Irondequoit, NY Map & Demographics
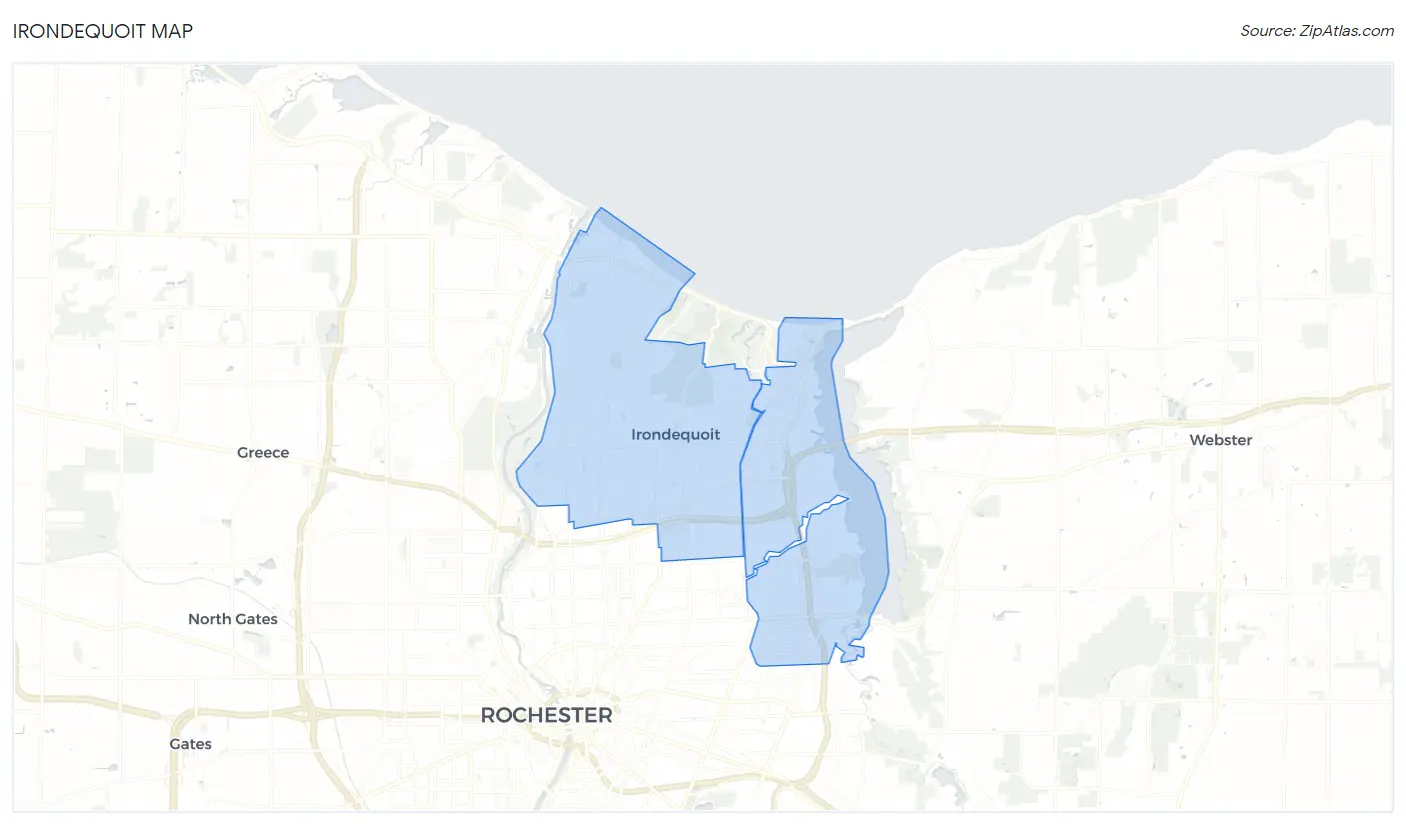
Irondequoit Map
Irondequoit Overview
$42,912
PER CAPITA INCOME
$95,835
AVG FAMILY INCOME
$74,031
AVG HOUSEHOLD INCOME
14.0%
WAGE / INCOME GAP [ % ]
86.0¢/ $1
WAGE / INCOME GAP [ $ ]
$13,040
FAMILY INCOME DEFICIT
0.43
INEQUALITY / GINI INDEX
50,780
TOTAL POPULATION
24,313
MALE POPULATION
26,467
FEMALE POPULATION
91.86
MALES / 100 FEMALES
108.86
FEMALES / 100 MALES
44.3
MEDIAN AGE
2.8
AVG FAMILY SIZE
2.2
AVG HOUSEHOLD SIZE
27,522
LABOR FORCE [ PEOPLE ]
65.1%
PERCENT IN LABOR FORCE
5.1%
UNEMPLOYMENT RATE
Irondequoit Area Codes
Income in Irondequoit
Income Overview in Irondequoit
Per Capita Income in Irondequoit is $42,912, while median incomes of families and households are $95,835 and $74,031 respectively.
| Characteristic | Number | Measure |
| Per Capita Income | 50,780 | $42,912 |
| Median Family Income | 13,673 | $95,835 |
| Mean Family Income | 13,673 | $115,266 |
| Median Household Income | 22,469 | $74,031 |
| Mean Household Income | 22,469 | $94,476 |
| Income Deficit | 13,673 | $13,040 |
| Wage / Income Gap (%) | 50,780 | 13.95% |
| Wage / Income Gap ($) | 50,780 | 86.05¢ per $1 |
| Gini / Inequality Index | 50,780 | 0.43 |
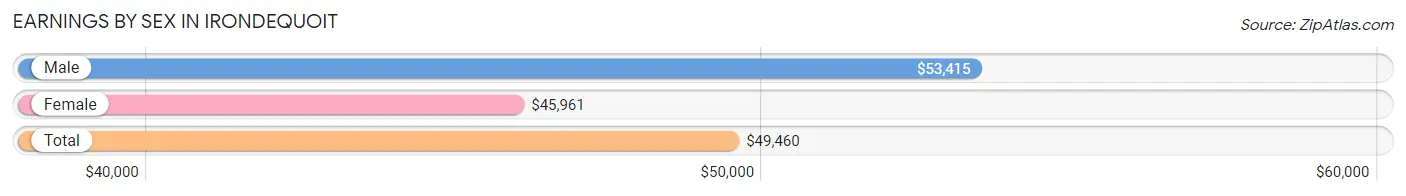
Earnings by Sex in Irondequoit
Average Earnings in Irondequoit are $49,460, $53,415 for men and $45,961 for women, a difference of 14.0%.
| Sex | Number | Average Earnings |
| Male | 14,316 (50.3%) | $53,415 |
| Female | 14,119 (49.6%) | $45,961 |
| Total | 28,435 (100.0%) | $49,460 |
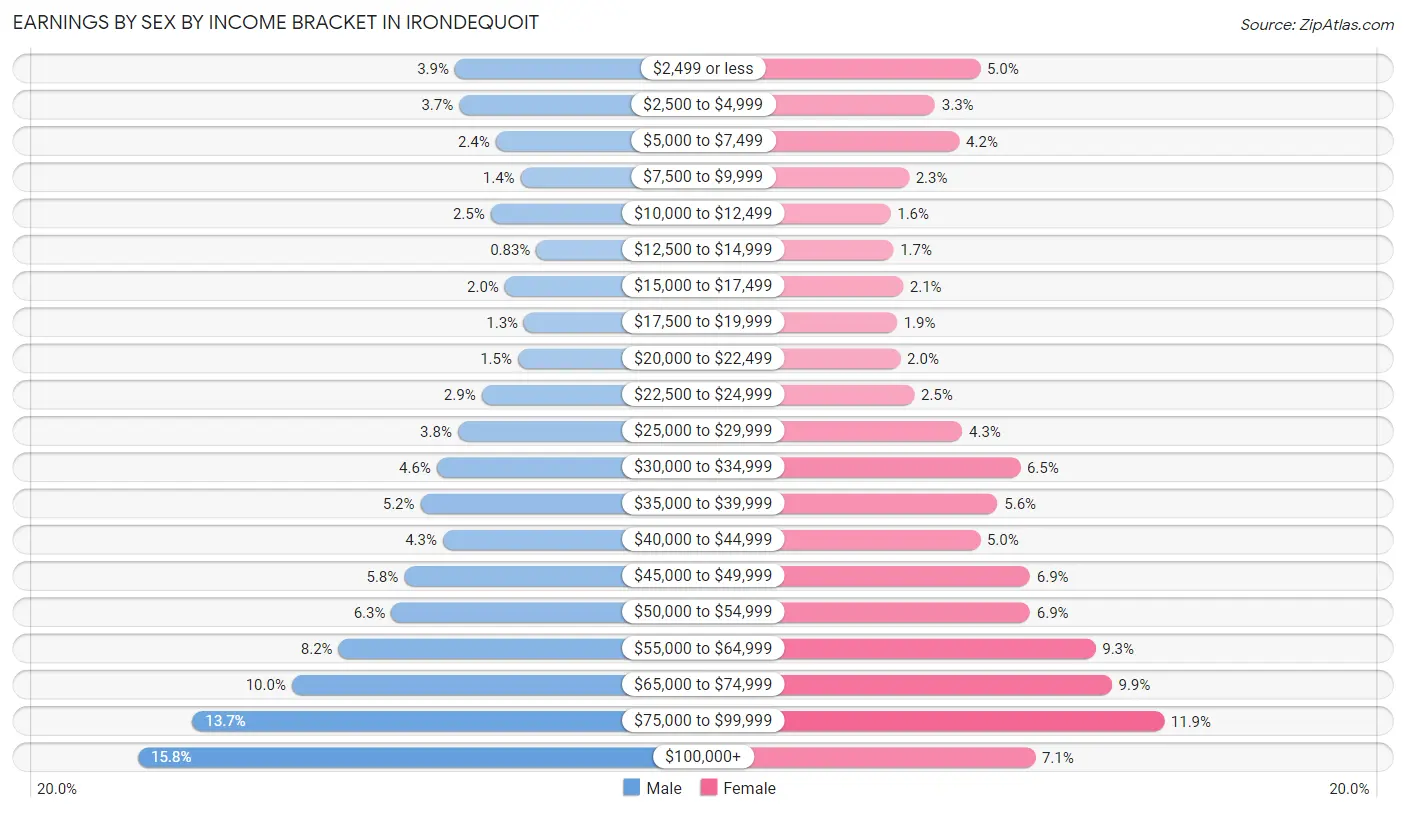
Earnings by Sex by Income Bracket in Irondequoit
The most common earnings brackets in Irondequoit are $100,000+ for men (2,255 | 15.8%) and $75,000 to $99,999 for women (1,677 | 11.9%).
| Income | Male | Female |
| $2,499 or less | 555 (3.9%) | 704 (5.0%) |
| $2,500 to $4,999 | 533 (3.7%) | 466 (3.3%) |
| $5,000 to $7,499 | 336 (2.4%) | 594 (4.2%) |
| $7,500 to $9,999 | 204 (1.4%) | 327 (2.3%) |
| $10,000 to $12,499 | 364 (2.5%) | 230 (1.6%) |
| $12,500 to $14,999 | 119 (0.8%) | 245 (1.7%) |
| $15,000 to $17,499 | 288 (2.0%) | 297 (2.1%) |
| $17,500 to $19,999 | 185 (1.3%) | 264 (1.9%) |
| $20,000 to $22,499 | 217 (1.5%) | 283 (2.0%) |
| $22,500 to $24,999 | 413 (2.9%) | 356 (2.5%) |
| $25,000 to $29,999 | 539 (3.8%) | 610 (4.3%) |
| $30,000 to $34,999 | 653 (4.6%) | 917 (6.5%) |
| $35,000 to $39,999 | 740 (5.2%) | 797 (5.6%) |
| $40,000 to $44,999 | 620 (4.3%) | 704 (5.0%) |
| $45,000 to $49,999 | 827 (5.8%) | 968 (6.9%) |
| $50,000 to $54,999 | 896 (6.3%) | 969 (6.9%) |
| $55,000 to $64,999 | 1,179 (8.2%) | 1,315 (9.3%) |
| $65,000 to $74,999 | 1,430 (10.0%) | 1,400 (9.9%) |
| $75,000 to $99,999 | 1,963 (13.7%) | 1,677 (11.9%) |
| $100,000+ | 2,255 (15.8%) | 996 (7.0%) |
| Total | 14,316 (100.0%) | 14,119 (100.0%) |
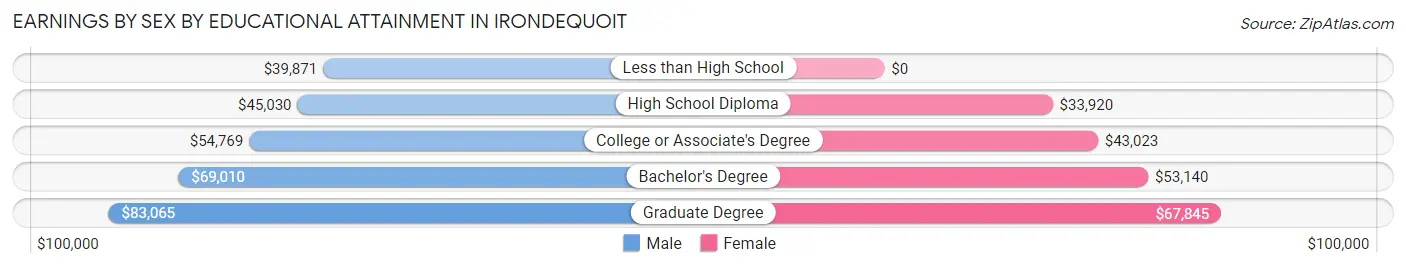
Earnings by Sex by Educational Attainment in Irondequoit
Average earnings in Irondequoit are $59,709 for men and $48,067 for women, a difference of 19.5%. Men with an educational attainment of graduate degree enjoy the highest average annual earnings of $83,065, while those with less than high school education earn the least with $39,871. Women with an educational attainment of graduate degree earn the most with the average annual earnings of $67,845, while those with high school diploma education have the smallest earnings of $33,920.
| Educational Attainment | Male Income | Female Income |
| Less than High School | $39,871 | $0 |
| High School Diploma | $45,030 | $33,920 |
| College or Associate's Degree | $54,769 | $43,023 |
| Bachelor's Degree | $69,010 | $53,140 |
| Graduate Degree | $83,065 | $67,845 |
| Total | $59,709 | $48,067 |
Family Income in Irondequoit
Family Income Brackets in Irondequoit
According to the Irondequoit family income data, there are 3,459 families falling into the $100,000 to $149,999 income range, which is the most common income bracket and makes up 25.3% of all families. Conversely, the $10,000 to $14,999 income bracket is the least frequent group with only 123 families (0.9%) belonging to this category.
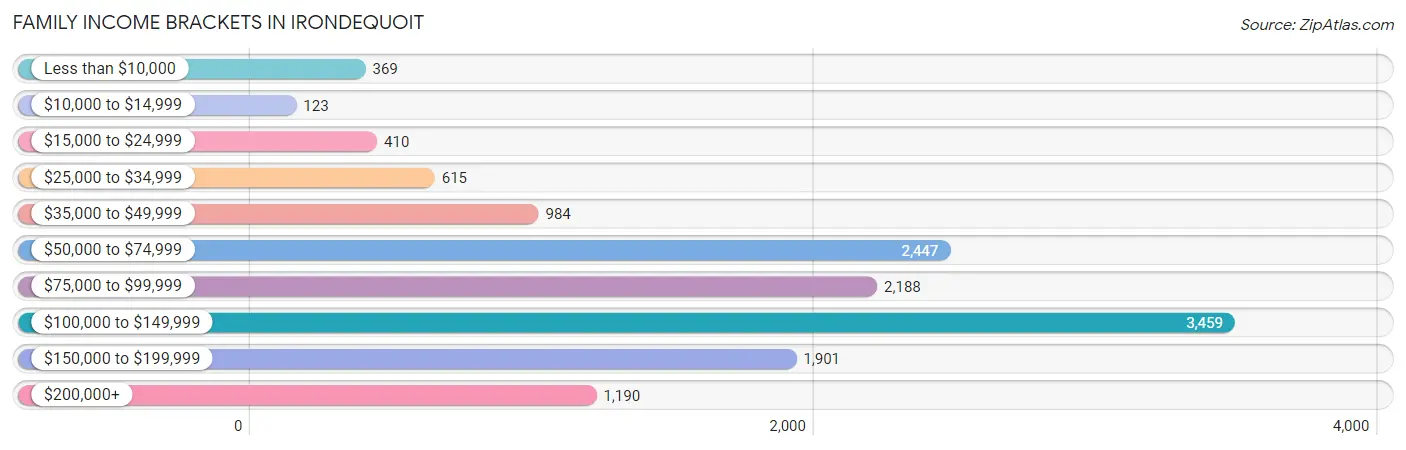
| Income Bracket | # Families | % Families |
| Less than $10,000 | 369 | 2.7% |
| $10,000 to $14,999 | 123 | 0.9% |
| $15,000 to $24,999 | 410 | 3.0% |
| $25,000 to $34,999 | 615 | 4.5% |
| $35,000 to $49,999 | 984 | 7.2% |
| $50,000 to $74,999 | 2,447 | 17.9% |
| $75,000 to $99,999 | 2,188 | 16.0% |
| $100,000 to $149,999 | 3,459 | 25.3% |
| $150,000 to $199,999 | 1,901 | 13.9% |
| $200,000+ | 1,190 | 8.7% |
Family Income by Famaliy Size in Irondequoit
6-person families (290 | 2.1%) account for the highest median family income in Irondequoit with $155,729 per family, while 2-person families (7,594 | 55.5%) have the highest median income of $42,385 per family member.
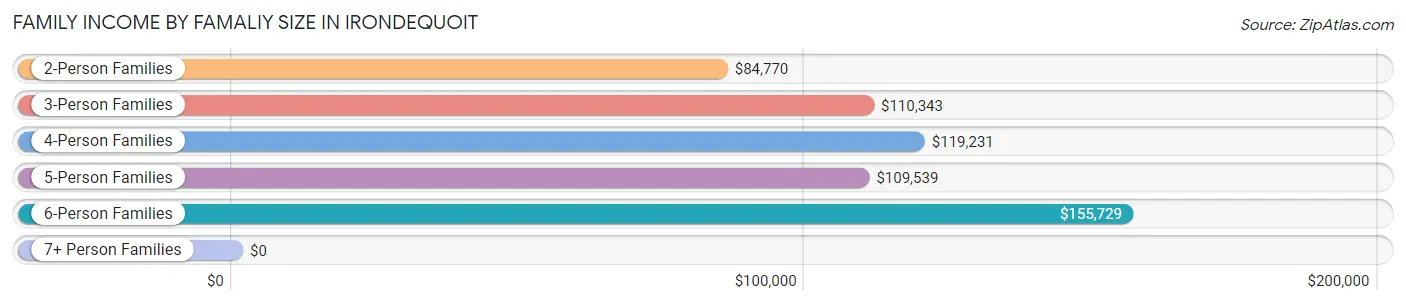
| Income Bracket | # Families | Median Income |
| 2-Person Families | 7,594 (55.5%) | $84,770 |
| 3-Person Families | 3,117 (22.8%) | $110,343 |
| 4-Person Families | 1,988 (14.5%) | $119,231 |
| 5-Person Families | 610 (4.5%) | $109,539 |
| 6-Person Families | 290 (2.1%) | $155,729 |
| 7+ Person Families | 74 (0.5%) | $0 |
| Total | 13,673 (100.0%) | $95,835 |
Family Income by Number of Earners in Irondequoit
The median family income in Irondequoit is $95,835, with families comprising 3+ earners (1,369) having the highest median family income of $149,926, while families with no earners (2,067) have the lowest median family income of $54,401, accounting for 10.0% and 15.1% of families, respectively.
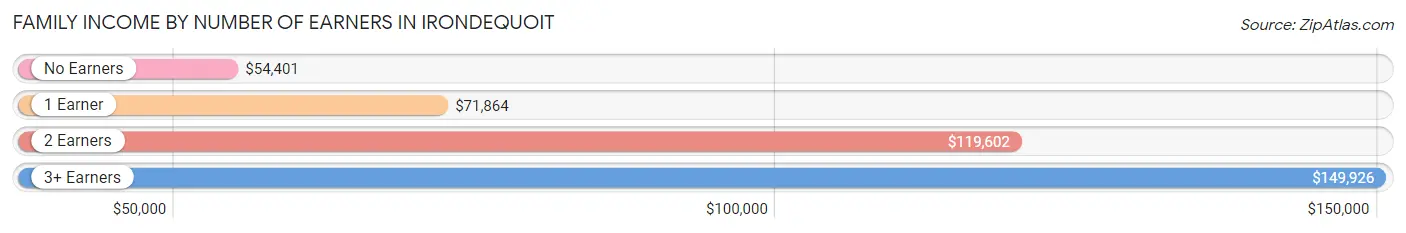
| Number of Earners | # Families | Median Income |
| No Earners | 2,067 (15.1%) | $54,401 |
| 1 Earner | 4,206 (30.8%) | $71,864 |
| 2 Earners | 6,031 (44.1%) | $119,602 |
| 3+ Earners | 1,369 (10.0%) | $149,926 |
| Total | 13,673 (100.0%) | $95,835 |
Household Income in Irondequoit
Household Income Brackets in Irondequoit
With 4,359 households falling in the category, the $100,000 to $149,999 income range is the most frequent in Irondequoit, accounting for 19.4% of all households. In contrast, only 652 households (2.9%) fall into the $10,000 to $14,999 income bracket, making it the least populous group.
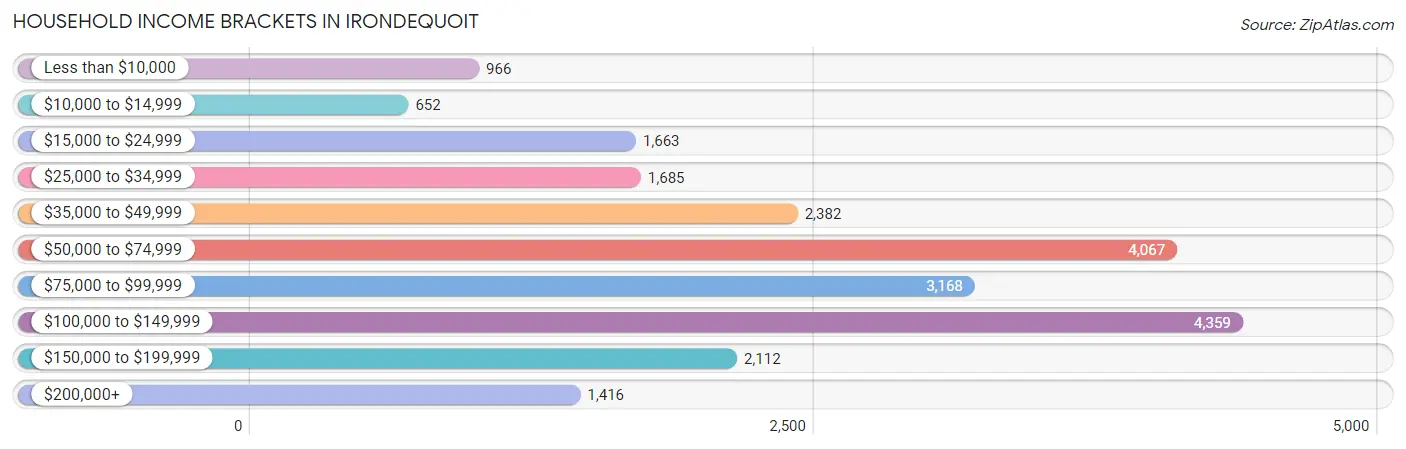
| Income Bracket | # Households | % Households |
| Less than $10,000 | 966 | 4.3% |
| $10,000 to $14,999 | 652 | 2.9% |
| $15,000 to $24,999 | 1,663 | 7.4% |
| $25,000 to $34,999 | 1,685 | 7.5% |
| $35,000 to $49,999 | 2,382 | 10.6% |
| $50,000 to $74,999 | 4,067 | 18.1% |
| $75,000 to $99,999 | 3,168 | 14.1% |
| $100,000 to $149,999 | 4,359 | 19.4% |
| $150,000 to $199,999 | 2,112 | 9.4% |
| $200,000+ | 1,416 | 6.3% |
Household Income by Householder Age in Irondequoit
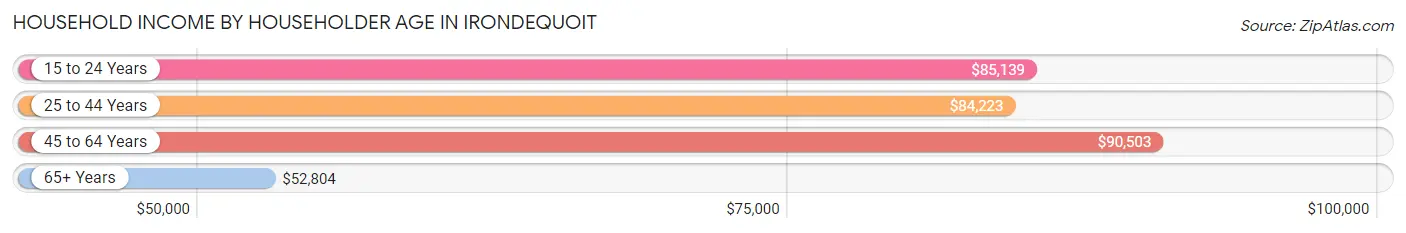
The median household income in Irondequoit is $74,031, with the highest median household income of $90,503 found in the 45 to 64 years age bracket for the primary householder. A total of 7,834 households (34.9%) fall into this category. Meanwhile, the 65+ years age bracket for the primary householder has the lowest median household income of $52,804, with 7,138 households (31.8%) in this group.
| Income Bracket | # Households | Median Income |
| 15 to 24 Years | 327 (1.5%) | $85,139 |
| 25 to 44 Years | 7,170 (31.9%) | $84,223 |
| 45 to 64 Years | 7,834 (34.9%) | $90,503 |
| 65+ Years | 7,138 (31.8%) | $52,804 |
| Total | 22,469 (100.0%) | $74,031 |
Poverty in Irondequoit
Income Below Poverty by Sex and Age in Irondequoit
With 7.4% poverty level for males and 11.2% for females among the residents of Irondequoit, under 5 year old males and 5 year old females are the most vulnerable to poverty, with 231 males (19.4%) and 143 females (51.4%) in their respective age groups living below the poverty level.
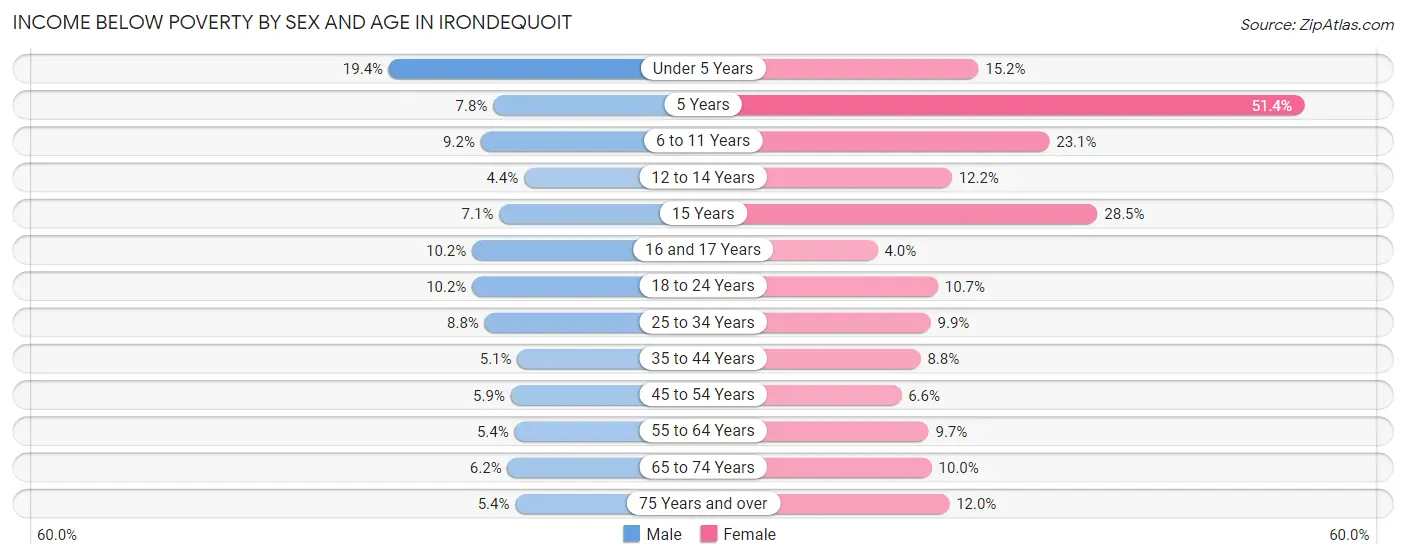
| Age Bracket | Male | Female |
| Under 5 Years | 231 (19.4%) | 183 (15.2%) |
| 5 Years | 20 (7.8%) | 143 (51.4%) |
| 6 to 11 Years | 133 (9.2%) | 355 (23.1%) |
| 12 to 14 Years | 49 (4.4%) | 82 (12.2%) |
| 15 Years | 28 (7.1%) | 76 (28.5%) |
| 16 and 17 Years | 58 (10.2%) | 17 (4.0%) |
| 18 to 24 Years | 166 (10.2%) | 131 (10.7%) |
| 25 to 34 Years | 304 (8.8%) | 348 (9.9%) |
| 35 to 44 Years | 147 (5.1%) | 310 (8.8%) |
| 45 to 54 Years | 187 (5.9%) | 216 (6.6%) |
| 55 to 64 Years | 180 (5.4%) | 372 (9.7%) |
| 65 to 74 Years | 184 (6.2%) | 358 (10.0%) |
| 75 Years and over | 85 (5.3%) | 308 (12.0%) |
| Total | 1,772 (7.4%) | 2,899 (11.2%) |
Income Above Poverty by Sex and Age in Irondequoit
According to the poverty statistics in Irondequoit, males aged 12 to 14 years and females aged 16 and 17 years are the age groups that are most secure financially, with 95.6% of males and 96.0% of females in these age groups living above the poverty line.
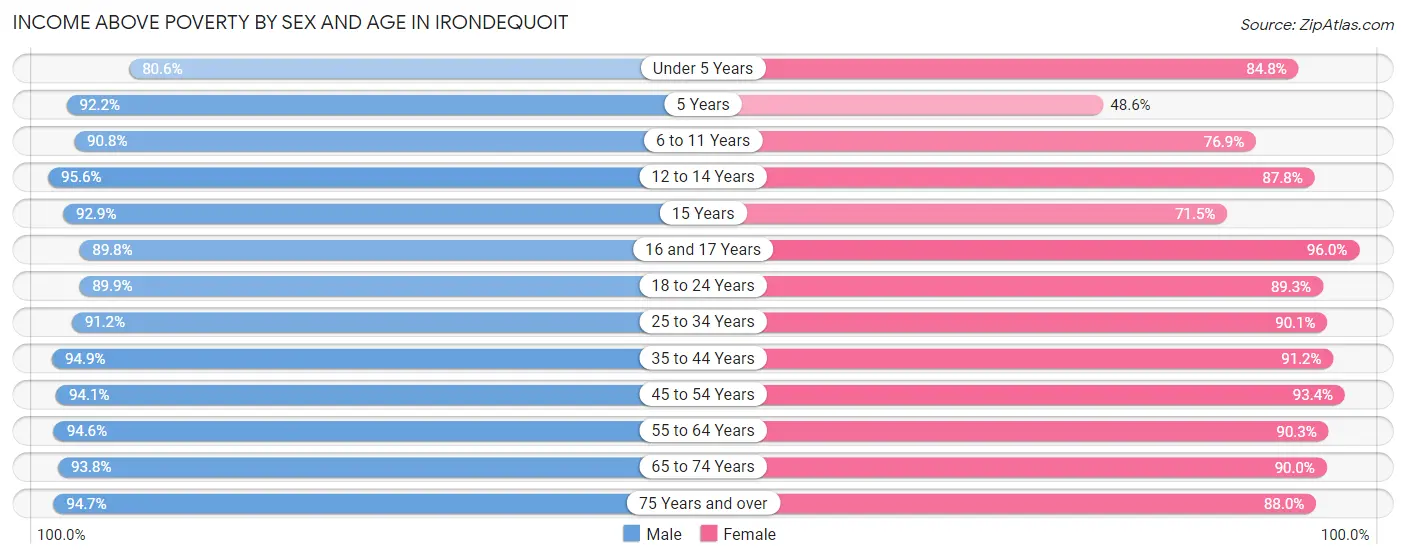
| Age Bracket | Male | Female |
| Under 5 Years | 958 (80.6%) | 1,020 (84.8%) |
| 5 Years | 236 (92.2%) | 135 (48.6%) |
| 6 to 11 Years | 1,313 (90.8%) | 1,181 (76.9%) |
| 12 to 14 Years | 1,069 (95.6%) | 588 (87.8%) |
| 15 Years | 364 (92.9%) | 191 (71.5%) |
| 16 and 17 Years | 513 (89.8%) | 410 (96.0%) |
| 18 to 24 Years | 1,470 (89.8%) | 1,093 (89.3%) |
| 25 to 34 Years | 3,168 (91.2%) | 3,172 (90.1%) |
| 35 to 44 Years | 2,725 (94.9%) | 3,227 (91.2%) |
| 45 to 54 Years | 3,002 (94.1%) | 3,046 (93.4%) |
| 55 to 64 Years | 3,129 (94.6%) | 3,479 (90.3%) |
| 65 to 74 Years | 2,775 (93.8%) | 3,223 (90.0%) |
| 75 Years and over | 1,504 (94.7%) | 2,268 (88.0%) |
| Total | 22,226 (92.6%) | 23,033 (88.8%) |
Income Below Poverty Among Married-Couple Families in Irondequoit
The poverty statistics for married-couple families in Irondequoit show that 2.4% or 236 of the total 10,056 families live below the poverty line. Families with 3 or 4 children have the highest poverty rate of 7.2%, comprising of 42 families. On the other hand, families with 5 or more children have the lowest poverty rate of 0.0%, which includes 0 families.
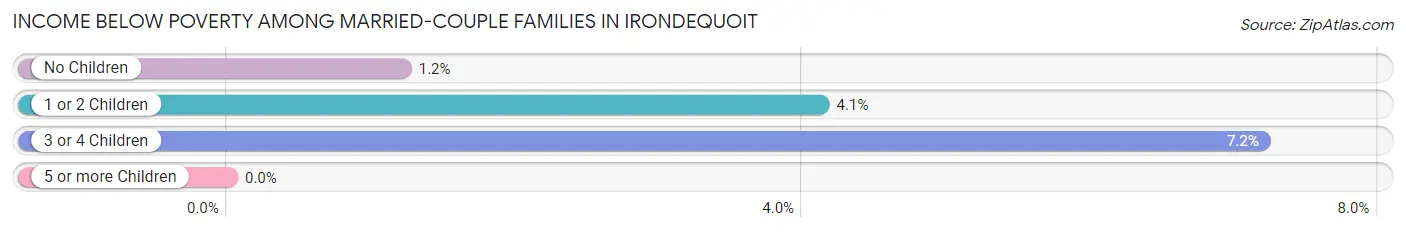
| Children | Above Poverty | Below Poverty |
| No Children | 6,619 (98.8%) | 81 (1.2%) |
| 1 or 2 Children | 2,628 (95.9%) | 113 (4.1%) |
| 3 or 4 Children | 542 (92.8%) | 42 (7.2%) |
| 5 or more Children | 31 (100.0%) | 0 (0.0%) |
| Total | 9,820 (97.7%) | 236 (2.4%) |
Income Below Poverty Among Single-Parent Households in Irondequoit
According to the poverty data in Irondequoit, 7.7% or 73 single-father households and 18.2% or 487 single-mother households are living below the poverty line. Among single-father households, those with 3 or 4 children have the highest poverty rate, with 18 households (36.0%) experiencing poverty. Likewise, among single-mother households, those with 3 or 4 children have the highest poverty rate, with 128 households (47.2%) falling below the poverty line.
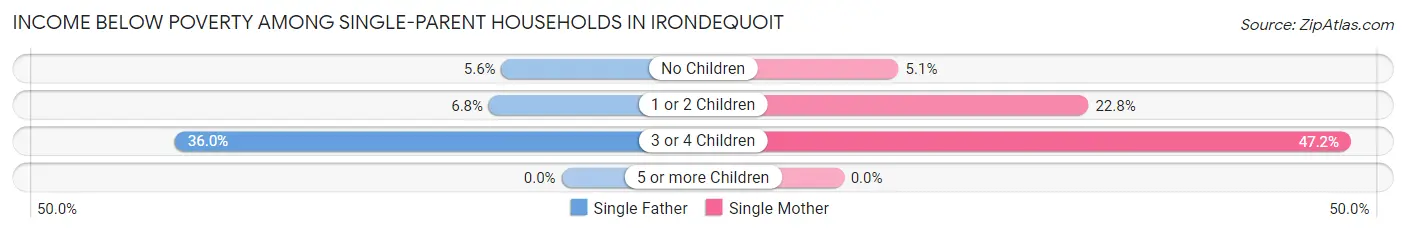
| Children | Single Father | Single Mother |
| No Children | 26 (5.6%) | 54 (5.1%) |
| 1 or 2 Children | 29 (6.8%) | 305 (22.8%) |
| 3 or 4 Children | 18 (36.0%) | 128 (47.2%) |
| 5 or more Children | 0 (0.0%) | 0 (0.0%) |
| Total | 73 (7.7%) | 487 (18.2%) |
Income Below Poverty Among Married-Couple vs Single-Parent Households in Irondequoit
The poverty data for Irondequoit shows that 236 of the married-couple family households (2.4%) and 560 of the single-parent households (15.5%) are living below the poverty level. Within the married-couple family households, those with 3 or 4 children have the highest poverty rate, with 42 households (7.2%) falling below the poverty line. Among the single-parent households, those with 3 or 4 children have the highest poverty rate, with 146 household (45.5%) living below poverty.
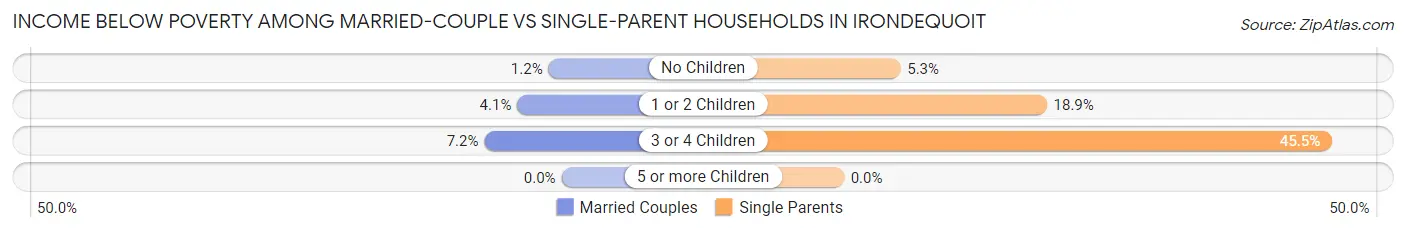
| Children | Married-Couple Families | Single-Parent Households |
| No Children | 81 (1.2%) | 80 (5.3%) |
| 1 or 2 Children | 113 (4.1%) | 334 (18.9%) |
| 3 or 4 Children | 42 (7.2%) | 146 (45.5%) |
| 5 or more Children | 0 (0.0%) | 0 (0.0%) |
| Total | 236 (2.4%) | 560 (15.5%) |
Race in Irondequoit
The most populous races in Irondequoit are White / Caucasian (40,513 | 79.8%), Hispanic or Latino (5,196 | 10.2%), and Black / African American (4,086 | 8.1%).
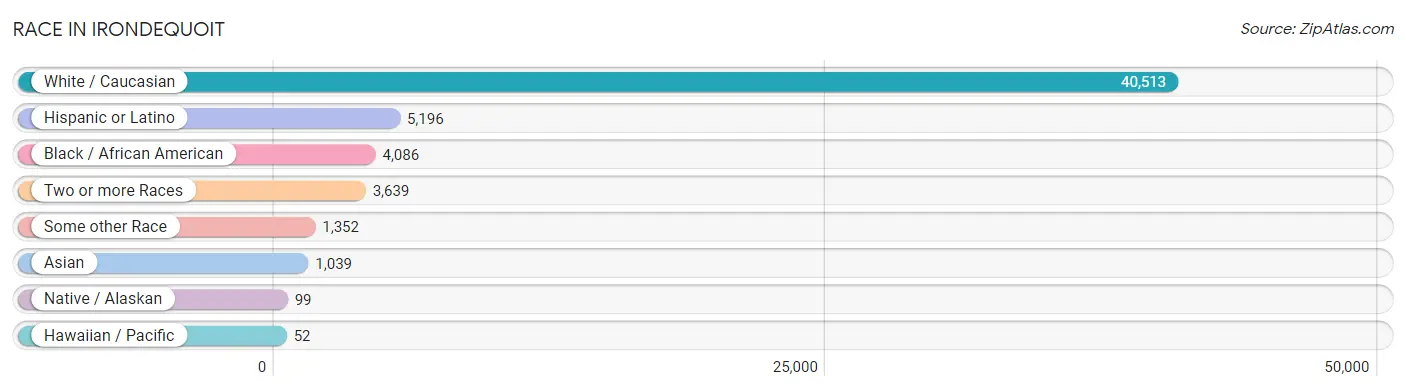
| Race | # Population | % Population |
| Asian | 1,039 | 2.1% |
| Black / African American | 4,086 | 8.1% |
| Hawaiian / Pacific | 52 | 0.1% |
| Hispanic or Latino | 5,196 | 10.2% |
| Native / Alaskan | 99 | 0.2% |
| White / Caucasian | 40,513 | 79.8% |
| Two or more Races | 3,639 | 7.2% |
| Some other Race | 1,352 | 2.7% |
| Total | 50,780 | 100.0% |
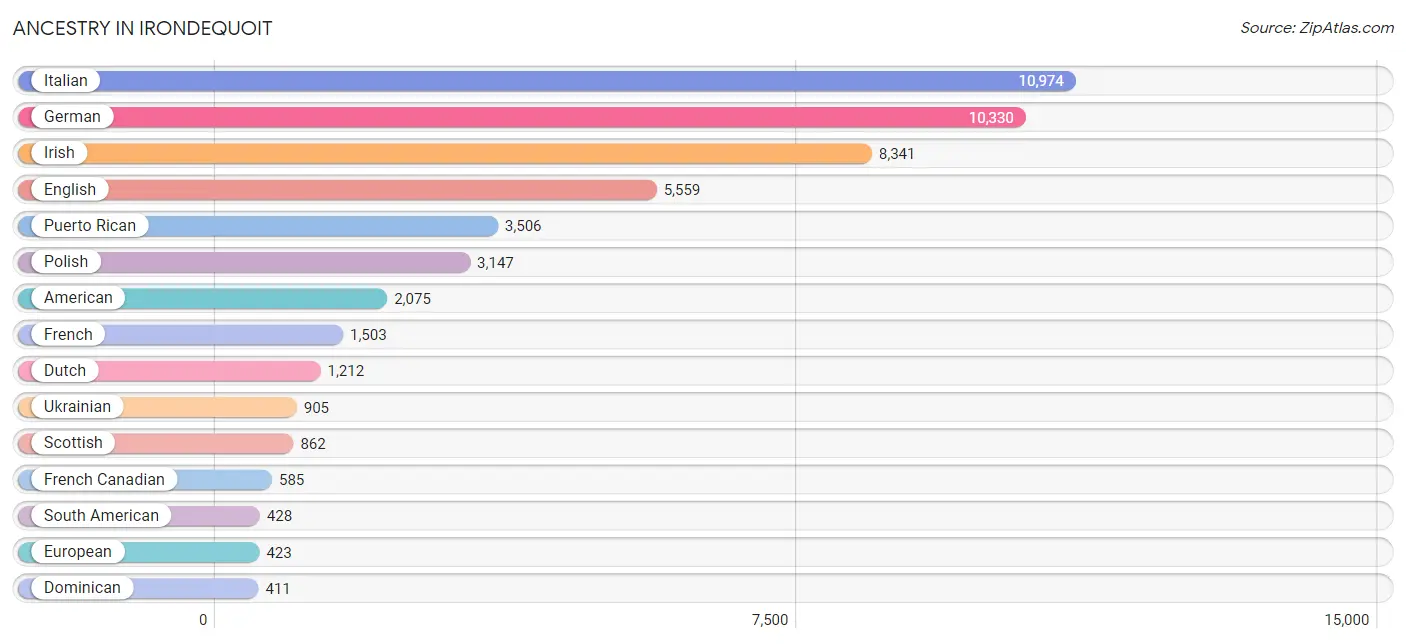
Ancestry in Irondequoit
The most populous ancestries reported in Irondequoit are Italian (10,974 | 21.6%), German (10,330 | 20.3%), Irish (8,341 | 16.4%), English (5,559 | 11.0%), and Puerto Rican (3,506 | 6.9%), together accounting for 76.2% of all Irondequoit residents.
| Ancestry | # Population | % Population |
| African | 132 | 0.3% |
| Alaskan Athabascan | 7 | 0.0% |
| Albanian | 32 | 0.1% |
| American | 2,075 | 4.1% |
| Apache | 4 | 0.0% |
| Arab | 182 | 0.4% |
| Argentinean | 18 | 0.0% |
| Armenian | 34 | 0.1% |
| Austrian | 69 | 0.1% |
| Barbadian | 9 | 0.0% |
| Belgian | 59 | 0.1% |
| Belizean | 11 | 0.0% |
| Bhutanese | 110 | 0.2% |
| Blackfeet | 20 | 0.0% |
| Bolivian | 104 | 0.2% |
| Brazilian | 24 | 0.1% |
| British | 308 | 0.6% |
| Bulgarian | 9 | 0.0% |
| Burmese | 141 | 0.3% |
| Cambodian | 23 | 0.1% |
| Canadian | 123 | 0.2% |
| Central American | 169 | 0.3% |
| Central American Indian | 58 | 0.1% |
| Cherokee | 41 | 0.1% |
| Chinese | 112 | 0.2% |
| Colombian | 106 | 0.2% |
| Costa Rican | 41 | 0.1% |
| Cuban | 61 | 0.1% |
| Cypriot | 10 | 0.0% |
| Czech | 63 | 0.1% |
| Czechoslovakian | 12 | 0.0% |
| Danish | 6 | 0.0% |
| Dominican | 411 | 0.8% |
| Dutch | 1,212 | 2.4% |
| Eastern European | 148 | 0.3% |
| Ecuadorian | 29 | 0.1% |
| Egyptian | 20 | 0.0% |
| English | 5,559 | 11.0% |
| Ethiopian | 8 | 0.0% |
| European | 423 | 0.8% |
| Finnish | 8 | 0.0% |
| French | 1,503 | 3.0% |
| French Canadian | 585 | 1.1% |
| German | 10,330 | 20.3% |
| Ghanaian | 7 | 0.0% |
| Greek | 136 | 0.3% |
| Guamanian / Chamorro | 110 | 0.2% |
| Guatemalan | 22 | 0.0% |
| Haitian | 31 | 0.1% |
| Hungarian | 241 | 0.5% |
| Indian (Asian) | 328 | 0.6% |
| Indonesian | 125 | 0.3% |
| Inupiat | 34 | 0.1% |
| Iranian | 9 | 0.0% |
| Irish | 8,341 | 16.4% |
| Iroquois | 64 | 0.1% |
| Italian | 10,974 | 21.6% |
| Jamaican | 118 | 0.2% |
| Korean | 333 | 0.7% |
| Latvian | 53 | 0.1% |
| Lebanese | 101 | 0.2% |
| Liberian | 7 | 0.0% |
| Lithuanian | 232 | 0.5% |
| Luxembourger | 8 | 0.0% |
| Macedonian | 195 | 0.4% |
| Malaysian | 126 | 0.3% |
| Maltese | 12 | 0.0% |
| Mexican | 238 | 0.5% |
| Navajo | 4 | 0.0% |
| Nigerian | 8 | 0.0% |
| Northern European | 46 | 0.1% |
| Norwegian | 121 | 0.2% |
| Pakistani | 40 | 0.1% |
| Panamanian | 77 | 0.2% |
| Pennsylvania German | 35 | 0.1% |
| Peruvian | 67 | 0.1% |
| Polish | 3,147 | 6.2% |
| Portuguese | 59 | 0.1% |
| Puerto Rican | 3,506 | 6.9% |
| Romanian | 8 | 0.0% |
| Russian | 187 | 0.4% |
| Salvadoran | 18 | 0.0% |
| Scandinavian | 32 | 0.1% |
| Scotch-Irish | 337 | 0.7% |
| Scottish | 862 | 1.7% |
| Sioux | 2 | 0.0% |
| Slavic | 124 | 0.2% |
| Slovak | 43 | 0.1% |
| Slovene | 16 | 0.0% |
| South American | 428 | 0.8% |
| South American Indian | 60 | 0.1% |
| Spaniard | 42 | 0.1% |
| Spanish | 249 | 0.5% |
| Spanish American Indian | 8 | 0.0% |
| Sri Lankan | 127 | 0.3% |
| Subsaharan African | 298 | 0.6% |
| Sudanese | 69 | 0.1% |
| Swedish | 373 | 0.7% |
| Swiss | 107 | 0.2% |
| Syrian | 26 | 0.1% |
| Thai | 367 | 0.7% |
| Trinidadian and Tobagonian | 63 | 0.1% |
| Turkish | 271 | 0.5% |
| Ukrainian | 905 | 1.8% |
| Venezuelan | 104 | 0.2% |
| Vietnamese | 16 | 0.0% |
| Welsh | 302 | 0.6% |
| Yugoslavian | 47 | 0.1% | View All 108 Rows |
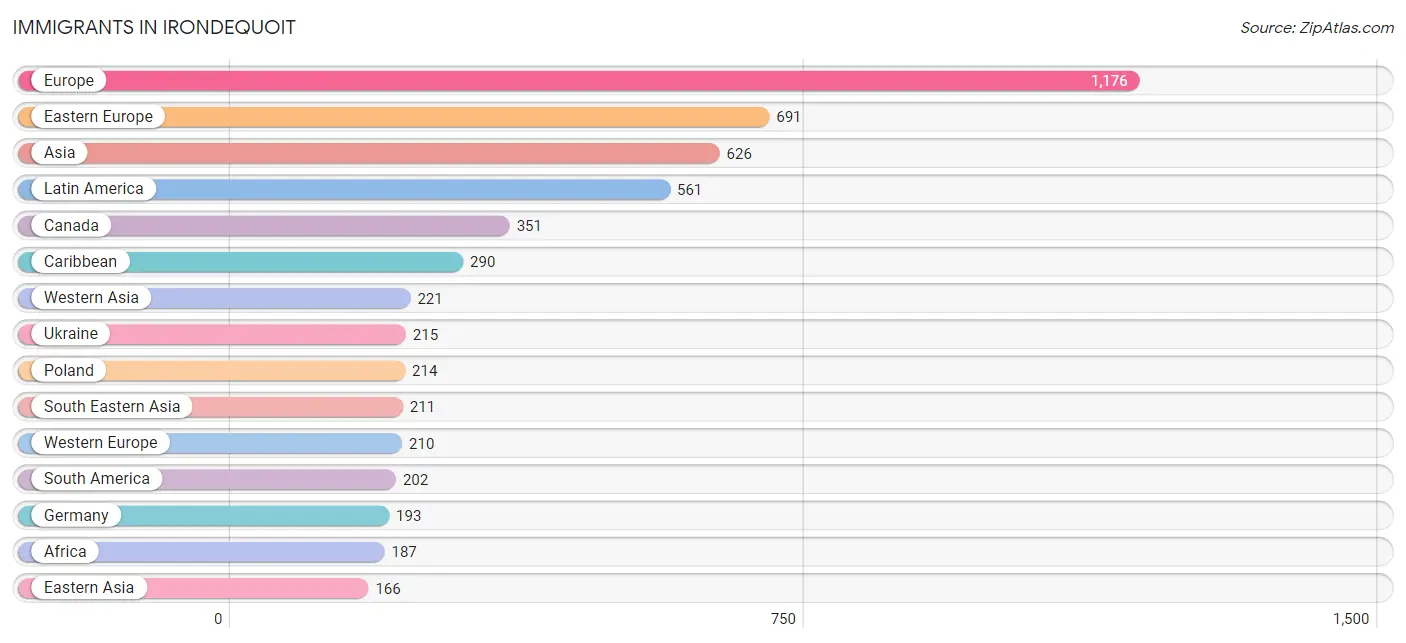
Immigrants in Irondequoit
The most numerous immigrant groups reported in Irondequoit came from Europe (1,176 | 2.3%), Eastern Europe (691 | 1.4%), Asia (626 | 1.2%), Latin America (561 | 1.1%), and Canada (351 | 0.7%), together accounting for 6.7% of all Irondequoit residents.
| Immigration Origin | # Population | % Population |
| Africa | 187 | 0.4% |
| Albania | 21 | 0.0% |
| Argentina | 22 | 0.0% |
| Asia | 626 | 1.2% |
| Austria | 7 | 0.0% |
| Barbados | 17 | 0.0% |
| Belize | 11 | 0.0% |
| Bolivia | 78 | 0.2% |
| Bosnia and Herzegovina | 47 | 0.1% |
| Brazil | 18 | 0.0% |
| Bulgaria | 9 | 0.0% |
| Canada | 351 | 0.7% |
| Caribbean | 290 | 0.6% |
| Central America | 69 | 0.1% |
| China | 57 | 0.1% |
| Colombia | 56 | 0.1% |
| Congo | 16 | 0.0% |
| Costa Rica | 14 | 0.0% |
| Cuba | 32 | 0.1% |
| Czechoslovakia | 9 | 0.0% |
| Dominican Republic | 111 | 0.2% |
| Eastern Africa | 57 | 0.1% |
| Eastern Asia | 166 | 0.3% |
| Eastern Europe | 691 | 1.4% |
| Ecuador | 5 | 0.0% |
| Egypt | 14 | 0.0% |
| England | 45 | 0.1% |
| Eritrea | 17 | 0.0% |
| Europe | 1,176 | 2.3% |
| France | 10 | 0.0% |
| Germany | 193 | 0.4% |
| Greece | 30 | 0.1% |
| Guyana | 1 | 0.0% |
| Hong Kong | 10 | 0.0% |
| India | 28 | 0.1% |
| Ireland | 20 | 0.0% |
| Italy | 71 | 0.1% |
| Jamaica | 107 | 0.2% |
| Japan | 12 | 0.0% |
| Korea | 86 | 0.2% |
| Laos | 44 | 0.1% |
| Latin America | 561 | 1.1% |
| Liberia | 7 | 0.0% |
| Mexico | 24 | 0.1% |
| Middle Africa | 16 | 0.0% |
| Nigeria | 30 | 0.1% |
| North Macedonia | 113 | 0.2% |
| Northern Africa | 49 | 0.1% |
| Northern Europe | 113 | 0.2% |
| Panama | 20 | 0.0% |
| Philippines | 65 | 0.1% |
| Poland | 214 | 0.4% |
| Romania | 20 | 0.0% |
| Russia | 17 | 0.0% |
| South America | 202 | 0.4% |
| South Central Asia | 28 | 0.1% |
| South Eastern Asia | 211 | 0.4% |
| Southern Europe | 101 | 0.2% |
| Sudan | 35 | 0.1% |
| Syria | 11 | 0.0% |
| Taiwan | 8 | 0.0% |
| Trinidad and Tobago | 23 | 0.1% |
| Turkey | 136 | 0.3% |
| Ukraine | 215 | 0.4% |
| Venezuela | 22 | 0.0% |
| Vietnam | 61 | 0.1% |
| Western Africa | 65 | 0.1% |
| Western Asia | 221 | 0.4% |
| Western Europe | 210 | 0.4% |
| Yemen | 74 | 0.2% | View All 70 Rows |
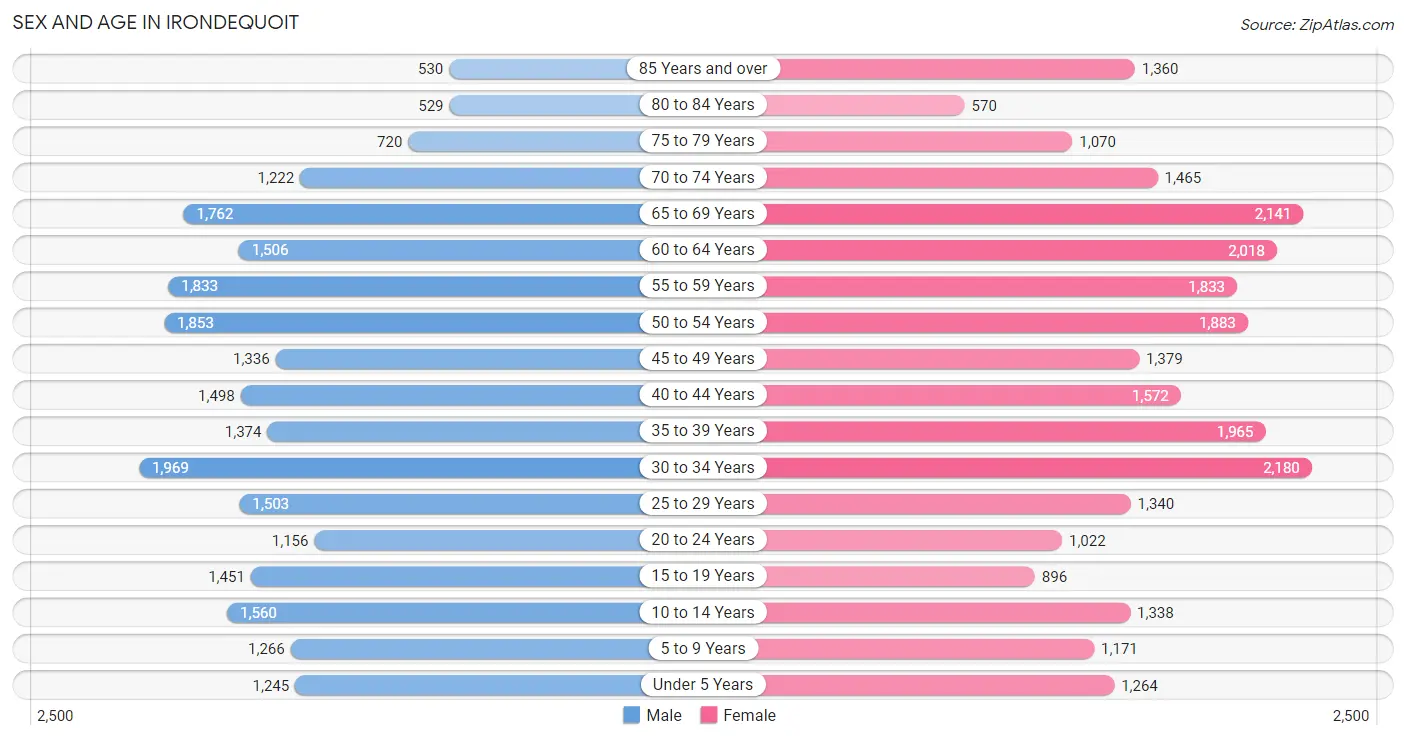
Sex and Age in Irondequoit
Sex and Age in Irondequoit
The most populous age groups in Irondequoit are 30 to 34 Years (1,969 | 8.1%) for men and 30 to 34 Years (2,180 | 8.2%) for women.
| Age Bracket | Male | Female |
| Under 5 Years | 1,245 (5.1%) | 1,264 (4.8%) |
| 5 to 9 Years | 1,266 (5.2%) | 1,171 (4.4%) |
| 10 to 14 Years | 1,560 (6.4%) | 1,338 (5.1%) |
| 15 to 19 Years | 1,451 (6.0%) | 896 (3.4%) |
| 20 to 24 Years | 1,156 (4.8%) | 1,022 (3.9%) |
| 25 to 29 Years | 1,503 (6.2%) | 1,340 (5.1%) |
| 30 to 34 Years | 1,969 (8.1%) | 2,180 (8.2%) |
| 35 to 39 Years | 1,374 (5.7%) | 1,965 (7.4%) |
| 40 to 44 Years | 1,498 (6.2%) | 1,572 (5.9%) |
| 45 to 49 Years | 1,336 (5.5%) | 1,379 (5.2%) |
| 50 to 54 Years | 1,853 (7.6%) | 1,883 (7.1%) |
| 55 to 59 Years | 1,833 (7.5%) | 1,833 (6.9%) |
| 60 to 64 Years | 1,506 (6.2%) | 2,018 (7.6%) |
| 65 to 69 Years | 1,762 (7.2%) | 2,141 (8.1%) |
| 70 to 74 Years | 1,222 (5.0%) | 1,465 (5.5%) |
| 75 to 79 Years | 720 (3.0%) | 1,070 (4.0%) |
| 80 to 84 Years | 529 (2.2%) | 570 (2.1%) |
| 85 Years and over | 530 (2.2%) | 1,360 (5.1%) |
| Total | 24,313 (100.0%) | 26,467 (100.0%) |
Families and Households in Irondequoit
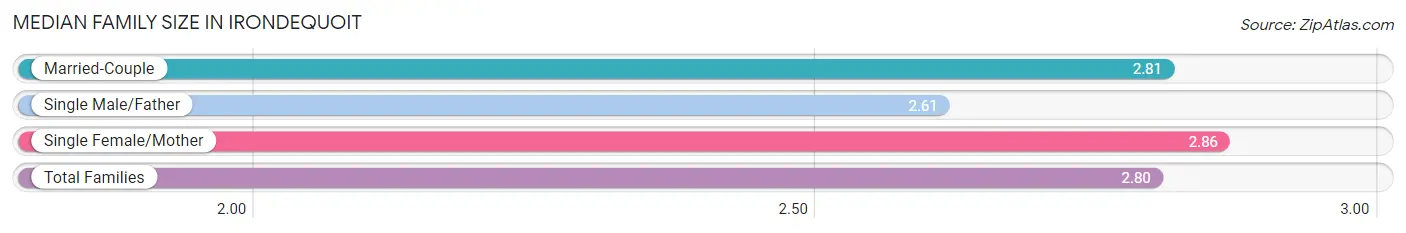
Median Family Size in Irondequoit
The median family size in Irondequoit is 2.80 persons per family, with single female/mother families (2,673 | 19.6%) accounting for the largest median family size of 2.86 persons per family. On the other hand, single male/father families (944 | 6.9%) represent the smallest median family size with 2.61 persons per family.
| Family Type | # Families | Family Size |
| Married-Couple | 10,056 (73.6%) | 2.81 |
| Single Male/Father | 944 (6.9%) | 2.61 |
| Single Female/Mother | 2,673 (19.6%) | 2.86 |
| Total Families | 13,673 (100.0%) | 2.80 |
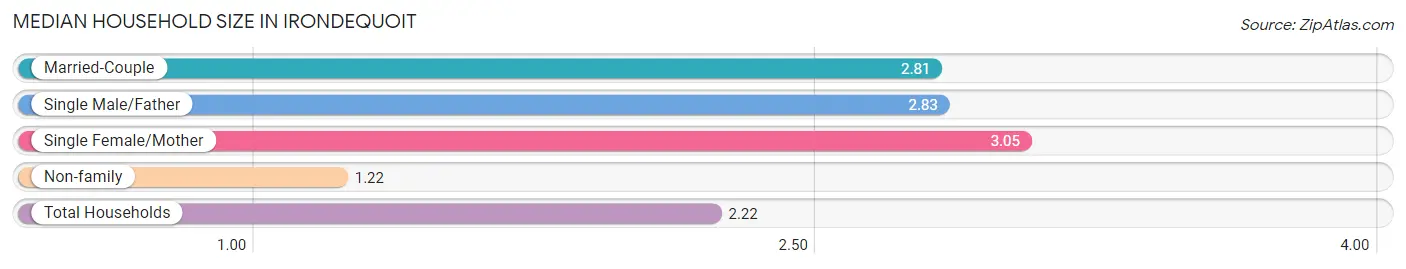
Median Household Size in Irondequoit
The median household size in Irondequoit is 2.22 persons per household, with single female/mother households (2,673 | 11.9%) accounting for the largest median household size of 3.05 persons per household. non-family households (8,796 | 39.2%) represent the smallest median household size with 1.22 persons per household.
| Household Type | # Households | Household Size |
| Married-Couple | 10,056 (44.8%) | 2.81 |
| Single Male/Father | 944 (4.2%) | 2.83 |
| Single Female/Mother | 2,673 (11.9%) | 3.05 |
| Non-family | 8,796 (39.2%) | 1.22 |
| Total Households | 22,469 (100.0%) | 2.22 |
Household Size by Marriage Status in Irondequoit
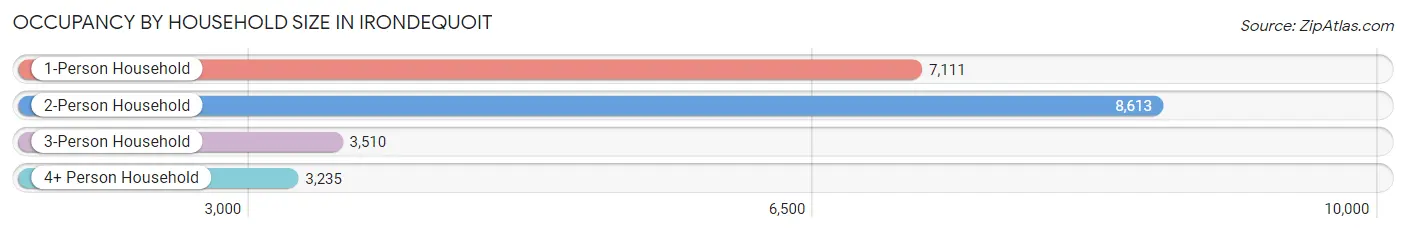
Out of a total of 22,469 households in Irondequoit, 13,673 (60.9%) are family households, while 8,796 (39.2%) are nonfamily households. The most numerous type of family households are 2-person households, comprising 7,170, and the most common type of nonfamily households are 1-person households, comprising 7,111.
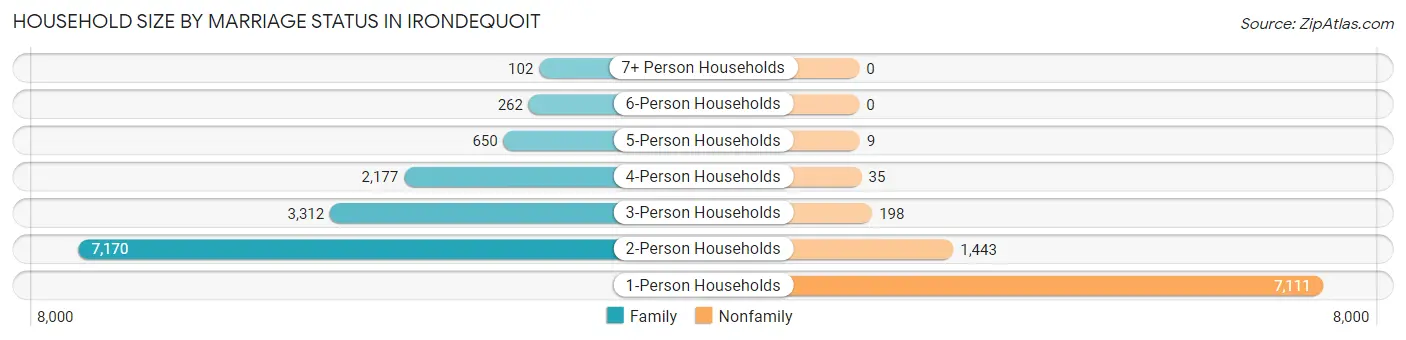
| Household Size | Family Households | Nonfamily Households |
| 1-Person Households | - | 7,111 (31.7%) |
| 2-Person Households | 7,170 (31.9%) | 1,443 (6.4%) |
| 3-Person Households | 3,312 (14.7%) | 198 (0.9%) |
| 4-Person Households | 2,177 (9.7%) | 35 (0.2%) |
| 5-Person Households | 650 (2.9%) | 9 (0.0%) |
| 6-Person Households | 262 (1.2%) | 0 (0.0%) |
| 7+ Person Households | 102 (0.4%) | 0 (0.0%) |
| Total | 13,673 (60.9%) | 8,796 (39.2%) |
Female Fertility in Irondequoit
Fertility by Age in Irondequoit
Average fertility rate in Irondequoit is 32.0 births per 1,000 women. Women in the age bracket of 35 to 50 years have the highest fertility rate with 39.0 births per 1,000 women. Women in the age bracket of 35 to 50 years acount for 61.3% of all women with births.
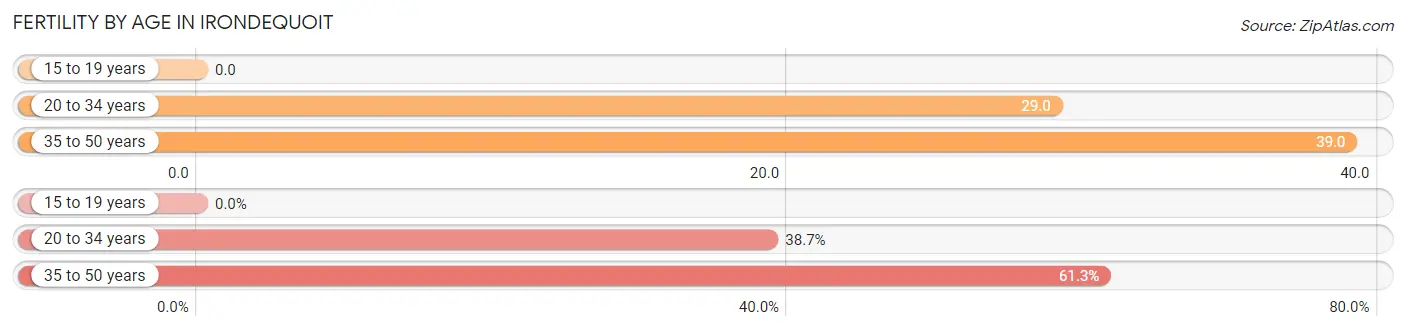
| Age Bracket | Women with Births | Births / 1,000 Women |
| 15 to 19 years | 0 (0.0%) | 0.0 |
| 20 to 34 years | 132 (38.7%) | 29.0 |
| 35 to 50 years | 209 (61.3%) | 39.0 |
| Total | 341 (100.0%) | 32.0 |
Fertility by Age by Marriage Status in Irondequoit
70.7% of women with births (341) in Irondequoit are married. The highest percentage of unmarried women with births falls into 20 to 34 years age bracket with 41.7% of them unmarried at the time of birth, while the lowest percentage of unmarried women with births belong to 35 to 50 years age bracket with 21.5% of them unmarried.
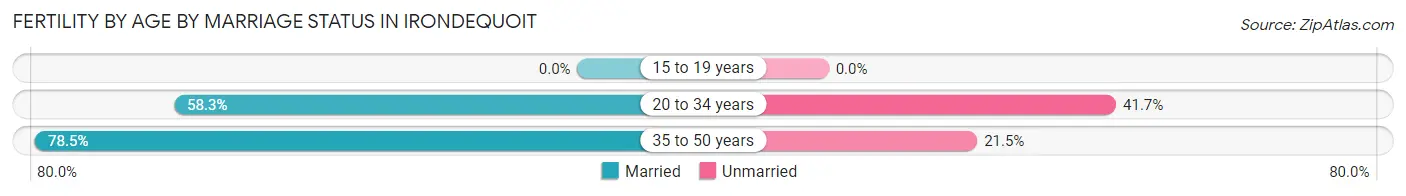
| Age Bracket | Married | Unmarried |
| 15 to 19 years | 0 (0.0%) | 0 (0.0%) |
| 20 to 34 years | 77 (58.3%) | 55 (41.7%) |
| 35 to 50 years | 164 (78.5%) | 45 (21.5%) |
| Total | 241 (70.7%) | 100 (29.3%) |
Fertility by Education in Irondequoit
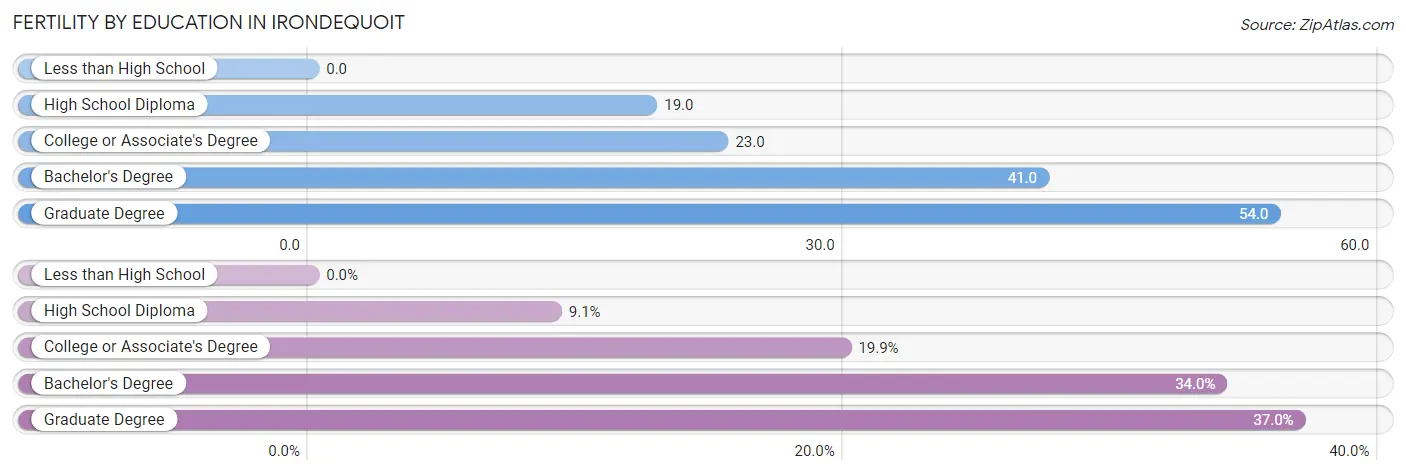
| Educational Attainment | Women with Births | Births / 1,000 Women |
| Less than High School | 0 (0.0%) | 0.0 |
| High School Diploma | 31 (9.1%) | 19.0 |
| College or Associate's Degree | 68 (19.9%) | 23.0 |
| Bachelor's Degree | 116 (34.0%) | 41.0 |
| Graduate Degree | 126 (36.9%) | 54.0 |
| Total | 341 (100.0%) | 32.0 |
Fertility by Education by Marriage Status in Irondequoit
29.3% of women with births in Irondequoit are unmarried. Women with the educational attainment of graduate degree are most likely to be married with 100.0% of them married at childbirth, while women with the educational attainment of high school diploma are least likely to be married with 100.0% of them unmarried at childbirth.
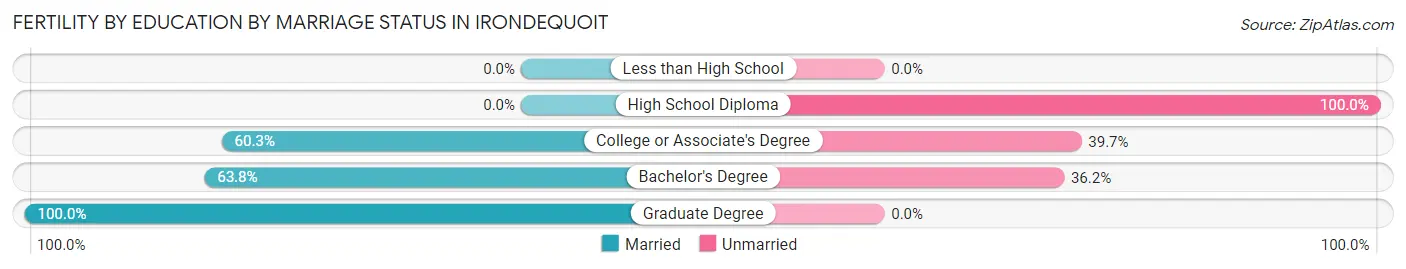
| Educational Attainment | Married | Unmarried |
| Less than High School | 0 (0.0%) | 0 (0.0%) |
| High School Diploma | 0 (0.0%) | 31 (100.0%) |
| College or Associate's Degree | 41 (60.3%) | 27 (39.7%) |
| Bachelor's Degree | 74 (63.8%) | 42 (36.2%) |
| Graduate Degree | 126 (100.0%) | 0 (0.0%) |
| Total | 241 (70.7%) | 100 (29.3%) |
Employment Characteristics in Irondequoit
Employment by Class of Employer in Irondequoit
Among the 25,526 employed individuals in Irondequoit, private company employees (15,264 | 59.8%), not-for-profit organizations (4,203 | 16.5%), and local government employees (2,720 | 10.7%) make up the most common classes of employment.
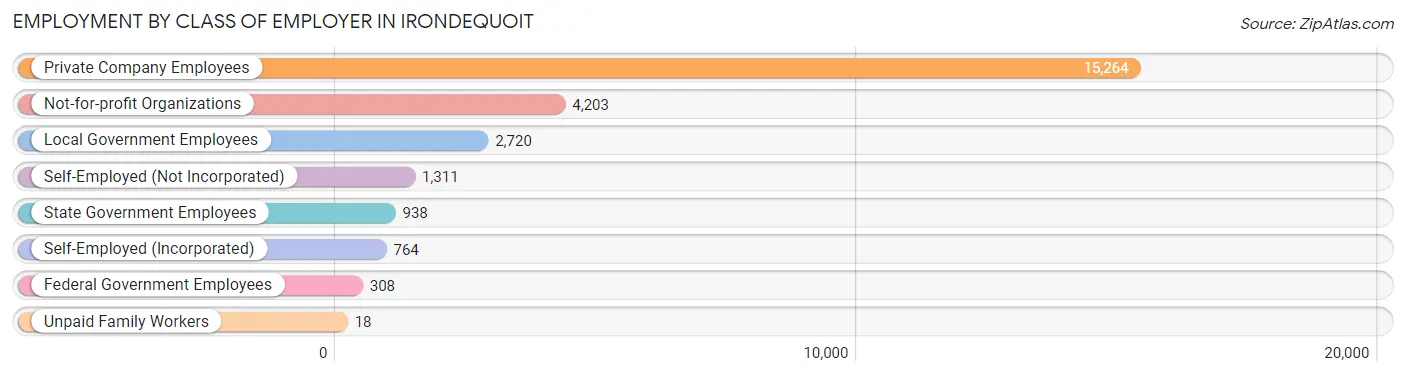
| Employer Class | # Employees | % Employees |
| Private Company Employees | 15,264 | 59.8% |
| Self-Employed (Incorporated) | 764 | 3.0% |
| Self-Employed (Not Incorporated) | 1,311 | 5.1% |
| Not-for-profit Organizations | 4,203 | 16.5% |
| Local Government Employees | 2,720 | 10.7% |
| State Government Employees | 938 | 3.7% |
| Federal Government Employees | 308 | 1.2% |
| Unpaid Family Workers | 18 | 0.1% |
| Total | 25,526 | 100.0% |
Employment Status by Age in Irondequoit
According to the labor force statistics for Irondequoit, out of the total population over 16 years of age (42,277), 65.1% or 27,522 individuals are in the labor force, with 5.1% or 1,404 of them unemployed. The age group with the highest labor force participation rate is 30 to 34 years, with 95.2% or 3,950 individuals in the labor force. Within the labor force, the 16 to 19 years age range has the highest percentage of unemployed individuals, with 11.0% or 85 of them being unemployed.
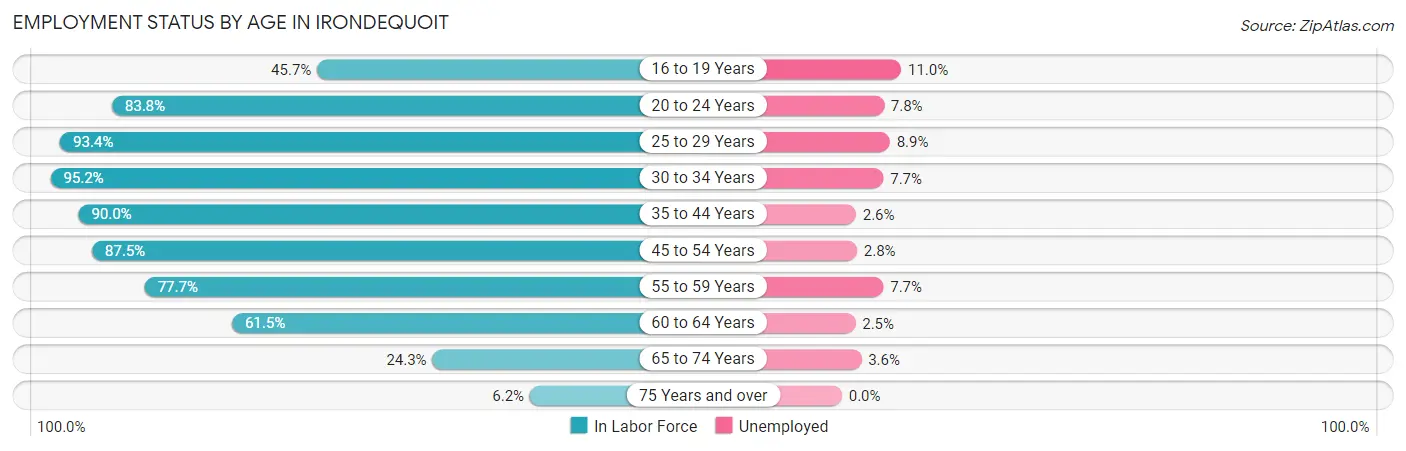
| Age Bracket | In Labor Force | Unemployed |
| 16 to 19 Years | 771 (45.7%) | 85 (11.0%) |
| 20 to 24 Years | 1,825 (83.8%) | 142 (7.8%) |
| 25 to 29 Years | 2,655 (93.4%) | 236 (8.9%) |
| 30 to 34 Years | 3,950 (95.2%) | 304 (7.7%) |
| 35 to 44 Years | 5,768 (90.0%) | 150 (2.6%) |
| 45 to 54 Years | 5,645 (87.5%) | 158 (2.8%) |
| 55 to 59 Years | 2,848 (77.7%) | 219 (7.7%) |
| 60 to 64 Years | 2,167 (61.5%) | 54 (2.5%) |
| 65 to 74 Years | 1,601 (24.3%) | 58 (3.6%) |
| 75 Years and over | 296 (6.2%) | 0 (0.0%) |
| Total | 27,522 (65.1%) | 1,404 (5.1%) |
Employment Status by Educational Attainment in Irondequoit
According to labor force statistics for Irondequoit, 85.2% of individuals (23,040) out of the total population between 25 and 64 years of age (27,042) are in the labor force, with 4.9% or 1,129 of them being unemployed. The group with the highest labor force participation rate are those with the educational attainment of bachelor's degree or higher, with 92.5% or 10,600 individuals in the labor force. Within the labor force, individuals with less than high school education have the highest percentage of unemployment, with 12.9% or 120 of them being unemployed.
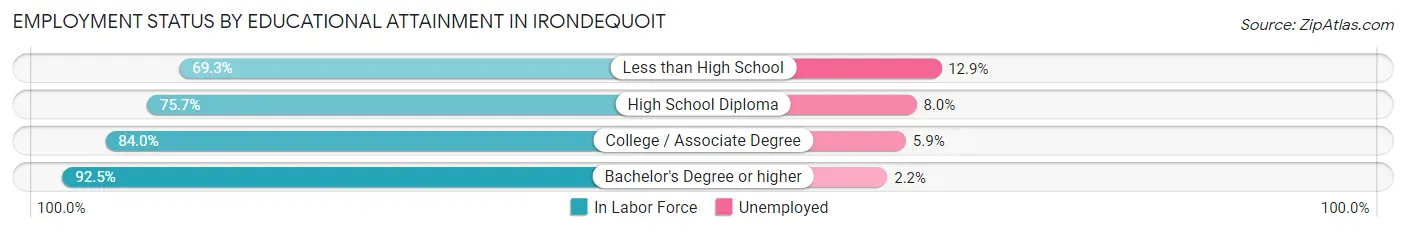
| Educational Attainment | In Labor Force | Unemployed |
| Less than High School | 927 (69.3%) | 172 (12.9%) |
| High School Diploma | 4,129 (75.7%) | 436 (8.0%) |
| College / Associate Degree | 7,384 (84.0%) | 519 (5.9%) |
| Bachelor's Degree or higher | 10,600 (92.5%) | 252 (2.2%) |
| Total | 23,040 (85.2%) | 1,325 (4.9%) |
Employment Occupations by Sex in Irondequoit
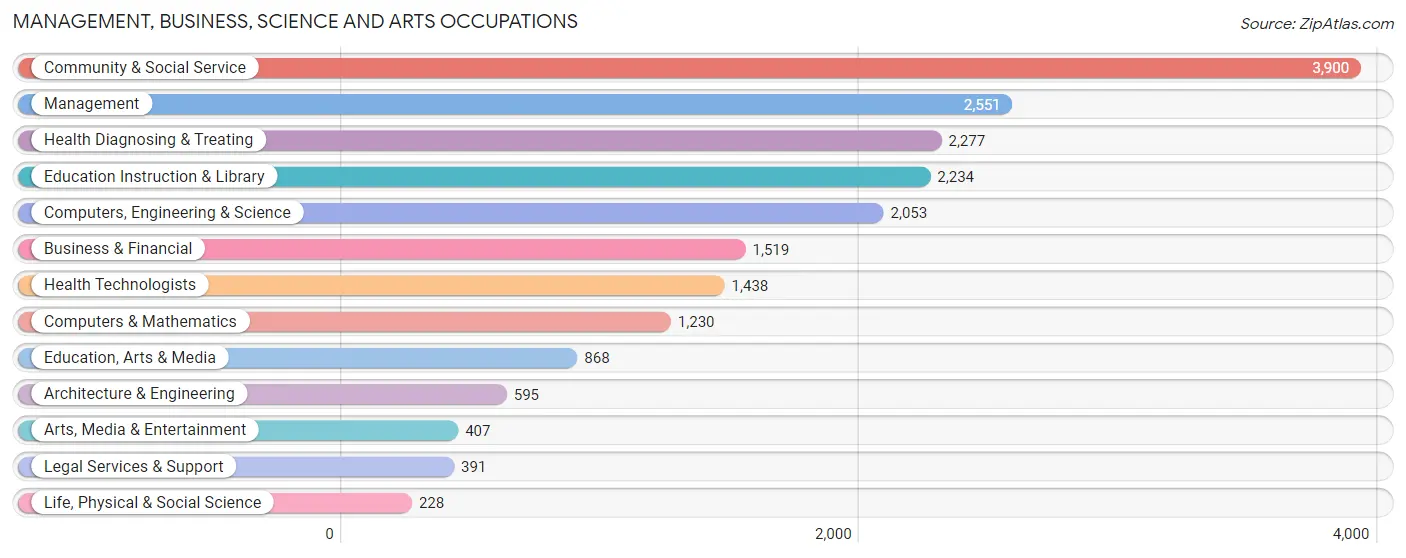
Management, Business, Science and Arts Occupations
The most common Management, Business, Science and Arts occupations in Irondequoit are Community & Social Service (3,900 | 14.9%), Management (2,551 | 9.8%), Health Diagnosing & Treating (2,277 | 8.7%), Education Instruction & Library (2,234 | 8.6%), and Computers, Engineering & Science (2,053 | 7.9%).
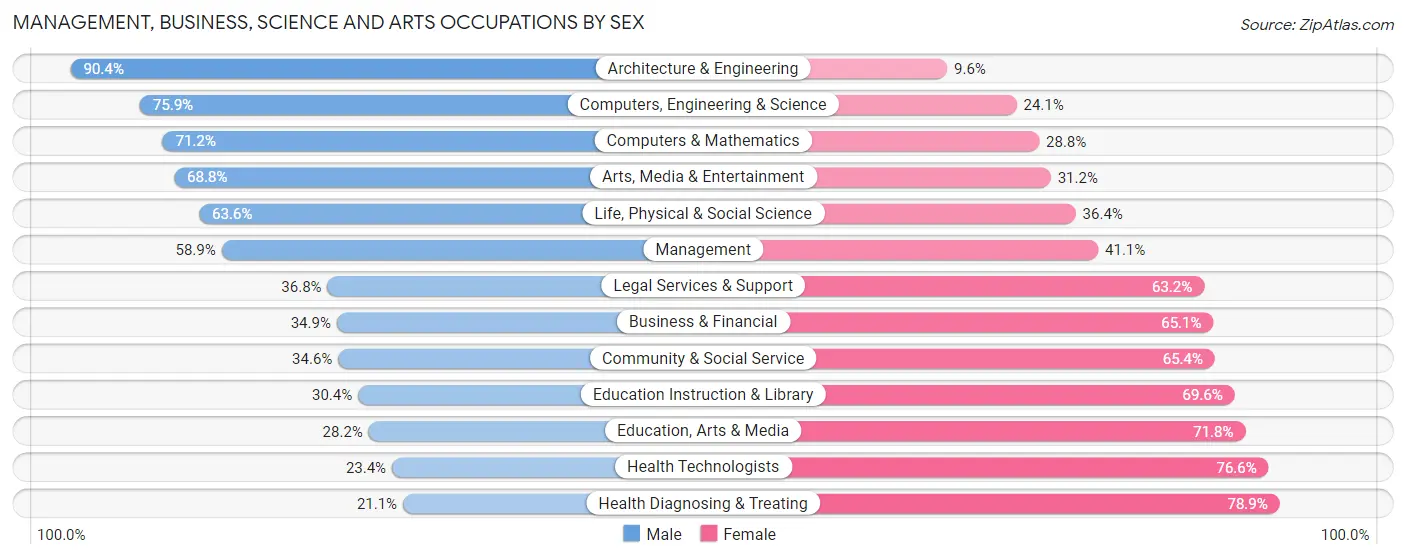
Management, Business, Science and Arts Occupations by Sex
Within the Management, Business, Science and Arts occupations in Irondequoit, the most male-oriented occupations are Architecture & Engineering (90.4%), Computers, Engineering & Science (75.9%), and Computers & Mathematics (71.2%), while the most female-oriented occupations are Health Diagnosing & Treating (78.9%), Health Technologists (76.6%), and Education, Arts & Media (71.8%).
| Occupation | Male | Female |
| Management | 1,503 (58.9%) | 1,048 (41.1%) |
| Business & Financial | 530 (34.9%) | 989 (65.1%) |
| Computers, Engineering & Science | 1,559 (75.9%) | 494 (24.1%) |
| Computers & Mathematics | 876 (71.2%) | 354 (28.8%) |
| Architecture & Engineering | 538 (90.4%) | 57 (9.6%) |
| Life, Physical & Social Science | 145 (63.6%) | 83 (36.4%) |
| Community & Social Service | 1,349 (34.6%) | 2,551 (65.4%) |
| Education, Arts & Media | 245 (28.2%) | 623 (71.8%) |
| Legal Services & Support | 144 (36.8%) | 247 (63.2%) |
| Education Instruction & Library | 680 (30.4%) | 1,554 (69.6%) |
| Arts, Media & Entertainment | 280 (68.8%) | 127 (31.2%) |
| Health Diagnosing & Treating | 480 (21.1%) | 1,797 (78.9%) |
| Health Technologists | 336 (23.4%) | 1,102 (76.6%) |
| Total (Category) | 5,421 (44.1%) | 6,879 (55.9%) |
| Total (Overall) | 13,012 (49.8%) | 13,111 (50.2%) |
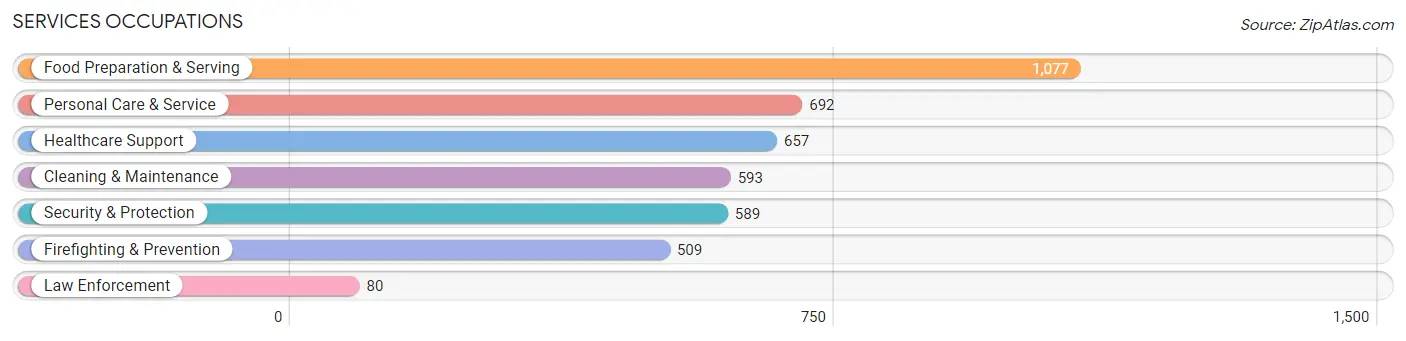
Services Occupations
The most common Services occupations in Irondequoit are Food Preparation & Serving (1,077 | 4.1%), Personal Care & Service (692 | 2.6%), Healthcare Support (657 | 2.5%), Cleaning & Maintenance (593 | 2.3%), and Security & Protection (589 | 2.2%).
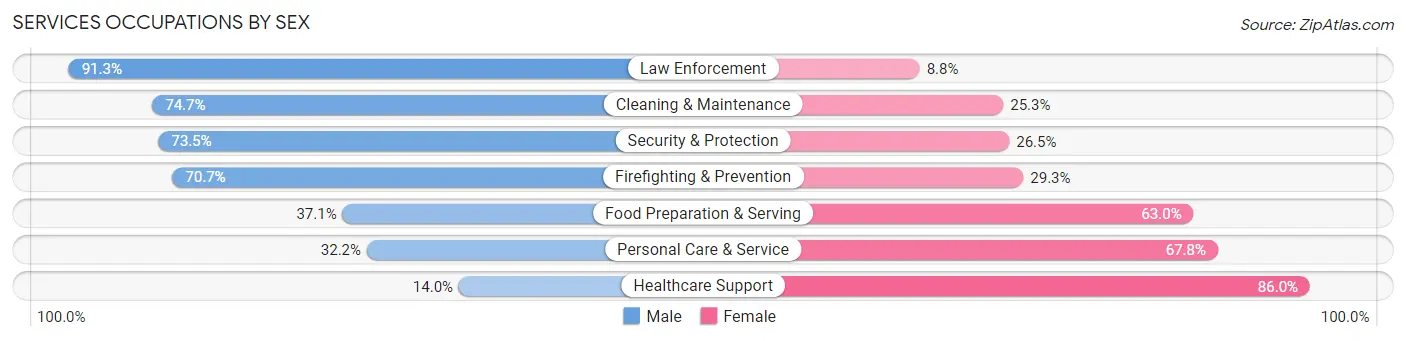
Services Occupations by Sex
Within the Services occupations in Irondequoit, the most male-oriented occupations are Law Enforcement (91.2%), Cleaning & Maintenance (74.7%), and Security & Protection (73.5%), while the most female-oriented occupations are Healthcare Support (86.0%), Personal Care & Service (67.8%), and Food Preparation & Serving (62.9%).
| Occupation | Male | Female |
| Healthcare Support | 92 (14.0%) | 565 (86.0%) |
| Security & Protection | 433 (73.5%) | 156 (26.5%) |
| Firefighting & Prevention | 360 (70.7%) | 149 (29.3%) |
| Law Enforcement | 73 (91.2%) | 7 (8.7%) |
| Food Preparation & Serving | 399 (37.0%) | 678 (62.9%) |
| Cleaning & Maintenance | 443 (74.7%) | 150 (25.3%) |
| Personal Care & Service | 223 (32.2%) | 469 (67.8%) |
| Total (Category) | 1,590 (44.1%) | 2,018 (55.9%) |
| Total (Overall) | 13,012 (49.8%) | 13,111 (50.2%) |
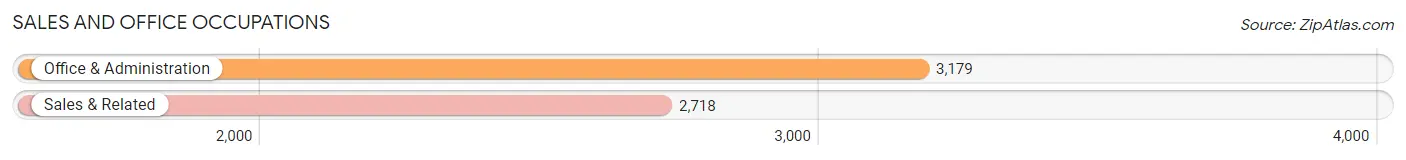
Sales and Office Occupations
The most common Sales and Office occupations in Irondequoit are Office & Administration (3,179 | 12.2%), and Sales & Related (2,718 | 10.4%).
Sales and Office Occupations by Sex
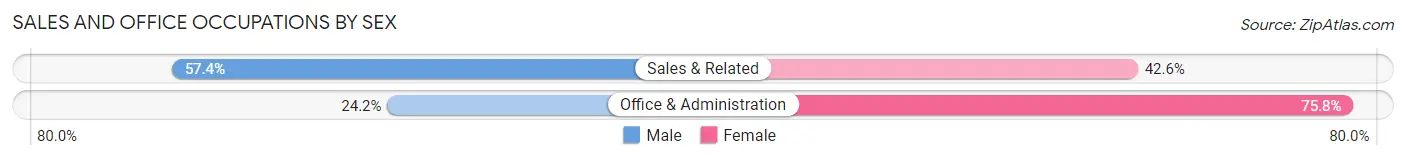
| Occupation | Male | Female |
| Sales & Related | 1,559 (57.4%) | 1,159 (42.6%) |
| Office & Administration | 769 (24.2%) | 2,410 (75.8%) |
| Total (Category) | 2,328 (39.5%) | 3,569 (60.5%) |
| Total (Overall) | 13,012 (49.8%) | 13,111 (50.2%) |
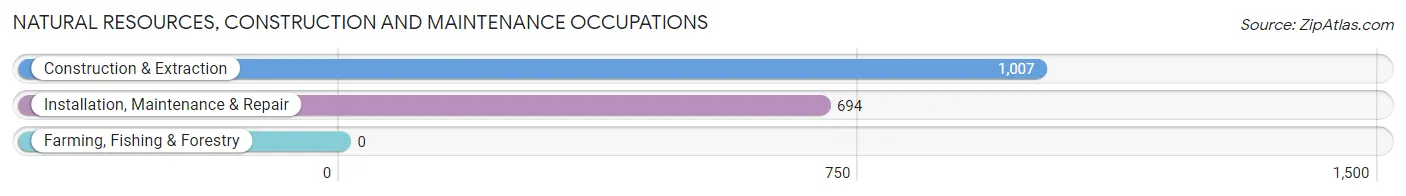
Natural Resources, Construction and Maintenance Occupations
The most common Natural Resources, Construction and Maintenance occupations in Irondequoit are Construction & Extraction (1,007 | 3.8%), and Installation, Maintenance & Repair (694 | 2.7%).
Natural Resources, Construction and Maintenance Occupations by Sex
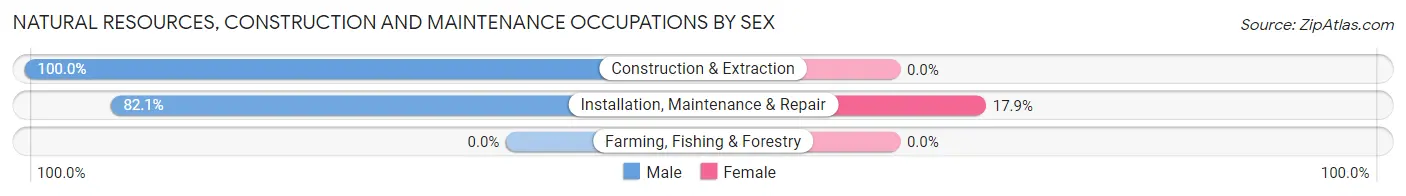
| Occupation | Male | Female |
| Farming, Fishing & Forestry | 0 (0.0%) | 0 (0.0%) |
| Construction & Extraction | 1,007 (100.0%) | 0 (0.0%) |
| Installation, Maintenance & Repair | 570 (82.1%) | 124 (17.9%) |
| Total (Category) | 1,577 (92.7%) | 124 (7.3%) |
| Total (Overall) | 13,012 (49.8%) | 13,111 (50.2%) |
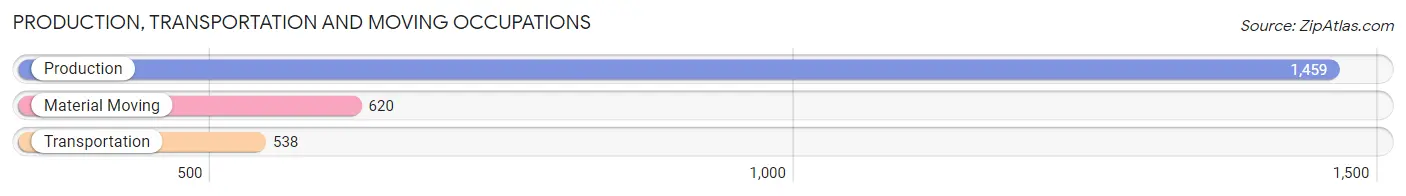
Production, Transportation and Moving Occupations
The most common Production, Transportation and Moving occupations in Irondequoit are Production (1,459 | 5.6%), Material Moving (620 | 2.4%), and Transportation (538 | 2.1%).
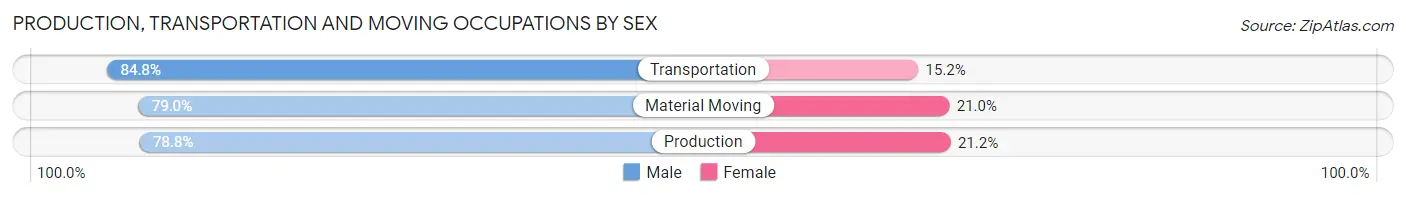
Production, Transportation and Moving Occupations by Sex
| Occupation | Male | Female |
| Production | 1,150 (78.8%) | 309 (21.2%) |
| Transportation | 456 (84.8%) | 82 (15.2%) |
| Material Moving | 490 (79.0%) | 130 (21.0%) |
| Total (Category) | 2,096 (80.1%) | 521 (19.9%) |
| Total (Overall) | 13,012 (49.8%) | 13,111 (50.2%) |
Employment Industries by Sex in Irondequoit
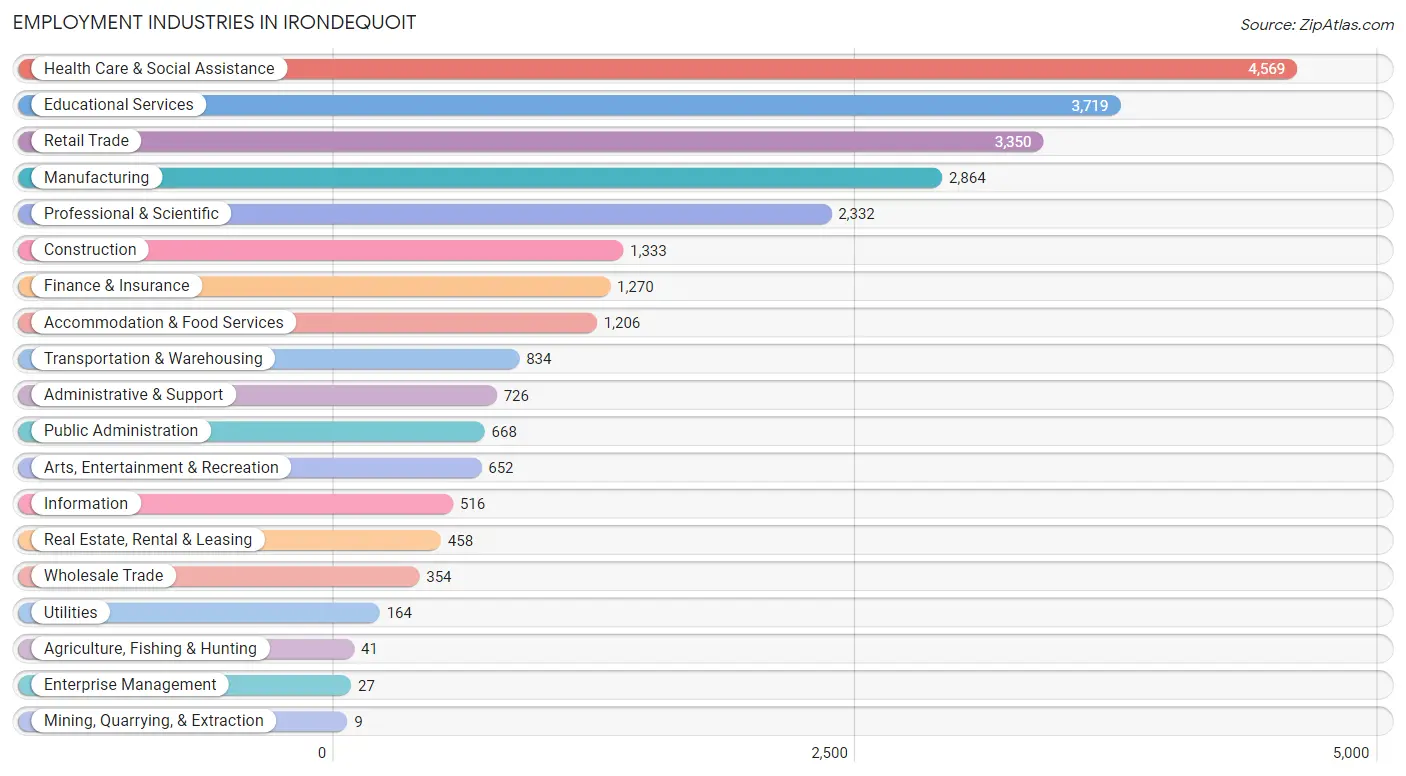
Employment Industries in Irondequoit
The major employment industries in Irondequoit include Health Care & Social Assistance (4,569 | 17.5%), Educational Services (3,719 | 14.2%), Retail Trade (3,350 | 12.8%), Manufacturing (2,864 | 11.0%), and Professional & Scientific (2,332 | 8.9%).
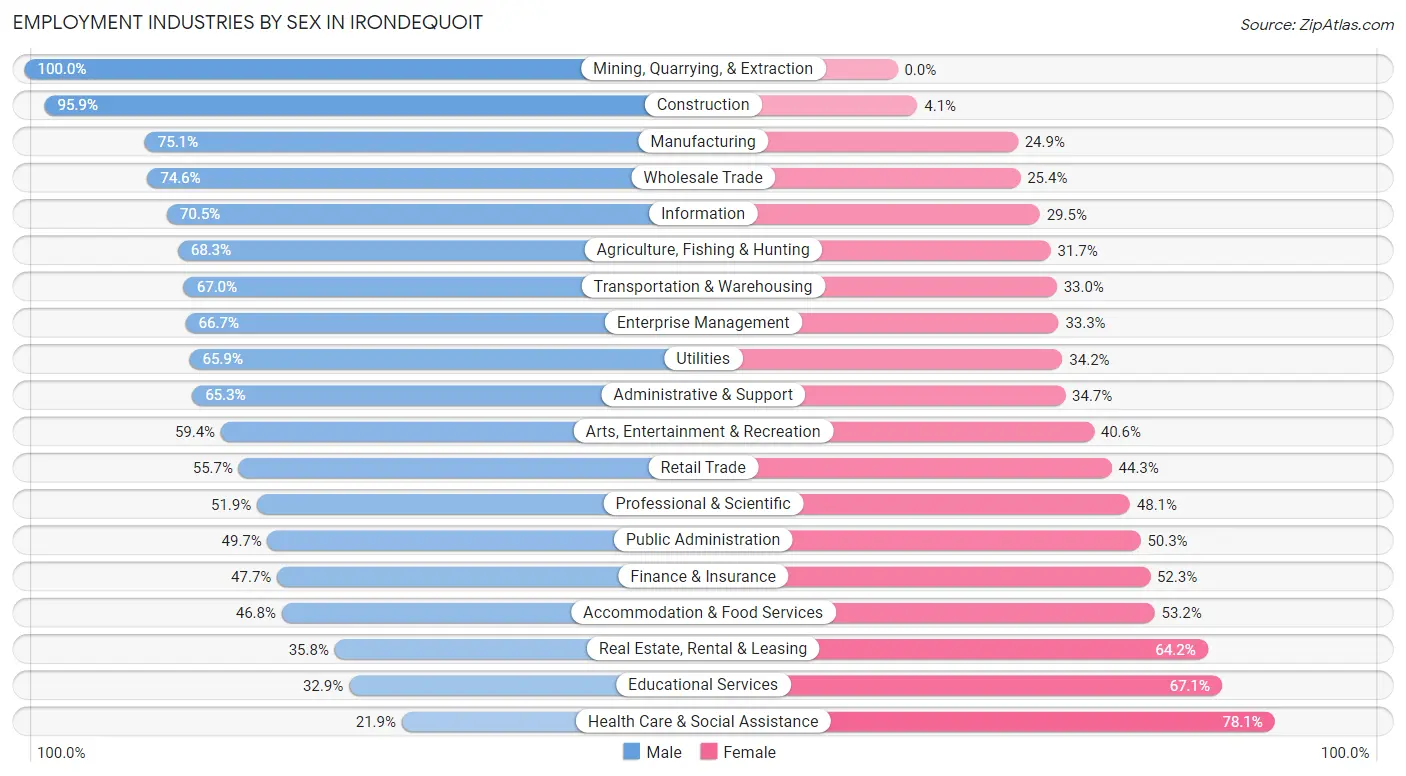
Employment Industries by Sex in Irondequoit
The Irondequoit industries that see more men than women are Mining, Quarrying, & Extraction (100.0%), Construction (95.9%), and Manufacturing (75.1%), whereas the industries that tend to have a higher number of women are Health Care & Social Assistance (78.1%), Educational Services (67.1%), and Real Estate, Rental & Leasing (64.2%).
| Industry | Male | Female |
| Agriculture, Fishing & Hunting | 28 (68.3%) | 13 (31.7%) |
| Mining, Quarrying, & Extraction | 9 (100.0%) | 0 (0.0%) |
| Construction | 1,278 (95.9%) | 55 (4.1%) |
| Manufacturing | 2,151 (75.1%) | 713 (24.9%) |
| Wholesale Trade | 264 (74.6%) | 90 (25.4%) |
| Retail Trade | 1,865 (55.7%) | 1,485 (44.3%) |
| Transportation & Warehousing | 559 (67.0%) | 275 (33.0%) |
| Utilities | 108 (65.8%) | 56 (34.2%) |
| Information | 364 (70.5%) | 152 (29.5%) |
| Finance & Insurance | 606 (47.7%) | 664 (52.3%) |
| Real Estate, Rental & Leasing | 164 (35.8%) | 294 (64.2%) |
| Professional & Scientific | 1,210 (51.9%) | 1,122 (48.1%) |
| Enterprise Management | 18 (66.7%) | 9 (33.3%) |
| Administrative & Support | 474 (65.3%) | 252 (34.7%) |
| Educational Services | 1,222 (32.9%) | 2,497 (67.1%) |
| Health Care & Social Assistance | 1,002 (21.9%) | 3,567 (78.1%) |
| Arts, Entertainment & Recreation | 387 (59.4%) | 265 (40.6%) |
| Accommodation & Food Services | 564 (46.8%) | 642 (53.2%) |
| Public Administration | 332 (49.7%) | 336 (50.3%) |
| Total | 13,012 (49.8%) | 13,111 (50.2%) |
Education in Irondequoit
School Enrollment in Irondequoit
The most common levels of schooling among the 9,386 students in Irondequoit are middle school (2,241 | 23.9%), high school (2,056 | 21.9%), and elementary school (1,916 | 20.4%).
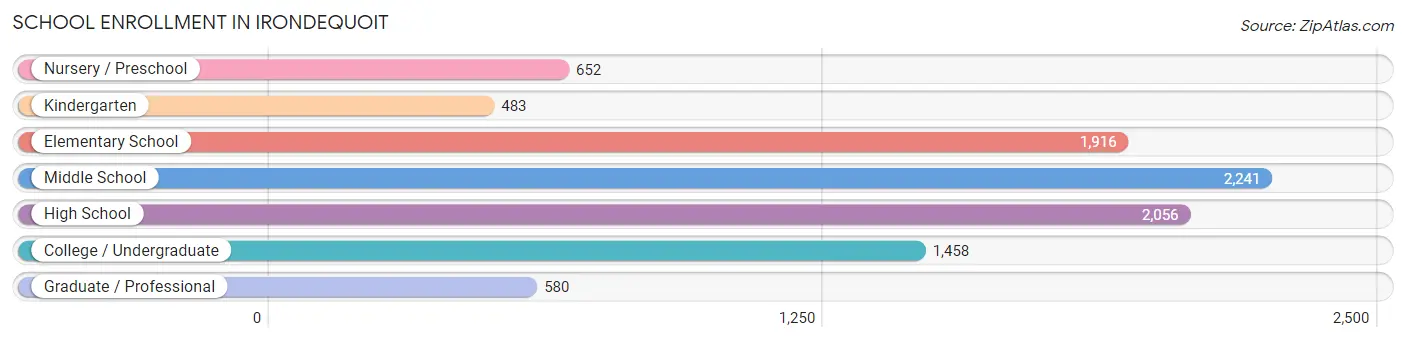
| School Level | # Students | % Students |
| Nursery / Preschool | 652 | 7.0% |
| Kindergarten | 483 | 5.1% |
| Elementary School | 1,916 | 20.4% |
| Middle School | 2,241 | 23.9% |
| High School | 2,056 | 21.9% |
| College / Undergraduate | 1,458 | 15.5% |
| Graduate / Professional | 580 | 6.2% |
| Total | 9,386 | 100.0% |
School Enrollment by Age by Funding Source in Irondequoit
Out of a total of 9,386 students who are enrolled in schools in Irondequoit, 1,887 (20.1%) attend a private institution, while the remaining 7,499 (79.9%) are enrolled in public schools. The age group of 3 to 4 year olds has the highest likelihood of being enrolled in private schools, with 207 (51.5% in the age bracket) enrolled. Conversely, the age group of 5 to 9 year old has the lowest likelihood of being enrolled in a private school, with 2,130 (90.8% in the age bracket) attending a public institution.
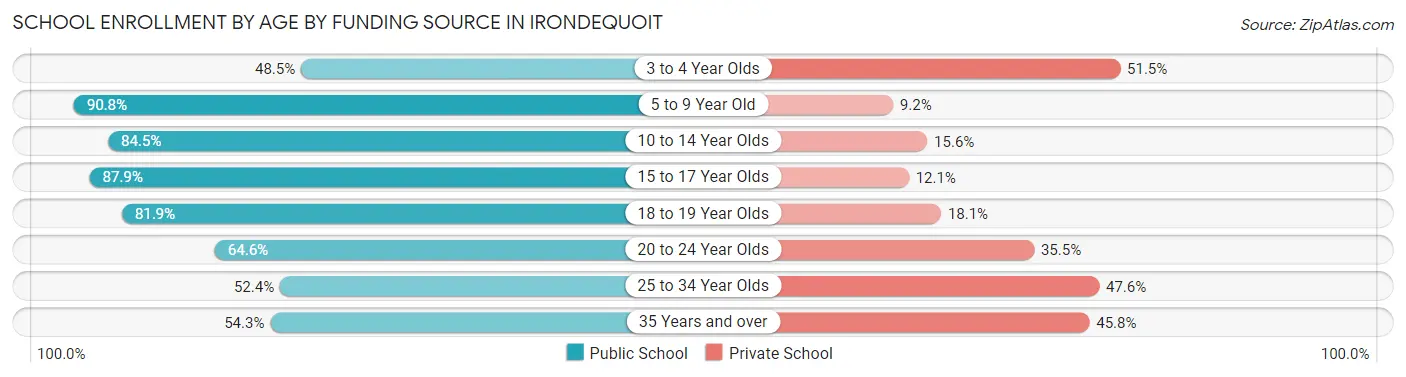
| Age Bracket | Public School | Private School |
| 3 to 4 Year Olds | 195 (48.5%) | 207 (51.5%) |
| 5 to 9 Year Old | 2,130 (90.8%) | 215 (9.2%) |
| 10 to 14 Year Olds | 2,428 (84.5%) | 447 (15.5%) |
| 15 to 17 Year Olds | 1,386 (87.9%) | 191 (12.1%) |
| 18 to 19 Year Olds | 348 (81.9%) | 77 (18.1%) |
| 20 to 24 Year Olds | 426 (64.5%) | 234 (35.4%) |
| 25 to 34 Year Olds | 399 (52.4%) | 362 (47.6%) |
| 35 Years and over | 185 (54.2%) | 156 (45.8%) |
| Total | 7,499 (79.9%) | 1,887 (20.1%) |
Educational Attainment by Field of Study in Irondequoit
Business (2,641 | 15.8%), education (2,299 | 13.8%), science & technology (1,829 | 11.0%), social sciences (1,158 | 6.9%), and arts & humanities (1,066 | 6.4%) are the most common fields of study among 16,676 individuals in Irondequoit who have obtained a bachelor's degree or higher.
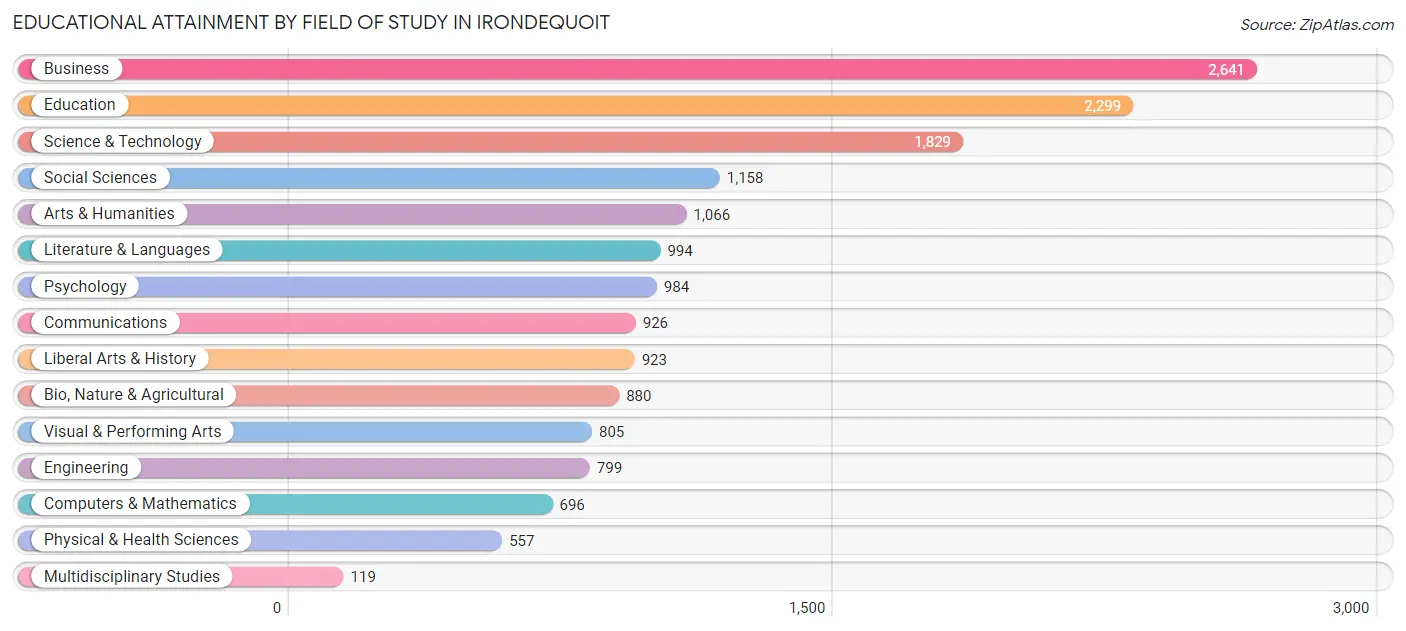
| Field of Study | # Graduates | % Graduates |
| Computers & Mathematics | 696 | 4.2% |
| Bio, Nature & Agricultural | 880 | 5.3% |
| Physical & Health Sciences | 557 | 3.3% |
| Psychology | 984 | 5.9% |
| Social Sciences | 1,158 | 6.9% |
| Engineering | 799 | 4.8% |
| Multidisciplinary Studies | 119 | 0.7% |
| Science & Technology | 1,829 | 11.0% |
| Business | 2,641 | 15.8% |
| Education | 2,299 | 13.8% |
| Literature & Languages | 994 | 6.0% |
| Liberal Arts & History | 923 | 5.5% |
| Visual & Performing Arts | 805 | 4.8% |
| Communications | 926 | 5.6% |
| Arts & Humanities | 1,066 | 6.4% |
| Total | 16,676 | 100.0% |
Transportation & Commute in Irondequoit
Vehicle Availability by Sex in Irondequoit
The most prevalent vehicle ownership categories in Irondequoit are males with 2 vehicles (7,033, accounting for 55.0%) and females with 2 vehicles (6,463, making up 55.3%).
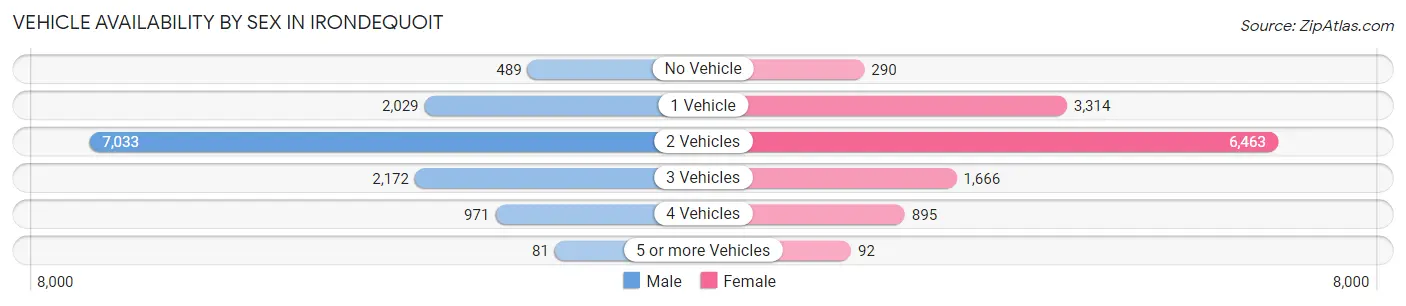
| Vehicles Available | Male | Female |
| No Vehicle | 489 (3.8%) | 290 (2.3%) |
| 1 Vehicle | 2,029 (15.9%) | 3,314 (26.1%) |
| 2 Vehicles | 7,033 (55.0%) | 6,463 (50.8%) |
| 3 Vehicles | 2,172 (17.0%) | 1,666 (13.1%) |
| 4 Vehicles | 971 (7.6%) | 895 (7.0%) |
| 5 or more Vehicles | 81 (0.6%) | 92 (0.7%) |
| Total | 12,775 (100.0%) | 12,720 (100.0%) |
Commute Time in Irondequoit
The most frequently occuring commute durations in Irondequoit are 20 to 24 minutes (5,721 commuters, 24.7%), 15 to 19 minutes (4,727 commuters, 20.4%), and 10 to 14 minutes (4,309 commuters, 18.6%).
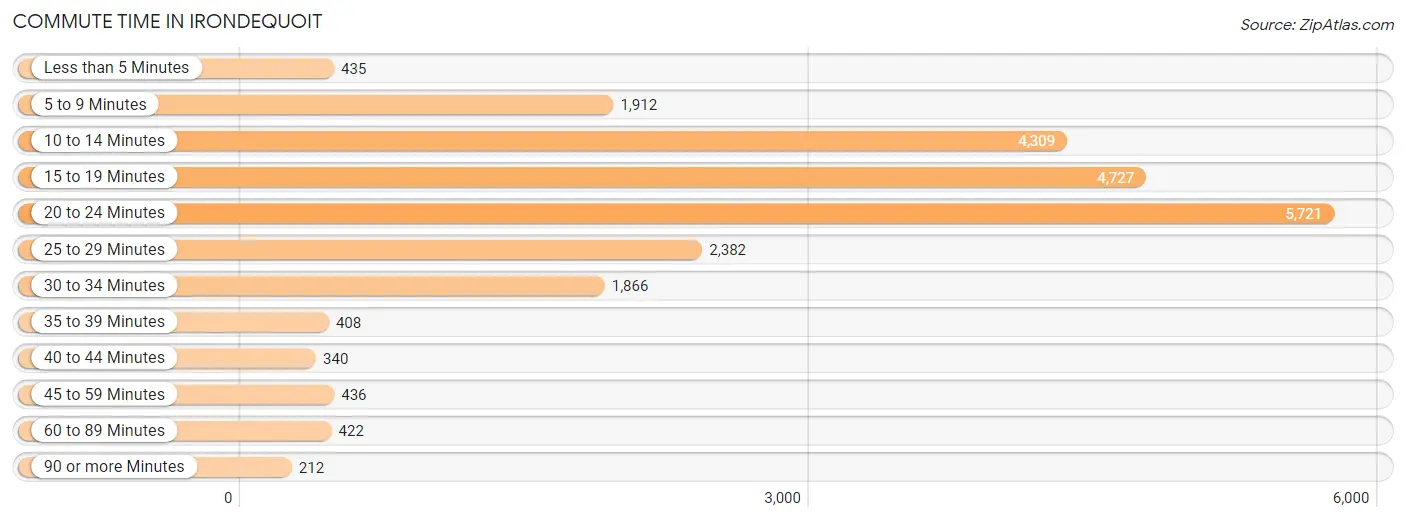
| Commute Time | # Commuters | % Commuters |
| Less than 5 Minutes | 435 | 1.9% |
| 5 to 9 Minutes | 1,912 | 8.3% |
| 10 to 14 Minutes | 4,309 | 18.6% |
| 15 to 19 Minutes | 4,727 | 20.4% |
| 20 to 24 Minutes | 5,721 | 24.7% |
| 25 to 29 Minutes | 2,382 | 10.3% |
| 30 to 34 Minutes | 1,866 | 8.1% |
| 35 to 39 Minutes | 408 | 1.8% |
| 40 to 44 Minutes | 340 | 1.5% |
| 45 to 59 Minutes | 436 | 1.9% |
| 60 to 89 Minutes | 422 | 1.8% |
| 90 or more Minutes | 212 | 0.9% |
Commute Time by Sex in Irondequoit
The most common commute times in Irondequoit are 20 to 24 minutes (3,135 commuters, 26.5%) for males and 20 to 24 minutes (2,586 commuters, 22.8%) for females.
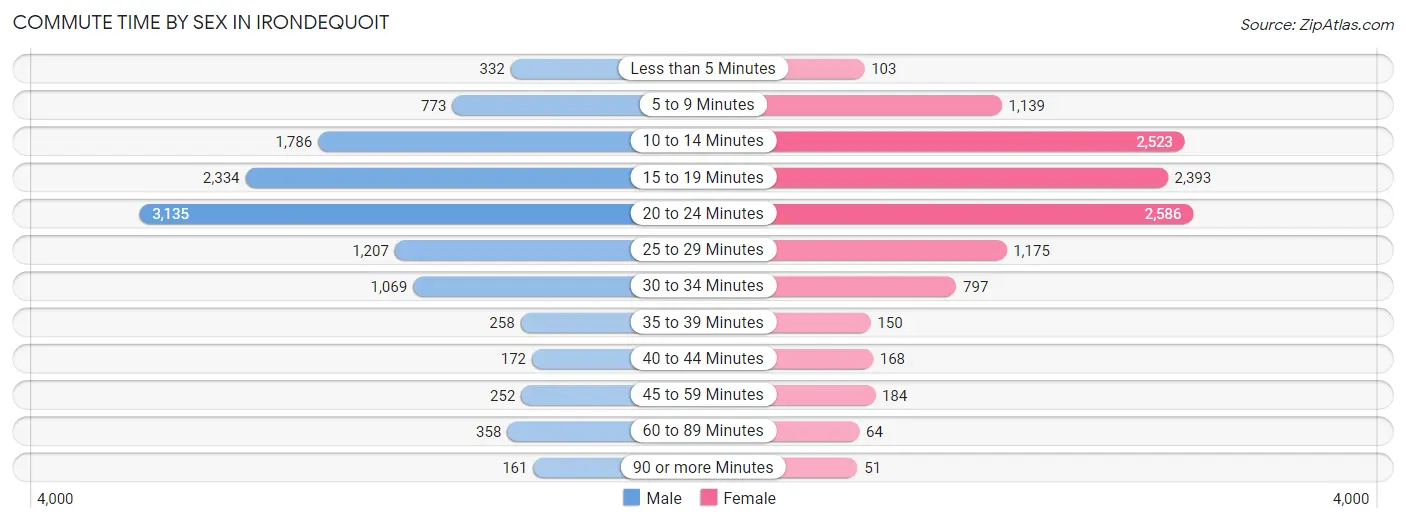
| Commute Time | Male | Female |
| Less than 5 Minutes | 332 (2.8%) | 103 (0.9%) |
| 5 to 9 Minutes | 773 (6.5%) | 1,139 (10.1%) |
| 10 to 14 Minutes | 1,786 (15.1%) | 2,523 (22.3%) |
| 15 to 19 Minutes | 2,334 (19.7%) | 2,393 (21.1%) |
| 20 to 24 Minutes | 3,135 (26.5%) | 2,586 (22.8%) |
| 25 to 29 Minutes | 1,207 (10.2%) | 1,175 (10.4%) |
| 30 to 34 Minutes | 1,069 (9.0%) | 797 (7.0%) |
| 35 to 39 Minutes | 258 (2.2%) | 150 (1.3%) |
| 40 to 44 Minutes | 172 (1.5%) | 168 (1.5%) |
| 45 to 59 Minutes | 252 (2.1%) | 184 (1.6%) |
| 60 to 89 Minutes | 358 (3.0%) | 64 (0.6%) |
| 90 or more Minutes | 161 (1.4%) | 51 (0.4%) |
Time of Departure to Work by Sex in Irondequoit
The most frequent times of departure to work in Irondequoit are 7:00 AM to 7:29 AM (1,613, 13.6%) for males and 7:00 AM to 7:29 AM (2,134, 18.8%) for females.
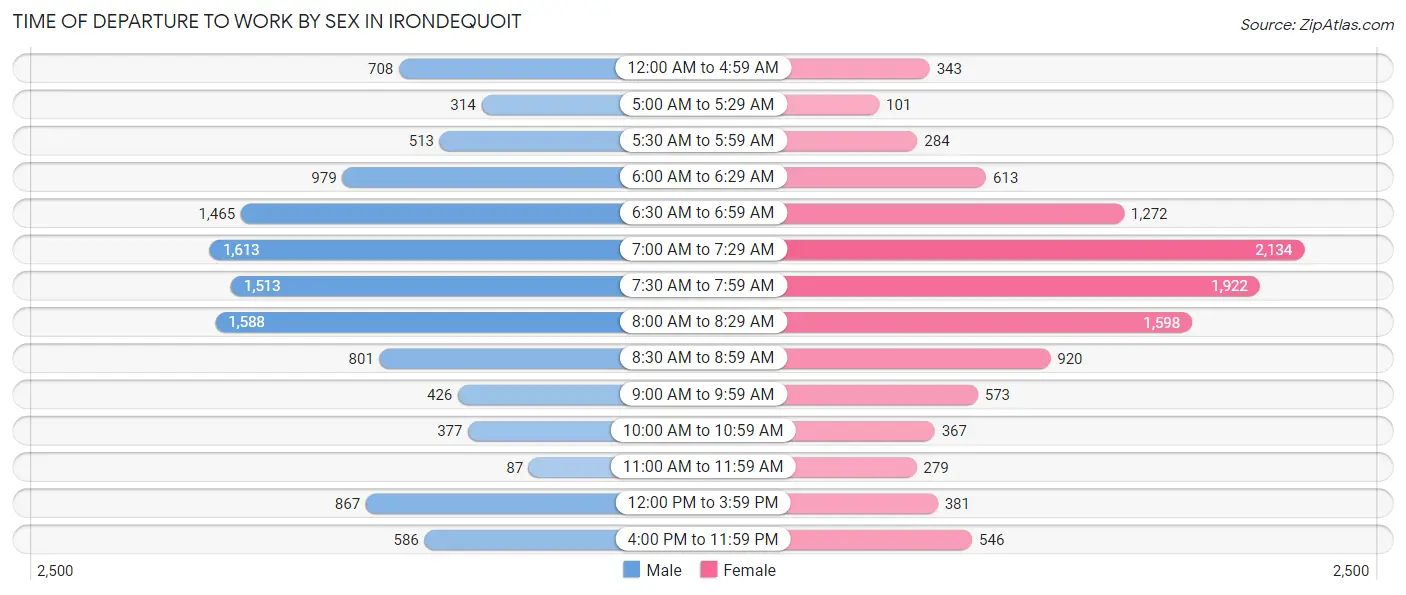
| Time of Departure | Male | Female |
| 12:00 AM to 4:59 AM | 708 (6.0%) | 343 (3.0%) |
| 5:00 AM to 5:29 AM | 314 (2.6%) | 101 (0.9%) |
| 5:30 AM to 5:59 AM | 513 (4.3%) | 284 (2.5%) |
| 6:00 AM to 6:29 AM | 979 (8.3%) | 613 (5.4%) |
| 6:30 AM to 6:59 AM | 1,465 (12.4%) | 1,272 (11.2%) |
| 7:00 AM to 7:29 AM | 1,613 (13.6%) | 2,134 (18.8%) |
| 7:30 AM to 7:59 AM | 1,513 (12.8%) | 1,922 (17.0%) |
| 8:00 AM to 8:29 AM | 1,588 (13.4%) | 1,598 (14.1%) |
| 8:30 AM to 8:59 AM | 801 (6.8%) | 920 (8.1%) |
| 9:00 AM to 9:59 AM | 426 (3.6%) | 573 (5.1%) |
| 10:00 AM to 10:59 AM | 377 (3.2%) | 367 (3.2%) |
| 11:00 AM to 11:59 AM | 87 (0.7%) | 279 (2.5%) |
| 12:00 PM to 3:59 PM | 867 (7.3%) | 381 (3.4%) |
| 4:00 PM to 11:59 PM | 586 (5.0%) | 546 (4.8%) |
| Total | 11,837 (100.0%) | 11,333 (100.0%) |
Housing Occupancy in Irondequoit
Occupancy by Ownership in Irondequoit
Of the total 22,469 dwellings in Irondequoit, owner-occupied units account for 17,709 (78.8%), while renter-occupied units make up 4,760 (21.2%).
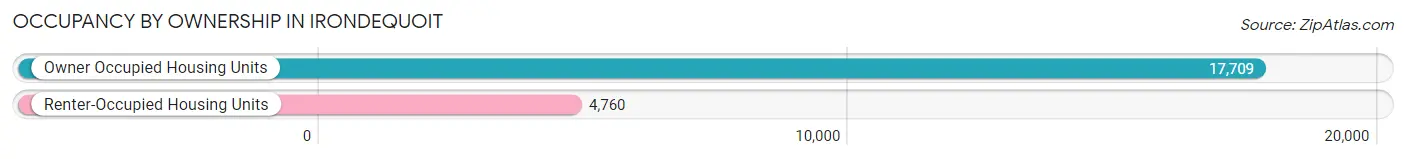
| Occupancy | # Housing Units | % Housing Units |
| Owner Occupied Housing Units | 17,709 | 78.8% |
| Renter-Occupied Housing Units | 4,760 | 21.2% |
| Total Occupied Housing Units | 22,469 | 100.0% |
Occupancy by Household Size in Irondequoit
| Household Size | # Housing Units | % Housing Units |
| 1-Person Household | 7,111 | 31.7% |
| 2-Person Household | 8,613 | 38.3% |
| 3-Person Household | 3,510 | 15.6% |
| 4+ Person Household | 3,235 | 14.4% |
| Total Housing Units | 22,469 | 100.0% |
Occupancy by Ownership by Household Size in Irondequoit
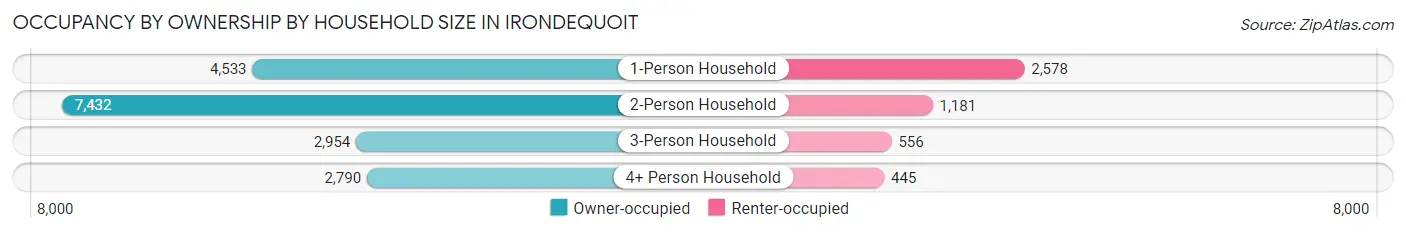
| Household Size | Owner-occupied | Renter-occupied |
| 1-Person Household | 4,533 (63.7%) | 2,578 (36.2%) |
| 2-Person Household | 7,432 (86.3%) | 1,181 (13.7%) |
| 3-Person Household | 2,954 (84.2%) | 556 (15.8%) |
| 4+ Person Household | 2,790 (86.2%) | 445 (13.8%) |
| Total Housing Units | 17,709 (78.8%) | 4,760 (21.2%) |
Occupancy by Educational Attainment in Irondequoit
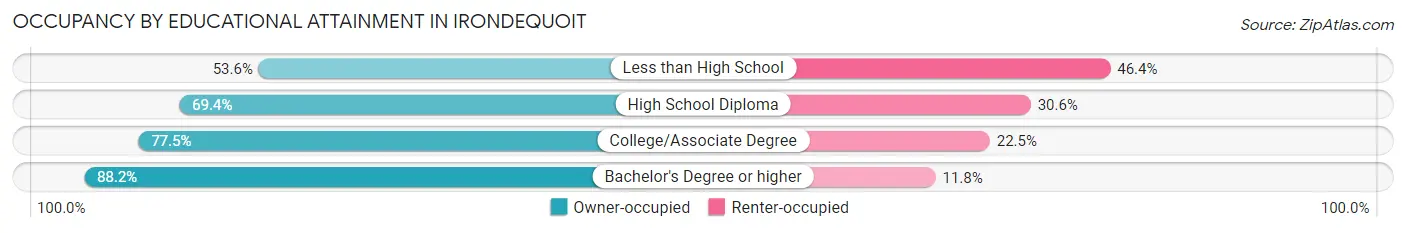
| Household Size | Owner-occupied | Renter-occupied |
| Less than High School | 673 (53.6%) | 583 (46.4%) |
| High School Diploma | 3,275 (69.4%) | 1,447 (30.6%) |
| College/Associate Degree | 5,681 (77.5%) | 1,652 (22.5%) |
| Bachelor's Degree or higher | 8,080 (88.2%) | 1,078 (11.8%) |
Occupancy by Age of Householder in Irondequoit
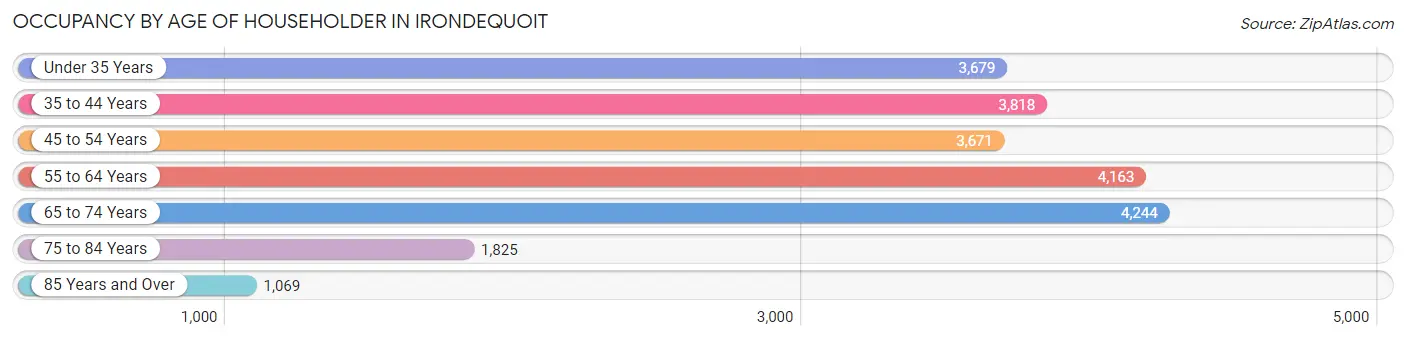
| Age Bracket | # Households | % Households |
| Under 35 Years | 3,679 | 16.4% |
| 35 to 44 Years | 3,818 | 17.0% |
| 45 to 54 Years | 3,671 | 16.3% |
| 55 to 64 Years | 4,163 | 18.5% |
| 65 to 74 Years | 4,244 | 18.9% |
| 75 to 84 Years | 1,825 | 8.1% |
| 85 Years and Over | 1,069 | 4.8% |
| Total | 22,469 | 100.0% |
Housing Finances in Irondequoit
Median Income by Occupancy in Irondequoit
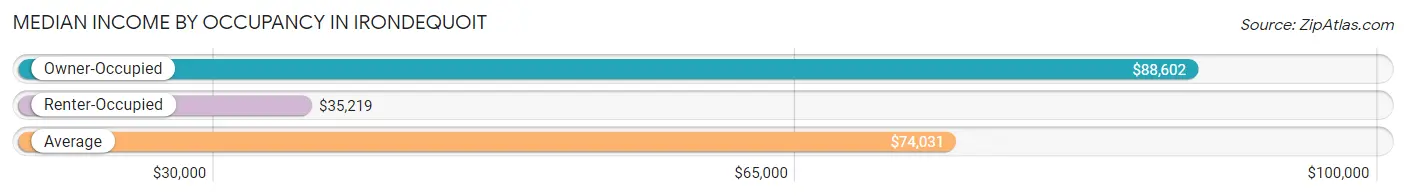
| Occupancy Type | # Households | Median Income |
| Owner-Occupied | 17,709 (78.8%) | $88,602 |
| Renter-Occupied | 4,760 (21.2%) | $35,219 |
| Average | 22,469 (100.0%) | $74,031 |
Occupancy by Householder Income Bracket in Irondequoit
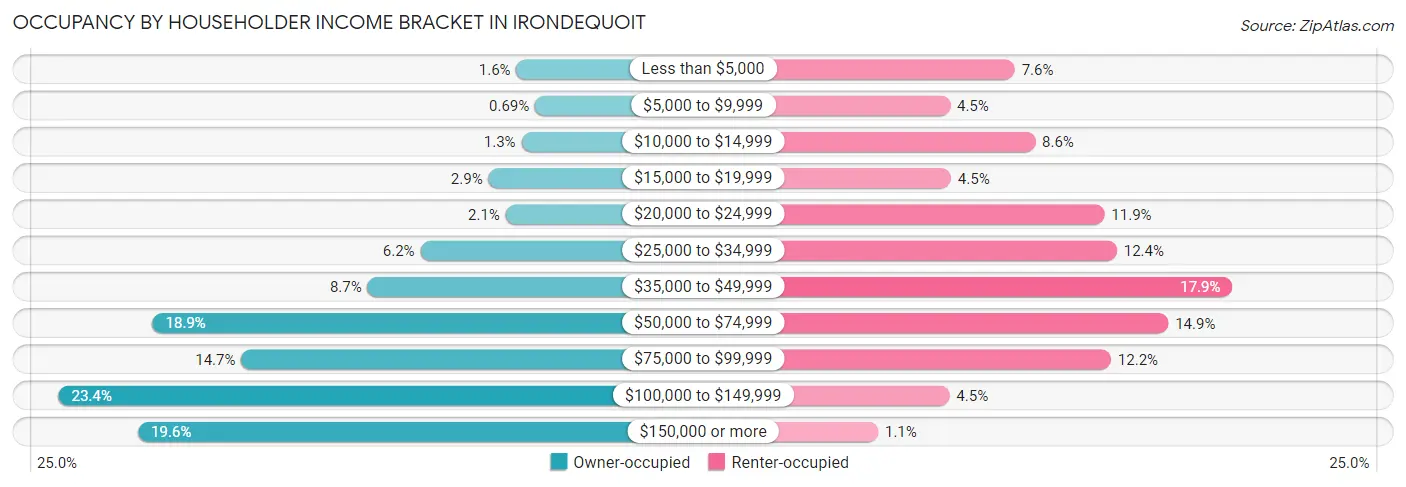
| Income Bracket | Owner-occupied | Renter-occupied |
| Less than $5,000 | 280 (1.6%) | 361 (7.6%) |
| $5,000 to $9,999 | 122 (0.7%) | 214 (4.5%) |
| $10,000 to $14,999 | 238 (1.3%) | 407 (8.6%) |
| $15,000 to $19,999 | 515 (2.9%) | 216 (4.5%) |
| $20,000 to $24,999 | 370 (2.1%) | 564 (11.8%) |
| $25,000 to $34,999 | 1,089 (6.1%) | 592 (12.4%) |
| $35,000 to $49,999 | 1,535 (8.7%) | 854 (17.9%) |
| $50,000 to $74,999 | 3,348 (18.9%) | 709 (14.9%) |
| $75,000 to $99,999 | 2,600 (14.7%) | 579 (12.2%) |
| $100,000 to $149,999 | 4,141 (23.4%) | 213 (4.5%) |
| $150,000 or more | 3,471 (19.6%) | 51 (1.1%) |
| Total | 17,709 (100.0%) | 4,760 (100.0%) |
Monthly Housing Cost Tiers in Irondequoit
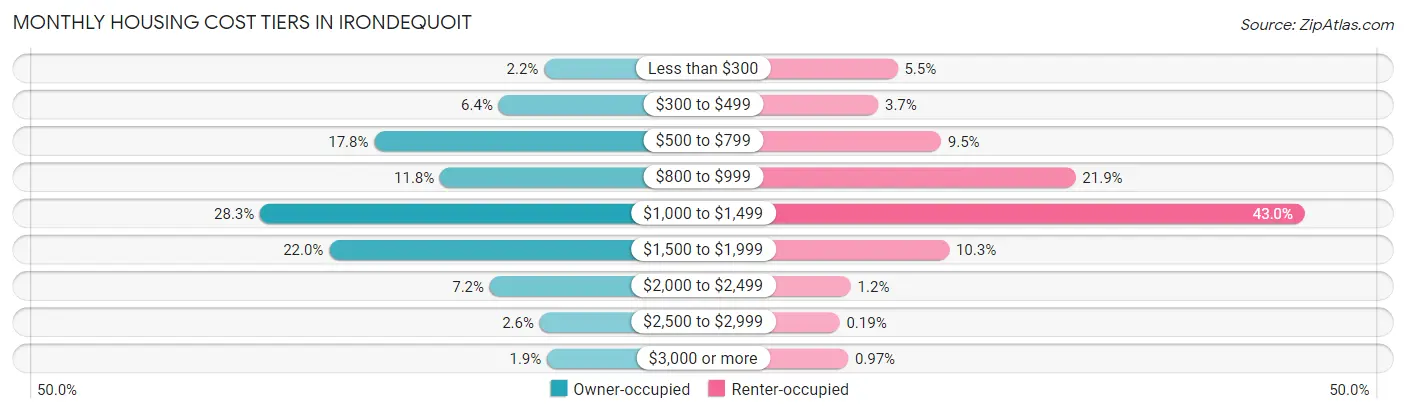
| Monthly Cost | Owner-occupied | Renter-occupied |
| Less than $300 | 384 (2.2%) | 263 (5.5%) |
| $300 to $499 | 1,124 (6.4%) | 178 (3.7%) |
| $500 to $799 | 3,154 (17.8%) | 453 (9.5%) |
| $800 to $999 | 2,081 (11.7%) | 1,043 (21.9%) |
| $1,000 to $1,499 | 5,016 (28.3%) | 2,048 (43.0%) |
| $1,500 to $1,999 | 3,889 (22.0%) | 489 (10.3%) |
| $2,000 to $2,499 | 1,269 (7.2%) | 58 (1.2%) |
| $2,500 to $2,999 | 456 (2.6%) | 9 (0.2%) |
| $3,000 or more | 336 (1.9%) | 46 (1.0%) |
| Total | 17,709 (100.0%) | 4,760 (100.0%) |
Physical Housing Characteristics in Irondequoit
Housing Structures in Irondequoit
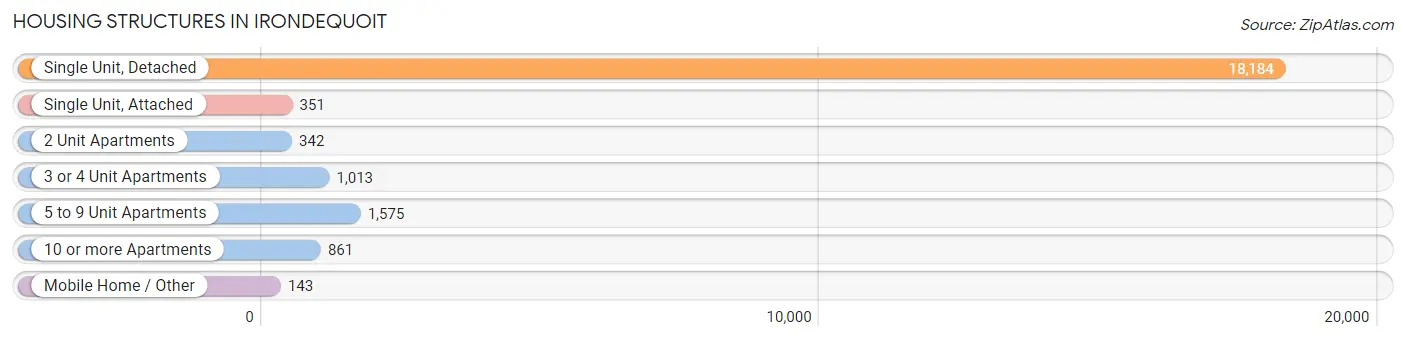
| Structure Type | # Housing Units | % Housing Units |
| Single Unit, Detached | 18,184 | 80.9% |
| Single Unit, Attached | 351 | 1.6% |
| 2 Unit Apartments | 342 | 1.5% |
| 3 or 4 Unit Apartments | 1,013 | 4.5% |
| 5 to 9 Unit Apartments | 1,575 | 7.0% |
| 10 or more Apartments | 861 | 3.8% |
| Mobile Home / Other | 143 | 0.6% |
| Total | 22,469 | 100.0% |
Housing Structures by Occupancy in Irondequoit
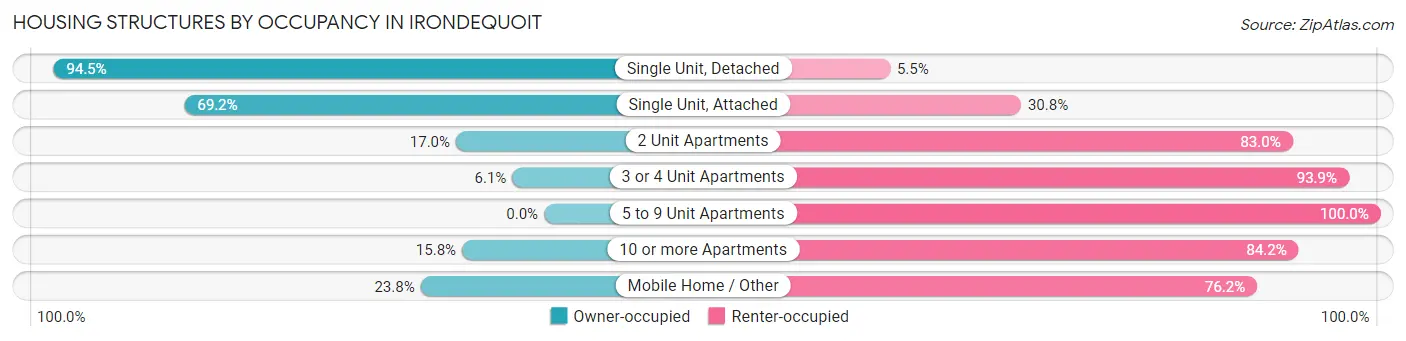
| Structure Type | Owner-occupied | Renter-occupied |
| Single Unit, Detached | 17,176 (94.5%) | 1,008 (5.5%) |
| Single Unit, Attached | 243 (69.2%) | 108 (30.8%) |
| 2 Unit Apartments | 58 (17.0%) | 284 (83.0%) |
| 3 or 4 Unit Apartments | 62 (6.1%) | 951 (93.9%) |
| 5 to 9 Unit Apartments | 0 (0.0%) | 1,575 (100.0%) |
| 10 or more Apartments | 136 (15.8%) | 725 (84.2%) |
| Mobile Home / Other | 34 (23.8%) | 109 (76.2%) |
| Total | 17,709 (78.8%) | 4,760 (21.2%) |
Housing Structures by Number of Rooms in Irondequoit
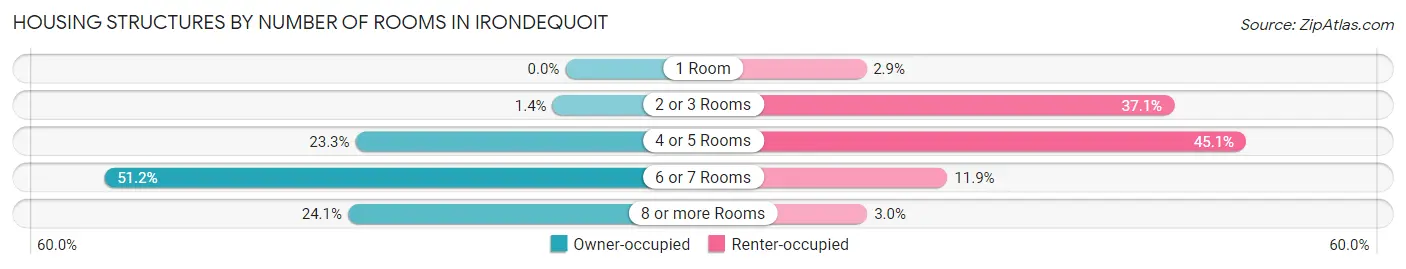
| Number of Rooms | Owner-occupied | Renter-occupied |
| 1 Room | 0 (0.0%) | 139 (2.9%) |
| 2 or 3 Rooms | 251 (1.4%) | 1,764 (37.1%) |
| 4 or 5 Rooms | 4,124 (23.3%) | 2,145 (45.1%) |
| 6 or 7 Rooms | 9,060 (51.2%) | 568 (11.9%) |
| 8 or more Rooms | 4,274 (24.1%) | 144 (3.0%) |
| Total | 17,709 (100.0%) | 4,760 (100.0%) |
Housing Structure by Heating Type in Irondequoit
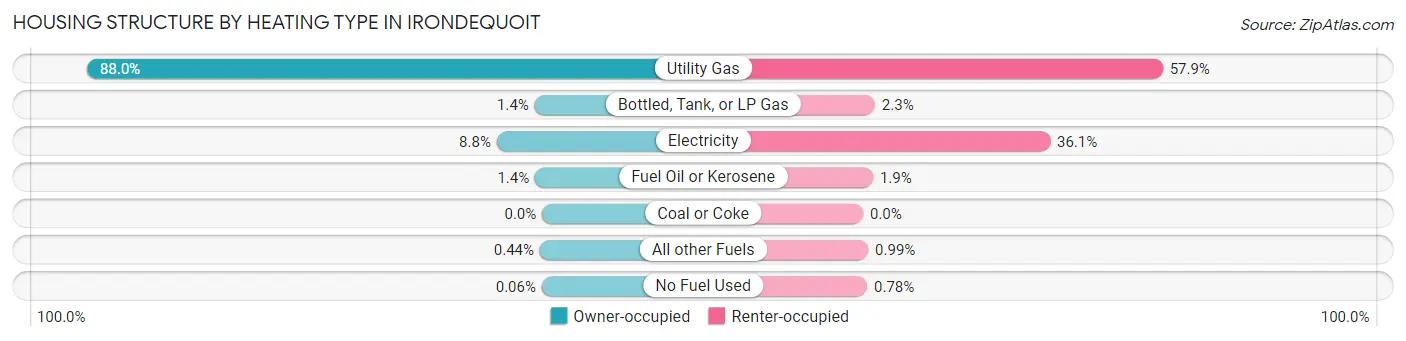
| Heating Type | Owner-occupied | Renter-occupied |
| Utility Gas | 15,575 (87.9%) | 2,756 (57.9%) |
| Bottled, Tank, or LP Gas | 253 (1.4%) | 109 (2.3%) |
| Electricity | 1,553 (8.8%) | 1,720 (36.1%) |
| Fuel Oil or Kerosene | 240 (1.4%) | 91 (1.9%) |
| Coal or Coke | 0 (0.0%) | 0 (0.0%) |
| All other Fuels | 78 (0.4%) | 47 (1.0%) |
| No Fuel Used | 10 (0.1%) | 37 (0.8%) |
| Total | 17,709 (100.0%) | 4,760 (100.0%) |
Household Vehicle Usage in Irondequoit
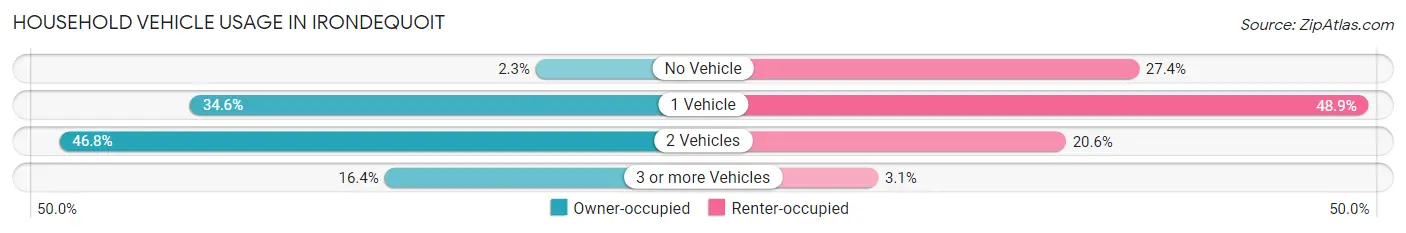
| Vehicles per Household | Owner-occupied | Renter-occupied |
| No Vehicle | 403 (2.3%) | 1,306 (27.4%) |
| 1 Vehicle | 6,122 (34.6%) | 2,326 (48.9%) |
| 2 Vehicles | 8,279 (46.8%) | 981 (20.6%) |
| 3 or more Vehicles | 2,905 (16.4%) | 147 (3.1%) |
| Total | 17,709 (100.0%) | 4,760 (100.0%) |
Real Estate & Mortgages in Irondequoit
Real Estate and Mortgage Overview in Irondequoit
| Characteristic | Without Mortgage | With Mortgage |
| Housing Units | 6,370 | 11,339 |
| Median Property Value | $150,800 | $157,300 |
| Median Household Income | $67,611 | $2,587 |
| Monthly Housing Costs | $680 | $297 |
| Real Estate Taxes | $4,868 | $195 |
Property Value by Mortgage Status in Irondequoit
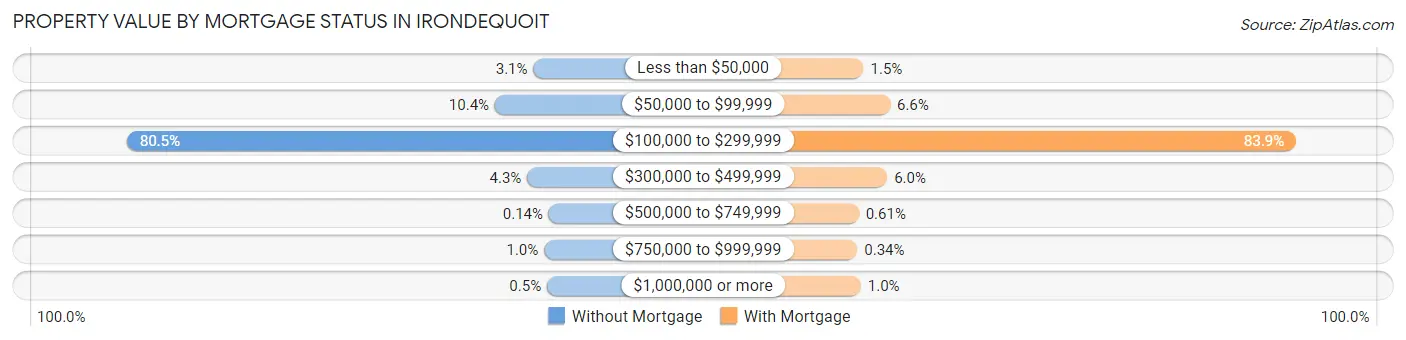
| Property Value | Without Mortgage | With Mortgage |
| Less than $50,000 | 197 (3.1%) | 174 (1.5%) |
| $50,000 to $99,999 | 664 (10.4%) | 745 (6.6%) |
| $100,000 to $299,999 | 5,130 (80.5%) | 9,514 (83.9%) |
| $300,000 to $499,999 | 272 (4.3%) | 684 (6.0%) |
| $500,000 to $749,999 | 9 (0.1%) | 69 (0.6%) |
| $750,000 to $999,999 | 66 (1.0%) | 38 (0.3%) |
| $1,000,000 or more | 32 (0.5%) | 115 (1.0%) |
| Total | 6,370 (100.0%) | 11,339 (100.0%) |
Household Income by Mortgage Status in Irondequoit
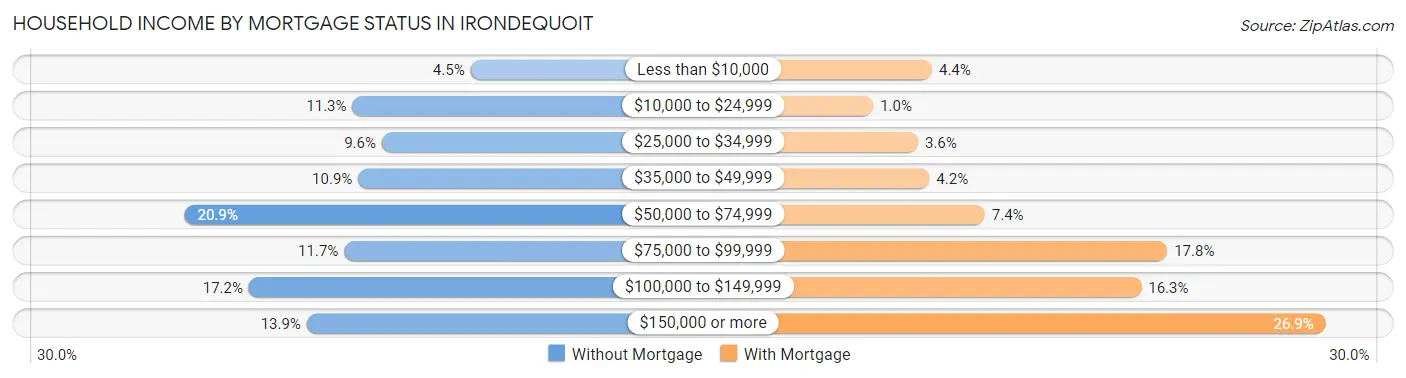
| Household Income | Without Mortgage | With Mortgage |
| Less than $10,000 | 288 (4.5%) | 495 (4.4%) |
| $10,000 to $24,999 | 718 (11.3%) | 114 (1.0%) |
| $25,000 to $34,999 | 611 (9.6%) | 405 (3.6%) |
| $35,000 to $49,999 | 697 (10.9%) | 478 (4.2%) |
| $50,000 to $74,999 | 1,329 (20.9%) | 838 (7.4%) |
| $75,000 to $99,999 | 748 (11.7%) | 2,019 (17.8%) |
| $100,000 to $149,999 | 1,095 (17.2%) | 1,852 (16.3%) |
| $150,000 or more | 884 (13.9%) | 3,046 (26.9%) |
| Total | 6,370 (100.0%) | 11,339 (100.0%) |
Property Value to Household Income Ratio in Irondequoit
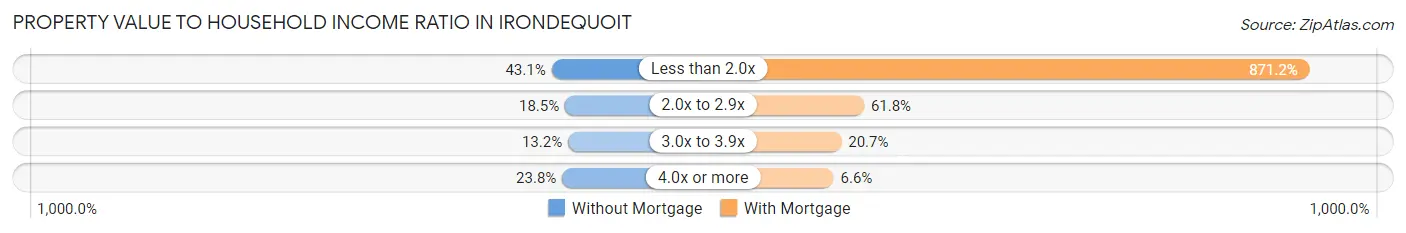
| Value-to-Income Ratio | Without Mortgage | With Mortgage |
| Less than 2.0x | 2,746 (43.1%) | 98,783 (871.2%) |
| 2.0x to 2.9x | 1,180 (18.5%) | 7,003 (61.8%) |
| 3.0x to 3.9x | 839 (13.2%) | 2,344 (20.7%) |
| 4.0x or more | 1,513 (23.7%) | 749 (6.6%) |
| Total | 6,370 (100.0%) | 11,339 (100.0%) |
Real Estate Taxes by Mortgage Status in Irondequoit
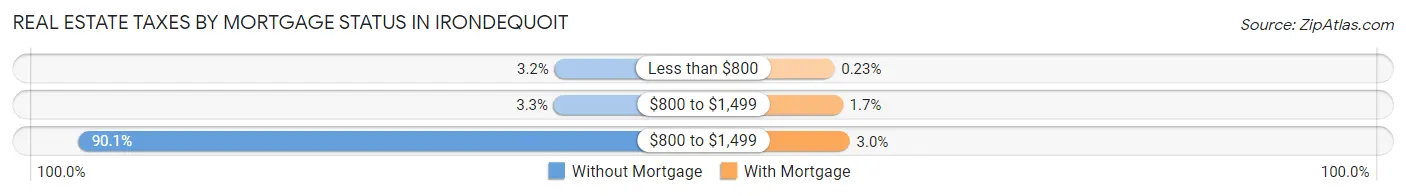
| Property Taxes | Without Mortgage | With Mortgage |
| Less than $800 | 203 (3.2%) | 26 (0.2%) |
| $800 to $1,499 | 212 (3.3%) | 197 (1.7%) |
| $800 to $1,499 | 5,740 (90.1%) | 343 (3.0%) |
| Total | 6,370 (100.0%) | 11,339 (100.0%) |
Health & Disability in Irondequoit
Health Insurance Coverage by Age in Irondequoit
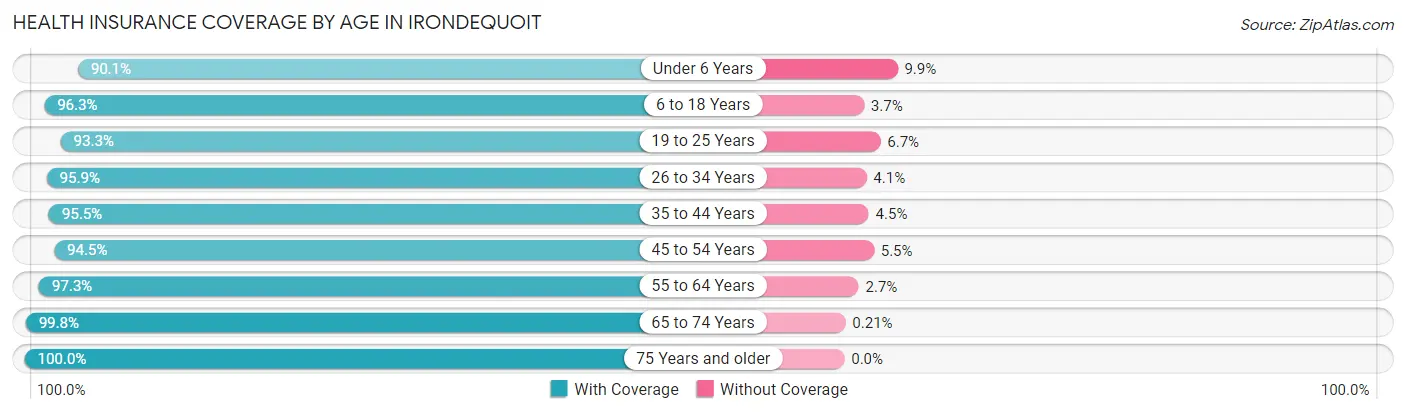
| Age Bracket | With Coverage | Without Coverage |
| Under 6 Years | 2,741 (90.1%) | 302 (9.9%) |
| 6 to 18 Years | 6,479 (96.3%) | 246 (3.7%) |
| 19 to 25 Years | 3,117 (93.3%) | 225 (6.7%) |
| 26 to 34 Years | 5,976 (95.9%) | 257 (4.1%) |
| 35 to 44 Years | 6,118 (95.5%) | 291 (4.5%) |
| 45 to 54 Years | 6,096 (94.5%) | 355 (5.5%) |
| 55 to 64 Years | 6,969 (97.3%) | 191 (2.7%) |
| 65 to 74 Years | 6,526 (99.8%) | 14 (0.2%) |
| 75 Years and older | 4,165 (100.0%) | 0 (0.0%) |
| Total | 48,187 (96.2%) | 1,881 (3.8%) |
Health Insurance Coverage by Citizenship Status in Irondequoit
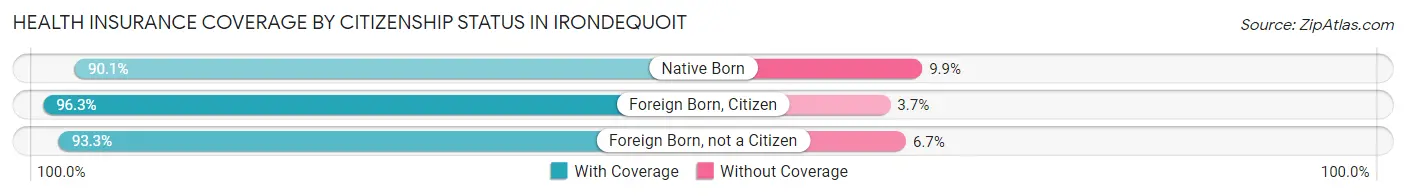
| Citizenship Status | With Coverage | Without Coverage |
| Native Born | 2,741 (90.1%) | 302 (9.9%) |
| Foreign Born, Citizen | 6,479 (96.3%) | 246 (3.7%) |
| Foreign Born, not a Citizen | 3,117 (93.3%) | 225 (6.7%) |
Health Insurance Coverage by Household Income in Irondequoit
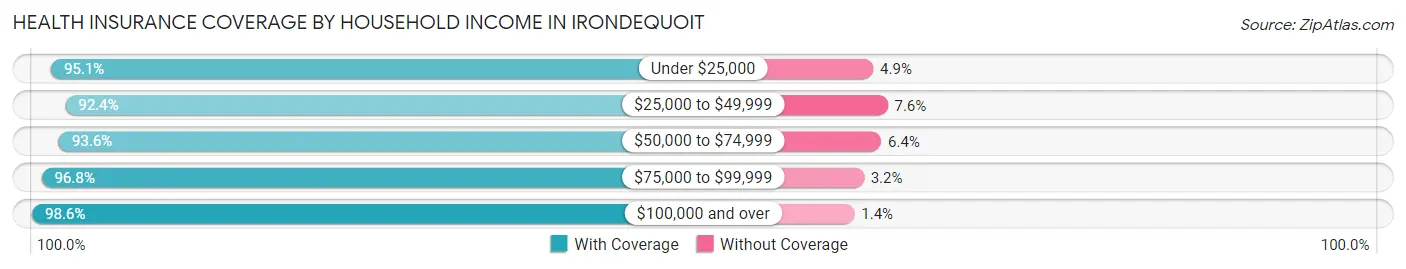
| Household Income | With Coverage | Without Coverage |
| Under $25,000 | 4,714 (95.1%) | 245 (4.9%) |
| $25,000 to $49,999 | 6,305 (92.4%) | 521 (7.6%) |
| $50,000 to $74,999 | 8,176 (93.6%) | 562 (6.4%) |
| $75,000 to $99,999 | 6,836 (96.8%) | 224 (3.2%) |
| $100,000 and over | 21,957 (98.6%) | 314 (1.4%) |
Public vs Private Health Insurance Coverage by Age in Irondequoit
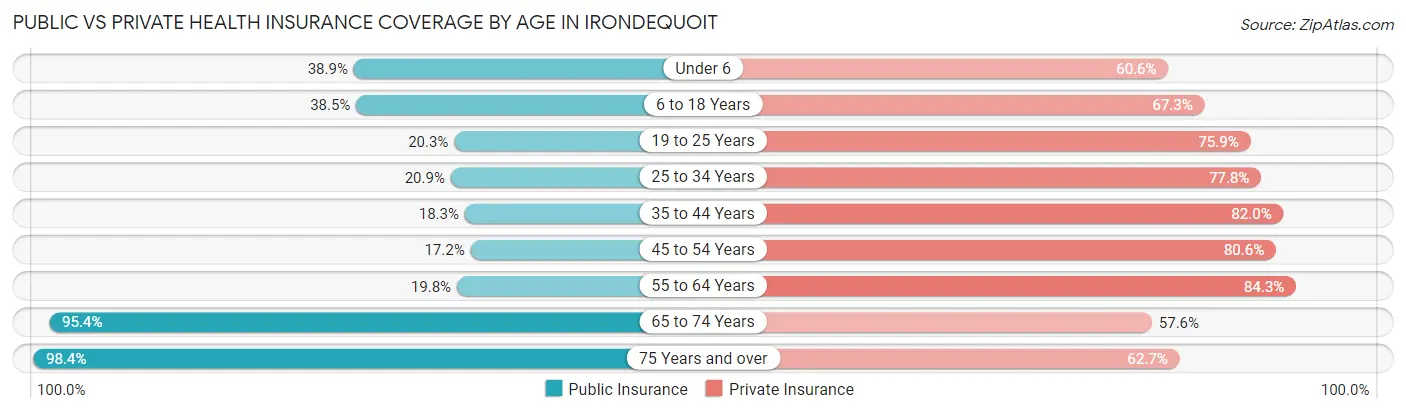
| Age Bracket | Public Insurance | Private Insurance |
| Under 6 | 1,184 (38.9%) | 1,844 (60.6%) |
| 6 to 18 Years | 2,586 (38.5%) | 4,527 (67.3%) |
| 19 to 25 Years | 677 (20.3%) | 2,535 (75.8%) |
| 25 to 34 Years | 1,303 (20.9%) | 4,852 (77.8%) |
| 35 to 44 Years | 1,173 (18.3%) | 5,254 (82.0%) |
| 45 to 54 Years | 1,112 (17.2%) | 5,199 (80.6%) |
| 55 to 64 Years | 1,414 (19.8%) | 6,038 (84.3%) |
| 65 to 74 Years | 6,242 (95.4%) | 3,764 (57.6%) |
| 75 Years and over | 4,099 (98.4%) | 2,612 (62.7%) |
| Total | 19,790 (39.5%) | 36,625 (73.2%) |
Disability Status by Sex by Age in Irondequoit
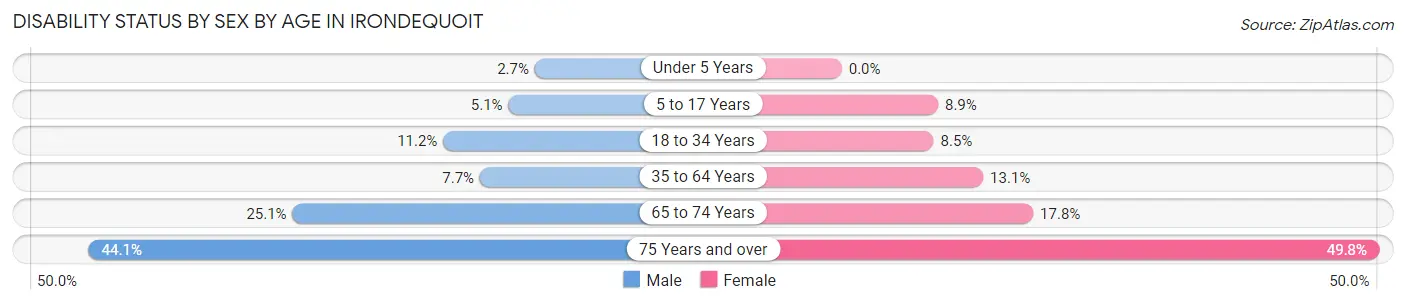
| Age Bracket | Male | Female |
| Under 5 Years | 33 (2.6%) | 0 (0.0%) |
| 5 to 17 Years | 193 (5.1%) | 286 (8.9%) |
| 18 to 34 Years | 569 (11.2%) | 404 (8.5%) |
| 35 to 64 Years | 725 (7.7%) | 1,397 (13.1%) |
| 65 to 74 Years | 744 (25.1%) | 636 (17.8%) |
| 75 Years and over | 700 (44.1%) | 1,284 (49.8%) |
Disability Class by Sex by Age in Irondequoit
Disability Class: Hearing Difficulty
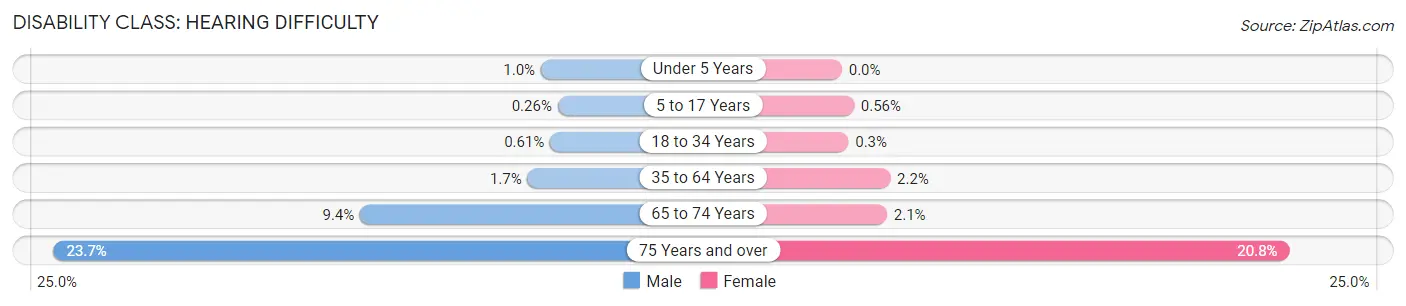
| Age Bracket | Male | Female |
| Under 5 Years | 13 (1.0%) | 0 (0.0%) |
| 5 to 17 Years | 10 (0.3%) | 18 (0.6%) |
| 18 to 34 Years | 31 (0.6%) | 14 (0.3%) |
| 35 to 64 Years | 156 (1.7%) | 239 (2.2%) |
| 65 to 74 Years | 279 (9.4%) | 75 (2.1%) |
| 75 Years and over | 376 (23.7%) | 535 (20.8%) |
Disability Class: Vision Difficulty
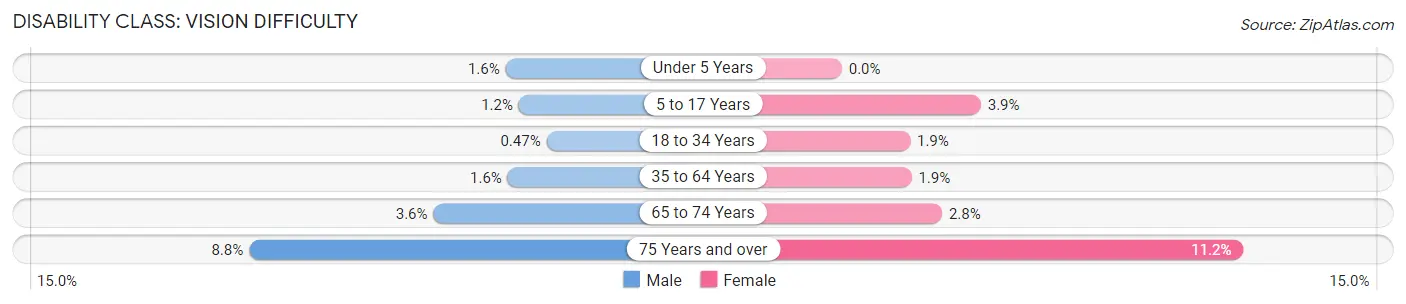
| Age Bracket | Male | Female |
| Under 5 Years | 20 (1.6%) | 0 (0.0%) |
| 5 to 17 Years | 47 (1.2%) | 124 (3.9%) |
| 18 to 34 Years | 24 (0.5%) | 90 (1.9%) |
| 35 to 64 Years | 145 (1.5%) | 207 (1.9%) |
| 65 to 74 Years | 107 (3.6%) | 100 (2.8%) |
| 75 Years and over | 139 (8.7%) | 288 (11.2%) |
Disability Class: Cognitive Difficulty
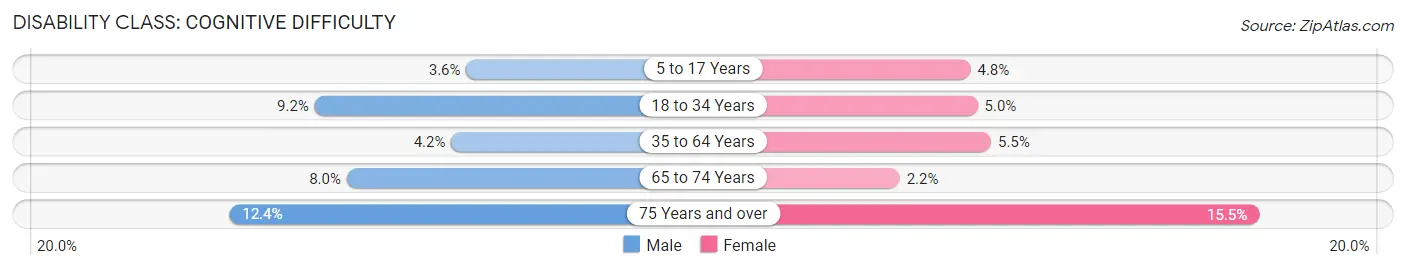
| Age Bracket | Male | Female |
| 5 to 17 Years | 136 (3.6%) | 153 (4.8%) |
| 18 to 34 Years | 471 (9.2%) | 239 (5.0%) |
| 35 to 64 Years | 390 (4.2%) | 590 (5.5%) |
| 65 to 74 Years | 238 (8.0%) | 77 (2.1%) |
| 75 Years and over | 197 (12.4%) | 399 (15.5%) |
Disability Class: Ambulatory Difficulty
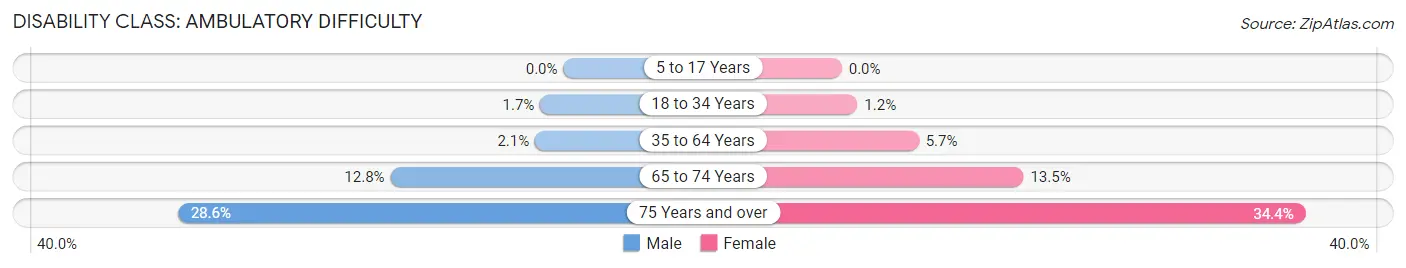
| Age Bracket | Male | Female |
| 5 to 17 Years | 0 (0.0%) | 0 (0.0%) |
| 18 to 34 Years | 88 (1.7%) | 55 (1.2%) |
| 35 to 64 Years | 197 (2.1%) | 608 (5.7%) |
| 65 to 74 Years | 380 (12.8%) | 483 (13.5%) |
| 75 Years and over | 455 (28.6%) | 887 (34.4%) |
Disability Class: Self-Care Difficulty
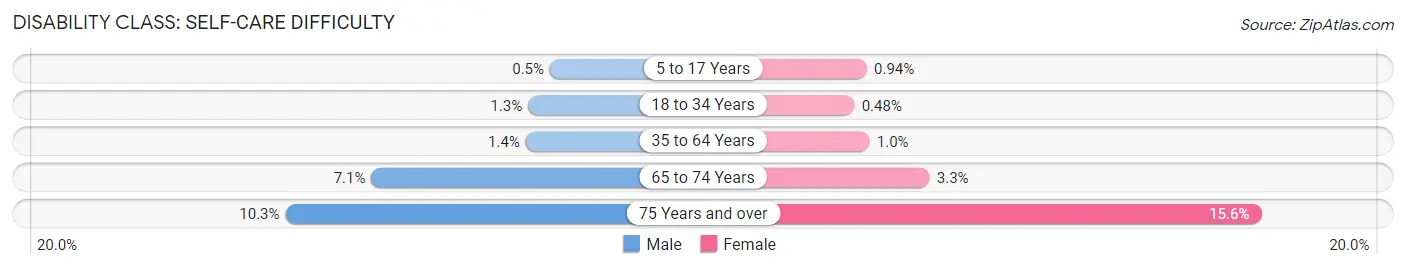
| Age Bracket | Male | Female |
| 5 to 17 Years | 19 (0.5%) | 30 (0.9%) |
| 18 to 34 Years | 67 (1.3%) | 23 (0.5%) |
| 35 to 64 Years | 131 (1.4%) | 111 (1.0%) |
| 65 to 74 Years | 211 (7.1%) | 117 (3.3%) |
| 75 Years and over | 164 (10.3%) | 401 (15.6%) |
Technology Access in Irondequoit
Computing Device Access in Irondequoit
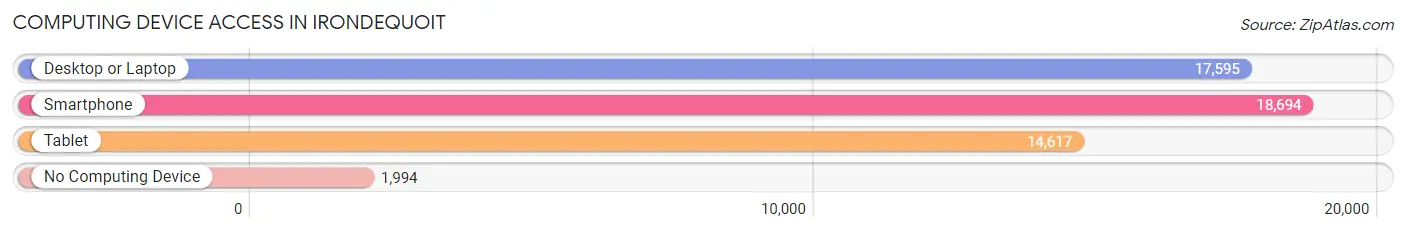
| Device Type | # Households | % Households |
| Desktop or Laptop | 17,595 | 78.3% |
| Smartphone | 18,694 | 83.2% |
| Tablet | 14,617 | 65.0% |
| No Computing Device | 1,994 | 8.9% |
| Total | 22,469 | 100.0% |
Internet Access in Irondequoit
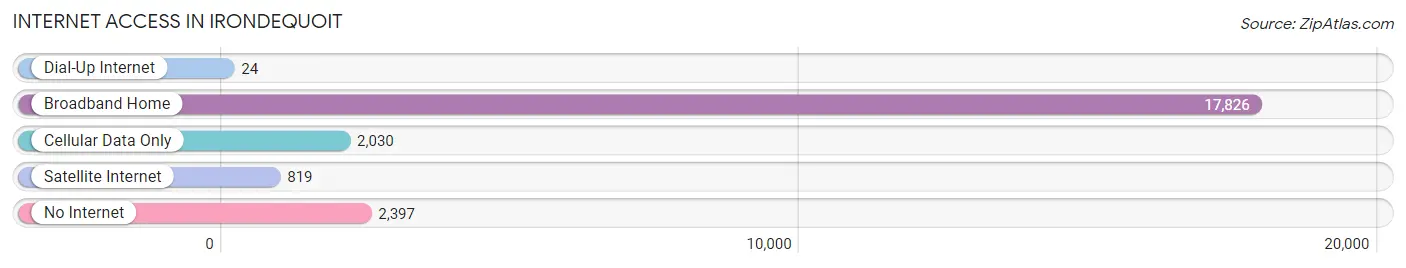
| Internet Type | # Households | % Households |
| Dial-Up Internet | 24 | 0.1% |
| Broadband Home | 17,826 | 79.3% |
| Cellular Data Only | 2,030 | 9.0% |
| Satellite Internet | 819 | 3.6% |
| No Internet | 2,397 | 10.7% |
| Total | 22,469 | 100.0% |
Irondequoit Summary
Irondequoit is a town located in Monroe County, New York, United States. It is a suburb of Rochester, located just east of the city. As of the 2010 census, the town had a total population of 51,692.
History
The area that is now Irondequoit was originally inhabited by the Seneca people, a member of the Iroquois Confederacy. The first Europeans to settle in the area were French fur traders in the late 17th century. The area was part of the Phelps and Gorham Purchase in 1788, and was part of the Town of Brighton until 1839, when it was separated and incorporated as the Town of Irondequoit.
The town was named after the Iroquois word for "where the land and water meet". The town was an important port on the Erie Canal, and was home to several industries, including a paper mill, a brickyard, and a tannery.
Geography
Irondequoit is located in the northwest corner of Monroe County, bordered by the towns of Webster to the west, Penfield to the south, Brighton to the east, and Lake Ontario to the north. The town is situated on the south shore of Irondequoit Bay, an arm of Lake Ontario. The bay is fed by the Genesee River, which flows through the town.
The town has a total area of 24.2 square miles, of which 22.7 square miles is land and 1.5 square miles is water. The highest point in the town is the summit of Durand Eastman Park, at an elevation of 602 feet above sea level.
Economy
Irondequoit is home to a variety of businesses and industries. The town is home to several large employers, including Wegmans, Paychex, and the University of Rochester. The town is also home to several smaller businesses, including restaurants, retail stores, and professional services.
The town is also home to several industrial parks, including the Irondequoit Industrial Park, the Eastman Business Park, and the Rochester Technology Park. These parks are home to a variety of businesses, including manufacturing, research and development, and technology companies.
Demographics
As of the 2010 census, there were 51,692 people, 21,845 households, and 13,845 families residing in the town. The population density was 2,269.2 people per square mile. There were 22,945 housing units at an average density of 1,006.2 per square mile.
The racial makeup of the town was 87.2% White, 8.2% African American, 0.3% Native American, 1.7% Asian, 0.1% Pacific Islander, 0.7% from other races, and 1.9% from two or more races. Hispanic or Latino of any race were 3.2% of the population.
There were 21,845 households, out of which 28.2% had children under the age of 18 living with them, 47.2% were married couples living together, 12.3% had a female householder with no husband present, and 36.3% were non-families. 29.7% of all households were made up of individuals, and 11.2% had someone living alone who was 65 years of age or older. The average household size was 2.37 and the average family size was 2.94.
In the town, the population was spread out, with 22.3% under the age of 18, 8.2% from 18 to 24, 28.2% from 25 to 44, 25.2% from 45 to 64, and 16.1% who were 65 years of age or older. The median age was 39 years. For every 100 females, there were 91.2 males. For every 100 females age 18 and over, there were 87.7 males.
The median income for a household in the town was $50,945, and the median income for a family was $62,917. Males had a median income of $45,845 versus $33,945 for females. The per capita income for the town was $25,945. About 4.2% of families and 6.3% of the population were below the poverty line, including 8.2% of those under age 18 and 5.2% of those age 65 or over.
Common Questions
What is Per Capita Income in Irondequoit?
Per Capita income in Irondequoit is $42,912.
What is the Median Family Income in Irondequoit?
Median Family Income in Irondequoit is $95,835.
What is the Median Household income in Irondequoit?
Median Household Income in Irondequoit is $74,031.
What is Income or Wage Gap in Irondequoit?
Income or Wage Gap in Irondequoit is 14.0%.
Women in Irondequoit earn 86.0 cents for every dollar earned by a man.
What is Family Income Deficit in Irondequoit?
Family Income Deficit in Irondequoit is $13,040.
Families that are below poverty line in Irondequoit earn $13,040 less on average than the poverty threshold level.
What is Inequality or Gini Index in Irondequoit?
Inequality or Gini Index in Irondequoit is 0.43.
What is the Total Population of Irondequoit?
Total Population of Irondequoit is 50,780.
What is the Total Male Population of Irondequoit?
Total Male Population of Irondequoit is 24,313.
What is the Total Female Population of Irondequoit?
Total Female Population of Irondequoit is 26,467.
What is the Ratio of Males per 100 Females in Irondequoit?
There are 91.86 Males per 100 Females in Irondequoit.
What is the Ratio of Females per 100 Males in Irondequoit?
There are 108.86 Females per 100 Males in Irondequoit.
What is the Median Population Age in Irondequoit?
Median Population Age in Irondequoit is 44.3 Years.
What is the Average Family Size in Irondequoit
Average Family Size in Irondequoit is 2.8 People.
What is the Average Household Size in Irondequoit
Average Household Size in Irondequoit is 2.2 People.
How Large is the Labor Force in Irondequoit?
There are 27,522 People in the Labor Forcein in Irondequoit.
What is the Percentage of People in the Labor Force in Irondequoit?
65.1% of People are in the Labor Force in Irondequoit.
What is the Unemployment Rate in Irondequoit?
Unemployment Rate in Irondequoit is 5.1%.