New Hartford, NY Map & Demographics
New Hartford Map
New Hartford Overview
$47,512
PER CAPITA INCOME
$107,434
AVG FAMILY INCOME
$77,625
AVG HOUSEHOLD INCOME
38.0%
WAGE / INCOME GAP [ % ]
62.0¢/ $1
WAGE / INCOME GAP [ $ ]
$7,408
FAMILY INCOME DEFICIT
0.47
INEQUALITY / GINI INDEX
1,891
TOTAL POPULATION
839
MALE POPULATION
1,052
FEMALE POPULATION
79.75
MALES / 100 FEMALES
125.39
FEMALES / 100 MALES
51.5
MEDIAN AGE
2.9
AVG FAMILY SIZE
2.0
AVG HOUSEHOLD SIZE
864
LABOR FORCE [ PEOPLE ]
54.6%
PERCENT IN LABOR FORCE
2.5%
UNEMPLOYMENT RATE
New Hartford Zip Codes
New Hartford Area Codes
Income in New Hartford
Income Overview in New Hartford
Per Capita Income in New Hartford is $47,512, while median incomes of families and households are $107,434 and $77,625 respectively.
| Characteristic | Number | Measure |
| Per Capita Income | 1,891 | $47,512 |
| Median Family Income | 455 | $107,434 |
| Mean Family Income | 455 | $140,293 |
| Median Household Income | 919 | $77,625 |
| Mean Household Income | 919 | $96,527 |
| Income Deficit | 455 | $7,408 |
| Wage / Income Gap (%) | 1,891 | 37.96% |
| Wage / Income Gap ($) | 1,891 | 62.04¢ per $1 |
| Gini / Inequality Index | 1,891 | 0.47 |
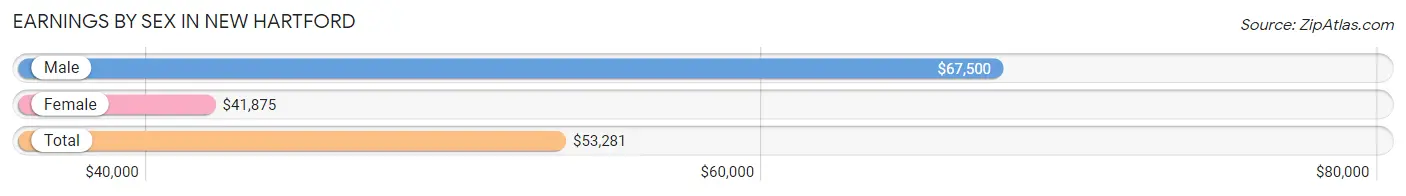
Earnings by Sex in New Hartford
Average Earnings in New Hartford are $53,281, $67,500 for men and $41,875 for women, a difference of 38.0%.
| Sex | Number | Average Earnings |
| Male | 444 (48.0%) | $67,500 |
| Female | 481 (52.0%) | $41,875 |
| Total | 925 (100.0%) | $53,281 |
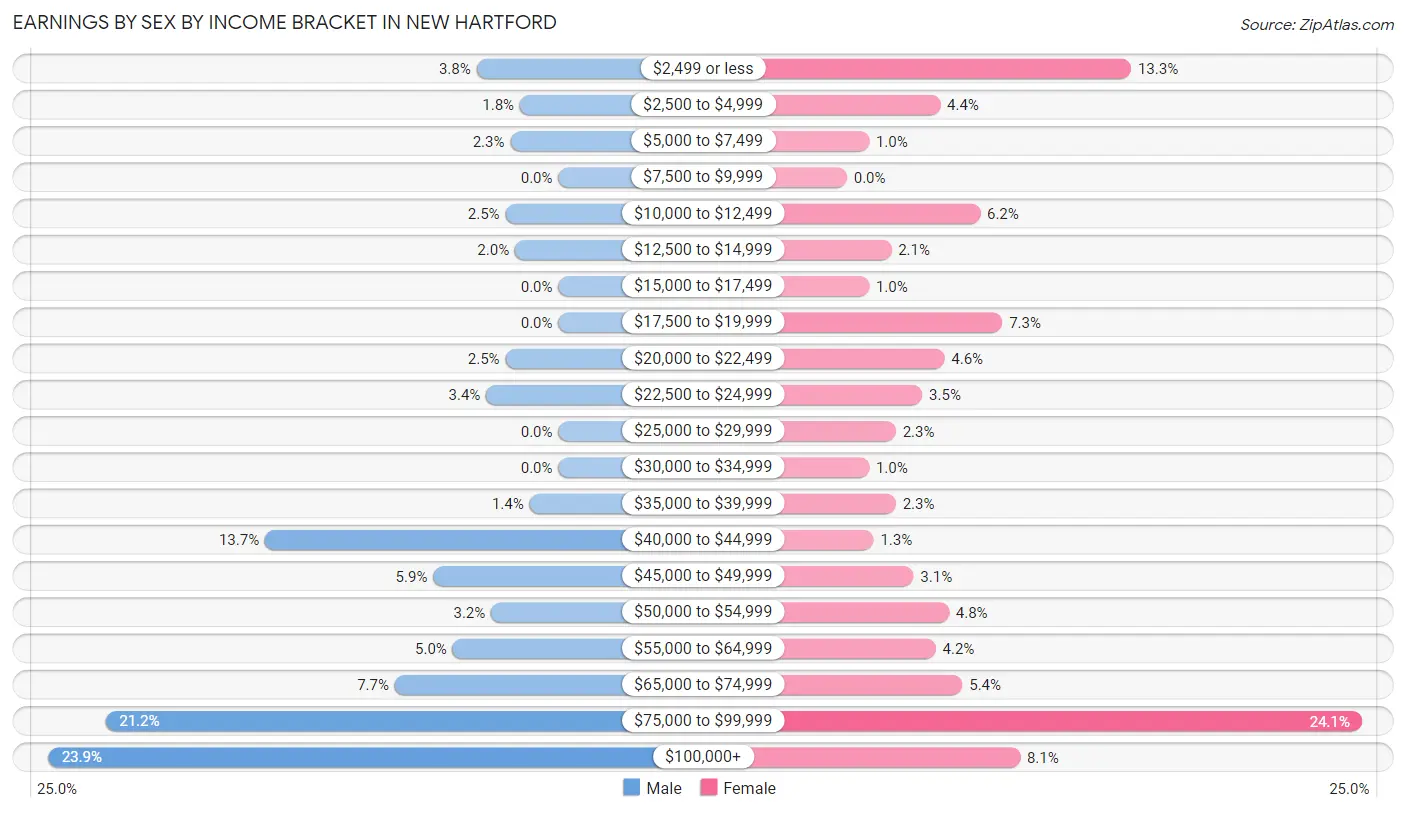
Earnings by Sex by Income Bracket in New Hartford
The most common earnings brackets in New Hartford are $100,000+ for men (106 | 23.9%) and $75,000 to $99,999 for women (116 | 24.1%).
| Income | Male | Female |
| $2,499 or less | 17 (3.8%) | 64 (13.3%) |
| $2,500 to $4,999 | 8 (1.8%) | 21 (4.4%) |
| $5,000 to $7,499 | 10 (2.2%) | 5 (1.0%) |
| $7,500 to $9,999 | 0 (0.0%) | 0 (0.0%) |
| $10,000 to $12,499 | 11 (2.5%) | 30 (6.2%) |
| $12,500 to $14,999 | 9 (2.0%) | 10 (2.1%) |
| $15,000 to $17,499 | 0 (0.0%) | 5 (1.0%) |
| $17,500 to $19,999 | 0 (0.0%) | 35 (7.3%) |
| $20,000 to $22,499 | 11 (2.5%) | 22 (4.6%) |
| $22,500 to $24,999 | 15 (3.4%) | 17 (3.5%) |
| $25,000 to $29,999 | 0 (0.0%) | 11 (2.3%) |
| $30,000 to $34,999 | 0 (0.0%) | 5 (1.0%) |
| $35,000 to $39,999 | 6 (1.3%) | 11 (2.3%) |
| $40,000 to $44,999 | 61 (13.7%) | 6 (1.3%) |
| $45,000 to $49,999 | 26 (5.9%) | 15 (3.1%) |
| $50,000 to $54,999 | 14 (3.2%) | 23 (4.8%) |
| $55,000 to $64,999 | 22 (5.0%) | 20 (4.2%) |
| $65,000 to $74,999 | 34 (7.7%) | 26 (5.4%) |
| $75,000 to $99,999 | 94 (21.2%) | 116 (24.1%) |
| $100,000+ | 106 (23.9%) | 39 (8.1%) |
| Total | 444 (100.0%) | 481 (100.0%) |
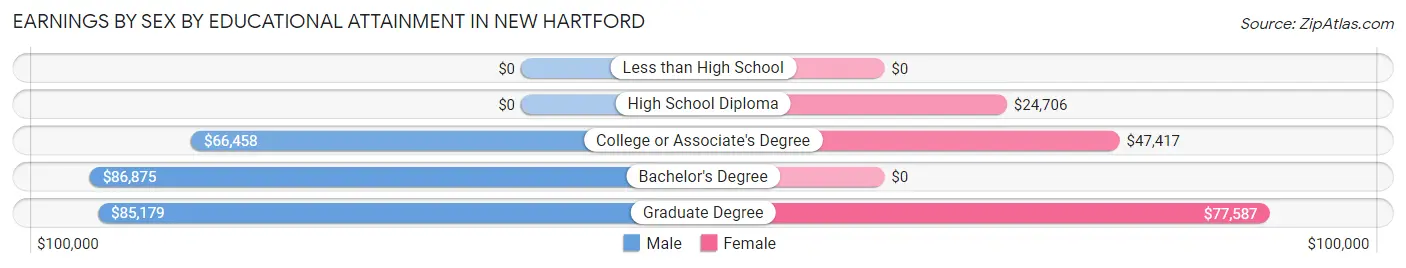
Earnings by Sex by Educational Attainment in New Hartford
Average earnings in New Hartford are $80,167 for men and $50,978 for women, a difference of 36.4%. Men with an educational attainment of bachelor's degree enjoy the highest average annual earnings of $86,875, while those with college or associate's degree education earn the least with $66,458. Women with an educational attainment of graduate degree earn the most with the average annual earnings of $77,587, while those with high school diploma education have the smallest earnings of $24,706.
| Educational Attainment | Male Income | Female Income |
| Less than High School | - | - |
| High School Diploma | - | - |
| College or Associate's Degree | $66,458 | $47,417 |
| Bachelor's Degree | $86,875 | $0 |
| Graduate Degree | $85,179 | $77,587 |
| Total | $80,167 | $50,978 |
Family Income in New Hartford
Family Income Brackets in New Hartford
According to the New Hartford family income data, there are 117 families falling into the $100,000 to $149,999 income range, which is the most common income bracket and makes up 25.7% of all families.
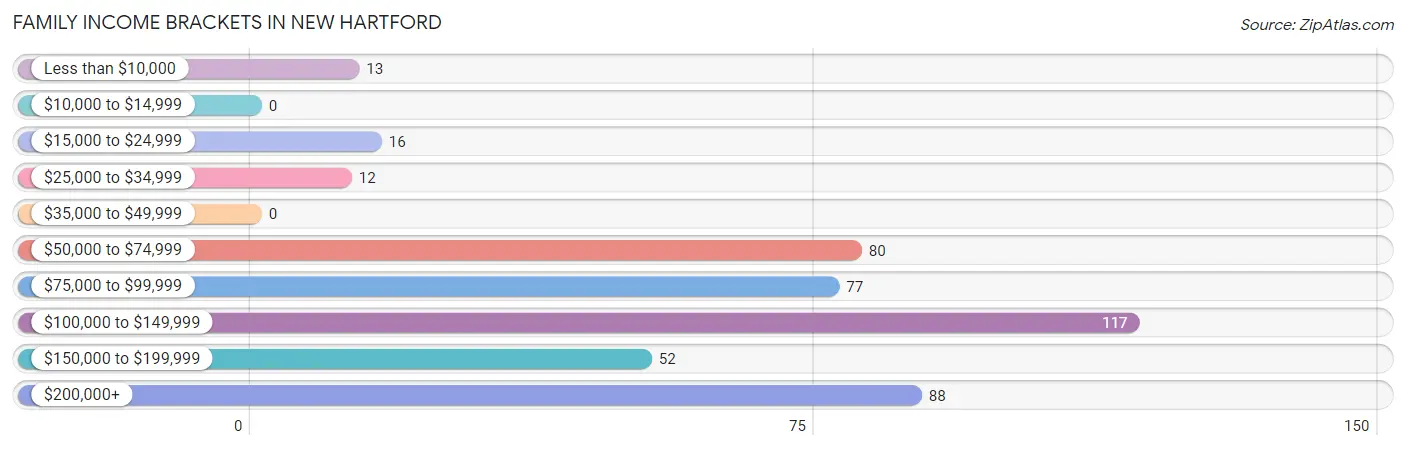
| Income Bracket | # Families | % Families |
| Less than $10,000 | 13 | 2.9% |
| $10,000 to $14,999 | 0 | 0.0% |
| $15,000 to $24,999 | 16 | 3.5% |
| $25,000 to $34,999 | 12 | 2.6% |
| $35,000 to $49,999 | 0 | 0.0% |
| $50,000 to $74,999 | 80 | 17.6% |
| $75,000 to $99,999 | 77 | 16.9% |
| $100,000 to $149,999 | 117 | 25.7% |
| $150,000 to $199,999 | 52 | 11.4% |
| $200,000+ | 88 | 19.3% |
Family Income by Famaliy Size in New Hartford
4-person families (56 | 12.3%) account for the highest median family income in New Hartford with $134,643 per family, while 2-person families (247 | 54.3%) have the highest median income of $44,956 per family member.
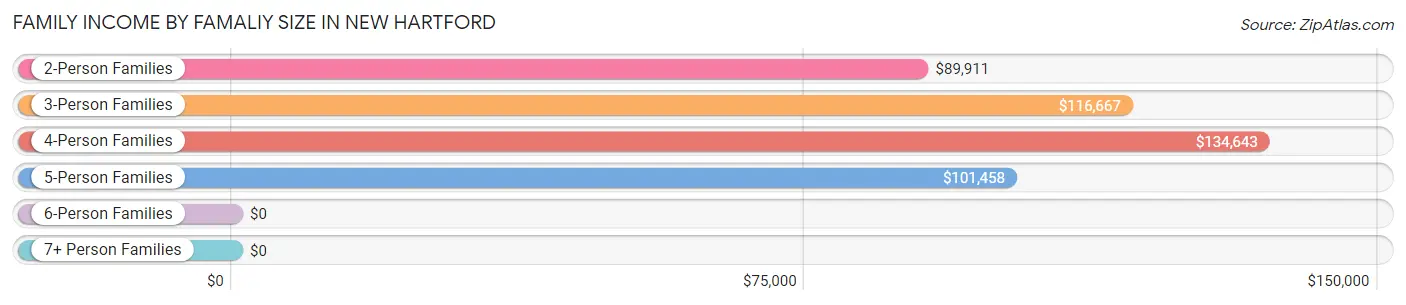
| Income Bracket | # Families | Median Income |
| 2-Person Families | 247 (54.3%) | $89,911 |
| 3-Person Families | 100 (22.0%) | $116,667 |
| 4-Person Families | 56 (12.3%) | $134,643 |
| 5-Person Families | 47 (10.3%) | $101,458 |
| 6-Person Families | 5 (1.1%) | $0 |
| 7+ Person Families | 0 (0.0%) | $0 |
| Total | 455 (100.0%) | $107,434 |
Family Income by Number of Earners in New Hartford
The median family income in New Hartford is $107,434, with families comprising 3+ earners (57) having the highest median family income of $191,250, while families with 1 earner (114) have the lowest median family income of $73,750, accounting for 12.5% and 25.1% of families, respectively.
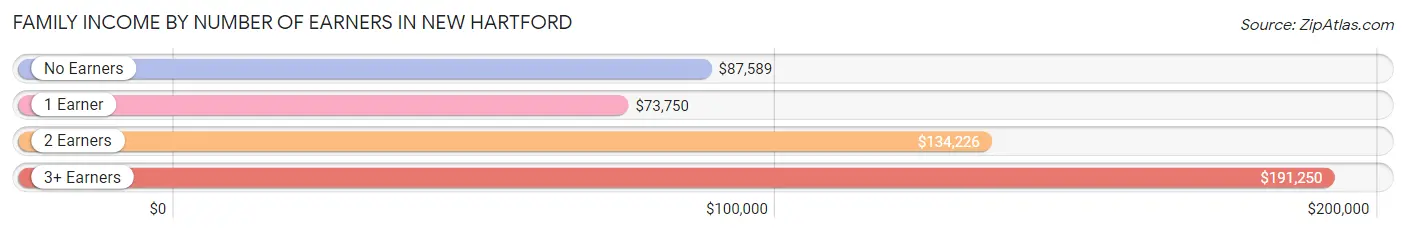
| Number of Earners | # Families | Median Income |
| No Earners | 81 (17.8%) | $87,589 |
| 1 Earner | 114 (25.1%) | $73,750 |
| 2 Earners | 203 (44.6%) | $134,226 |
| 3+ Earners | 57 (12.5%) | $191,250 |
| Total | 455 (100.0%) | $107,434 |
Household Income in New Hartford
Household Income Brackets in New Hartford
With 168 households falling in the category, the $100,000 to $149,999 income range is the most frequent in New Hartford, accounting for 18.3% of all households. In contrast, only 19 households (2.1%) fall into the $10,000 to $14,999 income bracket, making it the least populous group.
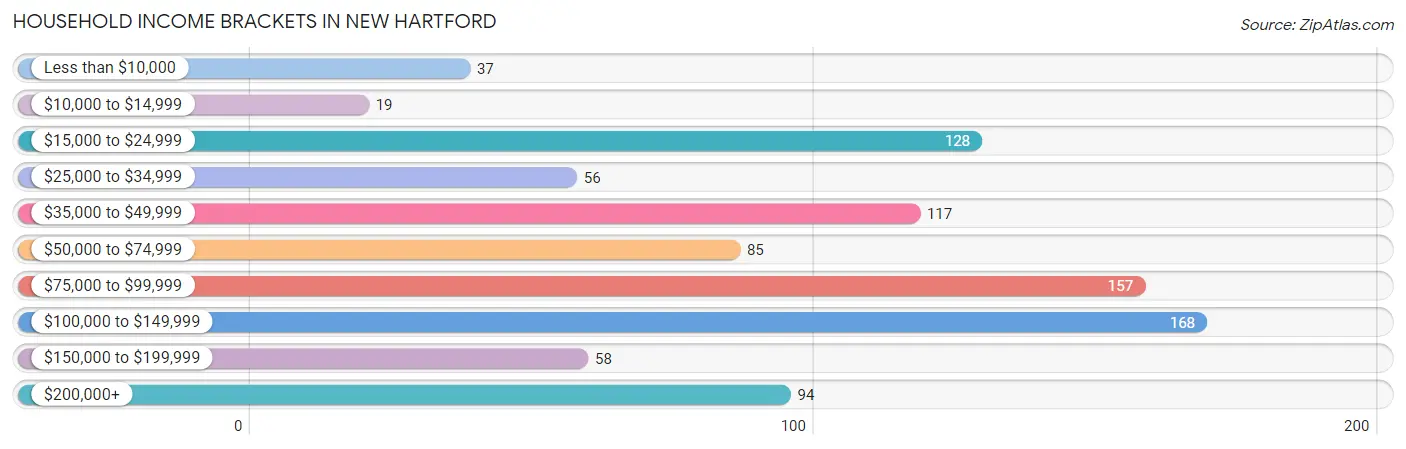
| Income Bracket | # Households | % Households |
| Less than $10,000 | 37 | 4.0% |
| $10,000 to $14,999 | 19 | 2.1% |
| $15,000 to $24,999 | 128 | 13.9% |
| $25,000 to $34,999 | 56 | 6.1% |
| $35,000 to $49,999 | 117 | 12.7% |
| $50,000 to $74,999 | 85 | 9.2% |
| $75,000 to $99,999 | 157 | 17.1% |
| $100,000 to $149,999 | 168 | 18.3% |
| $150,000 to $199,999 | 58 | 6.3% |
| $200,000+ | 94 | 10.2% |
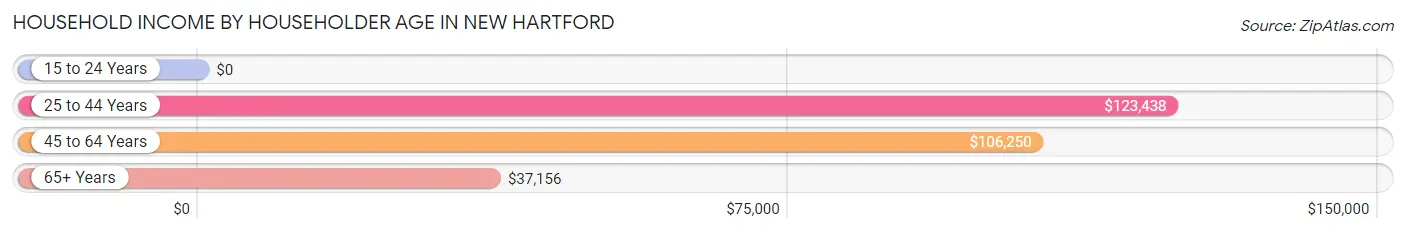
Household Income by Householder Age in New Hartford
The median household income in New Hartford is $77,625, with the highest median household income of $123,438 found in the 25 to 44 years age bracket for the primary householder. A total of 163 households (17.7%) fall into this category.
| Income Bracket | # Households | Median Income |
| 15 to 24 Years | 0 (0.0%) | $0 |
| 25 to 44 Years | 163 (17.7%) | $123,438 |
| 45 to 64 Years | 323 (35.1%) | $106,250 |
| 65+ Years | 433 (47.1%) | $37,156 |
| Total | 919 (100.0%) | $77,625 |
Poverty in New Hartford
Income Below Poverty by Sex and Age in New Hartford
With 8.1% poverty level for males and 9.0% for females among the residents of New Hartford, 16 and 17 year old males and 15 year old females are the most vulnerable to poverty, with 10 males (18.9%) and 8 females (53.3%) in their respective age groups living below the poverty level.
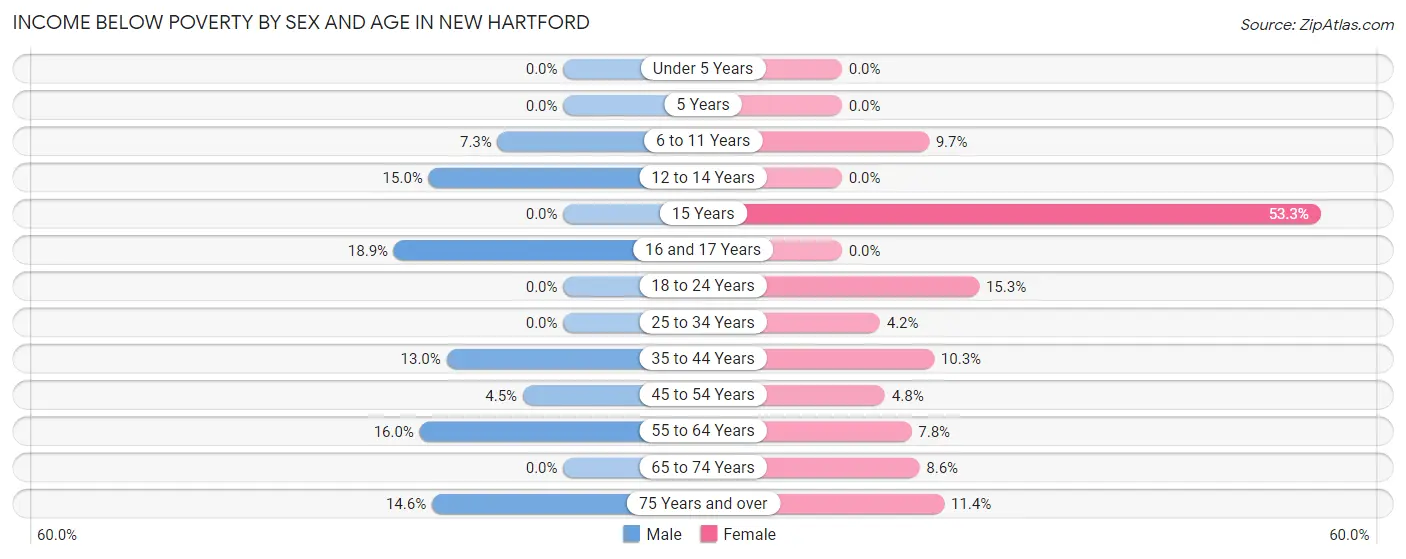
| Age Bracket | Male | Female |
| Under 5 Years | 0 (0.0%) | 0 (0.0%) |
| 5 Years | 0 (0.0%) | 0 (0.0%) |
| 6 to 11 Years | 6 (7.3%) | 6 (9.7%) |
| 12 to 14 Years | 6 (15.0%) | 0 (0.0%) |
| 15 Years | 0 (0.0%) | 8 (53.3%) |
| 16 and 17 Years | 10 (18.9%) | 0 (0.0%) |
| 18 to 24 Years | 0 (0.0%) | 11 (15.3%) |
| 25 to 34 Years | 0 (0.0%) | 3 (4.2%) |
| 35 to 44 Years | 13 (13.0%) | 12 (10.3%) |
| 45 to 54 Years | 5 (4.5%) | 6 (4.8%) |
| 55 to 64 Years | 16 (16.0%) | 10 (7.7%) |
| 65 to 74 Years | 0 (0.0%) | 7 (8.6%) |
| 75 Years and over | 12 (14.6%) | 32 (11.4%) |
| Total | 68 (8.1%) | 95 (9.0%) |
Income Above Poverty by Sex and Age in New Hartford
According to the poverty statistics in New Hartford, males aged under 5 years and females aged under 5 years are the age groups that are most secure financially, with 100.0% of males and 100.0% of females in these age groups living above the poverty line.
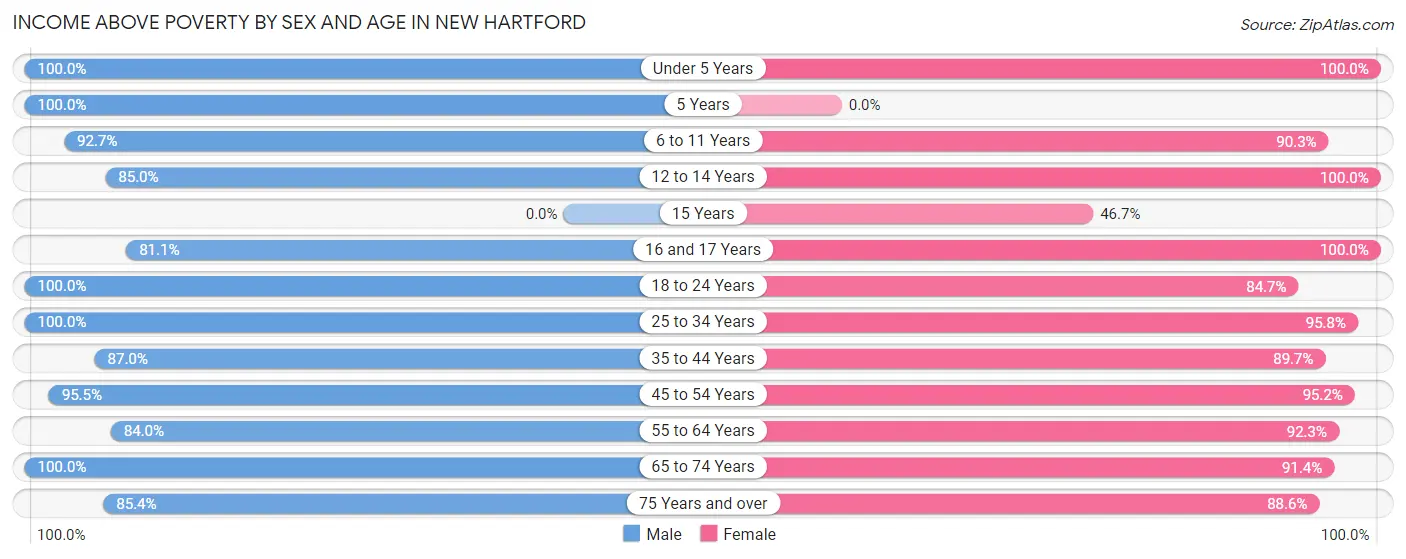
| Age Bracket | Male | Female |
| Under 5 Years | 18 (100.0%) | 44 (100.0%) |
| 5 Years | 6 (100.0%) | 0 (0.0%) |
| 6 to 11 Years | 76 (92.7%) | 56 (90.3%) |
| 12 to 14 Years | 34 (85.0%) | 41 (100.0%) |
| 15 Years | 0 (0.0%) | 7 (46.7%) |
| 16 and 17 Years | 43 (81.1%) | 13 (100.0%) |
| 18 to 24 Years | 63 (100.0%) | 61 (84.7%) |
| 25 to 34 Years | 56 (100.0%) | 68 (95.8%) |
| 35 to 44 Years | 87 (87.0%) | 105 (89.7%) |
| 45 to 54 Years | 106 (95.5%) | 119 (95.2%) |
| 55 to 64 Years | 84 (84.0%) | 119 (92.2%) |
| 65 to 74 Years | 128 (100.0%) | 74 (91.4%) |
| 75 Years and over | 70 (85.4%) | 249 (88.6%) |
| Total | 771 (91.9%) | 956 (91.0%) |
Income Below Poverty Among Married-Couple Families in New Hartford
The poverty statistics for married-couple families in New Hartford show that 8.3% or 25 of the total 302 families live below the poverty line. Families with 1 or 2 children have the highest poverty rate of 11.0%, comprising of 9 families. On the other hand, families with no children have the lowest poverty rate of 6.8%, which includes 13 families.
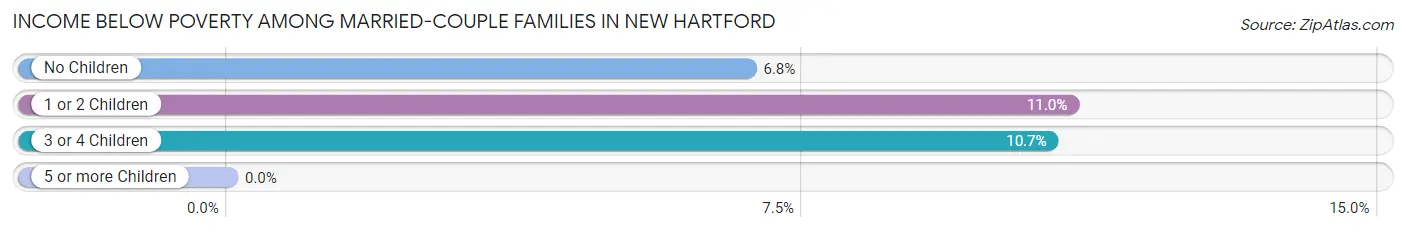
| Children | Above Poverty | Below Poverty |
| No Children | 179 (93.2%) | 13 (6.8%) |
| 1 or 2 Children | 73 (89.0%) | 9 (11.0%) |
| 3 or 4 Children | 25 (89.3%) | 3 (10.7%) |
| 5 or more Children | 0 (0.0%) | 0 (0.0%) |
| Total | 277 (91.7%) | 25 (8.3%) |
Income Below Poverty Among Single-Parent Households in New Hartford
| Children | Single Father | Single Mother |
| No Children | 0 (0.0%) | 0 (0.0%) |
| 1 or 2 Children | 0 (0.0%) | 0 (0.0%) |
| 3 or 4 Children | 0 (0.0%) | 0 (0.0%) |
| 5 or more Children | 0 (0.0%) | 0 (0.0%) |
| Total | 0 (0.0%) | 0 (0.0%) |
Income Below Poverty Among Married-Couple vs Single-Parent Households in New Hartford
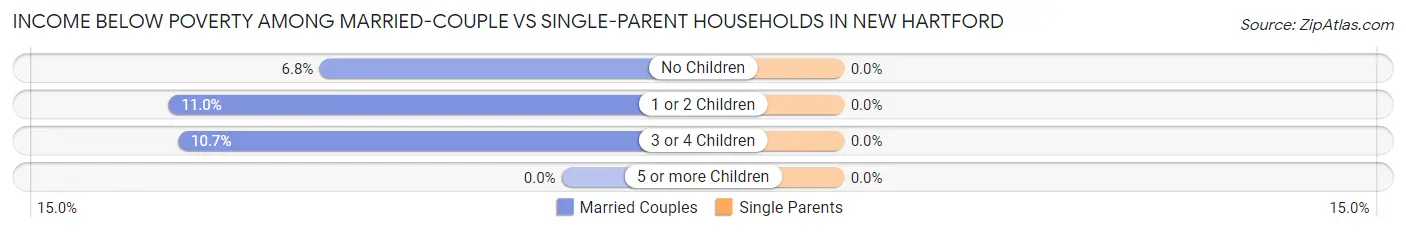
| Children | Married-Couple Families | Single-Parent Households |
| No Children | 13 (6.8%) | 0 (0.0%) |
| 1 or 2 Children | 9 (11.0%) | 0 (0.0%) |
| 3 or 4 Children | 3 (10.7%) | 0 (0.0%) |
| 5 or more Children | 0 (0.0%) | 0 (0.0%) |
| Total | 25 (8.3%) | 0 (0.0%) |
Race in New Hartford
The most populous races in New Hartford are White / Caucasian (1,653 | 87.4%), Hispanic or Latino (134 | 7.1%), and Asian (104 | 5.5%).
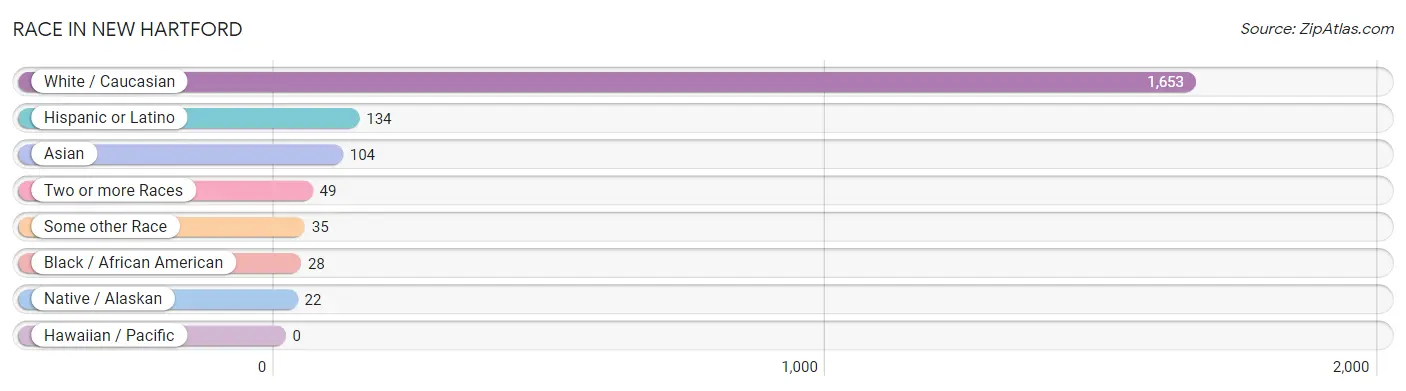
| Race | # Population | % Population |
| Asian | 104 | 5.5% |
| Black / African American | 28 | 1.5% |
| Hawaiian / Pacific | 0 | 0.0% |
| Hispanic or Latino | 134 | 7.1% |
| Native / Alaskan | 22 | 1.2% |
| White / Caucasian | 1,653 | 87.4% |
| Two or more Races | 49 | 2.6% |
| Some other Race | 35 | 1.8% |
| Total | 1,891 | 100.0% |
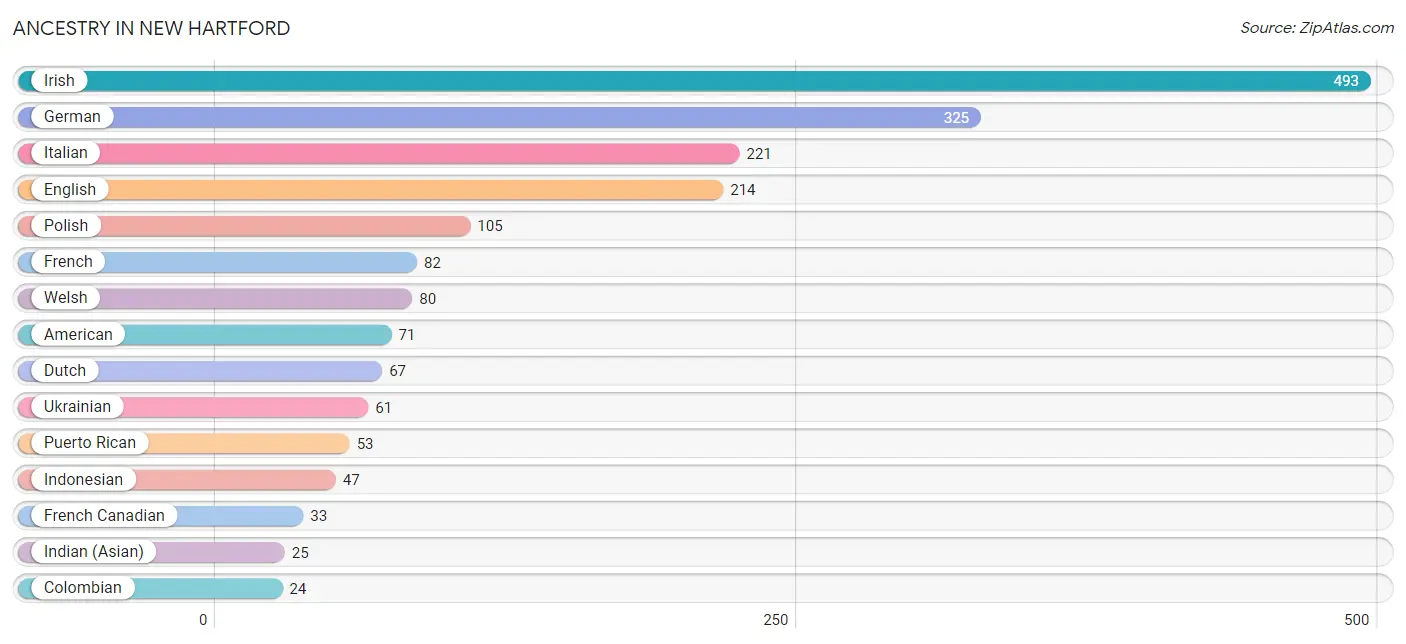
Ancestry in New Hartford
The most populous ancestries reported in New Hartford are Irish (493 | 26.1%), German (325 | 17.2%), Italian (221 | 11.7%), English (214 | 11.3%), and Polish (105 | 5.6%), together accounting for 71.8% of all New Hartford residents.
| Ancestry | # Population | % Population |
| American | 71 | 3.7% |
| Arab | 10 | 0.5% |
| Austrian | 21 | 1.1% |
| Belgian | 8 | 0.4% |
| Bhutanese | 4 | 0.2% |
| British | 5 | 0.3% |
| Burmese | 7 | 0.4% |
| Colombian | 24 | 1.3% |
| Croatian | 5 | 0.3% |
| Czechoslovakian | 5 | 0.3% |
| Danish | 6 | 0.3% |
| Dominican | 9 | 0.5% |
| Dutch | 67 | 3.5% |
| Eastern European | 9 | 0.5% |
| English | 214 | 11.3% |
| European | 23 | 1.2% |
| Finnish | 10 | 0.5% |
| French | 82 | 4.3% |
| French Canadian | 33 | 1.8% |
| German | 325 | 17.2% |
| Greek | 3 | 0.2% |
| Hungarian | 12 | 0.6% |
| Indian (Asian) | 25 | 1.3% |
| Indonesian | 47 | 2.5% |
| Irish | 493 | 26.1% |
| Italian | 221 | 11.7% |
| Korean | 4 | 0.2% |
| Lebanese | 10 | 0.5% |
| Lithuanian | 4 | 0.2% |
| Mexican | 19 | 1.0% |
| Norwegian | 4 | 0.2% |
| Polish | 105 | 5.6% |
| Potawatomi | 12 | 0.6% |
| Puerto Rican | 53 | 2.8% |
| Russian | 18 | 0.9% |
| Scotch-Irish | 10 | 0.5% |
| Scottish | 23 | 1.2% |
| South American | 24 | 1.3% |
| Swedish | 4 | 0.2% |
| Thai | 24 | 1.3% |
| Ukrainian | 61 | 3.2% |
| Welsh | 80 | 4.2% |
| Yugoslavian | 7 | 0.4% | View All 43 Rows |
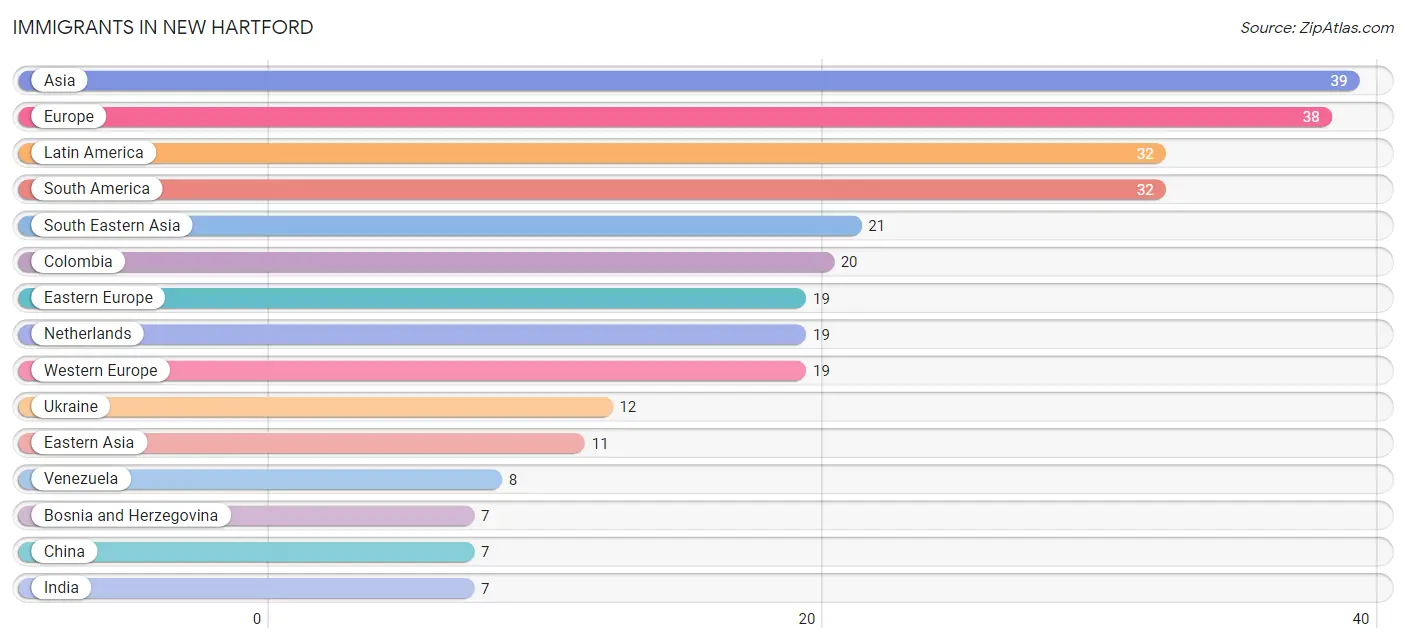
Immigrants in New Hartford
The most numerous immigrant groups reported in New Hartford came from Asia (39 | 2.1%), Europe (38 | 2.0%), Latin America (32 | 1.7%), South America (32 | 1.7%), and South Eastern Asia (21 | 1.1%), together accounting for 8.6% of all New Hartford residents.
| Immigration Origin | # Population | % Population |
| Africa | 5 | 0.3% |
| Asia | 39 | 2.1% |
| Bosnia and Herzegovina | 7 | 0.4% |
| China | 7 | 0.4% |
| Colombia | 20 | 1.1% |
| Eastern Asia | 11 | 0.6% |
| Eastern Europe | 19 | 1.0% |
| Europe | 38 | 2.0% |
| India | 7 | 0.4% |
| Japan | 4 | 0.2% |
| Latin America | 32 | 1.7% |
| Netherlands | 19 | 1.0% |
| Northern Africa | 5 | 0.3% |
| South America | 32 | 1.7% |
| South Central Asia | 7 | 0.4% |
| South Eastern Asia | 21 | 1.1% |
| Ukraine | 12 | 0.6% |
| Venezuela | 8 | 0.4% |
| Western Europe | 19 | 1.0% | View All 19 Rows |
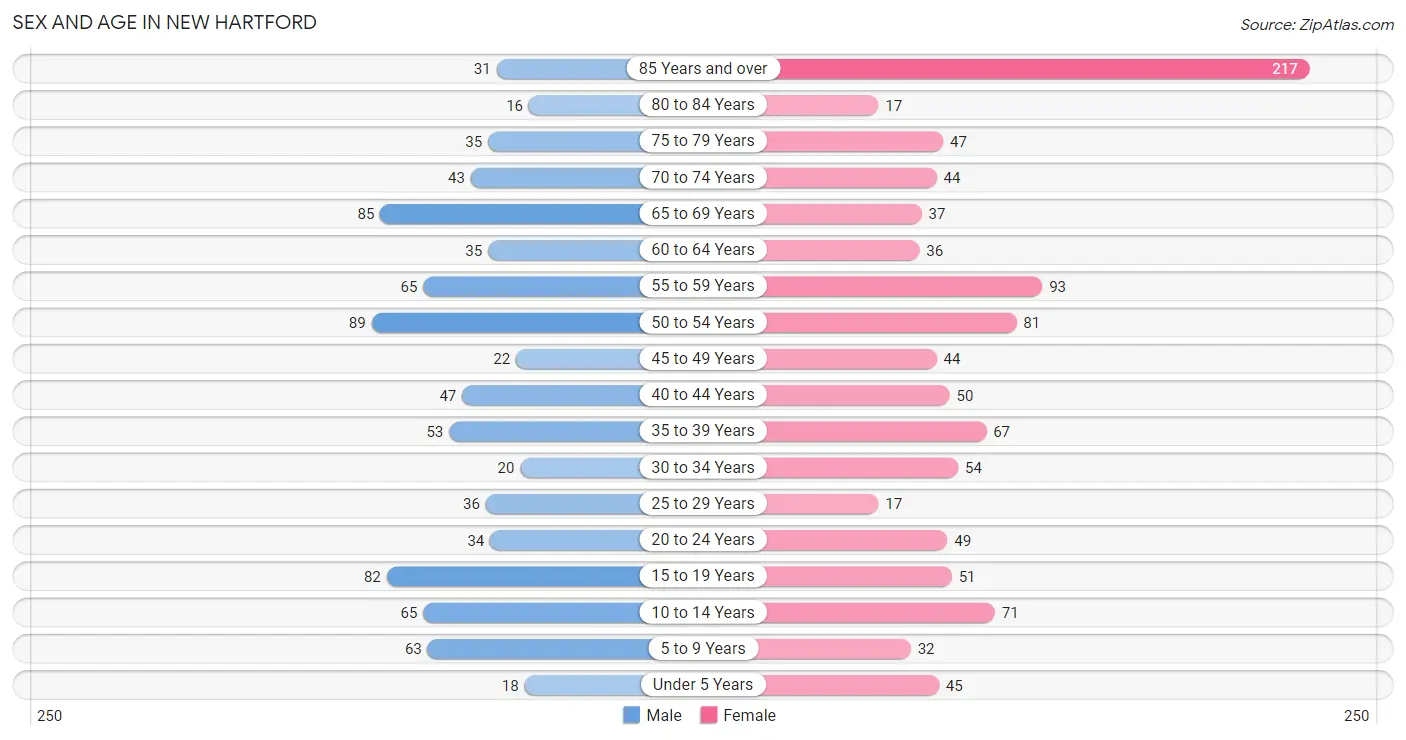
Sex and Age in New Hartford
Sex and Age in New Hartford
The most populous age groups in New Hartford are 50 to 54 Years (89 | 10.6%) for men and 85 Years and over (217 | 20.6%) for women.
| Age Bracket | Male | Female |
| Under 5 Years | 18 (2.1%) | 45 (4.3%) |
| 5 to 9 Years | 63 (7.5%) | 32 (3.0%) |
| 10 to 14 Years | 65 (7.7%) | 71 (6.8%) |
| 15 to 19 Years | 82 (9.8%) | 51 (4.9%) |
| 20 to 24 Years | 34 (4.1%) | 49 (4.7%) |
| 25 to 29 Years | 36 (4.3%) | 17 (1.6%) |
| 30 to 34 Years | 20 (2.4%) | 54 (5.1%) |
| 35 to 39 Years | 53 (6.3%) | 67 (6.4%) |
| 40 to 44 Years | 47 (5.6%) | 50 (4.8%) |
| 45 to 49 Years | 22 (2.6%) | 44 (4.2%) |
| 50 to 54 Years | 89 (10.6%) | 81 (7.7%) |
| 55 to 59 Years | 65 (7.7%) | 93 (8.8%) |
| 60 to 64 Years | 35 (4.2%) | 36 (3.4%) |
| 65 to 69 Years | 85 (10.1%) | 37 (3.5%) |
| 70 to 74 Years | 43 (5.1%) | 44 (4.2%) |
| 75 to 79 Years | 35 (4.2%) | 47 (4.5%) |
| 80 to 84 Years | 16 (1.9%) | 17 (1.6%) |
| 85 Years and over | 31 (3.7%) | 217 (20.6%) |
| Total | 839 (100.0%) | 1,052 (100.0%) |
Families and Households in New Hartford
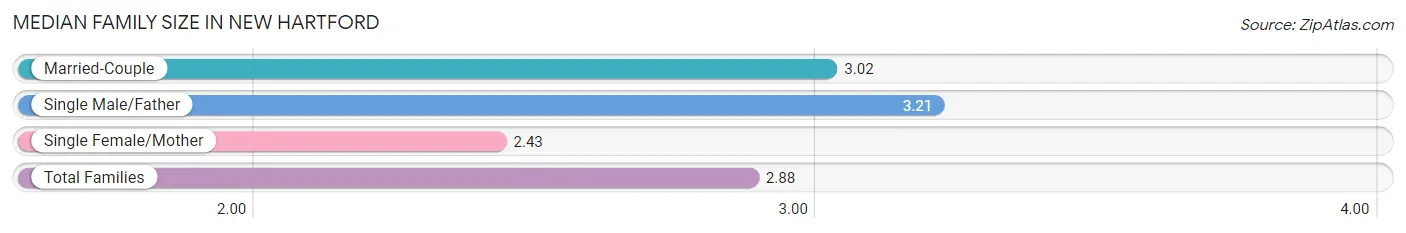
Median Family Size in New Hartford
The median family size in New Hartford is 2.88 persons per family, with single male/father families (33 | 7.2%) accounting for the largest median family size of 3.21 persons per family. On the other hand, single female/mother families (120 | 26.4%) represent the smallest median family size with 2.43 persons per family.
| Family Type | # Families | Family Size |
| Married-Couple | 302 (66.4%) | 3.02 |
| Single Male/Father | 33 (7.2%) | 3.21 |
| Single Female/Mother | 120 (26.4%) | 2.43 |
| Total Families | 455 (100.0%) | 2.88 |
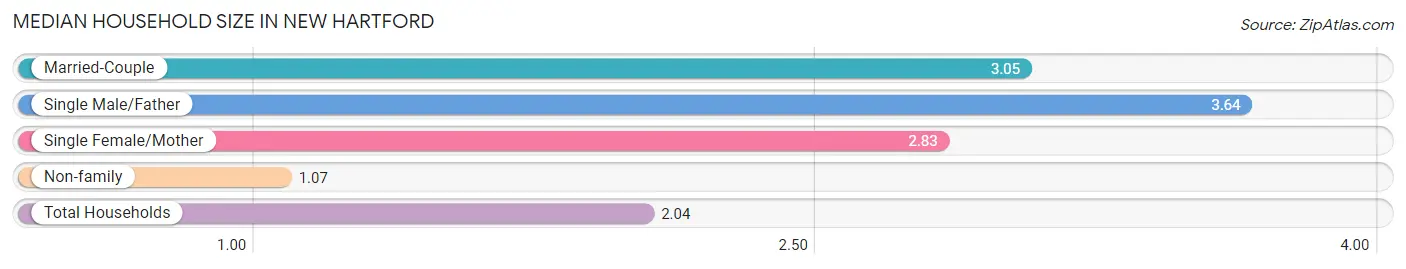
Median Household Size in New Hartford
The median household size in New Hartford is 2.04 persons per household, with single male/father households (33 | 3.6%) accounting for the largest median household size of 3.64 persons per household. non-family households (464 | 50.5%) represent the smallest median household size with 1.07 persons per household.
| Household Type | # Households | Household Size |
| Married-Couple | 302 (32.9%) | 3.05 |
| Single Male/Father | 33 (3.6%) | 3.64 |
| Single Female/Mother | 120 (13.1%) | 2.83 |
| Non-family | 464 (50.5%) | 1.07 |
| Total Households | 919 (100.0%) | 2.04 |
Household Size by Marriage Status in New Hartford
Out of a total of 919 households in New Hartford, 455 (49.5%) are family households, while 464 (50.5%) are nonfamily households. The most numerous type of family households are 2-person households, comprising 225, and the most common type of nonfamily households are 1-person households, comprising 431.
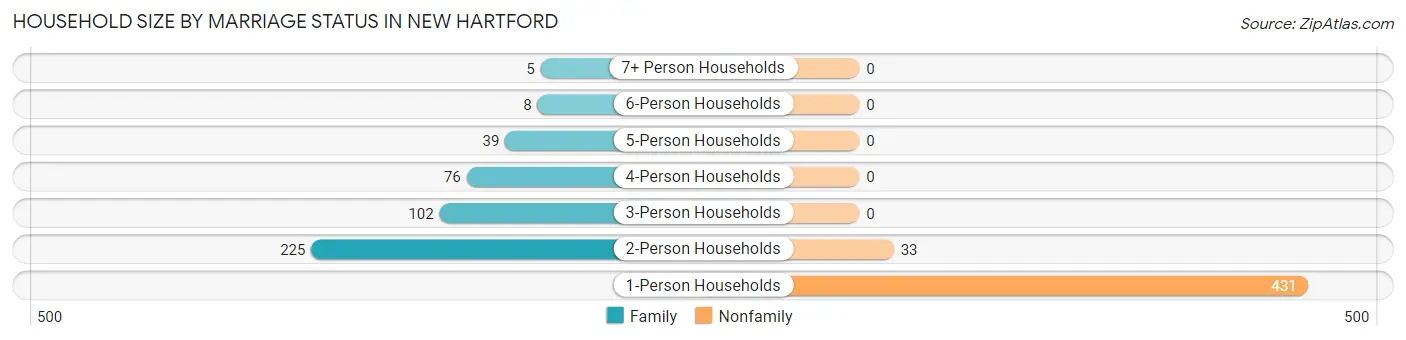
| Household Size | Family Households | Nonfamily Households |
| 1-Person Households | - | 431 (46.9%) |
| 2-Person Households | 225 (24.5%) | 33 (3.6%) |
| 3-Person Households | 102 (11.1%) | 0 (0.0%) |
| 4-Person Households | 76 (8.3%) | 0 (0.0%) |
| 5-Person Households | 39 (4.2%) | 0 (0.0%) |
| 6-Person Households | 8 (0.9%) | 0 (0.0%) |
| 7+ Person Households | 5 (0.5%) | 0 (0.0%) |
| Total | 455 (49.5%) | 464 (50.5%) |
Female Fertility in New Hartford
Fertility by Age in New Hartford
Average fertility rate in New Hartford is 96.0 births per 1,000 women. Women in the age bracket of 35 to 50 years have the highest fertility rate with 143.0 births per 1,000 women. Women in the age bracket of 35 to 50 years acount for 71.9% of all women with births.
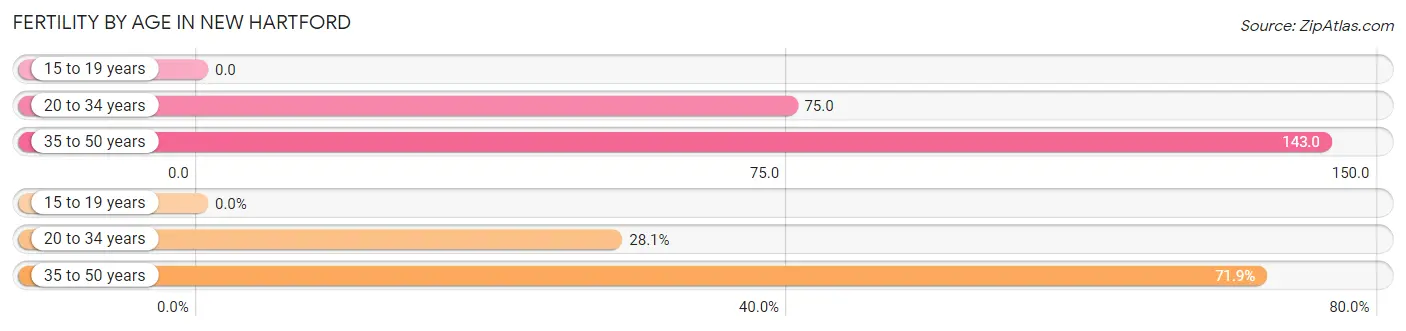
| Age Bracket | Women with Births | Births / 1,000 Women |
| 15 to 19 years | 0 (0.0%) | 0.0 |
| 20 to 34 years | 9 (28.1%) | 75.0 |
| 35 to 50 years | 23 (71.9%) | 143.0 |
| Total | 32 (100.0%) | 96.0 |
Fertility by Age by Marriage Status in New Hartford
75.0% of women with births (32) in New Hartford are married. The highest percentage of unmarried women with births falls into 35 to 50 years age bracket with 34.8% of them unmarried at the time of birth, while the lowest percentage of unmarried women with births belong to 20 to 34 years age bracket with 0.0% of them unmarried.
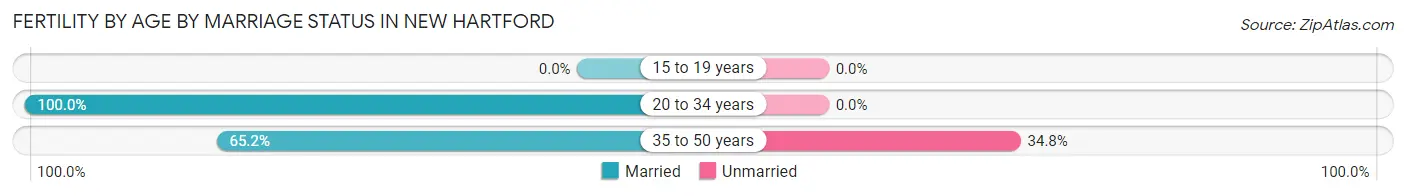
| Age Bracket | Married | Unmarried |
| 15 to 19 years | 0 (0.0%) | 0 (0.0%) |
| 20 to 34 years | 9 (100.0%) | 0 (0.0%) |
| 35 to 50 years | 15 (65.2%) | 8 (34.8%) |
| Total | 24 (75.0%) | 8 (25.0%) |
Fertility by Education in New Hartford
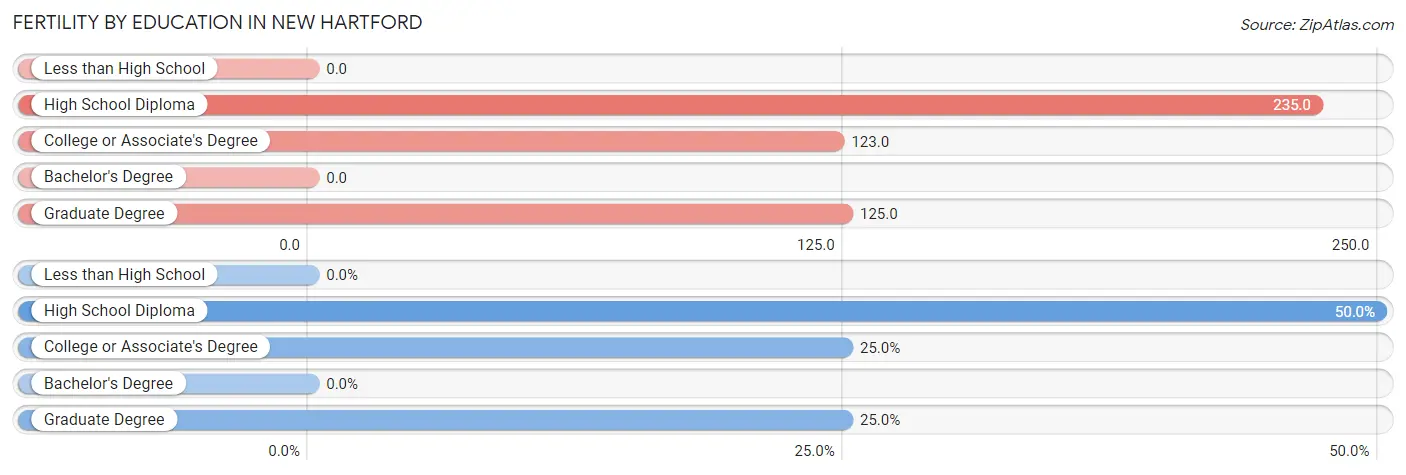
| Educational Attainment | Women with Births | Births / 1,000 Women |
| Less than High School | 0 (0.0%) | 0.0 |
| High School Diploma | 16 (50.0%) | 235.0 |
| College or Associate's Degree | 8 (25.0%) | 123.0 |
| Bachelor's Degree | 0 (0.0%) | 0.0 |
| Graduate Degree | 8 (25.0%) | 125.0 |
| Total | 32 (100.0%) | 96.0 |
Fertility by Education by Marriage Status in New Hartford
25.0% of women with births in New Hartford are unmarried. Women with the educational attainment of high school diploma are most likely to be married with 100.0% of them married at childbirth, while women with the educational attainment of graduate degree are least likely to be married with 100.0% of them unmarried at childbirth.
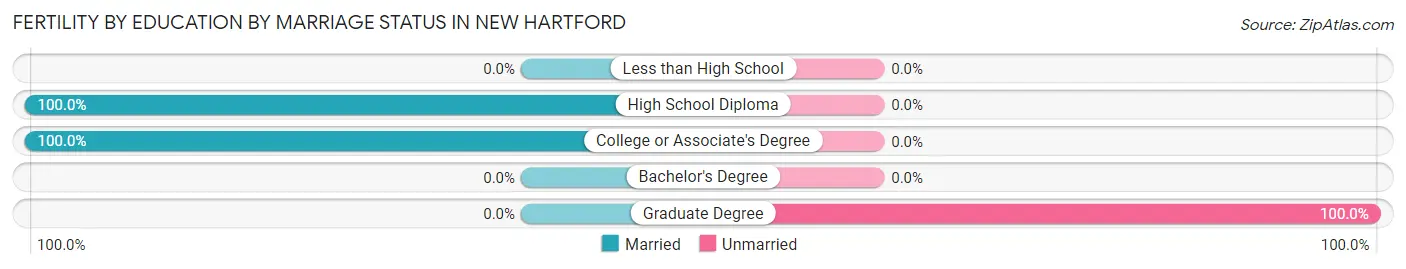
| Educational Attainment | Married | Unmarried |
| Less than High School | 0 (0.0%) | 0 (0.0%) |
| High School Diploma | 16 (100.0%) | 0 (0.0%) |
| College or Associate's Degree | 8 (100.0%) | 0 (0.0%) |
| Bachelor's Degree | 0 (0.0%) | 0 (0.0%) |
| Graduate Degree | 0 (0.0%) | 8 (100.0%) |
| Total | 24 (75.0%) | 8 (25.0%) |
Employment Characteristics in New Hartford
Employment by Class of Employer in New Hartford
Among the 829 employed individuals in New Hartford, private company employees (353 | 42.6%), not-for-profit organizations (162 | 19.5%), and local government employees (99 | 11.9%) make up the most common classes of employment.
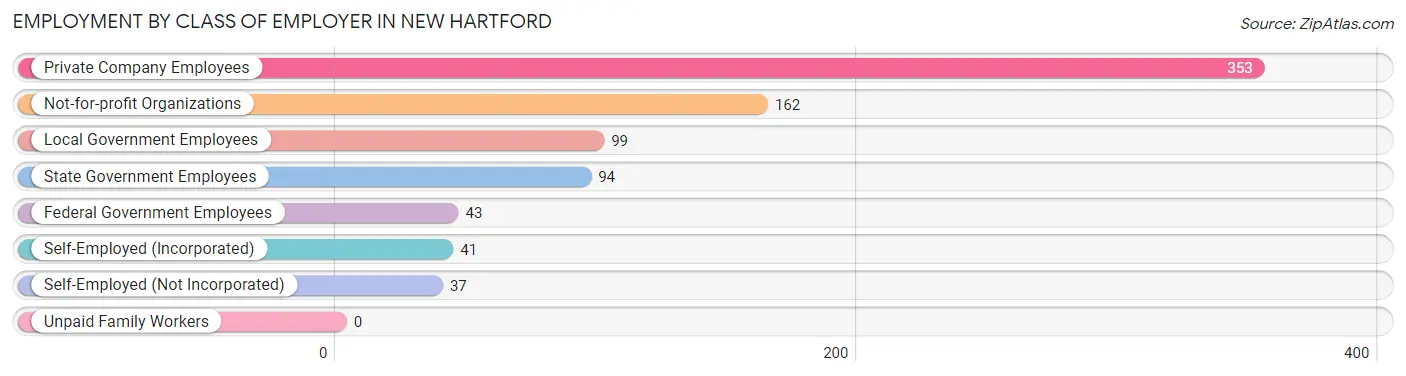
| Employer Class | # Employees | % Employees |
| Private Company Employees | 353 | 42.6% |
| Self-Employed (Incorporated) | 41 | 5.0% |
| Self-Employed (Not Incorporated) | 37 | 4.5% |
| Not-for-profit Organizations | 162 | 19.5% |
| Local Government Employees | 99 | 11.9% |
| State Government Employees | 94 | 11.3% |
| Federal Government Employees | 43 | 5.2% |
| Unpaid Family Workers | 0 | 0.0% |
| Total | 829 | 100.0% |
Employment Status by Age in New Hartford
According to the labor force statistics for New Hartford, out of the total population over 16 years of age (1,582), 54.6% or 864 individuals are in the labor force, with 2.5% or 22 of them unemployed. The age group with the highest labor force participation rate is 30 to 34 years, with 95.9% or 71 individuals in the labor force. Within the labor force, the 16 to 19 years age range has the highest percentage of unemployed individuals, with 25.6% or 10 of them being unemployed.
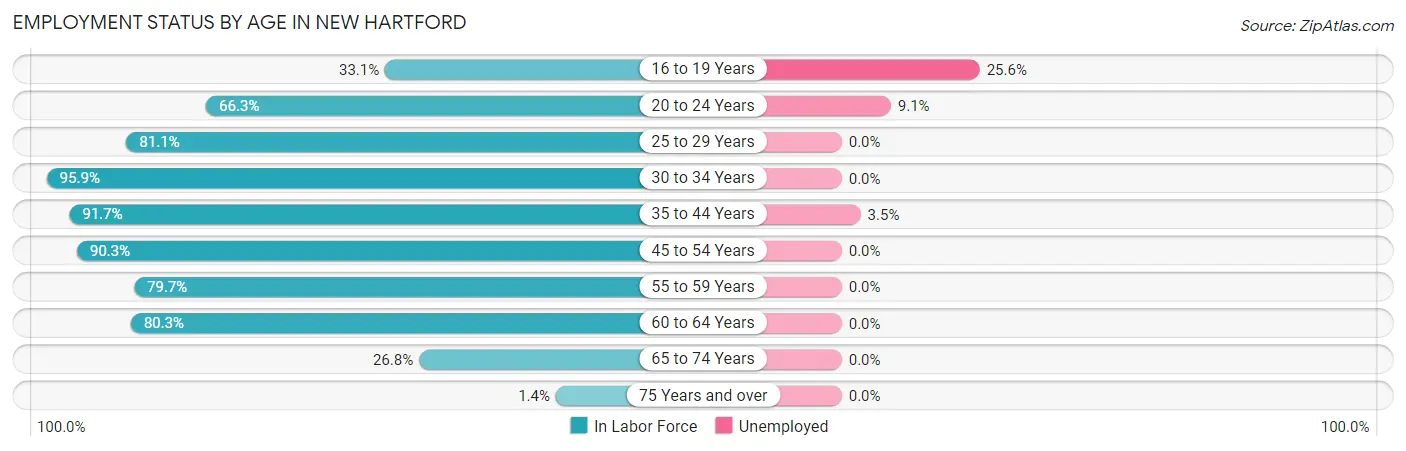
| Age Bracket | In Labor Force | Unemployed |
| 16 to 19 Years | 39 (33.1%) | 10 (25.6%) |
| 20 to 24 Years | 55 (66.3%) | 5 (9.1%) |
| 25 to 29 Years | 43 (81.1%) | 0 (0.0%) |
| 30 to 34 Years | 71 (95.9%) | 0 (0.0%) |
| 35 to 44 Years | 199 (91.7%) | 7 (3.5%) |
| 45 to 54 Years | 213 (90.3%) | 0 (0.0%) |
| 55 to 59 Years | 126 (79.7%) | 0 (0.0%) |
| 60 to 64 Years | 57 (80.3%) | 0 (0.0%) |
| 65 to 74 Years | 56 (26.8%) | 0 (0.0%) |
| 75 Years and over | 5 (1.4%) | 0 (0.0%) |
| Total | 864 (54.6%) | 22 (2.5%) |
Employment Status by Educational Attainment in New Hartford
According to labor force statistics for New Hartford, 87.6% of individuals (709) out of the total population between 25 and 64 years of age (809) are in the labor force, with 1.0% or 7 of them being unemployed. The group with the highest labor force participation rate are those with the educational attainment of college / associate degree, with 94.1% or 175 individuals in the labor force. Within the labor force, individuals with bachelor's degree or higher education have the highest percentage of unemployment, with 1.6% or 7 of them being unemployed.
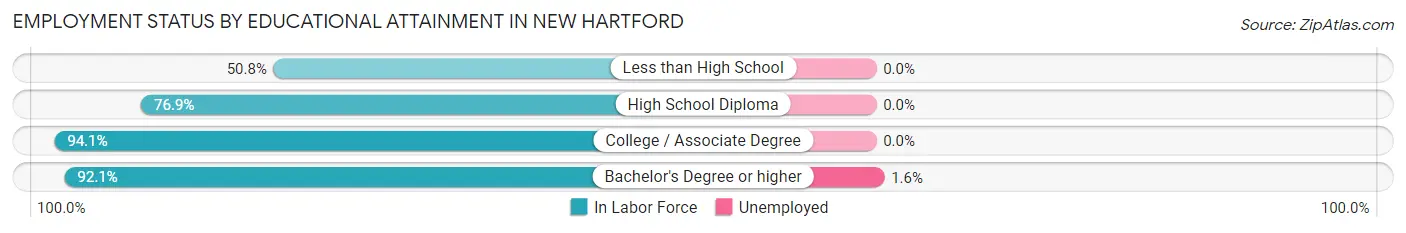
| Educational Attainment | In Labor Force | Unemployed |
| Less than High School | 32 (50.8%) | 0 (0.0%) |
| High School Diploma | 70 (76.9%) | 0 (0.0%) |
| College / Associate Degree | 175 (94.1%) | 0 (0.0%) |
| Bachelor's Degree or higher | 432 (92.1%) | 8 (1.6%) |
| Total | 709 (87.6%) | 8 (1.0%) |
Employment Occupations by Sex in New Hartford
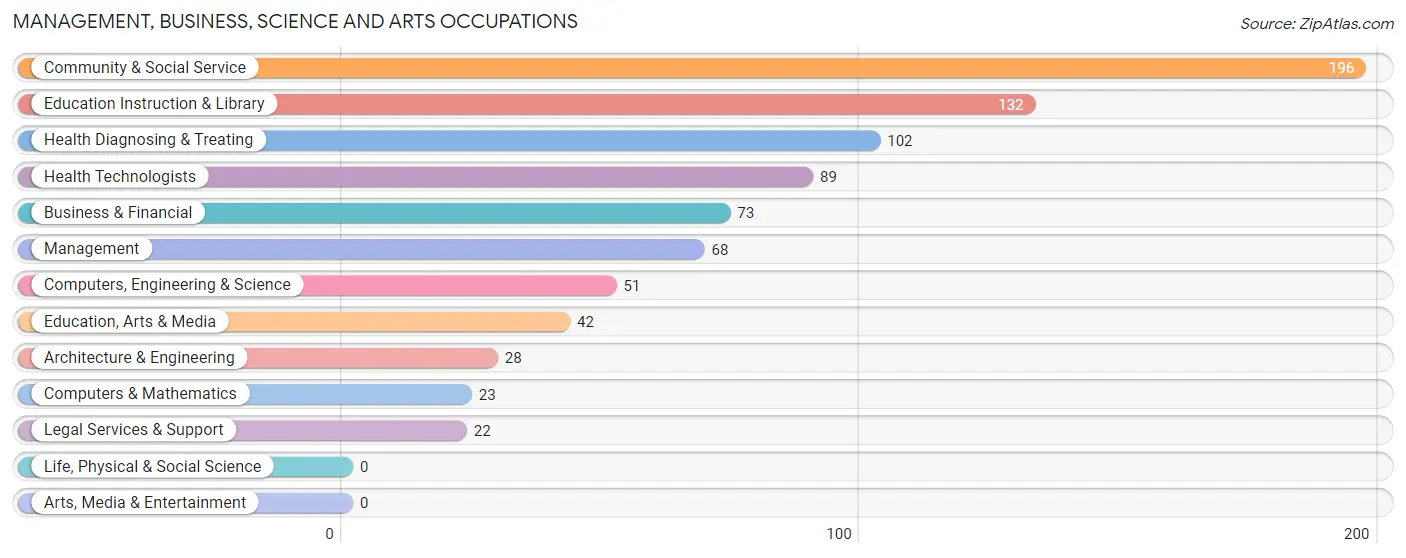
Management, Business, Science and Arts Occupations
The most common Management, Business, Science and Arts occupations in New Hartford are Community & Social Service (196 | 23.3%), Education Instruction & Library (132 | 15.7%), Health Diagnosing & Treating (102 | 12.1%), Health Technologists (89 | 10.6%), and Business & Financial (73 | 8.7%).
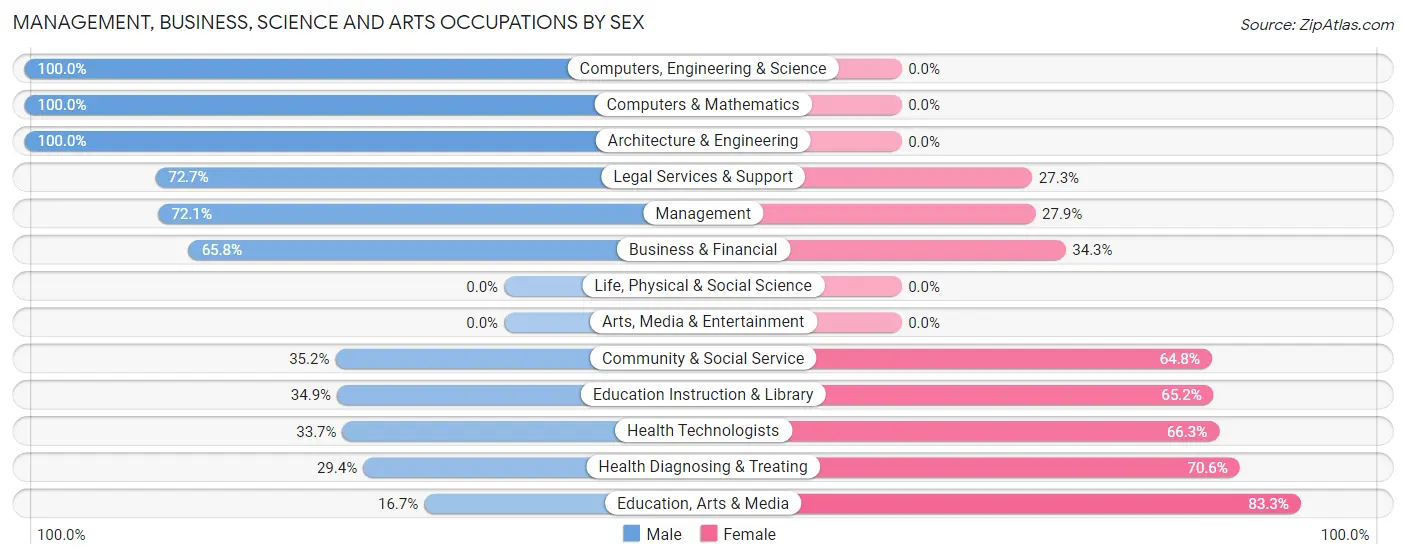
Management, Business, Science and Arts Occupations by Sex
Within the Management, Business, Science and Arts occupations in New Hartford, the most male-oriented occupations are Computers, Engineering & Science (100.0%), Computers & Mathematics (100.0%), and Architecture & Engineering (100.0%), while the most female-oriented occupations are Education, Arts & Media (83.3%), Health Diagnosing & Treating (70.6%), and Health Technologists (66.3%).
| Occupation | Male | Female |
| Management | 49 (72.1%) | 19 (27.9%) |
| Business & Financial | 48 (65.7%) | 25 (34.3%) |
| Computers, Engineering & Science | 51 (100.0%) | 0 (0.0%) |
| Computers & Mathematics | 23 (100.0%) | 0 (0.0%) |
| Architecture & Engineering | 28 (100.0%) | 0 (0.0%) |
| Life, Physical & Social Science | 0 (0.0%) | 0 (0.0%) |
| Community & Social Service | 69 (35.2%) | 127 (64.8%) |
| Education, Arts & Media | 7 (16.7%) | 35 (83.3%) |
| Legal Services & Support | 16 (72.7%) | 6 (27.3%) |
| Education Instruction & Library | 46 (34.8%) | 86 (65.1%) |
| Arts, Media & Entertainment | 0 (0.0%) | 0 (0.0%) |
| Health Diagnosing & Treating | 30 (29.4%) | 72 (70.6%) |
| Health Technologists | 30 (33.7%) | 59 (66.3%) |
| Total (Category) | 247 (50.4%) | 243 (49.6%) |
| Total (Overall) | 435 (51.7%) | 407 (48.3%) |
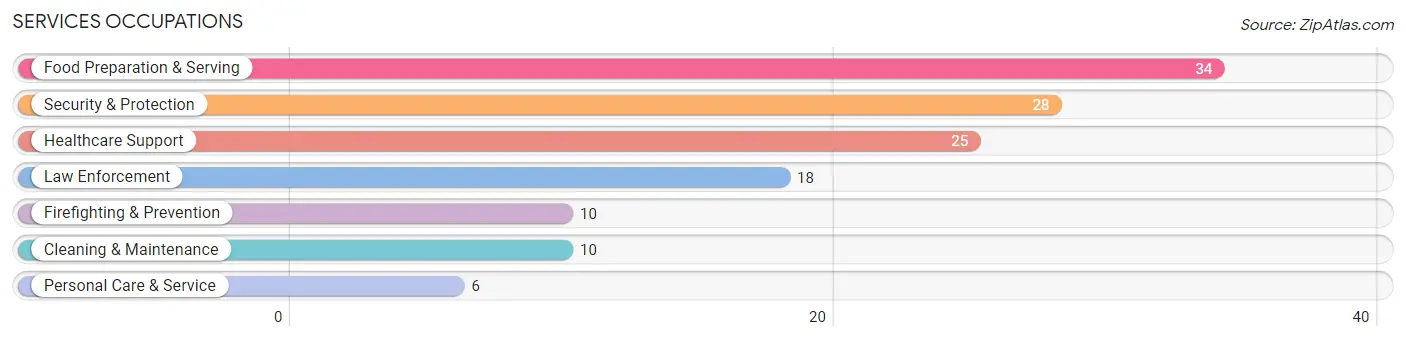
Services Occupations
The most common Services occupations in New Hartford are Food Preparation & Serving (34 | 4.0%), Security & Protection (28 | 3.3%), Healthcare Support (25 | 3.0%), Law Enforcement (18 | 2.1%), and Firefighting & Prevention (10 | 1.2%).
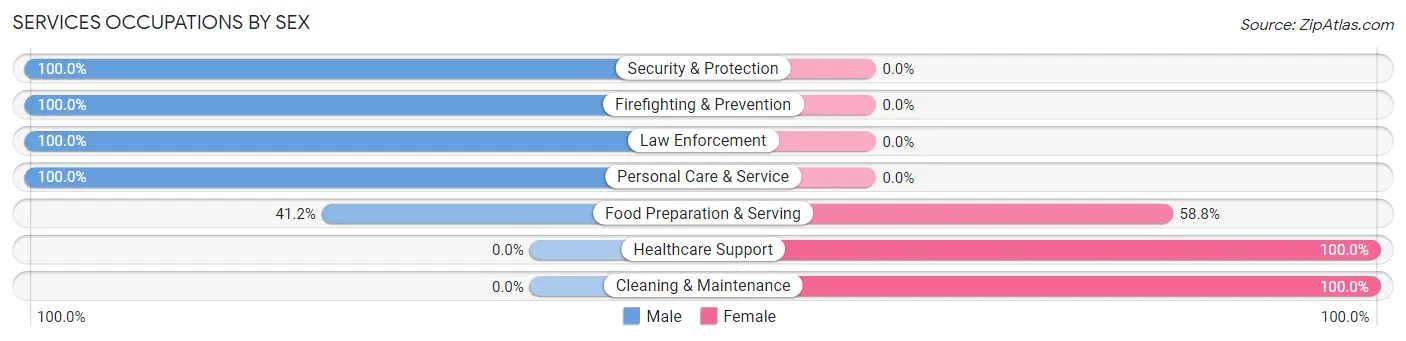
Services Occupations by Sex
Within the Services occupations in New Hartford, the most male-oriented occupations are Security & Protection (100.0%), Firefighting & Prevention (100.0%), and Law Enforcement (100.0%), while the most female-oriented occupations are Healthcare Support (100.0%), Cleaning & Maintenance (100.0%), and Food Preparation & Serving (58.8%).
| Occupation | Male | Female |
| Healthcare Support | 0 (0.0%) | 25 (100.0%) |
| Security & Protection | 28 (100.0%) | 0 (0.0%) |
| Firefighting & Prevention | 10 (100.0%) | 0 (0.0%) |
| Law Enforcement | 18 (100.0%) | 0 (0.0%) |
| Food Preparation & Serving | 14 (41.2%) | 20 (58.8%) |
| Cleaning & Maintenance | 0 (0.0%) | 10 (100.0%) |
| Personal Care & Service | 6 (100.0%) | 0 (0.0%) |
| Total (Category) | 48 (46.6%) | 55 (53.4%) |
| Total (Overall) | 435 (51.7%) | 407 (48.3%) |
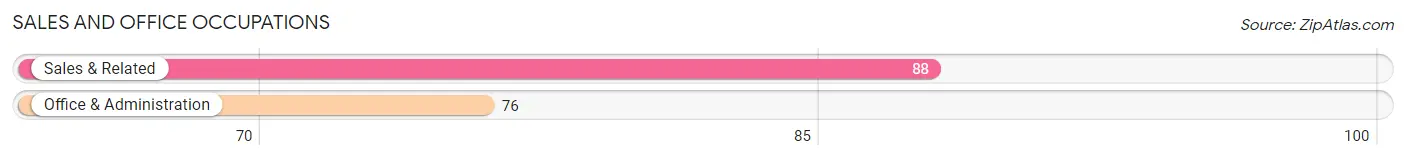
Sales and Office Occupations
The most common Sales and Office occupations in New Hartford are Sales & Related (88 | 10.4%), and Office & Administration (76 | 9.0%).
Sales and Office Occupations by Sex
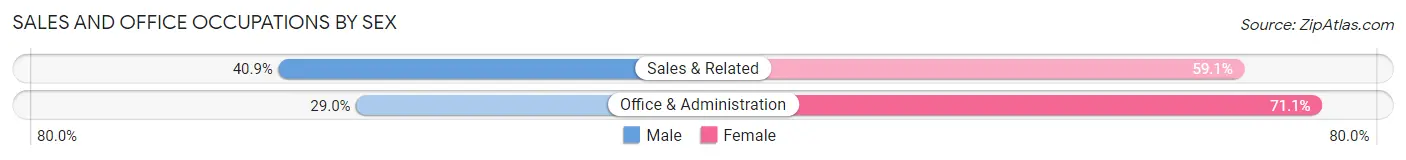
| Occupation | Male | Female |
| Sales & Related | 36 (40.9%) | 52 (59.1%) |
| Office & Administration | 22 (28.9%) | 54 (71.1%) |
| Total (Category) | 58 (35.4%) | 106 (64.6%) |
| Total (Overall) | 435 (51.7%) | 407 (48.3%) |
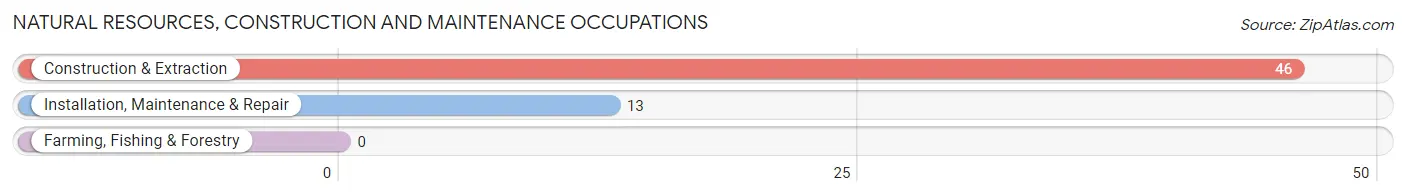
Natural Resources, Construction and Maintenance Occupations
The most common Natural Resources, Construction and Maintenance occupations in New Hartford are Construction & Extraction (46 | 5.5%), and Installation, Maintenance & Repair (13 | 1.5%).
Natural Resources, Construction and Maintenance Occupations by Sex
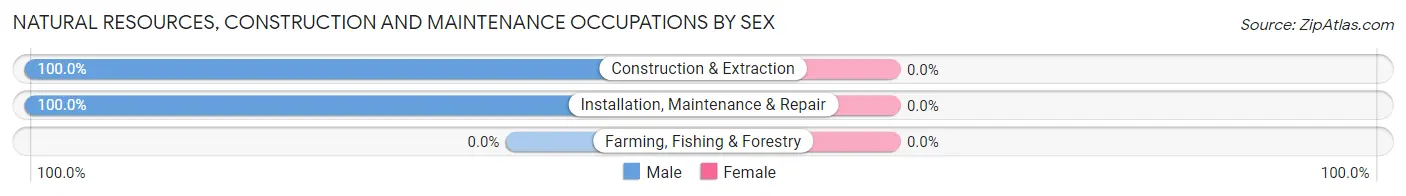
| Occupation | Male | Female |
| Farming, Fishing & Forestry | 0 (0.0%) | 0 (0.0%) |
| Construction & Extraction | 46 (100.0%) | 0 (0.0%) |
| Installation, Maintenance & Repair | 13 (100.0%) | 0 (0.0%) |
| Total (Category) | 59 (100.0%) | 0 (0.0%) |
| Total (Overall) | 435 (51.7%) | 407 (48.3%) |
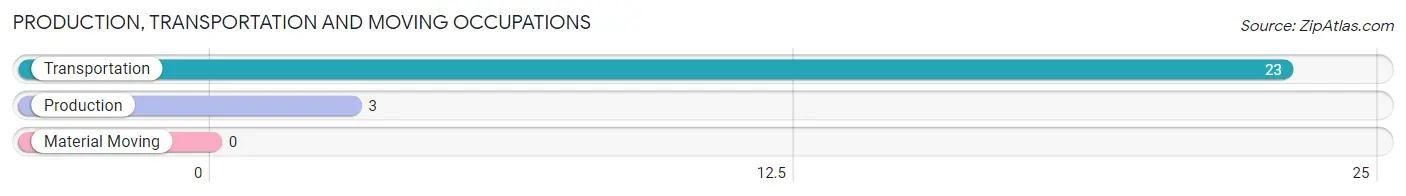
Production, Transportation and Moving Occupations
The most common Production, Transportation and Moving occupations in New Hartford are Transportation (23 | 2.7%), and Production (3 | 0.4%).
Production, Transportation and Moving Occupations by Sex
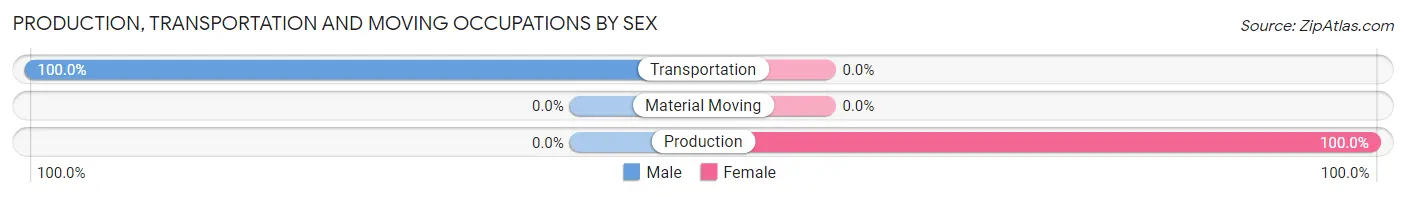
| Occupation | Male | Female |
| Production | 0 (0.0%) | 3 (100.0%) |
| Transportation | 23 (100.0%) | 0 (0.0%) |
| Material Moving | 0 (0.0%) | 0 (0.0%) |
| Total (Category) | 23 (88.5%) | 3 (11.5%) |
| Total (Overall) | 435 (51.7%) | 407 (48.3%) |
Employment Industries by Sex in New Hartford
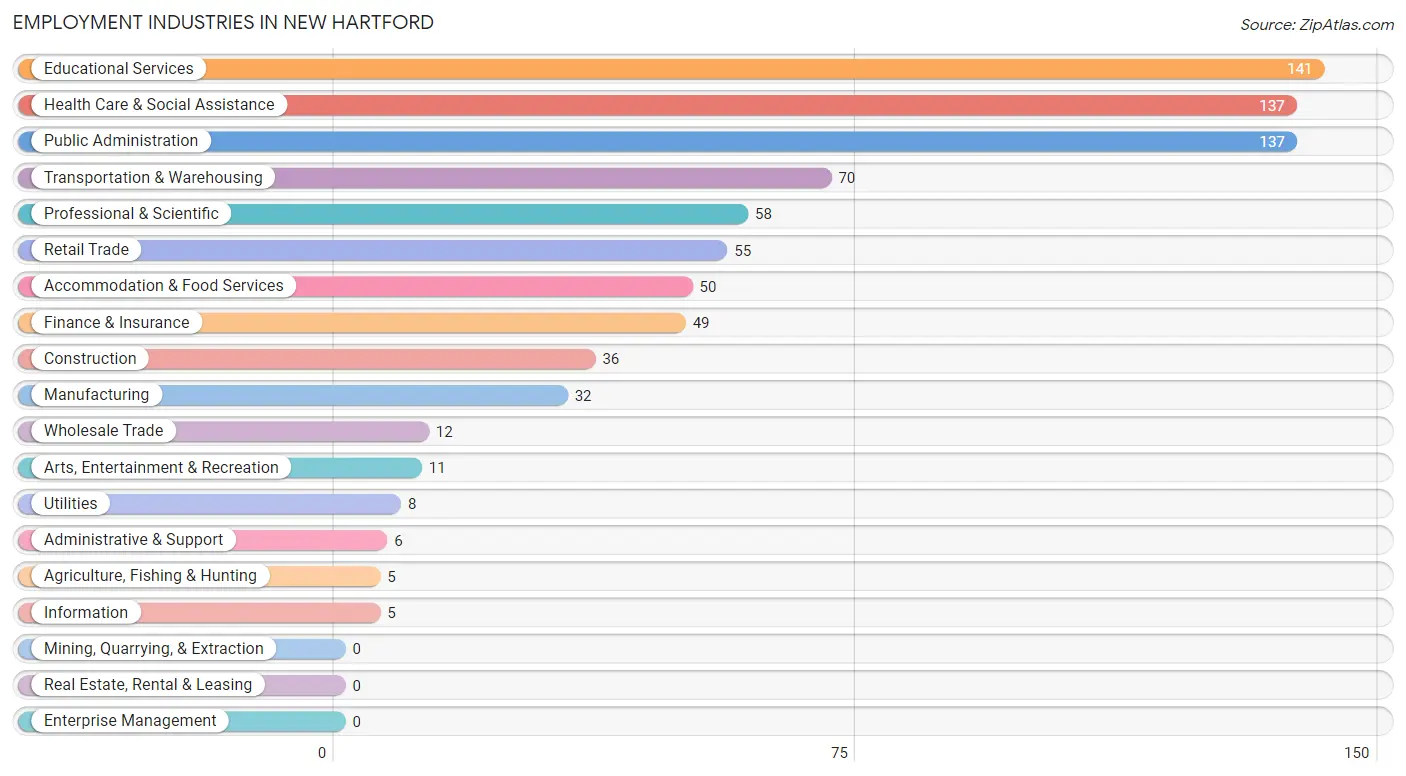
Employment Industries in New Hartford
The major employment industries in New Hartford include Educational Services (141 | 16.8%), Health Care & Social Assistance (137 | 16.3%), Public Administration (137 | 16.3%), Transportation & Warehousing (70 | 8.3%), and Professional & Scientific (58 | 6.9%).
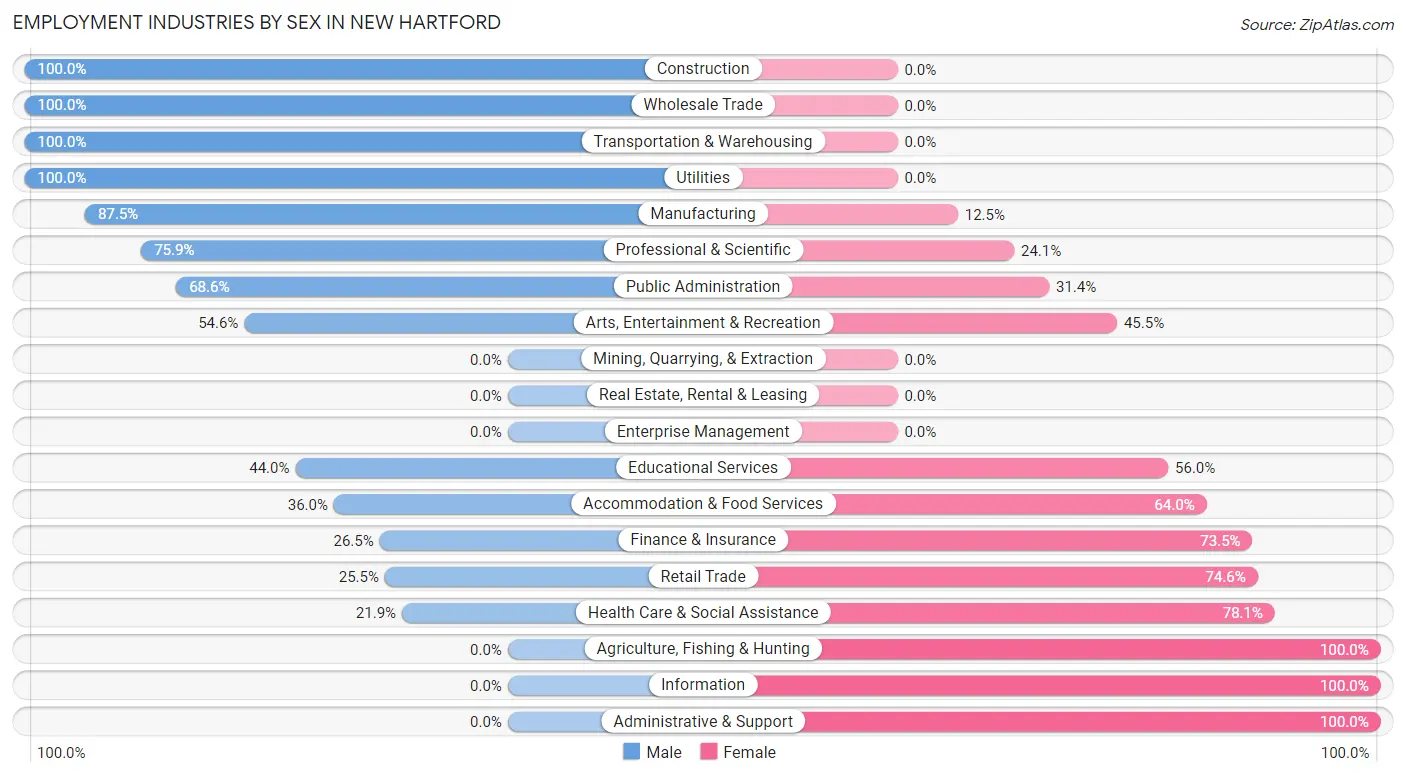
Employment Industries by Sex in New Hartford
The New Hartford industries that see more men than women are Construction (100.0%), Wholesale Trade (100.0%), and Transportation & Warehousing (100.0%), whereas the industries that tend to have a higher number of women are Agriculture, Fishing & Hunting (100.0%), Information (100.0%), and Administrative & Support (100.0%).
| Industry | Male | Female |
| Agriculture, Fishing & Hunting | 0 (0.0%) | 5 (100.0%) |
| Mining, Quarrying, & Extraction | 0 (0.0%) | 0 (0.0%) |
| Construction | 36 (100.0%) | 0 (0.0%) |
| Manufacturing | 28 (87.5%) | 4 (12.5%) |
| Wholesale Trade | 12 (100.0%) | 0 (0.0%) |
| Retail Trade | 14 (25.5%) | 41 (74.6%) |
| Transportation & Warehousing | 70 (100.0%) | 0 (0.0%) |
| Utilities | 8 (100.0%) | 0 (0.0%) |
| Information | 0 (0.0%) | 5 (100.0%) |
| Finance & Insurance | 13 (26.5%) | 36 (73.5%) |
| Real Estate, Rental & Leasing | 0 (0.0%) | 0 (0.0%) |
| Professional & Scientific | 44 (75.9%) | 14 (24.1%) |
| Enterprise Management | 0 (0.0%) | 0 (0.0%) |
| Administrative & Support | 0 (0.0%) | 6 (100.0%) |
| Educational Services | 62 (44.0%) | 79 (56.0%) |
| Health Care & Social Assistance | 30 (21.9%) | 107 (78.1%) |
| Arts, Entertainment & Recreation | 6 (54.5%) | 5 (45.5%) |
| Accommodation & Food Services | 18 (36.0%) | 32 (64.0%) |
| Public Administration | 94 (68.6%) | 43 (31.4%) |
| Total | 435 (51.7%) | 407 (48.3%) |
Education in New Hartford
School Enrollment in New Hartford
The most common levels of schooling among the 463 students in New Hartford are high school (133 | 28.7%), elementary school (110 | 23.8%), and middle school (93 | 20.1%).
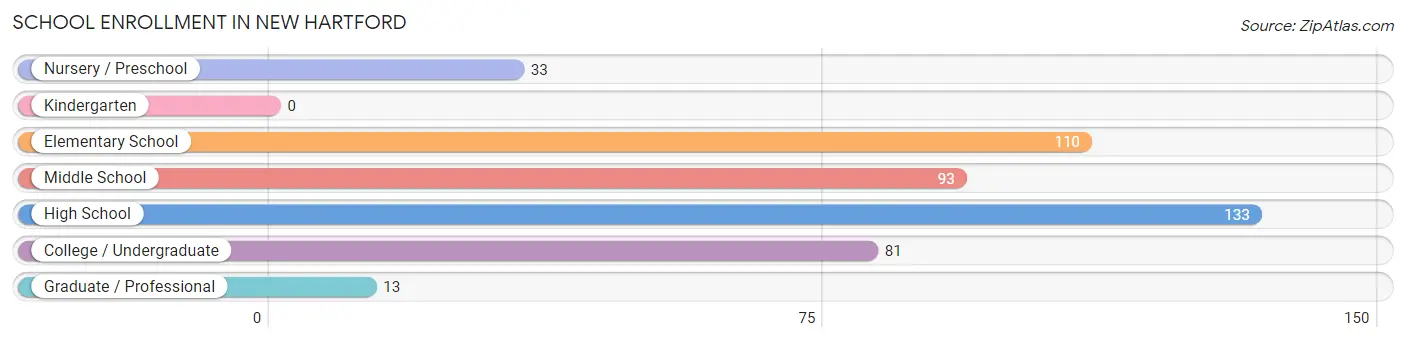
| School Level | # Students | % Students |
| Nursery / Preschool | 33 | 7.1% |
| Kindergarten | 0 | 0.0% |
| Elementary School | 110 | 23.8% |
| Middle School | 93 | 20.1% |
| High School | 133 | 28.7% |
| College / Undergraduate | 81 | 17.5% |
| Graduate / Professional | 13 | 2.8% |
| Total | 463 | 100.0% |
School Enrollment by Age by Funding Source in New Hartford
Out of a total of 463 students who are enrolled in schools in New Hartford, 76 (16.4%) attend a private institution, while the remaining 387 (83.6%) are enrolled in public schools. The age group of 35 years and over has the highest likelihood of being enrolled in private schools, with 17 (77.3% in the age bracket) enrolled. Conversely, the age group of 15 to 17 year olds has the lowest likelihood of being enrolled in a private school, with 81 (100.0% in the age bracket) attending a public institution.
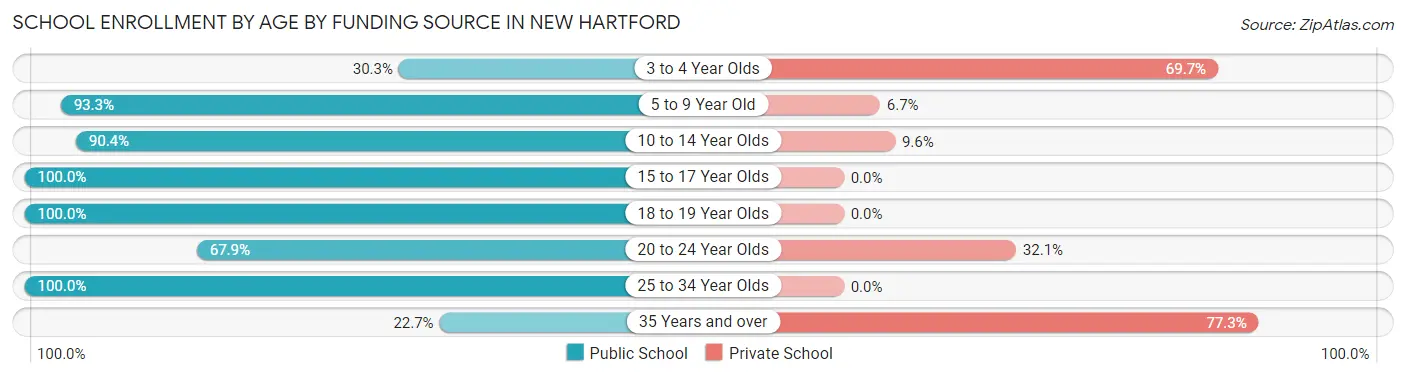
| Age Bracket | Public School | Private School |
| 3 to 4 Year Olds | 10 (30.3%) | 23 (69.7%) |
| 5 to 9 Year Old | 83 (93.3%) | 6 (6.7%) |
| 10 to 14 Year Olds | 123 (90.4%) | 13 (9.6%) |
| 15 to 17 Year Olds | 81 (100.0%) | 0 (0.0%) |
| 18 to 19 Year Olds | 42 (100.0%) | 0 (0.0%) |
| 20 to 24 Year Olds | 36 (67.9%) | 17 (32.1%) |
| 25 to 34 Year Olds | 7 (100.0%) | 0 (0.0%) |
| 35 Years and over | 5 (22.7%) | 17 (77.3%) |
| Total | 387 (83.6%) | 76 (16.4%) |
Educational Attainment by Field of Study in New Hartford
Science & technology (144 | 18.0%), education (125 | 15.6%), liberal arts & history (113 | 14.1%), social sciences (74 | 9.2%), and arts & humanities (65 | 8.1%) are the most common fields of study among 800 individuals in New Hartford who have obtained a bachelor's degree or higher.
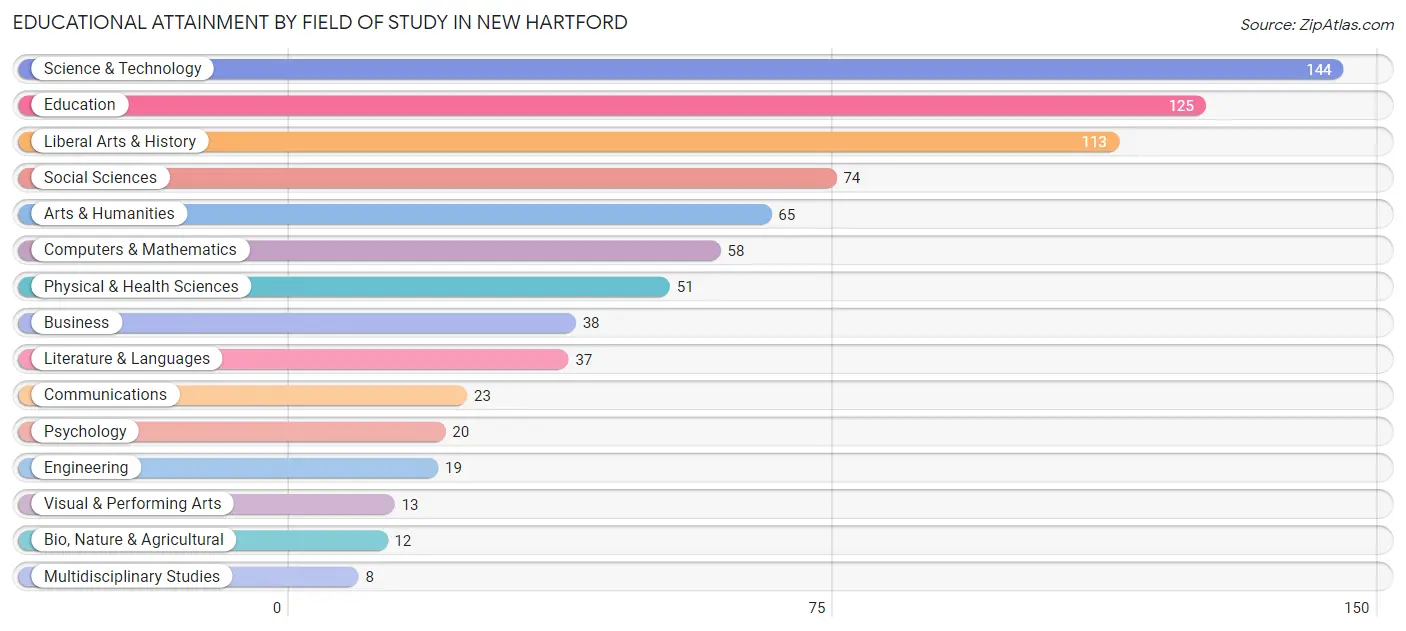
| Field of Study | # Graduates | % Graduates |
| Computers & Mathematics | 58 | 7.2% |
| Bio, Nature & Agricultural | 12 | 1.5% |
| Physical & Health Sciences | 51 | 6.4% |
| Psychology | 20 | 2.5% |
| Social Sciences | 74 | 9.2% |
| Engineering | 19 | 2.4% |
| Multidisciplinary Studies | 8 | 1.0% |
| Science & Technology | 144 | 18.0% |
| Business | 38 | 4.8% |
| Education | 125 | 15.6% |
| Literature & Languages | 37 | 4.6% |
| Liberal Arts & History | 113 | 14.1% |
| Visual & Performing Arts | 13 | 1.6% |
| Communications | 23 | 2.9% |
| Arts & Humanities | 65 | 8.1% |
| Total | 800 | 100.0% |
Transportation & Commute in New Hartford
Vehicle Availability by Sex in New Hartford
The most prevalent vehicle ownership categories in New Hartford are males with 2 vehicles (204, accounting for 46.9%) and females with 2 vehicles (200, making up 51.9%).
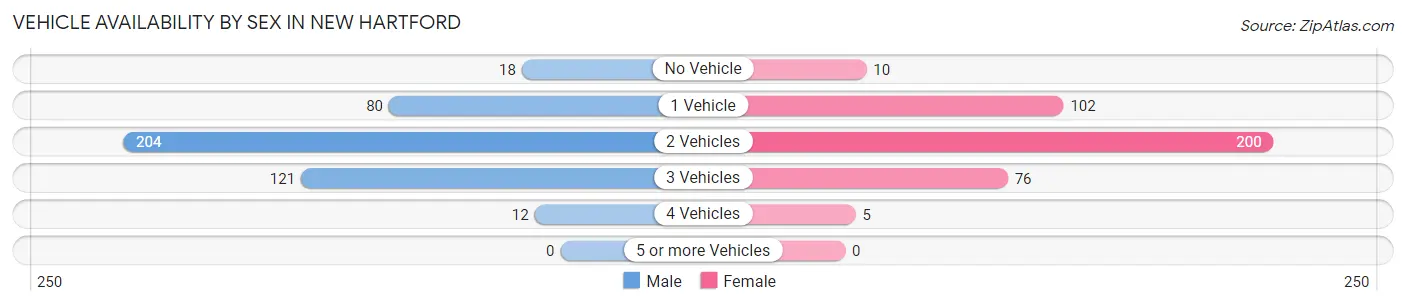
| Vehicles Available | Male | Female |
| No Vehicle | 18 (4.1%) | 10 (2.5%) |
| 1 Vehicle | 80 (18.4%) | 102 (26.0%) |
| 2 Vehicles | 204 (46.9%) | 200 (50.9%) |
| 3 Vehicles | 121 (27.8%) | 76 (19.3%) |
| 4 Vehicles | 12 (2.8%) | 5 (1.3%) |
| 5 or more Vehicles | 0 (0.0%) | 0 (0.0%) |
| Total | 435 (100.0%) | 393 (100.0%) |
Commute Time in New Hartford
The most frequently occuring commute durations in New Hartford are 5 to 9 minutes (168 commuters, 23.5%), 10 to 14 minutes (162 commuters, 22.7%), and 15 to 19 minutes (112 commuters, 15.7%).
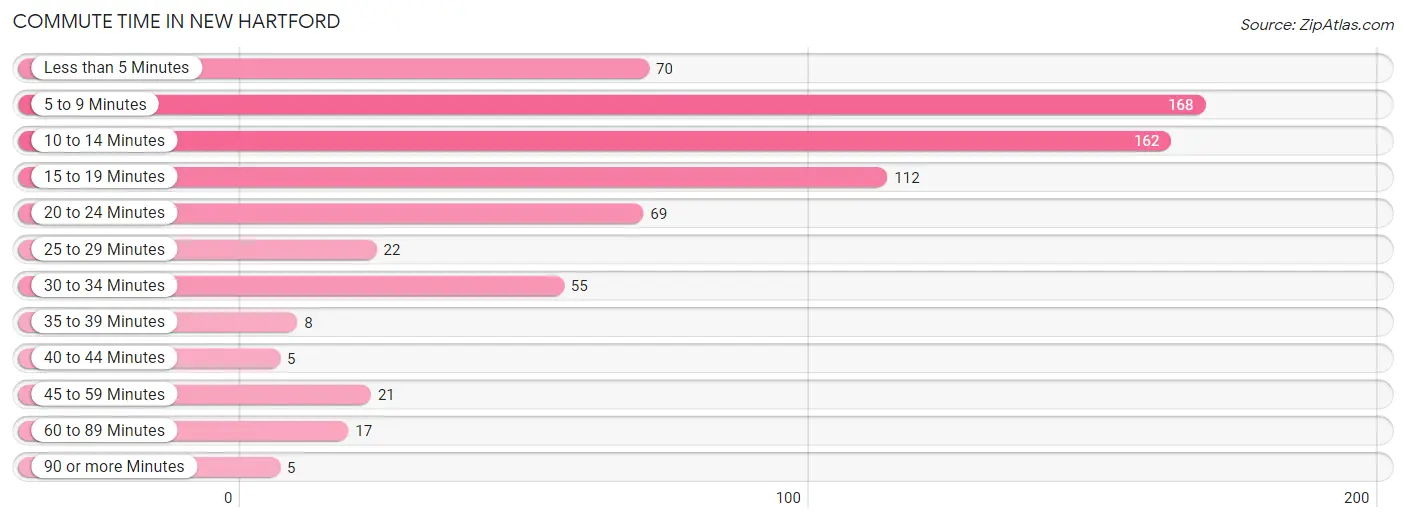
| Commute Time | # Commuters | % Commuters |
| Less than 5 Minutes | 70 | 9.8% |
| 5 to 9 Minutes | 168 | 23.5% |
| 10 to 14 Minutes | 162 | 22.7% |
| 15 to 19 Minutes | 112 | 15.7% |
| 20 to 24 Minutes | 69 | 9.7% |
| 25 to 29 Minutes | 22 | 3.1% |
| 30 to 34 Minutes | 55 | 7.7% |
| 35 to 39 Minutes | 8 | 1.1% |
| 40 to 44 Minutes | 5 | 0.7% |
| 45 to 59 Minutes | 21 | 2.9% |
| 60 to 89 Minutes | 17 | 2.4% |
| 90 or more Minutes | 5 | 0.7% |
Commute Time by Sex in New Hartford
The most common commute times in New Hartford are 5 to 9 minutes (97 commuters, 26.3%) for males and 10 to 14 minutes (88 commuters, 25.5%) for females.
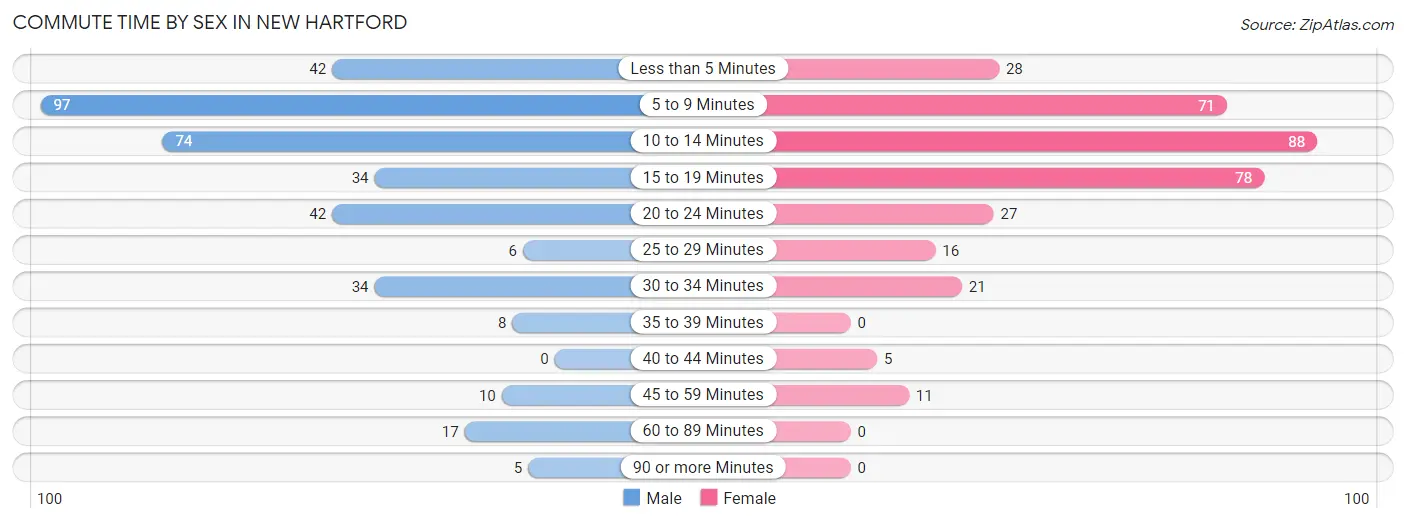
| Commute Time | Male | Female |
| Less than 5 Minutes | 42 (11.4%) | 28 (8.1%) |
| 5 to 9 Minutes | 97 (26.3%) | 71 (20.6%) |
| 10 to 14 Minutes | 74 (20.1%) | 88 (25.5%) |
| 15 to 19 Minutes | 34 (9.2%) | 78 (22.6%) |
| 20 to 24 Minutes | 42 (11.4%) | 27 (7.8%) |
| 25 to 29 Minutes | 6 (1.6%) | 16 (4.6%) |
| 30 to 34 Minutes | 34 (9.2%) | 21 (6.1%) |
| 35 to 39 Minutes | 8 (2.2%) | 0 (0.0%) |
| 40 to 44 Minutes | 0 (0.0%) | 5 (1.5%) |
| 45 to 59 Minutes | 10 (2.7%) | 11 (3.2%) |
| 60 to 89 Minutes | 17 (4.6%) | 0 (0.0%) |
| 90 or more Minutes | 5 (1.4%) | 0 (0.0%) |
Time of Departure to Work by Sex in New Hartford
The most frequent times of departure to work in New Hartford are 6:30 AM to 6:59 AM (88, 23.8%) for males and 7:30 AM to 7:59 AM (157, 45.5%) for females.
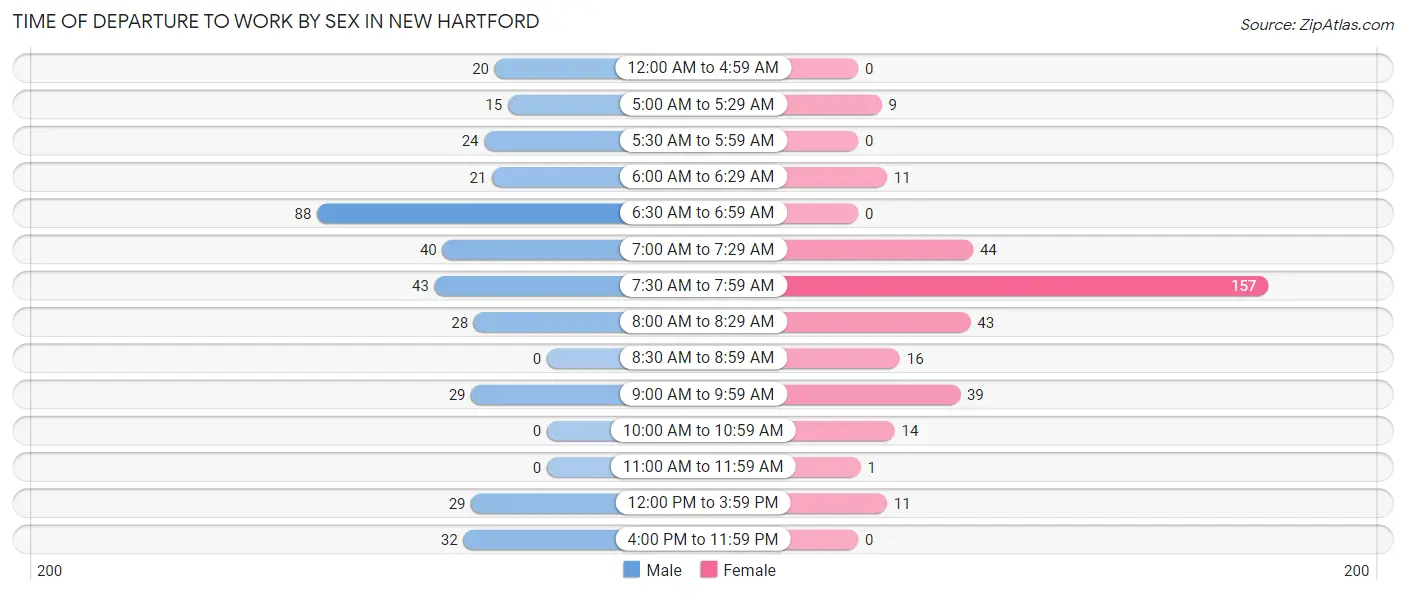
| Time of Departure | Male | Female |
| 12:00 AM to 4:59 AM | 20 (5.4%) | 0 (0.0%) |
| 5:00 AM to 5:29 AM | 15 (4.1%) | 9 (2.6%) |
| 5:30 AM to 5:59 AM | 24 (6.5%) | 0 (0.0%) |
| 6:00 AM to 6:29 AM | 21 (5.7%) | 11 (3.2%) |
| 6:30 AM to 6:59 AM | 88 (23.8%) | 0 (0.0%) |
| 7:00 AM to 7:29 AM | 40 (10.8%) | 44 (12.8%) |
| 7:30 AM to 7:59 AM | 43 (11.7%) | 157 (45.5%) |
| 8:00 AM to 8:29 AM | 28 (7.6%) | 43 (12.5%) |
| 8:30 AM to 8:59 AM | 0 (0.0%) | 16 (4.6%) |
| 9:00 AM to 9:59 AM | 29 (7.9%) | 39 (11.3%) |
| 10:00 AM to 10:59 AM | 0 (0.0%) | 14 (4.1%) |
| 11:00 AM to 11:59 AM | 0 (0.0%) | 1 (0.3%) |
| 12:00 PM to 3:59 PM | 29 (7.9%) | 11 (3.2%) |
| 4:00 PM to 11:59 PM | 32 (8.7%) | 0 (0.0%) |
| Total | 369 (100.0%) | 345 (100.0%) |
Housing Occupancy in New Hartford
Occupancy by Ownership in New Hartford
Of the total 919 dwellings in New Hartford, owner-occupied units account for 613 (66.7%), while renter-occupied units make up 306 (33.3%).
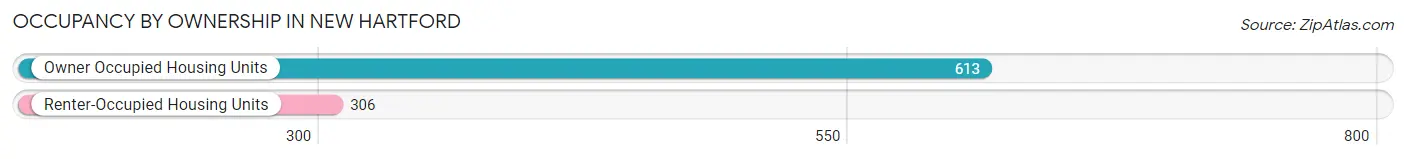
| Occupancy | # Housing Units | % Housing Units |
| Owner Occupied Housing Units | 613 | 66.7% |
| Renter-Occupied Housing Units | 306 | 33.3% |
| Total Occupied Housing Units | 919 | 100.0% |
Occupancy by Household Size in New Hartford
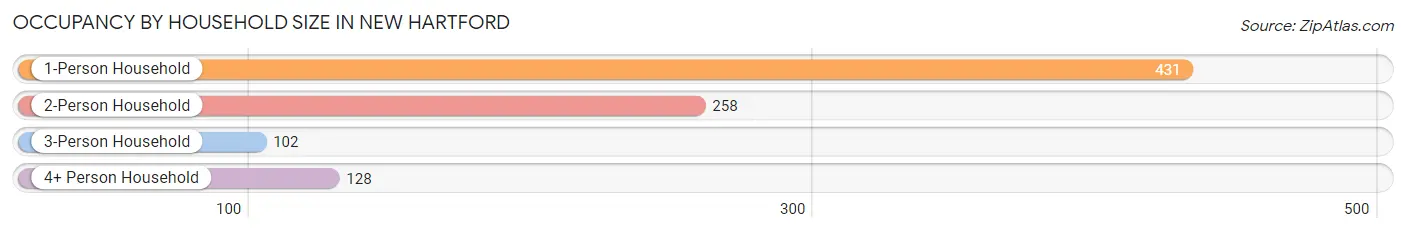
| Household Size | # Housing Units | % Housing Units |
| 1-Person Household | 431 | 46.9% |
| 2-Person Household | 258 | 28.1% |
| 3-Person Household | 102 | 11.1% |
| 4+ Person Household | 128 | 13.9% |
| Total Housing Units | 919 | 100.0% |
Occupancy by Ownership by Household Size in New Hartford
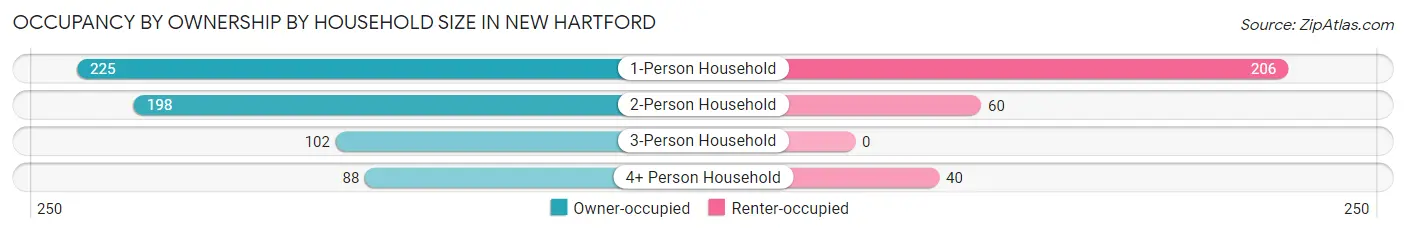
| Household Size | Owner-occupied | Renter-occupied |
| 1-Person Household | 225 (52.2%) | 206 (47.8%) |
| 2-Person Household | 198 (76.7%) | 60 (23.3%) |
| 3-Person Household | 102 (100.0%) | 0 (0.0%) |
| 4+ Person Household | 88 (68.8%) | 40 (31.2%) |
| Total Housing Units | 613 (66.7%) | 306 (33.3%) |
Occupancy by Educational Attainment in New Hartford
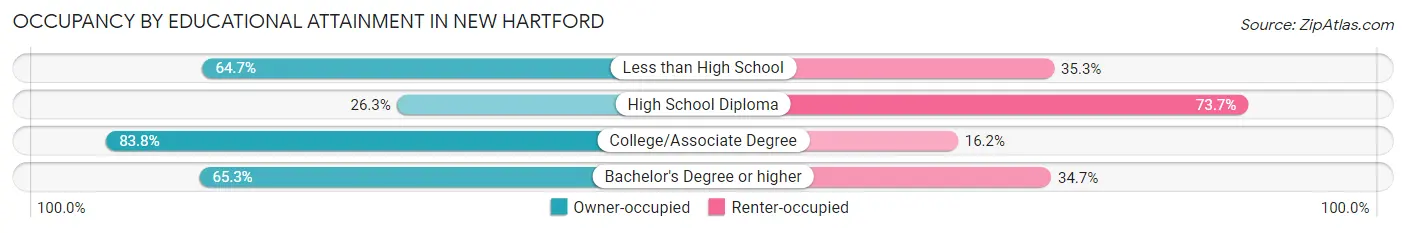
| Household Size | Owner-occupied | Renter-occupied |
| Less than High School | 11 (64.7%) | 6 (35.3%) |
| High School Diploma | 26 (26.3%) | 73 (73.7%) |
| College/Associate Degree | 233 (83.8%) | 45 (16.2%) |
| Bachelor's Degree or higher | 343 (65.3%) | 182 (34.7%) |
Occupancy by Age of Householder in New Hartford
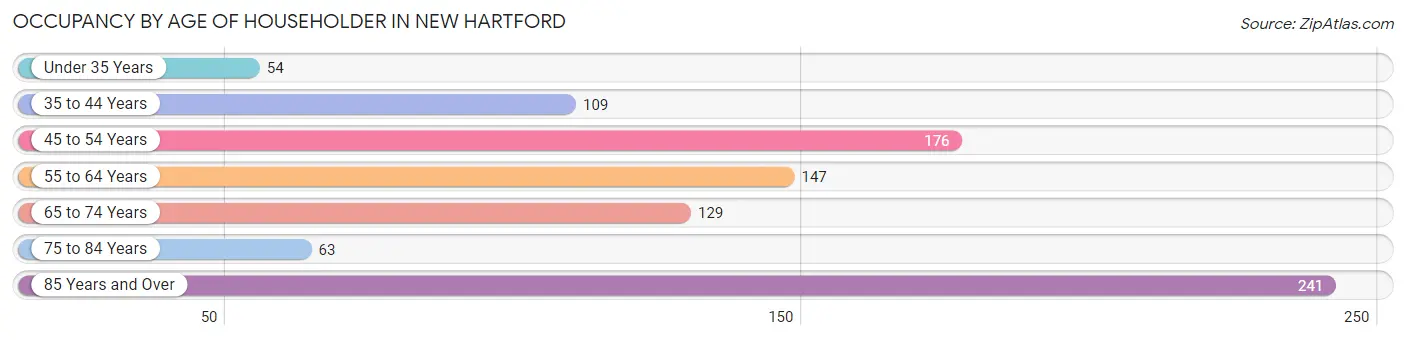
| Age Bracket | # Households | % Households |
| Under 35 Years | 54 | 5.9% |
| 35 to 44 Years | 109 | 11.9% |
| 45 to 54 Years | 176 | 19.2% |
| 55 to 64 Years | 147 | 16.0% |
| 65 to 74 Years | 129 | 14.0% |
| 75 to 84 Years | 63 | 6.9% |
| 85 Years and Over | 241 | 26.2% |
| Total | 919 | 100.0% |
Housing Finances in New Hartford
Median Income by Occupancy in New Hartford
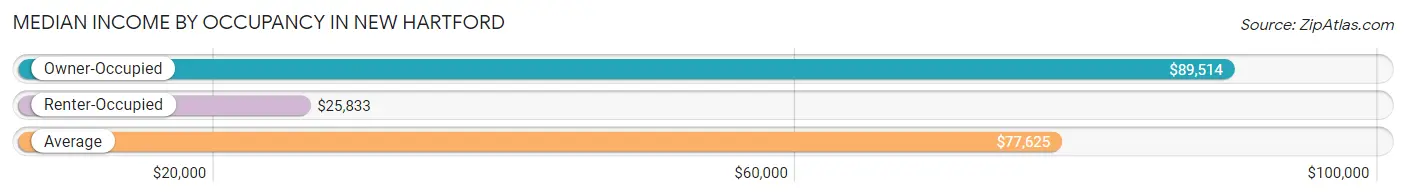
| Occupancy Type | # Households | Median Income |
| Owner-Occupied | 613 (66.7%) | $89,514 |
| Renter-Occupied | 306 (33.3%) | $25,833 |
| Average | 919 (100.0%) | $77,625 |
Occupancy by Householder Income Bracket in New Hartford
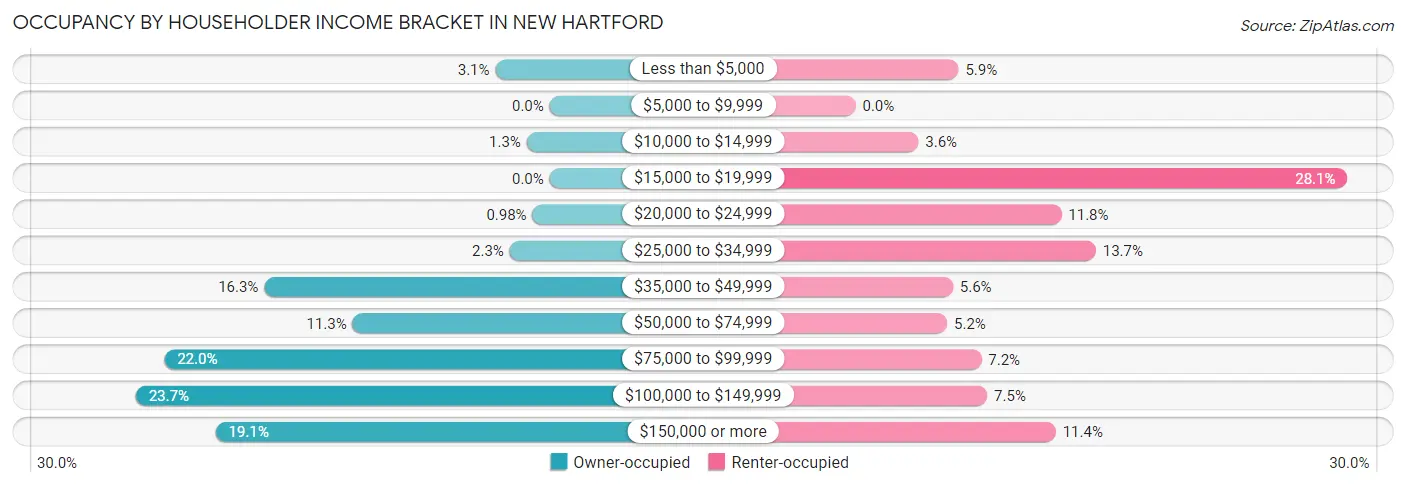
| Income Bracket | Owner-occupied | Renter-occupied |
| Less than $5,000 | 19 (3.1%) | 18 (5.9%) |
| $5,000 to $9,999 | 0 (0.0%) | 0 (0.0%) |
| $10,000 to $14,999 | 8 (1.3%) | 11 (3.6%) |
| $15,000 to $19,999 | 0 (0.0%) | 86 (28.1%) |
| $20,000 to $24,999 | 6 (1.0%) | 36 (11.8%) |
| $25,000 to $34,999 | 14 (2.3%) | 42 (13.7%) |
| $35,000 to $49,999 | 100 (16.3%) | 17 (5.6%) |
| $50,000 to $74,999 | 69 (11.3%) | 16 (5.2%) |
| $75,000 to $99,999 | 135 (22.0%) | 22 (7.2%) |
| $100,000 to $149,999 | 145 (23.6%) | 23 (7.5%) |
| $150,000 or more | 117 (19.1%) | 35 (11.4%) |
| Total | 613 (100.0%) | 306 (100.0%) |
Monthly Housing Cost Tiers in New Hartford
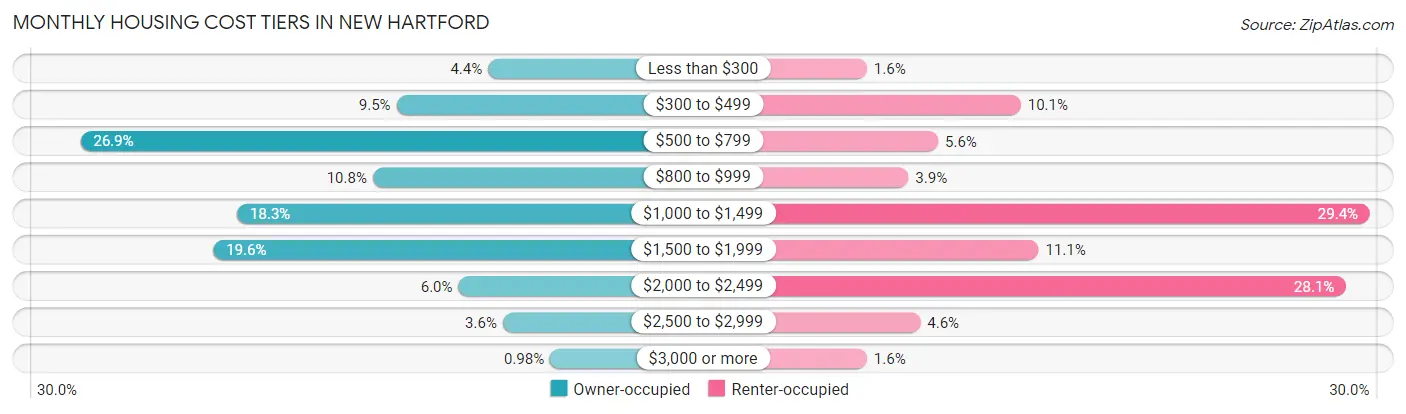
| Monthly Cost | Owner-occupied | Renter-occupied |
| Less than $300 | 27 (4.4%) | 5 (1.6%) |
| $300 to $499 | 58 (9.5%) | 31 (10.1%) |
| $500 to $799 | 165 (26.9%) | 17 (5.6%) |
| $800 to $999 | 66 (10.8%) | 12 (3.9%) |
| $1,000 to $1,499 | 112 (18.3%) | 90 (29.4%) |
| $1,500 to $1,999 | 120 (19.6%) | 34 (11.1%) |
| $2,000 to $2,499 | 37 (6.0%) | 86 (28.1%) |
| $2,500 to $2,999 | 22 (3.6%) | 14 (4.6%) |
| $3,000 or more | 6 (1.0%) | 5 (1.6%) |
| Total | 613 (100.0%) | 306 (100.0%) |
Physical Housing Characteristics in New Hartford
Housing Structures in New Hartford
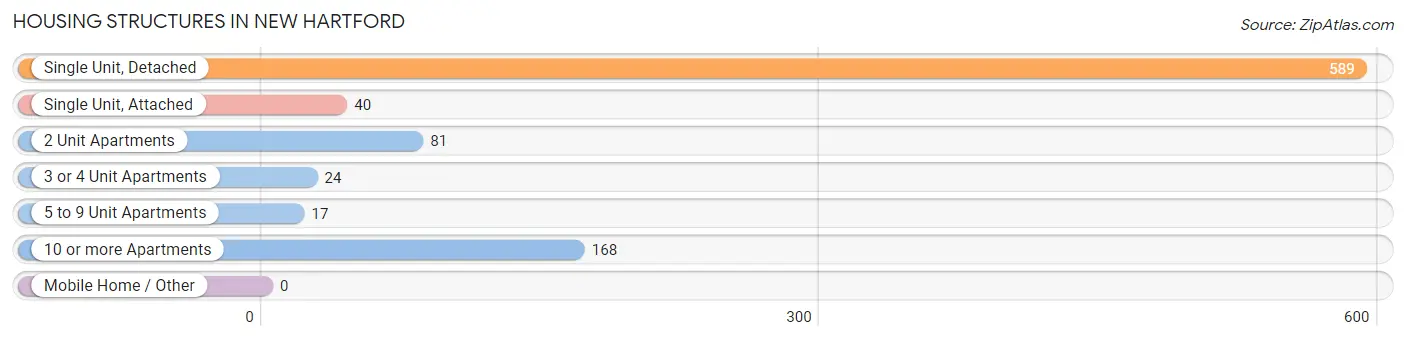
| Structure Type | # Housing Units | % Housing Units |
| Single Unit, Detached | 589 | 64.1% |
| Single Unit, Attached | 40 | 4.3% |
| 2 Unit Apartments | 81 | 8.8% |
| 3 or 4 Unit Apartments | 24 | 2.6% |
| 5 to 9 Unit Apartments | 17 | 1.8% |
| 10 or more Apartments | 168 | 18.3% |
| Mobile Home / Other | 0 | 0.0% |
| Total | 919 | 100.0% |
Housing Structures by Occupancy in New Hartford
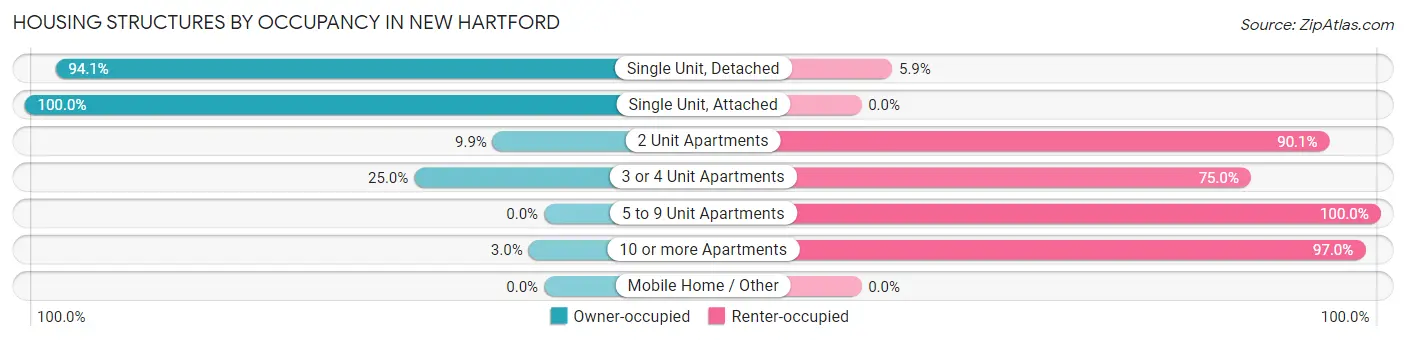
| Structure Type | Owner-occupied | Renter-occupied |
| Single Unit, Detached | 554 (94.1%) | 35 (5.9%) |
| Single Unit, Attached | 40 (100.0%) | 0 (0.0%) |
| 2 Unit Apartments | 8 (9.9%) | 73 (90.1%) |
| 3 or 4 Unit Apartments | 6 (25.0%) | 18 (75.0%) |
| 5 to 9 Unit Apartments | 0 (0.0%) | 17 (100.0%) |
| 10 or more Apartments | 5 (3.0%) | 163 (97.0%) |
| Mobile Home / Other | 0 (0.0%) | 0 (0.0%) |
| Total | 613 (66.7%) | 306 (33.3%) |
Housing Structures by Number of Rooms in New Hartford
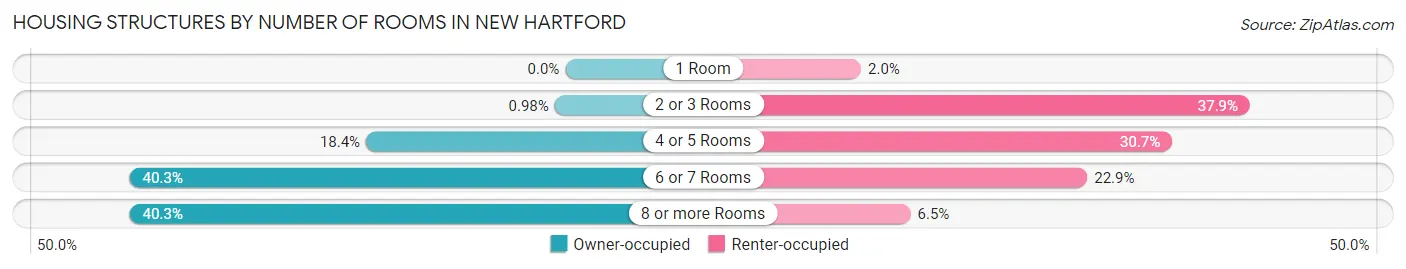
| Number of Rooms | Owner-occupied | Renter-occupied |
| 1 Room | 0 (0.0%) | 6 (2.0%) |
| 2 or 3 Rooms | 6 (1.0%) | 116 (37.9%) |
| 4 or 5 Rooms | 113 (18.4%) | 94 (30.7%) |
| 6 or 7 Rooms | 247 (40.3%) | 70 (22.9%) |
| 8 or more Rooms | 247 (40.3%) | 20 (6.5%) |
| Total | 613 (100.0%) | 306 (100.0%) |
Housing Structure by Heating Type in New Hartford
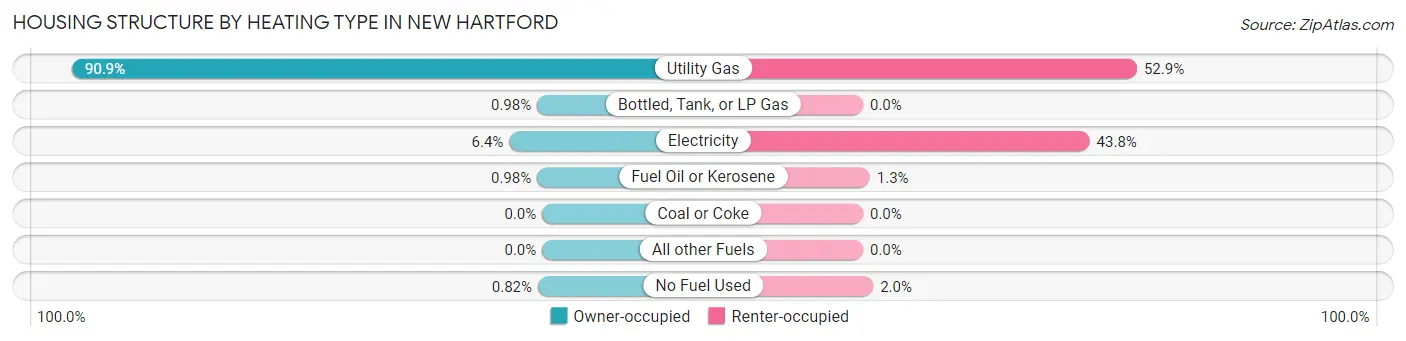
| Heating Type | Owner-occupied | Renter-occupied |
| Utility Gas | 557 (90.9%) | 162 (52.9%) |
| Bottled, Tank, or LP Gas | 6 (1.0%) | 0 (0.0%) |
| Electricity | 39 (6.4%) | 134 (43.8%) |
| Fuel Oil or Kerosene | 6 (1.0%) | 4 (1.3%) |
| Coal or Coke | 0 (0.0%) | 0 (0.0%) |
| All other Fuels | 0 (0.0%) | 0 (0.0%) |
| No Fuel Used | 5 (0.8%) | 6 (2.0%) |
| Total | 613 (100.0%) | 306 (100.0%) |
Household Vehicle Usage in New Hartford
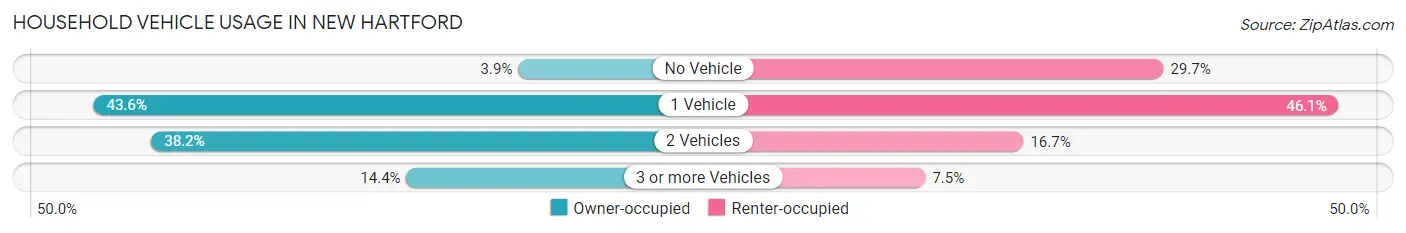
| Vehicles per Household | Owner-occupied | Renter-occupied |
| No Vehicle | 24 (3.9%) | 91 (29.7%) |
| 1 Vehicle | 267 (43.6%) | 141 (46.1%) |
| 2 Vehicles | 234 (38.2%) | 51 (16.7%) |
| 3 or more Vehicles | 88 (14.4%) | 23 (7.5%) |
| Total | 613 (100.0%) | 306 (100.0%) |
Real Estate & Mortgages in New Hartford
Real Estate and Mortgage Overview in New Hartford
| Characteristic | Without Mortgage | With Mortgage |
| Housing Units | 307 | 306 |
| Median Property Value | $184,900 | $193,400 |
| Median Household Income | $51,250 | $70 |
| Monthly Housing Costs | $573 | $0 |
| Real Estate Taxes | $3,739 | $6 |
Property Value by Mortgage Status in New Hartford
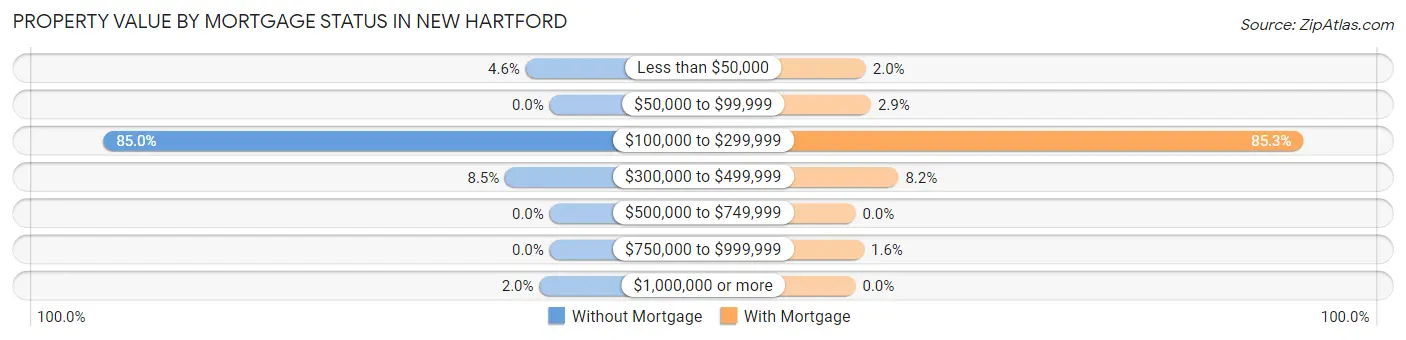
| Property Value | Without Mortgage | With Mortgage |
| Less than $50,000 | 14 (4.6%) | 6 (2.0%) |
| $50,000 to $99,999 | 0 (0.0%) | 9 (2.9%) |
| $100,000 to $299,999 | 261 (85.0%) | 261 (85.3%) |
| $300,000 to $499,999 | 26 (8.5%) | 25 (8.2%) |
| $500,000 to $749,999 | 0 (0.0%) | 0 (0.0%) |
| $750,000 to $999,999 | 0 (0.0%) | 5 (1.6%) |
| $1,000,000 or more | 6 (1.9%) | 0 (0.0%) |
| Total | 307 (100.0%) | 306 (100.0%) |
Household Income by Mortgage Status in New Hartford
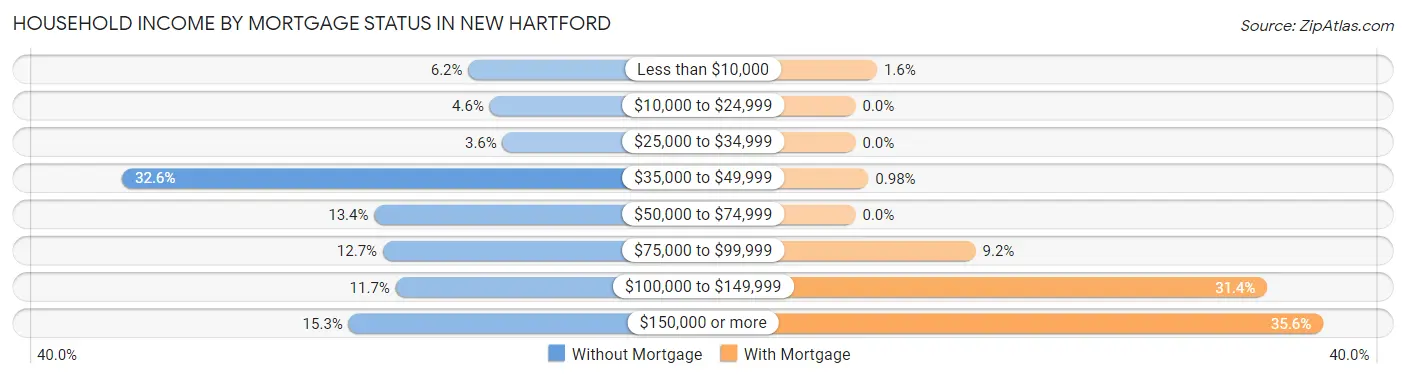
| Household Income | Without Mortgage | With Mortgage |
| Less than $10,000 | 19 (6.2%) | 5 (1.6%) |
| $10,000 to $24,999 | 14 (4.6%) | 0 (0.0%) |
| $25,000 to $34,999 | 11 (3.6%) | 0 (0.0%) |
| $35,000 to $49,999 | 100 (32.6%) | 3 (1.0%) |
| $50,000 to $74,999 | 41 (13.4%) | 0 (0.0%) |
| $75,000 to $99,999 | 39 (12.7%) | 28 (9.1%) |
| $100,000 to $149,999 | 36 (11.7%) | 96 (31.4%) |
| $150,000 or more | 47 (15.3%) | 109 (35.6%) |
| Total | 307 (100.0%) | 306 (100.0%) |
Property Value to Household Income Ratio in New Hartford
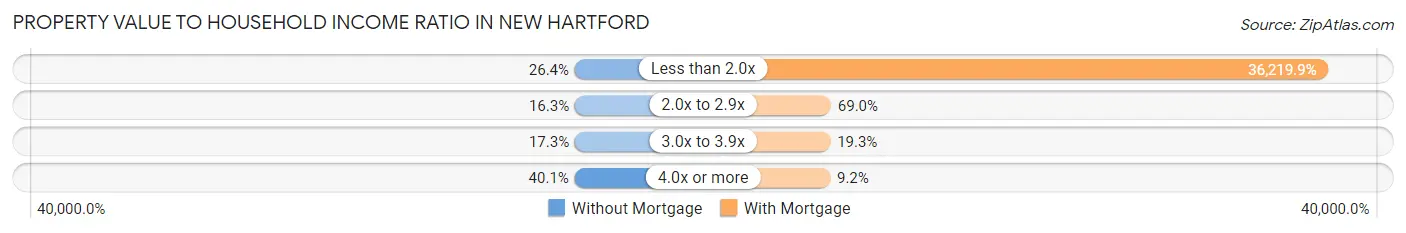
| Value-to-Income Ratio | Without Mortgage | With Mortgage |
| Less than 2.0x | 81 (26.4%) | 110,833 (36,219.9%) |
| 2.0x to 2.9x | 50 (16.3%) | 211 (69.0%) |
| 3.0x to 3.9x | 53 (17.3%) | 59 (19.3%) |
| 4.0x or more | 123 (40.1%) | 28 (9.1%) |
| Total | 307 (100.0%) | 306 (100.0%) |
Real Estate Taxes by Mortgage Status in New Hartford
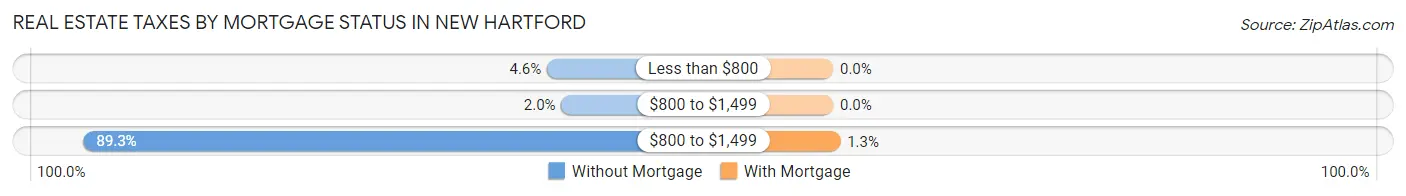
| Property Taxes | Without Mortgage | With Mortgage |
| Less than $800 | 14 (4.6%) | 0 (0.0%) |
| $800 to $1,499 | 6 (1.9%) | 0 (0.0%) |
| $800 to $1,499 | 274 (89.2%) | 4 (1.3%) |
| Total | 307 (100.0%) | 306 (100.0%) |
Health & Disability in New Hartford
Health Insurance Coverage by Age in New Hartford
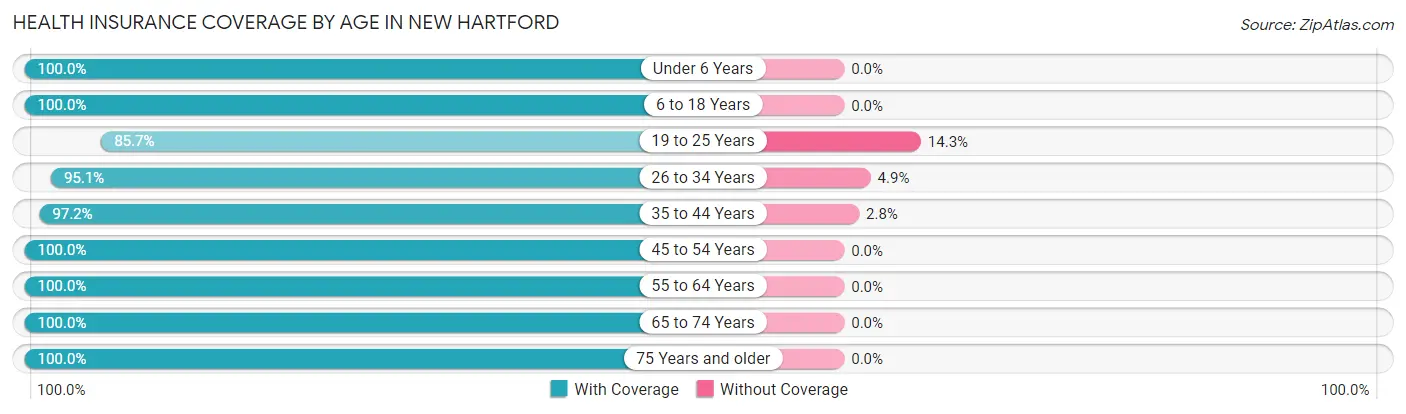
| Age Bracket | With Coverage | Without Coverage |
| Under 6 Years | 69 (100.0%) | 0 (0.0%) |
| 6 to 18 Years | 348 (100.0%) | 0 (0.0%) |
| 19 to 25 Years | 84 (85.7%) | 14 (14.3%) |
| 26 to 34 Years | 116 (95.1%) | 6 (4.9%) |
| 35 to 44 Years | 211 (97.2%) | 6 (2.8%) |
| 45 to 54 Years | 236 (100.0%) | 0 (0.0%) |
| 55 to 64 Years | 229 (100.0%) | 0 (0.0%) |
| 65 to 74 Years | 209 (100.0%) | 0 (0.0%) |
| 75 Years and older | 363 (100.0%) | 0 (0.0%) |
| Total | 1,865 (98.6%) | 26 (1.4%) |
Health Insurance Coverage by Citizenship Status in New Hartford
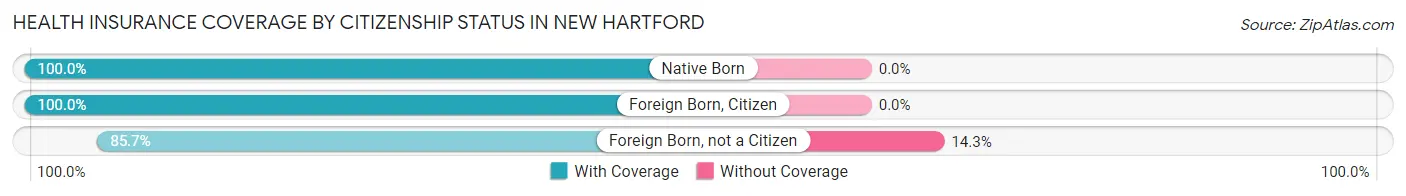
| Citizenship Status | With Coverage | Without Coverage |
| Native Born | 69 (100.0%) | 0 (0.0%) |
| Foreign Born, Citizen | 348 (100.0%) | 0 (0.0%) |
| Foreign Born, not a Citizen | 84 (85.7%) | 14 (14.3%) |
Health Insurance Coverage by Household Income in New Hartford
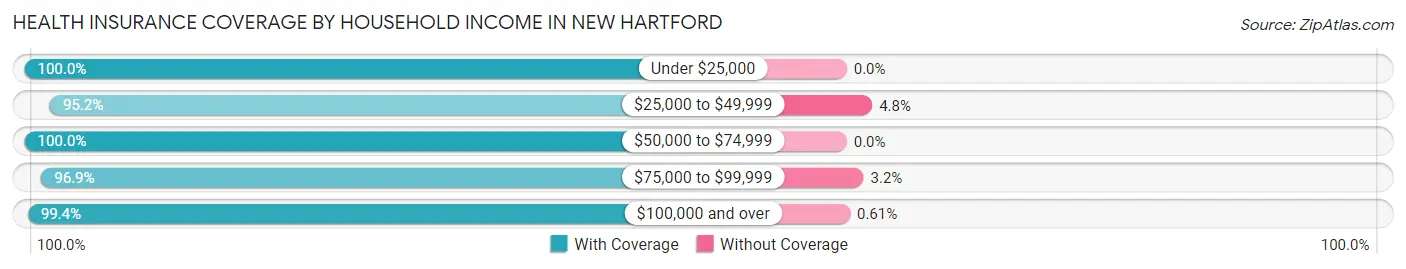
| Household Income | With Coverage | Without Coverage |
| Under $25,000 | 213 (100.0%) | 0 (0.0%) |
| $25,000 to $49,999 | 220 (95.2%) | 11 (4.8%) |
| $50,000 to $74,999 | 173 (100.0%) | 0 (0.0%) |
| $75,000 to $99,999 | 277 (96.9%) | 9 (3.2%) |
| $100,000 and over | 970 (99.4%) | 6 (0.6%) |
Public vs Private Health Insurance Coverage by Age in New Hartford
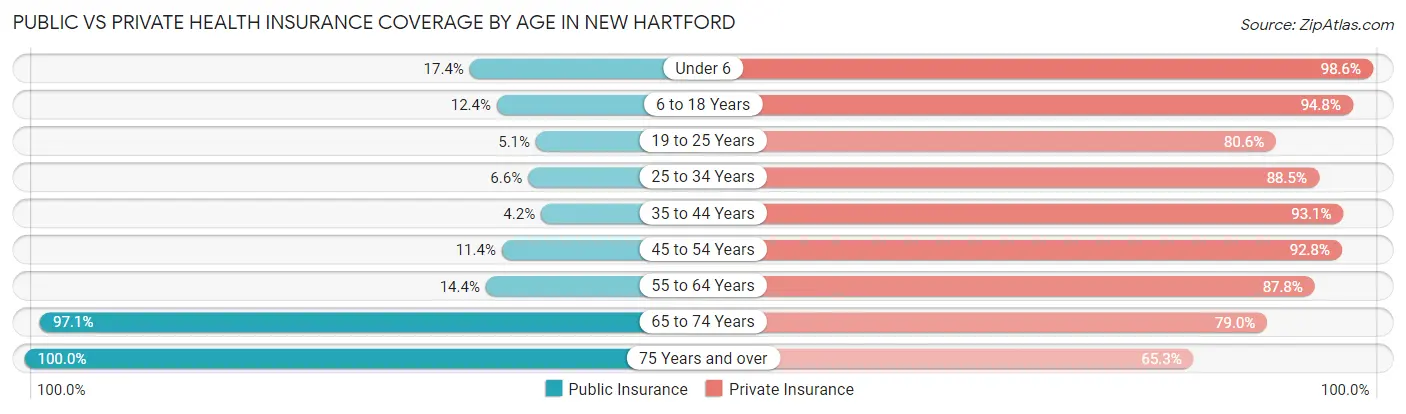
| Age Bracket | Public Insurance | Private Insurance |
| Under 6 | 12 (17.4%) | 68 (98.6%) |
| 6 to 18 Years | 43 (12.4%) | 330 (94.8%) |
| 19 to 25 Years | 5 (5.1%) | 79 (80.6%) |
| 25 to 34 Years | 8 (6.6%) | 108 (88.5%) |
| 35 to 44 Years | 9 (4.2%) | 202 (93.1%) |
| 45 to 54 Years | 27 (11.4%) | 219 (92.8%) |
| 55 to 64 Years | 33 (14.4%) | 201 (87.8%) |
| 65 to 74 Years | 203 (97.1%) | 165 (78.9%) |
| 75 Years and over | 363 (100.0%) | 237 (65.3%) |
| Total | 703 (37.2%) | 1,609 (85.1%) |
Disability Status by Sex by Age in New Hartford
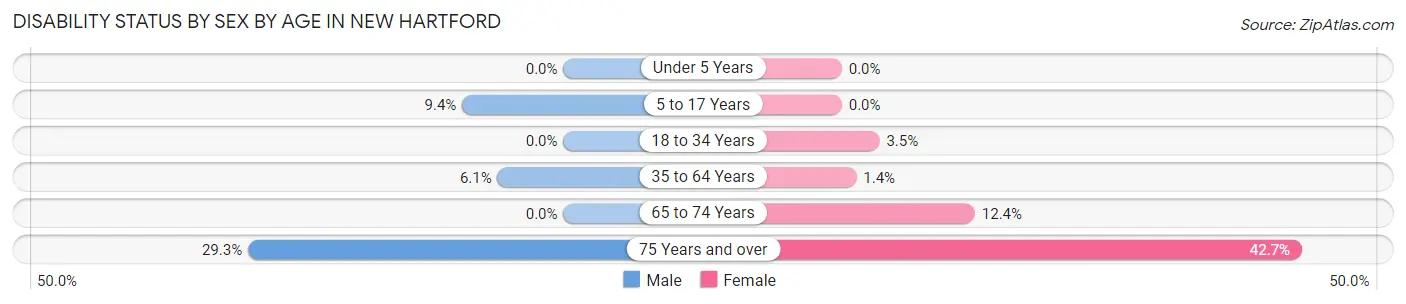
| Age Bracket | Male | Female |
| Under 5 Years | 0 (0.0%) | 0 (0.0%) |
| 5 to 17 Years | 17 (9.4%) | 0 (0.0%) |
| 18 to 34 Years | 0 (0.0%) | 5 (3.5%) |
| 35 to 64 Years | 19 (6.1%) | 5 (1.3%) |
| 65 to 74 Years | 0 (0.0%) | 10 (12.3%) |
| 75 Years and over | 24 (29.3%) | 120 (42.7%) |
Disability Class by Sex by Age in New Hartford
Disability Class: Hearing Difficulty
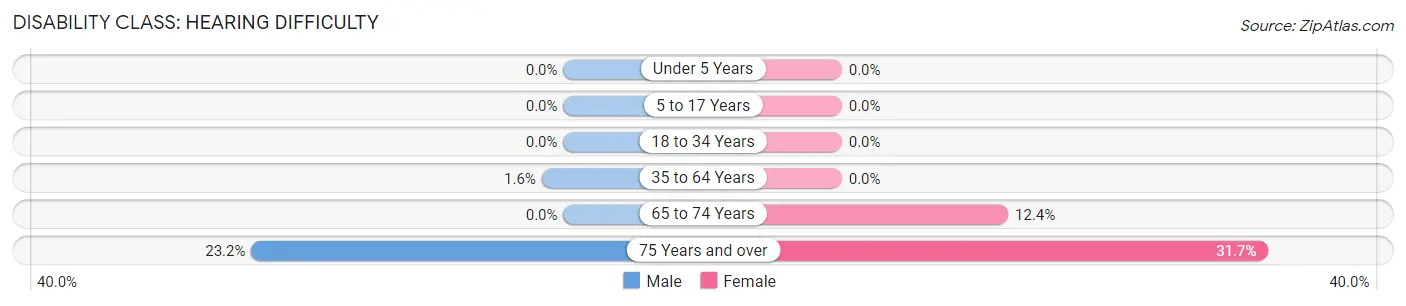
| Age Bracket | Male | Female |
| Under 5 Years | 0 (0.0%) | 0 (0.0%) |
| 5 to 17 Years | 0 (0.0%) | 0 (0.0%) |
| 18 to 34 Years | 0 (0.0%) | 0 (0.0%) |
| 35 to 64 Years | 5 (1.6%) | 0 (0.0%) |
| 65 to 74 Years | 0 (0.0%) | 10 (12.3%) |
| 75 Years and over | 19 (23.2%) | 89 (31.7%) |
Disability Class: Vision Difficulty
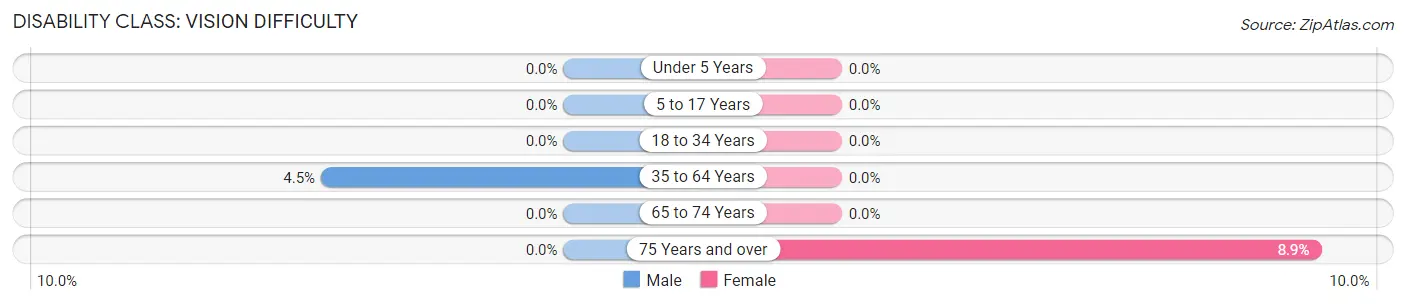
| Age Bracket | Male | Female |
| Under 5 Years | 0 (0.0%) | 0 (0.0%) |
| 5 to 17 Years | 0 (0.0%) | 0 (0.0%) |
| 18 to 34 Years | 0 (0.0%) | 0 (0.0%) |
| 35 to 64 Years | 14 (4.5%) | 0 (0.0%) |
| 65 to 74 Years | 0 (0.0%) | 0 (0.0%) |
| 75 Years and over | 0 (0.0%) | 25 (8.9%) |
Disability Class: Cognitive Difficulty
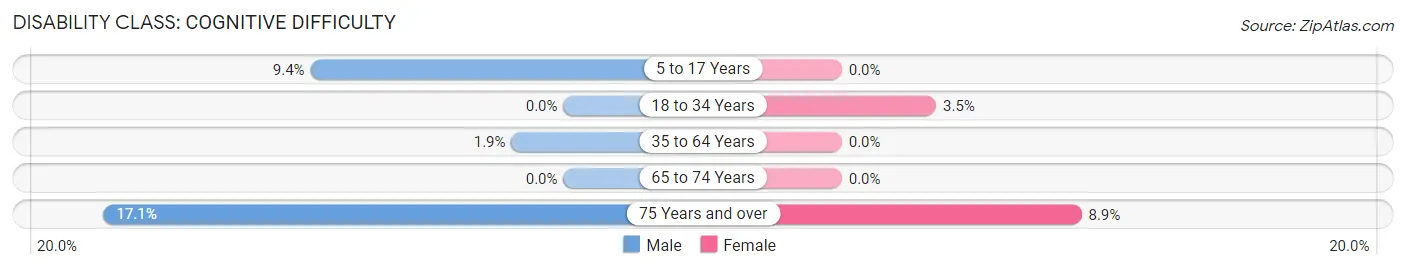
| Age Bracket | Male | Female |
| 5 to 17 Years | 17 (9.4%) | 0 (0.0%) |
| 18 to 34 Years | 0 (0.0%) | 5 (3.5%) |
| 35 to 64 Years | 6 (1.9%) | 0 (0.0%) |
| 65 to 74 Years | 0 (0.0%) | 0 (0.0%) |
| 75 Years and over | 14 (17.1%) | 25 (8.9%) |
Disability Class: Ambulatory Difficulty
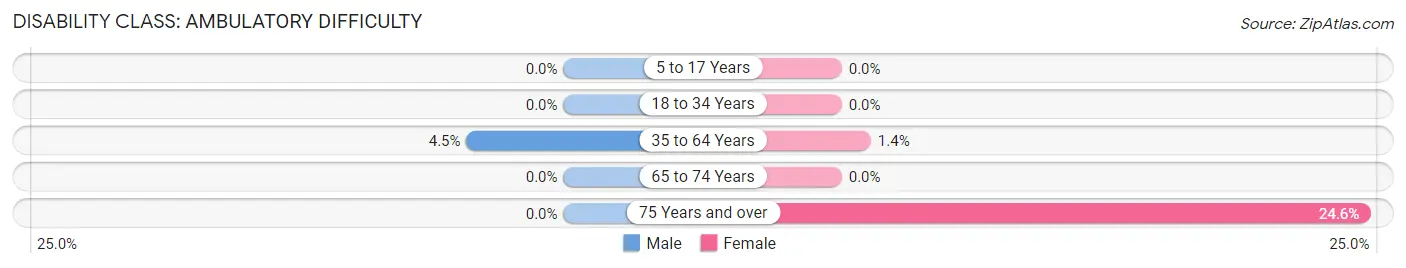
| Age Bracket | Male | Female |
| 5 to 17 Years | 0 (0.0%) | 0 (0.0%) |
| 18 to 34 Years | 0 (0.0%) | 0 (0.0%) |
| 35 to 64 Years | 14 (4.5%) | 5 (1.3%) |
| 65 to 74 Years | 0 (0.0%) | 0 (0.0%) |
| 75 Years and over | 0 (0.0%) | 69 (24.6%) |
Disability Class: Self-Care Difficulty
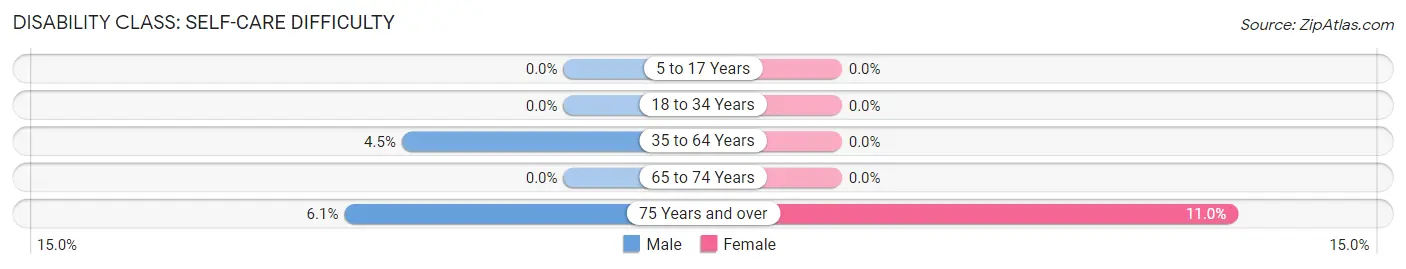
| Age Bracket | Male | Female |
| 5 to 17 Years | 0 (0.0%) | 0 (0.0%) |
| 18 to 34 Years | 0 (0.0%) | 0 (0.0%) |
| 35 to 64 Years | 14 (4.5%) | 0 (0.0%) |
| 65 to 74 Years | 0 (0.0%) | 0 (0.0%) |
| 75 Years and over | 5 (6.1%) | 31 (11.0%) |
Technology Access in New Hartford
Computing Device Access in New Hartford
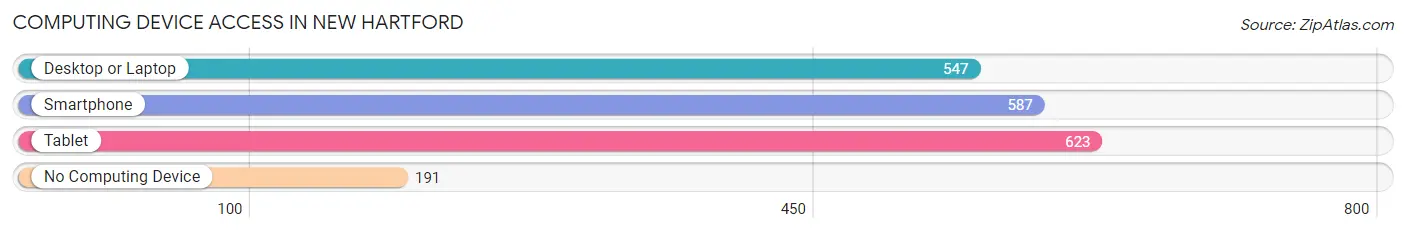
| Device Type | # Households | % Households |
| Desktop or Laptop | 547 | 59.5% |
| Smartphone | 587 | 63.9% |
| Tablet | 623 | 67.8% |
| No Computing Device | 191 | 20.8% |
| Total | 919 | 100.0% |
Internet Access in New Hartford
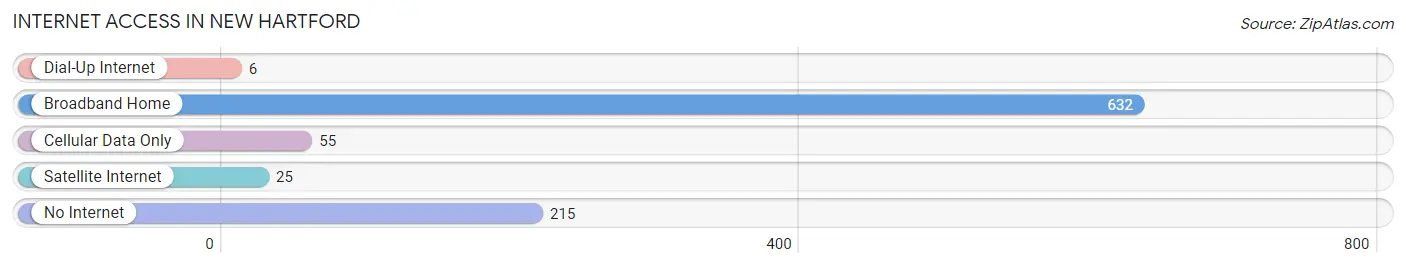
| Internet Type | # Households | % Households |
| Dial-Up Internet | 6 | 0.6% |
| Broadband Home | 632 | 68.8% |
| Cellular Data Only | 55 | 6.0% |
| Satellite Internet | 25 | 2.7% |
| No Internet | 215 | 23.4% |
| Total | 919 | 100.0% |
New Hartford Summary
New Hartford is a town located in Oneida County, New York, United States. The population was 22,166 at the 2010 census. The town is located in the south-central part of the county, east of Utica.
History
The area that is now New Hartford was first settled in 1788 by a group of settlers from Hartford, Connecticut. The town was formed in 1798 from the Town of Whitestown. The town was named after Hartford, Connecticut.
In 1802, the first schoolhouse was built in the town. In 1810, the first church was built. In 1812, the first post office was established.
In 1817, the first newspaper, the New Hartford Gazette, was established. In 1820, the first bank was established.
In 1825, the first railroad was built in the town. In 1827, the first bridge was built over the Sauquoit Creek.
In 1832 the first fire company was established In 1835 the first library was established
In 1836, the first telegraph line was established. In 1837, the first telephone line was established.
In 1845 the first gas company was established In 1848 the first water works was established
In 1851 the first fire department was established In 1853 the first fire engine was purchased
In 1854 the first fire alarm system was established In 1855 the first fire hose was purchased
In 1856 the first fire hydrant was installed In 1857 the first fire bell was purchased
In 1858 the first fire station was built In 1859 the first fire engine house was built
In 1860 the first fire engine was purchased In 1861 the first fire hose cart was purchased
In 1864 the first fire ladder truck was purchased In 1866 the first fire hose reel was purchased
In 1867 the first fire alarm box was installed In 1868 the first fire alarm gong was purchased
In 1869, the first fire alarm bell was purchased. In 1870, the first fire alarm telegraph was installed.
In 1871, the first fire alarm telephone was installed. In 1872, the first fire alarm system was installed.
In 1873, the first fire alarm system was connected to the police station. In 1874, the first fire alarm system was connected to the fire station.
In 1875, the first fire alarm system was connected to the town hall. In 1876, the first fire alarm system was connected to the schoolhouse.
In 1877, the first fire alarm system was connected to the post office. In 1878, the first fire alarm system was connected to the railroad station.
In 1879, the first fire alarm system was connected to the courthouse. In 1880, the first fire alarm system was connected to the churches.
In 1881, the first fire alarm system was connected to the factories. In 1882, the first fire alarm system was connected to the stores.
In 1883, the first fire alarm system was connected to the banks. In 1884, the first fire alarm system was connected to the hotels.
In 1885, the first fire alarm system was connected to the theaters. In 1886, the first fire alarm system was connected to the hospitals.
In 1887, the first fire alarm system was connected to the police station. In 1888, the first fire alarm system was connected to the fire station.
In 1889, the first fire alarm system was connected to the town hall. In 1890, the first fire alarm system was connected to the schoolhouse.
In 1891, the first fire alarm system was connected to the post office. In 1892, the first fire alarm system was connected to the railroad station.
In 1893, the first fire alarm system was connected to the courthouse. In 1894, the first fire alarm system was connected to the churches.
In 1895, the first fire alarm system was connected to the factories. In 1896, the first fire alarm system was connected to the stores.
In 1897, the first fire alarm system was connected to the banks. In 1898, the first fire alarm system was connected to the hotels.
In 1899, the first fire alarm system was connected to the theaters. In 1900, the first fire alarm system was connected to the hospitals.
Geography
New Hartford is located at 43 3 25 North 75 14 25 West 43 056944 75 240278
According to the United States Census Bureau, the town has a total area of 24.2 square miles, of which 24.1 square miles is land and 0.1 square miles is water.
The town is located in the Mohawk Valley region of New York. The Sauquoit Creek flows through the town.
Economy
The economy of New Hartford is largely based on retail, manufacturing, and services. The town is home to several large retail stores, including Walmart, Target, and Lowe's.
The town is also home to several manufacturing companies, including Utica Cutlery, Utica Boilers, and Utica Textiles.
The town is also home to several service-based businesses, including banks, insurance companies, and medical offices.
Demographics
As of the census of 2010, there were 22,166 people, 8,845 households, and 5,845 families residing in the town. The population density was 917.3 people per square mile.
The racial makeup of the town was 94.2% White, 1.7% African American, 0.3% Native American, 1.7% Asian, 0.1% Pacific Islander, 0.7% from other races, and 1.3% from two or more races. Hispanic or Latino of any race were 3.2% of the population.
There were 8,845 households, out of which 30.2% had children under the age of 18 living with them, 53.2% were married couples living together, 10.2% had a female householder with no husband present, and 32.2% were non-families. 27.2% of all households were made up of individuals, and 11.7% had someone living alone who was 65 years of age or older. The average household size was 2.48 and the average family size was 3.03.
In the town, the population was spread out, with 24.2% under the age of 18, 6.7% from 18 to 24, 28.2% from 25 to 44, 25.2% from 45 to 64, and 15.7% who were 65 years of age or older. The median age was 39 years. For every 100 females, there were 93.2 males. For every 100 females age 18 and over, there were 90.2 males.
The median income for a household in the town was $50,945, and the median income for a family was $62,917. Males had a median income of $45,945 versus $30,945 for females. The per capita income for the town was $25,945. About 4.2% of families and 6.2% of the population were below the poverty line, including 8.2% of those under age 18 and 5.2% of those age 65 or over.
Common Questions
What is Per Capita Income in New Hartford?
Per Capita income in New Hartford is $47,512.
What is the Median Family Income in New Hartford?
Median Family Income in New Hartford is $107,434.
What is the Median Household income in New Hartford?
Median Household Income in New Hartford is $77,625.
What is Income or Wage Gap in New Hartford?
Income or Wage Gap in New Hartford is 38.0%.
Women in New Hartford earn 62.0 cents for every dollar earned by a man.
What is Family Income Deficit in New Hartford?
Family Income Deficit in New Hartford is $7,408.
Families that are below poverty line in New Hartford earn $7,408 less on average than the poverty threshold level.
What is Inequality or Gini Index in New Hartford?
Inequality or Gini Index in New Hartford is 0.47.
What is the Total Population of New Hartford?
Total Population of New Hartford is 1,891.
What is the Total Male Population of New Hartford?
Total Male Population of New Hartford is 839.
What is the Total Female Population of New Hartford?
Total Female Population of New Hartford is 1,052.
What is the Ratio of Males per 100 Females in New Hartford?
There are 79.75 Males per 100 Females in New Hartford.
What is the Ratio of Females per 100 Males in New Hartford?
There are 125.39 Females per 100 Males in New Hartford.
What is the Median Population Age in New Hartford?
Median Population Age in New Hartford is 51.5 Years.
What is the Average Family Size in New Hartford
Average Family Size in New Hartford is 2.9 People.
What is the Average Household Size in New Hartford
Average Household Size in New Hartford is 2.0 People.
How Large is the Labor Force in New Hartford?
There are 864 People in the Labor Forcein in New Hartford.
What is the Percentage of People in the Labor Force in New Hartford?
54.6% of People are in the Labor Force in New Hartford.
What is the Unemployment Rate in New Hartford?
Unemployment Rate in New Hartford is 2.5%.