Wantagh, NY Map & Demographics
Wantagh Map
Wantagh Overview
$63,636
PER CAPITA INCOME
$192,464
AVG FAMILY INCOME
$180,167
AVG HOUSEHOLD INCOME
35.4%
WAGE / INCOME GAP [ % ]
64.6¢/ $1
WAGE / INCOME GAP [ $ ]
0.38
INEQUALITY / GINI INDEX
17,995
TOTAL POPULATION
9,168
MALE POPULATION
8,827
FEMALE POPULATION
103.86
MALES / 100 FEMALES
96.28
FEMALES / 100 MALES
40.8
MEDIAN AGE
3.4
AVG FAMILY SIZE
3.1
AVG HOUSEHOLD SIZE
9,305
LABOR FORCE [ PEOPLE ]
65.0%
PERCENT IN LABOR FORCE
3.7%
UNEMPLOYMENT RATE
Wantagh Zip Codes
Income in Wantagh
Income Overview in Wantagh
Per Capita Income in Wantagh is $63,636, while median incomes of families and households are $192,464 and $180,167 respectively.
| Characteristic | Number | Measure |
| Per Capita Income | 17,995 | $63,636 |
| Median Family Income | 4,787 | $192,464 |
| Mean Family Income | 4,787 | $213,267 |
| Median Household Income | 5,816 | $180,167 |
| Mean Household Income | 5,816 | $193,536 |
| Income Deficit | 4,787 | $0 |
| Wage / Income Gap (%) | 17,995 | 35.36% |
| Wage / Income Gap ($) | 17,995 | 64.64¢ per $1 |
| Gini / Inequality Index | 17,995 | 0.38 |
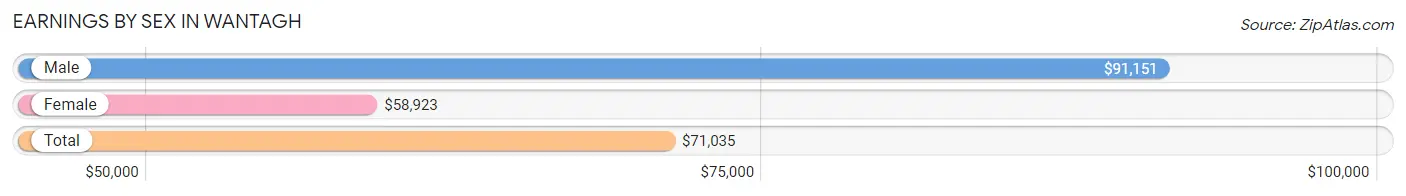
Earnings by Sex in Wantagh
Average Earnings in Wantagh are $71,035, $91,151 for men and $58,923 for women, a difference of 35.4%.
| Sex | Number | Average Earnings |
| Male | 5,270 (53.7%) | $91,151 |
| Female | 4,545 (46.3%) | $58,923 |
| Total | 9,815 (100.0%) | $71,035 |
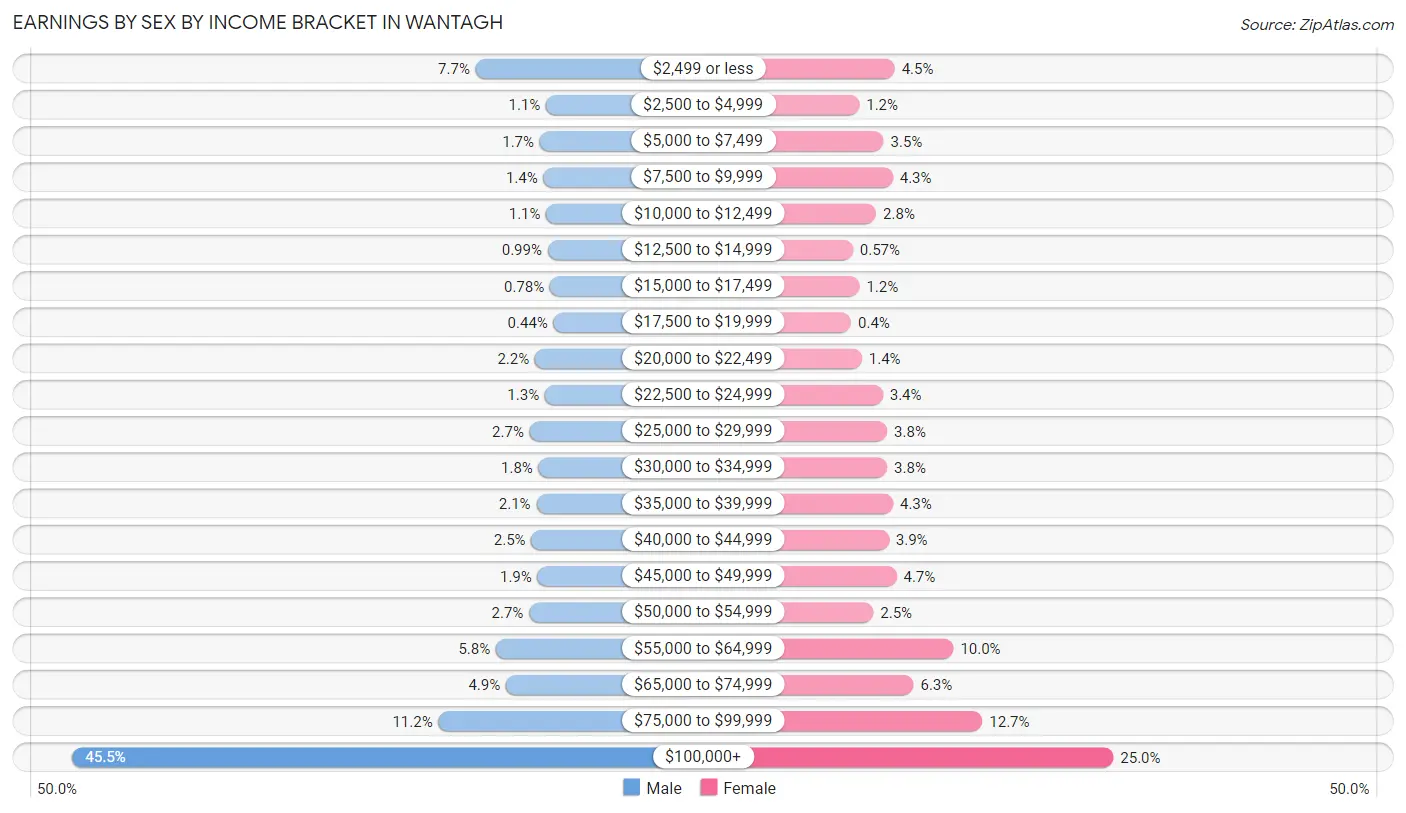
Earnings by Sex by Income Bracket in Wantagh
The most common earnings brackets in Wantagh are $100,000+ for men (2,399 | 45.5%) and $100,000+ for women (1,135 | 25.0%).
| Income | Male | Female |
| $2,499 or less | 408 (7.7%) | 204 (4.5%) |
| $2,500 to $4,999 | 60 (1.1%) | 53 (1.2%) |
| $5,000 to $7,499 | 91 (1.7%) | 157 (3.5%) |
| $7,500 to $9,999 | 73 (1.4%) | 196 (4.3%) |
| $10,000 to $12,499 | 59 (1.1%) | 125 (2.8%) |
| $12,500 to $14,999 | 52 (1.0%) | 26 (0.6%) |
| $15,000 to $17,499 | 41 (0.8%) | 54 (1.2%) |
| $17,500 to $19,999 | 23 (0.4%) | 18 (0.4%) |
| $20,000 to $22,499 | 115 (2.2%) | 64 (1.4%) |
| $22,500 to $24,999 | 66 (1.3%) | 153 (3.4%) |
| $25,000 to $29,999 | 141 (2.7%) | 172 (3.8%) |
| $30,000 to $34,999 | 97 (1.8%) | 172 (3.8%) |
| $35,000 to $39,999 | 108 (2.1%) | 197 (4.3%) |
| $40,000 to $44,999 | 133 (2.5%) | 179 (3.9%) |
| $45,000 to $49,999 | 102 (1.9%) | 212 (4.7%) |
| $50,000 to $54,999 | 144 (2.7%) | 113 (2.5%) |
| $55,000 to $64,999 | 308 (5.8%) | 454 (10.0%) |
| $65,000 to $74,999 | 258 (4.9%) | 284 (6.2%) |
| $75,000 to $99,999 | 592 (11.2%) | 577 (12.7%) |
| $100,000+ | 2,399 (45.5%) | 1,135 (25.0%) |
| Total | 5,270 (100.0%) | 4,545 (100.0%) |
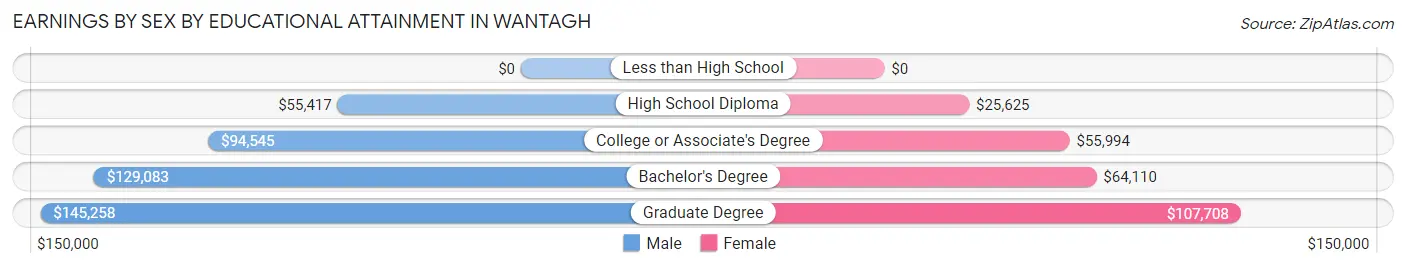
Earnings by Sex by Educational Attainment in Wantagh
Average earnings in Wantagh are $108,331 for men and $64,379 for women, a difference of 40.6%. Men with an educational attainment of graduate degree enjoy the highest average annual earnings of $145,258, while those with high school diploma education earn the least with $55,417. Women with an educational attainment of graduate degree earn the most with the average annual earnings of $107,708, while those with high school diploma education have the smallest earnings of $25,625.
| Educational Attainment | Male Income | Female Income |
| Less than High School | - | - |
| High School Diploma | $55,417 | $25,625 |
| College or Associate's Degree | $94,545 | $55,994 |
| Bachelor's Degree | $129,083 | $64,110 |
| Graduate Degree | $145,258 | $107,708 |
| Total | $108,331 | $64,379 |
Family Income in Wantagh
Family Income Brackets in Wantagh
According to the Wantagh family income data, there are 2,245 families falling into the $200,000+ income range, which is the most common income bracket and makes up 46.9% of all families. Conversely, the $10,000 to $14,999 income bracket is the least frequent group with only 19 families (0.4%) belonging to this category.
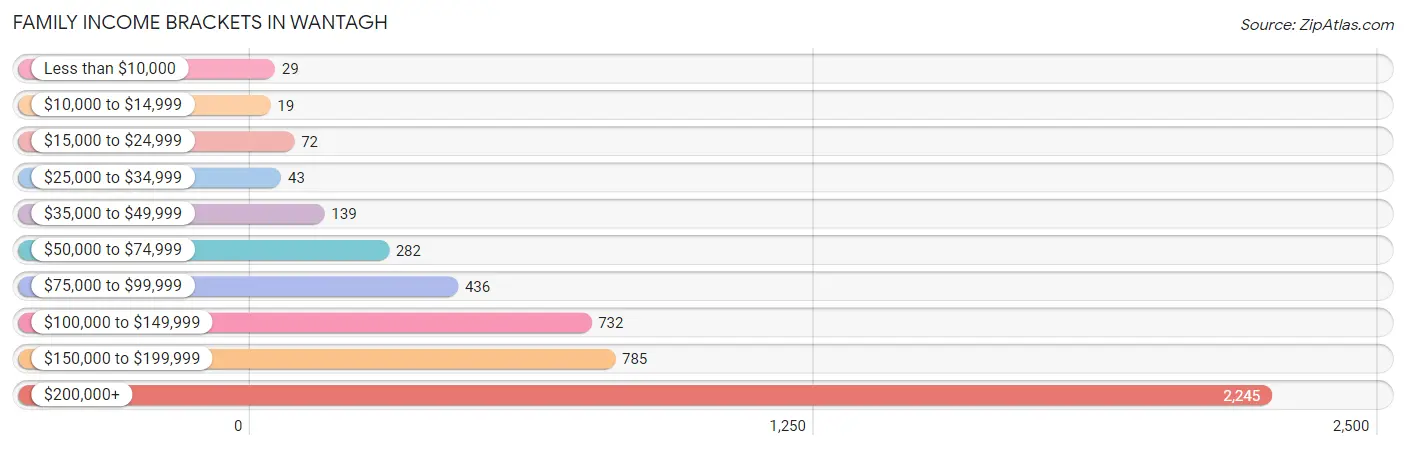
| Income Bracket | # Families | % Families |
| Less than $10,000 | 29 | 0.6% |
| $10,000 to $14,999 | 19 | 0.4% |
| $15,000 to $24,999 | 72 | 1.5% |
| $25,000 to $34,999 | 43 | 0.9% |
| $35,000 to $49,999 | 139 | 2.9% |
| $50,000 to $74,999 | 282 | 5.9% |
| $75,000 to $99,999 | 436 | 9.1% |
| $100,000 to $149,999 | 732 | 15.3% |
| $150,000 to $199,999 | 785 | 16.4% |
| $200,000+ | 2,245 | 46.9% |
Family Income by Famaliy Size in Wantagh
6-person families (72 | 1.5%) account for the highest median family income in Wantagh with $250,001 per family, while 2-person families (1,610 | 33.6%) have the highest median income of $69,500 per family member.
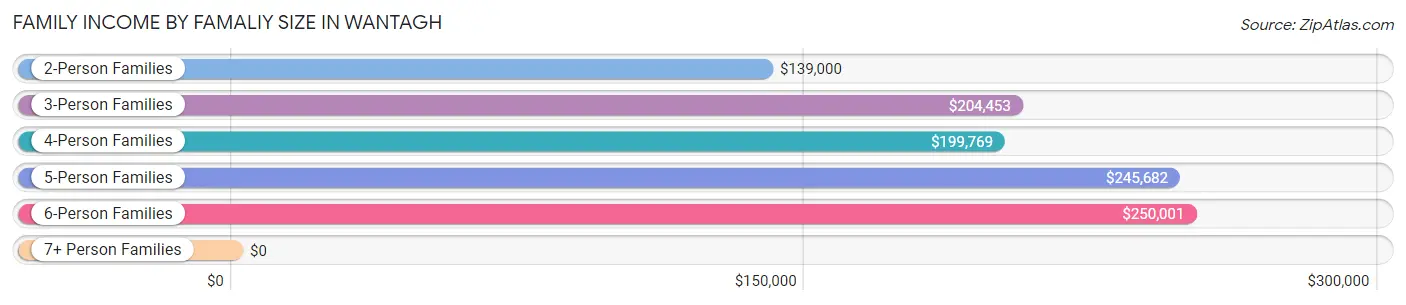
| Income Bracket | # Families | Median Income |
| 2-Person Families | 1,610 (33.6%) | $139,000 |
| 3-Person Families | 1,043 (21.8%) | $204,453 |
| 4-Person Families | 1,528 (31.9%) | $199,769 |
| 5-Person Families | 498 (10.4%) | $245,682 |
| 6-Person Families | 72 (1.5%) | $250,001 |
| 7+ Person Families | 36 (0.7%) | $0 |
| Total | 4,787 (100.0%) | $192,464 |
Family Income by Number of Earners in Wantagh
The median family income in Wantagh is $192,464, with families comprising 3+ earners (892) having the highest median family income of $246,818, while families with no earners (484) have the lowest median family income of $90,000, accounting for 18.6% and 10.1% of families, respectively.
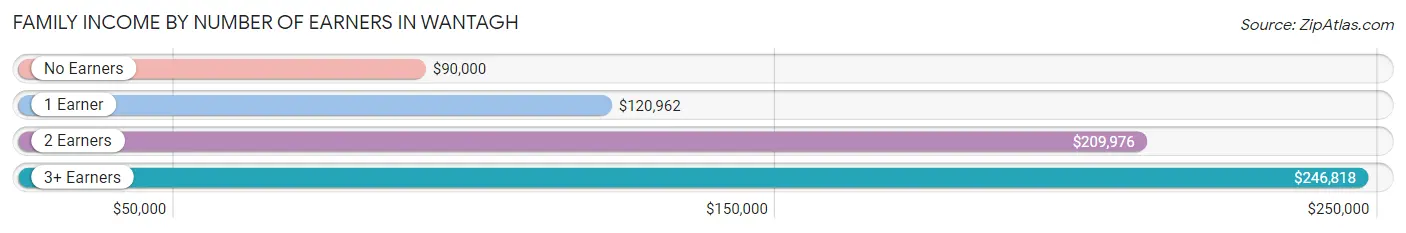
| Number of Earners | # Families | Median Income |
| No Earners | 484 (10.1%) | $90,000 |
| 1 Earner | 1,278 (26.7%) | $120,962 |
| 2 Earners | 2,133 (44.6%) | $209,976 |
| 3+ Earners | 892 (18.6%) | $246,818 |
| Total | 4,787 (100.0%) | $192,464 |
Household Income in Wantagh
Household Income Brackets in Wantagh
With 2,414 households falling in the category, the $200,000+ income range is the most frequent in Wantagh, accounting for 41.5% of all households. In contrast, only 17 households (0.3%) fall into the $10,000 to $14,999 income bracket, making it the least populous group.
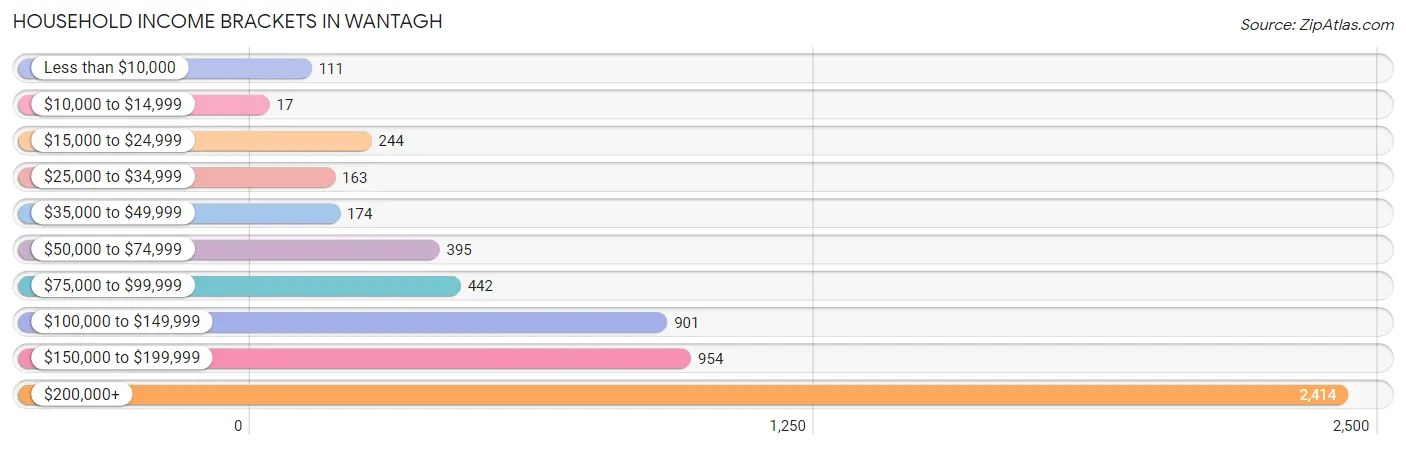
| Income Bracket | # Households | % Households |
| Less than $10,000 | 111 | 1.9% |
| $10,000 to $14,999 | 17 | 0.3% |
| $15,000 to $24,999 | 244 | 4.2% |
| $25,000 to $34,999 | 163 | 2.8% |
| $35,000 to $49,999 | 174 | 3.0% |
| $50,000 to $74,999 | 395 | 6.8% |
| $75,000 to $99,999 | 442 | 7.6% |
| $100,000 to $149,999 | 901 | 15.5% |
| $150,000 to $199,999 | 954 | 16.4% |
| $200,000+ | 2,414 | 41.5% |
Household Income by Householder Age in Wantagh
The median household income in Wantagh is $180,167, with the highest median household income of $207,898 found in the 25 to 44 years age bracket for the primary householder. A total of 1,383 households (23.8%) fall into this category. Meanwhile, the 15 to 24 years age bracket for the primary householder has the lowest median household income of $0, with 11 households (0.2%) in this group.
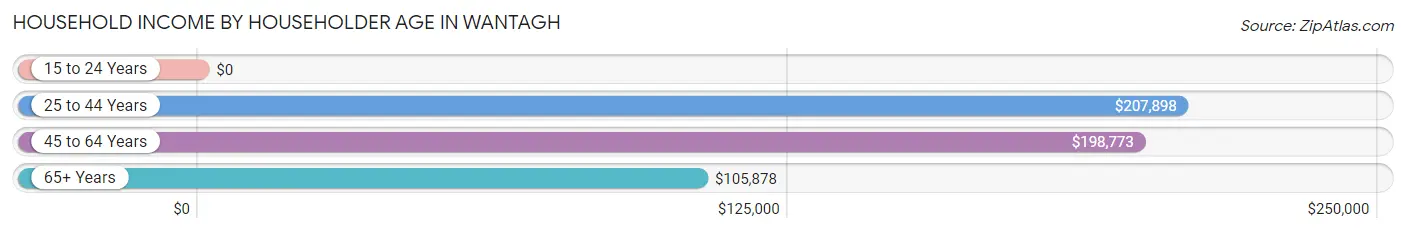
| Income Bracket | # Households | Median Income |
| 15 to 24 Years | 11 (0.2%) | $0 |
| 25 to 44 Years | 1,383 (23.8%) | $207,898 |
| 45 to 64 Years | 2,837 (48.8%) | $198,773 |
| 65+ Years | 1,585 (27.3%) | $105,878 |
| Total | 5,816 (100.0%) | $180,167 |
Poverty in Wantagh
Income Below Poverty by Sex and Age in Wantagh
With 2.8% poverty level for males and 4.4% for females among the residents of Wantagh, 6 to 11 year old males and 5 year old females are the most vulnerable to poverty, with 102 males (11.2%) and 18 females (40.9%) in their respective age groups living below the poverty level.
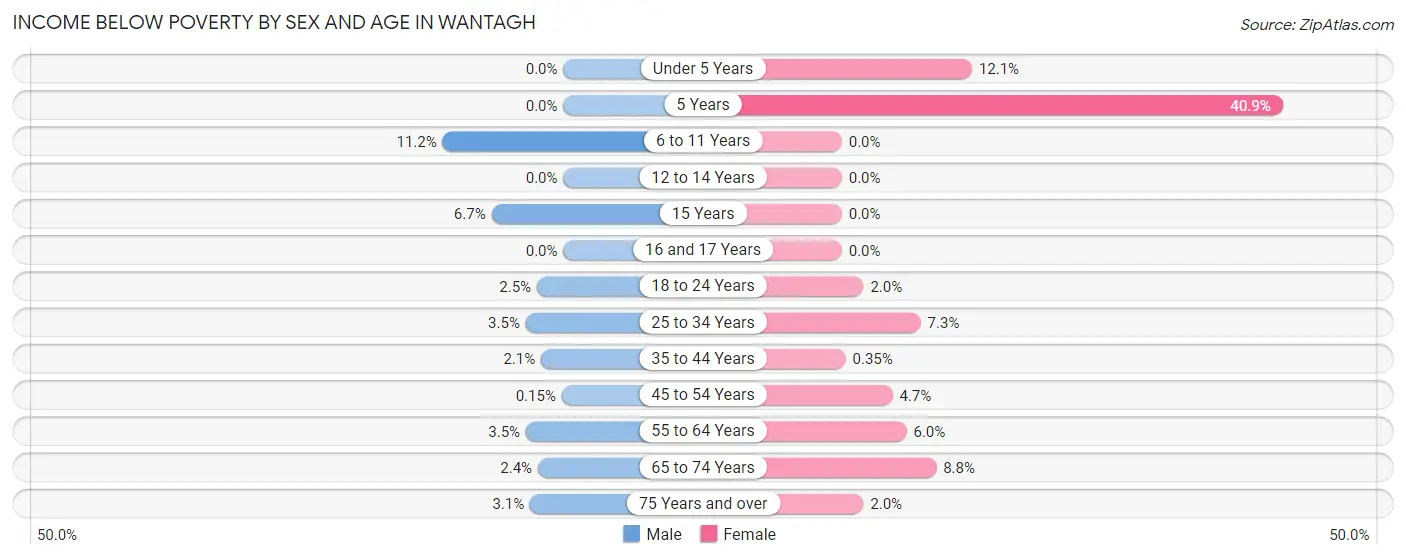
| Age Bracket | Male | Female |
| Under 5 Years | 0 (0.0%) | 47 (12.1%) |
| 5 Years | 0 (0.0%) | 18 (40.9%) |
| 6 to 11 Years | 102 (11.2%) | 0 (0.0%) |
| 12 to 14 Years | 0 (0.0%) | 0 (0.0%) |
| 15 Years | 7 (6.7%) | 0 (0.0%) |
| 16 and 17 Years | 0 (0.0%) | 0 (0.0%) |
| 18 to 24 Years | 22 (2.5%) | 11 (2.0%) |
| 25 to 34 Years | 26 (3.5%) | 72 (7.3%) |
| 35 to 44 Years | 27 (2.1%) | 4 (0.4%) |
| 45 to 54 Years | 2 (0.2%) | 58 (4.7%) |
| 55 to 64 Years | 40 (3.5%) | 85 (6.0%) |
| 65 to 74 Years | 17 (2.4%) | 74 (8.8%) |
| 75 Years and over | 14 (3.1%) | 16 (2.0%) |
| Total | 257 (2.8%) | 385 (4.4%) |
Income Above Poverty by Sex and Age in Wantagh
According to the poverty statistics in Wantagh, males aged under 5 years and females aged 6 to 11 years are the age groups that are most secure financially, with 100.0% of males and 100.0% of females in these age groups living above the poverty line.
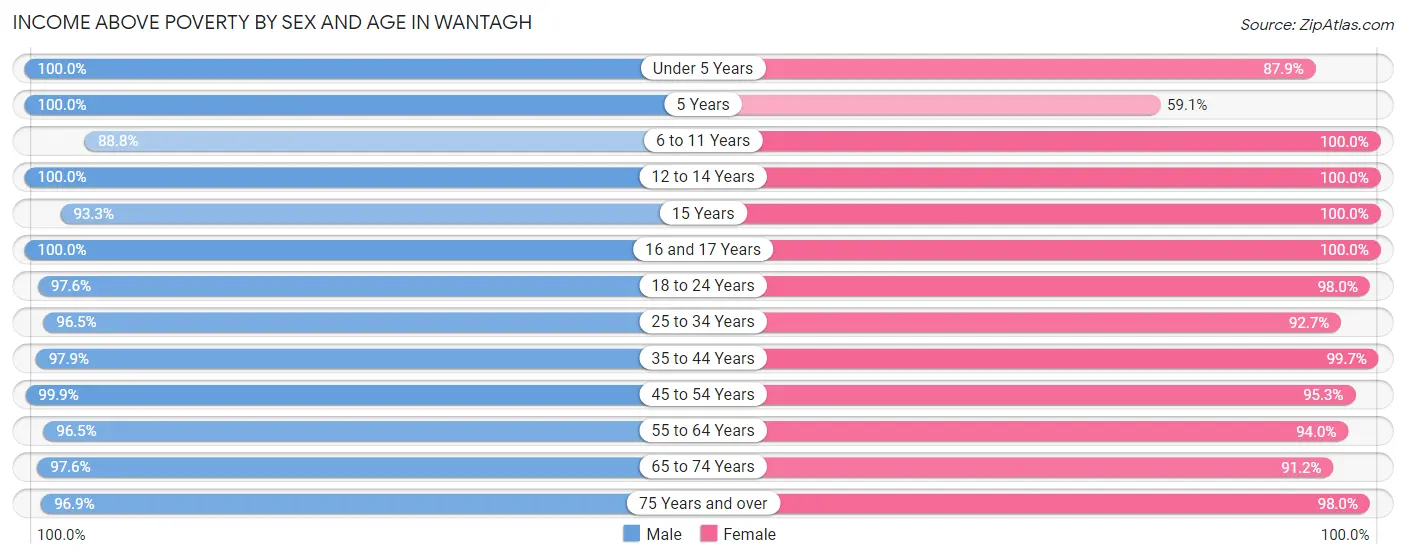
| Age Bracket | Male | Female |
| Under 5 Years | 355 (100.0%) | 342 (87.9%) |
| 5 Years | 184 (100.0%) | 26 (59.1%) |
| 6 to 11 Years | 808 (88.8%) | 610 (100.0%) |
| 12 to 14 Years | 445 (100.0%) | 352 (100.0%) |
| 15 Years | 98 (93.3%) | 193 (100.0%) |
| 16 and 17 Years | 562 (100.0%) | 183 (100.0%) |
| 18 to 24 Years | 875 (97.6%) | 537 (98.0%) |
| 25 to 34 Years | 720 (96.5%) | 912 (92.7%) |
| 35 to 44 Years | 1,278 (97.9%) | 1,139 (99.7%) |
| 45 to 54 Years | 1,319 (99.9%) | 1,174 (95.3%) |
| 55 to 64 Years | 1,113 (96.5%) | 1,330 (94.0%) |
| 65 to 74 Years | 704 (97.6%) | 771 (91.2%) |
| 75 Years and over | 439 (96.9%) | 786 (98.0%) |
| Total | 8,900 (97.2%) | 8,355 (95.6%) |
Income Below Poverty Among Married-Couple Families in Wantagh
The poverty statistics for married-couple families in Wantagh show that 1.7% or 68 of the total 3,917 families live below the poverty line. Families with no children have the highest poverty rate of 2.1%, comprising of 43 families. On the other hand, families with 3 or 4 children have the lowest poverty rate of 0.0%, which includes 0 families.
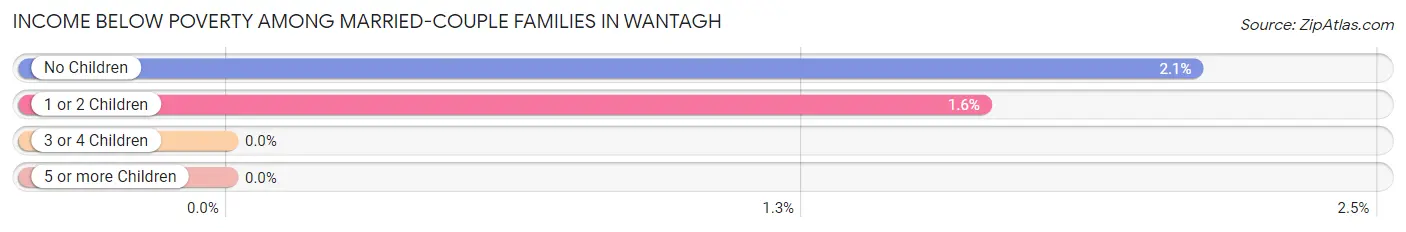
| Children | Above Poverty | Below Poverty |
| No Children | 2,007 (97.9%) | 43 (2.1%) |
| 1 or 2 Children | 1,501 (98.4%) | 25 (1.6%) |
| 3 or 4 Children | 305 (100.0%) | 0 (0.0%) |
| 5 or more Children | 36 (100.0%) | 0 (0.0%) |
| Total | 3,849 (98.3%) | 68 (1.7%) |
Income Below Poverty Among Single-Parent Households in Wantagh
According to the poverty data in Wantagh, 6.7% or 11 single-father households and 4.8% or 34 single-mother households are living below the poverty line. Among single-father households, those with 1 or 2 children have the highest poverty rate, with 11 households (12.5%) experiencing poverty. Likewise, among single-mother households, those with 3 or 4 children have the highest poverty rate, with 34 households (38.2%) falling below the poverty line.
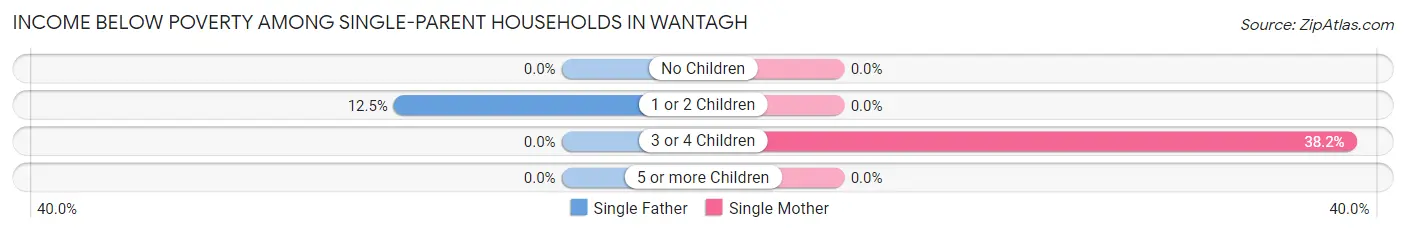
| Children | Single Father | Single Mother |
| No Children | 0 (0.0%) | 0 (0.0%) |
| 1 or 2 Children | 11 (12.5%) | 0 (0.0%) |
| 3 or 4 Children | 0 (0.0%) | 34 (38.2%) |
| 5 or more Children | 0 (0.0%) | 0 (0.0%) |
| Total | 11 (6.7%) | 34 (4.8%) |
Income Below Poverty Among Married-Couple vs Single-Parent Households in Wantagh
The poverty data for Wantagh shows that 68 of the married-couple family households (1.7%) and 45 of the single-parent households (5.2%) are living below the poverty level. Within the married-couple family households, those with no children have the highest poverty rate, with 43 households (2.1%) falling below the poverty line. Among the single-parent households, those with 3 or 4 children have the highest poverty rate, with 34 household (38.2%) living below poverty.
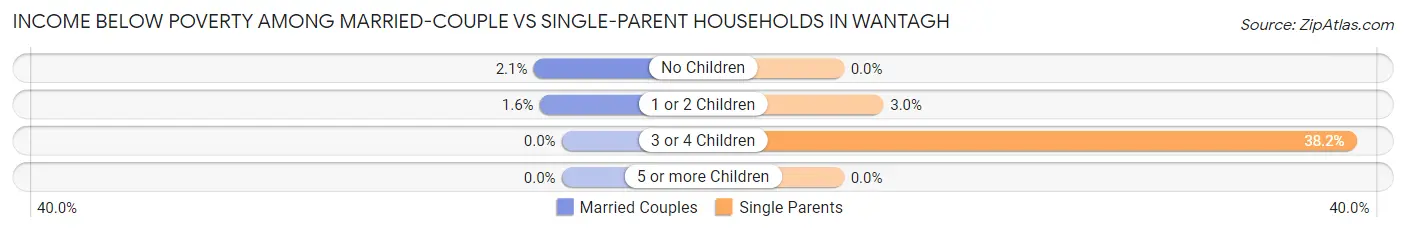
| Children | Married-Couple Families | Single-Parent Households |
| No Children | 43 (2.1%) | 0 (0.0%) |
| 1 or 2 Children | 25 (1.6%) | 11 (2.9%) |
| 3 or 4 Children | 0 (0.0%) | 34 (38.2%) |
| 5 or more Children | 0 (0.0%) | 0 (0.0%) |
| Total | 68 (1.7%) | 45 (5.2%) |
Race in Wantagh
The most populous races in Wantagh are White / Caucasian (15,855 | 88.1%), Hispanic or Latino (1,408 | 7.8%), and Two or more Races (1,010 | 5.6%).
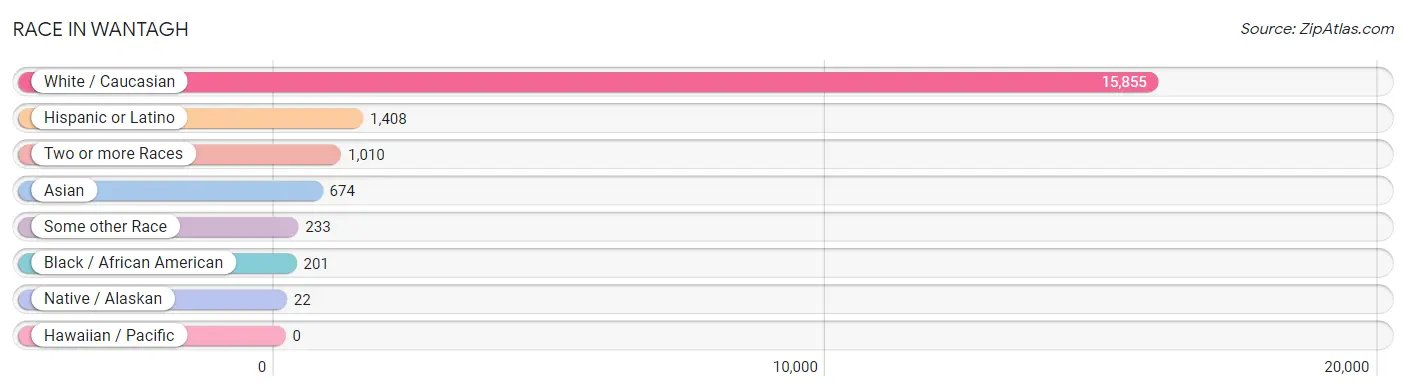
| Race | # Population | % Population |
| Asian | 674 | 3.7% |
| Black / African American | 201 | 1.1% |
| Hawaiian / Pacific | 0 | 0.0% |
| Hispanic or Latino | 1,408 | 7.8% |
| Native / Alaskan | 22 | 0.1% |
| White / Caucasian | 15,855 | 88.1% |
| Two or more Races | 1,010 | 5.6% |
| Some other Race | 233 | 1.3% |
| Total | 17,995 | 100.0% |
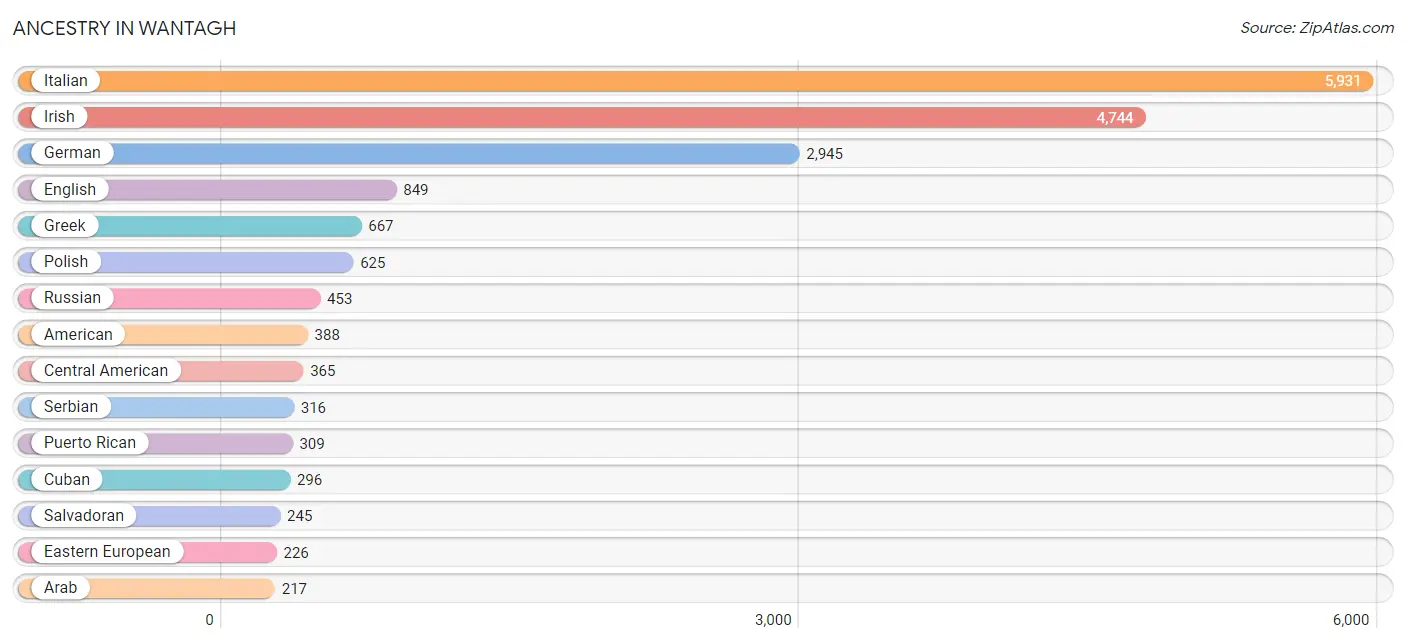
Ancestry in Wantagh
The most populous ancestries reported in Wantagh are Italian (5,931 | 33.0%), Irish (4,744 | 26.4%), German (2,945 | 16.4%), English (849 | 4.7%), and Greek (667 | 3.7%), together accounting for 84.1% of all Wantagh residents.
| Ancestry | # Population | % Population |
| Albanian | 30 | 0.2% |
| American | 388 | 2.2% |
| Arab | 217 | 1.2% |
| Armenian | 70 | 0.4% |
| Austrian | 103 | 0.6% |
| Belgian | 8 | 0.0% |
| Bhutanese | 65 | 0.4% |
| Brazilian | 14 | 0.1% |
| British | 15 | 0.1% |
| British West Indian | 12 | 0.1% |
| Burmese | 30 | 0.2% |
| Central American | 365 | 2.0% |
| Chilean | 16 | 0.1% |
| Costa Rican | 16 | 0.1% |
| Croatian | 12 | 0.1% |
| Cuban | 296 | 1.6% |
| Czech | 86 | 0.5% |
| Czechoslovakian | 76 | 0.4% |
| Danish | 14 | 0.1% |
| Dominican | 70 | 0.4% |
| Dutch | 132 | 0.7% |
| Eastern European | 226 | 1.3% |
| Ecuadorian | 4 | 0.0% |
| Egyptian | 77 | 0.4% |
| English | 849 | 4.7% |
| European | 60 | 0.3% |
| Filipino | 9 | 0.1% |
| Finnish | 12 | 0.1% |
| French | 104 | 0.6% |
| French Canadian | 62 | 0.3% |
| German | 2,945 | 16.4% |
| Greek | 667 | 3.7% |
| Guyanese | 13 | 0.1% |
| Honduran | 104 | 0.6% |
| Hungarian | 111 | 0.6% |
| Indian (Asian) | 122 | 0.7% |
| Irish | 4,744 | 26.4% |
| Italian | 5,931 | 33.0% |
| Jamaican | 8 | 0.0% |
| Korean | 151 | 0.8% |
| Latvian | 16 | 0.1% |
| Lebanese | 80 | 0.4% |
| Lithuanian | 81 | 0.4% |
| Macedonian | 32 | 0.2% |
| Maltese | 63 | 0.4% |
| Norwegian | 205 | 1.1% |
| Polish | 625 | 3.5% |
| Portuguese | 56 | 0.3% |
| Puerto Rican | 309 | 1.7% |
| Romanian | 21 | 0.1% |
| Russian | 453 | 2.5% |
| Salvadoran | 245 | 1.4% |
| Scandinavian | 28 | 0.2% |
| Scottish | 110 | 0.6% |
| Serbian | 316 | 1.8% |
| South American | 20 | 0.1% |
| Spaniard | 159 | 0.9% |
| Spanish | 18 | 0.1% |
| Sri Lankan | 61 | 0.3% |
| Swedish | 164 | 0.9% |
| Syrian | 60 | 0.3% |
| Thai | 169 | 0.9% |
| Turkish | 19 | 0.1% |
| Ukrainian | 174 | 1.0% |
| Welsh | 4 | 0.0% |
| West Indian | 22 | 0.1% | View All 66 Rows |
Immigrants in Wantagh
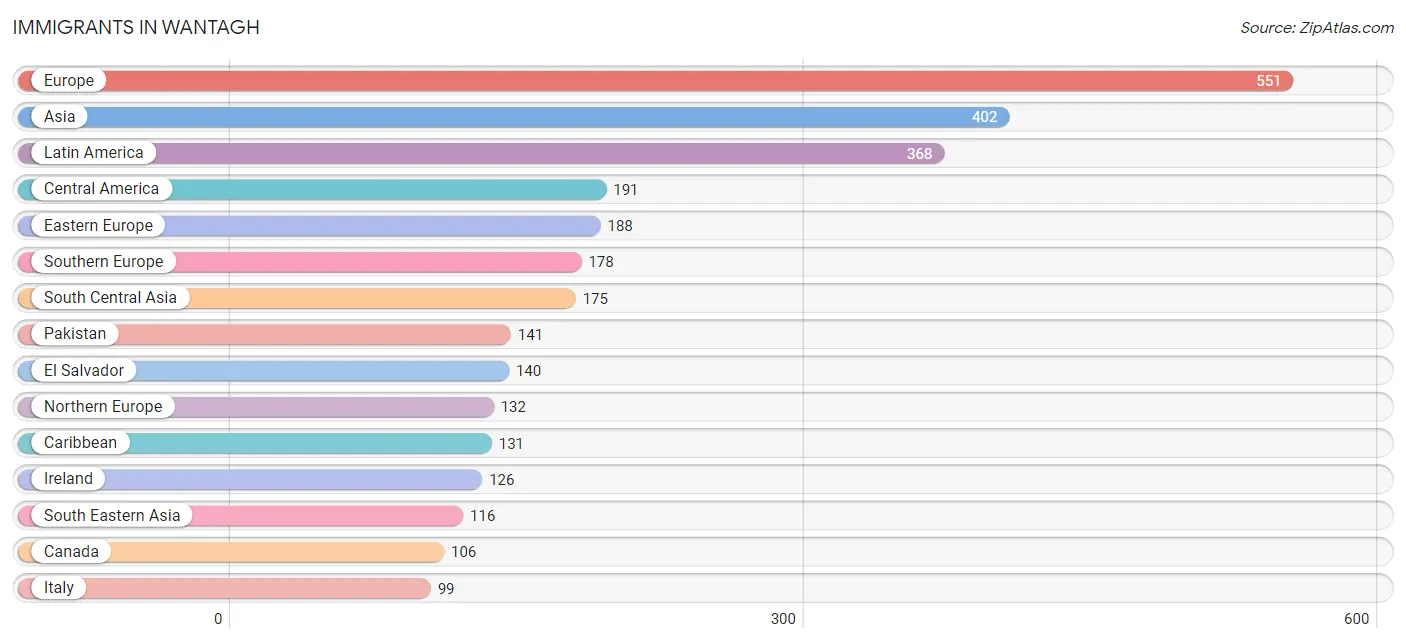
The most numerous immigrant groups reported in Wantagh came from Europe (551 | 3.1%), Asia (402 | 2.2%), Latin America (368 | 2.1%), Central America (191 | 1.1%), and Eastern Europe (188 | 1.0%), together accounting for 9.4% of all Wantagh residents.
| Immigration Origin | # Population | % Population |
| Africa | 32 | 0.2% |
| Asia | 402 | 2.2% |
| Brazil | 14 | 0.1% |
| Canada | 106 | 0.6% |
| Caribbean | 131 | 0.7% |
| Central America | 191 | 1.1% |
| China | 42 | 0.2% |
| Croatia | 12 | 0.1% |
| Cuba | 79 | 0.4% |
| Dominican Republic | 44 | 0.2% |
| Eastern Asia | 56 | 0.3% |
| Eastern Europe | 188 | 1.0% |
| Ecuador | 4 | 0.0% |
| Egypt | 32 | 0.2% |
| El Salvador | 140 | 0.8% |
| England | 6 | 0.0% |
| Europe | 551 | 3.1% |
| France | 31 | 0.2% |
| Germany | 22 | 0.1% |
| Greece | 12 | 0.1% |
| Guyana | 28 | 0.2% |
| Honduras | 51 | 0.3% |
| India | 34 | 0.2% |
| Ireland | 126 | 0.7% |
| Italy | 99 | 0.5% |
| Jamaica | 8 | 0.0% |
| Korea | 14 | 0.1% |
| Latin America | 368 | 2.1% |
| Lebanon | 22 | 0.1% |
| Lithuania | 8 | 0.0% |
| Malaysia | 13 | 0.1% |
| Northern Africa | 32 | 0.2% |
| Northern Europe | 132 | 0.7% |
| Oceania | 21 | 0.1% |
| Pakistan | 141 | 0.8% |
| Philippines | 74 | 0.4% |
| Portugal | 31 | 0.2% |
| Russia | 92 | 0.5% |
| Serbia | 76 | 0.4% |
| South America | 46 | 0.3% |
| South Central Asia | 175 | 1.0% |
| South Eastern Asia | 116 | 0.6% |
| Southern Europe | 178 | 1.0% |
| Vietnam | 29 | 0.2% |
| Western Asia | 55 | 0.3% |
| Western Europe | 53 | 0.3% | View All 46 Rows |
Sex and Age in Wantagh
Sex and Age in Wantagh
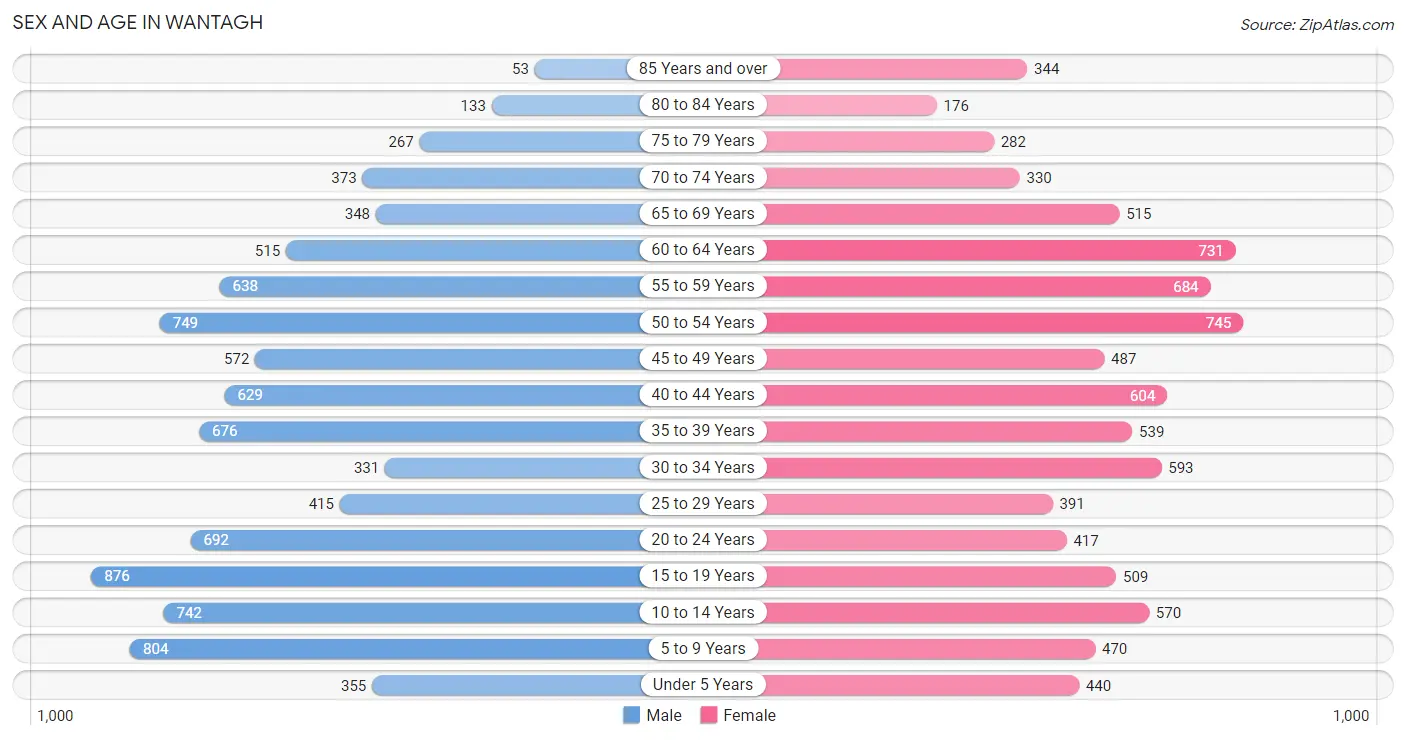
The most populous age groups in Wantagh are 15 to 19 Years (876 | 9.6%) for men and 50 to 54 Years (745 | 8.4%) for women.
| Age Bracket | Male | Female |
| Under 5 Years | 355 (3.9%) | 440 (5.0%) |
| 5 to 9 Years | 804 (8.8%) | 470 (5.3%) |
| 10 to 14 Years | 742 (8.1%) | 570 (6.5%) |
| 15 to 19 Years | 876 (9.6%) | 509 (5.8%) |
| 20 to 24 Years | 692 (7.5%) | 417 (4.7%) |
| 25 to 29 Years | 415 (4.5%) | 391 (4.4%) |
| 30 to 34 Years | 331 (3.6%) | 593 (6.7%) |
| 35 to 39 Years | 676 (7.4%) | 539 (6.1%) |
| 40 to 44 Years | 629 (6.9%) | 604 (6.8%) |
| 45 to 49 Years | 572 (6.2%) | 487 (5.5%) |
| 50 to 54 Years | 749 (8.2%) | 745 (8.4%) |
| 55 to 59 Years | 638 (7.0%) | 684 (7.7%) |
| 60 to 64 Years | 515 (5.6%) | 731 (8.3%) |
| 65 to 69 Years | 348 (3.8%) | 515 (5.8%) |
| 70 to 74 Years | 373 (4.1%) | 330 (3.7%) |
| 75 to 79 Years | 267 (2.9%) | 282 (3.2%) |
| 80 to 84 Years | 133 (1.5%) | 176 (2.0%) |
| 85 Years and over | 53 (0.6%) | 344 (3.9%) |
| Total | 9,168 (100.0%) | 8,827 (100.0%) |
Families and Households in Wantagh
Median Family Size in Wantagh
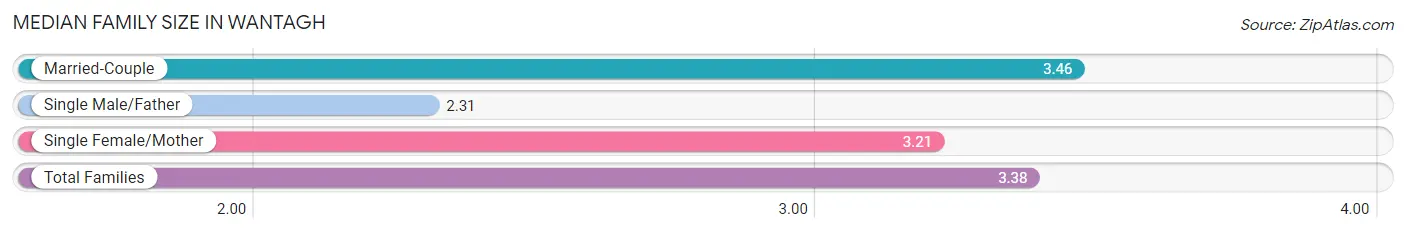
The median family size in Wantagh is 3.38 persons per family, with married-couple families (3,917 | 81.8%) accounting for the largest median family size of 3.46 persons per family. On the other hand, single male/father families (164 | 3.4%) represent the smallest median family size with 2.31 persons per family.
| Family Type | # Families | Family Size |
| Married-Couple | 3,917 (81.8%) | 3.46 |
| Single Male/Father | 164 (3.4%) | 2.31 |
| Single Female/Mother | 706 (14.7%) | 3.21 |
| Total Families | 4,787 (100.0%) | 3.38 |
Median Household Size in Wantagh
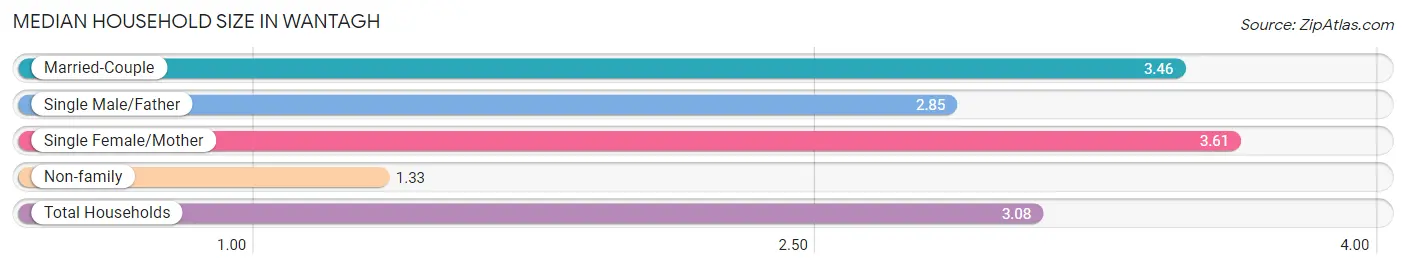
The median household size in Wantagh is 3.08 persons per household, with single female/mother households (706 | 12.1%) accounting for the largest median household size of 3.61 persons per household. non-family households (1,029 | 17.7%) represent the smallest median household size with 1.33 persons per household.
| Household Type | # Households | Household Size |
| Married-Couple | 3,917 (67.3%) | 3.46 |
| Single Male/Father | 164 (2.8%) | 2.85 |
| Single Female/Mother | 706 (12.1%) | 3.61 |
| Non-family | 1,029 (17.7%) | 1.33 |
| Total Households | 5,816 (100.0%) | 3.08 |
Household Size by Marriage Status in Wantagh
Out of a total of 5,816 households in Wantagh, 4,787 (82.3%) are family households, while 1,029 (17.7%) are nonfamily households. The most numerous type of family households are 4-person households, comprising 1,492, and the most common type of nonfamily households are 1-person households, comprising 766.
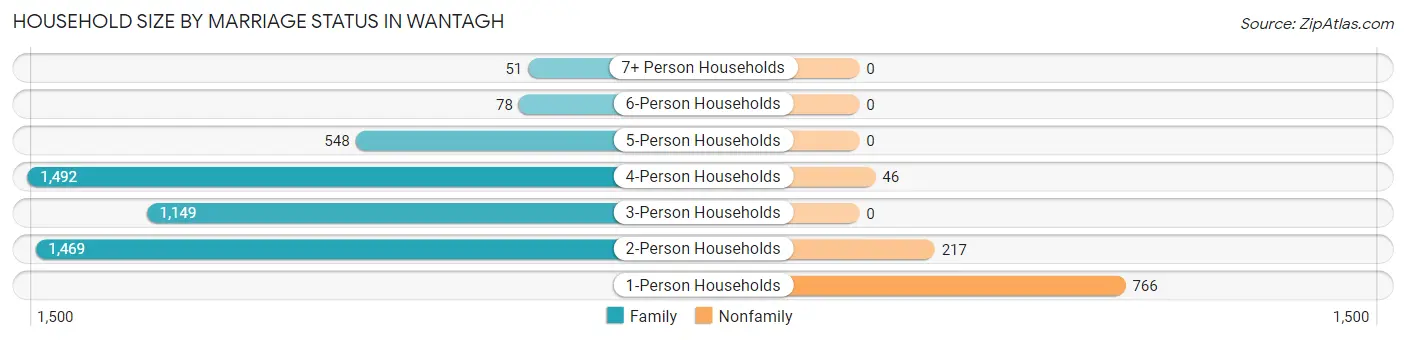
| Household Size | Family Households | Nonfamily Households |
| 1-Person Households | - | 766 (13.2%) |
| 2-Person Households | 1,469 (25.3%) | 217 (3.7%) |
| 3-Person Households | 1,149 (19.8%) | 0 (0.0%) |
| 4-Person Households | 1,492 (25.7%) | 46 (0.8%) |
| 5-Person Households | 548 (9.4%) | 0 (0.0%) |
| 6-Person Households | 78 (1.3%) | 0 (0.0%) |
| 7+ Person Households | 51 (0.9%) | 0 (0.0%) |
| Total | 4,787 (82.3%) | 1,029 (17.7%) |
Female Fertility in Wantagh
Fertility by Age in Wantagh
Average fertility rate in Wantagh is 46.0 births per 1,000 women. Women in the age bracket of 35 to 50 years have the highest fertility rate with 66.0 births per 1,000 women. Women in the age bracket of 35 to 50 years acount for 69.2% of all women with births.
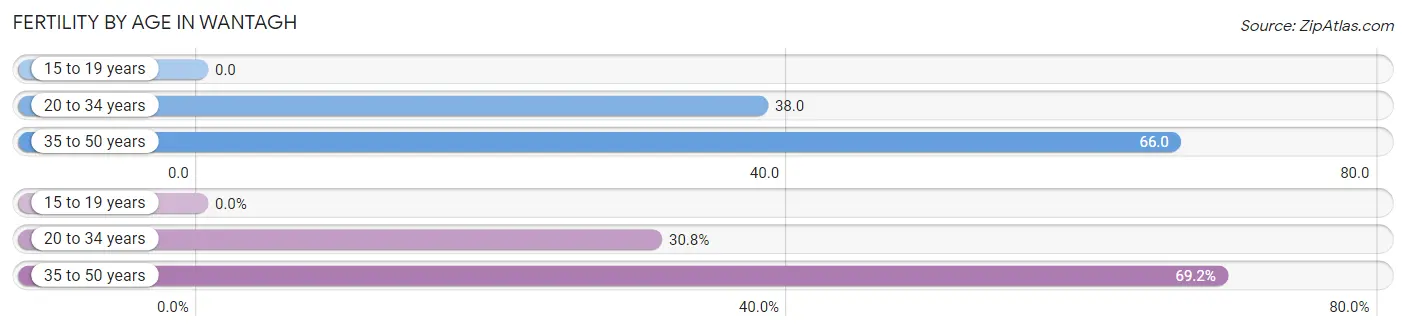
| Age Bracket | Women with Births | Births / 1,000 Women |
| 15 to 19 years | 0 (0.0%) | 0.0 |
| 20 to 34 years | 53 (30.8%) | 38.0 |
| 35 to 50 years | 119 (69.2%) | 66.0 |
| Total | 172 (100.0%) | 46.0 |
Fertility by Age by Marriage Status in Wantagh
82.6% of women with births (172) in Wantagh are married. The highest percentage of unmarried women with births falls into 35 to 50 years age bracket with 17.6% of them unmarried at the time of birth, while the lowest percentage of unmarried women with births belong to 20 to 34 years age bracket with 17.0% of them unmarried.
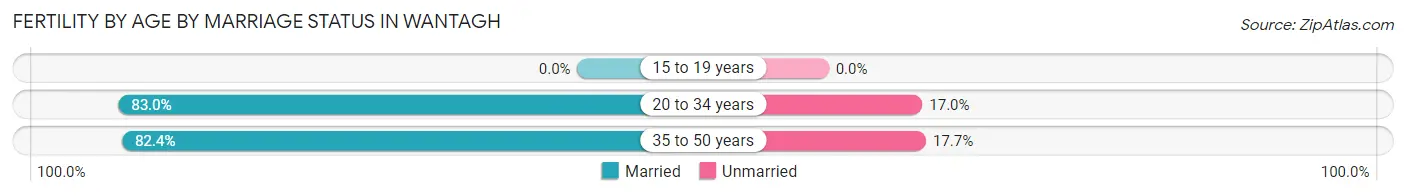
| Age Bracket | Married | Unmarried |
| 15 to 19 years | 0 (0.0%) | 0 (0.0%) |
| 20 to 34 years | 44 (83.0%) | 9 (17.0%) |
| 35 to 50 years | 98 (82.4%) | 21 (17.6%) |
| Total | 142 (82.6%) | 30 (17.4%) |
Fertility by Education in Wantagh
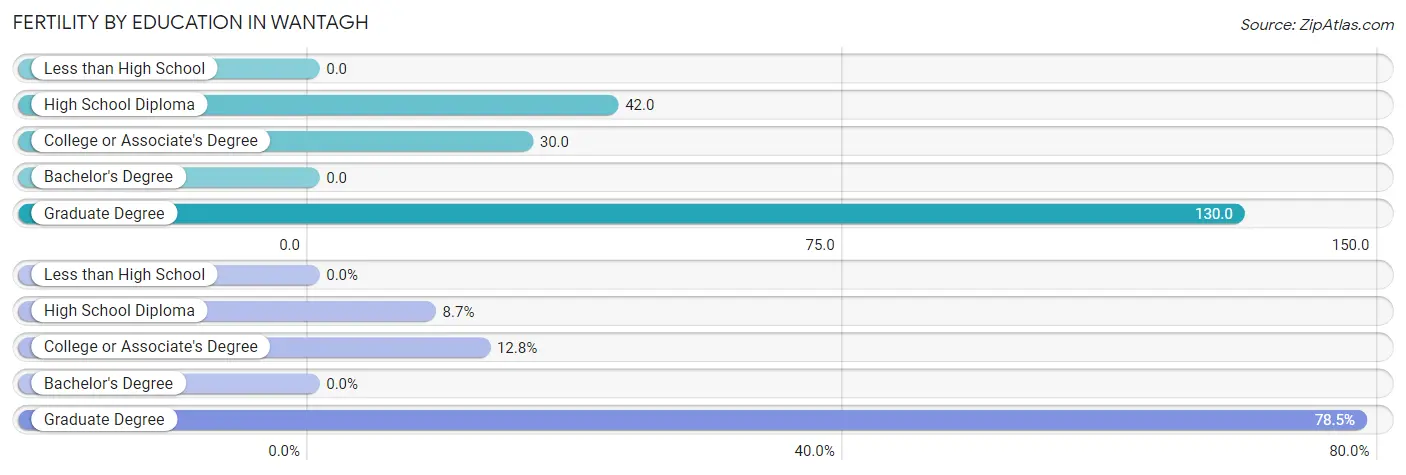
| Educational Attainment | Women with Births | Births / 1,000 Women |
| Less than High School | 0 (0.0%) | 0.0 |
| High School Diploma | 15 (8.7%) | 42.0 |
| College or Associate's Degree | 22 (12.8%) | 30.0 |
| Bachelor's Degree | 0 (0.0%) | 0.0 |
| Graduate Degree | 135 (78.5%) | 130.0 |
| Total | 172 (100.0%) | 46.0 |
Fertility by Education by Marriage Status in Wantagh
17.4% of women with births in Wantagh are unmarried. Women with the educational attainment of college or associate's degree are most likely to be married with 100.0% of them married at childbirth, while women with the educational attainment of high school diploma are least likely to be married with 100.0% of them unmarried at childbirth.
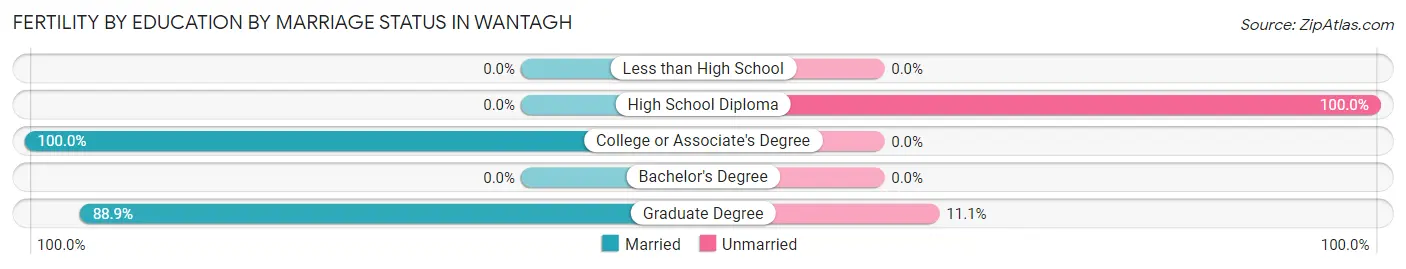
| Educational Attainment | Married | Unmarried |
| Less than High School | 0 (0.0%) | 0 (0.0%) |
| High School Diploma | 0 (0.0%) | 15 (100.0%) |
| College or Associate's Degree | 22 (100.0%) | 0 (0.0%) |
| Bachelor's Degree | 0 (0.0%) | 0 (0.0%) |
| Graduate Degree | 120 (88.9%) | 15 (11.1%) |
| Total | 142 (82.6%) | 30 (17.4%) |
Employment Characteristics in Wantagh
Employment by Class of Employer in Wantagh
Among the 8,876 employed individuals in Wantagh, private company employees (5,408 | 60.9%), local government employees (1,295 | 14.6%), and not-for-profit organizations (863 | 9.7%) make up the most common classes of employment.
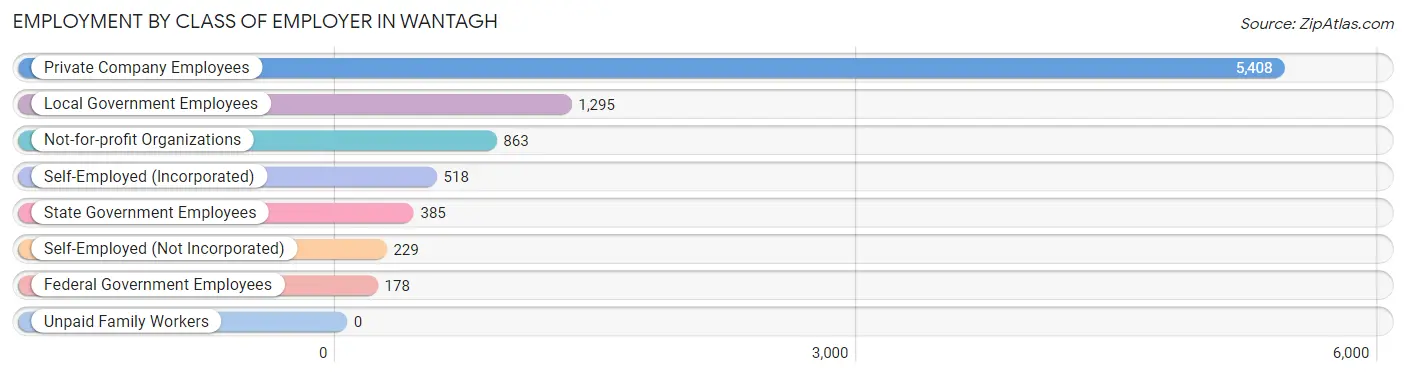
| Employer Class | # Employees | % Employees |
| Private Company Employees | 5,408 | 60.9% |
| Self-Employed (Incorporated) | 518 | 5.8% |
| Self-Employed (Not Incorporated) | 229 | 2.6% |
| Not-for-profit Organizations | 863 | 9.7% |
| Local Government Employees | 1,295 | 14.6% |
| State Government Employees | 385 | 4.3% |
| Federal Government Employees | 178 | 2.0% |
| Unpaid Family Workers | 0 | 0.0% |
| Total | 8,876 | 100.0% |
Employment Status by Age in Wantagh
According to the labor force statistics for Wantagh, out of the total population over 16 years of age (14,315), 65.0% or 9,305 individuals are in the labor force, with 3.7% or 344 of them unemployed. The age group with the highest labor force participation rate is 30 to 34 years, with 88.1% or 814 individuals in the labor force. Within the labor force, the 16 to 19 years age range has the highest percentage of unemployed individuals, with 7.8% or 10 of them being unemployed.
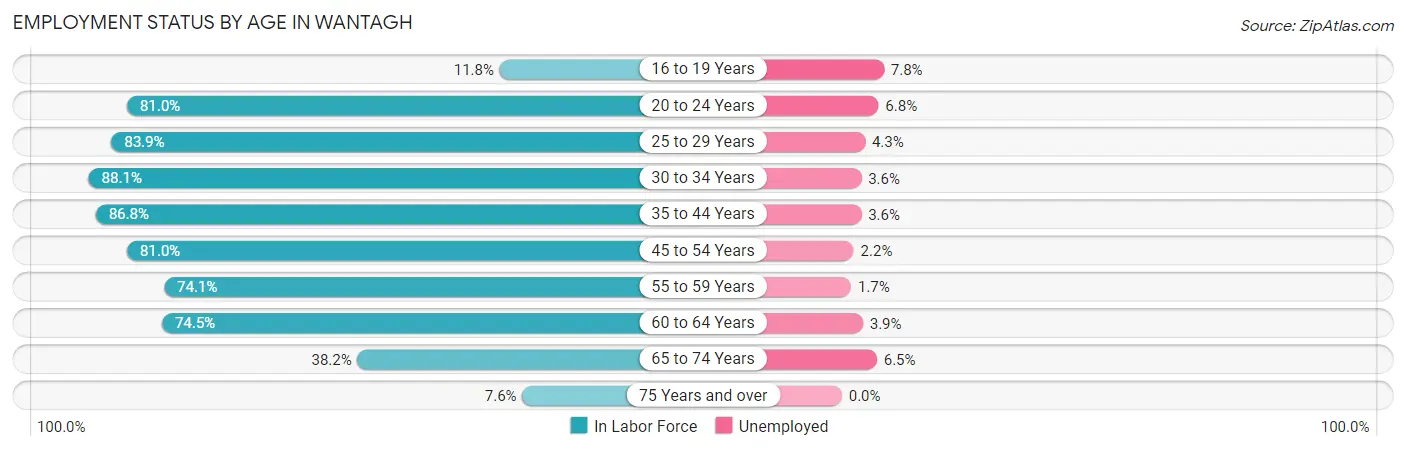
| Age Bracket | In Labor Force | Unemployed |
| 16 to 19 Years | 128 (11.8%) | 10 (7.8%) |
| 20 to 24 Years | 898 (81.0%) | 61 (6.8%) |
| 25 to 29 Years | 676 (83.9%) | 29 (4.3%) |
| 30 to 34 Years | 814 (88.1%) | 29 (3.6%) |
| 35 to 44 Years | 2,125 (86.8%) | 76 (3.6%) |
| 45 to 54 Years | 2,068 (81.0%) | 45 (2.2%) |
| 55 to 59 Years | 980 (74.1%) | 17 (1.7%) |
| 60 to 64 Years | 928 (74.5%) | 36 (3.9%) |
| 65 to 74 Years | 598 (38.2%) | 39 (6.5%) |
| 75 Years and over | 95 (7.6%) | 0 (0.0%) |
| Total | 9,305 (65.0%) | 344 (3.7%) |
Employment Status by Educational Attainment in Wantagh
According to labor force statistics for Wantagh, 81.6% of individuals (7,588) out of the total population between 25 and 64 years of age (9,299) are in the labor force, with 3.1% or 235 of them being unemployed. The group with the highest labor force participation rate are those with the educational attainment of bachelor's degree or higher, with 89.0% or 4,858 individuals in the labor force. Within the labor force, individuals with less than high school education have the highest percentage of unemployment, with 19.0% or 11 of them being unemployed.
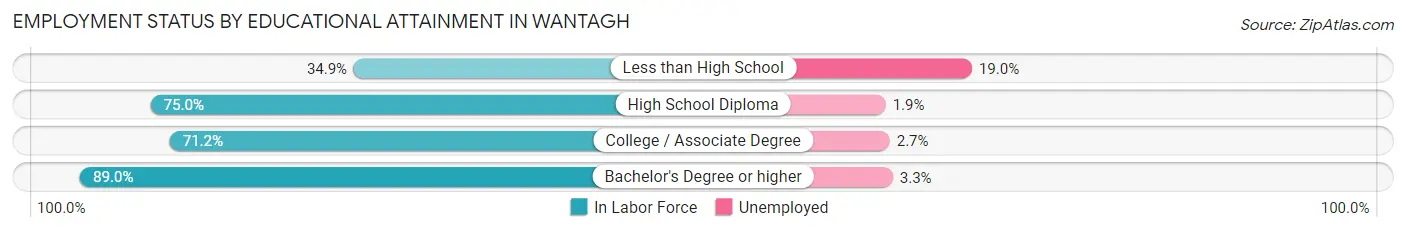
| Educational Attainment | In Labor Force | Unemployed |
| Less than High School | 58 (34.9%) | 32 (19.0%) |
| High School Diploma | 1,169 (75.0%) | 30 (1.9%) |
| College / Associate Degree | 1,507 (71.2%) | 57 (2.7%) |
| Bachelor's Degree or higher | 4,858 (89.0%) | 180 (3.3%) |
| Total | 7,588 (81.6%) | 288 (3.1%) |
Employment Occupations by Sex in Wantagh
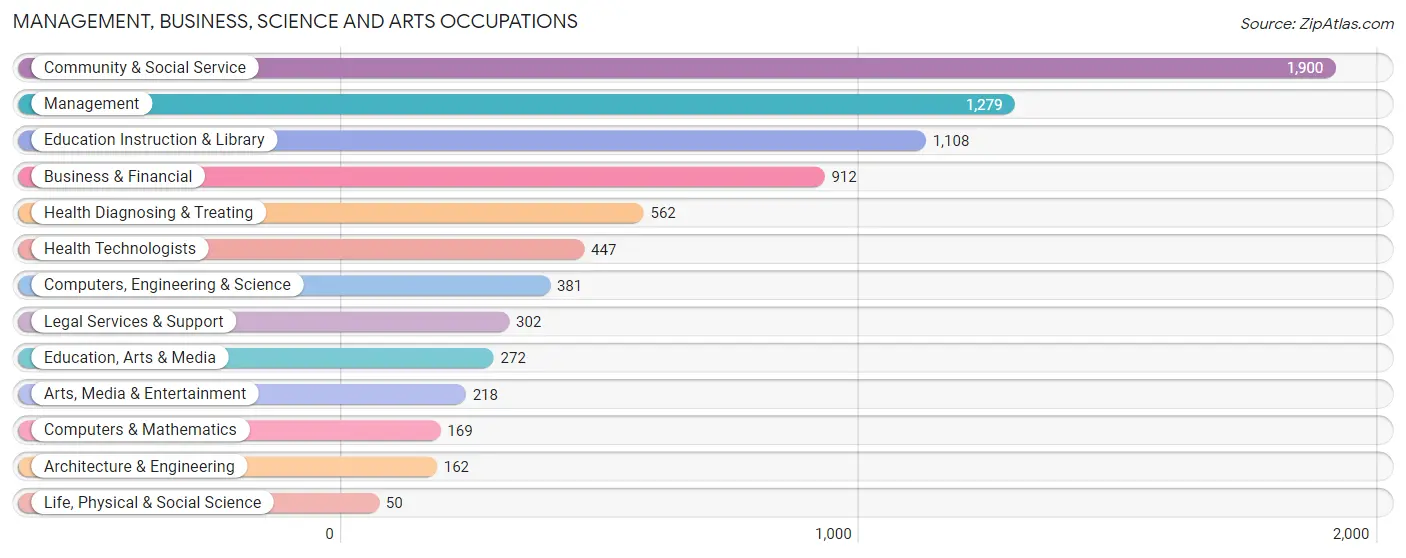
Management, Business, Science and Arts Occupations
The most common Management, Business, Science and Arts occupations in Wantagh are Community & Social Service (1,900 | 21.2%), Management (1,279 | 14.3%), Education Instruction & Library (1,108 | 12.4%), Business & Financial (912 | 10.2%), and Health Diagnosing & Treating (562 | 6.3%).
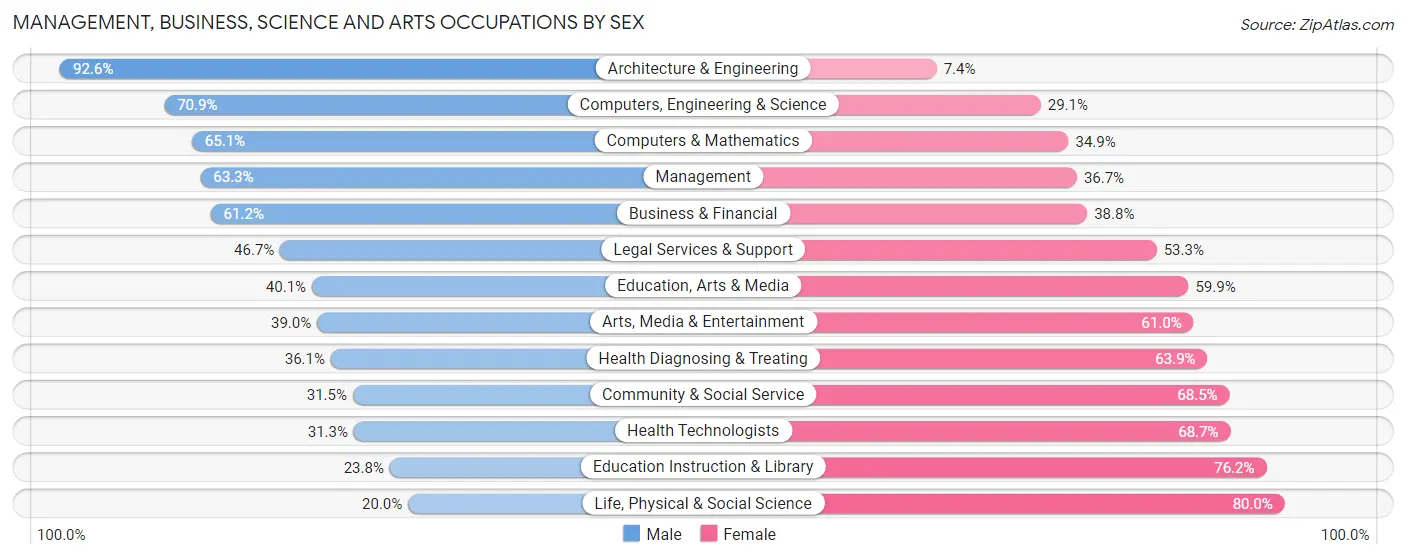
Management, Business, Science and Arts Occupations by Sex
Within the Management, Business, Science and Arts occupations in Wantagh, the most male-oriented occupations are Architecture & Engineering (92.6%), Computers, Engineering & Science (70.9%), and Computers & Mathematics (65.1%), while the most female-oriented occupations are Life, Physical & Social Science (80.0%), Education Instruction & Library (76.2%), and Health Technologists (68.7%).
| Occupation | Male | Female |
| Management | 810 (63.3%) | 469 (36.7%) |
| Business & Financial | 558 (61.2%) | 354 (38.8%) |
| Computers, Engineering & Science | 270 (70.9%) | 111 (29.1%) |
| Computers & Mathematics | 110 (65.1%) | 59 (34.9%) |
| Architecture & Engineering | 150 (92.6%) | 12 (7.4%) |
| Life, Physical & Social Science | 10 (20.0%) | 40 (80.0%) |
| Community & Social Service | 599 (31.5%) | 1,301 (68.5%) |
| Education, Arts & Media | 109 (40.1%) | 163 (59.9%) |
| Legal Services & Support | 141 (46.7%) | 161 (53.3%) |
| Education Instruction & Library | 264 (23.8%) | 844 (76.2%) |
| Arts, Media & Entertainment | 85 (39.0%) | 133 (61.0%) |
| Health Diagnosing & Treating | 203 (36.1%) | 359 (63.9%) |
| Health Technologists | 140 (31.3%) | 307 (68.7%) |
| Total (Category) | 2,440 (48.5%) | 2,594 (51.5%) |
| Total (Overall) | 4,805 (53.6%) | 4,162 (46.4%) |
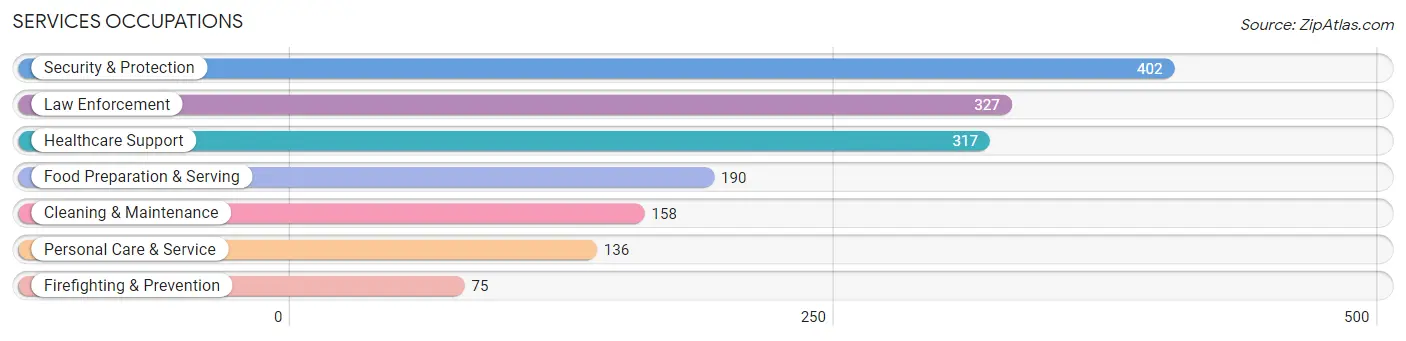
Services Occupations
The most common Services occupations in Wantagh are Security & Protection (402 | 4.5%), Law Enforcement (327 | 3.6%), Healthcare Support (317 | 3.5%), Food Preparation & Serving (190 | 2.1%), and Cleaning & Maintenance (158 | 1.8%).
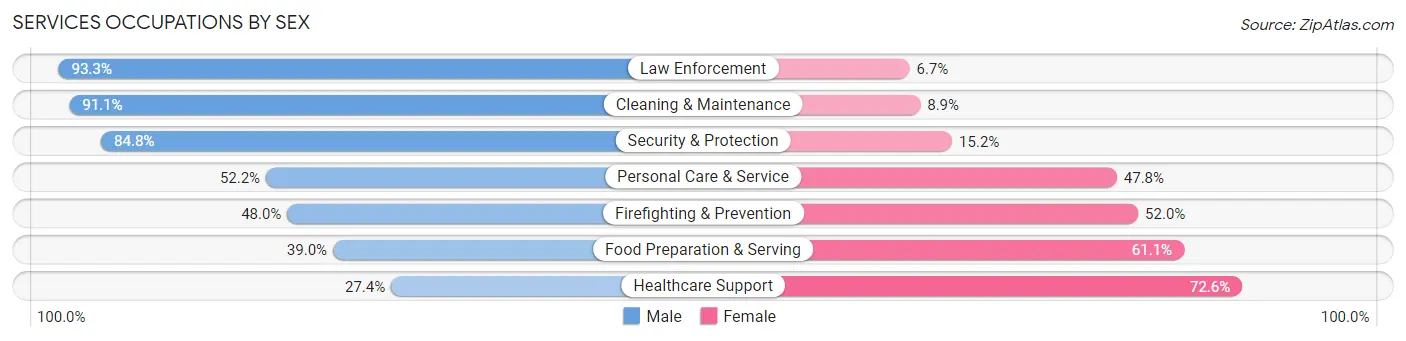
Services Occupations by Sex
Within the Services occupations in Wantagh, the most male-oriented occupations are Law Enforcement (93.3%), Cleaning & Maintenance (91.1%), and Security & Protection (84.8%), while the most female-oriented occupations are Healthcare Support (72.6%), Food Preparation & Serving (61.1%), and Firefighting & Prevention (52.0%).
| Occupation | Male | Female |
| Healthcare Support | 87 (27.4%) | 230 (72.6%) |
| Security & Protection | 341 (84.8%) | 61 (15.2%) |
| Firefighting & Prevention | 36 (48.0%) | 39 (52.0%) |
| Law Enforcement | 305 (93.3%) | 22 (6.7%) |
| Food Preparation & Serving | 74 (39.0%) | 116 (61.1%) |
| Cleaning & Maintenance | 144 (91.1%) | 14 (8.9%) |
| Personal Care & Service | 71 (52.2%) | 65 (47.8%) |
| Total (Category) | 717 (59.6%) | 486 (40.4%) |
| Total (Overall) | 4,805 (53.6%) | 4,162 (46.4%) |
Sales and Office Occupations
The most common Sales and Office occupations in Wantagh are Office & Administration (905 | 10.1%), and Sales & Related (785 | 8.7%).
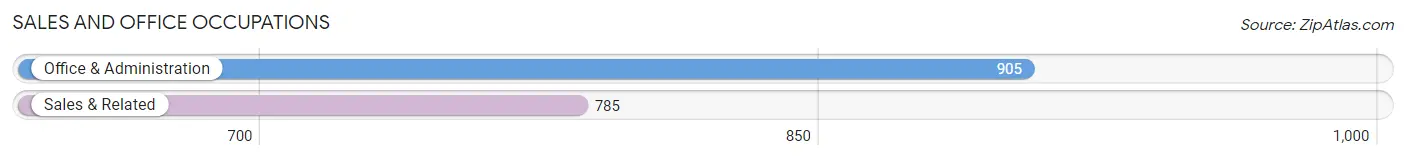
Sales and Office Occupations by Sex
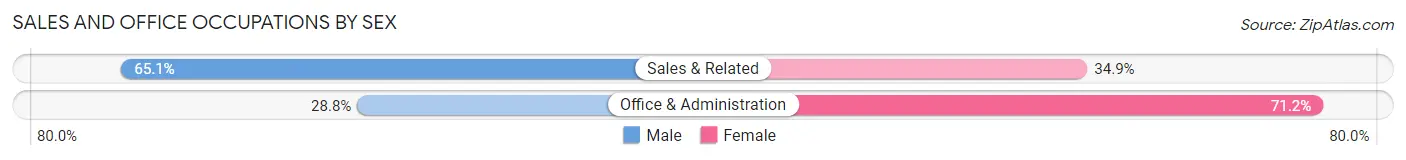
| Occupation | Male | Female |
| Sales & Related | 511 (65.1%) | 274 (34.9%) |
| Office & Administration | 261 (28.8%) | 644 (71.2%) |
| Total (Category) | 772 (45.7%) | 918 (54.3%) |
| Total (Overall) | 4,805 (53.6%) | 4,162 (46.4%) |
Natural Resources, Construction and Maintenance Occupations
The most common Natural Resources, Construction and Maintenance occupations in Wantagh are Construction & Extraction (294 | 3.3%), and Installation, Maintenance & Repair (229 | 2.5%).
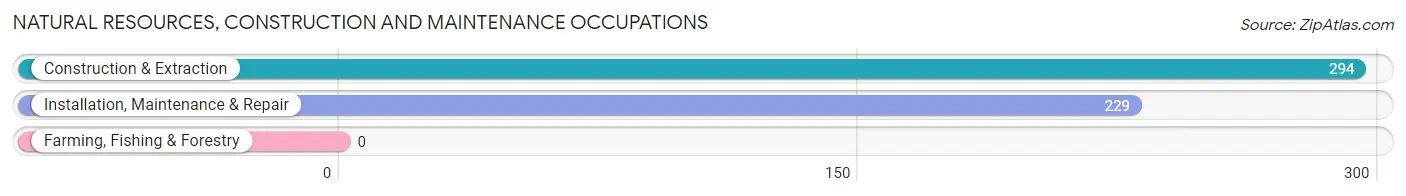
Natural Resources, Construction and Maintenance Occupations by Sex
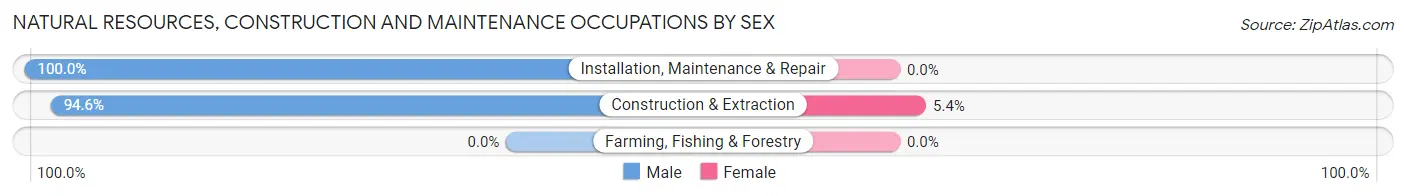
| Occupation | Male | Female |
| Farming, Fishing & Forestry | 0 (0.0%) | 0 (0.0%) |
| Construction & Extraction | 278 (94.6%) | 16 (5.4%) |
| Installation, Maintenance & Repair | 229 (100.0%) | 0 (0.0%) |
| Total (Category) | 507 (96.9%) | 16 (3.1%) |
| Total (Overall) | 4,805 (53.6%) | 4,162 (46.4%) |
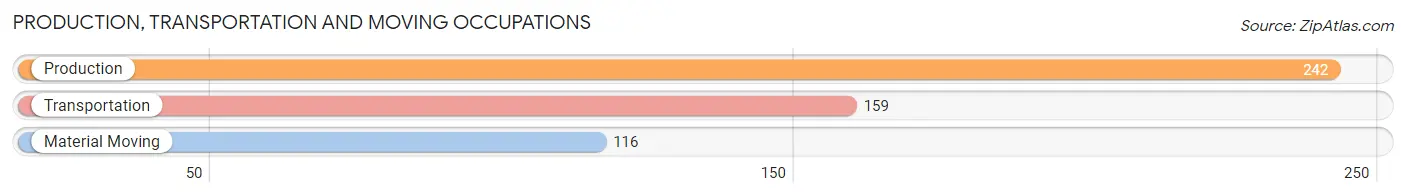
Production, Transportation and Moving Occupations
The most common Production, Transportation and Moving occupations in Wantagh are Production (242 | 2.7%), Transportation (159 | 1.8%), and Material Moving (116 | 1.3%).
Production, Transportation and Moving Occupations by Sex
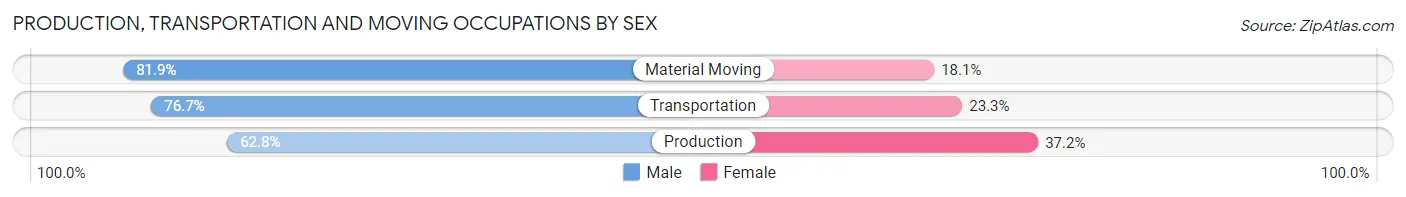
| Occupation | Male | Female |
| Production | 152 (62.8%) | 90 (37.2%) |
| Transportation | 122 (76.7%) | 37 (23.3%) |
| Material Moving | 95 (81.9%) | 21 (18.1%) |
| Total (Category) | 369 (71.4%) | 148 (28.6%) |
| Total (Overall) | 4,805 (53.6%) | 4,162 (46.4%) |
Employment Industries by Sex in Wantagh
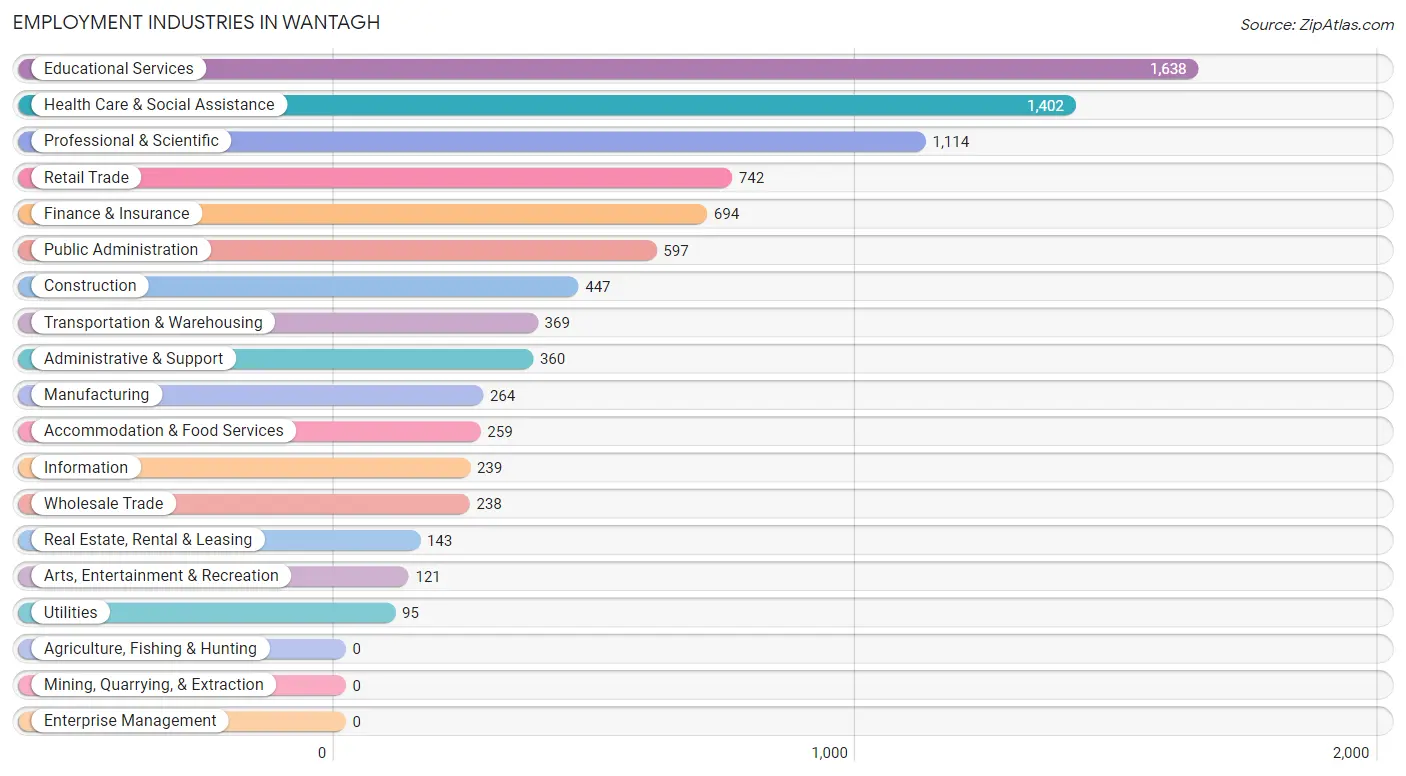
Employment Industries in Wantagh
The major employment industries in Wantagh include Educational Services (1,638 | 18.3%), Health Care & Social Assistance (1,402 | 15.6%), Professional & Scientific (1,114 | 12.4%), Retail Trade (742 | 8.3%), and Finance & Insurance (694 | 7.7%).
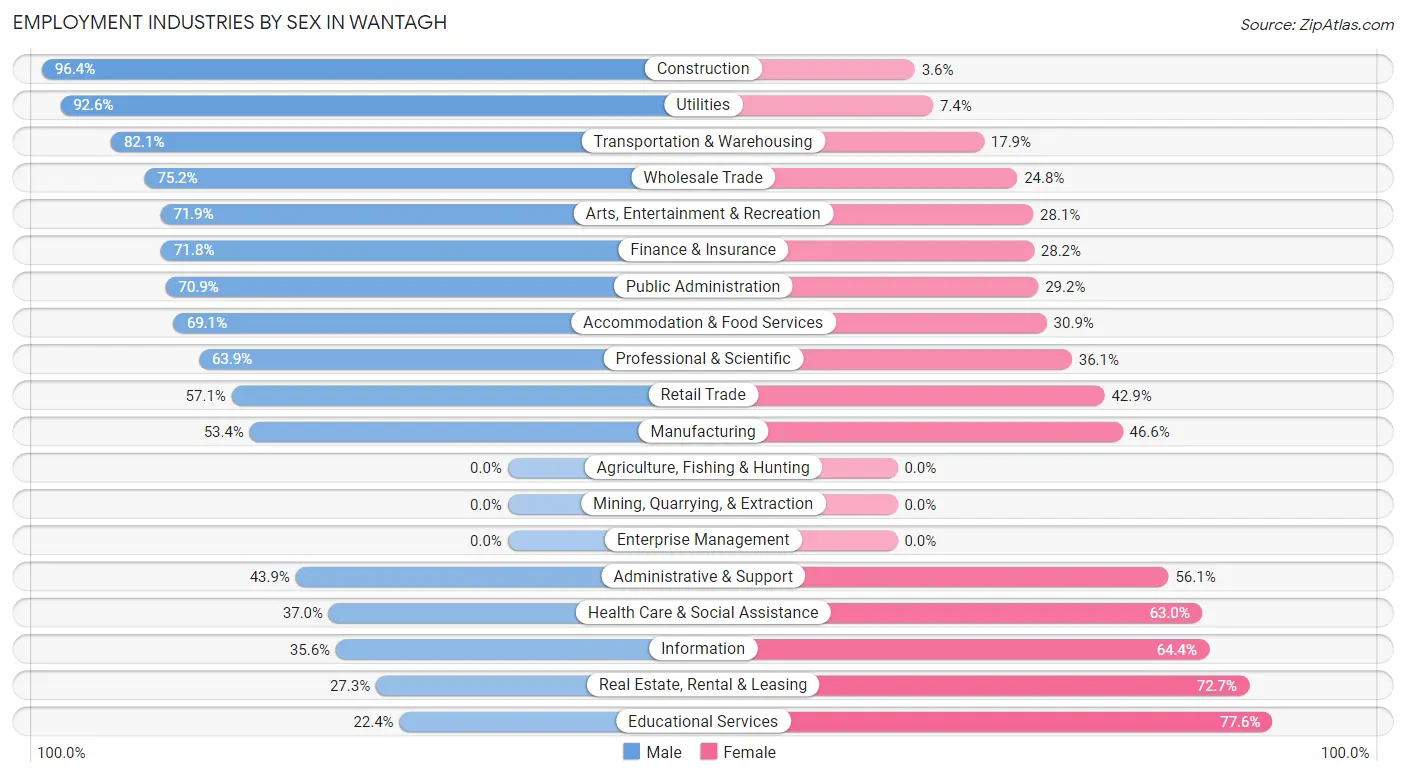
Employment Industries by Sex in Wantagh
The Wantagh industries that see more men than women are Construction (96.4%), Utilities (92.6%), and Transportation & Warehousing (82.1%), whereas the industries that tend to have a higher number of women are Educational Services (77.6%), Real Estate, Rental & Leasing (72.7%), and Information (64.4%).
| Industry | Male | Female |
| Agriculture, Fishing & Hunting | 0 (0.0%) | 0 (0.0%) |
| Mining, Quarrying, & Extraction | 0 (0.0%) | 0 (0.0%) |
| Construction | 431 (96.4%) | 16 (3.6%) |
| Manufacturing | 141 (53.4%) | 123 (46.6%) |
| Wholesale Trade | 179 (75.2%) | 59 (24.8%) |
| Retail Trade | 424 (57.1%) | 318 (42.9%) |
| Transportation & Warehousing | 303 (82.1%) | 66 (17.9%) |
| Utilities | 88 (92.6%) | 7 (7.4%) |
| Information | 85 (35.6%) | 154 (64.4%) |
| Finance & Insurance | 498 (71.8%) | 196 (28.2%) |
| Real Estate, Rental & Leasing | 39 (27.3%) | 104 (72.7%) |
| Professional & Scientific | 712 (63.9%) | 402 (36.1%) |
| Enterprise Management | 0 (0.0%) | 0 (0.0%) |
| Administrative & Support | 158 (43.9%) | 202 (56.1%) |
| Educational Services | 367 (22.4%) | 1,271 (77.6%) |
| Health Care & Social Assistance | 519 (37.0%) | 883 (63.0%) |
| Arts, Entertainment & Recreation | 87 (71.9%) | 34 (28.1%) |
| Accommodation & Food Services | 179 (69.1%) | 80 (30.9%) |
| Public Administration | 423 (70.9%) | 174 (29.1%) |
| Total | 4,805 (53.6%) | 4,162 (46.4%) |
Education in Wantagh
School Enrollment in Wantagh
The most common levels of schooling among the 4,938 students in Wantagh are high school (1,182 | 23.9%), middle school (1,145 | 23.2%), and elementary school (968 | 19.6%).
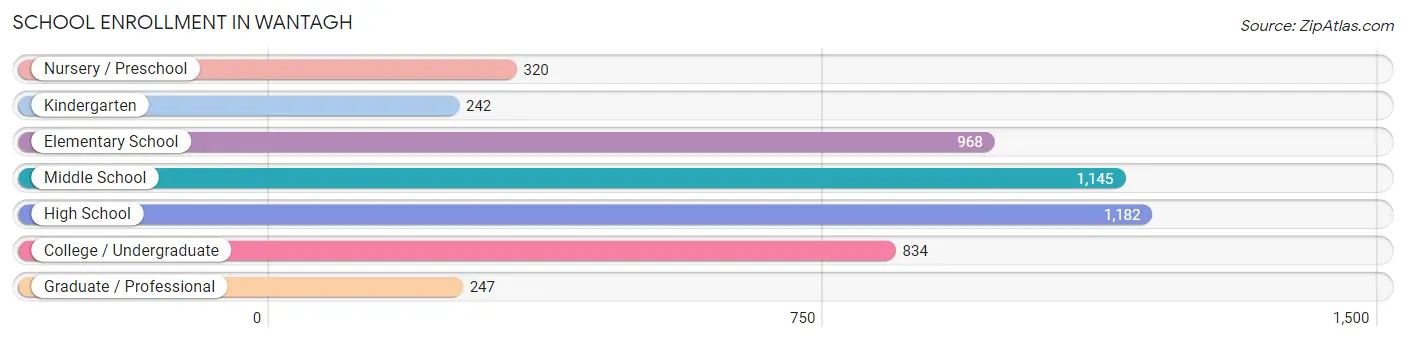
| School Level | # Students | % Students |
| Nursery / Preschool | 320 | 6.5% |
| Kindergarten | 242 | 4.9% |
| Elementary School | 968 | 19.6% |
| Middle School | 1,145 | 23.2% |
| High School | 1,182 | 23.9% |
| College / Undergraduate | 834 | 16.9% |
| Graduate / Professional | 247 | 5.0% |
| Total | 4,938 | 100.0% |
School Enrollment by Age by Funding Source in Wantagh
Out of a total of 4,938 students who are enrolled in schools in Wantagh, 859 (17.4%) attend a private institution, while the remaining 4,079 (82.6%) are enrolled in public schools. The age group of 25 to 34 year olds has the highest likelihood of being enrolled in private schools, with 48 (55.2% in the age bracket) enrolled. Conversely, the age group of 10 to 14 year olds has the lowest likelihood of being enrolled in a private school, with 1,279 (98.2% in the age bracket) attending a public institution.
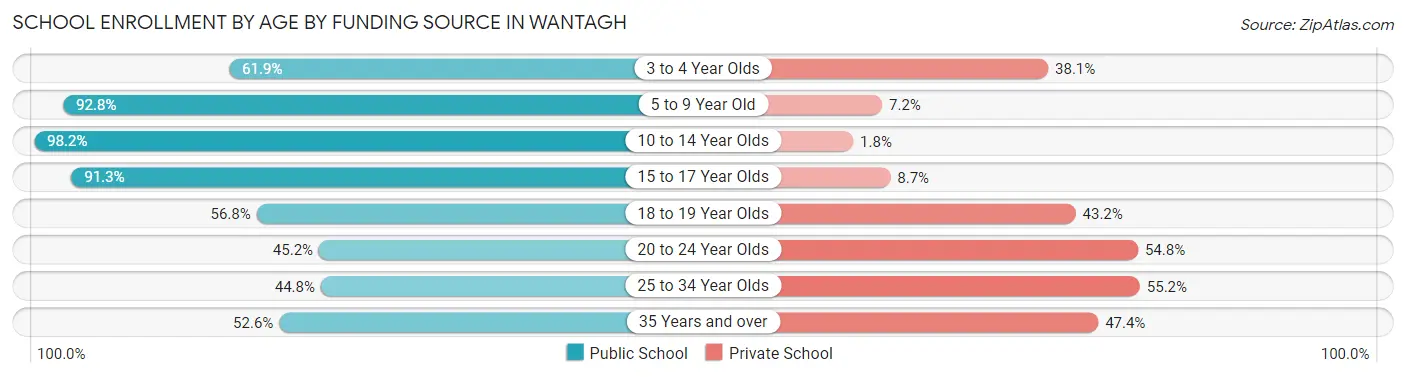
| Age Bracket | Public School | Private School |
| 3 to 4 Year Olds | 161 (61.9%) | 99 (38.1%) |
| 5 to 9 Year Old | 1,141 (92.8%) | 88 (7.2%) |
| 10 to 14 Year Olds | 1,279 (98.2%) | 23 (1.8%) |
| 15 to 17 Year Olds | 955 (91.3%) | 91 (8.7%) |
| 18 to 19 Year Olds | 192 (56.8%) | 146 (43.2%) |
| 20 to 24 Year Olds | 253 (45.2%) | 307 (54.8%) |
| 25 to 34 Year Olds | 39 (44.8%) | 48 (55.2%) |
| 35 Years and over | 61 (52.6%) | 55 (47.4%) |
| Total | 4,079 (82.6%) | 859 (17.4%) |
Educational Attainment by Field of Study in Wantagh
Business (1,852 | 26.9%), education (924 | 13.4%), science & technology (862 | 12.5%), social sciences (543 | 7.9%), and psychology (497 | 7.2%) are the most common fields of study among 6,895 individuals in Wantagh who have obtained a bachelor's degree or higher.
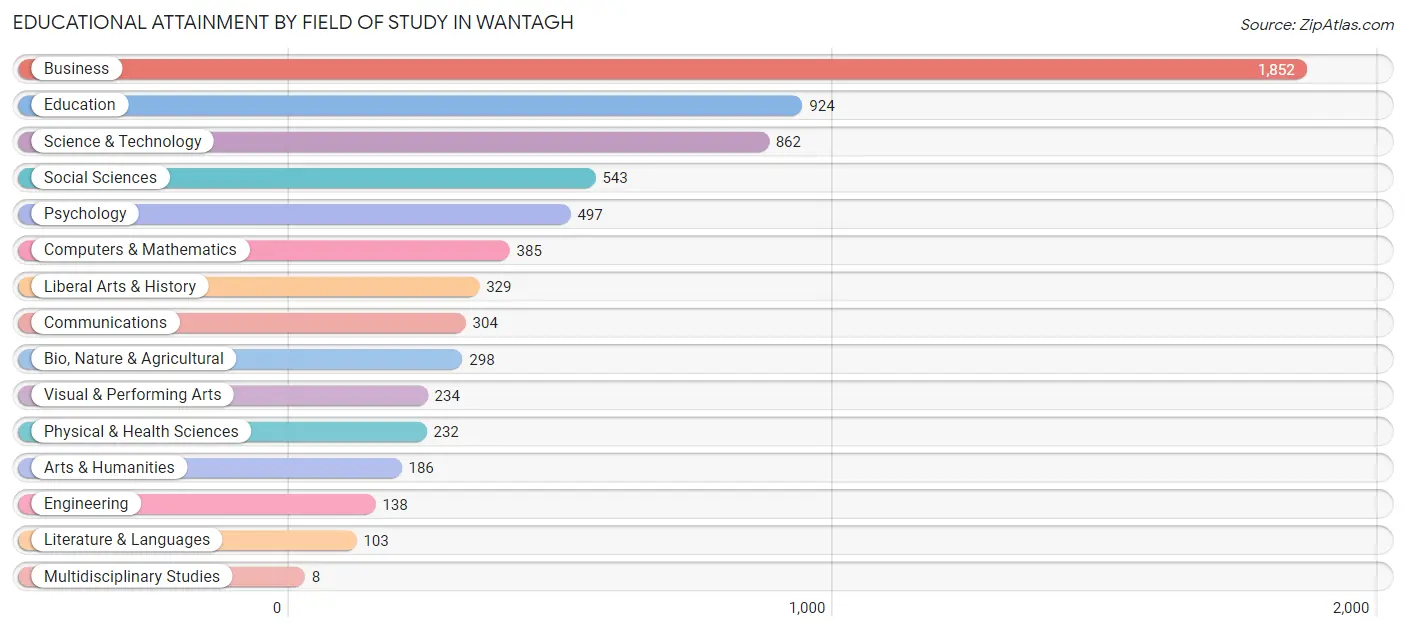
| Field of Study | # Graduates | % Graduates |
| Computers & Mathematics | 385 | 5.6% |
| Bio, Nature & Agricultural | 298 | 4.3% |
| Physical & Health Sciences | 232 | 3.4% |
| Psychology | 497 | 7.2% |
| Social Sciences | 543 | 7.9% |
| Engineering | 138 | 2.0% |
| Multidisciplinary Studies | 8 | 0.1% |
| Science & Technology | 862 | 12.5% |
| Business | 1,852 | 26.9% |
| Education | 924 | 13.4% |
| Literature & Languages | 103 | 1.5% |
| Liberal Arts & History | 329 | 4.8% |
| Visual & Performing Arts | 234 | 3.4% |
| Communications | 304 | 4.4% |
| Arts & Humanities | 186 | 2.7% |
| Total | 6,895 | 100.0% |
Transportation & Commute in Wantagh
Vehicle Availability by Sex in Wantagh
The most prevalent vehicle ownership categories in Wantagh are males with 2 vehicles (2,103, accounting for 43.8%) and females with 2 vehicles (2,056, making up 51.7%).
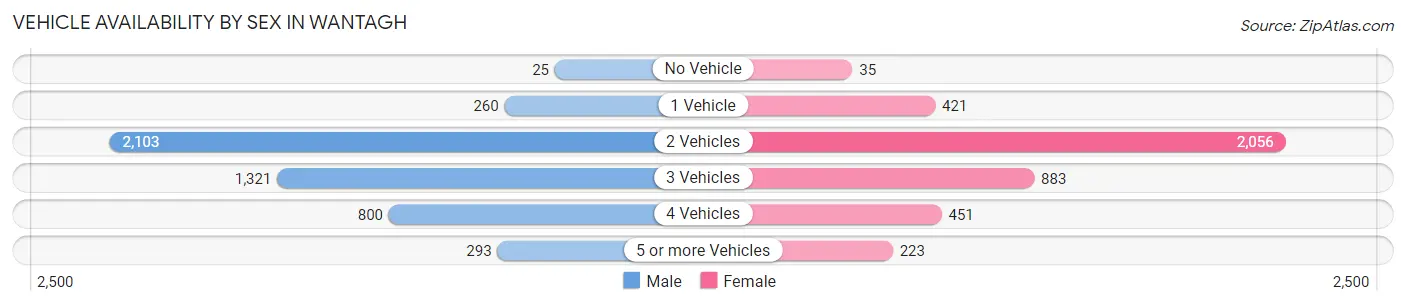
| Vehicles Available | Male | Female |
| No Vehicle | 25 (0.5%) | 35 (0.9%) |
| 1 Vehicle | 260 (5.4%) | 421 (10.3%) |
| 2 Vehicles | 2,103 (43.8%) | 2,056 (50.5%) |
| 3 Vehicles | 1,321 (27.5%) | 883 (21.7%) |
| 4 Vehicles | 800 (16.7%) | 451 (11.1%) |
| 5 or more Vehicles | 293 (6.1%) | 223 (5.5%) |
| Total | 4,802 (100.0%) | 4,069 (100.0%) |
Commute Time in Wantagh
The most frequently occuring commute durations in Wantagh are 20 to 24 minutes (1,548 commuters, 20.1%), 30 to 34 minutes (1,086 commuters, 14.1%), and 15 to 19 minutes (978 commuters, 12.7%).
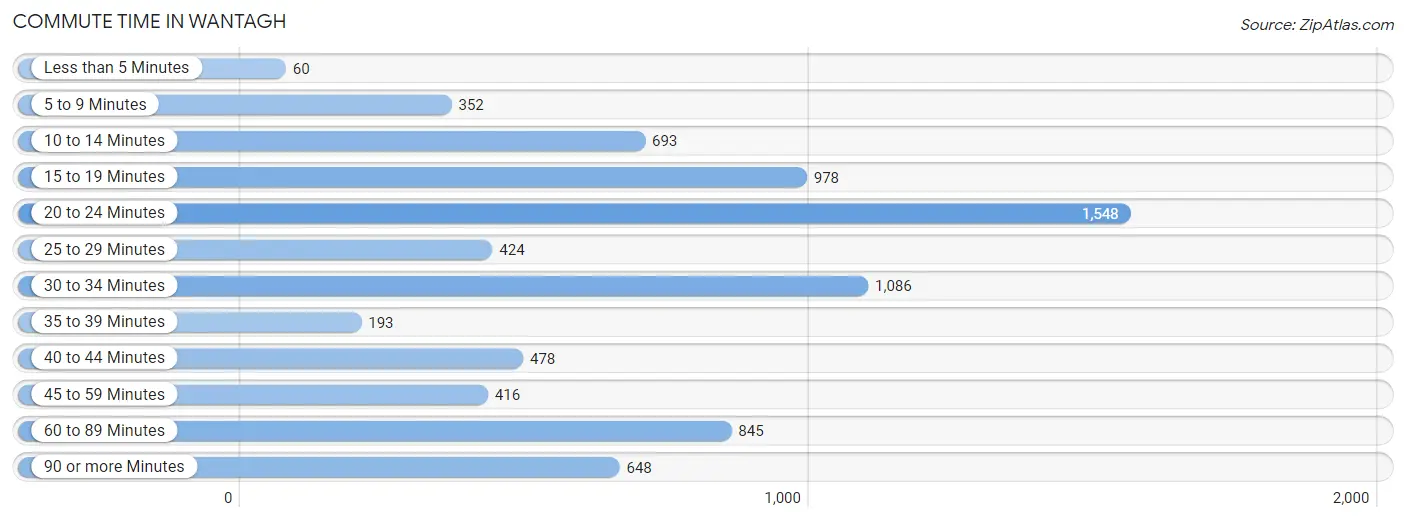
| Commute Time | # Commuters | % Commuters |
| Less than 5 Minutes | 60 | 0.8% |
| 5 to 9 Minutes | 352 | 4.6% |
| 10 to 14 Minutes | 693 | 9.0% |
| 15 to 19 Minutes | 978 | 12.7% |
| 20 to 24 Minutes | 1,548 | 20.1% |
| 25 to 29 Minutes | 424 | 5.5% |
| 30 to 34 Minutes | 1,086 | 14.1% |
| 35 to 39 Minutes | 193 | 2.5% |
| 40 to 44 Minutes | 478 | 6.2% |
| 45 to 59 Minutes | 416 | 5.4% |
| 60 to 89 Minutes | 845 | 10.9% |
| 90 or more Minutes | 648 | 8.4% |
Commute Time by Sex in Wantagh
The most common commute times in Wantagh are 20 to 24 minutes (805 commuters, 18.6%) for males and 20 to 24 minutes (743 commuters, 21.9%) for females.
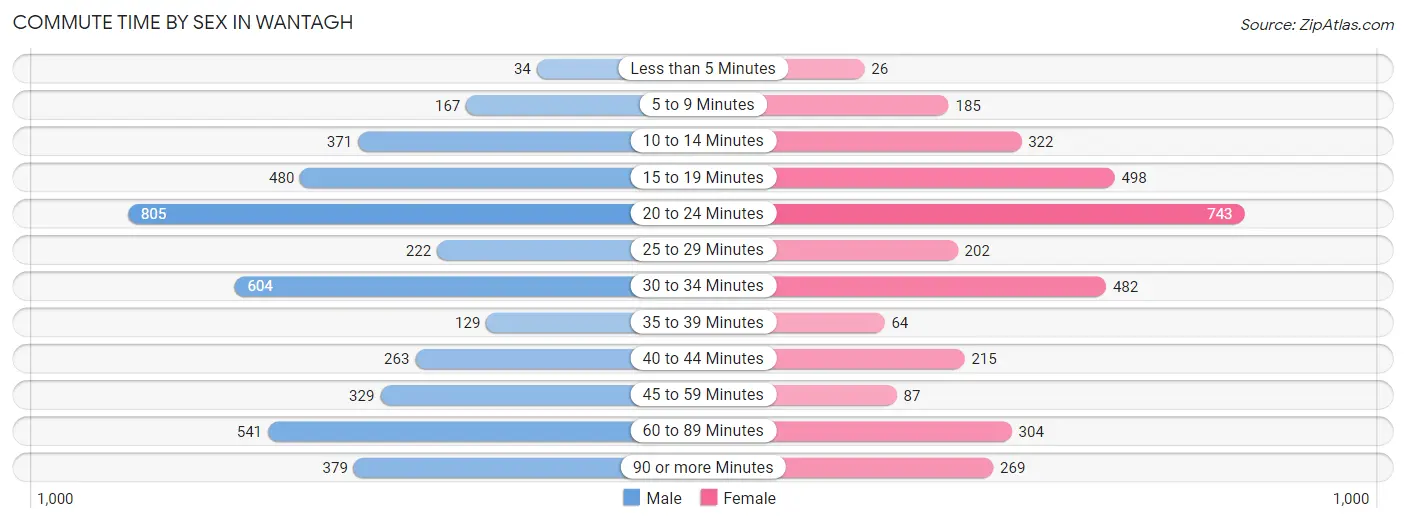
| Commute Time | Male | Female |
| Less than 5 Minutes | 34 (0.8%) | 26 (0.8%) |
| 5 to 9 Minutes | 167 (3.9%) | 185 (5.4%) |
| 10 to 14 Minutes | 371 (8.6%) | 322 (9.5%) |
| 15 to 19 Minutes | 480 (11.1%) | 498 (14.7%) |
| 20 to 24 Minutes | 805 (18.6%) | 743 (21.9%) |
| 25 to 29 Minutes | 222 (5.1%) | 202 (5.9%) |
| 30 to 34 Minutes | 604 (14.0%) | 482 (14.2%) |
| 35 to 39 Minutes | 129 (3.0%) | 64 (1.9%) |
| 40 to 44 Minutes | 263 (6.1%) | 215 (6.3%) |
| 45 to 59 Minutes | 329 (7.6%) | 87 (2.6%) |
| 60 to 89 Minutes | 541 (12.5%) | 304 (8.9%) |
| 90 or more Minutes | 379 (8.8%) | 269 (7.9%) |
Time of Departure to Work by Sex in Wantagh
The most frequent times of departure to work in Wantagh are 7:00 AM to 7:29 AM (778, 18.0%) for males and 8:00 AM to 8:29 AM (622, 18.3%) for females.
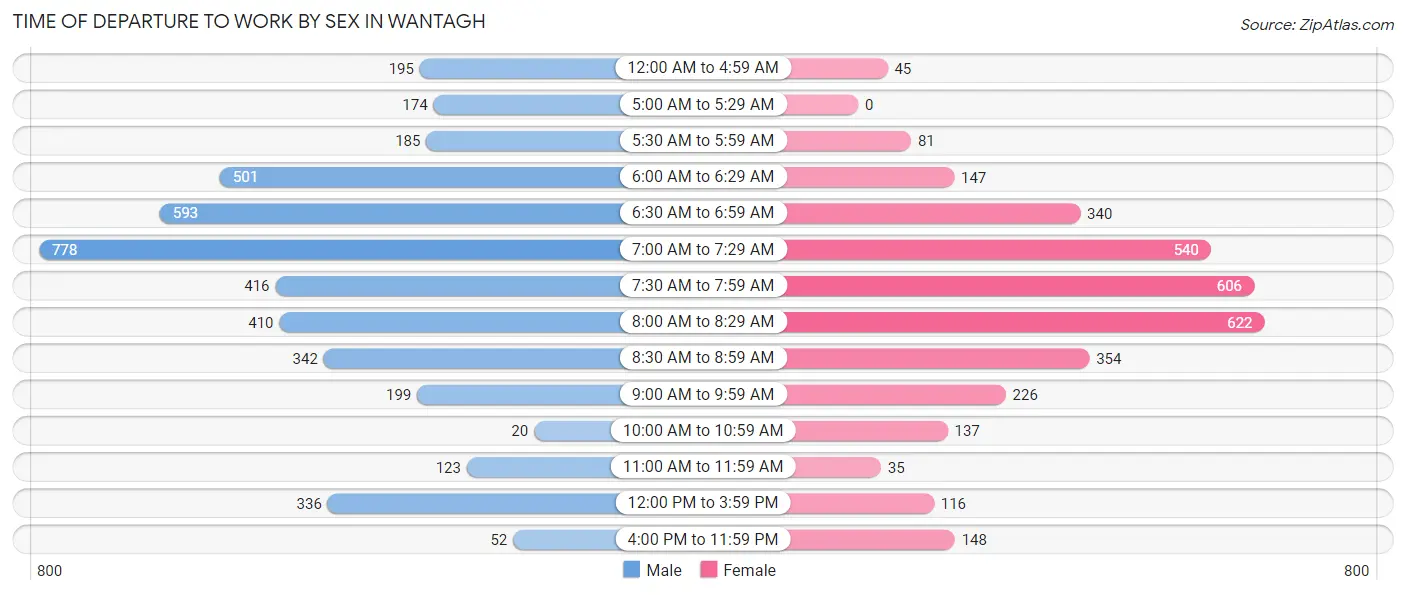
| Time of Departure | Male | Female |
| 12:00 AM to 4:59 AM | 195 (4.5%) | 45 (1.3%) |
| 5:00 AM to 5:29 AM | 174 (4.0%) | 0 (0.0%) |
| 5:30 AM to 5:59 AM | 185 (4.3%) | 81 (2.4%) |
| 6:00 AM to 6:29 AM | 501 (11.6%) | 147 (4.3%) |
| 6:30 AM to 6:59 AM | 593 (13.7%) | 340 (10.0%) |
| 7:00 AM to 7:29 AM | 778 (18.0%) | 540 (15.9%) |
| 7:30 AM to 7:59 AM | 416 (9.6%) | 606 (17.8%) |
| 8:00 AM to 8:29 AM | 410 (9.5%) | 622 (18.3%) |
| 8:30 AM to 8:59 AM | 342 (7.9%) | 354 (10.4%) |
| 9:00 AM to 9:59 AM | 199 (4.6%) | 226 (6.7%) |
| 10:00 AM to 10:59 AM | 20 (0.5%) | 137 (4.0%) |
| 11:00 AM to 11:59 AM | 123 (2.8%) | 35 (1.0%) |
| 12:00 PM to 3:59 PM | 336 (7.8%) | 116 (3.4%) |
| 4:00 PM to 11:59 PM | 52 (1.2%) | 148 (4.4%) |
| Total | 4,324 (100.0%) | 3,397 (100.0%) |
Housing Occupancy in Wantagh
Occupancy by Ownership in Wantagh
Of the total 5,816 dwellings in Wantagh, owner-occupied units account for 5,514 (94.8%), while renter-occupied units make up 302 (5.2%).
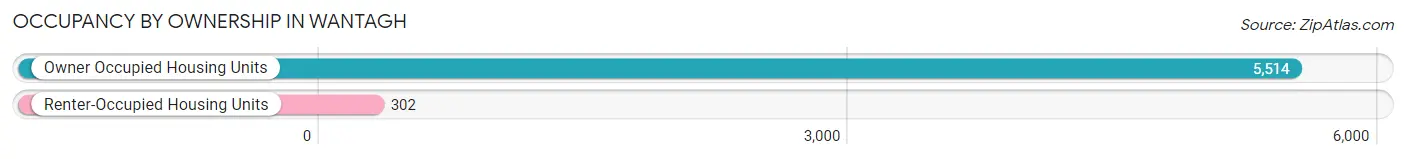
| Occupancy | # Housing Units | % Housing Units |
| Owner Occupied Housing Units | 5,514 | 94.8% |
| Renter-Occupied Housing Units | 302 | 5.2% |
| Total Occupied Housing Units | 5,816 | 100.0% |
Occupancy by Household Size in Wantagh
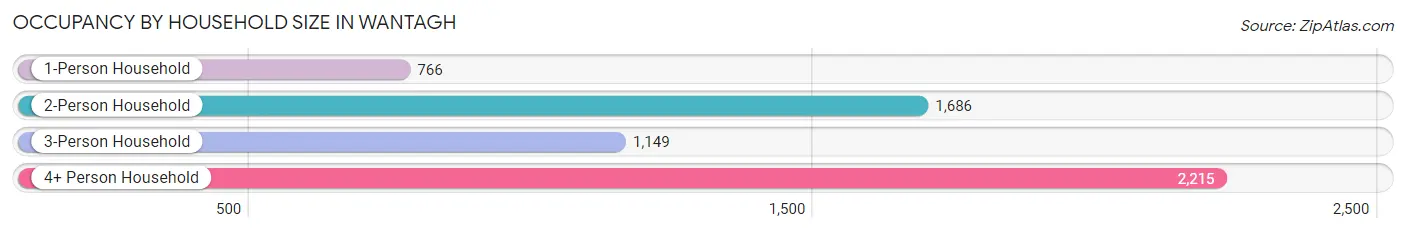
| Household Size | # Housing Units | % Housing Units |
| 1-Person Household | 766 | 13.2% |
| 2-Person Household | 1,686 | 29.0% |
| 3-Person Household | 1,149 | 19.8% |
| 4+ Person Household | 2,215 | 38.1% |
| Total Housing Units | 5,816 | 100.0% |
Occupancy by Ownership by Household Size in Wantagh
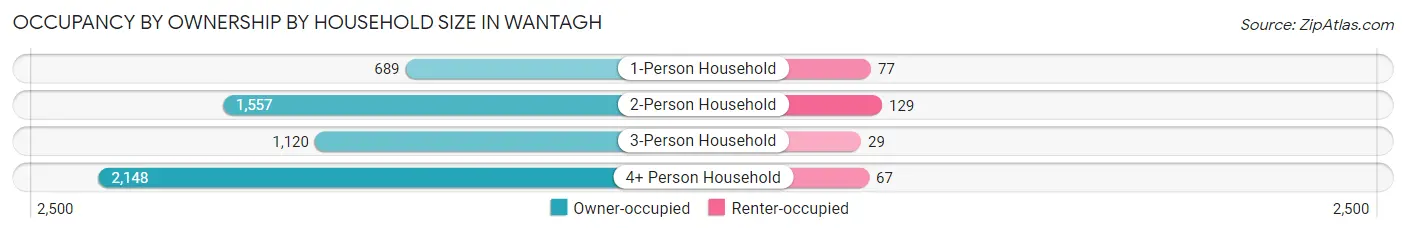
| Household Size | Owner-occupied | Renter-occupied |
| 1-Person Household | 689 (89.9%) | 77 (10.1%) |
| 2-Person Household | 1,557 (92.3%) | 129 (7.6%) |
| 3-Person Household | 1,120 (97.5%) | 29 (2.5%) |
| 4+ Person Household | 2,148 (97.0%) | 67 (3.0%) |
| Total Housing Units | 5,514 (94.8%) | 302 (5.2%) |
Occupancy by Educational Attainment in Wantagh
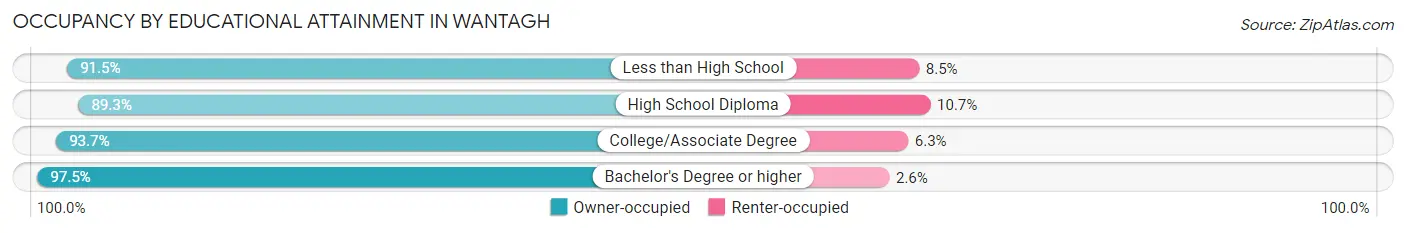
| Household Size | Owner-occupied | Renter-occupied |
| Less than High School | 119 (91.5%) | 11 (8.5%) |
| High School Diploma | 1,036 (89.3%) | 124 (10.7%) |
| College/Associate Degree | 1,298 (93.7%) | 87 (6.3%) |
| Bachelor's Degree or higher | 3,061 (97.5%) | 80 (2.5%) |
Occupancy by Age of Householder in Wantagh
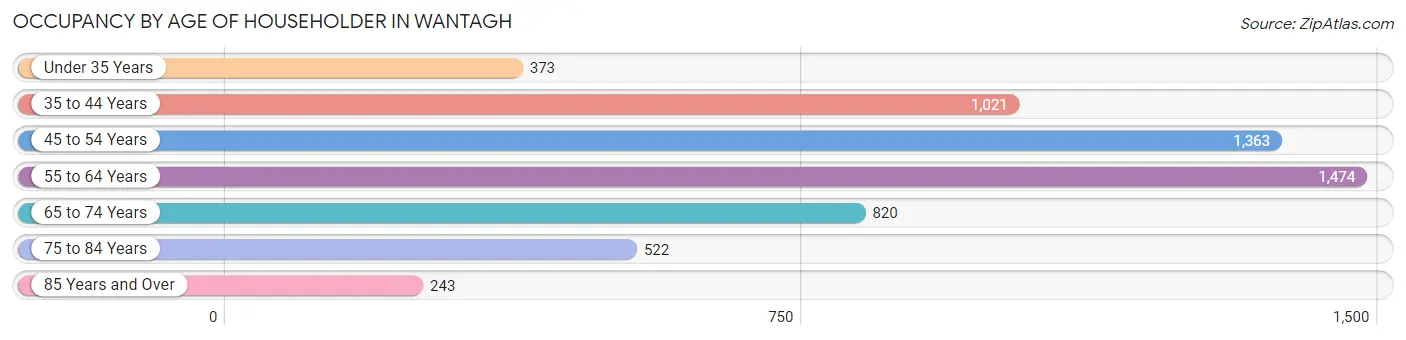
| Age Bracket | # Households | % Households |
| Under 35 Years | 373 | 6.4% |
| 35 to 44 Years | 1,021 | 17.6% |
| 45 to 54 Years | 1,363 | 23.4% |
| 55 to 64 Years | 1,474 | 25.3% |
| 65 to 74 Years | 820 | 14.1% |
| 75 to 84 Years | 522 | 9.0% |
| 85 Years and Over | 243 | 4.2% |
| Total | 5,816 | 100.0% |
Housing Finances in Wantagh
Median Income by Occupancy in Wantagh
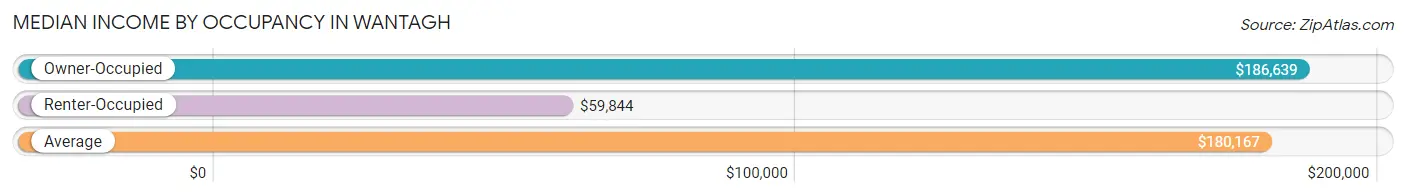
| Occupancy Type | # Households | Median Income |
| Owner-Occupied | 5,514 (94.8%) | $186,639 |
| Renter-Occupied | 302 (5.2%) | $59,844 |
| Average | 5,816 (100.0%) | $180,167 |
Occupancy by Householder Income Bracket in Wantagh
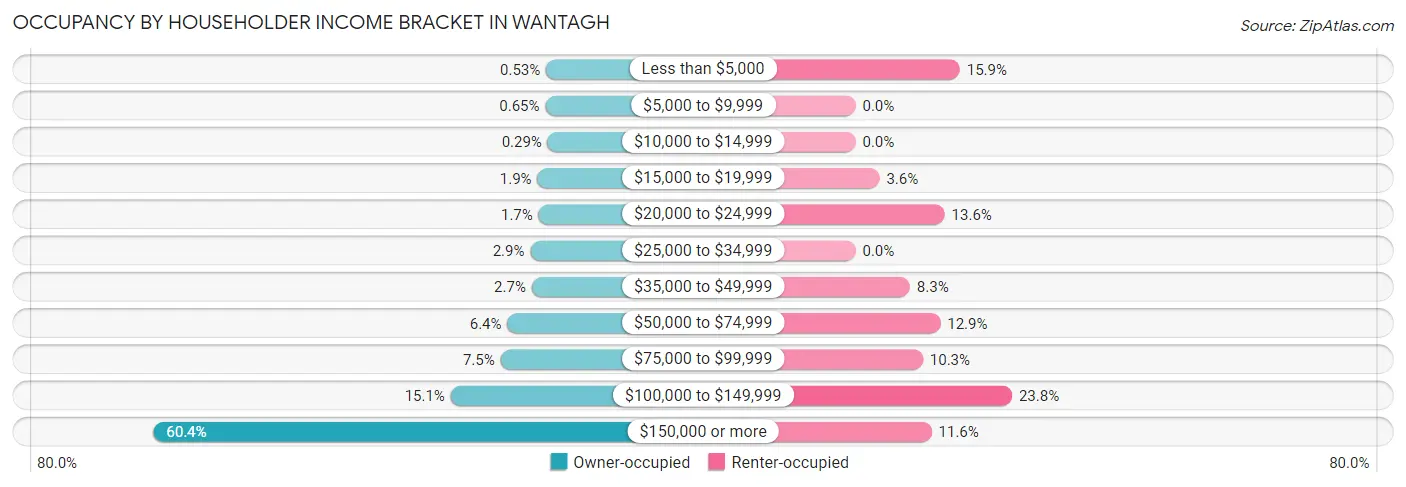
| Income Bracket | Owner-occupied | Renter-occupied |
| Less than $5,000 | 29 (0.5%) | 48 (15.9%) |
| $5,000 to $9,999 | 36 (0.6%) | 0 (0.0%) |
| $10,000 to $14,999 | 16 (0.3%) | 0 (0.0%) |
| $15,000 to $19,999 | 102 (1.8%) | 11 (3.6%) |
| $20,000 to $24,999 | 92 (1.7%) | 41 (13.6%) |
| $25,000 to $34,999 | 162 (2.9%) | 0 (0.0%) |
| $35,000 to $49,999 | 150 (2.7%) | 25 (8.3%) |
| $50,000 to $74,999 | 355 (6.4%) | 39 (12.9%) |
| $75,000 to $99,999 | 412 (7.5%) | 31 (10.3%) |
| $100,000 to $149,999 | 831 (15.1%) | 72 (23.8%) |
| $150,000 or more | 3,329 (60.4%) | 35 (11.6%) |
| Total | 5,514 (100.0%) | 302 (100.0%) |
Monthly Housing Cost Tiers in Wantagh
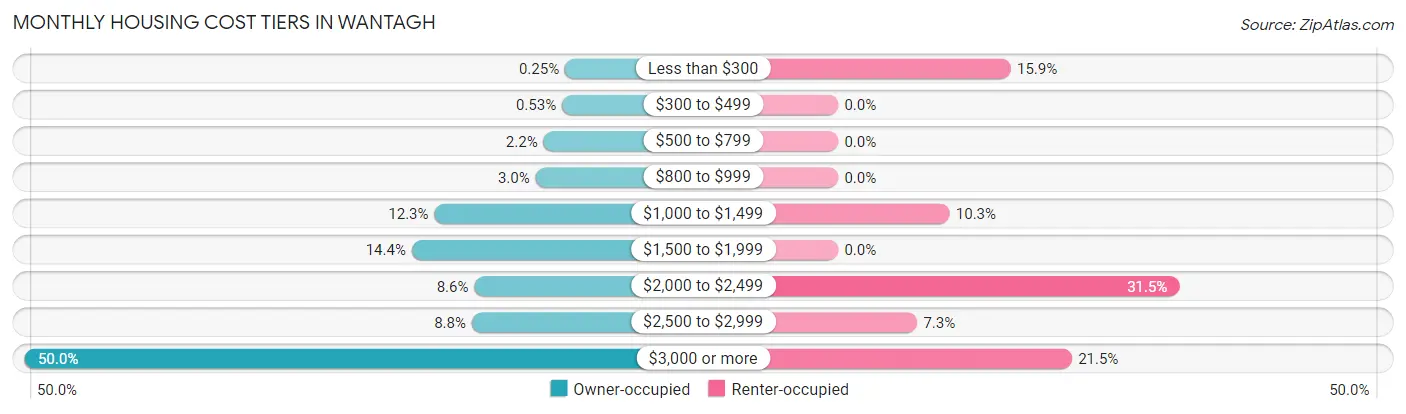
| Monthly Cost | Owner-occupied | Renter-occupied |
| Less than $300 | 14 (0.3%) | 48 (15.9%) |
| $300 to $499 | 29 (0.5%) | 0 (0.0%) |
| $500 to $799 | 123 (2.2%) | 0 (0.0%) |
| $800 to $999 | 163 (3.0%) | 0 (0.0%) |
| $1,000 to $1,499 | 677 (12.3%) | 31 (10.3%) |
| $1,500 to $1,999 | 792 (14.4%) | 0 (0.0%) |
| $2,000 to $2,499 | 474 (8.6%) | 95 (31.5%) |
| $2,500 to $2,999 | 487 (8.8%) | 22 (7.3%) |
| $3,000 or more | 2,755 (50.0%) | 65 (21.5%) |
| Total | 5,514 (100.0%) | 302 (100.0%) |
Physical Housing Characteristics in Wantagh
Housing Structures in Wantagh
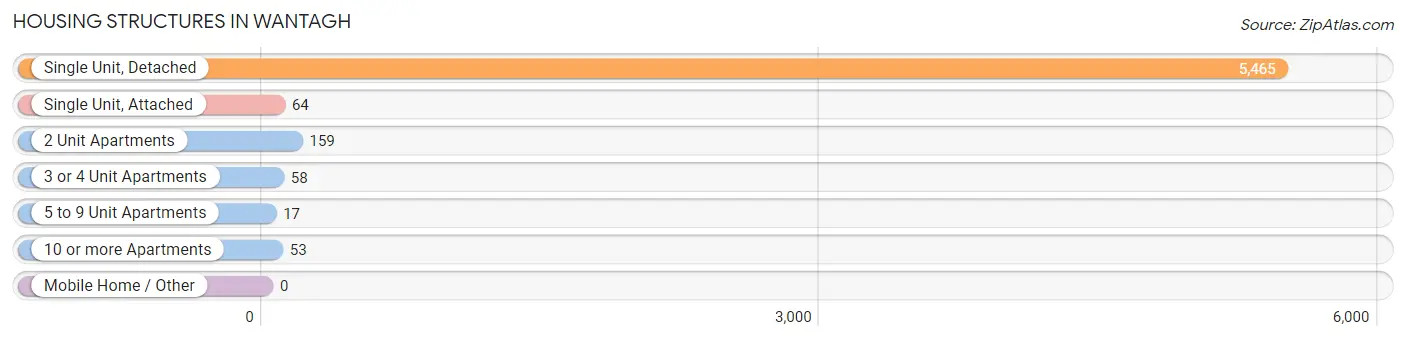
| Structure Type | # Housing Units | % Housing Units |
| Single Unit, Detached | 5,465 | 94.0% |
| Single Unit, Attached | 64 | 1.1% |
| 2 Unit Apartments | 159 | 2.7% |
| 3 or 4 Unit Apartments | 58 | 1.0% |
| 5 to 9 Unit Apartments | 17 | 0.3% |
| 10 or more Apartments | 53 | 0.9% |
| Mobile Home / Other | 0 | 0.0% |
| Total | 5,816 | 100.0% |
Housing Structures by Occupancy in Wantagh
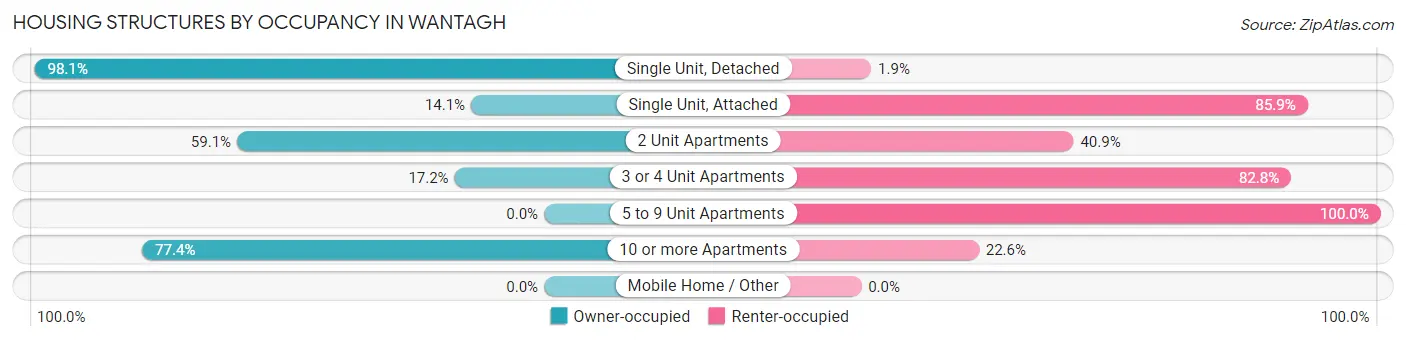
| Structure Type | Owner-occupied | Renter-occupied |
| Single Unit, Detached | 5,360 (98.1%) | 105 (1.9%) |
| Single Unit, Attached | 9 (14.1%) | 55 (85.9%) |
| 2 Unit Apartments | 94 (59.1%) | 65 (40.9%) |
| 3 or 4 Unit Apartments | 10 (17.2%) | 48 (82.8%) |
| 5 to 9 Unit Apartments | 0 (0.0%) | 17 (100.0%) |
| 10 or more Apartments | 41 (77.4%) | 12 (22.6%) |
| Mobile Home / Other | 0 (0.0%) | 0 (0.0%) |
| Total | 5,514 (94.8%) | 302 (5.2%) |
Housing Structures by Number of Rooms in Wantagh
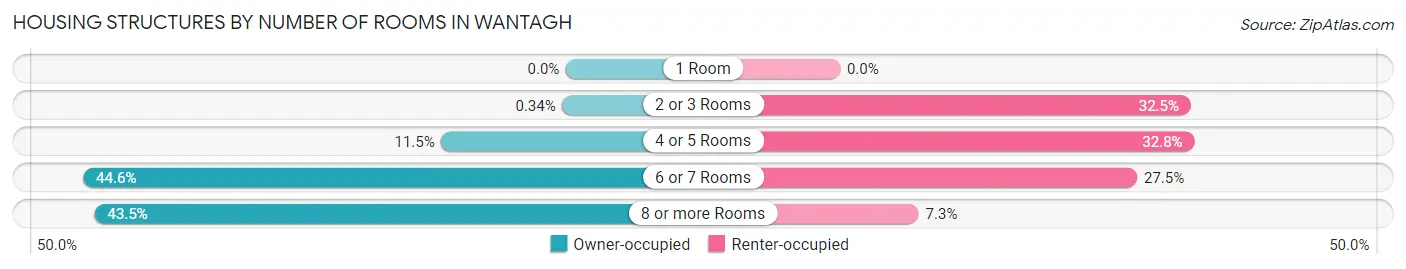
| Number of Rooms | Owner-occupied | Renter-occupied |
| 1 Room | 0 (0.0%) | 0 (0.0%) |
| 2 or 3 Rooms | 19 (0.3%) | 98 (32.5%) |
| 4 or 5 Rooms | 636 (11.5%) | 99 (32.8%) |
| 6 or 7 Rooms | 2,458 (44.6%) | 83 (27.5%) |
| 8 or more Rooms | 2,401 (43.5%) | 22 (7.3%) |
| Total | 5,514 (100.0%) | 302 (100.0%) |
Housing Structure by Heating Type in Wantagh
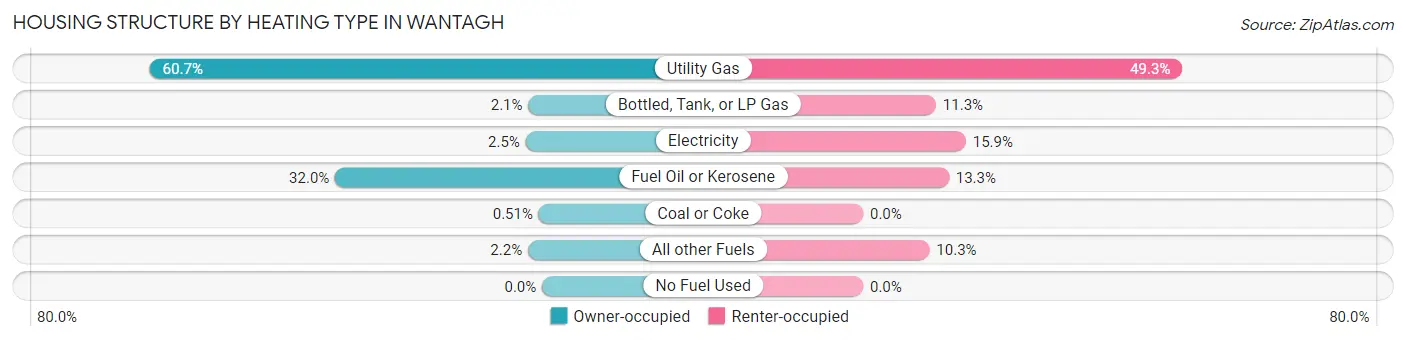
| Heating Type | Owner-occupied | Renter-occupied |
| Utility Gas | 3,345 (60.7%) | 149 (49.3%) |
| Bottled, Tank, or LP Gas | 117 (2.1%) | 34 (11.3%) |
| Electricity | 140 (2.5%) | 48 (15.9%) |
| Fuel Oil or Kerosene | 1,764 (32.0%) | 40 (13.3%) |
| Coal or Coke | 28 (0.5%) | 0 (0.0%) |
| All other Fuels | 120 (2.2%) | 31 (10.3%) |
| No Fuel Used | 0 (0.0%) | 0 (0.0%) |
| Total | 5,514 (100.0%) | 302 (100.0%) |
Household Vehicle Usage in Wantagh
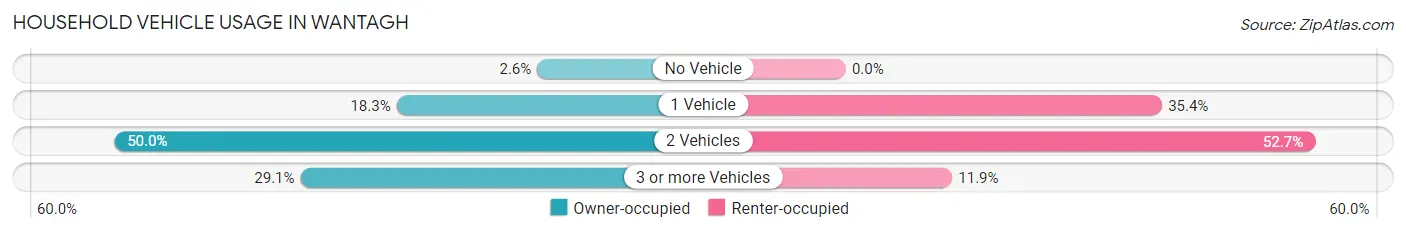
| Vehicles per Household | Owner-occupied | Renter-occupied |
| No Vehicle | 143 (2.6%) | 0 (0.0%) |
| 1 Vehicle | 1,011 (18.3%) | 107 (35.4%) |
| 2 Vehicles | 2,755 (50.0%) | 159 (52.6%) |
| 3 or more Vehicles | 1,605 (29.1%) | 36 (11.9%) |
| Total | 5,514 (100.0%) | 302 (100.0%) |
Real Estate & Mortgages in Wantagh
Real Estate and Mortgage Overview in Wantagh
| Characteristic | Without Mortgage | With Mortgage |
| Housing Units | 2,110 | 3,404 |
| Median Property Value | $619,600 | $662,000 |
| Median Household Income | $145,217 | $2,295 |
| Monthly Housing Costs | $1,501 | $2,701 |
| Real Estate Taxes | $10,001 | $18 |
Property Value by Mortgage Status in Wantagh
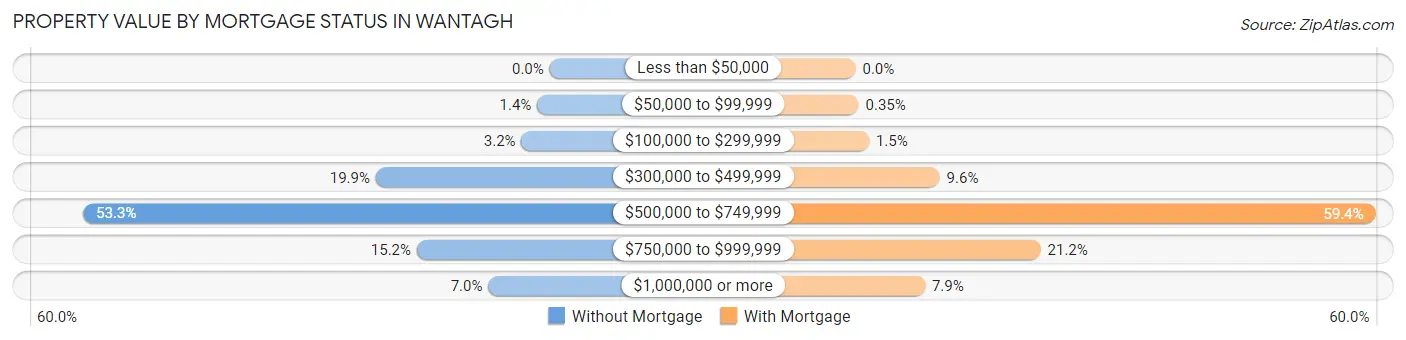
| Property Value | Without Mortgage | With Mortgage |
| Less than $50,000 | 0 (0.0%) | 0 (0.0%) |
| $50,000 to $99,999 | 30 (1.4%) | 12 (0.4%) |
| $100,000 to $299,999 | 68 (3.2%) | 52 (1.5%) |
| $300,000 to $499,999 | 419 (19.9%) | 327 (9.6%) |
| $500,000 to $749,999 | 1,125 (53.3%) | 2,023 (59.4%) |
| $750,000 to $999,999 | 320 (15.2%) | 720 (21.1%) |
| $1,000,000 or more | 148 (7.0%) | 270 (7.9%) |
| Total | 2,110 (100.0%) | 3,404 (100.0%) |
Household Income by Mortgage Status in Wantagh
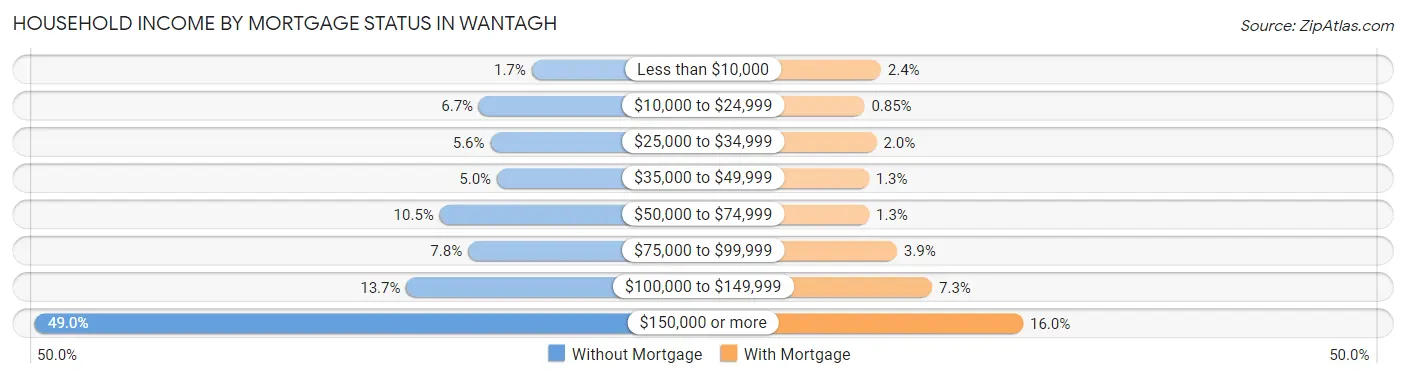
| Household Income | Without Mortgage | With Mortgage |
| Less than $10,000 | 36 (1.7%) | 82 (2.4%) |
| $10,000 to $24,999 | 142 (6.7%) | 29 (0.9%) |
| $25,000 to $34,999 | 119 (5.6%) | 68 (2.0%) |
| $35,000 to $49,999 | 106 (5.0%) | 43 (1.3%) |
| $50,000 to $74,999 | 221 (10.5%) | 44 (1.3%) |
| $75,000 to $99,999 | 164 (7.8%) | 134 (3.9%) |
| $100,000 to $149,999 | 288 (13.7%) | 248 (7.3%) |
| $150,000 or more | 1,034 (49.0%) | 543 (16.0%) |
| Total | 2,110 (100.0%) | 3,404 (100.0%) |
Property Value to Household Income Ratio in Wantagh
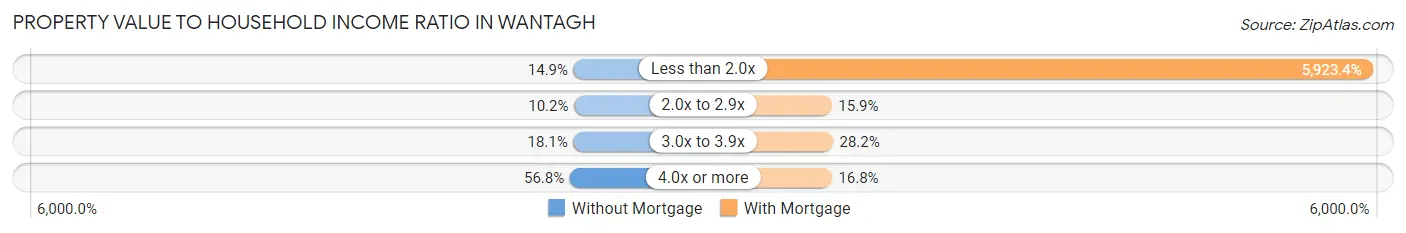
| Value-to-Income Ratio | Without Mortgage | With Mortgage |
| Less than 2.0x | 315 (14.9%) | 201,634 (5,923.4%) |
| 2.0x to 2.9x | 215 (10.2%) | 541 (15.9%) |
| 3.0x to 3.9x | 381 (18.1%) | 961 (28.2%) |
| 4.0x or more | 1,199 (56.8%) | 571 (16.8%) |
| Total | 2,110 (100.0%) | 3,404 (100.0%) |
Real Estate Taxes by Mortgage Status in Wantagh
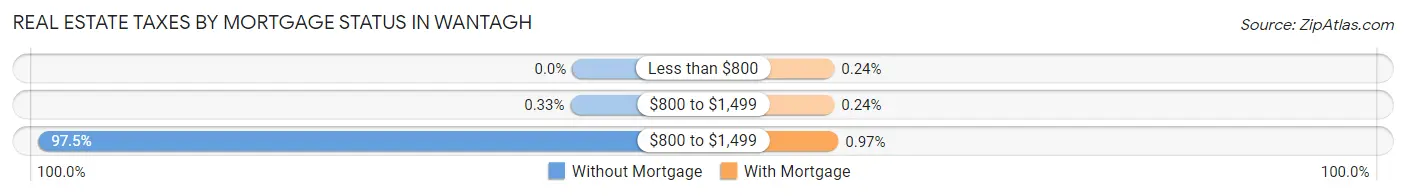
| Property Taxes | Without Mortgage | With Mortgage |
| Less than $800 | 0 (0.0%) | 8 (0.2%) |
| $800 to $1,499 | 7 (0.3%) | 8 (0.2%) |
| $800 to $1,499 | 2,057 (97.5%) | 33 (1.0%) |
| Total | 2,110 (100.0%) | 3,404 (100.0%) |
Health & Disability in Wantagh
Health Insurance Coverage by Age in Wantagh
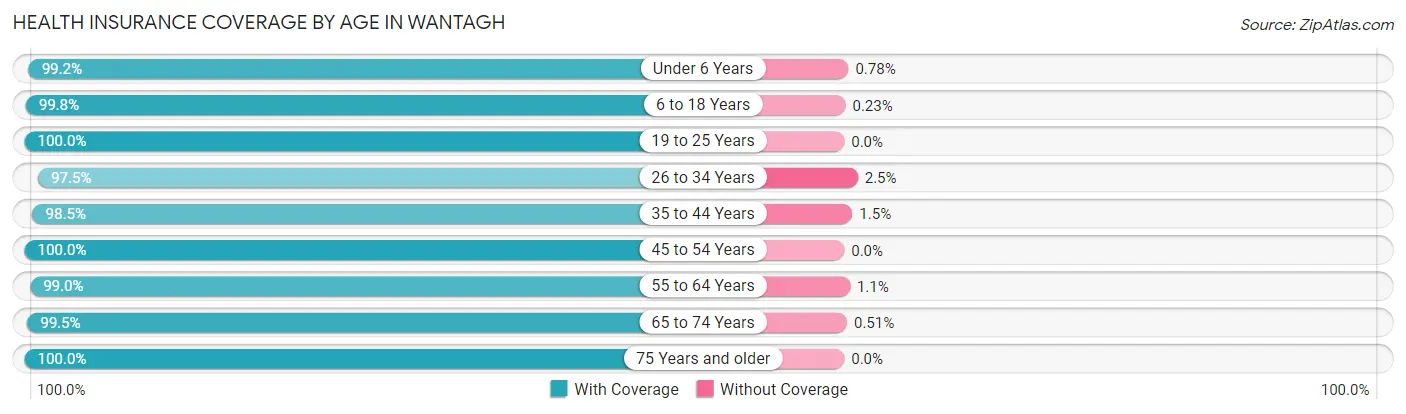
| Age Bracket | With Coverage | Without Coverage |
| Under 6 Years | 1,015 (99.2%) | 8 (0.8%) |
| 6 to 18 Years | 3,513 (99.8%) | 8 (0.2%) |
| 19 to 25 Years | 1,464 (100.0%) | 0 (0.0%) |
| 26 to 34 Years | 1,549 (97.5%) | 40 (2.5%) |
| 35 to 44 Years | 2,411 (98.5%) | 37 (1.5%) |
| 45 to 54 Years | 2,553 (100.0%) | 0 (0.0%) |
| 55 to 64 Years | 2,541 (99.0%) | 27 (1.1%) |
| 65 to 74 Years | 1,558 (99.5%) | 8 (0.5%) |
| 75 Years and older | 1,255 (100.0%) | 0 (0.0%) |
| Total | 17,859 (99.3%) | 128 (0.7%) |
Health Insurance Coverage by Citizenship Status in Wantagh
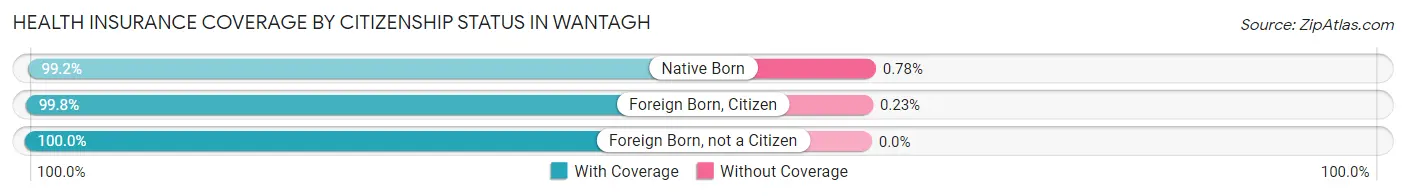
| Citizenship Status | With Coverage | Without Coverage |
| Native Born | 1,015 (99.2%) | 8 (0.8%) |
| Foreign Born, Citizen | 3,513 (99.8%) | 8 (0.2%) |
| Foreign Born, not a Citizen | 1,464 (100.0%) | 0 (0.0%) |
Health Insurance Coverage by Household Income in Wantagh
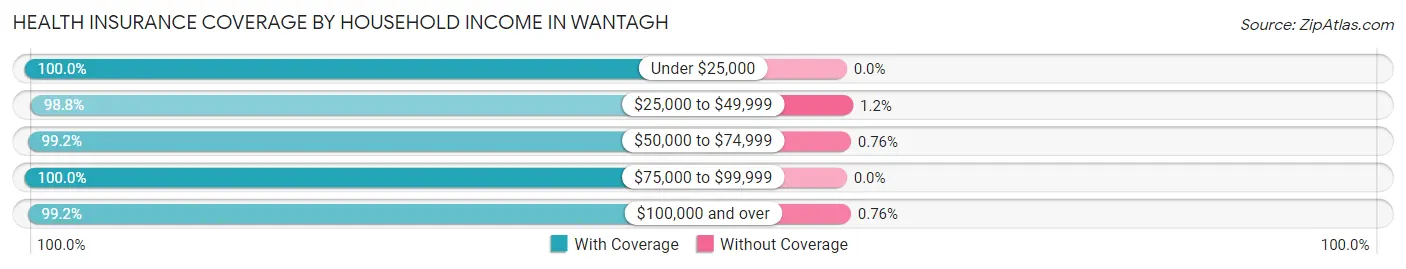
| Household Income | With Coverage | Without Coverage |
| Under $25,000 | 654 (100.0%) | 0 (0.0%) |
| $25,000 to $49,999 | 585 (98.8%) | 7 (1.2%) |
| $50,000 to $74,999 | 1,047 (99.2%) | 8 (0.8%) |
| $75,000 to $99,999 | 1,045 (100.0%) | 0 (0.0%) |
| $100,000 and over | 14,470 (99.2%) | 111 (0.8%) |
Public vs Private Health Insurance Coverage by Age in Wantagh
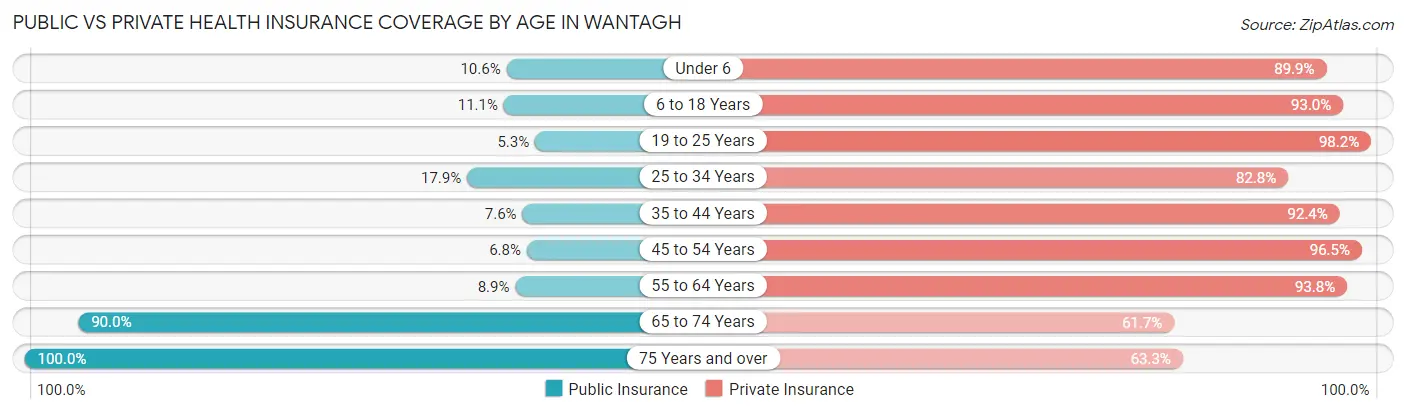
| Age Bracket | Public Insurance | Private Insurance |
| Under 6 | 108 (10.6%) | 920 (89.9%) |
| 6 to 18 Years | 389 (11.1%) | 3,276 (93.0%) |
| 19 to 25 Years | 77 (5.3%) | 1,438 (98.2%) |
| 25 to 34 Years | 284 (17.9%) | 1,316 (82.8%) |
| 35 to 44 Years | 186 (7.6%) | 2,262 (92.4%) |
| 45 to 54 Years | 173 (6.8%) | 2,464 (96.5%) |
| 55 to 64 Years | 229 (8.9%) | 2,408 (93.8%) |
| 65 to 74 Years | 1,410 (90.0%) | 966 (61.7%) |
| 75 Years and over | 1,255 (100.0%) | 794 (63.3%) |
| Total | 4,111 (22.9%) | 15,844 (88.1%) |
Disability Status by Sex by Age in Wantagh
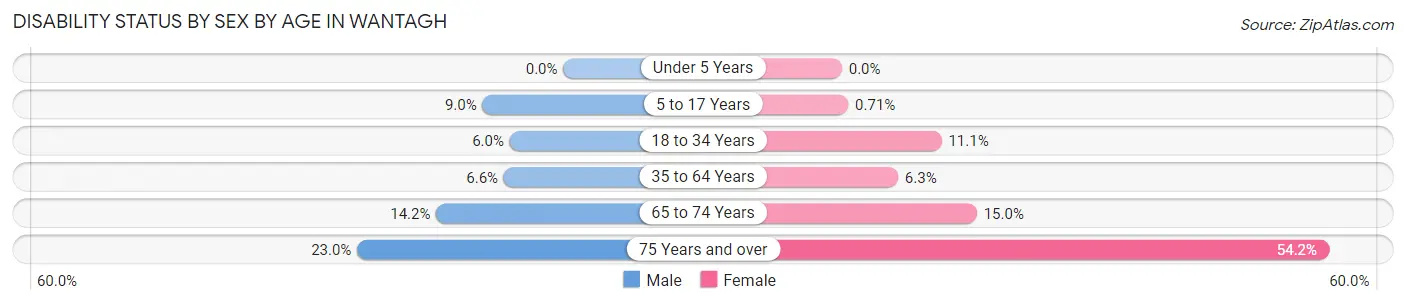
| Age Bracket | Male | Female |
| Under 5 Years | 0 (0.0%) | 0 (0.0%) |
| 5 to 17 Years | 199 (9.0%) | 10 (0.7%) |
| 18 to 34 Years | 98 (6.0%) | 170 (11.1%) |
| 35 to 64 Years | 250 (6.6%) | 237 (6.2%) |
| 65 to 74 Years | 102 (14.1%) | 127 (15.0%) |
| 75 Years and over | 104 (23.0%) | 435 (54.2%) |
Disability Class by Sex by Age in Wantagh
Disability Class: Hearing Difficulty
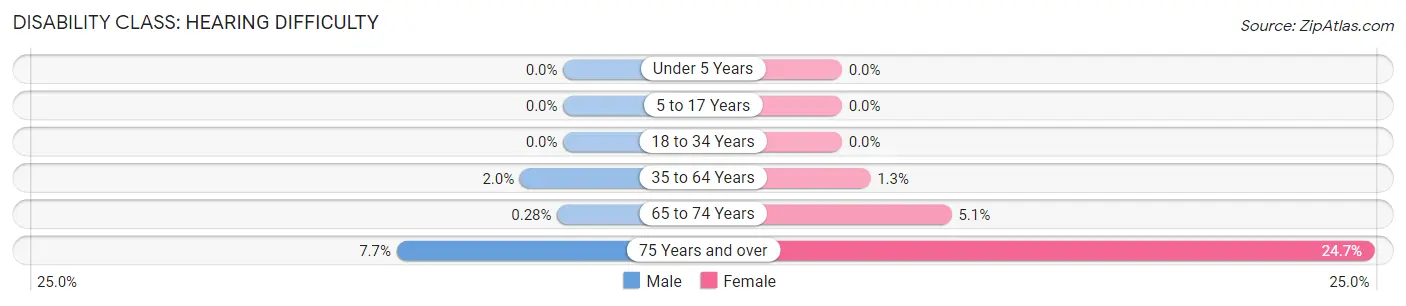
| Age Bracket | Male | Female |
| Under 5 Years | 0 (0.0%) | 0 (0.0%) |
| 5 to 17 Years | 0 (0.0%) | 0 (0.0%) |
| 18 to 34 Years | 0 (0.0%) | 0 (0.0%) |
| 35 to 64 Years | 76 (2.0%) | 50 (1.3%) |
| 65 to 74 Years | 2 (0.3%) | 43 (5.1%) |
| 75 Years and over | 35 (7.7%) | 198 (24.7%) |
Disability Class: Vision Difficulty
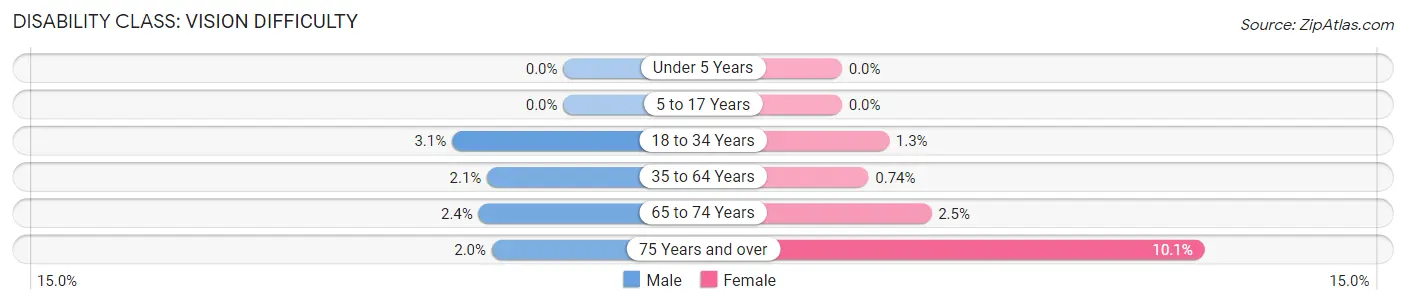
| Age Bracket | Male | Female |
| Under 5 Years | 0 (0.0%) | 0 (0.0%) |
| 5 to 17 Years | 0 (0.0%) | 0 (0.0%) |
| 18 to 34 Years | 51 (3.1%) | 20 (1.3%) |
| 35 to 64 Years | 80 (2.1%) | 28 (0.7%) |
| 65 to 74 Years | 17 (2.4%) | 21 (2.5%) |
| 75 Years and over | 9 (2.0%) | 81 (10.1%) |
Disability Class: Cognitive Difficulty
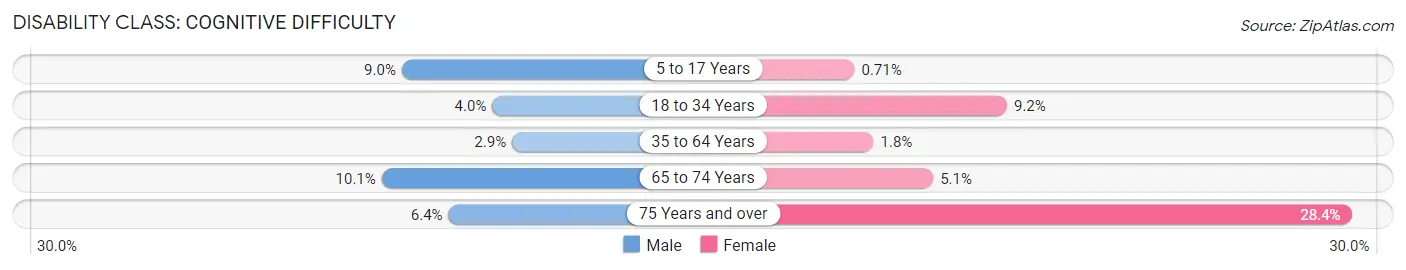
| Age Bracket | Male | Female |
| 5 to 17 Years | 199 (9.0%) | 10 (0.7%) |
| 18 to 34 Years | 65 (4.0%) | 141 (9.2%) |
| 35 to 64 Years | 108 (2.9%) | 67 (1.8%) |
| 65 to 74 Years | 73 (10.1%) | 43 (5.1%) |
| 75 Years and over | 29 (6.4%) | 228 (28.4%) |
Disability Class: Ambulatory Difficulty
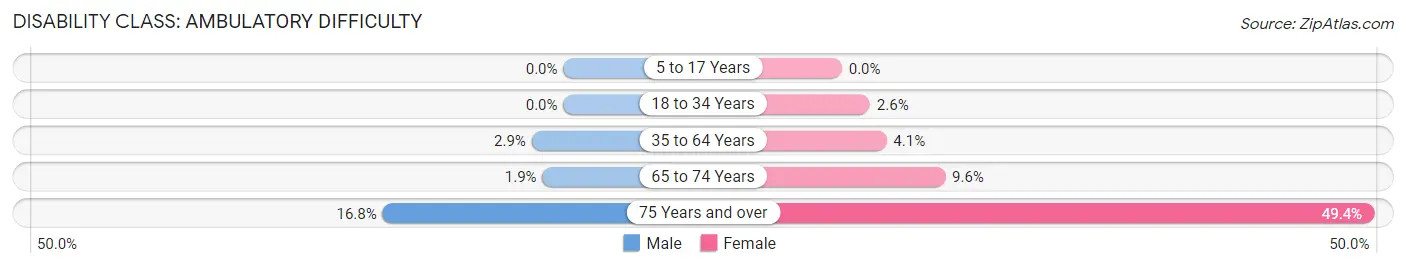
| Age Bracket | Male | Female |
| 5 to 17 Years | 0 (0.0%) | 0 (0.0%) |
| 18 to 34 Years | 0 (0.0%) | 40 (2.6%) |
| 35 to 64 Years | 111 (2.9%) | 157 (4.1%) |
| 65 to 74 Years | 14 (1.9%) | 81 (9.6%) |
| 75 Years and over | 76 (16.8%) | 396 (49.4%) |
Disability Class: Self-Care Difficulty
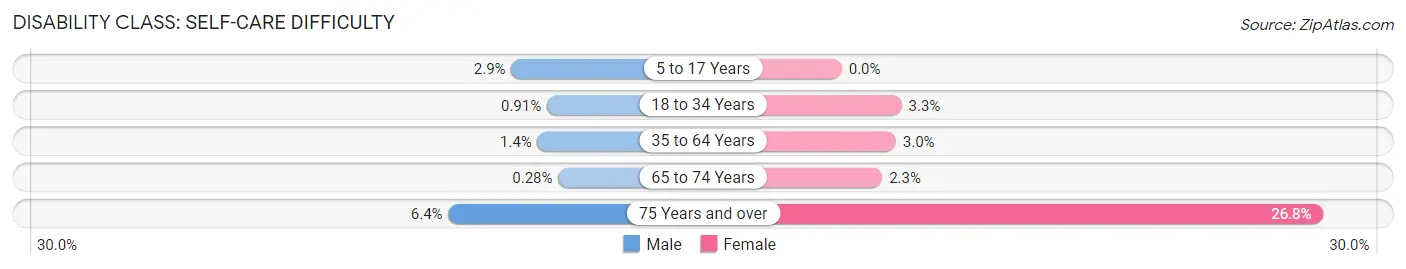
| Age Bracket | Male | Female |
| 5 to 17 Years | 64 (2.9%) | 0 (0.0%) |
| 18 to 34 Years | 15 (0.9%) | 51 (3.3%) |
| 35 to 64 Years | 54 (1.4%) | 114 (3.0%) |
| 65 to 74 Years | 2 (0.3%) | 19 (2.2%) |
| 75 Years and over | 29 (6.4%) | 215 (26.8%) |
Technology Access in Wantagh
Computing Device Access in Wantagh
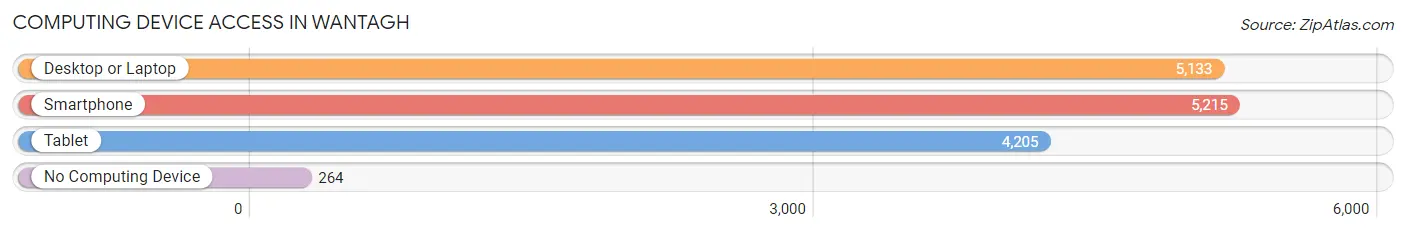
| Device Type | # Households | % Households |
| Desktop or Laptop | 5,133 | 88.3% |
| Smartphone | 5,215 | 89.7% |
| Tablet | 4,205 | 72.3% |
| No Computing Device | 264 | 4.5% |
| Total | 5,816 | 100.0% |
Internet Access in Wantagh
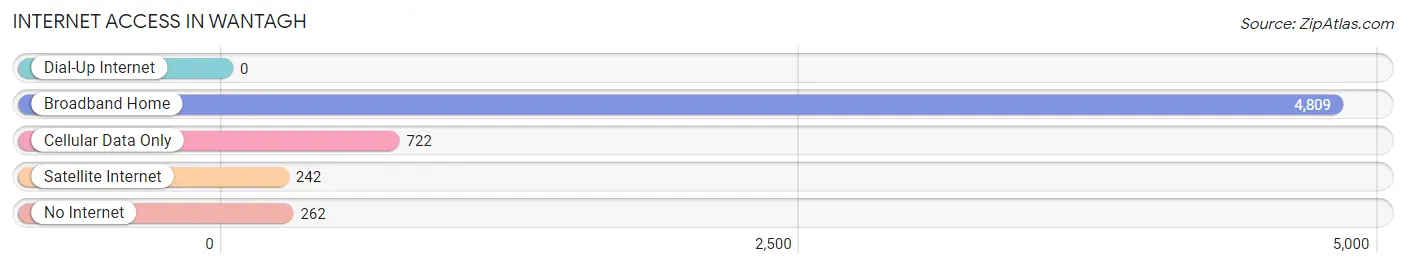
| Internet Type | # Households | % Households |
| Dial-Up Internet | 0 | 0.0% |
| Broadband Home | 4,809 | 82.7% |
| Cellular Data Only | 722 | 12.4% |
| Satellite Internet | 242 | 4.2% |
| No Internet | 262 | 4.5% |
| Total | 5,816 | 100.0% |
Wantagh Summary
History
The history of Wantagh, New York dates back to the 1600s when the area was inhabited by the Meroke Indians. The Meroke Indians were a part of the Algonquin tribe and were known for their fishing and hunting skills. The Meroke Indians were eventually displaced by the English settlers in the late 1600s. The area was then known as Jerusalem, and was part of the Town of Hempstead. In the early 1800s, the area was renamed Wantagh, after the Meroke Indian Chief, Wantagh.
The area was primarily a farming community until the late 1800s when the Long Island Rail Road was extended to Wantagh. This allowed for the development of the area and the population began to grow. In the early 1900s, the area was known for its potato farms and was a popular destination for summer vacationers.
In the 1950s, the area began to experience rapid growth as more people moved to the area. This growth was fueled by the construction of the Wantagh Parkway, which connected Wantagh to the rest of Long Island. The area also experienced a boom in the construction of single-family homes and shopping centers.
Geography
Wantagh is located in Nassau County, New York, on the south shore of Long Island. It is bordered by the towns of Hempstead to the west, Oyster Bay to the east, and the Atlantic Ocean to the south. The area is approximately 10 miles long and 2 miles wide.
The terrain of Wantagh is mostly flat, with some rolling hills. The area is home to several parks, including Jones Beach State Park, which is located on the Atlantic Ocean. The area is also home to several lakes, including Wantagh Lake and Massapequa Lake.
Economy
The economy of Wantagh is largely based on tourism and retail. The area is home to several shopping centers, including the Wantagh Shopping Center and the Wantagh Town Center. The area is also home to several restaurants, bars, and other entertainment venues.
The area is also home to several manufacturing and industrial businesses. These businesses include aerospace, electronics, and medical device companies.
Demographics
As of the 2010 census, the population of Wantagh was 18,871. The population is primarily white (90.2%), with a small percentage of African Americans (3.2%), Asians (2.7%), and Hispanics (2.3%). The median household income is $97,845, and the median age is 43.
Wantagh is a predominantly residential area, with most of the population living in single-family homes. The area is also home to several schools, including Wantagh High School and Wantagh Middle School.
Common Questions
What is Per Capita Income in Wantagh?
Per Capita income in Wantagh is $63,636.
What is the Median Family Income in Wantagh?
Median Family Income in Wantagh is $192,464.
What is the Median Household income in Wantagh?
Median Household Income in Wantagh is $180,167.
What is Income or Wage Gap in Wantagh?
Income or Wage Gap in Wantagh is 35.4%.
Women in Wantagh earn 64.6 cents for every dollar earned by a man.
What is Inequality or Gini Index in Wantagh?
Inequality or Gini Index in Wantagh is 0.38.
What is the Total Population of Wantagh?
Total Population of Wantagh is 17,995.
What is the Total Male Population of Wantagh?
Total Male Population of Wantagh is 9,168.
What is the Total Female Population of Wantagh?
Total Female Population of Wantagh is 8,827.
What is the Ratio of Males per 100 Females in Wantagh?
There are 103.86 Males per 100 Females in Wantagh.
What is the Ratio of Females per 100 Males in Wantagh?
There are 96.28 Females per 100 Males in Wantagh.
What is the Median Population Age in Wantagh?
Median Population Age in Wantagh is 40.8 Years.
What is the Average Family Size in Wantagh
Average Family Size in Wantagh is 3.4 People.
What is the Average Household Size in Wantagh
Average Household Size in Wantagh is 3.1 People.
How Large is the Labor Force in Wantagh?
There are 9,305 People in the Labor Forcein in Wantagh.
What is the Percentage of People in the Labor Force in Wantagh?
65.0% of People are in the Labor Force in Wantagh.
What is the Unemployment Rate in Wantagh?
Unemployment Rate in Wantagh is 3.7%.