Wheatley Heights, NY Map & Demographics
Wheatley Heights Map
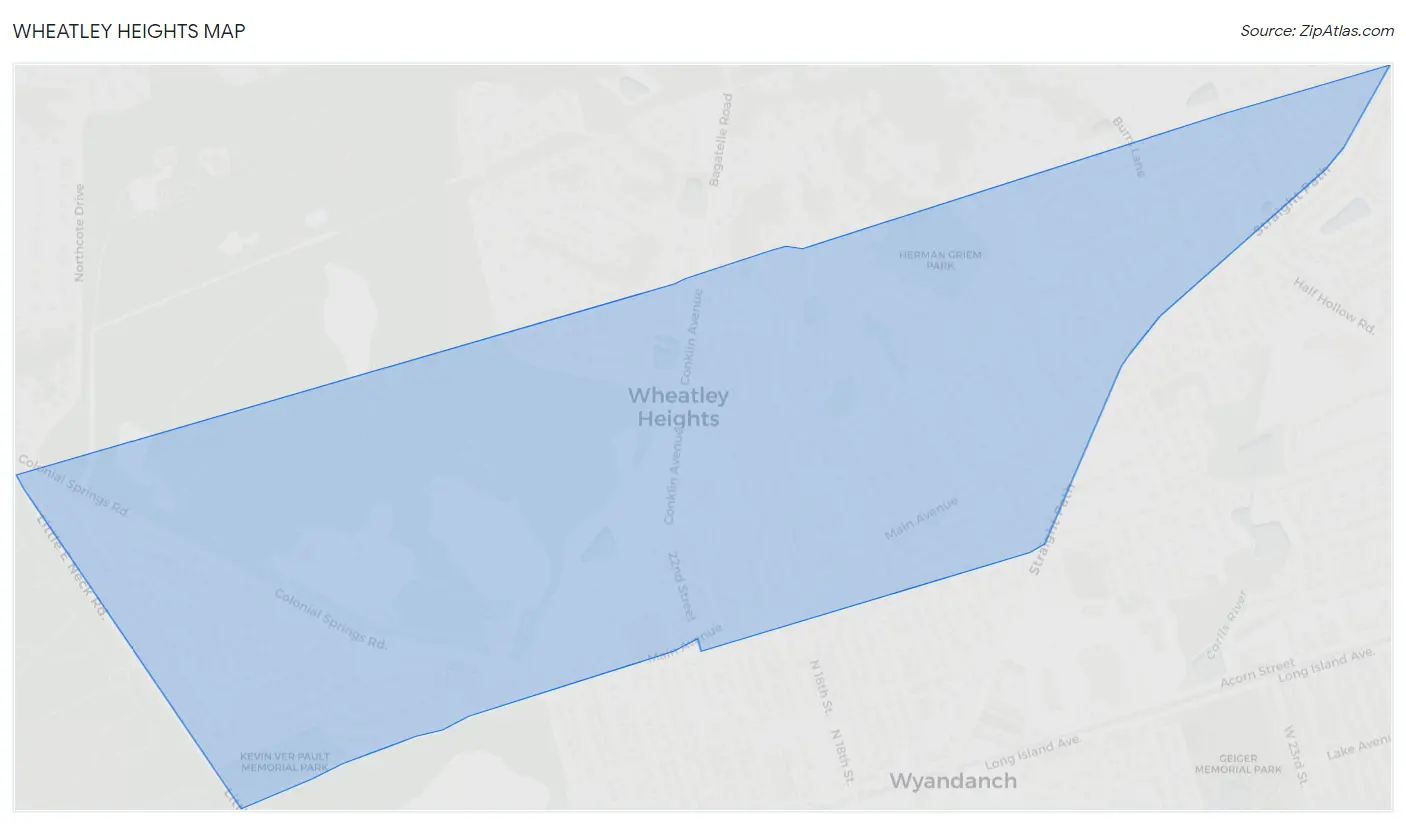
Wheatley Heights Overview
$39,881
PER CAPITA INCOME
$141,229
AVG FAMILY INCOME
$133,125
AVG HOUSEHOLD INCOME
2.9%
WAGE / INCOME GAP [ % ]
97.1¢/ $1
WAGE / INCOME GAP [ $ ]
0.37
INEQUALITY / GINI INDEX
5,338
TOTAL POPULATION
2,498
MALE POPULATION
2,840
FEMALE POPULATION
87.96
MALES / 100 FEMALES
113.69
FEMALES / 100 MALES
36.9
MEDIAN AGE
4.0
AVG FAMILY SIZE
3.5
AVG HOUSEHOLD SIZE
2,697
LABOR FORCE [ PEOPLE ]
64.5%
PERCENT IN LABOR FORCE
3.1%
UNEMPLOYMENT RATE
Wheatley Heights Area Codes
Income in Wheatley Heights
Income Overview in Wheatley Heights
Per Capita Income in Wheatley Heights is $39,881, while median incomes of families and households are $141,229 and $133,125 respectively.
| Characteristic | Number | Measure |
| Per Capita Income | 5,338 | $39,881 |
| Median Family Income | 1,135 | $141,229 |
| Mean Family Income | 1,135 | $151,405 |
| Median Household Income | 1,521 | $133,125 |
| Mean Household Income | 1,521 | $132,305 |
| Income Deficit | 1,135 | $0 |
| Wage / Income Gap (%) | 5,338 | 2.92% |
| Wage / Income Gap ($) | 5,338 | 97.08¢ per $1 |
| Gini / Inequality Index | 5,338 | 0.37 |
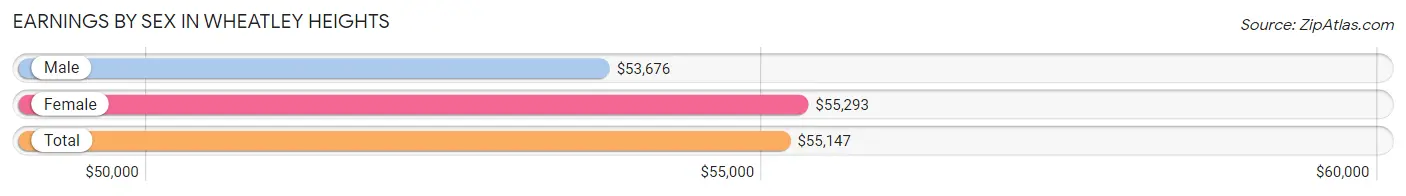
Earnings by Sex in Wheatley Heights
Average Earnings in Wheatley Heights are $55,147, $53,676 for men and $55,293 for women, a difference of 2.9%.
| Sex | Number | Average Earnings |
| Male | 1,122 (40.2%) | $53,676 |
| Female | 1,671 (59.8%) | $55,293 |
| Total | 2,793 (100.0%) | $55,147 |
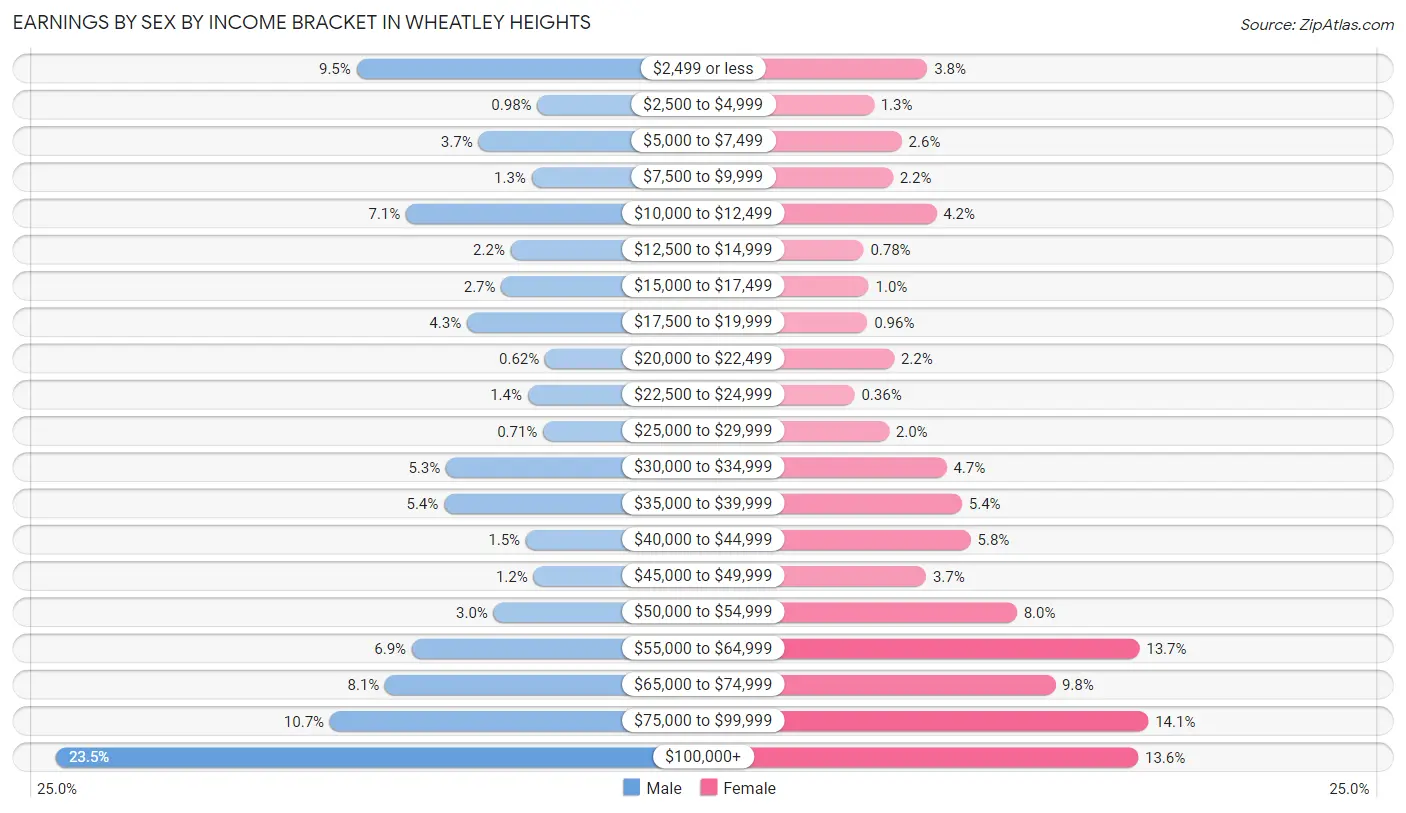
Earnings by Sex by Income Bracket in Wheatley Heights
The most common earnings brackets in Wheatley Heights are $100,000+ for men (264 | 23.5%) and $75,000 to $99,999 for women (236 | 14.1%).
| Income | Male | Female |
| $2,499 or less | 106 (9.5%) | 63 (3.8%) |
| $2,500 to $4,999 | 11 (1.0%) | 21 (1.3%) |
| $5,000 to $7,499 | 42 (3.7%) | 43 (2.6%) |
| $7,500 to $9,999 | 14 (1.3%) | 36 (2.1%) |
| $10,000 to $12,499 | 80 (7.1%) | 70 (4.2%) |
| $12,500 to $14,999 | 25 (2.2%) | 13 (0.8%) |
| $15,000 to $17,499 | 30 (2.7%) | 17 (1.0%) |
| $17,500 to $19,999 | 48 (4.3%) | 16 (1.0%) |
| $20,000 to $22,499 | 7 (0.6%) | 37 (2.2%) |
| $22,500 to $24,999 | 16 (1.4%) | 6 (0.4%) |
| $25,000 to $29,999 | 8 (0.7%) | 33 (2.0%) |
| $30,000 to $34,999 | 59 (5.3%) | 78 (4.7%) |
| $35,000 to $39,999 | 60 (5.3%) | 90 (5.4%) |
| $40,000 to $44,999 | 17 (1.5%) | 97 (5.8%) |
| $45,000 to $49,999 | 13 (1.2%) | 62 (3.7%) |
| $50,000 to $54,999 | 34 (3.0%) | 133 (8.0%) |
| $55,000 to $64,999 | 77 (6.9%) | 229 (13.7%) |
| $65,000 to $74,999 | 91 (8.1%) | 163 (9.8%) |
| $75,000 to $99,999 | 120 (10.7%) | 236 (14.1%) |
| $100,000+ | 264 (23.5%) | 228 (13.6%) |
| Total | 1,122 (100.0%) | 1,671 (100.0%) |
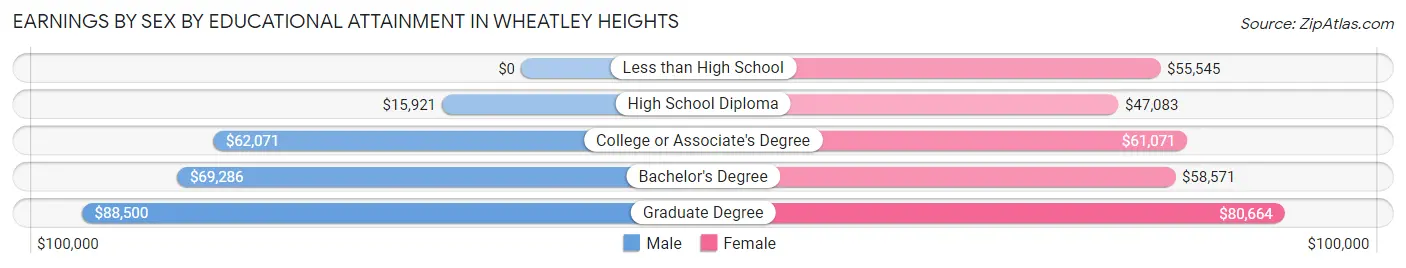
Earnings by Sex by Educational Attainment in Wheatley Heights
Average earnings in Wheatley Heights are $60,250 for men and $56,036 for women, a difference of 7.0%. Men with an educational attainment of graduate degree enjoy the highest average annual earnings of $88,500, while those with high school diploma education earn the least with $15,921. Women with an educational attainment of graduate degree earn the most with the average annual earnings of $80,664, while those with high school diploma education have the smallest earnings of $47,083.
| Educational Attainment | Male Income | Female Income |
| Less than High School | - | - |
| High School Diploma | $15,921 | $47,083 |
| College or Associate's Degree | $62,071 | $61,071 |
| Bachelor's Degree | $69,286 | $58,571 |
| Graduate Degree | $88,500 | $80,664 |
| Total | $60,250 | $56,036 |
Family Income in Wheatley Heights
Family Income Brackets in Wheatley Heights
According to the Wheatley Heights family income data, there are 363 families falling into the $100,000 to $149,999 income range, which is the most common income bracket and makes up 32.0% of all families.
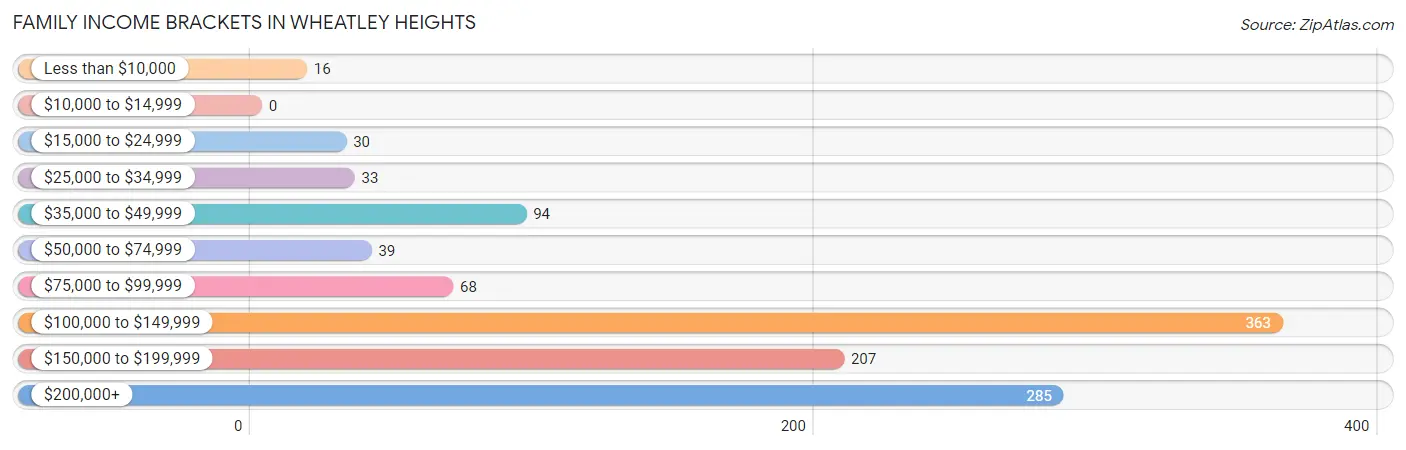
| Income Bracket | # Families | % Families |
| Less than $10,000 | 16 | 1.4% |
| $10,000 to $14,999 | 0 | 0.0% |
| $15,000 to $24,999 | 30 | 2.6% |
| $25,000 to $34,999 | 33 | 2.9% |
| $35,000 to $49,999 | 94 | 8.3% |
| $50,000 to $74,999 | 39 | 3.4% |
| $75,000 to $99,999 | 68 | 6.0% |
| $100,000 to $149,999 | 363 | 32.0% |
| $150,000 to $199,999 | 207 | 18.2% |
| $200,000+ | 285 | 25.1% |
Family Income by Famaliy Size in Wheatley Heights
4-person families (203 | 17.9%) account for the highest median family income in Wheatley Heights with $193,490 per family, while 2-person families (424 | 37.4%) have the highest median income of $56,750 per family member.
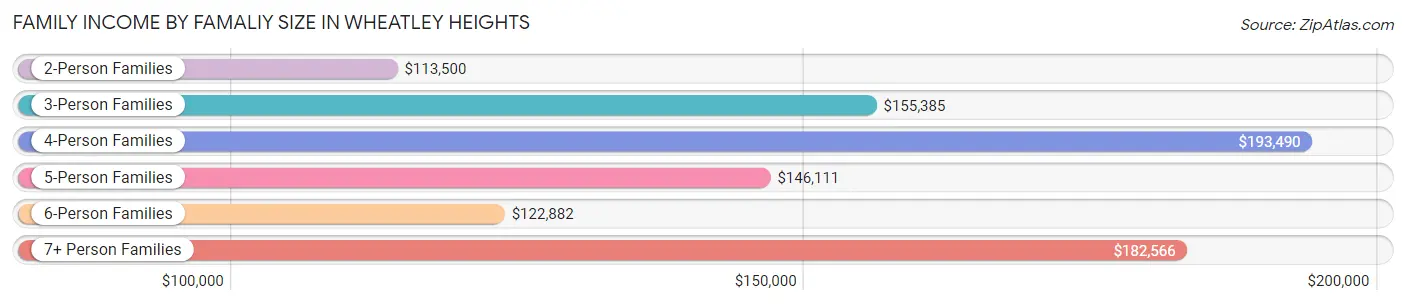
| Income Bracket | # Families | Median Income |
| 2-Person Families | 424 (37.4%) | $113,500 |
| 3-Person Families | 236 (20.8%) | $155,385 |
| 4-Person Families | 203 (17.9%) | $193,490 |
| 5-Person Families | 120 (10.6%) | $146,111 |
| 6-Person Families | 61 (5.4%) | $122,882 |
| 7+ Person Families | 91 (8.0%) | $182,566 |
| Total | 1,135 (100.0%) | $141,229 |
Family Income by Number of Earners in Wheatley Heights
The median family income in Wheatley Heights is $141,229, with families comprising 3+ earners (263) having the highest median family income of $192,760, while families with no earners (158) have the lowest median family income of $47,031, accounting for 23.2% and 13.9% of families, respectively.
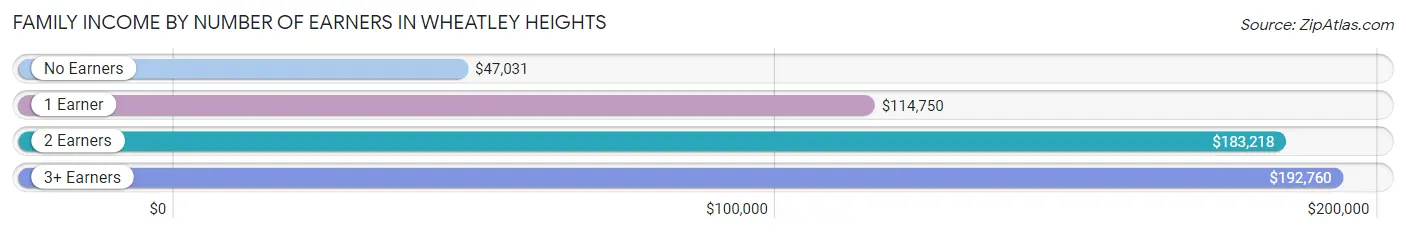
| Number of Earners | # Families | Median Income |
| No Earners | 158 (13.9%) | $47,031 |
| 1 Earner | 259 (22.8%) | $114,750 |
| 2 Earners | 455 (40.1%) | $183,218 |
| 3+ Earners | 263 (23.2%) | $192,760 |
| Total | 1,135 (100.0%) | $141,229 |
Household Income in Wheatley Heights
Household Income Brackets in Wheatley Heights
With 353 households falling in the category, the $200,000+ income range is the most frequent in Wheatley Heights, accounting for 23.2% of all households. In contrast, only 24 households (1.6%) fall into the less than $10,000 income bracket, making it the least populous group.
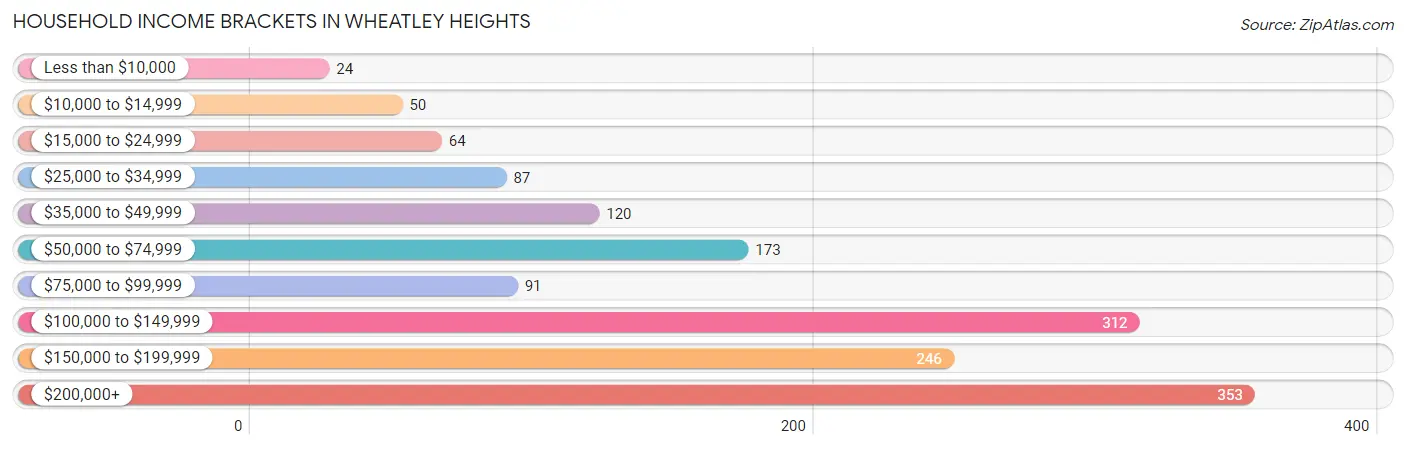
| Income Bracket | # Households | % Households |
| Less than $10,000 | 24 | 1.6% |
| $10,000 to $14,999 | 50 | 3.3% |
| $15,000 to $24,999 | 64 | 4.2% |
| $25,000 to $34,999 | 87 | 5.7% |
| $35,000 to $49,999 | 120 | 7.9% |
| $50,000 to $74,999 | 173 | 11.4% |
| $75,000 to $99,999 | 91 | 6.0% |
| $100,000 to $149,999 | 312 | 20.5% |
| $150,000 to $199,999 | 246 | 16.2% |
| $200,000+ | 353 | 23.2% |
Household Income by Householder Age in Wheatley Heights
The median household income in Wheatley Heights is $133,125, with the highest median household income of $165,703 found in the 45 to 64 years age bracket for the primary householder. A total of 704 households (46.3%) fall into this category.
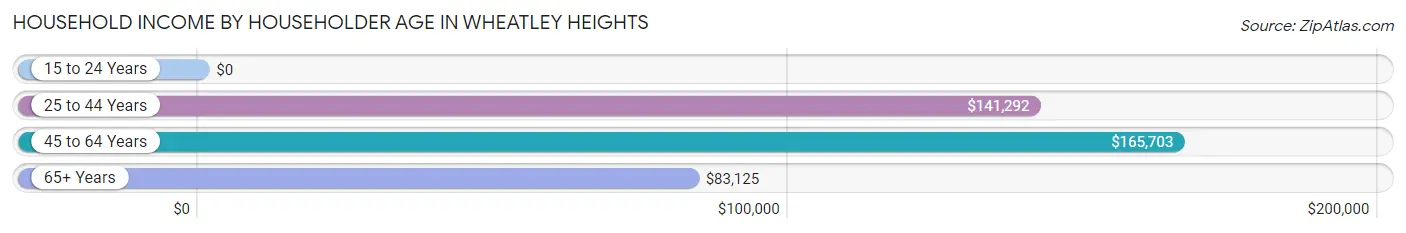
| Income Bracket | # Households | Median Income |
| 15 to 24 Years | 0 (0.0%) | $0 |
| 25 to 44 Years | 390 (25.6%) | $141,292 |
| 45 to 64 Years | 704 (46.3%) | $165,703 |
| 65+ Years | 427 (28.1%) | $83,125 |
| Total | 1,521 (100.0%) | $133,125 |
Poverty in Wheatley Heights
Income Below Poverty by Sex and Age in Wheatley Heights
With 6.7% poverty level for males and 5.4% for females among the residents of Wheatley Heights, 15 year old males and 12 to 14 year old females are the most vulnerable to poverty, with 23 males (71.9%) and 6 females (14.6%) in their respective age groups living below the poverty level.
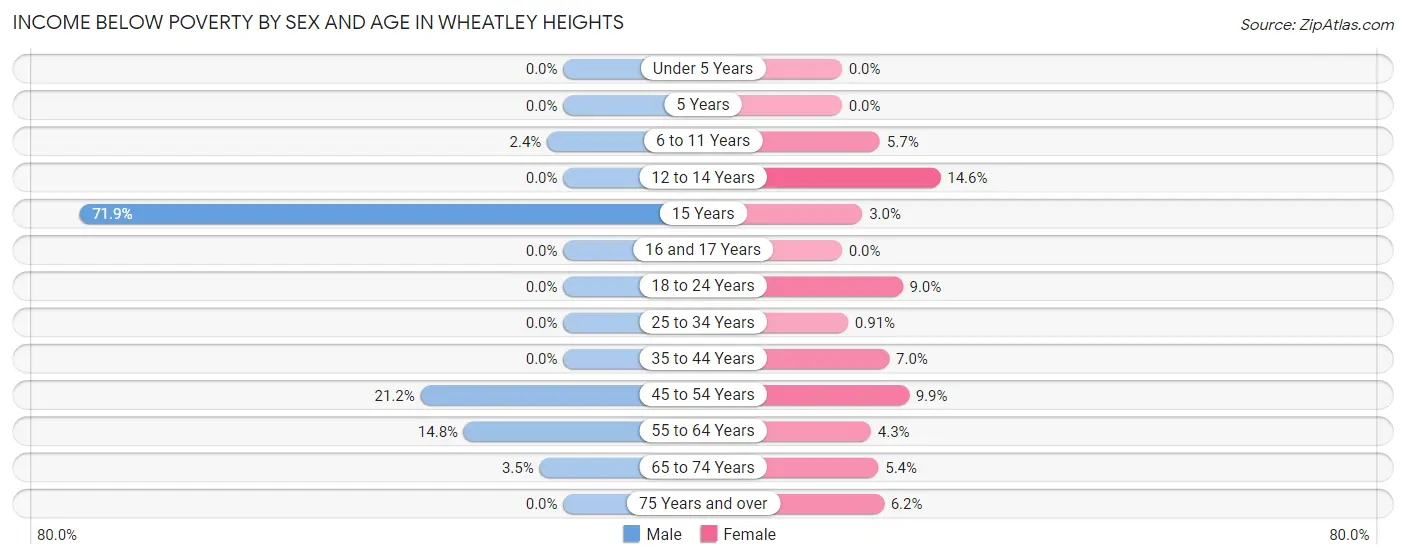
| Age Bracket | Male | Female |
| Under 5 Years | 0 (0.0%) | 0 (0.0%) |
| 5 Years | 0 (0.0%) | 0 (0.0%) |
| 6 to 11 Years | 6 (2.4%) | 12 (5.7%) |
| 12 to 14 Years | 0 (0.0%) | 6 (14.6%) |
| 15 Years | 23 (71.9%) | 1 (3.0%) |
| 16 and 17 Years | 0 (0.0%) | 0 (0.0%) |
| 18 to 24 Years | 0 (0.0%) | 12 (9.0%) |
| 25 to 34 Years | 0 (0.0%) | 4 (0.9%) |
| 35 to 44 Years | 0 (0.0%) | 38 (7.0%) |
| 45 to 54 Years | 77 (21.2%) | 36 (9.9%) |
| 55 to 64 Years | 52 (14.8%) | 16 (4.3%) |
| 65 to 74 Years | 6 (3.5%) | 13 (5.4%) |
| 75 Years and over | 0 (0.0%) | 13 (6.2%) |
| Total | 164 (6.7%) | 151 (5.4%) |
Income Above Poverty by Sex and Age in Wheatley Heights
According to the poverty statistics in Wheatley Heights, males aged under 5 years and females aged under 5 years are the age groups that are most secure financially, with 100.0% of males and 100.0% of females in these age groups living above the poverty line.
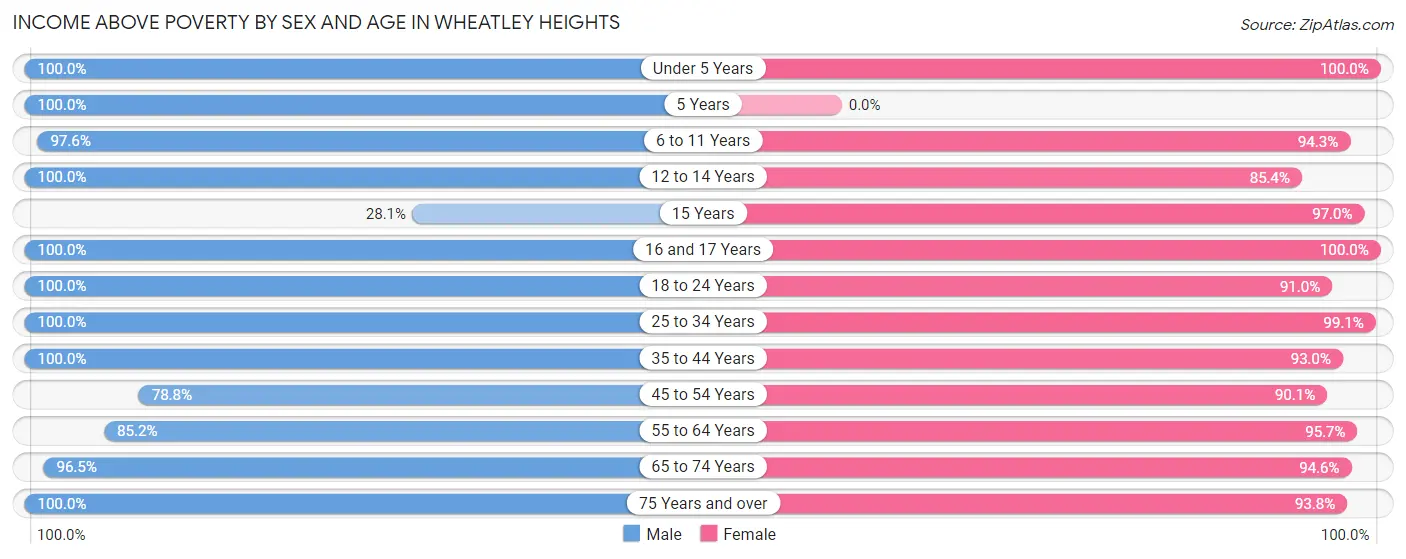
| Age Bracket | Male | Female |
| Under 5 Years | 192 (100.0%) | 87 (100.0%) |
| 5 Years | 65 (100.0%) | 0 (0.0%) |
| 6 to 11 Years | 244 (97.6%) | 200 (94.3%) |
| 12 to 14 Years | 137 (100.0%) | 35 (85.4%) |
| 15 Years | 9 (28.1%) | 32 (97.0%) |
| 16 and 17 Years | 67 (100.0%) | 123 (100.0%) |
| 18 to 24 Years | 210 (100.0%) | 121 (91.0%) |
| 25 to 34 Years | 331 (100.0%) | 434 (99.1%) |
| 35 to 44 Years | 174 (100.0%) | 503 (93.0%) |
| 45 to 54 Years | 286 (78.8%) | 326 (90.1%) |
| 55 to 64 Years | 300 (85.2%) | 355 (95.7%) |
| 65 to 74 Years | 164 (96.5%) | 227 (94.6%) |
| 75 Years and over | 98 (100.0%) | 196 (93.8%) |
| Total | 2,277 (93.3%) | 2,639 (94.6%) |
Income Below Poverty Among Married-Couple Families in Wheatley Heights
The poverty statistics for married-couple families in Wheatley Heights show that 1.6% or 14 of the total 859 families live below the poverty line. Families with 1 or 2 children have the highest poverty rate of 2.9%, comprising of 7 families. On the other hand, families with 3 or 4 children have the lowest poverty rate of 0.0%, which includes 0 families.
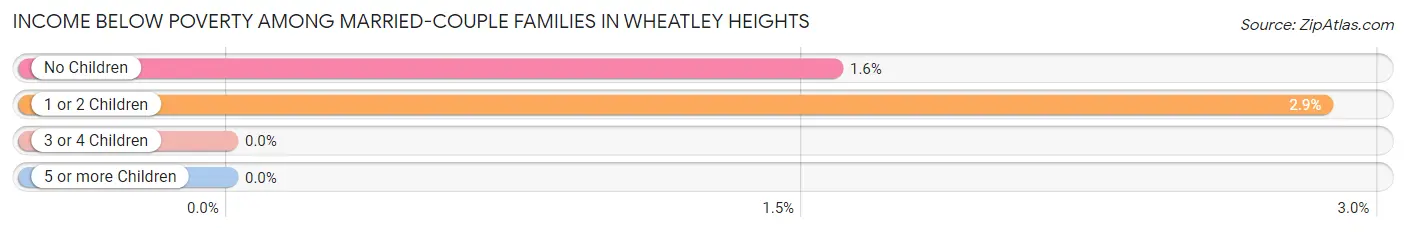
| Children | Above Poverty | Below Poverty |
| No Children | 437 (98.4%) | 7 (1.6%) |
| 1 or 2 Children | 238 (97.1%) | 7 (2.9%) |
| 3 or 4 Children | 136 (100.0%) | 0 (0.0%) |
| 5 or more Children | 34 (100.0%) | 0 (0.0%) |
| Total | 845 (98.4%) | 14 (1.6%) |
Income Below Poverty Among Single-Parent Households in Wheatley Heights
According to the poverty data in Wheatley Heights, 7.0% or 3 single-father households and 2.6% or 6 single-mother households are living below the poverty line. Among single-father households, those with 1 or 2 children have the highest poverty rate, with 3 households (30.0%) experiencing poverty. Likewise, among single-mother households, those with no children have the highest poverty rate, with 6 households (3.5%) falling below the poverty line.
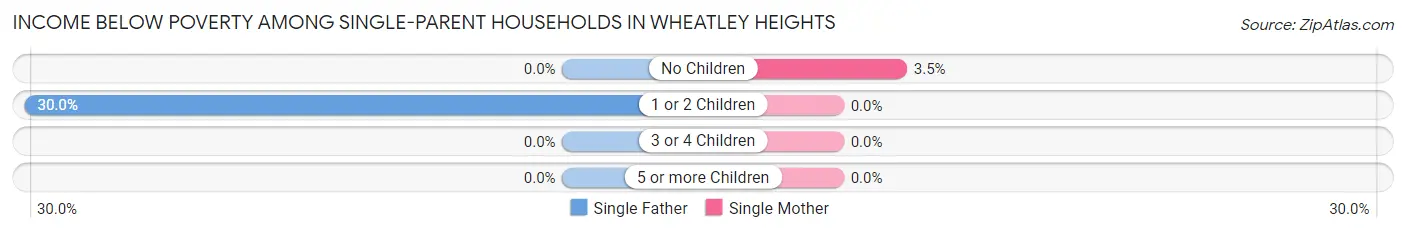
| Children | Single Father | Single Mother |
| No Children | 0 (0.0%) | 6 (3.5%) |
| 1 or 2 Children | 3 (30.0%) | 0 (0.0%) |
| 3 or 4 Children | 0 (0.0%) | 0 (0.0%) |
| 5 or more Children | 0 (0.0%) | 0 (0.0%) |
| Total | 3 (7.0%) | 6 (2.6%) |
Income Below Poverty Among Married-Couple vs Single-Parent Households in Wheatley Heights
The poverty data for Wheatley Heights shows that 14 of the married-couple family households (1.6%) and 9 of the single-parent households (3.3%) are living below the poverty level. Within the married-couple family households, those with 1 or 2 children have the highest poverty rate, with 7 households (2.9%) falling below the poverty line. Among the single-parent households, those with 1 or 2 children have the highest poverty rate, with 3 household (5.4%) living below poverty.
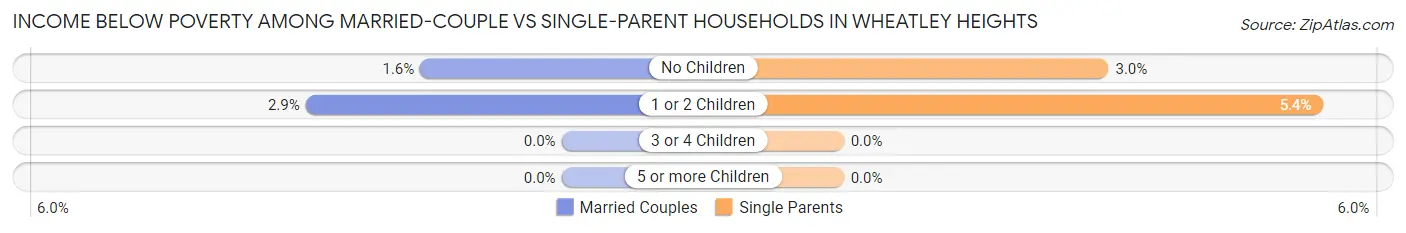
| Children | Married-Couple Families | Single-Parent Households |
| No Children | 7 (1.6%) | 6 (3.0%) |
| 1 or 2 Children | 7 (2.9%) | 3 (5.4%) |
| 3 or 4 Children | 0 (0.0%) | 0 (0.0%) |
| 5 or more Children | 0 (0.0%) | 0 (0.0%) |
| Total | 14 (1.6%) | 9 (3.3%) |
Race in Wheatley Heights
The most populous races in Wheatley Heights are Black / African American (3,064 | 57.4%), White / Caucasian (1,269 | 23.8%), and Hispanic or Latino (599 | 11.2%).
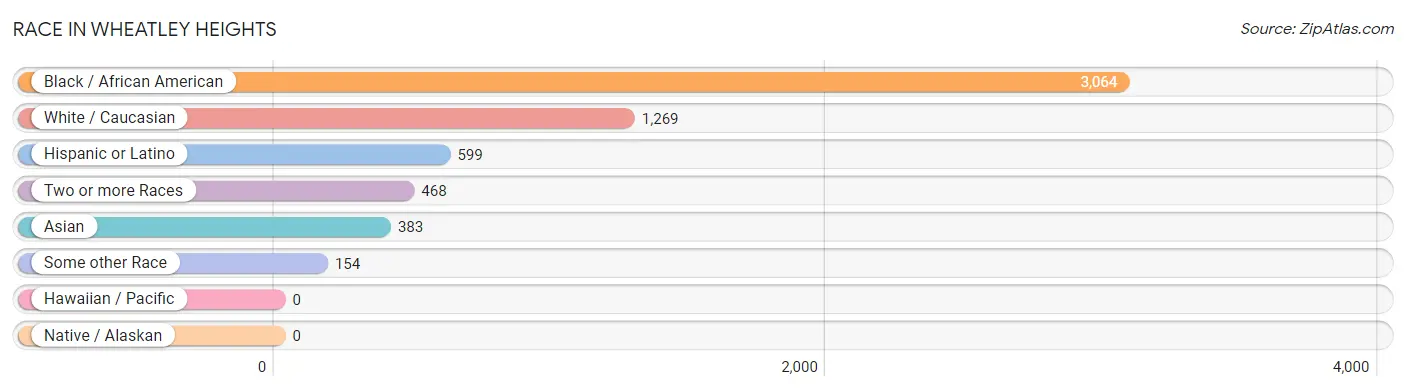
| Race | # Population | % Population |
| Asian | 383 | 7.2% |
| Black / African American | 3,064 | 57.4% |
| Hawaiian / Pacific | 0 | 0.0% |
| Hispanic or Latino | 599 | 11.2% |
| Native / Alaskan | 0 | 0.0% |
| White / Caucasian | 1,269 | 23.8% |
| Two or more Races | 468 | 8.8% |
| Some other Race | 154 | 2.9% |
| Total | 5,338 | 100.0% |
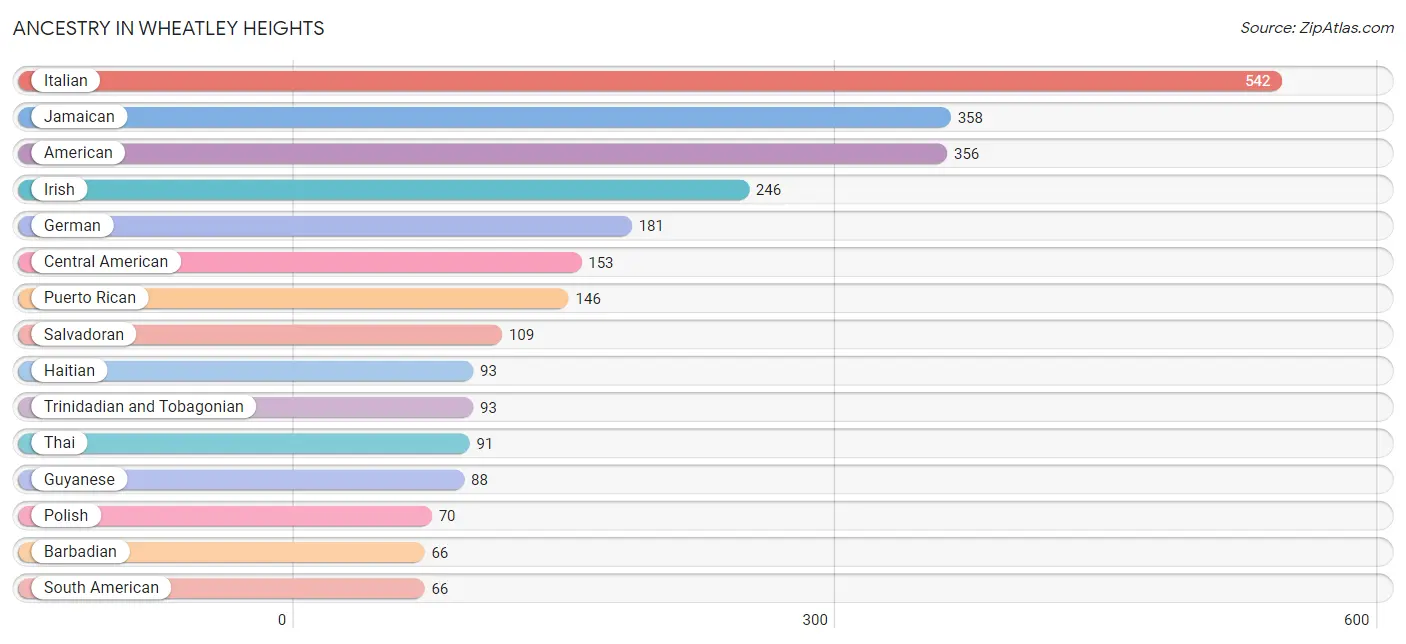
Ancestry in Wheatley Heights
The most populous ancestries reported in Wheatley Heights are Italian (542 | 10.2%), Jamaican (358 | 6.7%), American (356 | 6.7%), Irish (246 | 4.6%), and German (181 | 3.4%), together accounting for 31.5% of all Wheatley Heights residents.
| Ancestry | # Population | % Population |
| American | 356 | 6.7% |
| Arab | 36 | 0.7% |
| Austrian | 28 | 0.5% |
| Barbadian | 66 | 1.2% |
| Bermudan | 49 | 0.9% |
| Burmese | 12 | 0.2% |
| Central American | 153 | 2.9% |
| Cherokee | 29 | 0.5% |
| Chilean | 7 | 0.1% |
| Colombian | 54 | 1.0% |
| Croatian | 24 | 0.4% |
| Cuban | 32 | 0.6% |
| Czechoslovakian | 15 | 0.3% |
| Danish | 4 | 0.1% |
| Dominican | 27 | 0.5% |
| Dutch | 13 | 0.2% |
| Dutch West Indian | 6 | 0.1% |
| Eastern European | 13 | 0.2% |
| Egyptian | 6 | 0.1% |
| English | 43 | 0.8% |
| Finnish | 12 | 0.2% |
| French | 12 | 0.2% |
| French Canadian | 13 | 0.2% |
| German | 181 | 3.4% |
| Greek | 20 | 0.4% |
| Guatemalan | 44 | 0.8% |
| Guyanese | 88 | 1.7% |
| Haitian | 93 | 1.7% |
| Hungarian | 10 | 0.2% |
| Indian (Asian) | 28 | 0.5% |
| Irish | 246 | 4.6% |
| Iroquois | 29 | 0.5% |
| Italian | 542 | 10.2% |
| Jamaican | 358 | 6.7% |
| Korean | 32 | 0.6% |
| Lebanese | 6 | 0.1% |
| Mexican American Indian | 8 | 0.2% |
| Peruvian | 5 | 0.1% |
| Polish | 70 | 1.3% |
| Puerto Rican | 146 | 2.7% |
| Romanian | 9 | 0.2% |
| Russian | 57 | 1.1% |
| Salvadoran | 109 | 2.0% |
| Seminole | 4 | 0.1% |
| Serbian | 7 | 0.1% |
| South American | 66 | 1.2% |
| Spaniard | 29 | 0.5% |
| Swedish | 13 | 0.2% |
| Thai | 91 | 1.7% |
| Trinidadian and Tobagonian | 93 | 1.7% |
| Ukrainian | 25 | 0.5% |
| West Indian | 39 | 0.7% | View All 52 Rows |
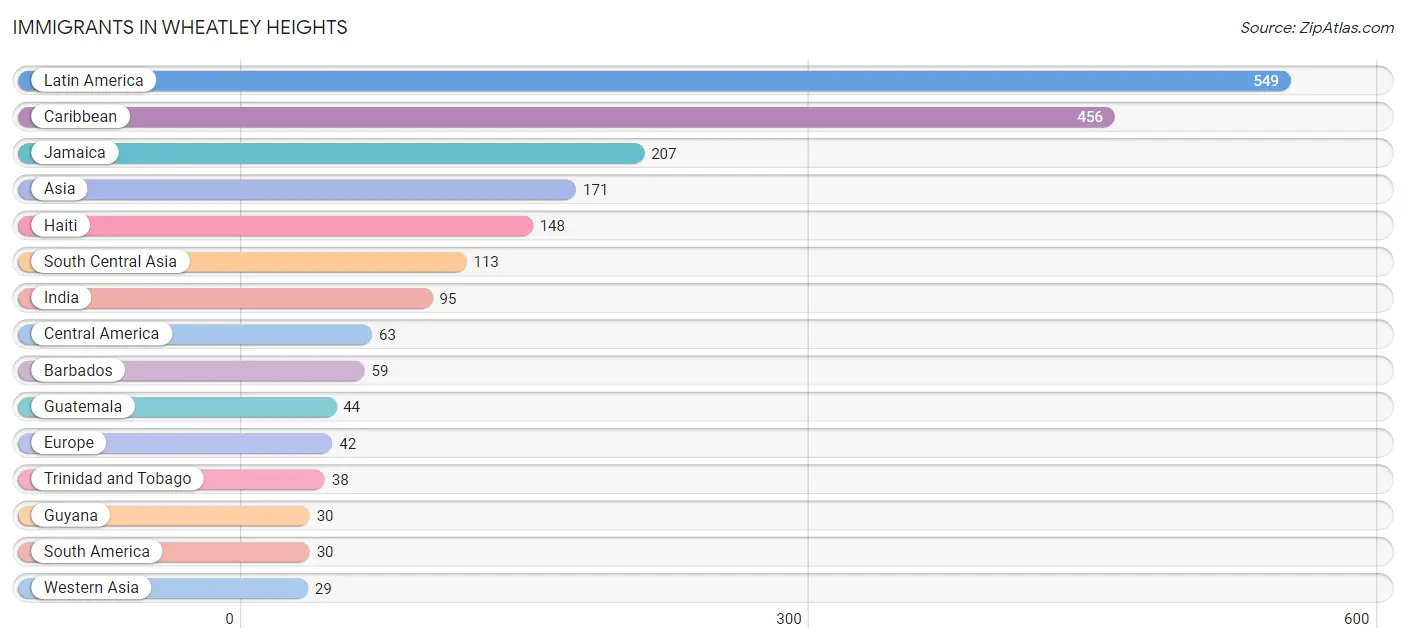
Immigrants in Wheatley Heights
The most numerous immigrant groups reported in Wheatley Heights came from Latin America (549 | 10.3%), Caribbean (456 | 8.5%), Jamaica (207 | 3.9%), Asia (171 | 3.2%), and Haiti (148 | 2.8%), together accounting for 28.7% of all Wheatley Heights residents.
| Immigration Origin | # Population | % Population |
| Africa | 6 | 0.1% |
| Asia | 171 | 3.2% |
| Barbados | 59 | 1.1% |
| Caribbean | 456 | 8.5% |
| Central America | 63 | 1.2% |
| China | 14 | 0.3% |
| Eastern Asia | 20 | 0.4% |
| Eastern Europe | 13 | 0.2% |
| Egypt | 6 | 0.1% |
| El Salvador | 9 | 0.2% |
| Europe | 42 | 0.8% |
| France | 4 | 0.1% |
| Germany | 17 | 0.3% |
| Guatemala | 44 | 0.8% |
| Guyana | 30 | 0.6% |
| Haiti | 148 | 2.8% |
| Hungary | 6 | 0.1% |
| India | 95 | 1.8% |
| Israel | 3 | 0.1% |
| Italy | 8 | 0.2% |
| Jamaica | 207 | 3.9% |
| Korea | 6 | 0.1% |
| Latin America | 549 | 10.3% |
| Northern Africa | 6 | 0.1% |
| Pakistan | 18 | 0.3% |
| Panama | 10 | 0.2% |
| Saudi Arabia | 3 | 0.1% |
| Serbia | 7 | 0.1% |
| South America | 30 | 0.6% |
| South Central Asia | 113 | 2.1% |
| Southern Europe | 8 | 0.2% |
| St. Vincent and the Grenadines | 4 | 0.1% |
| Trinidad and Tobago | 38 | 0.7% |
| Western Asia | 29 | 0.5% |
| Western Europe | 21 | 0.4% |
| Yemen | 23 | 0.4% | View All 36 Rows |
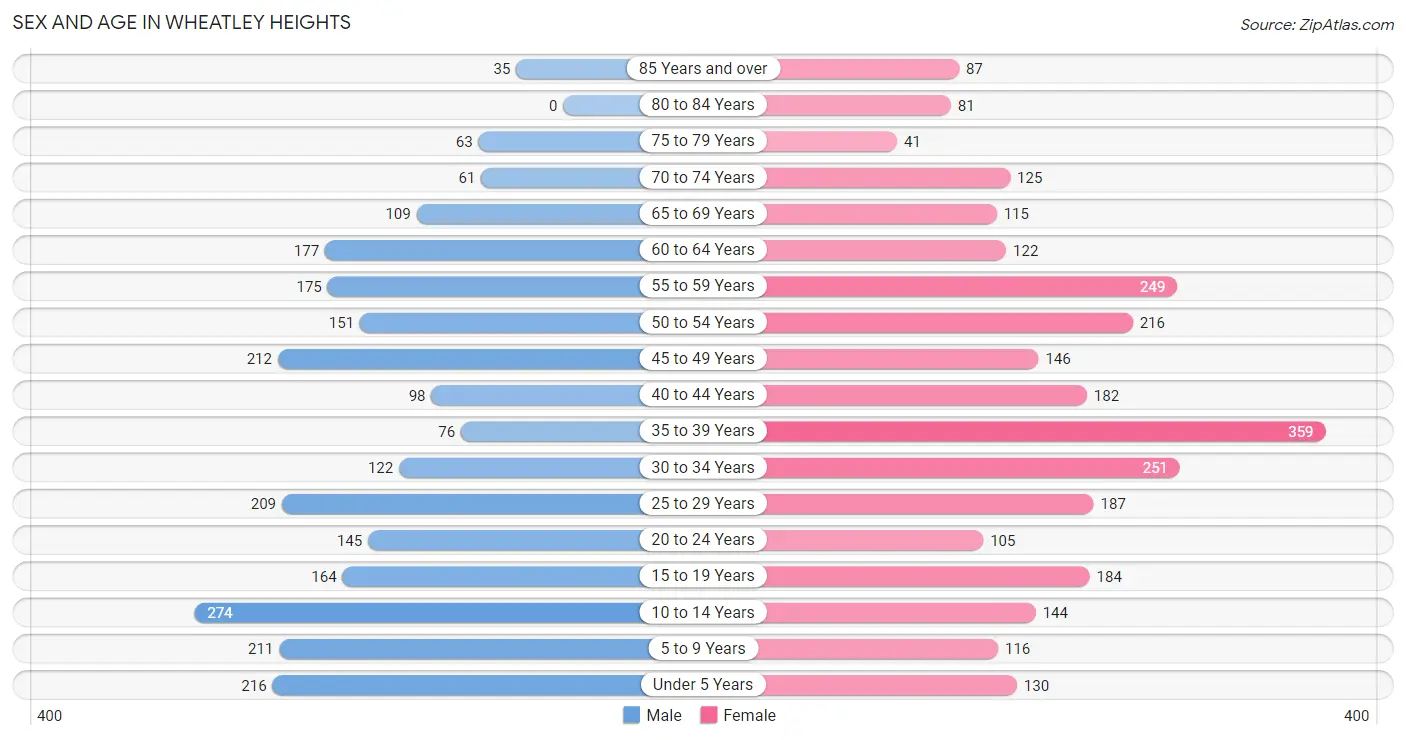
Sex and Age in Wheatley Heights
Sex and Age in Wheatley Heights
The most populous age groups in Wheatley Heights are 10 to 14 Years (274 | 11.0%) for men and 35 to 39 Years (359 | 12.6%) for women.
| Age Bracket | Male | Female |
| Under 5 Years | 216 (8.6%) | 130 (4.6%) |
| 5 to 9 Years | 211 (8.5%) | 116 (4.1%) |
| 10 to 14 Years | 274 (11.0%) | 144 (5.1%) |
| 15 to 19 Years | 164 (6.6%) | 184 (6.5%) |
| 20 to 24 Years | 145 (5.8%) | 105 (3.7%) |
| 25 to 29 Years | 209 (8.4%) | 187 (6.6%) |
| 30 to 34 Years | 122 (4.9%) | 251 (8.8%) |
| 35 to 39 Years | 76 (3.0%) | 359 (12.6%) |
| 40 to 44 Years | 98 (3.9%) | 182 (6.4%) |
| 45 to 49 Years | 212 (8.5%) | 146 (5.1%) |
| 50 to 54 Years | 151 (6.0%) | 216 (7.6%) |
| 55 to 59 Years | 175 (7.0%) | 249 (8.8%) |
| 60 to 64 Years | 177 (7.1%) | 122 (4.3%) |
| 65 to 69 Years | 109 (4.4%) | 115 (4.1%) |
| 70 to 74 Years | 61 (2.4%) | 125 (4.4%) |
| 75 to 79 Years | 63 (2.5%) | 41 (1.4%) |
| 80 to 84 Years | 0 (0.0%) | 81 (2.9%) |
| 85 Years and over | 35 (1.4%) | 87 (3.1%) |
| Total | 2,498 (100.0%) | 2,840 (100.0%) |
Families and Households in Wheatley Heights
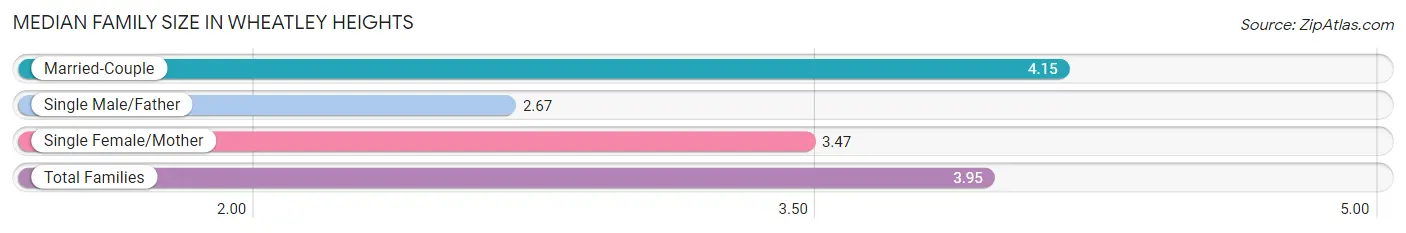
Median Family Size in Wheatley Heights
The median family size in Wheatley Heights is 3.95 persons per family, with married-couple families (859 | 75.7%) accounting for the largest median family size of 4.15 persons per family. On the other hand, single male/father families (43 | 3.8%) represent the smallest median family size with 2.67 persons per family.
| Family Type | # Families | Family Size |
| Married-Couple | 859 (75.7%) | 4.15 |
| Single Male/Father | 43 (3.8%) | 2.67 |
| Single Female/Mother | 233 (20.5%) | 3.47 |
| Total Families | 1,135 (100.0%) | 3.95 |
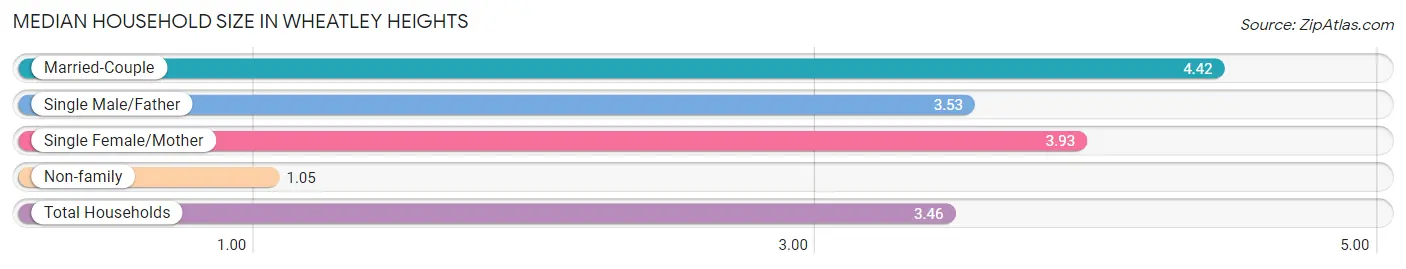
Median Household Size in Wheatley Heights
The median household size in Wheatley Heights is 3.46 persons per household, with married-couple households (859 | 56.5%) accounting for the largest median household size of 4.42 persons per household. non-family households (386 | 25.4%) represent the smallest median household size with 1.05 persons per household.
| Household Type | # Households | Household Size |
| Married-Couple | 859 (56.5%) | 4.42 |
| Single Male/Father | 43 (2.8%) | 3.53 |
| Single Female/Mother | 233 (15.3%) | 3.93 |
| Non-family | 386 (25.4%) | 1.05 |
| Total Households | 1,521 (100.0%) | 3.46 |
Household Size by Marriage Status in Wheatley Heights
Out of a total of 1,521 households in Wheatley Heights, 1,135 (74.6%) are family households, while 386 (25.4%) are nonfamily households. The most numerous type of family households are 2-person households, comprising 403, and the most common type of nonfamily households are 1-person households, comprising 367.
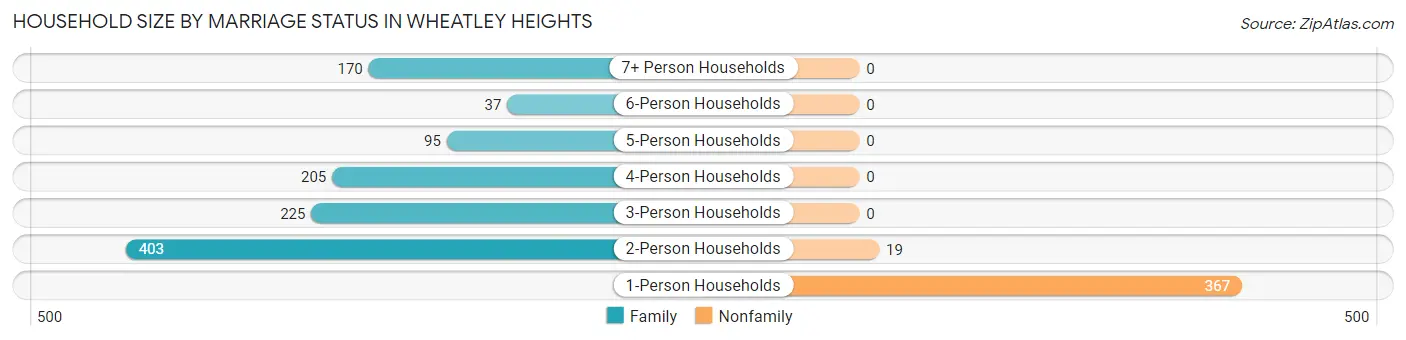
| Household Size | Family Households | Nonfamily Households |
| 1-Person Households | - | 367 (24.1%) |
| 2-Person Households | 403 (26.5%) | 19 (1.3%) |
| 3-Person Households | 225 (14.8%) | 0 (0.0%) |
| 4-Person Households | 205 (13.5%) | 0 (0.0%) |
| 5-Person Households | 95 (6.2%) | 0 (0.0%) |
| 6-Person Households | 37 (2.4%) | 0 (0.0%) |
| 7+ Person Households | 170 (11.2%) | 0 (0.0%) |
| Total | 1,135 (74.6%) | 386 (25.4%) |
Female Fertility in Wheatley Heights
Fertility by Age in Wheatley Heights
Average fertility rate in Wheatley Heights is 33.0 births per 1,000 women. Women in the age bracket of 20 to 34 years have the highest fertility rate with 44.0 births per 1,000 women. Women in the age bracket of 35 to 50 years acount for 51.0% of all women with births.
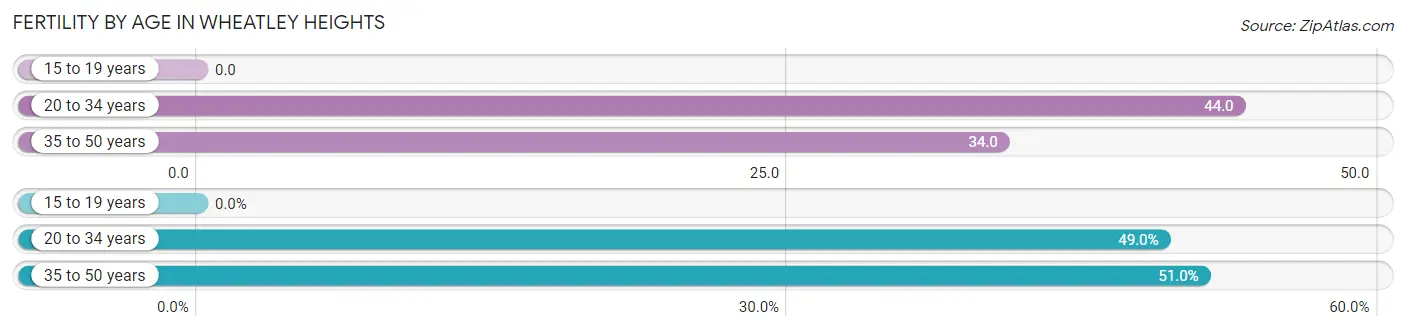
| Age Bracket | Women with Births | Births / 1,000 Women |
| 15 to 19 years | 0 (0.0%) | 0.0 |
| 20 to 34 years | 24 (49.0%) | 44.0 |
| 35 to 50 years | 25 (51.0%) | 34.0 |
| Total | 49 (100.0%) | 33.0 |
Fertility by Age by Marriage Status in Wheatley Heights
32.7% of women with births (49) in Wheatley Heights are married. The highest percentage of unmarried women with births falls into 20 to 34 years age bracket with 100.0% of them unmarried at the time of birth, while the lowest percentage of unmarried women with births belong to 35 to 50 years age bracket with 36.0% of them unmarried.
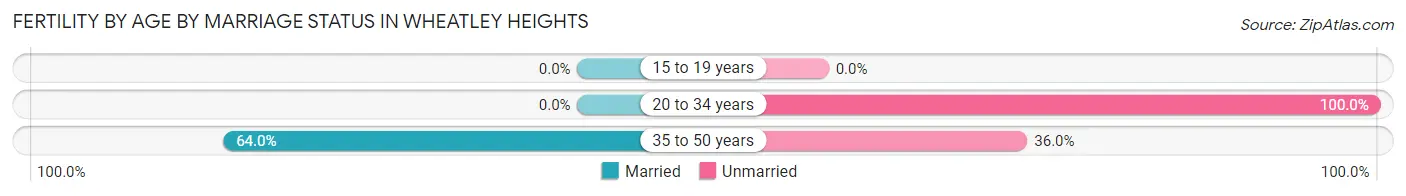
| Age Bracket | Married | Unmarried |
| 15 to 19 years | 0 (0.0%) | 0 (0.0%) |
| 20 to 34 years | 0 (0.0%) | 24 (100.0%) |
| 35 to 50 years | 16 (64.0%) | 9 (36.0%) |
| Total | 16 (32.7%) | 33 (67.3%) |
Fertility by Education in Wheatley Heights
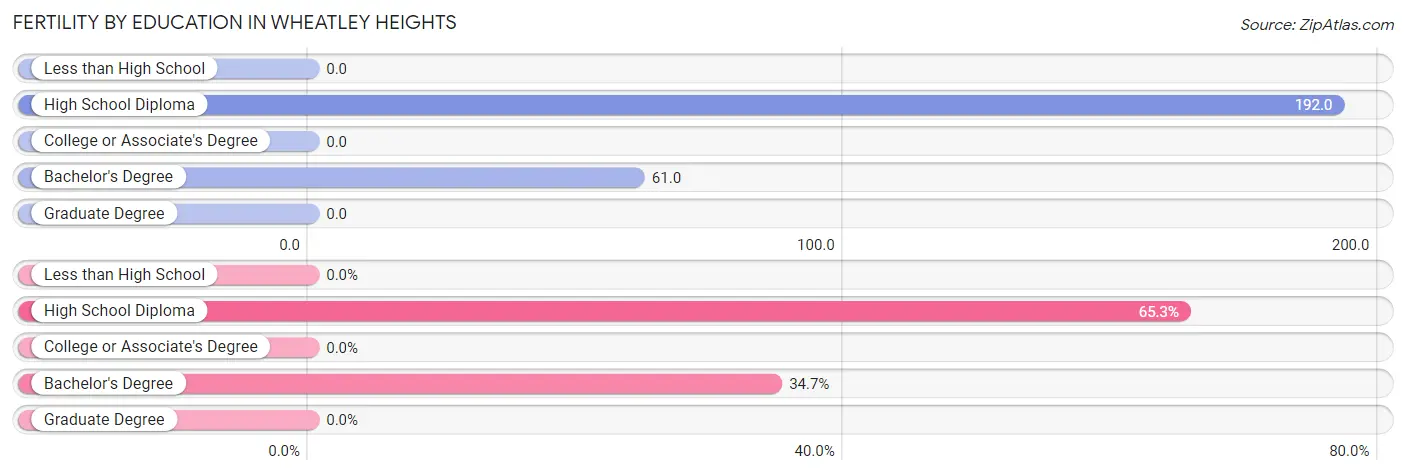
| Educational Attainment | Women with Births | Births / 1,000 Women |
| Less than High School | 0 (0.0%) | 0.0 |
| High School Diploma | 32 (65.3%) | 192.0 |
| College or Associate's Degree | 0 (0.0%) | 0.0 |
| Bachelor's Degree | 17 (34.7%) | 61.0 |
| Graduate Degree | 0 (0.0%) | 0.0 |
| Total | 49 (100.0%) | 33.0 |
Fertility by Education by Marriage Status in Wheatley Heights
67.3% of women with births in Wheatley Heights are unmarried. Women with the educational attainment of bachelor's degree are most likely to be married with 47.1% of them married at childbirth, while women with the educational attainment of high school diploma are least likely to be married with 75.0% of them unmarried at childbirth.
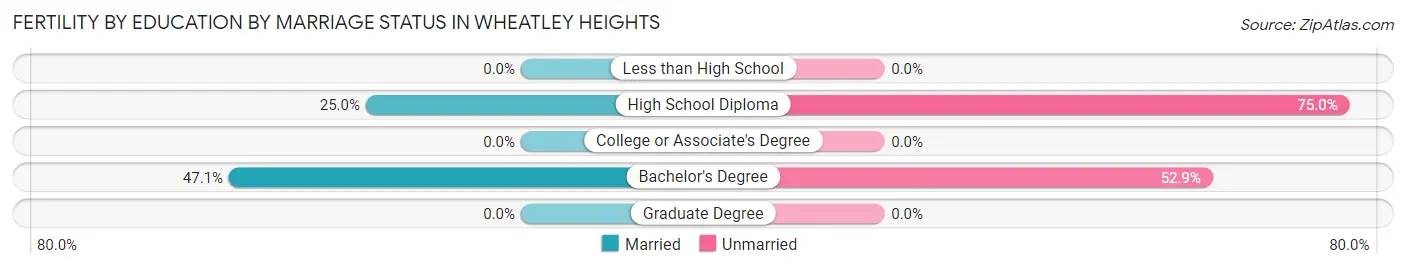
| Educational Attainment | Married | Unmarried |
| Less than High School | 0 (0.0%) | 0 (0.0%) |
| High School Diploma | 8 (25.0%) | 24 (75.0%) |
| College or Associate's Degree | 0 (0.0%) | 0 (0.0%) |
| Bachelor's Degree | 8 (47.1%) | 9 (52.9%) |
| Graduate Degree | 0 (0.0%) | 0 (0.0%) |
| Total | 16 (32.7%) | 33 (67.3%) |
Employment Characteristics in Wheatley Heights
Employment by Class of Employer in Wheatley Heights
Among the 2,524 employed individuals in Wheatley Heights, private company employees (1,671 | 66.2%), not-for-profit organizations (264 | 10.5%), and local government employees (215 | 8.5%) make up the most common classes of employment.
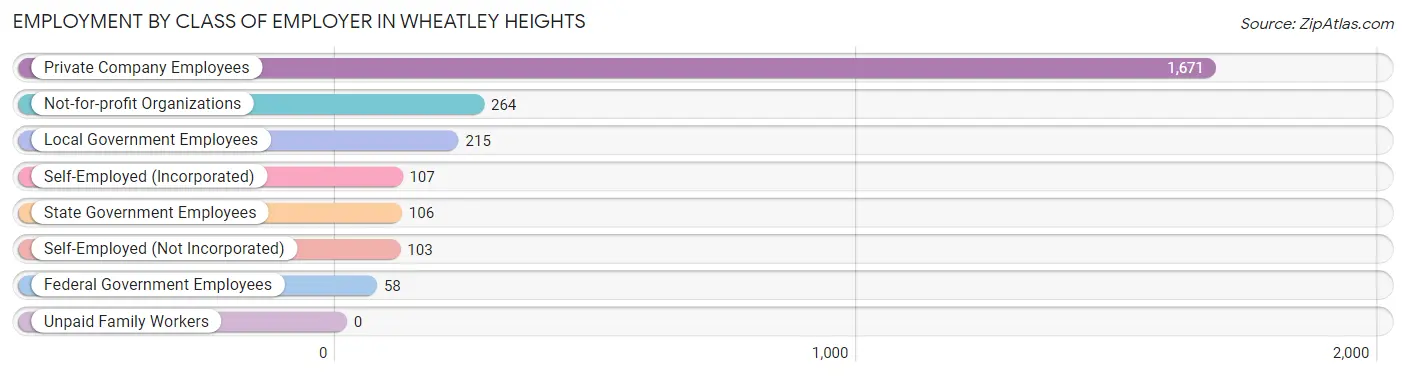
| Employer Class | # Employees | % Employees |
| Private Company Employees | 1,671 | 66.2% |
| Self-Employed (Incorporated) | 107 | 4.2% |
| Self-Employed (Not Incorporated) | 103 | 4.1% |
| Not-for-profit Organizations | 264 | 10.5% |
| Local Government Employees | 215 | 8.5% |
| State Government Employees | 106 | 4.2% |
| Federal Government Employees | 58 | 2.3% |
| Unpaid Family Workers | 0 | 0.0% |
| Total | 2,524 | 100.0% |
Employment Status by Age in Wheatley Heights
According to the labor force statistics for Wheatley Heights, out of the total population over 16 years of age (4,182), 64.5% or 2,697 individuals are in the labor force, with 3.1% or 84 of them unemployed. The age group with the highest labor force participation rate is 30 to 34 years, with 94.6% or 353 individuals in the labor force. Within the labor force, the 20 to 24 years age range has the highest percentage of unemployed individuals, with 6.7% or 11 of them being unemployed.
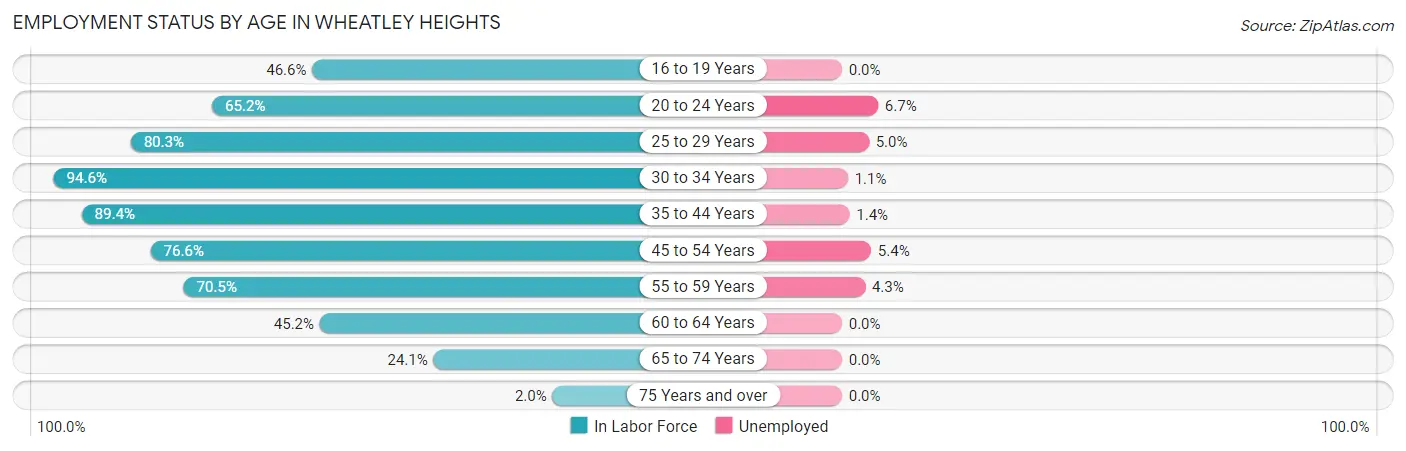
| Age Bracket | In Labor Force | Unemployed |
| 16 to 19 Years | 132 (46.6%) | 0 (0.0%) |
| 20 to 24 Years | 163 (65.2%) | 11 (6.7%) |
| 25 to 29 Years | 318 (80.3%) | 16 (5.0%) |
| 30 to 34 Years | 353 (94.6%) | 4 (1.1%) |
| 35 to 44 Years | 639 (89.4%) | 9 (1.4%) |
| 45 to 54 Years | 555 (76.6%) | 30 (5.4%) |
| 55 to 59 Years | 299 (70.5%) | 13 (4.3%) |
| 60 to 64 Years | 135 (45.2%) | 0 (0.0%) |
| 65 to 74 Years | 99 (24.1%) | 0 (0.0%) |
| 75 Years and over | 6 (2.0%) | 0 (0.0%) |
| Total | 2,697 (64.5%) | 84 (3.1%) |
Employment Status by Educational Attainment in Wheatley Heights
According to labor force statistics for Wheatley Heights, 78.4% of individuals (2,299) out of the total population between 25 and 64 years of age (2,932) are in the labor force, with 3.1% or 71 of them being unemployed. The group with the highest labor force participation rate are those with the educational attainment of less than high school, with 91.2% or 423 individuals in the labor force. Within the labor force, individuals with high school diploma education have the highest percentage of unemployment, with 8.5% or 35 of them being unemployed.
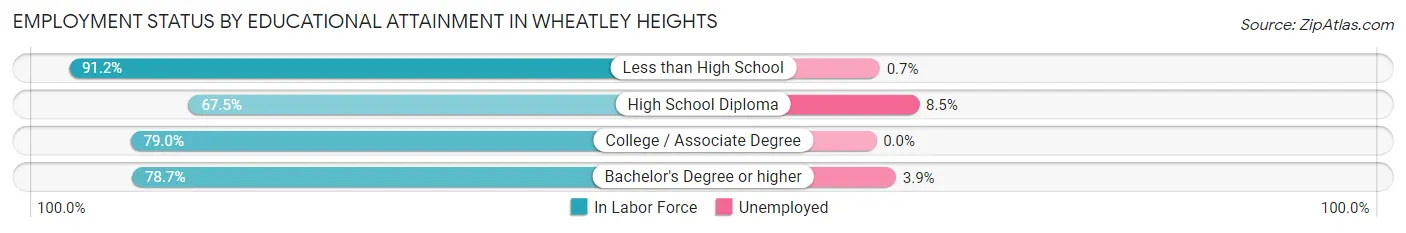
| Educational Attainment | In Labor Force | Unemployed |
| Less than High School | 423 (91.2%) | 3 (0.7%) |
| High School Diploma | 414 (67.5%) | 52 (8.5%) |
| College / Associate Degree | 589 (79.0%) | 0 (0.0%) |
| Bachelor's Degree or higher | 873 (78.7%) | 43 (3.9%) |
| Total | 2,299 (78.4%) | 91 (3.1%) |
Employment Occupations by Sex in Wheatley Heights
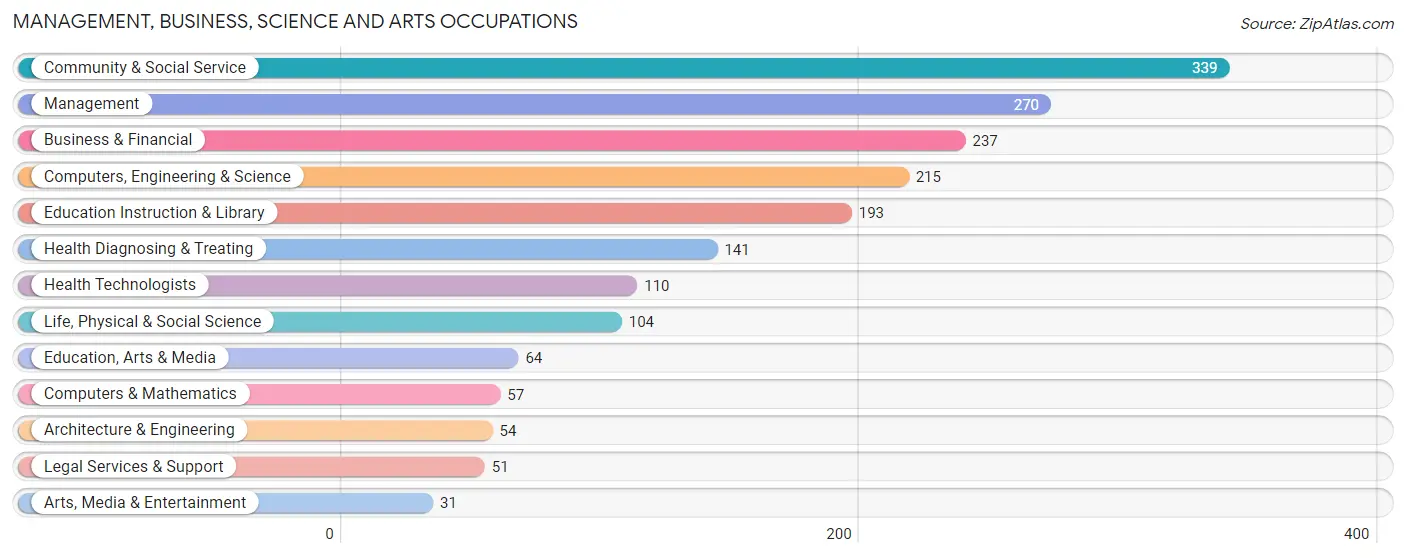
Management, Business, Science and Arts Occupations
The most common Management, Business, Science and Arts occupations in Wheatley Heights are Community & Social Service (339 | 13.0%), Management (270 | 10.3%), Business & Financial (237 | 9.1%), Computers, Engineering & Science (215 | 8.2%), and Education Instruction & Library (193 | 7.4%).
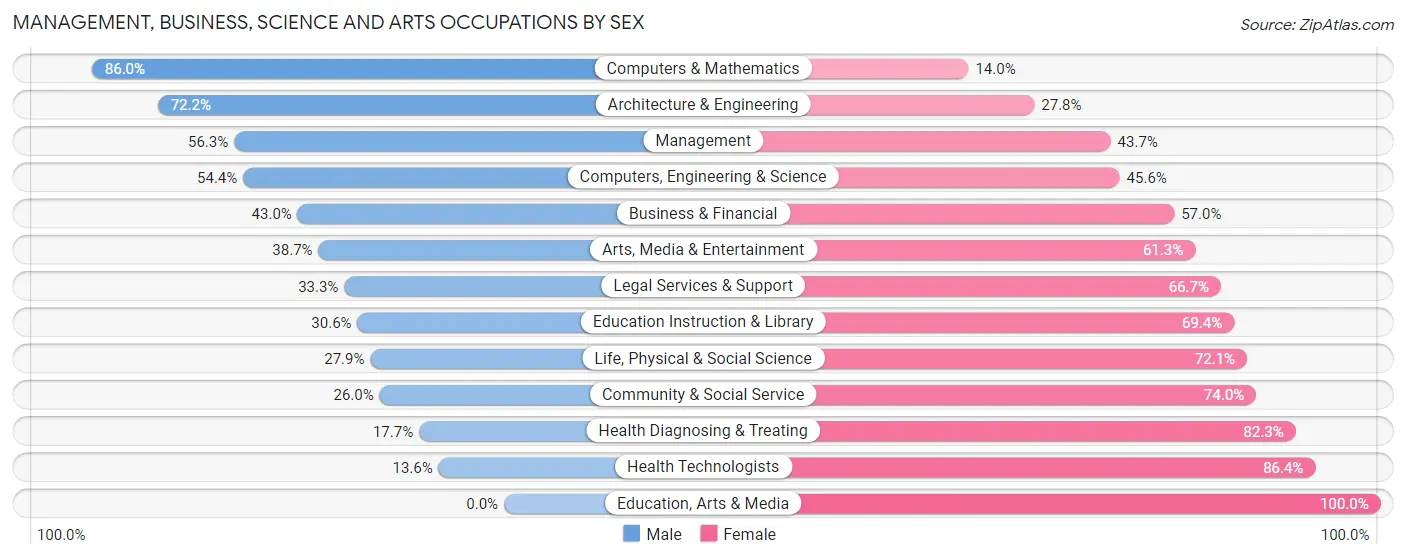
Management, Business, Science and Arts Occupations by Sex
Within the Management, Business, Science and Arts occupations in Wheatley Heights, the most male-oriented occupations are Computers & Mathematics (86.0%), Architecture & Engineering (72.2%), and Management (56.3%), while the most female-oriented occupations are Education, Arts & Media (100.0%), Health Technologists (86.4%), and Health Diagnosing & Treating (82.3%).
| Occupation | Male | Female |
| Management | 152 (56.3%) | 118 (43.7%) |
| Business & Financial | 102 (43.0%) | 135 (57.0%) |
| Computers, Engineering & Science | 117 (54.4%) | 98 (45.6%) |
| Computers & Mathematics | 49 (86.0%) | 8 (14.0%) |
| Architecture & Engineering | 39 (72.2%) | 15 (27.8%) |
| Life, Physical & Social Science | 29 (27.9%) | 75 (72.1%) |
| Community & Social Service | 88 (26.0%) | 251 (74.0%) |
| Education, Arts & Media | 0 (0.0%) | 64 (100.0%) |
| Legal Services & Support | 17 (33.3%) | 34 (66.7%) |
| Education Instruction & Library | 59 (30.6%) | 134 (69.4%) |
| Arts, Media & Entertainment | 12 (38.7%) | 19 (61.3%) |
| Health Diagnosing & Treating | 25 (17.7%) | 116 (82.3%) |
| Health Technologists | 15 (13.6%) | 95 (86.4%) |
| Total (Category) | 484 (40.3%) | 718 (59.7%) |
| Total (Overall) | 1,045 (40.0%) | 1,571 (60.1%) |
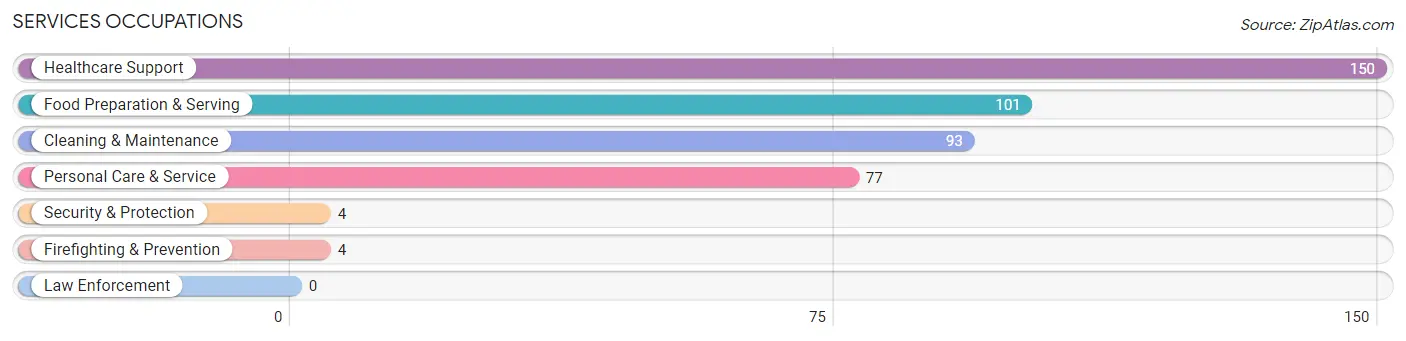
Services Occupations
The most common Services occupations in Wheatley Heights are Healthcare Support (150 | 5.7%), Food Preparation & Serving (101 | 3.9%), Cleaning & Maintenance (93 | 3.6%), Personal Care & Service (77 | 2.9%), and Security & Protection (4 | 0.2%).
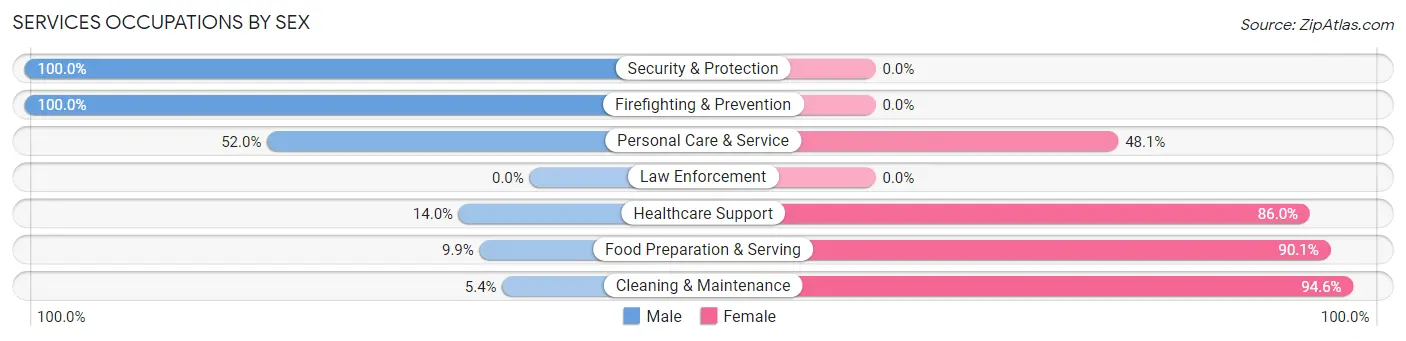
Services Occupations by Sex
Within the Services occupations in Wheatley Heights, the most male-oriented occupations are Security & Protection (100.0%), Firefighting & Prevention (100.0%), and Personal Care & Service (51.9%), while the most female-oriented occupations are Cleaning & Maintenance (94.6%), Food Preparation & Serving (90.1%), and Healthcare Support (86.0%).
| Occupation | Male | Female |
| Healthcare Support | 21 (14.0%) | 129 (86.0%) |
| Security & Protection | 4 (100.0%) | 0 (0.0%) |
| Firefighting & Prevention | 4 (100.0%) | 0 (0.0%) |
| Law Enforcement | 0 (0.0%) | 0 (0.0%) |
| Food Preparation & Serving | 10 (9.9%) | 91 (90.1%) |
| Cleaning & Maintenance | 5 (5.4%) | 88 (94.6%) |
| Personal Care & Service | 40 (51.9%) | 37 (48.0%) |
| Total (Category) | 80 (18.8%) | 345 (81.2%) |
| Total (Overall) | 1,045 (40.0%) | 1,571 (60.1%) |
Sales and Office Occupations
The most common Sales and Office occupations in Wheatley Heights are Office & Administration (426 | 16.3%), and Sales & Related (191 | 7.3%).
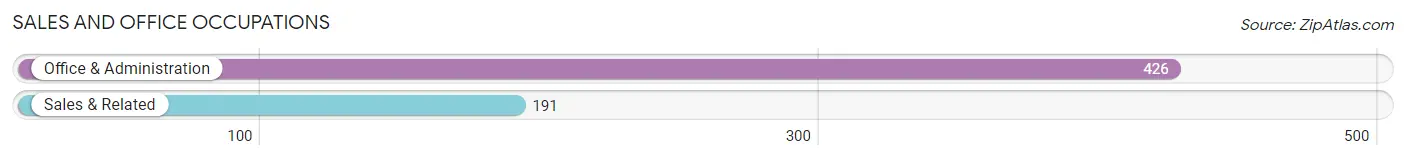
Sales and Office Occupations by Sex
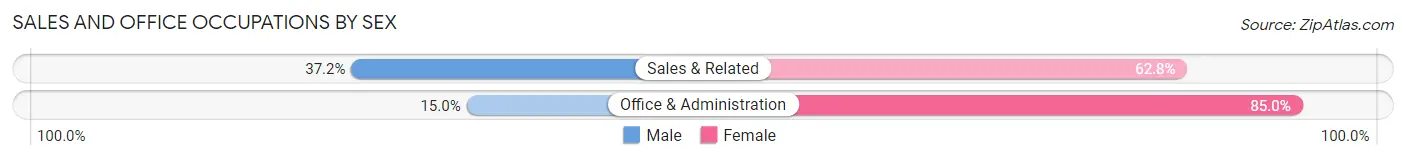
| Occupation | Male | Female |
| Sales & Related | 71 (37.2%) | 120 (62.8%) |
| Office & Administration | 64 (15.0%) | 362 (85.0%) |
| Total (Category) | 135 (21.9%) | 482 (78.1%) |
| Total (Overall) | 1,045 (40.0%) | 1,571 (60.1%) |
Natural Resources, Construction and Maintenance Occupations
The most common Natural Resources, Construction and Maintenance occupations in Wheatley Heights are Construction & Extraction (63 | 2.4%), and Installation, Maintenance & Repair (28 | 1.1%).
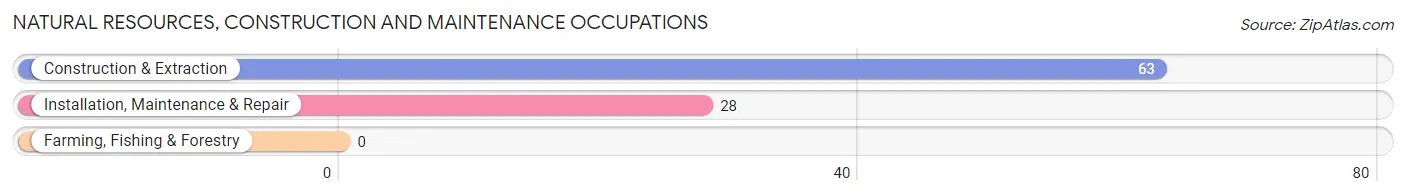
Natural Resources, Construction and Maintenance Occupations by Sex
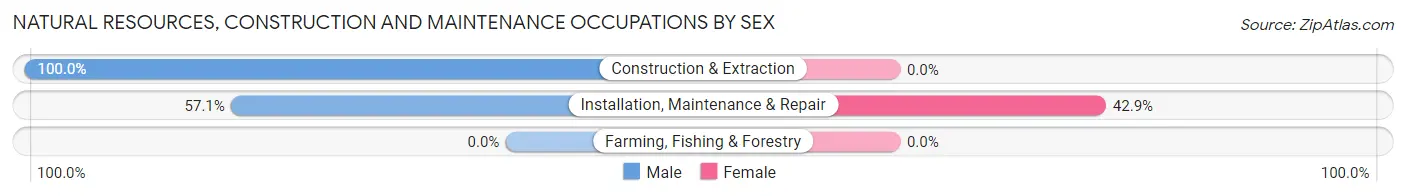
| Occupation | Male | Female |
| Farming, Fishing & Forestry | 0 (0.0%) | 0 (0.0%) |
| Construction & Extraction | 63 (100.0%) | 0 (0.0%) |
| Installation, Maintenance & Repair | 16 (57.1%) | 12 (42.9%) |
| Total (Category) | 79 (86.8%) | 12 (13.2%) |
| Total (Overall) | 1,045 (40.0%) | 1,571 (60.1%) |
Production, Transportation and Moving Occupations
The most common Production, Transportation and Moving occupations in Wheatley Heights are Transportation (172 | 6.6%), Material Moving (81 | 3.1%), and Production (28 | 1.1%).
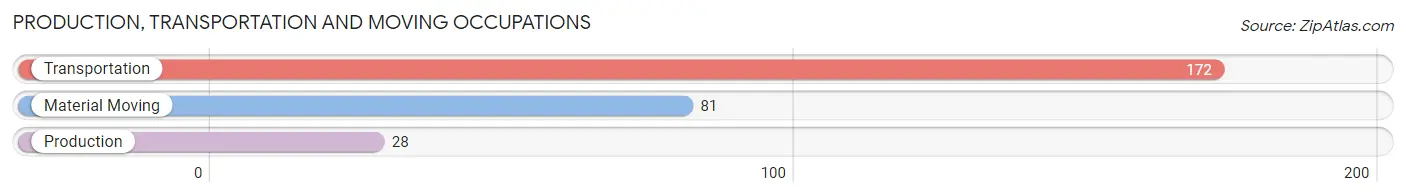
Production, Transportation and Moving Occupations by Sex
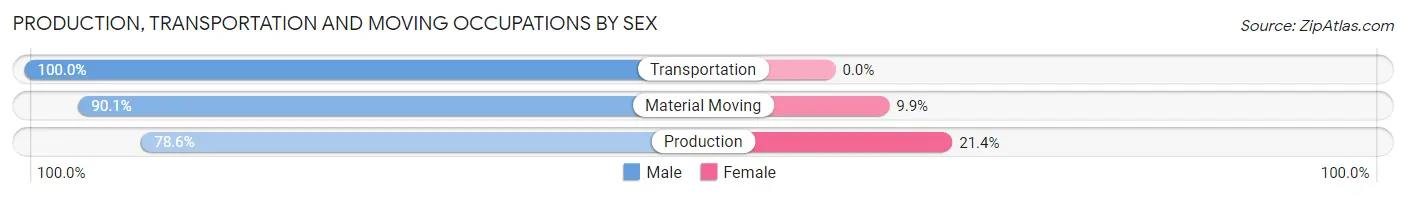
| Occupation | Male | Female |
| Production | 22 (78.6%) | 6 (21.4%) |
| Transportation | 172 (100.0%) | 0 (0.0%) |
| Material Moving | 73 (90.1%) | 8 (9.9%) |
| Total (Category) | 267 (95.0%) | 14 (5.0%) |
| Total (Overall) | 1,045 (40.0%) | 1,571 (60.1%) |
Employment Industries by Sex in Wheatley Heights
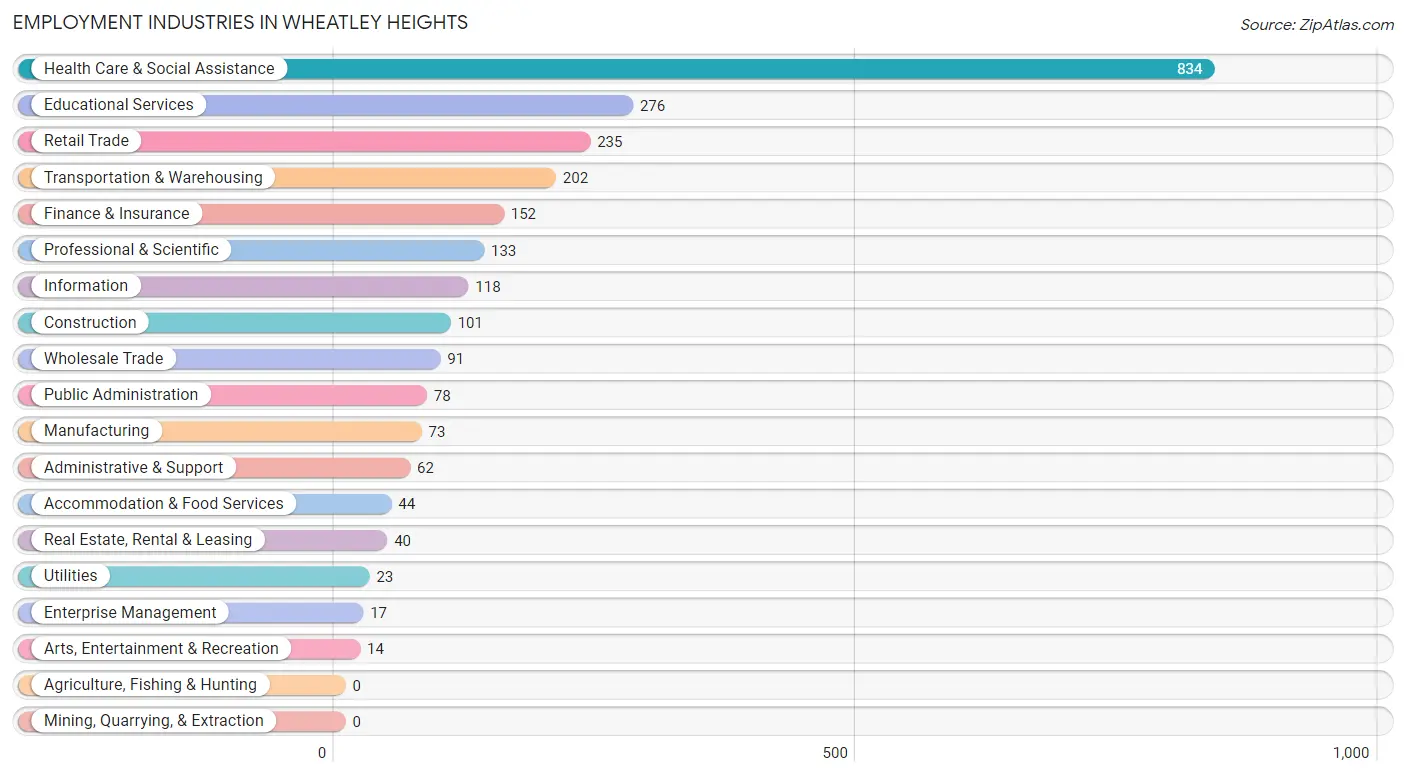
Employment Industries in Wheatley Heights
The major employment industries in Wheatley Heights include Health Care & Social Assistance (834 | 31.9%), Educational Services (276 | 10.5%), Retail Trade (235 | 9.0%), Transportation & Warehousing (202 | 7.7%), and Finance & Insurance (152 | 5.8%).
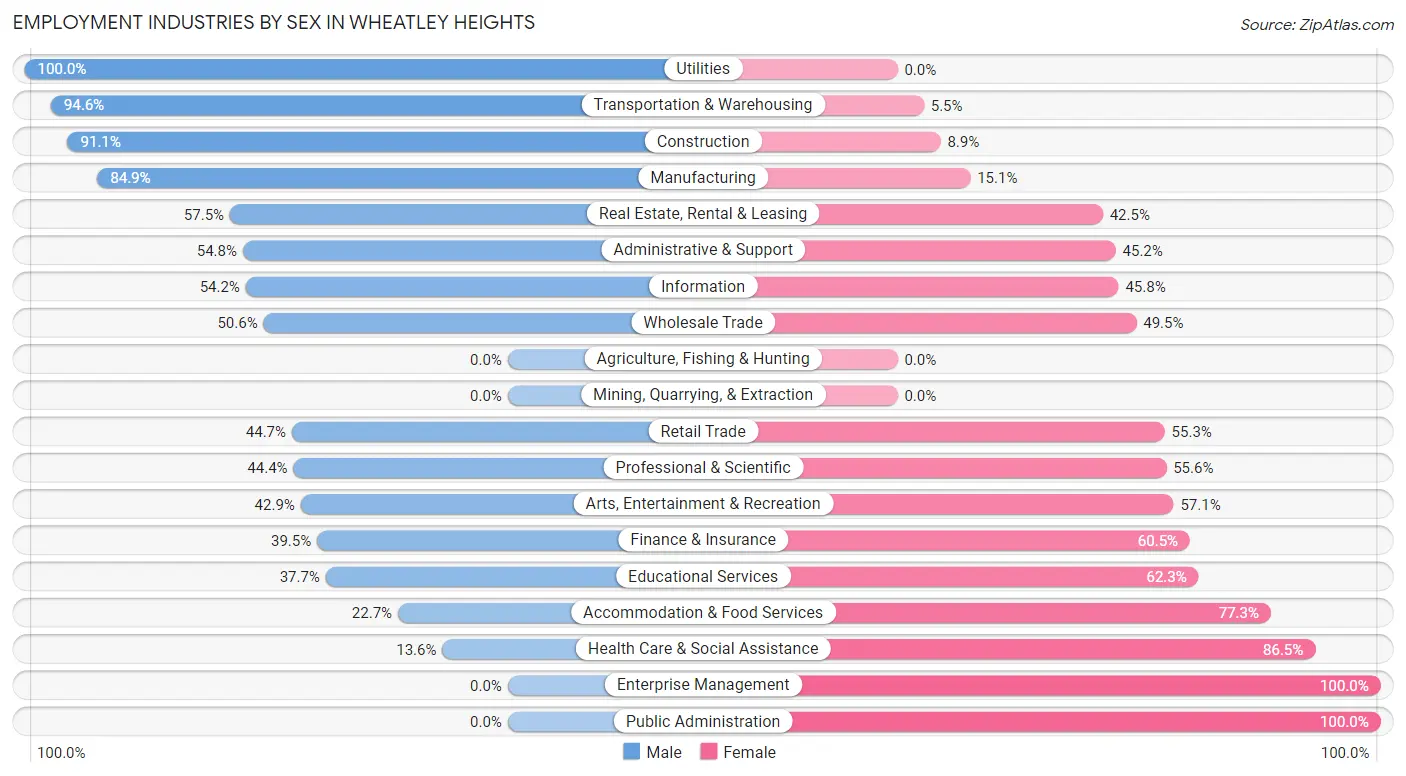
Employment Industries by Sex in Wheatley Heights
The Wheatley Heights industries that see more men than women are Utilities (100.0%), Transportation & Warehousing (94.6%), and Construction (91.1%), whereas the industries that tend to have a higher number of women are Enterprise Management (100.0%), Public Administration (100.0%), and Health Care & Social Assistance (86.5%).
| Industry | Male | Female |
| Agriculture, Fishing & Hunting | 0 (0.0%) | 0 (0.0%) |
| Mining, Quarrying, & Extraction | 0 (0.0%) | 0 (0.0%) |
| Construction | 92 (91.1%) | 9 (8.9%) |
| Manufacturing | 62 (84.9%) | 11 (15.1%) |
| Wholesale Trade | 46 (50.5%) | 45 (49.4%) |
| Retail Trade | 105 (44.7%) | 130 (55.3%) |
| Transportation & Warehousing | 191 (94.6%) | 11 (5.4%) |
| Utilities | 23 (100.0%) | 0 (0.0%) |
| Information | 64 (54.2%) | 54 (45.8%) |
| Finance & Insurance | 60 (39.5%) | 92 (60.5%) |
| Real Estate, Rental & Leasing | 23 (57.5%) | 17 (42.5%) |
| Professional & Scientific | 59 (44.4%) | 74 (55.6%) |
| Enterprise Management | 0 (0.0%) | 17 (100.0%) |
| Administrative & Support | 34 (54.8%) | 28 (45.2%) |
| Educational Services | 104 (37.7%) | 172 (62.3%) |
| Health Care & Social Assistance | 113 (13.6%) | 721 (86.5%) |
| Arts, Entertainment & Recreation | 6 (42.9%) | 8 (57.1%) |
| Accommodation & Food Services | 10 (22.7%) | 34 (77.3%) |
| Public Administration | 0 (0.0%) | 78 (100.0%) |
| Total | 1,045 (40.0%) | 1,571 (60.1%) |
Education in Wheatley Heights
School Enrollment in Wheatley Heights
The most common levels of schooling among the 1,302 students in Wheatley Heights are middle school (364 | 28.0%), high school (307 | 23.6%), and elementary school (255 | 19.6%).
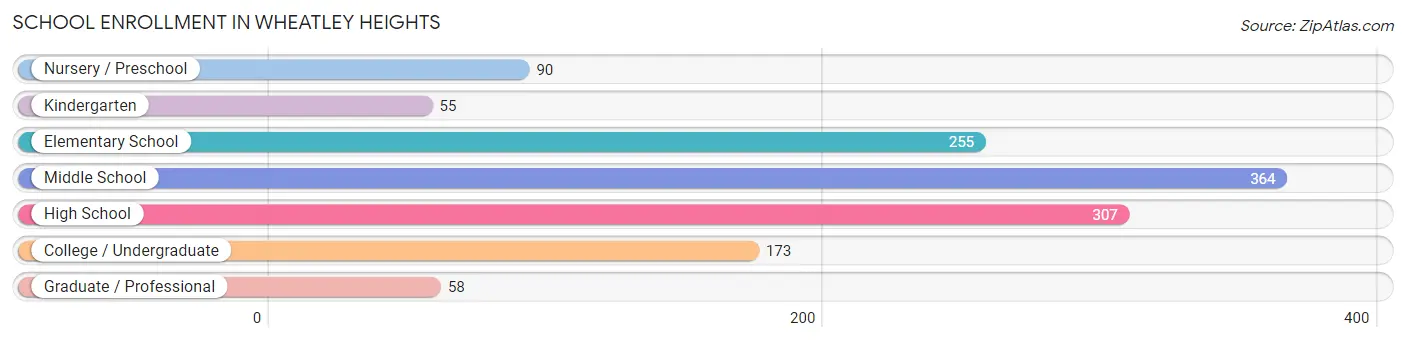
| School Level | # Students | % Students |
| Nursery / Preschool | 90 | 6.9% |
| Kindergarten | 55 | 4.2% |
| Elementary School | 255 | 19.6% |
| Middle School | 364 | 28.0% |
| High School | 307 | 23.6% |
| College / Undergraduate | 173 | 13.3% |
| Graduate / Professional | 58 | 4.4% |
| Total | 1,302 | 100.0% |
School Enrollment by Age by Funding Source in Wheatley Heights
Out of a total of 1,302 students who are enrolled in schools in Wheatley Heights, 154 (11.8%) attend a private institution, while the remaining 1,148 (88.2%) are enrolled in public schools. The age group of 25 to 34 year olds has the highest likelihood of being enrolled in private schools, with 25 (43.1% in the age bracket) enrolled. Conversely, the age group of 10 to 14 year olds has the lowest likelihood of being enrolled in a private school, with 399 (98.0% in the age bracket) attending a public institution.
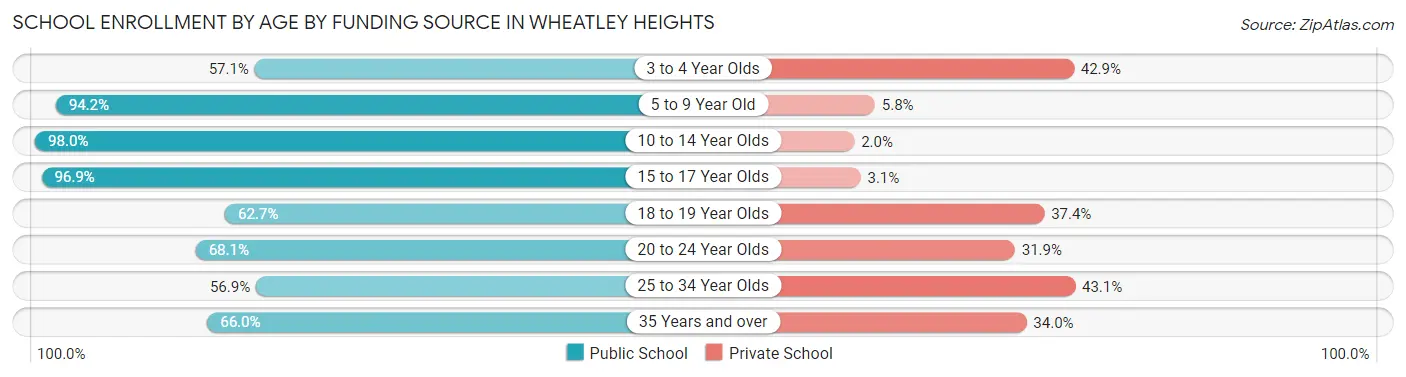
| Age Bracket | Public School | Private School |
| 3 to 4 Year Olds | 32 (57.1%) | 24 (42.9%) |
| 5 to 9 Year Old | 308 (94.2%) | 19 (5.8%) |
| 10 to 14 Year Olds | 399 (98.0%) | 8 (2.0%) |
| 15 to 17 Year Olds | 247 (96.9%) | 8 (3.1%) |
| 18 to 19 Year Olds | 52 (62.6%) | 31 (37.3%) |
| 20 to 24 Year Olds | 47 (68.1%) | 22 (31.9%) |
| 25 to 34 Year Olds | 33 (56.9%) | 25 (43.1%) |
| 35 Years and over | 31 (66.0%) | 16 (34.0%) |
| Total | 1,148 (88.2%) | 154 (11.8%) |
Educational Attainment by Field of Study in Wheatley Heights
Business (220 | 15.7%), education (214 | 15.3%), science & technology (213 | 15.2%), psychology (134 | 9.6%), and social sciences (114 | 8.1%) are the most common fields of study among 1,401 individuals in Wheatley Heights who have obtained a bachelor's degree or higher.
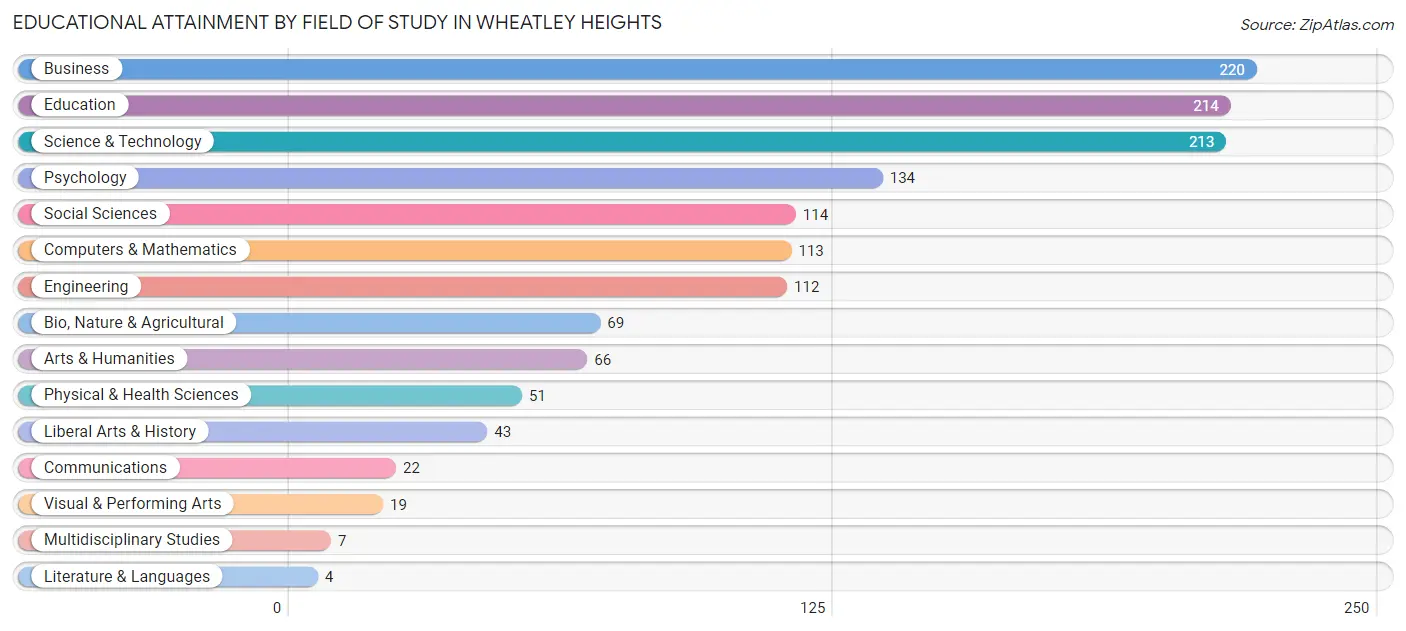
| Field of Study | # Graduates | % Graduates |
| Computers & Mathematics | 113 | 8.1% |
| Bio, Nature & Agricultural | 69 | 4.9% |
| Physical & Health Sciences | 51 | 3.6% |
| Psychology | 134 | 9.6% |
| Social Sciences | 114 | 8.1% |
| Engineering | 112 | 8.0% |
| Multidisciplinary Studies | 7 | 0.5% |
| Science & Technology | 213 | 15.2% |
| Business | 220 | 15.7% |
| Education | 214 | 15.3% |
| Literature & Languages | 4 | 0.3% |
| Liberal Arts & History | 43 | 3.1% |
| Visual & Performing Arts | 19 | 1.4% |
| Communications | 22 | 1.6% |
| Arts & Humanities | 66 | 4.7% |
| Total | 1,401 | 100.0% |
Transportation & Commute in Wheatley Heights
Vehicle Availability by Sex in Wheatley Heights
The most prevalent vehicle ownership categories in Wheatley Heights are males with 3 vehicles (345, accounting for 33.8%) and females with 3 vehicles (439, making up 23.0%).
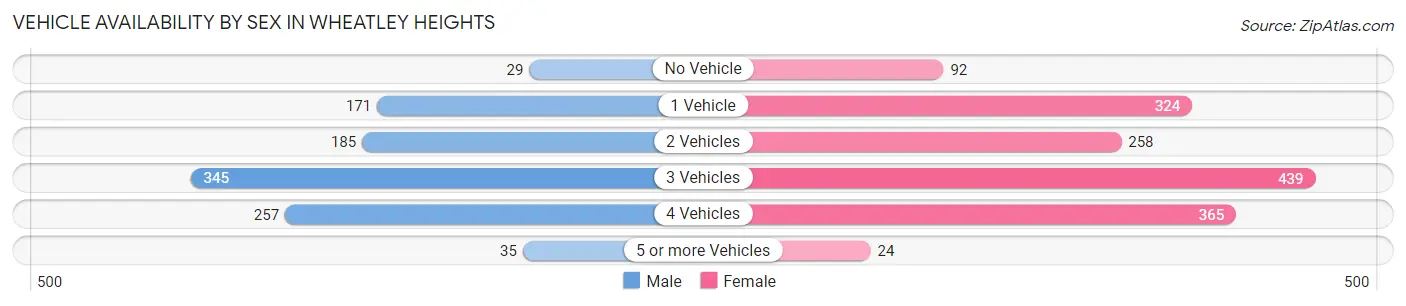
| Vehicles Available | Male | Female |
| No Vehicle | 29 (2.8%) | 92 (6.1%) |
| 1 Vehicle | 171 (16.7%) | 324 (21.6%) |
| 2 Vehicles | 185 (18.1%) | 258 (17.2%) |
| 3 Vehicles | 345 (33.8%) | 439 (29.2%) |
| 4 Vehicles | 257 (25.2%) | 365 (24.3%) |
| 5 or more Vehicles | 35 (3.4%) | 24 (1.6%) |
| Total | 1,022 (100.0%) | 1,502 (100.0%) |
Commute Time in Wheatley Heights
The most frequently occuring commute durations in Wheatley Heights are 30 to 34 minutes (348 commuters, 15.9%), 20 to 24 minutes (304 commuters, 13.9%), and 90 or more minutes (259 commuters, 11.8%).
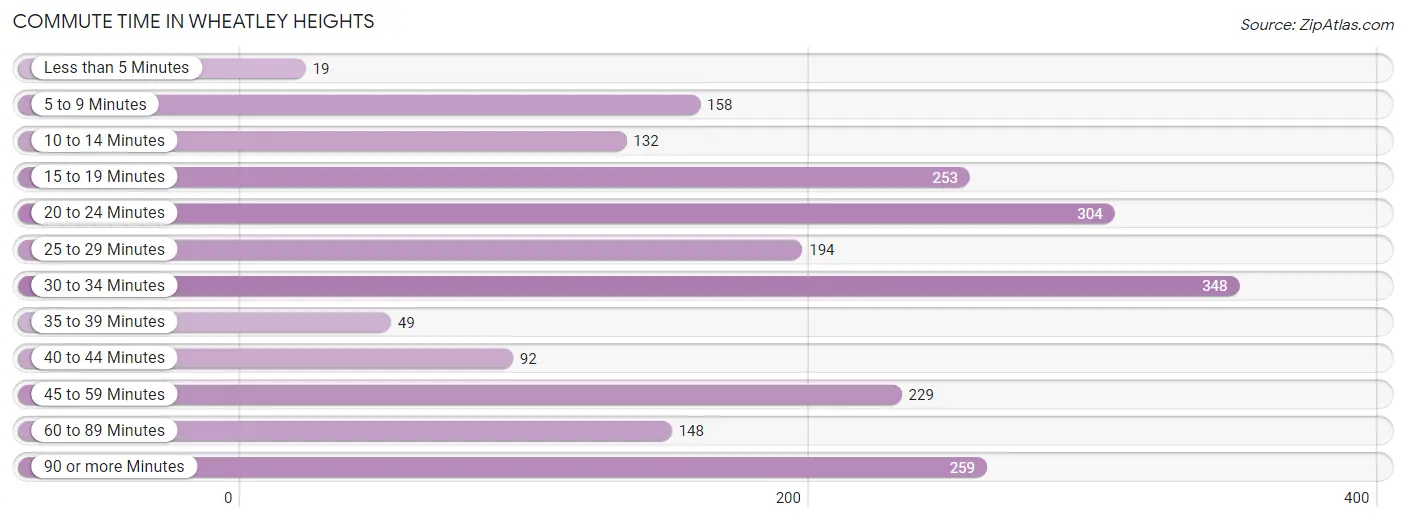
| Commute Time | # Commuters | % Commuters |
| Less than 5 Minutes | 19 | 0.9% |
| 5 to 9 Minutes | 158 | 7.2% |
| 10 to 14 Minutes | 132 | 6.0% |
| 15 to 19 Minutes | 253 | 11.6% |
| 20 to 24 Minutes | 304 | 13.9% |
| 25 to 29 Minutes | 194 | 8.9% |
| 30 to 34 Minutes | 348 | 15.9% |
| 35 to 39 Minutes | 49 | 2.2% |
| 40 to 44 Minutes | 92 | 4.2% |
| 45 to 59 Minutes | 229 | 10.5% |
| 60 to 89 Minutes | 148 | 6.8% |
| 90 or more Minutes | 259 | 11.8% |
Commute Time by Sex in Wheatley Heights
The most common commute times in Wheatley Heights are 20 to 24 minutes (181 commuters, 19.9%) for males and 30 to 34 minutes (261 commuters, 20.5%) for females.
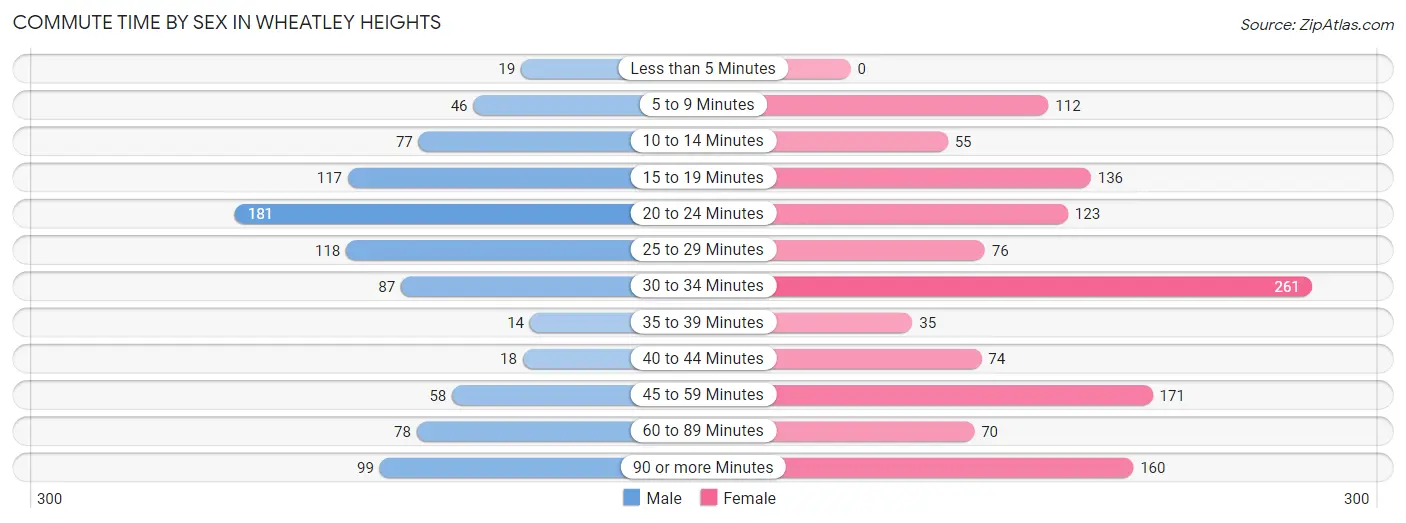
| Commute Time | Male | Female |
| Less than 5 Minutes | 19 (2.1%) | 0 (0.0%) |
| 5 to 9 Minutes | 46 (5.0%) | 112 (8.8%) |
| 10 to 14 Minutes | 77 (8.4%) | 55 (4.3%) |
| 15 to 19 Minutes | 117 (12.8%) | 136 (10.7%) |
| 20 to 24 Minutes | 181 (19.9%) | 123 (9.7%) |
| 25 to 29 Minutes | 118 (12.9%) | 76 (6.0%) |
| 30 to 34 Minutes | 87 (9.5%) | 261 (20.5%) |
| 35 to 39 Minutes | 14 (1.5%) | 35 (2.8%) |
| 40 to 44 Minutes | 18 (2.0%) | 74 (5.8%) |
| 45 to 59 Minutes | 58 (6.4%) | 171 (13.4%) |
| 60 to 89 Minutes | 78 (8.6%) | 70 (5.5%) |
| 90 or more Minutes | 99 (10.9%) | 160 (12.6%) |
Time of Departure to Work by Sex in Wheatley Heights
The most frequent times of departure to work in Wheatley Heights are 8:00 AM to 8:29 AM (126, 13.8%) for males and 12:00 AM to 4:59 AM (276, 21.7%) for females.
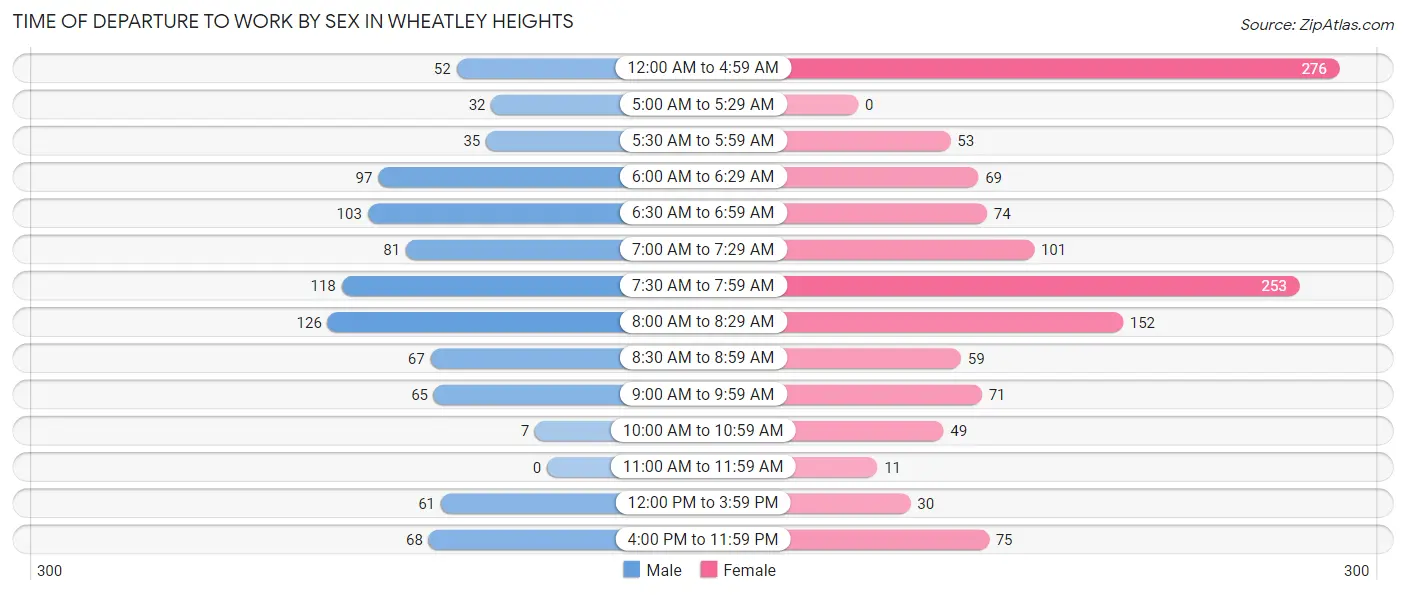
| Time of Departure | Male | Female |
| 12:00 AM to 4:59 AM | 52 (5.7%) | 276 (21.7%) |
| 5:00 AM to 5:29 AM | 32 (3.5%) | 0 (0.0%) |
| 5:30 AM to 5:59 AM | 35 (3.8%) | 53 (4.2%) |
| 6:00 AM to 6:29 AM | 97 (10.6%) | 69 (5.4%) |
| 6:30 AM to 6:59 AM | 103 (11.3%) | 74 (5.8%) |
| 7:00 AM to 7:29 AM | 81 (8.9%) | 101 (7.9%) |
| 7:30 AM to 7:59 AM | 118 (12.9%) | 253 (19.9%) |
| 8:00 AM to 8:29 AM | 126 (13.8%) | 152 (11.9%) |
| 8:30 AM to 8:59 AM | 67 (7.3%) | 59 (4.6%) |
| 9:00 AM to 9:59 AM | 65 (7.1%) | 71 (5.6%) |
| 10:00 AM to 10:59 AM | 7 (0.8%) | 49 (3.8%) |
| 11:00 AM to 11:59 AM | 0 (0.0%) | 11 (0.9%) |
| 12:00 PM to 3:59 PM | 61 (6.7%) | 30 (2.4%) |
| 4:00 PM to 11:59 PM | 68 (7.5%) | 75 (5.9%) |
| Total | 912 (100.0%) | 1,273 (100.0%) |
Housing Occupancy in Wheatley Heights
Occupancy by Ownership in Wheatley Heights
Of the total 1,521 dwellings in Wheatley Heights, owner-occupied units account for 1,417 (93.2%), while renter-occupied units make up 104 (6.8%).
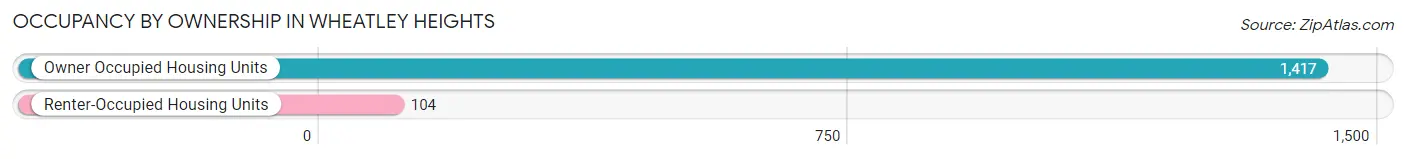
| Occupancy | # Housing Units | % Housing Units |
| Owner Occupied Housing Units | 1,417 | 93.2% |
| Renter-Occupied Housing Units | 104 | 6.8% |
| Total Occupied Housing Units | 1,521 | 100.0% |
Occupancy by Household Size in Wheatley Heights
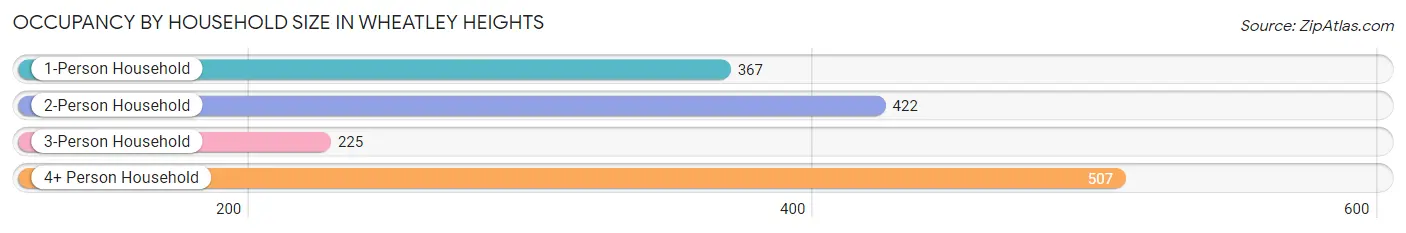
| Household Size | # Housing Units | % Housing Units |
| 1-Person Household | 367 | 24.1% |
| 2-Person Household | 422 | 27.7% |
| 3-Person Household | 225 | 14.8% |
| 4+ Person Household | 507 | 33.3% |
| Total Housing Units | 1,521 | 100.0% |
Occupancy by Ownership by Household Size in Wheatley Heights
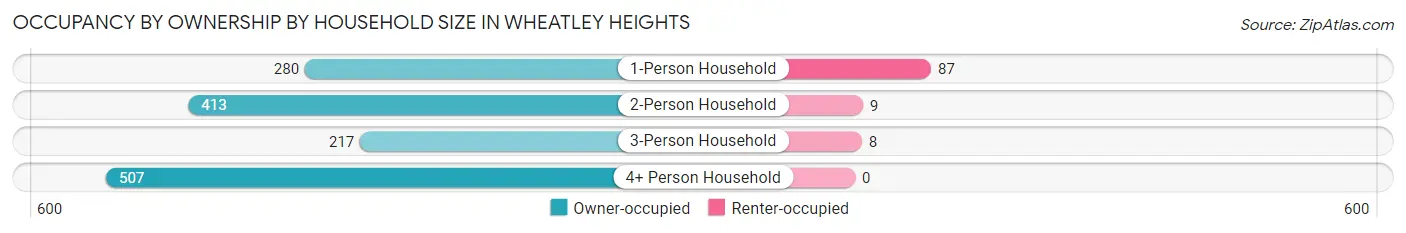
| Household Size | Owner-occupied | Renter-occupied |
| 1-Person Household | 280 (76.3%) | 87 (23.7%) |
| 2-Person Household | 413 (97.9%) | 9 (2.1%) |
| 3-Person Household | 217 (96.4%) | 8 (3.6%) |
| 4+ Person Household | 507 (100.0%) | 0 (0.0%) |
| Total Housing Units | 1,417 (93.2%) | 104 (6.8%) |
Occupancy by Educational Attainment in Wheatley Heights
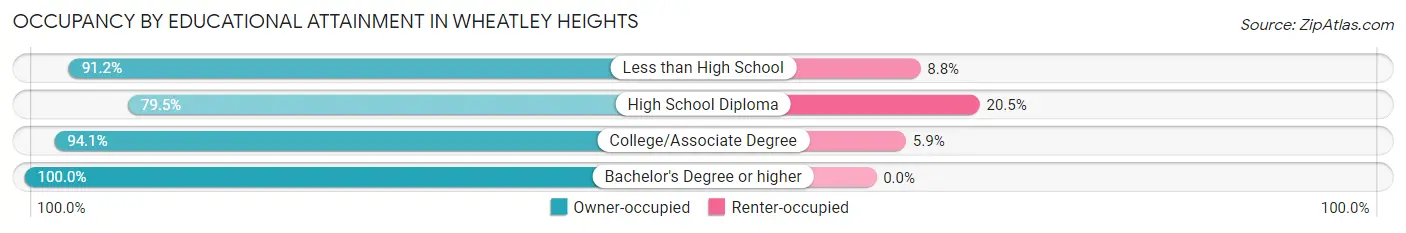
| Household Size | Owner-occupied | Renter-occupied |
| Less than High School | 250 (91.2%) | 24 (8.8%) |
| High School Diploma | 229 (79.5%) | 59 (20.5%) |
| College/Associate Degree | 335 (94.1%) | 21 (5.9%) |
| Bachelor's Degree or higher | 603 (100.0%) | 0 (0.0%) |
Occupancy by Age of Householder in Wheatley Heights
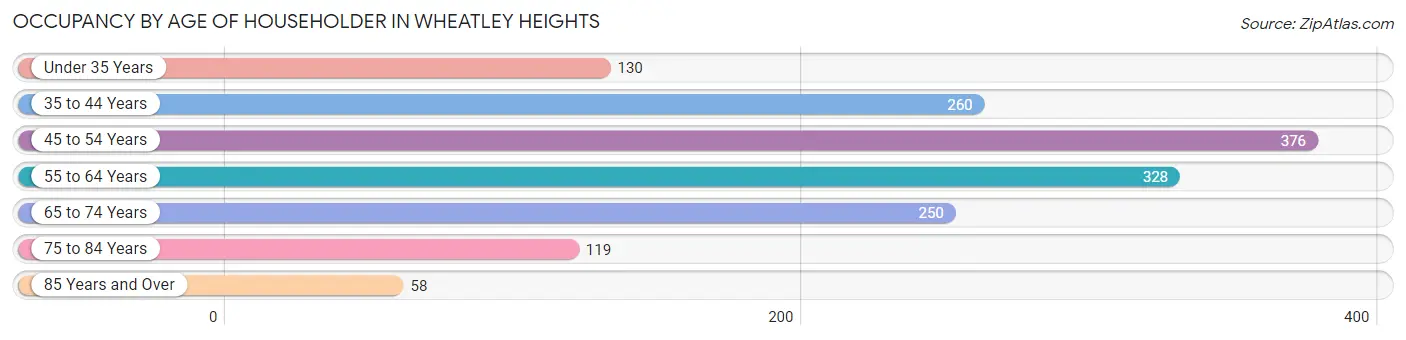
| Age Bracket | # Households | % Households |
| Under 35 Years | 130 | 8.6% |
| 35 to 44 Years | 260 | 17.1% |
| 45 to 54 Years | 376 | 24.7% |
| 55 to 64 Years | 328 | 21.6% |
| 65 to 74 Years | 250 | 16.4% |
| 75 to 84 Years | 119 | 7.8% |
| 85 Years and Over | 58 | 3.8% |
| Total | 1,521 | 100.0% |
Housing Finances in Wheatley Heights
Median Income by Occupancy in Wheatley Heights
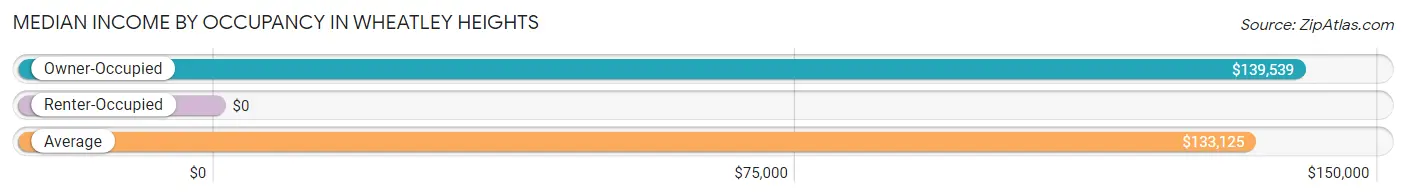
| Occupancy Type | # Households | Median Income |
| Owner-Occupied | 1,417 (93.2%) | $139,539 |
| Renter-Occupied | 104 (6.8%) | $0 |
| Average | 1,521 (100.0%) | $133,125 |
Occupancy by Householder Income Bracket in Wheatley Heights
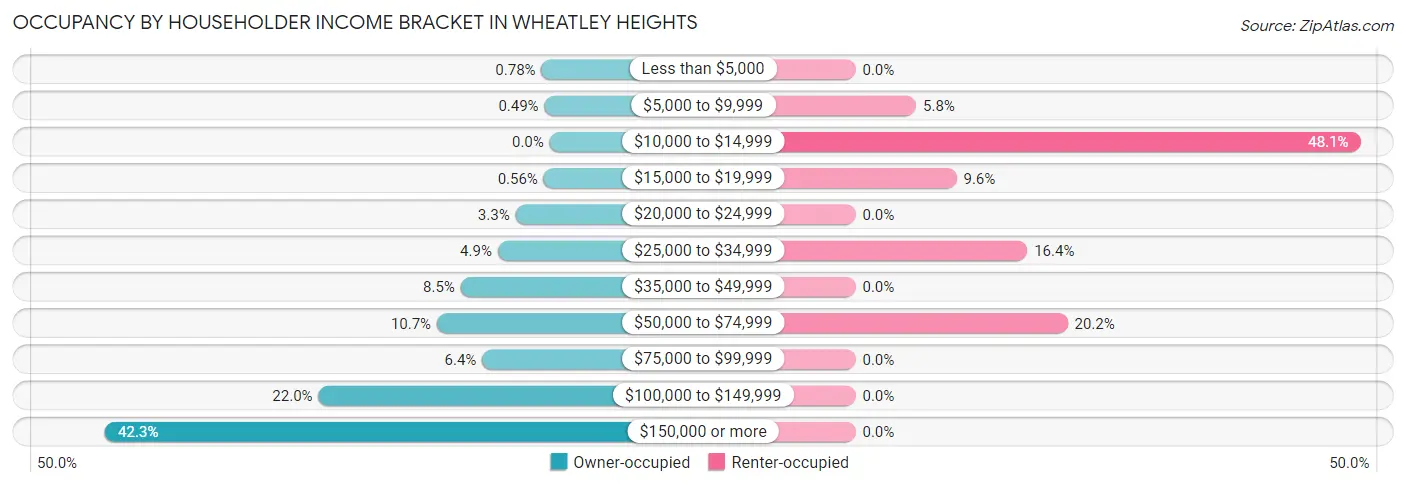
| Income Bracket | Owner-occupied | Renter-occupied |
| Less than $5,000 | 11 (0.8%) | 0 (0.0%) |
| $5,000 to $9,999 | 7 (0.5%) | 6 (5.8%) |
| $10,000 to $14,999 | 0 (0.0%) | 50 (48.1%) |
| $15,000 to $19,999 | 8 (0.6%) | 10 (9.6%) |
| $20,000 to $24,999 | 46 (3.3%) | 0 (0.0%) |
| $25,000 to $34,999 | 70 (4.9%) | 17 (16.4%) |
| $35,000 to $49,999 | 120 (8.5%) | 0 (0.0%) |
| $50,000 to $74,999 | 152 (10.7%) | 21 (20.2%) |
| $75,000 to $99,999 | 91 (6.4%) | 0 (0.0%) |
| $100,000 to $149,999 | 312 (22.0%) | 0 (0.0%) |
| $150,000 or more | 600 (42.3%) | 0 (0.0%) |
| Total | 1,417 (100.0%) | 104 (100.0%) |
Monthly Housing Cost Tiers in Wheatley Heights
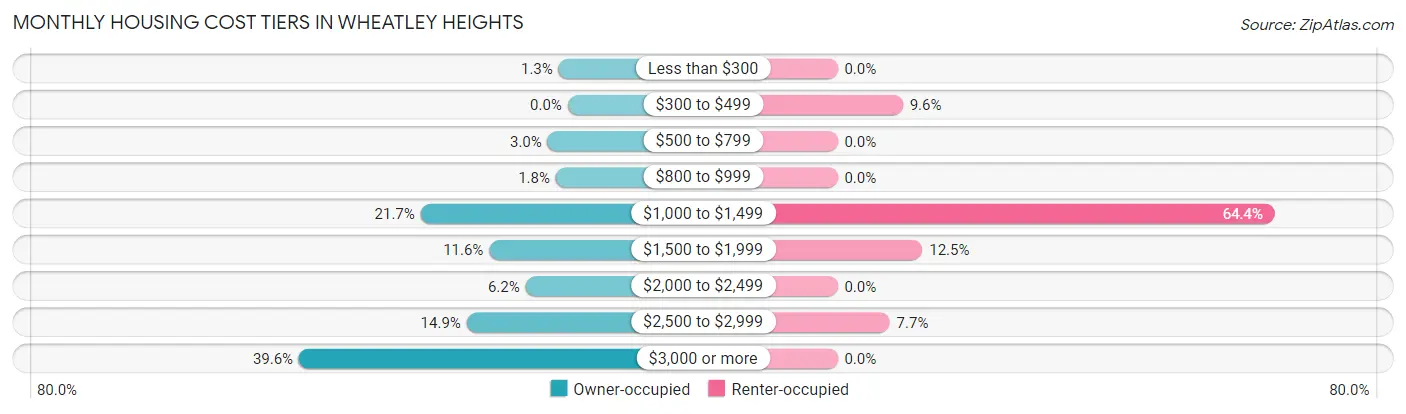
| Monthly Cost | Owner-occupied | Renter-occupied |
| Less than $300 | 19 (1.3%) | 0 (0.0%) |
| $300 to $499 | 0 (0.0%) | 10 (9.6%) |
| $500 to $799 | 42 (3.0%) | 0 (0.0%) |
| $800 to $999 | 25 (1.8%) | 0 (0.0%) |
| $1,000 to $1,499 | 307 (21.7%) | 67 (64.4%) |
| $1,500 to $1,999 | 164 (11.6%) | 13 (12.5%) |
| $2,000 to $2,499 | 88 (6.2%) | 0 (0.0%) |
| $2,500 to $2,999 | 211 (14.9%) | 8 (7.7%) |
| $3,000 or more | 561 (39.6%) | 0 (0.0%) |
| Total | 1,417 (100.0%) | 104 (100.0%) |
Physical Housing Characteristics in Wheatley Heights
Housing Structures in Wheatley Heights
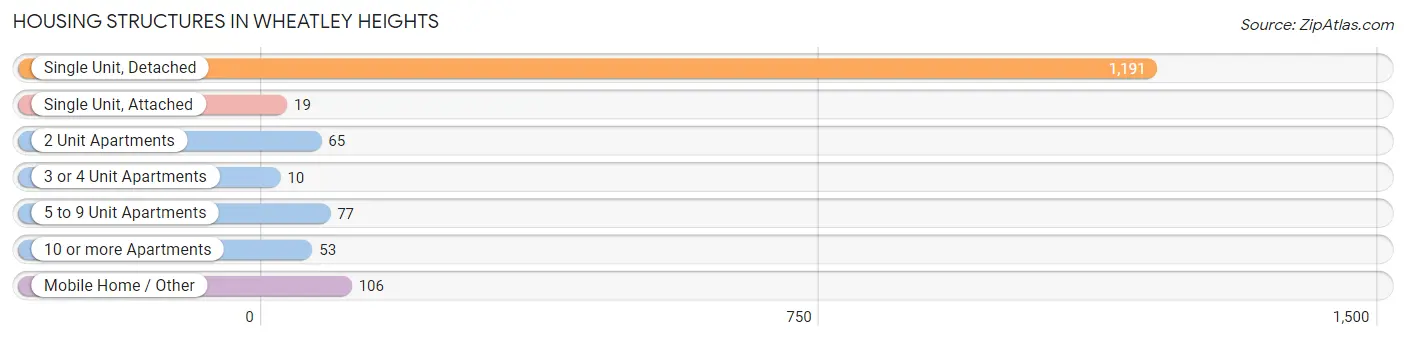
| Structure Type | # Housing Units | % Housing Units |
| Single Unit, Detached | 1,191 | 78.3% |
| Single Unit, Attached | 19 | 1.3% |
| 2 Unit Apartments | 65 | 4.3% |
| 3 or 4 Unit Apartments | 10 | 0.7% |
| 5 to 9 Unit Apartments | 77 | 5.1% |
| 10 or more Apartments | 53 | 3.5% |
| Mobile Home / Other | 106 | 7.0% |
| Total | 1,521 | 100.0% |
Housing Structures by Occupancy in Wheatley Heights
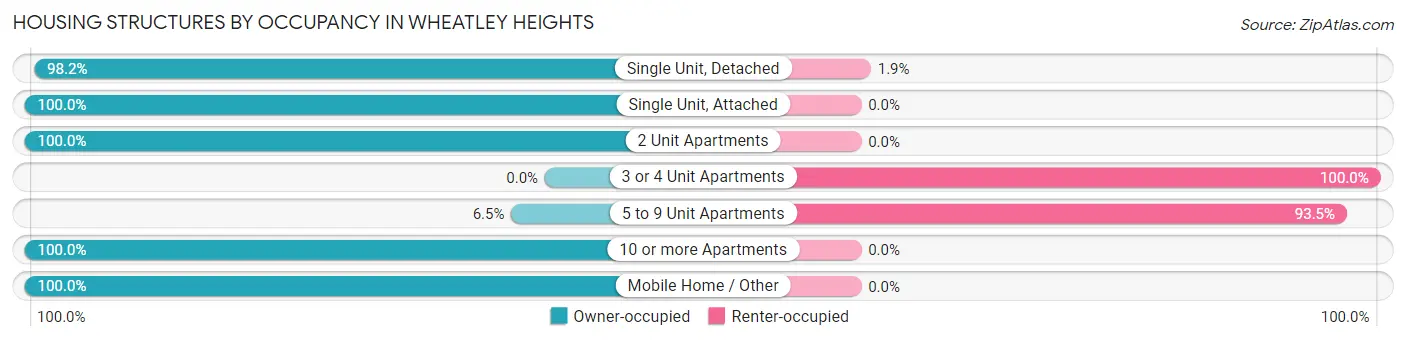
| Structure Type | Owner-occupied | Renter-occupied |
| Single Unit, Detached | 1,169 (98.2%) | 22 (1.8%) |
| Single Unit, Attached | 19 (100.0%) | 0 (0.0%) |
| 2 Unit Apartments | 65 (100.0%) | 0 (0.0%) |
| 3 or 4 Unit Apartments | 0 (0.0%) | 10 (100.0%) |
| 5 to 9 Unit Apartments | 5 (6.5%) | 72 (93.5%) |
| 10 or more Apartments | 53 (100.0%) | 0 (0.0%) |
| Mobile Home / Other | 106 (100.0%) | 0 (0.0%) |
| Total | 1,417 (93.2%) | 104 (6.8%) |
Housing Structures by Number of Rooms in Wheatley Heights
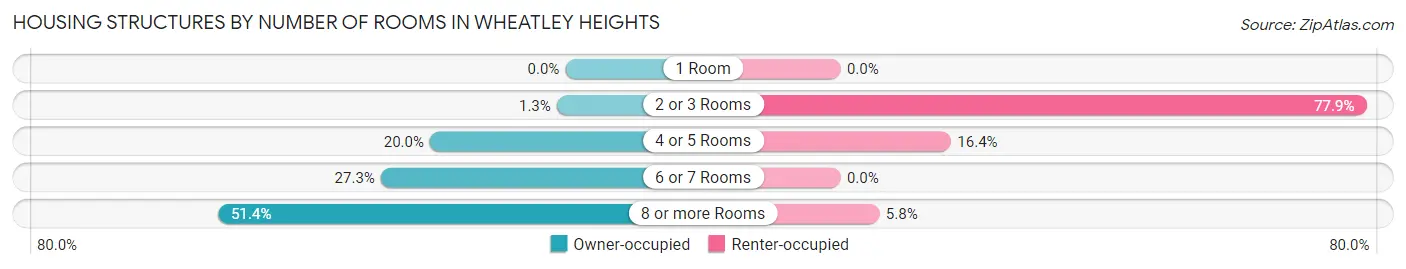
| Number of Rooms | Owner-occupied | Renter-occupied |
| 1 Room | 0 (0.0%) | 0 (0.0%) |
| 2 or 3 Rooms | 18 (1.3%) | 81 (77.9%) |
| 4 or 5 Rooms | 284 (20.0%) | 17 (16.4%) |
| 6 or 7 Rooms | 387 (27.3%) | 0 (0.0%) |
| 8 or more Rooms | 728 (51.4%) | 6 (5.8%) |
| Total | 1,417 (100.0%) | 104 (100.0%) |
Housing Structure by Heating Type in Wheatley Heights
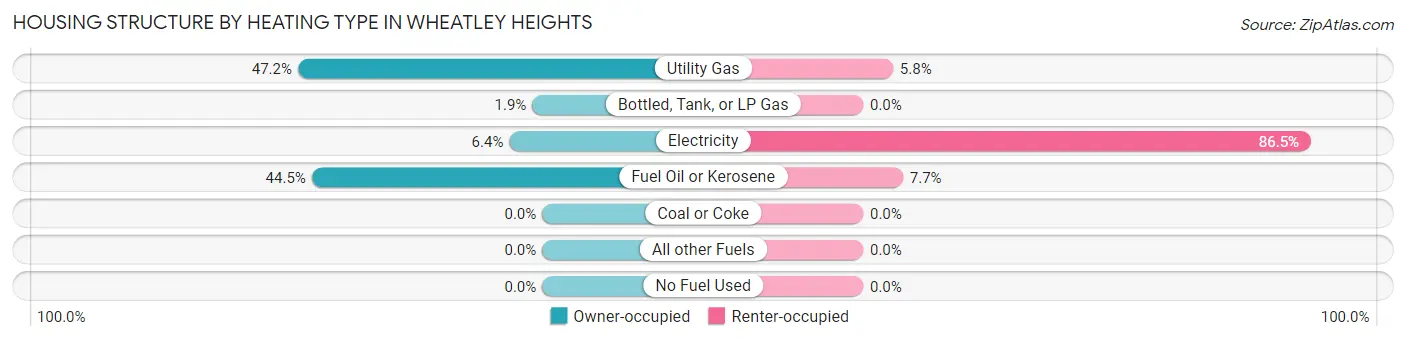
| Heating Type | Owner-occupied | Renter-occupied |
| Utility Gas | 669 (47.2%) | 6 (5.8%) |
| Bottled, Tank, or LP Gas | 27 (1.9%) | 0 (0.0%) |
| Electricity | 90 (6.4%) | 90 (86.5%) |
| Fuel Oil or Kerosene | 631 (44.5%) | 8 (7.7%) |
| Coal or Coke | 0 (0.0%) | 0 (0.0%) |
| All other Fuels | 0 (0.0%) | 0 (0.0%) |
| No Fuel Used | 0 (0.0%) | 0 (0.0%) |
| Total | 1,417 (100.0%) | 104 (100.0%) |
Household Vehicle Usage in Wheatley Heights
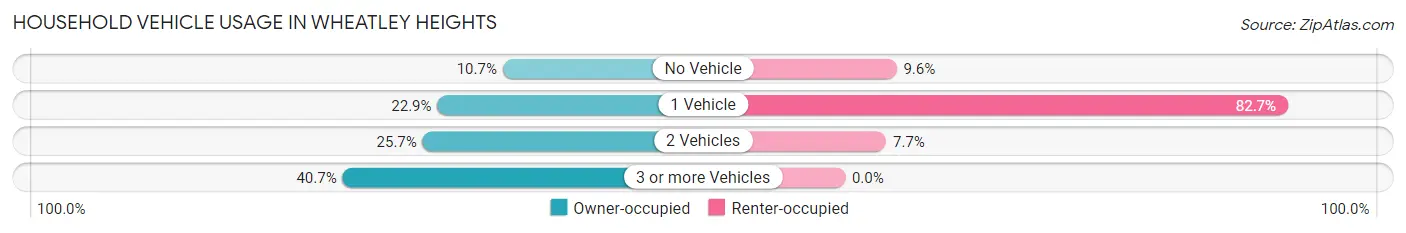
| Vehicles per Household | Owner-occupied | Renter-occupied |
| No Vehicle | 152 (10.7%) | 10 (9.6%) |
| 1 Vehicle | 325 (22.9%) | 86 (82.7%) |
| 2 Vehicles | 364 (25.7%) | 8 (7.7%) |
| 3 or more Vehicles | 576 (40.6%) | 0 (0.0%) |
| Total | 1,417 (100.0%) | 104 (100.0%) |
Real Estate & Mortgages in Wheatley Heights
Real Estate and Mortgage Overview in Wheatley Heights
| Characteristic | Without Mortgage | With Mortgage |
| Housing Units | 529 | 888 |
| Median Property Value | $433,100 | $540,000 |
| Median Household Income | $106,950 | $478 |
| Monthly Housing Costs | $1,296 | $561 |
| Real Estate Taxes | $10,001 | $30 |
Property Value by Mortgage Status in Wheatley Heights
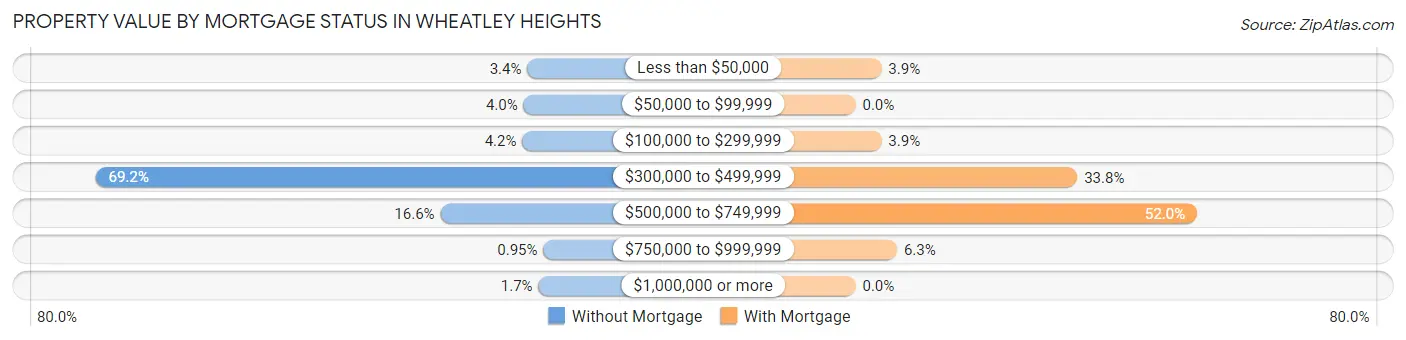
| Property Value | Without Mortgage | With Mortgage |
| Less than $50,000 | 18 (3.4%) | 35 (3.9%) |
| $50,000 to $99,999 | 21 (4.0%) | 0 (0.0%) |
| $100,000 to $299,999 | 22 (4.2%) | 35 (3.9%) |
| $300,000 to $499,999 | 366 (69.2%) | 300 (33.8%) |
| $500,000 to $749,999 | 88 (16.6%) | 462 (52.0%) |
| $750,000 to $999,999 | 5 (0.9%) | 56 (6.3%) |
| $1,000,000 or more | 9 (1.7%) | 0 (0.0%) |
| Total | 529 (100.0%) | 888 (100.0%) |
Household Income by Mortgage Status in Wheatley Heights
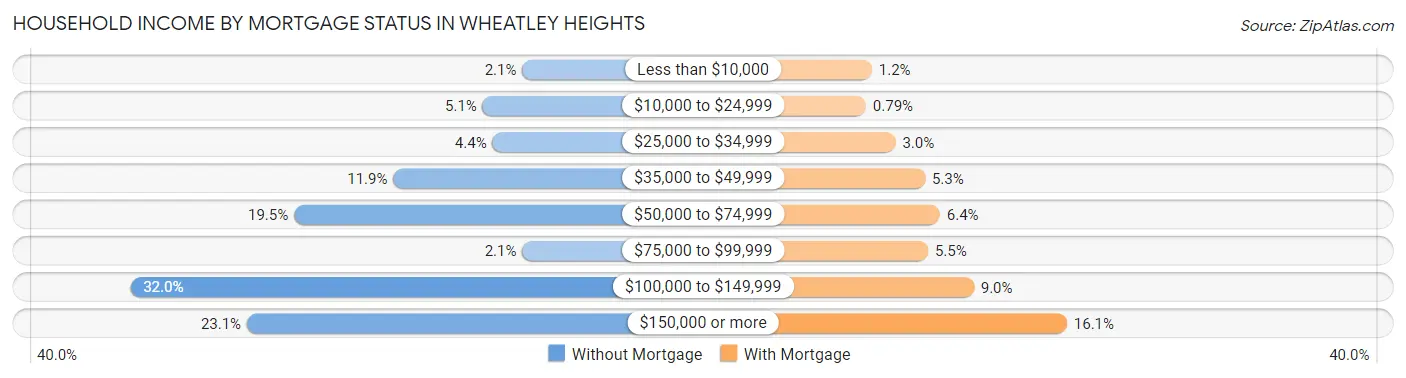
| Household Income | Without Mortgage | With Mortgage |
| Less than $10,000 | 11 (2.1%) | 11 (1.2%) |
| $10,000 to $24,999 | 27 (5.1%) | 7 (0.8%) |
| $25,000 to $34,999 | 23 (4.3%) | 27 (3.0%) |
| $35,000 to $49,999 | 63 (11.9%) | 47 (5.3%) |
| $50,000 to $74,999 | 103 (19.5%) | 57 (6.4%) |
| $75,000 to $99,999 | 11 (2.1%) | 49 (5.5%) |
| $100,000 to $149,999 | 169 (32.0%) | 80 (9.0%) |
| $150,000 or more | 122 (23.1%) | 143 (16.1%) |
| Total | 529 (100.0%) | 888 (100.0%) |
Property Value to Household Income Ratio in Wheatley Heights
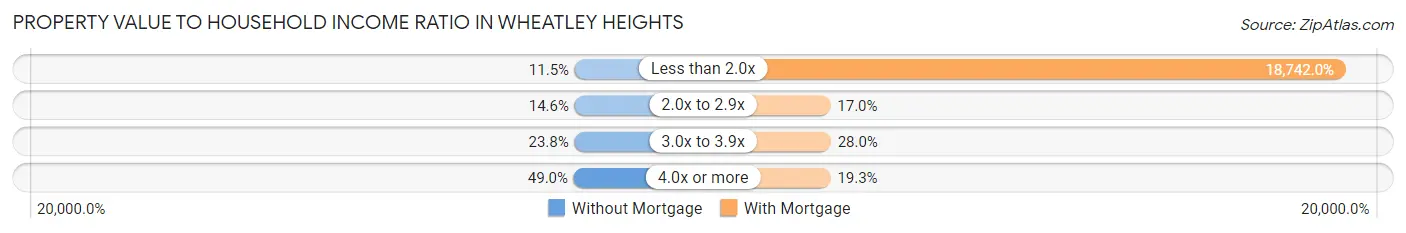
| Value-to-Income Ratio | Without Mortgage | With Mortgage |
| Less than 2.0x | 61 (11.5%) | 166,429 (18,742.0%) |
| 2.0x to 2.9x | 77 (14.6%) | 151 (17.0%) |
| 3.0x to 3.9x | 126 (23.8%) | 249 (28.0%) |
| 4.0x or more | 259 (49.0%) | 171 (19.3%) |
| Total | 529 (100.0%) | 888 (100.0%) |
Real Estate Taxes by Mortgage Status in Wheatley Heights
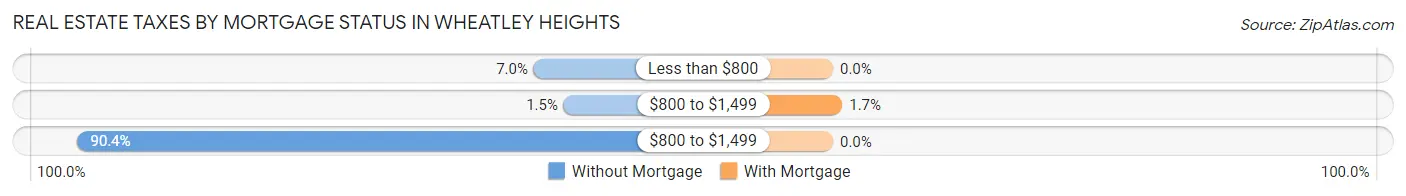
| Property Taxes | Without Mortgage | With Mortgage |
| Less than $800 | 37 (7.0%) | 0 (0.0%) |
| $800 to $1,499 | 8 (1.5%) | 15 (1.7%) |
| $800 to $1,499 | 478 (90.4%) | 0 (0.0%) |
| Total | 529 (100.0%) | 888 (100.0%) |
Health & Disability in Wheatley Heights
Health Insurance Coverage by Age in Wheatley Heights
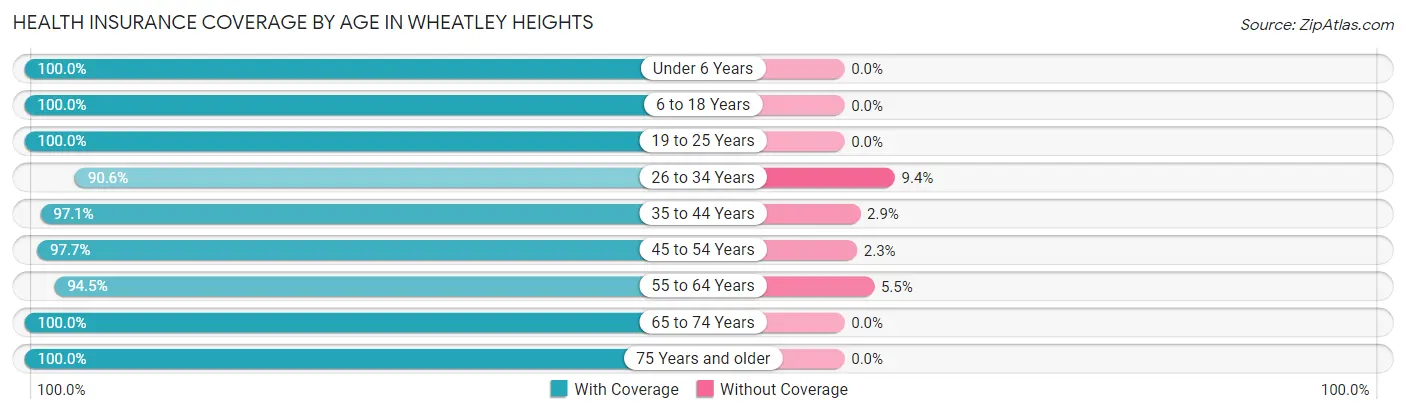
| Age Bracket | With Coverage | Without Coverage |
| Under 6 Years | 411 (100.0%) | 0 (0.0%) |
| 6 to 18 Years | 970 (100.0%) | 0 (0.0%) |
| 19 to 25 Years | 384 (100.0%) | 0 (0.0%) |
| 26 to 34 Years | 628 (90.6%) | 65 (9.4%) |
| 35 to 44 Years | 694 (97.1%) | 21 (2.9%) |
| 45 to 54 Years | 708 (97.7%) | 17 (2.3%) |
| 55 to 64 Years | 683 (94.5%) | 40 (5.5%) |
| 65 to 74 Years | 410 (100.0%) | 0 (0.0%) |
| 75 Years and older | 307 (100.0%) | 0 (0.0%) |
| Total | 5,195 (97.3%) | 143 (2.7%) |
Health Insurance Coverage by Citizenship Status in Wheatley Heights
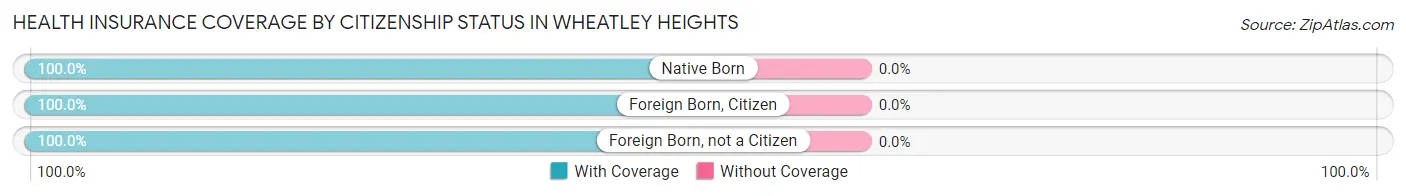
| Citizenship Status | With Coverage | Without Coverage |
| Native Born | 411 (100.0%) | 0 (0.0%) |
| Foreign Born, Citizen | 970 (100.0%) | 0 (0.0%) |
| Foreign Born, not a Citizen | 384 (100.0%) | 0 (0.0%) |
Health Insurance Coverage by Household Income in Wheatley Heights
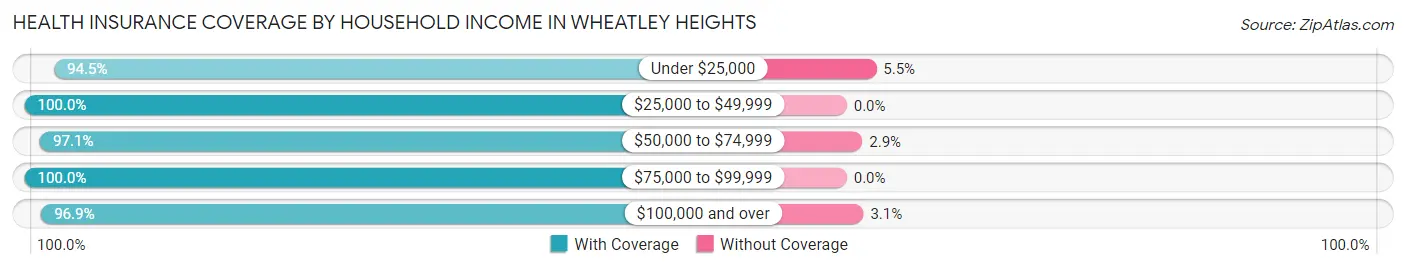
| Household Income | With Coverage | Without Coverage |
| Under $25,000 | 188 (94.5%) | 11 (5.5%) |
| $25,000 to $49,999 | 492 (100.0%) | 0 (0.0%) |
| $50,000 to $74,999 | 233 (97.1%) | 7 (2.9%) |
| $75,000 to $99,999 | 327 (100.0%) | 0 (0.0%) |
| $100,000 and over | 3,887 (96.9%) | 125 (3.1%) |
Public vs Private Health Insurance Coverage by Age in Wheatley Heights
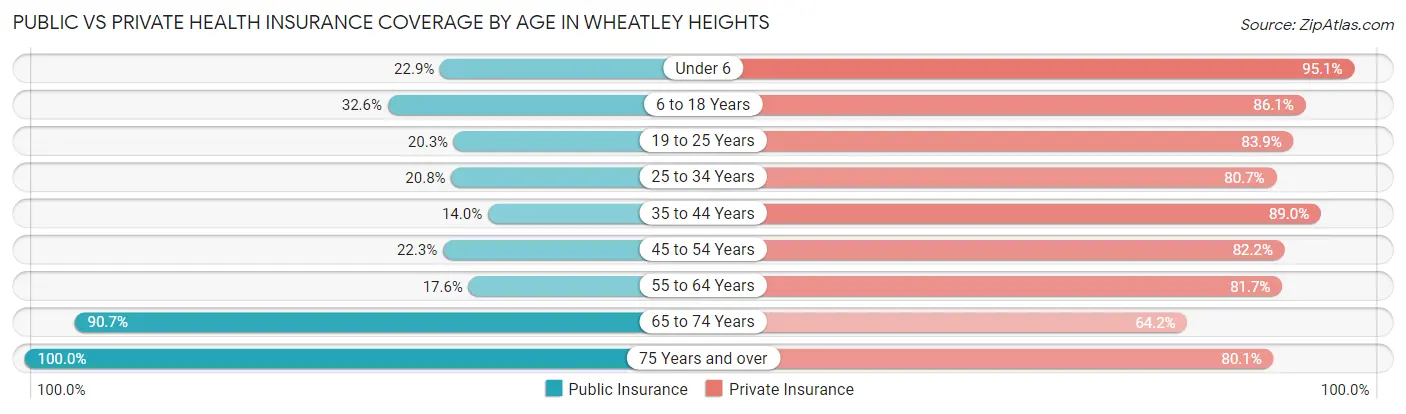
| Age Bracket | Public Insurance | Private Insurance |
| Under 6 | 94 (22.9%) | 391 (95.1%) |
| 6 to 18 Years | 316 (32.6%) | 835 (86.1%) |
| 19 to 25 Years | 78 (20.3%) | 322 (83.9%) |
| 25 to 34 Years | 144 (20.8%) | 559 (80.7%) |
| 35 to 44 Years | 100 (14.0%) | 636 (88.9%) |
| 45 to 54 Years | 162 (22.3%) | 596 (82.2%) |
| 55 to 64 Years | 127 (17.6%) | 591 (81.7%) |
| 65 to 74 Years | 372 (90.7%) | 263 (64.1%) |
| 75 Years and over | 307 (100.0%) | 246 (80.1%) |
| Total | 1,700 (31.9%) | 4,439 (83.2%) |
Disability Status by Sex by Age in Wheatley Heights
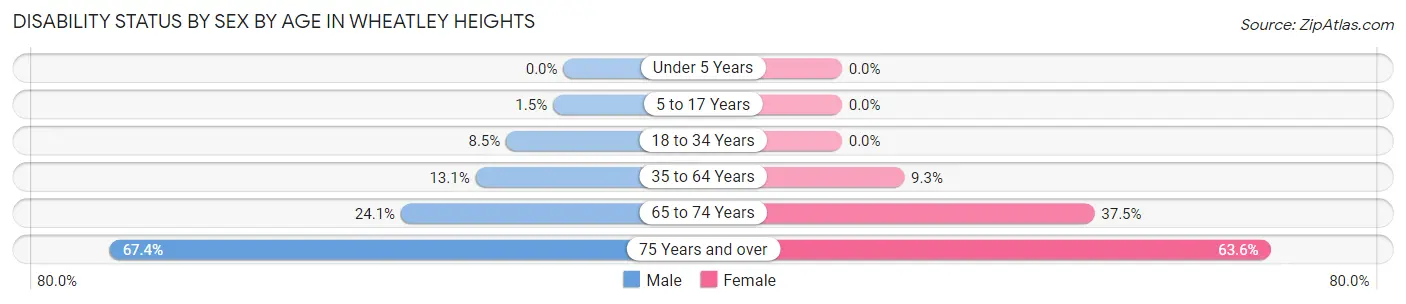
| Age Bracket | Male | Female |
| Under 5 Years | 0 (0.0%) | 0 (0.0%) |
| 5 to 17 Years | 9 (1.5%) | 0 (0.0%) |
| 18 to 34 Years | 46 (8.5%) | 0 (0.0%) |
| 35 to 64 Years | 116 (13.1%) | 118 (9.3%) |
| 65 to 74 Years | 41 (24.1%) | 90 (37.5%) |
| 75 Years and over | 66 (67.3%) | 133 (63.6%) |
Disability Class by Sex by Age in Wheatley Heights
Disability Class: Hearing Difficulty
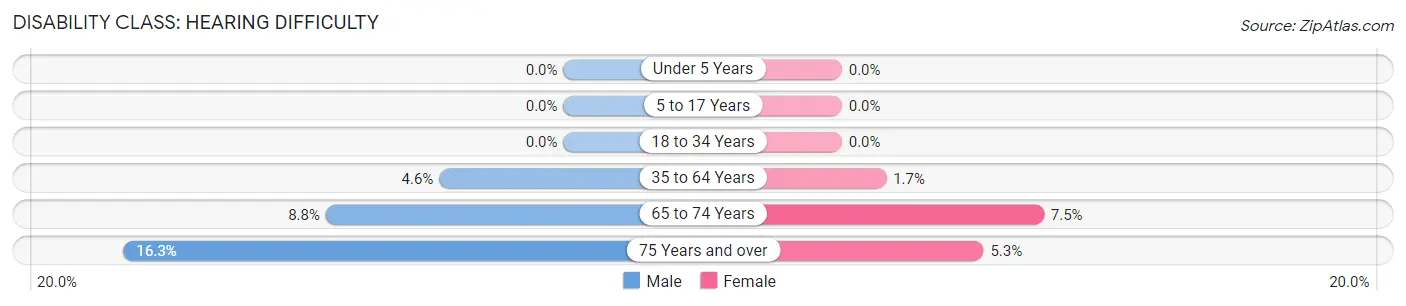
| Age Bracket | Male | Female |
| Under 5 Years | 0 (0.0%) | 0 (0.0%) |
| 5 to 17 Years | 0 (0.0%) | 0 (0.0%) |
| 18 to 34 Years | 0 (0.0%) | 0 (0.0%) |
| 35 to 64 Years | 41 (4.6%) | 21 (1.7%) |
| 65 to 74 Years | 15 (8.8%) | 18 (7.5%) |
| 75 Years and over | 16 (16.3%) | 11 (5.3%) |
Disability Class: Vision Difficulty
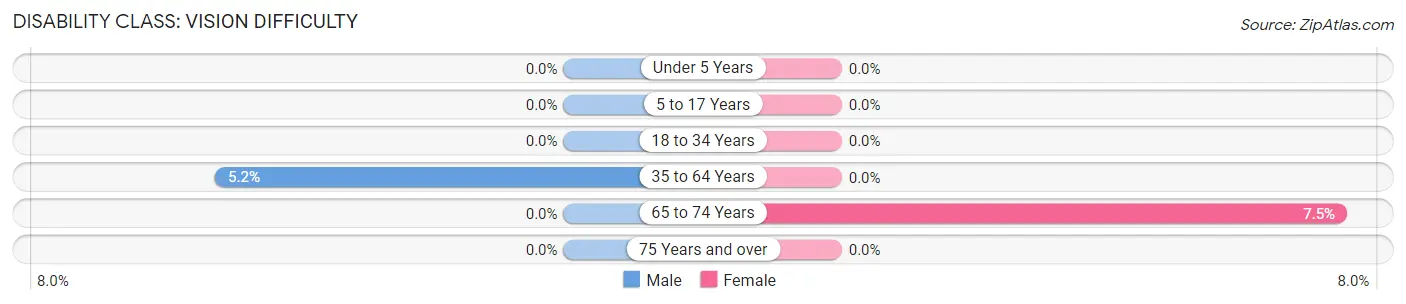
| Age Bracket | Male | Female |
| Under 5 Years | 0 (0.0%) | 0 (0.0%) |
| 5 to 17 Years | 0 (0.0%) | 0 (0.0%) |
| 18 to 34 Years | 0 (0.0%) | 0 (0.0%) |
| 35 to 64 Years | 46 (5.2%) | 0 (0.0%) |
| 65 to 74 Years | 0 (0.0%) | 18 (7.5%) |
| 75 Years and over | 0 (0.0%) | 0 (0.0%) |
Disability Class: Cognitive Difficulty
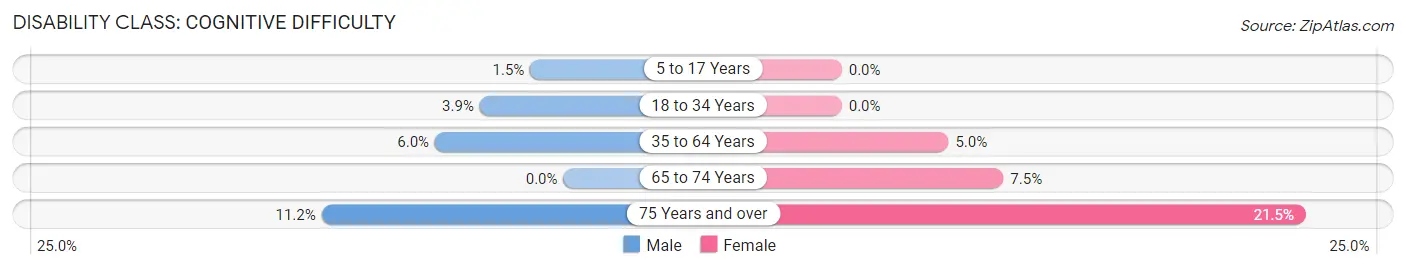
| Age Bracket | Male | Female |
| 5 to 17 Years | 9 (1.5%) | 0 (0.0%) |
| 18 to 34 Years | 21 (3.9%) | 0 (0.0%) |
| 35 to 64 Years | 53 (6.0%) | 63 (5.0%) |
| 65 to 74 Years | 0 (0.0%) | 18 (7.5%) |
| 75 Years and over | 11 (11.2%) | 45 (21.5%) |
Disability Class: Ambulatory Difficulty
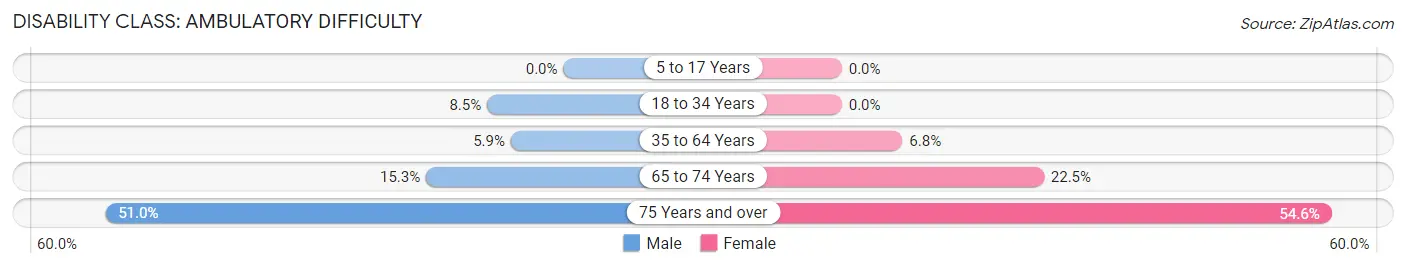
| Age Bracket | Male | Female |
| 5 to 17 Years | 0 (0.0%) | 0 (0.0%) |
| 18 to 34 Years | 46 (8.5%) | 0 (0.0%) |
| 35 to 64 Years | 52 (5.9%) | 86 (6.8%) |
| 65 to 74 Years | 26 (15.3%) | 54 (22.5%) |
| 75 Years and over | 50 (51.0%) | 114 (54.5%) |
Disability Class: Self-Care Difficulty
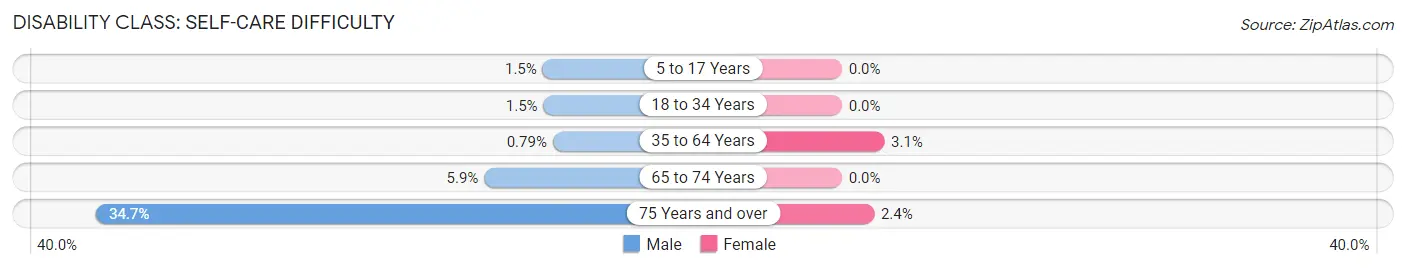
| Age Bracket | Male | Female |
| 5 to 17 Years | 9 (1.5%) | 0 (0.0%) |
| 18 to 34 Years | 8 (1.5%) | 0 (0.0%) |
| 35 to 64 Years | 7 (0.8%) | 40 (3.1%) |
| 65 to 74 Years | 10 (5.9%) | 0 (0.0%) |
| 75 Years and over | 34 (34.7%) | 5 (2.4%) |
Technology Access in Wheatley Heights
Computing Device Access in Wheatley Heights
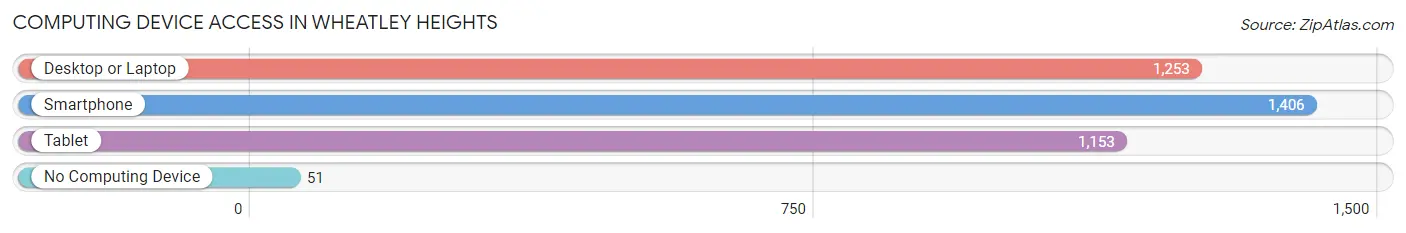
| Device Type | # Households | % Households |
| Desktop or Laptop | 1,253 | 82.4% |
| Smartphone | 1,406 | 92.4% |
| Tablet | 1,153 | 75.8% |
| No Computing Device | 51 | 3.4% |
| Total | 1,521 | 100.0% |
Internet Access in Wheatley Heights
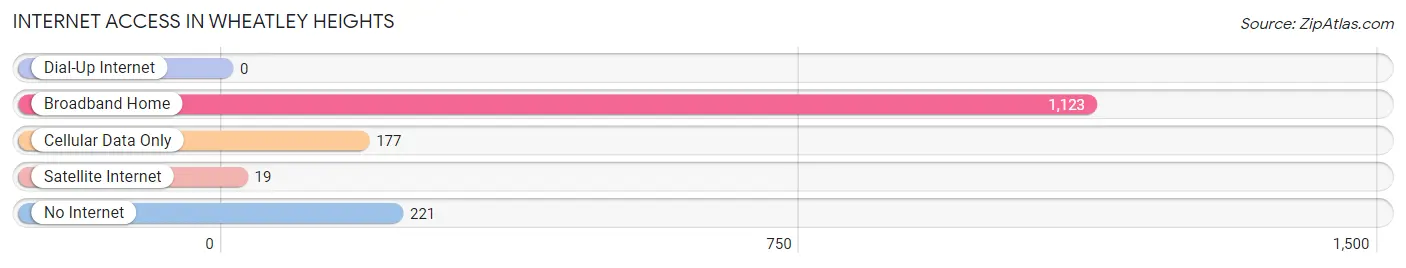
| Internet Type | # Households | % Households |
| Dial-Up Internet | 0 | 0.0% |
| Broadband Home | 1,123 | 73.8% |
| Cellular Data Only | 177 | 11.6% |
| Satellite Internet | 19 | 1.3% |
| No Internet | 221 | 14.5% |
| Total | 1,521 | 100.0% |
Wheatley Heights Summary
Wheatley Heights is a hamlet located in the Town of Babylon in Suffolk County, New York. It is situated on the South Shore of Long Island, approximately 50 miles east of New York City. The hamlet is bordered by Dix Hills to the west, Wyandanch to the east, North Babylon to the north, and Deer Park to the south.
History
The area now known as Wheatley Heights was originally inhabited by the Secatogue Indians, a branch of the Algonquin tribe. The area was first settled by Europeans in the late 1600s, and was known as “Wheatley” after the Wheatley family, who were among the first settlers. The area was renamed “Wheatley Heights” in the late 1800s, when the area began to develop as a residential community.
Geography
Wheatley Heights is located on the South Shore of Long Island, approximately 50 miles east of New York City. The hamlet is bordered by Dix Hills to the west, Wyandanch to the east, North Babylon to the north, and Deer Park to the south. The area is mostly flat, with some rolling hills. The highest point in the area is the summit of the Pine Hill, which is located in the northern part of the hamlet and rises to an elevation of approximately 200 feet.
Economy
The economy of Wheatley Heights is largely based on retail and services. The hamlet is home to several shopping centers, including the Wheatley Plaza Shopping Center, which is anchored by a Stop & Shop supermarket. Other businesses in the area include restaurants, banks, and other retail stores. The hamlet is also home to several industrial parks, which provide employment opportunities for local residents.
Demographics
As of the 2010 census, the population of Wheatley Heights was 8,845. The racial makeup of the hamlet was 57.3% White, 28.2% African American, 0.3% Native American, 5.2% Asian, and 8.9% from other races. The median household income was $77,845, and the median family income was $87,845. The unemployment rate was 5.2%.
Conclusion
Wheatley Heights is a hamlet located in the Town of Babylon in Suffolk County, New York. It is situated on the South Shore of Long Island, approximately 50 miles east of New York City. The hamlet is bordered by Dix Hills to the west, Wyandanch to the east, North Babylon to the north, and Deer Park to the south. The economy of Wheatley Heights is largely based on retail and services, and the hamlet is home to several shopping centers and industrial parks. As of the 2010 census, the population of Wheatley Heights was 8,845, with a median household income of $77,845 and a median family income of $87,845.
Common Questions
What is Per Capita Income in Wheatley Heights?
Per Capita income in Wheatley Heights is $39,881.
What is the Median Family Income in Wheatley Heights?
Median Family Income in Wheatley Heights is $141,229.
What is the Median Household income in Wheatley Heights?
Median Household Income in Wheatley Heights is $133,125.
What is Income or Wage Gap in Wheatley Heights?
Income or Wage Gap in Wheatley Heights is 2.9%.
Women in Wheatley Heights earn 97.1 cents for every dollar earned by a man.
What is Inequality or Gini Index in Wheatley Heights?
Inequality or Gini Index in Wheatley Heights is 0.37.
What is the Total Population of Wheatley Heights?
Total Population of Wheatley Heights is 5,338.
What is the Total Male Population of Wheatley Heights?
Total Male Population of Wheatley Heights is 2,498.
What is the Total Female Population of Wheatley Heights?
Total Female Population of Wheatley Heights is 2,840.
What is the Ratio of Males per 100 Females in Wheatley Heights?
There are 87.96 Males per 100 Females in Wheatley Heights.
What is the Ratio of Females per 100 Males in Wheatley Heights?
There are 113.69 Females per 100 Males in Wheatley Heights.
What is the Median Population Age in Wheatley Heights?
Median Population Age in Wheatley Heights is 36.9 Years.
What is the Average Family Size in Wheatley Heights
Average Family Size in Wheatley Heights is 4.0 People.
What is the Average Household Size in Wheatley Heights
Average Household Size in Wheatley Heights is 3.5 People.
How Large is the Labor Force in Wheatley Heights?
There are 2,697 People in the Labor Forcein in Wheatley Heights.
What is the Percentage of People in the Labor Force in Wheatley Heights?
64.5% of People are in the Labor Force in Wheatley Heights.
What is the Unemployment Rate in Wheatley Heights?
Unemployment Rate in Wheatley Heights is 3.1%.