Greece, NY Map & Demographics
Greece Map
Greece Overview
$37,717
PER CAPITA INCOME
$92,631
AVG FAMILY INCOME
$66,708
AVG HOUSEHOLD INCOME
18.9%
WAGE / INCOME GAP [ % ]
81.1¢/ $1
WAGE / INCOME GAP [ $ ]
0.42
INEQUALITY / GINI INDEX
14,406
TOTAL POPULATION
6,770
MALE POPULATION
7,636
FEMALE POPULATION
88.66
MALES / 100 FEMALES
112.79
FEMALES / 100 MALES
44.3
MEDIAN AGE
2.9
AVG FAMILY SIZE
2.2
AVG HOUSEHOLD SIZE
7,628
LABOR FORCE [ PEOPLE ]
62.3%
PERCENT IN LABOR FORCE
5.0%
UNEMPLOYMENT RATE
Greece Area Codes
Income in Greece
Income Overview in Greece
Per Capita Income in Greece is $37,717, while median incomes of families and households are $92,631 and $66,708 respectively.
| Characteristic | Number | Measure |
| Per Capita Income | 14,406 | $37,717 |
| Median Family Income | 3,585 | $92,631 |
| Mean Family Income | 3,585 | $102,197 |
| Median Household Income | 6,515 | $66,708 |
| Mean Household Income | 6,515 | $82,164 |
| Income Deficit | 3,585 | $0 |
| Wage / Income Gap (%) | 14,406 | 18.89% |
| Wage / Income Gap ($) | 14,406 | 81.11¢ per $1 |
| Gini / Inequality Index | 14,406 | 0.42 |
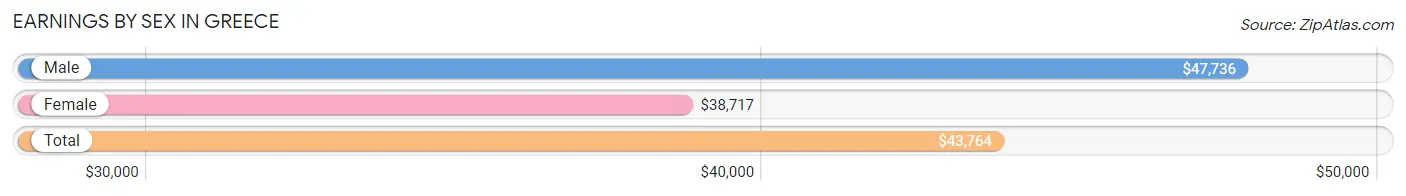
Earnings by Sex in Greece
Average Earnings in Greece are $43,764, $47,736 for men and $38,717 for women, a difference of 18.9%.
| Sex | Number | Average Earnings |
| Male | 3,917 (50.1%) | $47,736 |
| Female | 3,900 (49.9%) | $38,717 |
| Total | 7,817 (100.0%) | $43,764 |
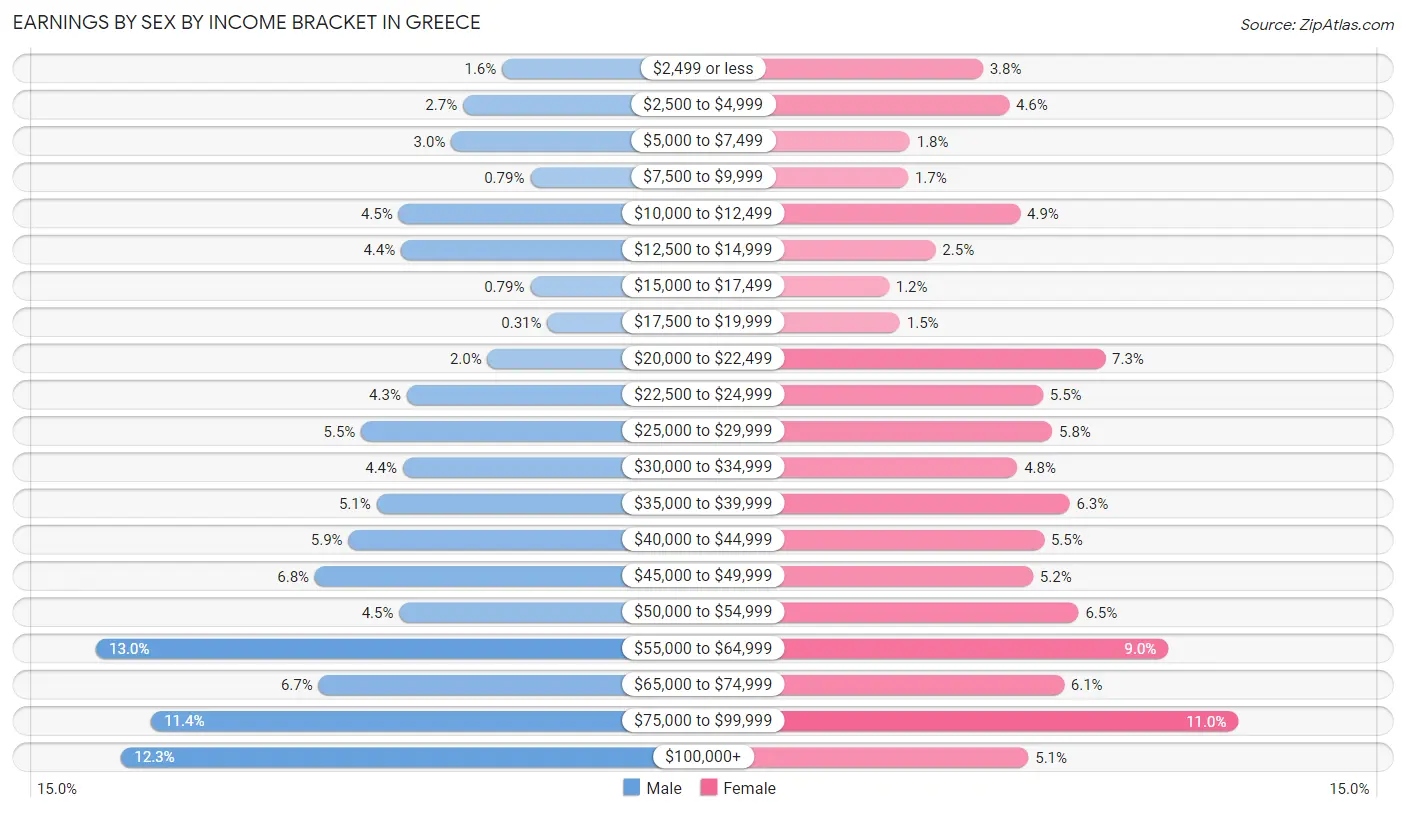
Earnings by Sex by Income Bracket in Greece
The most common earnings brackets in Greece are $55,000 to $64,999 for men (509 | 13.0%) and $75,000 to $99,999 for women (429 | 11.0%).
| Income | Male | Female |
| $2,499 or less | 62 (1.6%) | 149 (3.8%) |
| $2,500 to $4,999 | 105 (2.7%) | 178 (4.6%) |
| $5,000 to $7,499 | 118 (3.0%) | 69 (1.8%) |
| $7,500 to $9,999 | 31 (0.8%) | 67 (1.7%) |
| $10,000 to $12,499 | 176 (4.5%) | 190 (4.9%) |
| $12,500 to $14,999 | 173 (4.4%) | 97 (2.5%) |
| $15,000 to $17,499 | 31 (0.8%) | 46 (1.2%) |
| $17,500 to $19,999 | 12 (0.3%) | 58 (1.5%) |
| $20,000 to $22,499 | 78 (2.0%) | 283 (7.3%) |
| $22,500 to $24,999 | 167 (4.3%) | 215 (5.5%) |
| $25,000 to $29,999 | 217 (5.5%) | 225 (5.8%) |
| $30,000 to $34,999 | 171 (4.4%) | 187 (4.8%) |
| $35,000 to $39,999 | 200 (5.1%) | 244 (6.3%) |
| $40,000 to $44,999 | 231 (5.9%) | 216 (5.5%) |
| $45,000 to $49,999 | 268 (6.8%) | 204 (5.2%) |
| $50,000 to $54,999 | 175 (4.5%) | 254 (6.5%) |
| $55,000 to $64,999 | 509 (13.0%) | 352 (9.0%) |
| $65,000 to $74,999 | 264 (6.7%) | 238 (6.1%) |
| $75,000 to $99,999 | 448 (11.4%) | 429 (11.0%) |
| $100,000+ | 481 (12.3%) | 199 (5.1%) |
| Total | 3,917 (100.0%) | 3,900 (100.0%) |
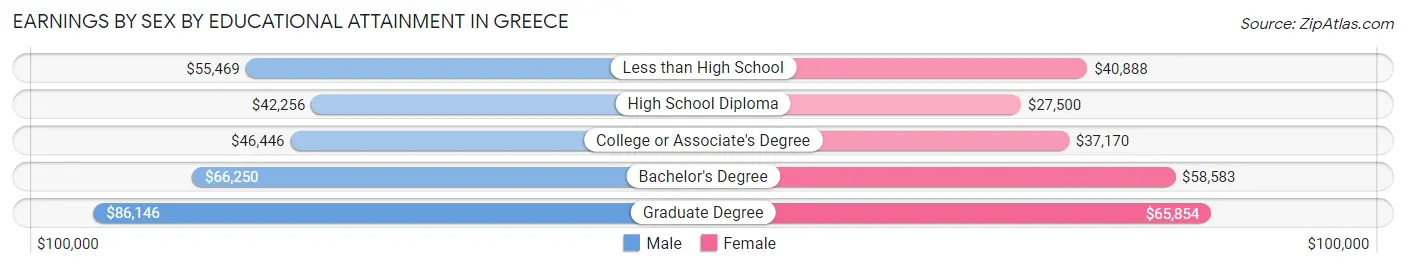
Earnings by Sex by Educational Attainment in Greece
Average earnings in Greece are $54,394 for men and $41,961 for women, a difference of 22.9%. Men with an educational attainment of graduate degree enjoy the highest average annual earnings of $86,146, while those with high school diploma education earn the least with $42,256. Women with an educational attainment of graduate degree earn the most with the average annual earnings of $65,854, while those with high school diploma education have the smallest earnings of $27,500.
| Educational Attainment | Male Income | Female Income |
| Less than High School | $55,469 | $40,888 |
| High School Diploma | $42,256 | $27,500 |
| College or Associate's Degree | $46,446 | $37,170 |
| Bachelor's Degree | $66,250 | $58,583 |
| Graduate Degree | $86,146 | $65,854 |
| Total | $54,394 | $41,961 |
Family Income in Greece
Family Income Brackets in Greece
According to the Greece family income data, there are 961 families falling into the $100,000 to $149,999 income range, which is the most common income bracket and makes up 26.8% of all families. Conversely, the $10,000 to $14,999 income bracket is the least frequent group with only 39 families (1.1%) belonging to this category.
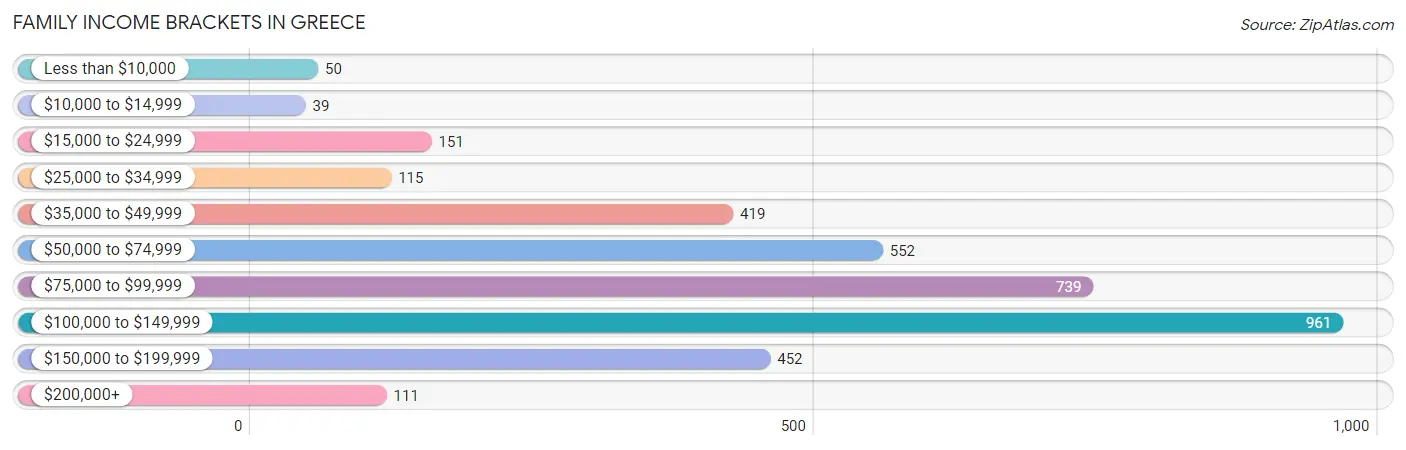
| Income Bracket | # Families | % Families |
| Less than $10,000 | 50 | 1.4% |
| $10,000 to $14,999 | 39 | 1.1% |
| $15,000 to $24,999 | 151 | 4.2% |
| $25,000 to $34,999 | 115 | 3.2% |
| $35,000 to $49,999 | 419 | 11.7% |
| $50,000 to $74,999 | 552 | 15.4% |
| $75,000 to $99,999 | 739 | 20.6% |
| $100,000 to $149,999 | 961 | 26.8% |
| $150,000 to $199,999 | 452 | 12.6% |
| $200,000+ | 111 | 3.1% |
Family Income by Famaliy Size in Greece
6-person families (81 | 2.3%) account for the highest median family income in Greece with $145,417 per family, while 2-person families (1,851 | 51.6%) have the highest median income of $44,162 per family member.
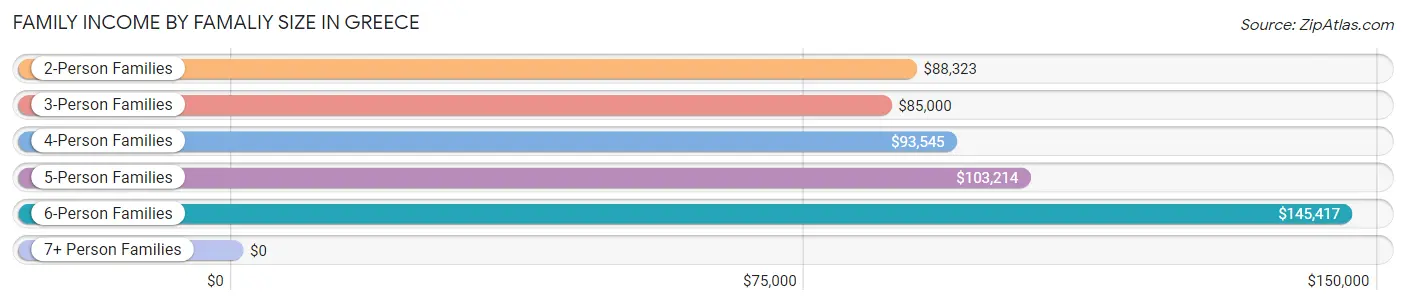
| Income Bracket | # Families | Median Income |
| 2-Person Families | 1,851 (51.6%) | $88,323 |
| 3-Person Families | 896 (25.0%) | $85,000 |
| 4-Person Families | 596 (16.6%) | $93,545 |
| 5-Person Families | 84 (2.3%) | $103,214 |
| 6-Person Families | 81 (2.3%) | $145,417 |
| 7+ Person Families | 77 (2.1%) | $0 |
| Total | 3,585 (100.0%) | $92,631 |
Family Income by Number of Earners in Greece
The median family income in Greece is $92,631, with families comprising 3+ earners (524) having the highest median family income of $111,875, while families with no earners (658) have the lowest median family income of $42,435, accounting for 14.6% and 18.3% of families, respectively.
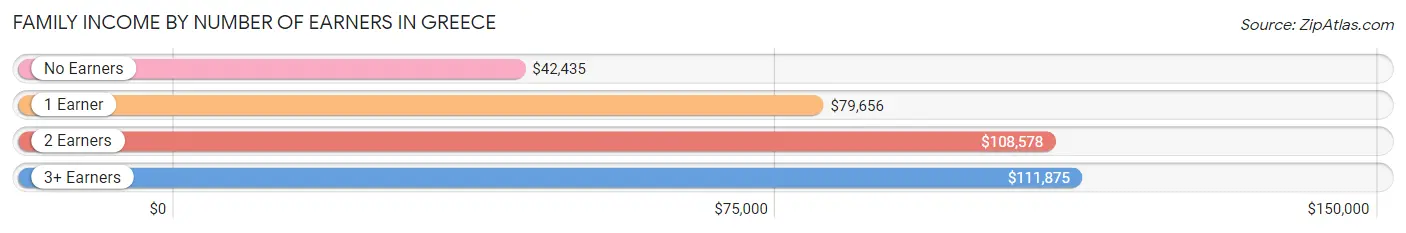
| Number of Earners | # Families | Median Income |
| No Earners | 658 (18.3%) | $42,435 |
| 1 Earner | 1,055 (29.4%) | $79,656 |
| 2 Earners | 1,348 (37.6%) | $108,578 |
| 3+ Earners | 524 (14.6%) | $111,875 |
| Total | 3,585 (100.0%) | $92,631 |
Household Income in Greece
Household Income Brackets in Greece
With 1,349 households falling in the category, the $100,000 to $149,999 income range is the most frequent in Greece, accounting for 20.7% of all households. In contrast, only 189 households (2.9%) fall into the $200,000+ income bracket, making it the least populous group.
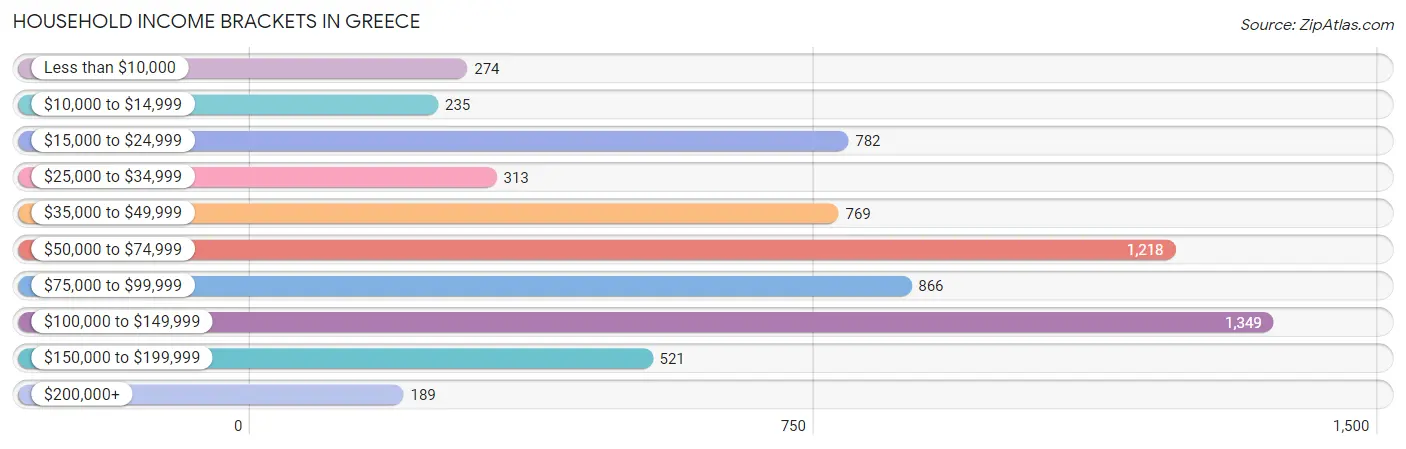
| Income Bracket | # Households | % Households |
| Less than $10,000 | 274 | 4.2% |
| $10,000 to $14,999 | 235 | 3.6% |
| $15,000 to $24,999 | 782 | 12.0% |
| $25,000 to $34,999 | 313 | 4.8% |
| $35,000 to $49,999 | 769 | 11.8% |
| $50,000 to $74,999 | 1,218 | 18.7% |
| $75,000 to $99,999 | 866 | 13.3% |
| $100,000 to $149,999 | 1,349 | 20.7% |
| $150,000 to $199,999 | 521 | 8.0% |
| $200,000+ | 189 | 2.9% |
Household Income by Householder Age in Greece
The median household income in Greece is $66,708, with the highest median household income of $91,005 found in the 45 to 64 years age bracket for the primary householder. A total of 2,181 households (33.5%) fall into this category. Meanwhile, the 15 to 24 years age bracket for the primary householder has the lowest median household income of $0, with 127 households (1.9%) in this group.
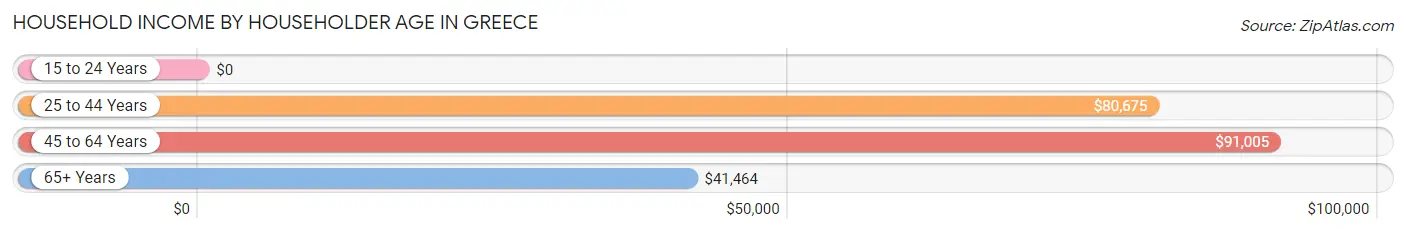
| Income Bracket | # Households | Median Income |
| 15 to 24 Years | 127 (1.9%) | $0 |
| 25 to 44 Years | 1,991 (30.6%) | $80,675 |
| 45 to 64 Years | 2,181 (33.5%) | $91,005 |
| 65+ Years | 2,216 (34.0%) | $41,464 |
| Total | 6,515 (100.0%) | $66,708 |
Poverty in Greece
Income Below Poverty by Sex and Age in Greece
With 7.1% poverty level for males and 12.2% for females among the residents of Greece, 12 to 14 year old males and 15 year old females are the most vulnerable to poverty, with 42 males (21.9%) and 32 females (36.4%) in their respective age groups living below the poverty level.
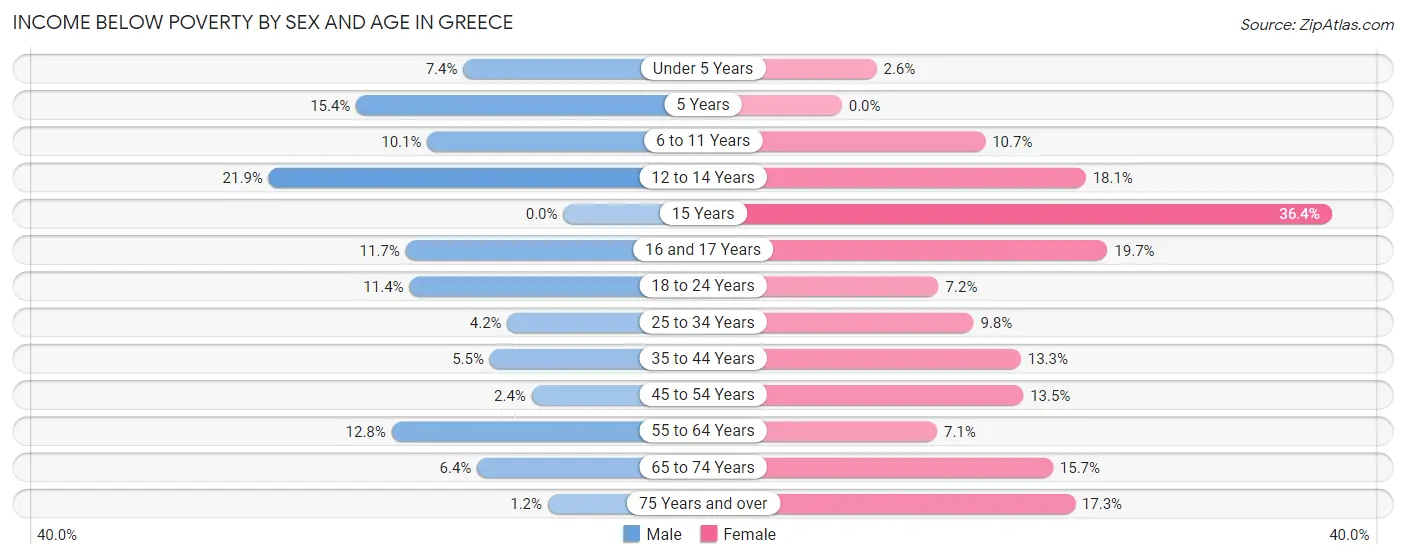
| Age Bracket | Male | Female |
| Under 5 Years | 24 (7.4%) | 10 (2.6%) |
| 5 Years | 12 (15.4%) | 0 (0.0%) |
| 6 to 11 Years | 41 (10.1%) | 33 (10.6%) |
| 12 to 14 Years | 42 (21.9%) | 23 (18.1%) |
| 15 Years | 0 (0.0%) | 32 (36.4%) |
| 16 and 17 Years | 13 (11.7%) | 42 (19.7%) |
| 18 to 24 Years | 64 (11.4%) | 36 (7.2%) |
| 25 to 34 Years | 42 (4.2%) | 101 (9.8%) |
| 35 to 44 Years | 49 (5.5%) | 111 (13.3%) |
| 45 to 54 Years | 20 (2.4%) | 144 (13.5%) |
| 55 to 64 Years | 121 (12.8%) | 72 (7.1%) |
| 65 to 74 Years | 45 (6.4%) | 136 (15.7%) |
| 75 Years and over | 6 (1.1%) | 185 (17.3%) |
| Total | 479 (7.1%) | 925 (12.2%) |
Income Above Poverty by Sex and Age in Greece
According to the poverty statistics in Greece, males aged 15 years and females aged 5 years are the age groups that are most secure financially, with 100.0% of males and 100.0% of females in these age groups living above the poverty line.
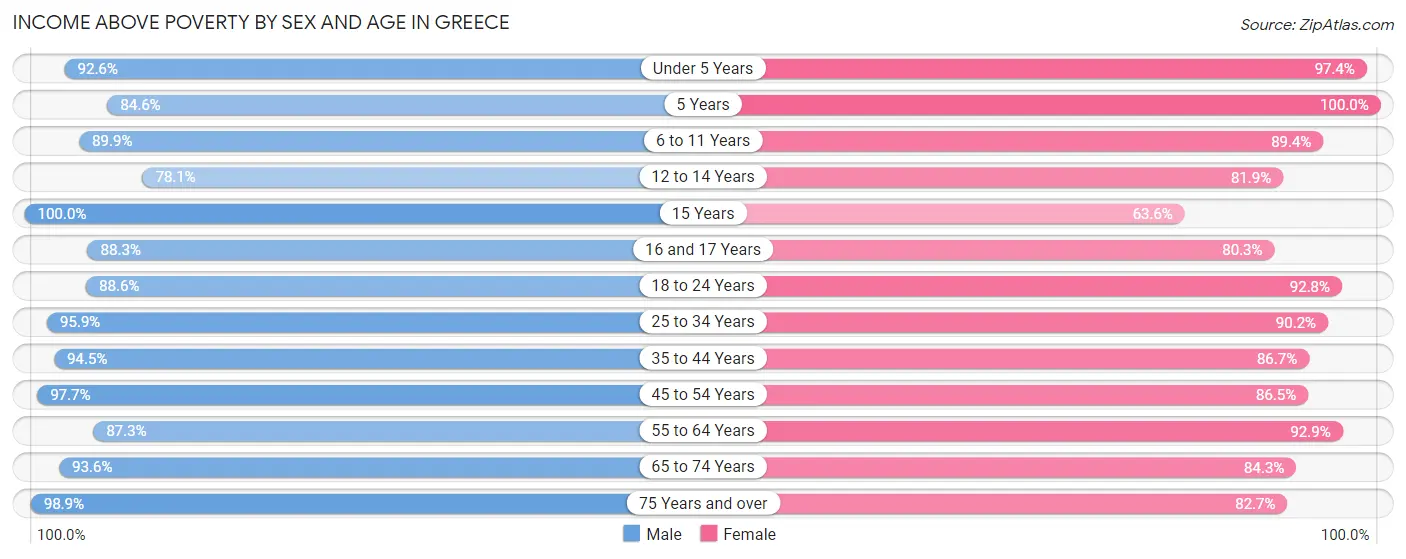
| Age Bracket | Male | Female |
| Under 5 Years | 299 (92.6%) | 378 (97.4%) |
| 5 Years | 66 (84.6%) | 90 (100.0%) |
| 6 to 11 Years | 365 (89.9%) | 277 (89.3%) |
| 12 to 14 Years | 150 (78.1%) | 104 (81.9%) |
| 15 Years | 160 (100.0%) | 56 (63.6%) |
| 16 and 17 Years | 98 (88.3%) | 171 (80.3%) |
| 18 to 24 Years | 496 (88.6%) | 465 (92.8%) |
| 25 to 34 Years | 971 (95.9%) | 932 (90.2%) |
| 35 to 44 Years | 849 (94.5%) | 724 (86.7%) |
| 45 to 54 Years | 831 (97.7%) | 925 (86.5%) |
| 55 to 64 Years | 828 (87.3%) | 947 (92.9%) |
| 65 to 74 Years | 658 (93.6%) | 732 (84.3%) |
| 75 Years and over | 514 (98.9%) | 884 (82.7%) |
| Total | 6,285 (92.9%) | 6,685 (87.8%) |
Income Below Poverty Among Married-Couple Families in Greece
The poverty statistics for married-couple families in Greece show that 3.3% or 81 of the total 2,455 families live below the poverty line. Families with no children have the highest poverty rate of 4.8%, comprising of 76 families. On the other hand, families with 1 or 2 children have the lowest poverty rate of 0.0%, which includes 0 families.
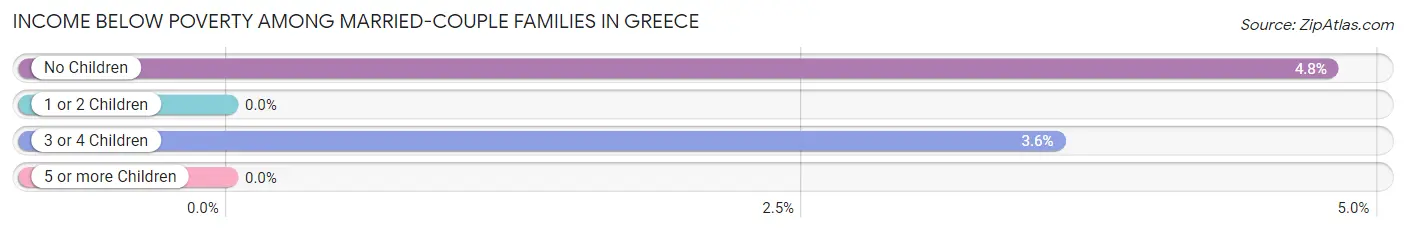
| Children | Above Poverty | Below Poverty |
| No Children | 1,512 (95.2%) | 76 (4.8%) |
| 1 or 2 Children | 688 (100.0%) | 0 (0.0%) |
| 3 or 4 Children | 134 (96.4%) | 5 (3.6%) |
| 5 or more Children | 40 (100.0%) | 0 (0.0%) |
| Total | 2,374 (96.7%) | 81 (3.3%) |
Income Below Poverty Among Single-Parent Households in Greece
According to the poverty data in Greece, 12.1% or 35 single-father households and 15.1% or 127 single-mother households are living below the poverty line. Among single-father households, those with no children have the highest poverty rate, with 35 households (26.9%) experiencing poverty. Likewise, among single-mother households, those with 3 or 4 children have the highest poverty rate, with 42 households (87.5%) falling below the poverty line.
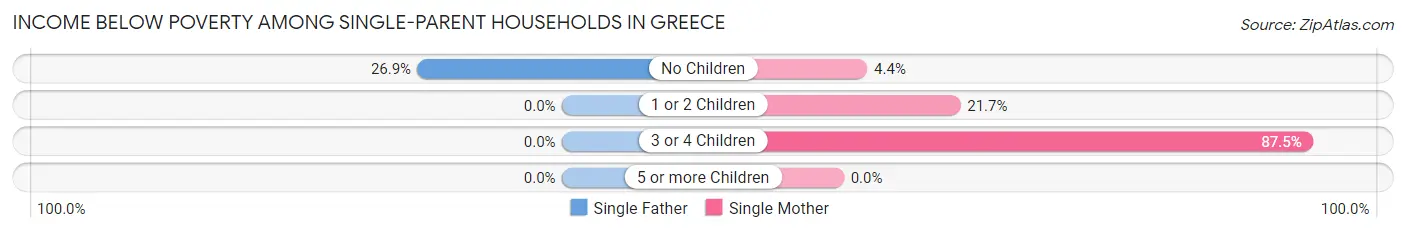
| Children | Single Father | Single Mother |
| No Children | 35 (26.9%) | 22 (4.4%) |
| 1 or 2 Children | 0 (0.0%) | 63 (21.7%) |
| 3 or 4 Children | 0 (0.0%) | 42 (87.5%) |
| 5 or more Children | 0 (0.0%) | 0 (0.0%) |
| Total | 35 (12.1%) | 127 (15.1%) |
Income Below Poverty Among Married-Couple vs Single-Parent Households in Greece
The poverty data for Greece shows that 81 of the married-couple family households (3.3%) and 162 of the single-parent households (14.3%) are living below the poverty level. Within the married-couple family households, those with no children have the highest poverty rate, with 76 households (4.8%) falling below the poverty line. Among the single-parent households, those with 3 or 4 children have the highest poverty rate, with 42 household (87.5%) living below poverty.
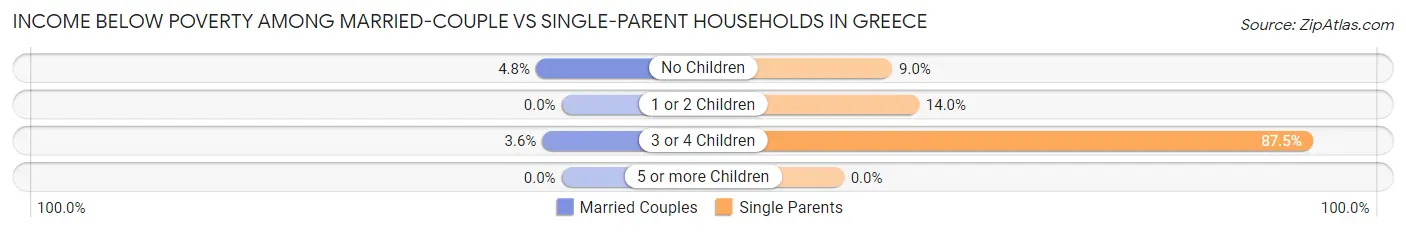
| Children | Married-Couple Families | Single-Parent Households |
| No Children | 76 (4.8%) | 57 (9.0%) |
| 1 or 2 Children | 0 (0.0%) | 63 (14.0%) |
| 3 or 4 Children | 5 (3.6%) | 42 (87.5%) |
| 5 or more Children | 0 (0.0%) | 0 (0.0%) |
| Total | 81 (3.3%) | 162 (14.3%) |
Race in Greece
The most populous races in Greece are White / Caucasian (11,547 | 80.1%), Hispanic or Latino (1,740 | 12.1%), and Black / African American (1,091 | 7.6%).
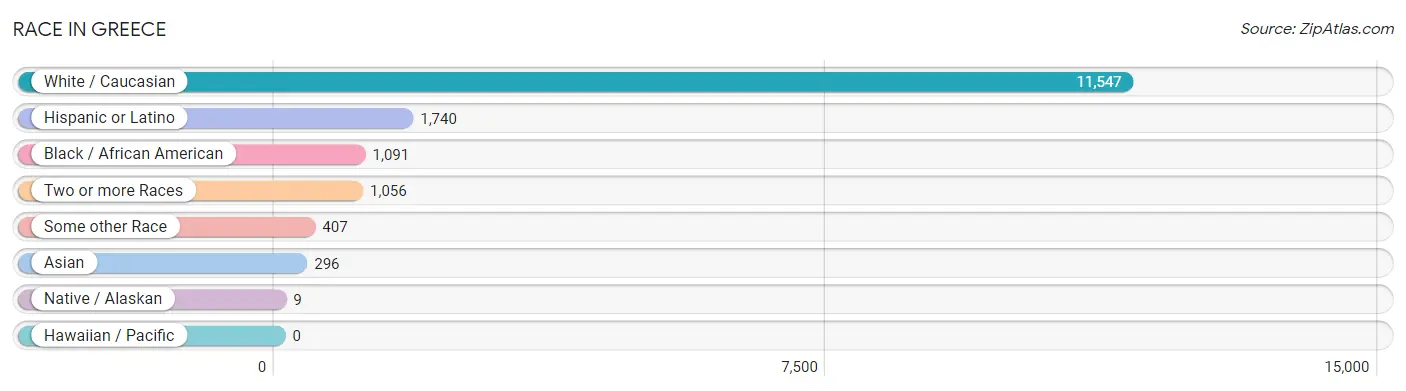
| Race | # Population | % Population |
| Asian | 296 | 2.1% |
| Black / African American | 1,091 | 7.6% |
| Hawaiian / Pacific | 0 | 0.0% |
| Hispanic or Latino | 1,740 | 12.1% |
| Native / Alaskan | 9 | 0.1% |
| White / Caucasian | 11,547 | 80.1% |
| Two or more Races | 1,056 | 7.3% |
| Some other Race | 407 | 2.8% |
| Total | 14,406 | 100.0% |
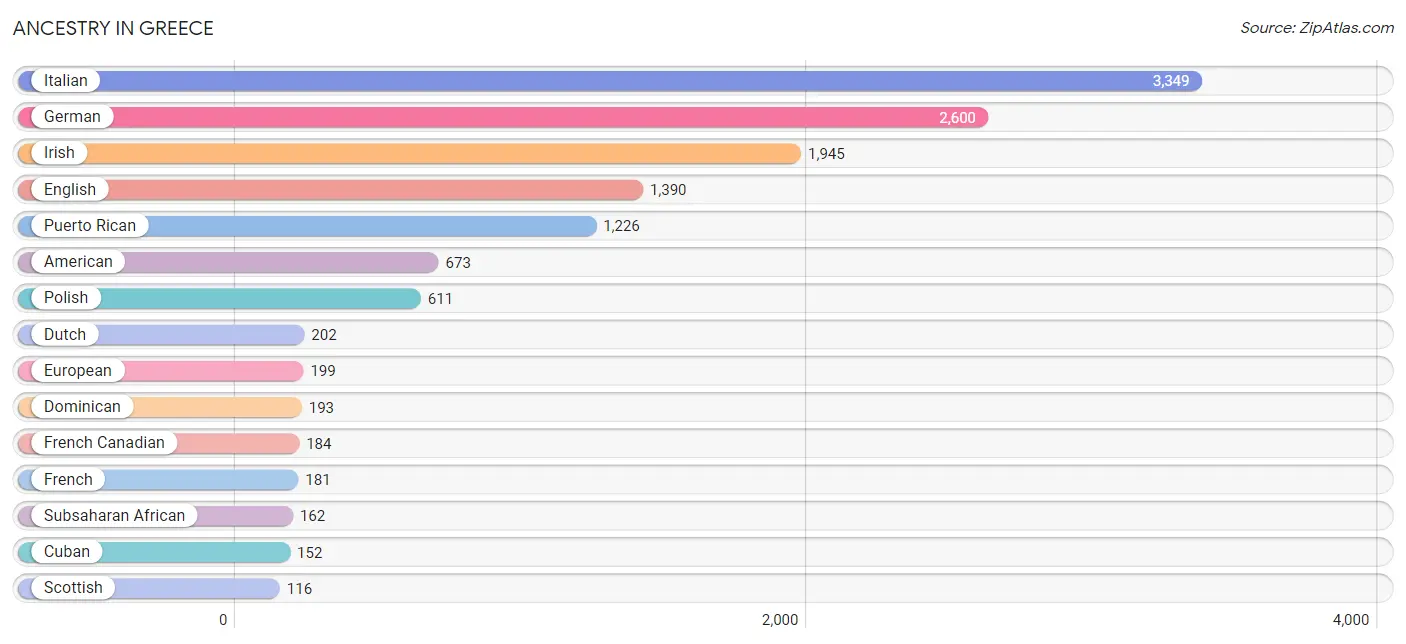
Ancestry in Greece
The most populous ancestries reported in Greece are Italian (3,349 | 23.3%), German (2,600 | 18.0%), Irish (1,945 | 13.5%), English (1,390 | 9.7%), and Puerto Rican (1,226 | 8.5%), together accounting for 73.0% of all Greece residents.
| Ancestry | # Population | % Population |
| African | 31 | 0.2% |
| Albanian | 7 | 0.1% |
| American | 673 | 4.7% |
| Arab | 61 | 0.4% |
| Austrian | 73 | 0.5% |
| Barbadian | 28 | 0.2% |
| Bhutanese | 76 | 0.5% |
| British | 70 | 0.5% |
| Bulgarian | 9 | 0.1% |
| Burmese | 26 | 0.2% |
| Canadian | 58 | 0.4% |
| Central American | 46 | 0.3% |
| Central American Indian | 31 | 0.2% |
| Cherokee | 29 | 0.2% |
| Chilean | 9 | 0.1% |
| Colombian | 13 | 0.1% |
| Costa Rican | 12 | 0.1% |
| Croatian | 12 | 0.1% |
| Cuban | 152 | 1.1% |
| Czechoslovakian | 22 | 0.2% |
| Danish | 8 | 0.1% |
| Dominican | 193 | 1.3% |
| Dutch | 202 | 1.4% |
| Eastern European | 10 | 0.1% |
| English | 1,390 | 9.7% |
| European | 199 | 1.4% |
| Finnish | 7 | 0.1% |
| French | 181 | 1.3% |
| French Canadian | 184 | 1.3% |
| German | 2,600 | 18.0% |
| Greek | 17 | 0.1% |
| Haitian | 16 | 0.1% |
| Honduran | 25 | 0.2% |
| Hungarian | 15 | 0.1% |
| Indian (Asian) | 36 | 0.3% |
| Irish | 1,945 | 13.5% |
| Iroquois | 34 | 0.2% |
| Italian | 3,349 | 23.3% |
| Jamaican | 10 | 0.1% |
| Lebanese | 28 | 0.2% |
| Lithuanian | 25 | 0.2% |
| Malaysian | 69 | 0.5% |
| Mexican | 28 | 0.2% |
| Northern European | 10 | 0.1% |
| Norwegian | 29 | 0.2% |
| Paraguayan | 9 | 0.1% |
| Peruvian | 6 | 0.0% |
| Polish | 611 | 4.2% |
| Portuguese | 8 | 0.1% |
| Puerto Rican | 1,226 | 8.5% |
| Russian | 12 | 0.1% |
| Salvadoran | 9 | 0.1% |
| Scotch-Irish | 92 | 0.6% |
| Scottish | 116 | 0.8% |
| Slovak | 16 | 0.1% |
| Slovene | 16 | 0.1% |
| South American | 37 | 0.3% |
| Spaniard | 37 | 0.3% |
| Sri Lankan | 52 | 0.4% |
| Subsaharan African | 162 | 1.1% |
| Swedish | 59 | 0.4% |
| Thai | 65 | 0.4% |
| Turkish | 48 | 0.3% |
| U.S. Virgin Islander | 28 | 0.2% |
| Ukrainian | 86 | 0.6% |
| Welsh | 50 | 0.4% |
| West Indian | 60 | 0.4% |
| Yugoslavian | 12 | 0.1% | View All 68 Rows |
Immigrants in Greece
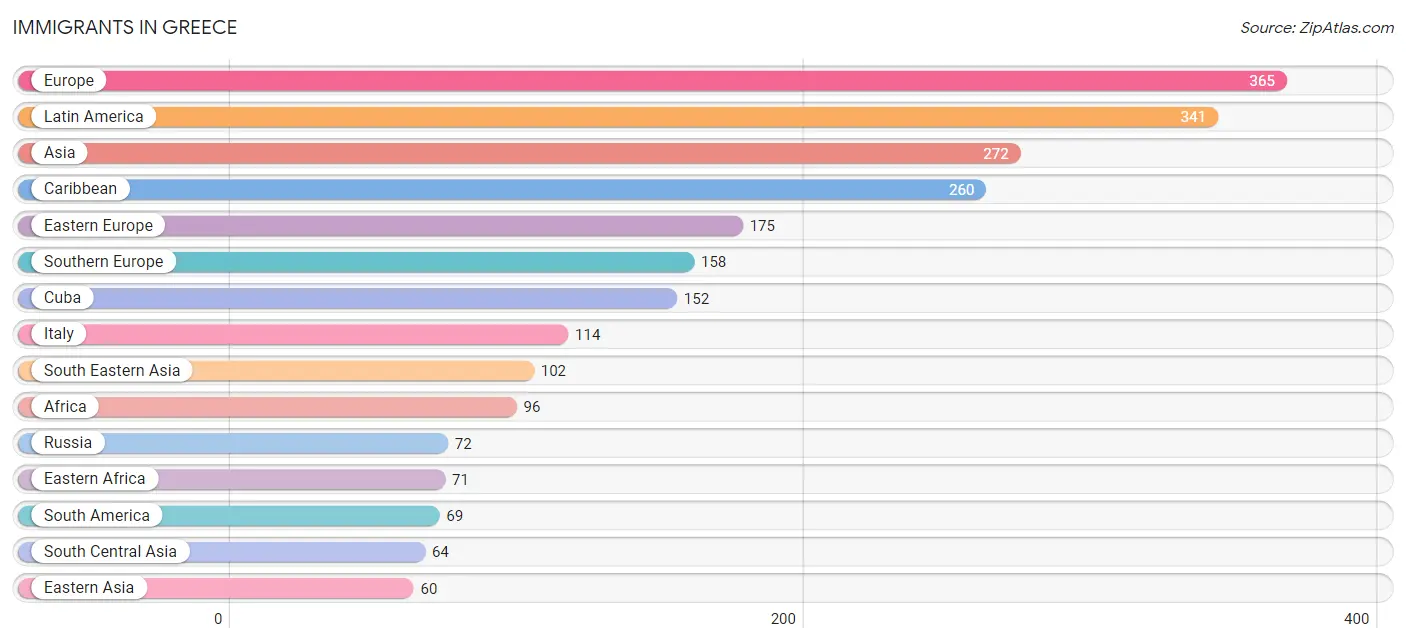
The most numerous immigrant groups reported in Greece came from Europe (365 | 2.5%), Latin America (341 | 2.4%), Asia (272 | 1.9%), Caribbean (260 | 1.8%), and Eastern Europe (175 | 1.2%), together accounting for 9.8% of all Greece residents.
| Immigration Origin | # Population | % Population |
| Africa | 96 | 0.7% |
| Argentina | 38 | 0.3% |
| Asia | 272 | 1.9% |
| Australia | 18 | 0.1% |
| Bulgaria | 9 | 0.1% |
| Canada | 46 | 0.3% |
| Caribbean | 260 | 1.8% |
| Central America | 12 | 0.1% |
| China | 31 | 0.2% |
| Costa Rica | 12 | 0.1% |
| Croatia | 12 | 0.1% |
| Cuba | 152 | 1.1% |
| Dominican Republic | 54 | 0.4% |
| Eastern Africa | 71 | 0.5% |
| Eastern Asia | 60 | 0.4% |
| Eastern Europe | 175 | 1.2% |
| Europe | 365 | 2.5% |
| Germany | 16 | 0.1% |
| Greece | 17 | 0.1% |
| Guyana | 16 | 0.1% |
| Haiti | 16 | 0.1% |
| India | 40 | 0.3% |
| Italy | 114 | 0.8% |
| Japan | 3 | 0.0% |
| Korea | 26 | 0.2% |
| Laos | 50 | 0.4% |
| Latin America | 341 | 2.4% |
| Middle Africa | 16 | 0.1% |
| Morocco | 9 | 0.1% |
| Netherlands | 6 | 0.0% |
| Northern Africa | 9 | 0.1% |
| Northern Europe | 10 | 0.1% |
| Oceania | 18 | 0.1% |
| Pakistan | 11 | 0.1% |
| Peru | 6 | 0.0% |
| Poland | 19 | 0.1% |
| Russia | 72 | 0.5% |
| South America | 69 | 0.5% |
| South Central Asia | 64 | 0.4% |
| South Eastern Asia | 102 | 0.7% |
| Southern Europe | 158 | 1.1% |
| Spain | 27 | 0.2% |
| Ukraine | 42 | 0.3% |
| Vietnam | 52 | 0.4% |
| Western Asia | 38 | 0.3% |
| Western Europe | 22 | 0.2% |
| Yemen | 38 | 0.3% |
| Zaire | 16 | 0.1% | View All 48 Rows |
Sex and Age in Greece
Sex and Age in Greece
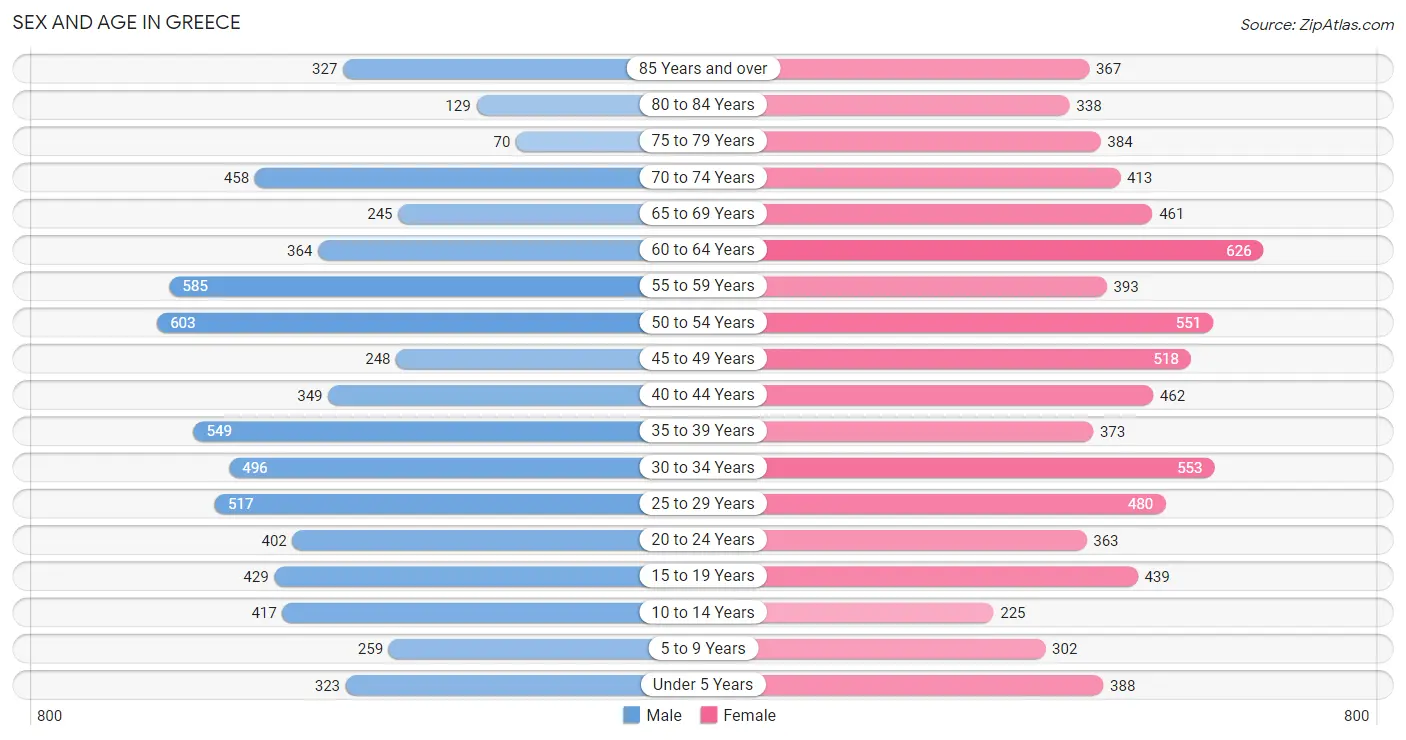
The most populous age groups in Greece are 50 to 54 Years (603 | 8.9%) for men and 60 to 64 Years (626 | 8.2%) for women.
| Age Bracket | Male | Female |
| Under 5 Years | 323 (4.8%) | 388 (5.1%) |
| 5 to 9 Years | 259 (3.8%) | 302 (4.0%) |
| 10 to 14 Years | 417 (6.2%) | 225 (2.9%) |
| 15 to 19 Years | 429 (6.3%) | 439 (5.8%) |
| 20 to 24 Years | 402 (5.9%) | 363 (4.8%) |
| 25 to 29 Years | 517 (7.6%) | 480 (6.3%) |
| 30 to 34 Years | 496 (7.3%) | 553 (7.2%) |
| 35 to 39 Years | 549 (8.1%) | 373 (4.9%) |
| 40 to 44 Years | 349 (5.2%) | 462 (6.0%) |
| 45 to 49 Years | 248 (3.7%) | 518 (6.8%) |
| 50 to 54 Years | 603 (8.9%) | 551 (7.2%) |
| 55 to 59 Years | 585 (8.6%) | 393 (5.1%) |
| 60 to 64 Years | 364 (5.4%) | 626 (8.2%) |
| 65 to 69 Years | 245 (3.6%) | 461 (6.0%) |
| 70 to 74 Years | 458 (6.8%) | 413 (5.4%) |
| 75 to 79 Years | 70 (1.0%) | 384 (5.0%) |
| 80 to 84 Years | 129 (1.9%) | 338 (4.4%) |
| 85 Years and over | 327 (4.8%) | 367 (4.8%) |
| Total | 6,770 (100.0%) | 7,636 (100.0%) |
Families and Households in Greece
Median Family Size in Greece
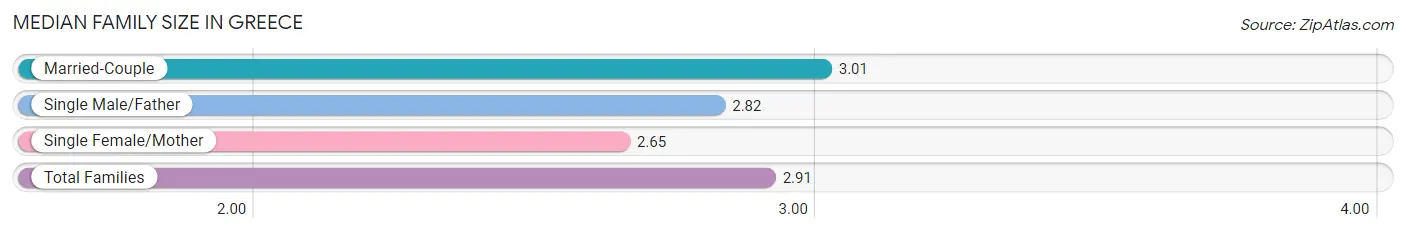
The median family size in Greece is 2.91 persons per family, with married-couple families (2,455 | 68.5%) accounting for the largest median family size of 3.01 persons per family. On the other hand, single female/mother families (840 | 23.4%) represent the smallest median family size with 2.65 persons per family.
| Family Type | # Families | Family Size |
| Married-Couple | 2,455 (68.5%) | 3.01 |
| Single Male/Father | 290 (8.1%) | 2.82 |
| Single Female/Mother | 840 (23.4%) | 2.65 |
| Total Families | 3,585 (100.0%) | 2.91 |
Median Household Size in Greece
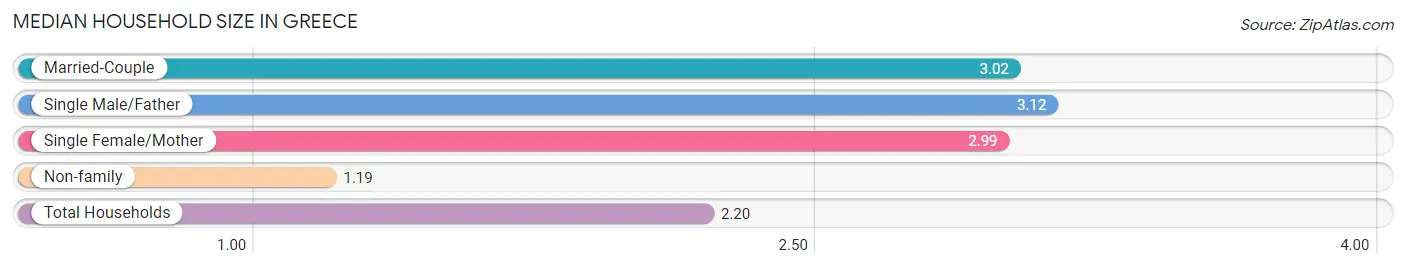
The median household size in Greece is 2.20 persons per household, with single male/father households (290 | 4.4%) accounting for the largest median household size of 3.12 persons per household. non-family households (2,930 | 45.0%) represent the smallest median household size with 1.19 persons per household.
| Household Type | # Households | Household Size |
| Married-Couple | 2,455 (37.7%) | 3.02 |
| Single Male/Father | 290 (4.4%) | 3.12 |
| Single Female/Mother | 840 (12.9%) | 2.99 |
| Non-family | 2,930 (45.0%) | 1.19 |
| Total Households | 6,515 (100.0%) | 2.20 |
Household Size by Marriage Status in Greece
Out of a total of 6,515 households in Greece, 3,585 (55.0%) are family households, while 2,930 (45.0%) are nonfamily households. The most numerous type of family households are 2-person households, comprising 1,657, and the most common type of nonfamily households are 1-person households, comprising 2,386.
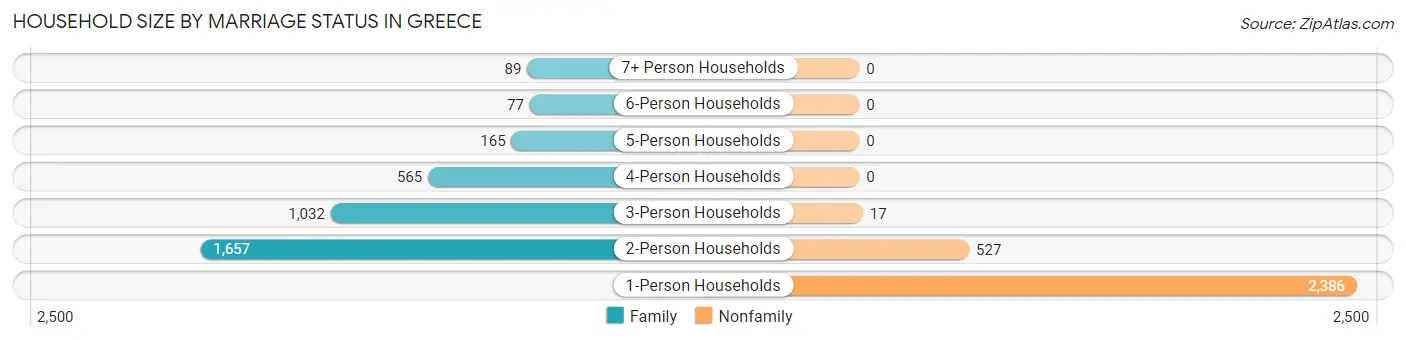
| Household Size | Family Households | Nonfamily Households |
| 1-Person Households | - | 2,386 (36.6%) |
| 2-Person Households | 1,657 (25.4%) | 527 (8.1%) |
| 3-Person Households | 1,032 (15.8%) | 17 (0.3%) |
| 4-Person Households | 565 (8.7%) | 0 (0.0%) |
| 5-Person Households | 165 (2.5%) | 0 (0.0%) |
| 6-Person Households | 77 (1.2%) | 0 (0.0%) |
| 7+ Person Households | 89 (1.4%) | 0 (0.0%) |
| Total | 3,585 (55.0%) | 2,930 (45.0%) |
Female Fertility in Greece
Fertility by Age in Greece
Average fertility rate in Greece is 50.0 births per 1,000 women. Women in the age bracket of 20 to 34 years have the highest fertility rate with 71.0 births per 1,000 women. Women in the age bracket of 20 to 34 years acount for 60.4% of all women with births.
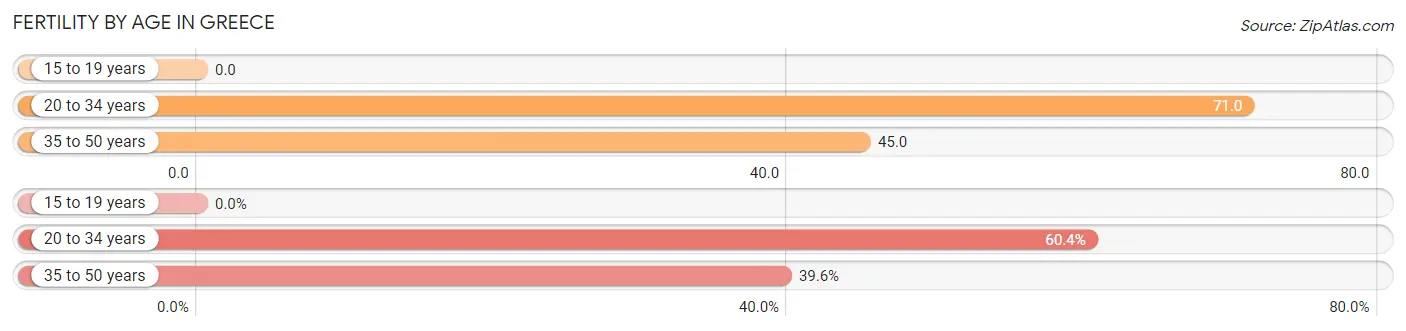
| Age Bracket | Women with Births | Births / 1,000 Women |
| 15 to 19 years | 0 (0.0%) | 0.0 |
| 20 to 34 years | 99 (60.4%) | 71.0 |
| 35 to 50 years | 65 (39.6%) | 45.0 |
| Total | 164 (100.0%) | 50.0 |
Fertility by Age by Marriage Status in Greece
93.9% of women with births (164) in Greece are married. The highest percentage of unmarried women with births falls into 35 to 50 years age bracket with 15.4% of them unmarried at the time of birth, while the lowest percentage of unmarried women with births belong to 20 to 34 years age bracket with 0.0% of them unmarried.
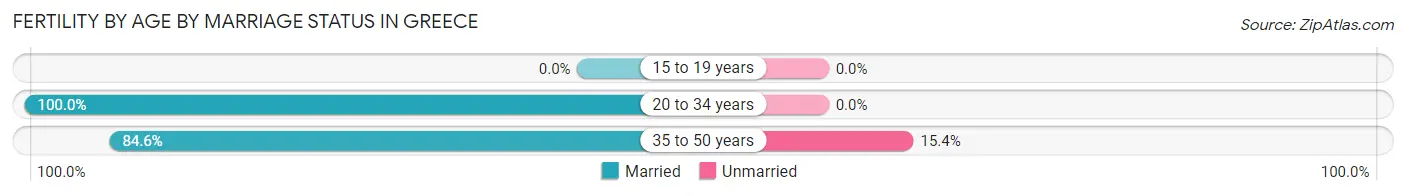
| Age Bracket | Married | Unmarried |
| 15 to 19 years | 0 (0.0%) | 0 (0.0%) |
| 20 to 34 years | 99 (100.0%) | 0 (0.0%) |
| 35 to 50 years | 55 (84.6%) | 10 (15.4%) |
| Total | 154 (93.9%) | 10 (6.1%) |
Fertility by Education in Greece
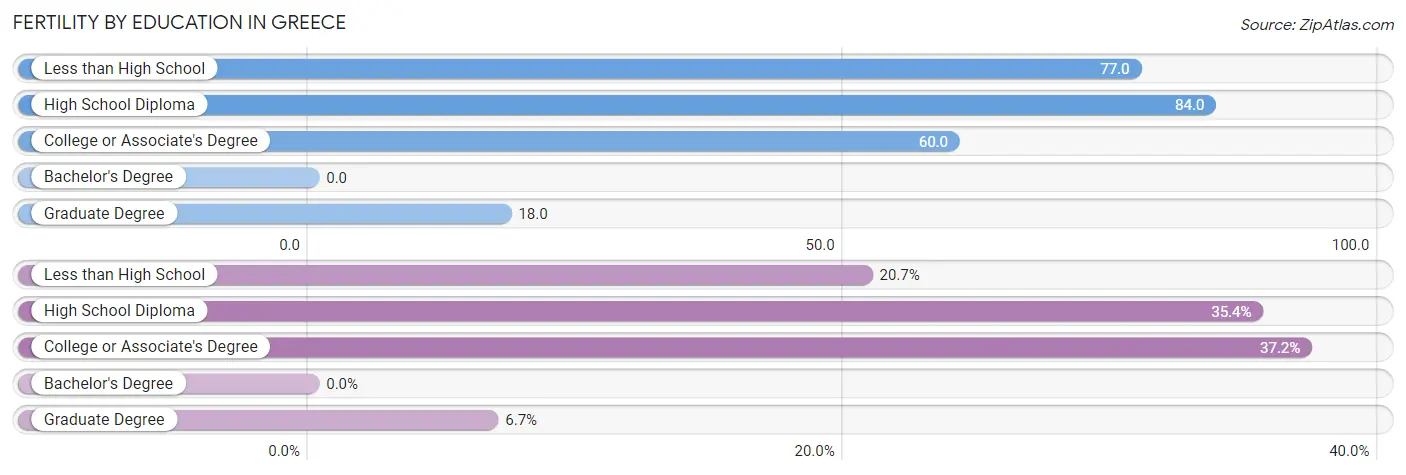
| Educational Attainment | Women with Births | Births / 1,000 Women |
| Less than High School | 34 (20.7%) | 77.0 |
| High School Diploma | 58 (35.4%) | 84.0 |
| College or Associate's Degree | 61 (37.2%) | 60.0 |
| Bachelor's Degree | 0 (0.0%) | 0.0 |
| Graduate Degree | 11 (6.7%) | 18.0 |
| Total | 164 (100.0%) | 50.0 |
Fertility by Education by Marriage Status in Greece
6.1% of women with births in Greece are unmarried. Women with the educational attainment of less than high school are most likely to be married with 100.0% of them married at childbirth, while women with the educational attainment of college or associate's degree are least likely to be married with 16.4% of them unmarried at childbirth.
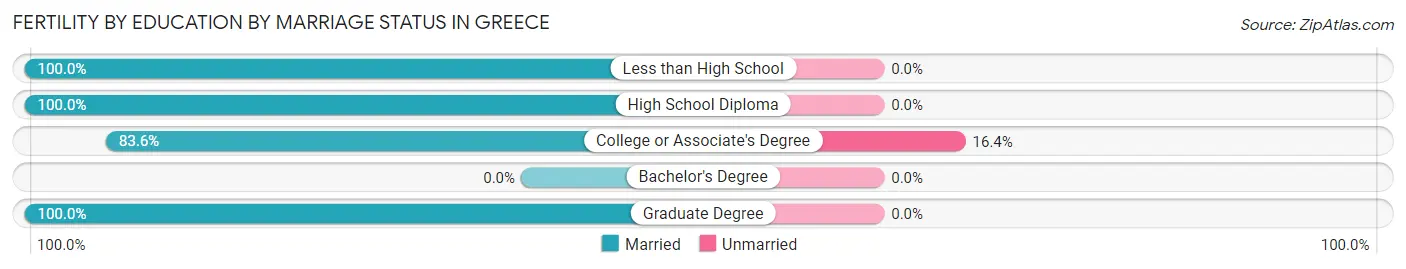
| Educational Attainment | Married | Unmarried |
| Less than High School | 34 (100.0%) | 0 (0.0%) |
| High School Diploma | 58 (100.0%) | 0 (0.0%) |
| College or Associate's Degree | 51 (83.6%) | 10 (16.4%) |
| Bachelor's Degree | 0 (0.0%) | 0 (0.0%) |
| Graduate Degree | 11 (100.0%) | 0 (0.0%) |
| Total | 154 (93.9%) | 10 (6.1%) |
Employment Characteristics in Greece
Employment by Class of Employer in Greece
Among the 7,136 employed individuals in Greece, private company employees (4,628 | 64.8%), not-for-profit organizations (1,268 | 17.8%), and local government employees (526 | 7.4%) make up the most common classes of employment.
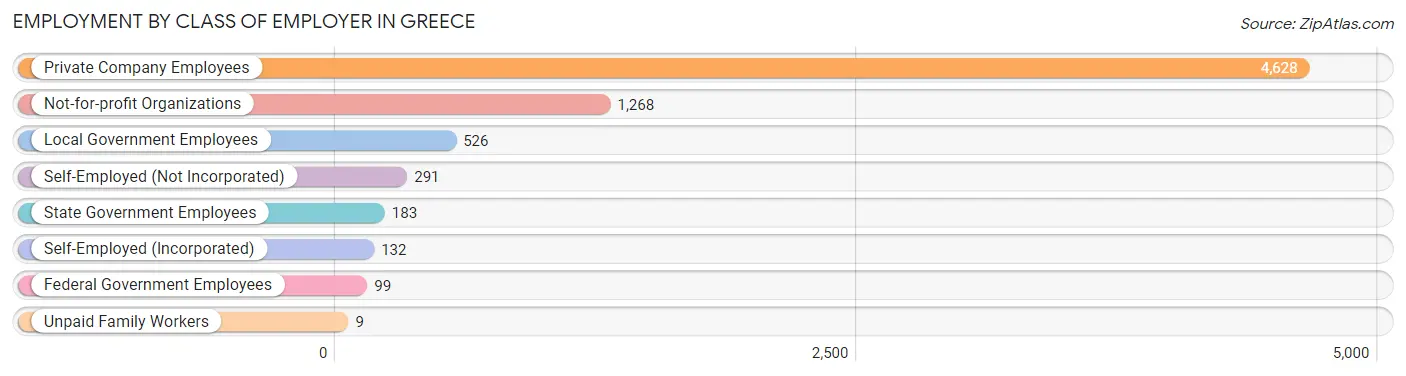
| Employer Class | # Employees | % Employees |
| Private Company Employees | 4,628 | 64.8% |
| Self-Employed (Incorporated) | 132 | 1.8% |
| Self-Employed (Not Incorporated) | 291 | 4.1% |
| Not-for-profit Organizations | 1,268 | 17.8% |
| Local Government Employees | 526 | 7.4% |
| State Government Employees | 183 | 2.6% |
| Federal Government Employees | 99 | 1.4% |
| Unpaid Family Workers | 9 | 0.1% |
| Total | 7,136 | 100.0% |
Employment Status by Age in Greece
According to the labor force statistics for Greece, out of the total population over 16 years of age (12,244), 62.3% or 7,628 individuals are in the labor force, with 5.0% or 381 of them unemployed. The age group with the highest labor force participation rate is 25 to 29 years, with 93.1% or 928 individuals in the labor force. Within the labor force, the 16 to 19 years age range has the highest percentage of unemployed individuals, with 17.3% or 51 of them being unemployed.
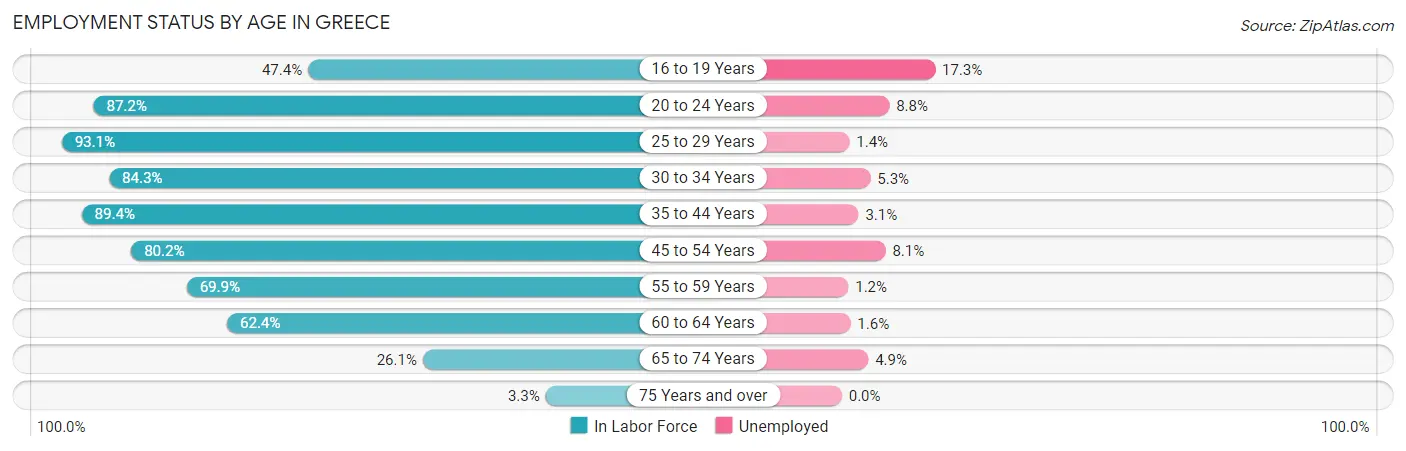
| Age Bracket | In Labor Force | Unemployed |
| 16 to 19 Years | 294 (47.4%) | 51 (17.3%) |
| 20 to 24 Years | 667 (87.2%) | 59 (8.8%) |
| 25 to 29 Years | 928 (93.1%) | 13 (1.4%) |
| 30 to 34 Years | 884 (84.3%) | 47 (5.3%) |
| 35 to 44 Years | 1,549 (89.4%) | 48 (3.1%) |
| 45 to 54 Years | 1,540 (80.2%) | 125 (8.1%) |
| 55 to 59 Years | 684 (69.9%) | 8 (1.2%) |
| 60 to 64 Years | 618 (62.4%) | 10 (1.6%) |
| 65 to 74 Years | 412 (26.1%) | 20 (4.9%) |
| 75 Years and over | 53 (3.3%) | 0 (0.0%) |
| Total | 7,628 (62.3%) | 381 (5.0%) |
Employment Status by Educational Attainment in Greece
According to labor force statistics for Greece, 80.9% of individuals (6,203) out of the total population between 25 and 64 years of age (7,667) are in the labor force, with 4.0% or 248 of them being unemployed. The group with the highest labor force participation rate are those with the educational attainment of bachelor's degree or higher, with 88.7% or 2,261 individuals in the labor force. Within the labor force, individuals with less than high school education have the highest percentage of unemployment, with 10.3% or 30 of them being unemployed.
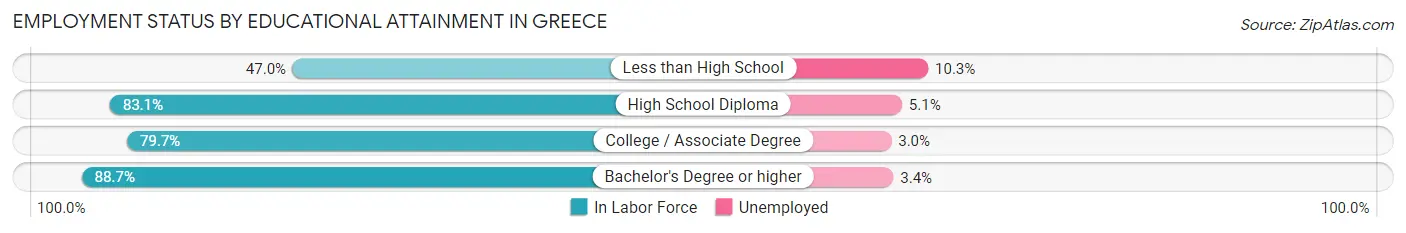
| Educational Attainment | In Labor Force | Unemployed |
| Less than High School | 291 (47.0%) | 64 (10.3%) |
| High School Diploma | 1,597 (83.1%) | 98 (5.1%) |
| College / Associate Degree | 2,054 (79.7%) | 77 (3.0%) |
| Bachelor's Degree or higher | 2,261 (88.7%) | 87 (3.4%) |
| Total | 6,203 (80.9%) | 307 (4.0%) |
Employment Occupations by Sex in Greece
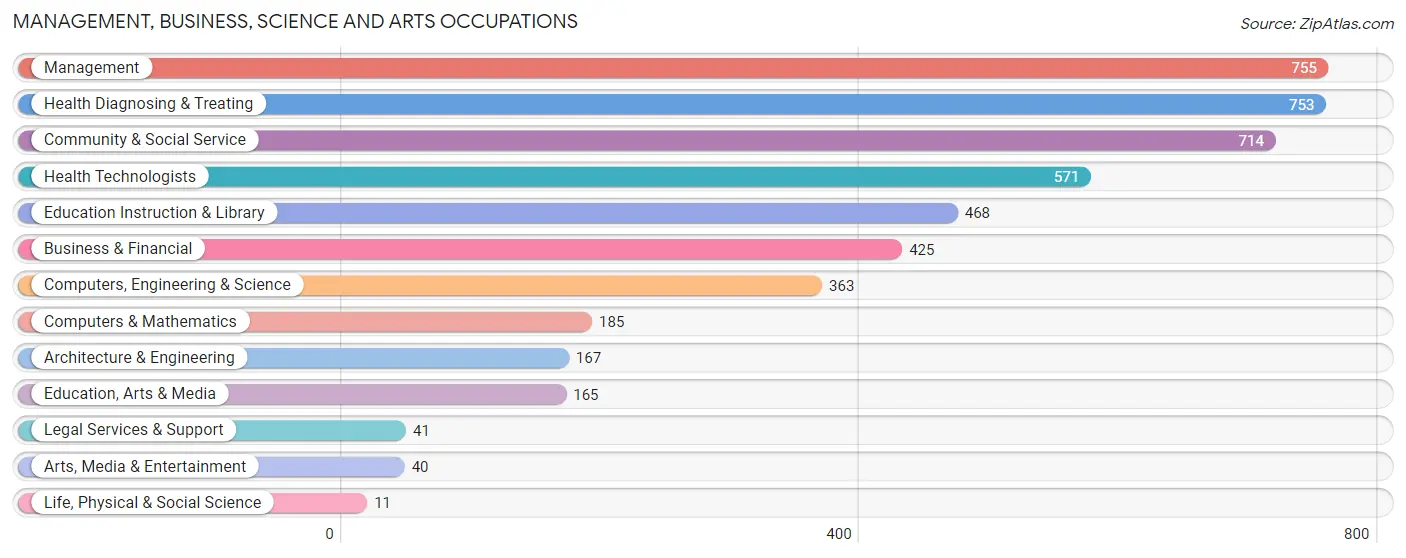
Management, Business, Science and Arts Occupations
The most common Management, Business, Science and Arts occupations in Greece are Management (755 | 10.4%), Health Diagnosing & Treating (753 | 10.4%), Community & Social Service (714 | 9.9%), Health Technologists (571 | 7.9%), and Education Instruction & Library (468 | 6.5%).
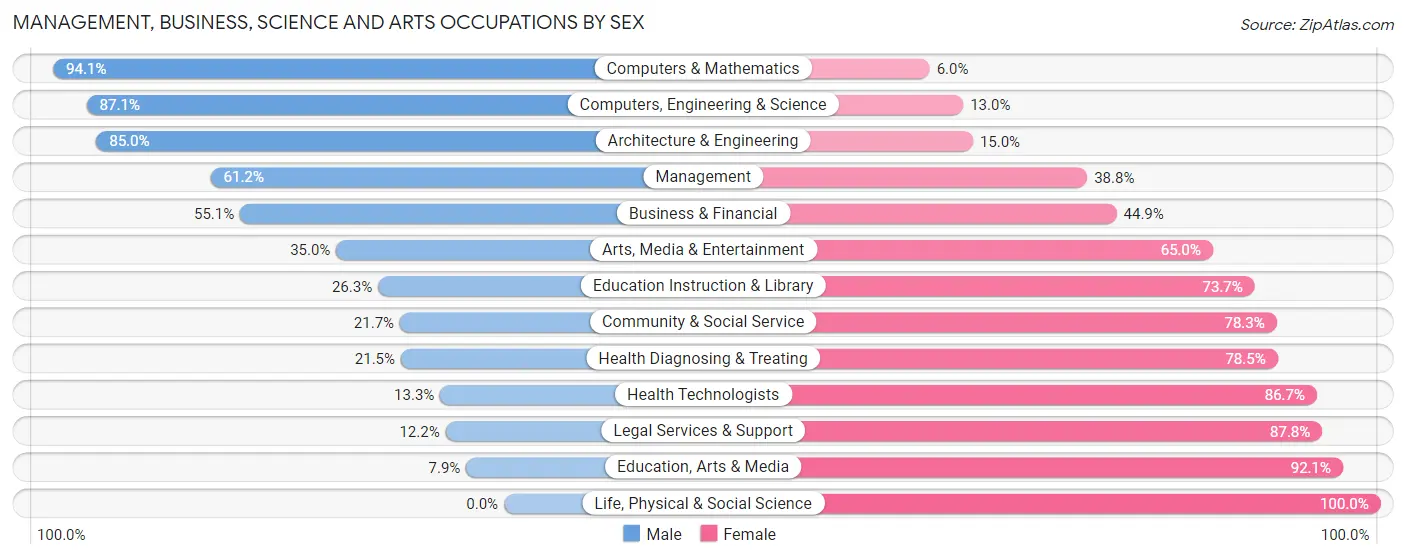
Management, Business, Science and Arts Occupations by Sex
Within the Management, Business, Science and Arts occupations in Greece, the most male-oriented occupations are Computers & Mathematics (94.1%), Computers, Engineering & Science (87.1%), and Architecture & Engineering (85.0%), while the most female-oriented occupations are Life, Physical & Social Science (100.0%), Education, Arts & Media (92.1%), and Legal Services & Support (87.8%).
| Occupation | Male | Female |
| Management | 462 (61.2%) | 293 (38.8%) |
| Business & Financial | 234 (55.1%) | 191 (44.9%) |
| Computers, Engineering & Science | 316 (87.1%) | 47 (13.0%) |
| Computers & Mathematics | 174 (94.1%) | 11 (5.9%) |
| Architecture & Engineering | 142 (85.0%) | 25 (15.0%) |
| Life, Physical & Social Science | 0 (0.0%) | 11 (100.0%) |
| Community & Social Service | 155 (21.7%) | 559 (78.3%) |
| Education, Arts & Media | 13 (7.9%) | 152 (92.1%) |
| Legal Services & Support | 5 (12.2%) | 36 (87.8%) |
| Education Instruction & Library | 123 (26.3%) | 345 (73.7%) |
| Arts, Media & Entertainment | 14 (35.0%) | 26 (65.0%) |
| Health Diagnosing & Treating | 162 (21.5%) | 591 (78.5%) |
| Health Technologists | 76 (13.3%) | 495 (86.7%) |
| Total (Category) | 1,329 (44.2%) | 1,681 (55.8%) |
| Total (Overall) | 3,587 (49.5%) | 3,663 (50.5%) |
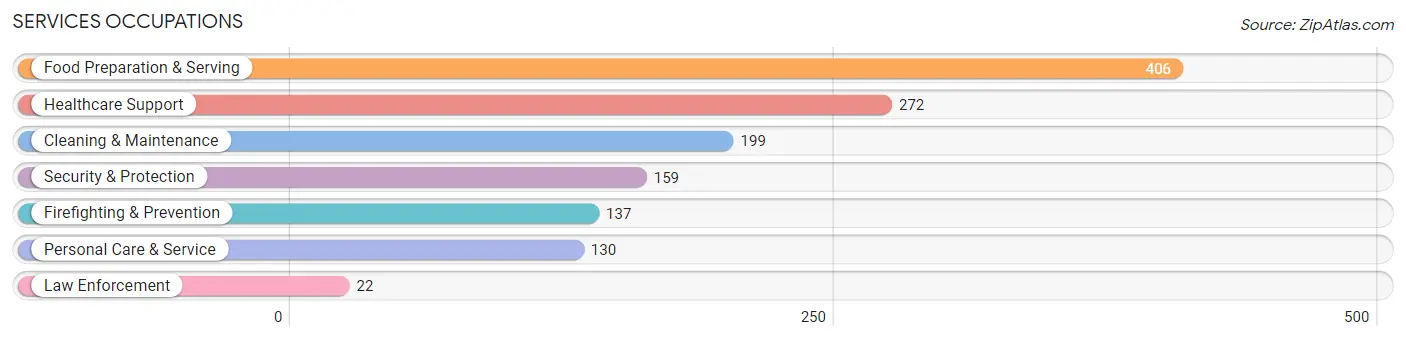
Services Occupations
The most common Services occupations in Greece are Food Preparation & Serving (406 | 5.6%), Healthcare Support (272 | 3.7%), Cleaning & Maintenance (199 | 2.7%), Security & Protection (159 | 2.2%), and Firefighting & Prevention (137 | 1.9%).
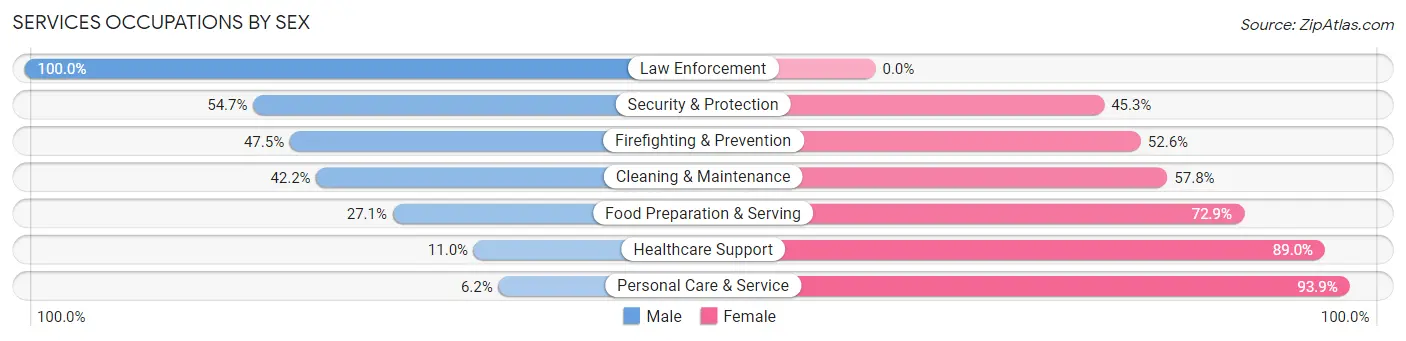
Services Occupations by Sex
Within the Services occupations in Greece, the most male-oriented occupations are Law Enforcement (100.0%), Security & Protection (54.7%), and Firefighting & Prevention (47.4%), while the most female-oriented occupations are Personal Care & Service (93.9%), Healthcare Support (89.0%), and Food Preparation & Serving (72.9%).
| Occupation | Male | Female |
| Healthcare Support | 30 (11.0%) | 242 (89.0%) |
| Security & Protection | 87 (54.7%) | 72 (45.3%) |
| Firefighting & Prevention | 65 (47.4%) | 72 (52.5%) |
| Law Enforcement | 22 (100.0%) | 0 (0.0%) |
| Food Preparation & Serving | 110 (27.1%) | 296 (72.9%) |
| Cleaning & Maintenance | 84 (42.2%) | 115 (57.8%) |
| Personal Care & Service | 8 (6.1%) | 122 (93.9%) |
| Total (Category) | 319 (27.4%) | 847 (72.6%) |
| Total (Overall) | 3,587 (49.5%) | 3,663 (50.5%) |
Sales and Office Occupations
The most common Sales and Office occupations in Greece are Office & Administration (813 | 11.2%), and Sales & Related (673 | 9.3%).

Sales and Office Occupations by Sex
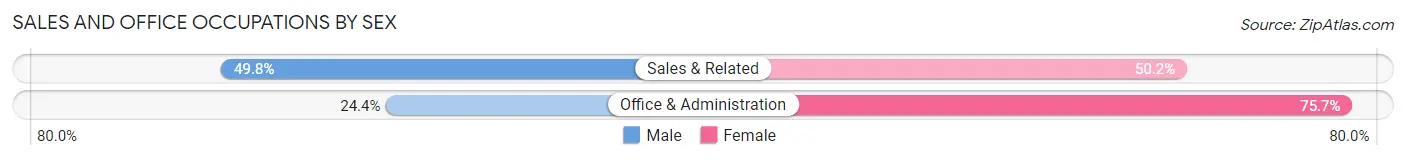
| Occupation | Male | Female |
| Sales & Related | 335 (49.8%) | 338 (50.2%) |
| Office & Administration | 198 (24.3%) | 615 (75.6%) |
| Total (Category) | 533 (35.9%) | 953 (64.1%) |
| Total (Overall) | 3,587 (49.5%) | 3,663 (50.5%) |
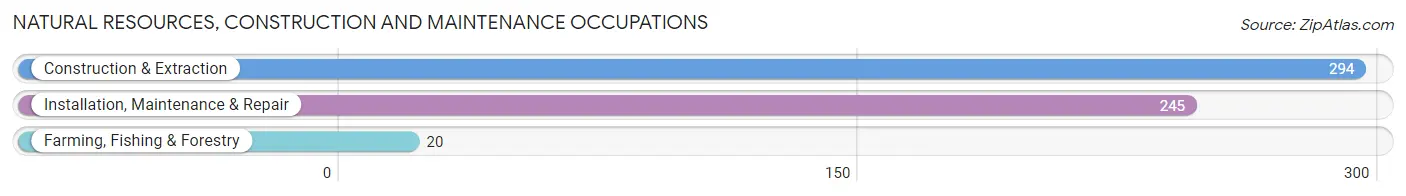
Natural Resources, Construction and Maintenance Occupations
The most common Natural Resources, Construction and Maintenance occupations in Greece are Construction & Extraction (294 | 4.1%), Installation, Maintenance & Repair (245 | 3.4%), and Farming, Fishing & Forestry (20 | 0.3%).
Natural Resources, Construction and Maintenance Occupations by Sex
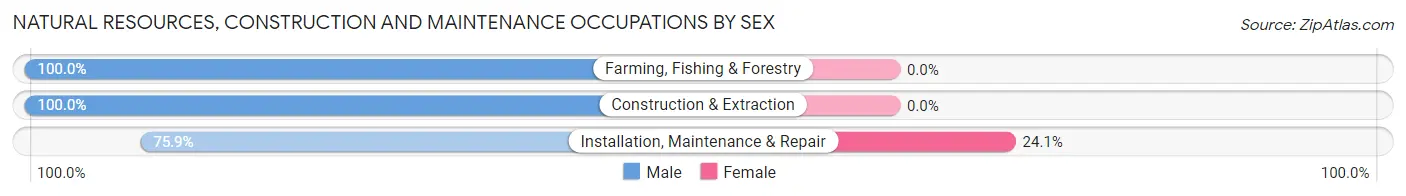
| Occupation | Male | Female |
| Farming, Fishing & Forestry | 20 (100.0%) | 0 (0.0%) |
| Construction & Extraction | 294 (100.0%) | 0 (0.0%) |
| Installation, Maintenance & Repair | 186 (75.9%) | 59 (24.1%) |
| Total (Category) | 500 (89.4%) | 59 (10.5%) |
| Total (Overall) | 3,587 (49.5%) | 3,663 (50.5%) |
Production, Transportation and Moving Occupations
The most common Production, Transportation and Moving occupations in Greece are Production (525 | 7.2%), Transportation (252 | 3.5%), and Material Moving (252 | 3.5%).
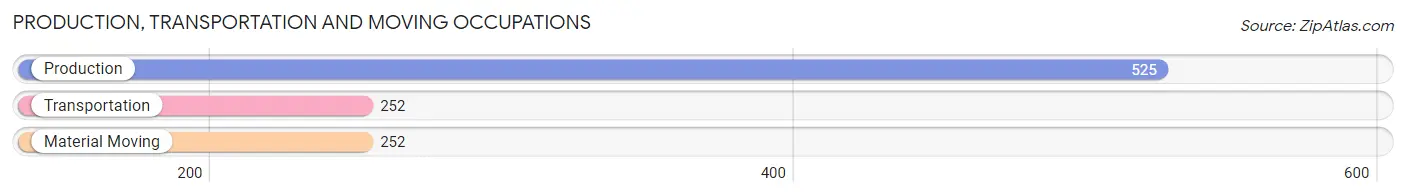
Production, Transportation and Moving Occupations by Sex
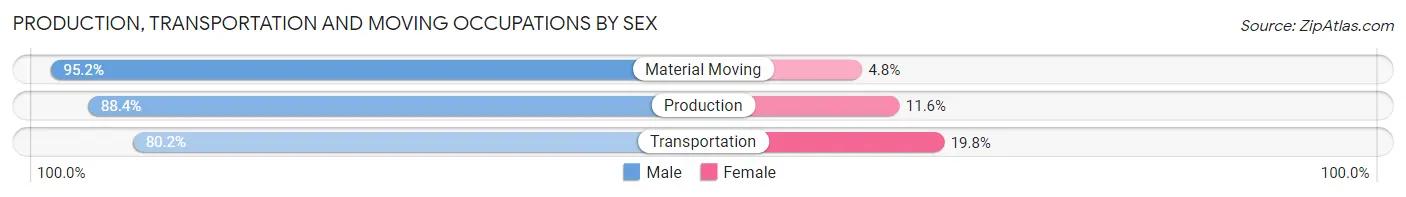
| Occupation | Male | Female |
| Production | 464 (88.4%) | 61 (11.6%) |
| Transportation | 202 (80.2%) | 50 (19.8%) |
| Material Moving | 240 (95.2%) | 12 (4.8%) |
| Total (Category) | 906 (88.0%) | 123 (11.9%) |
| Total (Overall) | 3,587 (49.5%) | 3,663 (50.5%) |
Employment Industries by Sex in Greece
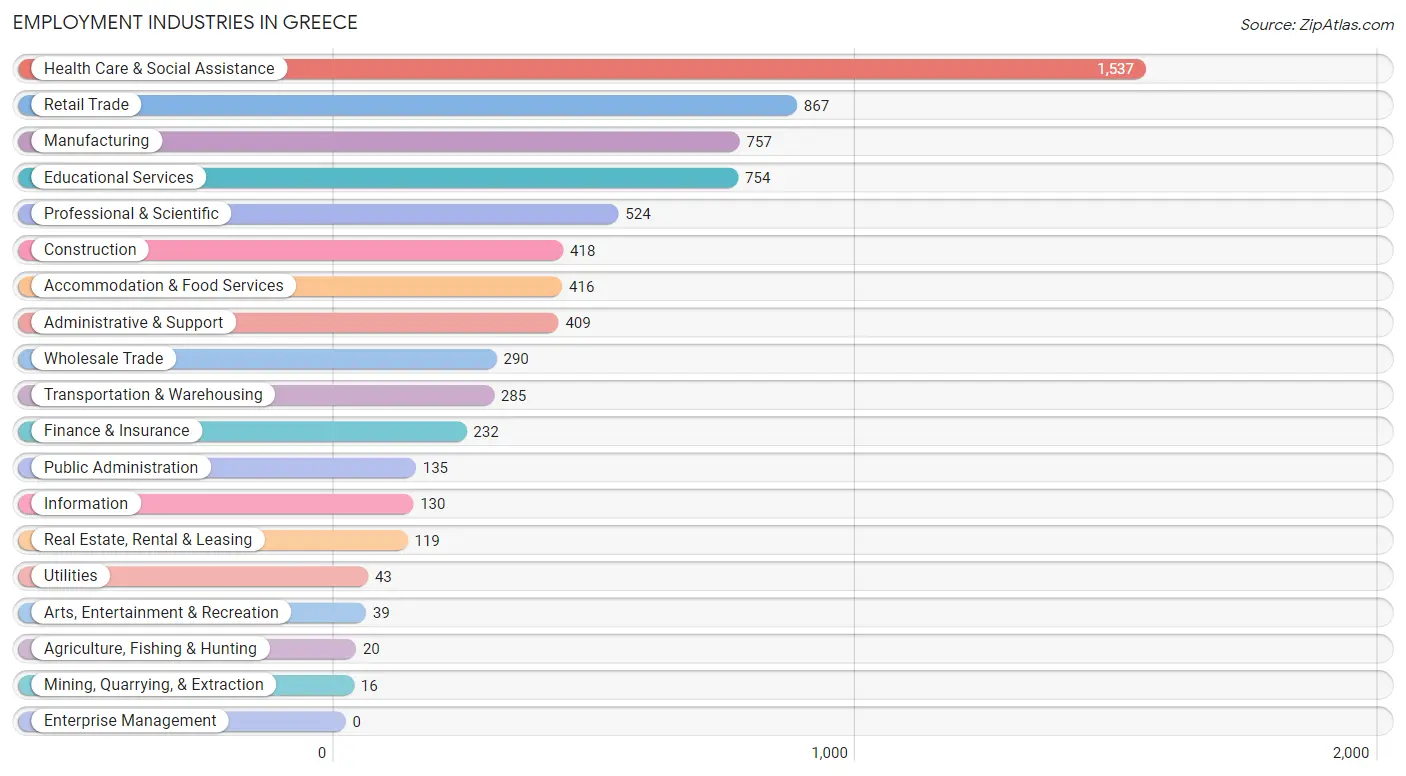
Employment Industries in Greece
The major employment industries in Greece include Health Care & Social Assistance (1,537 | 21.2%), Retail Trade (867 | 12.0%), Manufacturing (757 | 10.4%), Educational Services (754 | 10.4%), and Professional & Scientific (524 | 7.2%).
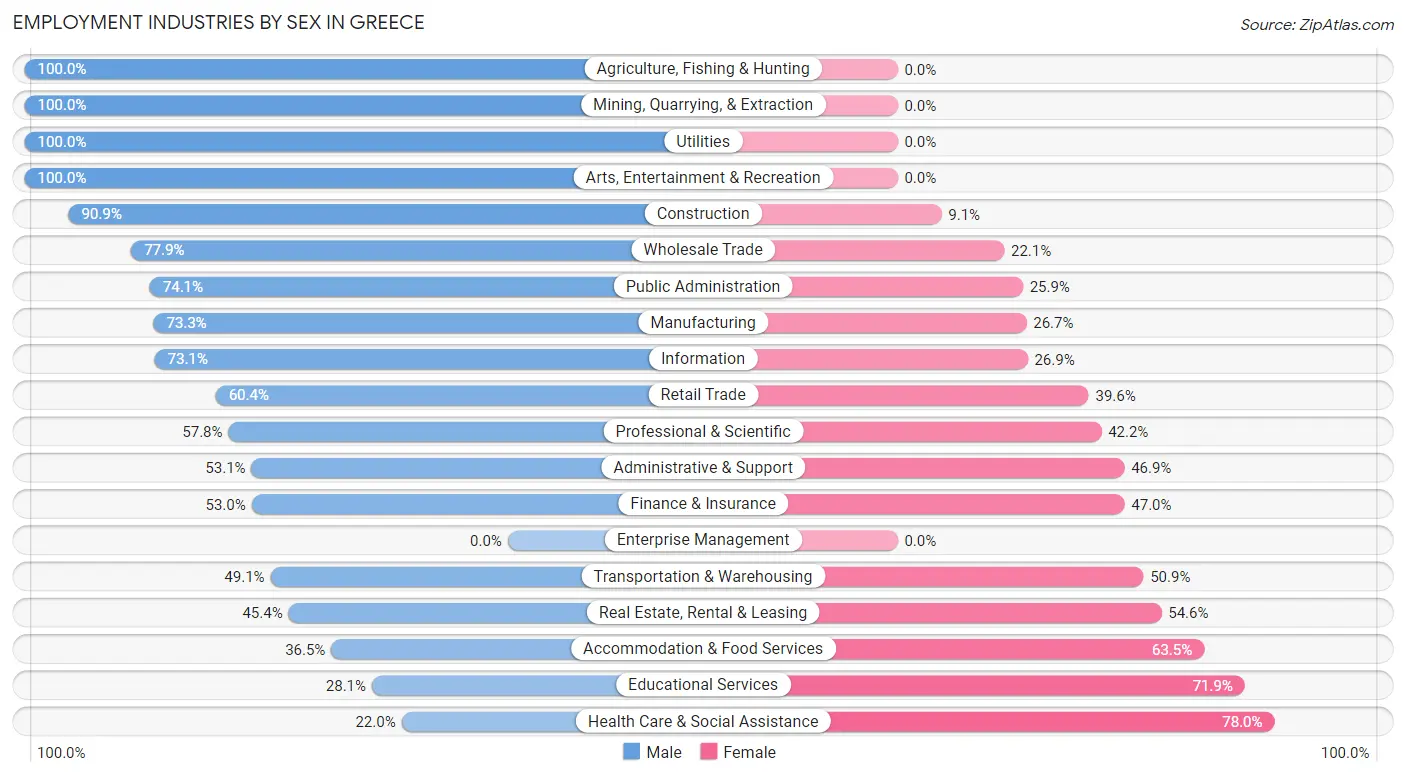
Employment Industries by Sex in Greece
The Greece industries that see more men than women are Agriculture, Fishing & Hunting (100.0%), Mining, Quarrying, & Extraction (100.0%), and Utilities (100.0%), whereas the industries that tend to have a higher number of women are Health Care & Social Assistance (78.0%), Educational Services (71.9%), and Accommodation & Food Services (63.5%).
| Industry | Male | Female |
| Agriculture, Fishing & Hunting | 20 (100.0%) | 0 (0.0%) |
| Mining, Quarrying, & Extraction | 16 (100.0%) | 0 (0.0%) |
| Construction | 380 (90.9%) | 38 (9.1%) |
| Manufacturing | 555 (73.3%) | 202 (26.7%) |
| Wholesale Trade | 226 (77.9%) | 64 (22.1%) |
| Retail Trade | 524 (60.4%) | 343 (39.6%) |
| Transportation & Warehousing | 140 (49.1%) | 145 (50.9%) |
| Utilities | 43 (100.0%) | 0 (0.0%) |
| Information | 95 (73.1%) | 35 (26.9%) |
| Finance & Insurance | 123 (53.0%) | 109 (47.0%) |
| Real Estate, Rental & Leasing | 54 (45.4%) | 65 (54.6%) |
| Professional & Scientific | 303 (57.8%) | 221 (42.2%) |
| Enterprise Management | 0 (0.0%) | 0 (0.0%) |
| Administrative & Support | 217 (53.1%) | 192 (46.9%) |
| Educational Services | 212 (28.1%) | 542 (71.9%) |
| Health Care & Social Assistance | 338 (22.0%) | 1,199 (78.0%) |
| Arts, Entertainment & Recreation | 39 (100.0%) | 0 (0.0%) |
| Accommodation & Food Services | 152 (36.5%) | 264 (63.5%) |
| Public Administration | 100 (74.1%) | 35 (25.9%) |
| Total | 3,587 (49.5%) | 3,663 (50.5%) |
Education in Greece
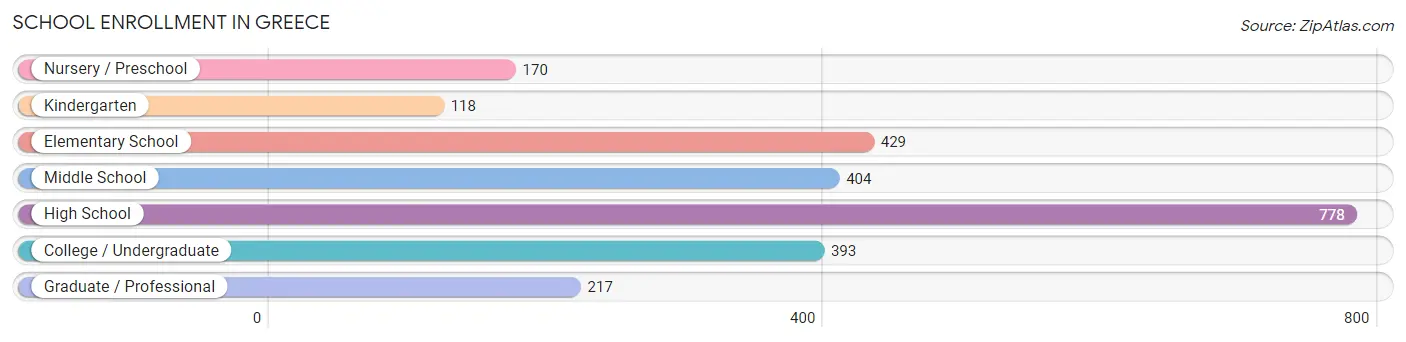
School Enrollment in Greece
The most common levels of schooling among the 2,509 students in Greece are high school (778 | 31.0%), elementary school (429 | 17.1%), and middle school (404 | 16.1%).
| School Level | # Students | % Students |
| Nursery / Preschool | 170 | 6.8% |
| Kindergarten | 118 | 4.7% |
| Elementary School | 429 | 17.1% |
| Middle School | 404 | 16.1% |
| High School | 778 | 31.0% |
| College / Undergraduate | 393 | 15.7% |
| Graduate / Professional | 217 | 8.6% |
| Total | 2,509 | 100.0% |
School Enrollment by Age by Funding Source in Greece
Out of a total of 2,509 students who are enrolled in schools in Greece, 740 (29.5%) attend a private institution, while the remaining 1,769 (70.5%) are enrolled in public schools. The age group of 35 years and over has the highest likelihood of being enrolled in private schools, with 162 (69.5% in the age bracket) enrolled. Conversely, the age group of 15 to 17 year olds has the lowest likelihood of being enrolled in a private school, with 503 (87.9% in the age bracket) attending a public institution.
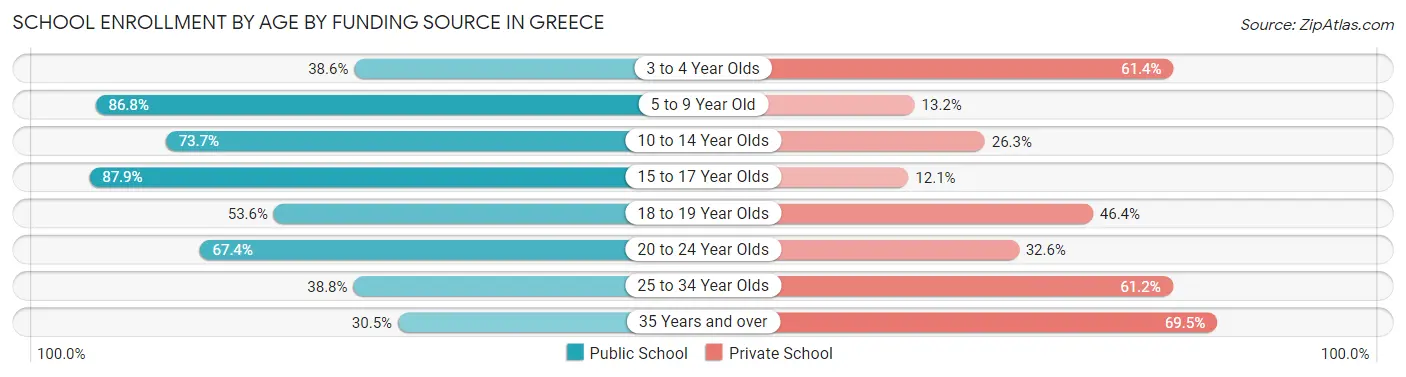
| Age Bracket | Public School | Private School |
| 3 to 4 Year Olds | 44 (38.6%) | 70 (61.4%) |
| 5 to 9 Year Old | 466 (86.8%) | 71 (13.2%) |
| 10 to 14 Year Olds | 401 (73.7%) | 143 (26.3%) |
| 15 to 17 Year Olds | 503 (87.9%) | 69 (12.1%) |
| 18 to 19 Year Olds | 82 (53.6%) | 71 (46.4%) |
| 20 to 24 Year Olds | 153 (67.4%) | 74 (32.6%) |
| 25 to 34 Year Olds | 50 (38.8%) | 79 (61.2%) |
| 35 Years and over | 71 (30.5%) | 162 (69.5%) |
| Total | 1,769 (70.5%) | 740 (29.5%) |
Educational Attainment by Field of Study in Greece
Business (548 | 17.0%), education (510 | 15.8%), science & technology (424 | 13.1%), engineering (320 | 9.9%), and arts & humanities (266 | 8.2%) are the most common fields of study among 3,231 individuals in Greece who have obtained a bachelor's degree or higher.
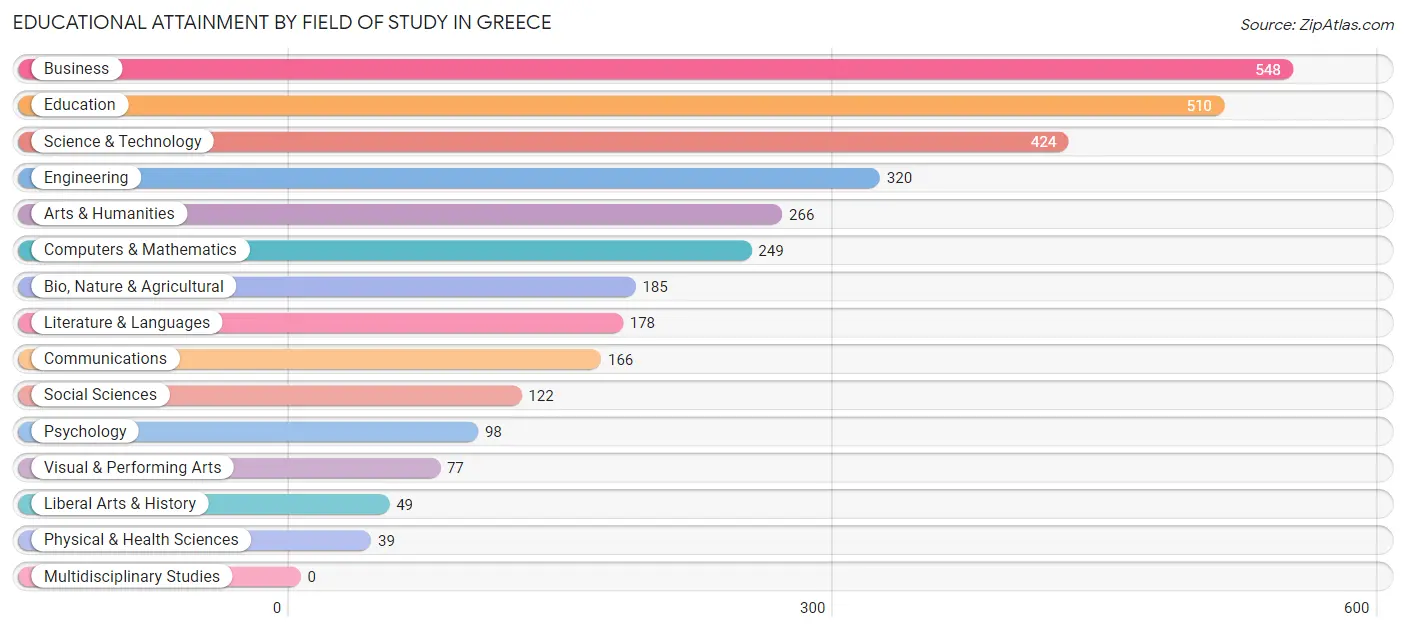
| Field of Study | # Graduates | % Graduates |
| Computers & Mathematics | 249 | 7.7% |
| Bio, Nature & Agricultural | 185 | 5.7% |
| Physical & Health Sciences | 39 | 1.2% |
| Psychology | 98 | 3.0% |
| Social Sciences | 122 | 3.8% |
| Engineering | 320 | 9.9% |
| Multidisciplinary Studies | 0 | 0.0% |
| Science & Technology | 424 | 13.1% |
| Business | 548 | 17.0% |
| Education | 510 | 15.8% |
| Literature & Languages | 178 | 5.5% |
| Liberal Arts & History | 49 | 1.5% |
| Visual & Performing Arts | 77 | 2.4% |
| Communications | 166 | 5.1% |
| Arts & Humanities | 266 | 8.2% |
| Total | 3,231 | 100.0% |
Transportation & Commute in Greece
Vehicle Availability by Sex in Greece
The most prevalent vehicle ownership categories in Greece are males with 2 vehicles (1,964, accounting for 55.0%) and females with 2 vehicles (1,490, making up 55.3%).
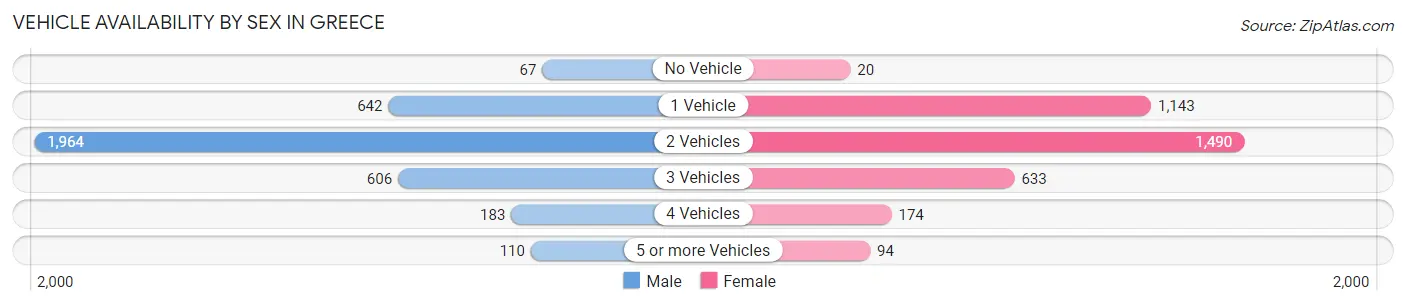
| Vehicles Available | Male | Female |
| No Vehicle | 67 (1.9%) | 20 (0.6%) |
| 1 Vehicle | 642 (18.0%) | 1,143 (32.2%) |
| 2 Vehicles | 1,964 (55.0%) | 1,490 (41.9%) |
| 3 Vehicles | 606 (17.0%) | 633 (17.8%) |
| 4 Vehicles | 183 (5.1%) | 174 (4.9%) |
| 5 or more Vehicles | 110 (3.1%) | 94 (2.6%) |
| Total | 3,572 (100.0%) | 3,554 (100.0%) |
Commute Time in Greece
The most frequently occuring commute durations in Greece are 15 to 19 minutes (1,546 commuters, 23.6%), 20 to 24 minutes (1,514 commuters, 23.2%), and 5 to 9 minutes (898 commuters, 13.7%).
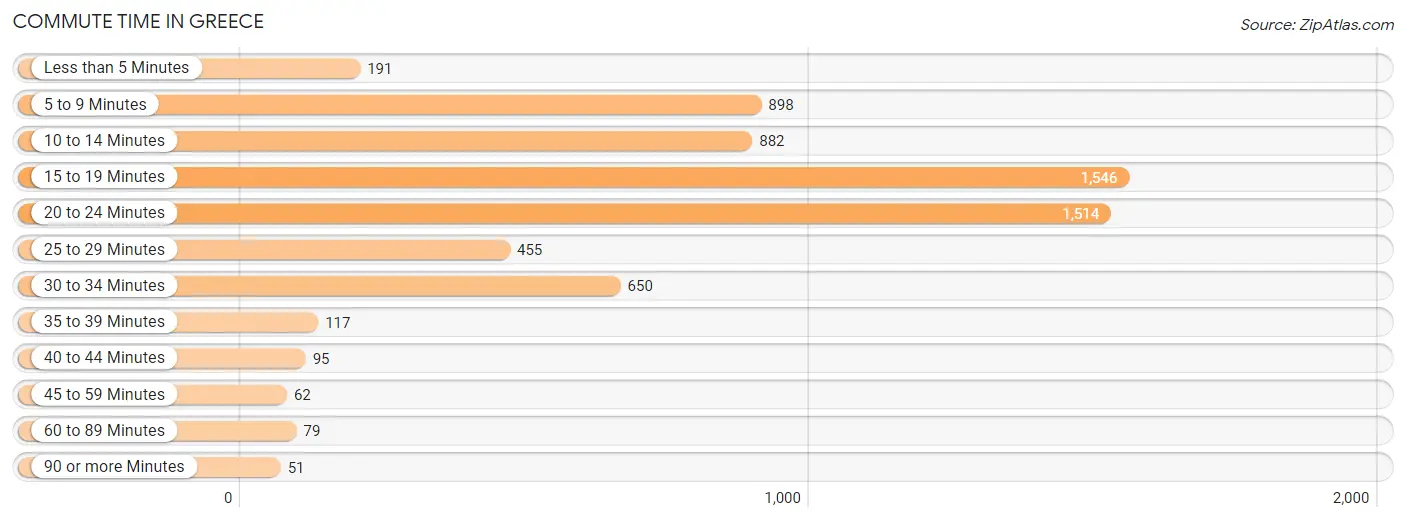
| Commute Time | # Commuters | % Commuters |
| Less than 5 Minutes | 191 | 2.9% |
| 5 to 9 Minutes | 898 | 13.7% |
| 10 to 14 Minutes | 882 | 13.5% |
| 15 to 19 Minutes | 1,546 | 23.6% |
| 20 to 24 Minutes | 1,514 | 23.2% |
| 25 to 29 Minutes | 455 | 7.0% |
| 30 to 34 Minutes | 650 | 9.9% |
| 35 to 39 Minutes | 117 | 1.8% |
| 40 to 44 Minutes | 95 | 1.5% |
| 45 to 59 Minutes | 62 | 0.9% |
| 60 to 89 Minutes | 79 | 1.2% |
| 90 or more Minutes | 51 | 0.8% |
Commute Time by Sex in Greece
The most common commute times in Greece are 20 to 24 minutes (775 commuters, 23.4%) for males and 15 to 19 minutes (851 commuters, 26.4%) for females.
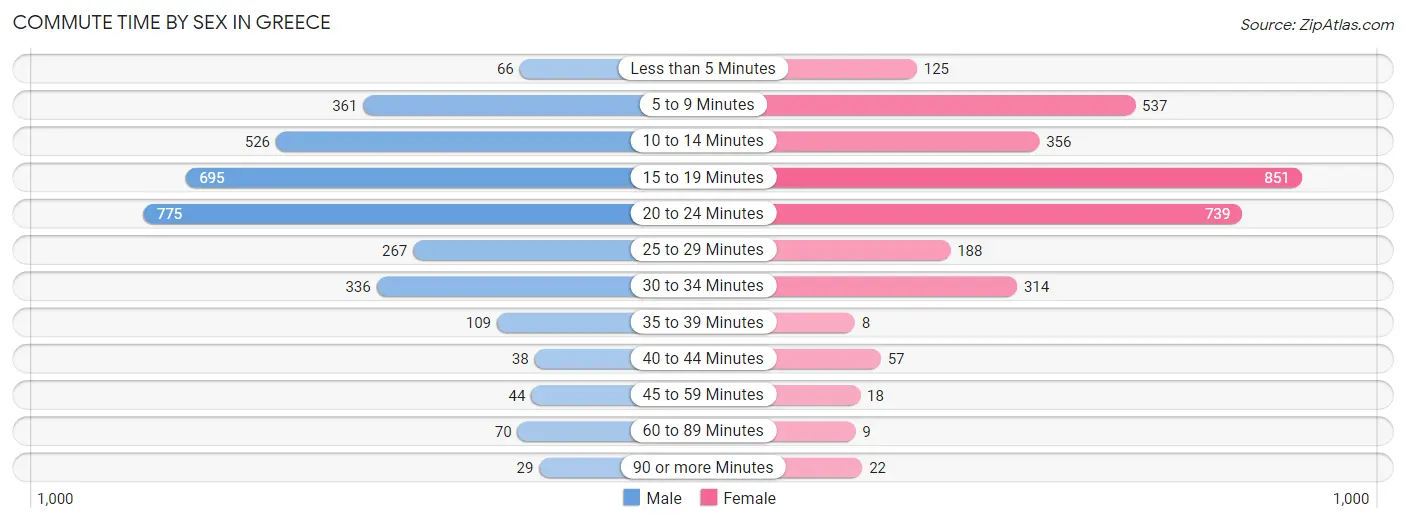
| Commute Time | Male | Female |
| Less than 5 Minutes | 66 (2.0%) | 125 (3.9%) |
| 5 to 9 Minutes | 361 (10.9%) | 537 (16.7%) |
| 10 to 14 Minutes | 526 (15.9%) | 356 (11.0%) |
| 15 to 19 Minutes | 695 (21.0%) | 851 (26.4%) |
| 20 to 24 Minutes | 775 (23.4%) | 739 (22.9%) |
| 25 to 29 Minutes | 267 (8.1%) | 188 (5.8%) |
| 30 to 34 Minutes | 336 (10.1%) | 314 (9.7%) |
| 35 to 39 Minutes | 109 (3.3%) | 8 (0.3%) |
| 40 to 44 Minutes | 38 (1.1%) | 57 (1.8%) |
| 45 to 59 Minutes | 44 (1.3%) | 18 (0.6%) |
| 60 to 89 Minutes | 70 (2.1%) | 9 (0.3%) |
| 90 or more Minutes | 29 (0.9%) | 22 (0.7%) |
Time of Departure to Work by Sex in Greece
The most frequent times of departure to work in Greece are 12:00 PM to 3:59 PM (468, 14.1%) for males and 7:30 AM to 7:59 AM (468, 14.5%) for females.
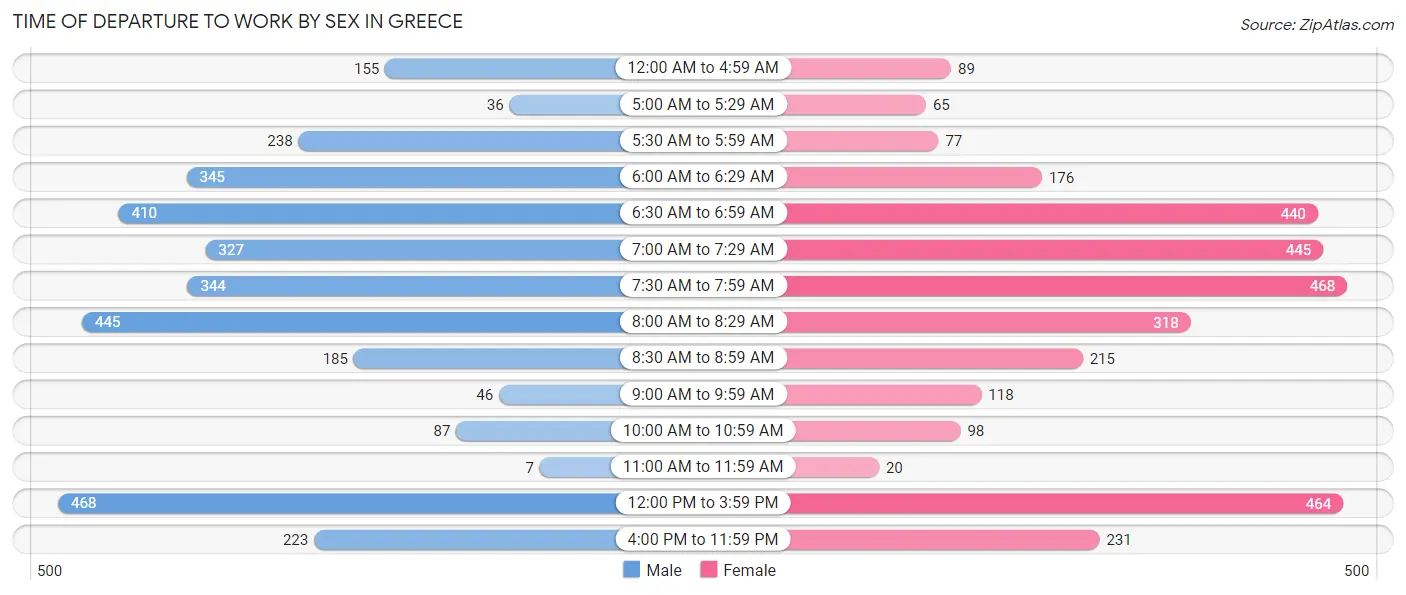
| Time of Departure | Male | Female |
| 12:00 AM to 4:59 AM | 155 (4.7%) | 89 (2.8%) |
| 5:00 AM to 5:29 AM | 36 (1.1%) | 65 (2.0%) |
| 5:30 AM to 5:59 AM | 238 (7.2%) | 77 (2.4%) |
| 6:00 AM to 6:29 AM | 345 (10.4%) | 176 (5.5%) |
| 6:30 AM to 6:59 AM | 410 (12.4%) | 440 (13.7%) |
| 7:00 AM to 7:29 AM | 327 (9.9%) | 445 (13.8%) |
| 7:30 AM to 7:59 AM | 344 (10.4%) | 468 (14.5%) |
| 8:00 AM to 8:29 AM | 445 (13.4%) | 318 (9.9%) |
| 8:30 AM to 8:59 AM | 185 (5.6%) | 215 (6.7%) |
| 9:00 AM to 9:59 AM | 46 (1.4%) | 118 (3.7%) |
| 10:00 AM to 10:59 AM | 87 (2.6%) | 98 (3.0%) |
| 11:00 AM to 11:59 AM | 7 (0.2%) | 20 (0.6%) |
| 12:00 PM to 3:59 PM | 468 (14.1%) | 464 (14.4%) |
| 4:00 PM to 11:59 PM | 223 (6.7%) | 231 (7.2%) |
| Total | 3,316 (100.0%) | 3,224 (100.0%) |
Housing Occupancy in Greece
Occupancy by Ownership in Greece
Of the total 6,515 dwellings in Greece, owner-occupied units account for 4,390 (67.4%), while renter-occupied units make up 2,125 (32.6%).
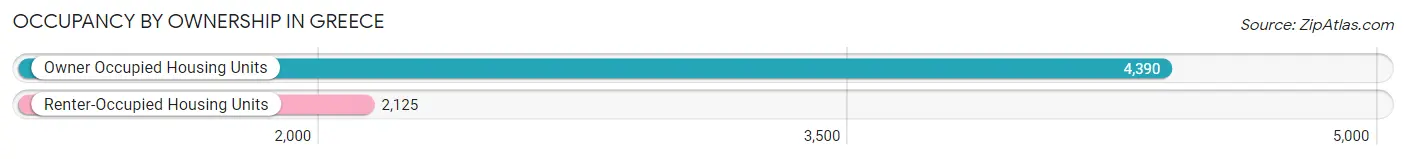
| Occupancy | # Housing Units | % Housing Units |
| Owner Occupied Housing Units | 4,390 | 67.4% |
| Renter-Occupied Housing Units | 2,125 | 32.6% |
| Total Occupied Housing Units | 6,515 | 100.0% |
Occupancy by Household Size in Greece
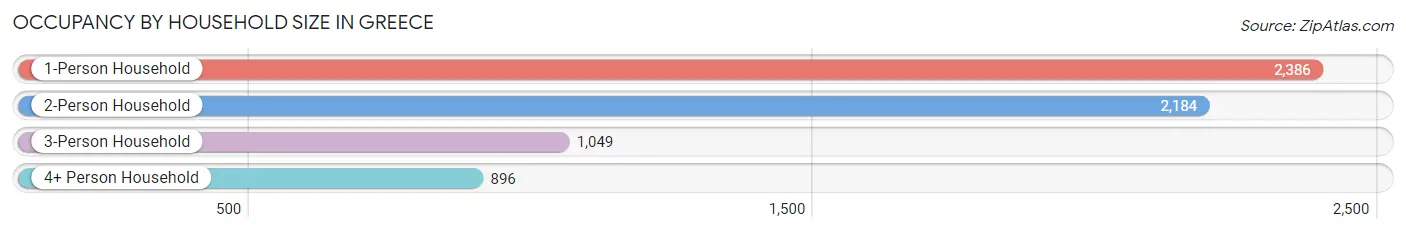
| Household Size | # Housing Units | % Housing Units |
| 1-Person Household | 2,386 | 36.6% |
| 2-Person Household | 2,184 | 33.5% |
| 3-Person Household | 1,049 | 16.1% |
| 4+ Person Household | 896 | 13.8% |
| Total Housing Units | 6,515 | 100.0% |
Occupancy by Ownership by Household Size in Greece
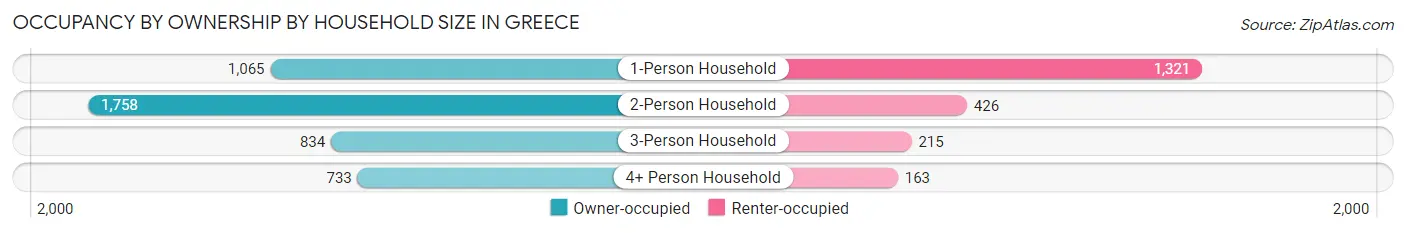
| Household Size | Owner-occupied | Renter-occupied |
| 1-Person Household | 1,065 (44.6%) | 1,321 (55.4%) |
| 2-Person Household | 1,758 (80.5%) | 426 (19.5%) |
| 3-Person Household | 834 (79.5%) | 215 (20.5%) |
| 4+ Person Household | 733 (81.8%) | 163 (18.2%) |
| Total Housing Units | 4,390 (67.4%) | 2,125 (32.6%) |
Occupancy by Educational Attainment in Greece
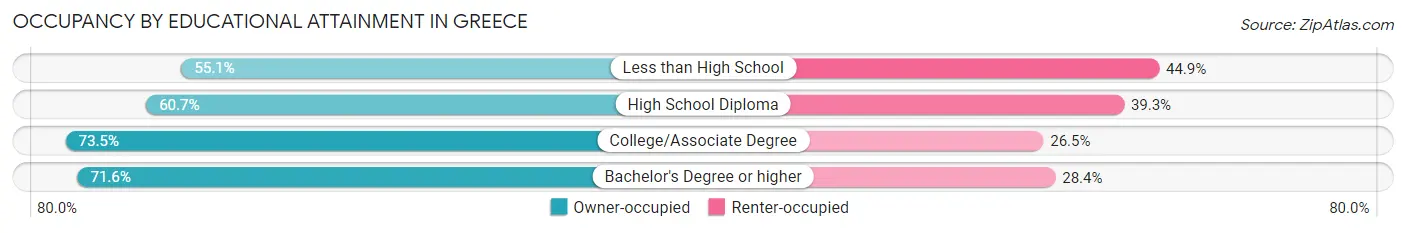
| Household Size | Owner-occupied | Renter-occupied |
| Less than High School | 376 (55.1%) | 306 (44.9%) |
| High School Diploma | 1,095 (60.7%) | 709 (39.3%) |
| College/Associate Degree | 1,339 (73.5%) | 483 (26.5%) |
| Bachelor's Degree or higher | 1,580 (71.6%) | 627 (28.4%) |
Occupancy by Age of Householder in Greece
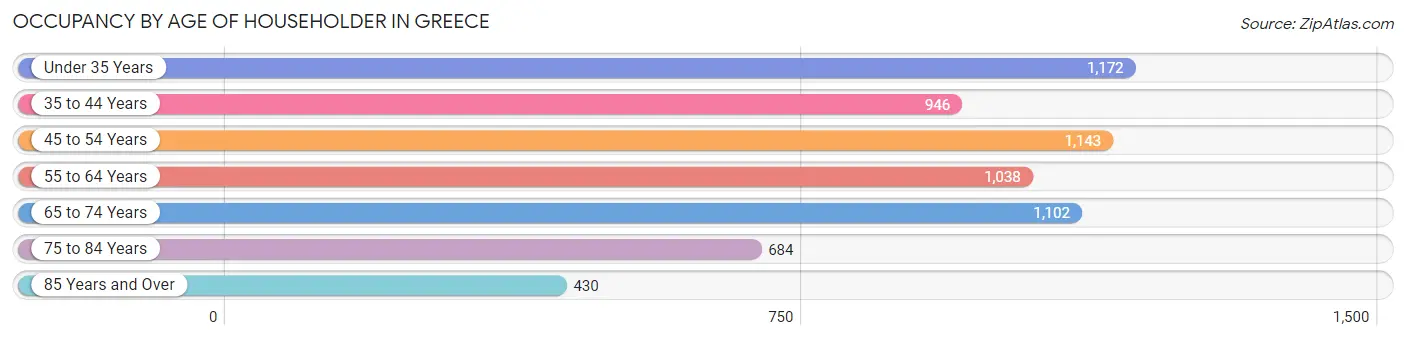
| Age Bracket | # Households | % Households |
| Under 35 Years | 1,172 | 18.0% |
| 35 to 44 Years | 946 | 14.5% |
| 45 to 54 Years | 1,143 | 17.5% |
| 55 to 64 Years | 1,038 | 15.9% |
| 65 to 74 Years | 1,102 | 16.9% |
| 75 to 84 Years | 684 | 10.5% |
| 85 Years and Over | 430 | 6.6% |
| Total | 6,515 | 100.0% |
Housing Finances in Greece
Median Income by Occupancy in Greece
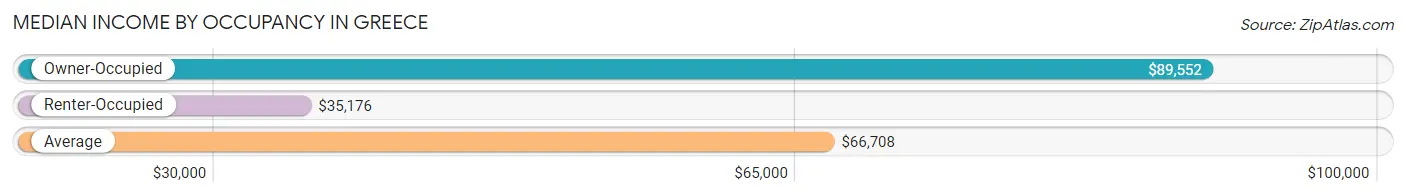
| Occupancy Type | # Households | Median Income |
| Owner-Occupied | 4,390 (67.4%) | $89,552 |
| Renter-Occupied | 2,125 (32.6%) | $35,176 |
| Average | 6,515 (100.0%) | $66,708 |
Occupancy by Householder Income Bracket in Greece
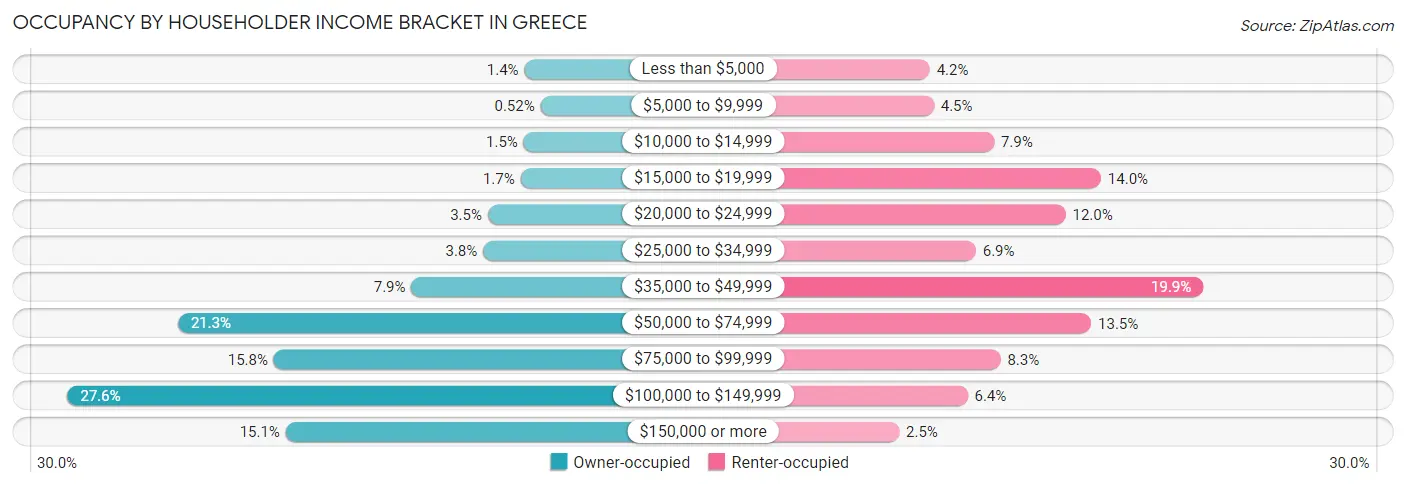
| Income Bracket | Owner-occupied | Renter-occupied |
| Less than $5,000 | 63 (1.4%) | 90 (4.2%) |
| $5,000 to $9,999 | 23 (0.5%) | 95 (4.5%) |
| $10,000 to $14,999 | 65 (1.5%) | 168 (7.9%) |
| $15,000 to $19,999 | 73 (1.7%) | 298 (14.0%) |
| $20,000 to $24,999 | 155 (3.5%) | 255 (12.0%) |
| $25,000 to $34,999 | 167 (3.8%) | 146 (6.9%) |
| $35,000 to $49,999 | 347 (7.9%) | 422 (19.9%) |
| $50,000 to $74,999 | 933 (21.2%) | 286 (13.5%) |
| $75,000 to $99,999 | 692 (15.8%) | 176 (8.3%) |
| $100,000 to $149,999 | 1,210 (27.6%) | 136 (6.4%) |
| $150,000 or more | 662 (15.1%) | 53 (2.5%) |
| Total | 4,390 (100.0%) | 2,125 (100.0%) |
Monthly Housing Cost Tiers in Greece
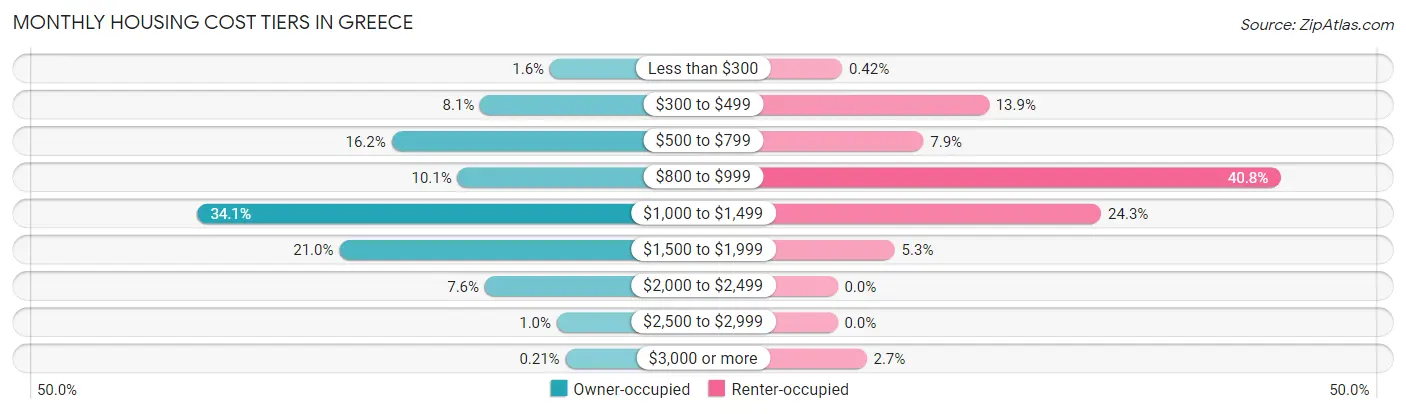
| Monthly Cost | Owner-occupied | Renter-occupied |
| Less than $300 | 72 (1.6%) | 9 (0.4%) |
| $300 to $499 | 354 (8.1%) | 296 (13.9%) |
| $500 to $799 | 712 (16.2%) | 168 (7.9%) |
| $800 to $999 | 445 (10.1%) | 866 (40.7%) |
| $1,000 to $1,499 | 1,496 (34.1%) | 516 (24.3%) |
| $1,500 to $1,999 | 923 (21.0%) | 112 (5.3%) |
| $2,000 to $2,499 | 335 (7.6%) | 0 (0.0%) |
| $2,500 to $2,999 | 44 (1.0%) | 0 (0.0%) |
| $3,000 or more | 9 (0.2%) | 57 (2.7%) |
| Total | 4,390 (100.0%) | 2,125 (100.0%) |
Physical Housing Characteristics in Greece
Housing Structures in Greece
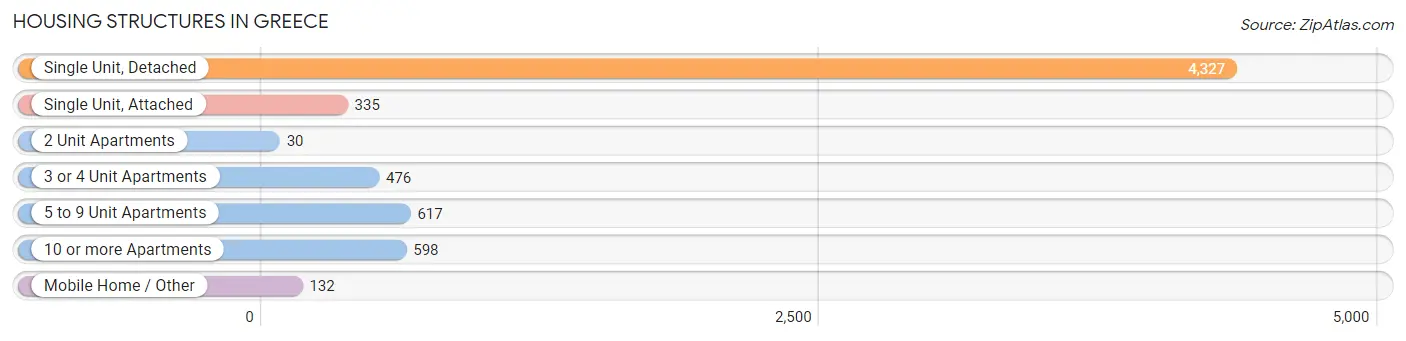
| Structure Type | # Housing Units | % Housing Units |
| Single Unit, Detached | 4,327 | 66.4% |
| Single Unit, Attached | 335 | 5.1% |
| 2 Unit Apartments | 30 | 0.5% |
| 3 or 4 Unit Apartments | 476 | 7.3% |
| 5 to 9 Unit Apartments | 617 | 9.5% |
| 10 or more Apartments | 598 | 9.2% |
| Mobile Home / Other | 132 | 2.0% |
| Total | 6,515 | 100.0% |
Housing Structures by Occupancy in Greece
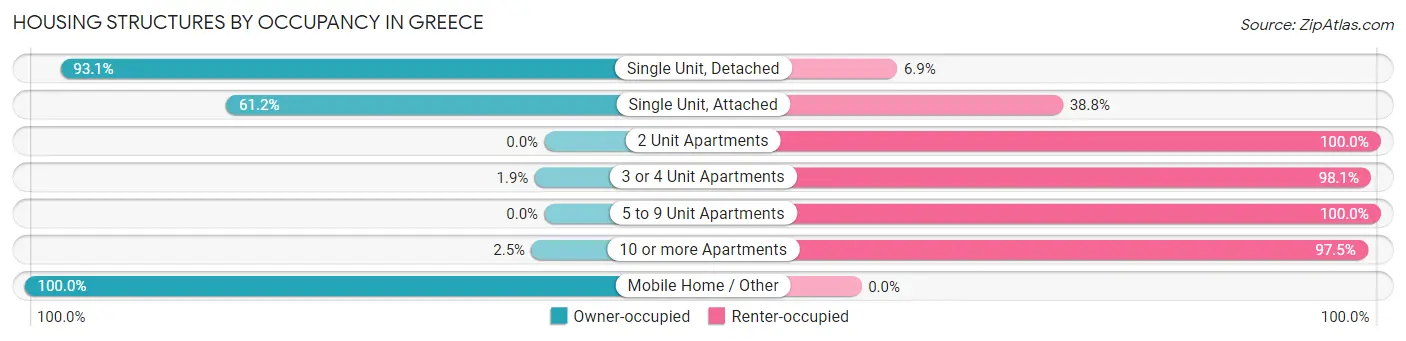
| Structure Type | Owner-occupied | Renter-occupied |
| Single Unit, Detached | 4,029 (93.1%) | 298 (6.9%) |
| Single Unit, Attached | 205 (61.2%) | 130 (38.8%) |
| 2 Unit Apartments | 0 (0.0%) | 30 (100.0%) |
| 3 or 4 Unit Apartments | 9 (1.9%) | 467 (98.1%) |
| 5 to 9 Unit Apartments | 0 (0.0%) | 617 (100.0%) |
| 10 or more Apartments | 15 (2.5%) | 583 (97.5%) |
| Mobile Home / Other | 132 (100.0%) | 0 (0.0%) |
| Total | 4,390 (67.4%) | 2,125 (32.6%) |
Housing Structures by Number of Rooms in Greece
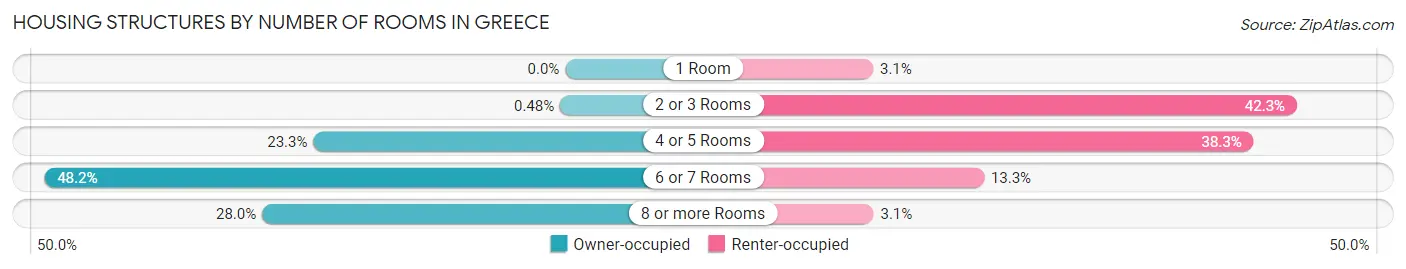
| Number of Rooms | Owner-occupied | Renter-occupied |
| 1 Room | 0 (0.0%) | 65 (3.1%) |
| 2 or 3 Rooms | 21 (0.5%) | 898 (42.3%) |
| 4 or 5 Rooms | 1,023 (23.3%) | 813 (38.3%) |
| 6 or 7 Rooms | 2,115 (48.2%) | 283 (13.3%) |
| 8 or more Rooms | 1,231 (28.0%) | 66 (3.1%) |
| Total | 4,390 (100.0%) | 2,125 (100.0%) |
Housing Structure by Heating Type in Greece
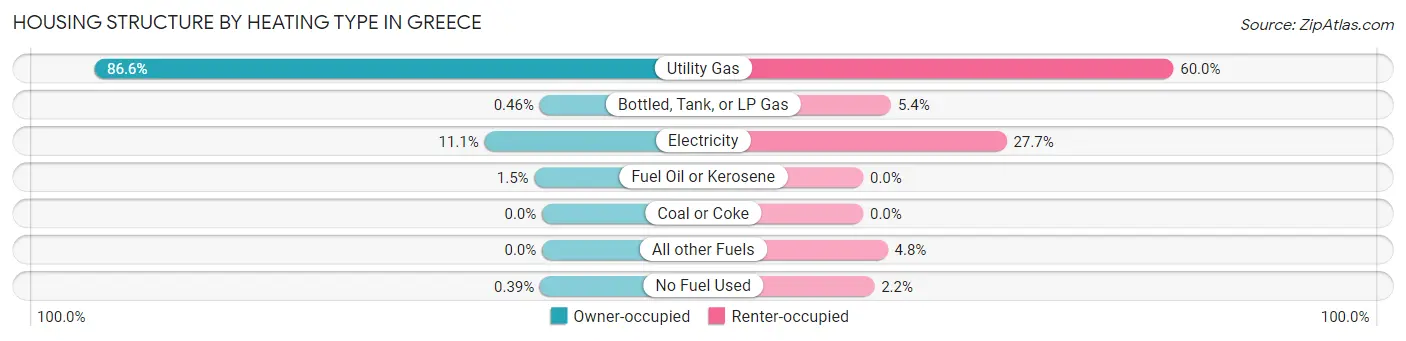
| Heating Type | Owner-occupied | Renter-occupied |
| Utility Gas | 3,800 (86.6%) | 1,274 (60.0%) |
| Bottled, Tank, or LP Gas | 20 (0.5%) | 115 (5.4%) |
| Electricity | 488 (11.1%) | 589 (27.7%) |
| Fuel Oil or Kerosene | 65 (1.5%) | 0 (0.0%) |
| Coal or Coke | 0 (0.0%) | 0 (0.0%) |
| All other Fuels | 0 (0.0%) | 101 (4.8%) |
| No Fuel Used | 17 (0.4%) | 46 (2.2%) |
| Total | 4,390 (100.0%) | 2,125 (100.0%) |
Household Vehicle Usage in Greece
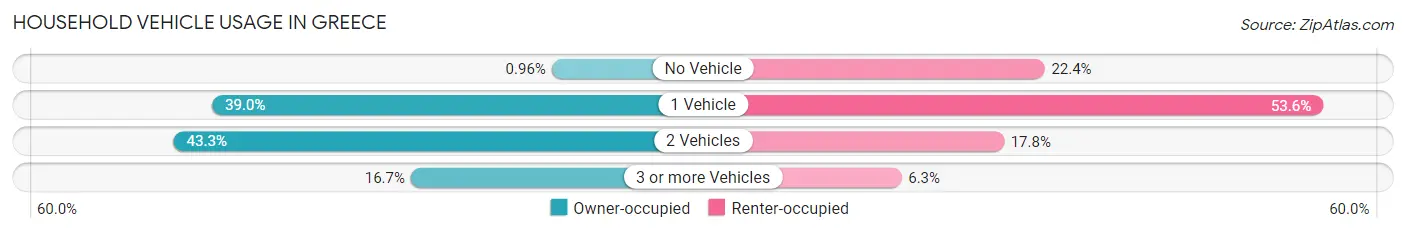
| Vehicles per Household | Owner-occupied | Renter-occupied |
| No Vehicle | 42 (1.0%) | 475 (22.4%) |
| 1 Vehicle | 1,712 (39.0%) | 1,138 (53.5%) |
| 2 Vehicles | 1,901 (43.3%) | 378 (17.8%) |
| 3 or more Vehicles | 735 (16.7%) | 134 (6.3%) |
| Total | 4,390 (100.0%) | 2,125 (100.0%) |
Real Estate & Mortgages in Greece
Real Estate and Mortgage Overview in Greece
| Characteristic | Without Mortgage | With Mortgage |
| Housing Units | 1,307 | 3,083 |
| Median Property Value | $141,500 | $150,100 |
| Median Household Income | $61,995 | $501 |
| Monthly Housing Costs | $703 | $9 |
| Real Estate Taxes | $4,407 | $0 |
Property Value by Mortgage Status in Greece
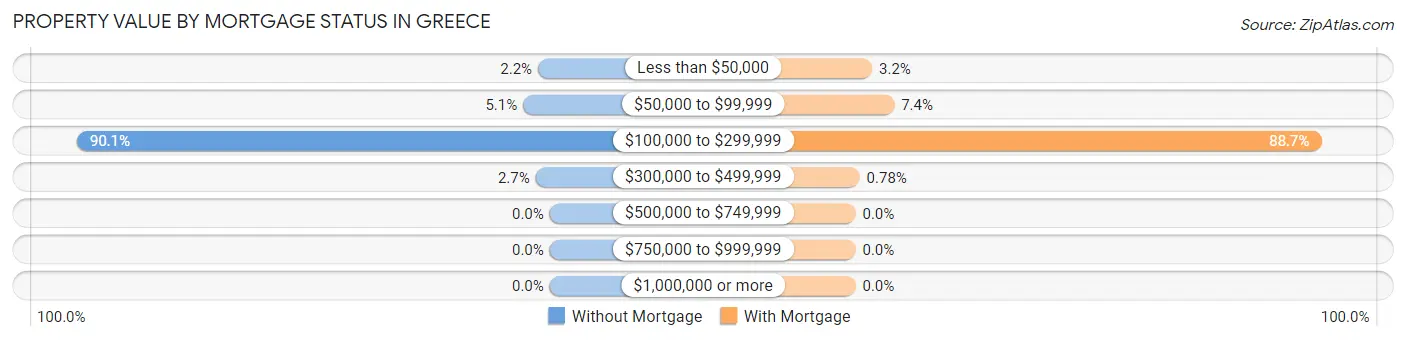
| Property Value | Without Mortgage | With Mortgage |
| Less than $50,000 | 29 (2.2%) | 97 (3.2%) |
| $50,000 to $99,999 | 66 (5.1%) | 227 (7.4%) |
| $100,000 to $299,999 | 1,177 (90.0%) | 2,735 (88.7%) |
| $300,000 to $499,999 | 35 (2.7%) | 24 (0.8%) |
| $500,000 to $749,999 | 0 (0.0%) | 0 (0.0%) |
| $750,000 to $999,999 | 0 (0.0%) | 0 (0.0%) |
| $1,000,000 or more | 0 (0.0%) | 0 (0.0%) |
| Total | 1,307 (100.0%) | 3,083 (100.0%) |
Household Income by Mortgage Status in Greece
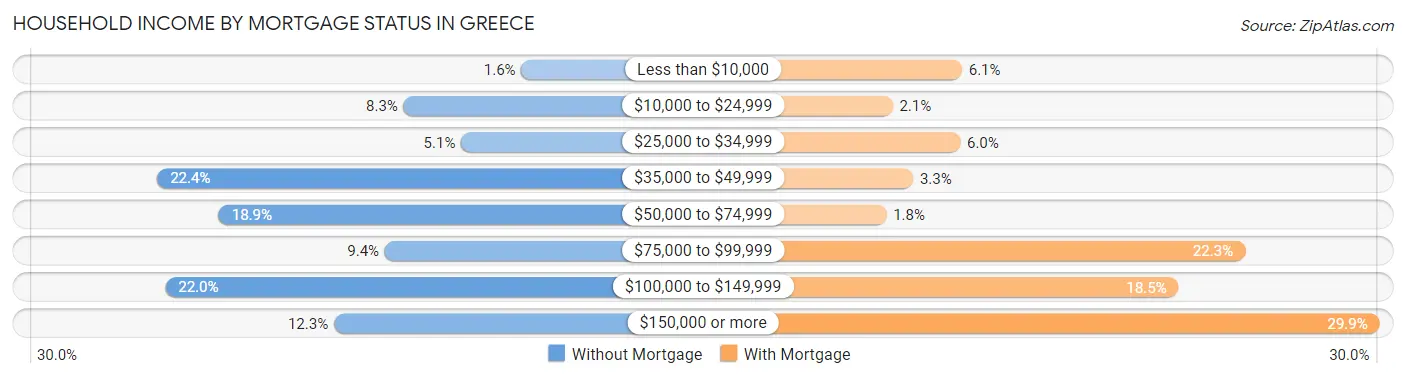
| Household Income | Without Mortgage | With Mortgage |
| Less than $10,000 | 21 (1.6%) | 187 (6.1%) |
| $10,000 to $24,999 | 109 (8.3%) | 65 (2.1%) |
| $25,000 to $34,999 | 66 (5.1%) | 184 (6.0%) |
| $35,000 to $49,999 | 293 (22.4%) | 101 (3.3%) |
| $50,000 to $74,999 | 247 (18.9%) | 54 (1.8%) |
| $75,000 to $99,999 | 123 (9.4%) | 686 (22.3%) |
| $100,000 to $149,999 | 287 (22.0%) | 569 (18.5%) |
| $150,000 or more | 161 (12.3%) | 923 (29.9%) |
| Total | 1,307 (100.0%) | 3,083 (100.0%) |
Property Value to Household Income Ratio in Greece
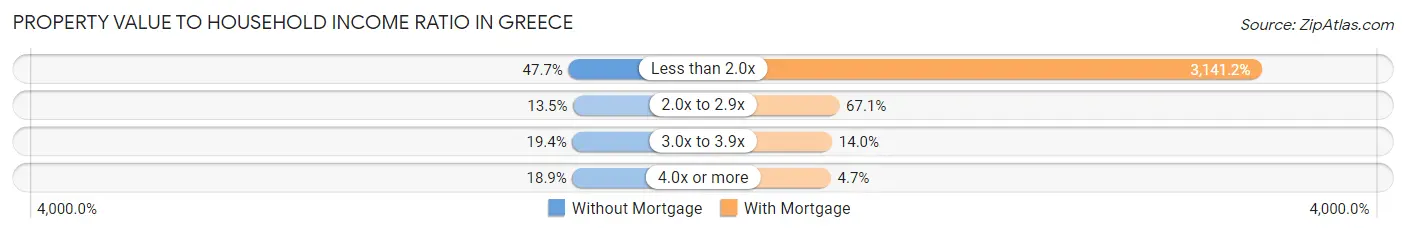
| Value-to-Income Ratio | Without Mortgage | With Mortgage |
| Less than 2.0x | 623 (47.7%) | 96,844 (3,141.2%) |
| 2.0x to 2.9x | 176 (13.5%) | 2,069 (67.1%) |
| 3.0x to 3.9x | 253 (19.4%) | 432 (14.0%) |
| 4.0x or more | 247 (18.9%) | 146 (4.7%) |
| Total | 1,307 (100.0%) | 3,083 (100.0%) |
Real Estate Taxes by Mortgage Status in Greece

| Property Taxes | Without Mortgage | With Mortgage |
| Less than $800 | 29 (2.2%) | 8 (0.3%) |
| $800 to $1,499 | 11 (0.8%) | 101 (3.3%) |
| $800 to $1,499 | 1,240 (94.9%) | 90 (2.9%) |
| Total | 1,307 (100.0%) | 3,083 (100.0%) |
Health & Disability in Greece
Health Insurance Coverage by Age in Greece
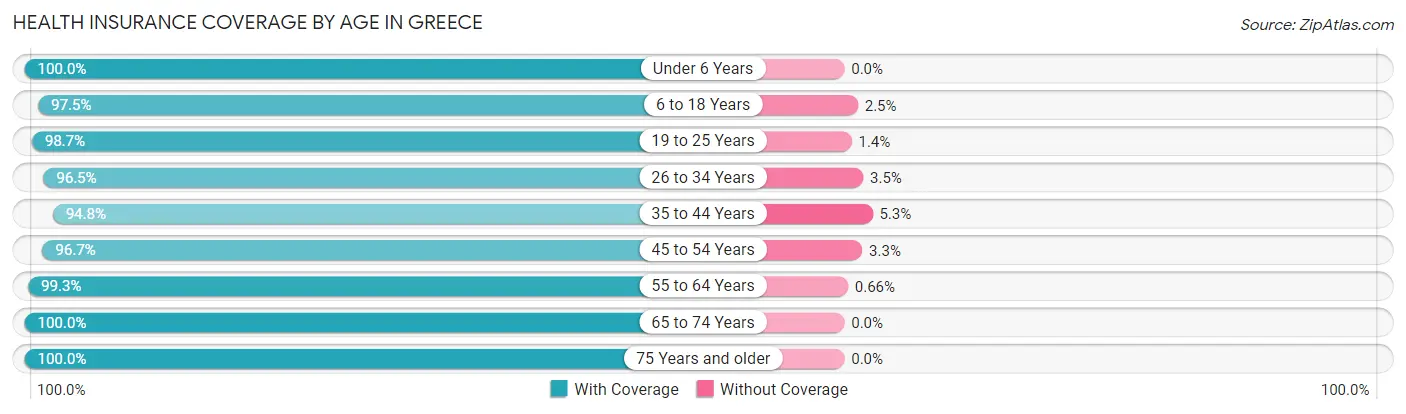
| Age Bracket | With Coverage | Without Coverage |
| Under 6 Years | 879 (100.0%) | 0 (0.0%) |
| 6 to 18 Years | 1,709 (97.5%) | 44 (2.5%) |
| 19 to 25 Years | 1,094 (98.7%) | 15 (1.3%) |
| 26 to 34 Years | 1,787 (96.5%) | 65 (3.5%) |
| 35 to 44 Years | 1,642 (94.8%) | 91 (5.2%) |
| 45 to 54 Years | 1,856 (96.7%) | 64 (3.3%) |
| 55 to 64 Years | 1,955 (99.3%) | 13 (0.7%) |
| 65 to 74 Years | 1,571 (100.0%) | 0 (0.0%) |
| 75 Years and older | 1,589 (100.0%) | 0 (0.0%) |
| Total | 14,082 (98.0%) | 292 (2.0%) |
Health Insurance Coverage by Citizenship Status in Greece

| Citizenship Status | With Coverage | Without Coverage |
| Native Born | 879 (100.0%) | 0 (0.0%) |
| Foreign Born, Citizen | 1,709 (97.5%) | 44 (2.5%) |
| Foreign Born, not a Citizen | 1,094 (98.7%) | 15 (1.3%) |
Health Insurance Coverage by Household Income in Greece
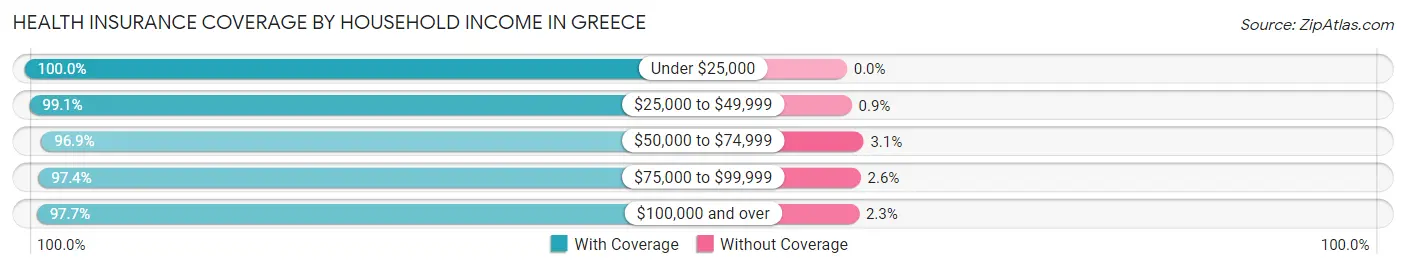
| Household Income | With Coverage | Without Coverage |
| Under $25,000 | 1,609 (100.0%) | 0 (0.0%) |
| $25,000 to $49,999 | 1,876 (99.1%) | 17 (0.9%) |
| $50,000 to $74,999 | 2,353 (96.9%) | 76 (3.1%) |
| $75,000 to $99,999 | 2,410 (97.4%) | 64 (2.6%) |
| $100,000 and over | 5,781 (97.7%) | 135 (2.3%) |
Public vs Private Health Insurance Coverage by Age in Greece
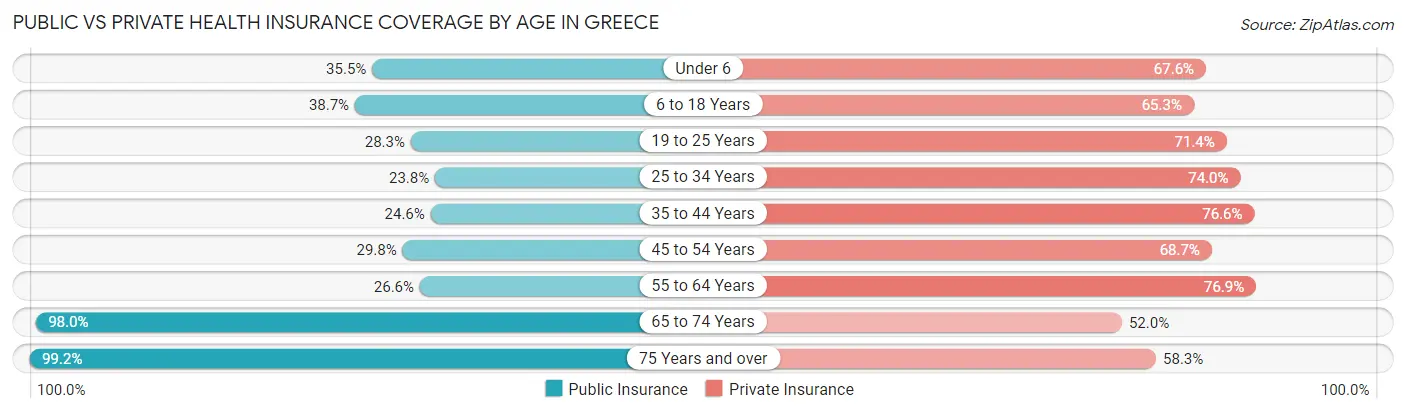
| Age Bracket | Public Insurance | Private Insurance |
| Under 6 | 312 (35.5%) | 594 (67.6%) |
| 6 to 18 Years | 678 (38.7%) | 1,145 (65.3%) |
| 19 to 25 Years | 314 (28.3%) | 792 (71.4%) |
| 25 to 34 Years | 441 (23.8%) | 1,370 (74.0%) |
| 35 to 44 Years | 427 (24.6%) | 1,327 (76.6%) |
| 45 to 54 Years | 573 (29.8%) | 1,318 (68.6%) |
| 55 to 64 Years | 524 (26.6%) | 1,513 (76.9%) |
| 65 to 74 Years | 1,540 (98.0%) | 817 (52.0%) |
| 75 Years and over | 1,576 (99.2%) | 927 (58.3%) |
| Total | 6,385 (44.4%) | 9,803 (68.2%) |
Disability Status by Sex by Age in Greece
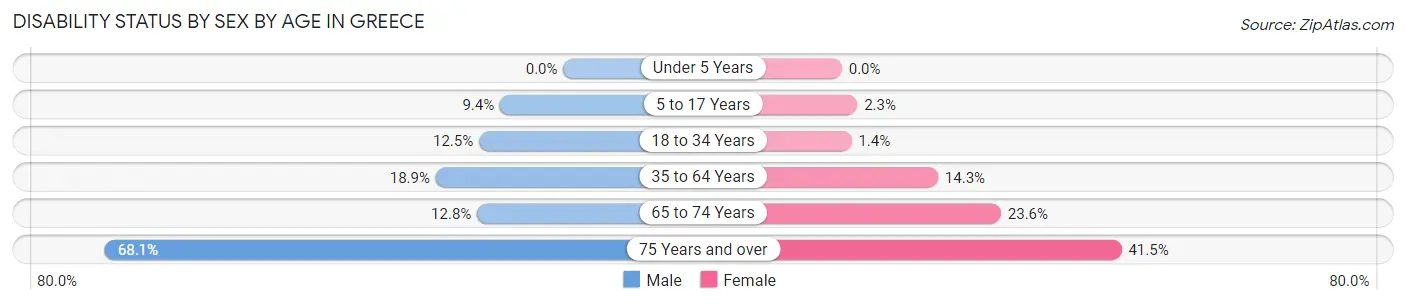
| Age Bracket | Male | Female |
| Under 5 Years | 0 (0.0%) | 0 (0.0%) |
| 5 to 17 Years | 89 (9.4%) | 19 (2.3%) |
| 18 to 34 Years | 197 (12.5%) | 22 (1.4%) |
| 35 to 64 Years | 511 (18.9%) | 417 (14.3%) |
| 65 to 74 Years | 90 (12.8%) | 205 (23.6%) |
| 75 Years and over | 354 (68.1%) | 444 (41.5%) |
Disability Class by Sex by Age in Greece
Disability Class: Hearing Difficulty
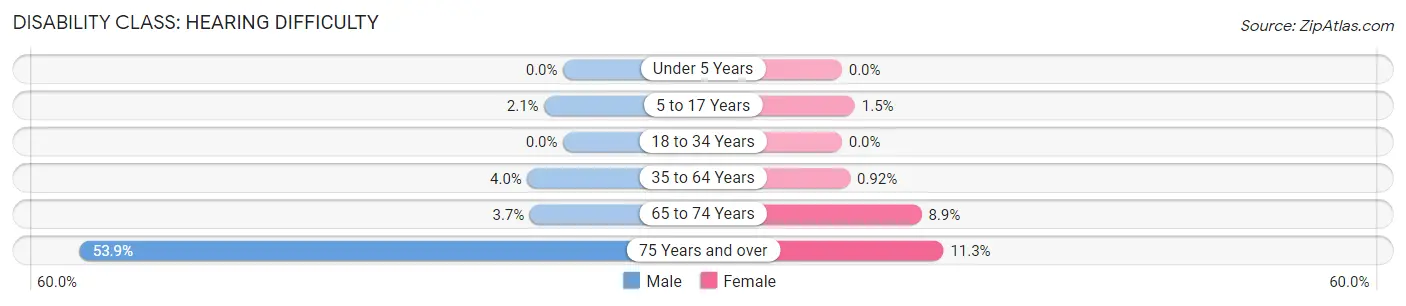
| Age Bracket | Male | Female |
| Under 5 Years | 0 (0.0%) | 0 (0.0%) |
| 5 to 17 Years | 20 (2.1%) | 12 (1.5%) |
| 18 to 34 Years | 0 (0.0%) | 0 (0.0%) |
| 35 to 64 Years | 107 (4.0%) | 27 (0.9%) |
| 65 to 74 Years | 26 (3.7%) | 77 (8.9%) |
| 75 Years and over | 280 (53.8%) | 121 (11.3%) |
Disability Class: Vision Difficulty
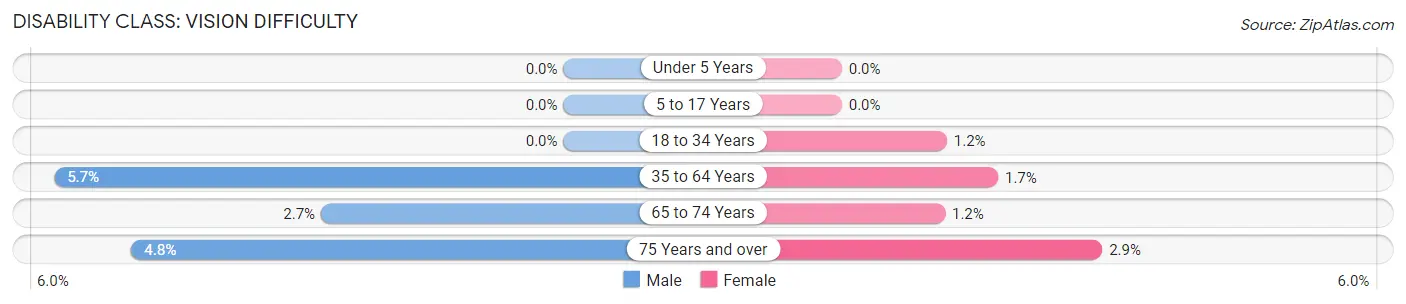
| Age Bracket | Male | Female |
| Under 5 Years | 0 (0.0%) | 0 (0.0%) |
| 5 to 17 Years | 0 (0.0%) | 0 (0.0%) |
| 18 to 34 Years | 0 (0.0%) | 18 (1.2%) |
| 35 to 64 Years | 153 (5.7%) | 51 (1.7%) |
| 65 to 74 Years | 19 (2.7%) | 10 (1.1%) |
| 75 Years and over | 25 (4.8%) | 31 (2.9%) |
Disability Class: Cognitive Difficulty
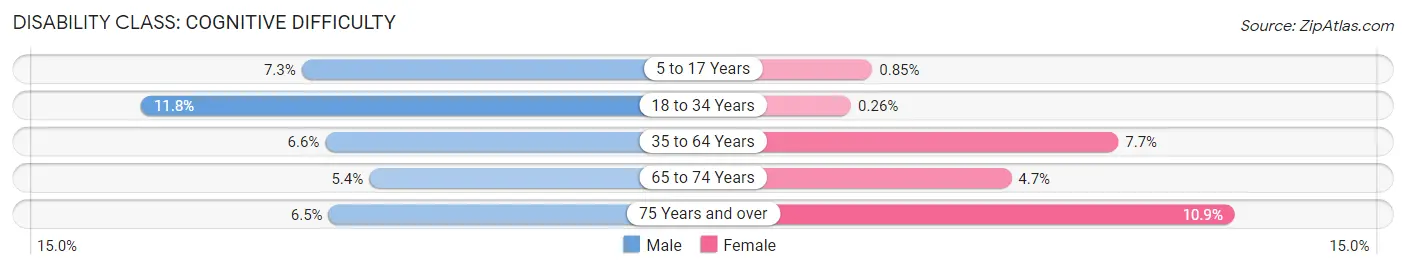
| Age Bracket | Male | Female |
| 5 to 17 Years | 69 (7.3%) | 7 (0.9%) |
| 18 to 34 Years | 185 (11.8%) | 4 (0.3%) |
| 35 to 64 Years | 179 (6.6%) | 225 (7.7%) |
| 65 to 74 Years | 38 (5.4%) | 41 (4.7%) |
| 75 Years and over | 34 (6.5%) | 117 (10.9%) |
Disability Class: Ambulatory Difficulty
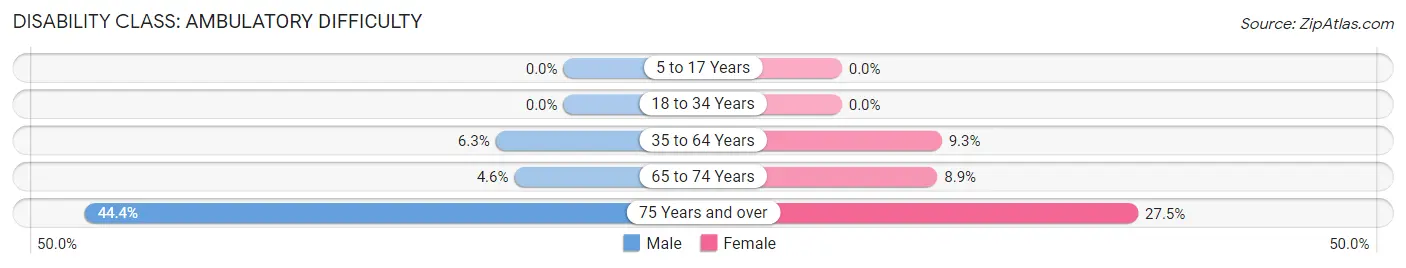
| Age Bracket | Male | Female |
| 5 to 17 Years | 0 (0.0%) | 0 (0.0%) |
| 18 to 34 Years | 0 (0.0%) | 0 (0.0%) |
| 35 to 64 Years | 170 (6.3%) | 271 (9.3%) |
| 65 to 74 Years | 32 (4.5%) | 77 (8.9%) |
| 75 Years and over | 231 (44.4%) | 294 (27.5%) |
Disability Class: Self-Care Difficulty
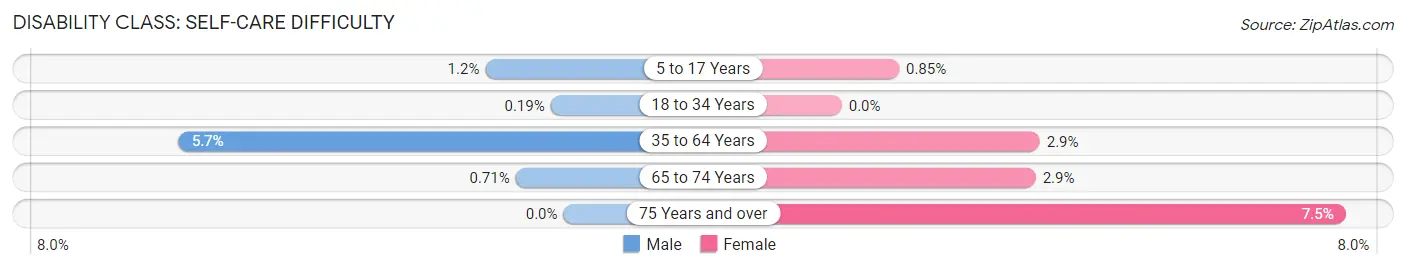
| Age Bracket | Male | Female |
| 5 to 17 Years | 11 (1.2%) | 7 (0.9%) |
| 18 to 34 Years | 3 (0.2%) | 0 (0.0%) |
| 35 to 64 Years | 154 (5.7%) | 86 (2.9%) |
| 65 to 74 Years | 5 (0.7%) | 25 (2.9%) |
| 75 Years and over | 0 (0.0%) | 80 (7.5%) |
Technology Access in Greece
Computing Device Access in Greece
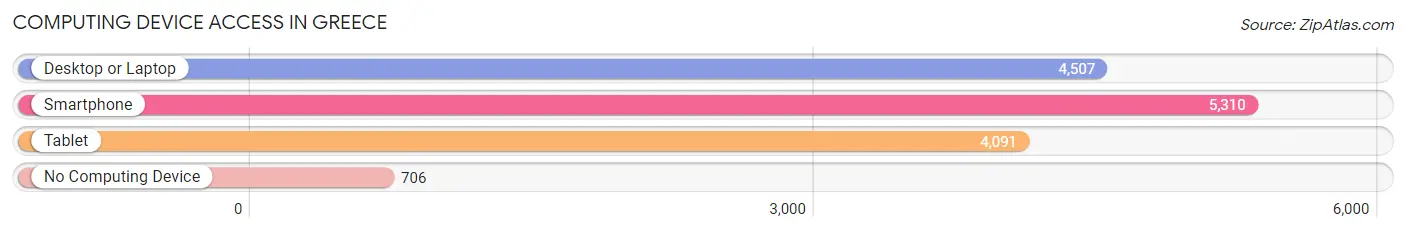
| Device Type | # Households | % Households |
| Desktop or Laptop | 4,507 | 69.2% |
| Smartphone | 5,310 | 81.5% |
| Tablet | 4,091 | 62.8% |
| No Computing Device | 706 | 10.8% |
| Total | 6,515 | 100.0% |
Internet Access in Greece
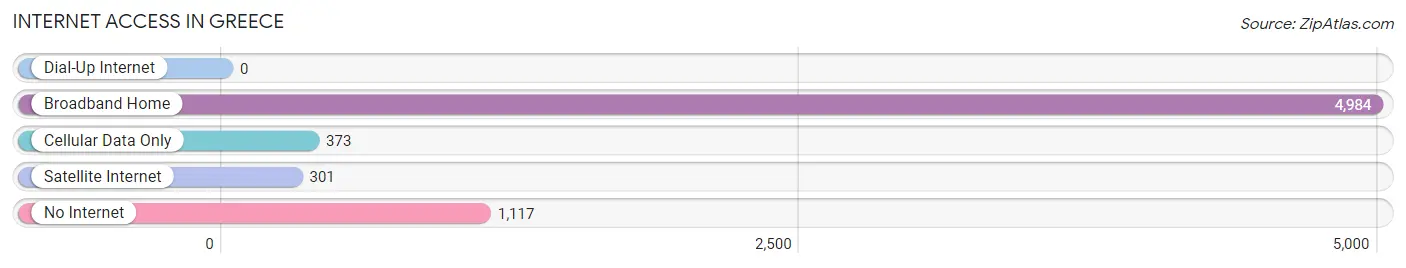
| Internet Type | # Households | % Households |
| Dial-Up Internet | 0 | 0.0% |
| Broadband Home | 4,984 | 76.5% |
| Cellular Data Only | 373 | 5.7% |
| Satellite Internet | 301 | 4.6% |
| No Internet | 1,117 | 17.2% |
| Total | 6,515 | 100.0% |
Greece Summary
Greece is a town located in Monroe County, New York, United States. It is a suburb of Rochester, New York, and is located just north of the city. As of the 2010 census, the town had a total population of 96,095.
History
Greece was first settled in 1788 by pioneers from New England. The town was originally part of the Town of Northampton, which was later divided into the towns of Greece and Gates. The town of Greece was officially established in 1822.
Greece was an agricultural community until the 1950s, when it began to experience rapid growth due to the expansion of the Rochester metropolitan area. The town has since become a suburban community, with many of its residents commuting to Rochester for work.
Geography
Greece is located in western Monroe County, bordered by the towns of Gates to the east, Parma to the south, and Ogden to the west. The town is located on the northern shore of Lake Ontario, and is approximately 10 miles north of the city of Rochester.
The town has a total area of 33.2 square miles, of which 32.9 square miles is land and 0.3 square miles is water. The town is located in the Finger Lakes region of New York, and is home to several small lakes, including Braddock Bay, Irondequoit Bay, and Round Pond.
Economy
Greece is home to a variety of businesses, including manufacturing, retail, and service industries. The town is also home to several large employers, including the University of Rochester Medical Center, Rochester Institute of Technology, and Wegmans Food Markets.
Greece is also home to several shopping centers, including Greece Ridge Mall, Long Pond Plaza, and Greece Towne Center. The town is also home to several golf courses, including the Country Club of Rochester and the Oak Hill Country Club.
Demographics
As of the 2010 census, there were 96,095 people, 37,945 households, and 25,845 families residing in the town. The population density was 2,919.3 people per square mile. There were 40,845 housing units at an average density of 1,238.3 per square mile.
The racial makeup of the town was 87.2% White, 8.2% African American, 0.3% Native American, 1.7% Asian, 0.1% Pacific Islander, 0.9% from other races, and 1.6% from two or more races. Hispanic or Latino of any race were 3.2% of the population.
There were 37,945 households, out of which 30.2% had children under the age of 18 living with them, 51.2% were married couples living together, 11.7% had a female householder with no husband present, and 32.7% were non-families. 26.2% of all households were made up of individuals, and 10.2% had someone living alone who was 65 years of age or older. The average household size was 2.51 and the average family size was 3.06.
In the town, the population was spread out, with 24.2% under the age of 18, 7.2% from 18 to 24, 28.2% from 25 to 44, 25.2% from 45 to 64, and 15.2% who were 65 years of age or older. The median age was 39 years. For every 100 females, there were 92.2 males. For every 100 females age 18 and over, there were 88.3 males.
The median income for a household in the town was $50,945, and the median income for a family was $60,945. Males had a median income of $45,945 versus $32,945 for females. The per capita income for the town was $25,945. About 4.2% of families and 6.2% of the population were below the poverty line, including 8.2% of those under age 18 and 5.2% of those age 65 or over.
Common Questions
What is Per Capita Income in Greece?
Per Capita income in Greece is $37,717.
What is the Median Family Income in Greece?
Median Family Income in Greece is $92,631.
What is the Median Household income in Greece?
Median Household Income in Greece is $66,708.
What is Income or Wage Gap in Greece?
Income or Wage Gap in Greece is 18.9%.
Women in Greece earn 81.1 cents for every dollar earned by a man.
What is Inequality or Gini Index in Greece?
Inequality or Gini Index in Greece is 0.42.
What is the Total Population of Greece?
Total Population of Greece is 14,406.
What is the Total Male Population of Greece?
Total Male Population of Greece is 6,770.
What is the Total Female Population of Greece?
Total Female Population of Greece is 7,636.
What is the Ratio of Males per 100 Females in Greece?
There are 88.66 Males per 100 Females in Greece.
What is the Ratio of Females per 100 Males in Greece?
There are 112.79 Females per 100 Males in Greece.
What is the Median Population Age in Greece?
Median Population Age in Greece is 44.3 Years.
What is the Average Family Size in Greece
Average Family Size in Greece is 2.9 People.
What is the Average Household Size in Greece
Average Household Size in Greece is 2.2 People.
How Large is the Labor Force in Greece?
There are 7,628 People in the Labor Forcein in Greece.
What is the Percentage of People in the Labor Force in Greece?
62.3% of People are in the Labor Force in Greece.
What is the Unemployment Rate in Greece?
Unemployment Rate in Greece is 5.0%.