Glens Falls, NY Map & Demographics
Glens Falls Map
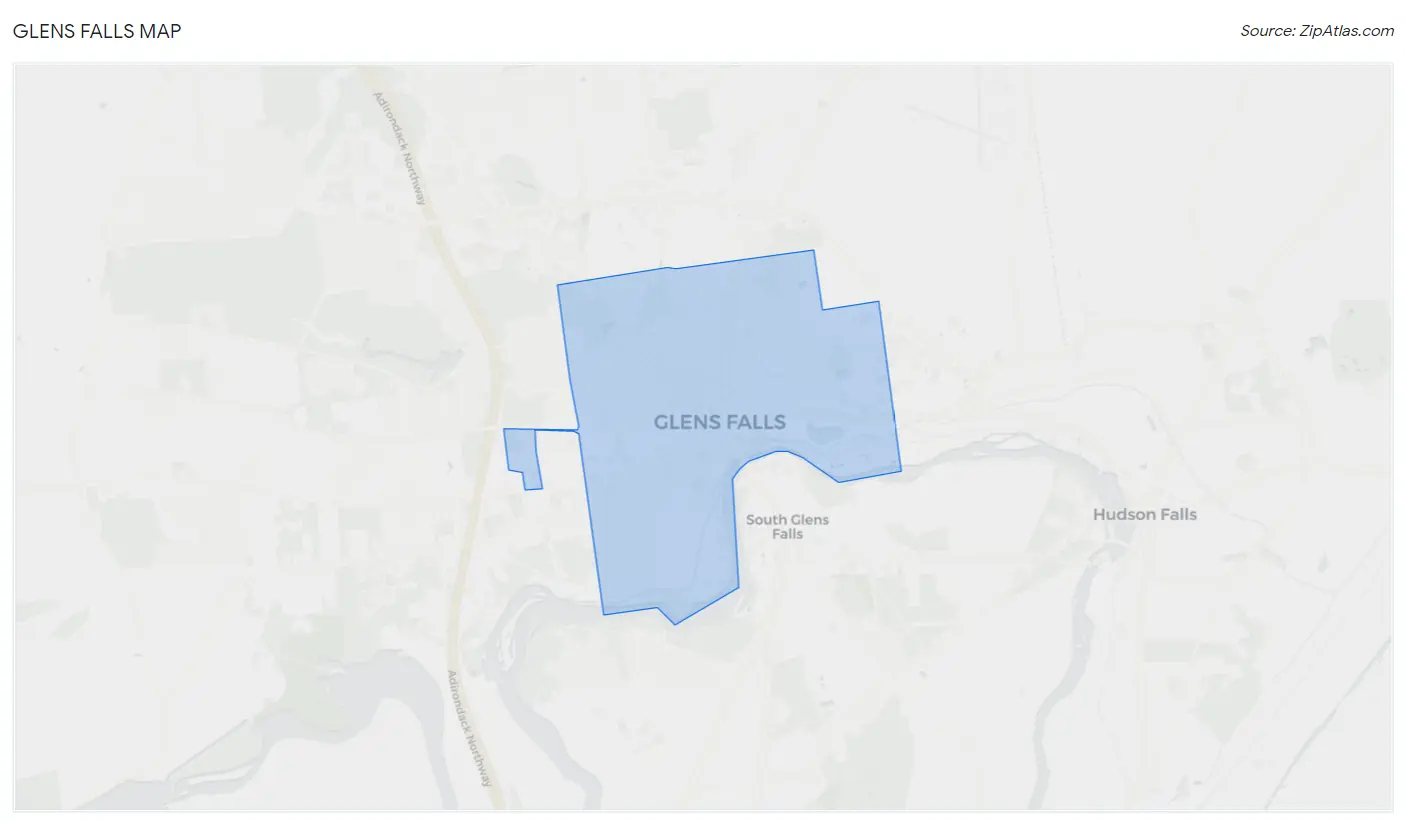
Glens Falls Overview
$36,031
PER CAPITA INCOME
$80,839
AVG FAMILY INCOME
$64,731
AVG HOUSEHOLD INCOME
28.9%
WAGE / INCOME GAP [ % ]
71.1¢/ $1
WAGE / INCOME GAP [ $ ]
$8,299
FAMILY INCOME DEFICIT
0.43
INEQUALITY / GINI INDEX
14,743
TOTAL POPULATION
7,499
MALE POPULATION
7,244
FEMALE POPULATION
103.52
MALES / 100 FEMALES
96.60
FEMALES / 100 MALES
37.0
MEDIAN AGE
2.9
AVG FAMILY SIZE
2.2
AVG HOUSEHOLD SIZE
8,039
LABOR FORCE [ PEOPLE ]
66.9%
PERCENT IN LABOR FORCE
5.7%
UNEMPLOYMENT RATE
Glens Falls Zip Codes
Glens Falls Area Codes
Income in Glens Falls
Income Overview in Glens Falls
Per Capita Income in Glens Falls is $36,031, while median incomes of families and households are $80,839 and $64,731 respectively.
| Characteristic | Number | Measure |
| Per Capita Income | 14,743 | $36,031 |
| Median Family Income | 3,521 | $80,839 |
| Mean Family Income | 3,521 | $98,623 |
| Median Household Income | 6,669 | $64,731 |
| Mean Household Income | 6,669 | $79,803 |
| Income Deficit | 3,521 | $8,299 |
| Wage / Income Gap (%) | 14,743 | 28.85% |
| Wage / Income Gap ($) | 14,743 | 71.15¢ per $1 |
| Gini / Inequality Index | 14,743 | 0.43 |
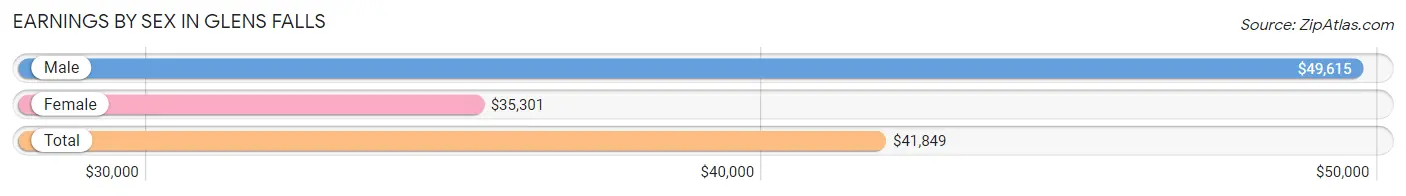
Earnings by Sex in Glens Falls
Average Earnings in Glens Falls are $41,849, $49,615 for men and $35,301 for women, a difference of 28.8%.
| Sex | Number | Average Earnings |
| Male | 4,436 (53.2%) | $49,615 |
| Female | 3,909 (46.8%) | $35,301 |
| Total | 8,345 (100.0%) | $41,849 |
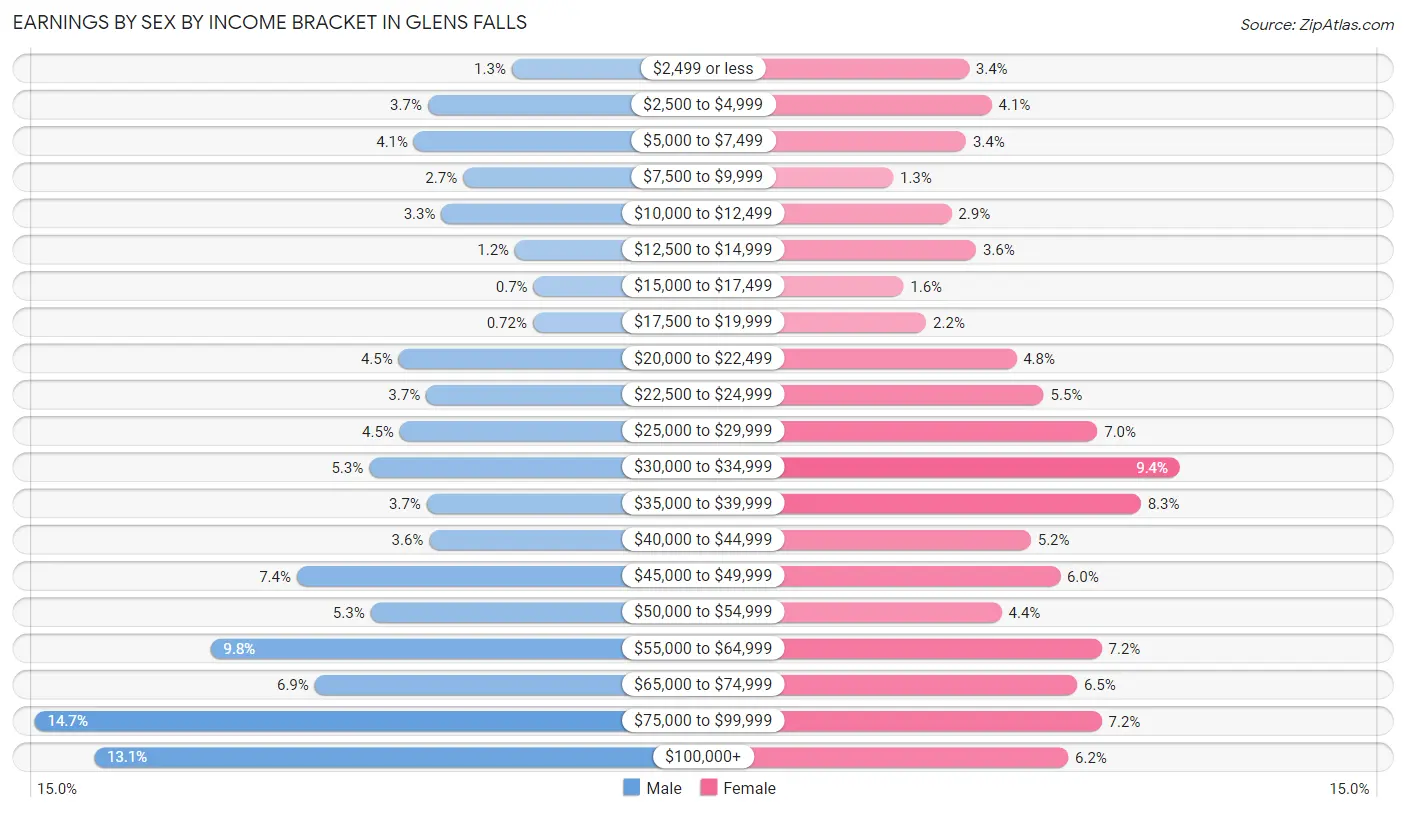
Earnings by Sex by Income Bracket in Glens Falls
The most common earnings brackets in Glens Falls are $75,000 to $99,999 for men (653 | 14.7%) and $30,000 to $34,999 for women (366 | 9.4%).
| Income | Male | Female |
| $2,499 or less | 58 (1.3%) | 134 (3.4%) |
| $2,500 to $4,999 | 163 (3.7%) | 159 (4.1%) |
| $5,000 to $7,499 | 180 (4.1%) | 131 (3.4%) |
| $7,500 to $9,999 | 119 (2.7%) | 51 (1.3%) |
| $10,000 to $12,499 | 146 (3.3%) | 115 (2.9%) |
| $12,500 to $14,999 | 54 (1.2%) | 142 (3.6%) |
| $15,000 to $17,499 | 31 (0.7%) | 62 (1.6%) |
| $17,500 to $19,999 | 32 (0.7%) | 87 (2.2%) |
| $20,000 to $22,499 | 199 (4.5%) | 186 (4.8%) |
| $22,500 to $24,999 | 165 (3.7%) | 216 (5.5%) |
| $25,000 to $29,999 | 198 (4.5%) | 275 (7.0%) |
| $30,000 to $34,999 | 236 (5.3%) | 366 (9.4%) |
| $35,000 to $39,999 | 164 (3.7%) | 323 (8.3%) |
| $40,000 to $44,999 | 161 (3.6%) | 202 (5.2%) |
| $45,000 to $49,999 | 326 (7.3%) | 234 (6.0%) |
| $50,000 to $54,999 | 234 (5.3%) | 170 (4.3%) |
| $55,000 to $64,999 | 434 (9.8%) | 280 (7.2%) |
| $65,000 to $74,999 | 304 (6.9%) | 253 (6.5%) |
| $75,000 to $99,999 | 653 (14.7%) | 280 (7.2%) |
| $100,000+ | 579 (13.1%) | 243 (6.2%) |
| Total | 4,436 (100.0%) | 3,909 (100.0%) |
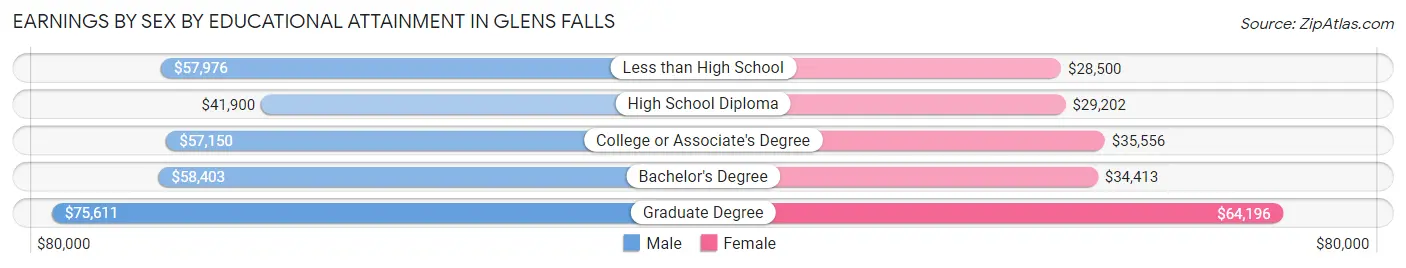
Earnings by Sex by Educational Attainment in Glens Falls
Average earnings in Glens Falls are $54,657 for men and $38,911 for women, a difference of 28.8%. Men with an educational attainment of graduate degree enjoy the highest average annual earnings of $75,611, while those with high school diploma education earn the least with $41,900. Women with an educational attainment of graduate degree earn the most with the average annual earnings of $64,196, while those with less than high school education have the smallest earnings of $28,500.
| Educational Attainment | Male Income | Female Income |
| Less than High School | $57,976 | $28,500 |
| High School Diploma | $41,900 | $29,202 |
| College or Associate's Degree | $57,150 | $35,556 |
| Bachelor's Degree | $58,403 | $34,413 |
| Graduate Degree | $75,611 | $64,196 |
| Total | $54,657 | $38,911 |
Family Income in Glens Falls
Family Income Brackets in Glens Falls
According to the Glens Falls family income data, there are 764 families falling into the $100,000 to $149,999 income range, which is the most common income bracket and makes up 21.7% of all families. Conversely, the $10,000 to $14,999 income bracket is the least frequent group with only 25 families (0.7%) belonging to this category.
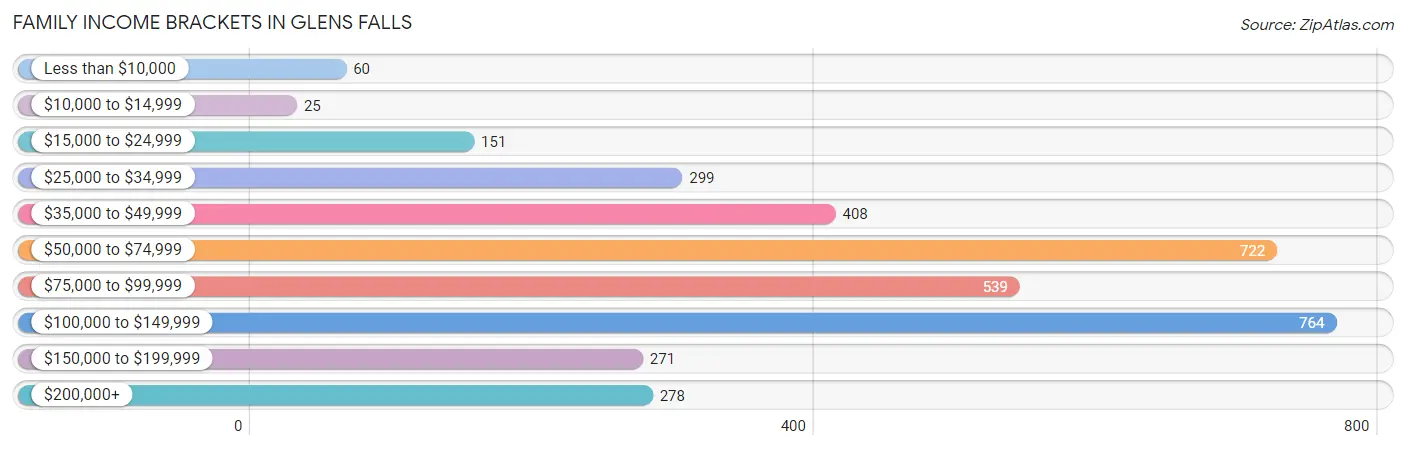
| Income Bracket | # Families | % Families |
| Less than $10,000 | 60 | 1.7% |
| $10,000 to $14,999 | 25 | 0.7% |
| $15,000 to $24,999 | 151 | 4.3% |
| $25,000 to $34,999 | 299 | 8.5% |
| $35,000 to $49,999 | 408 | 11.6% |
| $50,000 to $74,999 | 722 | 20.5% |
| $75,000 to $99,999 | 539 | 15.3% |
| $100,000 to $149,999 | 764 | 21.7% |
| $150,000 to $199,999 | 271 | 7.7% |
| $200,000+ | 278 | 7.9% |
Family Income by Famaliy Size in Glens Falls
5-person families (277 | 7.9%) account for the highest median family income in Glens Falls with $96,953 per family, while 2-person families (1,868 | 53.0%) have the highest median income of $36,204 per family member.
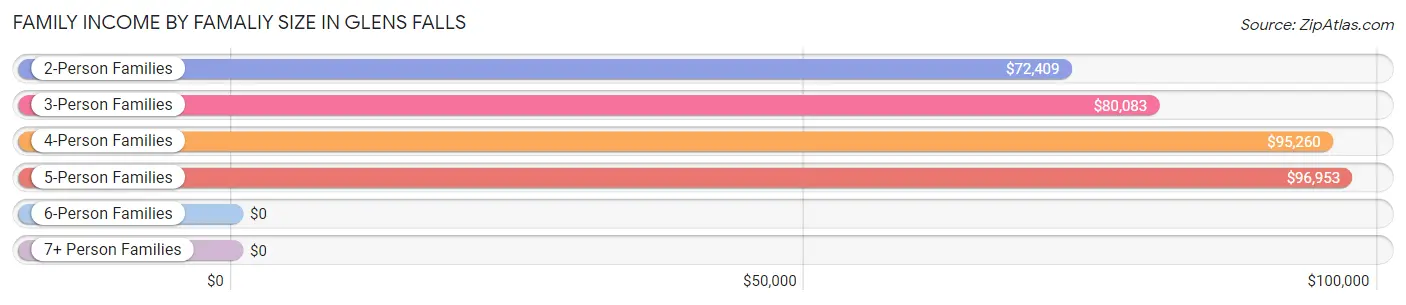
| Income Bracket | # Families | Median Income |
| 2-Person Families | 1,868 (53.0%) | $72,409 |
| 3-Person Families | 837 (23.8%) | $80,083 |
| 4-Person Families | 489 (13.9%) | $95,260 |
| 5-Person Families | 277 (7.9%) | $96,953 |
| 6-Person Families | 28 (0.8%) | $0 |
| 7+ Person Families | 22 (0.6%) | $0 |
| Total | 3,521 (100.0%) | $80,839 |
Family Income by Number of Earners in Glens Falls
The median family income in Glens Falls is $80,839, with families comprising 3+ earners (338) having the highest median family income of $148,523, while families with no earners (432) have the lowest median family income of $46,250, accounting for 9.6% and 12.3% of families, respectively.
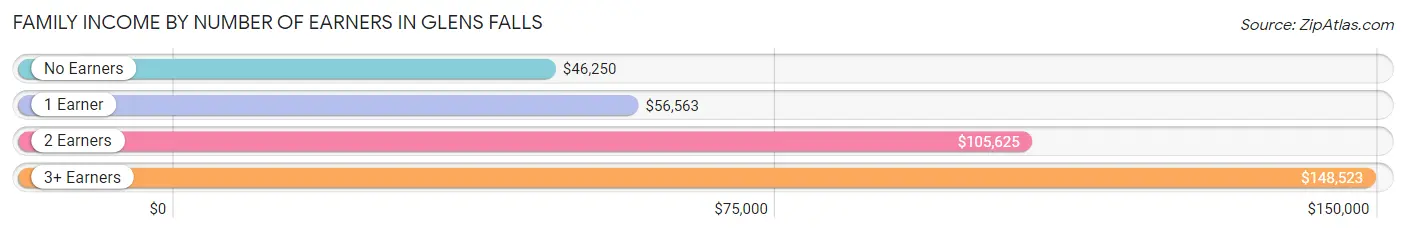
| Number of Earners | # Families | Median Income |
| No Earners | 432 (12.3%) | $46,250 |
| 1 Earner | 1,220 (34.6%) | $56,563 |
| 2 Earners | 1,531 (43.5%) | $105,625 |
| 3+ Earners | 338 (9.6%) | $148,523 |
| Total | 3,521 (100.0%) | $80,839 |
Household Income in Glens Falls
Household Income Brackets in Glens Falls
With 1,354 households falling in the category, the $50,000 to $74,999 income range is the most frequent in Glens Falls, accounting for 20.3% of all households. In contrast, only 267 households (4.0%) fall into the $10,000 to $14,999 income bracket, making it the least populous group.
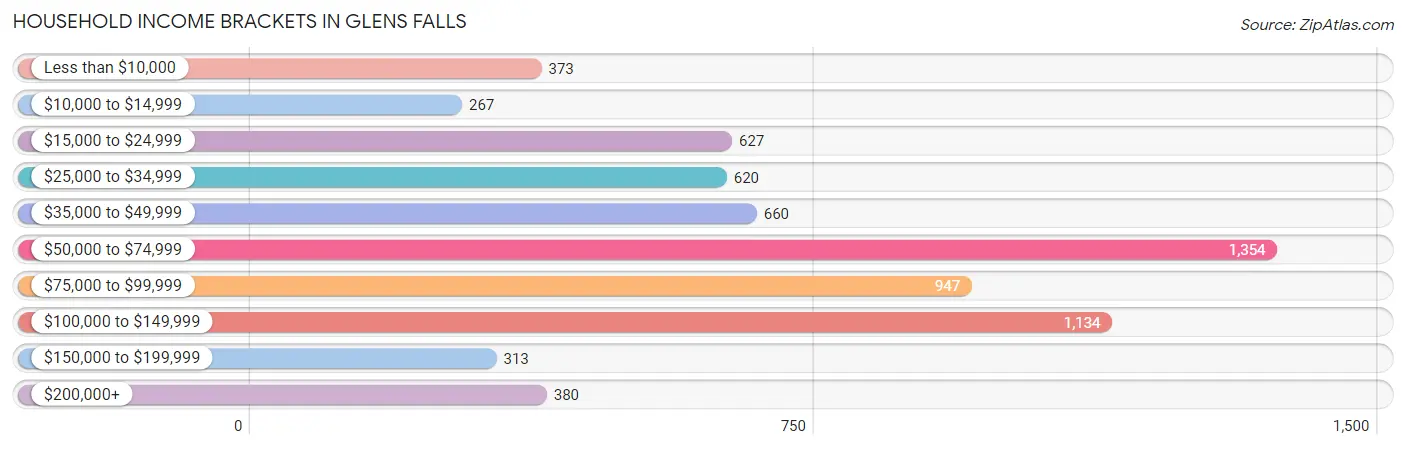
| Income Bracket | # Households | % Households |
| Less than $10,000 | 373 | 5.6% |
| $10,000 to $14,999 | 267 | 4.0% |
| $15,000 to $24,999 | 627 | 9.4% |
| $25,000 to $34,999 | 620 | 9.3% |
| $35,000 to $49,999 | 660 | 9.9% |
| $50,000 to $74,999 | 1,354 | 20.3% |
| $75,000 to $99,999 | 947 | 14.2% |
| $100,000 to $149,999 | 1,134 | 17.0% |
| $150,000 to $199,999 | 313 | 4.7% |
| $200,000+ | 380 | 5.7% |
Household Income by Householder Age in Glens Falls
The median household income in Glens Falls is $64,731, with the highest median household income of $77,313 found in the 45 to 64 years age bracket for the primary householder. A total of 2,306 households (34.6%) fall into this category. Meanwhile, the 65+ years age bracket for the primary householder has the lowest median household income of $42,446, with 1,606 households (24.1%) in this group.
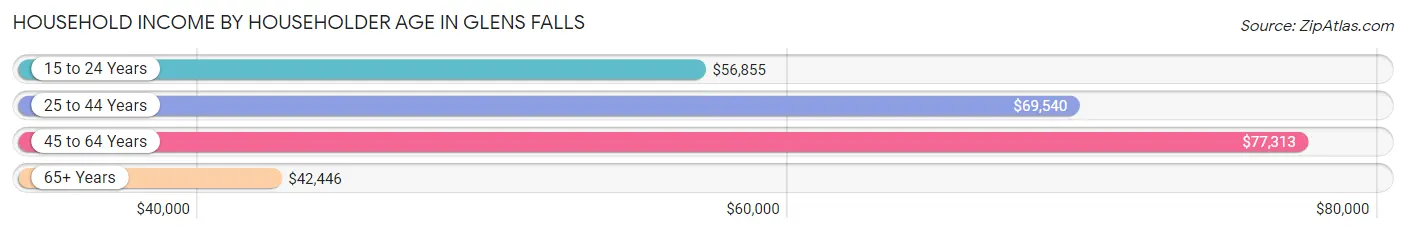
| Income Bracket | # Households | Median Income |
| 15 to 24 Years | 534 (8.0%) | $56,855 |
| 25 to 44 Years | 2,223 (33.3%) | $69,540 |
| 45 to 64 Years | 2,306 (34.6%) | $77,313 |
| 65+ Years | 1,606 (24.1%) | $42,446 |
| Total | 6,669 (100.0%) | $64,731 |
Poverty in Glens Falls
Income Below Poverty by Sex and Age in Glens Falls
With 12.5% poverty level for males and 10.5% for females among the residents of Glens Falls, 5 year old males and 75 year old and over females are the most vulnerable to poverty, with 22 males (45.8%) and 101 females (24.5%) in their respective age groups living below the poverty level.
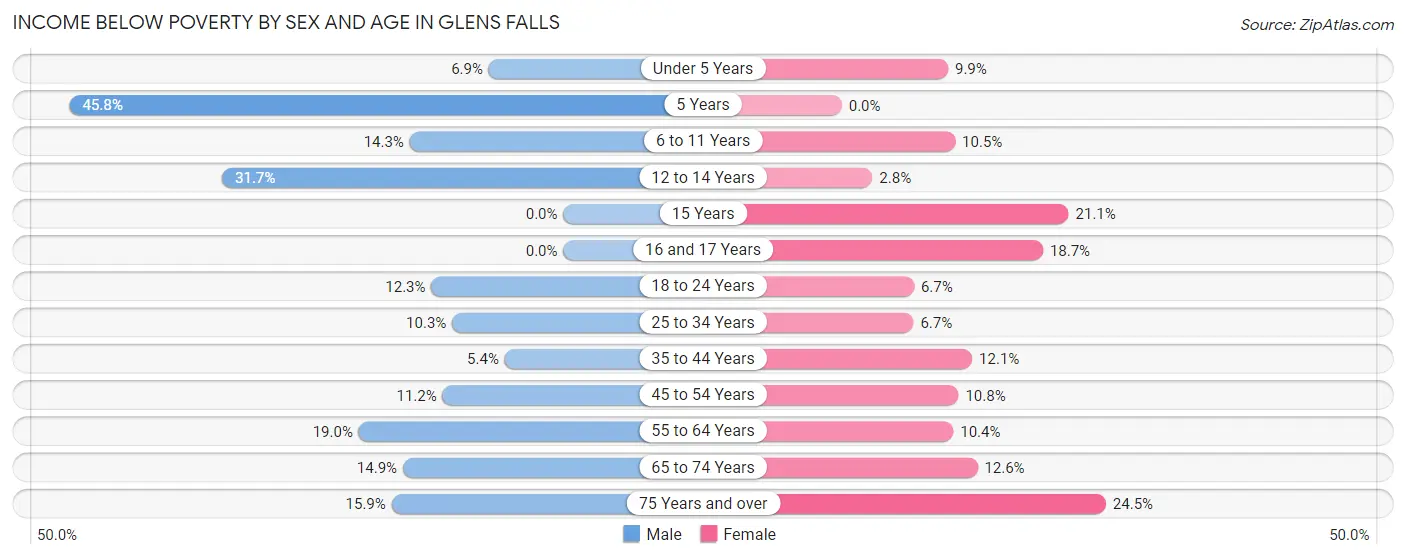
| Age Bracket | Male | Female |
| Under 5 Years | 31 (6.9%) | 34 (9.9%) |
| 5 Years | 22 (45.8%) | 0 (0.0%) |
| 6 to 11 Years | 78 (14.3%) | 67 (10.5%) |
| 12 to 14 Years | 76 (31.7%) | 6 (2.8%) |
| 15 Years | 0 (0.0%) | 16 (21.0%) |
| 16 and 17 Years | 0 (0.0%) | 14 (18.7%) |
| 18 to 24 Years | 85 (12.2%) | 53 (6.7%) |
| 25 to 34 Years | 124 (10.3%) | 80 (6.7%) |
| 35 to 44 Years | 50 (5.4%) | 103 (12.1%) |
| 45 to 54 Years | 111 (11.2%) | 85 (10.8%) |
| 55 to 64 Years | 192 (19.0%) | 104 (10.3%) |
| 65 to 74 Years | 92 (14.9%) | 92 (12.6%) |
| 75 Years and over | 62 (15.9%) | 101 (24.5%) |
| Total | 923 (12.5%) | 755 (10.5%) |
Income Above Poverty by Sex and Age in Glens Falls
According to the poverty statistics in Glens Falls, males aged 15 years and females aged 5 years are the age groups that are most secure financially, with 100.0% of males and 100.0% of females in these age groups living above the poverty line.
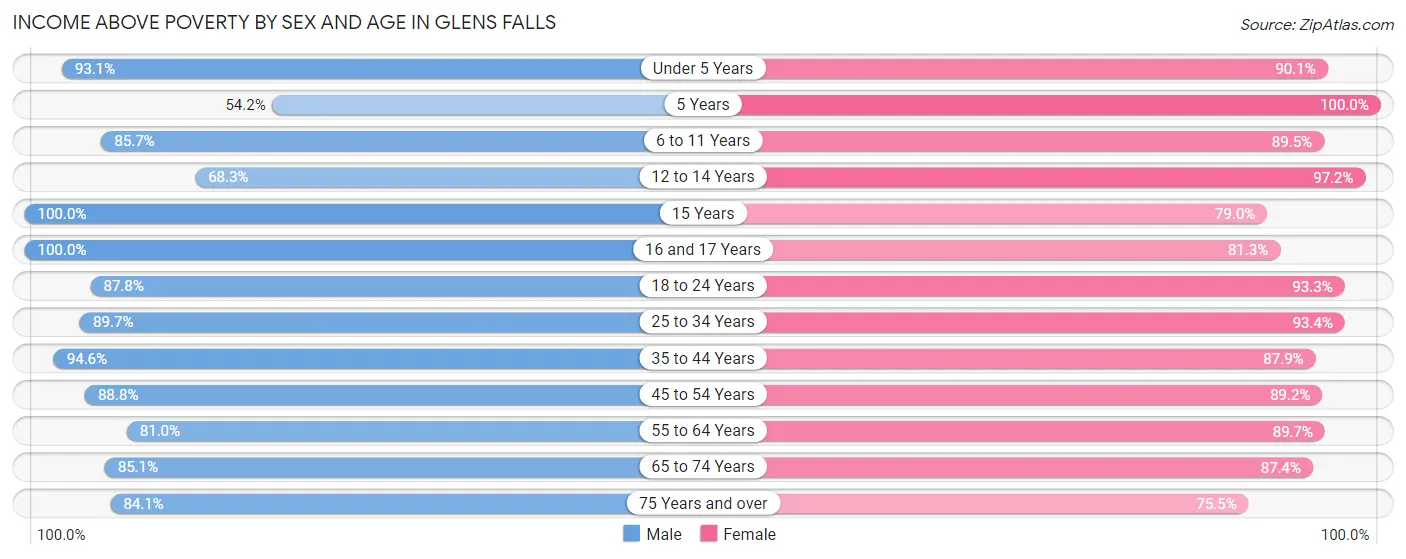
| Age Bracket | Male | Female |
| Under 5 Years | 417 (93.1%) | 311 (90.1%) |
| 5 Years | 26 (54.2%) | 40 (100.0%) |
| 6 to 11 Years | 469 (85.7%) | 570 (89.5%) |
| 12 to 14 Years | 164 (68.3%) | 205 (97.2%) |
| 15 Years | 117 (100.0%) | 60 (78.9%) |
| 16 and 17 Years | 155 (100.0%) | 61 (81.3%) |
| 18 to 24 Years | 609 (87.7%) | 738 (93.3%) |
| 25 to 34 Years | 1,077 (89.7%) | 1,123 (93.3%) |
| 35 to 44 Years | 869 (94.6%) | 748 (87.9%) |
| 45 to 54 Years | 879 (88.8%) | 700 (89.2%) |
| 55 to 64 Years | 819 (81.0%) | 901 (89.6%) |
| 65 to 74 Years | 526 (85.1%) | 639 (87.4%) |
| 75 Years and over | 327 (84.1%) | 311 (75.5%) |
| Total | 6,454 (87.5%) | 6,407 (89.5%) |
Income Below Poverty Among Married-Couple Families in Glens Falls
The poverty statistics for married-couple families in Glens Falls show that 3.8% or 94 of the total 2,448 families live below the poverty line. Families with 3 or 4 children have the highest poverty rate of 10.2%, comprising of 17 families. On the other hand, families with no children have the lowest poverty rate of 2.4%, which includes 36 families.
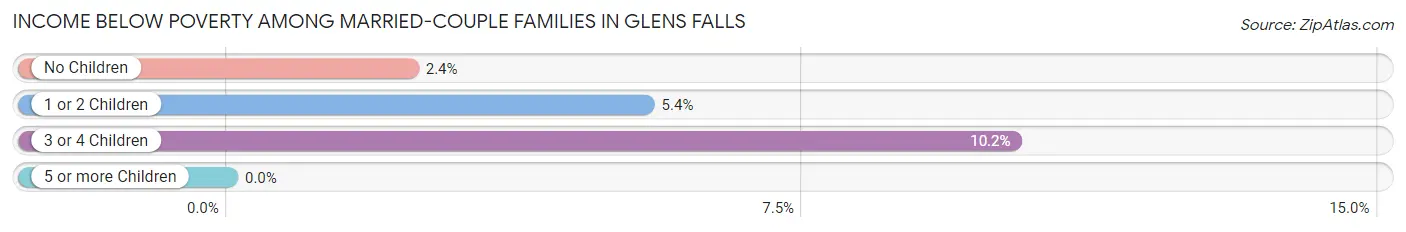
| Children | Above Poverty | Below Poverty |
| No Children | 1,492 (97.6%) | 36 (2.4%) |
| 1 or 2 Children | 713 (94.6%) | 41 (5.4%) |
| 3 or 4 Children | 149 (89.8%) | 17 (10.2%) |
| 5 or more Children | 0 (0.0%) | 0 (0.0%) |
| Total | 2,354 (96.2%) | 94 (3.8%) |
Income Below Poverty Among Single-Parent Households in Glens Falls
According to the poverty data in Glens Falls, 5.5% or 16 single-father households and 14.2% or 111 single-mother households are living below the poverty line. Among single-father households, those with 1 or 2 children have the highest poverty rate, with 16 households (7.9%) experiencing poverty. Likewise, among single-mother households, those with 3 or 4 children have the highest poverty rate, with 27 households (31.0%) falling below the poverty line.
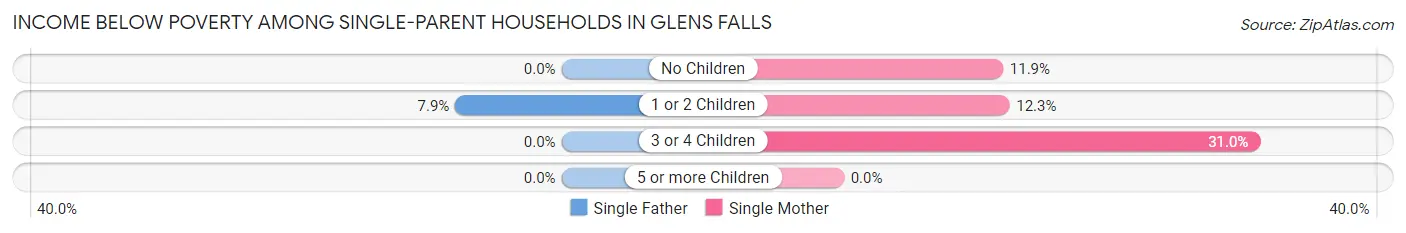
| Children | Single Father | Single Mother |
| No Children | 0 (0.0%) | 37 (11.9%) |
| 1 or 2 Children | 16 (7.9%) | 47 (12.3%) |
| 3 or 4 Children | 0 (0.0%) | 27 (31.0%) |
| 5 or more Children | 0 (0.0%) | 0 (0.0%) |
| Total | 16 (5.5%) | 111 (14.2%) |
Income Below Poverty Among Married-Couple vs Single-Parent Households in Glens Falls
The poverty data for Glens Falls shows that 94 of the married-couple family households (3.8%) and 127 of the single-parent households (11.8%) are living below the poverty level. Within the married-couple family households, those with 3 or 4 children have the highest poverty rate, with 17 households (10.2%) falling below the poverty line. Among the single-parent households, those with 3 or 4 children have the highest poverty rate, with 27 household (22.7%) living below poverty.
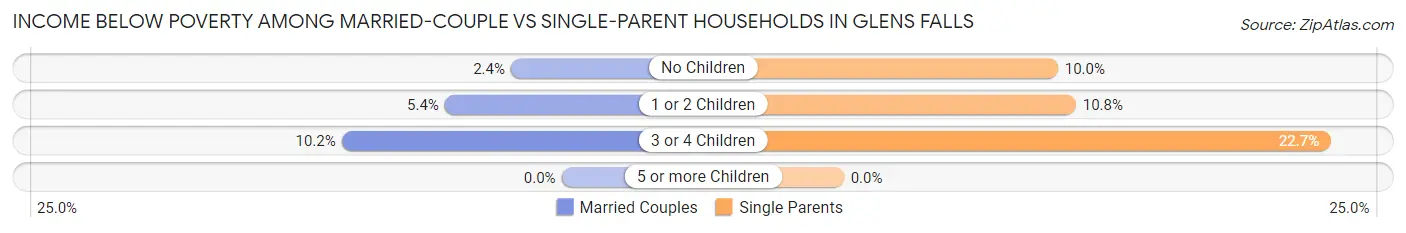
| Children | Married-Couple Families | Single-Parent Households |
| No Children | 36 (2.4%) | 37 (10.0%) |
| 1 or 2 Children | 41 (5.4%) | 63 (10.8%) |
| 3 or 4 Children | 17 (10.2%) | 27 (22.7%) |
| 5 or more Children | 0 (0.0%) | 0 (0.0%) |
| Total | 94 (3.8%) | 127 (11.8%) |
Race in Glens Falls
The most populous races in Glens Falls are White / Caucasian (13,411 | 91.0%), Two or more Races (757 | 5.1%), and Hispanic or Latino (634 | 4.3%).
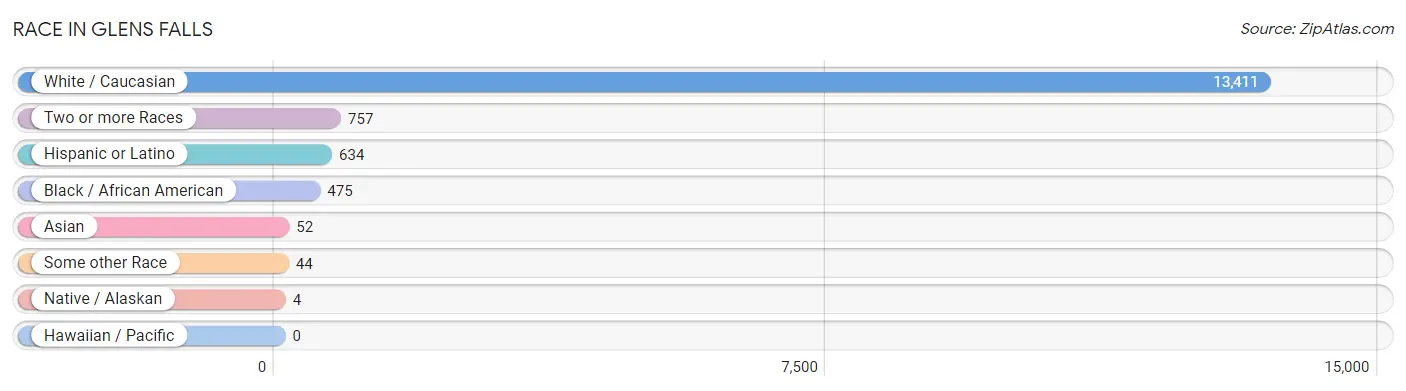
| Race | # Population | % Population |
| Asian | 52 | 0.4% |
| Black / African American | 475 | 3.2% |
| Hawaiian / Pacific | 0 | 0.0% |
| Hispanic or Latino | 634 | 4.3% |
| Native / Alaskan | 4 | 0.0% |
| White / Caucasian | 13,411 | 91.0% |
| Two or more Races | 757 | 5.1% |
| Some other Race | 44 | 0.3% |
| Total | 14,743 | 100.0% |
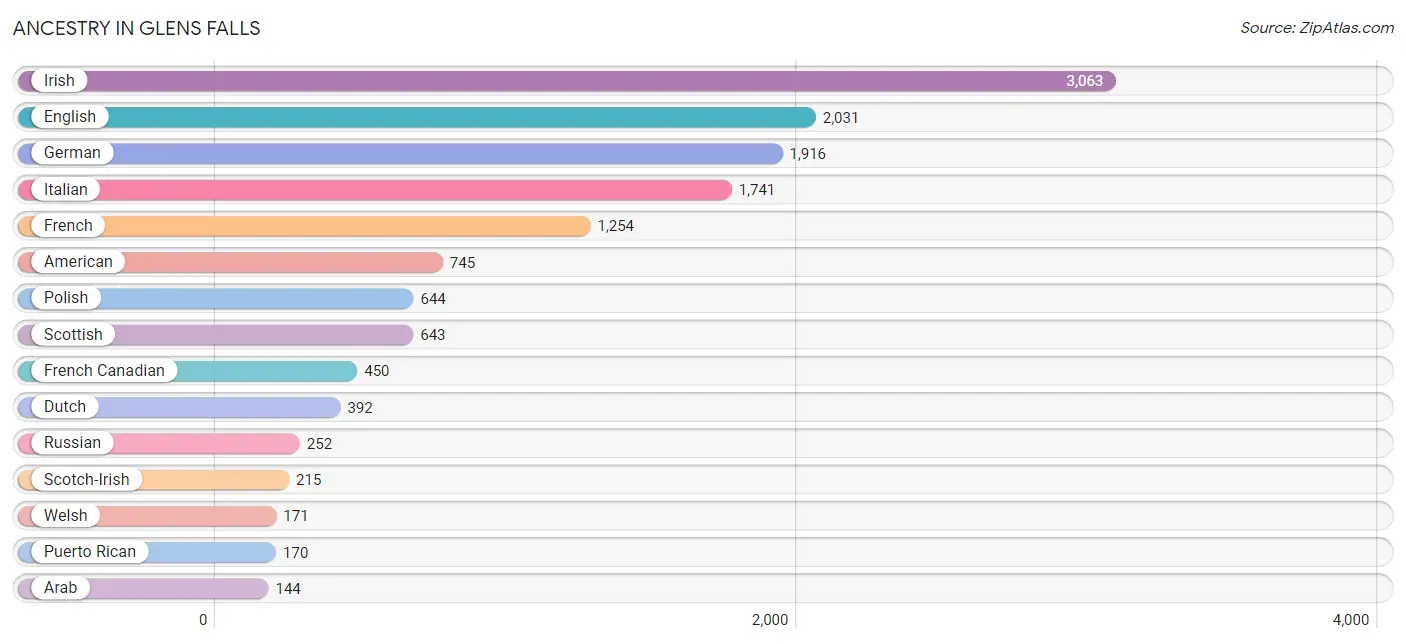
Ancestry in Glens Falls
The most populous ancestries reported in Glens Falls are Irish (3,063 | 20.8%), English (2,031 | 13.8%), German (1,916 | 13.0%), Italian (1,741 | 11.8%), and French (1,254 | 8.5%), together accounting for 67.9% of all Glens Falls residents.
| Ancestry | # Population | % Population |
| American | 745 | 5.1% |
| Arab | 144 | 1.0% |
| Argentinean | 67 | 0.4% |
| Austrian | 9 | 0.1% |
| Belgian | 14 | 0.1% |
| Bhutanese | 60 | 0.4% |
| Blackfeet | 8 | 0.1% |
| Brazilian | 10 | 0.1% |
| British | 56 | 0.4% |
| Burmese | 77 | 0.5% |
| Canadian | 101 | 0.7% |
| Central American | 129 | 0.9% |
| Cherokee | 10 | 0.1% |
| Cheyenne | 2 | 0.0% |
| Czech | 21 | 0.1% |
| Danish | 12 | 0.1% |
| Dominican | 61 | 0.4% |
| Dutch | 392 | 2.7% |
| Eastern European | 16 | 0.1% |
| Ecuadorian | 17 | 0.1% |
| English | 2,031 | 13.8% |
| European | 64 | 0.4% |
| French | 1,254 | 8.5% |
| French Canadian | 450 | 3.0% |
| German | 1,916 | 13.0% |
| Greek | 12 | 0.1% |
| Guatemalan | 2 | 0.0% |
| Guyanese | 8 | 0.1% |
| Honduran | 51 | 0.4% |
| Hungarian | 82 | 0.6% |
| Indian (Asian) | 75 | 0.5% |
| Iranian | 15 | 0.1% |
| Irish | 3,063 | 20.8% |
| Iroquois | 16 | 0.1% |
| Italian | 1,741 | 11.8% |
| Jordanian | 75 | 0.5% |
| Korean | 63 | 0.4% |
| Lebanese | 23 | 0.2% |
| Lithuanian | 62 | 0.4% |
| Mexican | 123 | 0.8% |
| Navajo | 6 | 0.0% |
| Northern European | 8 | 0.1% |
| Norwegian | 86 | 0.6% |
| Panamanian | 11 | 0.1% |
| Peruvian | 18 | 0.1% |
| Polish | 644 | 4.4% |
| Portuguese | 16 | 0.1% |
| Puerto Rican | 170 | 1.1% |
| Romanian | 62 | 0.4% |
| Russian | 252 | 1.7% |
| Salvadoran | 65 | 0.4% |
| Scandinavian | 62 | 0.4% |
| Scotch-Irish | 215 | 1.5% |
| Scottish | 643 | 4.4% |
| Slovak | 66 | 0.4% |
| Slovene | 8 | 0.1% |
| South American | 102 | 0.7% |
| Spaniard | 13 | 0.1% |
| Spanish | 36 | 0.2% |
| Swedish | 103 | 0.7% |
| Swiss | 11 | 0.1% |
| Syrian | 29 | 0.2% |
| Thai | 71 | 0.5% |
| Ukrainian | 37 | 0.3% |
| Welsh | 171 | 1.2% |
| Yugoslavian | 62 | 0.4% | View All 66 Rows |
Immigrants in Glens Falls
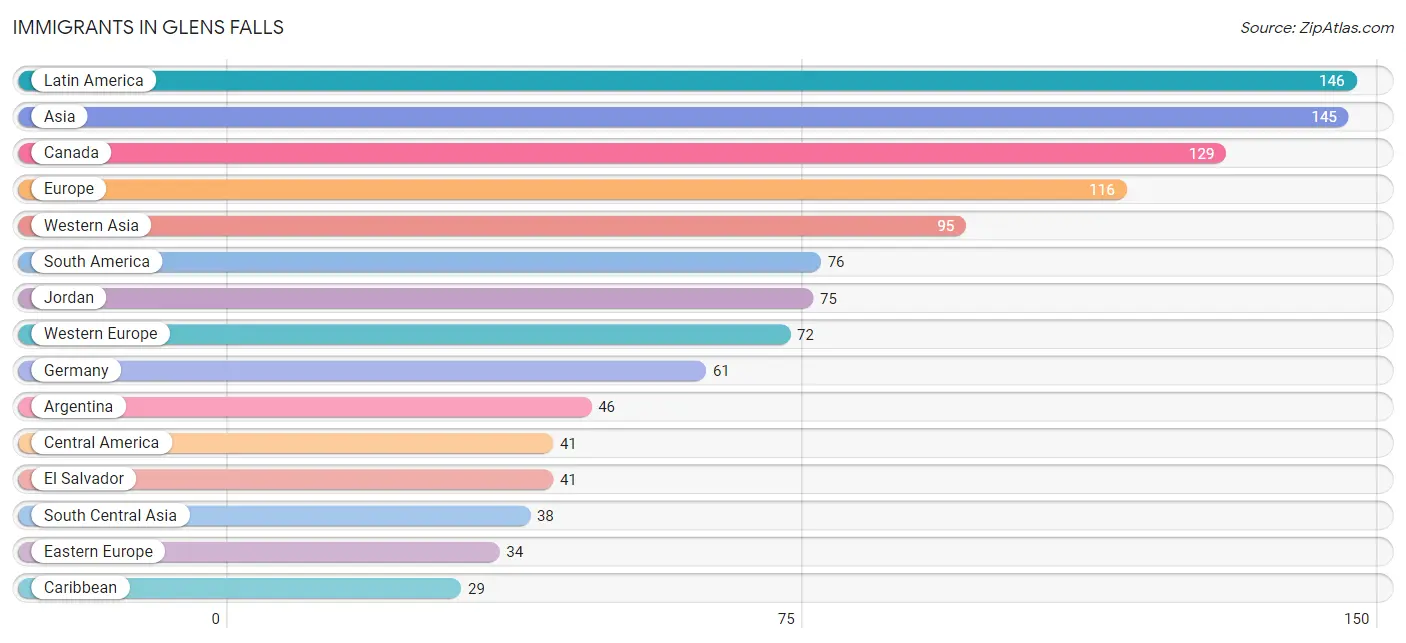
The most numerous immigrant groups reported in Glens Falls came from Latin America (146 | 1.0%), Asia (145 | 1.0%), Canada (129 | 0.9%), Europe (116 | 0.8%), and Western Asia (95 | 0.6%), together accounting for 4.3% of all Glens Falls residents.
| Immigration Origin | # Population | % Population |
| Argentina | 46 | 0.3% |
| Asia | 145 | 1.0% |
| Canada | 129 | 0.9% |
| Caribbean | 29 | 0.2% |
| Central America | 41 | 0.3% |
| Dominican Republic | 3 | 0.0% |
| Eastern Asia | 9 | 0.1% |
| Eastern Europe | 34 | 0.2% |
| Ecuador | 4 | 0.0% |
| El Salvador | 41 | 0.3% |
| England | 10 | 0.1% |
| Europe | 116 | 0.8% |
| Germany | 61 | 0.4% |
| Guyana | 8 | 0.1% |
| Hungary | 22 | 0.2% |
| India | 14 | 0.1% |
| Iran | 15 | 0.1% |
| Jamaica | 26 | 0.2% |
| Jordan | 75 | 0.5% |
| Korea | 9 | 0.1% |
| Kuwait | 7 | 0.1% |
| Latin America | 146 | 1.0% |
| Northern Europe | 10 | 0.1% |
| Pakistan | 9 | 0.1% |
| Peru | 18 | 0.1% |
| Philippines | 3 | 0.0% |
| Poland | 12 | 0.1% |
| Saudi Arabia | 13 | 0.1% |
| South America | 76 | 0.5% |
| South Central Asia | 38 | 0.3% |
| South Eastern Asia | 3 | 0.0% |
| Switzerland | 11 | 0.1% |
| Western Asia | 95 | 0.6% |
| Western Europe | 72 | 0.5% | View All 34 Rows |
Sex and Age in Glens Falls
Sex and Age in Glens Falls
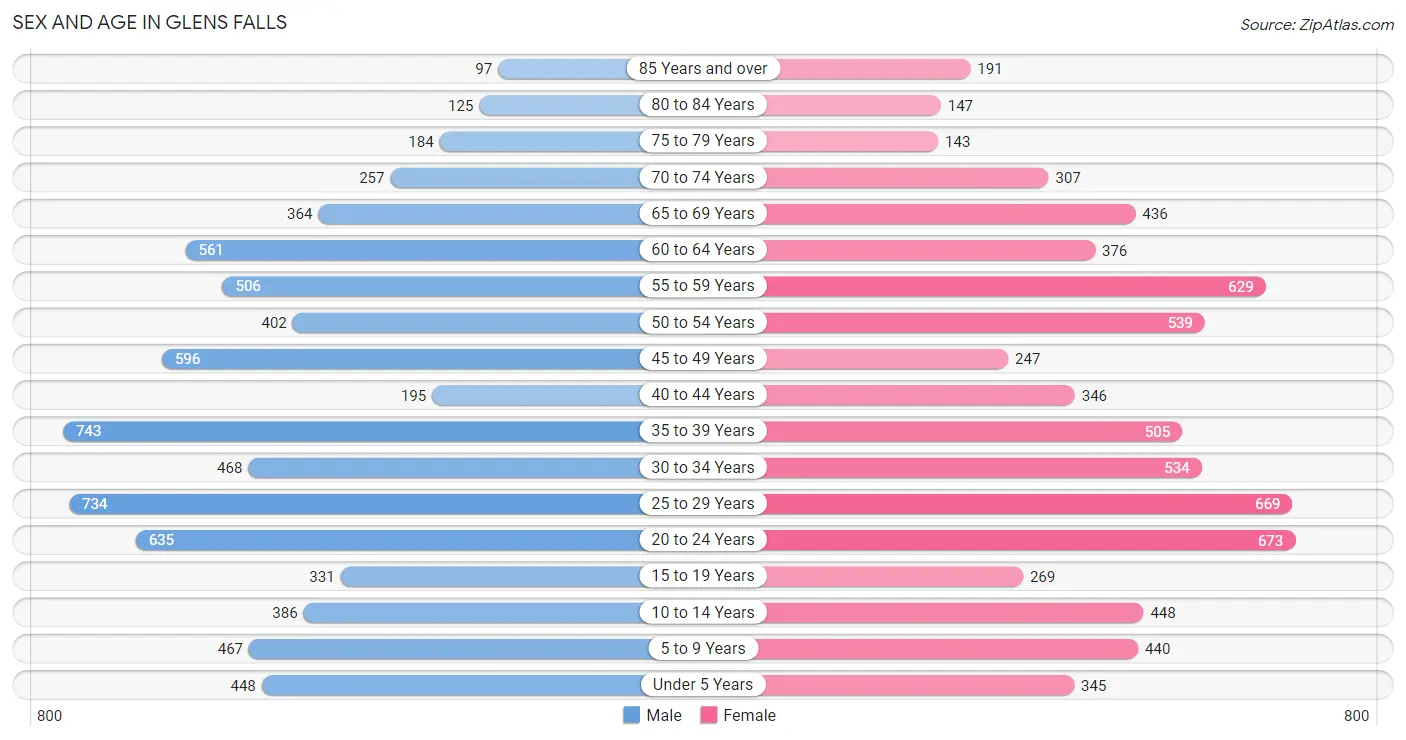
The most populous age groups in Glens Falls are 35 to 39 Years (743 | 9.9%) for men and 20 to 24 Years (673 | 9.3%) for women.
| Age Bracket | Male | Female |
| Under 5 Years | 448 (6.0%) | 345 (4.8%) |
| 5 to 9 Years | 467 (6.2%) | 440 (6.1%) |
| 10 to 14 Years | 386 (5.1%) | 448 (6.2%) |
| 15 to 19 Years | 331 (4.4%) | 269 (3.7%) |
| 20 to 24 Years | 635 (8.5%) | 673 (9.3%) |
| 25 to 29 Years | 734 (9.8%) | 669 (9.2%) |
| 30 to 34 Years | 468 (6.2%) | 534 (7.4%) |
| 35 to 39 Years | 743 (9.9%) | 505 (7.0%) |
| 40 to 44 Years | 195 (2.6%) | 346 (4.8%) |
| 45 to 49 Years | 596 (8.0%) | 247 (3.4%) |
| 50 to 54 Years | 402 (5.4%) | 539 (7.4%) |
| 55 to 59 Years | 506 (6.8%) | 629 (8.7%) |
| 60 to 64 Years | 561 (7.5%) | 376 (5.2%) |
| 65 to 69 Years | 364 (4.9%) | 436 (6.0%) |
| 70 to 74 Years | 257 (3.4%) | 307 (4.2%) |
| 75 to 79 Years | 184 (2.5%) | 143 (2.0%) |
| 80 to 84 Years | 125 (1.7%) | 147 (2.0%) |
| 85 Years and over | 97 (1.3%) | 191 (2.6%) |
| Total | 7,499 (100.0%) | 7,244 (100.0%) |
Families and Households in Glens Falls
Median Family Size in Glens Falls
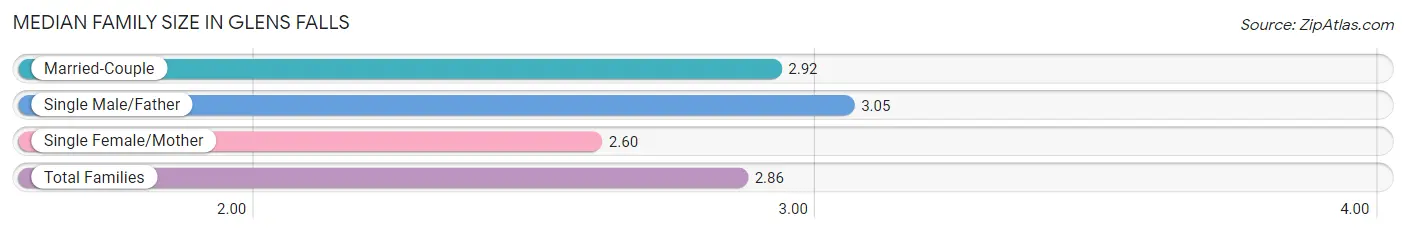
The median family size in Glens Falls is 2.86 persons per family, with single male/father families (293 | 8.3%) accounting for the largest median family size of 3.05 persons per family. On the other hand, single female/mother families (780 | 22.2%) represent the smallest median family size with 2.60 persons per family.
| Family Type | # Families | Family Size |
| Married-Couple | 2,448 (69.5%) | 2.92 |
| Single Male/Father | 293 (8.3%) | 3.05 |
| Single Female/Mother | 780 (22.2%) | 2.60 |
| Total Families | 3,521 (100.0%) | 2.86 |
Median Household Size in Glens Falls
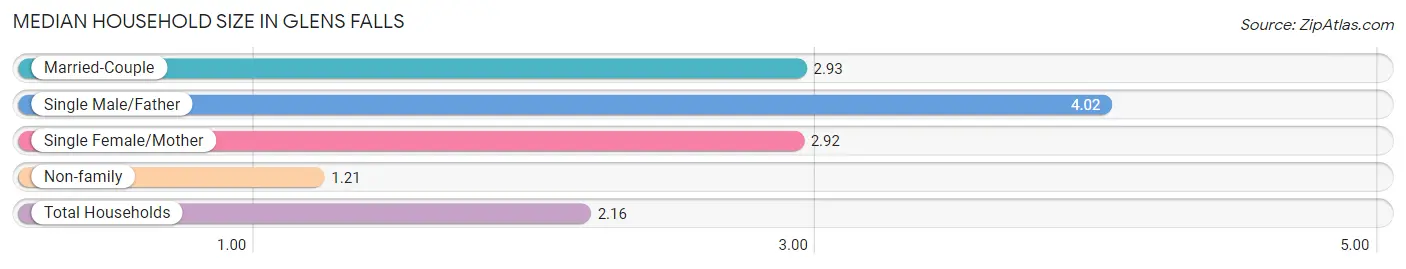
The median household size in Glens Falls is 2.16 persons per household, with single male/father households (293 | 4.4%) accounting for the largest median household size of 4.02 persons per household. non-family households (3,148 | 47.2%) represent the smallest median household size with 1.21 persons per household.
| Household Type | # Households | Household Size |
| Married-Couple | 2,448 (36.7%) | 2.93 |
| Single Male/Father | 293 (4.4%) | 4.02 |
| Single Female/Mother | 780 (11.7%) | 2.92 |
| Non-family | 3,148 (47.2%) | 1.21 |
| Total Households | 6,669 (100.0%) | 2.16 |
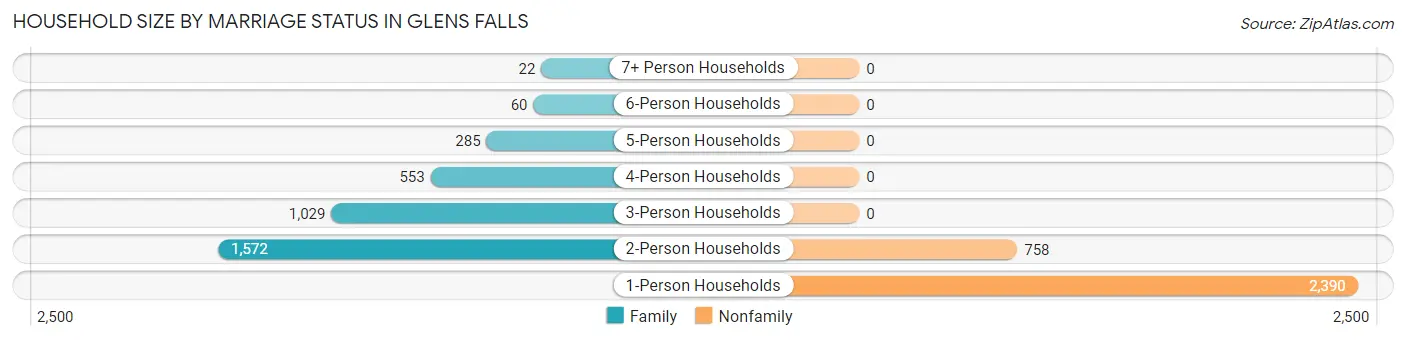
Household Size by Marriage Status in Glens Falls
Out of a total of 6,669 households in Glens Falls, 3,521 (52.8%) are family households, while 3,148 (47.2%) are nonfamily households. The most numerous type of family households are 2-person households, comprising 1,572, and the most common type of nonfamily households are 1-person households, comprising 2,390.
| Household Size | Family Households | Nonfamily Households |
| 1-Person Households | - | 2,390 (35.8%) |
| 2-Person Households | 1,572 (23.6%) | 758 (11.4%) |
| 3-Person Households | 1,029 (15.4%) | 0 (0.0%) |
| 4-Person Households | 553 (8.3%) | 0 (0.0%) |
| 5-Person Households | 285 (4.3%) | 0 (0.0%) |
| 6-Person Households | 60 (0.9%) | 0 (0.0%) |
| 7+ Person Households | 22 (0.3%) | 0 (0.0%) |
| Total | 3,521 (52.8%) | 3,148 (47.2%) |
Female Fertility in Glens Falls
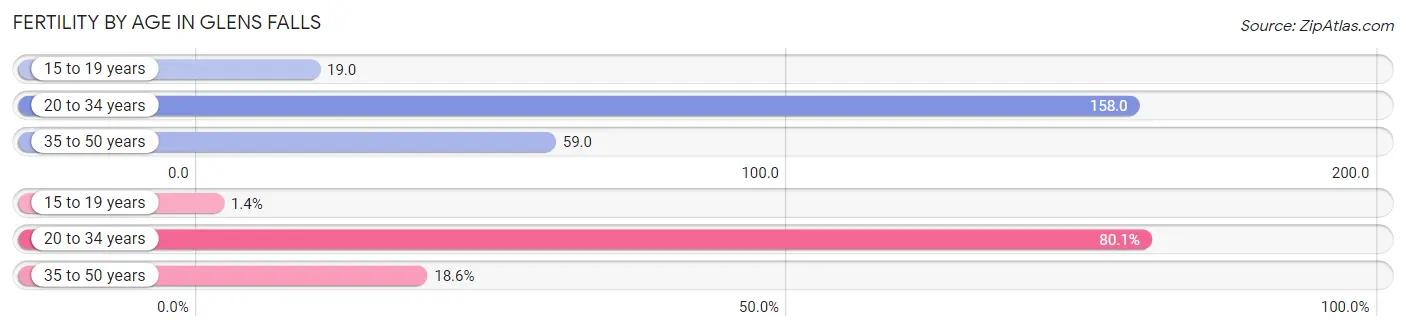
Fertility by Age in Glens Falls
Average fertility rate in Glens Falls is 112.0 births per 1,000 women. Women in the age bracket of 20 to 34 years have the highest fertility rate with 158.0 births per 1,000 women. Women in the age bracket of 20 to 34 years acount for 80.0% of all women with births.
| Age Bracket | Women with Births | Births / 1,000 Women |
| 15 to 19 years | 5 (1.3%) | 19.0 |
| 20 to 34 years | 297 (80.0%) | 158.0 |
| 35 to 50 years | 69 (18.6%) | 59.0 |
| Total | 371 (100.0%) | 112.0 |
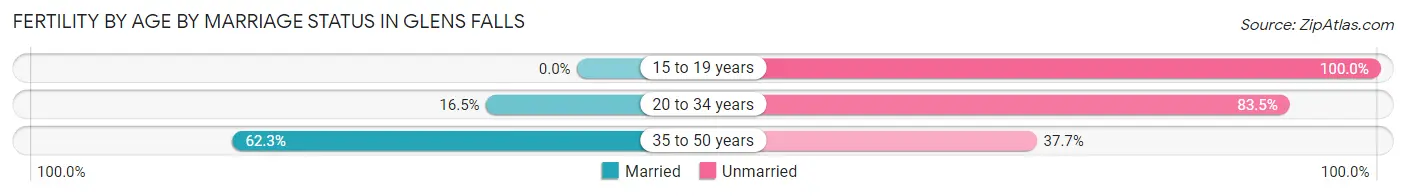
Fertility by Age by Marriage Status in Glens Falls
24.8% of women with births (371) in Glens Falls are married. The highest percentage of unmarried women with births falls into 15 to 19 years age bracket with 100.0% of them unmarried at the time of birth, while the lowest percentage of unmarried women with births belong to 35 to 50 years age bracket with 37.7% of them unmarried.
| Age Bracket | Married | Unmarried |
| 15 to 19 years | 0 (0.0%) | 5 (100.0%) |
| 20 to 34 years | 49 (16.5%) | 248 (83.5%) |
| 35 to 50 years | 43 (62.3%) | 26 (37.7%) |
| Total | 92 (24.8%) | 279 (75.2%) |
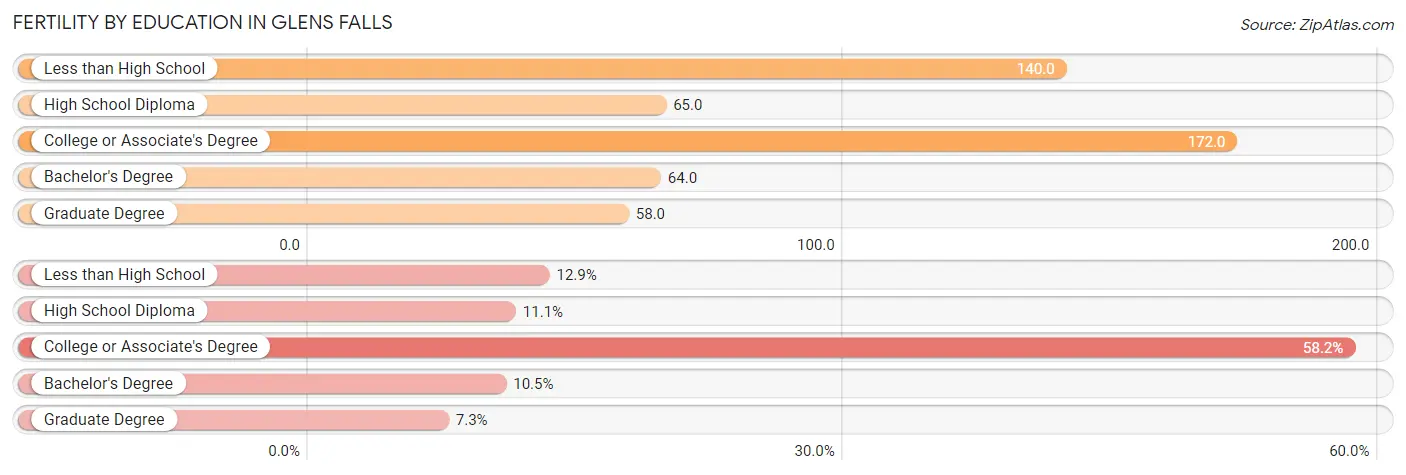
Fertility by Education in Glens Falls
Average fertility rate in Glens Falls is 112.0 births per 1,000 women. Women with the education attainment of college or associate's degree have the highest fertility rate of 172.0 births per 1,000 women, while women with the education attainment of graduate degree have the lowest fertility at 58.0 births per 1,000 women. Women with the education attainment of college or associate's degree represent 58.2% of all women with births.
| Educational Attainment | Women with Births | Births / 1,000 Women |
| Less than High School | 48 (12.9%) | 140.0 |
| High School Diploma | 41 (11.1%) | 65.0 |
| College or Associate's Degree | 216 (58.2%) | 172.0 |
| Bachelor's Degree | 39 (10.5%) | 64.0 |
| Graduate Degree | 27 (7.3%) | 58.0 |
| Total | 371 (100.0%) | 112.0 |
Fertility by Education by Marriage Status in Glens Falls
75.2% of women with births in Glens Falls are unmarried. Women with the educational attainment of graduate degree are most likely to be married with 100.0% of them married at childbirth, while women with the educational attainment of less than high school are least likely to be married with 100.0% of them unmarried at childbirth.
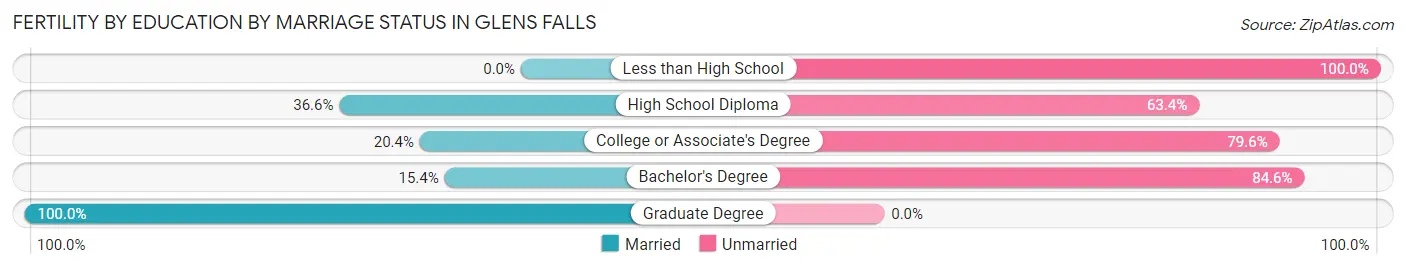
| Educational Attainment | Married | Unmarried |
| Less than High School | 0 (0.0%) | 48 (100.0%) |
| High School Diploma | 15 (36.6%) | 26 (63.4%) |
| College or Associate's Degree | 44 (20.4%) | 172 (79.6%) |
| Bachelor's Degree | 6 (15.4%) | 33 (84.6%) |
| Graduate Degree | 27 (100.0%) | 0 (0.0%) |
| Total | 92 (24.8%) | 279 (75.2%) |
Employment Characteristics in Glens Falls
Employment by Class of Employer in Glens Falls
Among the 7,447 employed individuals in Glens Falls, private company employees (4,403 | 59.1%), not-for-profit organizations (1,085 | 14.6%), and local government employees (972 | 13.1%) make up the most common classes of employment.
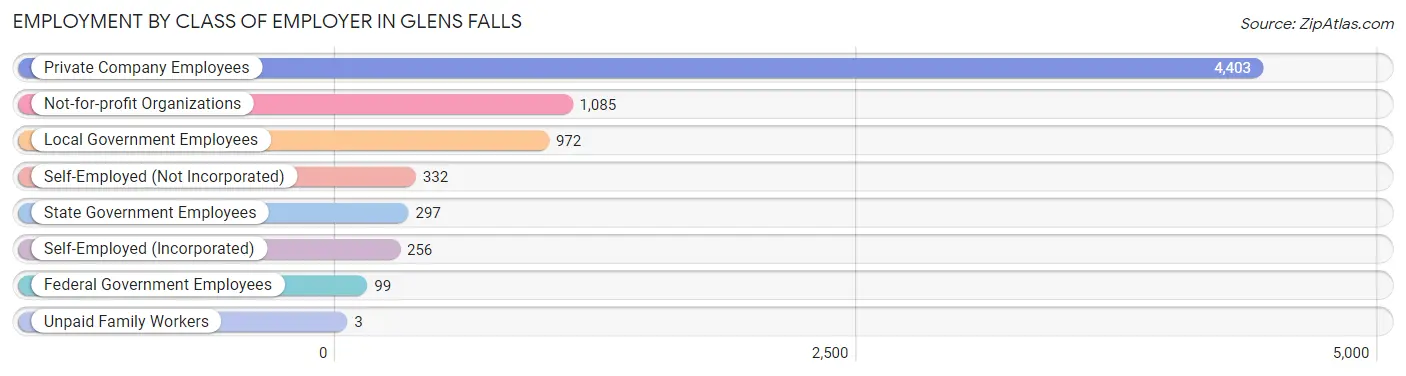
| Employer Class | # Employees | % Employees |
| Private Company Employees | 4,403 | 59.1% |
| Self-Employed (Incorporated) | 256 | 3.4% |
| Self-Employed (Not Incorporated) | 332 | 4.5% |
| Not-for-profit Organizations | 1,085 | 14.6% |
| Local Government Employees | 972 | 13.1% |
| State Government Employees | 297 | 4.0% |
| Federal Government Employees | 99 | 1.3% |
| Unpaid Family Workers | 3 | 0.0% |
| Total | 7,447 | 100.0% |
Employment Status by Age in Glens Falls
According to the labor force statistics for Glens Falls, out of the total population over 16 years of age (12,016), 66.9% or 8,039 individuals are in the labor force, with 5.7% or 458 of them unemployed. The age group with the highest labor force participation rate is 25 to 29 years, with 90.0% or 1,263 individuals in the labor force. Within the labor force, the 20 to 24 years age range has the highest percentage of unemployed individuals, with 10.6% or 114 of them being unemployed.
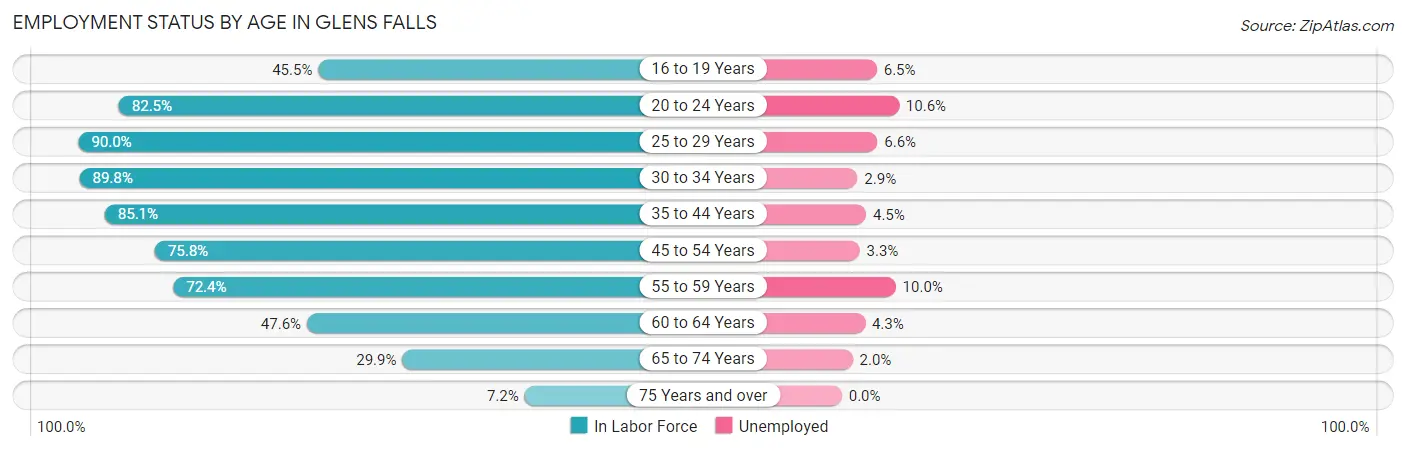
| Age Bracket | In Labor Force | Unemployed |
| 16 to 19 Years | 185 (45.5%) | 12 (6.5%) |
| 20 to 24 Years | 1,079 (82.5%) | 114 (10.6%) |
| 25 to 29 Years | 1,263 (90.0%) | 83 (6.6%) |
| 30 to 34 Years | 900 (89.8%) | 26 (2.9%) |
| 35 to 44 Years | 1,522 (85.1%) | 68 (4.5%) |
| 45 to 54 Years | 1,352 (75.8%) | 45 (3.3%) |
| 55 to 59 Years | 822 (72.4%) | 82 (10.0%) |
| 60 to 64 Years | 446 (47.6%) | 19 (4.3%) |
| 65 to 74 Years | 408 (29.9%) | 8 (2.0%) |
| 75 Years and over | 64 (7.2%) | 0 (0.0%) |
| Total | 8,039 (66.9%) | 458 (5.7%) |
Employment Status by Educational Attainment in Glens Falls
According to labor force statistics for Glens Falls, 78.3% of individuals (6,303) out of the total population between 25 and 64 years of age (8,050) are in the labor force, with 5.2% or 328 of them being unemployed. The group with the highest labor force participation rate are those with the educational attainment of bachelor's degree or higher, with 89.6% or 2,155 individuals in the labor force. Within the labor force, individuals with college / associate degree education have the highest percentage of unemployment, with 8.6% or 175 of them being unemployed.
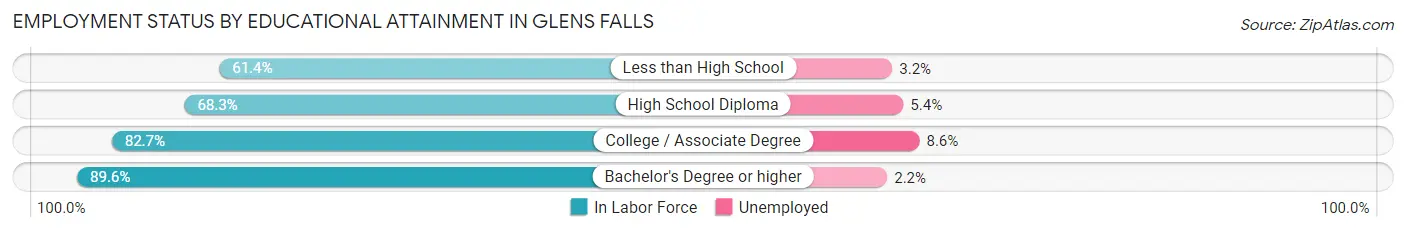
| Educational Attainment | In Labor Force | Unemployed |
| Less than High School | 507 (61.4%) | 26 (3.2%) |
| High School Diploma | 1,607 (68.3%) | 127 (5.4%) |
| College / Associate Degree | 2,039 (82.7%) | 212 (8.6%) |
| Bachelor's Degree or higher | 2,155 (89.6%) | 53 (2.2%) |
| Total | 6,303 (78.3%) | 419 (5.2%) |
Employment Occupations by Sex in Glens Falls
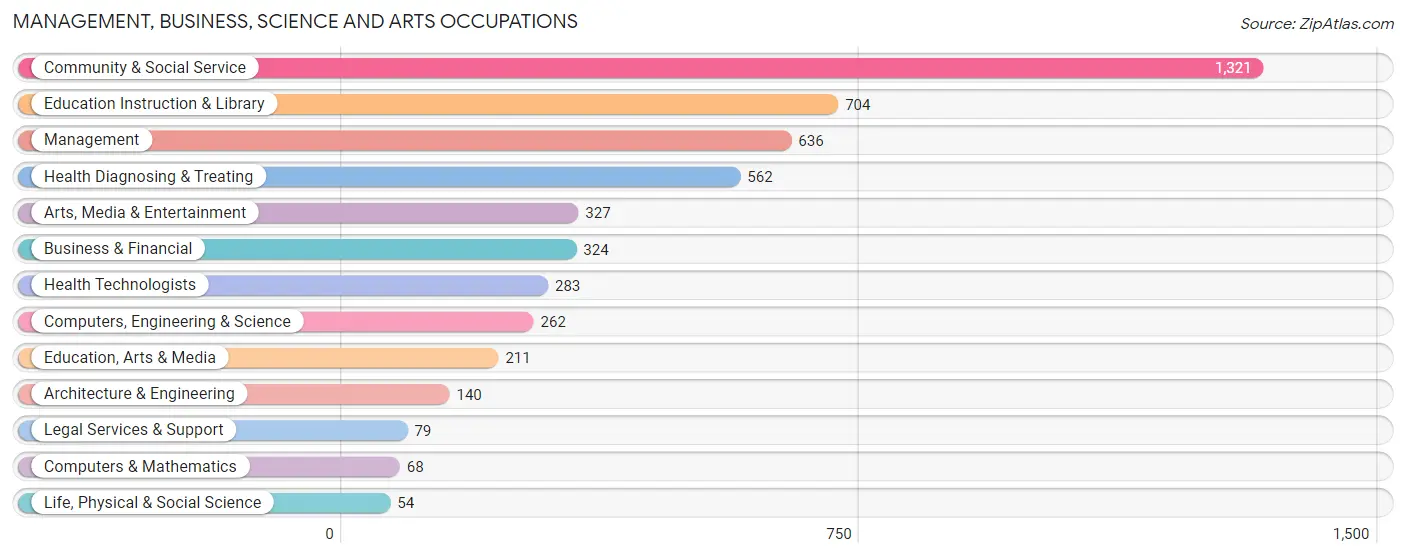
Management, Business, Science and Arts Occupations
The most common Management, Business, Science and Arts occupations in Glens Falls are Community & Social Service (1,321 | 17.5%), Education Instruction & Library (704 | 9.3%), Management (636 | 8.4%), Health Diagnosing & Treating (562 | 7.4%), and Arts, Media & Entertainment (327 | 4.3%).
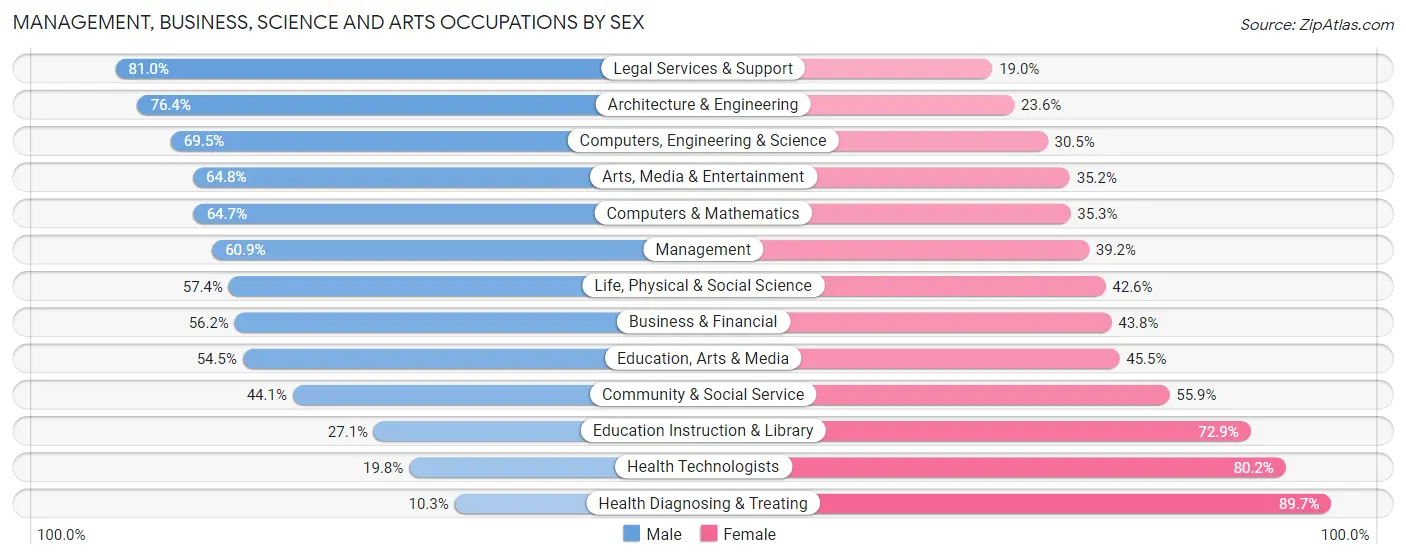
Management, Business, Science and Arts Occupations by Sex
Within the Management, Business, Science and Arts occupations in Glens Falls, the most male-oriented occupations are Legal Services & Support (81.0%), Architecture & Engineering (76.4%), and Computers, Engineering & Science (69.5%), while the most female-oriented occupations are Health Diagnosing & Treating (89.7%), Health Technologists (80.2%), and Education Instruction & Library (72.9%).
| Occupation | Male | Female |
| Management | 387 (60.9%) | 249 (39.2%) |
| Business & Financial | 182 (56.2%) | 142 (43.8%) |
| Computers, Engineering & Science | 182 (69.5%) | 80 (30.5%) |
| Computers & Mathematics | 44 (64.7%) | 24 (35.3%) |
| Architecture & Engineering | 107 (76.4%) | 33 (23.6%) |
| Life, Physical & Social Science | 31 (57.4%) | 23 (42.6%) |
| Community & Social Service | 582 (44.1%) | 739 (55.9%) |
| Education, Arts & Media | 115 (54.5%) | 96 (45.5%) |
| Legal Services & Support | 64 (81.0%) | 15 (19.0%) |
| Education Instruction & Library | 191 (27.1%) | 513 (72.9%) |
| Arts, Media & Entertainment | 212 (64.8%) | 115 (35.2%) |
| Health Diagnosing & Treating | 58 (10.3%) | 504 (89.7%) |
| Health Technologists | 56 (19.8%) | 227 (80.2%) |
| Total (Category) | 1,391 (44.8%) | 1,714 (55.2%) |
| Total (Overall) | 3,982 (52.8%) | 3,566 (47.2%) |
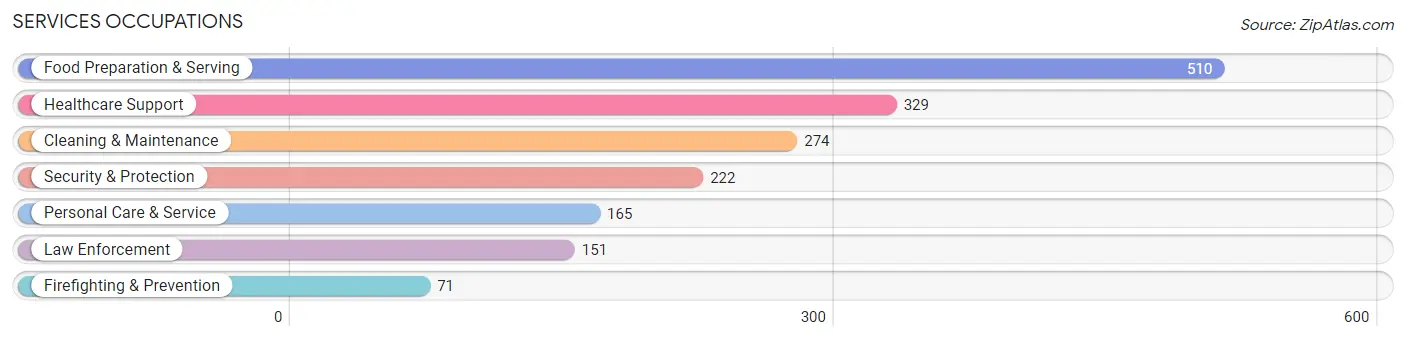
Services Occupations
The most common Services occupations in Glens Falls are Food Preparation & Serving (510 | 6.8%), Healthcare Support (329 | 4.4%), Cleaning & Maintenance (274 | 3.6%), Security & Protection (222 | 2.9%), and Personal Care & Service (165 | 2.2%).
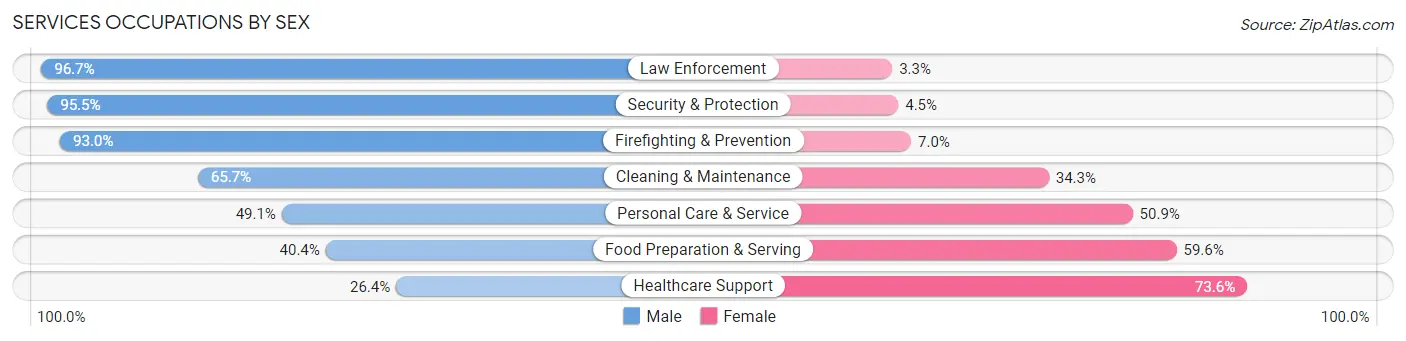
Services Occupations by Sex
Within the Services occupations in Glens Falls, the most male-oriented occupations are Law Enforcement (96.7%), Security & Protection (95.5%), and Firefighting & Prevention (93.0%), while the most female-oriented occupations are Healthcare Support (73.6%), Food Preparation & Serving (59.6%), and Personal Care & Service (50.9%).
| Occupation | Male | Female |
| Healthcare Support | 87 (26.4%) | 242 (73.6%) |
| Security & Protection | 212 (95.5%) | 10 (4.5%) |
| Firefighting & Prevention | 66 (93.0%) | 5 (7.0%) |
| Law Enforcement | 146 (96.7%) | 5 (3.3%) |
| Food Preparation & Serving | 206 (40.4%) | 304 (59.6%) |
| Cleaning & Maintenance | 180 (65.7%) | 94 (34.3%) |
| Personal Care & Service | 81 (49.1%) | 84 (50.9%) |
| Total (Category) | 766 (51.1%) | 734 (48.9%) |
| Total (Overall) | 3,982 (52.8%) | 3,566 (47.2%) |
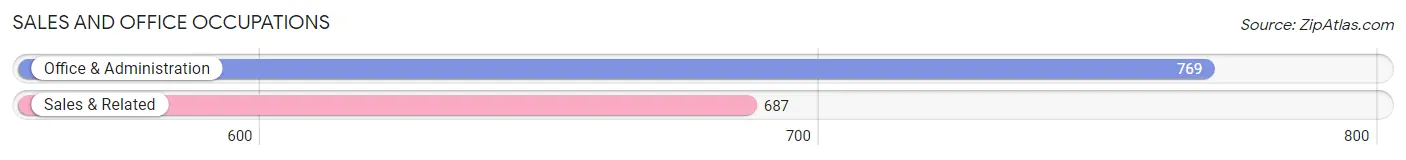
Sales and Office Occupations
The most common Sales and Office occupations in Glens Falls are Office & Administration (769 | 10.2%), and Sales & Related (687 | 9.1%).
Sales and Office Occupations by Sex
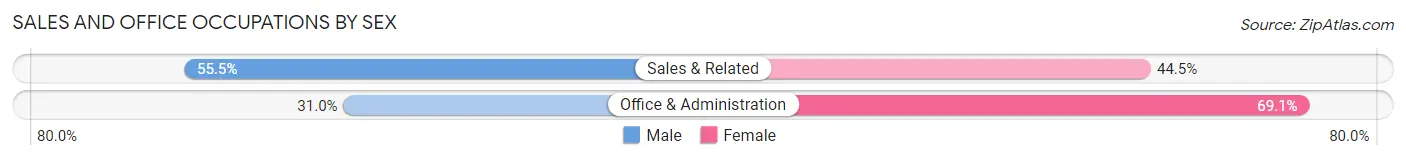
| Occupation | Male | Female |
| Sales & Related | 381 (55.5%) | 306 (44.5%) |
| Office & Administration | 238 (30.9%) | 531 (69.1%) |
| Total (Category) | 619 (42.5%) | 837 (57.5%) |
| Total (Overall) | 3,982 (52.8%) | 3,566 (47.2%) |
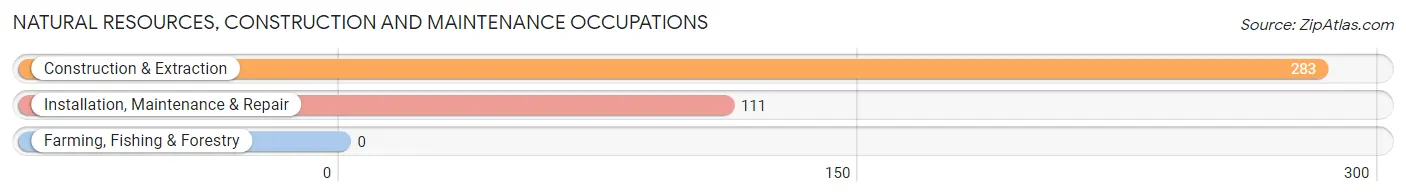
Natural Resources, Construction and Maintenance Occupations
The most common Natural Resources, Construction and Maintenance occupations in Glens Falls are Construction & Extraction (283 | 3.7%), and Installation, Maintenance & Repair (111 | 1.5%).
Natural Resources, Construction and Maintenance Occupations by Sex
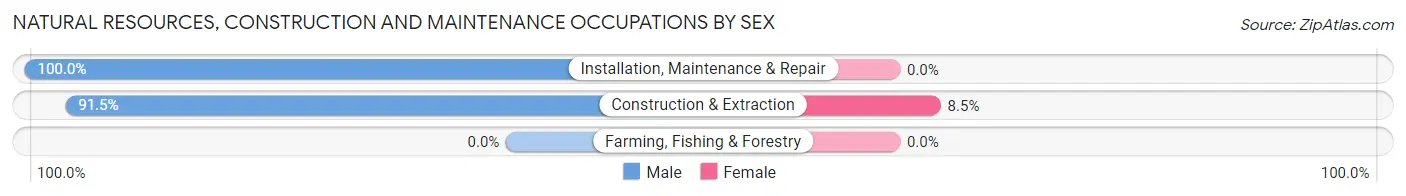
| Occupation | Male | Female |
| Farming, Fishing & Forestry | 0 (0.0%) | 0 (0.0%) |
| Construction & Extraction | 259 (91.5%) | 24 (8.5%) |
| Installation, Maintenance & Repair | 111 (100.0%) | 0 (0.0%) |
| Total (Category) | 370 (93.9%) | 24 (6.1%) |
| Total (Overall) | 3,982 (52.8%) | 3,566 (47.2%) |
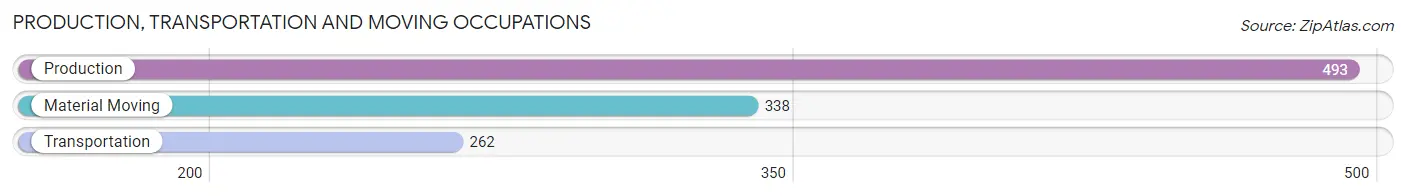
Production, Transportation and Moving Occupations
The most common Production, Transportation and Moving occupations in Glens Falls are Production (493 | 6.5%), Material Moving (338 | 4.5%), and Transportation (262 | 3.5%).
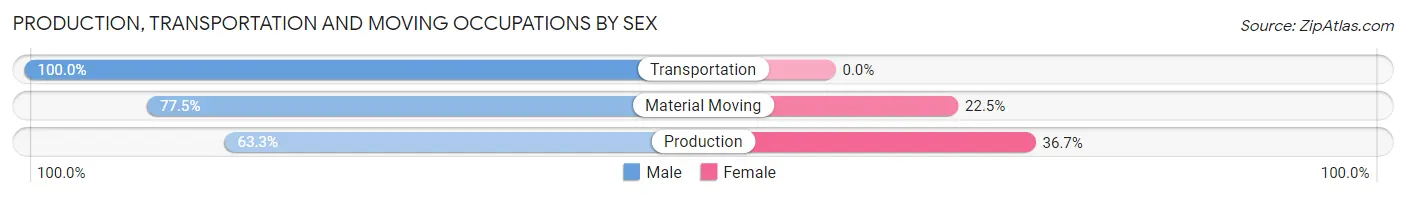
Production, Transportation and Moving Occupations by Sex
| Occupation | Male | Female |
| Production | 312 (63.3%) | 181 (36.7%) |
| Transportation | 262 (100.0%) | 0 (0.0%) |
| Material Moving | 262 (77.5%) | 76 (22.5%) |
| Total (Category) | 836 (76.5%) | 257 (23.5%) |
| Total (Overall) | 3,982 (52.8%) | 3,566 (47.2%) |
Employment Industries by Sex in Glens Falls
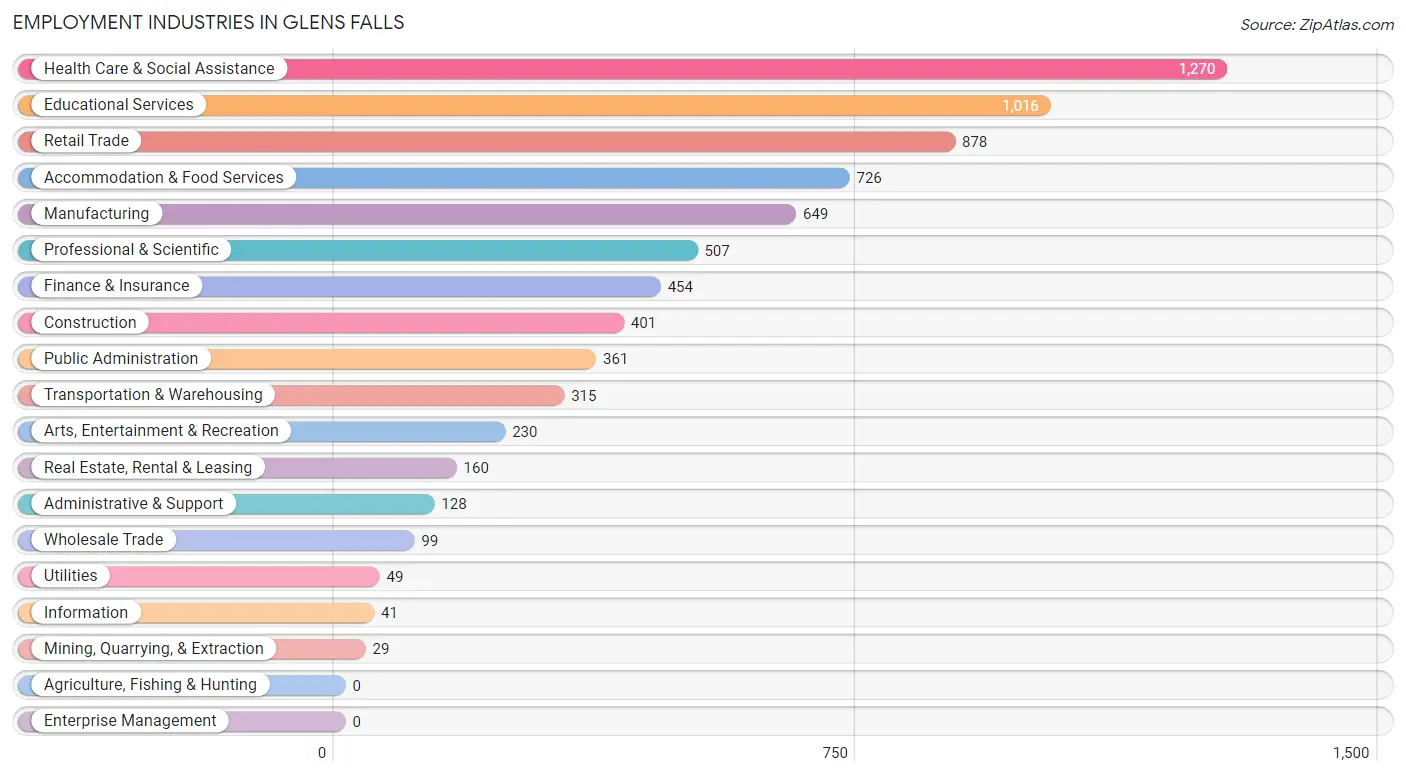
Employment Industries in Glens Falls
The major employment industries in Glens Falls include Health Care & Social Assistance (1,270 | 16.8%), Educational Services (1,016 | 13.5%), Retail Trade (878 | 11.6%), Accommodation & Food Services (726 | 9.6%), and Manufacturing (649 | 8.6%).
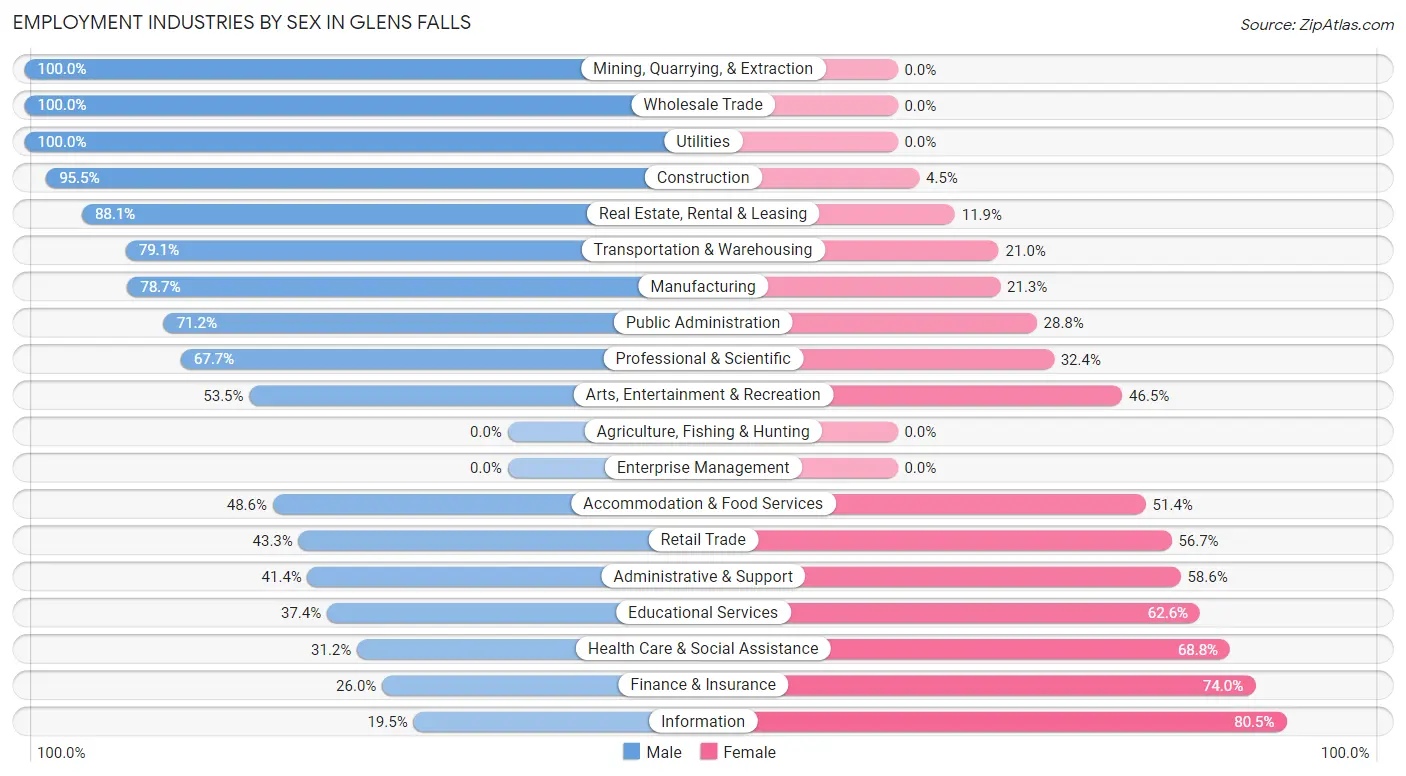
Employment Industries by Sex in Glens Falls
The Glens Falls industries that see more men than women are Mining, Quarrying, & Extraction (100.0%), Wholesale Trade (100.0%), and Utilities (100.0%), whereas the industries that tend to have a higher number of women are Information (80.5%), Finance & Insurance (74.0%), and Health Care & Social Assistance (68.8%).
| Industry | Male | Female |
| Agriculture, Fishing & Hunting | 0 (0.0%) | 0 (0.0%) |
| Mining, Quarrying, & Extraction | 29 (100.0%) | 0 (0.0%) |
| Construction | 383 (95.5%) | 18 (4.5%) |
| Manufacturing | 511 (78.7%) | 138 (21.3%) |
| Wholesale Trade | 99 (100.0%) | 0 (0.0%) |
| Retail Trade | 380 (43.3%) | 498 (56.7%) |
| Transportation & Warehousing | 249 (79.0%) | 66 (20.9%) |
| Utilities | 49 (100.0%) | 0 (0.0%) |
| Information | 8 (19.5%) | 33 (80.5%) |
| Finance & Insurance | 118 (26.0%) | 336 (74.0%) |
| Real Estate, Rental & Leasing | 141 (88.1%) | 19 (11.9%) |
| Professional & Scientific | 343 (67.6%) | 164 (32.4%) |
| Enterprise Management | 0 (0.0%) | 0 (0.0%) |
| Administrative & Support | 53 (41.4%) | 75 (58.6%) |
| Educational Services | 380 (37.4%) | 636 (62.6%) |
| Health Care & Social Assistance | 396 (31.2%) | 874 (68.8%) |
| Arts, Entertainment & Recreation | 123 (53.5%) | 107 (46.5%) |
| Accommodation & Food Services | 353 (48.6%) | 373 (51.4%) |
| Public Administration | 257 (71.2%) | 104 (28.8%) |
| Total | 3,982 (52.8%) | 3,566 (47.2%) |
Education in Glens Falls
School Enrollment in Glens Falls
The most common levels of schooling among the 3,024 students in Glens Falls are elementary school (778 | 25.7%), middle school (692 | 22.9%), and college / undergraduate (593 | 19.6%).
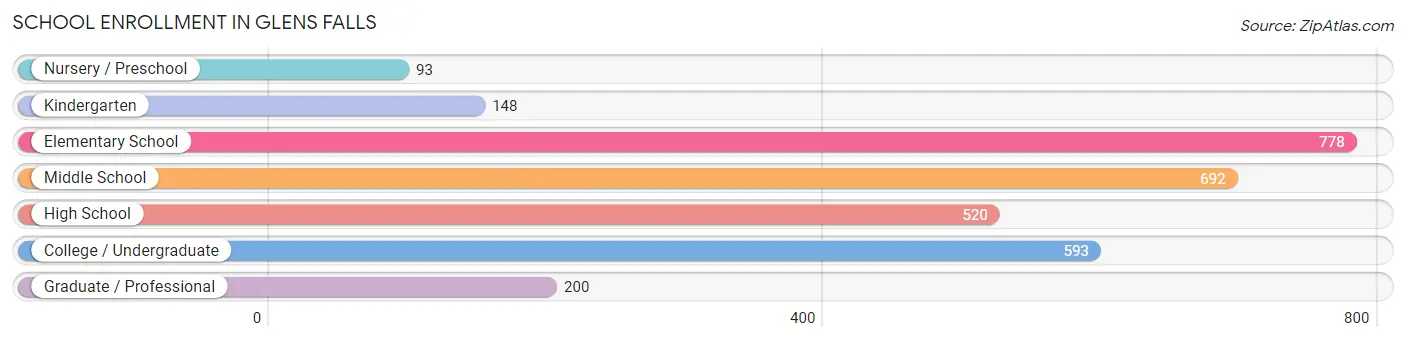
| School Level | # Students | % Students |
| Nursery / Preschool | 93 | 3.1% |
| Kindergarten | 148 | 4.9% |
| Elementary School | 778 | 25.7% |
| Middle School | 692 | 22.9% |
| High School | 520 | 17.2% |
| College / Undergraduate | 593 | 19.6% |
| Graduate / Professional | 200 | 6.6% |
| Total | 3,024 | 100.0% |
School Enrollment by Age by Funding Source in Glens Falls
Out of a total of 3,024 students who are enrolled in schools in Glens Falls, 445 (14.7%) attend a private institution, while the remaining 2,579 (85.3%) are enrolled in public schools. The age group of 18 to 19 year olds has the highest likelihood of being enrolled in private schools, with 78 (62.9% in the age bracket) enrolled. Conversely, the age group of 25 to 34 year olds has the lowest likelihood of being enrolled in a private school, with 205 (100.0% in the age bracket) attending a public institution.
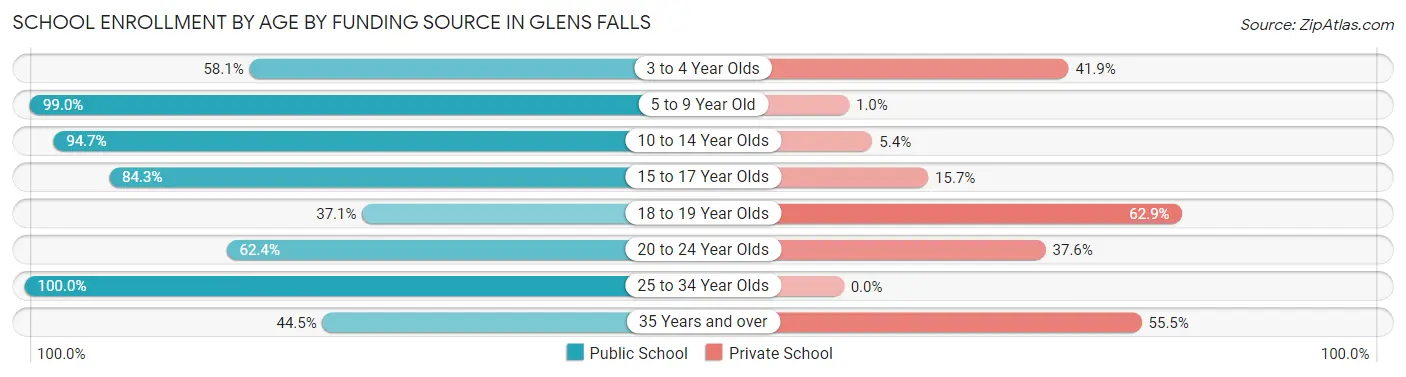
| Age Bracket | Public School | Private School |
| 3 to 4 Year Olds | 43 (58.1%) | 31 (41.9%) |
| 5 to 9 Year Old | 889 (99.0%) | 9 (1.0%) |
| 10 to 14 Year Olds | 760 (94.7%) | 43 (5.3%) |
| 15 to 17 Year Olds | 348 (84.3%) | 65 (15.7%) |
| 18 to 19 Year Olds | 46 (37.1%) | 78 (62.9%) |
| 20 to 24 Year Olds | 214 (62.4%) | 129 (37.6%) |
| 25 to 34 Year Olds | 205 (100.0%) | 0 (0.0%) |
| 35 Years and over | 73 (44.5%) | 91 (55.5%) |
| Total | 2,579 (85.3%) | 445 (14.7%) |
Educational Attainment by Field of Study in Glens Falls
Education (577 | 17.2%), business (436 | 13.0%), social sciences (351 | 10.4%), science & technology (329 | 9.8%), and visual & performing arts (289 | 8.6%) are the most common fields of study among 3,360 individuals in Glens Falls who have obtained a bachelor's degree or higher.
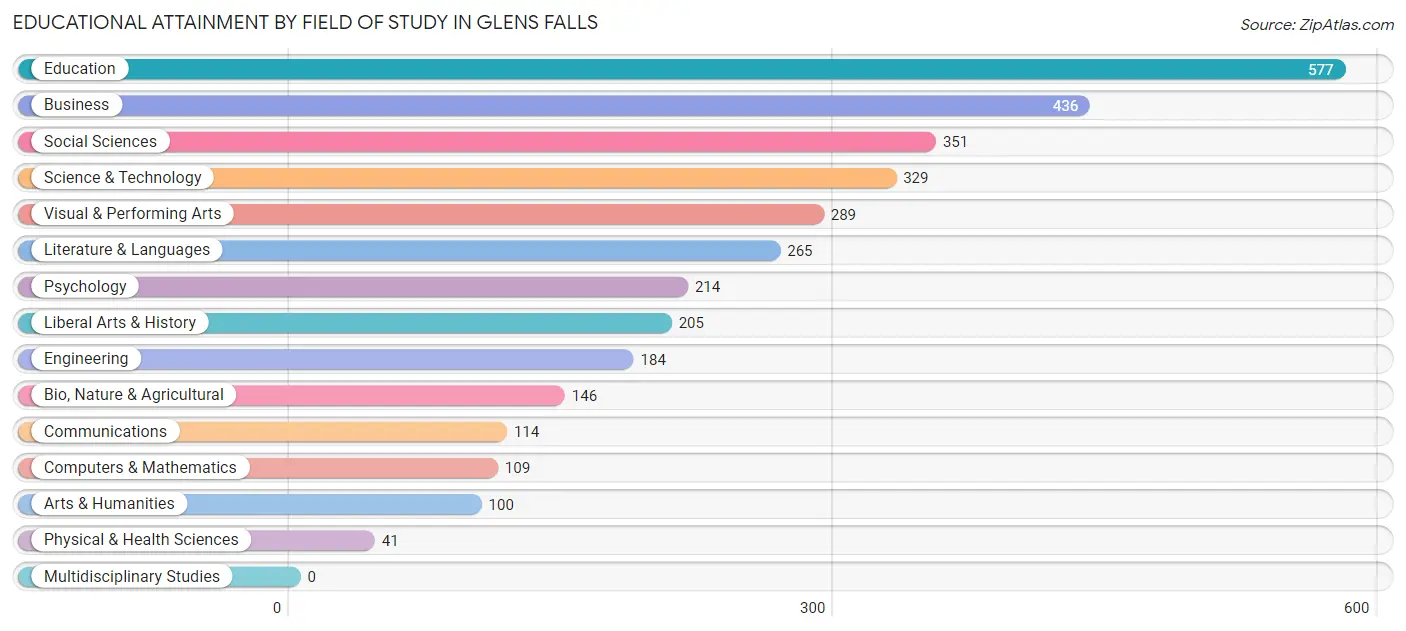
| Field of Study | # Graduates | % Graduates |
| Computers & Mathematics | 109 | 3.2% |
| Bio, Nature & Agricultural | 146 | 4.3% |
| Physical & Health Sciences | 41 | 1.2% |
| Psychology | 214 | 6.4% |
| Social Sciences | 351 | 10.4% |
| Engineering | 184 | 5.5% |
| Multidisciplinary Studies | 0 | 0.0% |
| Science & Technology | 329 | 9.8% |
| Business | 436 | 13.0% |
| Education | 577 | 17.2% |
| Literature & Languages | 265 | 7.9% |
| Liberal Arts & History | 205 | 6.1% |
| Visual & Performing Arts | 289 | 8.6% |
| Communications | 114 | 3.4% |
| Arts & Humanities | 100 | 3.0% |
| Total | 3,360 | 100.0% |
Transportation & Commute in Glens Falls
Vehicle Availability by Sex in Glens Falls
The most prevalent vehicle ownership categories in Glens Falls are males with 2 vehicles (1,882, accounting for 47.9%) and females with 2 vehicles (1,664, making up 53.7%).
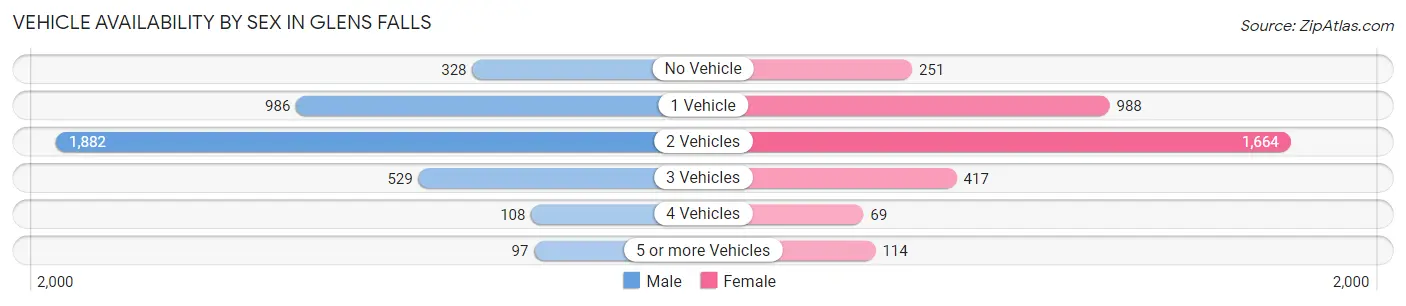
| Vehicles Available | Male | Female |
| No Vehicle | 328 (8.4%) | 251 (7.2%) |
| 1 Vehicle | 986 (25.1%) | 988 (28.2%) |
| 2 Vehicles | 1,882 (47.9%) | 1,664 (47.5%) |
| 3 Vehicles | 529 (13.5%) | 417 (11.9%) |
| 4 Vehicles | 108 (2.8%) | 69 (2.0%) |
| 5 or more Vehicles | 97 (2.5%) | 114 (3.3%) |
| Total | 3,930 (100.0%) | 3,503 (100.0%) |
Commute Time in Glens Falls
The most frequently occuring commute durations in Glens Falls are 10 to 14 minutes (1,454 commuters, 20.7%), 5 to 9 minutes (1,380 commuters, 19.6%), and 15 to 19 minutes (1,059 commuters, 15.1%).
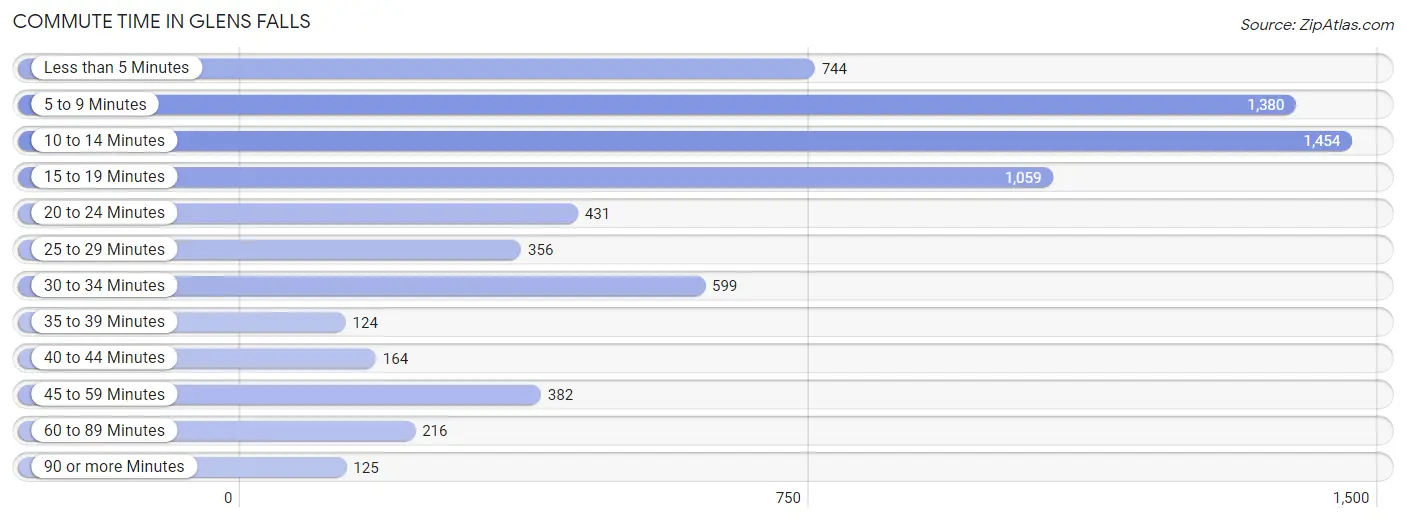
| Commute Time | # Commuters | % Commuters |
| Less than 5 Minutes | 744 | 10.6% |
| 5 to 9 Minutes | 1,380 | 19.6% |
| 10 to 14 Minutes | 1,454 | 20.7% |
| 15 to 19 Minutes | 1,059 | 15.1% |
| 20 to 24 Minutes | 431 | 6.1% |
| 25 to 29 Minutes | 356 | 5.1% |
| 30 to 34 Minutes | 599 | 8.5% |
| 35 to 39 Minutes | 124 | 1.8% |
| 40 to 44 Minutes | 164 | 2.3% |
| 45 to 59 Minutes | 382 | 5.4% |
| 60 to 89 Minutes | 216 | 3.1% |
| 90 or more Minutes | 125 | 1.8% |
Commute Time by Sex in Glens Falls
The most common commute times in Glens Falls are 10 to 14 minutes (854 commuters, 22.9%) for males and 5 to 9 minutes (753 commuters, 22.7%) for females.
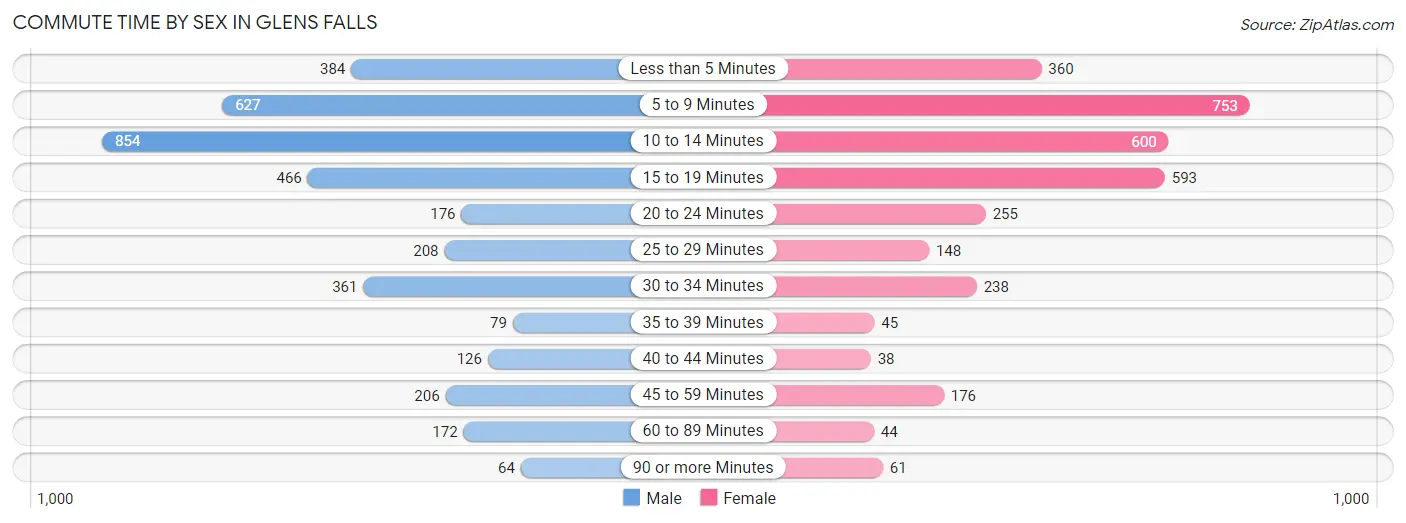
| Commute Time | Male | Female |
| Less than 5 Minutes | 384 (10.3%) | 360 (10.9%) |
| 5 to 9 Minutes | 627 (16.8%) | 753 (22.7%) |
| 10 to 14 Minutes | 854 (22.9%) | 600 (18.1%) |
| 15 to 19 Minutes | 466 (12.5%) | 593 (17.9%) |
| 20 to 24 Minutes | 176 (4.7%) | 255 (7.7%) |
| 25 to 29 Minutes | 208 (5.6%) | 148 (4.5%) |
| 30 to 34 Minutes | 361 (9.7%) | 238 (7.2%) |
| 35 to 39 Minutes | 79 (2.1%) | 45 (1.4%) |
| 40 to 44 Minutes | 126 (3.4%) | 38 (1.1%) |
| 45 to 59 Minutes | 206 (5.5%) | 176 (5.3%) |
| 60 to 89 Minutes | 172 (4.6%) | 44 (1.3%) |
| 90 or more Minutes | 64 (1.7%) | 61 (1.8%) |
Time of Departure to Work by Sex in Glens Falls
The most frequent times of departure to work in Glens Falls are 7:30 AM to 7:59 AM (507, 13.6%) for males and 7:30 AM to 7:59 AM (694, 21.0%) for females.
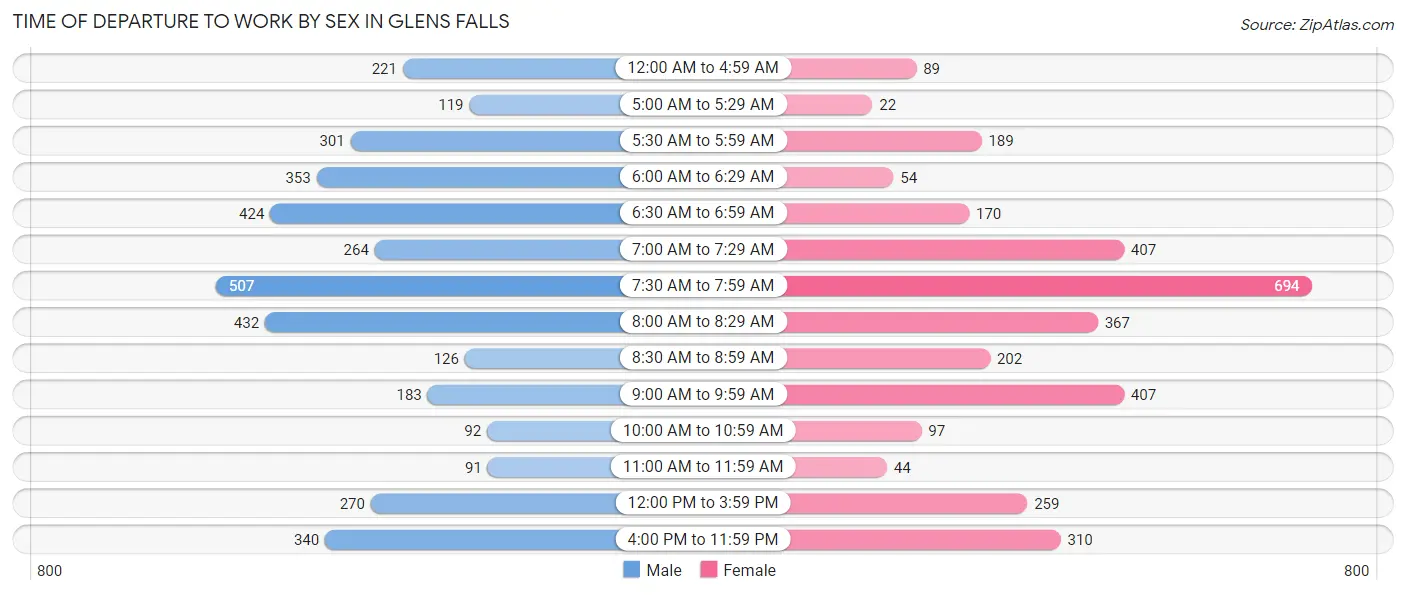
| Time of Departure | Male | Female |
| 12:00 AM to 4:59 AM | 221 (5.9%) | 89 (2.7%) |
| 5:00 AM to 5:29 AM | 119 (3.2%) | 22 (0.7%) |
| 5:30 AM to 5:59 AM | 301 (8.1%) | 189 (5.7%) |
| 6:00 AM to 6:29 AM | 353 (9.5%) | 54 (1.6%) |
| 6:30 AM to 6:59 AM | 424 (11.4%) | 170 (5.1%) |
| 7:00 AM to 7:29 AM | 264 (7.1%) | 407 (12.3%) |
| 7:30 AM to 7:59 AM | 507 (13.6%) | 694 (21.0%) |
| 8:00 AM to 8:29 AM | 432 (11.6%) | 367 (11.1%) |
| 8:30 AM to 8:59 AM | 126 (3.4%) | 202 (6.1%) |
| 9:00 AM to 9:59 AM | 183 (4.9%) | 407 (12.3%) |
| 10:00 AM to 10:59 AM | 92 (2.5%) | 97 (2.9%) |
| 11:00 AM to 11:59 AM | 91 (2.4%) | 44 (1.3%) |
| 12:00 PM to 3:59 PM | 270 (7.2%) | 259 (7.8%) |
| 4:00 PM to 11:59 PM | 340 (9.1%) | 310 (9.4%) |
| Total | 3,723 (100.0%) | 3,311 (100.0%) |
Housing Occupancy in Glens Falls
Occupancy by Ownership in Glens Falls
Of the total 6,669 dwellings in Glens Falls, owner-occupied units account for 3,385 (50.8%), while renter-occupied units make up 3,284 (49.2%).
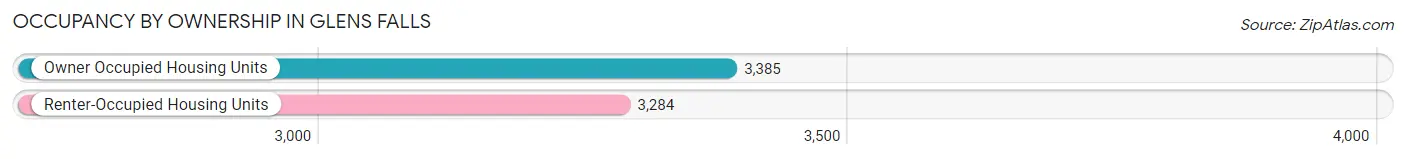
| Occupancy | # Housing Units | % Housing Units |
| Owner Occupied Housing Units | 3,385 | 50.8% |
| Renter-Occupied Housing Units | 3,284 | 49.2% |
| Total Occupied Housing Units | 6,669 | 100.0% |
Occupancy by Household Size in Glens Falls
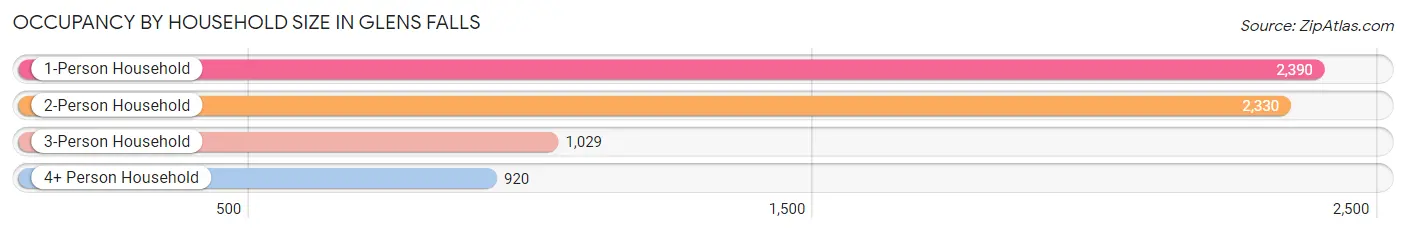
| Household Size | # Housing Units | % Housing Units |
| 1-Person Household | 2,390 | 35.8% |
| 2-Person Household | 2,330 | 34.9% |
| 3-Person Household | 1,029 | 15.4% |
| 4+ Person Household | 920 | 13.8% |
| Total Housing Units | 6,669 | 100.0% |
Occupancy by Ownership by Household Size in Glens Falls
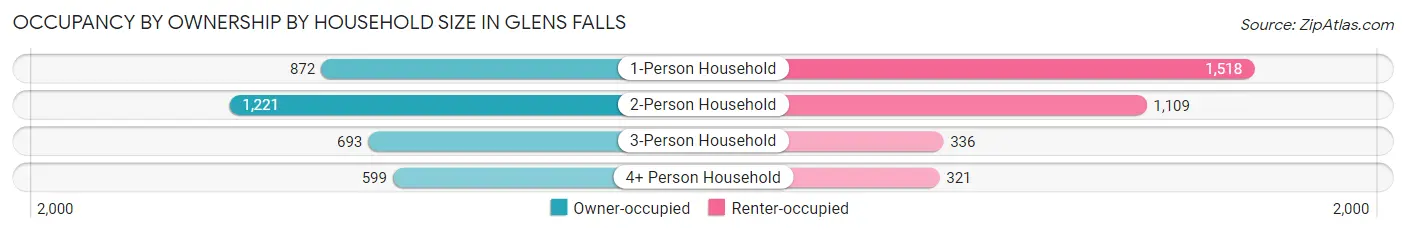
| Household Size | Owner-occupied | Renter-occupied |
| 1-Person Household | 872 (36.5%) | 1,518 (63.5%) |
| 2-Person Household | 1,221 (52.4%) | 1,109 (47.6%) |
| 3-Person Household | 693 (67.3%) | 336 (32.7%) |
| 4+ Person Household | 599 (65.1%) | 321 (34.9%) |
| Total Housing Units | 3,385 (50.8%) | 3,284 (49.2%) |
Occupancy by Educational Attainment in Glens Falls
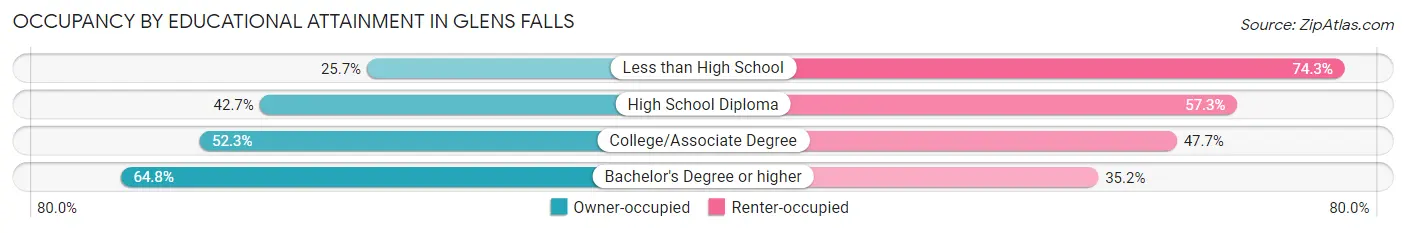
| Household Size | Owner-occupied | Renter-occupied |
| Less than High School | 166 (25.7%) | 480 (74.3%) |
| High School Diploma | 804 (42.7%) | 1,078 (57.3%) |
| College/Associate Degree | 1,124 (52.3%) | 1,024 (47.7%) |
| Bachelor's Degree or higher | 1,291 (64.8%) | 702 (35.2%) |
Occupancy by Age of Householder in Glens Falls
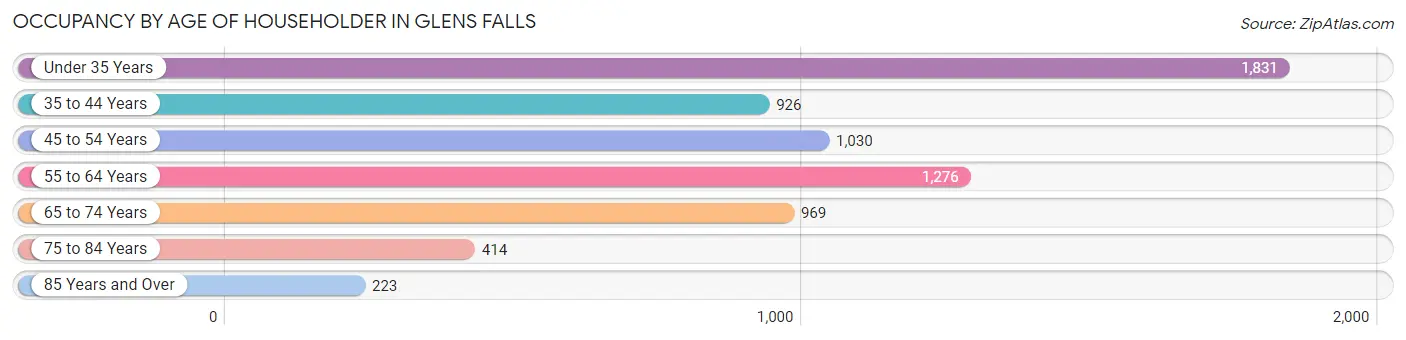
| Age Bracket | # Households | % Households |
| Under 35 Years | 1,831 | 27.5% |
| 35 to 44 Years | 926 | 13.9% |
| 45 to 54 Years | 1,030 | 15.4% |
| 55 to 64 Years | 1,276 | 19.1% |
| 65 to 74 Years | 969 | 14.5% |
| 75 to 84 Years | 414 | 6.2% |
| 85 Years and Over | 223 | 3.3% |
| Total | 6,669 | 100.0% |
Housing Finances in Glens Falls
Median Income by Occupancy in Glens Falls
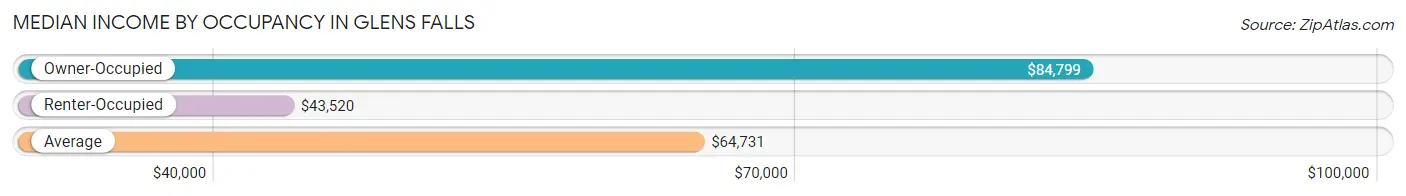
| Occupancy Type | # Households | Median Income |
| Owner-Occupied | 3,385 (50.8%) | $84,799 |
| Renter-Occupied | 3,284 (49.2%) | $43,520 |
| Average | 6,669 (100.0%) | $64,731 |
Occupancy by Householder Income Bracket in Glens Falls
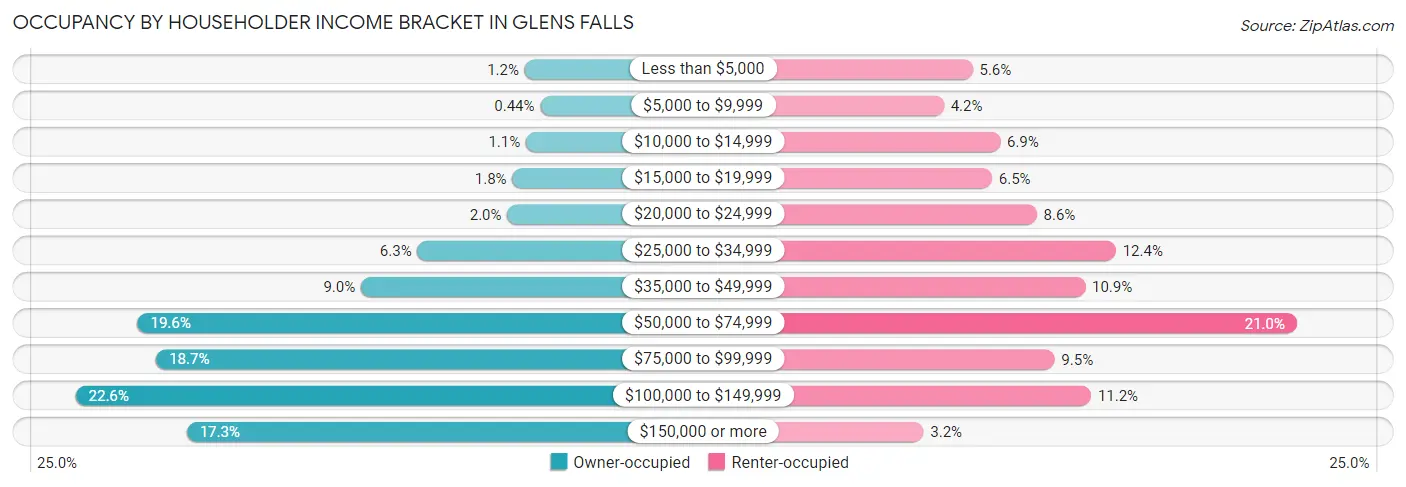
| Income Bracket | Owner-occupied | Renter-occupied |
| Less than $5,000 | 40 (1.2%) | 183 (5.6%) |
| $5,000 to $9,999 | 15 (0.4%) | 138 (4.2%) |
| $10,000 to $14,999 | 38 (1.1%) | 226 (6.9%) |
| $15,000 to $19,999 | 60 (1.8%) | 213 (6.5%) |
| $20,000 to $24,999 | 68 (2.0%) | 283 (8.6%) |
| $25,000 to $34,999 | 213 (6.3%) | 407 (12.4%) |
| $35,000 to $49,999 | 304 (9.0%) | 359 (10.9%) |
| $50,000 to $74,999 | 664 (19.6%) | 690 (21.0%) |
| $75,000 to $99,999 | 634 (18.7%) | 311 (9.5%) |
| $100,000 to $149,999 | 764 (22.6%) | 368 (11.2%) |
| $150,000 or more | 585 (17.3%) | 106 (3.2%) |
| Total | 3,385 (100.0%) | 3,284 (100.0%) |
Monthly Housing Cost Tiers in Glens Falls
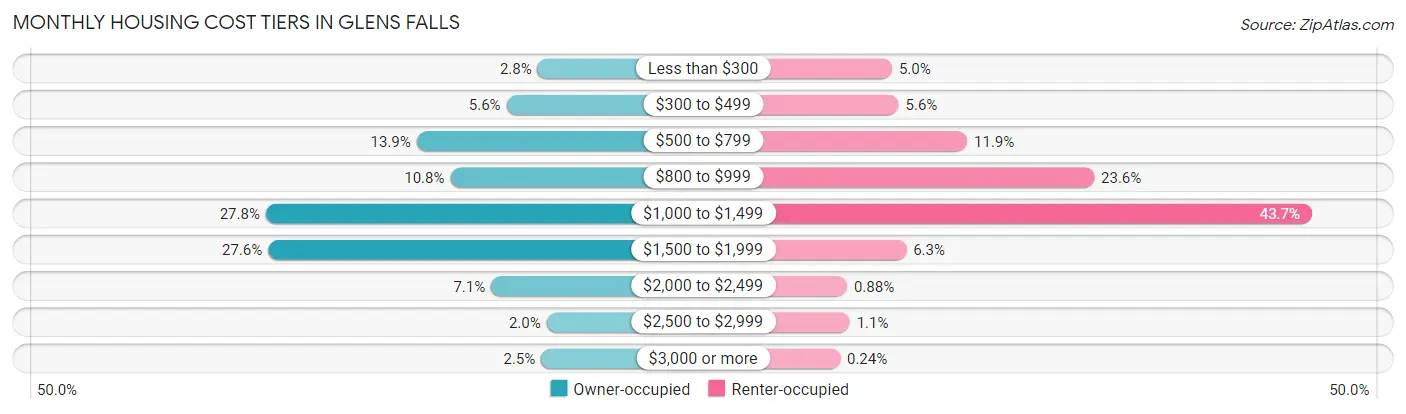
| Monthly Cost | Owner-occupied | Renter-occupied |
| Less than $300 | 94 (2.8%) | 165 (5.0%) |
| $300 to $499 | 191 (5.6%) | 185 (5.6%) |
| $500 to $799 | 471 (13.9%) | 392 (11.9%) |
| $800 to $999 | 366 (10.8%) | 776 (23.6%) |
| $1,000 to $1,499 | 941 (27.8%) | 1,434 (43.7%) |
| $1,500 to $1,999 | 934 (27.6%) | 208 (6.3%) |
| $2,000 to $2,499 | 239 (7.1%) | 29 (0.9%) |
| $2,500 to $2,999 | 66 (1.9%) | 37 (1.1%) |
| $3,000 or more | 83 (2.5%) | 8 (0.2%) |
| Total | 3,385 (100.0%) | 3,284 (100.0%) |
Physical Housing Characteristics in Glens Falls
Housing Structures in Glens Falls
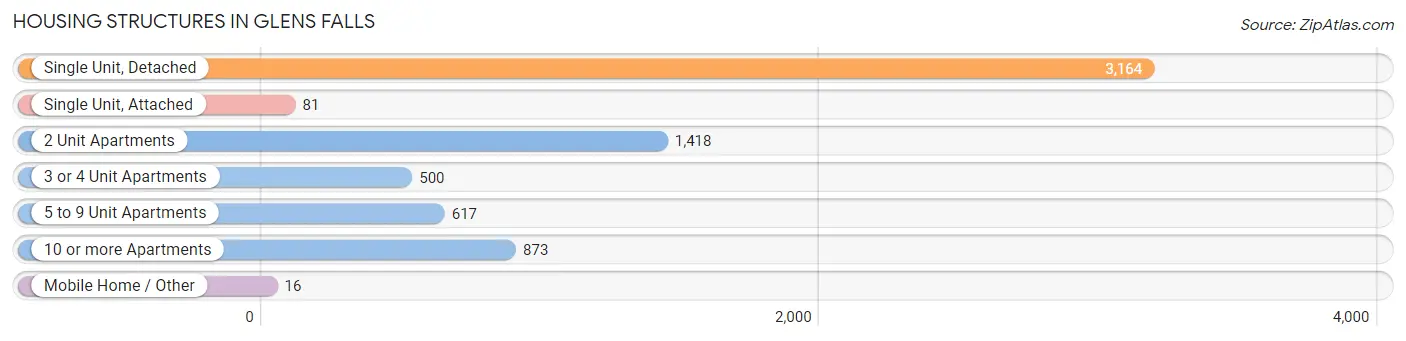
| Structure Type | # Housing Units | % Housing Units |
| Single Unit, Detached | 3,164 | 47.4% |
| Single Unit, Attached | 81 | 1.2% |
| 2 Unit Apartments | 1,418 | 21.3% |
| 3 or 4 Unit Apartments | 500 | 7.5% |
| 5 to 9 Unit Apartments | 617 | 9.2% |
| 10 or more Apartments | 873 | 13.1% |
| Mobile Home / Other | 16 | 0.2% |
| Total | 6,669 | 100.0% |
Housing Structures by Occupancy in Glens Falls
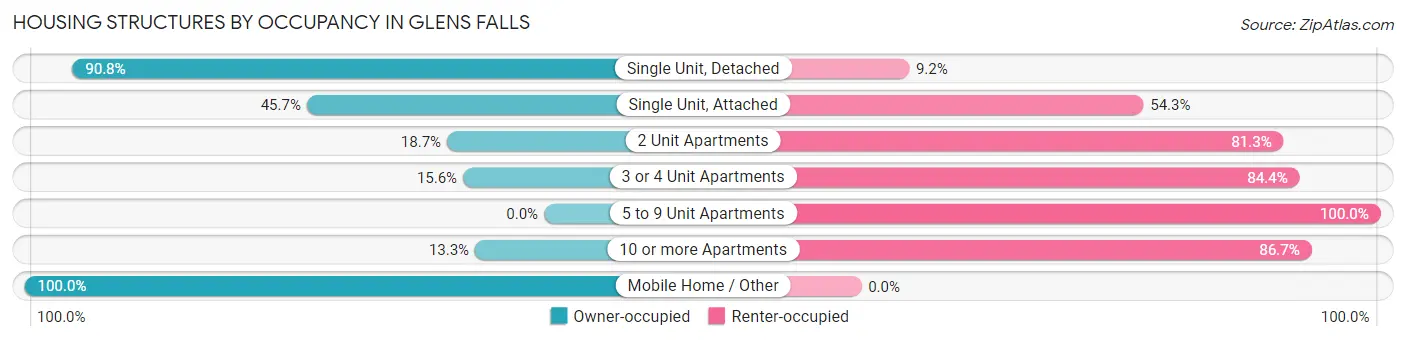
| Structure Type | Owner-occupied | Renter-occupied |
| Single Unit, Detached | 2,873 (90.8%) | 291 (9.2%) |
| Single Unit, Attached | 37 (45.7%) | 44 (54.3%) |
| 2 Unit Apartments | 265 (18.7%) | 1,153 (81.3%) |
| 3 or 4 Unit Apartments | 78 (15.6%) | 422 (84.4%) |
| 5 to 9 Unit Apartments | 0 (0.0%) | 617 (100.0%) |
| 10 or more Apartments | 116 (13.3%) | 757 (86.7%) |
| Mobile Home / Other | 16 (100.0%) | 0 (0.0%) |
| Total | 3,385 (50.8%) | 3,284 (49.2%) |
Housing Structures by Number of Rooms in Glens Falls
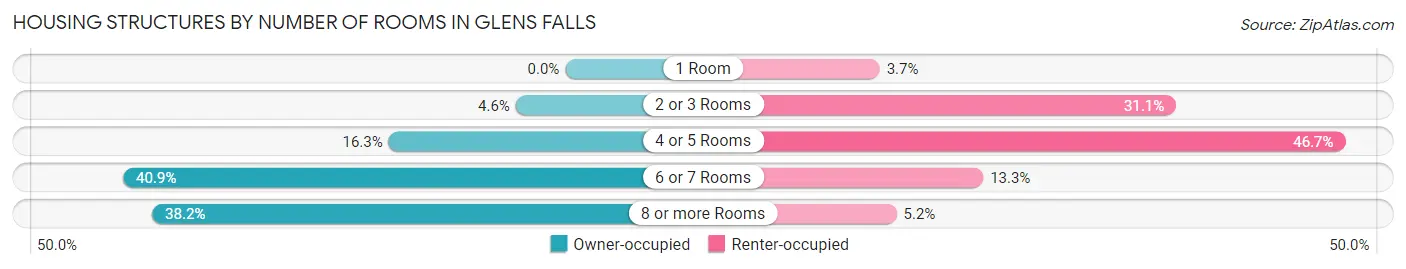
| Number of Rooms | Owner-occupied | Renter-occupied |
| 1 Room | 0 (0.0%) | 121 (3.7%) |
| 2 or 3 Rooms | 155 (4.6%) | 1,021 (31.1%) |
| 4 or 5 Rooms | 553 (16.3%) | 1,535 (46.7%) |
| 6 or 7 Rooms | 1,384 (40.9%) | 435 (13.3%) |
| 8 or more Rooms | 1,293 (38.2%) | 172 (5.2%) |
| Total | 3,385 (100.0%) | 3,284 (100.0%) |
Housing Structure by Heating Type in Glens Falls
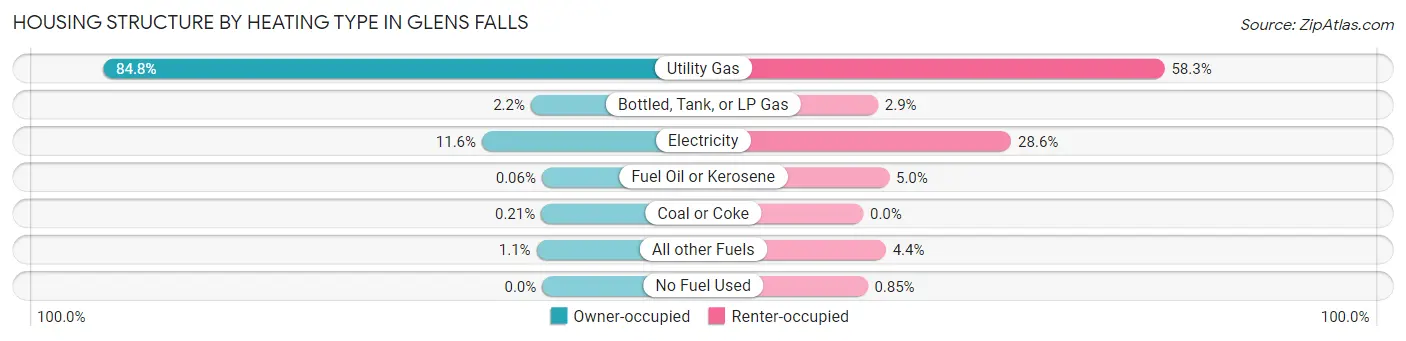
| Heating Type | Owner-occupied | Renter-occupied |
| Utility Gas | 2,871 (84.8%) | 1,913 (58.3%) |
| Bottled, Tank, or LP Gas | 74 (2.2%) | 94 (2.9%) |
| Electricity | 394 (11.6%) | 940 (28.6%) |
| Fuel Oil or Kerosene | 2 (0.1%) | 165 (5.0%) |
| Coal or Coke | 7 (0.2%) | 0 (0.0%) |
| All other Fuels | 37 (1.1%) | 144 (4.4%) |
| No Fuel Used | 0 (0.0%) | 28 (0.9%) |
| Total | 3,385 (100.0%) | 3,284 (100.0%) |
Household Vehicle Usage in Glens Falls
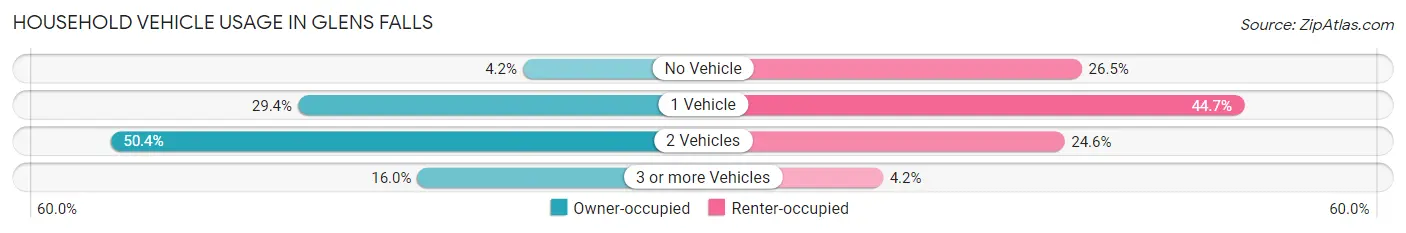
| Vehicles per Household | Owner-occupied | Renter-occupied |
| No Vehicle | 142 (4.2%) | 871 (26.5%) |
| 1 Vehicle | 995 (29.4%) | 1,467 (44.7%) |
| 2 Vehicles | 1,706 (50.4%) | 807 (24.6%) |
| 3 or more Vehicles | 542 (16.0%) | 139 (4.2%) |
| Total | 3,385 (100.0%) | 3,284 (100.0%) |
Real Estate & Mortgages in Glens Falls
Real Estate and Mortgage Overview in Glens Falls
| Characteristic | Without Mortgage | With Mortgage |
| Housing Units | 1,027 | 2,358 |
| Median Property Value | $186,200 | $179,100 |
| Median Household Income | $59,766 | $433 |
| Monthly Housing Costs | $660 | $83 |
| Real Estate Taxes | $4,233 | $92 |
Property Value by Mortgage Status in Glens Falls
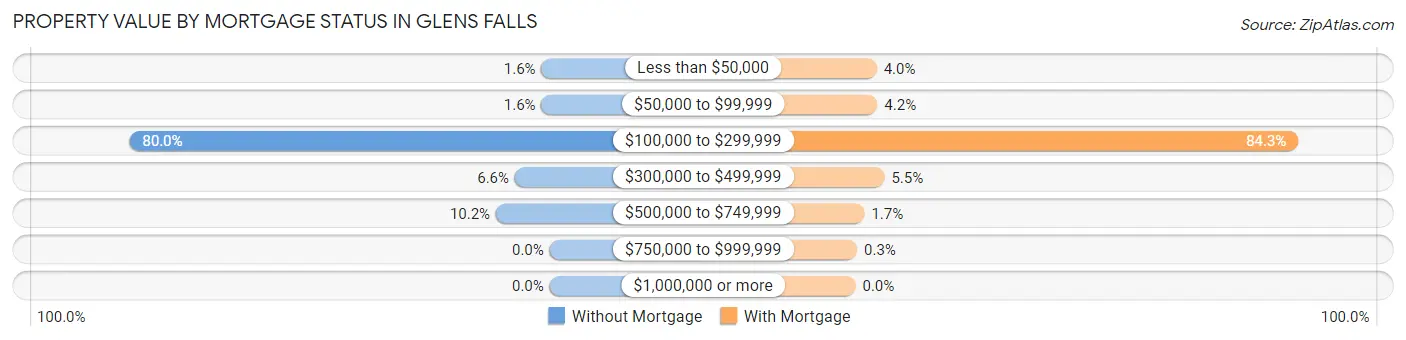
| Property Value | Without Mortgage | With Mortgage |
| Less than $50,000 | 16 (1.6%) | 95 (4.0%) |
| $50,000 to $99,999 | 16 (1.6%) | 98 (4.2%) |
| $100,000 to $299,999 | 822 (80.0%) | 1,988 (84.3%) |
| $300,000 to $499,999 | 68 (6.6%) | 130 (5.5%) |
| $500,000 to $749,999 | 105 (10.2%) | 40 (1.7%) |
| $750,000 to $999,999 | 0 (0.0%) | 7 (0.3%) |
| $1,000,000 or more | 0 (0.0%) | 0 (0.0%) |
| Total | 1,027 (100.0%) | 2,358 (100.0%) |
Household Income by Mortgage Status in Glens Falls
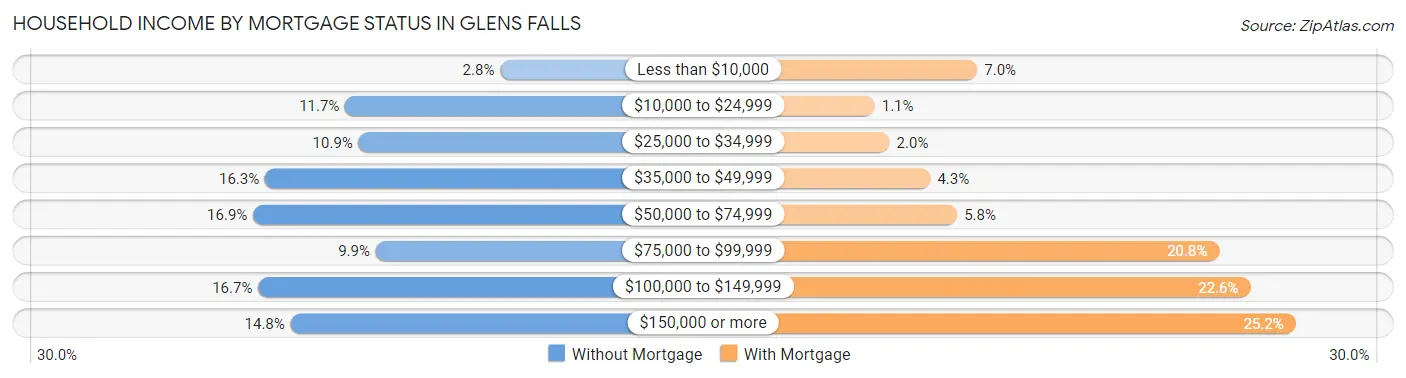
| Household Income | Without Mortgage | With Mortgage |
| Less than $10,000 | 29 (2.8%) | 164 (7.0%) |
| $10,000 to $24,999 | 120 (11.7%) | 26 (1.1%) |
| $25,000 to $34,999 | 112 (10.9%) | 46 (1.9%) |
| $35,000 to $49,999 | 167 (16.3%) | 101 (4.3%) |
| $50,000 to $74,999 | 174 (16.9%) | 137 (5.8%) |
| $75,000 to $99,999 | 102 (9.9%) | 490 (20.8%) |
| $100,000 to $149,999 | 171 (16.7%) | 532 (22.6%) |
| $150,000 or more | 152 (14.8%) | 593 (25.2%) |
| Total | 1,027 (100.0%) | 2,358 (100.0%) |
Property Value to Household Income Ratio in Glens Falls
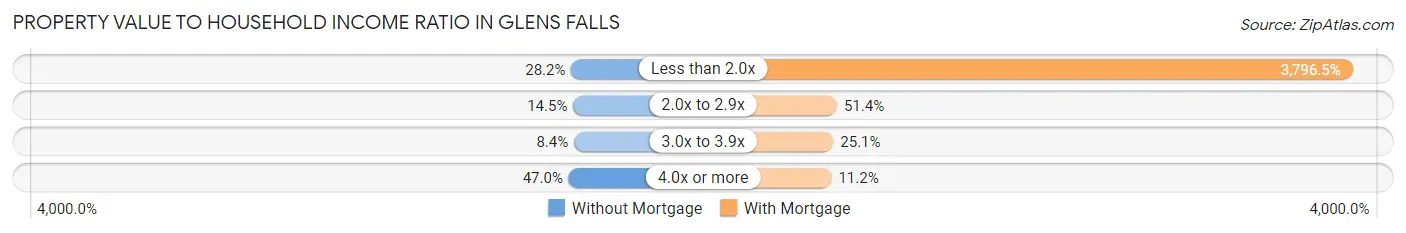
| Value-to-Income Ratio | Without Mortgage | With Mortgage |
| Less than 2.0x | 290 (28.2%) | 89,521 (3,796.5%) |
| 2.0x to 2.9x | 149 (14.5%) | 1,211 (51.4%) |
| 3.0x to 3.9x | 86 (8.4%) | 592 (25.1%) |
| 4.0x or more | 483 (47.0%) | 265 (11.2%) |
| Total | 1,027 (100.0%) | 2,358 (100.0%) |
Real Estate Taxes by Mortgage Status in Glens Falls
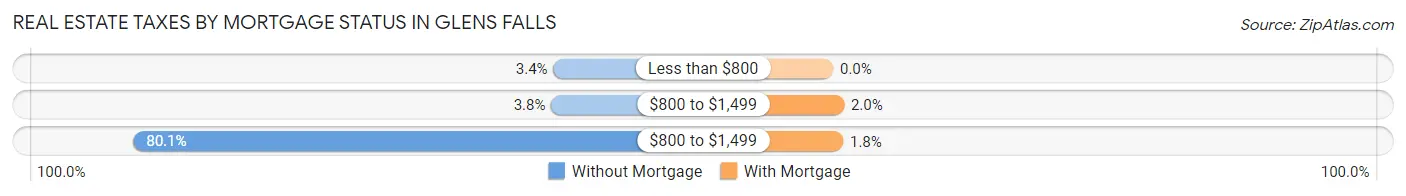
| Property Taxes | Without Mortgage | With Mortgage |
| Less than $800 | 35 (3.4%) | 0 (0.0%) |
| $800 to $1,499 | 39 (3.8%) | 47 (2.0%) |
| $800 to $1,499 | 823 (80.1%) | 43 (1.8%) |
| Total | 1,027 (100.0%) | 2,358 (100.0%) |
Health & Disability in Glens Falls
Health Insurance Coverage by Age in Glens Falls
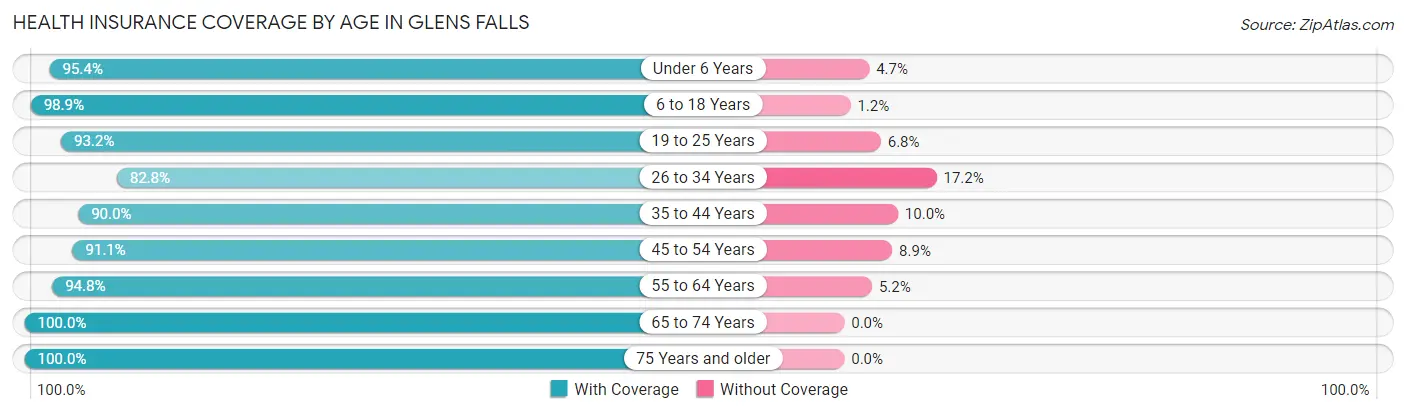
| Age Bracket | With Coverage | Without Coverage |
| Under 6 Years | 840 (95.4%) | 41 (4.6%) |
| 6 to 18 Years | 2,145 (98.9%) | 25 (1.1%) |
| 19 to 25 Years | 1,505 (93.2%) | 110 (6.8%) |
| 26 to 34 Years | 1,805 (82.8%) | 375 (17.2%) |
| 35 to 44 Years | 1,593 (90.0%) | 177 (10.0%) |
| 45 to 54 Years | 1,582 (91.1%) | 155 (8.9%) |
| 55 to 64 Years | 1,912 (94.8%) | 104 (5.2%) |
| 65 to 74 Years | 1,349 (100.0%) | 0 (0.0%) |
| 75 Years and older | 801 (100.0%) | 0 (0.0%) |
| Total | 13,532 (93.2%) | 987 (6.8%) |
Health Insurance Coverage by Citizenship Status in Glens Falls
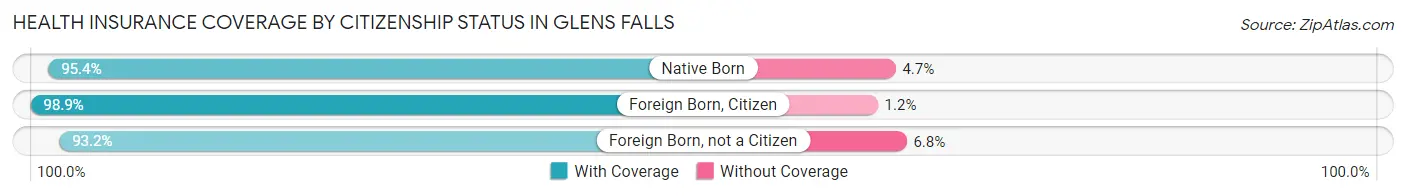
| Citizenship Status | With Coverage | Without Coverage |
| Native Born | 840 (95.4%) | 41 (4.6%) |
| Foreign Born, Citizen | 2,145 (98.9%) | 25 (1.1%) |
| Foreign Born, not a Citizen | 1,505 (93.2%) | 110 (6.8%) |
Health Insurance Coverage by Household Income in Glens Falls
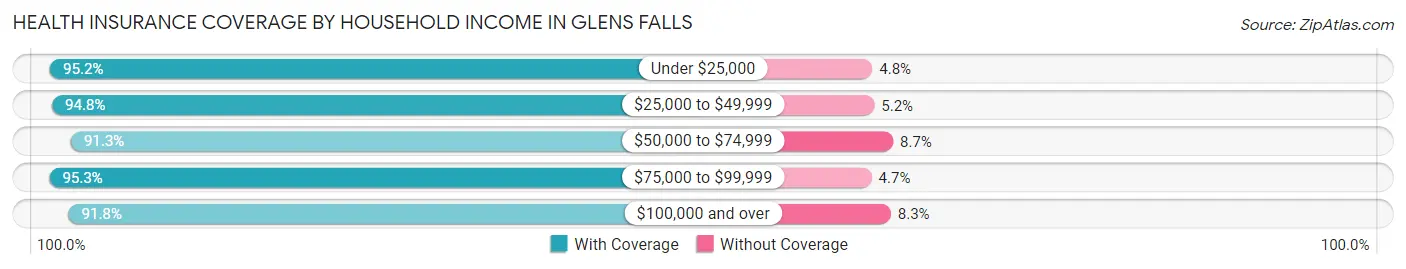
| Household Income | With Coverage | Without Coverage |
| Under $25,000 | 1,690 (95.2%) | 85 (4.8%) |
| $25,000 to $49,999 | 2,298 (94.8%) | 125 (5.2%) |
| $50,000 to $74,999 | 2,652 (91.3%) | 252 (8.7%) |
| $75,000 to $99,999 | 2,171 (95.3%) | 106 (4.7%) |
| $100,000 and over | 4,604 (91.7%) | 414 (8.3%) |
Public vs Private Health Insurance Coverage by Age in Glens Falls
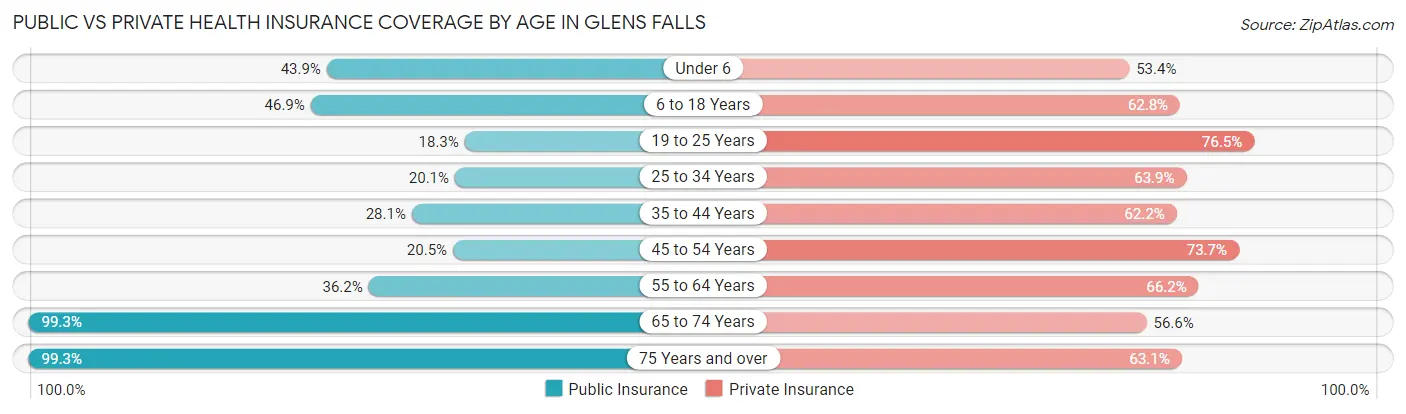
| Age Bracket | Public Insurance | Private Insurance |
| Under 6 | 387 (43.9%) | 470 (53.3%) |
| 6 to 18 Years | 1,018 (46.9%) | 1,362 (62.8%) |
| 19 to 25 Years | 296 (18.3%) | 1,236 (76.5%) |
| 25 to 34 Years | 439 (20.1%) | 1,394 (63.9%) |
| 35 to 44 Years | 498 (28.1%) | 1,100 (62.2%) |
| 45 to 54 Years | 356 (20.5%) | 1,280 (73.7%) |
| 55 to 64 Years | 729 (36.2%) | 1,335 (66.2%) |
| 65 to 74 Years | 1,339 (99.3%) | 763 (56.6%) |
| 75 Years and over | 795 (99.3%) | 505 (63.0%) |
| Total | 5,857 (40.3%) | 9,445 (65.0%) |
Disability Status by Sex by Age in Glens Falls
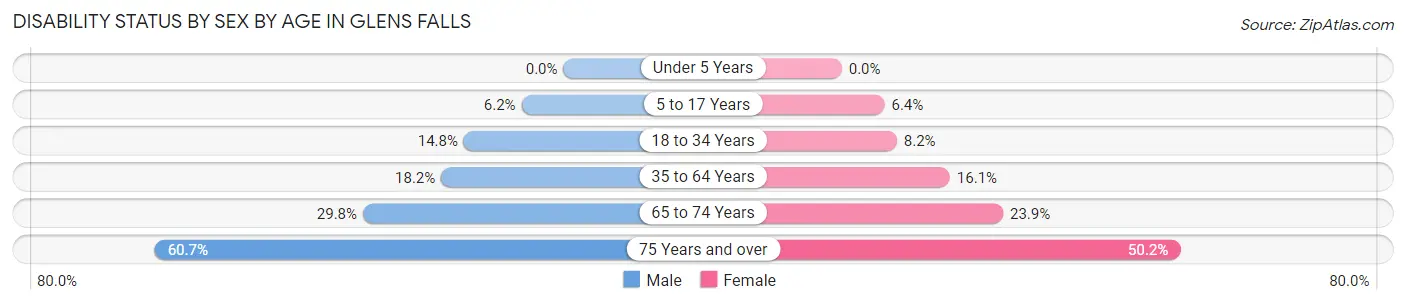
| Age Bracket | Male | Female |
| Under 5 Years | 0 (0.0%) | 0 (0.0%) |
| 5 to 17 Years | 70 (6.2%) | 66 (6.4%) |
| 18 to 34 Years | 280 (14.8%) | 163 (8.2%) |
| 35 to 64 Years | 523 (18.1%) | 424 (16.1%) |
| 65 to 74 Years | 184 (29.8%) | 175 (23.9%) |
| 75 Years and over | 236 (60.7%) | 207 (50.2%) |
Disability Class by Sex by Age in Glens Falls
Disability Class: Hearing Difficulty
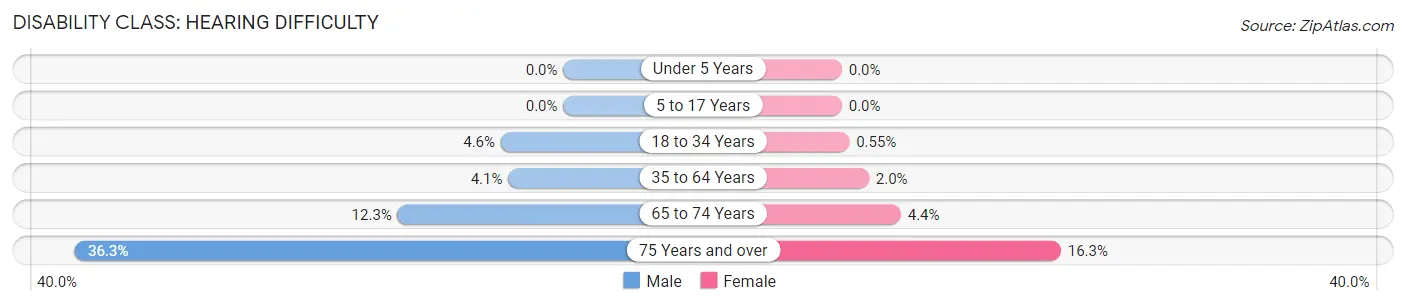
| Age Bracket | Male | Female |
| Under 5 Years | 0 (0.0%) | 0 (0.0%) |
| 5 to 17 Years | 0 (0.0%) | 0 (0.0%) |
| 18 to 34 Years | 88 (4.6%) | 11 (0.5%) |
| 35 to 64 Years | 118 (4.1%) | 53 (2.0%) |
| 65 to 74 Years | 76 (12.3%) | 32 (4.4%) |
| 75 Years and over | 141 (36.2%) | 67 (16.3%) |
Disability Class: Vision Difficulty
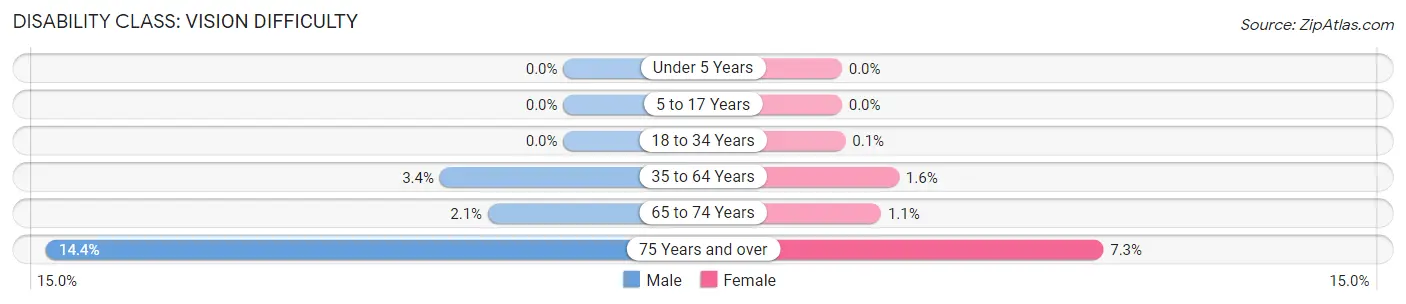
| Age Bracket | Male | Female |
| Under 5 Years | 0 (0.0%) | 0 (0.0%) |
| 5 to 17 Years | 0 (0.0%) | 0 (0.0%) |
| 18 to 34 Years | 0 (0.0%) | 2 (0.1%) |
| 35 to 64 Years | 99 (3.4%) | 42 (1.6%) |
| 65 to 74 Years | 13 (2.1%) | 8 (1.1%) |
| 75 Years and over | 56 (14.4%) | 30 (7.3%) |
Disability Class: Cognitive Difficulty
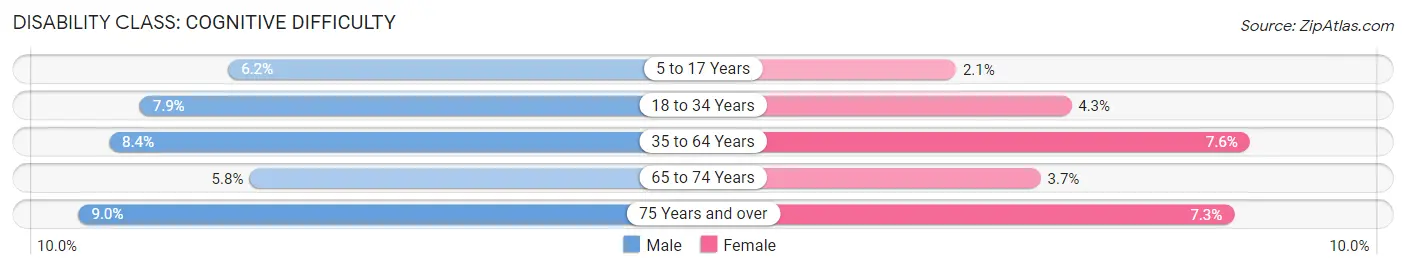
| Age Bracket | Male | Female |
| 5 to 17 Years | 70 (6.2%) | 22 (2.1%) |
| 18 to 34 Years | 149 (7.9%) | 85 (4.3%) |
| 35 to 64 Years | 243 (8.4%) | 200 (7.6%) |
| 65 to 74 Years | 36 (5.8%) | 27 (3.7%) |
| 75 Years and over | 35 (9.0%) | 30 (7.3%) |
Disability Class: Ambulatory Difficulty
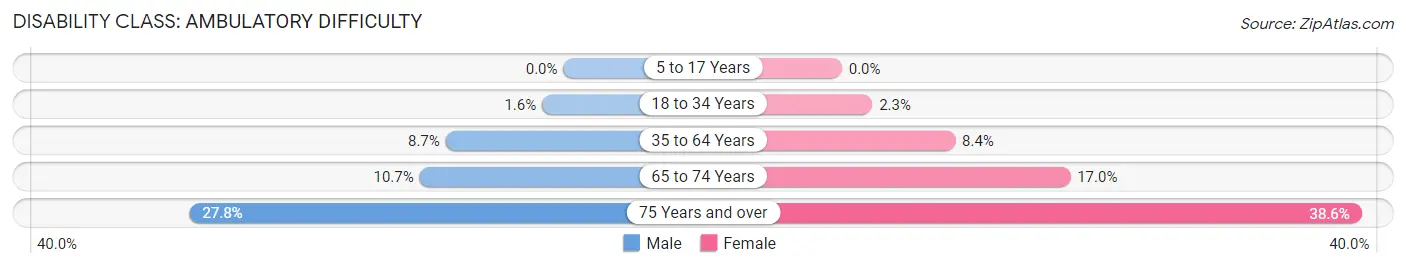
| Age Bracket | Male | Female |
| 5 to 17 Years | 0 (0.0%) | 0 (0.0%) |
| 18 to 34 Years | 30 (1.6%) | 45 (2.3%) |
| 35 to 64 Years | 252 (8.7%) | 222 (8.4%) |
| 65 to 74 Years | 66 (10.7%) | 124 (17.0%) |
| 75 Years and over | 108 (27.8%) | 159 (38.6%) |
Disability Class: Self-Care Difficulty
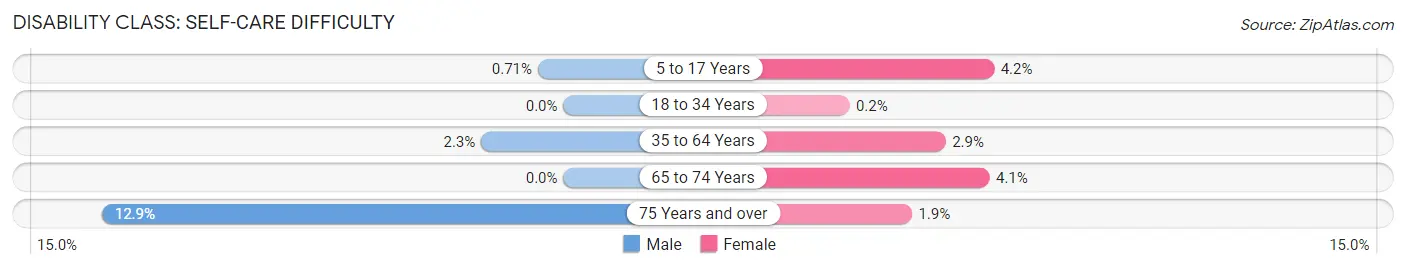
| Age Bracket | Male | Female |
| 5 to 17 Years | 8 (0.7%) | 44 (4.2%) |
| 18 to 34 Years | 0 (0.0%) | 4 (0.2%) |
| 35 to 64 Years | 66 (2.3%) | 76 (2.9%) |
| 65 to 74 Years | 0 (0.0%) | 30 (4.1%) |
| 75 Years and over | 50 (12.9%) | 8 (1.9%) |
Technology Access in Glens Falls
Computing Device Access in Glens Falls
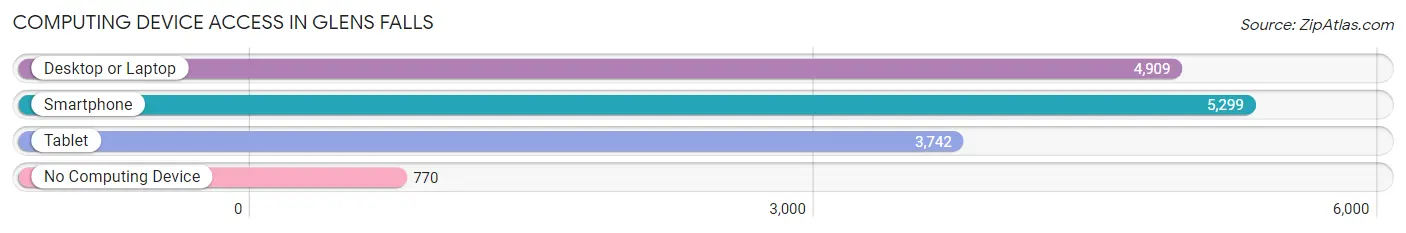
| Device Type | # Households | % Households |
| Desktop or Laptop | 4,909 | 73.6% |
| Smartphone | 5,299 | 79.5% |
| Tablet | 3,742 | 56.1% |
| No Computing Device | 770 | 11.6% |
| Total | 6,669 | 100.0% |
Internet Access in Glens Falls
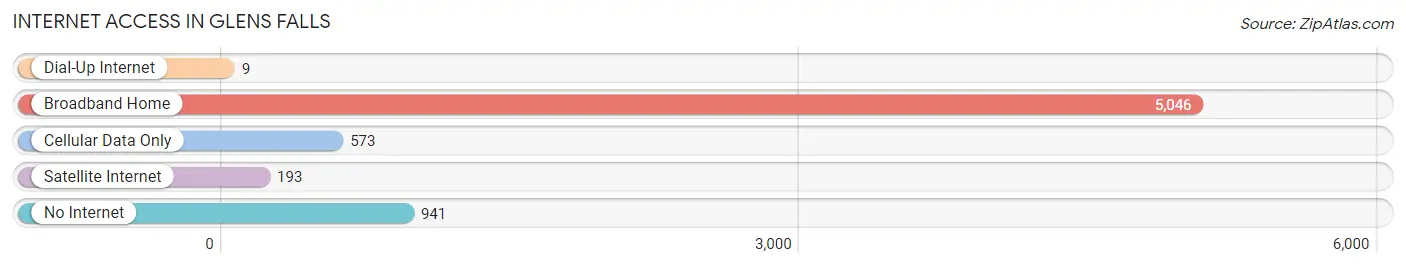
| Internet Type | # Households | % Households |
| Dial-Up Internet | 9 | 0.1% |
| Broadband Home | 5,046 | 75.7% |
| Cellular Data Only | 573 | 8.6% |
| Satellite Internet | 193 | 2.9% |
| No Internet | 941 | 14.1% |
| Total | 6,669 | 100.0% |
Glens Falls Summary
Glens Falls, NY is a city located in Warren County, New York, United States. It is situated at the southeast corner of the Adirondack Park, and is the largest city in the county. The population was 14,700 at the 2010 census. The name of the city is derived from a large waterfall located on the Hudson River, which was named after the first settler of the area, Colonel Johannes Glen.
Geography
Glens Falls is located at the confluence of the Hudson River and the Schroon River, and is situated at the southeast corner of the Adirondack Park. The city is located in the foothills of the Adirondack Mountains, and is surrounded by mountains and hills. The city is located approximately 40 miles north of Albany, and is approximately 30 miles south of Lake George.
The city has a total area of 8.2 square miles, of which 8.1 square miles is land and 0.1 square miles is water. The city is located in a humid continental climate zone, with cold, snowy winters and warm, humid summers.
History
The area that is now Glens Falls was first settled by the Mohawk people in the early 1700s. The first European settler of the area was Colonel Johannes Glen, who arrived in 1762 and established a trading post. The area was later settled by other Europeans, and the city was officially incorporated in 1839.
The city grew rapidly in the late 19th century, and was a major industrial center in the region. The city was home to several large paper mills, and was also a major center for the production of iron and steel. The city was also home to several large manufacturing companies, including the Glens Falls Foundry and the Glens Falls Iron Works.
Economy
Glens Falls is a major economic center in the region, and is home to several large employers. The largest employer in the city is Glens Falls Hospital, which employs over 2,000 people. Other major employers in the city include Glens Falls National Bank, Glens Falls Insurance, and Glens Falls Manufacturing.
The city is also home to several large retail stores, including Walmart, Target, and Lowe's. The city is also home to several restaurants, bars, and other entertainment venues.
Demographics
As of the 2010 census, the population of Glens Falls was 14,700. The racial makeup of the city was 94.3% White, 2.2% African American, 0.5% Native American, 0.9% Asian, 0.1% Pacific Islander, 0.7% from other races, and 1.3% from two or more races. Hispanic or Latino of any race were 2.7% of the population.
The median income for a household in the city was $41,945, and the median income for a family was $50,945. The per capita income for the city was $22,845. About 11.3% of families and 14.2% of the population were below the poverty line, including 19.2% of those under age 18 and 8.2% of those age 65 or over.
Common Questions
What is Per Capita Income in Glens Falls?
Per Capita income in Glens Falls is $36,031.
What is the Median Family Income in Glens Falls?
Median Family Income in Glens Falls is $80,839.
What is the Median Household income in Glens Falls?
Median Household Income in Glens Falls is $64,731.
What is Income or Wage Gap in Glens Falls?
Income or Wage Gap in Glens Falls is 28.9%.
Women in Glens Falls earn 71.1 cents for every dollar earned by a man.
What is Family Income Deficit in Glens Falls?
Family Income Deficit in Glens Falls is $8,299.
Families that are below poverty line in Glens Falls earn $8,299 less on average than the poverty threshold level.
What is Inequality or Gini Index in Glens Falls?
Inequality or Gini Index in Glens Falls is 0.43.
What is the Total Population of Glens Falls?
Total Population of Glens Falls is 14,743.
What is the Total Male Population of Glens Falls?
Total Male Population of Glens Falls is 7,499.
What is the Total Female Population of Glens Falls?
Total Female Population of Glens Falls is 7,244.
What is the Ratio of Males per 100 Females in Glens Falls?
There are 103.52 Males per 100 Females in Glens Falls.
What is the Ratio of Females per 100 Males in Glens Falls?
There are 96.60 Females per 100 Males in Glens Falls.
What is the Median Population Age in Glens Falls?
Median Population Age in Glens Falls is 37.0 Years.
What is the Average Family Size in Glens Falls
Average Family Size in Glens Falls is 2.9 People.
What is the Average Household Size in Glens Falls
Average Household Size in Glens Falls is 2.2 People.
How Large is the Labor Force in Glens Falls?
There are 8,039 People in the Labor Forcein in Glens Falls.
What is the Percentage of People in the Labor Force in Glens Falls?
66.9% of People are in the Labor Force in Glens Falls.
What is the Unemployment Rate in Glens Falls?
Unemployment Rate in Glens Falls is 5.7%.