East Meadow, NY Map & Demographics
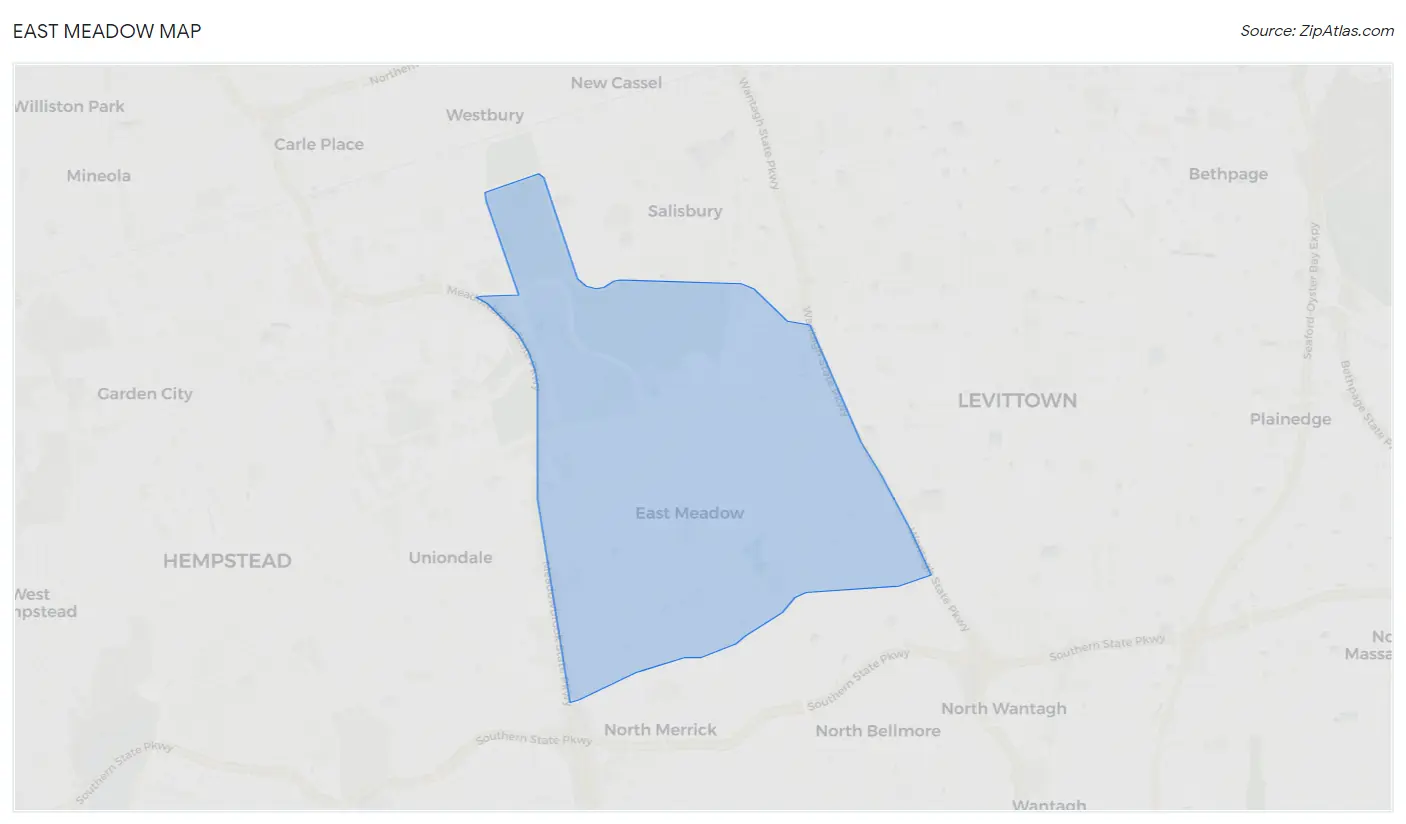
East Meadow Map
East Meadow Overview
$49,776
PER CAPITA INCOME
$149,719
AVG FAMILY INCOME
$129,268
AVG HOUSEHOLD INCOME
21.3%
WAGE / INCOME GAP [ % ]
78.7¢/ $1
WAGE / INCOME GAP [ $ ]
0.40
INEQUALITY / GINI INDEX
36,856
TOTAL POPULATION
17,028
MALE POPULATION
19,828
FEMALE POPULATION
85.88
MALES / 100 FEMALES
116.44
FEMALES / 100 MALES
42.3
MEDIAN AGE
3.5
AVG FAMILY SIZE
3.0
AVG HOUSEHOLD SIZE
17,664
LABOR FORCE [ PEOPLE ]
58.7%
PERCENT IN LABOR FORCE
3.4%
UNEMPLOYMENT RATE
East Meadow Zip Codes
East Meadow Area Codes
Income in East Meadow
Income Overview in East Meadow
Per Capita Income in East Meadow is $49,776, while median incomes of families and households are $149,719 and $129,268 respectively.
| Characteristic | Number | Measure |
| Per Capita Income | 36,856 | $49,776 |
| Median Family Income | 9,277 | $149,719 |
| Mean Family Income | 9,277 | $172,255 |
| Median Household Income | 11,716 | $129,268 |
| Mean Household Income | 11,716 | $152,771 |
| Income Deficit | 9,277 | $0 |
| Wage / Income Gap (%) | 36,856 | 21.32% |
| Wage / Income Gap ($) | 36,856 | 78.68¢ per $1 |
| Gini / Inequality Index | 36,856 | 0.40 |
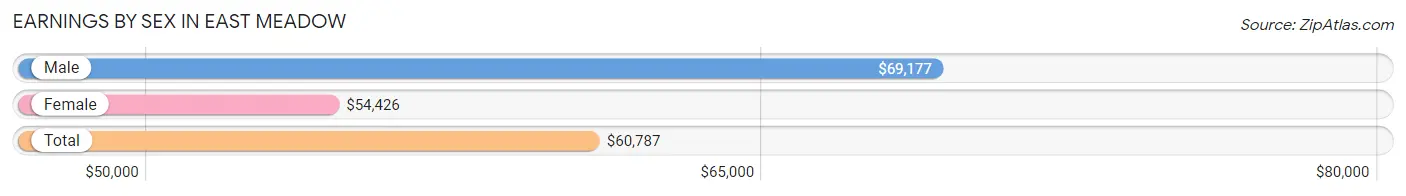
Earnings by Sex in East Meadow
Average Earnings in East Meadow are $60,787, $69,177 for men and $54,426 for women, a difference of 21.3%.
| Sex | Number | Average Earnings |
| Male | 9,627 (52.2%) | $69,177 |
| Female | 8,809 (47.8%) | $54,426 |
| Total | 18,436 (100.0%) | $60,787 |
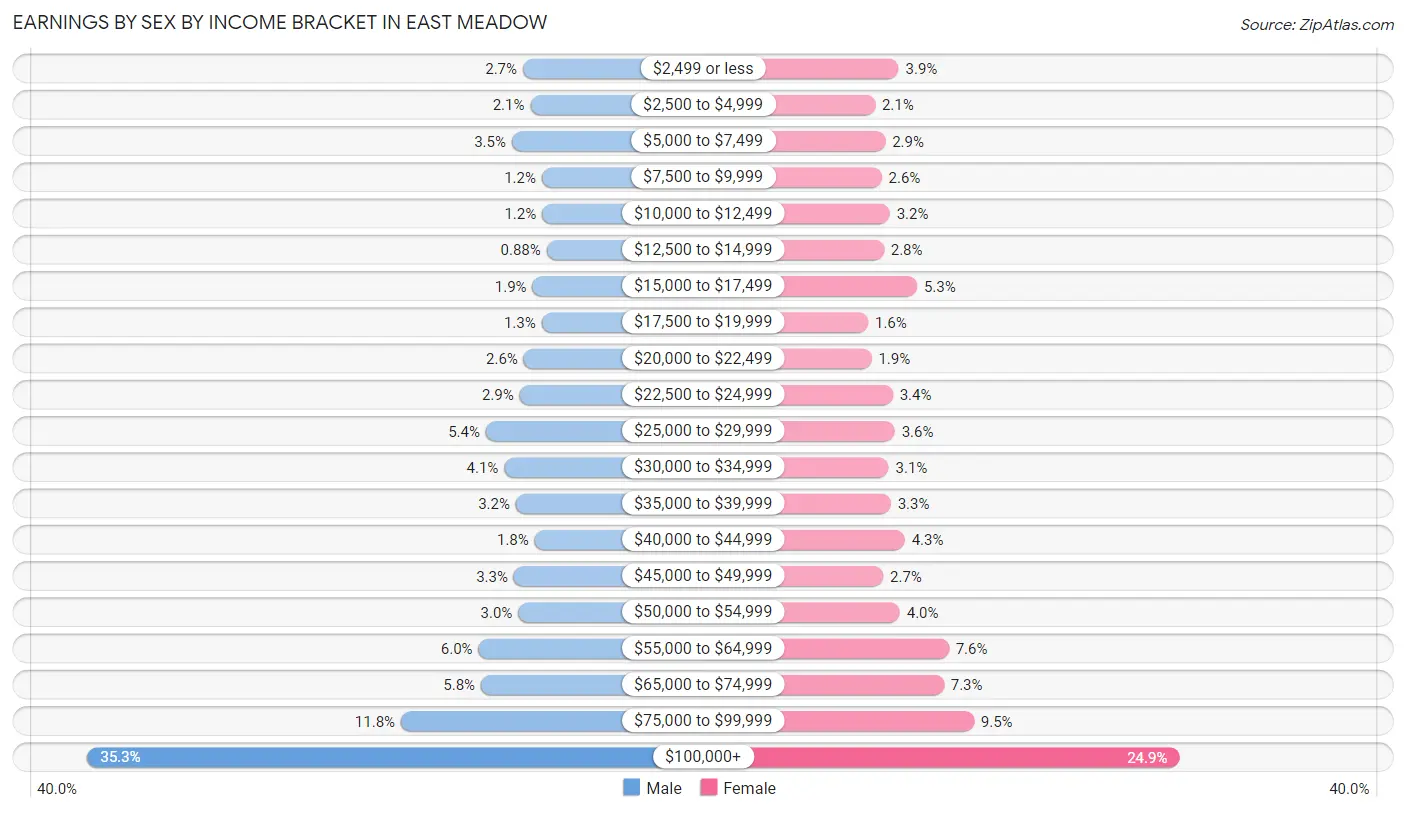
Earnings by Sex by Income Bracket in East Meadow
The most common earnings brackets in East Meadow are $100,000+ for men (3,398 | 35.3%) and $100,000+ for women (2,194 | 24.9%).
| Income | Male | Female |
| $2,499 or less | 256 (2.7%) | 342 (3.9%) |
| $2,500 to $4,999 | 202 (2.1%) | 186 (2.1%) |
| $5,000 to $7,499 | 336 (3.5%) | 254 (2.9%) |
| $7,500 to $9,999 | 119 (1.2%) | 230 (2.6%) |
| $10,000 to $12,499 | 117 (1.2%) | 284 (3.2%) |
| $12,500 to $14,999 | 85 (0.9%) | 244 (2.8%) |
| $15,000 to $17,499 | 187 (1.9%) | 463 (5.3%) |
| $17,500 to $19,999 | 121 (1.3%) | 140 (1.6%) |
| $20,000 to $22,499 | 250 (2.6%) | 163 (1.8%) |
| $22,500 to $24,999 | 280 (2.9%) | 303 (3.4%) |
| $25,000 to $29,999 | 524 (5.4%) | 316 (3.6%) |
| $30,000 to $34,999 | 391 (4.1%) | 276 (3.1%) |
| $35,000 to $39,999 | 307 (3.2%) | 290 (3.3%) |
| $40,000 to $44,999 | 171 (1.8%) | 382 (4.3%) |
| $45,000 to $49,999 | 322 (3.3%) | 240 (2.7%) |
| $50,000 to $54,999 | 290 (3.0%) | 350 (4.0%) |
| $55,000 to $64,999 | 577 (6.0%) | 673 (7.6%) |
| $65,000 to $74,999 | 558 (5.8%) | 640 (7.3%) |
| $75,000 to $99,999 | 1,136 (11.8%) | 839 (9.5%) |
| $100,000+ | 3,398 (35.3%) | 2,194 (24.9%) |
| Total | 9,627 (100.0%) | 8,809 (100.0%) |
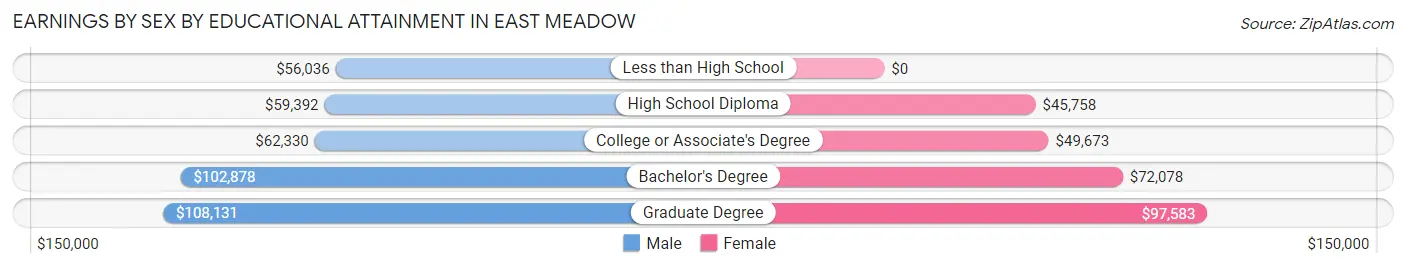
Earnings by Sex by Educational Attainment in East Meadow
Average earnings in East Meadow are $80,865 for men and $62,817 for women, a difference of 22.3%. Men with an educational attainment of graduate degree enjoy the highest average annual earnings of $108,131, while those with less than high school education earn the least with $56,036. Women with an educational attainment of graduate degree earn the most with the average annual earnings of $97,583, while those with high school diploma education have the smallest earnings of $45,758.
| Educational Attainment | Male Income | Female Income |
| Less than High School | $56,036 | $0 |
| High School Diploma | $59,392 | $45,758 |
| College or Associate's Degree | $62,330 | $49,673 |
| Bachelor's Degree | $102,878 | $72,078 |
| Graduate Degree | $108,131 | $97,583 |
| Total | $80,865 | $62,817 |
Family Income in East Meadow
Family Income Brackets in East Meadow
According to the East Meadow family income data, there are 3,126 families falling into the $200,000+ income range, which is the most common income bracket and makes up 33.7% of all families. Conversely, the $15,000 to $24,999 income bracket is the least frequent group with only 37 families (0.4%) belonging to this category.
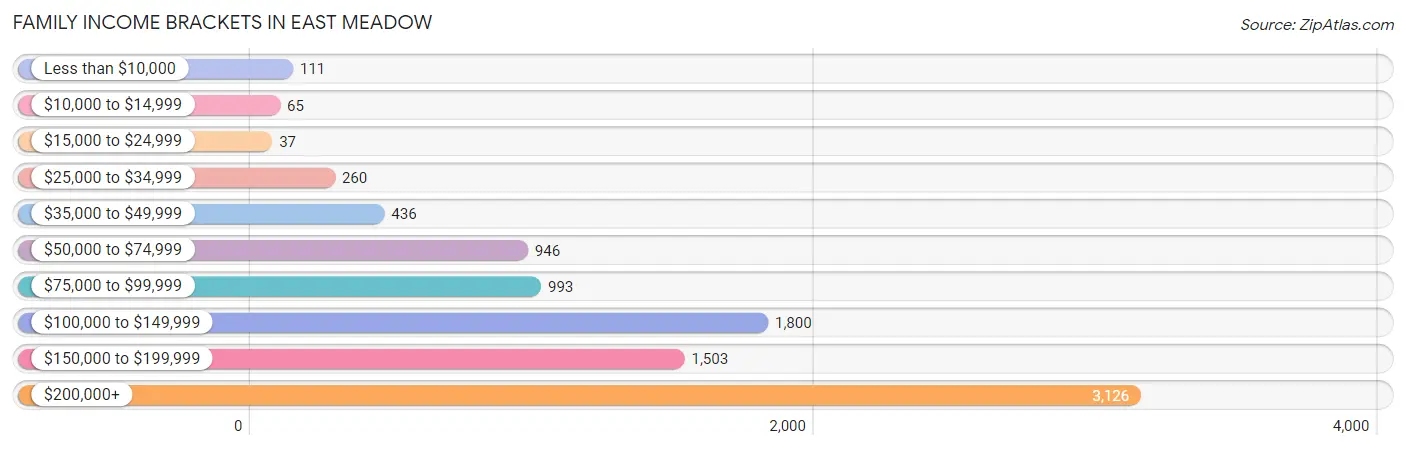
| Income Bracket | # Families | % Families |
| Less than $10,000 | 111 | 1.2% |
| $10,000 to $14,999 | 65 | 0.7% |
| $15,000 to $24,999 | 37 | 0.4% |
| $25,000 to $34,999 | 260 | 2.8% |
| $35,000 to $49,999 | 436 | 4.7% |
| $50,000 to $74,999 | 946 | 10.2% |
| $75,000 to $99,999 | 993 | 10.7% |
| $100,000 to $149,999 | 1,800 | 19.4% |
| $150,000 to $199,999 | 1,503 | 16.2% |
| $200,000+ | 3,126 | 33.7% |
Family Income by Famaliy Size in East Meadow
5-person families (1,201 | 13.0%) account for the highest median family income in East Meadow with $223,681 per family, while 3-person families (2,149 | 23.2%) have the highest median income of $53,944 per family member.
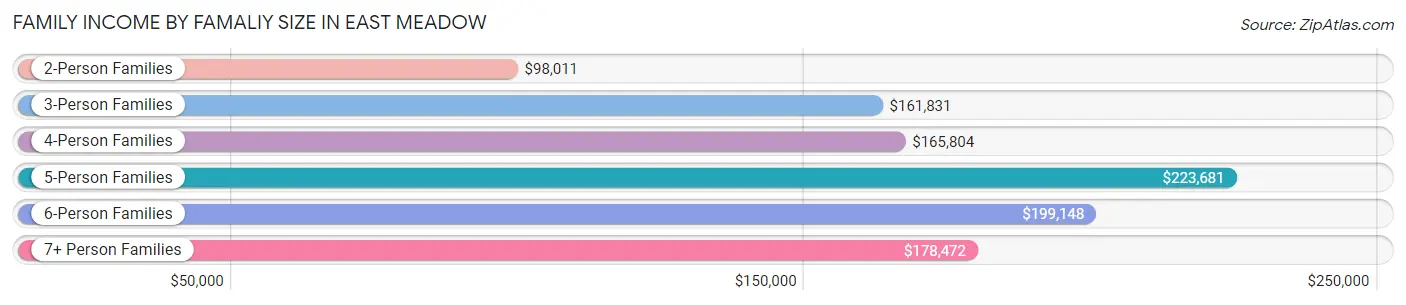
| Income Bracket | # Families | Median Income |
| 2-Person Families | 3,291 (35.5%) | $98,011 |
| 3-Person Families | 2,149 (23.2%) | $161,831 |
| 4-Person Families | 2,038 (22.0%) | $165,804 |
| 5-Person Families | 1,201 (13.0%) | $223,681 |
| 6-Person Families | 405 (4.4%) | $199,148 |
| 7+ Person Families | 193 (2.1%) | $178,472 |
| Total | 9,277 (100.0%) | $149,719 |
Family Income by Number of Earners in East Meadow
The median family income in East Meadow is $149,719, with families comprising 3+ earners (1,778) having the highest median family income of $239,362, while families with no earners (1,259) have the lowest median family income of $59,408, accounting for 19.2% and 13.6% of families, respectively.
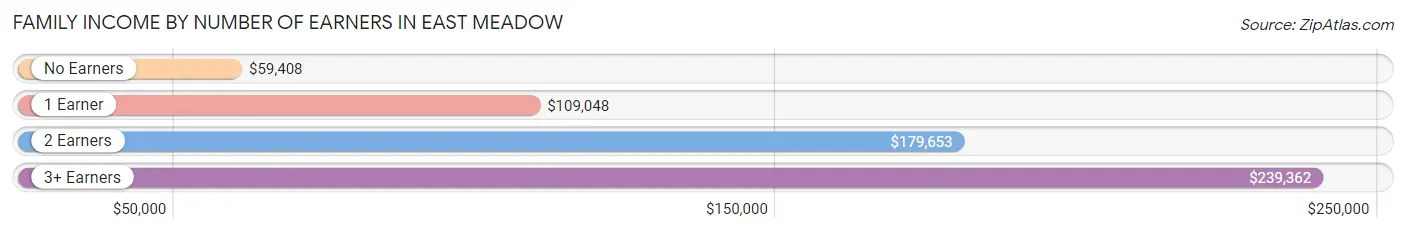
| Number of Earners | # Families | Median Income |
| No Earners | 1,259 (13.6%) | $59,408 |
| 1 Earner | 2,440 (26.3%) | $109,048 |
| 2 Earners | 3,800 (41.0%) | $179,653 |
| 3+ Earners | 1,778 (19.2%) | $239,362 |
| Total | 9,277 (100.0%) | $149,719 |
Household Income in East Meadow
Household Income Brackets in East Meadow
With 3,327 households falling in the category, the $200,000+ income range is the most frequent in East Meadow, accounting for 28.4% of all households. In contrast, only 141 households (1.2%) fall into the $10,000 to $14,999 income bracket, making it the least populous group.
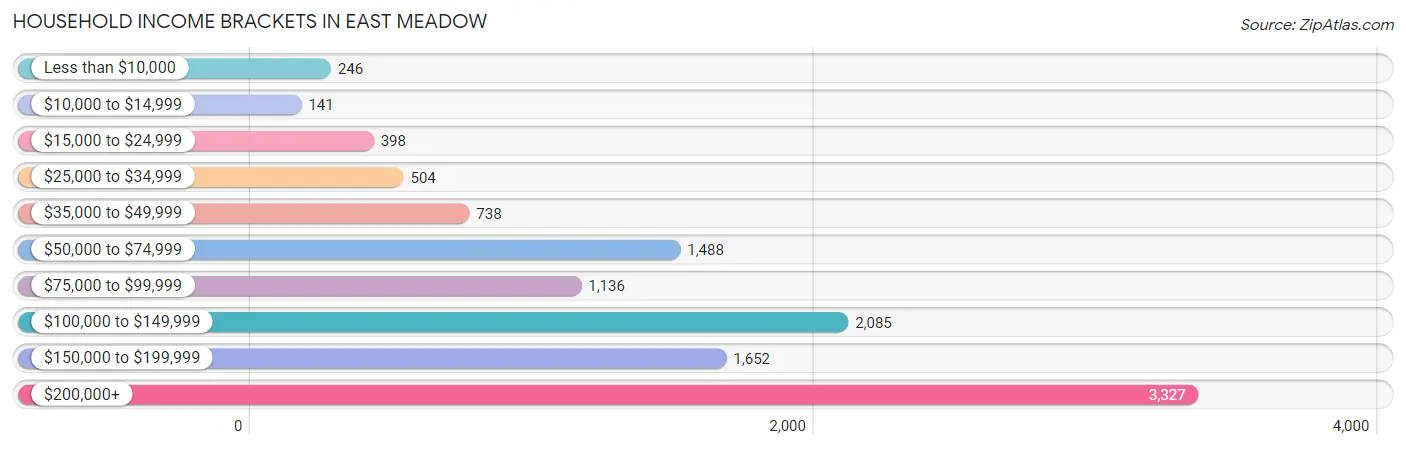
| Income Bracket | # Households | % Households |
| Less than $10,000 | 246 | 2.1% |
| $10,000 to $14,999 | 141 | 1.2% |
| $15,000 to $24,999 | 398 | 3.4% |
| $25,000 to $34,999 | 504 | 4.3% |
| $35,000 to $49,999 | 738 | 6.3% |
| $50,000 to $74,999 | 1,488 | 12.7% |
| $75,000 to $99,999 | 1,136 | 9.7% |
| $100,000 to $149,999 | 2,085 | 17.8% |
| $150,000 to $199,999 | 1,652 | 14.1% |
| $200,000+ | 3,327 | 28.4% |
Household Income by Householder Age in East Meadow
The median household income in East Meadow is $129,268, with the highest median household income of $173,288 found in the 45 to 64 years age bracket for the primary householder. A total of 4,663 households (39.8%) fall into this category. Meanwhile, the 15 to 24 years age bracket for the primary householder has the lowest median household income of $61,188, with 140 households (1.2%) in this group.
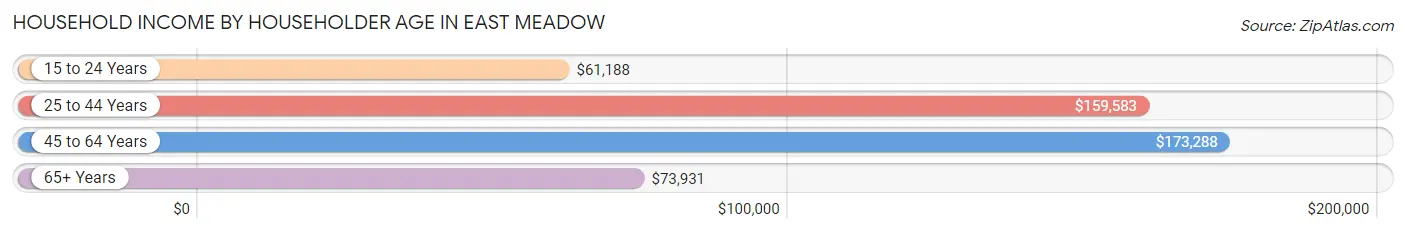
| Income Bracket | # Households | Median Income |
| 15 to 24 Years | 140 (1.2%) | $61,188 |
| 25 to 44 Years | 2,590 (22.1%) | $159,583 |
| 45 to 64 Years | 4,663 (39.8%) | $173,288 |
| 65+ Years | 4,323 (36.9%) | $73,931 |
| Total | 11,716 (100.0%) | $129,268 |
Poverty in East Meadow
Income Below Poverty by Sex and Age in East Meadow
With 3.7% poverty level for males and 7.7% for females among the residents of East Meadow, 12 to 14 year old males and 18 to 24 year old females are the most vulnerable to poverty, with 91 males (20.0%) and 334 females (19.7%) in their respective age groups living below the poverty level.
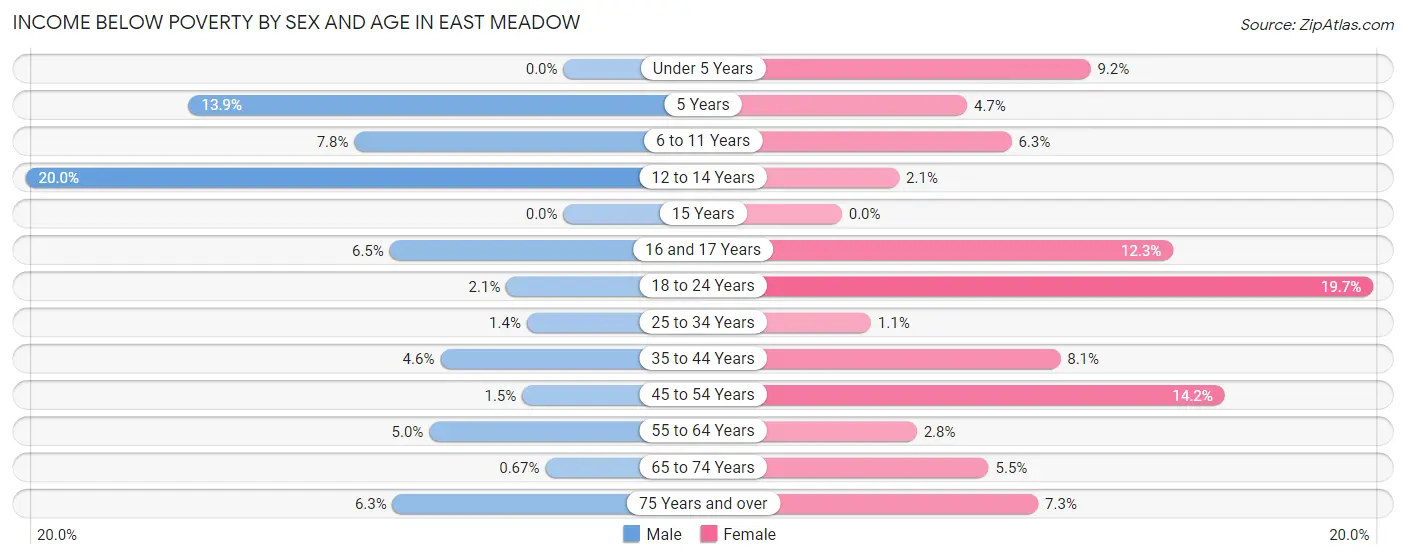
| Age Bracket | Male | Female |
| Under 5 Years | 0 (0.0%) | 93 (9.2%) |
| 5 Years | 16 (13.9%) | 14 (4.6%) |
| 6 to 11 Years | 73 (7.8%) | 90 (6.3%) |
| 12 to 14 Years | 91 (20.0%) | 20 (2.1%) |
| 15 Years | 0 (0.0%) | 0 (0.0%) |
| 16 and 17 Years | 32 (6.5%) | 38 (12.3%) |
| 18 to 24 Years | 28 (2.1%) | 334 (19.7%) |
| 25 to 34 Years | 25 (1.4%) | 23 (1.1%) |
| 35 to 44 Years | 99 (4.6%) | 169 (8.1%) |
| 45 to 54 Years | 30 (1.5%) | 371 (14.2%) |
| 55 to 64 Years | 97 (5.0%) | 75 (2.8%) |
| 65 to 74 Years | 15 (0.7%) | 105 (5.4%) |
| 75 Years and over | 89 (6.3%) | 166 (7.3%) |
| Total | 595 (3.7%) | 1,498 (7.7%) |
Income Above Poverty by Sex and Age in East Meadow
According to the poverty statistics in East Meadow, males aged under 5 years and females aged 15 years are the age groups that are most secure financially, with 100.0% of males and 100.0% of females in these age groups living above the poverty line.
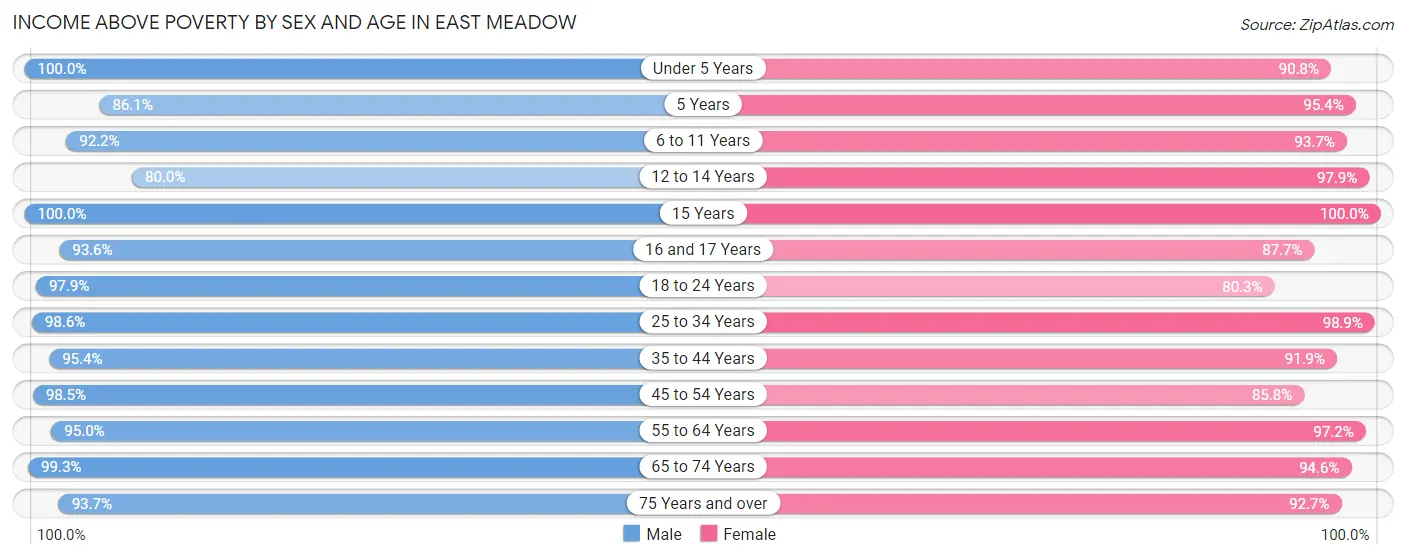
| Age Bracket | Male | Female |
| Under 5 Years | 1,121 (100.0%) | 915 (90.8%) |
| 5 Years | 99 (86.1%) | 287 (95.4%) |
| 6 to 11 Years | 868 (92.2%) | 1,339 (93.7%) |
| 12 to 14 Years | 365 (80.0%) | 920 (97.9%) |
| 15 Years | 203 (100.0%) | 138 (100.0%) |
| 16 and 17 Years | 464 (93.5%) | 271 (87.7%) |
| 18 to 24 Years | 1,292 (97.9%) | 1,360 (80.3%) |
| 25 to 34 Years | 1,810 (98.6%) | 2,116 (98.9%) |
| 35 to 44 Years | 2,066 (95.4%) | 1,915 (91.9%) |
| 45 to 54 Years | 1,933 (98.5%) | 2,239 (85.8%) |
| 55 to 64 Years | 1,851 (95.0%) | 2,618 (97.2%) |
| 65 to 74 Years | 2,210 (99.3%) | 1,822 (94.6%) |
| 75 Years and over | 1,314 (93.7%) | 2,110 (92.7%) |
| Total | 15,596 (96.3%) | 18,050 (92.3%) |
Income Below Poverty Among Married-Couple Families in East Meadow
The poverty statistics for married-couple families in East Meadow show that 2.1% or 153 of the total 7,354 families live below the poverty line. Families with 3 or 4 children have the highest poverty rate of 3.5%, comprising of 23 families. On the other hand, families with 5 or more children have the lowest poverty rate of 0.0%, which includes 0 families.
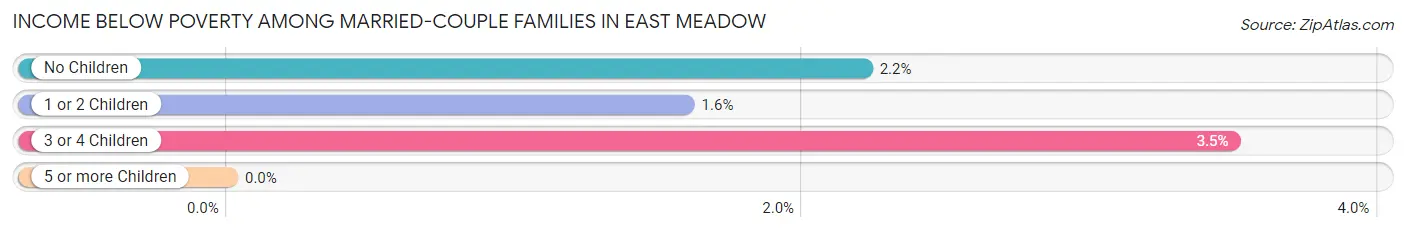
| Children | Above Poverty | Below Poverty |
| No Children | 3,762 (97.8%) | 85 (2.2%) |
| 1 or 2 Children | 2,791 (98.4%) | 45 (1.6%) |
| 3 or 4 Children | 636 (96.5%) | 23 (3.5%) |
| 5 or more Children | 12 (100.0%) | 0 (0.0%) |
| Total | 7,201 (97.9%) | 153 (2.1%) |
Income Below Poverty Among Single-Parent Households in East Meadow
According to the poverty data in East Meadow, 4.0% or 17 single-father households and 6.3% or 94 single-mother households are living below the poverty line. Among single-father households, those with 1 or 2 children have the highest poverty rate, with 17 households (18.9%) experiencing poverty. Likewise, among single-mother households, those with 3 or 4 children have the highest poverty rate, with 80 households (72.1%) falling below the poverty line.
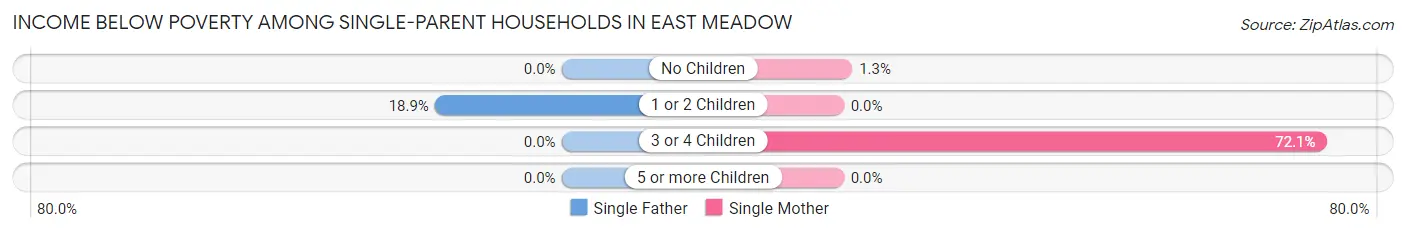
| Children | Single Father | Single Mother |
| No Children | 0 (0.0%) | 14 (1.3%) |
| 1 or 2 Children | 17 (18.9%) | 0 (0.0%) |
| 3 or 4 Children | 0 (0.0%) | 80 (72.1%) |
| 5 or more Children | 0 (0.0%) | 0 (0.0%) |
| Total | 17 (4.0%) | 94 (6.3%) |
Income Below Poverty Among Married-Couple vs Single-Parent Households in East Meadow
The poverty data for East Meadow shows that 153 of the married-couple family households (2.1%) and 111 of the single-parent households (5.8%) are living below the poverty level. Within the married-couple family households, those with 3 or 4 children have the highest poverty rate, with 23 households (3.5%) falling below the poverty line. Among the single-parent households, those with 3 or 4 children have the highest poverty rate, with 80 household (67.2%) living below poverty.
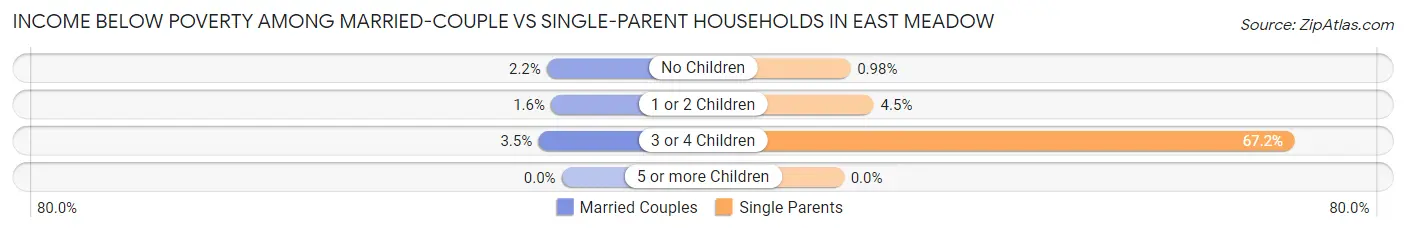
| Children | Married-Couple Families | Single-Parent Households |
| No Children | 85 (2.2%) | 14 (1.0%) |
| 1 or 2 Children | 45 (1.6%) | 17 (4.5%) |
| 3 or 4 Children | 23 (3.5%) | 80 (67.2%) |
| 5 or more Children | 0 (0.0%) | 0 (0.0%) |
| Total | 153 (2.1%) | 111 (5.8%) |
Race in East Meadow
The most populous races in East Meadow are White / Caucasian (24,364 | 66.1%), Asian (6,617 | 17.9%), and Hispanic or Latino (4,906 | 13.3%).
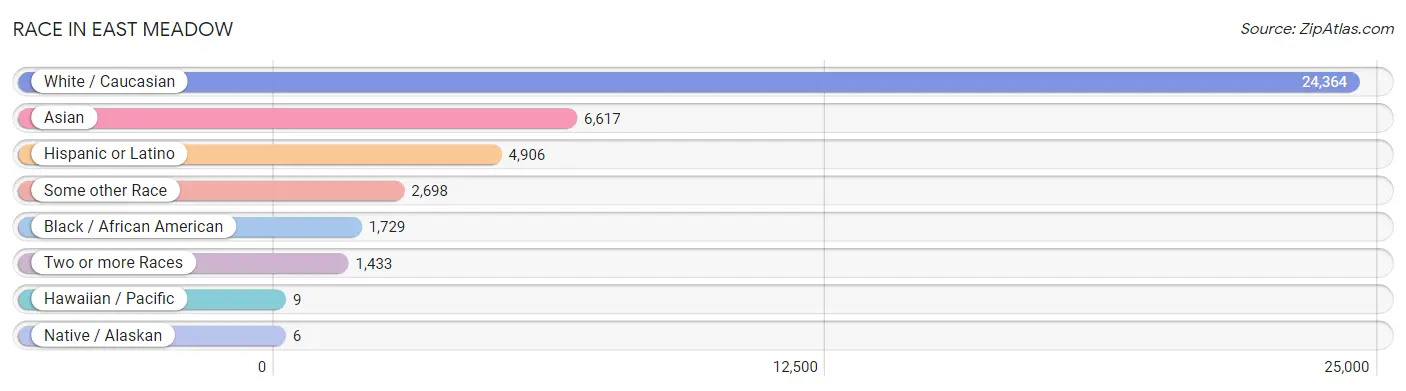
| Race | # Population | % Population |
| Asian | 6,617 | 17.9% |
| Black / African American | 1,729 | 4.7% |
| Hawaiian / Pacific | 9 | 0.0% |
| Hispanic or Latino | 4,906 | 13.3% |
| Native / Alaskan | 6 | 0.0% |
| White / Caucasian | 24,364 | 66.1% |
| Two or more Races | 1,433 | 3.9% |
| Some other Race | 2,698 | 7.3% |
| Total | 36,856 | 100.0% |
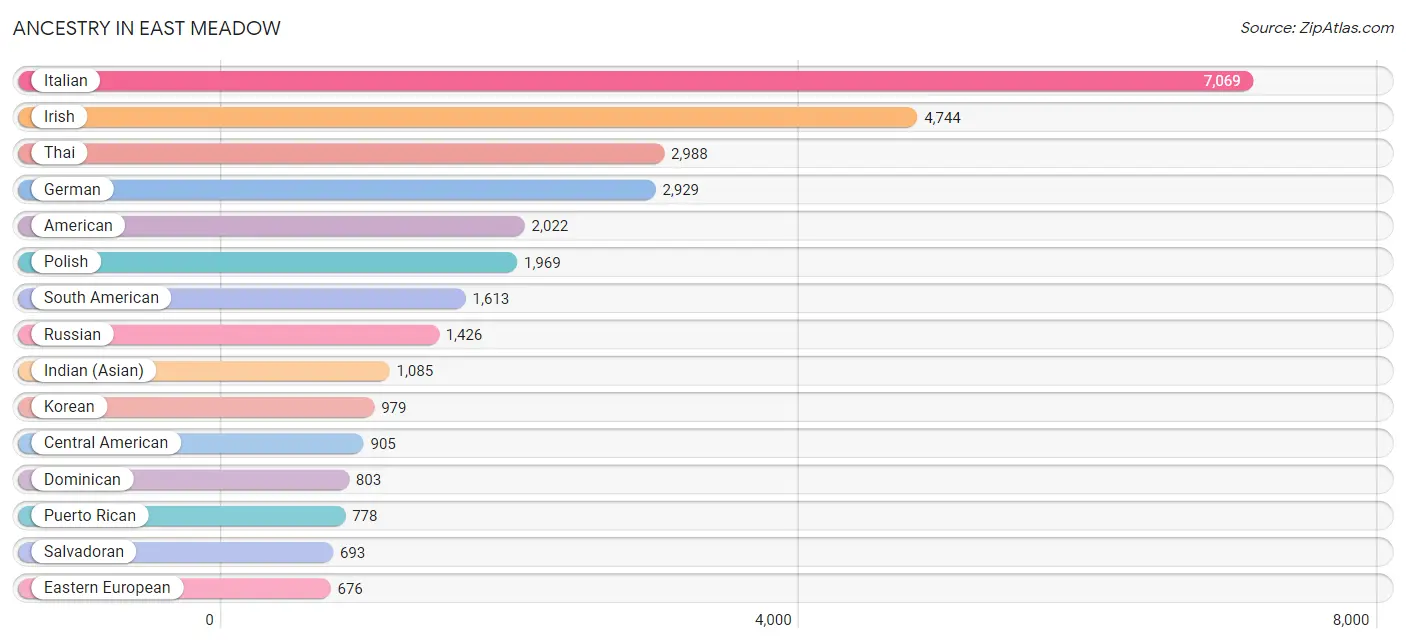
Ancestry in East Meadow
The most populous ancestries reported in East Meadow are Italian (7,069 | 19.2%), Irish (4,744 | 12.9%), Thai (2,988 | 8.1%), German (2,929 | 8.0%), and American (2,022 | 5.5%), together accounting for 53.6% of all East Meadow residents.
| Ancestry | # Population | % Population |
| Afghan | 27 | 0.1% |
| African | 3 | 0.0% |
| Albanian | 8 | 0.0% |
| American | 2,022 | 5.5% |
| Arab | 54 | 0.2% |
| Argentinean | 16 | 0.0% |
| Armenian | 227 | 0.6% |
| Austrian | 299 | 0.8% |
| Barbadian | 117 | 0.3% |
| Belizean | 43 | 0.1% |
| Bhutanese | 18 | 0.1% |
| Brazilian | 70 | 0.2% |
| British | 35 | 0.1% |
| Burmese | 383 | 1.0% |
| Canadian | 5 | 0.0% |
| Central American | 905 | 2.5% |
| Central American Indian | 22 | 0.1% |
| Chilean | 61 | 0.2% |
| Colombian | 513 | 1.4% |
| Croatian | 69 | 0.2% |
| Cuban | 137 | 0.4% |
| Cypriot | 131 | 0.4% |
| Czechoslovakian | 26 | 0.1% |
| Danish | 13 | 0.0% |
| Dominican | 803 | 2.2% |
| Dutch | 44 | 0.1% |
| Eastern European | 676 | 1.8% |
| Ecuadorian | 647 | 1.8% |
| Egyptian | 10 | 0.0% |
| English | 572 | 1.5% |
| Ethiopian | 45 | 0.1% |
| European | 355 | 1.0% |
| Finnish | 30 | 0.1% |
| French | 202 | 0.5% |
| French American Indian | 6 | 0.0% |
| French Canadian | 31 | 0.1% |
| German | 2,929 | 8.0% |
| Greek | 543 | 1.5% |
| Guatemalan | 158 | 0.4% |
| Guyanese | 167 | 0.4% |
| Haitian | 179 | 0.5% |
| Honduran | 54 | 0.2% |
| Hungarian | 178 | 0.5% |
| Indian (Asian) | 1,085 | 2.9% |
| Iranian | 5 | 0.0% |
| Irish | 4,744 | 12.9% |
| Iroquois | 154 | 0.4% |
| Israeli | 38 | 0.1% |
| Italian | 7,069 | 19.2% |
| Jamaican | 43 | 0.1% |
| Jordanian | 13 | 0.0% |
| Korean | 979 | 2.7% |
| Lebanese | 23 | 0.1% |
| Lithuanian | 192 | 0.5% |
| Mexican | 327 | 0.9% |
| Native Hawaiian | 9 | 0.0% |
| Nigerian | 333 | 0.9% |
| Northern European | 7 | 0.0% |
| Norwegian | 72 | 0.2% |
| Pakistani | 8 | 0.0% |
| Peruvian | 376 | 1.0% |
| Polish | 1,969 | 5.3% |
| Portuguese | 512 | 1.4% |
| Puerto Rican | 778 | 2.1% |
| Romanian | 181 | 0.5% |
| Russian | 1,426 | 3.9% |
| Salvadoran | 693 | 1.9% |
| Scandinavian | 4 | 0.0% |
| Scotch-Irish | 16 | 0.0% |
| Scottish | 252 | 0.7% |
| Shoshone | 31 | 0.1% |
| Slovene | 72 | 0.2% |
| South American | 1,613 | 4.4% |
| South American Indian | 31 | 0.1% |
| Spaniard | 123 | 0.3% |
| Spanish | 30 | 0.1% |
| Sri Lankan | 83 | 0.2% |
| Subsaharan African | 381 | 1.0% |
| Swedish | 115 | 0.3% |
| Swiss | 5 | 0.0% |
| Thai | 2,988 | 8.1% |
| Trinidadian and Tobagonian | 64 | 0.2% |
| Ukrainian | 115 | 0.3% |
| Vietnamese | 80 | 0.2% |
| West Indian | 65 | 0.2% |
| Yugoslavian | 14 | 0.0% | View All 86 Rows |
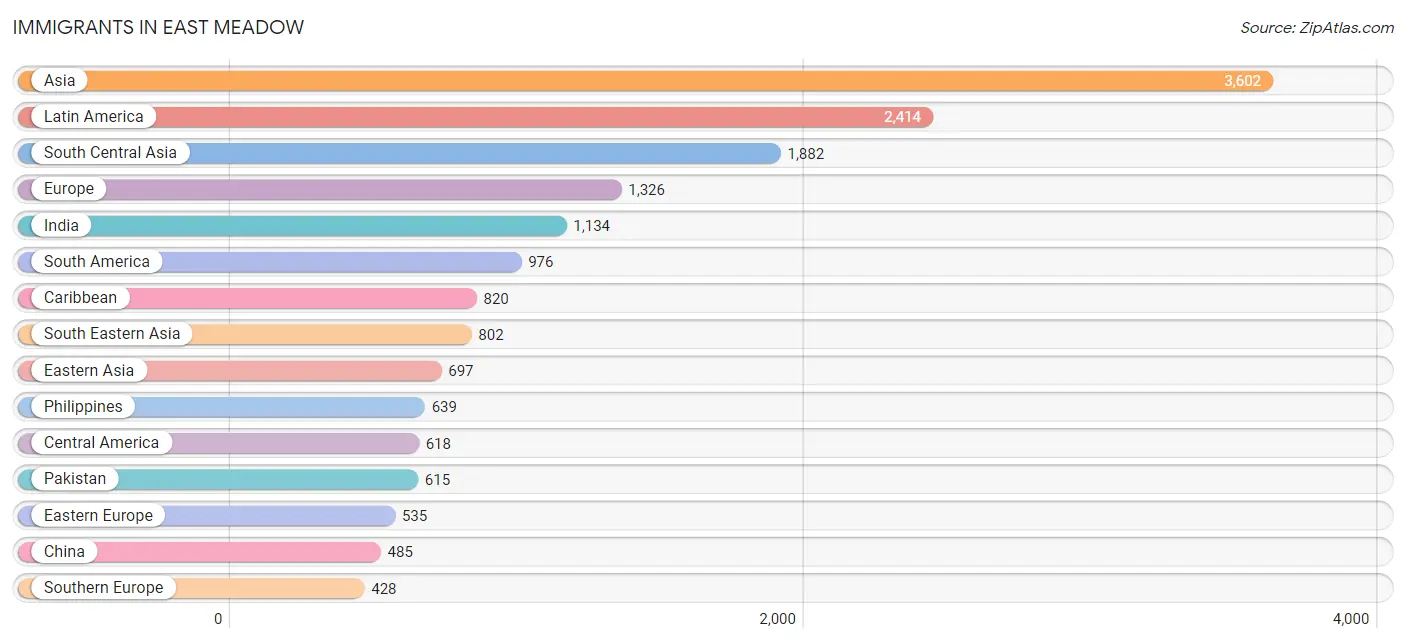
Immigrants in East Meadow
The most numerous immigrant groups reported in East Meadow came from Asia (3,602 | 9.8%), Latin America (2,414 | 6.6%), South Central Asia (1,882 | 5.1%), Europe (1,326 | 3.6%), and India (1,134 | 3.1%), together accounting for 28.1% of all East Meadow residents.
| Immigration Origin | # Population | % Population |
| Afghanistan | 27 | 0.1% |
| Africa | 172 | 0.5% |
| Albania | 5 | 0.0% |
| Asia | 3,602 | 9.8% |
| Bangladesh | 101 | 0.3% |
| Barbados | 62 | 0.2% |
| Belize | 17 | 0.1% |
| Brazil | 34 | 0.1% |
| Canada | 41 | 0.1% |
| Caribbean | 820 | 2.2% |
| Central America | 618 | 1.7% |
| Chile | 13 | 0.0% |
| China | 485 | 1.3% |
| Colombia | 215 | 0.6% |
| Croatia | 28 | 0.1% |
| Dominican Republic | 304 | 0.8% |
| Eastern Africa | 45 | 0.1% |
| Eastern Asia | 697 | 1.9% |
| Eastern Europe | 535 | 1.5% |
| Ecuador | 299 | 0.8% |
| Egypt | 10 | 0.0% |
| El Salvador | 410 | 1.1% |
| England | 24 | 0.1% |
| Ethiopia | 45 | 0.1% |
| Europe | 1,326 | 3.6% |
| France | 22 | 0.1% |
| Germany | 106 | 0.3% |
| Greece | 113 | 0.3% |
| Guatemala | 115 | 0.3% |
| Guyana | 333 | 0.9% |
| Haiti | 229 | 0.6% |
| Honduras | 64 | 0.2% |
| Hong Kong | 55 | 0.2% |
| Hungary | 11 | 0.0% |
| India | 1,134 | 3.1% |
| Indonesia | 66 | 0.2% |
| Iran | 5 | 0.0% |
| Ireland | 166 | 0.4% |
| Italy | 113 | 0.3% |
| Jamaica | 96 | 0.3% |
| Jordan | 27 | 0.1% |
| Korea | 212 | 0.6% |
| Kuwait | 13 | 0.0% |
| Latin America | 2,414 | 6.6% |
| Mexico | 12 | 0.0% |
| Nigeria | 100 | 0.3% |
| Northern Africa | 27 | 0.1% |
| Northern Europe | 235 | 0.6% |
| Pakistan | 615 | 1.7% |
| Peru | 82 | 0.2% |
| Philippines | 639 | 1.7% |
| Poland | 369 | 1.0% |
| Portugal | 161 | 0.4% |
| Romania | 14 | 0.0% |
| Russia | 69 | 0.2% |
| South America | 976 | 2.6% |
| South Central Asia | 1,882 | 5.1% |
| South Eastern Asia | 802 | 2.2% |
| Southern Europe | 428 | 1.2% |
| Spain | 41 | 0.1% |
| Taiwan | 26 | 0.1% |
| Thailand | 8 | 0.0% |
| Trinidad and Tobago | 129 | 0.4% |
| Turkey | 69 | 0.2% |
| Ukraine | 39 | 0.1% |
| Vietnam | 89 | 0.2% |
| Western Africa | 100 | 0.3% |
| Western Asia | 221 | 0.6% |
| Western Europe | 128 | 0.4% | View All 69 Rows |
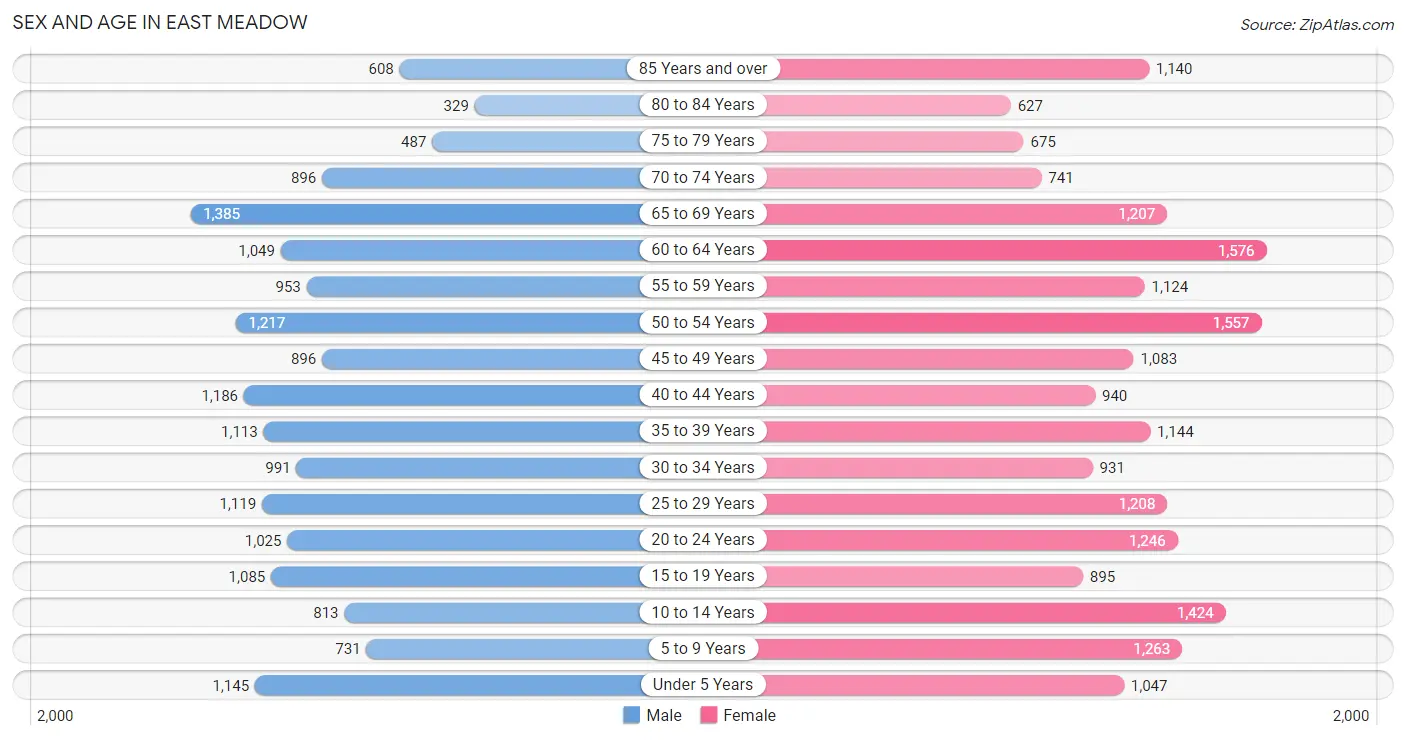
Sex and Age in East Meadow
Sex and Age in East Meadow
The most populous age groups in East Meadow are 65 to 69 Years (1,385 | 8.1%) for men and 60 to 64 Years (1,576 | 8.0%) for women.
| Age Bracket | Male | Female |
| Under 5 Years | 1,145 (6.7%) | 1,047 (5.3%) |
| 5 to 9 Years | 731 (4.3%) | 1,263 (6.4%) |
| 10 to 14 Years | 813 (4.8%) | 1,424 (7.2%) |
| 15 to 19 Years | 1,085 (6.4%) | 895 (4.5%) |
| 20 to 24 Years | 1,025 (6.0%) | 1,246 (6.3%) |
| 25 to 29 Years | 1,119 (6.6%) | 1,208 (6.1%) |
| 30 to 34 Years | 991 (5.8%) | 931 (4.7%) |
| 35 to 39 Years | 1,113 (6.5%) | 1,144 (5.8%) |
| 40 to 44 Years | 1,186 (7.0%) | 940 (4.7%) |
| 45 to 49 Years | 896 (5.3%) | 1,083 (5.5%) |
| 50 to 54 Years | 1,217 (7.1%) | 1,557 (7.9%) |
| 55 to 59 Years | 953 (5.6%) | 1,124 (5.7%) |
| 60 to 64 Years | 1,049 (6.2%) | 1,576 (8.0%) |
| 65 to 69 Years | 1,385 (8.1%) | 1,207 (6.1%) |
| 70 to 74 Years | 896 (5.3%) | 741 (3.7%) |
| 75 to 79 Years | 487 (2.9%) | 675 (3.4%) |
| 80 to 84 Years | 329 (1.9%) | 627 (3.2%) |
| 85 Years and over | 608 (3.6%) | 1,140 (5.8%) |
| Total | 17,028 (100.0%) | 19,828 (100.0%) |
Families and Households in East Meadow
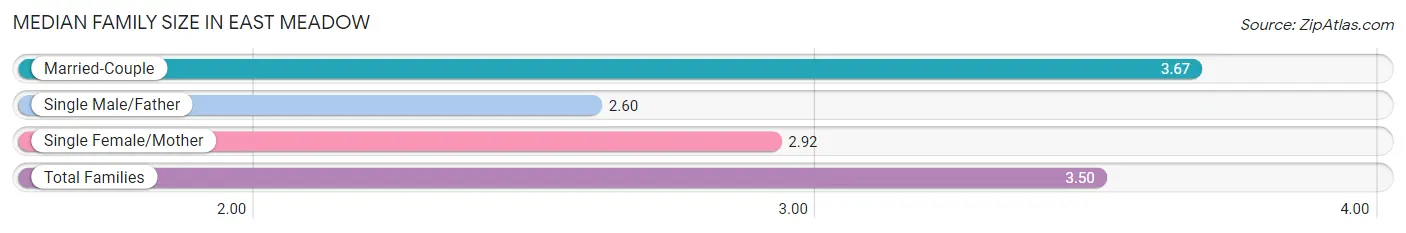
Median Family Size in East Meadow
The median family size in East Meadow is 3.50 persons per family, with married-couple families (7,354 | 79.3%) accounting for the largest median family size of 3.67 persons per family. On the other hand, single male/father families (421 | 4.5%) represent the smallest median family size with 2.60 persons per family.
| Family Type | # Families | Family Size |
| Married-Couple | 7,354 (79.3%) | 3.67 |
| Single Male/Father | 421 (4.5%) | 2.60 |
| Single Female/Mother | 1,502 (16.2%) | 2.92 |
| Total Families | 9,277 (100.0%) | 3.50 |
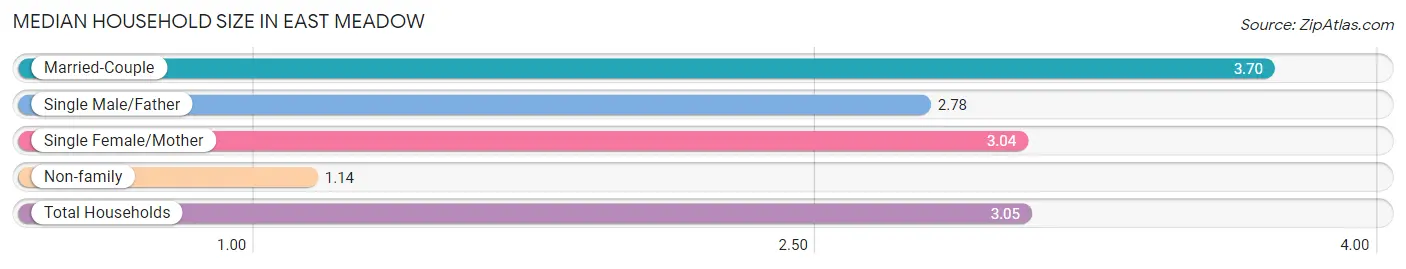
Median Household Size in East Meadow
The median household size in East Meadow is 3.05 persons per household, with married-couple households (7,354 | 62.8%) accounting for the largest median household size of 3.7 persons per household. non-family households (2,439 | 20.8%) represent the smallest median household size with 1.14 persons per household.
| Household Type | # Households | Household Size |
| Married-Couple | 7,354 (62.8%) | 3.70 |
| Single Male/Father | 421 (3.6%) | 2.78 |
| Single Female/Mother | 1,502 (12.8%) | 3.04 |
| Non-family | 2,439 (20.8%) | 1.14 |
| Total Households | 11,716 (100.0%) | 3.05 |
Household Size by Marriage Status in East Meadow
Out of a total of 11,716 households in East Meadow, 9,277 (79.2%) are family households, while 2,439 (20.8%) are nonfamily households. The most numerous type of family households are 2-person households, comprising 3,172, and the most common type of nonfamily households are 1-person households, comprising 2,232.
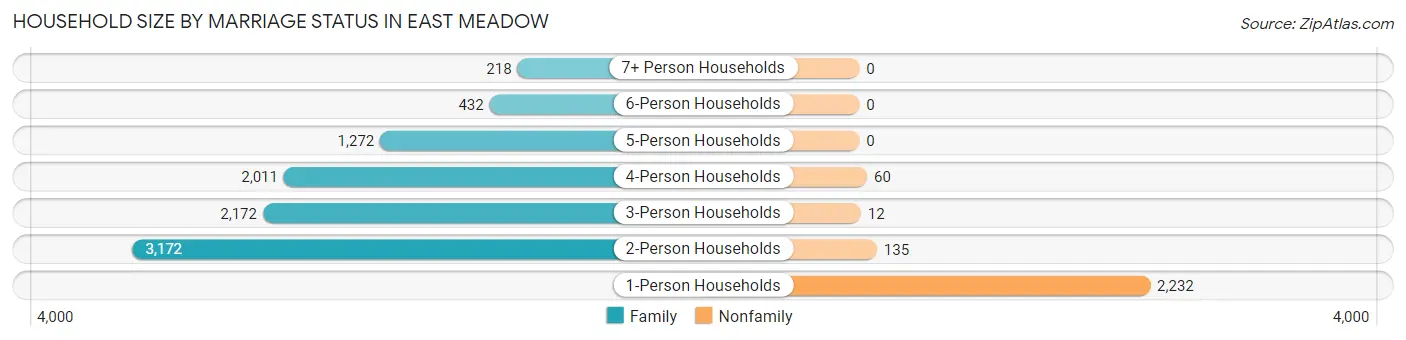
| Household Size | Family Households | Nonfamily Households |
| 1-Person Households | - | 2,232 (19.1%) |
| 2-Person Households | 3,172 (27.1%) | 135 (1.1%) |
| 3-Person Households | 2,172 (18.5%) | 12 (0.1%) |
| 4-Person Households | 2,011 (17.2%) | 60 (0.5%) |
| 5-Person Households | 1,272 (10.9%) | 0 (0.0%) |
| 6-Person Households | 432 (3.7%) | 0 (0.0%) |
| 7+ Person Households | 218 (1.9%) | 0 (0.0%) |
| Total | 9,277 (79.2%) | 2,439 (20.8%) |
Female Fertility in East Meadow
Fertility by Age in East Meadow
Average fertility rate in East Meadow is 50.0 births per 1,000 women. Women in the age bracket of 20 to 34 years have the highest fertility rate with 74.0 births per 1,000 women. Women in the age bracket of 20 to 34 years acount for 65.5% of all women with births.
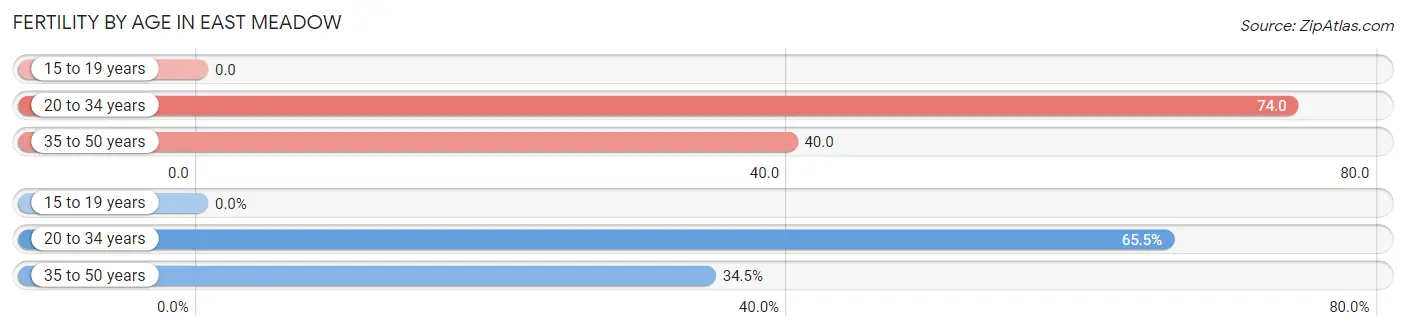
| Age Bracket | Women with Births | Births / 1,000 Women |
| 15 to 19 years | 0 (0.0%) | 0.0 |
| 20 to 34 years | 251 (65.5%) | 74.0 |
| 35 to 50 years | 132 (34.5%) | 40.0 |
| Total | 383 (100.0%) | 50.0 |
Fertility by Age by Marriage Status in East Meadow
92.4% of women with births (383) in East Meadow are married. The highest percentage of unmarried women with births falls into 35 to 50 years age bracket with 22.0% of them unmarried at the time of birth, while the lowest percentage of unmarried women with births belong to 20 to 34 years age bracket with 0.0% of them unmarried.
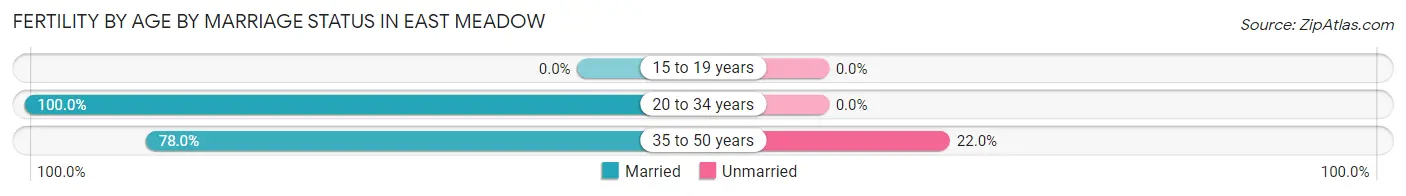
| Age Bracket | Married | Unmarried |
| 15 to 19 years | 0 (0.0%) | 0 (0.0%) |
| 20 to 34 years | 251 (100.0%) | 0 (0.0%) |
| 35 to 50 years | 103 (78.0%) | 29 (22.0%) |
| Total | 354 (92.4%) | 29 (7.6%) |
Fertility by Education in East Meadow
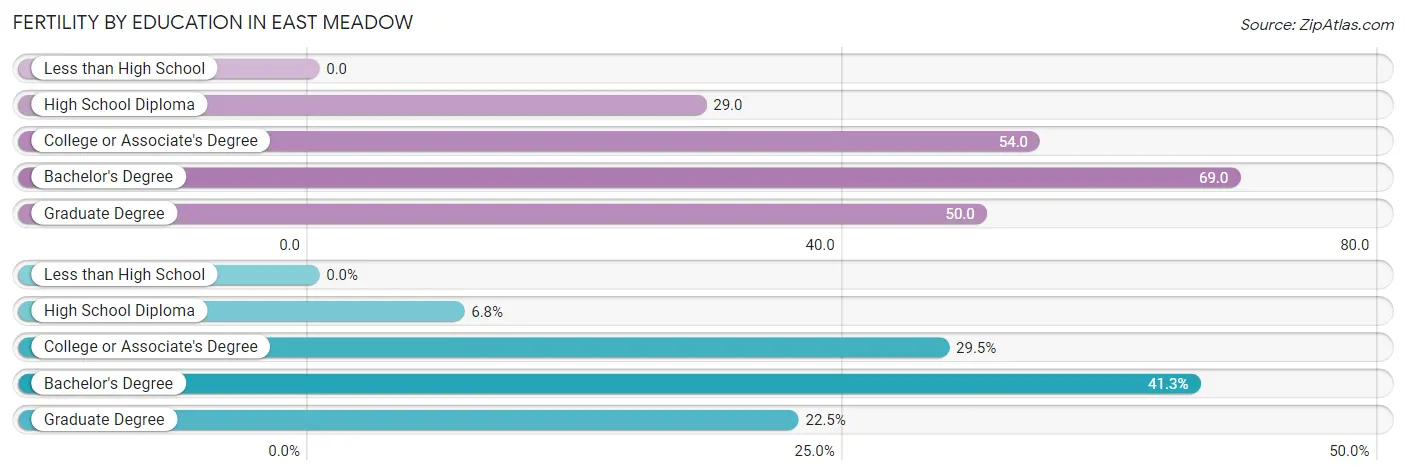
| Educational Attainment | Women with Births | Births / 1,000 Women |
| Less than High School | 0 (0.0%) | 0.0 |
| High School Diploma | 26 (6.8%) | 29.0 |
| College or Associate's Degree | 113 (29.5%) | 54.0 |
| Bachelor's Degree | 158 (41.2%) | 69.0 |
| Graduate Degree | 86 (22.5%) | 50.0 |
| Total | 383 (100.0%) | 50.0 |
Fertility by Education by Marriage Status in East Meadow
7.6% of women with births in East Meadow are unmarried. Women with the educational attainment of high school diploma are most likely to be married with 100.0% of them married at childbirth, while women with the educational attainment of college or associate's degree are least likely to be married with 18.6% of them unmarried at childbirth.
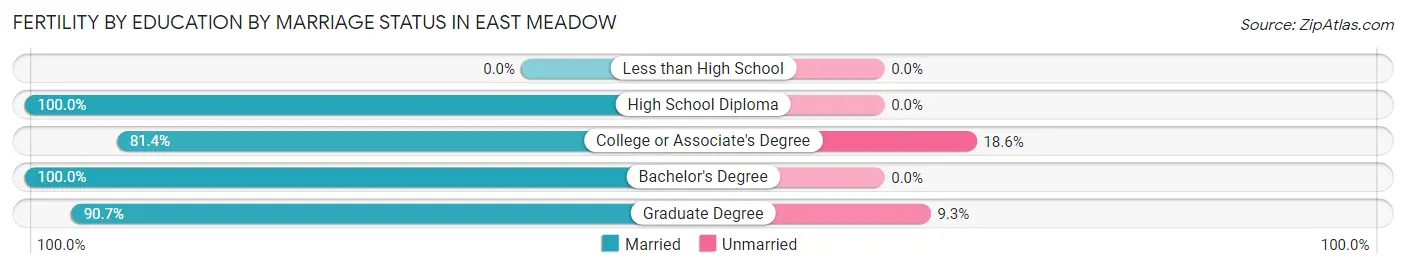
| Educational Attainment | Married | Unmarried |
| Less than High School | 0 (0.0%) | 0 (0.0%) |
| High School Diploma | 26 (100.0%) | 0 (0.0%) |
| College or Associate's Degree | 92 (81.4%) | 21 (18.6%) |
| Bachelor's Degree | 158 (100.0%) | 0 (0.0%) |
| Graduate Degree | 78 (90.7%) | 8 (9.3%) |
| Total | 354 (92.4%) | 29 (7.6%) |
Employment Characteristics in East Meadow
Employment by Class of Employer in East Meadow
Among the 16,828 employed individuals in East Meadow, private company employees (10,730 | 63.8%), local government employees (2,411 | 14.3%), and not-for-profit organizations (1,243 | 7.4%) make up the most common classes of employment.
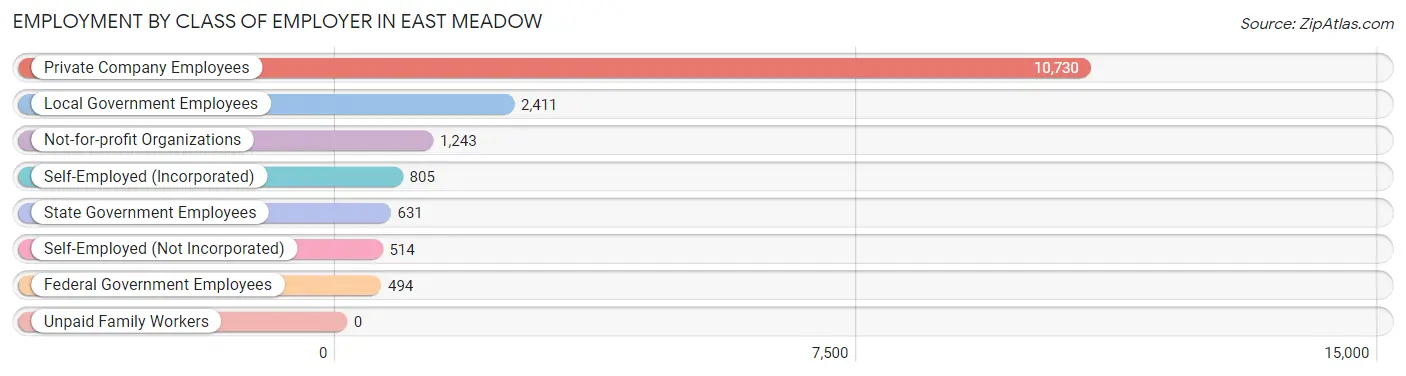
| Employer Class | # Employees | % Employees |
| Private Company Employees | 10,730 | 63.8% |
| Self-Employed (Incorporated) | 805 | 4.8% |
| Self-Employed (Not Incorporated) | 514 | 3.0% |
| Not-for-profit Organizations | 1,243 | 7.4% |
| Local Government Employees | 2,411 | 14.3% |
| State Government Employees | 631 | 3.7% |
| Federal Government Employees | 494 | 2.9% |
| Unpaid Family Workers | 0 | 0.0% |
| Total | 16,828 | 100.0% |
Employment Status by Age in East Meadow
According to the labor force statistics for East Meadow, out of the total population over 16 years of age (30,092), 58.7% or 17,664 individuals are in the labor force, with 3.4% or 601 of them unemployed. The age group with the highest labor force participation rate is 35 to 44 years, with 84.9% or 3,721 individuals in the labor force. Within the labor force, the 75 years and over age range has the highest percentage of unemployed individuals, with 6.7% or 22 of them being unemployed.
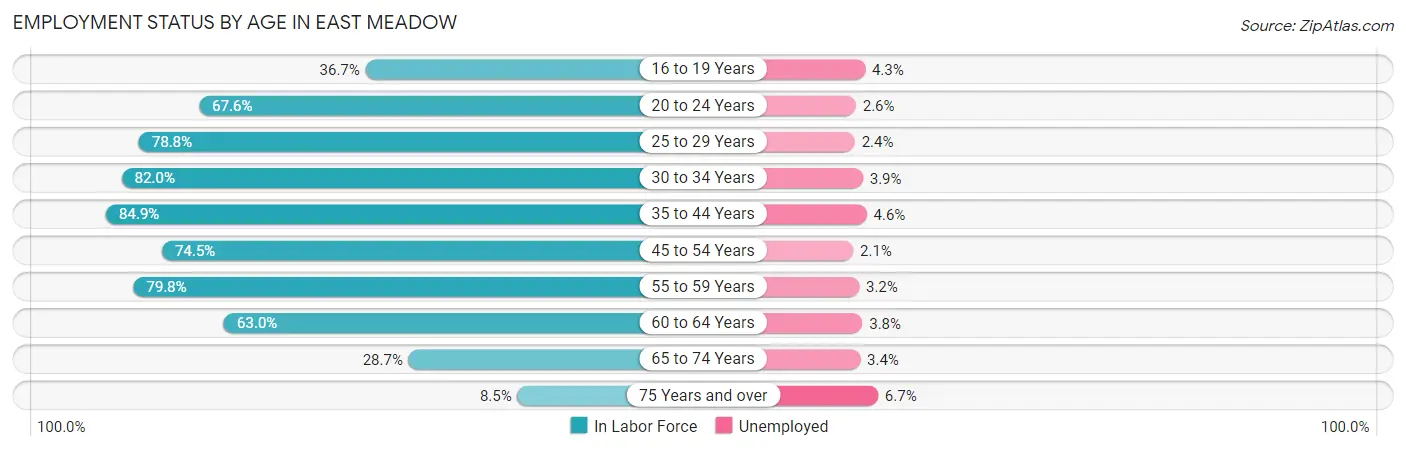
| Age Bracket | In Labor Force | Unemployed |
| 16 to 19 Years | 602 (36.7%) | 26 (4.3%) |
| 20 to 24 Years | 1,535 (67.6%) | 40 (2.6%) |
| 25 to 29 Years | 1,834 (78.8%) | 44 (2.4%) |
| 30 to 34 Years | 1,576 (82.0%) | 61 (3.9%) |
| 35 to 44 Years | 3,721 (84.9%) | 171 (4.6%) |
| 45 to 54 Years | 3,541 (74.5%) | 74 (2.1%) |
| 55 to 59 Years | 1,657 (79.8%) | 53 (3.2%) |
| 60 to 64 Years | 1,654 (63.0%) | 63 (3.8%) |
| 65 to 74 Years | 1,214 (28.7%) | 41 (3.4%) |
| 75 Years and over | 329 (8.5%) | 22 (6.7%) |
| Total | 17,664 (58.7%) | 601 (3.4%) |
Employment Status by Educational Attainment in East Meadow
According to labor force statistics for East Meadow, 77.3% of individuals (13,981) out of the total population between 25 and 64 years of age (18,087) are in the labor force, with 3.4% or 475 of them being unemployed. The group with the highest labor force participation rate are those with the educational attainment of bachelor's degree or higher, with 83.9% or 7,724 individuals in the labor force. Within the labor force, individuals with less than high school education have the highest percentage of unemployment, with 18.9% or 122 of them being unemployed.
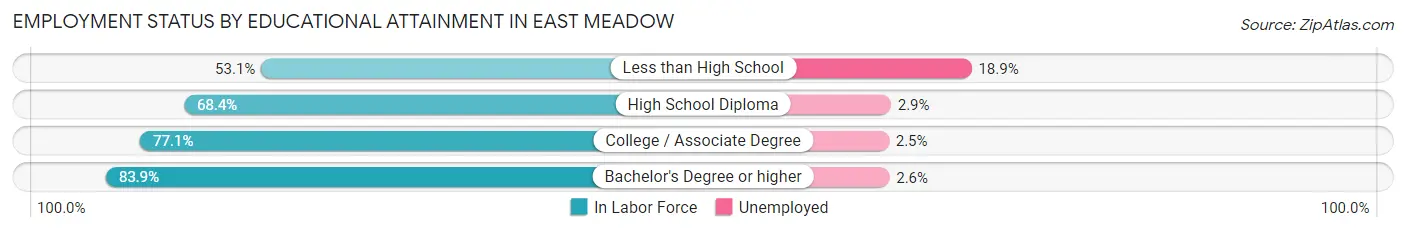
| Educational Attainment | In Labor Force | Unemployed |
| Less than High School | 645 (53.1%) | 230 (18.9%) |
| High School Diploma | 2,360 (68.4%) | 100 (2.9%) |
| College / Associate Degree | 3,250 (77.1%) | 105 (2.5%) |
| Bachelor's Degree or higher | 7,724 (83.9%) | 239 (2.6%) |
| Total | 13,981 (77.3%) | 615 (3.4%) |
Employment Occupations by Sex in East Meadow
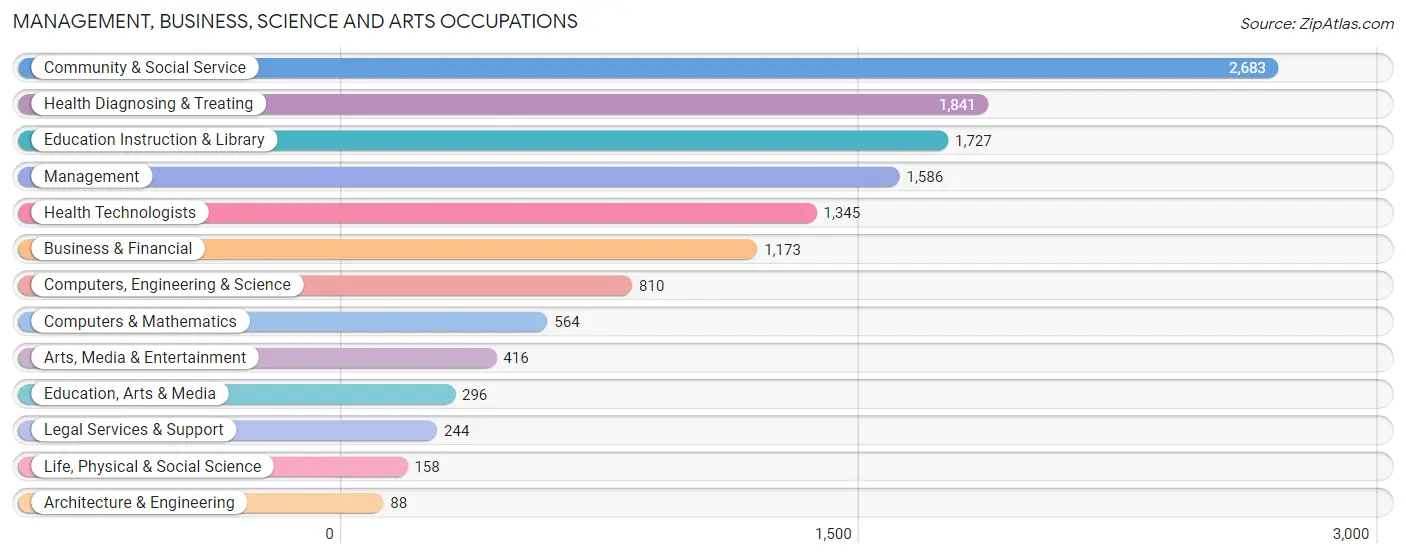
Management, Business, Science and Arts Occupations
The most common Management, Business, Science and Arts occupations in East Meadow are Community & Social Service (2,683 | 15.8%), Health Diagnosing & Treating (1,841 | 10.8%), Education Instruction & Library (1,727 | 10.2%), Management (1,586 | 9.3%), and Health Technologists (1,345 | 7.9%).
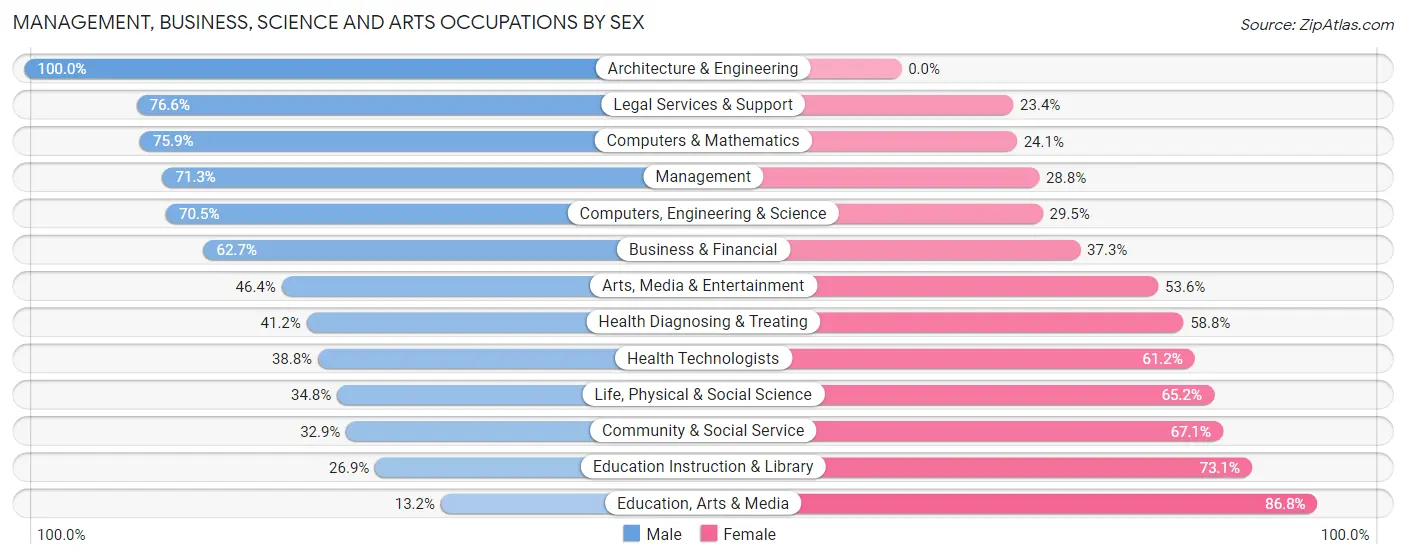
Management, Business, Science and Arts Occupations by Sex
Within the Management, Business, Science and Arts occupations in East Meadow, the most male-oriented occupations are Architecture & Engineering (100.0%), Legal Services & Support (76.6%), and Computers & Mathematics (75.9%), while the most female-oriented occupations are Education, Arts & Media (86.8%), Education Instruction & Library (73.1%), and Community & Social Service (67.1%).
| Occupation | Male | Female |
| Management | 1,130 (71.3%) | 456 (28.7%) |
| Business & Financial | 735 (62.7%) | 438 (37.3%) |
| Computers, Engineering & Science | 571 (70.5%) | 239 (29.5%) |
| Computers & Mathematics | 428 (75.9%) | 136 (24.1%) |
| Architecture & Engineering | 88 (100.0%) | 0 (0.0%) |
| Life, Physical & Social Science | 55 (34.8%) | 103 (65.2%) |
| Community & Social Service | 883 (32.9%) | 1,800 (67.1%) |
| Education, Arts & Media | 39 (13.2%) | 257 (86.8%) |
| Legal Services & Support | 187 (76.6%) | 57 (23.4%) |
| Education Instruction & Library | 464 (26.9%) | 1,263 (73.1%) |
| Arts, Media & Entertainment | 193 (46.4%) | 223 (53.6%) |
| Health Diagnosing & Treating | 758 (41.2%) | 1,083 (58.8%) |
| Health Technologists | 522 (38.8%) | 823 (61.2%) |
| Total (Category) | 4,077 (50.4%) | 4,016 (49.6%) |
| Total (Overall) | 8,865 (52.3%) | 8,096 (47.7%) |
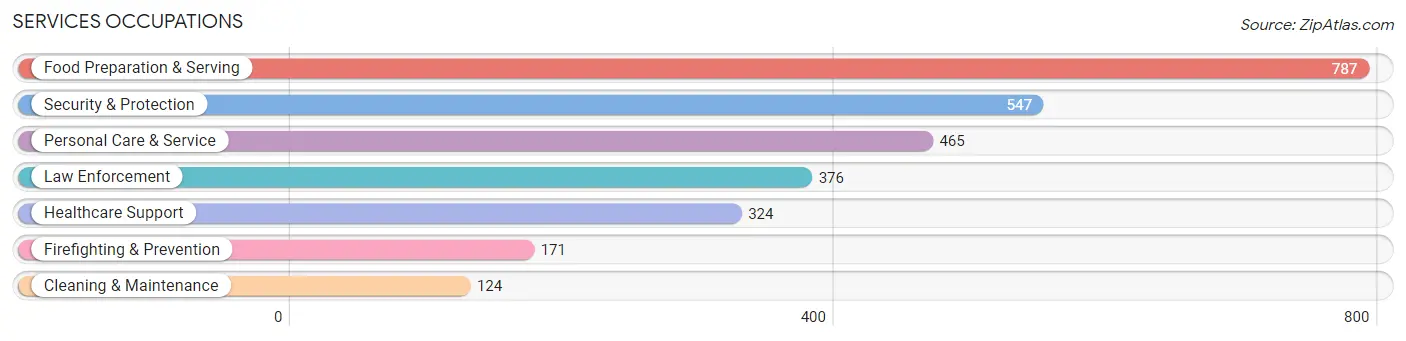
Services Occupations
The most common Services occupations in East Meadow are Food Preparation & Serving (787 | 4.6%), Security & Protection (547 | 3.2%), Personal Care & Service (465 | 2.7%), Law Enforcement (376 | 2.2%), and Healthcare Support (324 | 1.9%).
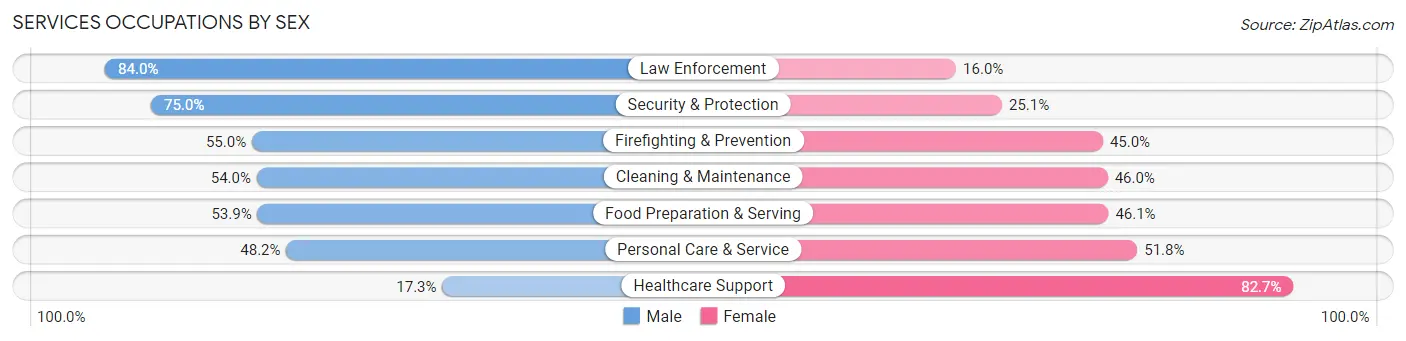
Services Occupations by Sex
Within the Services occupations in East Meadow, the most male-oriented occupations are Law Enforcement (84.0%), Security & Protection (75.0%), and Firefighting & Prevention (55.0%), while the most female-oriented occupations are Healthcare Support (82.7%), Personal Care & Service (51.8%), and Food Preparation & Serving (46.1%).
| Occupation | Male | Female |
| Healthcare Support | 56 (17.3%) | 268 (82.7%) |
| Security & Protection | 410 (75.0%) | 137 (25.1%) |
| Firefighting & Prevention | 94 (55.0%) | 77 (45.0%) |
| Law Enforcement | 316 (84.0%) | 60 (16.0%) |
| Food Preparation & Serving | 424 (53.9%) | 363 (46.1%) |
| Cleaning & Maintenance | 67 (54.0%) | 57 (46.0%) |
| Personal Care & Service | 224 (48.2%) | 241 (51.8%) |
| Total (Category) | 1,181 (52.6%) | 1,066 (47.4%) |
| Total (Overall) | 8,865 (52.3%) | 8,096 (47.7%) |
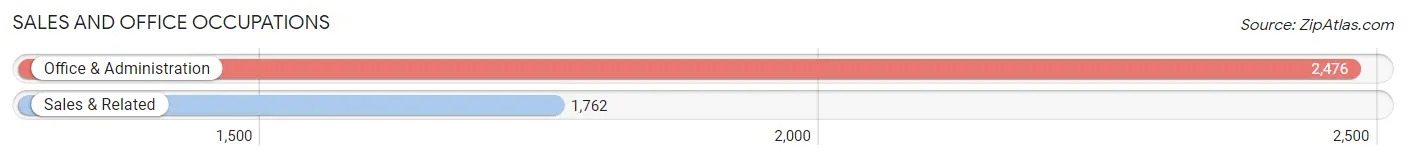
Sales and Office Occupations
The most common Sales and Office occupations in East Meadow are Office & Administration (2,476 | 14.6%), and Sales & Related (1,762 | 10.4%).
Sales and Office Occupations by Sex
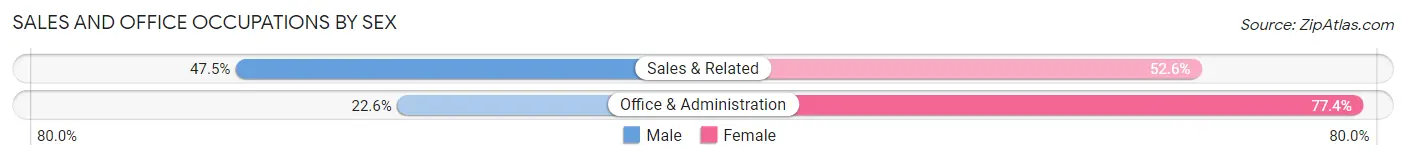
| Occupation | Male | Female |
| Sales & Related | 836 (47.4%) | 926 (52.5%) |
| Office & Administration | 560 (22.6%) | 1,916 (77.4%) |
| Total (Category) | 1,396 (32.9%) | 2,842 (67.1%) |
| Total (Overall) | 8,865 (52.3%) | 8,096 (47.7%) |
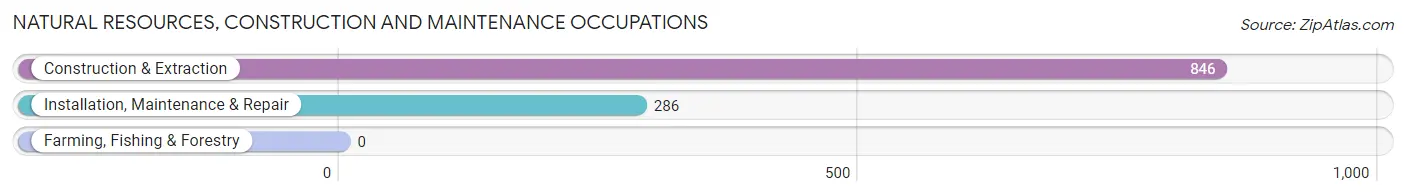
Natural Resources, Construction and Maintenance Occupations
The most common Natural Resources, Construction and Maintenance occupations in East Meadow are Construction & Extraction (846 | 5.0%), and Installation, Maintenance & Repair (286 | 1.7%).
Natural Resources, Construction and Maintenance Occupations by Sex
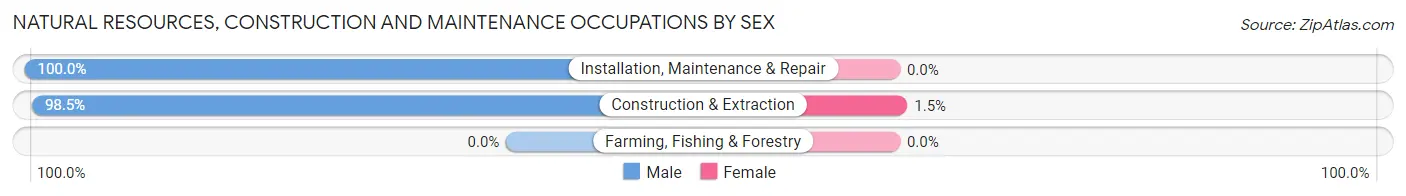
| Occupation | Male | Female |
| Farming, Fishing & Forestry | 0 (0.0%) | 0 (0.0%) |
| Construction & Extraction | 833 (98.5%) | 13 (1.5%) |
| Installation, Maintenance & Repair | 286 (100.0%) | 0 (0.0%) |
| Total (Category) | 1,119 (98.9%) | 13 (1.1%) |
| Total (Overall) | 8,865 (52.3%) | 8,096 (47.7%) |
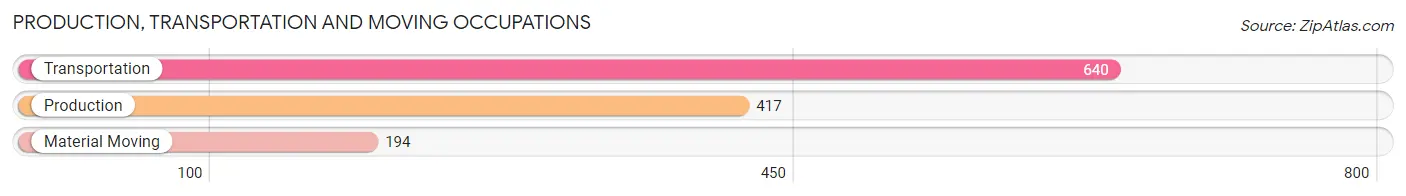
Production, Transportation and Moving Occupations
The most common Production, Transportation and Moving occupations in East Meadow are Transportation (640 | 3.8%), Production (417 | 2.5%), and Material Moving (194 | 1.1%).
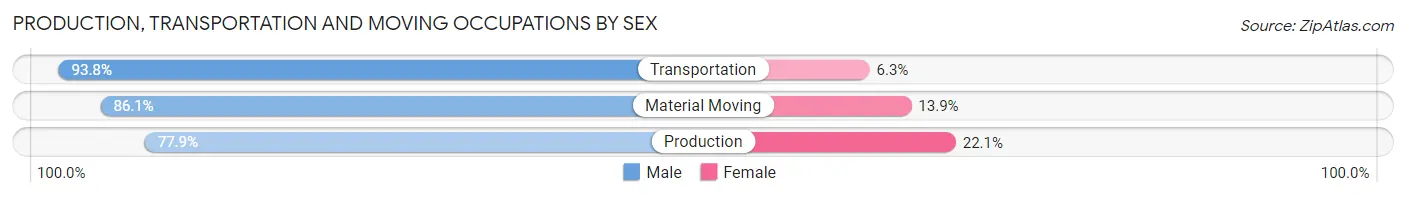
Production, Transportation and Moving Occupations by Sex
| Occupation | Male | Female |
| Production | 325 (77.9%) | 92 (22.1%) |
| Transportation | 600 (93.8%) | 40 (6.2%) |
| Material Moving | 167 (86.1%) | 27 (13.9%) |
| Total (Category) | 1,092 (87.3%) | 159 (12.7%) |
| Total (Overall) | 8,865 (52.3%) | 8,096 (47.7%) |
Employment Industries by Sex in East Meadow
Employment Industries in East Meadow
The major employment industries in East Meadow include Health Care & Social Assistance (2,775 | 16.4%), Educational Services (2,538 | 15.0%), Finance & Insurance (1,986 | 11.7%), Retail Trade (1,383 | 8.2%), and Professional & Scientific (1,316 | 7.8%).

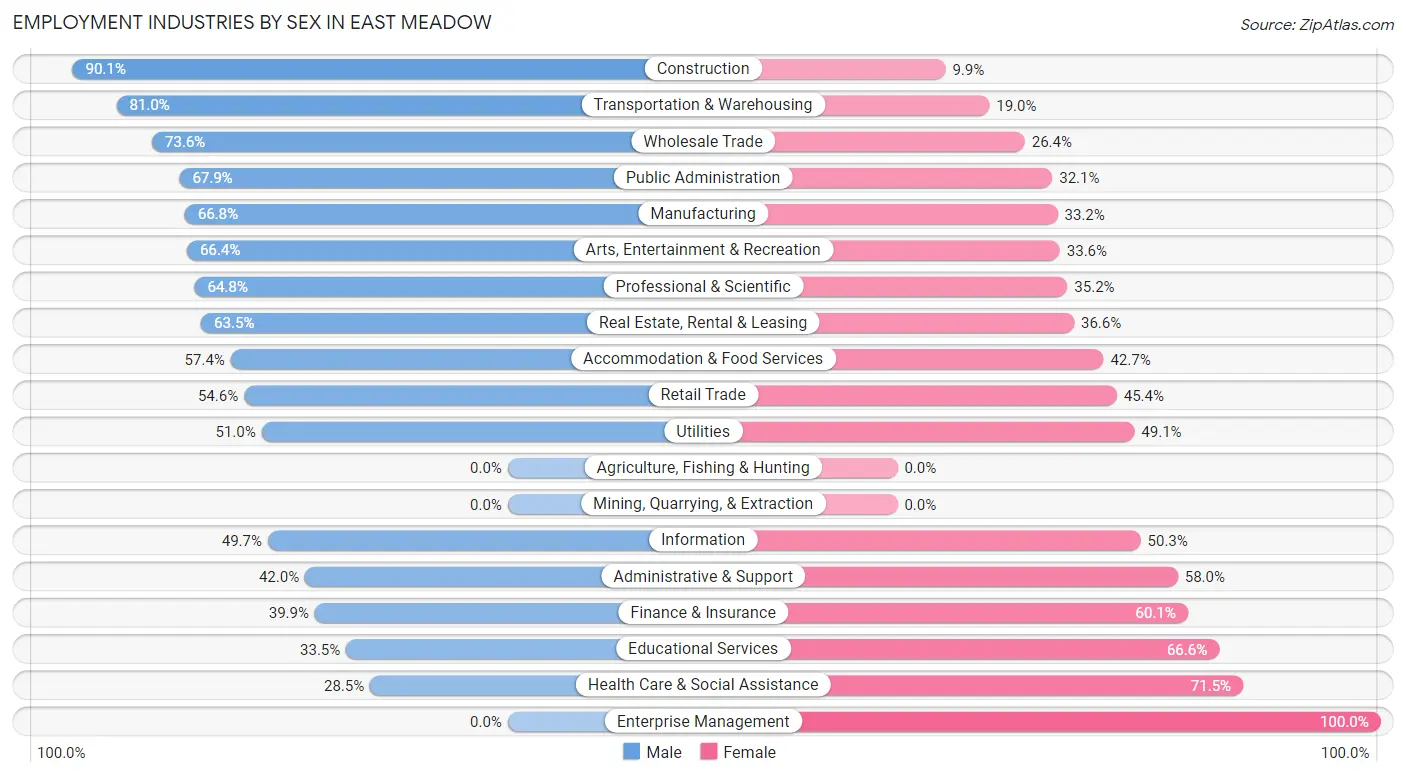
Employment Industries by Sex in East Meadow
The East Meadow industries that see more men than women are Construction (90.1%), Transportation & Warehousing (81.0%), and Wholesale Trade (73.6%), whereas the industries that tend to have a higher number of women are Enterprise Management (100.0%), Health Care & Social Assistance (71.5%), and Educational Services (66.5%).
| Industry | Male | Female |
| Agriculture, Fishing & Hunting | 0 (0.0%) | 0 (0.0%) |
| Mining, Quarrying, & Extraction | 0 (0.0%) | 0 (0.0%) |
| Construction | 1,115 (90.1%) | 123 (9.9%) |
| Manufacturing | 502 (66.8%) | 249 (33.2%) |
| Wholesale Trade | 324 (73.6%) | 116 (26.4%) |
| Retail Trade | 755 (54.6%) | 628 (45.4%) |
| Transportation & Warehousing | 579 (81.0%) | 136 (19.0%) |
| Utilities | 107 (50.9%) | 103 (49.0%) |
| Information | 73 (49.7%) | 74 (50.3%) |
| Finance & Insurance | 793 (39.9%) | 1,193 (60.1%) |
| Real Estate, Rental & Leasing | 243 (63.4%) | 140 (36.5%) |
| Professional & Scientific | 853 (64.8%) | 463 (35.2%) |
| Enterprise Management | 0 (0.0%) | 19 (100.0%) |
| Administrative & Support | 133 (42.0%) | 184 (58.0%) |
| Educational Services | 849 (33.5%) | 1,689 (66.5%) |
| Health Care & Social Assistance | 791 (28.5%) | 1,984 (71.5%) |
| Arts, Entertainment & Recreation | 233 (66.4%) | 118 (33.6%) |
| Accommodation & Food Services | 484 (57.4%) | 360 (42.6%) |
| Public Administration | 657 (67.9%) | 310 (32.1%) |
| Total | 8,865 (52.3%) | 8,096 (47.7%) |
Education in East Meadow
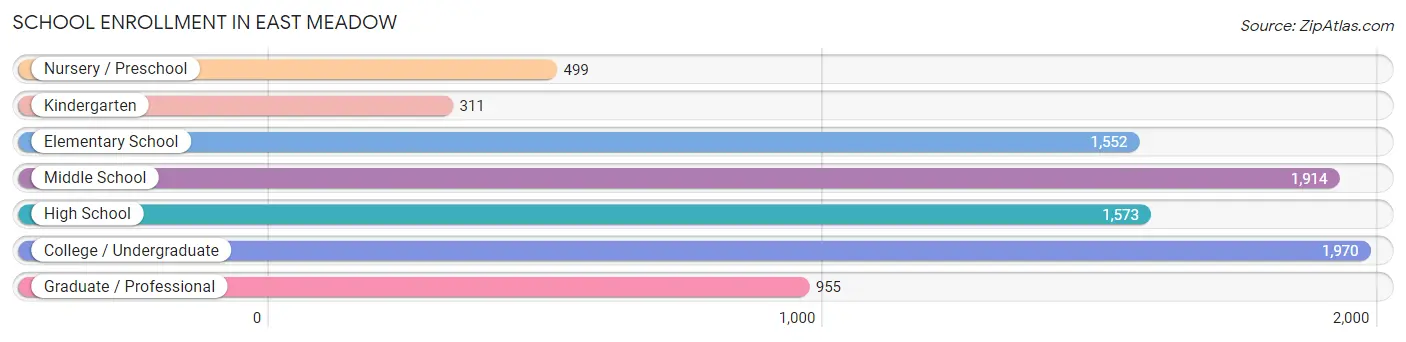
School Enrollment in East Meadow
The most common levels of schooling among the 8,774 students in East Meadow are college / undergraduate (1,970 | 22.5%), middle school (1,914 | 21.8%), and high school (1,573 | 17.9%).
| School Level | # Students | % Students |
| Nursery / Preschool | 499 | 5.7% |
| Kindergarten | 311 | 3.5% |
| Elementary School | 1,552 | 17.7% |
| Middle School | 1,914 | 21.8% |
| High School | 1,573 | 17.9% |
| College / Undergraduate | 1,970 | 22.5% |
| Graduate / Professional | 955 | 10.9% |
| Total | 8,774 | 100.0% |
School Enrollment by Age by Funding Source in East Meadow
Out of a total of 8,774 students who are enrolled in schools in East Meadow, 2,378 (27.1%) attend a private institution, while the remaining 6,396 (72.9%) are enrolled in public schools. The age group of 35 years and over has the highest likelihood of being enrolled in private schools, with 347 (76.6% in the age bracket) enrolled. Conversely, the age group of 10 to 14 year olds has the lowest likelihood of being enrolled in a private school, with 1,991 (92.6% in the age bracket) attending a public institution.
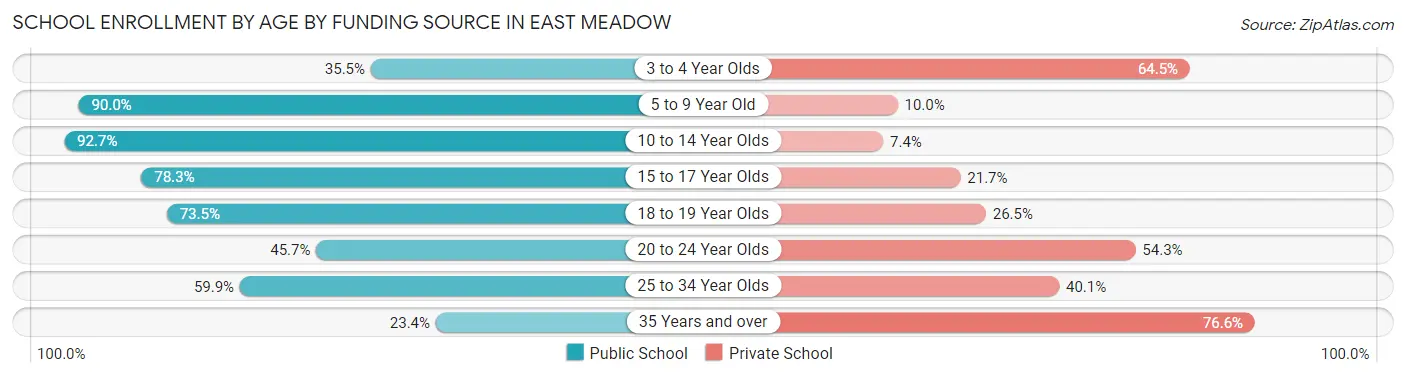
| Age Bracket | Public School | Private School |
| 3 to 4 Year Olds | 163 (35.5%) | 296 (64.5%) |
| 5 to 9 Year Old | 1,658 (90.0%) | 185 (10.0%) |
| 10 to 14 Year Olds | 1,991 (92.6%) | 158 (7.3%) |
| 15 to 17 Year Olds | 871 (78.3%) | 242 (21.7%) |
| 18 to 19 Year Olds | 583 (73.5%) | 210 (26.5%) |
| 20 to 24 Year Olds | 495 (45.7%) | 589 (54.3%) |
| 25 to 34 Year Olds | 527 (59.9%) | 353 (40.1%) |
| 35 Years and over | 106 (23.4%) | 347 (76.6%) |
| Total | 6,396 (72.9%) | 2,378 (27.1%) |
Educational Attainment by Field of Study in East Meadow
Business (2,475 | 19.8%), education (1,458 | 11.7%), science & technology (1,416 | 11.4%), psychology (846 | 6.8%), and social sciences (805 | 6.5%) are the most common fields of study among 12,474 individuals in East Meadow who have obtained a bachelor's degree or higher.
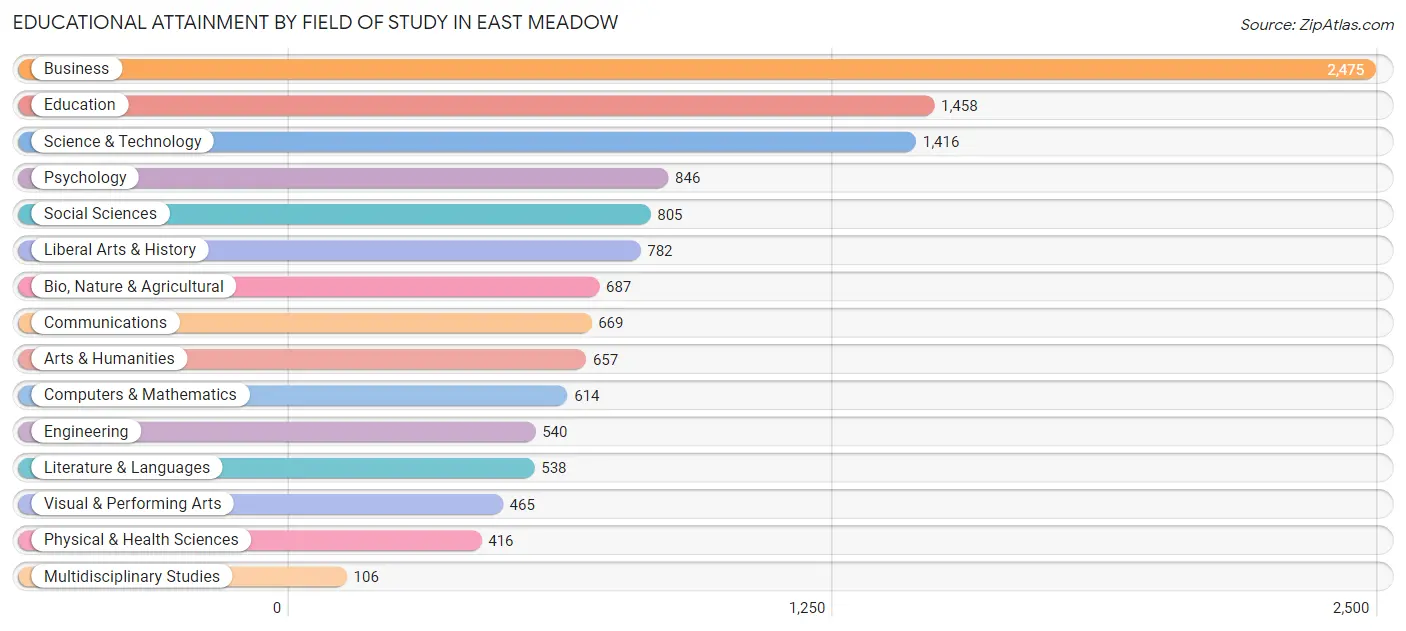
| Field of Study | # Graduates | % Graduates |
| Computers & Mathematics | 614 | 4.9% |
| Bio, Nature & Agricultural | 687 | 5.5% |
| Physical & Health Sciences | 416 | 3.3% |
| Psychology | 846 | 6.8% |
| Social Sciences | 805 | 6.5% |
| Engineering | 540 | 4.3% |
| Multidisciplinary Studies | 106 | 0.9% |
| Science & Technology | 1,416 | 11.4% |
| Business | 2,475 | 19.8% |
| Education | 1,458 | 11.7% |
| Literature & Languages | 538 | 4.3% |
| Liberal Arts & History | 782 | 6.3% |
| Visual & Performing Arts | 465 | 3.7% |
| Communications | 669 | 5.4% |
| Arts & Humanities | 657 | 5.3% |
| Total | 12,474 | 100.0% |
Transportation & Commute in East Meadow
Vehicle Availability by Sex in East Meadow
The most prevalent vehicle ownership categories in East Meadow are males with 2 vehicles (4,111, accounting for 46.7%) and females with 2 vehicles (3,711, making up 51.4%).
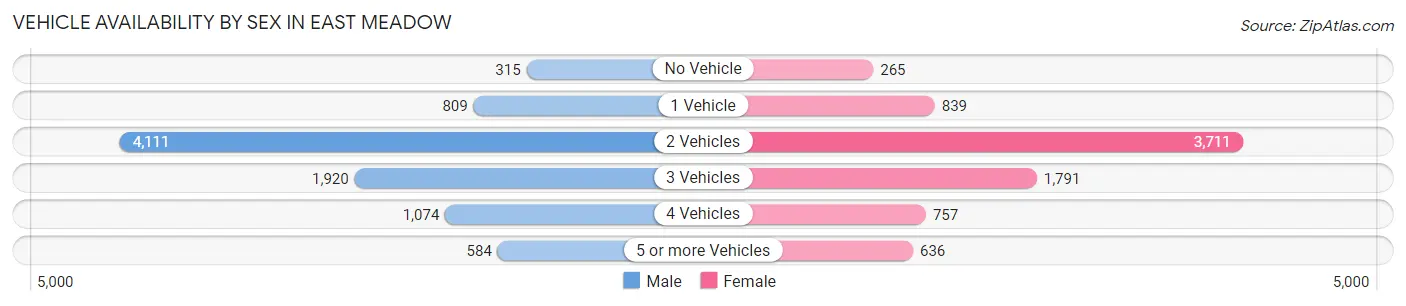
| Vehicles Available | Male | Female |
| No Vehicle | 315 (3.6%) | 265 (3.3%) |
| 1 Vehicle | 809 (9.2%) | 839 (10.5%) |
| 2 Vehicles | 4,111 (46.7%) | 3,711 (46.4%) |
| 3 Vehicles | 1,920 (21.8%) | 1,791 (22.4%) |
| 4 Vehicles | 1,074 (12.2%) | 757 (9.5%) |
| 5 or more Vehicles | 584 (6.6%) | 636 (8.0%) |
| Total | 8,813 (100.0%) | 7,999 (100.0%) |
Commute Time in East Meadow
The most frequently occuring commute durations in East Meadow are 20 to 24 minutes (2,007 commuters, 13.4%), 60 to 89 minutes (1,848 commuters, 12.3%), and 30 to 34 minutes (1,823 commuters, 12.1%).
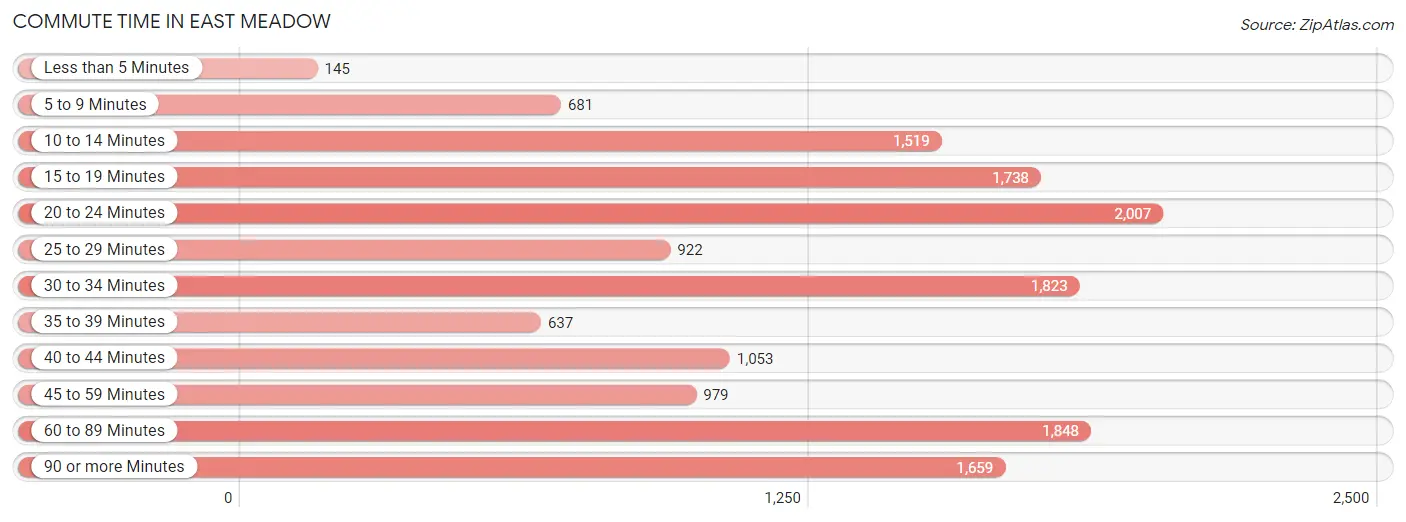
| Commute Time | # Commuters | % Commuters |
| Less than 5 Minutes | 145 | 1.0% |
| 5 to 9 Minutes | 681 | 4.5% |
| 10 to 14 Minutes | 1,519 | 10.1% |
| 15 to 19 Minutes | 1,738 | 11.6% |
| 20 to 24 Minutes | 2,007 | 13.4% |
| 25 to 29 Minutes | 922 | 6.1% |
| 30 to 34 Minutes | 1,823 | 12.1% |
| 35 to 39 Minutes | 637 | 4.2% |
| 40 to 44 Minutes | 1,053 | 7.0% |
| 45 to 59 Minutes | 979 | 6.5% |
| 60 to 89 Minutes | 1,848 | 12.3% |
| 90 or more Minutes | 1,659 | 11.1% |
Commute Time by Sex in East Meadow
The most common commute times in East Meadow are 60 to 89 minutes (1,232 commuters, 15.6%) for males and 15 to 19 minutes (1,185 commuters, 16.7%) for females.
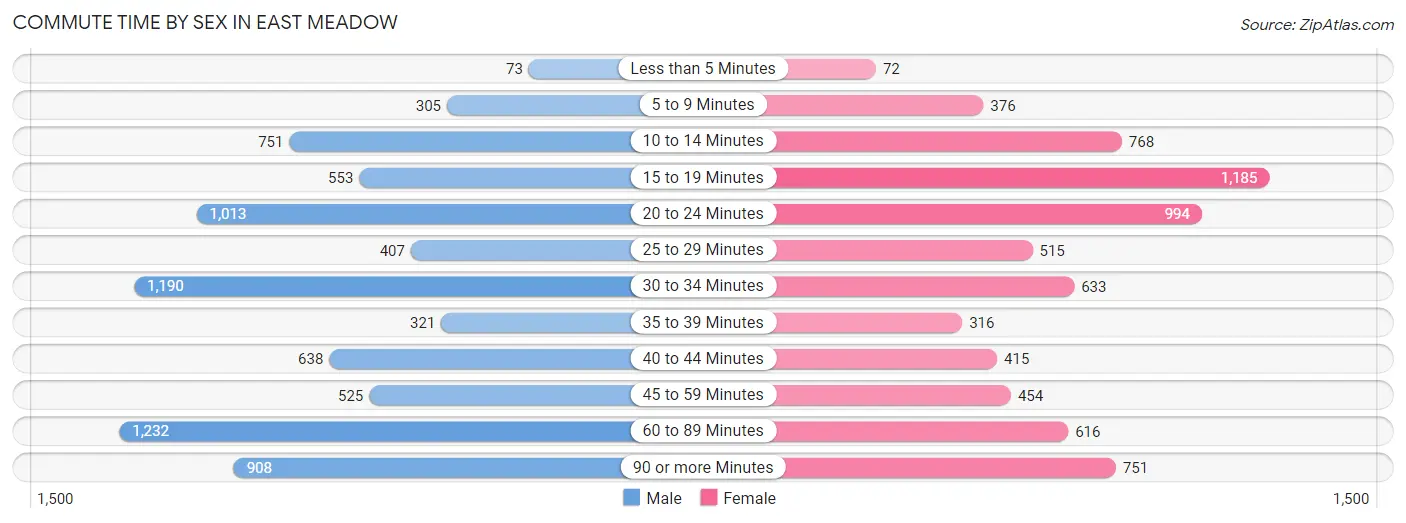
| Commute Time | Male | Female |
| Less than 5 Minutes | 73 (0.9%) | 72 (1.0%) |
| 5 to 9 Minutes | 305 (3.8%) | 376 (5.3%) |
| 10 to 14 Minutes | 751 (9.5%) | 768 (10.8%) |
| 15 to 19 Minutes | 553 (7.0%) | 1,185 (16.7%) |
| 20 to 24 Minutes | 1,013 (12.8%) | 994 (14.0%) |
| 25 to 29 Minutes | 407 (5.1%) | 515 (7.3%) |
| 30 to 34 Minutes | 1,190 (15.0%) | 633 (8.9%) |
| 35 to 39 Minutes | 321 (4.1%) | 316 (4.4%) |
| 40 to 44 Minutes | 638 (8.1%) | 415 (5.9%) |
| 45 to 59 Minutes | 525 (6.6%) | 454 (6.4%) |
| 60 to 89 Minutes | 1,232 (15.6%) | 616 (8.7%) |
| 90 or more Minutes | 908 (11.5%) | 751 (10.6%) |
Time of Departure to Work by Sex in East Meadow
The most frequent times of departure to work in East Meadow are 7:00 AM to 7:29 AM (1,296, 16.4%) for males and 7:30 AM to 7:59 AM (981, 13.8%) for females.
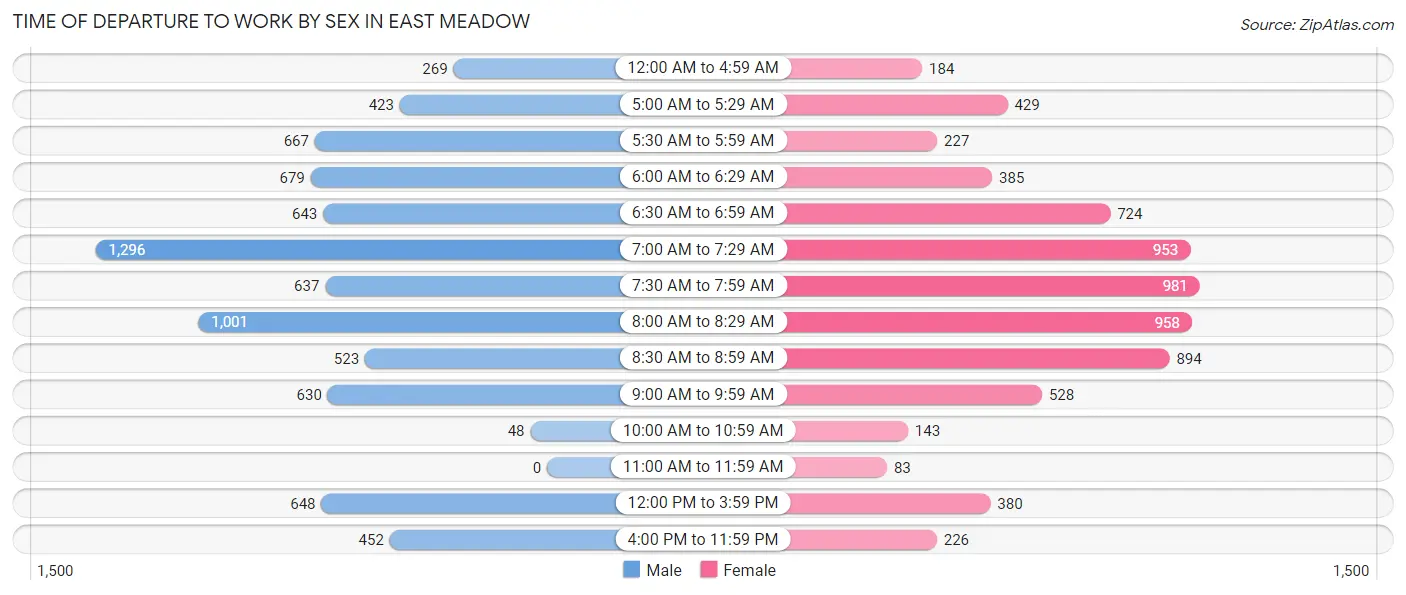
| Time of Departure | Male | Female |
| 12:00 AM to 4:59 AM | 269 (3.4%) | 184 (2.6%) |
| 5:00 AM to 5:29 AM | 423 (5.3%) | 429 (6.0%) |
| 5:30 AM to 5:59 AM | 667 (8.4%) | 227 (3.2%) |
| 6:00 AM to 6:29 AM | 679 (8.6%) | 385 (5.4%) |
| 6:30 AM to 6:59 AM | 643 (8.1%) | 724 (10.2%) |
| 7:00 AM to 7:29 AM | 1,296 (16.4%) | 953 (13.4%) |
| 7:30 AM to 7:59 AM | 637 (8.1%) | 981 (13.8%) |
| 8:00 AM to 8:29 AM | 1,001 (12.7%) | 958 (13.5%) |
| 8:30 AM to 8:59 AM | 523 (6.6%) | 894 (12.6%) |
| 9:00 AM to 9:59 AM | 630 (8.0%) | 528 (7.4%) |
| 10:00 AM to 10:59 AM | 48 (0.6%) | 143 (2.0%) |
| 11:00 AM to 11:59 AM | 0 (0.0%) | 83 (1.2%) |
| 12:00 PM to 3:59 PM | 648 (8.2%) | 380 (5.4%) |
| 4:00 PM to 11:59 PM | 452 (5.7%) | 226 (3.2%) |
| Total | 7,916 (100.0%) | 7,095 (100.0%) |
Housing Occupancy in East Meadow
Occupancy by Ownership in East Meadow
Of the total 11,716 dwellings in East Meadow, owner-occupied units account for 10,418 (88.9%), while renter-occupied units make up 1,298 (11.1%).
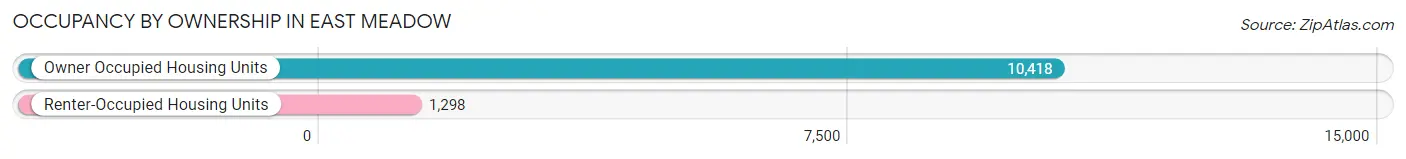
| Occupancy | # Housing Units | % Housing Units |
| Owner Occupied Housing Units | 10,418 | 88.9% |
| Renter-Occupied Housing Units | 1,298 | 11.1% |
| Total Occupied Housing Units | 11,716 | 100.0% |
Occupancy by Household Size in East Meadow
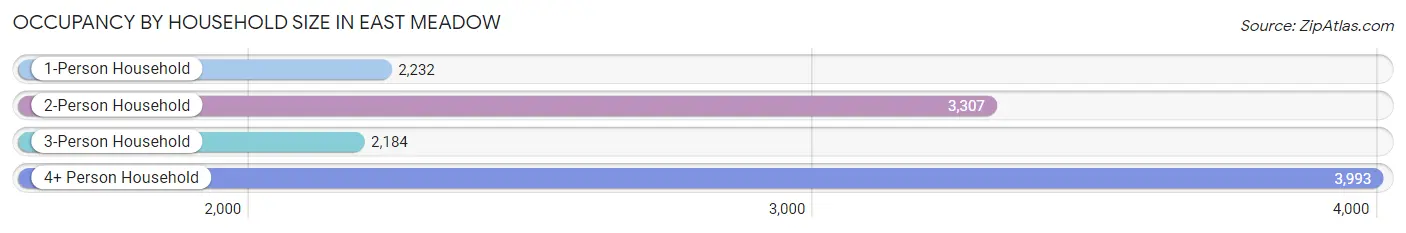
| Household Size | # Housing Units | % Housing Units |
| 1-Person Household | 2,232 | 19.1% |
| 2-Person Household | 3,307 | 28.2% |
| 3-Person Household | 2,184 | 18.6% |
| 4+ Person Household | 3,993 | 34.1% |
| Total Housing Units | 11,716 | 100.0% |
Occupancy by Ownership by Household Size in East Meadow
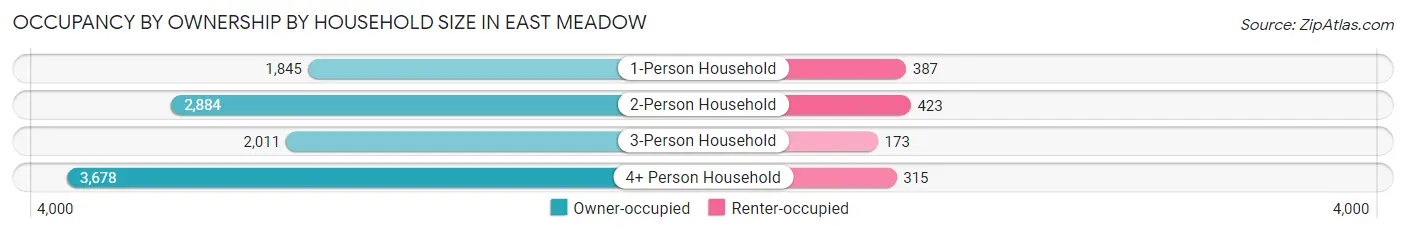
| Household Size | Owner-occupied | Renter-occupied |
| 1-Person Household | 1,845 (82.7%) | 387 (17.3%) |
| 2-Person Household | 2,884 (87.2%) | 423 (12.8%) |
| 3-Person Household | 2,011 (92.1%) | 173 (7.9%) |
| 4+ Person Household | 3,678 (92.1%) | 315 (7.9%) |
| Total Housing Units | 10,418 (88.9%) | 1,298 (11.1%) |
Occupancy by Educational Attainment in East Meadow
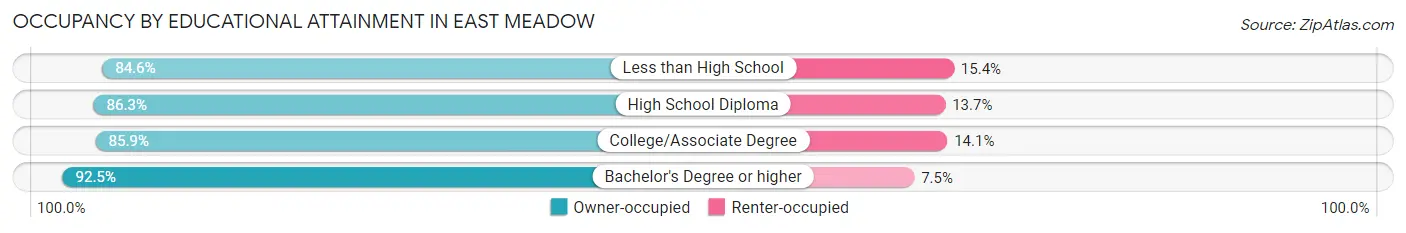
| Household Size | Owner-occupied | Renter-occupied |
| Less than High School | 538 (84.6%) | 98 (15.4%) |
| High School Diploma | 2,420 (86.3%) | 384 (13.7%) |
| College/Associate Degree | 2,518 (85.9%) | 413 (14.1%) |
| Bachelor's Degree or higher | 4,942 (92.5%) | 403 (7.5%) |
Occupancy by Age of Householder in East Meadow
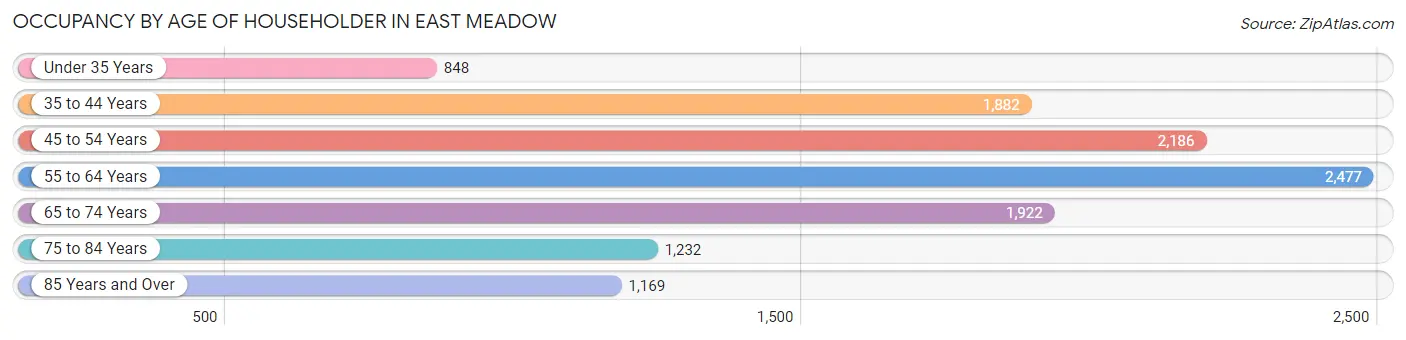
| Age Bracket | # Households | % Households |
| Under 35 Years | 848 | 7.2% |
| 35 to 44 Years | 1,882 | 16.1% |
| 45 to 54 Years | 2,186 | 18.7% |
| 55 to 64 Years | 2,477 | 21.1% |
| 65 to 74 Years | 1,922 | 16.4% |
| 75 to 84 Years | 1,232 | 10.5% |
| 85 Years and Over | 1,169 | 10.0% |
| Total | 11,716 | 100.0% |
Housing Finances in East Meadow
Median Income by Occupancy in East Meadow
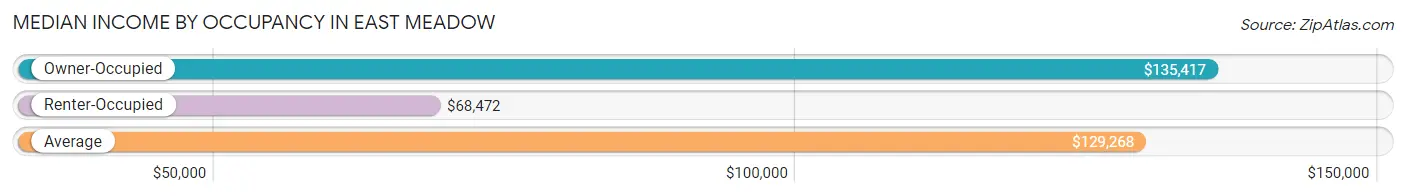
| Occupancy Type | # Households | Median Income |
| Owner-Occupied | 10,418 (88.9%) | $135,417 |
| Renter-Occupied | 1,298 (11.1%) | $68,472 |
| Average | 11,716 (100.0%) | $129,268 |
Occupancy by Householder Income Bracket in East Meadow
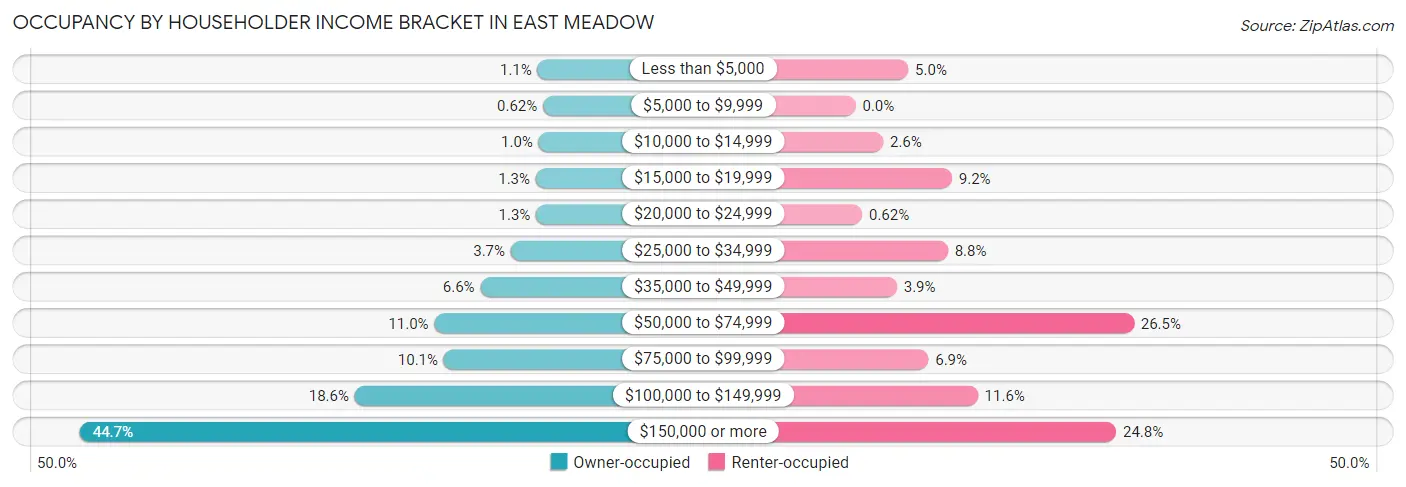
| Income Bracket | Owner-occupied | Renter-occupied |
| Less than $5,000 | 119 (1.1%) | 65 (5.0%) |
| $5,000 to $9,999 | 65 (0.6%) | 0 (0.0%) |
| $10,000 to $14,999 | 108 (1.0%) | 34 (2.6%) |
| $15,000 to $19,999 | 136 (1.3%) | 119 (9.2%) |
| $20,000 to $24,999 | 133 (1.3%) | 8 (0.6%) |
| $25,000 to $34,999 | 384 (3.7%) | 114 (8.8%) |
| $35,000 to $49,999 | 687 (6.6%) | 51 (3.9%) |
| $50,000 to $74,999 | 1,143 (11.0%) | 344 (26.5%) |
| $75,000 to $99,999 | 1,049 (10.1%) | 90 (6.9%) |
| $100,000 to $149,999 | 1,933 (18.5%) | 151 (11.6%) |
| $150,000 or more | 4,661 (44.7%) | 322 (24.8%) |
| Total | 10,418 (100.0%) | 1,298 (100.0%) |
Monthly Housing Cost Tiers in East Meadow
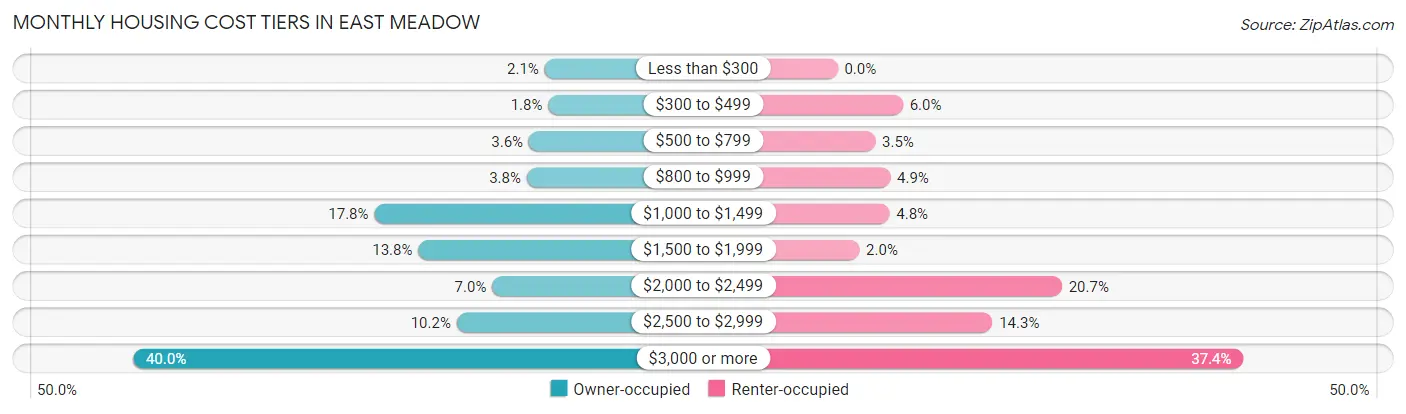
| Monthly Cost | Owner-occupied | Renter-occupied |
| Less than $300 | 221 (2.1%) | 0 (0.0%) |
| $300 to $499 | 186 (1.8%) | 78 (6.0%) |
| $500 to $799 | 372 (3.6%) | 45 (3.5%) |
| $800 to $999 | 393 (3.8%) | 63 (4.9%) |
| $1,000 to $1,499 | 1,854 (17.8%) | 62 (4.8%) |
| $1,500 to $1,999 | 1,434 (13.8%) | 26 (2.0%) |
| $2,000 to $2,499 | 724 (7.0%) | 268 (20.6%) |
| $2,500 to $2,999 | 1,065 (10.2%) | 185 (14.2%) |
| $3,000 or more | 4,169 (40.0%) | 485 (37.4%) |
| Total | 10,418 (100.0%) | 1,298 (100.0%) |
Physical Housing Characteristics in East Meadow
Housing Structures in East Meadow
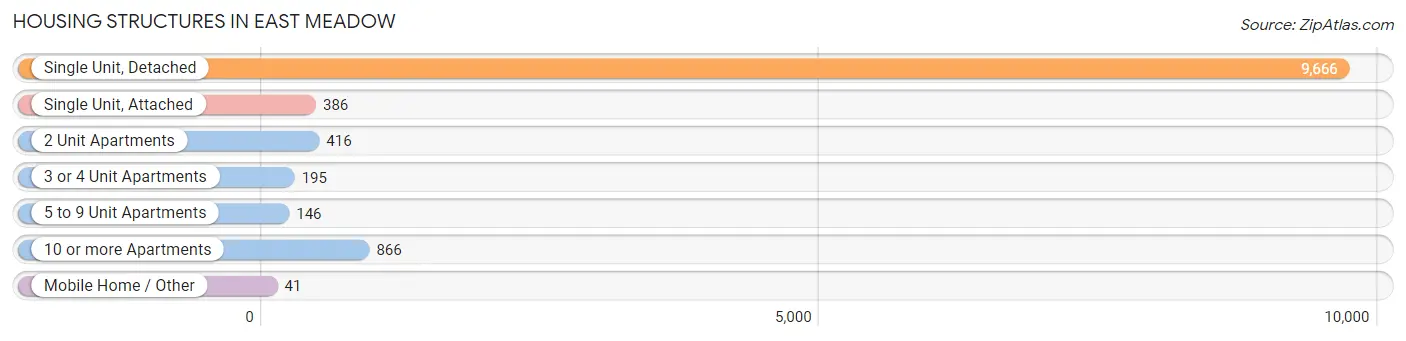
| Structure Type | # Housing Units | % Housing Units |
| Single Unit, Detached | 9,666 | 82.5% |
| Single Unit, Attached | 386 | 3.3% |
| 2 Unit Apartments | 416 | 3.5% |
| 3 or 4 Unit Apartments | 195 | 1.7% |
| 5 to 9 Unit Apartments | 146 | 1.3% |
| 10 or more Apartments | 866 | 7.4% |
| Mobile Home / Other | 41 | 0.4% |
| Total | 11,716 | 100.0% |
Housing Structures by Occupancy in East Meadow
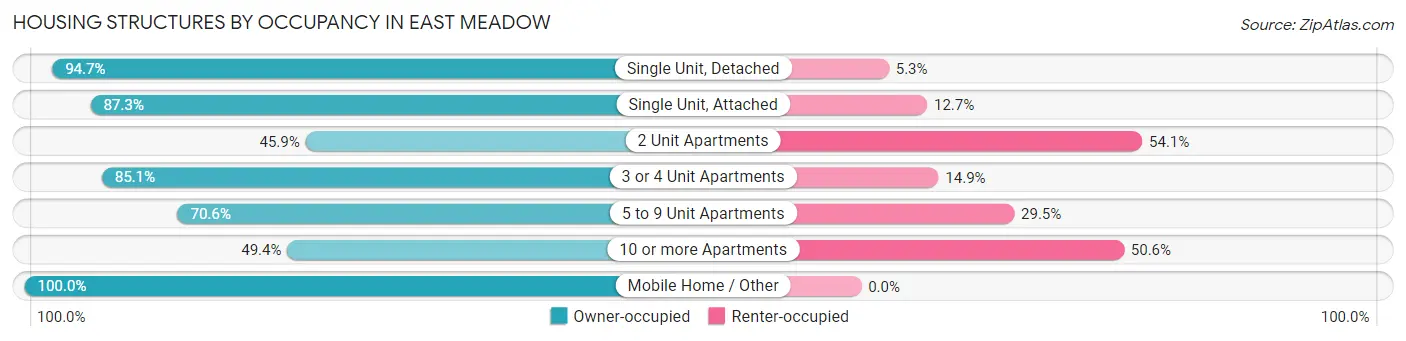
| Structure Type | Owner-occupied | Renter-occupied |
| Single Unit, Detached | 9,152 (94.7%) | 514 (5.3%) |
| Single Unit, Attached | 337 (87.3%) | 49 (12.7%) |
| 2 Unit Apartments | 191 (45.9%) | 225 (54.1%) |
| 3 or 4 Unit Apartments | 166 (85.1%) | 29 (14.9%) |
| 5 to 9 Unit Apartments | 103 (70.6%) | 43 (29.4%) |
| 10 or more Apartments | 428 (49.4%) | 438 (50.6%) |
| Mobile Home / Other | 41 (100.0%) | 0 (0.0%) |
| Total | 10,418 (88.9%) | 1,298 (11.1%) |
Housing Structures by Number of Rooms in East Meadow
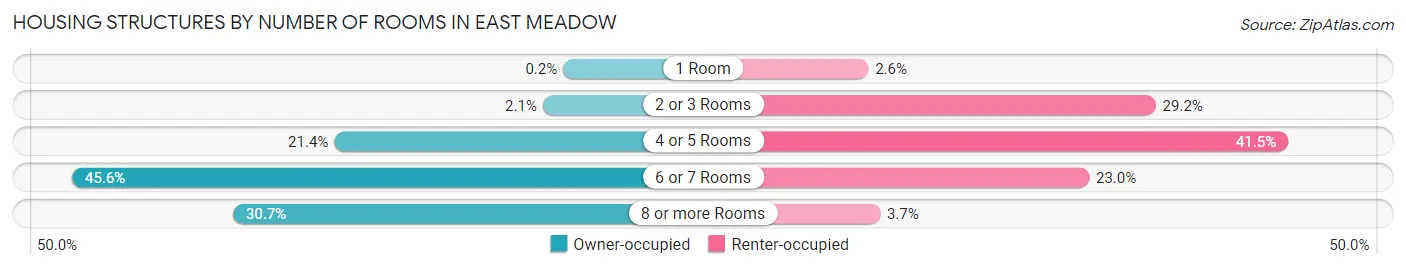
| Number of Rooms | Owner-occupied | Renter-occupied |
| 1 Room | 21 (0.2%) | 34 (2.6%) |
| 2 or 3 Rooms | 217 (2.1%) | 379 (29.2%) |
| 4 or 5 Rooms | 2,226 (21.4%) | 538 (41.4%) |
| 6 or 7 Rooms | 4,753 (45.6%) | 299 (23.0%) |
| 8 or more Rooms | 3,201 (30.7%) | 48 (3.7%) |
| Total | 10,418 (100.0%) | 1,298 (100.0%) |
Housing Structure by Heating Type in East Meadow
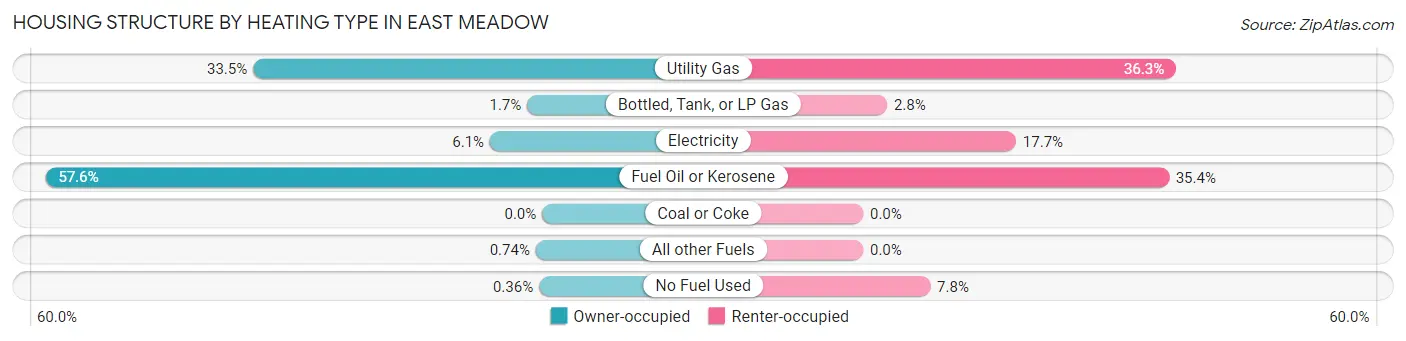
| Heating Type | Owner-occupied | Renter-occupied |
| Utility Gas | 3,491 (33.5%) | 471 (36.3%) |
| Bottled, Tank, or LP Gas | 181 (1.7%) | 36 (2.8%) |
| Electricity | 630 (6.0%) | 230 (17.7%) |
| Fuel Oil or Kerosene | 6,001 (57.6%) | 460 (35.4%) |
| Coal or Coke | 0 (0.0%) | 0 (0.0%) |
| All other Fuels | 77 (0.7%) | 0 (0.0%) |
| No Fuel Used | 38 (0.4%) | 101 (7.8%) |
| Total | 10,418 (100.0%) | 1,298 (100.0%) |
Household Vehicle Usage in East Meadow
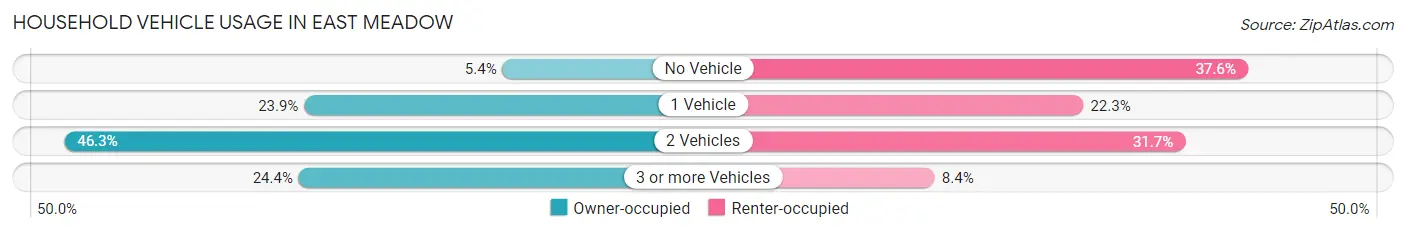
| Vehicles per Household | Owner-occupied | Renter-occupied |
| No Vehicle | 562 (5.4%) | 488 (37.6%) |
| 1 Vehicle | 2,490 (23.9%) | 289 (22.3%) |
| 2 Vehicles | 4,823 (46.3%) | 412 (31.7%) |
| 3 or more Vehicles | 2,543 (24.4%) | 109 (8.4%) |
| Total | 10,418 (100.0%) | 1,298 (100.0%) |
Real Estate & Mortgages in East Meadow
Real Estate and Mortgage Overview in East Meadow
| Characteristic | Without Mortgage | With Mortgage |
| Housing Units | 4,299 | 6,119 |
| Median Property Value | $548,600 | $620,400 |
| Median Household Income | $90,575 | $3,396 |
| Monthly Housing Costs | $1,316 | $4,169 |
| Real Estate Taxes | $10,001 | $38 |
Property Value by Mortgage Status in East Meadow
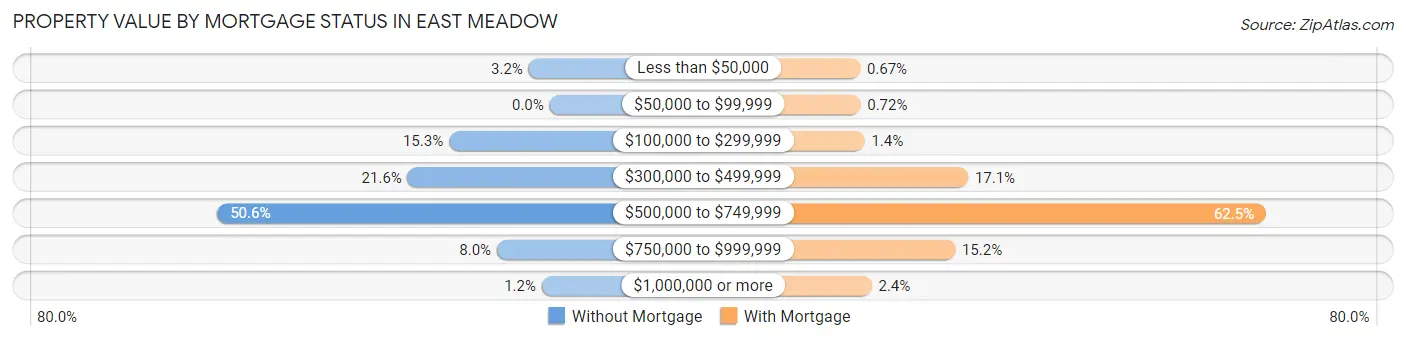
| Property Value | Without Mortgage | With Mortgage |
| Less than $50,000 | 137 (3.2%) | 41 (0.7%) |
| $50,000 to $99,999 | 0 (0.0%) | 44 (0.7%) |
| $100,000 to $299,999 | 659 (15.3%) | 83 (1.4%) |
| $300,000 to $499,999 | 930 (21.6%) | 1,048 (17.1%) |
| $500,000 to $749,999 | 2,177 (50.6%) | 3,827 (62.5%) |
| $750,000 to $999,999 | 345 (8.0%) | 927 (15.1%) |
| $1,000,000 or more | 51 (1.2%) | 149 (2.4%) |
| Total | 4,299 (100.0%) | 6,119 (100.0%) |
Household Income by Mortgage Status in East Meadow
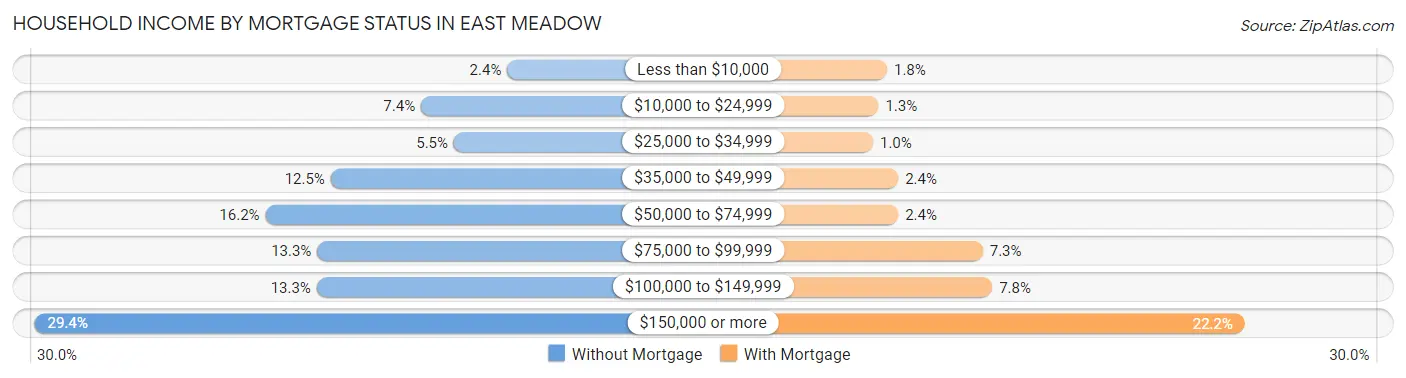
| Household Income | Without Mortgage | With Mortgage |
| Less than $10,000 | 104 (2.4%) | 110 (1.8%) |
| $10,000 to $24,999 | 316 (7.3%) | 80 (1.3%) |
| $25,000 to $34,999 | 235 (5.5%) | 61 (1.0%) |
| $35,000 to $49,999 | 538 (12.5%) | 149 (2.4%) |
| $50,000 to $74,999 | 698 (16.2%) | 149 (2.4%) |
| $75,000 to $99,999 | 571 (13.3%) | 445 (7.3%) |
| $100,000 to $149,999 | 572 (13.3%) | 478 (7.8%) |
| $150,000 or more | 1,265 (29.4%) | 1,361 (22.2%) |
| Total | 4,299 (100.0%) | 6,119 (100.0%) |
Property Value to Household Income Ratio in East Meadow
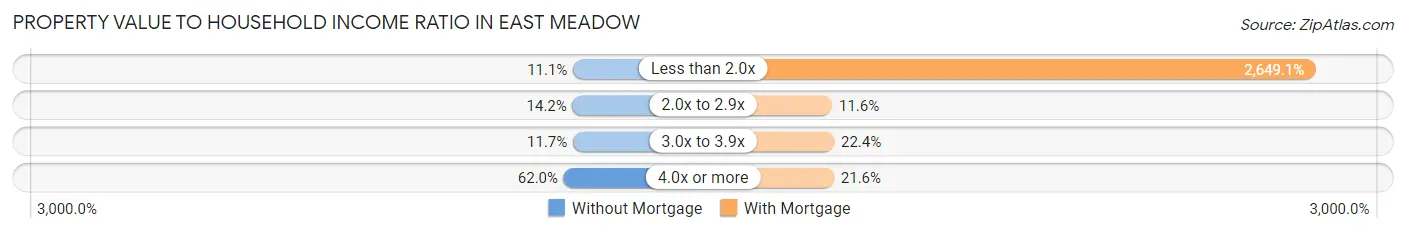
| Value-to-Income Ratio | Without Mortgage | With Mortgage |
| Less than 2.0x | 479 (11.1%) | 162,096 (2,649.1%) |
| 2.0x to 2.9x | 610 (14.2%) | 708 (11.6%) |
| 3.0x to 3.9x | 502 (11.7%) | 1,368 (22.4%) |
| 4.0x or more | 2,666 (62.0%) | 1,321 (21.6%) |
| Total | 4,299 (100.0%) | 6,119 (100.0%) |
Real Estate Taxes by Mortgage Status in East Meadow
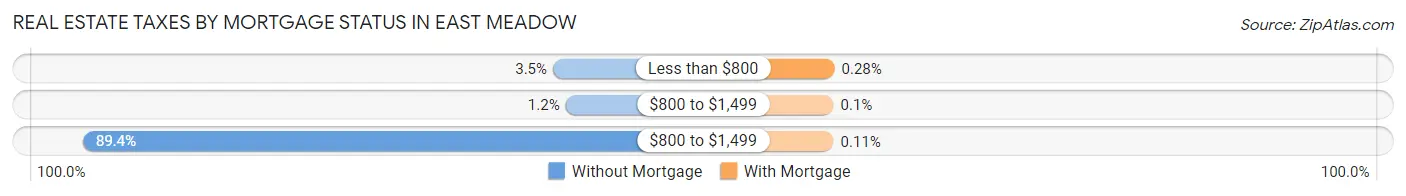
| Property Taxes | Without Mortgage | With Mortgage |
| Less than $800 | 151 (3.5%) | 17 (0.3%) |
| $800 to $1,499 | 52 (1.2%) | 6 (0.1%) |
| $800 to $1,499 | 3,842 (89.4%) | 7 (0.1%) |
| Total | 4,299 (100.0%) | 6,119 (100.0%) |
Health & Disability in East Meadow
Health Insurance Coverage by Age in East Meadow
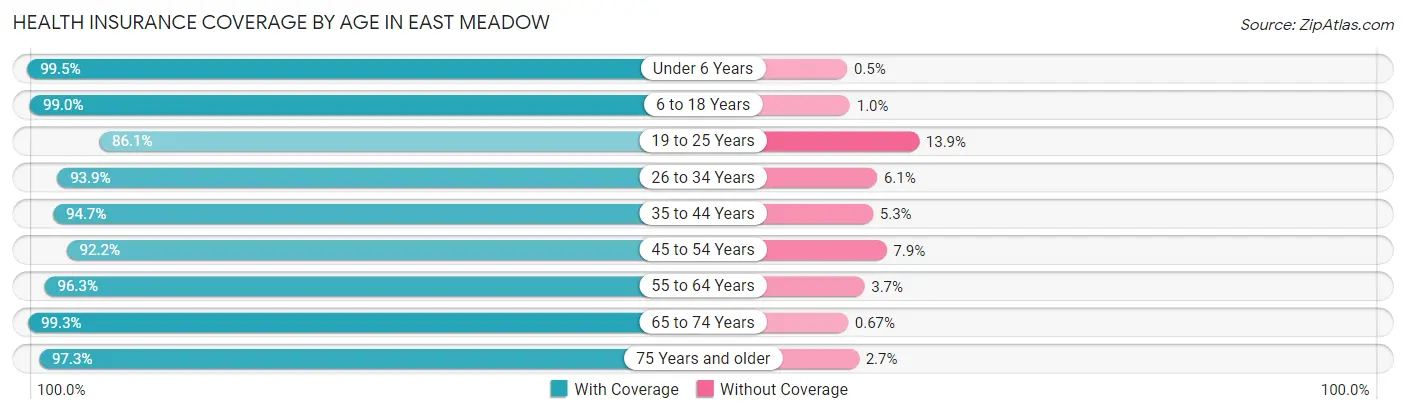
| Age Bracket | With Coverage | Without Coverage |
| Under 6 Years | 2,595 (99.5%) | 13 (0.5%) |
| 6 to 18 Years | 5,506 (99.0%) | 57 (1.0%) |
| 19 to 25 Years | 2,367 (86.1%) | 382 (13.9%) |
| 26 to 34 Years | 3,376 (93.9%) | 219 (6.1%) |
| 35 to 44 Years | 3,966 (94.7%) | 223 (5.3%) |
| 45 to 54 Years | 4,214 (92.1%) | 359 (7.9%) |
| 55 to 64 Years | 4,468 (96.3%) | 173 (3.7%) |
| 65 to 74 Years | 4,124 (99.3%) | 28 (0.7%) |
| 75 Years and older | 3,580 (97.3%) | 99 (2.7%) |
| Total | 34,196 (95.7%) | 1,553 (4.3%) |
Health Insurance Coverage by Citizenship Status in East Meadow
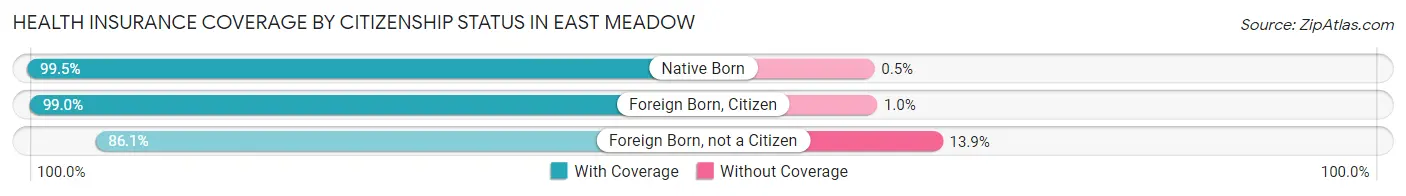
| Citizenship Status | With Coverage | Without Coverage |
| Native Born | 2,595 (99.5%) | 13 (0.5%) |
| Foreign Born, Citizen | 5,506 (99.0%) | 57 (1.0%) |
| Foreign Born, not a Citizen | 2,367 (86.1%) | 382 (13.9%) |
Health Insurance Coverage by Household Income in East Meadow
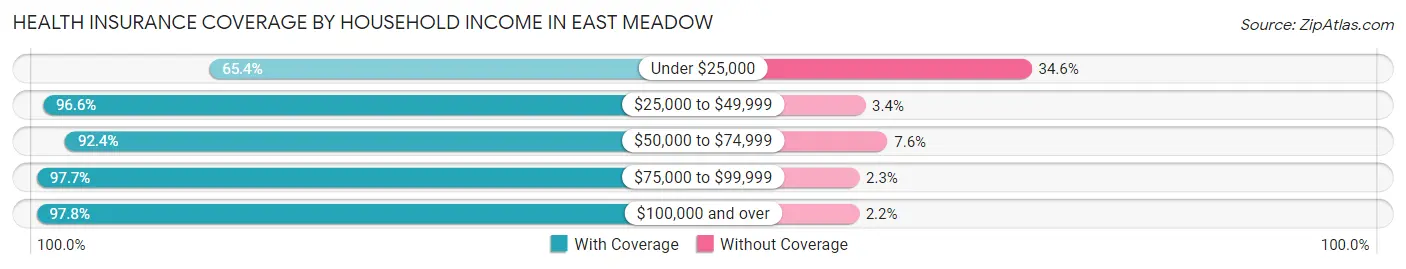
| Household Income | With Coverage | Without Coverage |
| Under $25,000 | 1,143 (65.4%) | 605 (34.6%) |
| $25,000 to $49,999 | 2,330 (96.6%) | 83 (3.4%) |
| $50,000 to $74,999 | 2,787 (92.4%) | 229 (7.6%) |
| $75,000 to $99,999 | 2,999 (97.7%) | 71 (2.3%) |
| $100,000 and over | 24,785 (97.8%) | 565 (2.2%) |
Public vs Private Health Insurance Coverage by Age in East Meadow
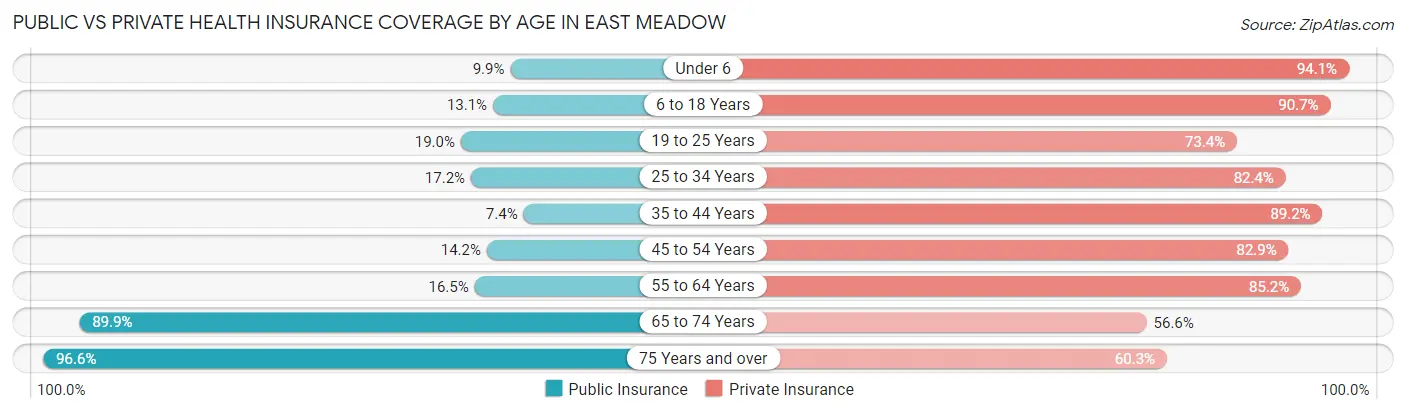
| Age Bracket | Public Insurance | Private Insurance |
| Under 6 | 257 (9.9%) | 2,455 (94.1%) |
| 6 to 18 Years | 727 (13.1%) | 5,045 (90.7%) |
| 19 to 25 Years | 523 (19.0%) | 2,017 (73.4%) |
| 25 to 34 Years | 617 (17.2%) | 2,962 (82.4%) |
| 35 to 44 Years | 310 (7.4%) | 3,737 (89.2%) |
| 45 to 54 Years | 650 (14.2%) | 3,792 (82.9%) |
| 55 to 64 Years | 765 (16.5%) | 3,956 (85.2%) |
| 65 to 74 Years | 3,731 (89.9%) | 2,349 (56.6%) |
| 75 Years and over | 3,553 (96.6%) | 2,220 (60.3%) |
| Total | 11,133 (31.1%) | 28,533 (79.8%) |
Disability Status by Sex by Age in East Meadow
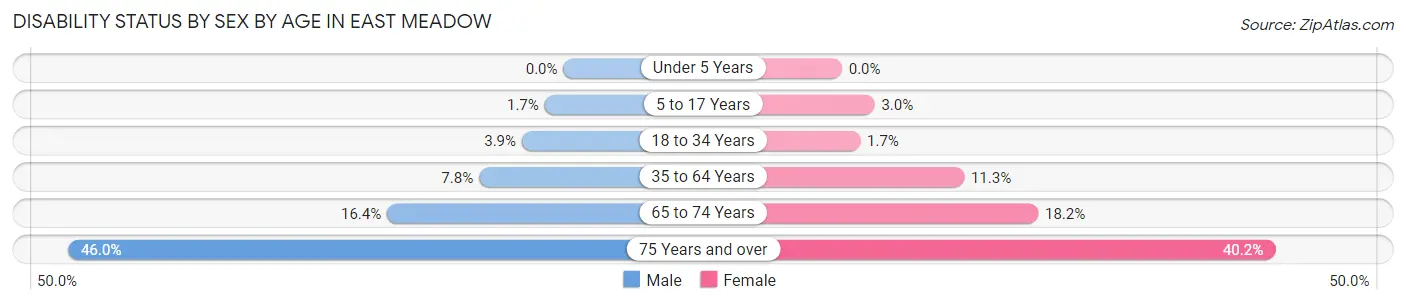
| Age Bracket | Male | Female |
| Under 5 Years | 0 (0.0%) | 0 (0.0%) |
| 5 to 17 Years | 39 (1.7%) | 95 (3.0%) |
| 18 to 34 Years | 120 (3.8%) | 65 (1.7%) |
| 35 to 64 Years | 472 (7.8%) | 836 (11.3%) |
| 65 to 74 Years | 364 (16.4%) | 351 (18.2%) |
| 75 Years and over | 645 (46.0%) | 915 (40.2%) |
Disability Class by Sex by Age in East Meadow
Disability Class: Hearing Difficulty
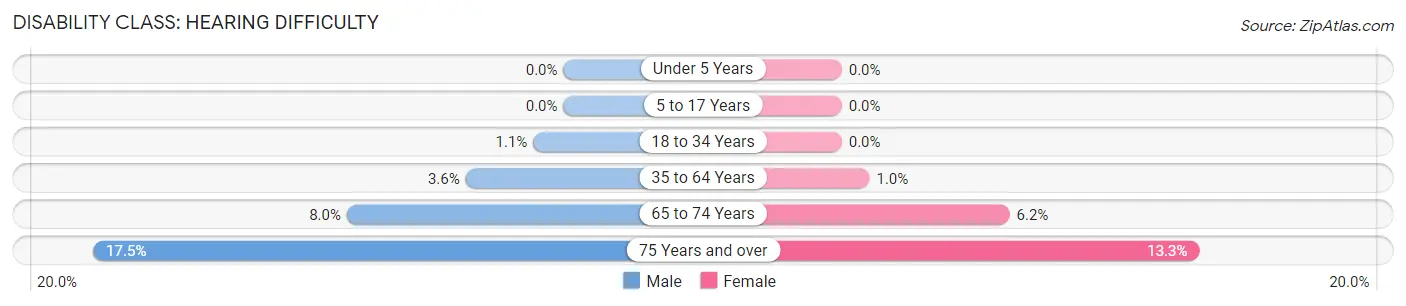
| Age Bracket | Male | Female |
| Under 5 Years | 0 (0.0%) | 0 (0.0%) |
| 5 to 17 Years | 0 (0.0%) | 0 (0.0%) |
| 18 to 34 Years | 35 (1.1%) | 0 (0.0%) |
| 35 to 64 Years | 219 (3.6%) | 76 (1.0%) |
| 65 to 74 Years | 179 (8.0%) | 120 (6.2%) |
| 75 Years and over | 245 (17.5%) | 302 (13.3%) |
Disability Class: Vision Difficulty
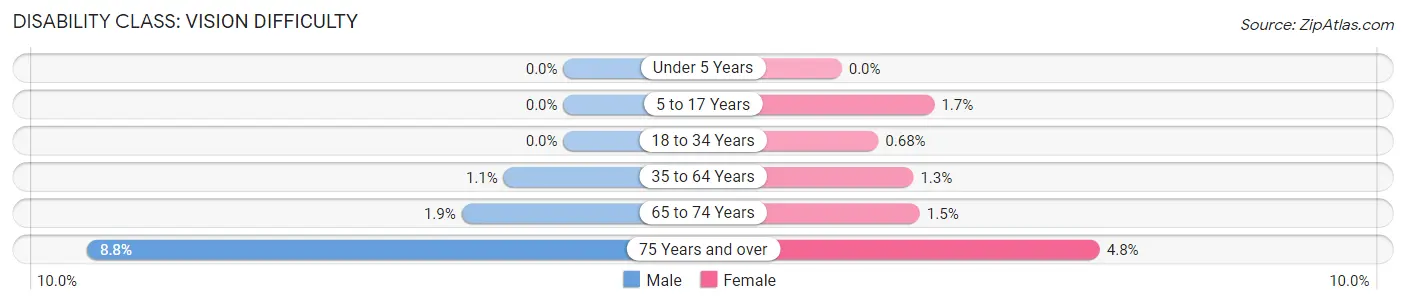
| Age Bracket | Male | Female |
| Under 5 Years | 0 (0.0%) | 0 (0.0%) |
| 5 to 17 Years | 0 (0.0%) | 54 (1.7%) |
| 18 to 34 Years | 0 (0.0%) | 26 (0.7%) |
| 35 to 64 Years | 67 (1.1%) | 98 (1.3%) |
| 65 to 74 Years | 42 (1.9%) | 28 (1.5%) |
| 75 Years and over | 124 (8.8%) | 109 (4.8%) |
Disability Class: Cognitive Difficulty
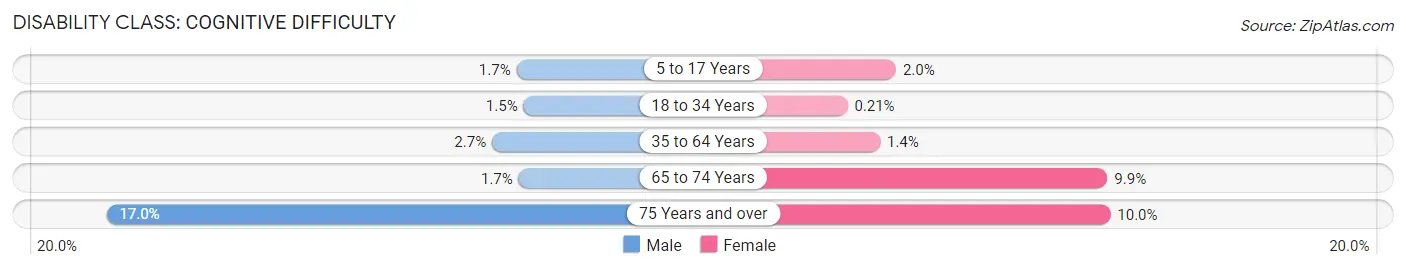
| Age Bracket | Male | Female |
| 5 to 17 Years | 39 (1.7%) | 63 (2.0%) |
| 18 to 34 Years | 46 (1.5%) | 8 (0.2%) |
| 35 to 64 Years | 160 (2.6%) | 105 (1.4%) |
| 65 to 74 Years | 37 (1.7%) | 190 (9.9%) |
| 75 Years and over | 238 (17.0%) | 227 (10.0%) |
Disability Class: Ambulatory Difficulty
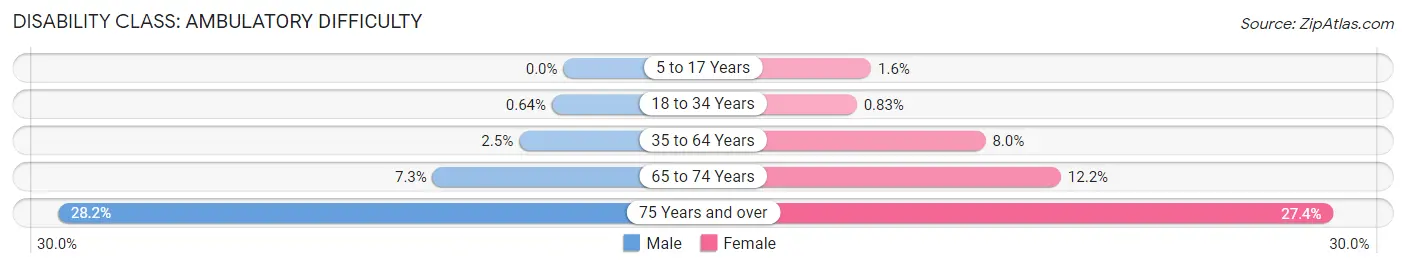
| Age Bracket | Male | Female |
| 5 to 17 Years | 0 (0.0%) | 51 (1.6%) |
| 18 to 34 Years | 20 (0.6%) | 32 (0.8%) |
| 35 to 64 Years | 149 (2.5%) | 590 (8.0%) |
| 65 to 74 Years | 162 (7.3%) | 235 (12.2%) |
| 75 Years and over | 395 (28.1%) | 623 (27.4%) |
Disability Class: Self-Care Difficulty
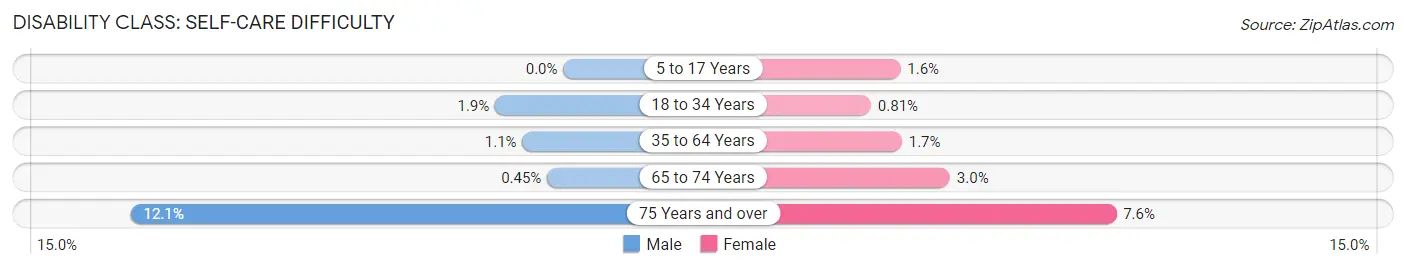
| Age Bracket | Male | Female |
| 5 to 17 Years | 0 (0.0%) | 51 (1.6%) |
| 18 to 34 Years | 59 (1.9%) | 31 (0.8%) |
| 35 to 64 Years | 69 (1.1%) | 123 (1.7%) |
| 65 to 74 Years | 10 (0.4%) | 58 (3.0%) |
| 75 Years and over | 169 (12.0%) | 174 (7.6%) |
Technology Access in East Meadow
Computing Device Access in East Meadow
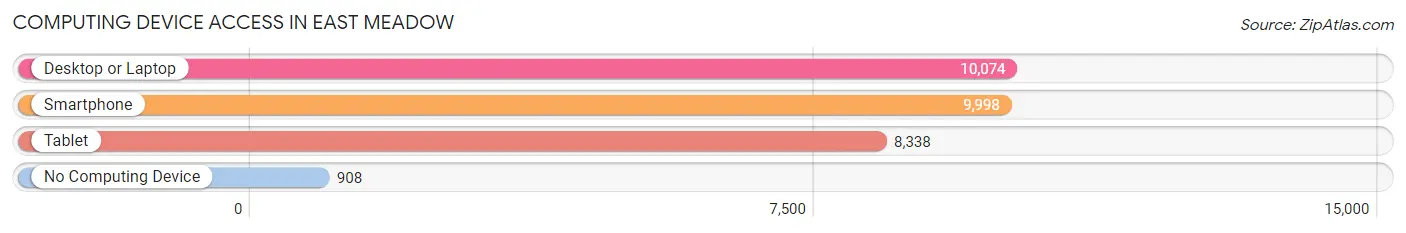
| Device Type | # Households | % Households |
| Desktop or Laptop | 10,074 | 86.0% |
| Smartphone | 9,998 | 85.3% |
| Tablet | 8,338 | 71.2% |
| No Computing Device | 908 | 7.7% |
| Total | 11,716 | 100.0% |
Internet Access in East Meadow
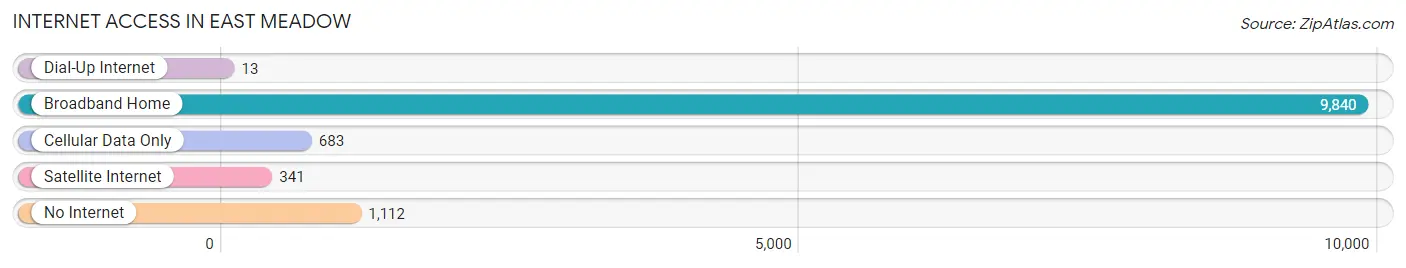
| Internet Type | # Households | % Households |
| Dial-Up Internet | 13 | 0.1% |
| Broadband Home | 9,840 | 84.0% |
| Cellular Data Only | 683 | 5.8% |
| Satellite Internet | 341 | 2.9% |
| No Internet | 1,112 | 9.5% |
| Total | 11,716 | 100.0% |
East Meadow Summary
History
East Meadow is a hamlet and census-designated place (CDP) located in Nassau County, New York, United States. It is located in the Town of Hempstead, and is part of the Greater New York City metropolitan area. The hamlet was first settled in 1655 by English settlers, and was originally known as “East Meadow”. The name was changed to “East Meadow” in 1875.
East Meadow was originally part of the Hempstead Plains, a large grassy area that was used by the local Native American tribes for hunting and gathering. The area was also used by the British during the Revolutionary War as a staging area for their troops.
In the late 19th century, East Meadow began to develop as a residential community. The first post office was established in 1875, and the first school was built in 1877. The hamlet was incorporated as a village in 1891, and the first fire department was established in 1895.
In the early 20th century, East Meadow continued to grow as a residential community. The hamlet was annexed by the Town of Hempstead in 1925, and the first public library was established in 1927.
Geography
East Meadow is located in the Town of Hempstead in Nassau County, New York. It is bordered by the hamlets of Levittown to the north, North Bellmore to the east, North Merrick to the south, and Wantagh to the west.
The hamlet is located on the Hempstead Plains, a large grassy area that was used by the local Native American tribes for hunting and gathering. The area is now mostly residential, with some commercial development.
East Meadow is located approximately 25 miles east of Manhattan, and is part of the Greater New York City metropolitan area. The hamlet is served by the Long Island Rail Road, and is accessible via the Wantagh State Parkway and the Meadowbrook State Parkway.
Economy
East Meadow is a primarily residential community, with some commercial development. The hamlet is home to several large employers, including Northwell Health, a large healthcare provider, and the Nassau County Department of Social Services.
The hamlet is also home to several shopping centers, including the East Meadow Mall and the East Meadow Shopping Center. The hamlet is also home to several restaurants, including the popular East Meadow Diner.
Demographics
As of the 2010 census, East Meadow had a population of 38,132. The racial makeup of the hamlet was 79.2% White, 8.3% African American, 0.3% Native American, 6.2% Asian, and 4.9% from other races. Hispanic or Latino of any race were 13.3% of the population.
The median household income in East Meadow was $90,945, and the median family income was $103,945. The per capita income was $37,945. About 4.2% of families and 5.7% of the population were below the poverty line, including 6.7% of those under age 18 and 4.2% of those age 65 or over.
Common Questions
What is Per Capita Income in East Meadow?
Per Capita income in East Meadow is $49,776.
What is the Median Family Income in East Meadow?
Median Family Income in East Meadow is $149,719.
What is the Median Household income in East Meadow?
Median Household Income in East Meadow is $129,268.
What is Income or Wage Gap in East Meadow?
Income or Wage Gap in East Meadow is 21.3%.
Women in East Meadow earn 78.7 cents for every dollar earned by a man.
What is Inequality or Gini Index in East Meadow?
Inequality or Gini Index in East Meadow is 0.40.
What is the Total Population of East Meadow?
Total Population of East Meadow is 36,856.
What is the Total Male Population of East Meadow?
Total Male Population of East Meadow is 17,028.
What is the Total Female Population of East Meadow?
Total Female Population of East Meadow is 19,828.
What is the Ratio of Males per 100 Females in East Meadow?
There are 85.88 Males per 100 Females in East Meadow.
What is the Ratio of Females per 100 Males in East Meadow?
There are 116.44 Females per 100 Males in East Meadow.
What is the Median Population Age in East Meadow?
Median Population Age in East Meadow is 42.3 Years.
What is the Average Family Size in East Meadow
Average Family Size in East Meadow is 3.5 People.
What is the Average Household Size in East Meadow
Average Household Size in East Meadow is 3.0 People.
How Large is the Labor Force in East Meadow?
There are 17,664 People in the Labor Forcein in East Meadow.
What is the Percentage of People in the Labor Force in East Meadow?
58.7% of People are in the Labor Force in East Meadow.
What is the Unemployment Rate in East Meadow?
Unemployment Rate in East Meadow is 3.4%.