West Seneca, NY Map & Demographics
West Seneca Map
West Seneca Overview
$40,320
PER CAPITA INCOME
$99,008
AVG FAMILY INCOME
$75,435
AVG HOUSEHOLD INCOME
32.9%
WAGE / INCOME GAP [ % ]
67.1¢/ $1
WAGE / INCOME GAP [ $ ]
0.39
INEQUALITY / GINI INDEX
45,387
TOTAL POPULATION
21,615
MALE POPULATION
23,772
FEMALE POPULATION
90.93
MALES / 100 FEMALES
109.98
FEMALES / 100 MALES
44.6
MEDIAN AGE
2.9
AVG FAMILY SIZE
2.2
AVG HOUSEHOLD SIZE
25,327
LABOR FORCE [ PEOPLE ]
66.0%
PERCENT IN LABOR FORCE
4.4%
UNEMPLOYMENT RATE
West Seneca Area Codes
Income in West Seneca
Income Overview in West Seneca
Per Capita Income in West Seneca is $40,320, while median incomes of families and households are $99,008 and $75,435 respectively.
| Characteristic | Number | Measure |
| Per Capita Income | 45,387 | $40,320 |
| Median Family Income | 11,920 | $99,008 |
| Mean Family Income | 11,920 | $111,973 |
| Median Household Income | 20,016 | $75,435 |
| Mean Household Income | 20,016 | $90,905 |
| Income Deficit | 11,920 | $0 |
| Wage / Income Gap (%) | 45,387 | 32.94% |
| Wage / Income Gap ($) | 45,387 | 67.06¢ per $1 |
| Gini / Inequality Index | 45,387 | 0.39 |
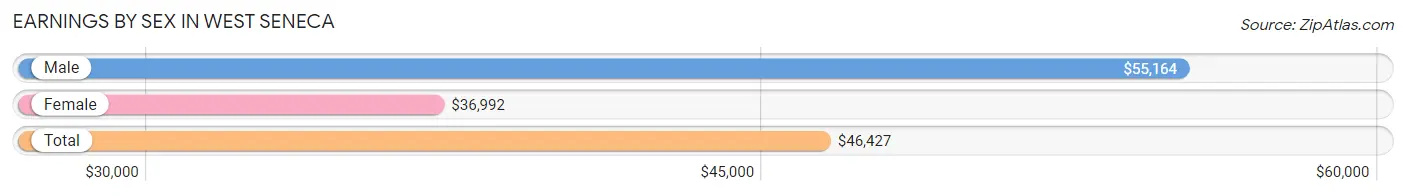
Earnings by Sex in West Seneca
Average Earnings in West Seneca are $46,427, $55,164 for men and $36,992 for women, a difference of 32.9%.
| Sex | Number | Average Earnings |
| Male | 13,197 (50.6%) | $55,164 |
| Female | 12,860 (49.3%) | $36,992 |
| Total | 26,057 (100.0%) | $46,427 |
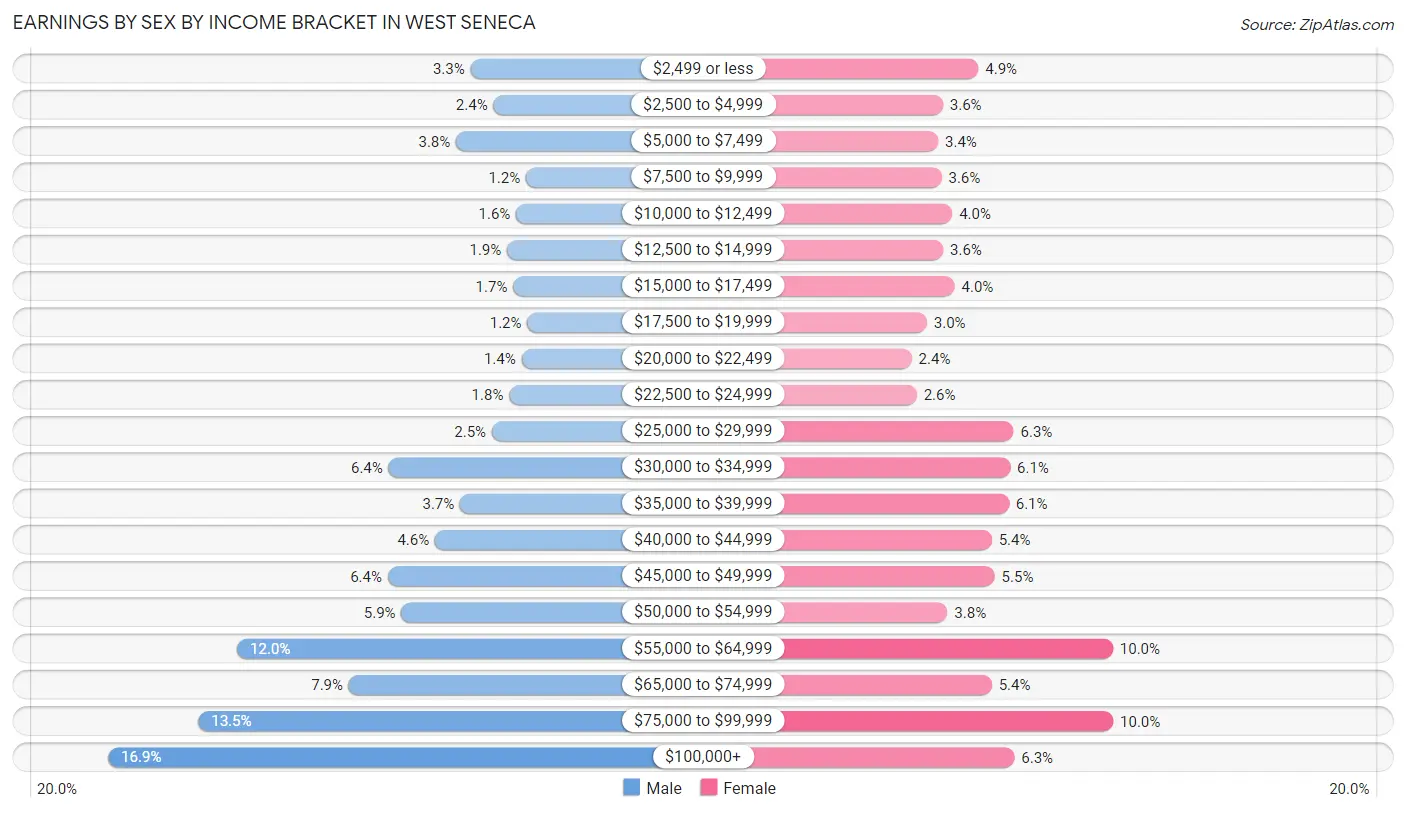
Earnings by Sex by Income Bracket in West Seneca
The most common earnings brackets in West Seneca are $100,000+ for men (2,226 | 16.9%) and $75,000 to $99,999 for women (1,284 | 10.0%).
| Income | Male | Female |
| $2,499 or less | 434 (3.3%) | 634 (4.9%) |
| $2,500 to $4,999 | 321 (2.4%) | 463 (3.6%) |
| $5,000 to $7,499 | 506 (3.8%) | 440 (3.4%) |
| $7,500 to $9,999 | 160 (1.2%) | 456 (3.5%) |
| $10,000 to $12,499 | 209 (1.6%) | 508 (4.0%) |
| $12,500 to $14,999 | 254 (1.9%) | 464 (3.6%) |
| $15,000 to $17,499 | 223 (1.7%) | 520 (4.0%) |
| $17,500 to $19,999 | 153 (1.2%) | 386 (3.0%) |
| $20,000 to $22,499 | 182 (1.4%) | 313 (2.4%) |
| $22,500 to $24,999 | 243 (1.8%) | 337 (2.6%) |
| $25,000 to $29,999 | 328 (2.5%) | 804 (6.2%) |
| $30,000 to $34,999 | 839 (6.4%) | 787 (6.1%) |
| $35,000 to $39,999 | 485 (3.7%) | 780 (6.1%) |
| $40,000 to $44,999 | 610 (4.6%) | 698 (5.4%) |
| $45,000 to $49,999 | 843 (6.4%) | 713 (5.5%) |
| $50,000 to $54,999 | 776 (5.9%) | 485 (3.8%) |
| $55,000 to $64,999 | 1,589 (12.0%) | 1,282 (10.0%) |
| $65,000 to $74,999 | 1,036 (7.9%) | 698 (5.4%) |
| $75,000 to $99,999 | 1,780 (13.5%) | 1,284 (10.0%) |
| $100,000+ | 2,226 (16.9%) | 808 (6.3%) |
| Total | 13,197 (100.0%) | 12,860 (100.0%) |
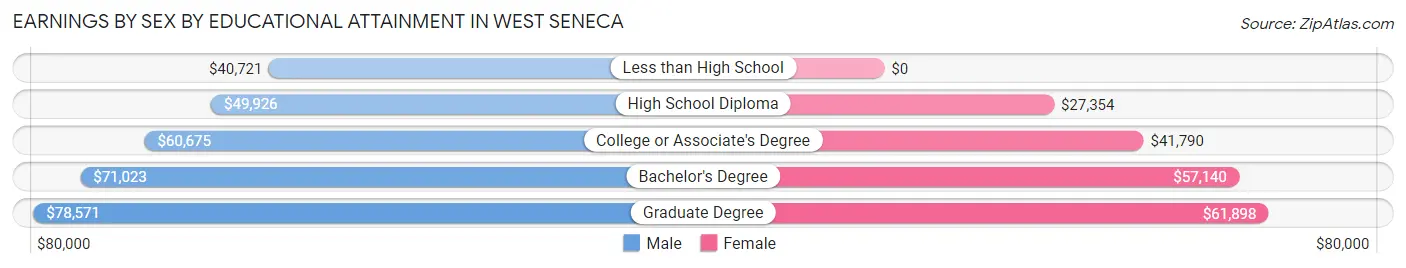
Earnings by Sex by Educational Attainment in West Seneca
Average earnings in West Seneca are $59,563 for men and $43,590 for women, a difference of 26.8%. Men with an educational attainment of graduate degree enjoy the highest average annual earnings of $78,571, while those with less than high school education earn the least with $40,721. Women with an educational attainment of graduate degree earn the most with the average annual earnings of $61,898, while those with high school diploma education have the smallest earnings of $27,354.
| Educational Attainment | Male Income | Female Income |
| Less than High School | $40,721 | $0 |
| High School Diploma | $49,926 | $27,354 |
| College or Associate's Degree | $60,675 | $41,790 |
| Bachelor's Degree | $71,023 | $57,140 |
| Graduate Degree | $78,571 | $61,898 |
| Total | $59,563 | $43,590 |
Family Income in West Seneca
Family Income Brackets in West Seneca
According to the West Seneca family income data, there are 3,218 families falling into the $100,000 to $149,999 income range, which is the most common income bracket and makes up 27.0% of all families. Conversely, the less than $10,000 income bracket is the least frequent group with only 48 families (0.4%) belonging to this category.
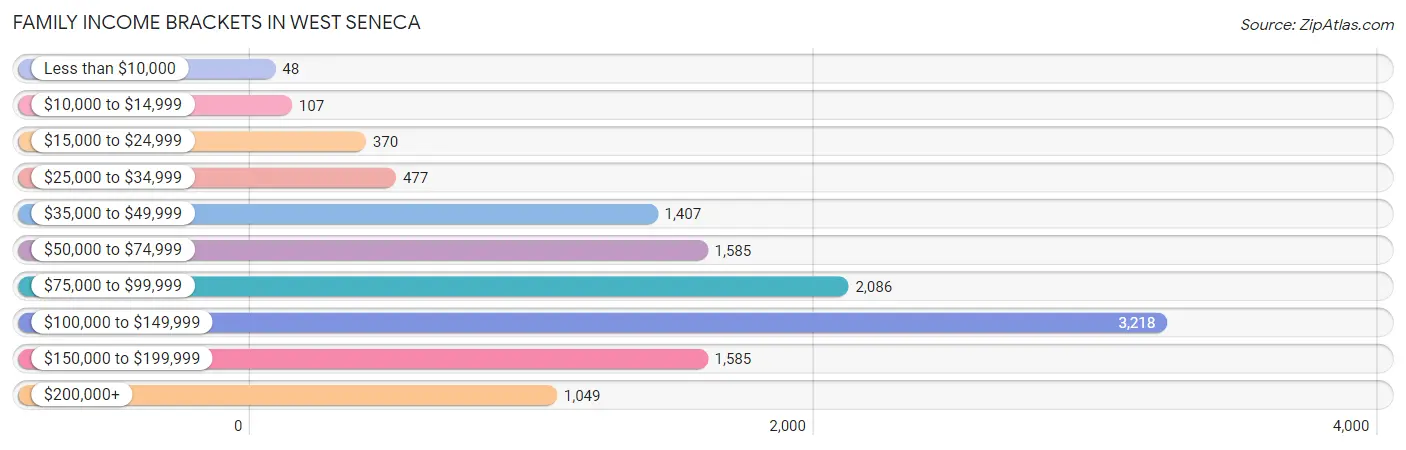
| Income Bracket | # Families | % Families |
| Less than $10,000 | 48 | 0.4% |
| $10,000 to $14,999 | 107 | 0.9% |
| $15,000 to $24,999 | 370 | 3.1% |
| $25,000 to $34,999 | 477 | 4.0% |
| $35,000 to $49,999 | 1,407 | 11.8% |
| $50,000 to $74,999 | 1,585 | 13.3% |
| $75,000 to $99,999 | 2,086 | 17.5% |
| $100,000 to $149,999 | 3,218 | 27.0% |
| $150,000 to $199,999 | 1,585 | 13.3% |
| $200,000+ | 1,049 | 8.8% |
Family Income by Famaliy Size in West Seneca
5-person families (845 | 7.1%) account for the highest median family income in West Seneca with $128,973 per family, while 2-person families (6,348 | 53.3%) have the highest median income of $41,519 per family member.
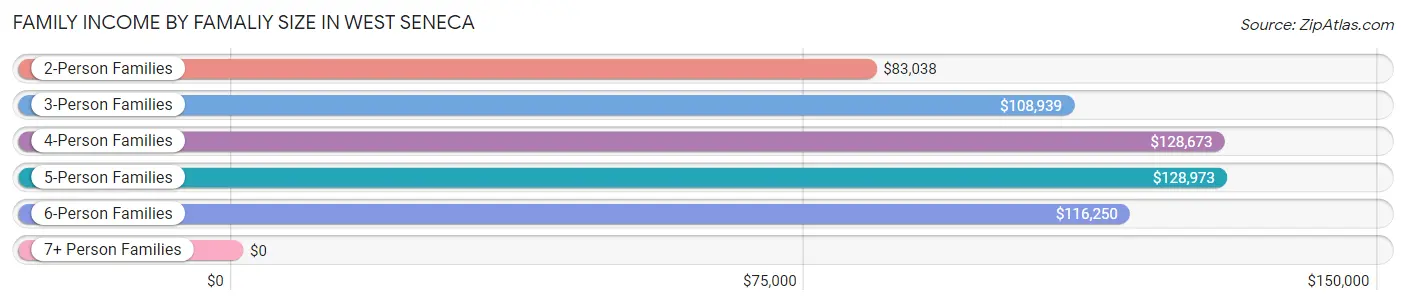
| Income Bracket | # Families | Median Income |
| 2-Person Families | 6,348 (53.3%) | $83,038 |
| 3-Person Families | 2,414 (20.3%) | $108,939 |
| 4-Person Families | 1,958 (16.4%) | $128,673 |
| 5-Person Families | 845 (7.1%) | $128,973 |
| 6-Person Families | 322 (2.7%) | $116,250 |
| 7+ Person Families | 33 (0.3%) | $0 |
| Total | 11,920 (100.0%) | $99,008 |
Family Income by Number of Earners in West Seneca
The median family income in West Seneca is $99,008, with families comprising 3+ earners (1,657) having the highest median family income of $155,785, while families with no earners (1,864) have the lowest median family income of $51,641, accounting for 13.9% and 15.6% of families, respectively.
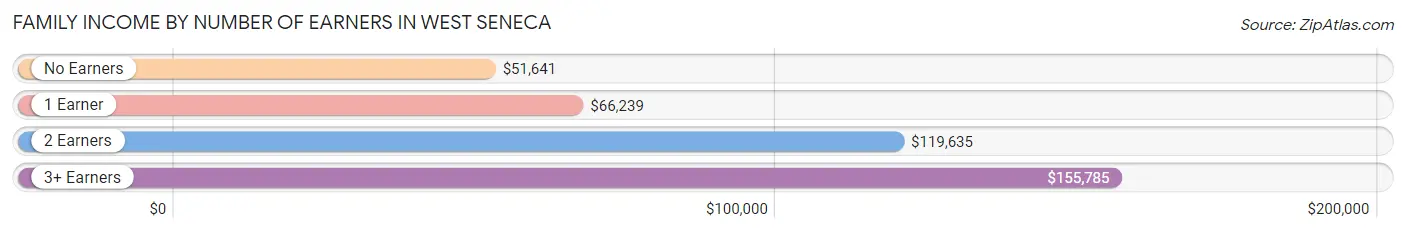
| Number of Earners | # Families | Median Income |
| No Earners | 1,864 (15.6%) | $51,641 |
| 1 Earner | 3,317 (27.8%) | $66,239 |
| 2 Earners | 5,082 (42.6%) | $119,635 |
| 3+ Earners | 1,657 (13.9%) | $155,785 |
| Total | 11,920 (100.0%) | $99,008 |
Household Income in West Seneca
Household Income Brackets in West Seneca
With 3,823 households falling in the category, the $100,000 to $149,999 income range is the most frequent in West Seneca, accounting for 19.1% of all households. In contrast, only 520 households (2.6%) fall into the less than $10,000 income bracket, making it the least populous group.
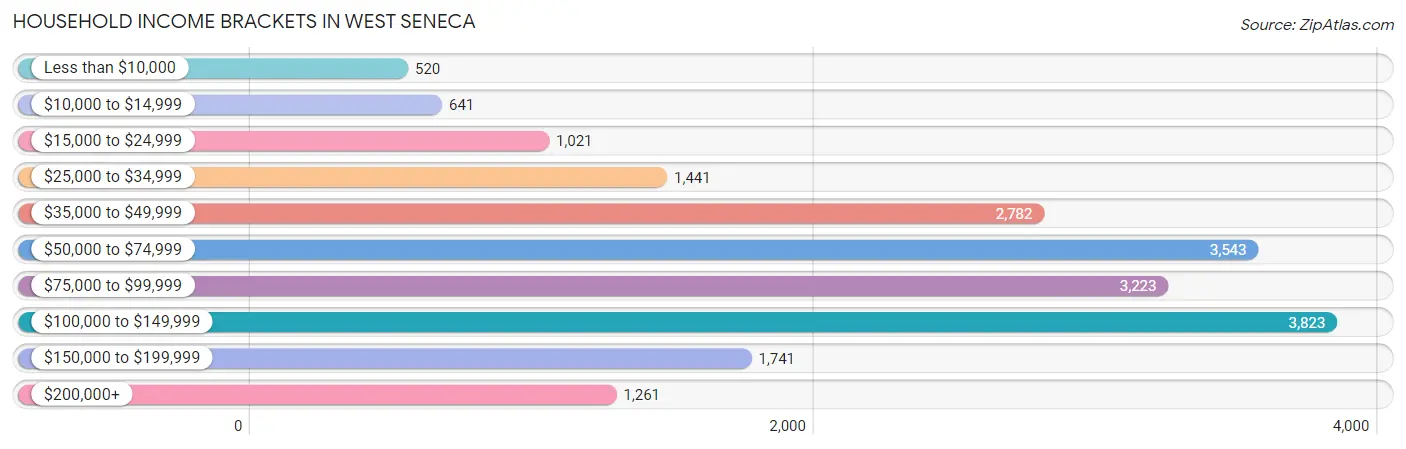
| Income Bracket | # Households | % Households |
| Less than $10,000 | 520 | 2.6% |
| $10,000 to $14,999 | 641 | 3.2% |
| $15,000 to $24,999 | 1,021 | 5.1% |
| $25,000 to $34,999 | 1,441 | 7.2% |
| $35,000 to $49,999 | 2,782 | 13.9% |
| $50,000 to $74,999 | 3,543 | 17.7% |
| $75,000 to $99,999 | 3,223 | 16.1% |
| $100,000 to $149,999 | 3,823 | 19.1% |
| $150,000 to $199,999 | 1,741 | 8.7% |
| $200,000+ | 1,261 | 6.3% |
Household Income by Householder Age in West Seneca
The median household income in West Seneca is $75,435, with the highest median household income of $93,653 found in the 45 to 64 years age bracket for the primary householder. A total of 7,791 households (38.9%) fall into this category. Meanwhile, the 15 to 24 years age bracket for the primary householder has the lowest median household income of $42,434, with 487 households (2.4%) in this group.
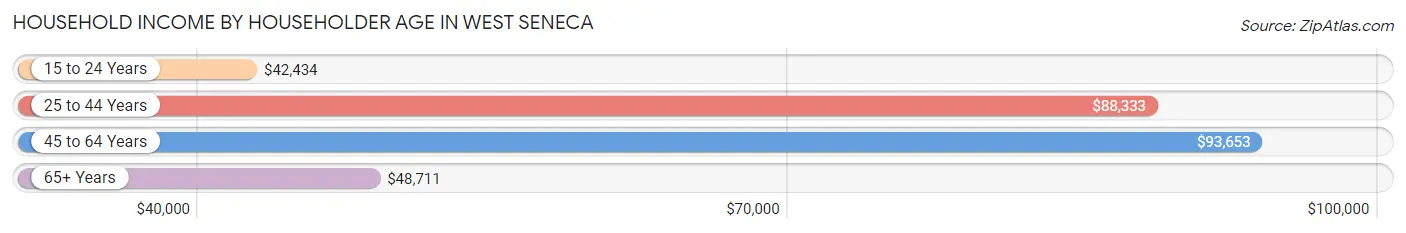
| Income Bracket | # Households | Median Income |
| 15 to 24 Years | 487 (2.4%) | $42,434 |
| 25 to 44 Years | 5,440 (27.2%) | $88,333 |
| 45 to 64 Years | 7,791 (38.9%) | $93,653 |
| 65+ Years | 6,298 (31.5%) | $48,711 |
| Total | 20,016 (100.0%) | $75,435 |
Poverty in West Seneca
Income Below Poverty by Sex and Age in West Seneca
With 5.8% poverty level for males and 8.6% for females among the residents of West Seneca, 5 year old males and 15 year old females are the most vulnerable to poverty, with 30 males (10.1%) and 83 females (25.9%) in their respective age groups living below the poverty level.
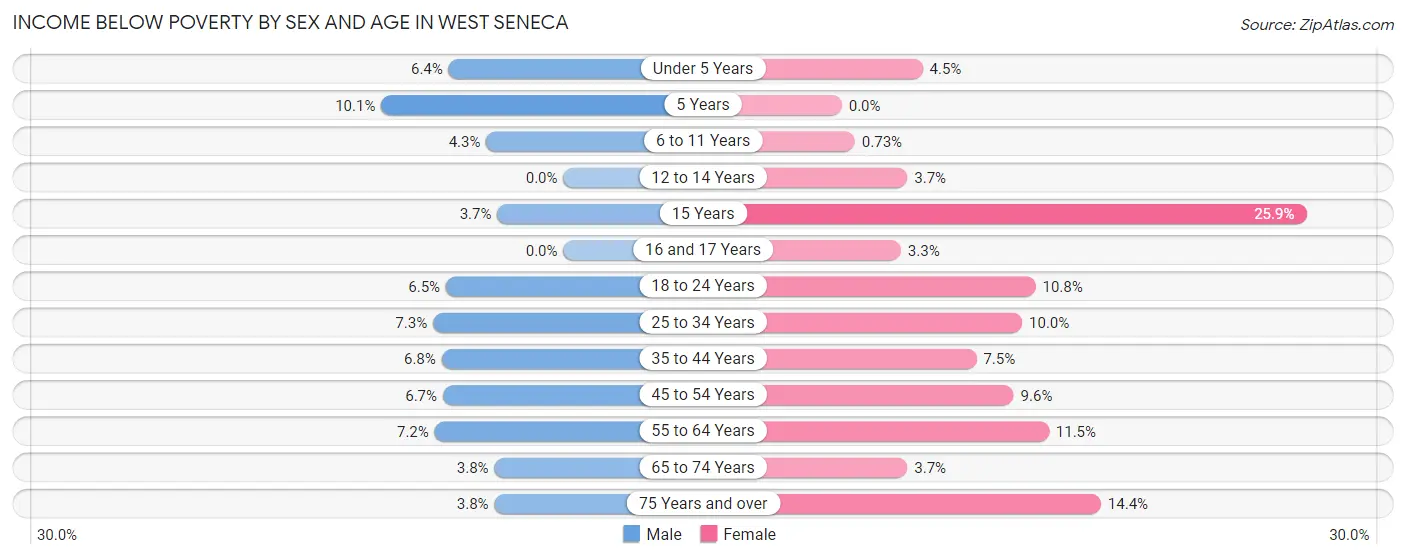
| Age Bracket | Male | Female |
| Under 5 Years | 56 (6.4%) | 60 (4.5%) |
| 5 Years | 30 (10.1%) | 0 (0.0%) |
| 6 to 11 Years | 41 (4.3%) | 10 (0.7%) |
| 12 to 14 Years | 0 (0.0%) | 24 (3.6%) |
| 15 Years | 7 (3.7%) | 83 (25.9%) |
| 16 and 17 Years | 0 (0.0%) | 22 (3.3%) |
| 18 to 24 Years | 103 (6.5%) | 197 (10.8%) |
| 25 to 34 Years | 224 (7.3%) | 298 (10.0%) |
| 35 to 44 Years | 175 (6.8%) | 184 (7.5%) |
| 45 to 54 Years | 219 (6.7%) | 284 (9.6%) |
| 55 to 64 Years | 248 (7.2%) | 399 (11.5%) |
| 65 to 74 Years | 91 (3.8%) | 105 (3.6%) |
| 75 Years and over | 57 (3.8%) | 361 (14.4%) |
| Total | 1,251 (5.8%) | 2,027 (8.6%) |
Income Above Poverty by Sex and Age in West Seneca
According to the poverty statistics in West Seneca, males aged 12 to 14 years and females aged 5 years are the age groups that are most secure financially, with 100.0% of males and 100.0% of females in these age groups living above the poverty line.
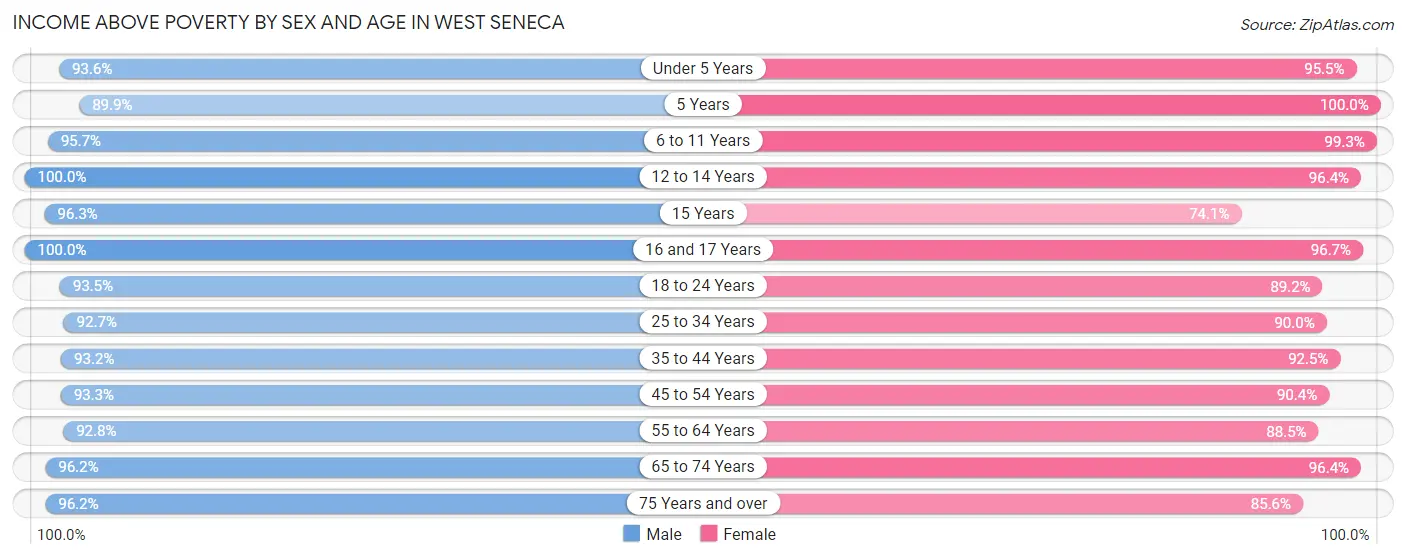
| Age Bracket | Male | Female |
| Under 5 Years | 820 (93.6%) | 1,274 (95.5%) |
| 5 Years | 266 (89.9%) | 164 (100.0%) |
| 6 to 11 Years | 914 (95.7%) | 1,367 (99.3%) |
| 12 to 14 Years | 699 (100.0%) | 633 (96.4%) |
| 15 Years | 183 (96.3%) | 238 (74.1%) |
| 16 and 17 Years | 678 (100.0%) | 647 (96.7%) |
| 18 to 24 Years | 1,472 (93.5%) | 1,629 (89.2%) |
| 25 to 34 Years | 2,863 (92.7%) | 2,671 (90.0%) |
| 35 to 44 Years | 2,407 (93.2%) | 2,269 (92.5%) |
| 45 to 54 Years | 3,046 (93.3%) | 2,684 (90.4%) |
| 55 to 64 Years | 3,209 (92.8%) | 3,062 (88.5%) |
| 65 to 74 Years | 2,280 (96.2%) | 2,768 (96.4%) |
| 75 Years and over | 1,429 (96.2%) | 2,140 (85.6%) |
| Total | 20,266 (94.2%) | 21,546 (91.4%) |
Income Below Poverty Among Married-Couple Families in West Seneca
The poverty statistics for married-couple families in West Seneca show that 1.7% or 150 of the total 8,815 families live below the poverty line. Families with 1 or 2 children have the highest poverty rate of 2.7%, comprising of 72 families. On the other hand, families with 5 or more children have the lowest poverty rate of 0.0%, which includes 0 families.
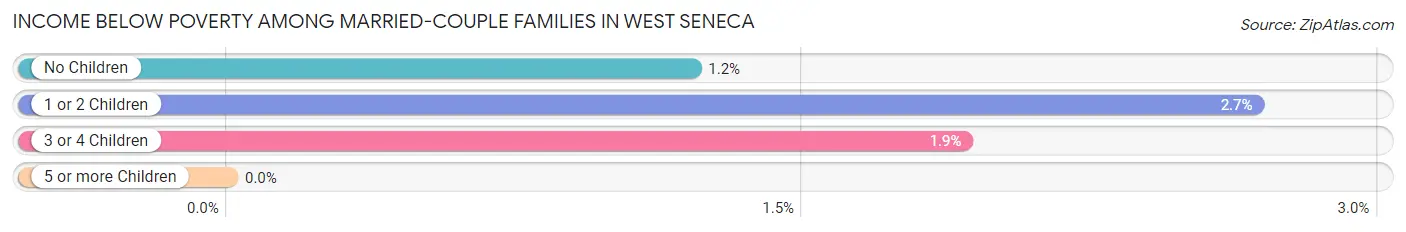
| Children | Above Poverty | Below Poverty |
| No Children | 5,467 (98.8%) | 67 (1.2%) |
| 1 or 2 Children | 2,615 (97.3%) | 72 (2.7%) |
| 3 or 4 Children | 561 (98.1%) | 11 (1.9%) |
| 5 or more Children | 22 (100.0%) | 0 (0.0%) |
| Total | 8,665 (98.3%) | 150 (1.7%) |
Income Below Poverty Among Single-Parent Households in West Seneca
According to the poverty data in West Seneca, 0.8% or 8 single-father households and 11.0% or 227 single-mother households are living below the poverty line. Among single-father households, those with no children have the highest poverty rate, with 8 households (1.5%) experiencing poverty. Likewise, among single-mother households, those with 1 or 2 children have the highest poverty rate, with 187 households (15.9%) falling below the poverty line.
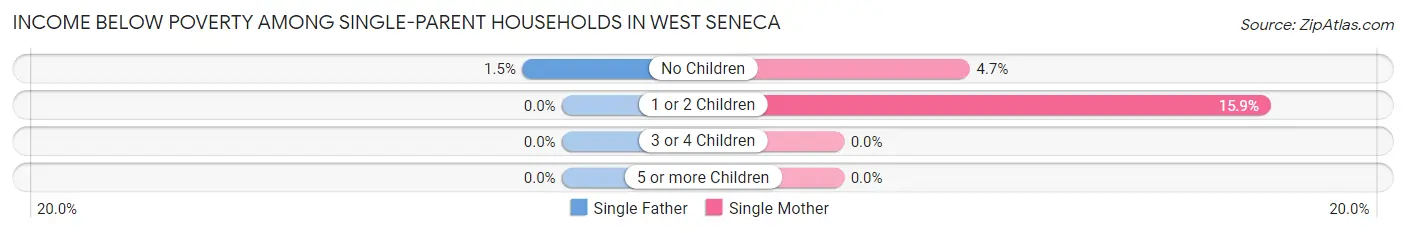
| Children | Single Father | Single Mother |
| No Children | 8 (1.5%) | 40 (4.7%) |
| 1 or 2 Children | 0 (0.0%) | 187 (15.9%) |
| 3 or 4 Children | 0 (0.0%) | 0 (0.0%) |
| 5 or more Children | 0 (0.0%) | 0 (0.0%) |
| Total | 8 (0.8%) | 227 (11.0%) |
Income Below Poverty Among Married-Couple vs Single-Parent Households in West Seneca
The poverty data for West Seneca shows that 150 of the married-couple family households (1.7%) and 235 of the single-parent households (7.6%) are living below the poverty level. Within the married-couple family households, those with 1 or 2 children have the highest poverty rate, with 72 households (2.7%) falling below the poverty line. Among the single-parent households, those with 1 or 2 children have the highest poverty rate, with 187 household (11.4%) living below poverty.
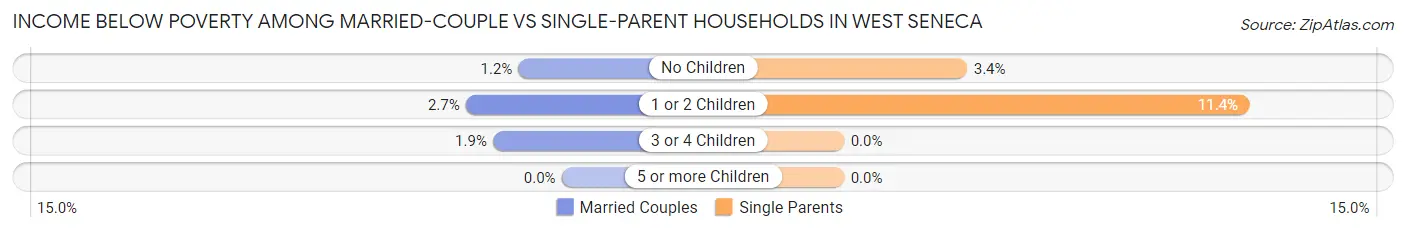
| Children | Married-Couple Families | Single-Parent Households |
| No Children | 67 (1.2%) | 48 (3.4%) |
| 1 or 2 Children | 72 (2.7%) | 187 (11.4%) |
| 3 or 4 Children | 11 (1.9%) | 0 (0.0%) |
| 5 or more Children | 0 (0.0%) | 0 (0.0%) |
| Total | 150 (1.7%) | 235 (7.6%) |
Race in West Seneca
The most populous races in West Seneca are White / Caucasian (42,768 | 94.2%), Hispanic or Latino (1,498 | 3.3%), and Two or more Races (1,131 | 2.5%).
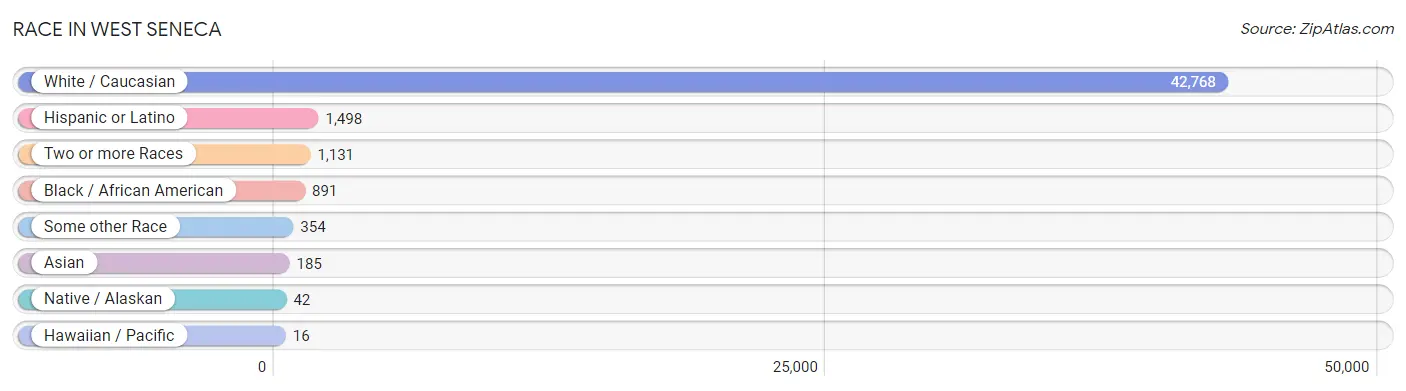
| Race | # Population | % Population |
| Asian | 185 | 0.4% |
| Black / African American | 891 | 2.0% |
| Hawaiian / Pacific | 16 | 0.0% |
| Hispanic or Latino | 1,498 | 3.3% |
| Native / Alaskan | 42 | 0.1% |
| White / Caucasian | 42,768 | 94.2% |
| Two or more Races | 1,131 | 2.5% |
| Some other Race | 354 | 0.8% |
| Total | 45,387 | 100.0% |
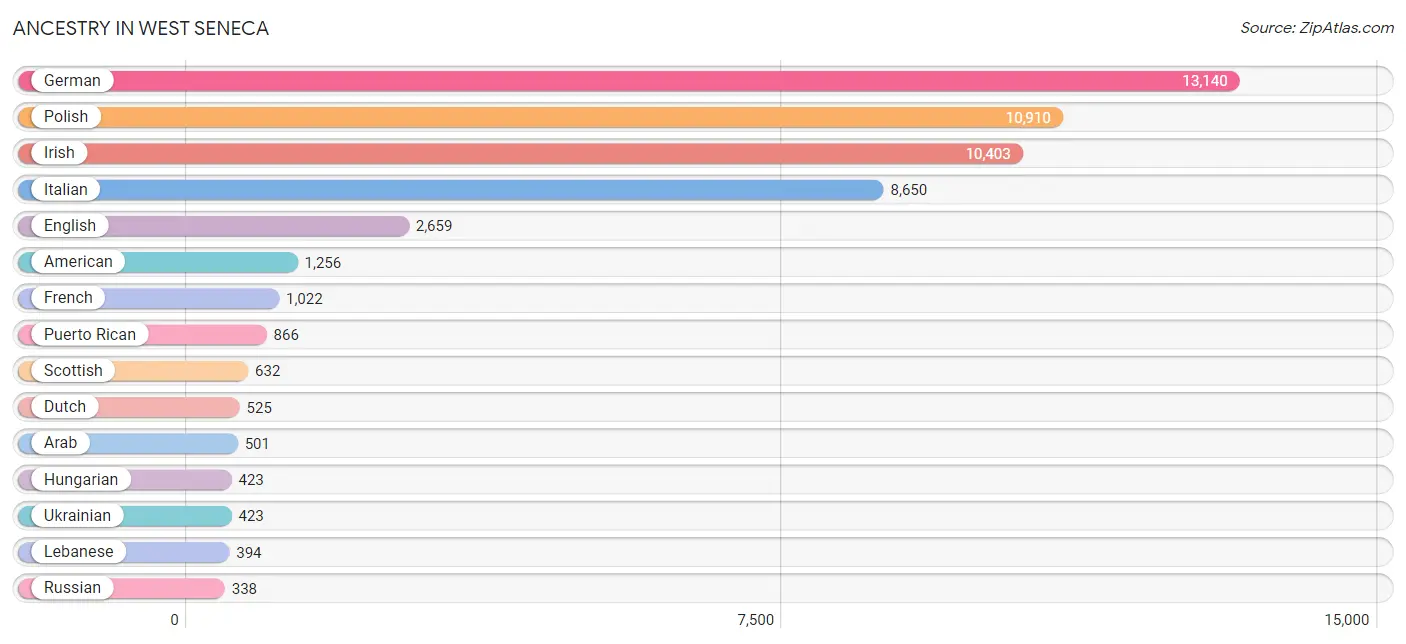
Ancestry in West Seneca
The most populous ancestries reported in West Seneca are German (13,140 | 28.9%), Polish (10,910 | 24.0%), Irish (10,403 | 22.9%), Italian (8,650 | 19.1%), and English (2,659 | 5.9%), together accounting for 100.8% of all West Seneca residents.
| Ancestry | # Population | % Population |
| African | 96 | 0.2% |
| Alaska Native | 4 | 0.0% |
| American | 1,256 | 2.8% |
| Arab | 501 | 1.1% |
| Austrian | 115 | 0.3% |
| Bhutanese | 14 | 0.0% |
| Blackfeet | 12 | 0.0% |
| British | 190 | 0.4% |
| Bulgarian | 16 | 0.0% |
| Burmese | 114 | 0.3% |
| Canadian | 98 | 0.2% |
| Central American | 9 | 0.0% |
| Cherokee | 20 | 0.0% |
| Chippewa | 5 | 0.0% |
| Colombian | 81 | 0.2% |
| Croatian | 105 | 0.2% |
| Cuban | 39 | 0.1% |
| Czech | 77 | 0.2% |
| Czechoslovakian | 121 | 0.3% |
| Danish | 20 | 0.0% |
| Dominican | 65 | 0.1% |
| Dutch | 525 | 1.2% |
| Eastern European | 194 | 0.4% |
| Ecuadorian | 34 | 0.1% |
| English | 2,659 | 5.9% |
| European | 332 | 0.7% |
| Finnish | 30 | 0.1% |
| French | 1,022 | 2.2% |
| French American Indian | 11 | 0.0% |
| French Canadian | 240 | 0.5% |
| German | 13,140 | 28.9% |
| Greek | 77 | 0.2% |
| Guamanian / Chamorro | 13 | 0.0% |
| Hungarian | 423 | 0.9% |
| Indian (Asian) | 50 | 0.1% |
| Irish | 10,403 | 22.9% |
| Iroquois | 57 | 0.1% |
| Israeli | 14 | 0.0% |
| Italian | 8,650 | 19.1% |
| Jamaican | 72 | 0.2% |
| Korean | 59 | 0.1% |
| Latvian | 34 | 0.1% |
| Lebanese | 394 | 0.9% |
| Lithuanian | 62 | 0.1% |
| Macedonian | 84 | 0.2% |
| Mexican | 177 | 0.4% |
| Native Hawaiian | 3 | 0.0% |
| Northern European | 9 | 0.0% |
| Norwegian | 67 | 0.2% |
| Pakistani | 25 | 0.1% |
| Palestinian | 19 | 0.0% |
| Pennsylvania German | 8 | 0.0% |
| Peruvian | 1 | 0.0% |
| Polish | 10,910 | 24.0% |
| Puerto Rican | 866 | 1.9% |
| Russian | 338 | 0.7% |
| Salvadoran | 9 | 0.0% |
| Scandinavian | 16 | 0.0% |
| Scotch-Irish | 241 | 0.5% |
| Scottish | 632 | 1.4% |
| Serbian | 8 | 0.0% |
| Slavic | 48 | 0.1% |
| Slovak | 16 | 0.0% |
| South American | 116 | 0.3% |
| Spaniard | 100 | 0.2% |
| Spanish | 49 | 0.1% |
| Sri Lankan | 69 | 0.2% |
| Subsaharan African | 130 | 0.3% |
| Swedish | 174 | 0.4% |
| Swiss | 51 | 0.1% |
| Thai | 30 | 0.1% |
| Trinidadian and Tobagonian | 9 | 0.0% |
| Turkish | 17 | 0.0% |
| Ukrainian | 423 | 0.9% |
| Welsh | 100 | 0.2% | View All 75 Rows |
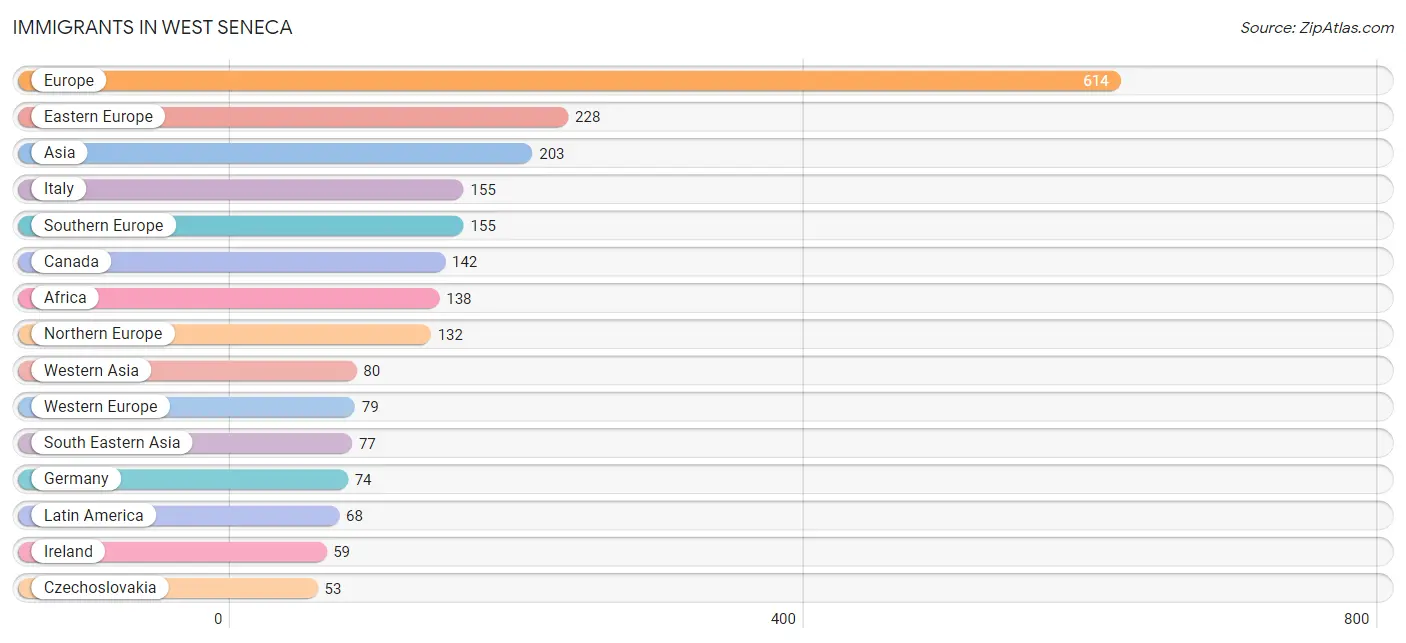
Immigrants in West Seneca
The most numerous immigrant groups reported in West Seneca came from Europe (614 | 1.3%), Eastern Europe (228 | 0.5%), Asia (203 | 0.4%), Italy (155 | 0.3%), and Southern Europe (155 | 0.3%), together accounting for 3.0% of all West Seneca residents.
| Immigration Origin | # Population | % Population |
| Africa | 138 | 0.3% |
| Asia | 203 | 0.4% |
| Austria | 5 | 0.0% |
| Belarus | 15 | 0.0% |
| Bosnia and Herzegovina | 20 | 0.0% |
| Canada | 142 | 0.3% |
| Caribbean | 38 | 0.1% |
| Central America | 20 | 0.0% |
| China | 19 | 0.0% |
| Colombia | 9 | 0.0% |
| Congo | 14 | 0.0% |
| Croatia | 11 | 0.0% |
| Cuba | 11 | 0.0% |
| Czechoslovakia | 53 | 0.1% |
| Dominican Republic | 23 | 0.1% |
| Eastern Africa | 42 | 0.1% |
| Eastern Asia | 26 | 0.1% |
| Eastern Europe | 228 | 0.5% |
| England | 15 | 0.0% |
| Ethiopia | 42 | 0.1% |
| Europe | 614 | 1.3% |
| Germany | 74 | 0.2% |
| Ghana | 7 | 0.0% |
| Haiti | 4 | 0.0% |
| Hungary | 35 | 0.1% |
| Iraq | 9 | 0.0% |
| Ireland | 59 | 0.1% |
| Israel | 7 | 0.0% |
| Italy | 155 | 0.3% |
| Japan | 7 | 0.0% |
| Jordan | 12 | 0.0% |
| Latin America | 68 | 0.2% |
| Liberia | 24 | 0.1% |
| Mexico | 20 | 0.0% |
| Middle Africa | 14 | 0.0% |
| Morocco | 14 | 0.0% |
| North Macedonia | 18 | 0.0% |
| Northern Africa | 31 | 0.1% |
| Northern Europe | 132 | 0.3% |
| Pakistan | 20 | 0.0% |
| Peru | 1 | 0.0% |
| Philippines | 39 | 0.1% |
| Poland | 41 | 0.1% |
| Russia | 23 | 0.1% |
| Scotland | 27 | 0.1% |
| South America | 10 | 0.0% |
| South Central Asia | 20 | 0.0% |
| South Eastern Asia | 77 | 0.2% |
| Southern Europe | 155 | 0.3% |
| Syria | 20 | 0.0% |
| Thailand | 25 | 0.1% |
| Turkey | 32 | 0.1% |
| Vietnam | 13 | 0.0% |
| Western Africa | 51 | 0.1% |
| Western Asia | 80 | 0.2% |
| Western Europe | 79 | 0.2% | View All 56 Rows |
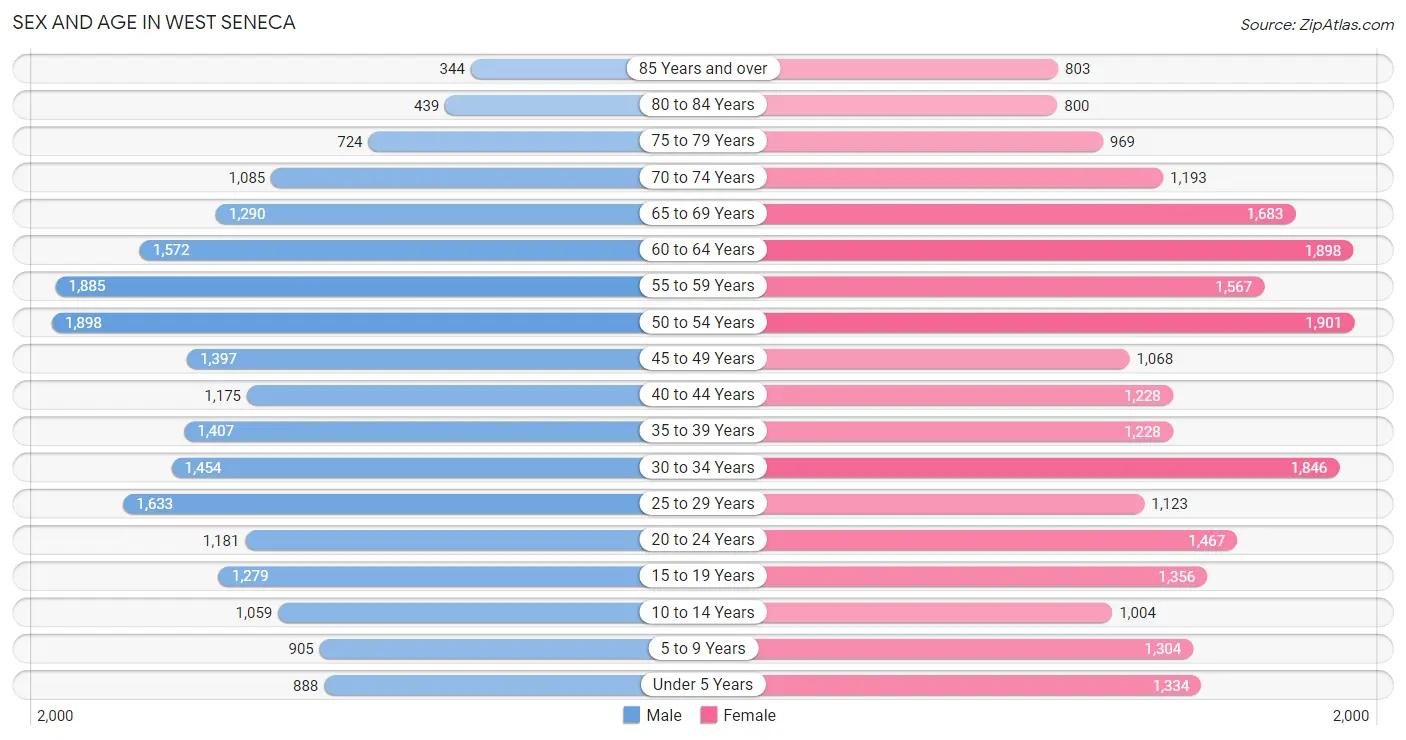
Sex and Age in West Seneca
Sex and Age in West Seneca
The most populous age groups in West Seneca are 50 to 54 Years (1,898 | 8.8%) for men and 50 to 54 Years (1,901 | 8.0%) for women.
| Age Bracket | Male | Female |
| Under 5 Years | 888 (4.1%) | 1,334 (5.6%) |
| 5 to 9 Years | 905 (4.2%) | 1,304 (5.5%) |
| 10 to 14 Years | 1,059 (4.9%) | 1,004 (4.2%) |
| 15 to 19 Years | 1,279 (5.9%) | 1,356 (5.7%) |
| 20 to 24 Years | 1,181 (5.5%) | 1,467 (6.2%) |
| 25 to 29 Years | 1,633 (7.5%) | 1,123 (4.7%) |
| 30 to 34 Years | 1,454 (6.7%) | 1,846 (7.8%) |
| 35 to 39 Years | 1,407 (6.5%) | 1,228 (5.2%) |
| 40 to 44 Years | 1,175 (5.4%) | 1,228 (5.2%) |
| 45 to 49 Years | 1,397 (6.5%) | 1,068 (4.5%) |
| 50 to 54 Years | 1,898 (8.8%) | 1,901 (8.0%) |
| 55 to 59 Years | 1,885 (8.7%) | 1,567 (6.6%) |
| 60 to 64 Years | 1,572 (7.3%) | 1,898 (8.0%) |
| 65 to 69 Years | 1,290 (6.0%) | 1,683 (7.1%) |
| 70 to 74 Years | 1,085 (5.0%) | 1,193 (5.0%) |
| 75 to 79 Years | 724 (3.4%) | 969 (4.1%) |
| 80 to 84 Years | 439 (2.0%) | 800 (3.4%) |
| 85 Years and over | 344 (1.6%) | 803 (3.4%) |
| Total | 21,615 (100.0%) | 23,772 (100.0%) |
Families and Households in West Seneca
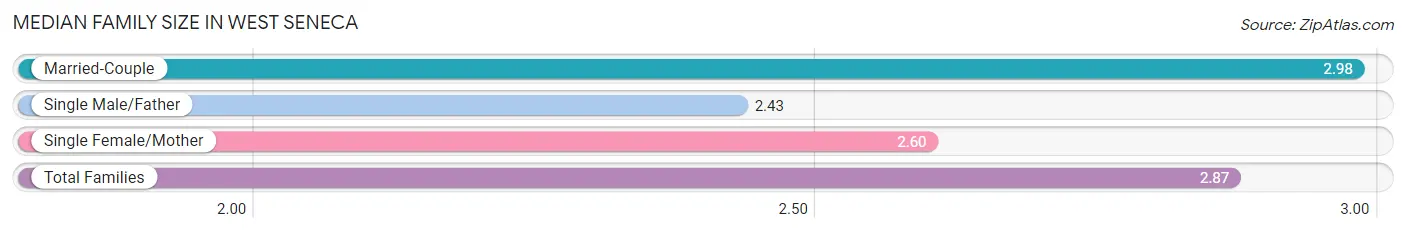
Median Family Size in West Seneca
The median family size in West Seneca is 2.87 persons per family, with married-couple families (8,815 | 74.0%) accounting for the largest median family size of 2.98 persons per family. On the other hand, single male/father families (1,043 | 8.7%) represent the smallest median family size with 2.43 persons per family.
| Family Type | # Families | Family Size |
| Married-Couple | 8,815 (74.0%) | 2.98 |
| Single Male/Father | 1,043 (8.7%) | 2.43 |
| Single Female/Mother | 2,062 (17.3%) | 2.60 |
| Total Families | 11,920 (100.0%) | 2.87 |
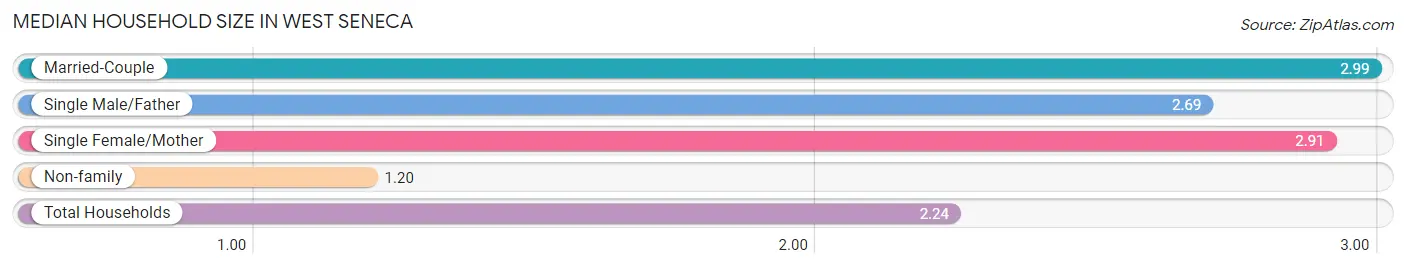
Median Household Size in West Seneca
The median household size in West Seneca is 2.24 persons per household, with married-couple households (8,815 | 44.0%) accounting for the largest median household size of 2.99 persons per household. non-family households (8,096 | 40.5%) represent the smallest median household size with 1.20 persons per household.
| Household Type | # Households | Household Size |
| Married-Couple | 8,815 (44.0%) | 2.99 |
| Single Male/Father | 1,043 (5.2%) | 2.69 |
| Single Female/Mother | 2,062 (10.3%) | 2.91 |
| Non-family | 8,096 (40.5%) | 1.20 |
| Total Households | 20,016 (100.0%) | 2.24 |
Household Size by Marriage Status in West Seneca
Out of a total of 20,016 households in West Seneca, 11,920 (59.6%) are family households, while 8,096 (40.5%) are nonfamily households. The most numerous type of family households are 2-person households, comprising 5,929, and the most common type of nonfamily households are 1-person households, comprising 6,719.
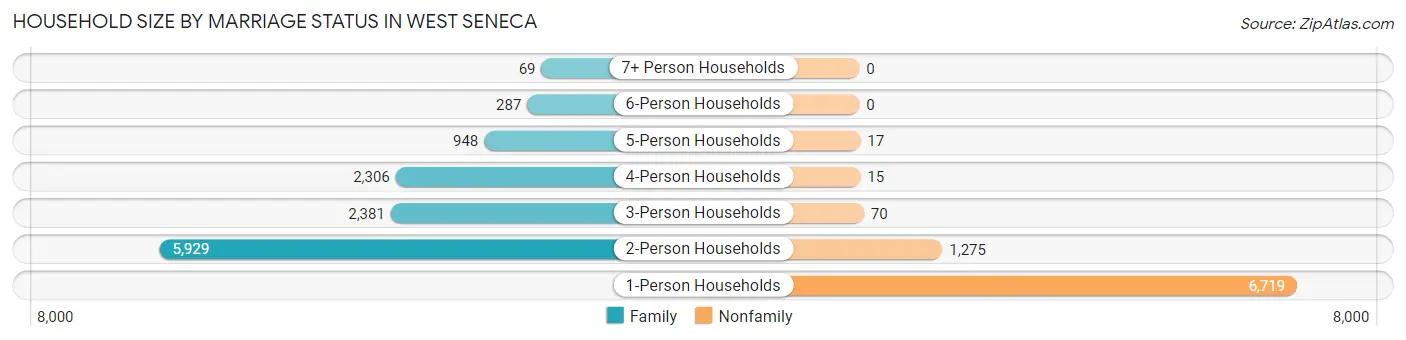
| Household Size | Family Households | Nonfamily Households |
| 1-Person Households | - | 6,719 (33.6%) |
| 2-Person Households | 5,929 (29.6%) | 1,275 (6.4%) |
| 3-Person Households | 2,381 (11.9%) | 70 (0.4%) |
| 4-Person Households | 2,306 (11.5%) | 15 (0.1%) |
| 5-Person Households | 948 (4.7%) | 17 (0.1%) |
| 6-Person Households | 287 (1.4%) | 0 (0.0%) |
| 7+ Person Households | 69 (0.3%) | 0 (0.0%) |
| Total | 11,920 (59.6%) | 8,096 (40.5%) |
Female Fertility in West Seneca
Fertility by Age in West Seneca
Average fertility rate in West Seneca is 59.0 births per 1,000 women. Women in the age bracket of 20 to 34 years have the highest fertility rate with 112.0 births per 1,000 women. Women in the age bracket of 20 to 34 years acount for 85.9% of all women with births.
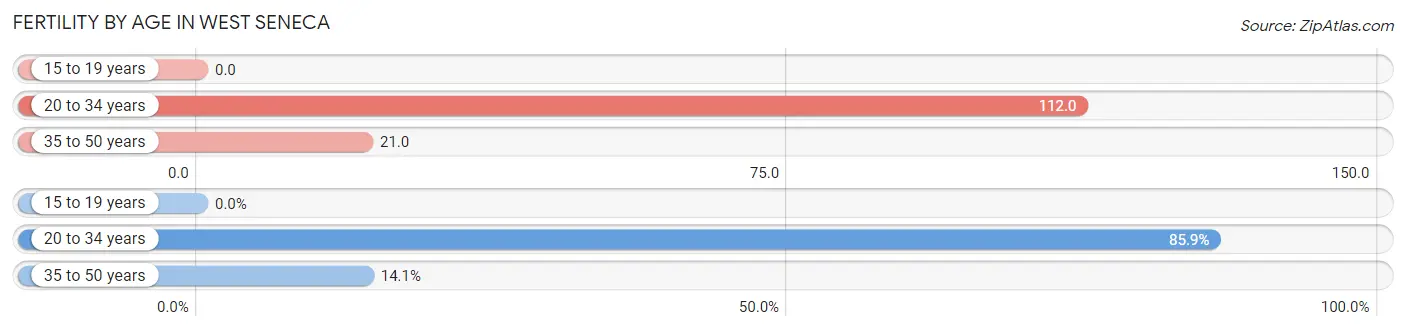
| Age Bracket | Women with Births | Births / 1,000 Women |
| 15 to 19 years | 0 (0.0%) | 0.0 |
| 20 to 34 years | 495 (85.9%) | 112.0 |
| 35 to 50 years | 81 (14.1%) | 21.0 |
| Total | 576 (100.0%) | 59.0 |
Fertility by Age by Marriage Status in West Seneca
77.3% of women with births (576) in West Seneca are married. The highest percentage of unmarried women with births falls into 35 to 50 years age bracket with 35.8% of them unmarried at the time of birth, while the lowest percentage of unmarried women with births belong to 20 to 34 years age bracket with 20.6% of them unmarried.
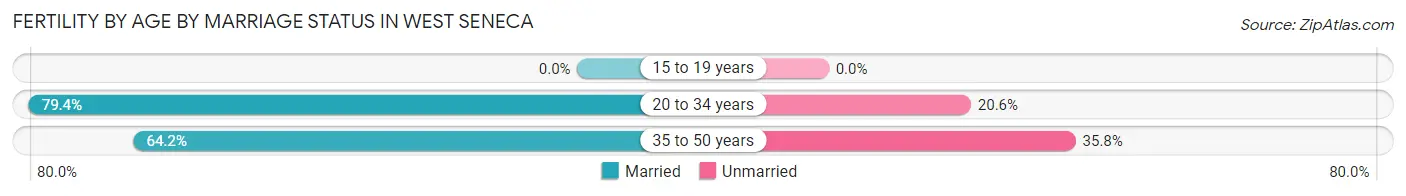
| Age Bracket | Married | Unmarried |
| 15 to 19 years | 0 (0.0%) | 0 (0.0%) |
| 20 to 34 years | 393 (79.4%) | 102 (20.6%) |
| 35 to 50 years | 52 (64.2%) | 29 (35.8%) |
| Total | 445 (77.3%) | 131 (22.7%) |
Fertility by Education in West Seneca
Average fertility rate in West Seneca is 59.0 births per 1,000 women. Women with the education attainment of college or associate's degree have the highest fertility rate of 103.0 births per 1,000 women, while women with the education attainment of high school diploma have the lowest fertility at 20.0 births per 1,000 women. Women with the education attainment of college or associate's degree represent 58.7% of all women with births.
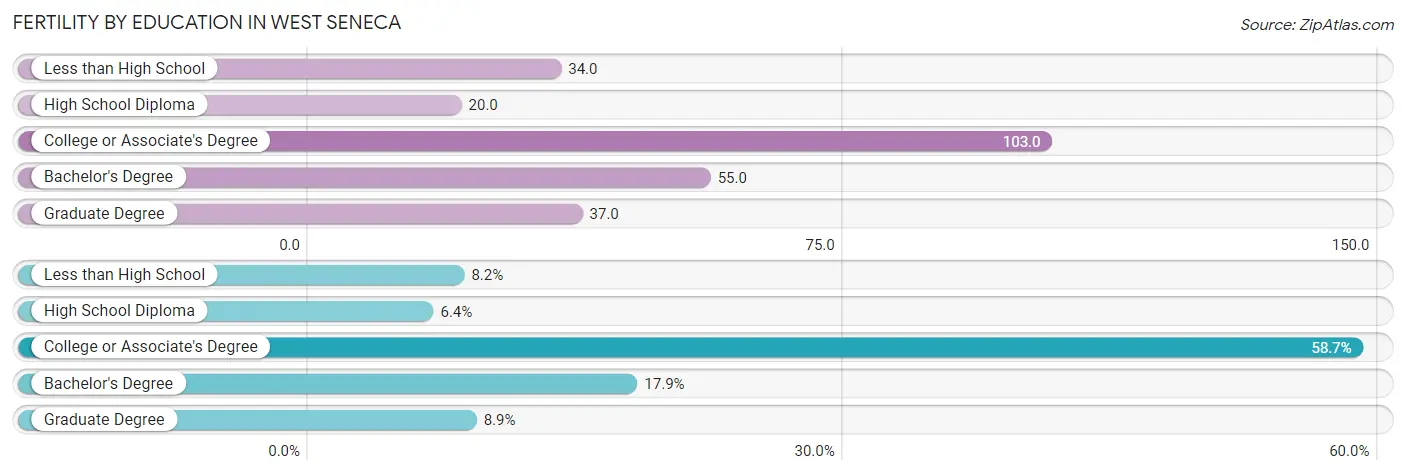
| Educational Attainment | Women with Births | Births / 1,000 Women |
| Less than High School | 47 (8.2%) | 34.0 |
| High School Diploma | 37 (6.4%) | 20.0 |
| College or Associate's Degree | 338 (58.7%) | 103.0 |
| Bachelor's Degree | 103 (17.9%) | 55.0 |
| Graduate Degree | 51 (8.8%) | 37.0 |
| Total | 576 (100.0%) | 59.0 |
Fertility by Education by Marriage Status in West Seneca
22.7% of women with births in West Seneca are unmarried. Women with the educational attainment of bachelor's degree are most likely to be married with 100.0% of them married at childbirth, while women with the educational attainment of high school diploma are least likely to be married with 75.7% of them unmarried at childbirth.
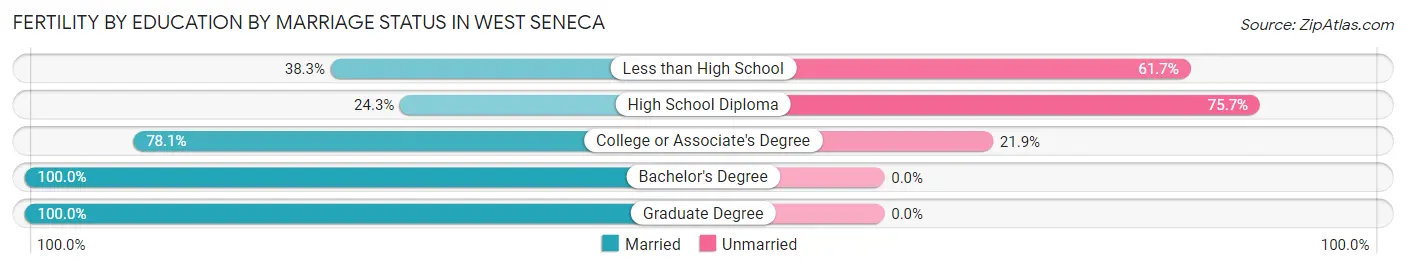
| Educational Attainment | Married | Unmarried |
| Less than High School | 18 (38.3%) | 29 (61.7%) |
| High School Diploma | 9 (24.3%) | 28 (75.7%) |
| College or Associate's Degree | 264 (78.1%) | 74 (21.9%) |
| Bachelor's Degree | 103 (100.0%) | 0 (0.0%) |
| Graduate Degree | 51 (100.0%) | 0 (0.0%) |
| Total | 445 (77.3%) | 131 (22.7%) |
Employment Characteristics in West Seneca
Employment by Class of Employer in West Seneca
Among the 23,686 employed individuals in West Seneca, private company employees (16,056 | 67.8%), not-for-profit organizations (2,523 | 10.6%), and local government employees (1,923 | 8.1%) make up the most common classes of employment.
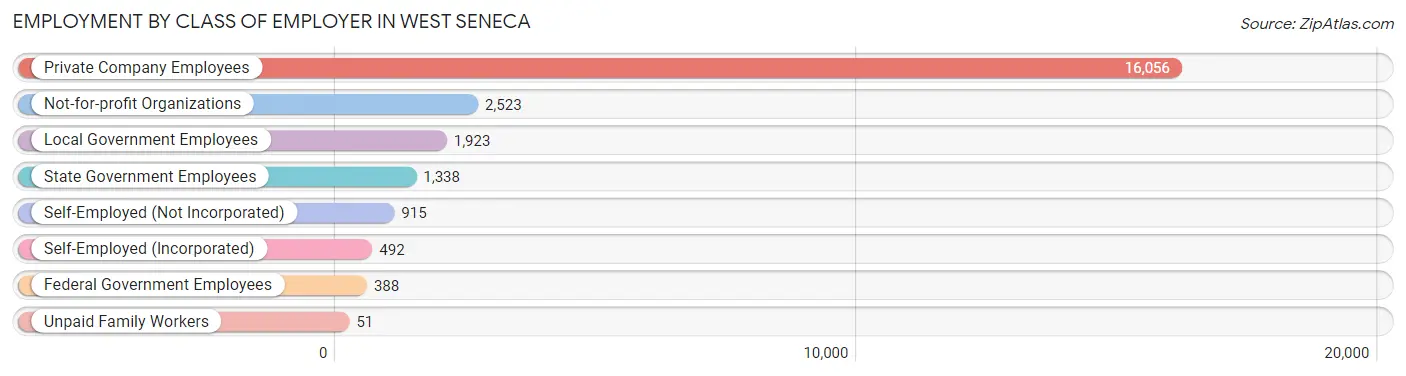
| Employer Class | # Employees | % Employees |
| Private Company Employees | 16,056 | 67.8% |
| Self-Employed (Incorporated) | 492 | 2.1% |
| Self-Employed (Not Incorporated) | 915 | 3.9% |
| Not-for-profit Organizations | 2,523 | 10.6% |
| Local Government Employees | 1,923 | 8.1% |
| State Government Employees | 1,338 | 5.7% |
| Federal Government Employees | 388 | 1.6% |
| Unpaid Family Workers | 51 | 0.2% |
| Total | 23,686 | 100.0% |
Employment Status by Age in West Seneca
According to the labor force statistics for West Seneca, out of the total population over 16 years of age (38,374), 66.0% or 25,327 individuals are in the labor force, with 4.4% or 1,114 of them unemployed. The age group with the highest labor force participation rate is 20 to 24 years, with 91.2% or 2,415 individuals in the labor force. Within the labor force, the 16 to 19 years age range has the highest percentage of unemployed individuals, with 10.5% or 124 of them being unemployed.
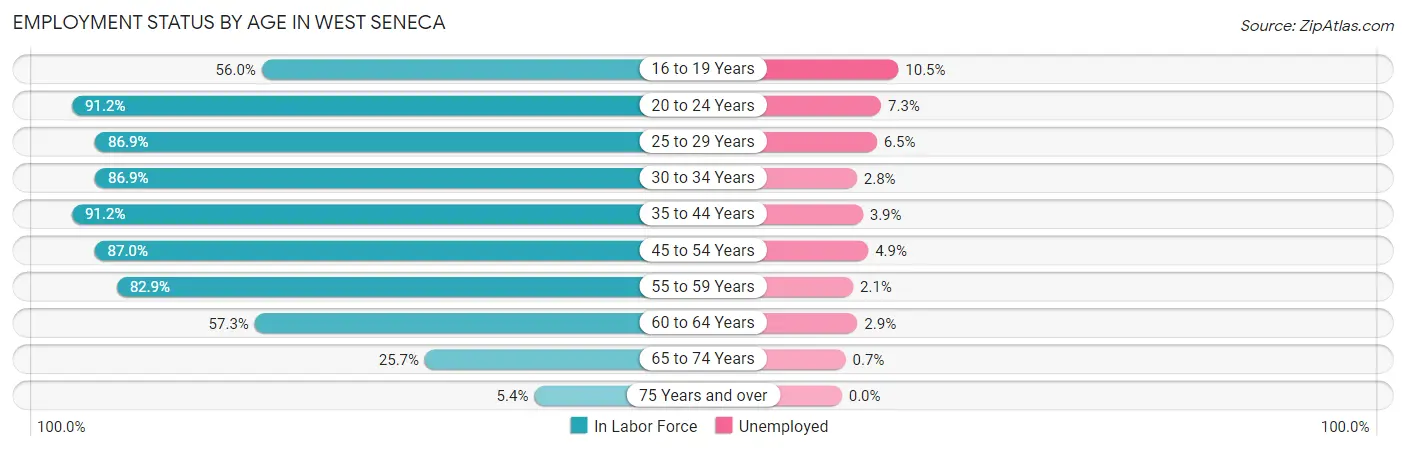
| Age Bracket | In Labor Force | Unemployed |
| 16 to 19 Years | 1,185 (56.0%) | 124 (10.5%) |
| 20 to 24 Years | 2,415 (91.2%) | 176 (7.3%) |
| 25 to 29 Years | 2,395 (86.9%) | 156 (6.5%) |
| 30 to 34 Years | 2,868 (86.9%) | 80 (2.8%) |
| 35 to 44 Years | 4,595 (91.2%) | 179 (3.9%) |
| 45 to 54 Years | 5,450 (87.0%) | 267 (4.9%) |
| 55 to 59 Years | 2,862 (82.9%) | 60 (2.1%) |
| 60 to 64 Years | 1,988 (57.3%) | 58 (2.9%) |
| 65 to 74 Years | 1,350 (25.7%) | 9 (0.7%) |
| 75 Years and over | 220 (5.4%) | 0 (0.0%) |
| Total | 25,327 (66.0%) | 1,114 (4.4%) |
Employment Status by Educational Attainment in West Seneca
According to labor force statistics for West Seneca, 83.0% of individuals (20,152) out of the total population between 25 and 64 years of age (24,280) are in the labor force, with 4.0% or 806 of them being unemployed. The group with the highest labor force participation rate are those with the educational attainment of bachelor's degree or higher, with 93.7% or 8,296 individuals in the labor force. Within the labor force, individuals with high school diploma education have the highest percentage of unemployment, with 7.8% or 336 of them being unemployed.
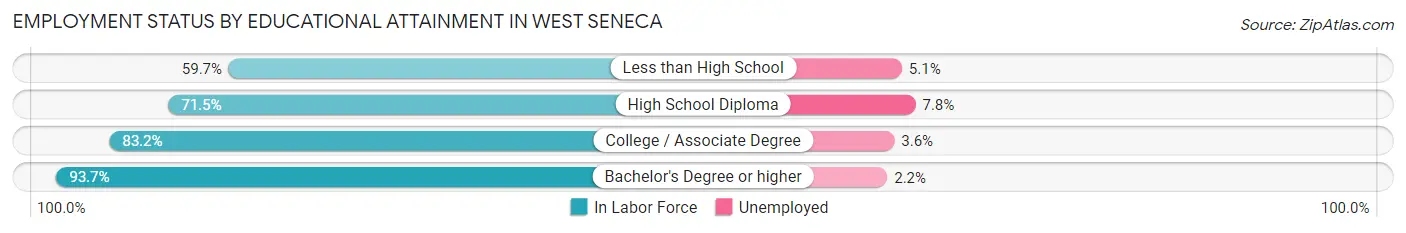
| Educational Attainment | In Labor Force | Unemployed |
| Less than High School | 685 (59.7%) | 58 (5.1%) |
| High School Diploma | 4,308 (71.5%) | 470 (7.8%) |
| College / Associate Degree | 6,867 (83.2%) | 297 (3.6%) |
| Bachelor's Degree or higher | 8,296 (93.7%) | 195 (2.2%) |
| Total | 20,152 (83.0%) | 971 (4.0%) |
Employment Occupations by Sex in West Seneca
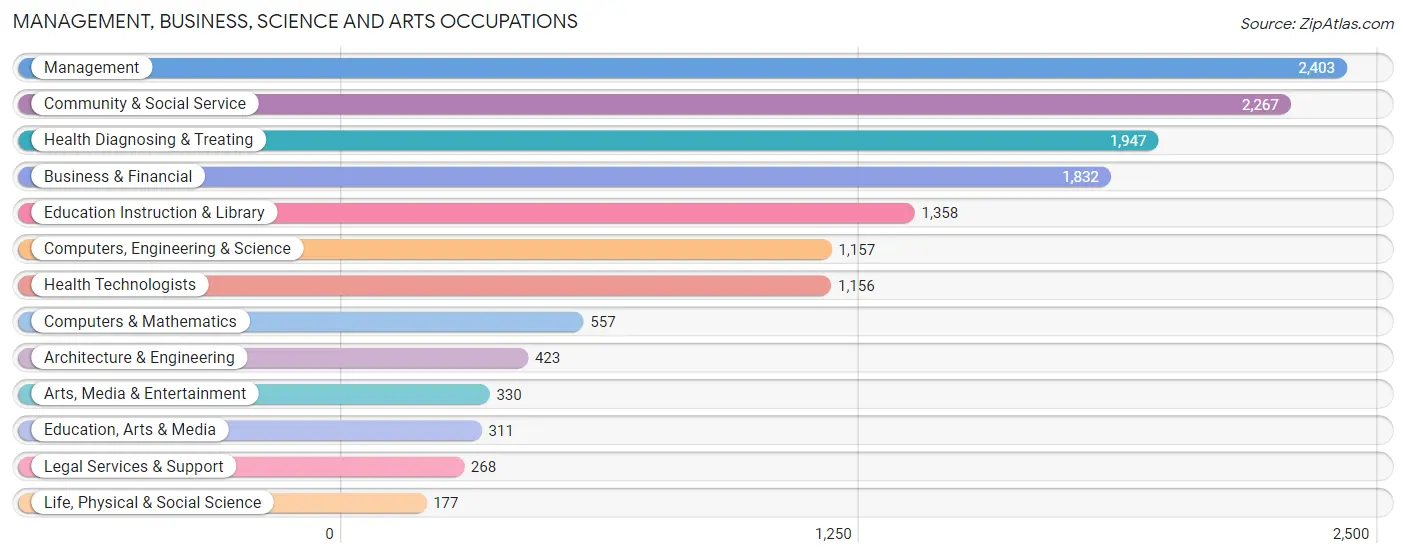
Management, Business, Science and Arts Occupations
The most common Management, Business, Science and Arts occupations in West Seneca are Management (2,403 | 9.9%), Community & Social Service (2,267 | 9.4%), Health Diagnosing & Treating (1,947 | 8.0%), Business & Financial (1,832 | 7.6%), and Education Instruction & Library (1,358 | 5.6%).
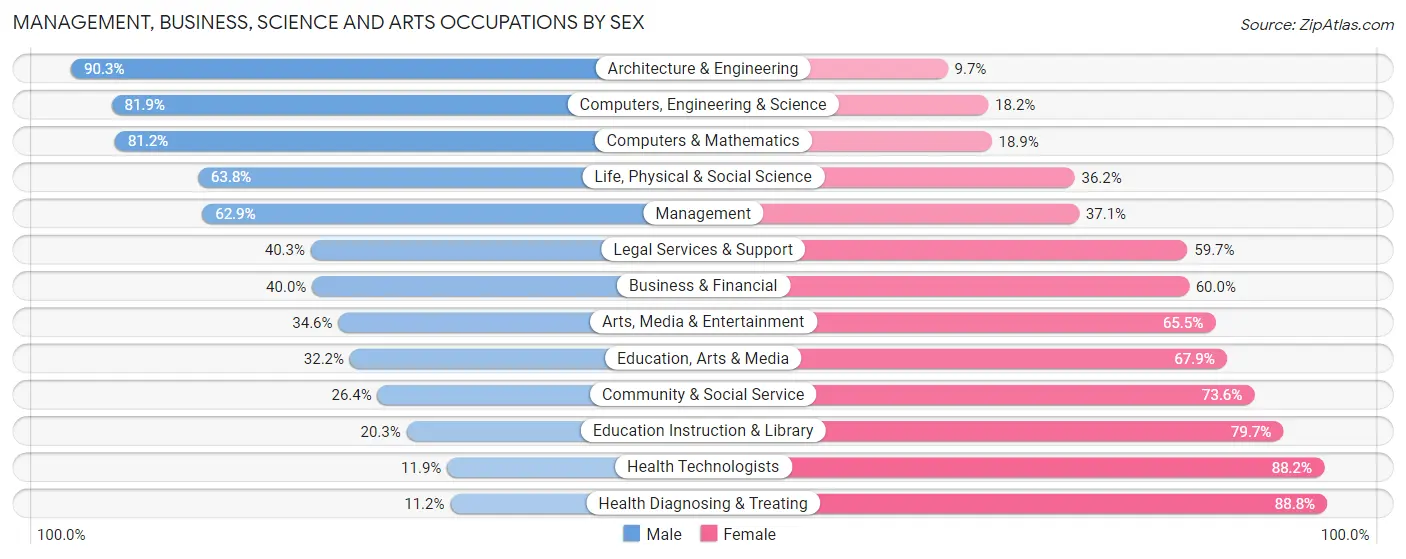
Management, Business, Science and Arts Occupations by Sex
Within the Management, Business, Science and Arts occupations in West Seneca, the most male-oriented occupations are Architecture & Engineering (90.3%), Computers, Engineering & Science (81.9%), and Computers & Mathematics (81.1%), while the most female-oriented occupations are Health Diagnosing & Treating (88.8%), Health Technologists (88.1%), and Education Instruction & Library (79.7%).
| Occupation | Male | Female |
| Management | 1,512 (62.9%) | 891 (37.1%) |
| Business & Financial | 733 (40.0%) | 1,099 (60.0%) |
| Computers, Engineering & Science | 947 (81.9%) | 210 (18.1%) |
| Computers & Mathematics | 452 (81.1%) | 105 (18.9%) |
| Architecture & Engineering | 382 (90.3%) | 41 (9.7%) |
| Life, Physical & Social Science | 113 (63.8%) | 64 (36.2%) |
| Community & Social Service | 598 (26.4%) | 1,669 (73.6%) |
| Education, Arts & Media | 100 (32.2%) | 211 (67.8%) |
| Legal Services & Support | 108 (40.3%) | 160 (59.7%) |
| Education Instruction & Library | 276 (20.3%) | 1,082 (79.7%) |
| Arts, Media & Entertainment | 114 (34.5%) | 216 (65.4%) |
| Health Diagnosing & Treating | 218 (11.2%) | 1,729 (88.8%) |
| Health Technologists | 137 (11.8%) | 1,019 (88.1%) |
| Total (Category) | 4,008 (41.7%) | 5,598 (58.3%) |
| Total (Overall) | 12,280 (50.7%) | 11,926 (49.3%) |
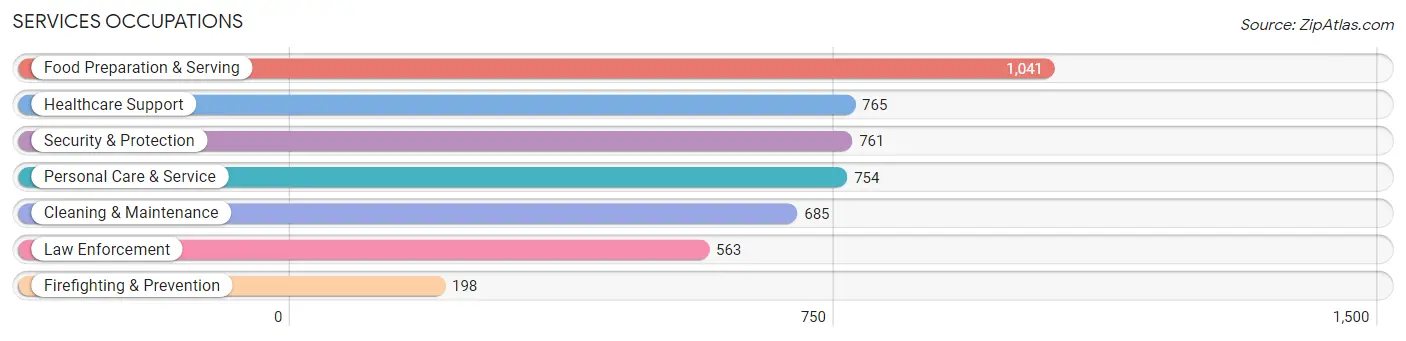
Services Occupations
The most common Services occupations in West Seneca are Food Preparation & Serving (1,041 | 4.3%), Healthcare Support (765 | 3.2%), Security & Protection (761 | 3.1%), Personal Care & Service (754 | 3.1%), and Cleaning & Maintenance (685 | 2.8%).
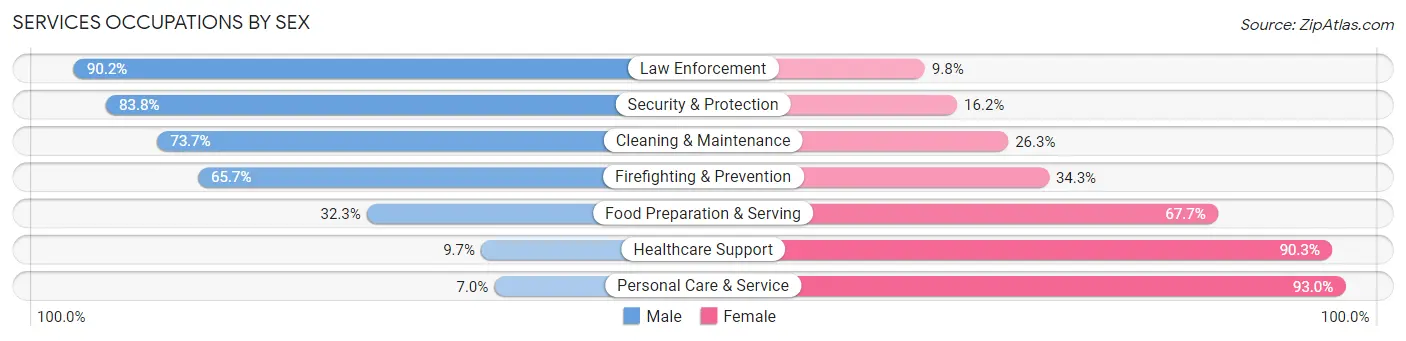
Services Occupations by Sex
Within the Services occupations in West Seneca, the most male-oriented occupations are Law Enforcement (90.2%), Security & Protection (83.8%), and Cleaning & Maintenance (73.7%), while the most female-oriented occupations are Personal Care & Service (93.0%), Healthcare Support (90.3%), and Food Preparation & Serving (67.7%).
| Occupation | Male | Female |
| Healthcare Support | 74 (9.7%) | 691 (90.3%) |
| Security & Protection | 638 (83.8%) | 123 (16.2%) |
| Firefighting & Prevention | 130 (65.7%) | 68 (34.3%) |
| Law Enforcement | 508 (90.2%) | 55 (9.8%) |
| Food Preparation & Serving | 336 (32.3%) | 705 (67.7%) |
| Cleaning & Maintenance | 505 (73.7%) | 180 (26.3%) |
| Personal Care & Service | 53 (7.0%) | 701 (93.0%) |
| Total (Category) | 1,606 (40.1%) | 2,400 (59.9%) |
| Total (Overall) | 12,280 (50.7%) | 11,926 (49.3%) |
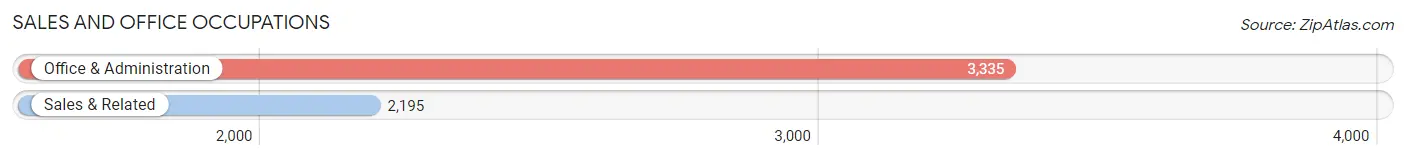
Sales and Office Occupations
The most common Sales and Office occupations in West Seneca are Office & Administration (3,335 | 13.8%), and Sales & Related (2,195 | 9.1%).
Sales and Office Occupations by Sex
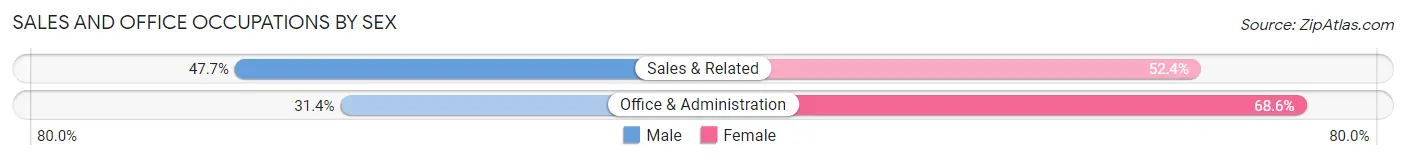
| Occupation | Male | Female |
| Sales & Related | 1,046 (47.6%) | 1,149 (52.3%) |
| Office & Administration | 1,048 (31.4%) | 2,287 (68.6%) |
| Total (Category) | 2,094 (37.9%) | 3,436 (62.1%) |
| Total (Overall) | 12,280 (50.7%) | 11,926 (49.3%) |
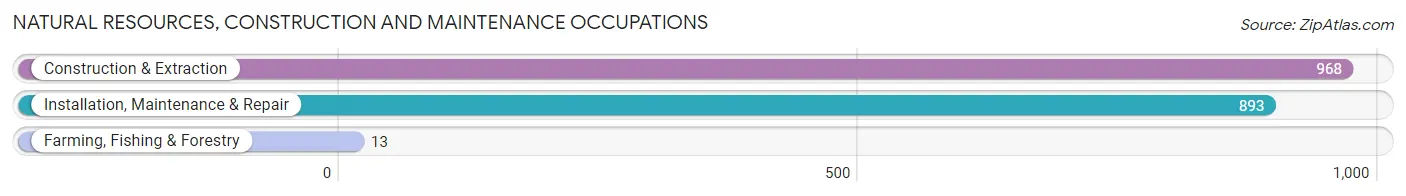
Natural Resources, Construction and Maintenance Occupations
The most common Natural Resources, Construction and Maintenance occupations in West Seneca are Construction & Extraction (968 | 4.0%), Installation, Maintenance & Repair (893 | 3.7%), and Farming, Fishing & Forestry (13 | 0.1%).
Natural Resources, Construction and Maintenance Occupations by Sex
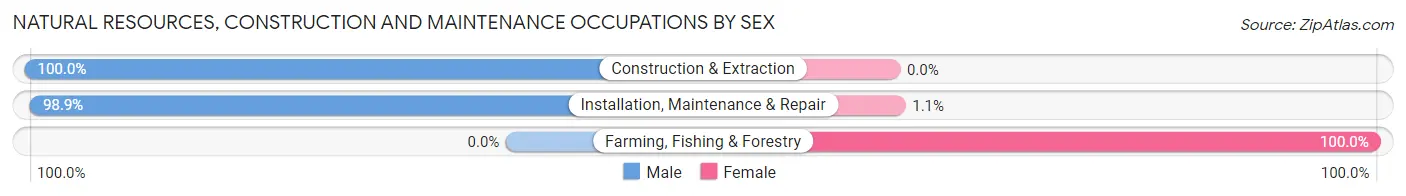
| Occupation | Male | Female |
| Farming, Fishing & Forestry | 0 (0.0%) | 13 (100.0%) |
| Construction & Extraction | 968 (100.0%) | 0 (0.0%) |
| Installation, Maintenance & Repair | 883 (98.9%) | 10 (1.1%) |
| Total (Category) | 1,851 (98.8%) | 23 (1.2%) |
| Total (Overall) | 12,280 (50.7%) | 11,926 (49.3%) |
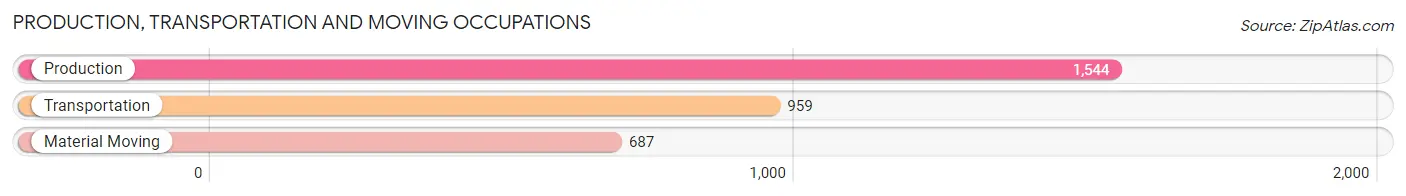
Production, Transportation and Moving Occupations
The most common Production, Transportation and Moving occupations in West Seneca are Production (1,544 | 6.4%), Transportation (959 | 4.0%), and Material Moving (687 | 2.8%).
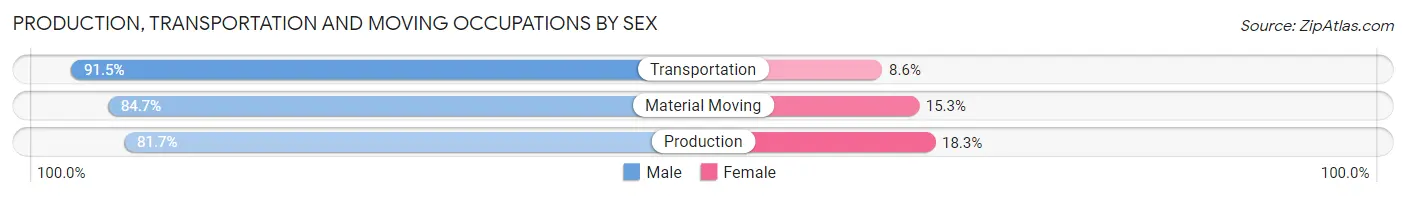
Production, Transportation and Moving Occupations by Sex
| Occupation | Male | Female |
| Production | 1,262 (81.7%) | 282 (18.3%) |
| Transportation | 877 (91.4%) | 82 (8.6%) |
| Material Moving | 582 (84.7%) | 105 (15.3%) |
| Total (Category) | 2,721 (85.3%) | 469 (14.7%) |
| Total (Overall) | 12,280 (50.7%) | 11,926 (49.3%) |
Employment Industries by Sex in West Seneca
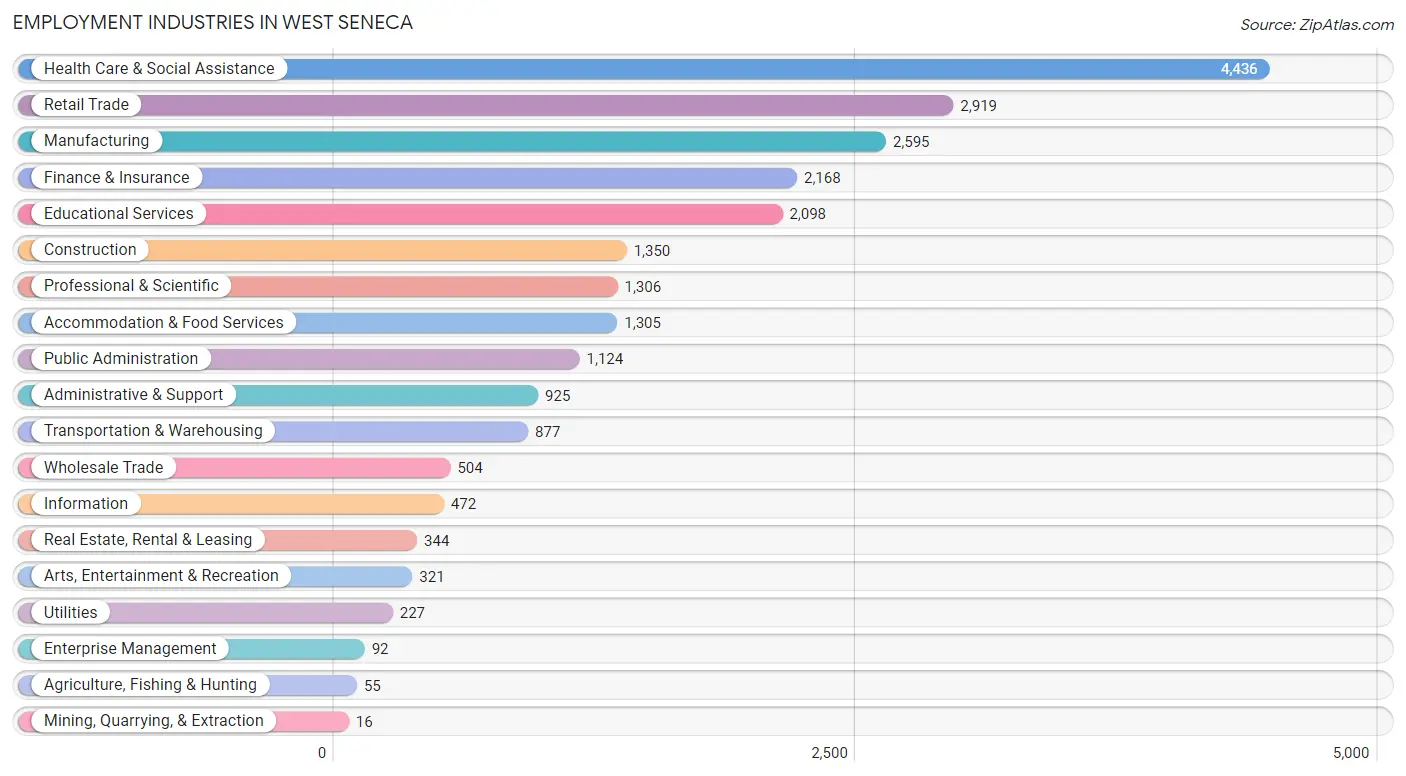
Employment Industries in West Seneca
The major employment industries in West Seneca include Health Care & Social Assistance (4,436 | 18.3%), Retail Trade (2,919 | 12.1%), Manufacturing (2,595 | 10.7%), Finance & Insurance (2,168 | 9.0%), and Educational Services (2,098 | 8.7%).
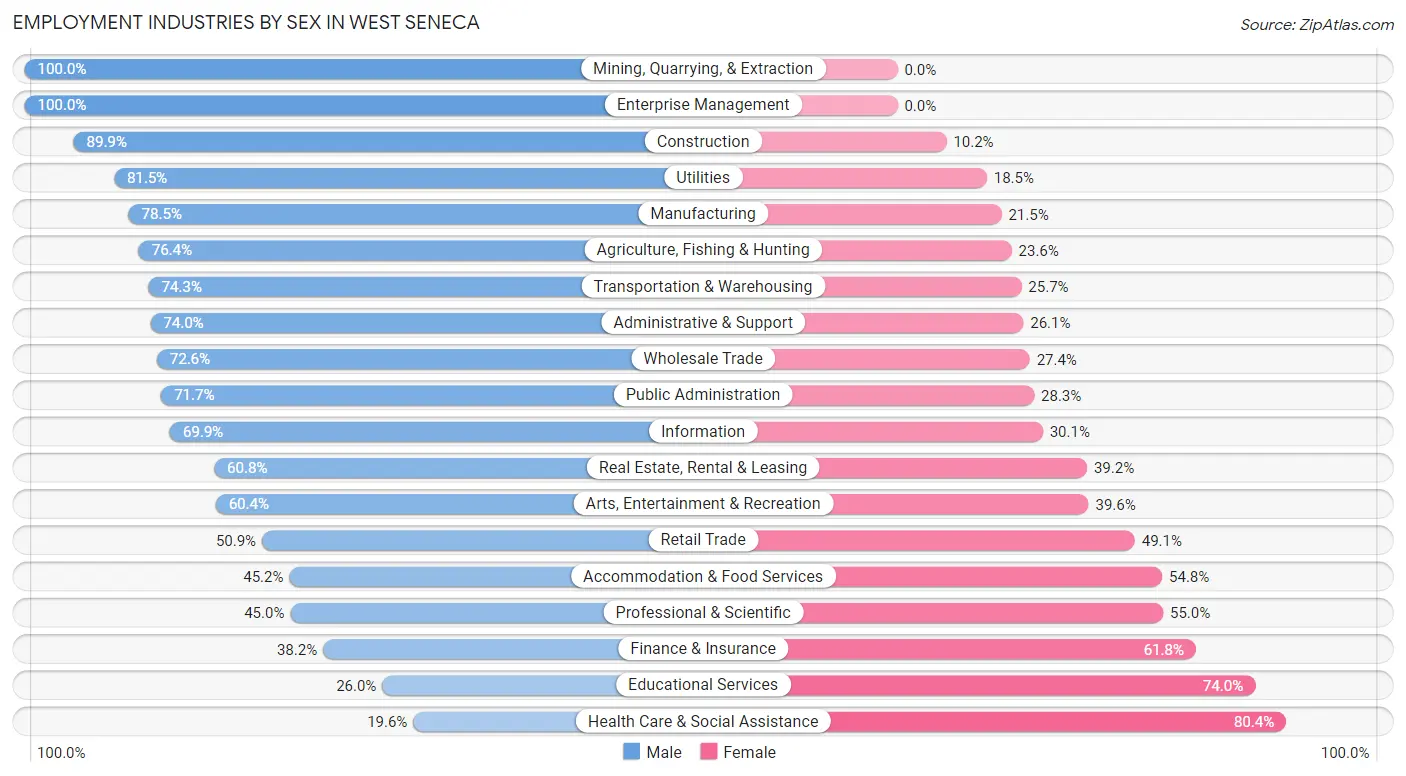
Employment Industries by Sex in West Seneca
The West Seneca industries that see more men than women are Mining, Quarrying, & Extraction (100.0%), Enterprise Management (100.0%), and Construction (89.8%), whereas the industries that tend to have a higher number of women are Health Care & Social Assistance (80.4%), Educational Services (74.0%), and Finance & Insurance (61.8%).
| Industry | Male | Female |
| Agriculture, Fishing & Hunting | 42 (76.4%) | 13 (23.6%) |
| Mining, Quarrying, & Extraction | 16 (100.0%) | 0 (0.0%) |
| Construction | 1,213 (89.8%) | 137 (10.2%) |
| Manufacturing | 2,036 (78.5%) | 559 (21.5%) |
| Wholesale Trade | 366 (72.6%) | 138 (27.4%) |
| Retail Trade | 1,485 (50.9%) | 1,434 (49.1%) |
| Transportation & Warehousing | 652 (74.3%) | 225 (25.7%) |
| Utilities | 185 (81.5%) | 42 (18.5%) |
| Information | 330 (69.9%) | 142 (30.1%) |
| Finance & Insurance | 829 (38.2%) | 1,339 (61.8%) |
| Real Estate, Rental & Leasing | 209 (60.8%) | 135 (39.2%) |
| Professional & Scientific | 588 (45.0%) | 718 (55.0%) |
| Enterprise Management | 92 (100.0%) | 0 (0.0%) |
| Administrative & Support | 684 (74.0%) | 241 (26.1%) |
| Educational Services | 545 (26.0%) | 1,553 (74.0%) |
| Health Care & Social Assistance | 868 (19.6%) | 3,568 (80.4%) |
| Arts, Entertainment & Recreation | 194 (60.4%) | 127 (39.6%) |
| Accommodation & Food Services | 590 (45.2%) | 715 (54.8%) |
| Public Administration | 806 (71.7%) | 318 (28.3%) |
| Total | 12,280 (50.7%) | 11,926 (49.3%) |
Education in West Seneca
School Enrollment in West Seneca
The most common levels of schooling among the 8,676 students in West Seneca are high school (2,170 | 25.0%), college / undergraduate (1,842 | 21.2%), and elementary school (1,681 | 19.4%).
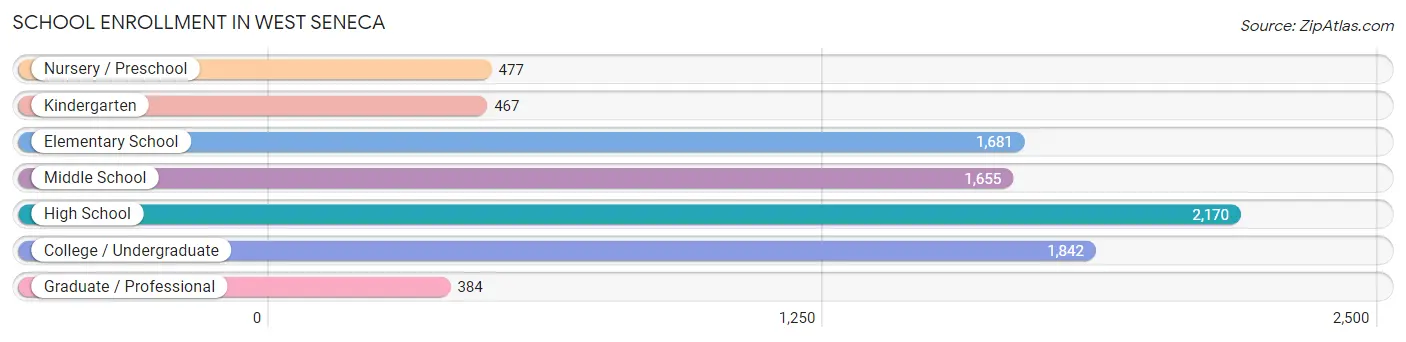
| School Level | # Students | % Students |
| Nursery / Preschool | 477 | 5.5% |
| Kindergarten | 467 | 5.4% |
| Elementary School | 1,681 | 19.4% |
| Middle School | 1,655 | 19.1% |
| High School | 2,170 | 25.0% |
| College / Undergraduate | 1,842 | 21.2% |
| Graduate / Professional | 384 | 4.4% |
| Total | 8,676 | 100.0% |
School Enrollment by Age by Funding Source in West Seneca
Out of a total of 8,676 students who are enrolled in schools in West Seneca, 1,432 (16.5%) attend a private institution, while the remaining 7,244 (83.5%) are enrolled in public schools. The age group of 18 to 19 year olds has the highest likelihood of being enrolled in private schools, with 277 (43.1% in the age bracket) enrolled. Conversely, the age group of 5 to 9 year old has the lowest likelihood of being enrolled in a private school, with 1,969 (92.6% in the age bracket) attending a public institution.
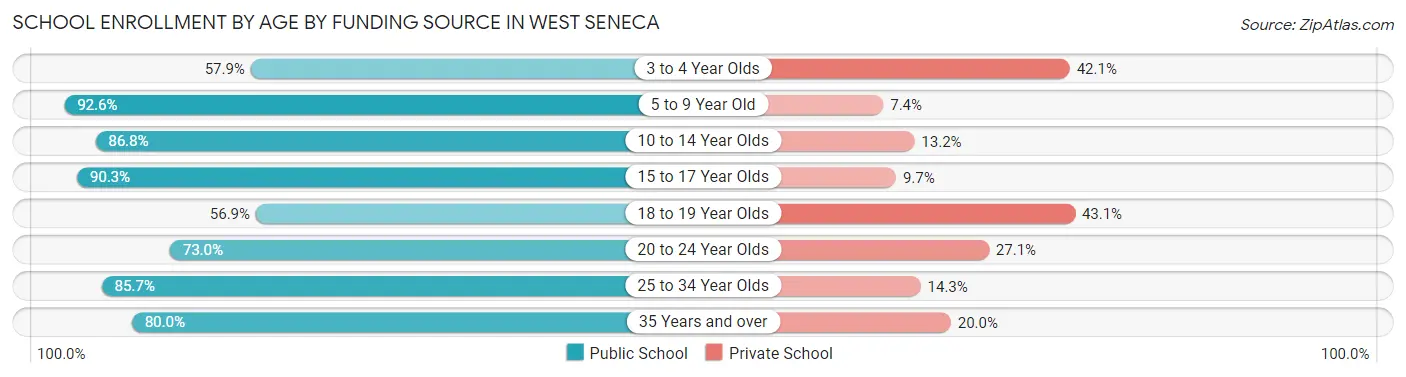
| Age Bracket | Public School | Private School |
| 3 to 4 Year Olds | 231 (57.9%) | 168 (42.1%) |
| 5 to 9 Year Old | 1,969 (92.6%) | 157 (7.4%) |
| 10 to 14 Year Olds | 1,785 (86.8%) | 271 (13.2%) |
| 15 to 17 Year Olds | 1,556 (90.3%) | 168 (9.7%) |
| 18 to 19 Year Olds | 366 (56.9%) | 277 (43.1%) |
| 20 to 24 Year Olds | 666 (73.0%) | 247 (27.1%) |
| 25 to 34 Year Olds | 299 (85.7%) | 50 (14.3%) |
| 35 Years and over | 373 (80.0%) | 93 (20.0%) |
| Total | 7,244 (83.5%) | 1,432 (16.5%) |
Educational Attainment by Field of Study in West Seneca
Business (2,430 | 21.2%), education (1,657 | 14.5%), science & technology (1,505 | 13.1%), computers & mathematics (816 | 7.1%), and social sciences (728 | 6.4%) are the most common fields of study among 11,455 individuals in West Seneca who have obtained a bachelor's degree or higher.
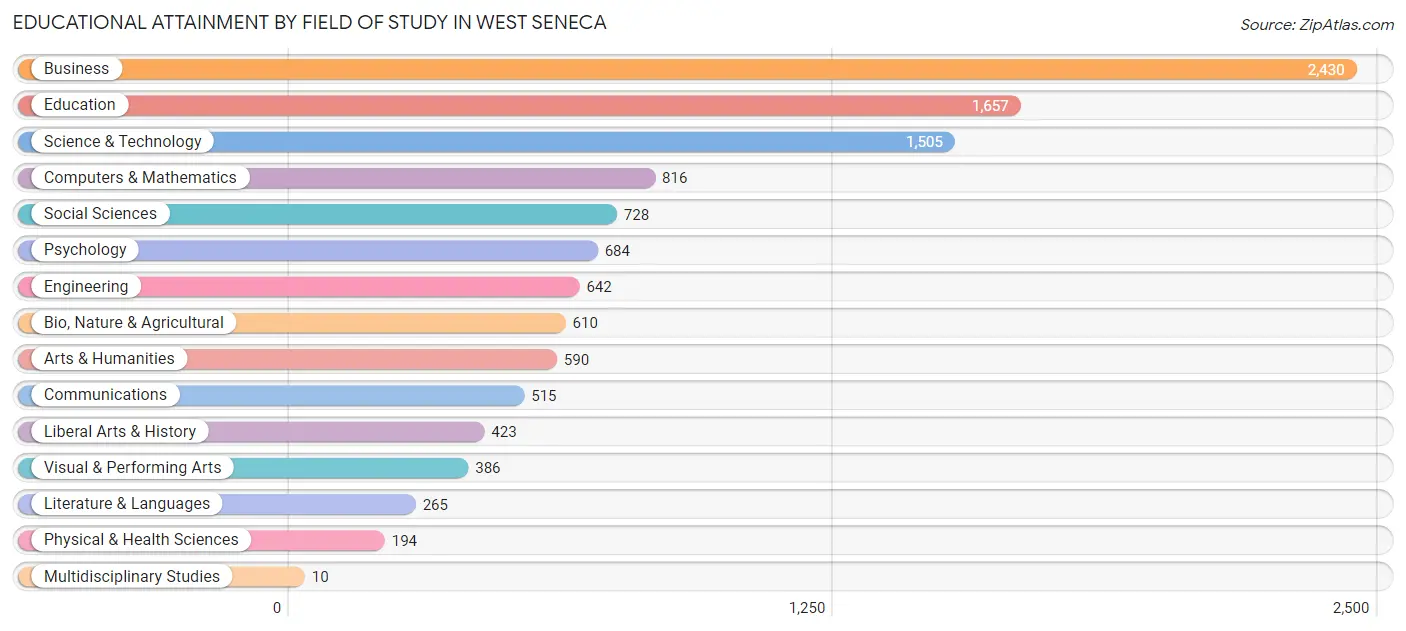
| Field of Study | # Graduates | % Graduates |
| Computers & Mathematics | 816 | 7.1% |
| Bio, Nature & Agricultural | 610 | 5.3% |
| Physical & Health Sciences | 194 | 1.7% |
| Psychology | 684 | 6.0% |
| Social Sciences | 728 | 6.4% |
| Engineering | 642 | 5.6% |
| Multidisciplinary Studies | 10 | 0.1% |
| Science & Technology | 1,505 | 13.1% |
| Business | 2,430 | 21.2% |
| Education | 1,657 | 14.5% |
| Literature & Languages | 265 | 2.3% |
| Liberal Arts & History | 423 | 3.7% |
| Visual & Performing Arts | 386 | 3.4% |
| Communications | 515 | 4.5% |
| Arts & Humanities | 590 | 5.1% |
| Total | 11,455 | 100.0% |
Transportation & Commute in West Seneca
Vehicle Availability by Sex in West Seneca
The most prevalent vehicle ownership categories in West Seneca are males with 2 vehicles (5,685, accounting for 47.1%) and females with 2 vehicles (5,479, making up 49.1%).
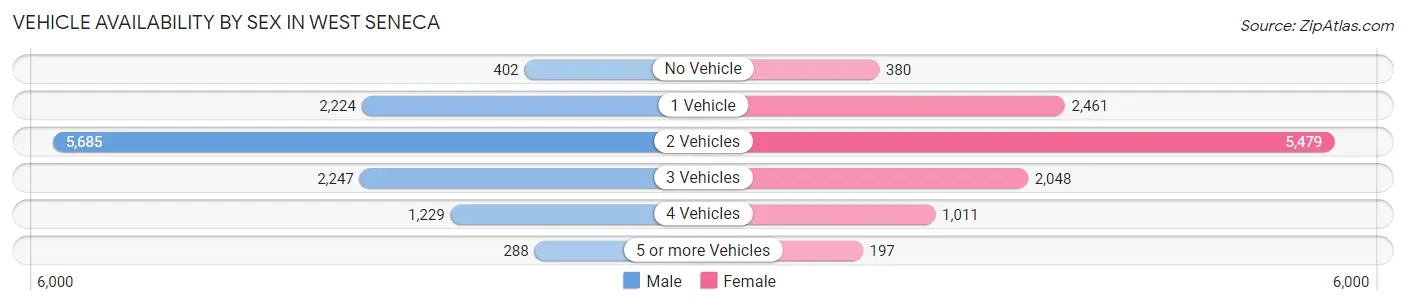
| Vehicles Available | Male | Female |
| No Vehicle | 402 (3.3%) | 380 (3.3%) |
| 1 Vehicle | 2,224 (18.4%) | 2,461 (21.3%) |
| 2 Vehicles | 5,685 (47.1%) | 5,479 (47.3%) |
| 3 Vehicles | 2,247 (18.6%) | 2,048 (17.7%) |
| 4 Vehicles | 1,229 (10.2%) | 1,011 (8.7%) |
| 5 or more Vehicles | 288 (2.4%) | 197 (1.7%) |
| Total | 12,075 (100.0%) | 11,576 (100.0%) |
Commute Time in West Seneca
The most frequently occuring commute durations in West Seneca are 20 to 24 minutes (4,789 commuters, 22.2%), 15 to 19 minutes (4,043 commuters, 18.7%), and 10 to 14 minutes (3,002 commuters, 13.9%).
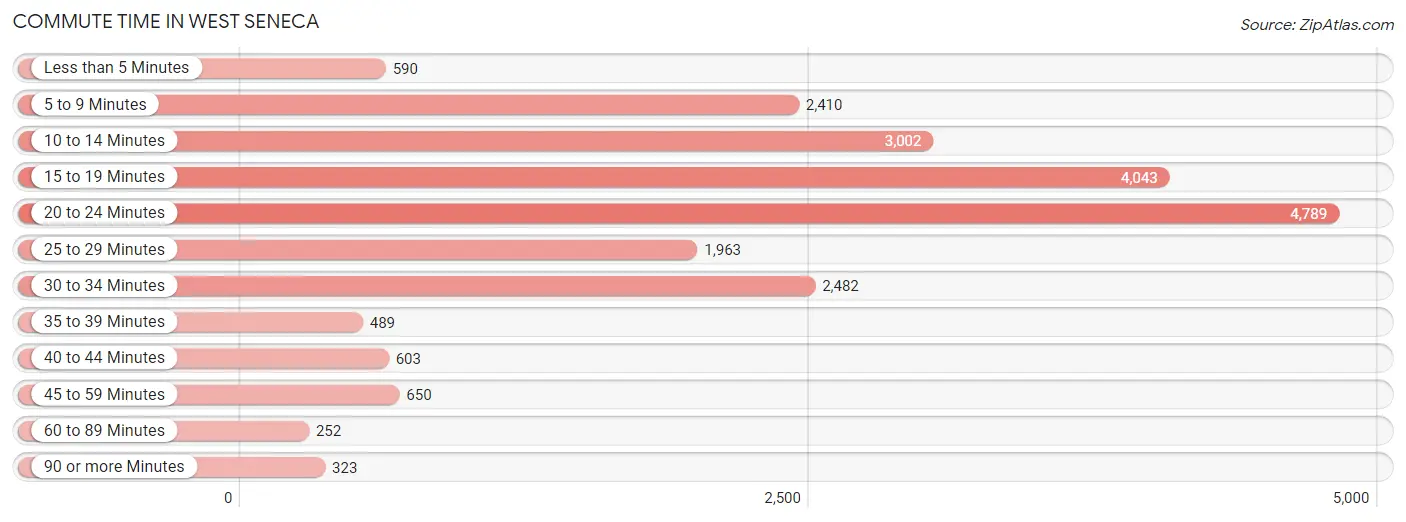
| Commute Time | # Commuters | % Commuters |
| Less than 5 Minutes | 590 | 2.7% |
| 5 to 9 Minutes | 2,410 | 11.2% |
| 10 to 14 Minutes | 3,002 | 13.9% |
| 15 to 19 Minutes | 4,043 | 18.7% |
| 20 to 24 Minutes | 4,789 | 22.2% |
| 25 to 29 Minutes | 1,963 | 9.1% |
| 30 to 34 Minutes | 2,482 | 11.5% |
| 35 to 39 Minutes | 489 | 2.3% |
| 40 to 44 Minutes | 603 | 2.8% |
| 45 to 59 Minutes | 650 | 3.0% |
| 60 to 89 Minutes | 252 | 1.2% |
| 90 or more Minutes | 323 | 1.5% |
Commute Time by Sex in West Seneca
The most common commute times in West Seneca are 20 to 24 minutes (2,685 commuters, 23.4%) for males and 20 to 24 minutes (2,104 commuters, 20.8%) for females.
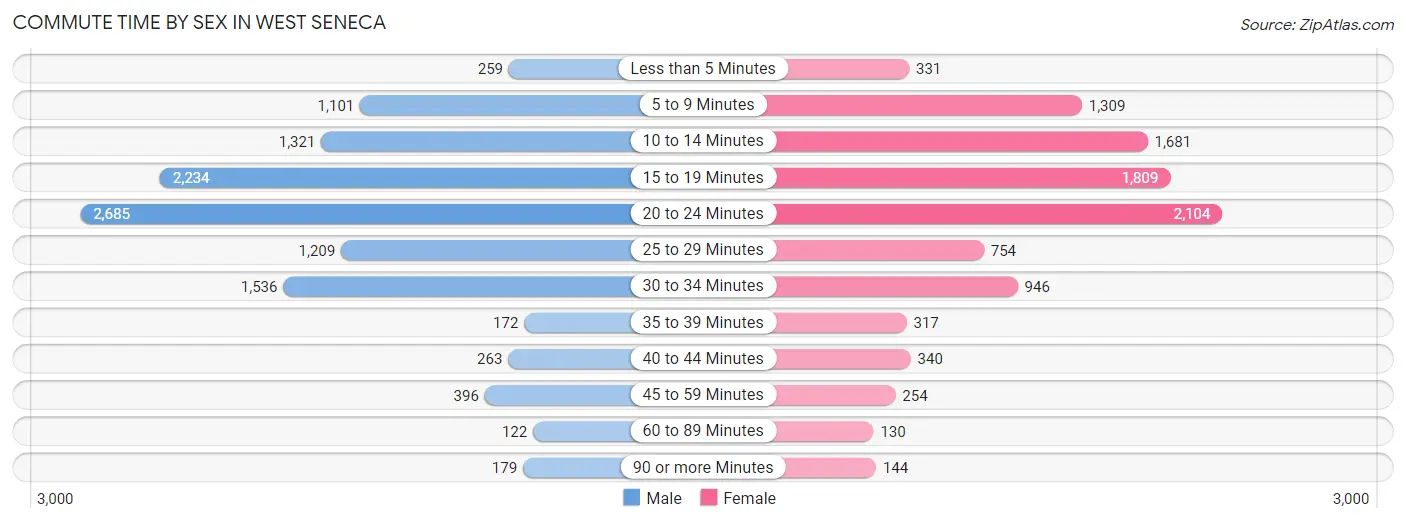
| Commute Time | Male | Female |
| Less than 5 Minutes | 259 (2.3%) | 331 (3.3%) |
| 5 to 9 Minutes | 1,101 (9.6%) | 1,309 (12.9%) |
| 10 to 14 Minutes | 1,321 (11.5%) | 1,681 (16.6%) |
| 15 to 19 Minutes | 2,234 (19.5%) | 1,809 (17.9%) |
| 20 to 24 Minutes | 2,685 (23.4%) | 2,104 (20.8%) |
| 25 to 29 Minutes | 1,209 (10.5%) | 754 (7.4%) |
| 30 to 34 Minutes | 1,536 (13.4%) | 946 (9.3%) |
| 35 to 39 Minutes | 172 (1.5%) | 317 (3.1%) |
| 40 to 44 Minutes | 263 (2.3%) | 340 (3.4%) |
| 45 to 59 Minutes | 396 (3.5%) | 254 (2.5%) |
| 60 to 89 Minutes | 122 (1.1%) | 130 (1.3%) |
| 90 or more Minutes | 179 (1.6%) | 144 (1.4%) |
Time of Departure to Work by Sex in West Seneca
The most frequent times of departure to work in West Seneca are 7:00 AM to 7:29 AM (1,772, 15.4%) for males and 7:30 AM to 7:59 AM (1,609, 15.9%) for females.
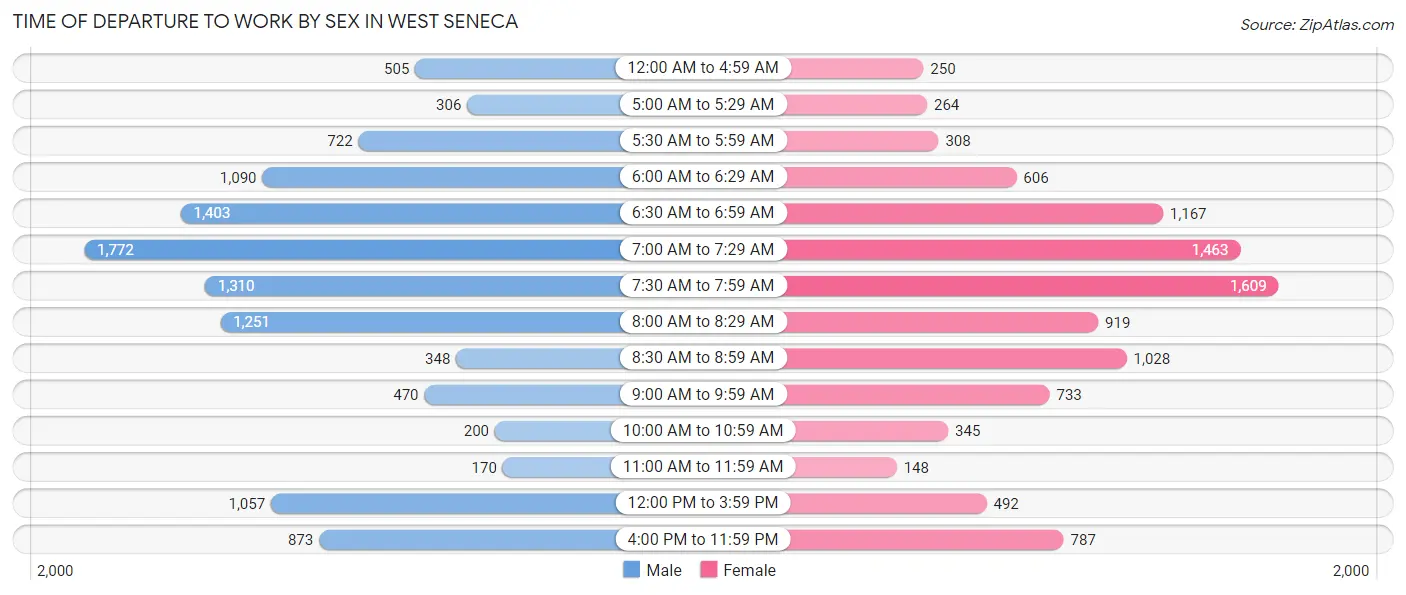
| Time of Departure | Male | Female |
| 12:00 AM to 4:59 AM | 505 (4.4%) | 250 (2.5%) |
| 5:00 AM to 5:29 AM | 306 (2.7%) | 264 (2.6%) |
| 5:30 AM to 5:59 AM | 722 (6.3%) | 308 (3.0%) |
| 6:00 AM to 6:29 AM | 1,090 (9.5%) | 606 (6.0%) |
| 6:30 AM to 6:59 AM | 1,403 (12.2%) | 1,167 (11.5%) |
| 7:00 AM to 7:29 AM | 1,772 (15.4%) | 1,463 (14.5%) |
| 7:30 AM to 7:59 AM | 1,310 (11.4%) | 1,609 (15.9%) |
| 8:00 AM to 8:29 AM | 1,251 (10.9%) | 919 (9.1%) |
| 8:30 AM to 8:59 AM | 348 (3.0%) | 1,028 (10.2%) |
| 9:00 AM to 9:59 AM | 470 (4.1%) | 733 (7.2%) |
| 10:00 AM to 10:59 AM | 200 (1.7%) | 345 (3.4%) |
| 11:00 AM to 11:59 AM | 170 (1.5%) | 148 (1.5%) |
| 12:00 PM to 3:59 PM | 1,057 (9.2%) | 492 (4.9%) |
| 4:00 PM to 11:59 PM | 873 (7.6%) | 787 (7.8%) |
| Total | 11,477 (100.0%) | 10,119 (100.0%) |
Housing Occupancy in West Seneca
Occupancy by Ownership in West Seneca
Of the total 20,016 dwellings in West Seneca, owner-occupied units account for 15,443 (77.1%), while renter-occupied units make up 4,573 (22.9%).
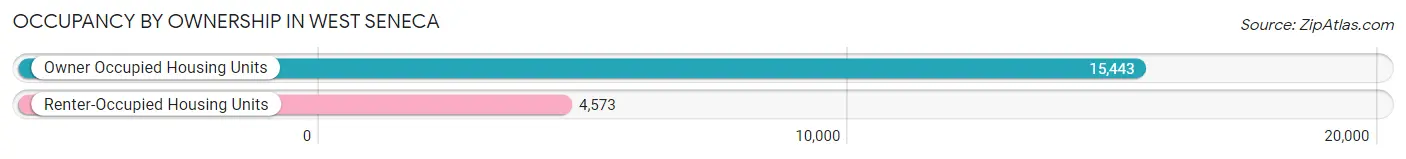
| Occupancy | # Housing Units | % Housing Units |
| Owner Occupied Housing Units | 15,443 | 77.1% |
| Renter-Occupied Housing Units | 4,573 | 22.9% |
| Total Occupied Housing Units | 20,016 | 100.0% |
Occupancy by Household Size in West Seneca
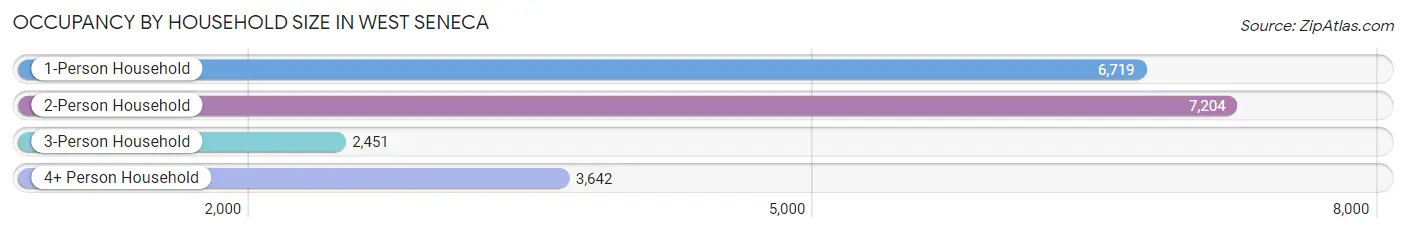
| Household Size | # Housing Units | % Housing Units |
| 1-Person Household | 6,719 | 33.6% |
| 2-Person Household | 7,204 | 36.0% |
| 3-Person Household | 2,451 | 12.2% |
| 4+ Person Household | 3,642 | 18.2% |
| Total Housing Units | 20,016 | 100.0% |
Occupancy by Ownership by Household Size in West Seneca
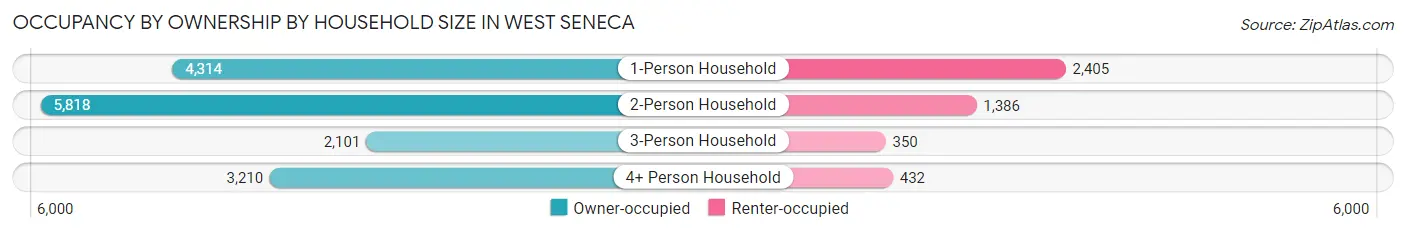
| Household Size | Owner-occupied | Renter-occupied |
| 1-Person Household | 4,314 (64.2%) | 2,405 (35.8%) |
| 2-Person Household | 5,818 (80.8%) | 1,386 (19.2%) |
| 3-Person Household | 2,101 (85.7%) | 350 (14.3%) |
| 4+ Person Household | 3,210 (88.1%) | 432 (11.9%) |
| Total Housing Units | 15,443 (77.1%) | 4,573 (22.9%) |
Occupancy by Educational Attainment in West Seneca
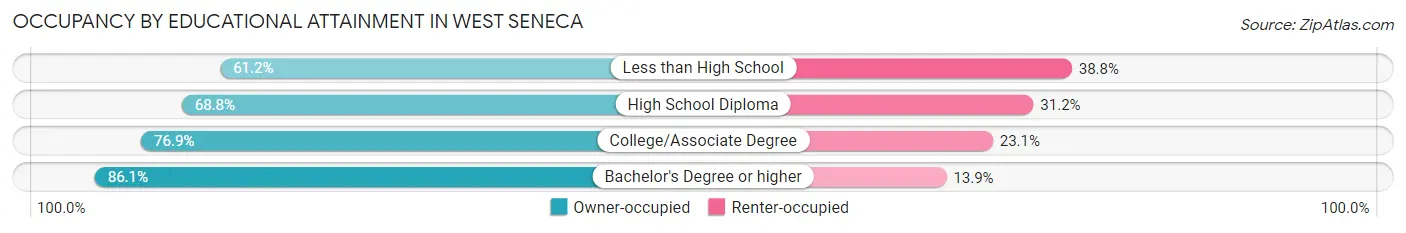
| Household Size | Owner-occupied | Renter-occupied |
| Less than High School | 497 (61.2%) | 315 (38.8%) |
| High School Diploma | 3,790 (68.8%) | 1,717 (31.2%) |
| College/Associate Degree | 5,294 (76.9%) | 1,592 (23.1%) |
| Bachelor's Degree or higher | 5,862 (86.1%) | 949 (13.9%) |
Occupancy by Age of Householder in West Seneca
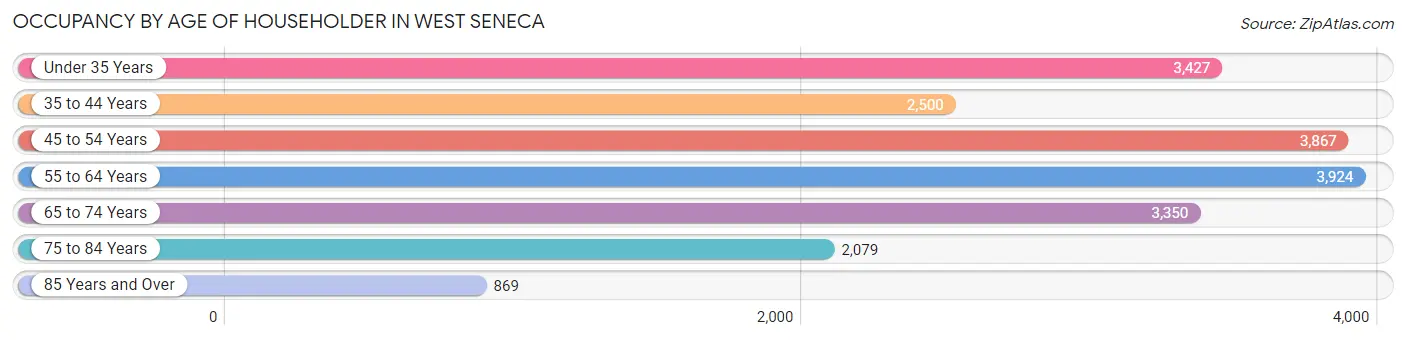
| Age Bracket | # Households | % Households |
| Under 35 Years | 3,427 | 17.1% |
| 35 to 44 Years | 2,500 | 12.5% |
| 45 to 54 Years | 3,867 | 19.3% |
| 55 to 64 Years | 3,924 | 19.6% |
| 65 to 74 Years | 3,350 | 16.7% |
| 75 to 84 Years | 2,079 | 10.4% |
| 85 Years and Over | 869 | 4.3% |
| Total | 20,016 | 100.0% |
Housing Finances in West Seneca
Median Income by Occupancy in West Seneca
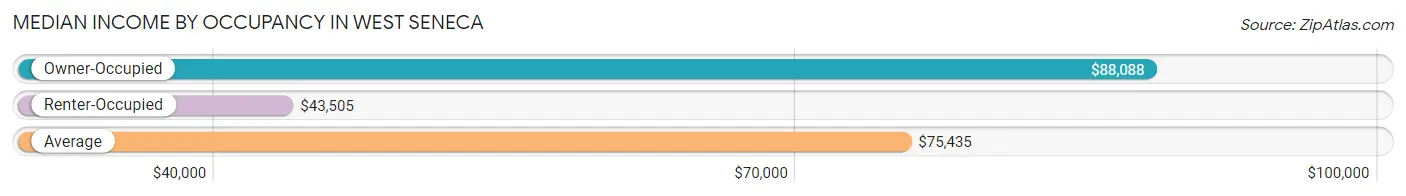
| Occupancy Type | # Households | Median Income |
| Owner-Occupied | 15,443 (77.1%) | $88,088 |
| Renter-Occupied | 4,573 (22.9%) | $43,505 |
| Average | 20,016 (100.0%) | $75,435 |
Occupancy by Householder Income Bracket in West Seneca
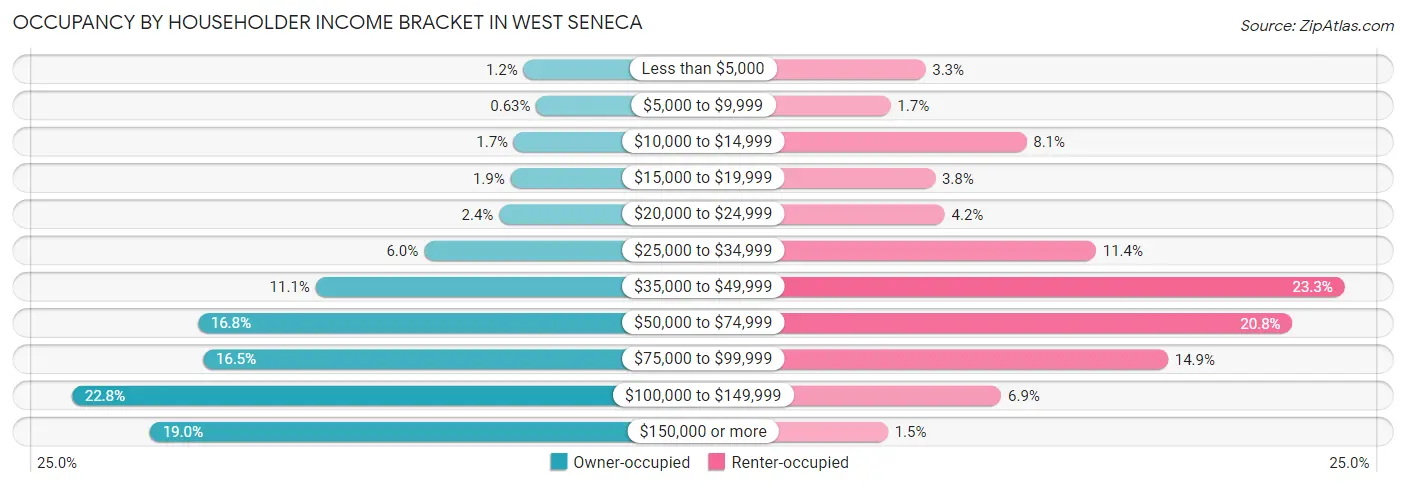
| Income Bracket | Owner-occupied | Renter-occupied |
| Less than $5,000 | 191 (1.2%) | 152 (3.3%) |
| $5,000 to $9,999 | 97 (0.6%) | 76 (1.7%) |
| $10,000 to $14,999 | 262 (1.7%) | 372 (8.1%) |
| $15,000 to $19,999 | 287 (1.9%) | 173 (3.8%) |
| $20,000 to $24,999 | 371 (2.4%) | 194 (4.2%) |
| $25,000 to $34,999 | 924 (6.0%) | 523 (11.4%) |
| $35,000 to $49,999 | 1,721 (11.1%) | 1,065 (23.3%) |
| $50,000 to $74,999 | 2,586 (16.8%) | 951 (20.8%) |
| $75,000 to $99,999 | 2,549 (16.5%) | 680 (14.9%) |
| $100,000 to $149,999 | 3,514 (22.8%) | 317 (6.9%) |
| $150,000 or more | 2,941 (19.0%) | 70 (1.5%) |
| Total | 15,443 (100.0%) | 4,573 (100.0%) |
Monthly Housing Cost Tiers in West Seneca
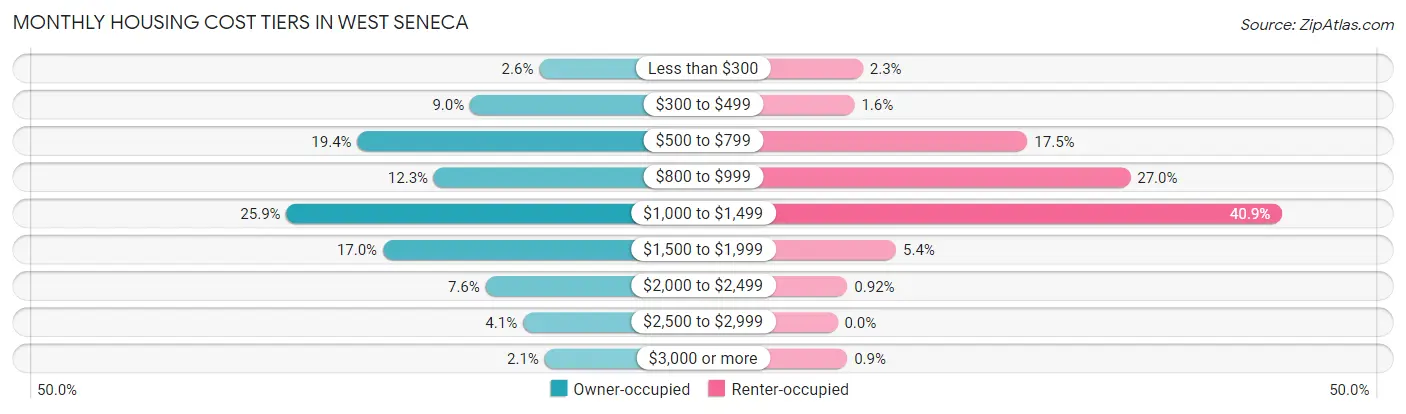
| Monthly Cost | Owner-occupied | Renter-occupied |
| Less than $300 | 404 (2.6%) | 107 (2.3%) |
| $300 to $499 | 1,389 (9.0%) | 72 (1.6%) |
| $500 to $799 | 2,990 (19.4%) | 800 (17.5%) |
| $800 to $999 | 1,902 (12.3%) | 1,233 (27.0%) |
| $1,000 to $1,499 | 3,999 (25.9%) | 1,872 (40.9%) |
| $1,500 to $1,999 | 2,627 (17.0%) | 247 (5.4%) |
| $2,000 to $2,499 | 1,168 (7.6%) | 42 (0.9%) |
| $2,500 to $2,999 | 637 (4.1%) | 0 (0.0%) |
| $3,000 or more | 327 (2.1%) | 41 (0.9%) |
| Total | 15,443 (100.0%) | 4,573 (100.0%) |
Physical Housing Characteristics in West Seneca
Housing Structures in West Seneca
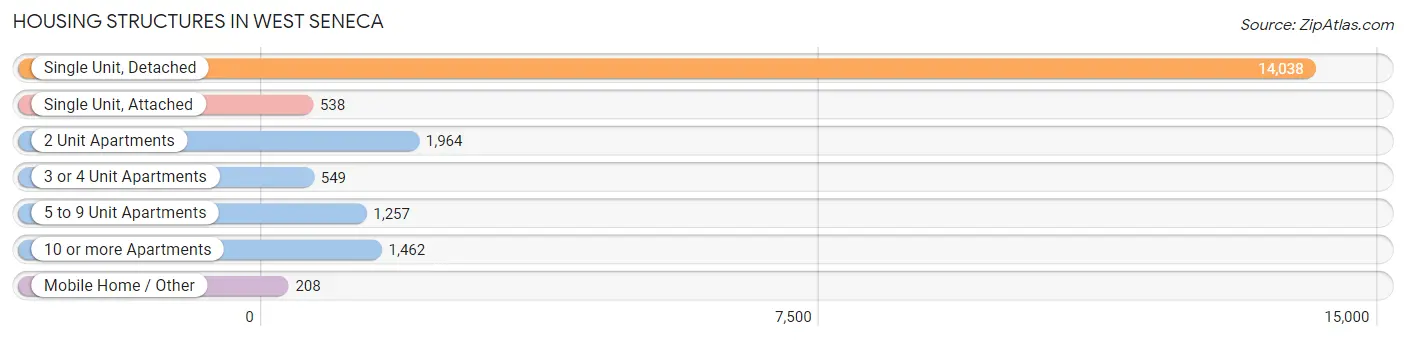
| Structure Type | # Housing Units | % Housing Units |
| Single Unit, Detached | 14,038 | 70.1% |
| Single Unit, Attached | 538 | 2.7% |
| 2 Unit Apartments | 1,964 | 9.8% |
| 3 or 4 Unit Apartments | 549 | 2.7% |
| 5 to 9 Unit Apartments | 1,257 | 6.3% |
| 10 or more Apartments | 1,462 | 7.3% |
| Mobile Home / Other | 208 | 1.0% |
| Total | 20,016 | 100.0% |
Housing Structures by Occupancy in West Seneca
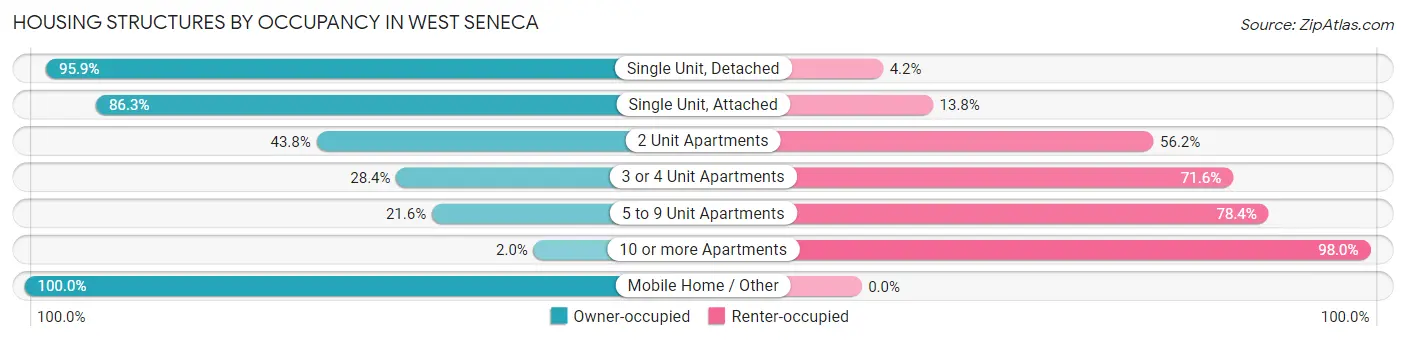
| Structure Type | Owner-occupied | Renter-occupied |
| Single Unit, Detached | 13,455 (95.9%) | 583 (4.2%) |
| Single Unit, Attached | 464 (86.3%) | 74 (13.8%) |
| 2 Unit Apartments | 860 (43.8%) | 1,104 (56.2%) |
| 3 or 4 Unit Apartments | 156 (28.4%) | 393 (71.6%) |
| 5 to 9 Unit Apartments | 271 (21.6%) | 986 (78.4%) |
| 10 or more Apartments | 29 (2.0%) | 1,433 (98.0%) |
| Mobile Home / Other | 208 (100.0%) | 0 (0.0%) |
| Total | 15,443 (77.1%) | 4,573 (22.9%) |
Housing Structures by Number of Rooms in West Seneca
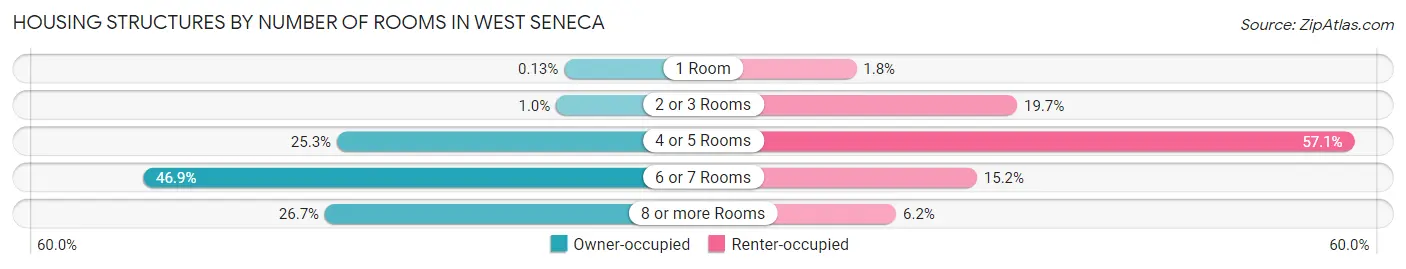
| Number of Rooms | Owner-occupied | Renter-occupied |
| 1 Room | 20 (0.1%) | 83 (1.8%) |
| 2 or 3 Rooms | 156 (1.0%) | 899 (19.7%) |
| 4 or 5 Rooms | 3,914 (25.3%) | 2,611 (57.1%) |
| 6 or 7 Rooms | 7,235 (46.9%) | 695 (15.2%) |
| 8 or more Rooms | 4,118 (26.7%) | 285 (6.2%) |
| Total | 15,443 (100.0%) | 4,573 (100.0%) |
Housing Structure by Heating Type in West Seneca
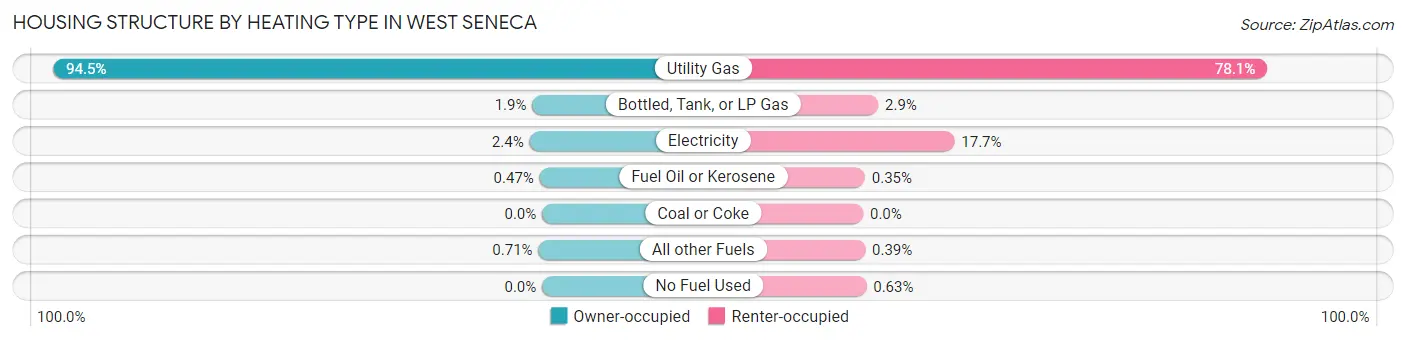
| Heating Type | Owner-occupied | Renter-occupied |
| Utility Gas | 14,591 (94.5%) | 3,570 (78.1%) |
| Bottled, Tank, or LP Gas | 294 (1.9%) | 133 (2.9%) |
| Electricity | 377 (2.4%) | 807 (17.6%) |
| Fuel Oil or Kerosene | 72 (0.5%) | 16 (0.4%) |
| Coal or Coke | 0 (0.0%) | 0 (0.0%) |
| All other Fuels | 109 (0.7%) | 18 (0.4%) |
| No Fuel Used | 0 (0.0%) | 29 (0.6%) |
| Total | 15,443 (100.0%) | 4,573 (100.0%) |
Household Vehicle Usage in West Seneca
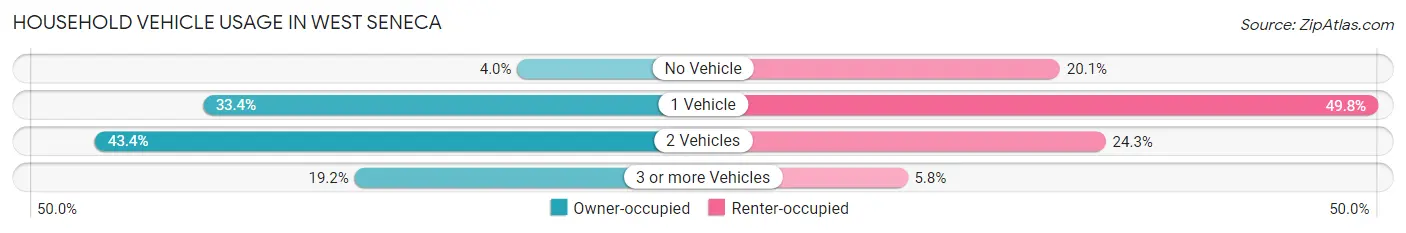
| Vehicles per Household | Owner-occupied | Renter-occupied |
| No Vehicle | 618 (4.0%) | 918 (20.1%) |
| 1 Vehicle | 5,154 (33.4%) | 2,275 (49.7%) |
| 2 Vehicles | 6,706 (43.4%) | 1,113 (24.3%) |
| 3 or more Vehicles | 2,965 (19.2%) | 267 (5.8%) |
| Total | 15,443 (100.0%) | 4,573 (100.0%) |
Real Estate & Mortgages in West Seneca
Real Estate and Mortgage Overview in West Seneca
| Characteristic | Without Mortgage | With Mortgage |
| Housing Units | 6,125 | 9,318 |
| Median Property Value | $191,100 | $203,200 |
| Median Household Income | $63,412 | $2,301 |
| Monthly Housing Costs | $631 | $319 |
| Real Estate Taxes | $4,325 | $179 |
Property Value by Mortgage Status in West Seneca
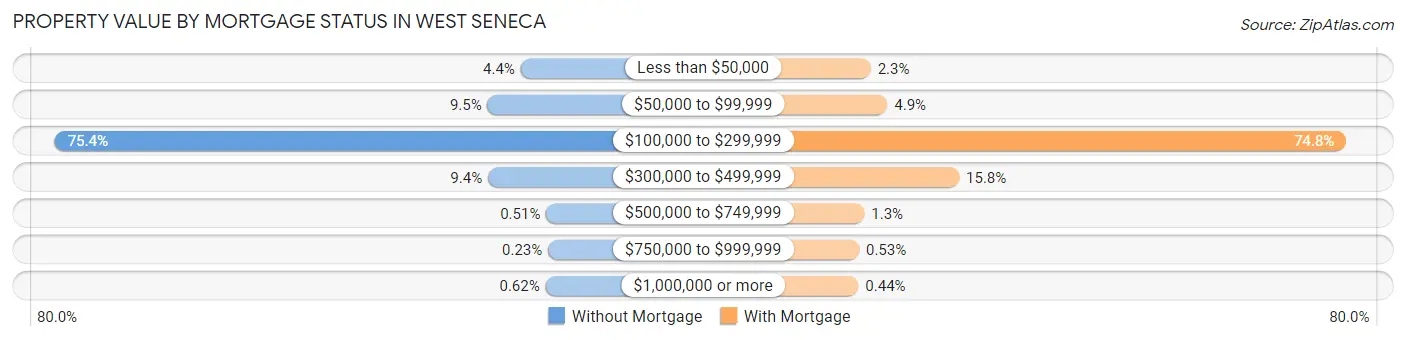
| Property Value | Without Mortgage | With Mortgage |
| Less than $50,000 | 270 (4.4%) | 215 (2.3%) |
| $50,000 to $99,999 | 579 (9.5%) | 452 (4.9%) |
| $100,000 to $299,999 | 4,618 (75.4%) | 6,966 (74.8%) |
| $300,000 to $499,999 | 575 (9.4%) | 1,470 (15.8%) |
| $500,000 to $749,999 | 31 (0.5%) | 125 (1.3%) |
| $750,000 to $999,999 | 14 (0.2%) | 49 (0.5%) |
| $1,000,000 or more | 38 (0.6%) | 41 (0.4%) |
| Total | 6,125 (100.0%) | 9,318 (100.0%) |
Household Income by Mortgage Status in West Seneca
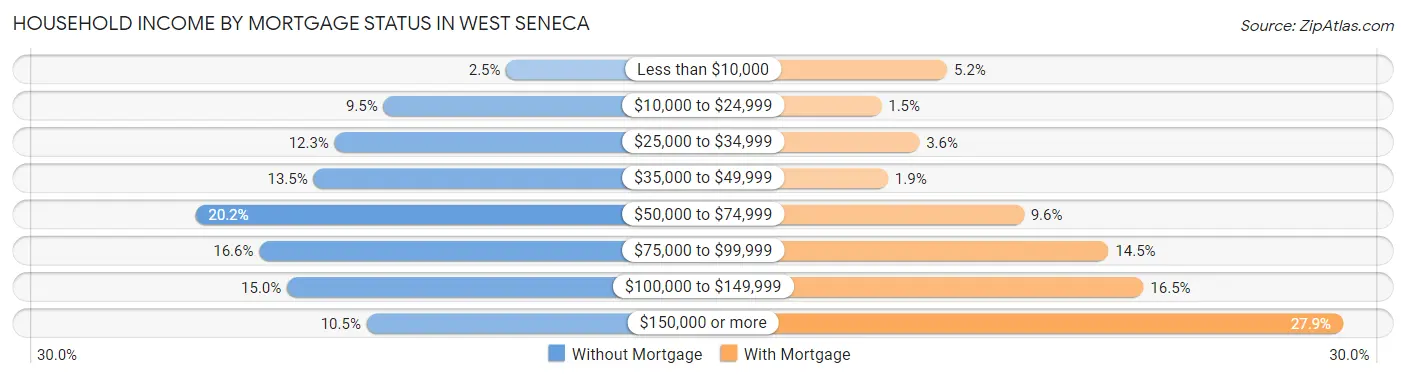
| Household Income | Without Mortgage | With Mortgage |
| Less than $10,000 | 151 (2.5%) | 487 (5.2%) |
| $10,000 to $24,999 | 581 (9.5%) | 137 (1.5%) |
| $25,000 to $34,999 | 752 (12.3%) | 339 (3.6%) |
| $35,000 to $49,999 | 826 (13.5%) | 172 (1.8%) |
| $50,000 to $74,999 | 1,240 (20.2%) | 895 (9.6%) |
| $75,000 to $99,999 | 1,016 (16.6%) | 1,346 (14.4%) |
| $100,000 to $149,999 | 919 (15.0%) | 1,533 (16.5%) |
| $150,000 or more | 640 (10.4%) | 2,595 (27.9%) |
| Total | 6,125 (100.0%) | 9,318 (100.0%) |
Property Value to Household Income Ratio in West Seneca
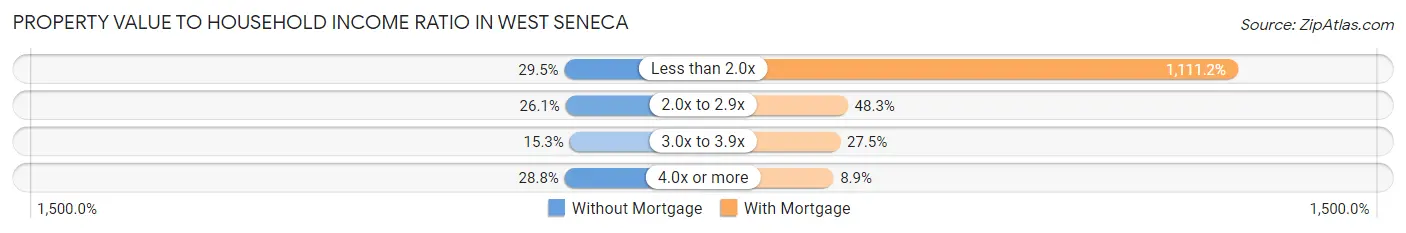
| Value-to-Income Ratio | Without Mortgage | With Mortgage |
| Less than 2.0x | 1,804 (29.4%) | 103,542 (1,111.2%) |
| 2.0x to 2.9x | 1,599 (26.1%) | 4,501 (48.3%) |
| 3.0x to 3.9x | 938 (15.3%) | 2,561 (27.5%) |
| 4.0x or more | 1,766 (28.8%) | 830 (8.9%) |
| Total | 6,125 (100.0%) | 9,318 (100.0%) |
Real Estate Taxes by Mortgage Status in West Seneca
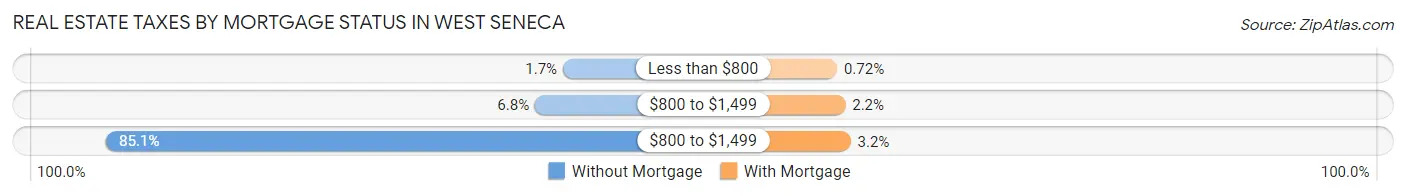
| Property Taxes | Without Mortgage | With Mortgage |
| Less than $800 | 102 (1.7%) | 67 (0.7%) |
| $800 to $1,499 | 415 (6.8%) | 208 (2.2%) |
| $800 to $1,499 | 5,213 (85.1%) | 299 (3.2%) |
| Total | 6,125 (100.0%) | 9,318 (100.0%) |
Health & Disability in West Seneca
Health Insurance Coverage by Age in West Seneca
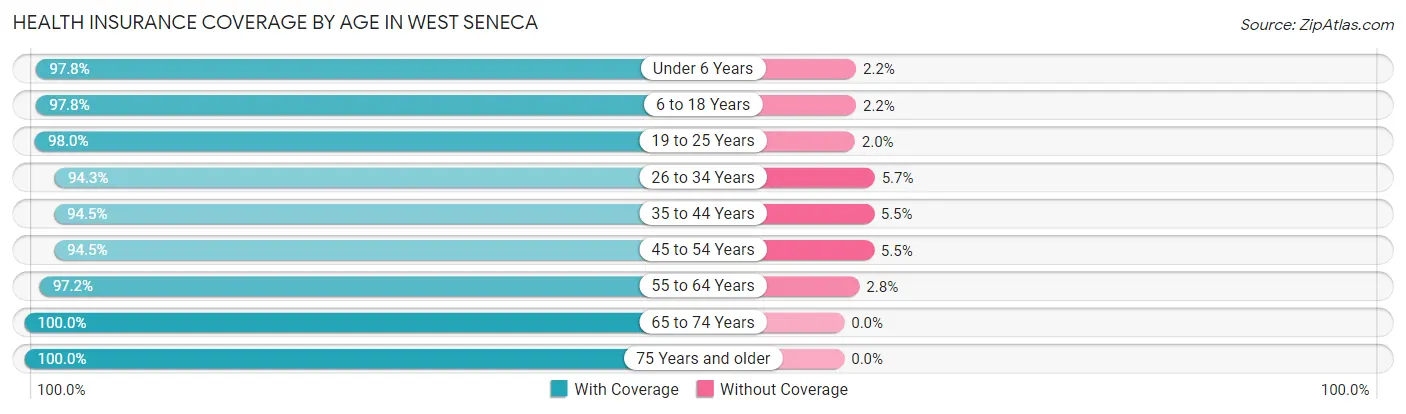
| Age Bracket | With Coverage | Without Coverage |
| Under 6 Years | 2,623 (97.8%) | 59 (2.2%) |
| 6 to 18 Years | 5,766 (97.8%) | 129 (2.2%) |
| 19 to 25 Years | 3,438 (98.0%) | 69 (2.0%) |
| 26 to 34 Years | 5,374 (94.3%) | 323 (5.7%) |
| 35 to 44 Years | 4,758 (94.5%) | 277 (5.5%) |
| 45 to 54 Years | 5,889 (94.5%) | 344 (5.5%) |
| 55 to 64 Years | 6,723 (97.2%) | 195 (2.8%) |
| 65 to 74 Years | 5,244 (100.0%) | 0 (0.0%) |
| 75 Years and older | 3,987 (100.0%) | 0 (0.0%) |
| Total | 43,802 (96.9%) | 1,396 (3.1%) |
Health Insurance Coverage by Citizenship Status in West Seneca
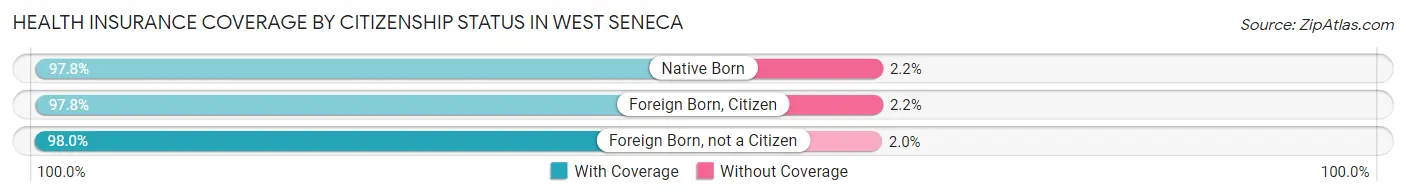
| Citizenship Status | With Coverage | Without Coverage |
| Native Born | 2,623 (97.8%) | 59 (2.2%) |
| Foreign Born, Citizen | 5,766 (97.8%) | 129 (2.2%) |
| Foreign Born, not a Citizen | 3,438 (98.0%) | 69 (2.0%) |
Health Insurance Coverage by Household Income in West Seneca
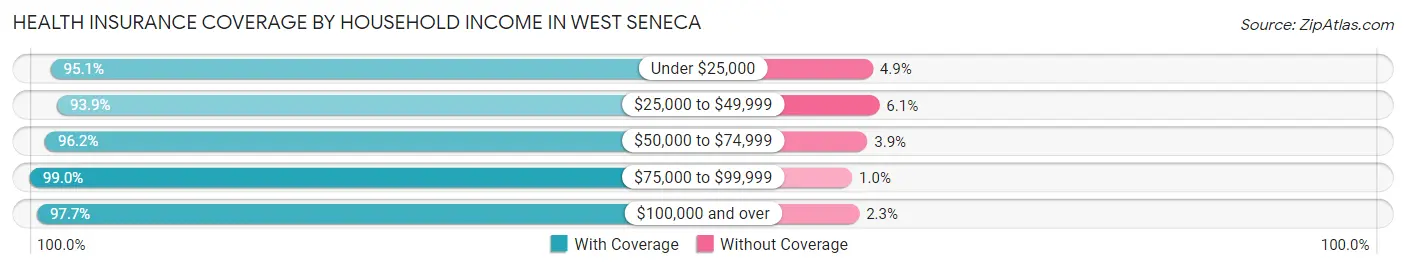
| Household Income | With Coverage | Without Coverage |
| Under $25,000 | 2,567 (95.1%) | 132 (4.9%) |
| $25,000 to $49,999 | 6,774 (93.9%) | 441 (6.1%) |
| $50,000 to $74,999 | 6,569 (96.2%) | 263 (3.8%) |
| $75,000 to $99,999 | 7,693 (99.0%) | 78 (1.0%) |
| $100,000 and over | 19,881 (97.7%) | 472 (2.3%) |
Public vs Private Health Insurance Coverage by Age in West Seneca
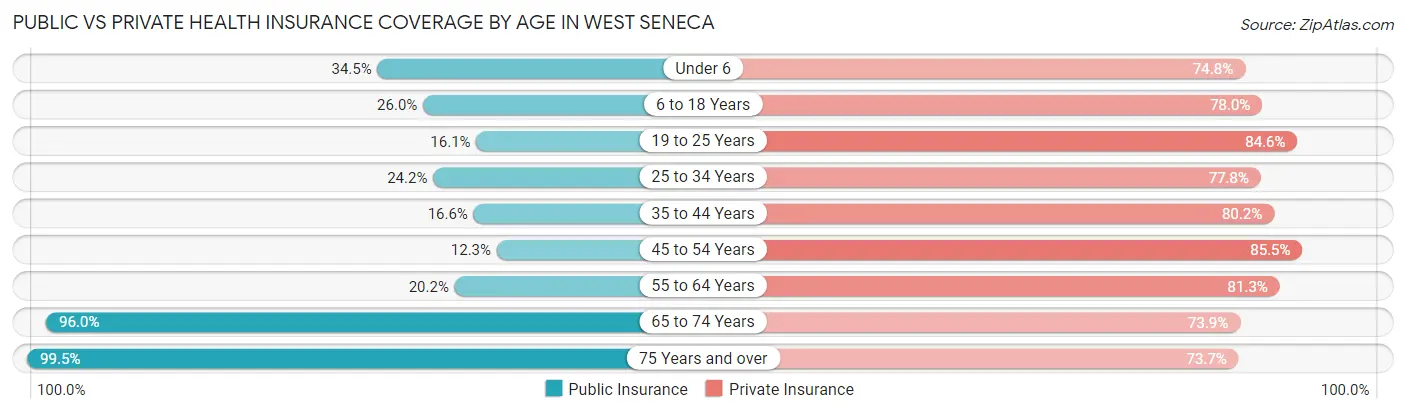
| Age Bracket | Public Insurance | Private Insurance |
| Under 6 | 925 (34.5%) | 2,007 (74.8%) |
| 6 to 18 Years | 1,534 (26.0%) | 4,600 (78.0%) |
| 19 to 25 Years | 566 (16.1%) | 2,965 (84.6%) |
| 25 to 34 Years | 1,376 (24.1%) | 4,430 (77.8%) |
| 35 to 44 Years | 838 (16.6%) | 4,039 (80.2%) |
| 45 to 54 Years | 769 (12.3%) | 5,328 (85.5%) |
| 55 to 64 Years | 1,395 (20.2%) | 5,622 (81.3%) |
| 65 to 74 Years | 5,035 (96.0%) | 3,877 (73.9%) |
| 75 Years and over | 3,968 (99.5%) | 2,937 (73.7%) |
| Total | 16,406 (36.3%) | 35,805 (79.2%) |
Disability Status by Sex by Age in West Seneca
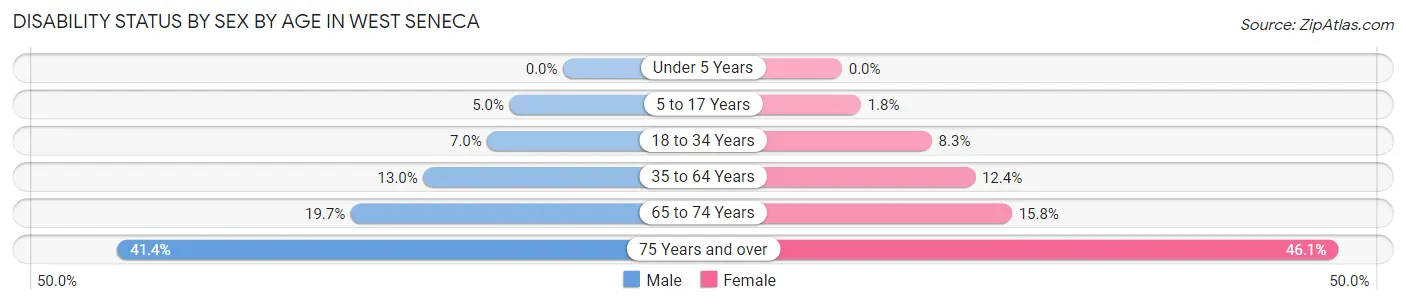
| Age Bracket | Male | Female |
| Under 5 Years | 0 (0.0%) | 0 (0.0%) |
| 5 to 17 Years | 140 (5.0%) | 58 (1.8%) |
| 18 to 34 Years | 327 (7.0%) | 400 (8.3%) |
| 35 to 64 Years | 1,207 (13.0%) | 1,098 (12.4%) |
| 65 to 74 Years | 467 (19.7%) | 453 (15.8%) |
| 75 Years and over | 615 (41.4%) | 1,152 (46.1%) |
Disability Class by Sex by Age in West Seneca
Disability Class: Hearing Difficulty
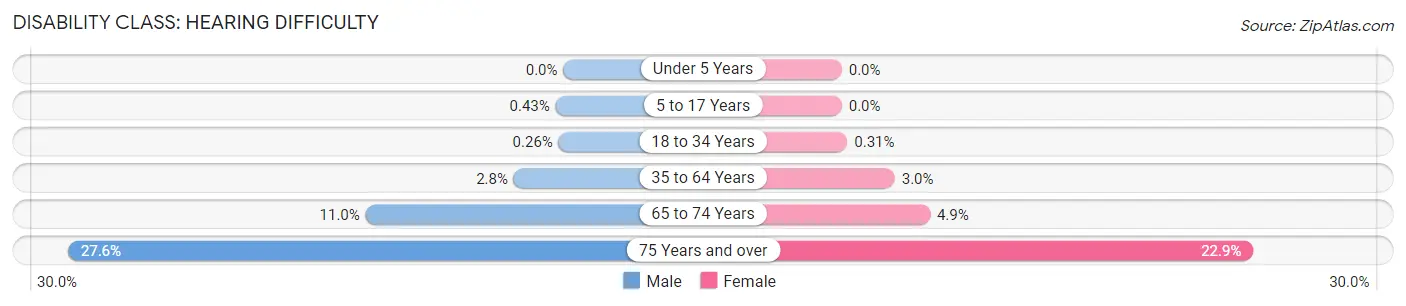
| Age Bracket | Male | Female |
| Under 5 Years | 0 (0.0%) | 0 (0.0%) |
| 5 to 17 Years | 12 (0.4%) | 0 (0.0%) |
| 18 to 34 Years | 12 (0.3%) | 15 (0.3%) |
| 35 to 64 Years | 257 (2.8%) | 262 (2.9%) |
| 65 to 74 Years | 261 (11.0%) | 141 (4.9%) |
| 75 Years and over | 410 (27.6%) | 573 (22.9%) |
Disability Class: Vision Difficulty
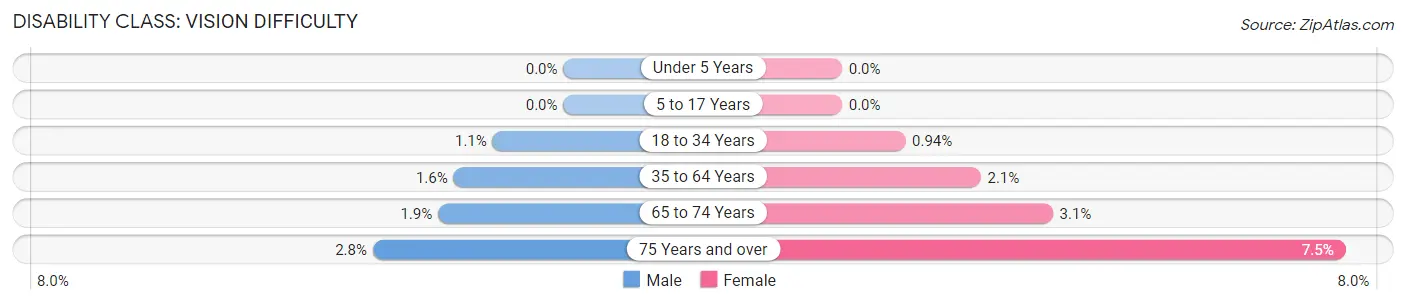
| Age Bracket | Male | Female |
| Under 5 Years | 0 (0.0%) | 0 (0.0%) |
| 5 to 17 Years | 0 (0.0%) | 0 (0.0%) |
| 18 to 34 Years | 49 (1.1%) | 45 (0.9%) |
| 35 to 64 Years | 152 (1.6%) | 183 (2.1%) |
| 65 to 74 Years | 44 (1.9%) | 90 (3.1%) |
| 75 Years and over | 42 (2.8%) | 187 (7.5%) |
Disability Class: Cognitive Difficulty
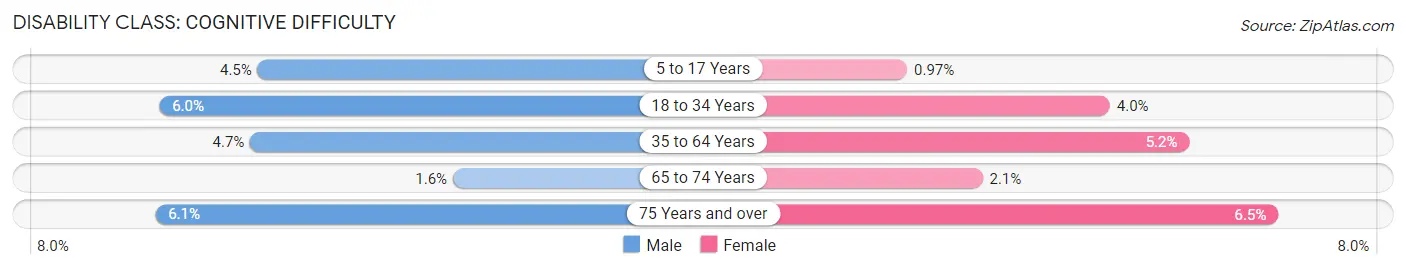
| Age Bracket | Male | Female |
| 5 to 17 Years | 128 (4.5%) | 32 (1.0%) |
| 18 to 34 Years | 279 (6.0%) | 191 (4.0%) |
| 35 to 64 Years | 433 (4.6%) | 458 (5.2%) |
| 65 to 74 Years | 39 (1.6%) | 60 (2.1%) |
| 75 Years and over | 90 (6.1%) | 162 (6.5%) |
Disability Class: Ambulatory Difficulty
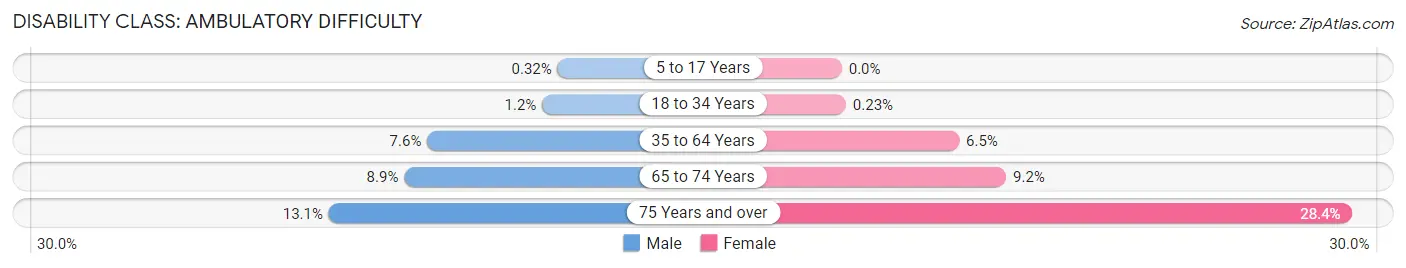
| Age Bracket | Male | Female |
| 5 to 17 Years | 9 (0.3%) | 0 (0.0%) |
| 18 to 34 Years | 55 (1.2%) | 11 (0.2%) |
| 35 to 64 Years | 705 (7.6%) | 580 (6.5%) |
| 65 to 74 Years | 210 (8.9%) | 263 (9.1%) |
| 75 Years and over | 194 (13.1%) | 711 (28.4%) |
Disability Class: Self-Care Difficulty
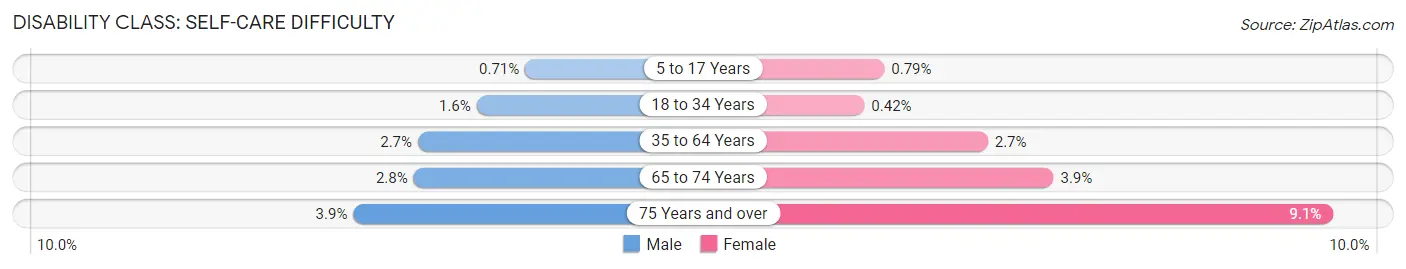
| Age Bracket | Male | Female |
| 5 to 17 Years | 20 (0.7%) | 26 (0.8%) |
| 18 to 34 Years | 75 (1.6%) | 20 (0.4%) |
| 35 to 64 Years | 251 (2.7%) | 241 (2.7%) |
| 65 to 74 Years | 66 (2.8%) | 113 (3.9%) |
| 75 Years and over | 58 (3.9%) | 228 (9.1%) |
Technology Access in West Seneca
Computing Device Access in West Seneca
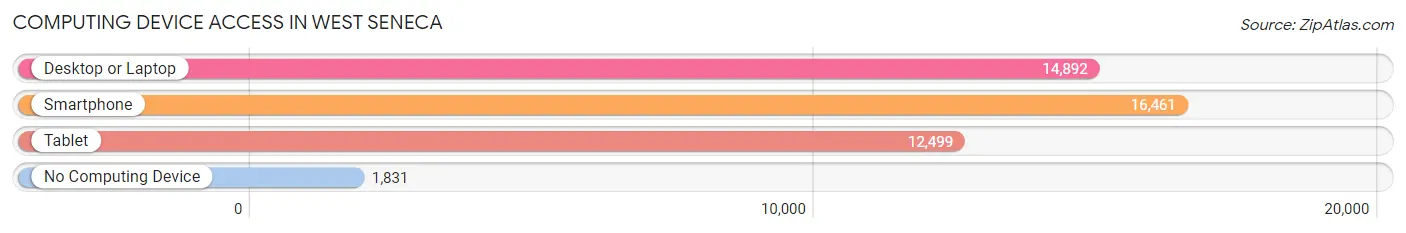
| Device Type | # Households | % Households |
| Desktop or Laptop | 14,892 | 74.4% |
| Smartphone | 16,461 | 82.2% |
| Tablet | 12,499 | 62.5% |
| No Computing Device | 1,831 | 9.1% |
| Total | 20,016 | 100.0% |
Internet Access in West Seneca
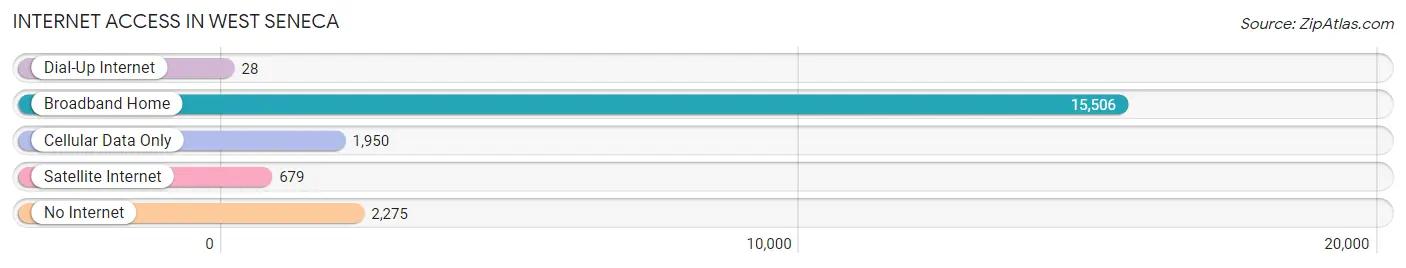
| Internet Type | # Households | % Households |
| Dial-Up Internet | 28 | 0.1% |
| Broadband Home | 15,506 | 77.5% |
| Cellular Data Only | 1,950 | 9.7% |
| Satellite Internet | 679 | 3.4% |
| No Internet | 2,275 | 11.4% |
| Total | 20,016 | 100.0% |
West Seneca Summary
West Seneca is a town located in Erie County, New York, United States. It is a suburb of Buffalo, located just south of the city. As of the 2010 census, the town had a total population of 44,711. The town is bordered on the north by the city of Buffalo and on the east by the town of Cheektowaga.
History
The area that is now West Seneca was originally part of the Buffalo Creek Reservation, a tract of land set aside for the Seneca Nation of Indians in the late 1700s. The Senecas were forced to cede the land to the state of New York in 1842, and the area was opened up for settlement. The town of West Seneca was formed in 1851 from the town of Cheektowaga.
Geography
West Seneca is located in western New York, just south of the city of Buffalo. It is bordered on the north by the city of Buffalo, on the east by the town of Cheektowaga, on the south by the town of Orchard Park, and on the west by the town of Hamburg. The town has a total area of 24.2 square miles, of which 24.1 square miles is land and 0.1 square miles is water.
Economy
West Seneca is home to a variety of businesses, including manufacturing, retail, and service industries. The town is also home to several large employers, including the West Seneca Central School District, the West Seneca Development Corporation, and the West Seneca Chamber of Commerce.
Demographics
As of the 2010 census, there were 44,711 people, 17,945 households, and 11,945 families residing in the town. The population density was 1,851.3 people per square mile. The racial makeup of the town was 94.2% White, 2.2% African American, 0.4% Native American, 1.2% Asian, 0.1% Pacific Islander, 0.7% from other races, and 1.2% from two or more races. Hispanic or Latino of any race were 3.2% of the population.
The median income for a household in the town was $50,945, and the median income for a family was $62,917. Males had a median income of $45,945 versus $35,945 for females. The per capita income for the town was $25,945. About 4.2% of families and 6.2% of the population were below the poverty line, including 8.2% of those under age 18 and 4.2% of those age 65 or over.
Common Questions
What is Per Capita Income in West Seneca?
Per Capita income in West Seneca is $40,320.
What is the Median Family Income in West Seneca?
Median Family Income in West Seneca is $99,008.
What is the Median Household income in West Seneca?
Median Household Income in West Seneca is $75,435.
What is Income or Wage Gap in West Seneca?
Income or Wage Gap in West Seneca is 32.9%.
Women in West Seneca earn 67.1 cents for every dollar earned by a man.
What is Inequality or Gini Index in West Seneca?
Inequality or Gini Index in West Seneca is 0.39.
What is the Total Population of West Seneca?
Total Population of West Seneca is 45,387.
What is the Total Male Population of West Seneca?
Total Male Population of West Seneca is 21,615.
What is the Total Female Population of West Seneca?
Total Female Population of West Seneca is 23,772.
What is the Ratio of Males per 100 Females in West Seneca?
There are 90.93 Males per 100 Females in West Seneca.
What is the Ratio of Females per 100 Males in West Seneca?
There are 109.98 Females per 100 Males in West Seneca.
What is the Median Population Age in West Seneca?
Median Population Age in West Seneca is 44.6 Years.
What is the Average Family Size in West Seneca
Average Family Size in West Seneca is 2.9 People.
What is the Average Household Size in West Seneca
Average Household Size in West Seneca is 2.2 People.
How Large is the Labor Force in West Seneca?
There are 25,327 People in the Labor Forcein in West Seneca.
What is the Percentage of People in the Labor Force in West Seneca?
66.0% of People are in the Labor Force in West Seneca.
What is the Unemployment Rate in West Seneca?
Unemployment Rate in West Seneca is 4.4%.