Syracuse, NY Map & Demographics
Syracuse Map
Syracuse Overview
$26,472
PER CAPITA INCOME
$54,860
AVG FAMILY INCOME
$43,584
AVG HOUSEHOLD INCOME
15.0%
WAGE / INCOME GAP [ % ]
85.0¢/ $1
WAGE / INCOME GAP [ $ ]
$13,078
FAMILY INCOME DEFICIT
0.50
INEQUALITY / GINI INDEX
146,134
TOTAL POPULATION
70,588
MALE POPULATION
75,546
FEMALE POPULATION
93.44
MALES / 100 FEMALES
107.02
FEMALES / 100 MALES
31.9
MEDIAN AGE
3.1
AVG FAMILY SIZE
2.2
AVG HOUSEHOLD SIZE
67,578
LABOR FORCE [ PEOPLE ]
57.0%
PERCENT IN LABOR FORCE
8.6%
UNEMPLOYMENT RATE
Syracuse Zip Codes
Syracuse Area Codes
Income in Syracuse
Income Overview in Syracuse
Per Capita Income in Syracuse is $26,472, while median incomes of families and households are $54,860 and $43,584 respectively.
| Characteristic | Number | Measure |
| Per Capita Income | 146,134 | $26,472 |
| Median Family Income | 27,798 | $54,860 |
| Mean Family Income | 27,798 | $76,120 |
| Median Household Income | 58,424 | $43,584 |
| Mean Household Income | 58,424 | $63,012 |
| Income Deficit | 27,798 | $13,078 |
| Wage / Income Gap (%) | 146,134 | 14.97% |
| Wage / Income Gap ($) | 146,134 | 85.03¢ per $1 |
| Gini / Inequality Index | 146,134 | 0.50 |
Earnings by Sex in Syracuse
Average Earnings in Syracuse are $29,951, $32,708 for men and $27,813 for women, a difference of 15.0%.
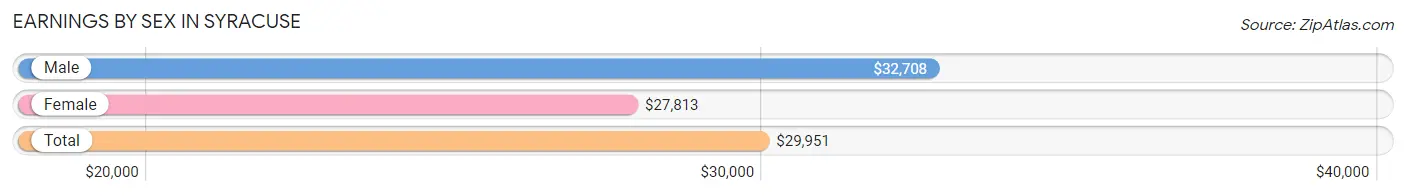
| Sex | Number | Average Earnings |
| Male | 35,643 (48.5%) | $32,708 |
| Female | 37,799 (51.5%) | $27,813 |
| Total | 73,442 (100.0%) | $29,951 |
Earnings by Sex by Income Bracket in Syracuse
The most common earnings brackets in Syracuse are $75,000 to $99,999 for men (3,254 | 9.1%) and $2,499 or less for women (3,996 | 10.6%).
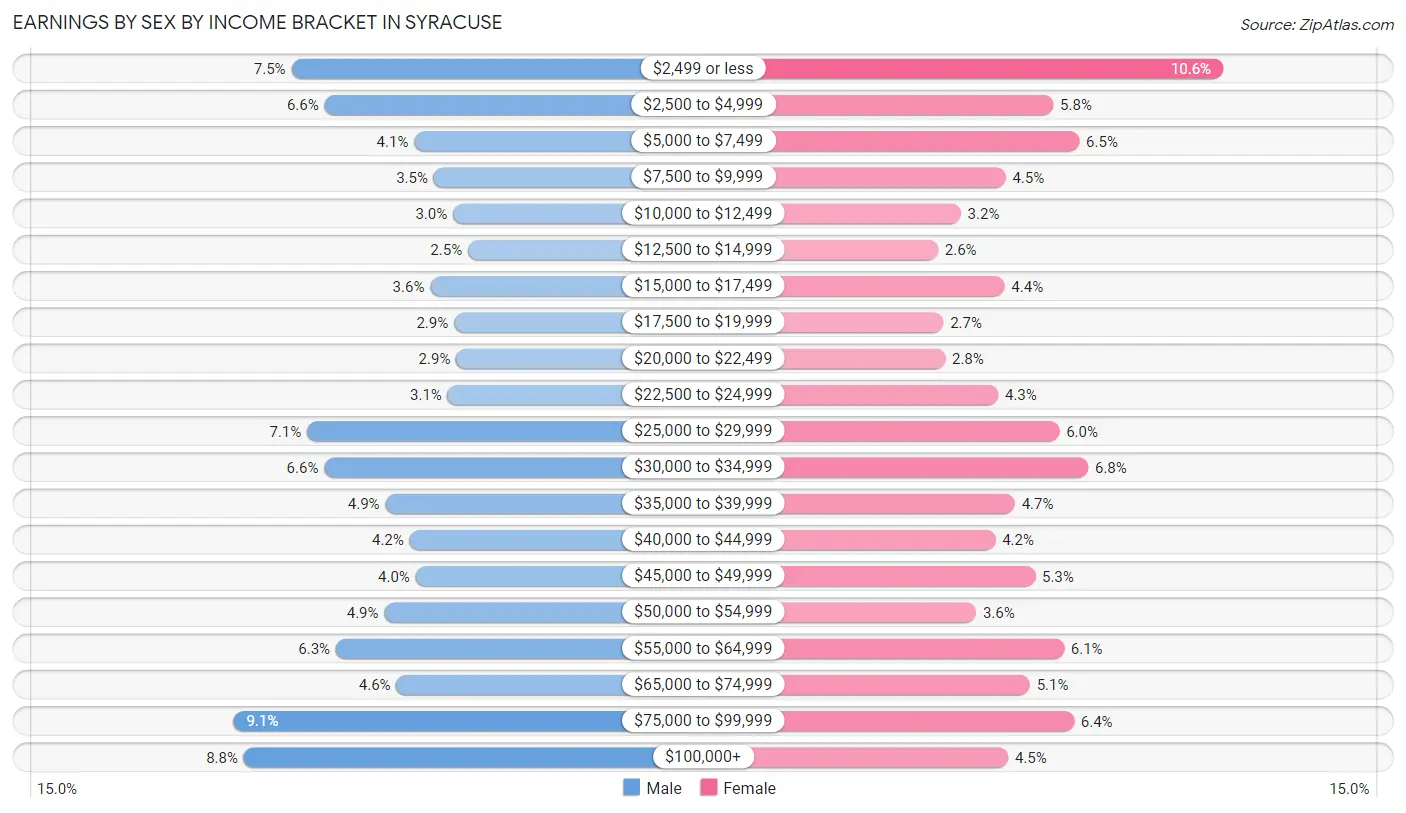
| Income | Male | Female |
| $2,499 or less | 2,675 (7.5%) | 3,996 (10.6%) |
| $2,500 to $4,999 | 2,341 (6.6%) | 2,191 (5.8%) |
| $5,000 to $7,499 | 1,445 (4.1%) | 2,470 (6.5%) |
| $7,500 to $9,999 | 1,248 (3.5%) | 1,686 (4.5%) |
| $10,000 to $12,499 | 1,056 (3.0%) | 1,210 (3.2%) |
| $12,500 to $14,999 | 907 (2.5%) | 968 (2.6%) |
| $15,000 to $17,499 | 1,283 (3.6%) | 1,676 (4.4%) |
| $17,500 to $19,999 | 1,044 (2.9%) | 1,024 (2.7%) |
| $20,000 to $22,499 | 1,024 (2.9%) | 1,045 (2.8%) |
| $22,500 to $24,999 | 1,109 (3.1%) | 1,605 (4.3%) |
| $25,000 to $29,999 | 2,516 (7.1%) | 2,256 (6.0%) |
| $30,000 to $34,999 | 2,347 (6.6%) | 2,562 (6.8%) |
| $35,000 to $39,999 | 1,734 (4.9%) | 1,786 (4.7%) |
| $40,000 to $44,999 | 1,491 (4.2%) | 1,577 (4.2%) |
| $45,000 to $49,999 | 1,428 (4.0%) | 2,001 (5.3%) |
| $50,000 to $54,999 | 1,742 (4.9%) | 1,372 (3.6%) |
| $55,000 to $64,999 | 2,227 (6.2%) | 2,307 (6.1%) |
| $65,000 to $74,999 | 1,620 (4.5%) | 1,943 (5.1%) |
| $75,000 to $99,999 | 3,254 (9.1%) | 2,411 (6.4%) |
| $100,000+ | 3,152 (8.8%) | 1,713 (4.5%) |
| Total | 35,643 (100.0%) | 37,799 (100.0%) |
Earnings by Sex by Educational Attainment in Syracuse
Average earnings in Syracuse are $41,066 for men and $35,079 for women, a difference of 14.6%. Men with an educational attainment of graduate degree enjoy the highest average annual earnings of $68,851, while those with less than high school education earn the least with $31,287. Women with an educational attainment of graduate degree earn the most with the average annual earnings of $58,205, while those with less than high school education have the smallest earnings of $21,486.
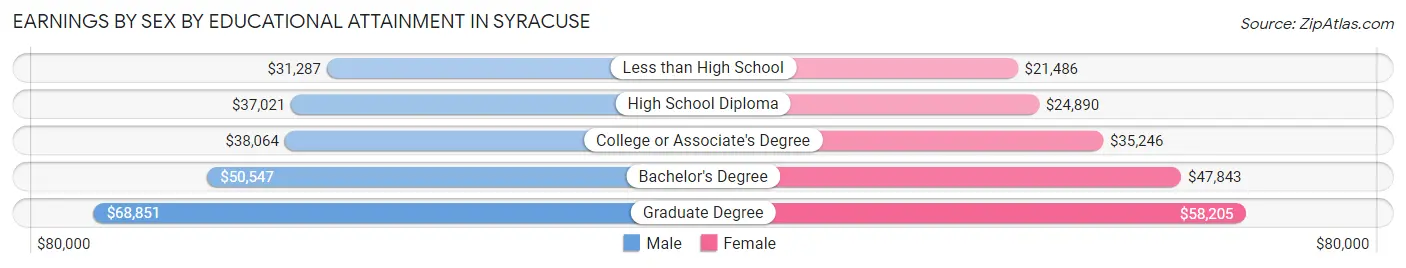
| Educational Attainment | Male Income | Female Income |
| Less than High School | $31,287 | $21,486 |
| High School Diploma | $37,021 | $24,890 |
| College or Associate's Degree | $38,064 | $35,246 |
| Bachelor's Degree | $50,547 | $47,843 |
| Graduate Degree | $68,851 | $58,205 |
| Total | $41,066 | $35,079 |
Family Income in Syracuse
Family Income Brackets in Syracuse
According to the Syracuse family income data, there are 4,420 families falling into the $50,000 to $74,999 income range, which is the most common income bracket and makes up 15.9% of all families. Conversely, the $10,000 to $14,999 income bracket is the least frequent group with only 1,195 families (4.3%) belonging to this category.
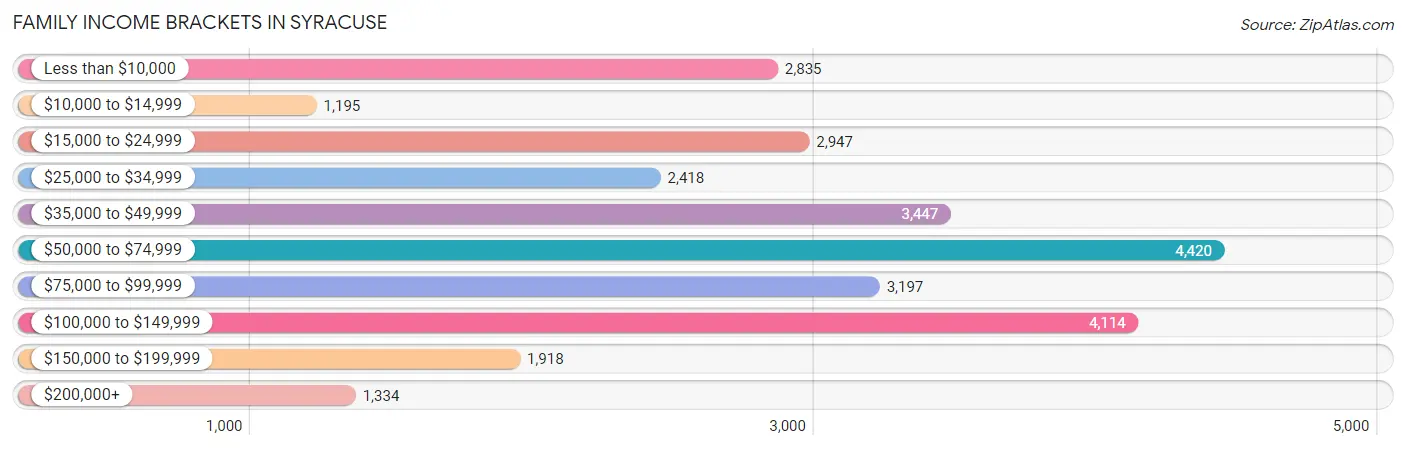
| Income Bracket | # Families | % Families |
| Less than $10,000 | 2,835 | 10.2% |
| $10,000 to $14,999 | 1,195 | 4.3% |
| $15,000 to $24,999 | 2,947 | 10.6% |
| $25,000 to $34,999 | 2,418 | 8.7% |
| $35,000 to $49,999 | 3,447 | 12.4% |
| $50,000 to $74,999 | 4,420 | 15.9% |
| $75,000 to $99,999 | 3,197 | 11.5% |
| $100,000 to $149,999 | 4,114 | 14.8% |
| $150,000 to $199,999 | 1,918 | 6.9% |
| $200,000+ | 1,334 | 4.8% |
Family Income by Famaliy Size in Syracuse
4-person families (4,439 | 16.0%) account for the highest median family income in Syracuse with $60,428 per family, while 2-person families (13,519 | 48.6%) have the highest median income of $28,498 per family member.
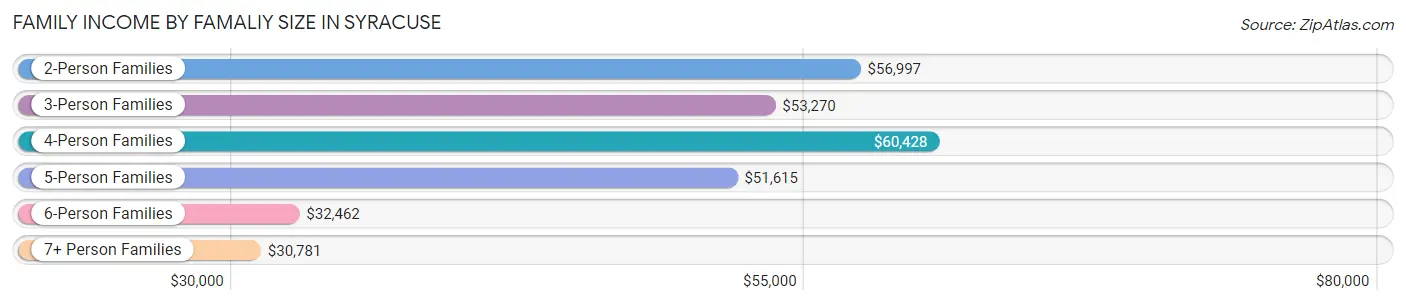
| Income Bracket | # Families | Median Income |
| 2-Person Families | 13,519 (48.6%) | $56,997 |
| 3-Person Families | 6,495 (23.4%) | $53,270 |
| 4-Person Families | 4,439 (16.0%) | $60,428 |
| 5-Person Families | 1,821 (6.6%) | $51,615 |
| 6-Person Families | 874 (3.1%) | $32,462 |
| 7+ Person Families | 650 (2.3%) | $30,781 |
| Total | 27,798 (100.0%) | $54,860 |
Family Income by Number of Earners in Syracuse
The median family income in Syracuse is $54,860, with families comprising 3+ earners (1,642) having the highest median family income of $133,875, while families with no earners (4,820) have the lowest median family income of $17,669, accounting for 5.9% and 17.3% of families, respectively.
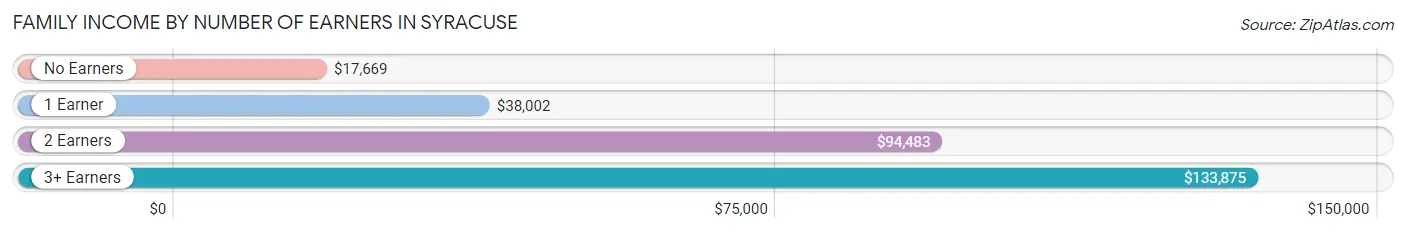
| Number of Earners | # Families | Median Income |
| No Earners | 4,820 (17.3%) | $17,669 |
| 1 Earner | 11,450 (41.2%) | $38,002 |
| 2 Earners | 9,886 (35.6%) | $94,483 |
| 3+ Earners | 1,642 (5.9%) | $133,875 |
| Total | 27,798 (100.0%) | $54,860 |
Household Income in Syracuse
Household Income Brackets in Syracuse
With 9,582 households falling in the category, the $50,000 to $74,999 income range is the most frequent in Syracuse, accounting for 16.4% of all households. In contrast, only 2,103 households (3.6%) fall into the $200,000+ income bracket, making it the least populous group.
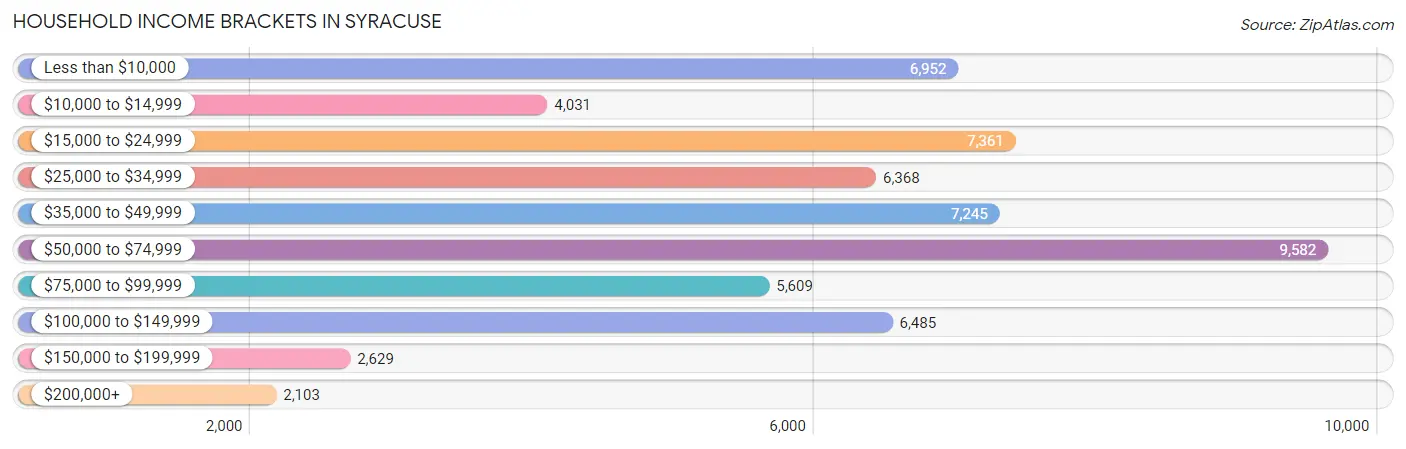
| Income Bracket | # Households | % Households |
| Less than $10,000 | 6,952 | 11.9% |
| $10,000 to $14,999 | 4,031 | 6.9% |
| $15,000 to $24,999 | 7,361 | 12.6% |
| $25,000 to $34,999 | 6,368 | 10.9% |
| $35,000 to $49,999 | 7,245 | 12.4% |
| $50,000 to $74,999 | 9,582 | 16.4% |
| $75,000 to $99,999 | 5,609 | 9.6% |
| $100,000 to $149,999 | 6,485 | 11.1% |
| $150,000 to $199,999 | 2,629 | 4.5% |
| $200,000+ | 2,103 | 3.6% |
Household Income by Householder Age in Syracuse
The median household income in Syracuse is $43,584, with the highest median household income of $51,165 found in the 45 to 64 years age bracket for the primary householder. A total of 19,833 households (34.0%) fall into this category. Meanwhile, the 15 to 24 years age bracket for the primary householder has the lowest median household income of $27,159, with 3,960 households (6.8%) in this group.
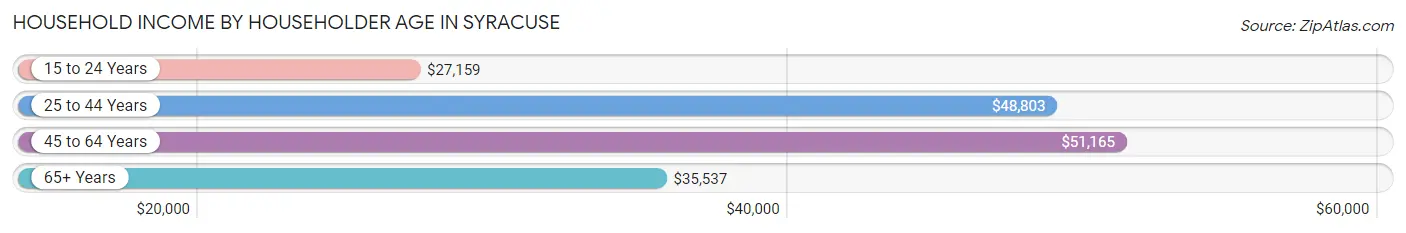
| Income Bracket | # Households | Median Income |
| 15 to 24 Years | 3,960 (6.8%) | $27,159 |
| 25 to 44 Years | 21,176 (36.2%) | $48,803 |
| 45 to 64 Years | 19,833 (34.0%) | $51,165 |
| 65+ Years | 13,455 (23.0%) | $35,537 |
| Total | 58,424 (100.0%) | $43,584 |
Poverty in Syracuse
Income Below Poverty by Sex and Age in Syracuse
With 27.4% poverty level for males and 31.6% for females among the residents of Syracuse, 5 year old males and 12 to 14 year old females are the most vulnerable to poverty, with 381 males (48.5%) and 1,121 females (53.0%) in their respective age groups living below the poverty level.
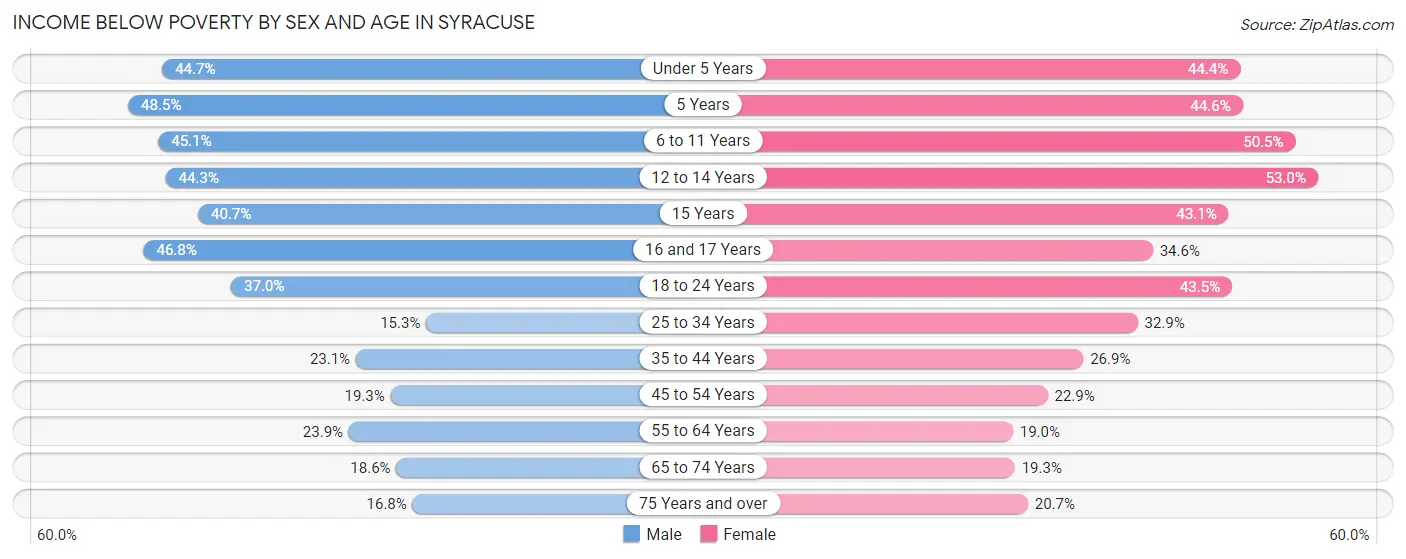
| Age Bracket | Male | Female |
| Under 5 Years | 1,929 (44.7%) | 1,960 (44.4%) |
| 5 Years | 381 (48.5%) | 403 (44.6%) |
| 6 to 11 Years | 2,261 (45.1%) | 2,474 (50.5%) |
| 12 to 14 Years | 1,259 (44.3%) | 1,121 (53.0%) |
| 15 Years | 327 (40.7%) | 401 (43.1%) |
| 16 and 17 Years | 713 (46.8%) | 473 (34.6%) |
| 18 to 24 Years | 2,325 (37.0%) | 3,124 (43.4%) |
| 25 to 34 Years | 1,716 (15.3%) | 3,979 (32.9%) |
| 35 to 44 Years | 1,742 (23.1%) | 2,220 (26.9%) |
| 45 to 54 Years | 1,408 (19.3%) | 1,702 (22.9%) |
| 55 to 64 Years | 1,974 (23.9%) | 1,461 (19.0%) |
| 65 to 74 Years | 982 (18.6%) | 1,173 (19.3%) |
| 75 Years and over | 408 (16.8%) | 882 (20.7%) |
| Total | 17,425 (27.4%) | 21,373 (31.6%) |
Income Above Poverty by Sex and Age in Syracuse
According to the poverty statistics in Syracuse, males aged 25 to 34 years and females aged 55 to 64 years are the age groups that are most secure financially, with 84.7% of males and 81.0% of females in these age groups living above the poverty line.
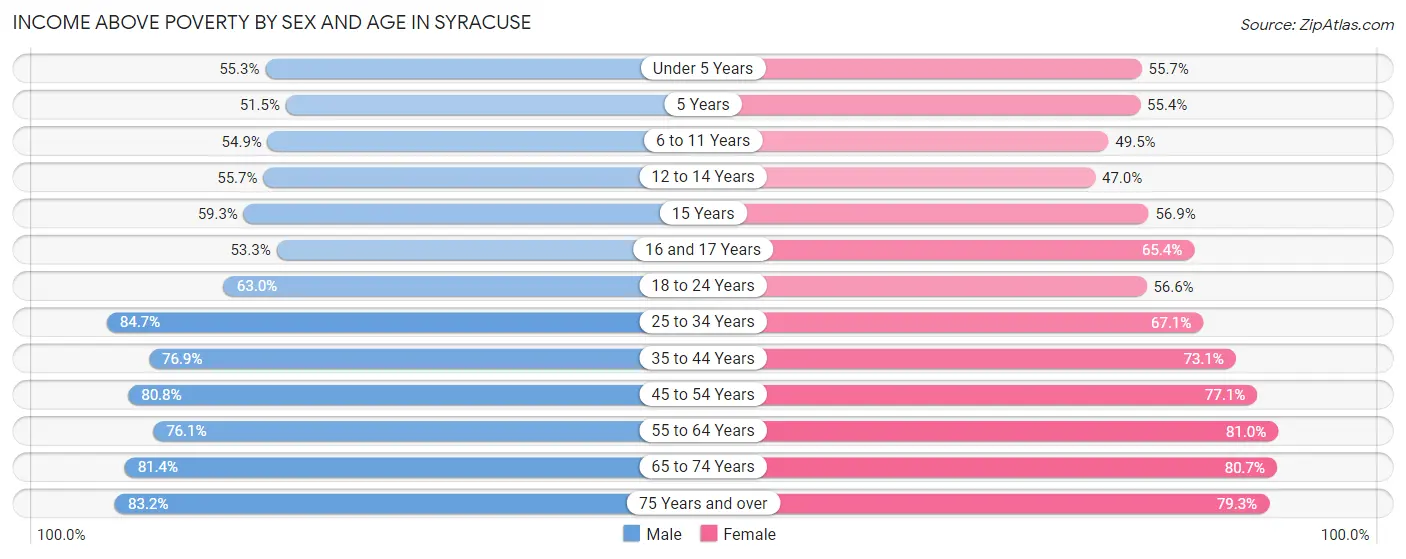
| Age Bracket | Male | Female |
| Under 5 Years | 2,389 (55.3%) | 2,459 (55.6%) |
| 5 Years | 405 (51.5%) | 500 (55.4%) |
| 6 to 11 Years | 2,751 (54.9%) | 2,424 (49.5%) |
| 12 to 14 Years | 1,583 (55.7%) | 994 (47.0%) |
| 15 Years | 477 (59.3%) | 530 (56.9%) |
| 16 and 17 Years | 812 (53.2%) | 893 (65.4%) |
| 18 to 24 Years | 3,959 (63.0%) | 4,066 (56.6%) |
| 25 to 34 Years | 9,525 (84.7%) | 8,101 (67.1%) |
| 35 to 44 Years | 5,800 (76.9%) | 6,036 (73.1%) |
| 45 to 54 Years | 5,905 (80.7%) | 5,726 (77.1%) |
| 55 to 64 Years | 6,292 (76.1%) | 6,211 (81.0%) |
| 65 to 74 Years | 4,301 (81.4%) | 4,917 (80.7%) |
| 75 Years and over | 2,022 (83.2%) | 3,375 (79.3%) |
| Total | 46,221 (72.6%) | 46,232 (68.4%) |
Income Below Poverty Among Married-Couple Families in Syracuse
The poverty statistics for married-couple families in Syracuse show that 8.8% or 1,197 of the total 13,522 families live below the poverty line. Families with 5 or more children have the highest poverty rate of 62.5%, comprising of 120 families. On the other hand, families with 1 or 2 children have the lowest poverty rate of 5.1%, which includes 202 families.
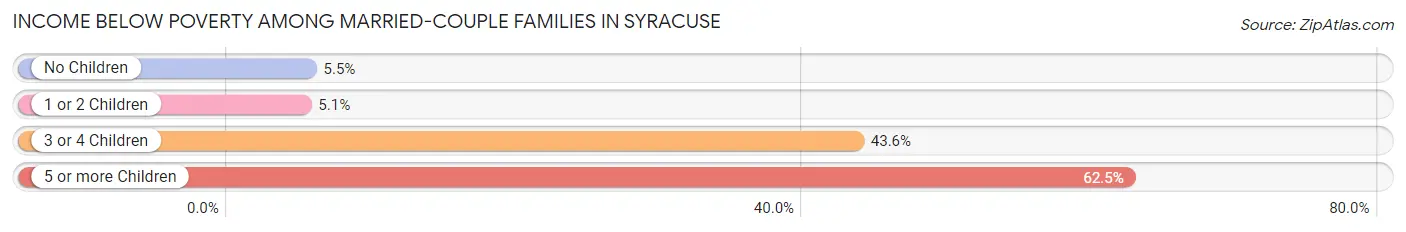
| Children | Above Poverty | Below Poverty |
| No Children | 7,964 (94.5%) | 461 (5.5%) |
| 1 or 2 Children | 3,753 (94.9%) | 202 (5.1%) |
| 3 or 4 Children | 536 (56.4%) | 414 (43.6%) |
| 5 or more Children | 72 (37.5%) | 120 (62.5%) |
| Total | 12,325 (91.1%) | 1,197 (8.8%) |
Income Below Poverty Among Single-Parent Households in Syracuse
According to the poverty data in Syracuse, 24.3% or 787 single-father households and 42.6% or 4,698 single-mother households are living below the poverty line. Among single-father households, those with 3 or 4 children have the highest poverty rate, with 109 households (44.3%) experiencing poverty. Likewise, among single-mother households, those with 5 or more children have the highest poverty rate, with 246 households (83.4%) falling below the poverty line.
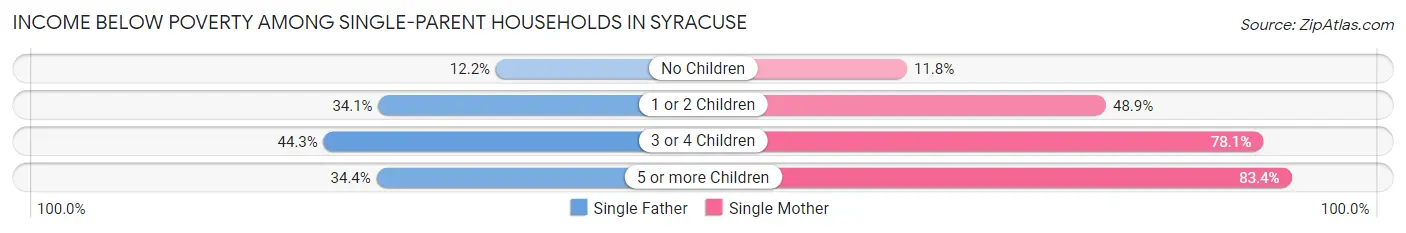
| Children | Single Father | Single Mother |
| No Children | 191 (12.2%) | 398 (11.8%) |
| 1 or 2 Children | 466 (34.1%) | 2,848 (48.9%) |
| 3 or 4 Children | 109 (44.3%) | 1,206 (78.1%) |
| 5 or more Children | 21 (34.4%) | 246 (83.4%) |
| Total | 787 (24.3%) | 4,698 (42.6%) |
Income Below Poverty Among Married-Couple vs Single-Parent Households in Syracuse
The poverty data for Syracuse shows that 1,197 of the married-couple family households (8.8%) and 5,485 of the single-parent households (38.4%) are living below the poverty level. Within the married-couple family households, those with 5 or more children have the highest poverty rate, with 120 households (62.5%) falling below the poverty line. Among the single-parent households, those with 5 or more children have the highest poverty rate, with 267 household (75.0%) living below poverty.
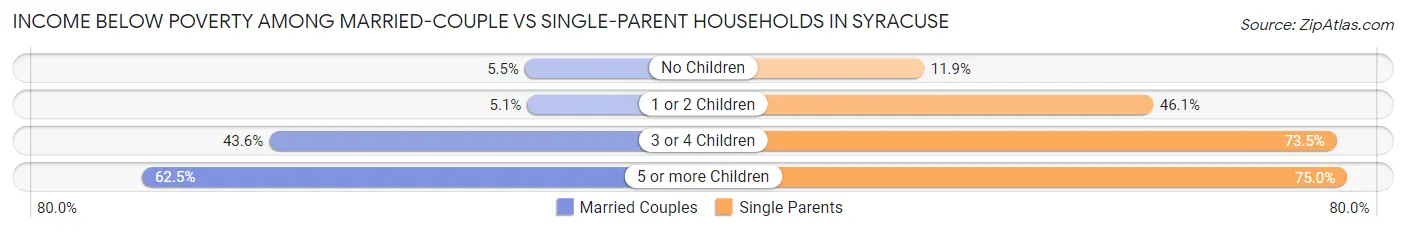
| Children | Married-Couple Families | Single-Parent Households |
| No Children | 461 (5.5%) | 589 (11.9%) |
| 1 or 2 Children | 202 (5.1%) | 3,314 (46.1%) |
| 3 or 4 Children | 414 (43.6%) | 1,315 (73.5%) |
| 5 or more Children | 120 (62.5%) | 267 (75.0%) |
| Total | 1,197 (8.8%) | 5,485 (38.4%) |
Race in Syracuse
The most populous races in Syracuse are White / Caucasian (75,859 | 51.9%), Black / African American (42,408 | 29.0%), and Hispanic or Latino (14,422 | 9.9%).
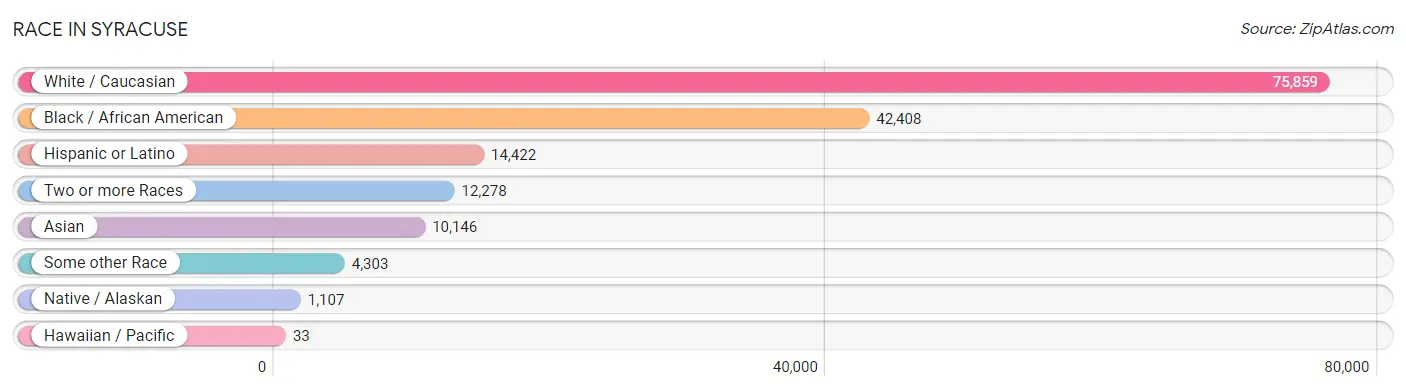
| Race | # Population | % Population |
| Asian | 10,146 | 6.9% |
| Black / African American | 42,408 | 29.0% |
| Hawaiian / Pacific | 33 | 0.0% |
| Hispanic or Latino | 14,422 | 9.9% |
| Native / Alaskan | 1,107 | 0.8% |
| White / Caucasian | 75,859 | 51.9% |
| Two or more Races | 12,278 | 8.4% |
| Some other Race | 4,303 | 2.9% |
| Total | 146,134 | 100.0% |
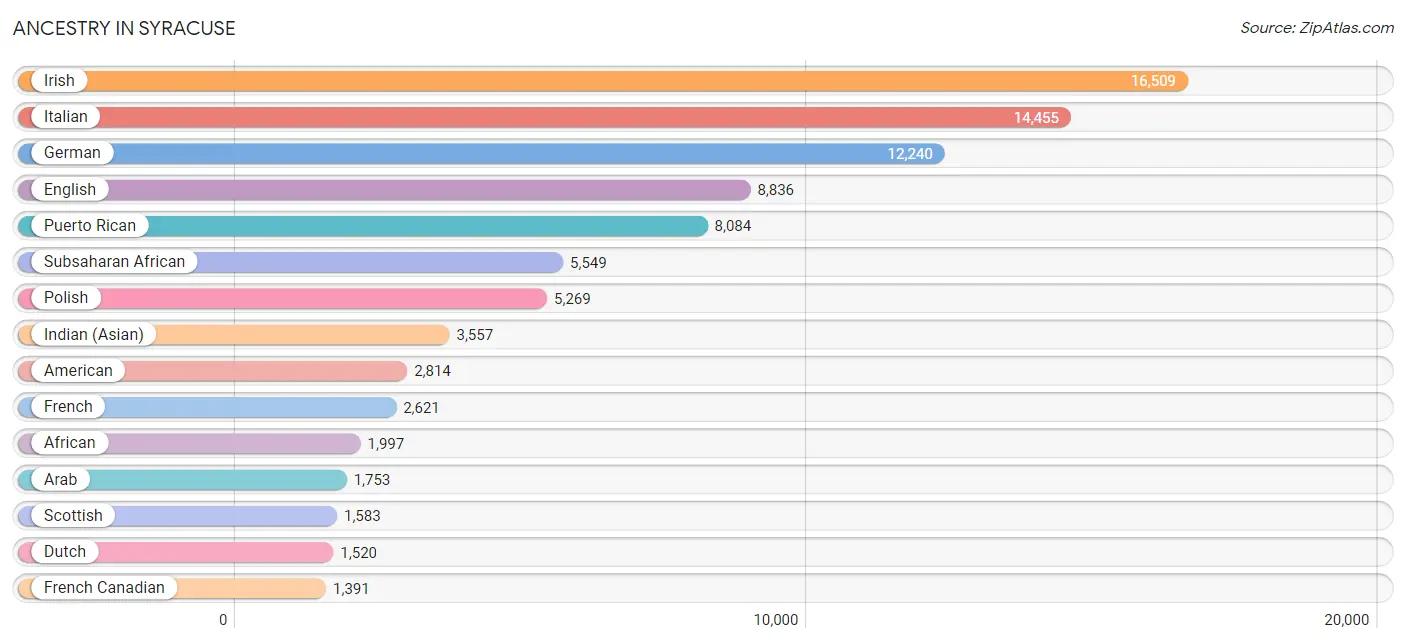
Ancestry in Syracuse
The most populous ancestries reported in Syracuse are Irish (16,509 | 11.3%), Italian (14,455 | 9.9%), German (12,240 | 8.4%), English (8,836 | 6.0%), and Puerto Rican (8,084 | 5.5%), together accounting for 41.2% of all Syracuse residents.
| Ancestry | # Population | % Population |
| Afghan | 147 | 0.1% |
| African | 1,997 | 1.4% |
| Albanian | 149 | 0.1% |
| Aleut | 10 | 0.0% |
| American | 2,814 | 1.9% |
| Arab | 1,753 | 1.2% |
| Argentinean | 69 | 0.1% |
| Armenian | 50 | 0.0% |
| Austrian | 219 | 0.2% |
| Bahamian | 15 | 0.0% |
| Bangladeshi | 39 | 0.0% |
| Barbadian | 61 | 0.0% |
| Basque | 7 | 0.0% |
| Belgian | 107 | 0.1% |
| Bhutanese | 171 | 0.1% |
| Blackfeet | 116 | 0.1% |
| Brazilian | 145 | 0.1% |
| British | 566 | 0.4% |
| British West Indian | 116 | 0.1% |
| Bulgarian | 9 | 0.0% |
| Burmese | 536 | 0.4% |
| Cambodian | 1 | 0.0% |
| Canadian | 268 | 0.2% |
| Celtic | 18 | 0.0% |
| Central American | 664 | 0.4% |
| Central American Indian | 230 | 0.2% |
| Cherokee | 302 | 0.2% |
| Chilean | 163 | 0.1% |
| Chippewa | 13 | 0.0% |
| Choctaw | 12 | 0.0% |
| Colombian | 579 | 0.4% |
| Costa Rican | 86 | 0.1% |
| Croatian | 85 | 0.1% |
| Cuban | 1,252 | 0.9% |
| Czech | 197 | 0.1% |
| Czechoslovakian | 62 | 0.0% |
| Danish | 131 | 0.1% |
| Dominican | 1,323 | 0.9% |
| Dutch | 1,520 | 1.0% |
| Eastern European | 190 | 0.1% |
| Ecuadorian | 127 | 0.1% |
| Egyptian | 131 | 0.1% |
| English | 8,836 | 6.0% |
| Estonian | 15 | 0.0% |
| Ethiopian | 395 | 0.3% |
| European | 1,182 | 0.8% |
| Filipino | 33 | 0.0% |
| Finnish | 142 | 0.1% |
| French | 2,621 | 1.8% |
| French American Indian | 7 | 0.0% |
| French Canadian | 1,391 | 0.9% |
| German | 12,240 | 8.4% |
| Ghanaian | 184 | 0.1% |
| Greek | 588 | 0.4% |
| Guamanian / Chamorro | 5 | 0.0% |
| Guatemalan | 73 | 0.1% |
| Guyanese | 219 | 0.2% |
| Haitian | 371 | 0.3% |
| Honduran | 37 | 0.0% |
| Hungarian | 300 | 0.2% |
| Indian (Asian) | 3,557 | 2.4% |
| Indonesian | 1,318 | 0.9% |
| Inupiat | 10 | 0.0% |
| Iranian | 127 | 0.1% |
| Iraqi | 327 | 0.2% |
| Irish | 16,509 | 11.3% |
| Iroquois | 698 | 0.5% |
| Israeli | 44 | 0.0% |
| Italian | 14,455 | 9.9% |
| Jamaican | 1,318 | 0.9% |
| Japanese | 342 | 0.2% |
| Jordanian | 15 | 0.0% |
| Kenyan | 380 | 0.3% |
| Korean | 298 | 0.2% |
| Laotian | 36 | 0.0% |
| Latvian | 12 | 0.0% |
| Lebanese | 63 | 0.0% |
| Liberian | 142 | 0.1% |
| Lithuanian | 154 | 0.1% |
| Luxembourger | 16 | 0.0% |
| Macedonian | 36 | 0.0% |
| Malaysian | 113 | 0.1% |
| Maltese | 20 | 0.0% |
| Mexican | 826 | 0.6% |
| Native Hawaiian | 51 | 0.0% |
| Navajo | 69 | 0.1% |
| Nicaraguan | 47 | 0.0% |
| Nigerian | 398 | 0.3% |
| Northern European | 194 | 0.1% |
| Norwegian | 458 | 0.3% |
| Okinawan | 47 | 0.0% |
| Pakistani | 372 | 0.3% |
| Palestinian | 138 | 0.1% |
| Panamanian | 260 | 0.2% |
| Pennsylvania German | 27 | 0.0% |
| Peruvian | 143 | 0.1% |
| Polish | 5,269 | 3.6% |
| Portuguese | 192 | 0.1% |
| Potawatomi | 54 | 0.0% |
| Puerto Rican | 8,084 | 5.5% |
| Romanian | 164 | 0.1% |
| Russian | 727 | 0.5% |
| Salvadoran | 137 | 0.1% |
| Samoan | 16 | 0.0% |
| Scandinavian | 247 | 0.2% |
| Scotch-Irish | 776 | 0.5% |
| Scottish | 1,583 | 1.1% |
| Seminole | 25 | 0.0% |
| Serbian | 26 | 0.0% |
| Sioux | 18 | 0.0% |
| Slavic | 106 | 0.1% |
| Slovak | 268 | 0.2% |
| Slovene | 137 | 0.1% |
| Somali | 1,081 | 0.7% |
| South African | 35 | 0.0% |
| South American | 1,166 | 0.8% |
| South American Indian | 10 | 0.0% |
| Spaniard | 277 | 0.2% |
| Spanish | 80 | 0.1% |
| Sri Lankan | 1,336 | 0.9% |
| Subsaharan African | 5,549 | 3.8% |
| Sudanese | 176 | 0.1% |
| Swedish | 737 | 0.5% |
| Swiss | 274 | 0.2% |
| Syrian | 172 | 0.1% |
| Thai | 1,046 | 0.7% |
| Trinidadian and Tobagonian | 93 | 0.1% |
| Turkish | 113 | 0.1% |
| U.S. Virgin Islander | 9 | 0.0% |
| Ukrainian | 1,040 | 0.7% |
| Uruguayan | 26 | 0.0% |
| Venezuelan | 59 | 0.0% |
| Vietnamese | 51 | 0.0% |
| Welsh | 535 | 0.4% |
| West Indian | 319 | 0.2% |
| Yaqui | 3 | 0.0% |
| Yugoslavian | 215 | 0.2% |
| Zimbabwean | 31 | 0.0% | View All 138 Rows |
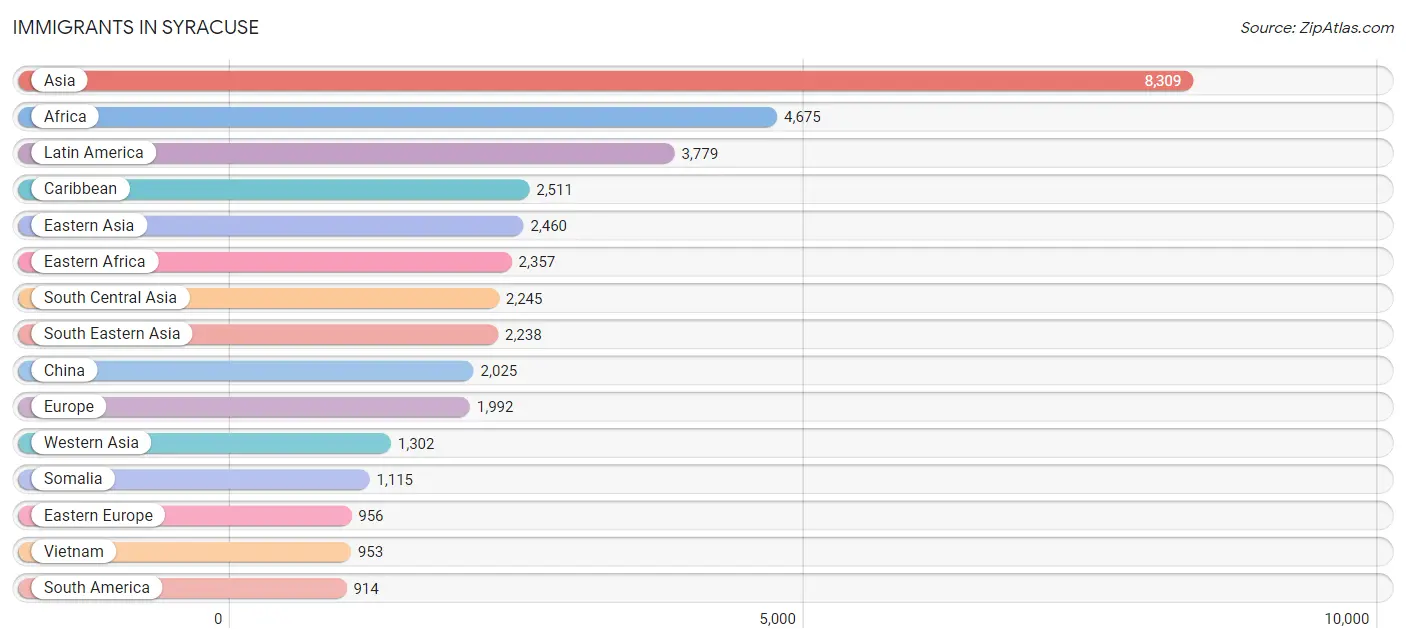
Immigrants in Syracuse
The most numerous immigrant groups reported in Syracuse came from Asia (8,309 | 5.7%), Africa (4,675 | 3.2%), Latin America (3,779 | 2.6%), Caribbean (2,511 | 1.7%), and Eastern Asia (2,460 | 1.7%), together accounting for 14.9% of all Syracuse residents.
| Immigration Origin | # Population | % Population |
| Afghanistan | 210 | 0.1% |
| Africa | 4,675 | 3.2% |
| Albania | 14 | 0.0% |
| Argentina | 60 | 0.0% |
| Armenia | 8 | 0.0% |
| Asia | 8,309 | 5.7% |
| Austria | 4 | 0.0% |
| Bahamas | 47 | 0.0% |
| Bangladesh | 58 | 0.0% |
| Barbados | 53 | 0.0% |
| Belarus | 57 | 0.0% |
| Bosnia and Herzegovina | 185 | 0.1% |
| Brazil | 122 | 0.1% |
| Bulgaria | 9 | 0.0% |
| Cambodia | 15 | 0.0% |
| Cameroon | 20 | 0.0% |
| Canada | 246 | 0.2% |
| Caribbean | 2,511 | 1.7% |
| Central America | 354 | 0.2% |
| Chile | 41 | 0.0% |
| China | 2,025 | 1.4% |
| Colombia | 321 | 0.2% |
| Congo | 305 | 0.2% |
| Cuba | 751 | 0.5% |
| Czechoslovakia | 24 | 0.0% |
| Dominica | 20 | 0.0% |
| Dominican Republic | 361 | 0.3% |
| Eastern Africa | 2,357 | 1.6% |
| Eastern Asia | 2,460 | 1.7% |
| Eastern Europe | 956 | 0.6% |
| Ecuador | 40 | 0.0% |
| Egypt | 51 | 0.0% |
| El Salvador | 20 | 0.0% |
| England | 105 | 0.1% |
| Eritrea | 146 | 0.1% |
| Ethiopia | 173 | 0.1% |
| Europe | 1,992 | 1.4% |
| France | 103 | 0.1% |
| Germany | 164 | 0.1% |
| Ghana | 277 | 0.2% |
| Greece | 147 | 0.1% |
| Grenada | 78 | 0.1% |
| Guatemala | 17 | 0.0% |
| Guyana | 234 | 0.2% |
| Haiti | 166 | 0.1% |
| Honduras | 57 | 0.0% |
| Hong Kong | 4 | 0.0% |
| Hungary | 44 | 0.0% |
| India | 692 | 0.5% |
| Indonesia | 16 | 0.0% |
| Iran | 179 | 0.1% |
| Iraq | 583 | 0.4% |
| Ireland | 7 | 0.0% |
| Israel | 51 | 0.0% |
| Italy | 242 | 0.2% |
| Jamaica | 806 | 0.5% |
| Japan | 28 | 0.0% |
| Jordan | 66 | 0.1% |
| Kazakhstan | 22 | 0.0% |
| Kenya | 624 | 0.4% |
| Korea | 407 | 0.3% |
| Kuwait | 9 | 0.0% |
| Laos | 12 | 0.0% |
| Latin America | 3,779 | 2.6% |
| Liberia | 82 | 0.1% |
| Malaysia | 19 | 0.0% |
| Mexico | 194 | 0.1% |
| Micronesia | 1 | 0.0% |
| Middle Africa | 721 | 0.5% |
| Moldova | 9 | 0.0% |
| Morocco | 58 | 0.0% |
| Nepal | 201 | 0.1% |
| Netherlands | 12 | 0.0% |
| Nicaragua | 12 | 0.0% |
| Nigeria | 89 | 0.1% |
| Northern Africa | 350 | 0.2% |
| Northern Europe | 256 | 0.2% |
| Oceania | 1 | 0.0% |
| Pakistan | 109 | 0.1% |
| Panama | 54 | 0.0% |
| Peru | 36 | 0.0% |
| Philippines | 162 | 0.1% |
| Poland | 284 | 0.2% |
| Portugal | 9 | 0.0% |
| Russia | 80 | 0.1% |
| Scotland | 5 | 0.0% |
| Singapore | 35 | 0.0% |
| Somalia | 1,115 | 0.8% |
| South Africa | 35 | 0.0% |
| South America | 914 | 0.6% |
| South Central Asia | 2,245 | 1.5% |
| South Eastern Asia | 2,238 | 1.5% |
| Southern Europe | 462 | 0.3% |
| Spain | 64 | 0.0% |
| Sri Lanka | 36 | 0.0% |
| Sudan | 230 | 0.2% |
| Switzerland | 35 | 0.0% |
| Syria | 346 | 0.2% |
| Taiwan | 53 | 0.0% |
| Thailand | 312 | 0.2% |
| Trinidad and Tobago | 124 | 0.1% |
| Turkey | 120 | 0.1% |
| Ukraine | 244 | 0.2% |
| Uruguay | 26 | 0.0% |
| Uzbekistan | 137 | 0.1% |
| Venezuela | 34 | 0.0% |
| Vietnam | 953 | 0.6% |
| Western Africa | 582 | 0.4% |
| Western Asia | 1,302 | 0.9% |
| Western Europe | 318 | 0.2% |
| Yemen | 62 | 0.0% |
| Zaire | 303 | 0.2% |
| Zimbabwe | 71 | 0.1% | View All 113 Rows |
Sex and Age in Syracuse
Sex and Age in Syracuse
The most populous age groups in Syracuse are 15 to 19 Years (7,399 | 10.5%) for men and 15 to 19 Years (8,377 | 11.1%) for women.
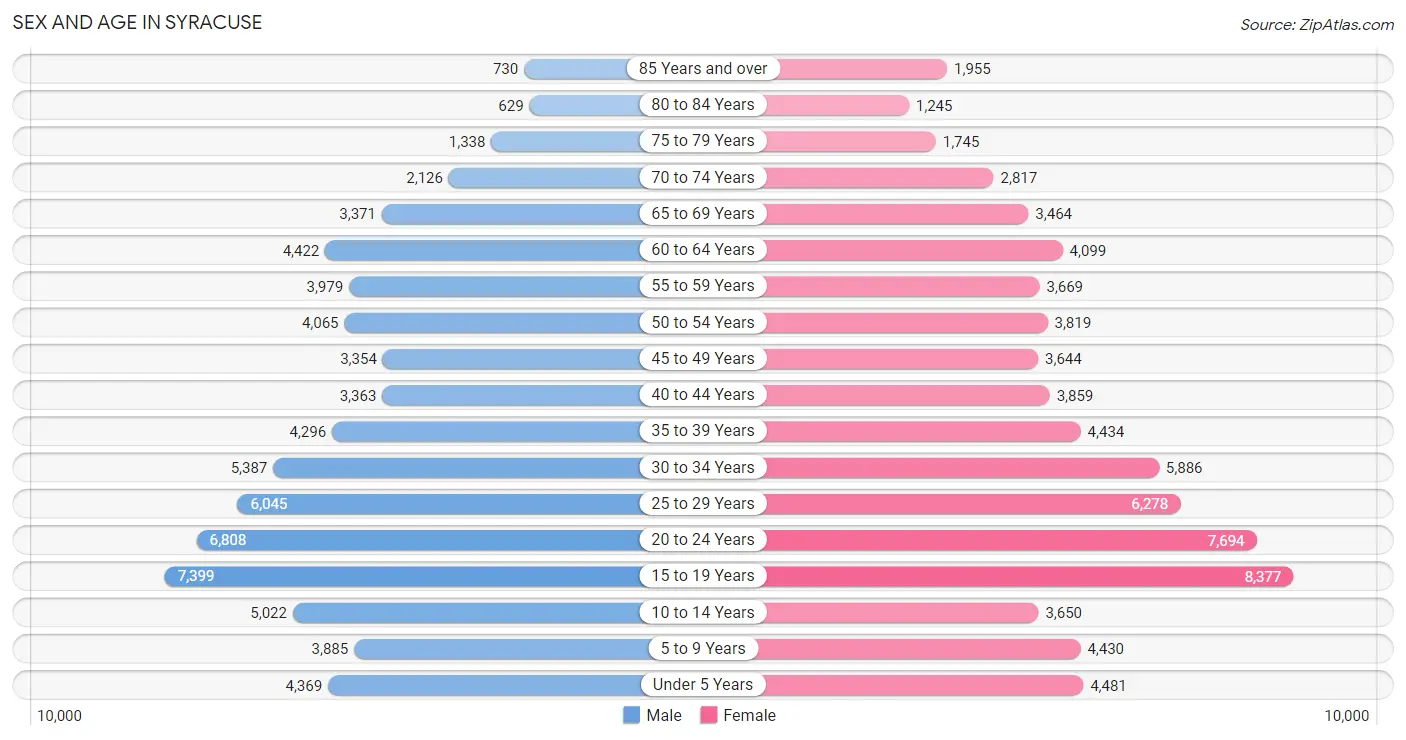
| Age Bracket | Male | Female |
| Under 5 Years | 4,369 (6.2%) | 4,481 (5.9%) |
| 5 to 9 Years | 3,885 (5.5%) | 4,430 (5.9%) |
| 10 to 14 Years | 5,022 (7.1%) | 3,650 (4.8%) |
| 15 to 19 Years | 7,399 (10.5%) | 8,377 (11.1%) |
| 20 to 24 Years | 6,808 (9.6%) | 7,694 (10.2%) |
| 25 to 29 Years | 6,045 (8.6%) | 6,278 (8.3%) |
| 30 to 34 Years | 5,387 (7.6%) | 5,886 (7.8%) |
| 35 to 39 Years | 4,296 (6.1%) | 4,434 (5.9%) |
| 40 to 44 Years | 3,363 (4.8%) | 3,859 (5.1%) |
| 45 to 49 Years | 3,354 (4.8%) | 3,644 (4.8%) |
| 50 to 54 Years | 4,065 (5.8%) | 3,819 (5.1%) |
| 55 to 59 Years | 3,979 (5.6%) | 3,669 (4.9%) |
| 60 to 64 Years | 4,422 (6.3%) | 4,099 (5.4%) |
| 65 to 69 Years | 3,371 (4.8%) | 3,464 (4.6%) |
| 70 to 74 Years | 2,126 (3.0%) | 2,817 (3.7%) |
| 75 to 79 Years | 1,338 (1.9%) | 1,745 (2.3%) |
| 80 to 84 Years | 629 (0.9%) | 1,245 (1.7%) |
| 85 Years and over | 730 (1.0%) | 1,955 (2.6%) |
| Total | 70,588 (100.0%) | 75,546 (100.0%) |
Families and Households in Syracuse
Median Family Size in Syracuse
The median family size in Syracuse is 3.10 persons per family, with married-couple families (13,522 | 48.6%) accounting for the largest median family size of 3.14 persons per family. On the other hand, single male/father families (3,238 | 11.7%) represent the smallest median family size with 2.85 persons per family.
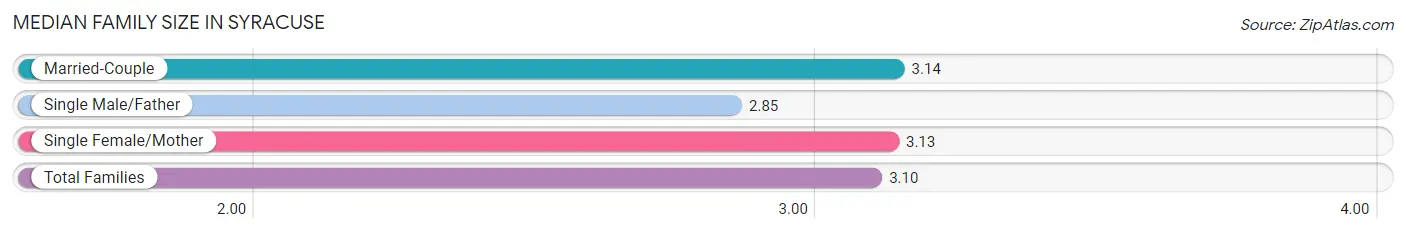
| Family Type | # Families | Family Size |
| Married-Couple | 13,522 (48.6%) | 3.14 |
| Single Male/Father | 3,238 (11.7%) | 2.85 |
| Single Female/Mother | 11,038 (39.7%) | 3.13 |
| Total Families | 27,798 (100.0%) | 3.10 |
Median Household Size in Syracuse
The median household size in Syracuse is 2.23 persons per household, with single female/mother households (11,038 | 18.9%) accounting for the largest median household size of 3.34 persons per household. non-family households (30,626 | 52.4%) represent the smallest median household size with 1.29 persons per household.
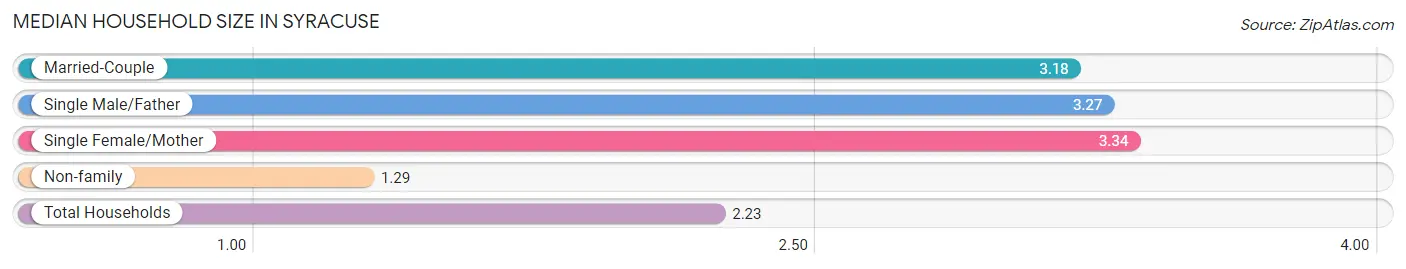
| Household Type | # Households | Household Size |
| Married-Couple | 13,522 (23.1%) | 3.18 |
| Single Male/Father | 3,238 (5.5%) | 3.27 |
| Single Female/Mother | 11,038 (18.9%) | 3.34 |
| Non-family | 30,626 (52.4%) | 1.29 |
| Total Households | 58,424 (100.0%) | 2.23 |
Household Size by Marriage Status in Syracuse
Out of a total of 58,424 households in Syracuse, 27,798 (47.6%) are family households, while 30,626 (52.4%) are nonfamily households. The most numerous type of family households are 2-person households, comprising 12,088, and the most common type of nonfamily households are 1-person households, comprising 23,989.
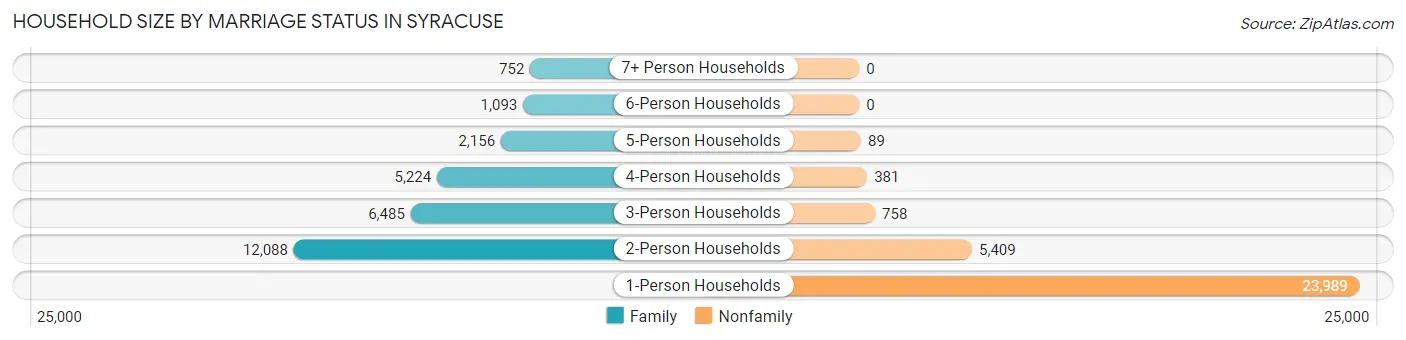
| Household Size | Family Households | Nonfamily Households |
| 1-Person Households | - | 23,989 (41.1%) |
| 2-Person Households | 12,088 (20.7%) | 5,409 (9.3%) |
| 3-Person Households | 6,485 (11.1%) | 758 (1.3%) |
| 4-Person Households | 5,224 (8.9%) | 381 (0.6%) |
| 5-Person Households | 2,156 (3.7%) | 89 (0.2%) |
| 6-Person Households | 1,093 (1.9%) | 0 (0.0%) |
| 7+ Person Households | 752 (1.3%) | 0 (0.0%) |
| Total | 27,798 (47.6%) | 30,626 (52.4%) |
Female Fertility in Syracuse
Fertility by Age in Syracuse
Average fertility rate in Syracuse is 47.0 births per 1,000 women. Women in the age bracket of 20 to 34 years have the highest fertility rate with 67.0 births per 1,000 women. Women in the age bracket of 20 to 34 years acount for 70.0% of all women with births.
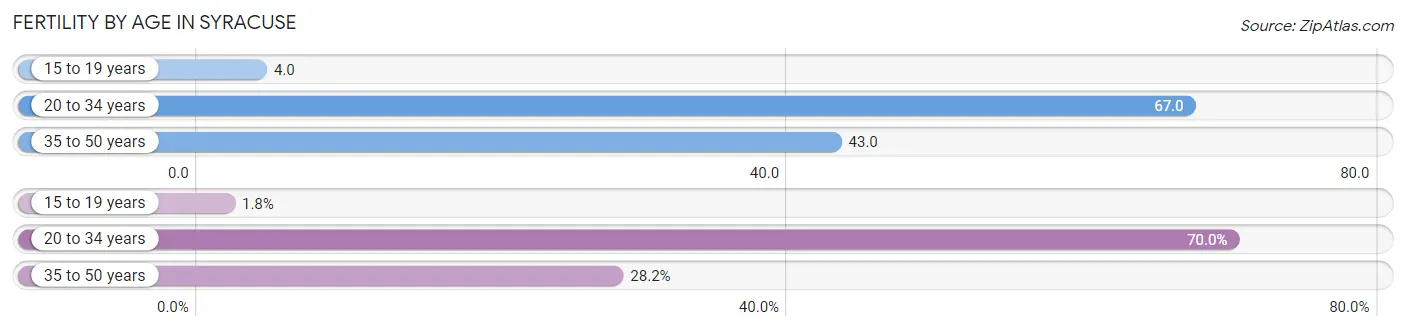
| Age Bracket | Women with Births | Births / 1,000 Women |
| 15 to 19 years | 35 (1.8%) | 4.0 |
| 20 to 34 years | 1,338 (70.0%) | 67.0 |
| 35 to 50 years | 539 (28.2%) | 43.0 |
| Total | 1,912 (100.0%) | 47.0 |
Fertility by Age by Marriage Status in Syracuse
47.3% of women with births (1,912) in Syracuse are married. The highest percentage of unmarried women with births falls into 15 to 19 years age bracket with 100.0% of them unmarried at the time of birth, while the lowest percentage of unmarried women with births belong to 35 to 50 years age bracket with 41.2% of them unmarried.
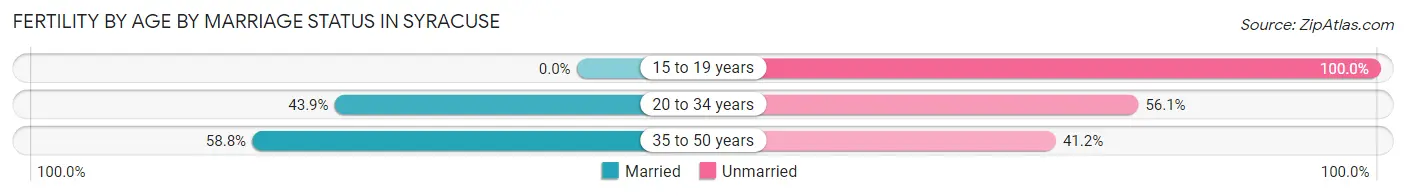
| Age Bracket | Married | Unmarried |
| 15 to 19 years | 0 (0.0%) | 35 (100.0%) |
| 20 to 34 years | 587 (43.9%) | 751 (56.1%) |
| 35 to 50 years | 317 (58.8%) | 222 (41.2%) |
| Total | 904 (47.3%) | 1,008 (52.7%) |
Fertility by Education in Syracuse
Average fertility rate in Syracuse is 47.0 births per 1,000 women. Women with the education attainment of high school diploma have the highest fertility rate of 71.0 births per 1,000 women, while women with the education attainment of college or associate's degree have the lowest fertility at 24.0 births per 1,000 women. Women with the education attainment of high school diploma represent 34.4% of all women with births.
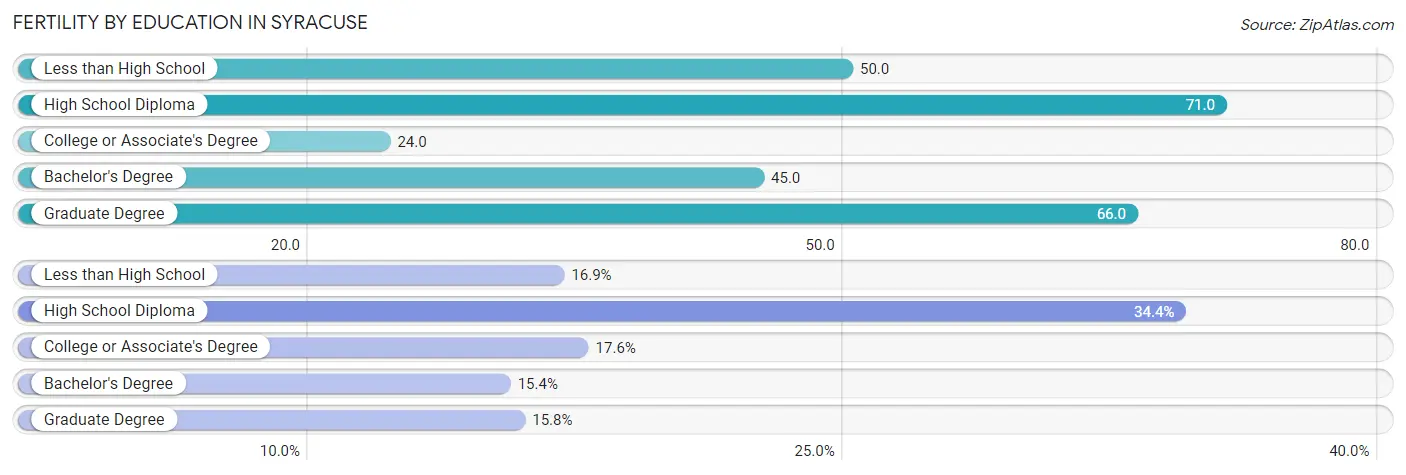
| Educational Attainment | Women with Births | Births / 1,000 Women |
| Less than High School | 323 (16.9%) | 50.0 |
| High School Diploma | 657 (34.4%) | 71.0 |
| College or Associate's Degree | 336 (17.6%) | 24.0 |
| Bachelor's Degree | 294 (15.4%) | 45.0 |
| Graduate Degree | 302 (15.8%) | 66.0 |
| Total | 1,912 (100.0%) | 47.0 |
Fertility by Education by Marriage Status in Syracuse
52.7% of women with births in Syracuse are unmarried. Women with the educational attainment of bachelor's degree are most likely to be married with 85.0% of them married at childbirth, while women with the educational attainment of high school diploma are least likely to be married with 74.9% of them unmarried at childbirth.
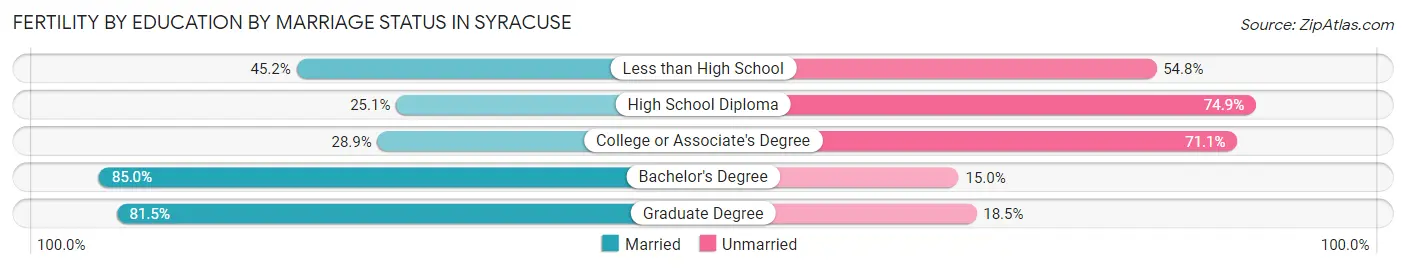
| Educational Attainment | Married | Unmarried |
| Less than High School | 146 (45.2%) | 177 (54.8%) |
| High School Diploma | 165 (25.1%) | 492 (74.9%) |
| College or Associate's Degree | 97 (28.9%) | 239 (71.1%) |
| Bachelor's Degree | 250 (85.0%) | 44 (15.0%) |
| Graduate Degree | 246 (81.5%) | 56 (18.5%) |
| Total | 904 (47.3%) | 1,008 (52.7%) |
Employment Characteristics in Syracuse
Employment by Class of Employer in Syracuse
Among the 60,249 employed individuals in Syracuse, private company employees (37,236 | 61.8%), not-for-profit organizations (9,783 | 16.2%), and local government employees (4,491 | 7.4%) make up the most common classes of employment.
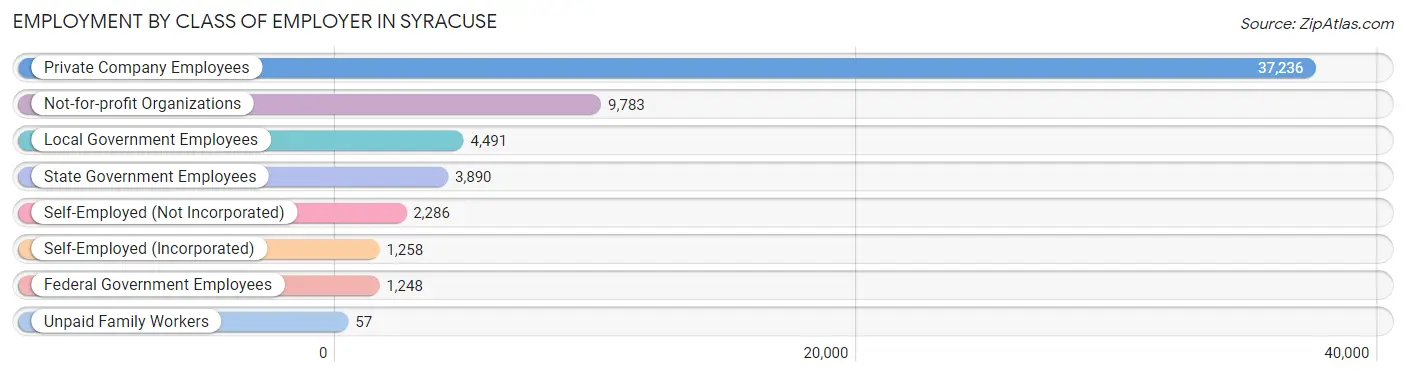
| Employer Class | # Employees | % Employees |
| Private Company Employees | 37,236 | 61.8% |
| Self-Employed (Incorporated) | 1,258 | 2.1% |
| Self-Employed (Not Incorporated) | 2,286 | 3.8% |
| Not-for-profit Organizations | 9,783 | 16.2% |
| Local Government Employees | 4,491 | 7.4% |
| State Government Employees | 3,890 | 6.5% |
| Federal Government Employees | 1,248 | 2.1% |
| Unpaid Family Workers | 57 | 0.1% |
| Total | 60,249 | 100.0% |
Employment Status by Age in Syracuse
According to the labor force statistics for Syracuse, out of the total population over 16 years of age (118,558), 57.0% or 67,578 individuals are in the labor force, with 8.6% or 5,812 of them unemployed. The age group with the highest labor force participation rate is 30 to 34 years, with 81.5% or 9,187 individuals in the labor force. Within the labor force, the 16 to 19 years age range has the highest percentage of unemployed individuals, with 21.5% or 809 of them being unemployed.
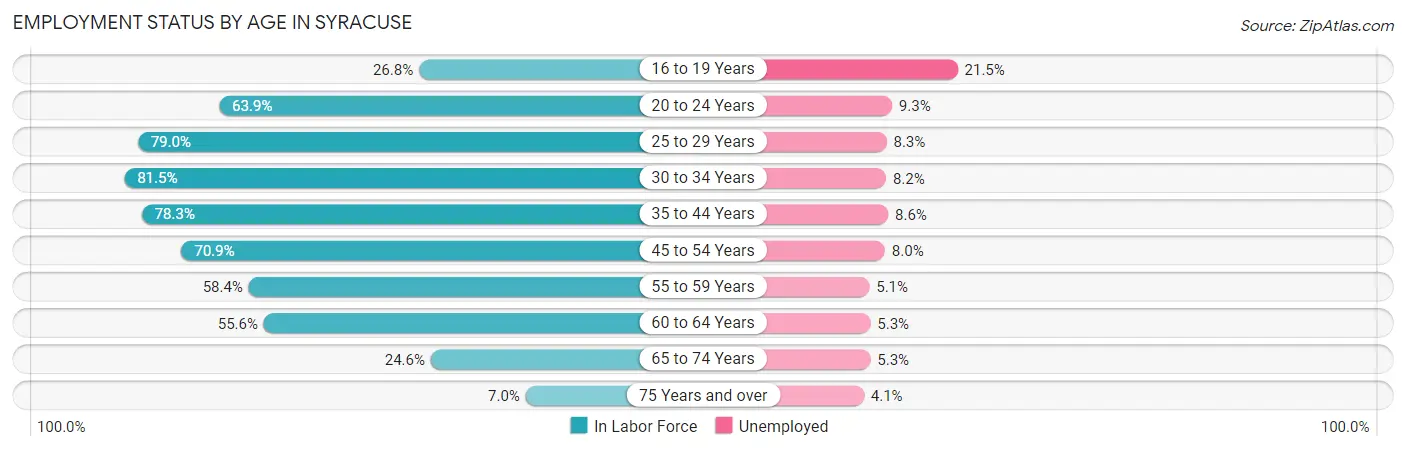
| Age Bracket | In Labor Force | Unemployed |
| 16 to 19 Years | 3,762 (26.8%) | 809 (21.5%) |
| 20 to 24 Years | 9,267 (63.9%) | 862 (9.3%) |
| 25 to 29 Years | 9,735 (79.0%) | 808 (8.3%) |
| 30 to 34 Years | 9,187 (81.5%) | 753 (8.2%) |
| 35 to 44 Years | 12,490 (78.3%) | 1,074 (8.6%) |
| 45 to 54 Years | 10,551 (70.9%) | 844 (8.0%) |
| 55 to 59 Years | 4,466 (58.4%) | 228 (5.1%) |
| 60 to 64 Years | 4,738 (55.6%) | 251 (5.3%) |
| 65 to 74 Years | 2,897 (24.6%) | 154 (5.3%) |
| 75 Years and over | 535 (7.0%) | 22 (4.1%) |
| Total | 67,578 (57.0%) | 5,812 (8.6%) |
Employment Status by Educational Attainment in Syracuse
According to labor force statistics for Syracuse, 72.5% of individuals (51,184) out of the total population between 25 and 64 years of age (70,599) are in the labor force, with 7.8% or 3,992 of them being unemployed. The group with the highest labor force participation rate are those with the educational attainment of bachelor's degree or higher, with 86.2% or 18,468 individuals in the labor force. Within the labor force, individuals with less than high school education have the highest percentage of unemployment, with 16.4% or 891 of them being unemployed.
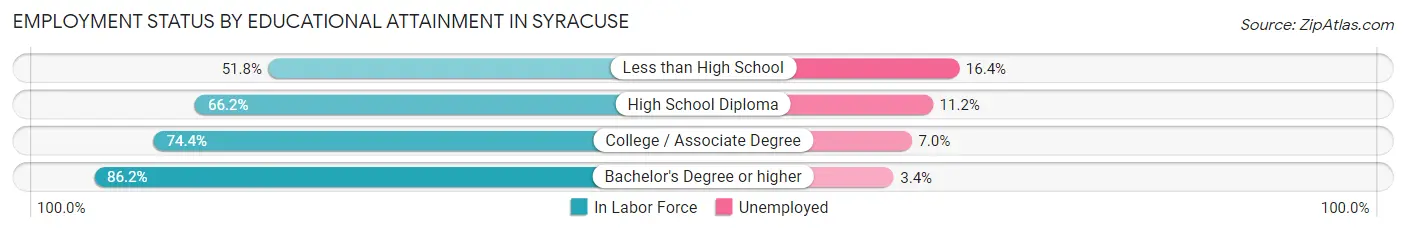
| Educational Attainment | In Labor Force | Unemployed |
| Less than High School | 5,432 (51.8%) | 1,720 (16.4%) |
| High School Diploma | 12,382 (66.2%) | 2,095 (11.2%) |
| College / Associate Degree | 14,867 (74.4%) | 1,399 (7.0%) |
| Bachelor's Degree or higher | 18,468 (86.2%) | 728 (3.4%) |
| Total | 51,184 (72.5%) | 5,507 (7.8%) |
Employment Occupations by Sex in Syracuse
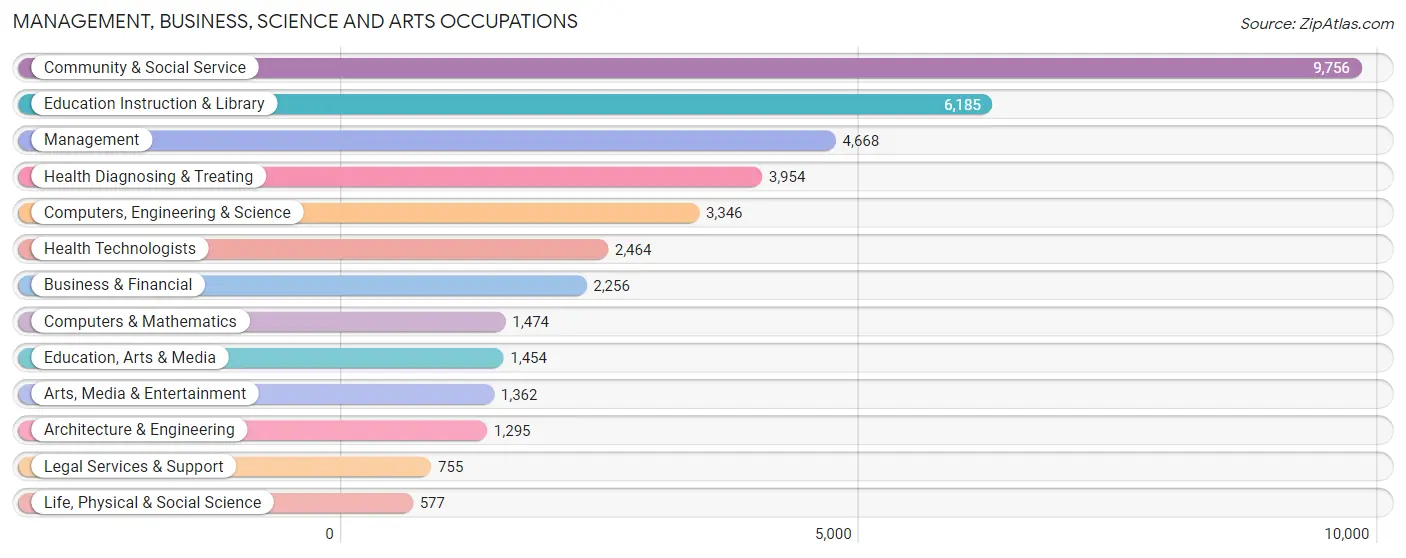
Management, Business, Science and Arts Occupations
The most common Management, Business, Science and Arts occupations in Syracuse are Community & Social Service (9,756 | 15.8%), Education Instruction & Library (6,185 | 10.0%), Management (4,668 | 7.6%), Health Diagnosing & Treating (3,954 | 6.4%), and Computers, Engineering & Science (3,346 | 5.4%).
Management, Business, Science and Arts Occupations by Sex
Within the Management, Business, Science and Arts occupations in Syracuse, the most male-oriented occupations are Architecture & Engineering (90.0%), Computers & Mathematics (79.7%), and Computers, Engineering & Science (79.0%), while the most female-oriented occupations are Education, Arts & Media (78.1%), Health Technologists (75.6%), and Health Diagnosing & Treating (74.9%).
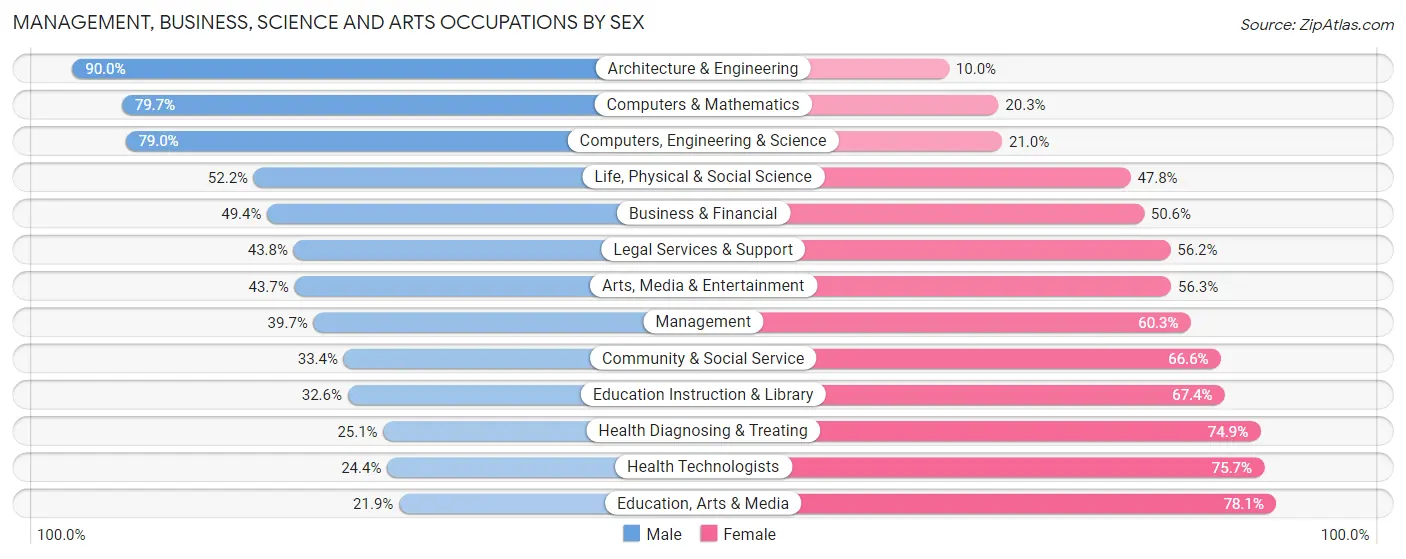
| Occupation | Male | Female |
| Management | 1,853 (39.7%) | 2,815 (60.3%) |
| Business & Financial | 1,114 (49.4%) | 1,142 (50.6%) |
| Computers, Engineering & Science | 2,642 (79.0%) | 704 (21.0%) |
| Computers & Mathematics | 1,175 (79.7%) | 299 (20.3%) |
| Architecture & Engineering | 1,166 (90.0%) | 129 (10.0%) |
| Life, Physical & Social Science | 301 (52.2%) | 276 (47.8%) |
| Community & Social Service | 3,259 (33.4%) | 6,497 (66.6%) |
| Education, Arts & Media | 318 (21.9%) | 1,136 (78.1%) |
| Legal Services & Support | 331 (43.8%) | 424 (56.2%) |
| Education Instruction & Library | 2,015 (32.6%) | 4,170 (67.4%) |
| Arts, Media & Entertainment | 595 (43.7%) | 767 (56.3%) |
| Health Diagnosing & Treating | 994 (25.1%) | 2,960 (74.9%) |
| Health Technologists | 600 (24.3%) | 1,864 (75.6%) |
| Total (Category) | 9,862 (41.1%) | 14,118 (58.9%) |
| Total (Overall) | 29,692 (48.1%) | 31,987 (51.9%) |
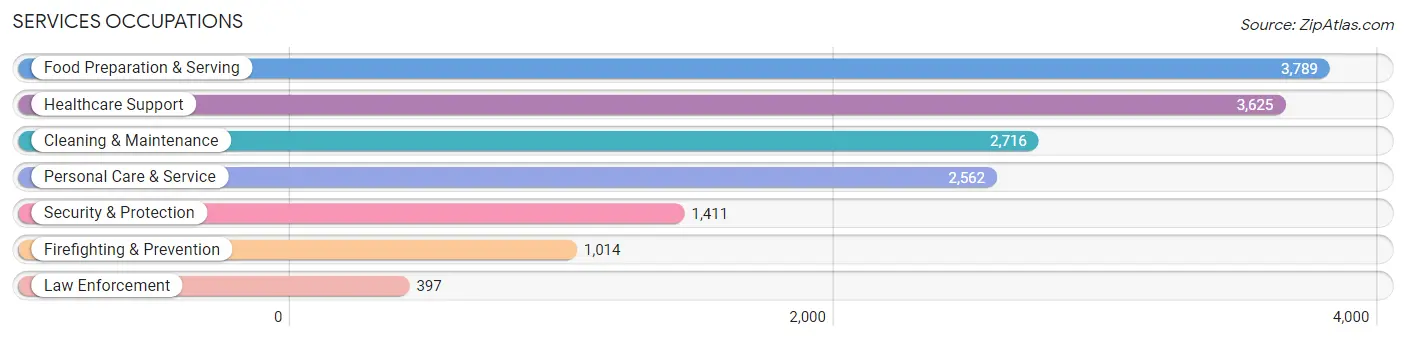
Services Occupations
The most common Services occupations in Syracuse are Food Preparation & Serving (3,789 | 6.1%), Healthcare Support (3,625 | 5.9%), Cleaning & Maintenance (2,716 | 4.4%), Personal Care & Service (2,562 | 4.2%), and Security & Protection (1,411 | 2.3%).
Services Occupations by Sex
Within the Services occupations in Syracuse, the most male-oriented occupations are Firefighting & Prevention (72.2%), Security & Protection (69.5%), and Cleaning & Maintenance (65.1%), while the most female-oriented occupations are Healthcare Support (87.0%), Personal Care & Service (63.6%), and Food Preparation & Serving (49.7%).
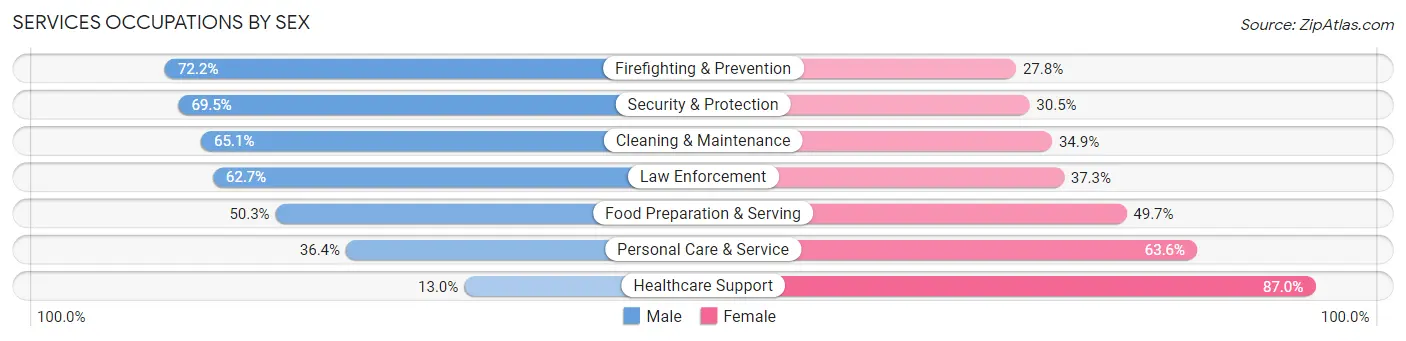
| Occupation | Male | Female |
| Healthcare Support | 470 (13.0%) | 3,155 (87.0%) |
| Security & Protection | 981 (69.5%) | 430 (30.5%) |
| Firefighting & Prevention | 732 (72.2%) | 282 (27.8%) |
| Law Enforcement | 249 (62.7%) | 148 (37.3%) |
| Food Preparation & Serving | 1,907 (50.3%) | 1,882 (49.7%) |
| Cleaning & Maintenance | 1,767 (65.1%) | 949 (34.9%) |
| Personal Care & Service | 932 (36.4%) | 1,630 (63.6%) |
| Total (Category) | 6,057 (42.9%) | 8,046 (57.1%) |
| Total (Overall) | 29,692 (48.1%) | 31,987 (51.9%) |
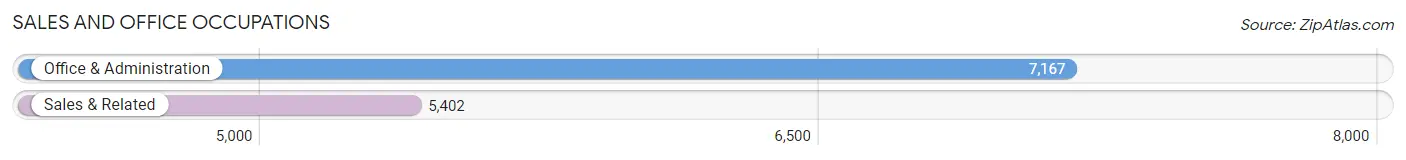
Sales and Office Occupations
The most common Sales and Office occupations in Syracuse are Office & Administration (7,167 | 11.6%), and Sales & Related (5,402 | 8.8%).
Sales and Office Occupations by Sex
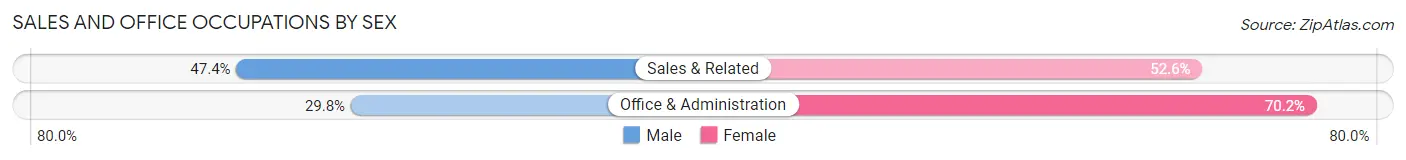
| Occupation | Male | Female |
| Sales & Related | 2,561 (47.4%) | 2,841 (52.6%) |
| Office & Administration | 2,135 (29.8%) | 5,032 (70.2%) |
| Total (Category) | 4,696 (37.4%) | 7,873 (62.6%) |
| Total (Overall) | 29,692 (48.1%) | 31,987 (51.9%) |
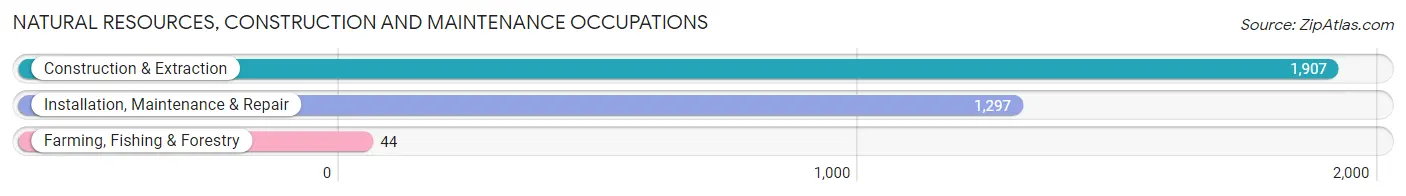
Natural Resources, Construction and Maintenance Occupations
The most common Natural Resources, Construction and Maintenance occupations in Syracuse are Construction & Extraction (1,907 | 3.1%), Installation, Maintenance & Repair (1,297 | 2.1%), and Farming, Fishing & Forestry (44 | 0.1%).
Natural Resources, Construction and Maintenance Occupations by Sex
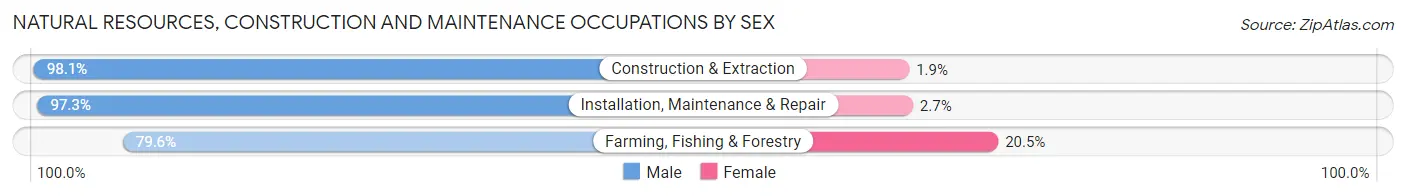
| Occupation | Male | Female |
| Farming, Fishing & Forestry | 35 (79.5%) | 9 (20.4%) |
| Construction & Extraction | 1,870 (98.1%) | 37 (1.9%) |
| Installation, Maintenance & Repair | 1,262 (97.3%) | 35 (2.7%) |
| Total (Category) | 3,167 (97.5%) | 81 (2.5%) |
| Total (Overall) | 29,692 (48.1%) | 31,987 (51.9%) |
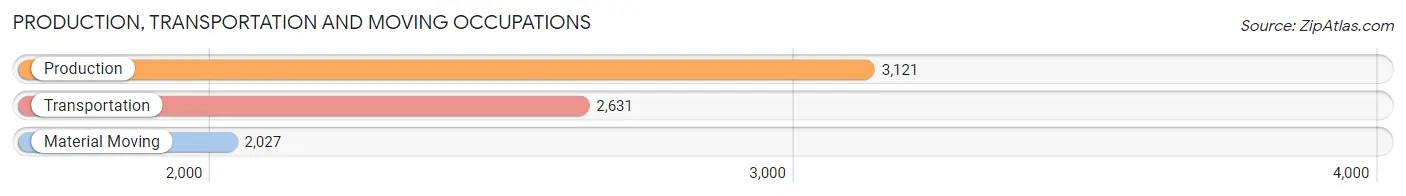
Production, Transportation and Moving Occupations
The most common Production, Transportation and Moving occupations in Syracuse are Production (3,121 | 5.1%), Transportation (2,631 | 4.3%), and Material Moving (2,027 | 3.3%).
Production, Transportation and Moving Occupations by Sex
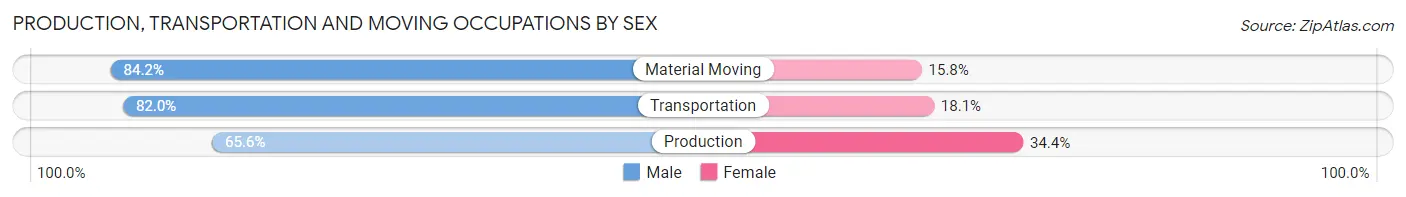
| Occupation | Male | Female |
| Production | 2,047 (65.6%) | 1,074 (34.4%) |
| Transportation | 2,156 (82.0%) | 475 (18.0%) |
| Material Moving | 1,707 (84.2%) | 320 (15.8%) |
| Total (Category) | 5,910 (76.0%) | 1,869 (24.0%) |
| Total (Overall) | 29,692 (48.1%) | 31,987 (51.9%) |
Employment Industries by Sex in Syracuse
Employment Industries in Syracuse
The major employment industries in Syracuse include Health Care & Social Assistance (11,645 | 18.9%), Educational Services (9,682 | 15.7%), Retail Trade (6,812 | 11.0%), Accommodation & Food Services (5,013 | 8.1%), and Professional & Scientific (4,089 | 6.6%).

Employment Industries by Sex in Syracuse
The Syracuse industries that see more men than women are Mining, Quarrying, & Extraction (100.0%), Construction (90.6%), and Transportation & Warehousing (77.7%), whereas the industries that tend to have a higher number of women are Health Care & Social Assistance (77.0%), Finance & Insurance (63.9%), and Educational Services (61.2%).
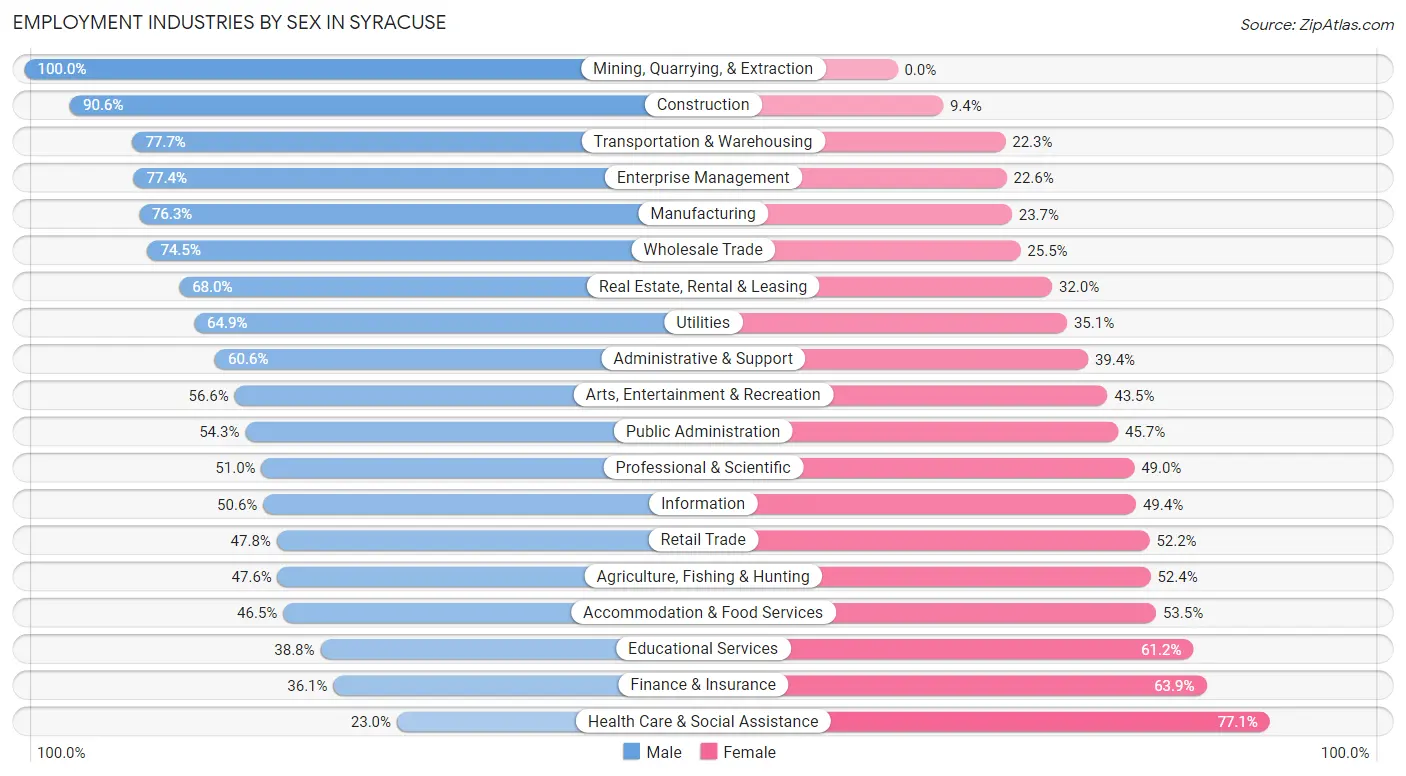
| Industry | Male | Female |
| Agriculture, Fishing & Hunting | 30 (47.6%) | 33 (52.4%) |
| Mining, Quarrying, & Extraction | 28 (100.0%) | 0 (0.0%) |
| Construction | 2,585 (90.6%) | 269 (9.4%) |
| Manufacturing | 3,057 (76.3%) | 948 (23.7%) |
| Wholesale Trade | 814 (74.5%) | 278 (25.5%) |
| Retail Trade | 3,258 (47.8%) | 3,554 (52.2%) |
| Transportation & Warehousing | 2,400 (77.7%) | 690 (22.3%) |
| Utilities | 379 (64.9%) | 205 (35.1%) |
| Information | 692 (50.6%) | 675 (49.4%) |
| Finance & Insurance | 767 (36.1%) | 1,358 (63.9%) |
| Real Estate, Rental & Leasing | 565 (68.0%) | 266 (32.0%) |
| Professional & Scientific | 2,085 (51.0%) | 2,004 (49.0%) |
| Enterprise Management | 24 (77.4%) | 7 (22.6%) |
| Administrative & Support | 1,394 (60.6%) | 908 (39.4%) |
| Educational Services | 3,755 (38.8%) | 5,927 (61.2%) |
| Health Care & Social Assistance | 2,673 (23.0%) | 8,972 (77.0%) |
| Arts, Entertainment & Recreation | 656 (56.6%) | 504 (43.4%) |
| Accommodation & Food Services | 2,330 (46.5%) | 2,683 (53.5%) |
| Public Administration | 1,078 (54.3%) | 906 (45.7%) |
| Total | 29,692 (48.1%) | 31,987 (51.9%) |
Education in Syracuse
School Enrollment in Syracuse
The most common levels of schooling among the 47,430 students in Syracuse are college / undergraduate (18,631 | 39.3%), middle school (7,183 | 15.1%), and elementary school (6,459 | 13.6%).
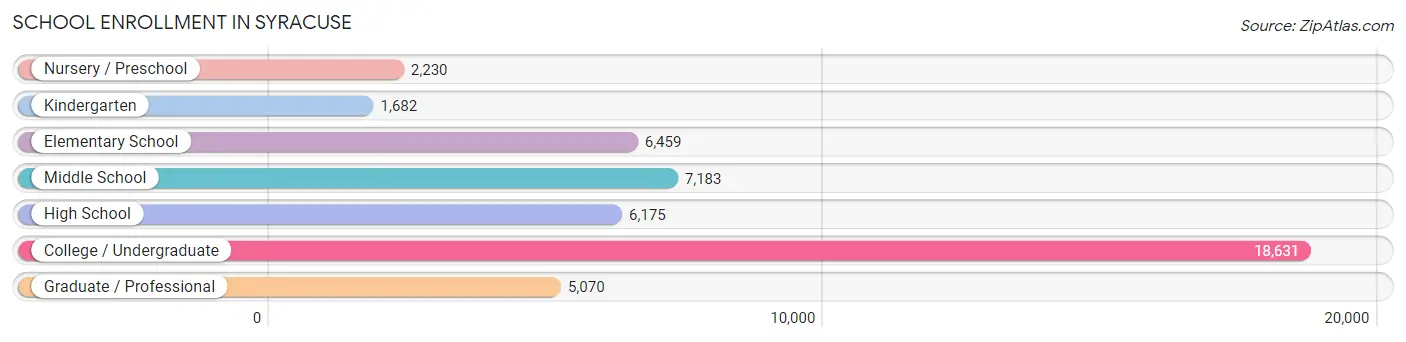
| School Level | # Students | % Students |
| Nursery / Preschool | 2,230 | 4.7% |
| Kindergarten | 1,682 | 3.5% |
| Elementary School | 6,459 | 13.6% |
| Middle School | 7,183 | 15.1% |
| High School | 6,175 | 13.0% |
| College / Undergraduate | 18,631 | 39.3% |
| Graduate / Professional | 5,070 | 10.7% |
| Total | 47,430 | 100.0% |
School Enrollment by Age by Funding Source in Syracuse
Out of a total of 47,430 students who are enrolled in schools in Syracuse, 17,407 (36.7%) attend a private institution, while the remaining 30,023 (63.3%) are enrolled in public schools. The age group of 18 to 19 year olds has the highest likelihood of being enrolled in private schools, with 6,836 (68.2% in the age bracket) enrolled. Conversely, the age group of 10 to 14 year olds has the lowest likelihood of being enrolled in a private school, with 7,891 (93.5% in the age bracket) attending a public institution.
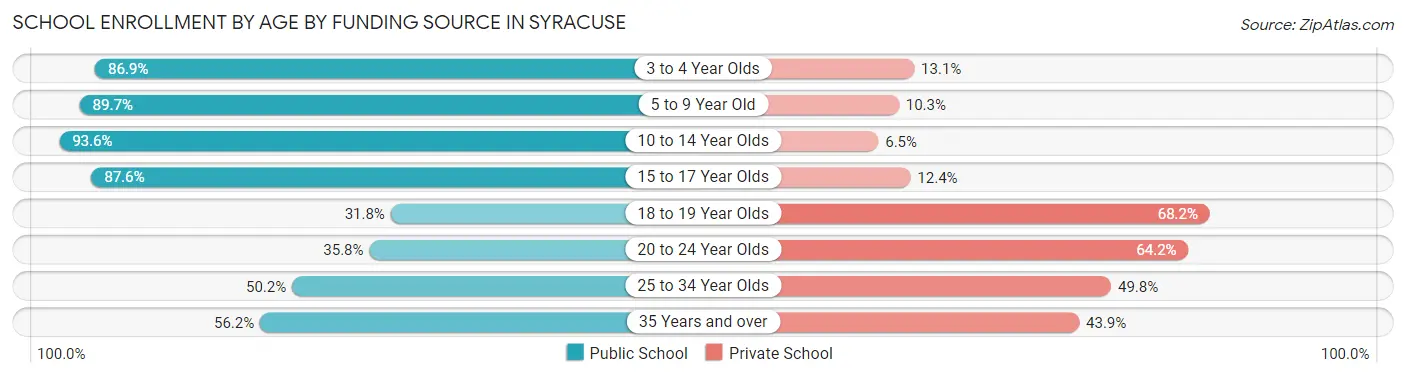
| Age Bracket | Public School | Private School |
| 3 to 4 Year Olds | 1,746 (86.9%) | 264 (13.1%) |
| 5 to 9 Year Old | 7,102 (89.7%) | 812 (10.3%) |
| 10 to 14 Year Olds | 7,891 (93.5%) | 544 (6.5%) |
| 15 to 17 Year Olds | 3,868 (87.6%) | 549 (12.4%) |
| 18 to 19 Year Olds | 3,189 (31.8%) | 6,836 (68.2%) |
| 20 to 24 Year Olds | 3,109 (35.8%) | 5,577 (64.2%) |
| 25 to 34 Year Olds | 1,995 (50.2%) | 1,980 (49.8%) |
| 35 Years and over | 1,105 (56.1%) | 863 (43.9%) |
| Total | 30,023 (63.3%) | 17,407 (36.7%) |
Educational Attainment by Field of Study in Syracuse
Business (3,659 | 12.4%), education (3,196 | 10.9%), science & technology (2,712 | 9.2%), bio, nature & agricultural (2,617 | 8.9%), and social sciences (2,566 | 8.7%) are the most common fields of study among 29,401 individuals in Syracuse who have obtained a bachelor's degree or higher.
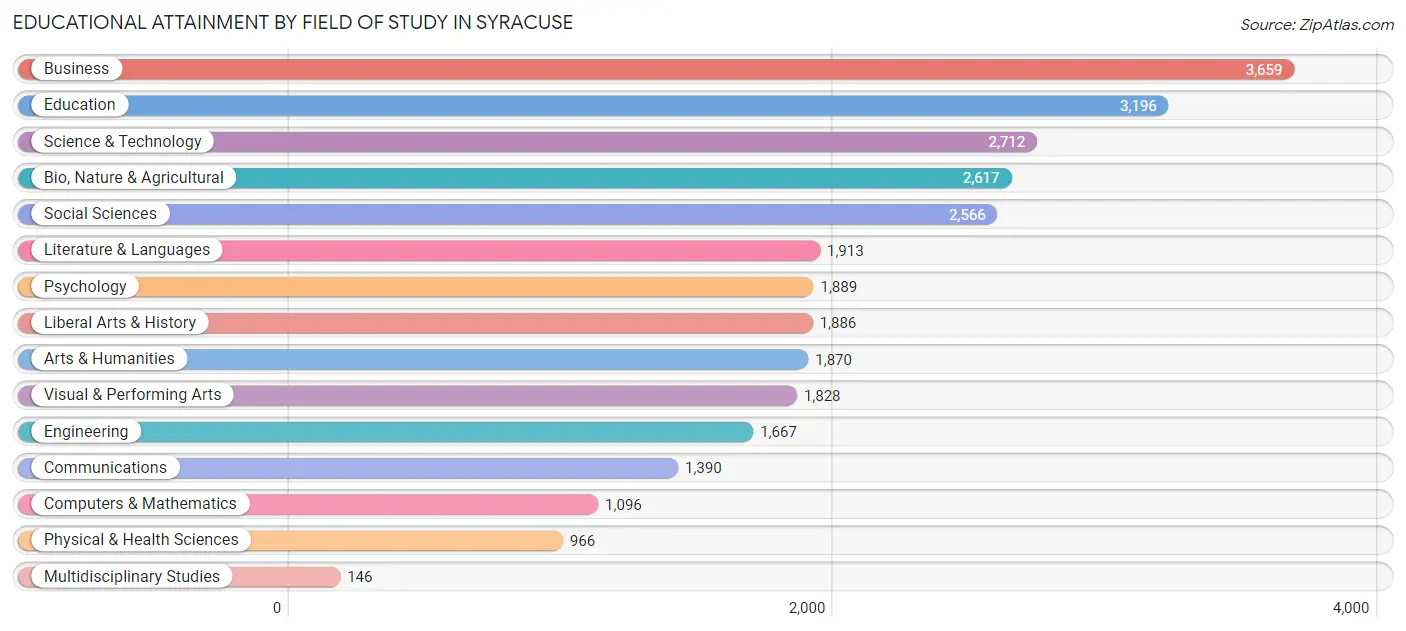
| Field of Study | # Graduates | % Graduates |
| Computers & Mathematics | 1,096 | 3.7% |
| Bio, Nature & Agricultural | 2,617 | 8.9% |
| Physical & Health Sciences | 966 | 3.3% |
| Psychology | 1,889 | 6.4% |
| Social Sciences | 2,566 | 8.7% |
| Engineering | 1,667 | 5.7% |
| Multidisciplinary Studies | 146 | 0.5% |
| Science & Technology | 2,712 | 9.2% |
| Business | 3,659 | 12.4% |
| Education | 3,196 | 10.9% |
| Literature & Languages | 1,913 | 6.5% |
| Liberal Arts & History | 1,886 | 6.4% |
| Visual & Performing Arts | 1,828 | 6.2% |
| Communications | 1,390 | 4.7% |
| Arts & Humanities | 1,870 | 6.4% |
| Total | 29,401 | 100.0% |
Transportation & Commute in Syracuse
Vehicle Availability by Sex in Syracuse
The most prevalent vehicle ownership categories in Syracuse are males with 1 vehicle (10,443, accounting for 37.4%) and females with 1 vehicle (11,681, making up 35.7%).
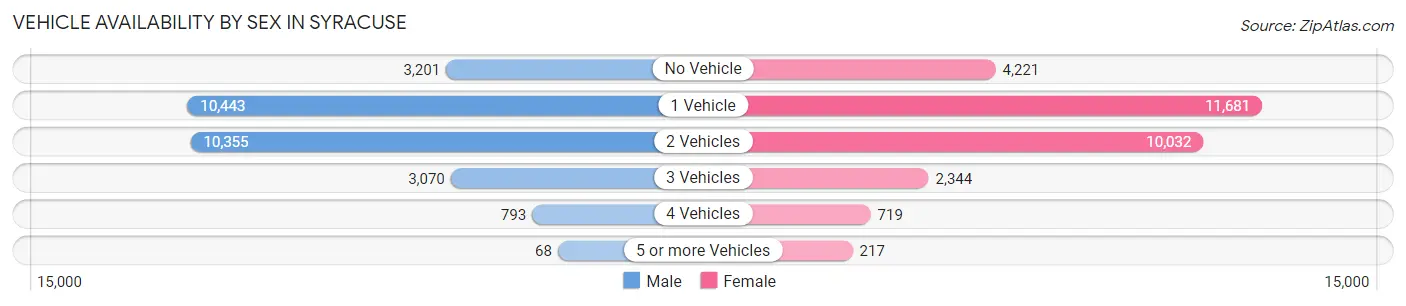
| Vehicles Available | Male | Female |
| No Vehicle | 3,201 (11.5%) | 4,221 (14.4%) |
| 1 Vehicle | 10,443 (37.4%) | 11,681 (40.0%) |
| 2 Vehicles | 10,355 (37.1%) | 10,032 (34.3%) |
| 3 Vehicles | 3,070 (11.0%) | 2,344 (8.0%) |
| 4 Vehicles | 793 (2.8%) | 719 (2.5%) |
| 5 or more Vehicles | 68 (0.2%) | 217 (0.7%) |
| Total | 27,930 (100.0%) | 29,214 (100.0%) |
Commute Time in Syracuse
The most frequently occuring commute durations in Syracuse are 10 to 14 minutes (14,304 commuters, 26.2%), 15 to 19 minutes (13,906 commuters, 25.5%), and 20 to 24 minutes (7,720 commuters, 14.1%).
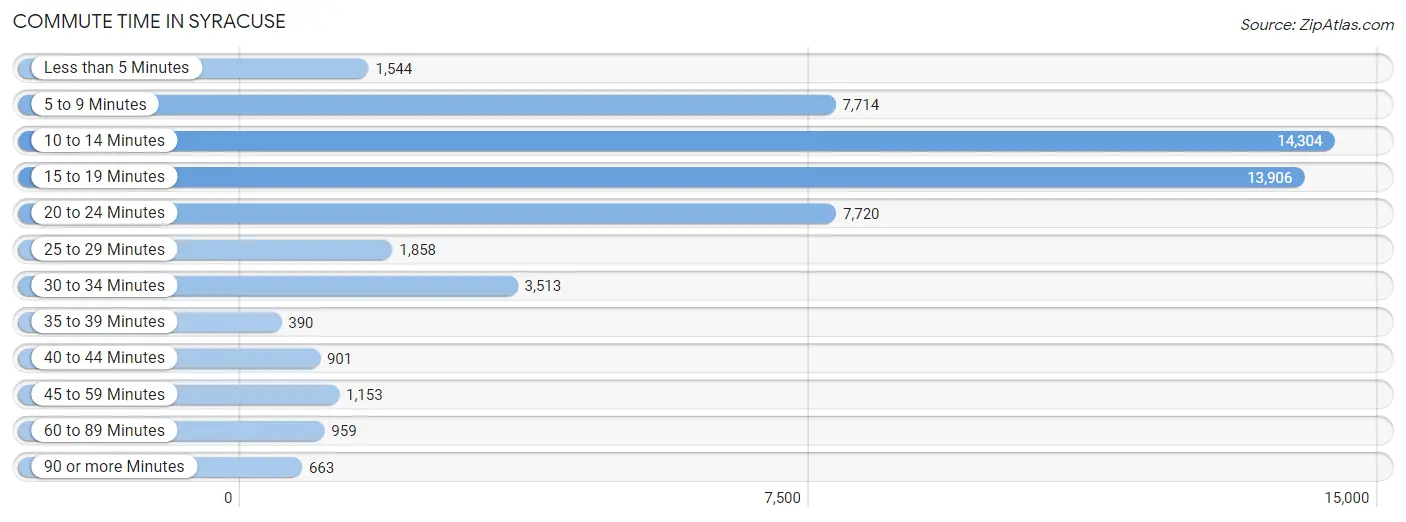
| Commute Time | # Commuters | % Commuters |
| Less than 5 Minutes | 1,544 | 2.8% |
| 5 to 9 Minutes | 7,714 | 14.1% |
| 10 to 14 Minutes | 14,304 | 26.2% |
| 15 to 19 Minutes | 13,906 | 25.5% |
| 20 to 24 Minutes | 7,720 | 14.1% |
| 25 to 29 Minutes | 1,858 | 3.4% |
| 30 to 34 Minutes | 3,513 | 6.4% |
| 35 to 39 Minutes | 390 | 0.7% |
| 40 to 44 Minutes | 901 | 1.7% |
| 45 to 59 Minutes | 1,153 | 2.1% |
| 60 to 89 Minutes | 959 | 1.8% |
| 90 or more Minutes | 663 | 1.2% |
Commute Time by Sex in Syracuse
The most common commute times in Syracuse are 10 to 14 minutes (6,816 commuters, 25.6%) for males and 15 to 19 minutes (7,598 commuters, 27.2%) for females.
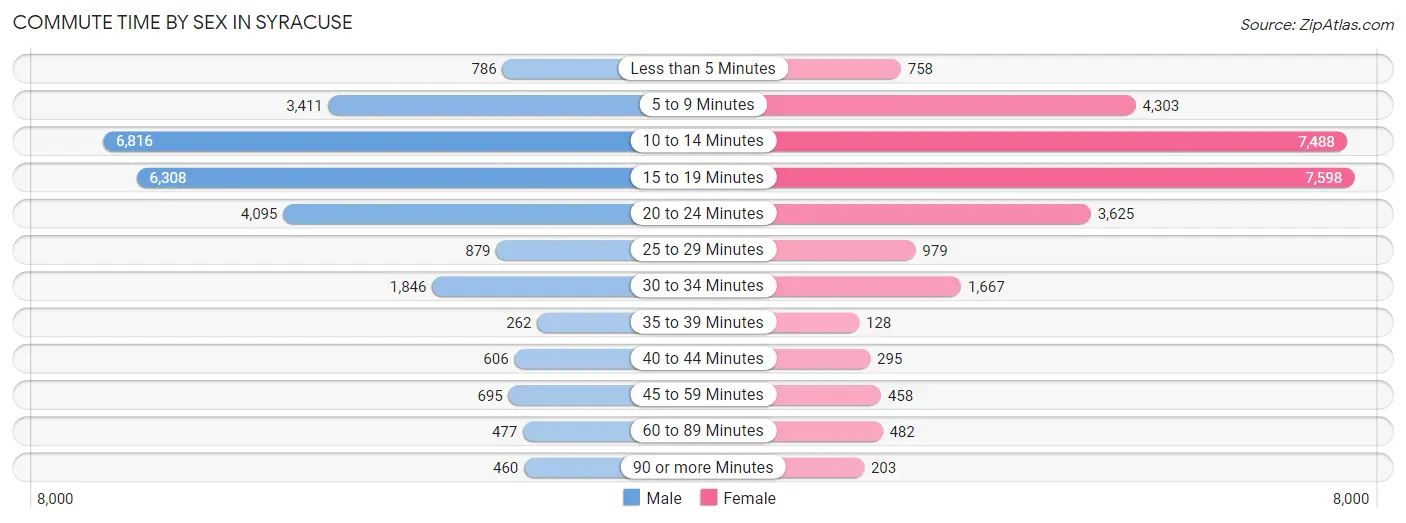
| Commute Time | Male | Female |
| Less than 5 Minutes | 786 (2.9%) | 758 (2.7%) |
| 5 to 9 Minutes | 3,411 (12.8%) | 4,303 (15.4%) |
| 10 to 14 Minutes | 6,816 (25.6%) | 7,488 (26.8%) |
| 15 to 19 Minutes | 6,308 (23.7%) | 7,598 (27.2%) |
| 20 to 24 Minutes | 4,095 (15.4%) | 3,625 (13.0%) |
| 25 to 29 Minutes | 879 (3.3%) | 979 (3.5%) |
| 30 to 34 Minutes | 1,846 (6.9%) | 1,667 (6.0%) |
| 35 to 39 Minutes | 262 (1.0%) | 128 (0.5%) |
| 40 to 44 Minutes | 606 (2.3%) | 295 (1.1%) |
| 45 to 59 Minutes | 695 (2.6%) | 458 (1.6%) |
| 60 to 89 Minutes | 477 (1.8%) | 482 (1.7%) |
| 90 or more Minutes | 460 (1.7%) | 203 (0.7%) |
Time of Departure to Work by Sex in Syracuse
The most frequent times of departure to work in Syracuse are 7:30 AM to 7:59 AM (3,303, 12.4%) for males and 8:00 AM to 8:29 AM (4,263, 15.2%) for females.
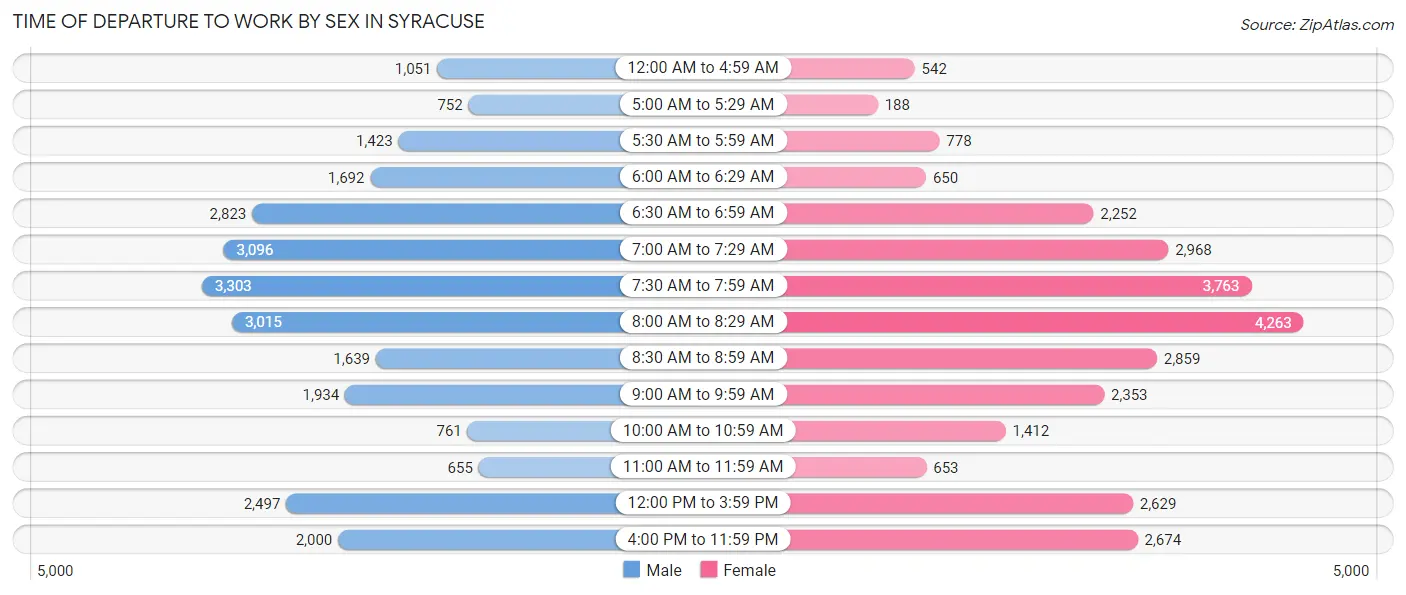
| Time of Departure | Male | Female |
| 12:00 AM to 4:59 AM | 1,051 (4.0%) | 542 (1.9%) |
| 5:00 AM to 5:29 AM | 752 (2.8%) | 188 (0.7%) |
| 5:30 AM to 5:59 AM | 1,423 (5.3%) | 778 (2.8%) |
| 6:00 AM to 6:29 AM | 1,692 (6.4%) | 650 (2.3%) |
| 6:30 AM to 6:59 AM | 2,823 (10.6%) | 2,252 (8.1%) |
| 7:00 AM to 7:29 AM | 3,096 (11.6%) | 2,968 (10.6%) |
| 7:30 AM to 7:59 AM | 3,303 (12.4%) | 3,763 (13.5%) |
| 8:00 AM to 8:29 AM | 3,015 (11.3%) | 4,263 (15.2%) |
| 8:30 AM to 8:59 AM | 1,639 (6.1%) | 2,859 (10.2%) |
| 9:00 AM to 9:59 AM | 1,934 (7.3%) | 2,353 (8.4%) |
| 10:00 AM to 10:59 AM | 761 (2.9%) | 1,412 (5.1%) |
| 11:00 AM to 11:59 AM | 655 (2.5%) | 653 (2.3%) |
| 12:00 PM to 3:59 PM | 2,497 (9.4%) | 2,629 (9.4%) |
| 4:00 PM to 11:59 PM | 2,000 (7.5%) | 2,674 (9.6%) |
| Total | 26,641 (100.0%) | 27,984 (100.0%) |
Housing Occupancy in Syracuse
Occupancy by Ownership in Syracuse
Of the total 58,424 dwellings in Syracuse, owner-occupied units account for 23,849 (40.8%), while renter-occupied units make up 34,575 (59.2%).
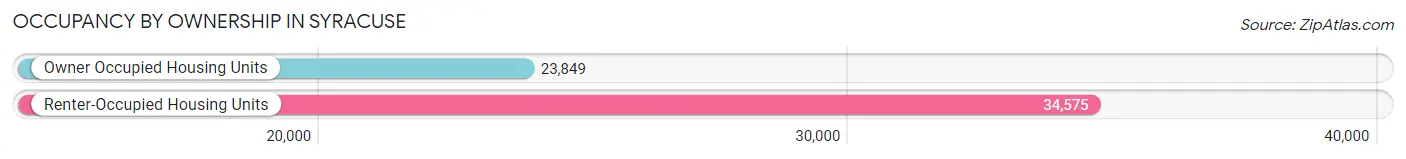
| Occupancy | # Housing Units | % Housing Units |
| Owner Occupied Housing Units | 23,849 | 40.8% |
| Renter-Occupied Housing Units | 34,575 | 59.2% |
| Total Occupied Housing Units | 58,424 | 100.0% |
Occupancy by Household Size in Syracuse
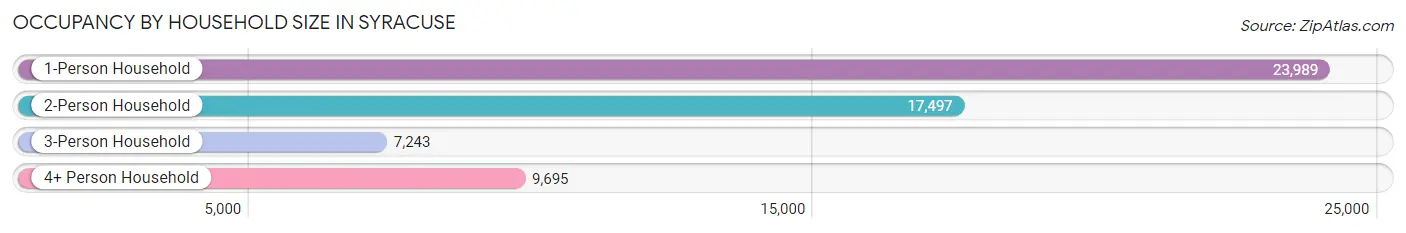
| Household Size | # Housing Units | % Housing Units |
| 1-Person Household | 23,989 | 41.1% |
| 2-Person Household | 17,497 | 29.9% |
| 3-Person Household | 7,243 | 12.4% |
| 4+ Person Household | 9,695 | 16.6% |
| Total Housing Units | 58,424 | 100.0% |
Occupancy by Ownership by Household Size in Syracuse
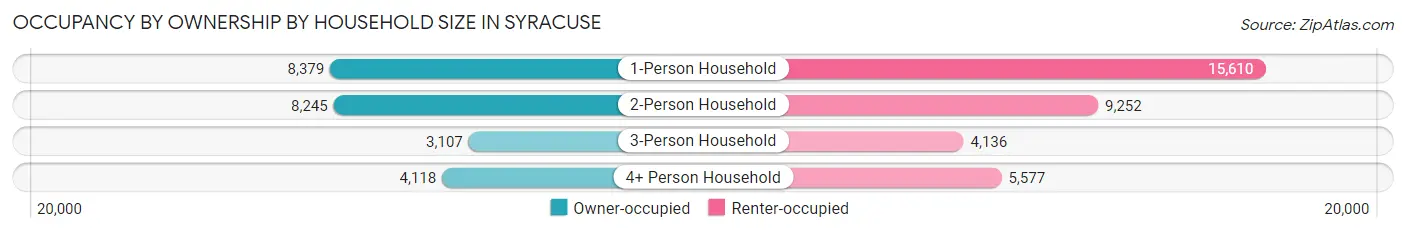
| Household Size | Owner-occupied | Renter-occupied |
| 1-Person Household | 8,379 (34.9%) | 15,610 (65.1%) |
| 2-Person Household | 8,245 (47.1%) | 9,252 (52.9%) |
| 3-Person Household | 3,107 (42.9%) | 4,136 (57.1%) |
| 4+ Person Household | 4,118 (42.5%) | 5,577 (57.5%) |
| Total Housing Units | 23,849 (40.8%) | 34,575 (59.2%) |
Occupancy by Educational Attainment in Syracuse
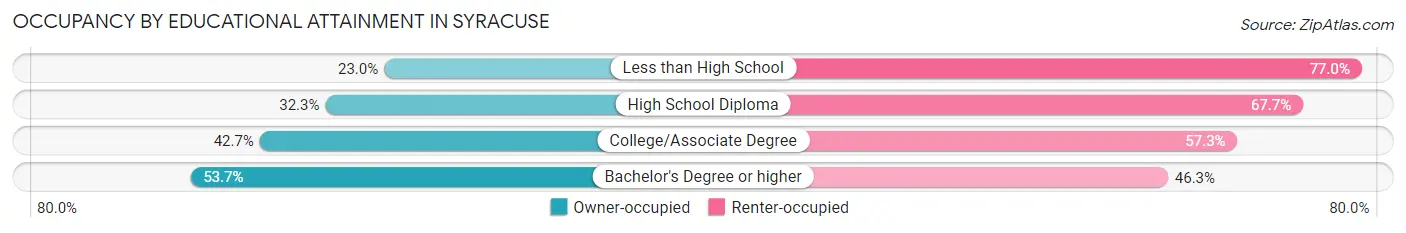
| Household Size | Owner-occupied | Renter-occupied |
| Less than High School | 1,869 (23.0%) | 6,261 (77.0%) |
| High School Diploma | 4,783 (32.3%) | 10,025 (67.7%) |
| College/Associate Degree | 7,248 (42.7%) | 9,721 (57.3%) |
| Bachelor's Degree or higher | 9,949 (53.7%) | 8,568 (46.3%) |
Occupancy by Age of Householder in Syracuse
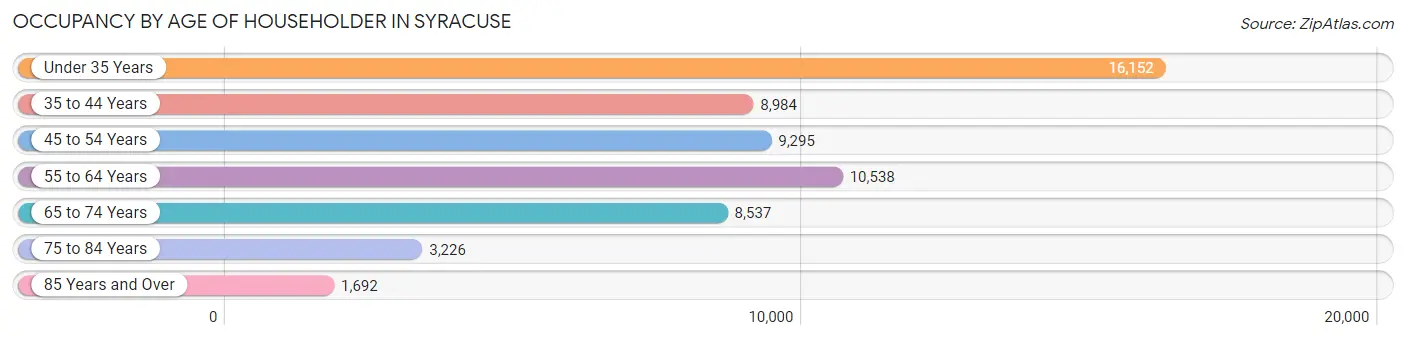
| Age Bracket | # Households | % Households |
| Under 35 Years | 16,152 | 27.7% |
| 35 to 44 Years | 8,984 | 15.4% |
| 45 to 54 Years | 9,295 | 15.9% |
| 55 to 64 Years | 10,538 | 18.0% |
| 65 to 74 Years | 8,537 | 14.6% |
| 75 to 84 Years | 3,226 | 5.5% |
| 85 Years and Over | 1,692 | 2.9% |
| Total | 58,424 | 100.0% |
Housing Finances in Syracuse
Median Income by Occupancy in Syracuse
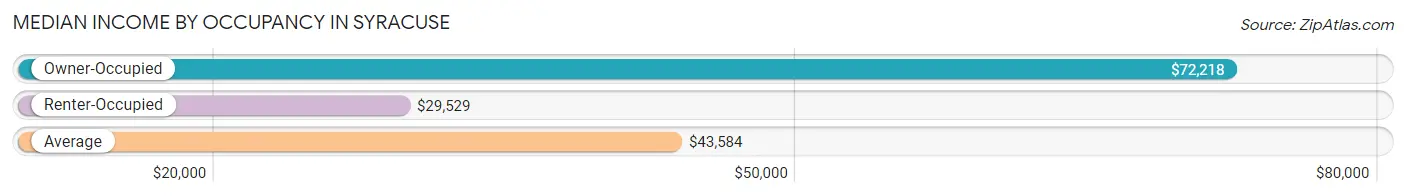
| Occupancy Type | # Households | Median Income |
| Owner-Occupied | 23,849 (40.8%) | $72,218 |
| Renter-Occupied | 34,575 (59.2%) | $29,529 |
| Average | 58,424 (100.0%) | $43,584 |
Occupancy by Householder Income Bracket in Syracuse
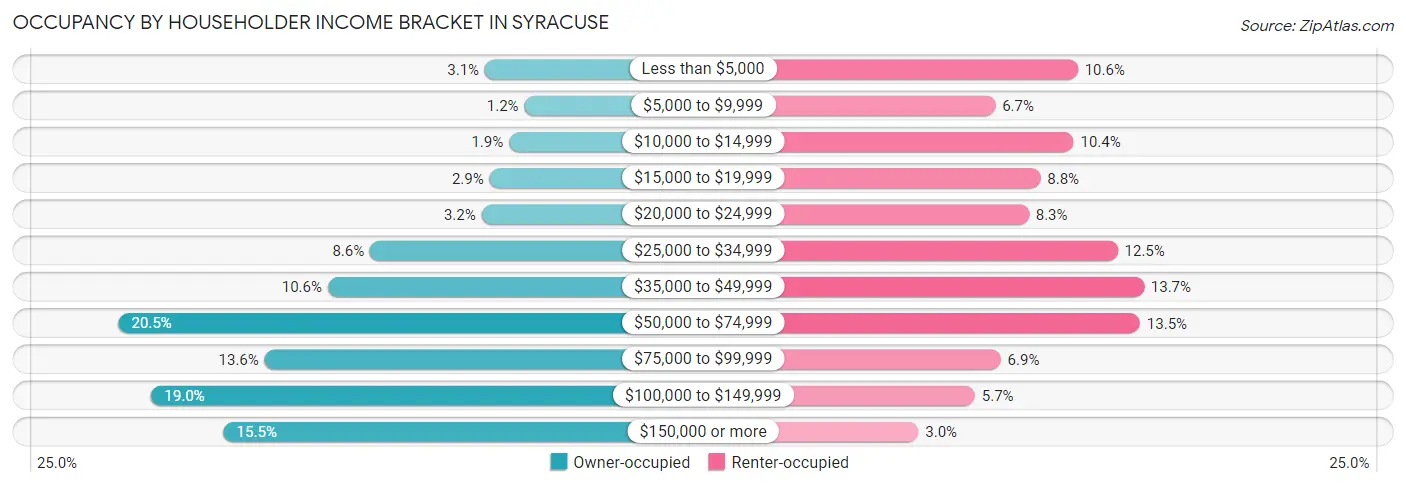
| Income Bracket | Owner-occupied | Renter-occupied |
| Less than $5,000 | 735 (3.1%) | 3,658 (10.6%) |
| $5,000 to $9,999 | 286 (1.2%) | 2,300 (6.7%) |
| $10,000 to $14,999 | 461 (1.9%) | 3,590 (10.4%) |
| $15,000 to $19,999 | 681 (2.9%) | 3,044 (8.8%) |
| $20,000 to $24,999 | 772 (3.2%) | 2,851 (8.3%) |
| $25,000 to $34,999 | 2,038 (8.6%) | 4,314 (12.5%) |
| $35,000 to $49,999 | 2,519 (10.6%) | 4,746 (13.7%) |
| $50,000 to $74,999 | 4,897 (20.5%) | 4,683 (13.5%) |
| $75,000 to $99,999 | 3,237 (13.6%) | 2,389 (6.9%) |
| $100,000 to $149,999 | 4,521 (19.0%) | 1,965 (5.7%) |
| $150,000 or more | 3,702 (15.5%) | 1,035 (3.0%) |
| Total | 23,849 (100.0%) | 34,575 (100.0%) |
Monthly Housing Cost Tiers in Syracuse
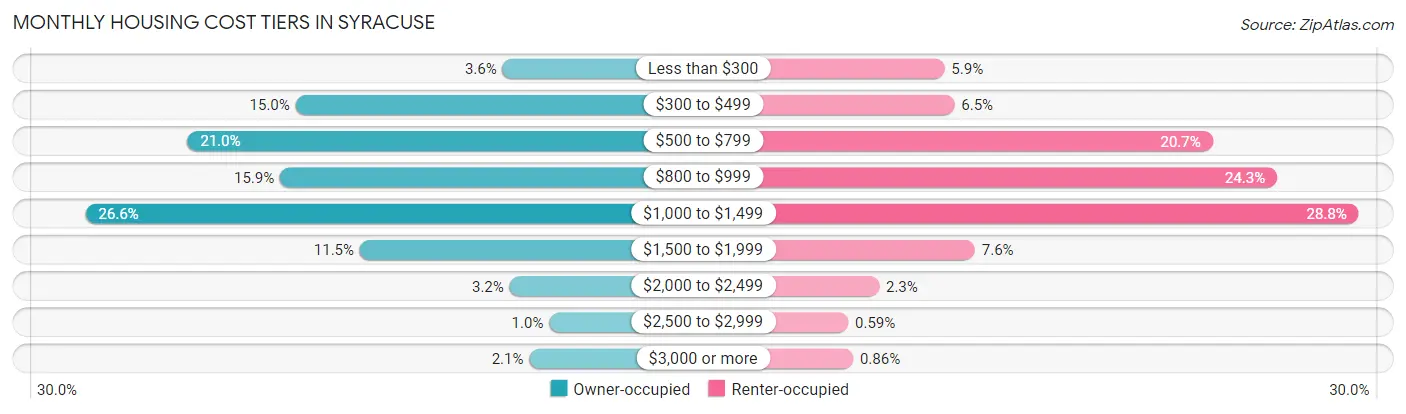
| Monthly Cost | Owner-occupied | Renter-occupied |
| Less than $300 | 859 (3.6%) | 2,042 (5.9%) |
| $300 to $499 | 3,584 (15.0%) | 2,234 (6.5%) |
| $500 to $799 | 5,011 (21.0%) | 7,164 (20.7%) |
| $800 to $999 | 3,790 (15.9%) | 8,395 (24.3%) |
| $1,000 to $1,499 | 6,353 (26.6%) | 9,954 (28.8%) |
| $1,500 to $1,999 | 2,737 (11.5%) | 2,625 (7.6%) |
| $2,000 to $2,499 | 766 (3.2%) | 795 (2.3%) |
| $2,500 to $2,999 | 243 (1.0%) | 203 (0.6%) |
| $3,000 or more | 506 (2.1%) | 298 (0.9%) |
| Total | 23,849 (100.0%) | 34,575 (100.0%) |
Physical Housing Characteristics in Syracuse
Housing Structures in Syracuse
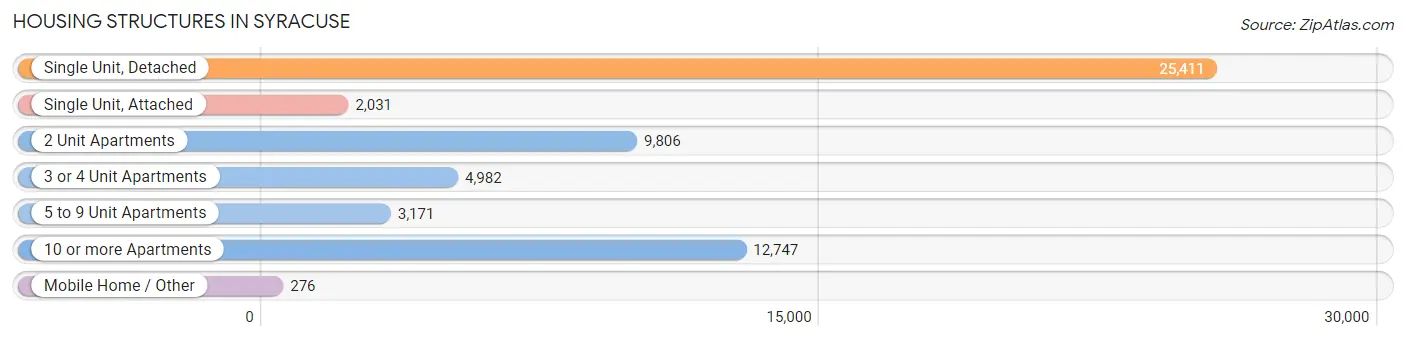
| Structure Type | # Housing Units | % Housing Units |
| Single Unit, Detached | 25,411 | 43.5% |
| Single Unit, Attached | 2,031 | 3.5% |
| 2 Unit Apartments | 9,806 | 16.8% |
| 3 or 4 Unit Apartments | 4,982 | 8.5% |
| 5 to 9 Unit Apartments | 3,171 | 5.4% |
| 10 or more Apartments | 12,747 | 21.8% |
| Mobile Home / Other | 276 | 0.5% |
| Total | 58,424 | 100.0% |
Housing Structures by Occupancy in Syracuse
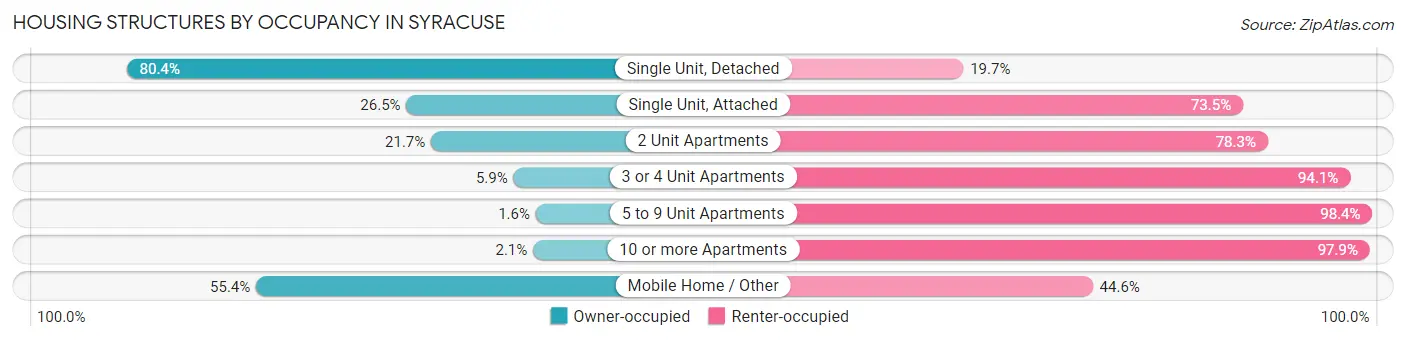
| Structure Type | Owner-occupied | Renter-occupied |
| Single Unit, Detached | 20,418 (80.3%) | 4,993 (19.7%) |
| Single Unit, Attached | 538 (26.5%) | 1,493 (73.5%) |
| 2 Unit Apartments | 2,131 (21.7%) | 7,675 (78.3%) |
| 3 or 4 Unit Apartments | 292 (5.9%) | 4,690 (94.1%) |
| 5 to 9 Unit Apartments | 50 (1.6%) | 3,121 (98.4%) |
| 10 or more Apartments | 267 (2.1%) | 12,480 (97.9%) |
| Mobile Home / Other | 153 (55.4%) | 123 (44.6%) |
| Total | 23,849 (40.8%) | 34,575 (59.2%) |
Housing Structures by Number of Rooms in Syracuse
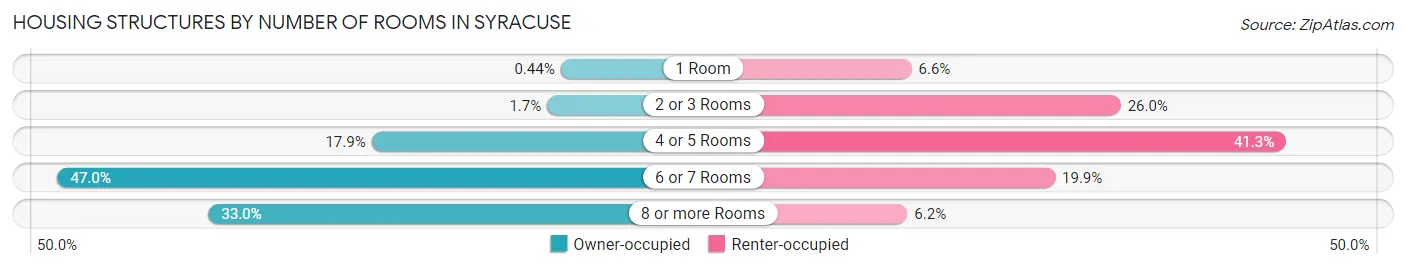
| Number of Rooms | Owner-occupied | Renter-occupied |
| 1 Room | 106 (0.4%) | 2,294 (6.6%) |
| 2 or 3 Rooms | 401 (1.7%) | 8,980 (26.0%) |
| 4 or 5 Rooms | 4,274 (17.9%) | 14,262 (41.2%) |
| 6 or 7 Rooms | 11,198 (46.9%) | 6,881 (19.9%) |
| 8 or more Rooms | 7,870 (33.0%) | 2,158 (6.2%) |
| Total | 23,849 (100.0%) | 34,575 (100.0%) |
Housing Structure by Heating Type in Syracuse
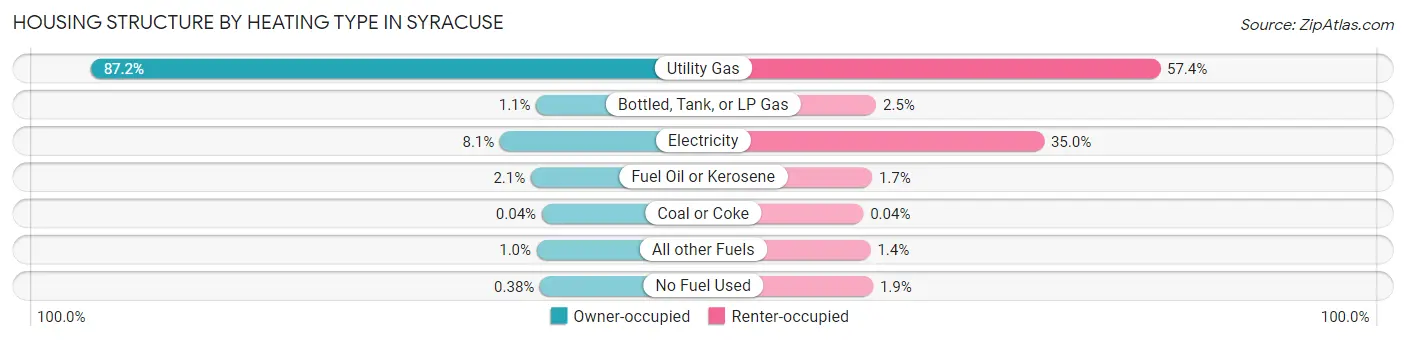
| Heating Type | Owner-occupied | Renter-occupied |
| Utility Gas | 20,800 (87.2%) | 19,844 (57.4%) |
| Bottled, Tank, or LP Gas | 265 (1.1%) | 873 (2.5%) |
| Electricity | 1,935 (8.1%) | 12,087 (35.0%) |
| Fuel Oil or Kerosene | 510 (2.1%) | 597 (1.7%) |
| Coal or Coke | 9 (0.0%) | 14 (0.0%) |
| All other Fuels | 240 (1.0%) | 497 (1.4%) |
| No Fuel Used | 90 (0.4%) | 663 (1.9%) |
| Total | 23,849 (100.0%) | 34,575 (100.0%) |
Household Vehicle Usage in Syracuse
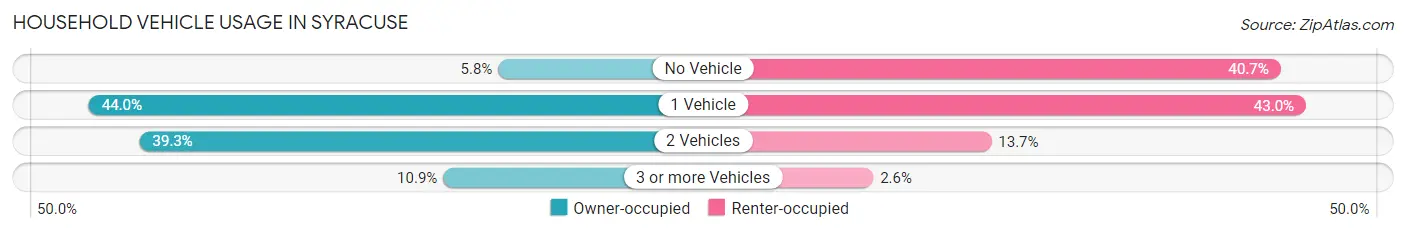
| Vehicles per Household | Owner-occupied | Renter-occupied |
| No Vehicle | 1,382 (5.8%) | 14,061 (40.7%) |
| 1 Vehicle | 10,493 (44.0%) | 14,876 (43.0%) |
| 2 Vehicles | 9,367 (39.3%) | 4,725 (13.7%) |
| 3 or more Vehicles | 2,607 (10.9%) | 913 (2.6%) |
| Total | 23,849 (100.0%) | 34,575 (100.0%) |
Real Estate & Mortgages in Syracuse
Real Estate and Mortgage Overview in Syracuse
| Characteristic | Without Mortgage | With Mortgage |
| Housing Units | 9,205 | 14,644 |
| Median Property Value | $100,600 | $126,000 |
| Median Household Income | $56,693 | $2,749 |
| Monthly Housing Costs | $531 | $498 |
| Real Estate Taxes | $2,731 | $427 |
Property Value by Mortgage Status in Syracuse
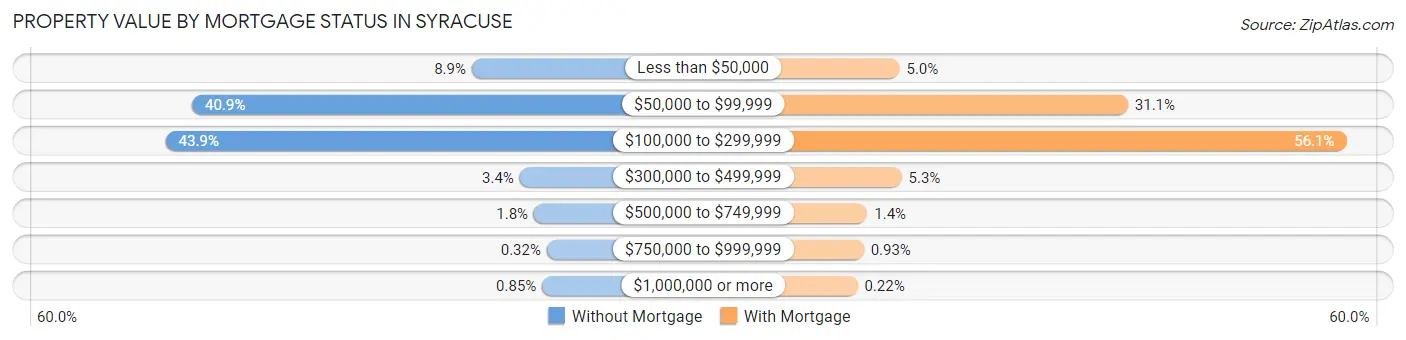
| Property Value | Without Mortgage | With Mortgage |
| Less than $50,000 | 818 (8.9%) | 737 (5.0%) |
| $50,000 to $99,999 | 3,761 (40.9%) | 4,557 (31.1%) |
| $100,000 to $299,999 | 4,039 (43.9%) | 8,213 (56.1%) |
| $300,000 to $499,999 | 315 (3.4%) | 771 (5.3%) |
| $500,000 to $749,999 | 165 (1.8%) | 198 (1.3%) |
| $750,000 to $999,999 | 29 (0.3%) | 136 (0.9%) |
| $1,000,000 or more | 78 (0.9%) | 32 (0.2%) |
| Total | 9,205 (100.0%) | 14,644 (100.0%) |
Household Income by Mortgage Status in Syracuse
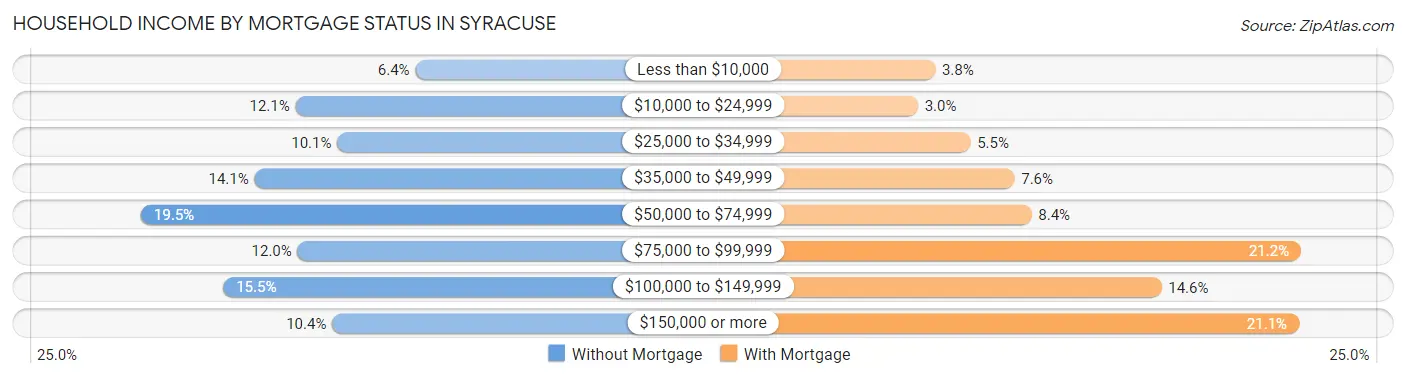
| Household Income | Without Mortgage | With Mortgage |
| Less than $10,000 | 588 (6.4%) | 554 (3.8%) |
| $10,000 to $24,999 | 1,114 (12.1%) | 433 (3.0%) |
| $25,000 to $34,999 | 931 (10.1%) | 800 (5.5%) |
| $35,000 to $49,999 | 1,293 (14.1%) | 1,107 (7.6%) |
| $50,000 to $74,999 | 1,791 (19.5%) | 1,226 (8.4%) |
| $75,000 to $99,999 | 1,105 (12.0%) | 3,106 (21.2%) |
| $100,000 to $149,999 | 1,430 (15.5%) | 2,132 (14.6%) |
| $150,000 or more | 953 (10.3%) | 3,091 (21.1%) |
| Total | 9,205 (100.0%) | 14,644 (100.0%) |
Property Value to Household Income Ratio in Syracuse
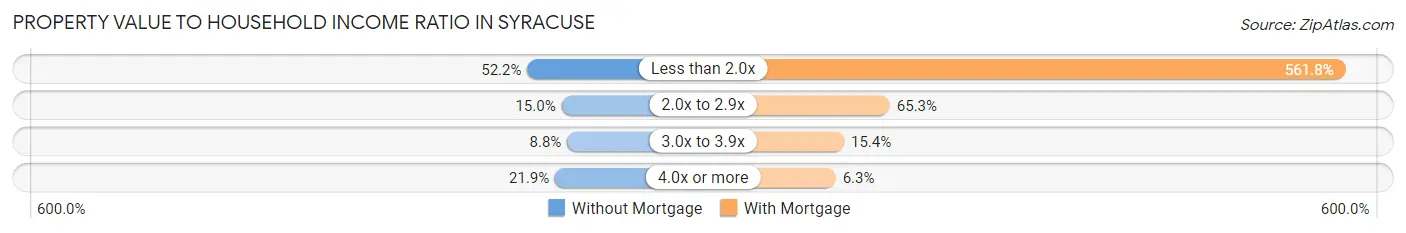
| Value-to-Income Ratio | Without Mortgage | With Mortgage |
| Less than 2.0x | 4,808 (52.2%) | 82,263 (561.7%) |
| 2.0x to 2.9x | 1,378 (15.0%) | 9,565 (65.3%) |
| 3.0x to 3.9x | 807 (8.8%) | 2,254 (15.4%) |
| 4.0x or more | 2,020 (21.9%) | 923 (6.3%) |
| Total | 9,205 (100.0%) | 14,644 (100.0%) |
Real Estate Taxes by Mortgage Status in Syracuse
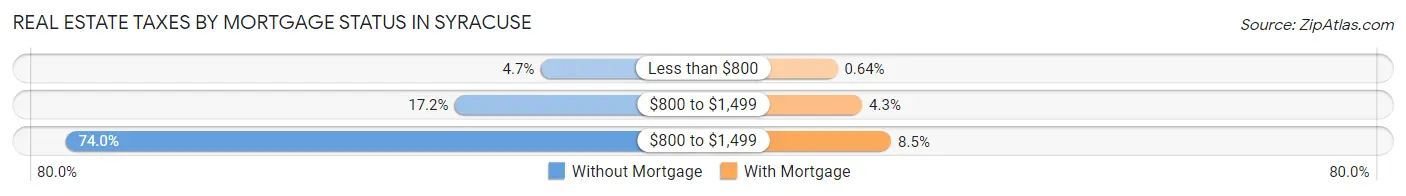
| Property Taxes | Without Mortgage | With Mortgage |
| Less than $800 | 429 (4.7%) | 93 (0.6%) |
| $800 to $1,499 | 1,585 (17.2%) | 622 (4.3%) |
| $800 to $1,499 | 6,813 (74.0%) | 1,244 (8.5%) |
| Total | 9,205 (100.0%) | 14,644 (100.0%) |
Health & Disability in Syracuse
Health Insurance Coverage by Age in Syracuse
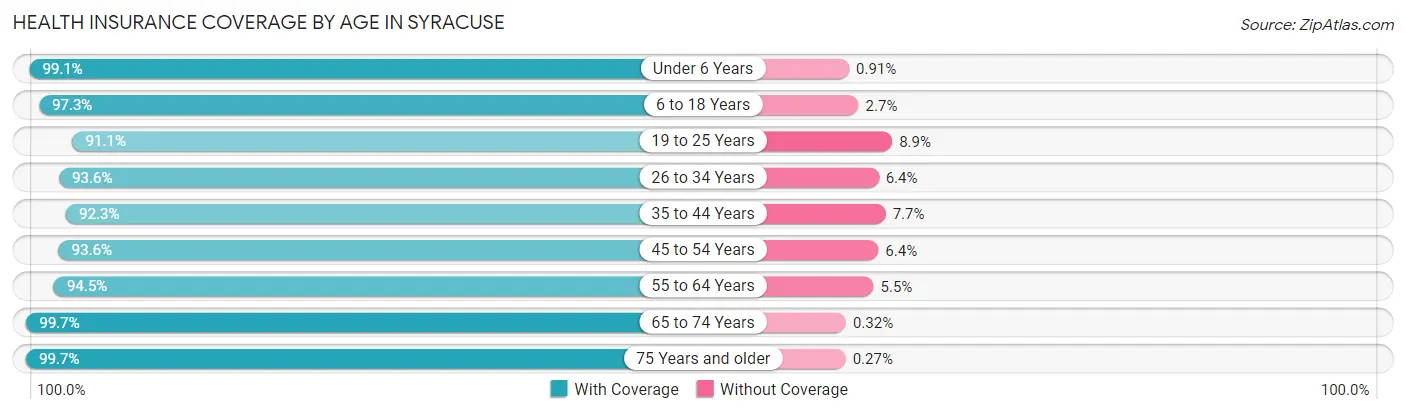
| Age Bracket | With Coverage | Without Coverage |
| Under 6 Years | 10,511 (99.1%) | 97 (0.9%) |
| 6 to 18 Years | 24,244 (97.3%) | 668 (2.7%) |
| 19 to 25 Years | 20,818 (91.1%) | 2,043 (8.9%) |
| 26 to 34 Years | 19,565 (93.6%) | 1,342 (6.4%) |
| 35 to 44 Years | 14,543 (92.3%) | 1,218 (7.7%) |
| 45 to 54 Years | 13,804 (93.6%) | 937 (6.4%) |
| 55 to 64 Years | 15,066 (94.5%) | 872 (5.5%) |
| 65 to 74 Years | 11,337 (99.7%) | 36 (0.3%) |
| 75 Years and older | 6,669 (99.7%) | 18 (0.3%) |
| Total | 136,557 (95.0%) | 7,231 (5.0%) |
Health Insurance Coverage by Citizenship Status in Syracuse
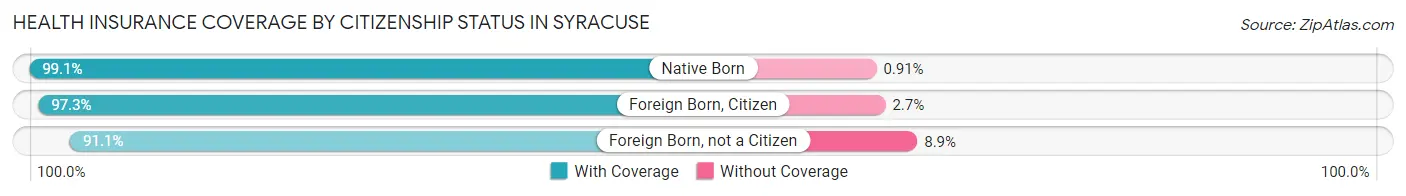
| Citizenship Status | With Coverage | Without Coverage |
| Native Born | 10,511 (99.1%) | 97 (0.9%) |
| Foreign Born, Citizen | 24,244 (97.3%) | 668 (2.7%) |
| Foreign Born, not a Citizen | 20,818 (91.1%) | 2,043 (8.9%) |
Health Insurance Coverage by Household Income in Syracuse
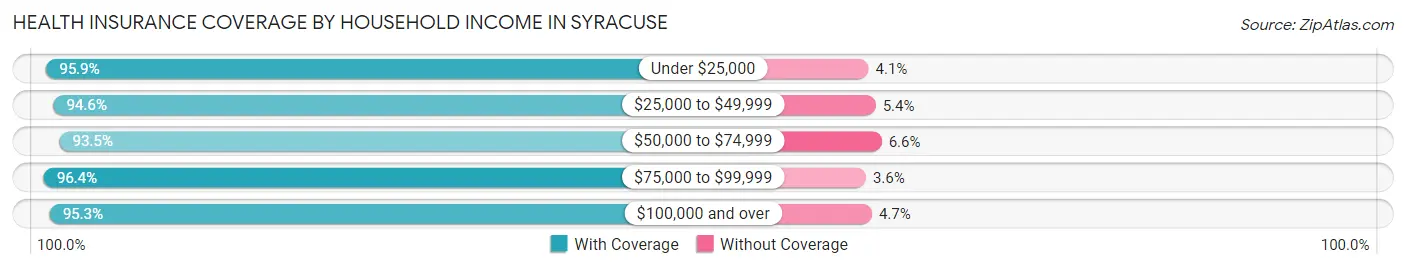
| Household Income | With Coverage | Without Coverage |
| Under $25,000 | 32,594 (95.9%) | 1,388 (4.1%) |
| $25,000 to $49,999 | 27,885 (94.6%) | 1,599 (5.4%) |
| $50,000 to $74,999 | 20,118 (93.4%) | 1,410 (6.6%) |
| $75,000 to $99,999 | 12,891 (96.4%) | 482 (3.6%) |
| $100,000 and over | 30,029 (95.3%) | 1,488 (4.7%) |
Public vs Private Health Insurance Coverage by Age in Syracuse
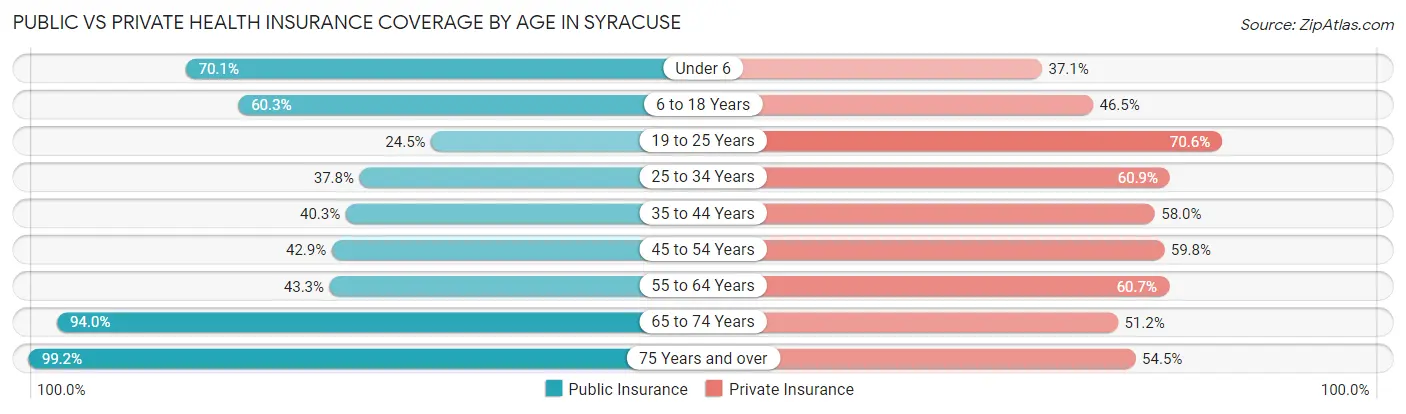
| Age Bracket | Public Insurance | Private Insurance |
| Under 6 | 7,438 (70.1%) | 3,932 (37.1%) |
| 6 to 18 Years | 15,033 (60.3%) | 11,595 (46.5%) |
| 19 to 25 Years | 5,598 (24.5%) | 16,133 (70.6%) |
| 25 to 34 Years | 7,900 (37.8%) | 12,730 (60.9%) |
| 35 to 44 Years | 6,358 (40.3%) | 9,143 (58.0%) |
| 45 to 54 Years | 6,328 (42.9%) | 8,809 (59.8%) |
| 55 to 64 Years | 6,907 (43.3%) | 9,671 (60.7%) |
| 65 to 74 Years | 10,688 (94.0%) | 5,819 (51.2%) |
| 75 Years and over | 6,634 (99.2%) | 3,641 (54.4%) |
| Total | 72,884 (50.7%) | 81,473 (56.7%) |
Disability Status by Sex by Age in Syracuse
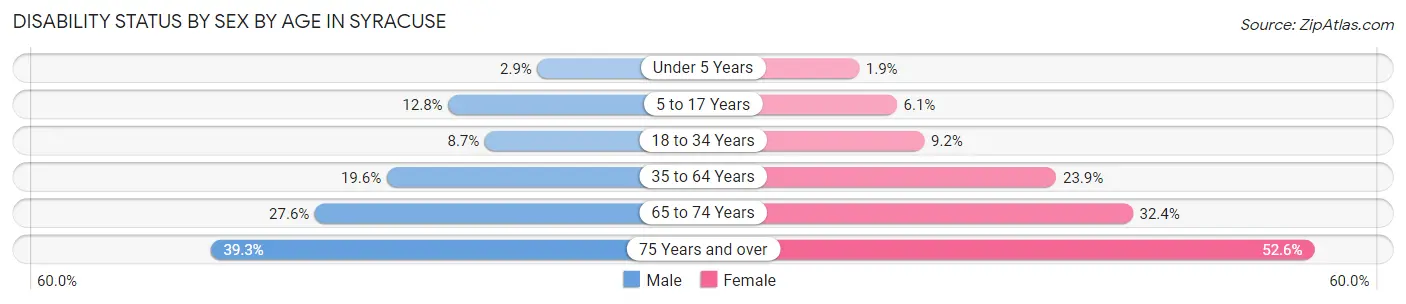
| Age Bracket | Male | Female |
| Under 5 Years | 125 (2.9%) | 85 (1.9%) |
| 5 to 17 Years | 1,440 (12.8%) | 640 (6.1%) |
| 18 to 34 Years | 2,002 (8.7%) | 2,358 (9.2%) |
| 35 to 64 Years | 4,541 (19.6%) | 5,564 (23.9%) |
| 65 to 74 Years | 1,460 (27.6%) | 1,972 (32.4%) |
| 75 Years and over | 955 (39.3%) | 2,240 (52.6%) |
Disability Class by Sex by Age in Syracuse
Disability Class: Hearing Difficulty
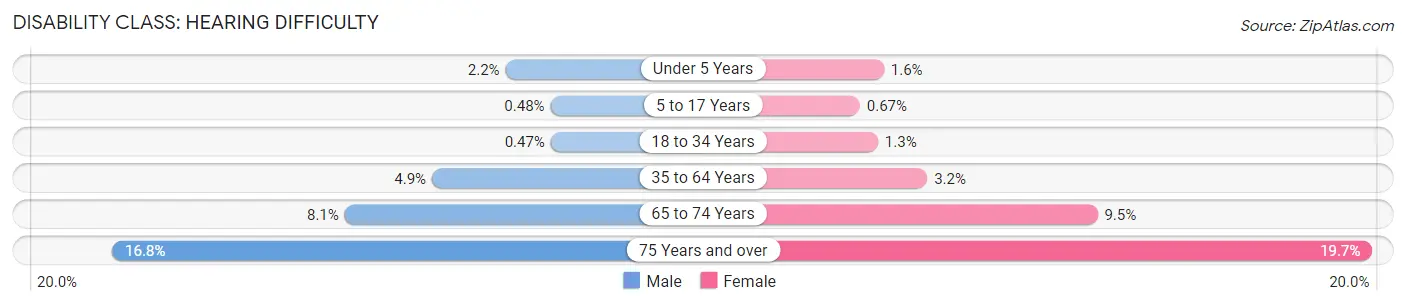
| Age Bracket | Male | Female |
| Under 5 Years | 94 (2.1%) | 70 (1.6%) |
| 5 to 17 Years | 54 (0.5%) | 70 (0.7%) |
| 18 to 34 Years | 107 (0.5%) | 344 (1.3%) |
| 35 to 64 Years | 1,128 (4.9%) | 739 (3.2%) |
| 65 to 74 Years | 429 (8.1%) | 578 (9.5%) |
| 75 Years and over | 407 (16.8%) | 838 (19.7%) |
Disability Class: Vision Difficulty
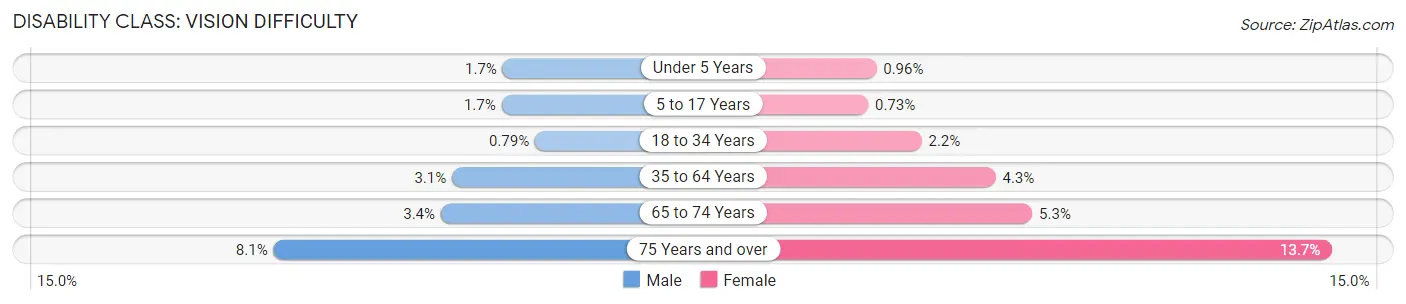
| Age Bracket | Male | Female |
| Under 5 Years | 74 (1.7%) | 43 (1.0%) |
| 5 to 17 Years | 194 (1.7%) | 77 (0.7%) |
| 18 to 34 Years | 181 (0.8%) | 571 (2.2%) |
| 35 to 64 Years | 717 (3.1%) | 997 (4.3%) |
| 65 to 74 Years | 180 (3.4%) | 323 (5.3%) |
| 75 Years and over | 196 (8.1%) | 581 (13.7%) |
Disability Class: Cognitive Difficulty
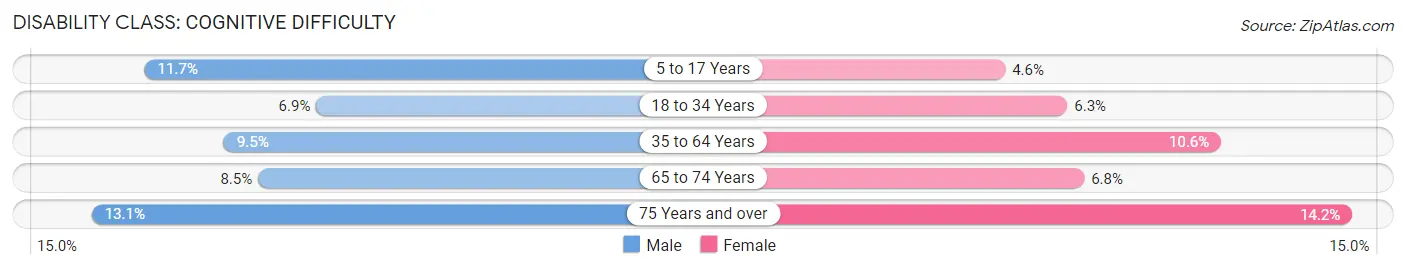
| Age Bracket | Male | Female |
| 5 to 17 Years | 1,312 (11.7%) | 477 (4.5%) |
| 18 to 34 Years | 1,581 (6.9%) | 1,616 (6.3%) |
| 35 to 64 Years | 2,184 (9.5%) | 2,463 (10.6%) |
| 65 to 74 Years | 449 (8.5%) | 411 (6.8%) |
| 75 Years and over | 319 (13.1%) | 605 (14.2%) |
Disability Class: Ambulatory Difficulty
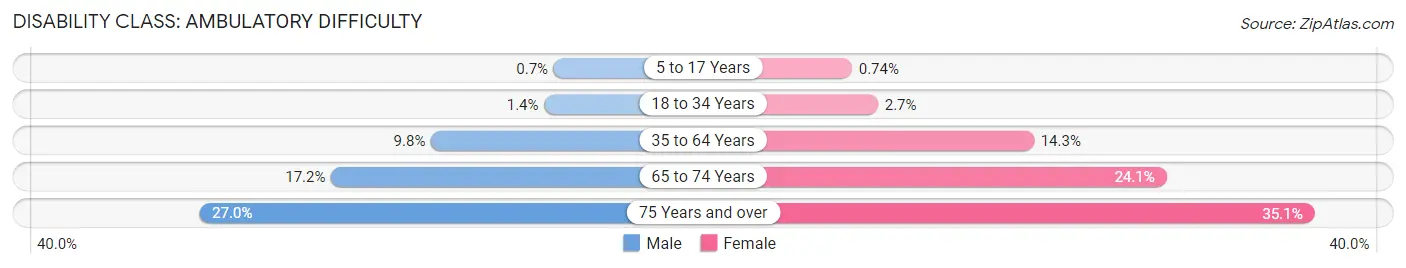
| Age Bracket | Male | Female |
| 5 to 17 Years | 79 (0.7%) | 78 (0.7%) |
| 18 to 34 Years | 323 (1.4%) | 687 (2.7%) |
| 35 to 64 Years | 2,268 (9.8%) | 3,323 (14.2%) |
| 65 to 74 Years | 910 (17.2%) | 1,469 (24.1%) |
| 75 Years and over | 657 (27.0%) | 1,494 (35.1%) |
Disability Class: Self-Care Difficulty
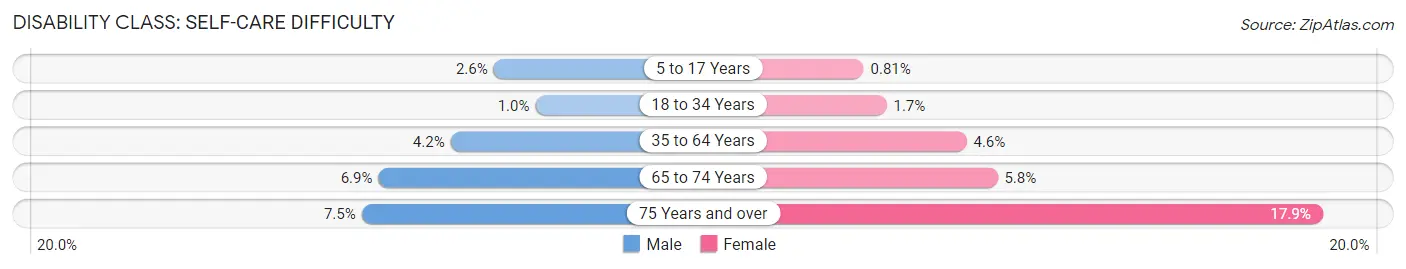
| Age Bracket | Male | Female |
| 5 to 17 Years | 291 (2.6%) | 85 (0.8%) |
| 18 to 34 Years | 238 (1.0%) | 427 (1.7%) |
| 35 to 64 Years | 968 (4.2%) | 1,079 (4.6%) |
| 65 to 74 Years | 363 (6.9%) | 352 (5.8%) |
| 75 Years and over | 182 (7.5%) | 760 (17.8%) |
Technology Access in Syracuse
Computing Device Access in Syracuse
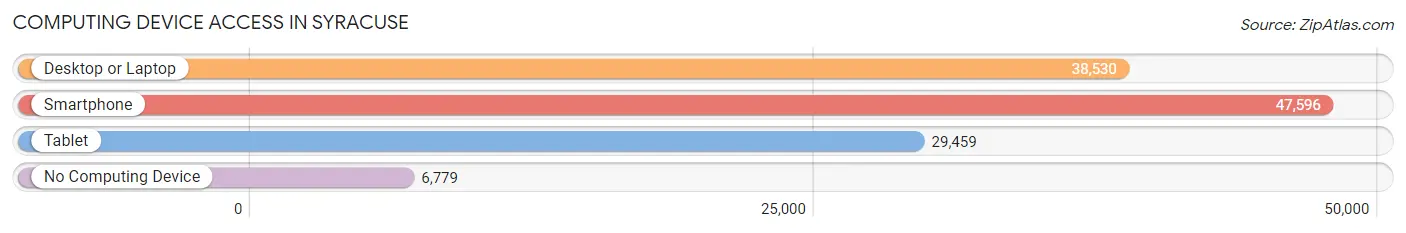
| Device Type | # Households | % Households |
| Desktop or Laptop | 38,530 | 65.9% |
| Smartphone | 47,596 | 81.5% |
| Tablet | 29,459 | 50.4% |
| No Computing Device | 6,779 | 11.6% |
| Total | 58,424 | 100.0% |
Internet Access in Syracuse
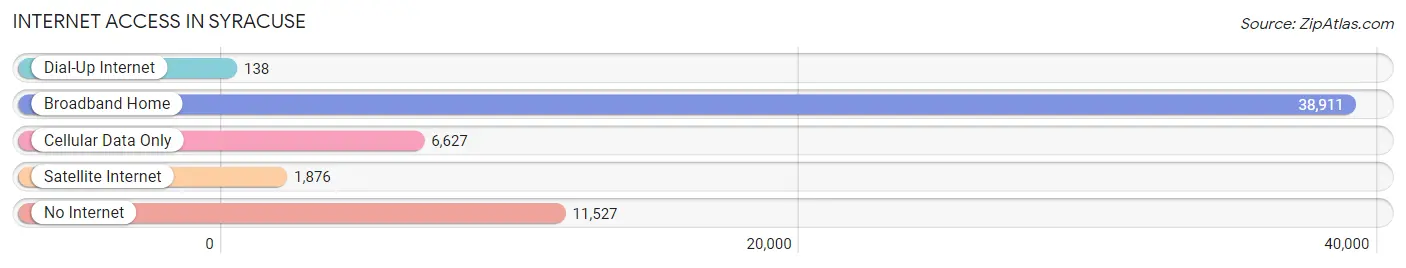
| Internet Type | # Households | % Households |
| Dial-Up Internet | 138 | 0.2% |
| Broadband Home | 38,911 | 66.6% |
| Cellular Data Only | 6,627 | 11.3% |
| Satellite Internet | 1,876 | 3.2% |
| No Internet | 11,527 | 19.7% |
| Total | 58,424 | 100.0% |
Syracuse Summary
Syracuse is a city located in the state of New York in the United States. It is the fifth most populous city in the state and the county seat of Onondaga County. Syracuse is located in the Finger Lakes region of New York and is the economic and educational hub of Central New York. The city has a population of 145,170 as of the 2010 census, making it the largest city in Upstate New York.
History
Syracuse was founded in 1788 by a group of settlers from the town of Onondaga. The settlers named the city after the Greek city of Syracuse, which was the birthplace of Archimedes. The city was incorporated in 1848 and quickly became an important transportation hub due to its location at the junction of the Erie Canal and the Oswego Canal. The city was also a major manufacturing center during the 19th century, producing a variety of products including salt, paper, and textiles.
In the 20th century, Syracuse experienced a period of economic decline due to the decline of manufacturing in the region. The city was also affected by the Great Depression and World War II. However, the city has since experienced a resurgence in recent years, with a focus on technology, education, and healthcare.
Geography
Syracuse is located in the Finger Lakes region of New York, at the northern end of Onondaga Lake. The city is situated at the junction of the Oswego and Seneca Rivers, and is surrounded by rolling hills and forests. The city has a total area of 25.3 square miles, of which 24.9 square miles is land and 0.4 square miles is water.
The climate in Syracuse is classified as humid continental, with cold, snowy winters and warm, humid summers. The average annual temperature is around 48°F, with an average high of around 70°F in the summer and an average low of around 25°F in the winter.
Economy
Syracuse has a diverse economy, with a focus on technology, education, healthcare, and manufacturing. The city is home to several major employers, including Syracuse University, Upstate Medical University, Lockheed Martin, and Syracuse Research Corporation. The city is also home to several major corporations, including Carrier Corporation, Anaren, and Welch Allyn.
The city has a strong tourism industry, with attractions such as the Erie Canal Museum, the Rosamond Gifford Zoo, and the Onondaga Lake Park. The city is also home to several major events, including the Great New York State Fair, the Syracuse Nationals, and the Syracuse International Film Festival.
Demographics
As of the 2010 census, the population of Syracuse was 145,170, with a population density of 5,717 people per square mile. The racial makeup of the city was 73.2% White, 17.2% African American, 0.4% Native American, 3.2% Asian, 0.1% Pacific Islander, and 5.9% from other races. The median household income was $33,945, and the median family income was $41,945.
The city has a large immigrant population, with over 10% of the population being foreign-born. The largest ethnic groups in the city are Italian (17.2%), Irish (14.2%), German (10.2%), and Polish (7.2%). The city also has a large student population, with over 30,000 students enrolled in Syracuse University and other local colleges and universities.
Common Questions
What is Per Capita Income in Syracuse?
Per Capita income in Syracuse is $26,472.
What is the Median Family Income in Syracuse?
Median Family Income in Syracuse is $54,860.
What is the Median Household income in Syracuse?
Median Household Income in Syracuse is $43,584.
What is Income or Wage Gap in Syracuse?
Income or Wage Gap in Syracuse is 15.0%.
Women in Syracuse earn 85.0 cents for every dollar earned by a man.
What is Family Income Deficit in Syracuse?
Family Income Deficit in Syracuse is $13,078.
Families that are below poverty line in Syracuse earn $13,078 less on average than the poverty threshold level.
What is Inequality or Gini Index in Syracuse?
Inequality or Gini Index in Syracuse is 0.50.
What is the Total Population of Syracuse?
Total Population of Syracuse is 146,134.
What is the Total Male Population of Syracuse?
Total Male Population of Syracuse is 70,588.
What is the Total Female Population of Syracuse?
Total Female Population of Syracuse is 75,546.
What is the Ratio of Males per 100 Females in Syracuse?
There are 93.44 Males per 100 Females in Syracuse.
What is the Ratio of Females per 100 Males in Syracuse?
There are 107.02 Females per 100 Males in Syracuse.
What is the Median Population Age in Syracuse?
Median Population Age in Syracuse is 31.9 Years.
What is the Average Family Size in Syracuse
Average Family Size in Syracuse is 3.1 People.
What is the Average Household Size in Syracuse
Average Household Size in Syracuse is 2.2 People.
How Large is the Labor Force in Syracuse?
There are 67,578 People in the Labor Forcein in Syracuse.
What is the Percentage of People in the Labor Force in Syracuse?
57.0% of People are in the Labor Force in Syracuse.
What is the Unemployment Rate in Syracuse?
Unemployment Rate in Syracuse is 8.6%.