Hauppauge, NY Map & Demographics
Hauppauge Map
Hauppauge Overview
$59,784
PER CAPITA INCOME
$161,053
AVG FAMILY INCOME
$138,156
AVG HOUSEHOLD INCOME
32.4%
WAGE / INCOME GAP [ % ]
67.6¢/ $1
WAGE / INCOME GAP [ $ ]
0.41
INEQUALITY / GINI INDEX
20,401
TOTAL POPULATION
10,240
MALE POPULATION
10,161
FEMALE POPULATION
100.78
MALES / 100 FEMALES
99.23
FEMALES / 100 MALES
43.4
MEDIAN AGE
3.4
AVG FAMILY SIZE
3.0
AVG HOUSEHOLD SIZE
11,344
LABOR FORCE [ PEOPLE ]
67.1%
PERCENT IN LABOR FORCE
5.1%
UNEMPLOYMENT RATE
Hauppauge Zip Codes
Income in Hauppauge
Income Overview in Hauppauge
Per Capita Income in Hauppauge is $59,784, while median incomes of families and households are $161,053 and $138,156 respectively.
| Characteristic | Number | Measure |
| Per Capita Income | 20,401 | $59,784 |
| Median Family Income | 5,246 | $161,053 |
| Mean Family Income | 5,246 | $189,646 |
| Median Household Income | 6,830 | $138,156 |
| Mean Household Income | 6,830 | $170,620 |
| Income Deficit | 5,246 | $0 |
| Wage / Income Gap (%) | 20,401 | 32.38% |
| Wage / Income Gap ($) | 20,401 | 67.62¢ per $1 |
| Gini / Inequality Index | 20,401 | 0.41 |
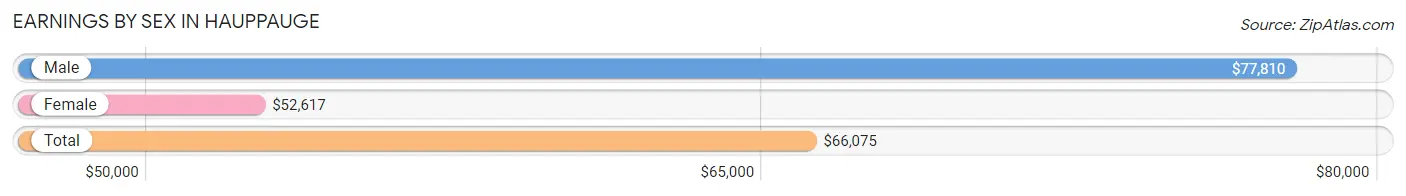
Earnings by Sex in Hauppauge
Average Earnings in Hauppauge are $66,075, $77,810 for men and $52,617 for women, a difference of 32.4%.
| Sex | Number | Average Earnings |
| Male | 6,090 (52.5%) | $77,810 |
| Female | 5,514 (47.5%) | $52,617 |
| Total | 11,604 (100.0%) | $66,075 |
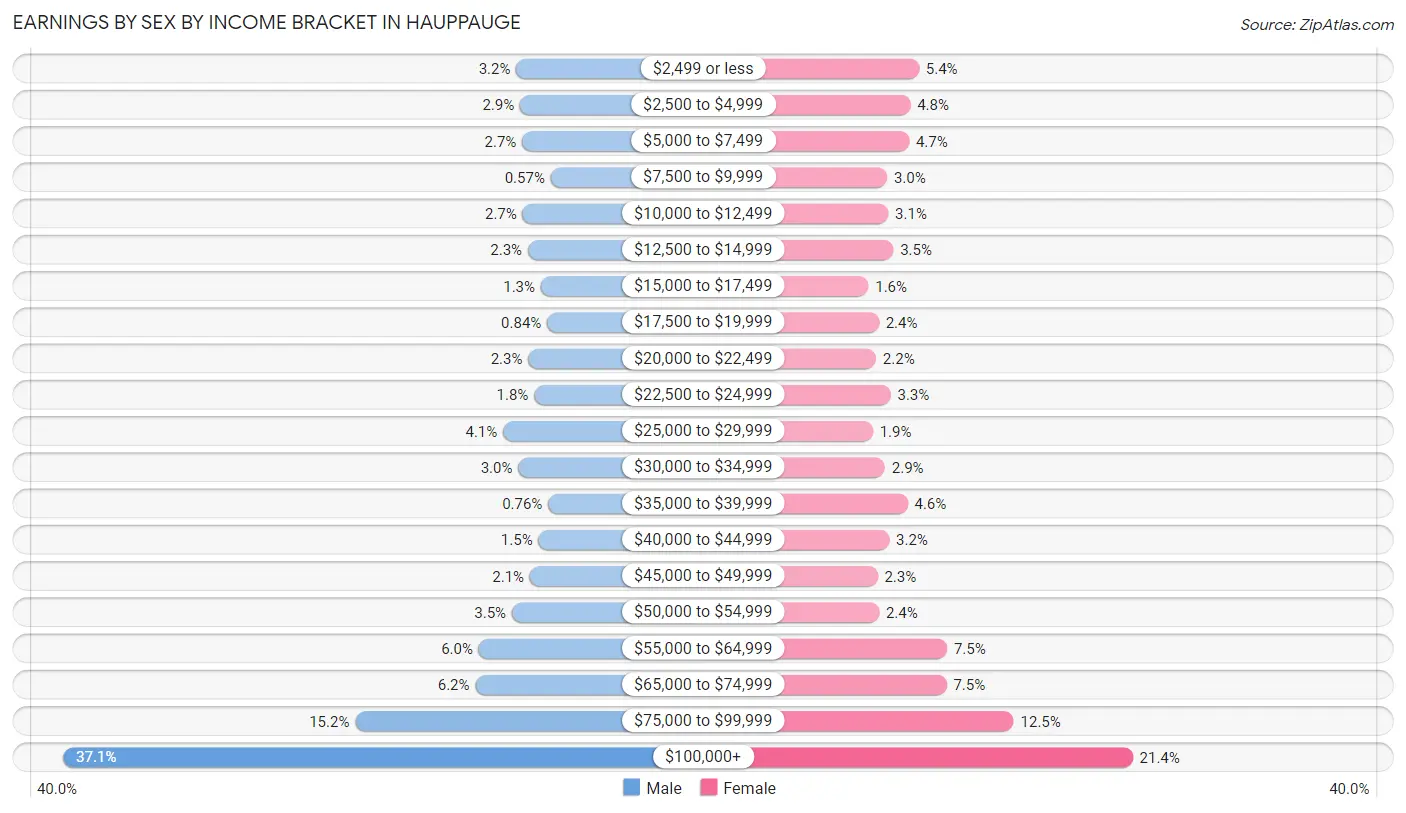
Earnings by Sex by Income Bracket in Hauppauge
The most common earnings brackets in Hauppauge are $100,000+ for men (2,260 | 37.1%) and $100,000+ for women (1,181 | 21.4%).
| Income | Male | Female |
| $2,499 or less | 192 (3.2%) | 298 (5.4%) |
| $2,500 to $4,999 | 175 (2.9%) | 262 (4.8%) |
| $5,000 to $7,499 | 165 (2.7%) | 257 (4.7%) |
| $7,500 to $9,999 | 35 (0.6%) | 166 (3.0%) |
| $10,000 to $12,499 | 163 (2.7%) | 171 (3.1%) |
| $12,500 to $14,999 | 139 (2.3%) | 192 (3.5%) |
| $15,000 to $17,499 | 80 (1.3%) | 89 (1.6%) |
| $17,500 to $19,999 | 51 (0.8%) | 132 (2.4%) |
| $20,000 to $22,499 | 137 (2.2%) | 120 (2.2%) |
| $22,500 to $24,999 | 110 (1.8%) | 181 (3.3%) |
| $25,000 to $29,999 | 252 (4.1%) | 107 (1.9%) |
| $30,000 to $34,999 | 183 (3.0%) | 157 (2.9%) |
| $35,000 to $39,999 | 46 (0.8%) | 251 (4.5%) |
| $40,000 to $44,999 | 91 (1.5%) | 175 (3.2%) |
| $45,000 to $49,999 | 130 (2.1%) | 127 (2.3%) |
| $50,000 to $54,999 | 212 (3.5%) | 133 (2.4%) |
| $55,000 to $64,999 | 363 (6.0%) | 414 (7.5%) |
| $65,000 to $74,999 | 379 (6.2%) | 412 (7.5%) |
| $75,000 to $99,999 | 927 (15.2%) | 689 (12.5%) |
| $100,000+ | 2,260 (37.1%) | 1,181 (21.4%) |
| Total | 6,090 (100.0%) | 5,514 (100.0%) |
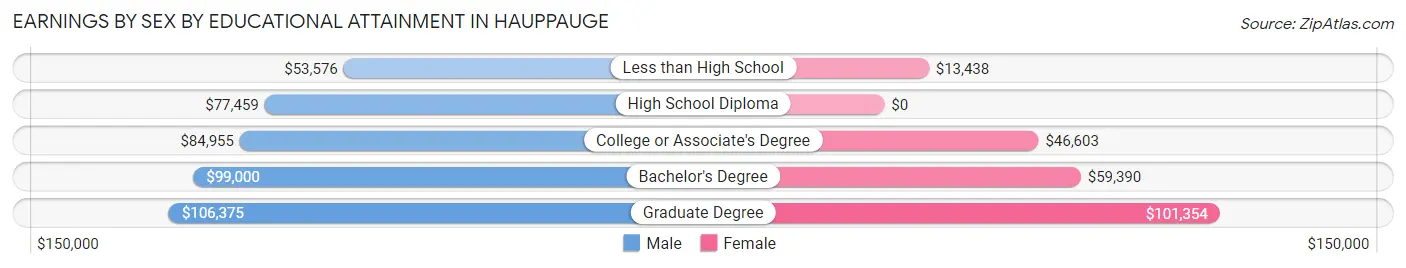
Earnings by Sex by Educational Attainment in Hauppauge
Average earnings in Hauppauge are $88,238 for men and $64,576 for women, a difference of 26.8%. Men with an educational attainment of graduate degree enjoy the highest average annual earnings of $106,375, while those with less than high school education earn the least with $53,576. Women with an educational attainment of graduate degree earn the most with the average annual earnings of $101,354, while those with less than high school education have the smallest earnings of $13,438.
| Educational Attainment | Male Income | Female Income |
| Less than High School | $53,576 | $13,438 |
| High School Diploma | $77,459 | $0 |
| College or Associate's Degree | $84,955 | $46,603 |
| Bachelor's Degree | $99,000 | $59,390 |
| Graduate Degree | $106,375 | $101,354 |
| Total | $88,238 | $64,576 |
Family Income in Hauppauge
Family Income Brackets in Hauppauge
According to the Hauppauge family income data, there are 1,946 families falling into the $200,000+ income range, which is the most common income bracket and makes up 37.1% of all families. Conversely, the $25,000 to $34,999 income bracket is the least frequent group with only 37 families (0.7%) belonging to this category.
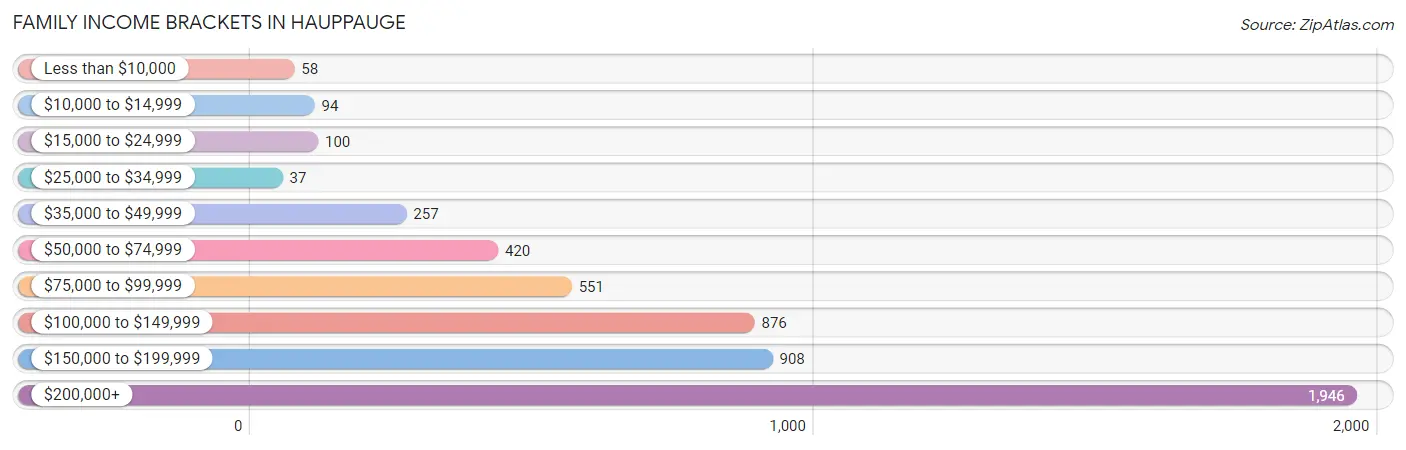
| Income Bracket | # Families | % Families |
| Less than $10,000 | 58 | 1.1% |
| $10,000 to $14,999 | 94 | 1.8% |
| $15,000 to $24,999 | 100 | 1.9% |
| $25,000 to $34,999 | 37 | 0.7% |
| $35,000 to $49,999 | 257 | 4.9% |
| $50,000 to $74,999 | 420 | 8.0% |
| $75,000 to $99,999 | 551 | 10.5% |
| $100,000 to $149,999 | 876 | 16.7% |
| $150,000 to $199,999 | 908 | 17.3% |
| $200,000+ | 1,946 | 37.1% |
Family Income by Famaliy Size in Hauppauge
5-person families (405 | 7.7%) account for the highest median family income in Hauppauge with $191,979 per family, while 3-person families (1,234 | 23.5%) have the highest median income of $61,927 per family member.
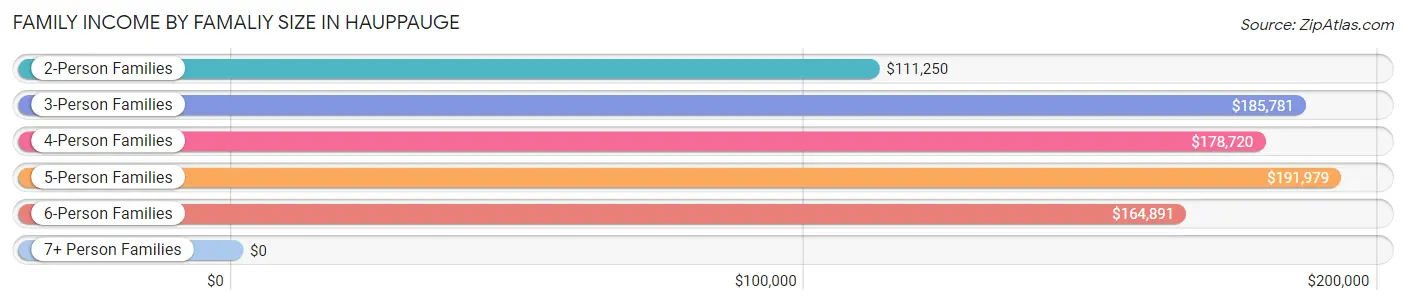
| Income Bracket | # Families | Median Income |
| 2-Person Families | 2,175 (41.5%) | $111,250 |
| 3-Person Families | 1,234 (23.5%) | $185,781 |
| 4-Person Families | 1,237 (23.6%) | $178,720 |
| 5-Person Families | 405 (7.7%) | $191,979 |
| 6-Person Families | 78 (1.5%) | $164,891 |
| 7+ Person Families | 117 (2.2%) | $0 |
| Total | 5,246 (100.0%) | $161,053 |
Family Income by Number of Earners in Hauppauge
The median family income in Hauppauge is $161,053, with families comprising 3+ earners (1,129) having the highest median family income of $238,125, while families with no earners (714) have the lowest median family income of $66,000, accounting for 21.5% and 13.6% of families, respectively.
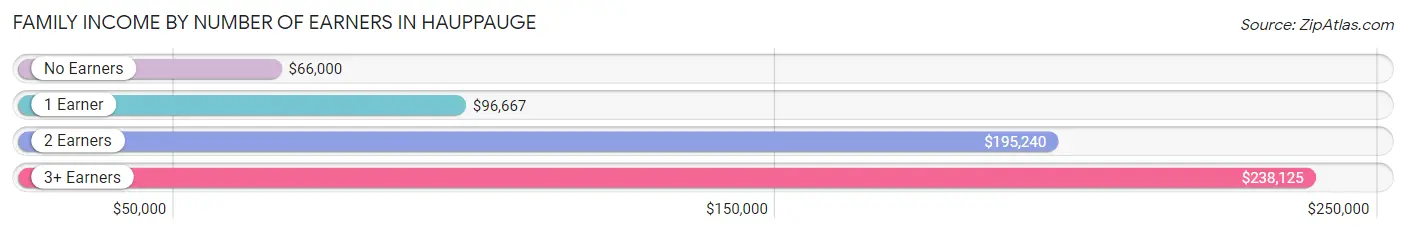
| Number of Earners | # Families | Median Income |
| No Earners | 714 (13.6%) | $66,000 |
| 1 Earner | 1,458 (27.8%) | $96,667 |
| 2 Earners | 1,945 (37.1%) | $195,240 |
| 3+ Earners | 1,129 (21.5%) | $238,125 |
| Total | 5,246 (100.0%) | $161,053 |
Household Income in Hauppauge
Household Income Brackets in Hauppauge
With 2,124 households falling in the category, the $200,000+ income range is the most frequent in Hauppauge, accounting for 31.1% of all households. In contrast, only 96 households (1.4%) fall into the $10,000 to $14,999 income bracket, making it the least populous group.
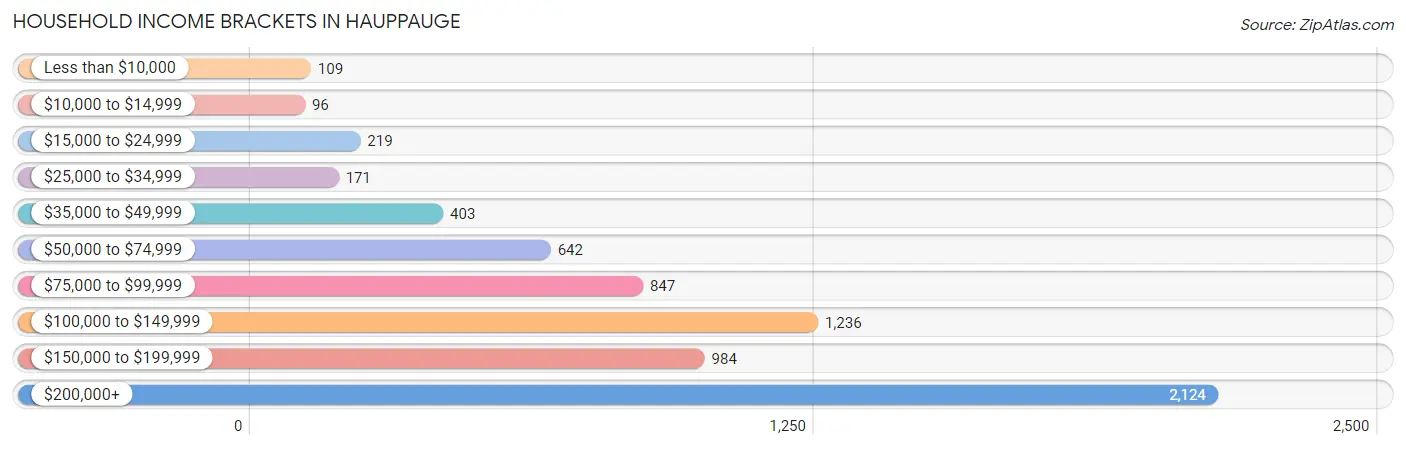
| Income Bracket | # Households | % Households |
| Less than $10,000 | 109 | 1.6% |
| $10,000 to $14,999 | 96 | 1.4% |
| $15,000 to $24,999 | 219 | 3.2% |
| $25,000 to $34,999 | 171 | 2.5% |
| $35,000 to $49,999 | 403 | 5.9% |
| $50,000 to $74,999 | 642 | 9.4% |
| $75,000 to $99,999 | 847 | 12.4% |
| $100,000 to $149,999 | 1,236 | 18.1% |
| $150,000 to $199,999 | 984 | 14.4% |
| $200,000+ | 2,124 | 31.1% |
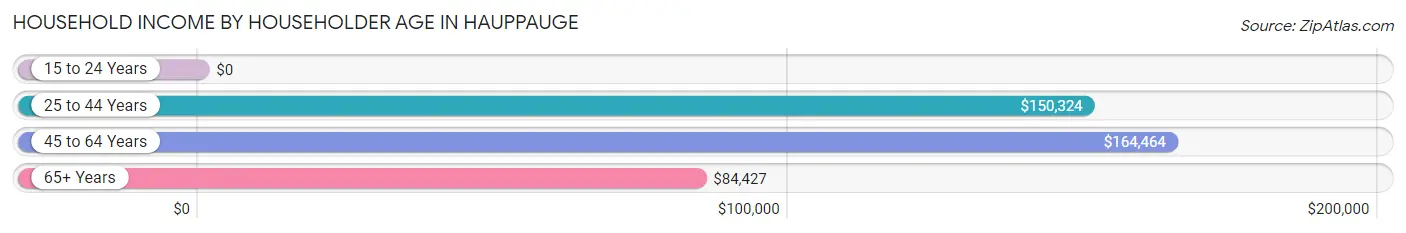
Household Income by Householder Age in Hauppauge
The median household income in Hauppauge is $138,156, with the highest median household income of $164,464 found in the 45 to 64 years age bracket for the primary householder. A total of 3,245 households (47.5%) fall into this category. Meanwhile, the 15 to 24 years age bracket for the primary householder has the lowest median household income of $0, with 64 households (0.9%) in this group.
| Income Bracket | # Households | Median Income |
| 15 to 24 Years | 64 (0.9%) | $0 |
| 25 to 44 Years | 1,517 (22.2%) | $150,324 |
| 45 to 64 Years | 3,245 (47.5%) | $164,464 |
| 65+ Years | 2,004 (29.3%) | $84,427 |
| Total | 6,830 (100.0%) | $138,156 |
Poverty in Hauppauge
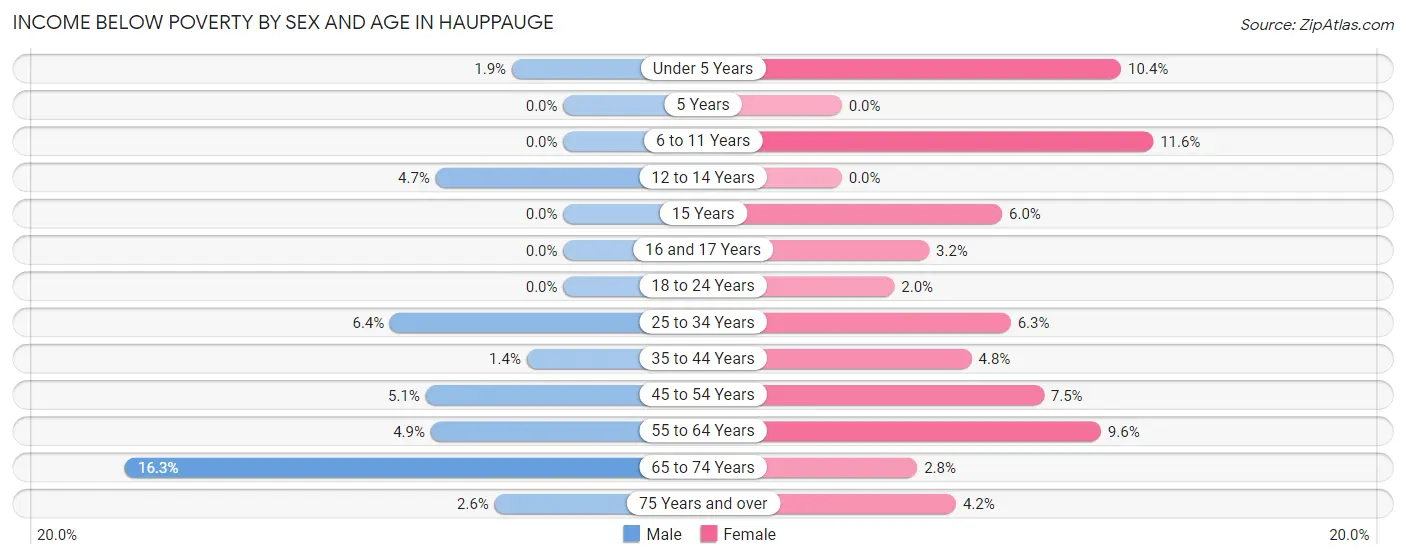
Income Below Poverty by Sex and Age in Hauppauge
With 4.6% poverty level for males and 6.2% for females among the residents of Hauppauge, 65 to 74 year old males and 6 to 11 year old females are the most vulnerable to poverty, with 180 males (16.3%) and 66 females (11.6%) in their respective age groups living below the poverty level.
| Age Bracket | Male | Female |
| Under 5 Years | 12 (1.9%) | 62 (10.4%) |
| 5 Years | 0 (0.0%) | 0 (0.0%) |
| 6 to 11 Years | 0 (0.0%) | 66 (11.6%) |
| 12 to 14 Years | 12 (4.7%) | 0 (0.0%) |
| 15 Years | 0 (0.0%) | 10 (5.9%) |
| 16 and 17 Years | 0 (0.0%) | 11 (3.2%) |
| 18 to 24 Years | 0 (0.0%) | 19 (1.9%) |
| 25 to 34 Years | 72 (6.4%) | 71 (6.3%) |
| 35 to 44 Years | 15 (1.4%) | 52 (4.8%) |
| 45 to 54 Years | 76 (5.1%) | 110 (7.5%) |
| 55 to 64 Years | 86 (4.9%) | 166 (9.6%) |
| 65 to 74 Years | 180 (16.3%) | 24 (2.8%) |
| 75 Years and over | 17 (2.5%) | 37 (4.2%) |
| Total | 470 (4.6%) | 628 (6.2%) |
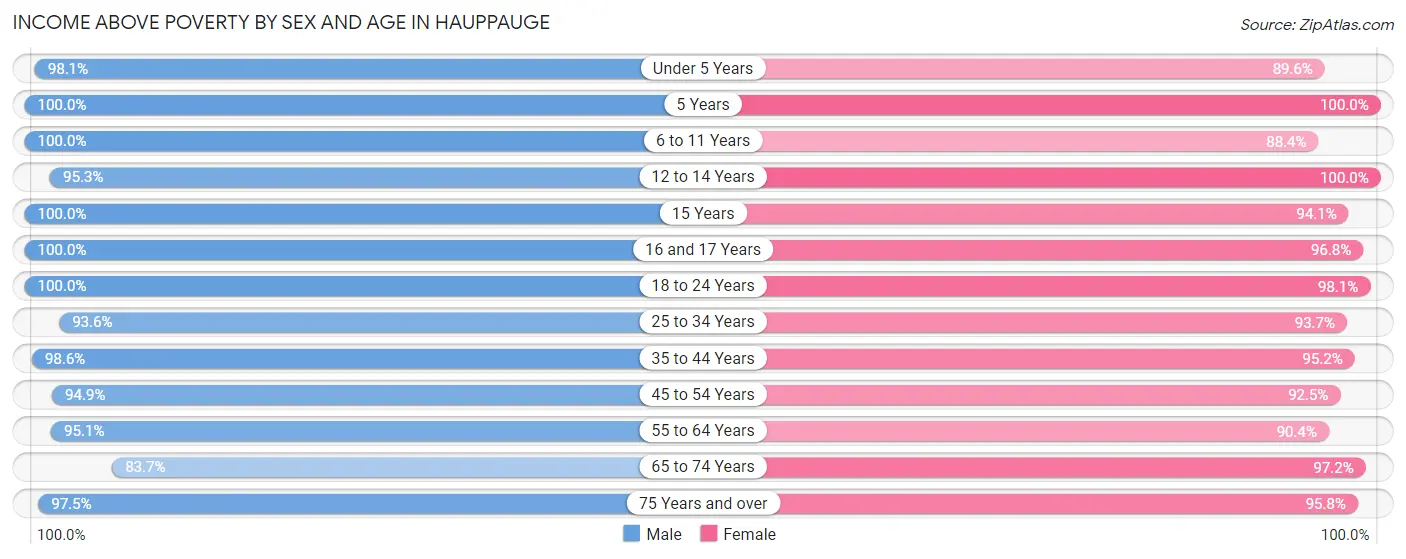
Income Above Poverty by Sex and Age in Hauppauge
According to the poverty statistics in Hauppauge, males aged 5 years and females aged 5 years are the age groups that are most secure financially, with 100.0% of males and 100.0% of females in these age groups living above the poverty line.
| Age Bracket | Male | Female |
| Under 5 Years | 616 (98.1%) | 536 (89.6%) |
| 5 Years | 10 (100.0%) | 25 (100.0%) |
| 6 to 11 Years | 727 (100.0%) | 505 (88.4%) |
| 12 to 14 Years | 241 (95.3%) | 339 (100.0%) |
| 15 Years | 124 (100.0%) | 158 (94.1%) |
| 16 and 17 Years | 181 (100.0%) | 329 (96.8%) |
| 18 to 24 Years | 1,035 (100.0%) | 953 (98.1%) |
| 25 to 34 Years | 1,048 (93.6%) | 1,062 (93.7%) |
| 35 to 44 Years | 1,091 (98.6%) | 1,026 (95.2%) |
| 45 to 54 Years | 1,412 (94.9%) | 1,356 (92.5%) |
| 55 to 64 Years | 1,661 (95.1%) | 1,560 (90.4%) |
| 65 to 74 Years | 926 (83.7%) | 833 (97.2%) |
| 75 Years and over | 649 (97.5%) | 835 (95.8%) |
| Total | 9,721 (95.4%) | 9,517 (93.8%) |
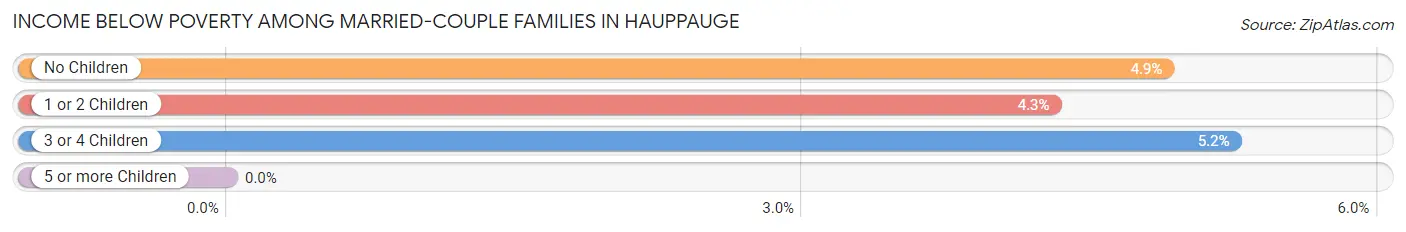
Income Below Poverty Among Married-Couple Families in Hauppauge
The poverty statistics for married-couple families in Hauppauge show that 4.7% or 204 of the total 4,320 families live below the poverty line. Families with 3 or 4 children have the highest poverty rate of 5.2%, comprising of 11 families. On the other hand, families with 1 or 2 children have the lowest poverty rate of 4.3%, which includes 59 families.
| Children | Above Poverty | Below Poverty |
| No Children | 2,604 (95.1%) | 134 (4.9%) |
| 1 or 2 Children | 1,313 (95.7%) | 59 (4.3%) |
| 3 or 4 Children | 199 (94.8%) | 11 (5.2%) |
| 5 or more Children | 0 (0.0%) | 0 (0.0%) |
| Total | 4,116 (95.3%) | 204 (4.7%) |
Income Below Poverty Among Single-Parent Households in Hauppauge
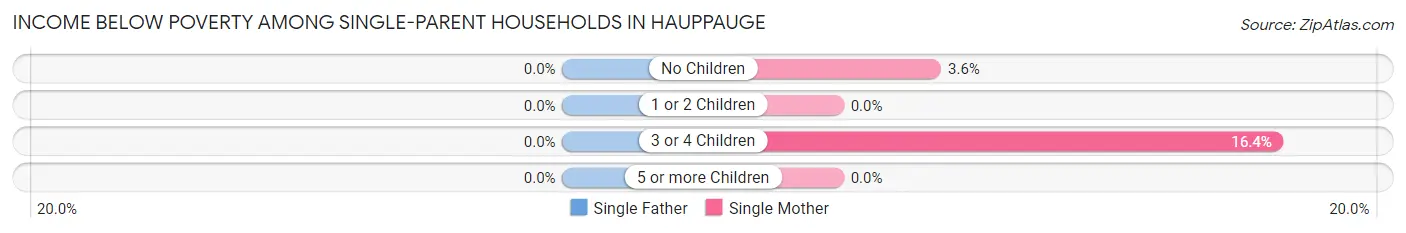
| Children | Single Father | Single Mother |
| No Children | 0 (0.0%) | 9 (3.6%) |
| 1 or 2 Children | 0 (0.0%) | 0 (0.0%) |
| 3 or 4 Children | 0 (0.0%) | 10 (16.4%) |
| 5 or more Children | 0 (0.0%) | 0 (0.0%) |
| Total | 0 (0.0%) | 19 (3.4%) |
Income Below Poverty Among Married-Couple vs Single-Parent Households in Hauppauge
The poverty data for Hauppauge shows that 204 of the married-couple family households (4.7%) and 19 of the single-parent households (2.1%) are living below the poverty level. Within the married-couple family households, those with 3 or 4 children have the highest poverty rate, with 11 households (5.2%) falling below the poverty line. Among the single-parent households, those with 3 or 4 children have the highest poverty rate, with 10 household (12.2%) living below poverty.
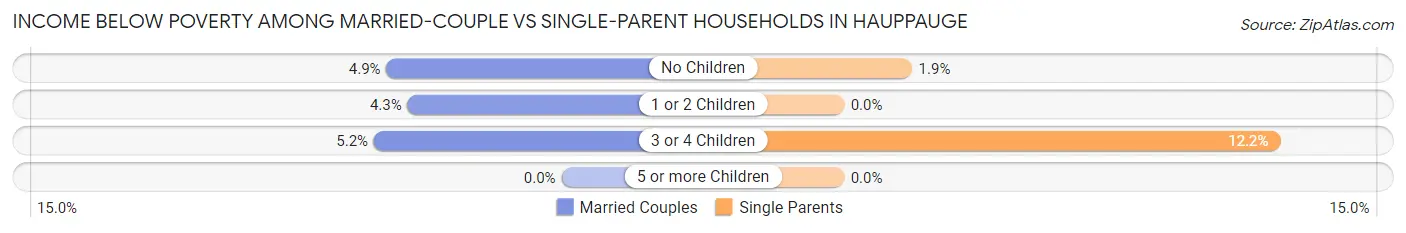
| Children | Married-Couple Families | Single-Parent Households |
| No Children | 134 (4.9%) | 9 (1.9%) |
| 1 or 2 Children | 59 (4.3%) | 0 (0.0%) |
| 3 or 4 Children | 11 (5.2%) | 10 (12.2%) |
| 5 or more Children | 0 (0.0%) | 0 (0.0%) |
| Total | 204 (4.7%) | 19 (2.1%) |
Race in Hauppauge
The most populous races in Hauppauge are White / Caucasian (16,630 | 81.5%), Hispanic or Latino (2,346 | 11.5%), and Asian (1,638 | 8.0%).
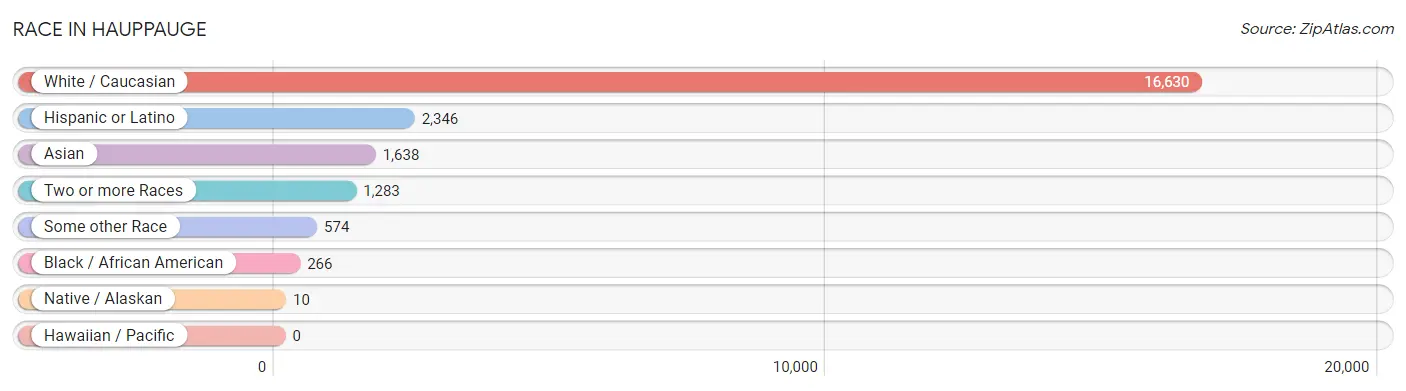
| Race | # Population | % Population |
| Asian | 1,638 | 8.0% |
| Black / African American | 266 | 1.3% |
| Hawaiian / Pacific | 0 | 0.0% |
| Hispanic or Latino | 2,346 | 11.5% |
| Native / Alaskan | 10 | 0.1% |
| White / Caucasian | 16,630 | 81.5% |
| Two or more Races | 1,283 | 6.3% |
| Some other Race | 574 | 2.8% |
| Total | 20,401 | 100.0% |
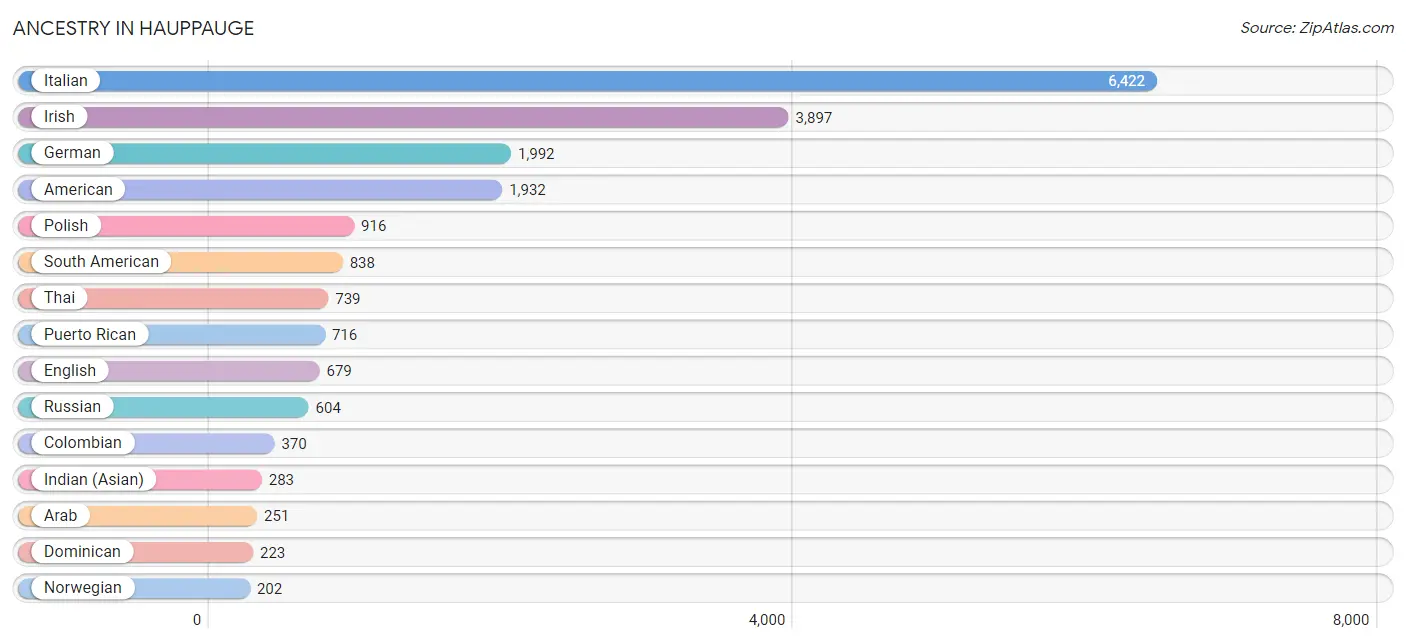
Ancestry in Hauppauge
The most populous ancestries reported in Hauppauge are Italian (6,422 | 31.5%), Irish (3,897 | 19.1%), German (1,992 | 9.8%), American (1,932 | 9.5%), and Polish (916 | 4.5%), together accounting for 74.3% of all Hauppauge residents.
| Ancestry | # Population | % Population |
| Afghan | 1 | 0.0% |
| African | 58 | 0.3% |
| Albanian | 57 | 0.3% |
| American | 1,932 | 9.5% |
| Arab | 251 | 1.2% |
| Argentinean | 51 | 0.3% |
| Armenian | 27 | 0.1% |
| Austrian | 82 | 0.4% |
| Belgian | 35 | 0.2% |
| Bhutanese | 1 | 0.0% |
| British | 41 | 0.2% |
| Burmese | 42 | 0.2% |
| Canadian | 7 | 0.0% |
| Central American | 140 | 0.7% |
| Chilean | 104 | 0.5% |
| Colombian | 370 | 1.8% |
| Croatian | 18 | 0.1% |
| Cuban | 59 | 0.3% |
| Czechoslovakian | 44 | 0.2% |
| Danish | 8 | 0.0% |
| Dominican | 223 | 1.1% |
| Dutch | 34 | 0.2% |
| Eastern European | 63 | 0.3% |
| Ecuadorian | 158 | 0.8% |
| English | 679 | 3.3% |
| European | 95 | 0.5% |
| Finnish | 58 | 0.3% |
| French | 139 | 0.7% |
| French Canadian | 7 | 0.0% |
| German | 1,992 | 9.8% |
| Greek | 179 | 0.9% |
| Haitian | 16 | 0.1% |
| Honduran | 12 | 0.1% |
| Hungarian | 152 | 0.7% |
| Indian (Asian) | 283 | 1.4% |
| Iranian | 14 | 0.1% |
| Irish | 3,897 | 19.1% |
| Iroquois | 19 | 0.1% |
| Italian | 6,422 | 31.5% |
| Jordanian | 106 | 0.5% |
| Korean | 103 | 0.5% |
| Laotian | 68 | 0.3% |
| Lithuanian | 61 | 0.3% |
| Maltese | 135 | 0.7% |
| Mexican | 180 | 0.9% |
| Mongolian | 68 | 0.3% |
| Moroccan | 86 | 0.4% |
| Norwegian | 202 | 1.0% |
| Okinawan | 68 | 0.3% |
| Peruvian | 129 | 0.6% |
| Polish | 916 | 4.5% |
| Portuguese | 96 | 0.5% |
| Puerto Rican | 716 | 3.5% |
| Romanian | 91 | 0.4% |
| Russian | 604 | 3.0% |
| Salvadoran | 128 | 0.6% |
| Scottish | 181 | 0.9% |
| Slovak | 37 | 0.2% |
| South American | 838 | 4.1% |
| South American Indian | 9 | 0.0% |
| Soviet Union | 23 | 0.1% |
| Spaniard | 148 | 0.7% |
| Spanish | 17 | 0.1% |
| Subsaharan African | 58 | 0.3% |
| Swedish | 102 | 0.5% |
| Swiss | 34 | 0.2% |
| Thai | 739 | 3.6% |
| Trinidadian and Tobagonian | 12 | 0.1% |
| Turkish | 70 | 0.3% |
| Ukrainian | 101 | 0.5% |
| Venezuelan | 26 | 0.1% |
| Welsh | 70 | 0.3% |
| Yugoslavian | 29 | 0.1% | View All 73 Rows |
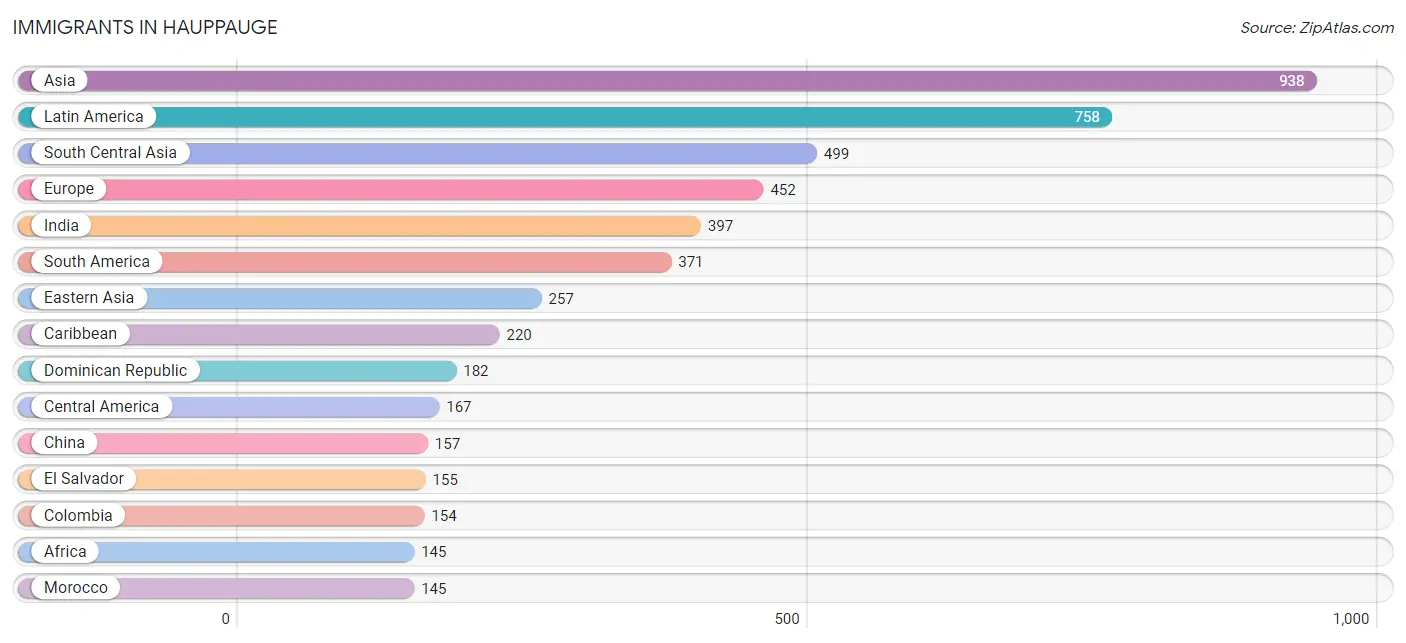
Immigrants in Hauppauge
The most numerous immigrant groups reported in Hauppauge came from Asia (938 | 4.6%), Latin America (758 | 3.7%), South Central Asia (499 | 2.5%), Europe (452 | 2.2%), and India (397 | 1.9%), together accounting for 14.9% of all Hauppauge residents.
| Immigration Origin | # Population | % Population |
| Afghanistan | 1 | 0.0% |
| Africa | 145 | 0.7% |
| Albania | 14 | 0.1% |
| Argentina | 38 | 0.2% |
| Asia | 938 | 4.6% |
| Bangladesh | 1 | 0.0% |
| Belarus | 17 | 0.1% |
| Canada | 13 | 0.1% |
| Caribbean | 220 | 1.1% |
| Central America | 167 | 0.8% |
| Chile | 33 | 0.2% |
| China | 157 | 0.8% |
| Colombia | 154 | 0.7% |
| Croatia | 18 | 0.1% |
| Dominican Republic | 182 | 0.9% |
| Eastern Asia | 257 | 1.3% |
| Eastern Europe | 129 | 0.6% |
| Ecuador | 27 | 0.1% |
| El Salvador | 155 | 0.8% |
| England | 60 | 0.3% |
| Europe | 452 | 2.2% |
| France | 11 | 0.1% |
| Germany | 82 | 0.4% |
| Guyana | 22 | 0.1% |
| Haiti | 16 | 0.1% |
| Honduras | 12 | 0.1% |
| Hong Kong | 28 | 0.1% |
| India | 397 | 1.9% |
| Iran | 14 | 0.1% |
| Ireland | 4 | 0.0% |
| Italy | 101 | 0.5% |
| Japan | 1 | 0.0% |
| Jordan | 67 | 0.3% |
| Korea | 99 | 0.5% |
| Latin America | 758 | 3.7% |
| Lithuania | 24 | 0.1% |
| Morocco | 145 | 0.7% |
| Northern Africa | 145 | 0.7% |
| Northern Europe | 64 | 0.3% |
| Pakistan | 83 | 0.4% |
| Peru | 85 | 0.4% |
| Poland | 14 | 0.1% |
| Portugal | 24 | 0.1% |
| Serbia | 8 | 0.0% |
| Singapore | 68 | 0.3% |
| South America | 371 | 1.8% |
| South Central Asia | 499 | 2.5% |
| South Eastern Asia | 115 | 0.6% |
| Southern Europe | 139 | 0.7% |
| Spain | 10 | 0.1% |
| Switzerland | 8 | 0.0% |
| Taiwan | 36 | 0.2% |
| Trinidad and Tobago | 22 | 0.1% |
| Uzbekistan | 3 | 0.0% |
| Vietnam | 47 | 0.2% |
| Western Asia | 67 | 0.3% |
| Western Europe | 101 | 0.5% | View All 57 Rows |
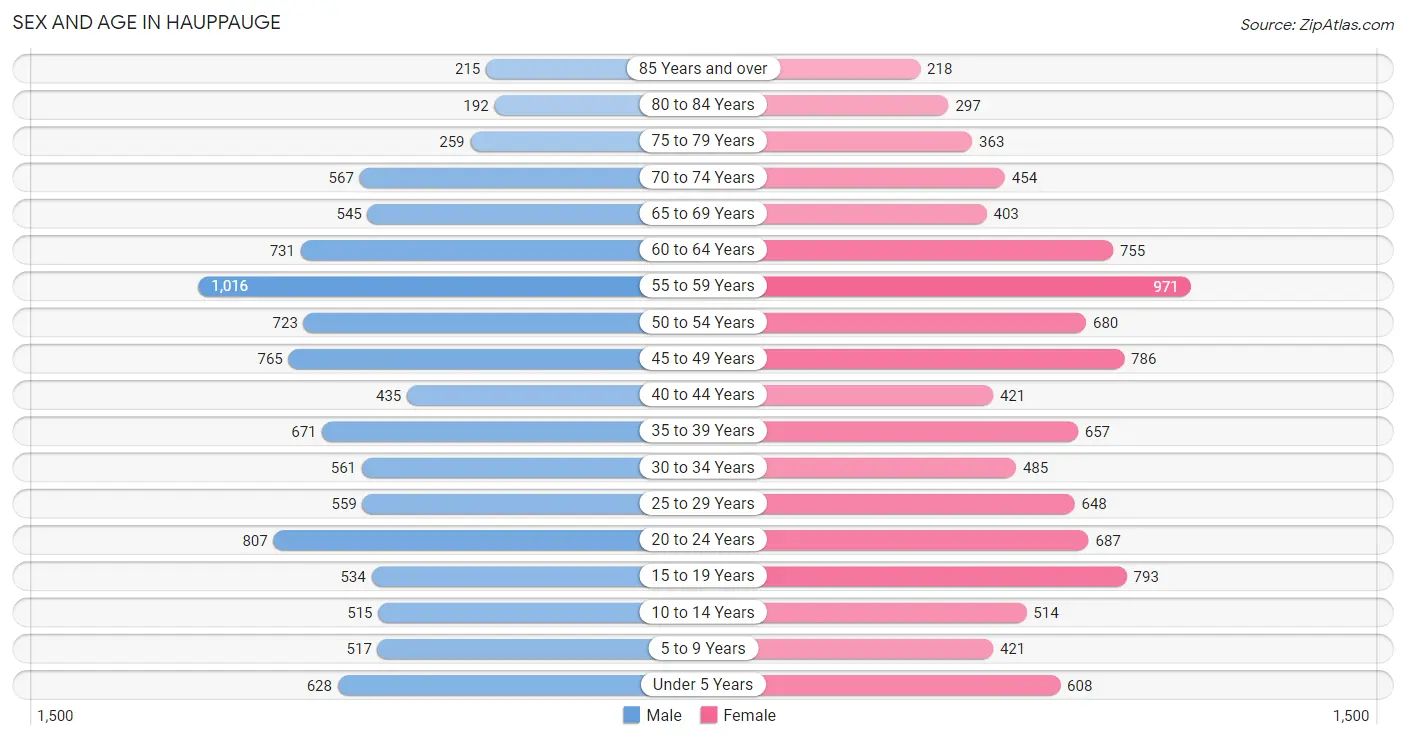
Sex and Age in Hauppauge
Sex and Age in Hauppauge
The most populous age groups in Hauppauge are 55 to 59 Years (1,016 | 9.9%) for men and 55 to 59 Years (971 | 9.6%) for women.
| Age Bracket | Male | Female |
| Under 5 Years | 628 (6.1%) | 608 (6.0%) |
| 5 to 9 Years | 517 (5.1%) | 421 (4.1%) |
| 10 to 14 Years | 515 (5.0%) | 514 (5.1%) |
| 15 to 19 Years | 534 (5.2%) | 793 (7.8%) |
| 20 to 24 Years | 807 (7.9%) | 687 (6.8%) |
| 25 to 29 Years | 559 (5.5%) | 648 (6.4%) |
| 30 to 34 Years | 561 (5.5%) | 485 (4.8%) |
| 35 to 39 Years | 671 (6.6%) | 657 (6.5%) |
| 40 to 44 Years | 435 (4.3%) | 421 (4.1%) |
| 45 to 49 Years | 765 (7.5%) | 786 (7.7%) |
| 50 to 54 Years | 723 (7.1%) | 680 (6.7%) |
| 55 to 59 Years | 1,016 (9.9%) | 971 (9.6%) |
| 60 to 64 Years | 731 (7.1%) | 755 (7.4%) |
| 65 to 69 Years | 545 (5.3%) | 403 (4.0%) |
| 70 to 74 Years | 567 (5.5%) | 454 (4.5%) |
| 75 to 79 Years | 259 (2.5%) | 363 (3.6%) |
| 80 to 84 Years | 192 (1.9%) | 297 (2.9%) |
| 85 Years and over | 215 (2.1%) | 218 (2.1%) |
| Total | 10,240 (100.0%) | 10,161 (100.0%) |
Families and Households in Hauppauge
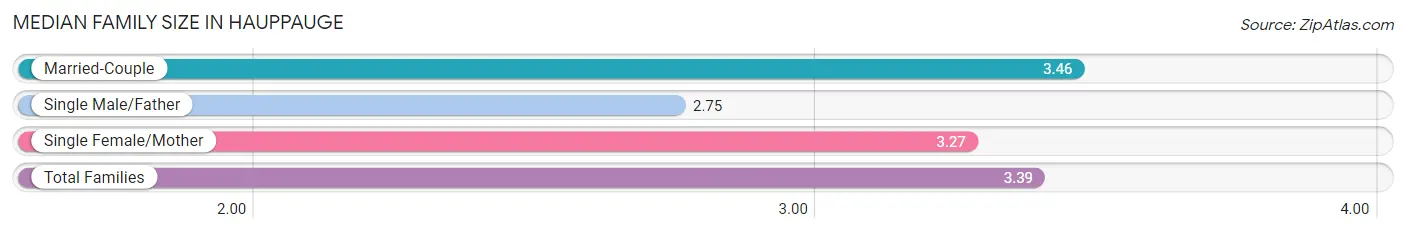
Median Family Size in Hauppauge
The median family size in Hauppauge is 3.39 persons per family, with married-couple families (4,320 | 82.4%) accounting for the largest median family size of 3.46 persons per family. On the other hand, single male/father families (374 | 7.1%) represent the smallest median family size with 2.75 persons per family.
| Family Type | # Families | Family Size |
| Married-Couple | 4,320 (82.4%) | 3.46 |
| Single Male/Father | 374 (7.1%) | 2.75 |
| Single Female/Mother | 552 (10.5%) | 3.27 |
| Total Families | 5,246 (100.0%) | 3.39 |
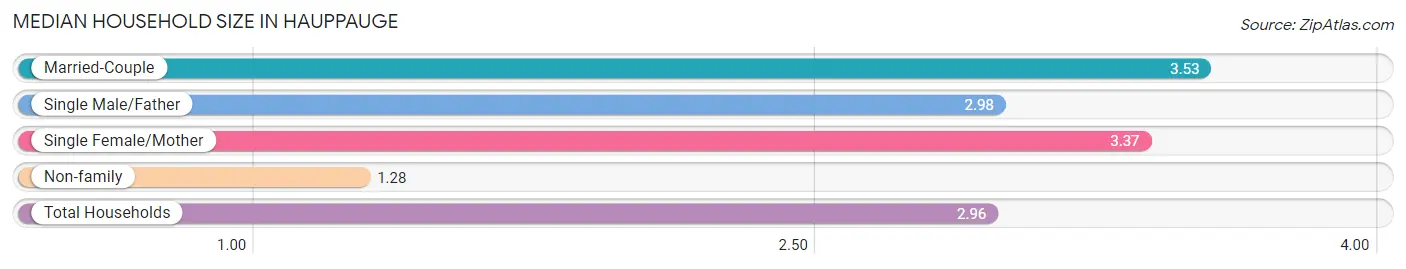
Median Household Size in Hauppauge
The median household size in Hauppauge is 2.96 persons per household, with married-couple households (4,320 | 63.2%) accounting for the largest median household size of 3.53 persons per household. non-family households (1,584 | 23.2%) represent the smallest median household size with 1.28 persons per household.
| Household Type | # Households | Household Size |
| Married-Couple | 4,320 (63.2%) | 3.53 |
| Single Male/Father | 374 (5.5%) | 2.98 |
| Single Female/Mother | 552 (8.1%) | 3.37 |
| Non-family | 1,584 (23.2%) | 1.28 |
| Total Households | 6,830 (100.0%) | 2.96 |
Household Size by Marriage Status in Hauppauge
Out of a total of 6,830 households in Hauppauge, 5,246 (76.8%) are family households, while 1,584 (23.2%) are nonfamily households. The most numerous type of family households are 2-person households, comprising 2,030, and the most common type of nonfamily households are 1-person households, comprising 1,225.
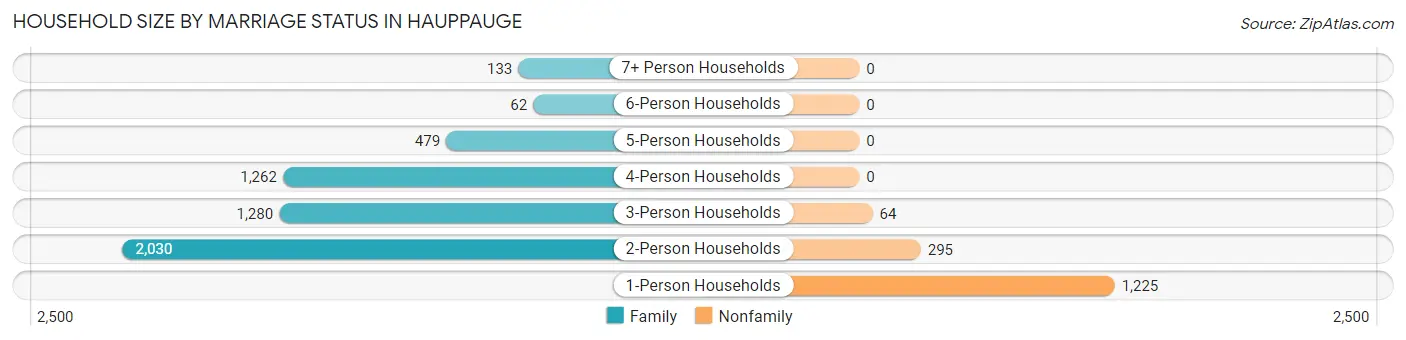
| Household Size | Family Households | Nonfamily Households |
| 1-Person Households | - | 1,225 (17.9%) |
| 2-Person Households | 2,030 (29.7%) | 295 (4.3%) |
| 3-Person Households | 1,280 (18.7%) | 64 (0.9%) |
| 4-Person Households | 1,262 (18.5%) | 0 (0.0%) |
| 5-Person Households | 479 (7.0%) | 0 (0.0%) |
| 6-Person Households | 62 (0.9%) | 0 (0.0%) |
| 7+ Person Households | 133 (1.9%) | 0 (0.0%) |
| Total | 5,246 (76.8%) | 1,584 (23.2%) |
Female Fertility in Hauppauge
Fertility by Age in Hauppauge
Average fertility rate in Hauppauge is 77.0 births per 1,000 women. Women in the age bracket of 35 to 50 years have the highest fertility rate with 119.0 births per 1,000 women. Women in the age bracket of 35 to 50 years acount for 65.9% of all women with births.
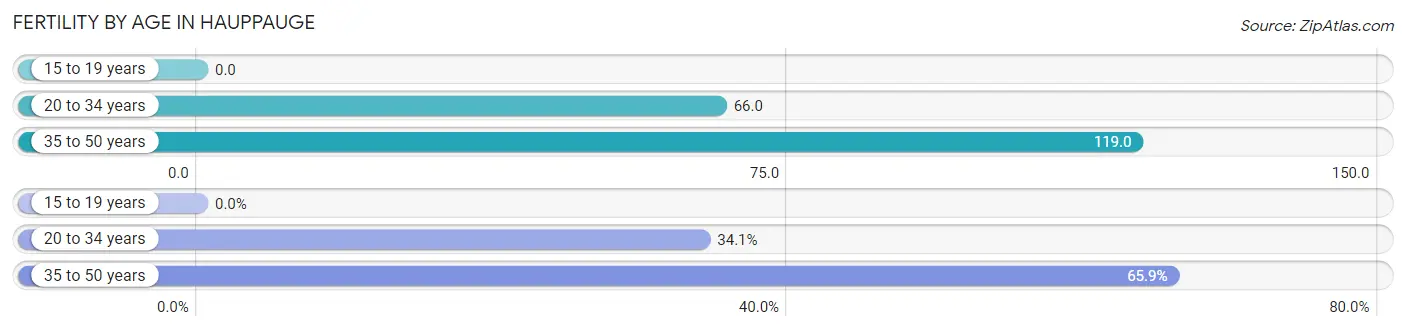
| Age Bracket | Women with Births | Births / 1,000 Women |
| 15 to 19 years | 0 (0.0%) | 0.0 |
| 20 to 34 years | 120 (34.1%) | 66.0 |
| 35 to 50 years | 232 (65.9%) | 119.0 |
| Total | 352 (100.0%) | 77.0 |
Fertility by Age by Marriage Status in Hauppauge
87.5% of women with births (352) in Hauppauge are married. The highest percentage of unmarried women with births falls into 20 to 34 years age bracket with 20.0% of them unmarried at the time of birth, while the lowest percentage of unmarried women with births belong to 35 to 50 years age bracket with 8.6% of them unmarried.
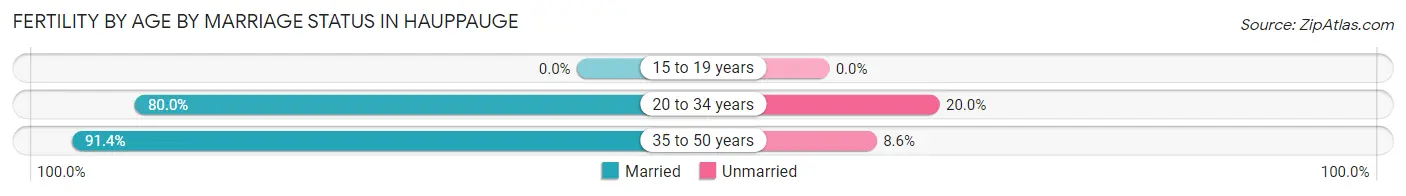
| Age Bracket | Married | Unmarried |
| 15 to 19 years | 0 (0.0%) | 0 (0.0%) |
| 20 to 34 years | 96 (80.0%) | 24 (20.0%) |
| 35 to 50 years | 212 (91.4%) | 20 (8.6%) |
| Total | 308 (87.5%) | 44 (12.5%) |
Fertility by Education in Hauppauge
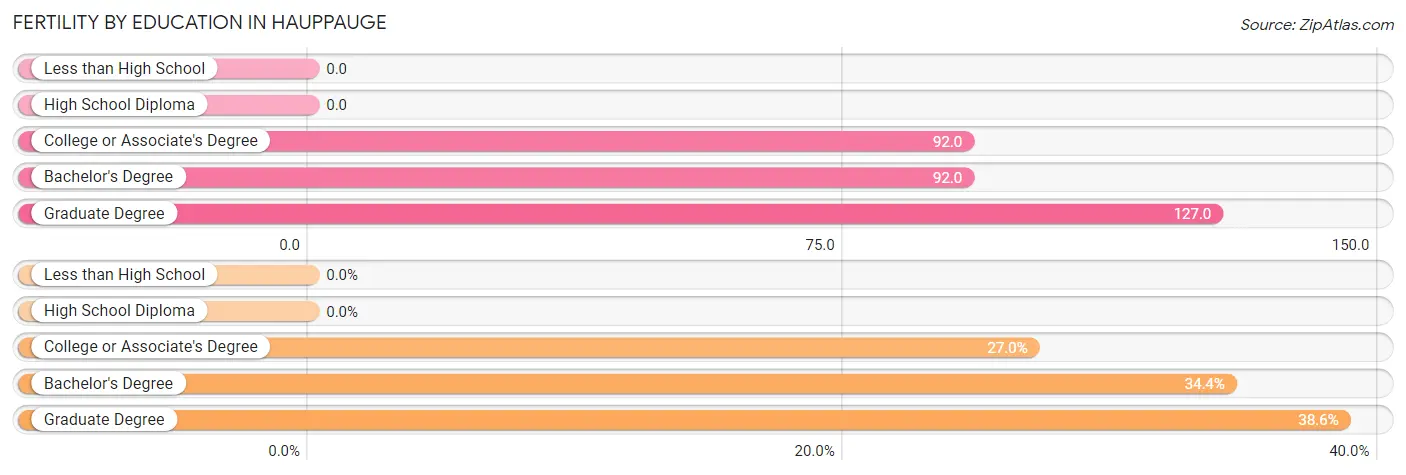
| Educational Attainment | Women with Births | Births / 1,000 Women |
| Less than High School | 0 (0.0%) | 0.0 |
| High School Diploma | 0 (0.0%) | 0.0 |
| College or Associate's Degree | 95 (27.0%) | 92.0 |
| Bachelor's Degree | 121 (34.4%) | 92.0 |
| Graduate Degree | 136 (38.6%) | 127.0 |
| Total | 352 (100.0%) | 77.0 |
Fertility by Education by Marriage Status in Hauppauge
12.5% of women with births in Hauppauge are unmarried. Women with the educational attainment of college or associate's degree are most likely to be married with 93.7% of them married at childbirth, while women with the educational attainment of graduate degree are least likely to be married with 19.9% of them unmarried at childbirth.
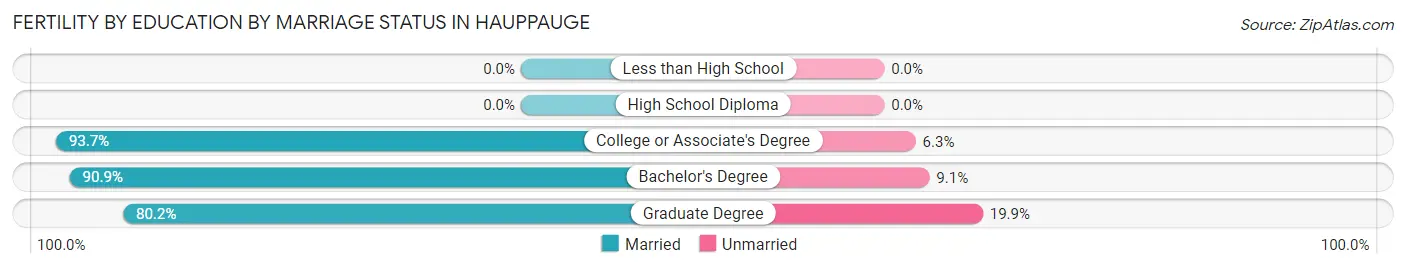
| Educational Attainment | Married | Unmarried |
| Less than High School | 0 (0.0%) | 0 (0.0%) |
| High School Diploma | 0 (0.0%) | 0 (0.0%) |
| College or Associate's Degree | 89 (93.7%) | 6 (6.3%) |
| Bachelor's Degree | 110 (90.9%) | 11 (9.1%) |
| Graduate Degree | 109 (80.1%) | 27 (19.9%) |
| Total | 308 (87.5%) | 44 (12.5%) |
Employment Characteristics in Hauppauge
Employment by Class of Employer in Hauppauge
Among the 10,503 employed individuals in Hauppauge, private company employees (6,800 | 64.7%), local government employees (1,461 | 13.9%), and not-for-profit organizations (679 | 6.5%) make up the most common classes of employment.
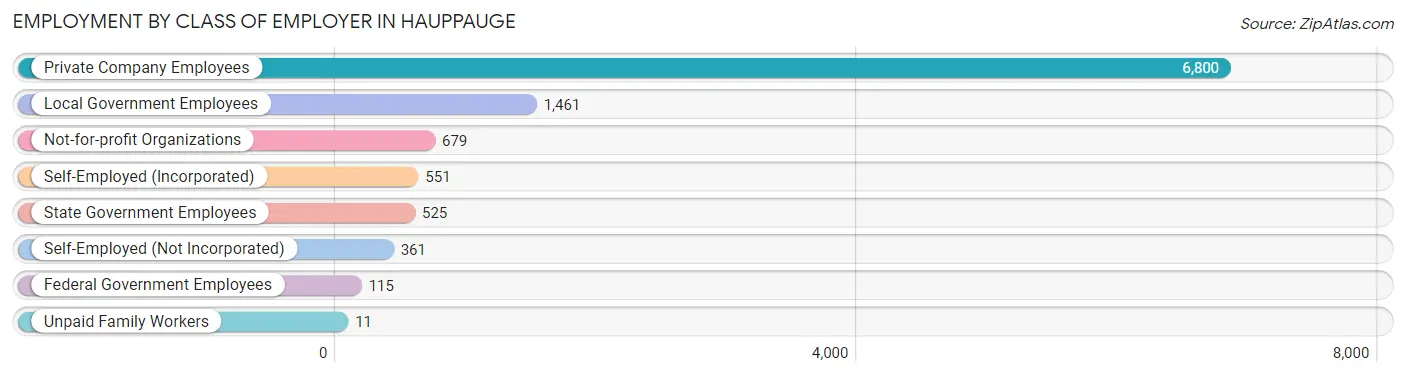
| Employer Class | # Employees | % Employees |
| Private Company Employees | 6,800 | 64.7% |
| Self-Employed (Incorporated) | 551 | 5.2% |
| Self-Employed (Not Incorporated) | 361 | 3.4% |
| Not-for-profit Organizations | 679 | 6.5% |
| Local Government Employees | 1,461 | 13.9% |
| State Government Employees | 525 | 5.0% |
| Federal Government Employees | 115 | 1.1% |
| Unpaid Family Workers | 11 | 0.1% |
| Total | 10,503 | 100.0% |
Employment Status by Age in Hauppauge
According to the labor force statistics for Hauppauge, out of the total population over 16 years of age (16,906), 67.1% or 11,344 individuals are in the labor force, with 5.1% or 579 of them unemployed. The age group with the highest labor force participation rate is 25 to 29 years, with 94.4% or 1,139 individuals in the labor force. Within the labor force, the 20 to 24 years age range has the highest percentage of unemployed individuals, with 13.0% or 166 of them being unemployed.
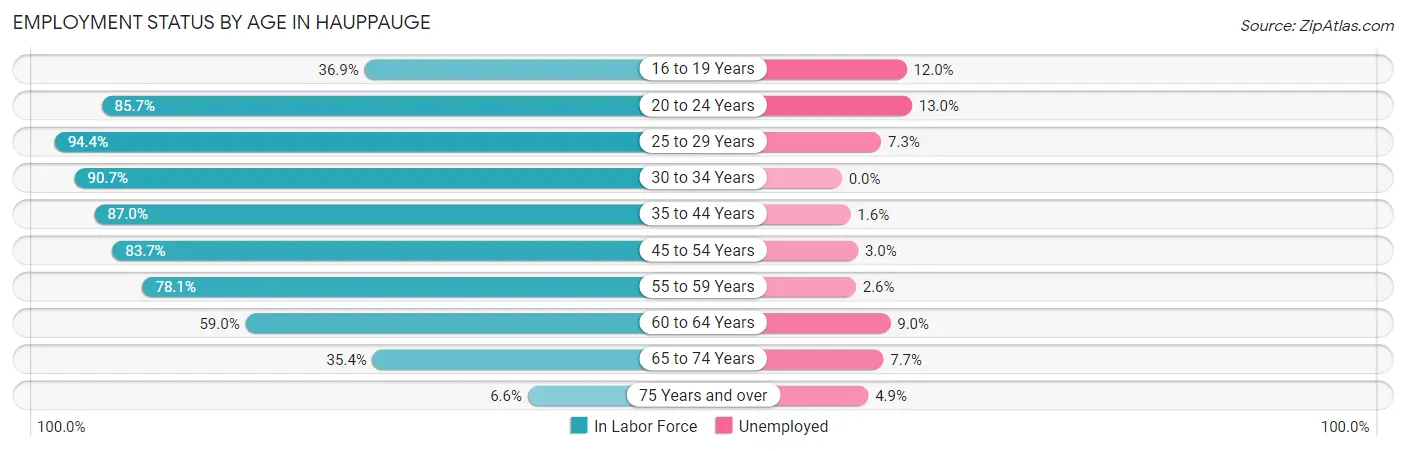
| Age Bracket | In Labor Force | Unemployed |
| 16 to 19 Years | 382 (36.9%) | 46 (12.0%) |
| 20 to 24 Years | 1,280 (85.7%) | 166 (13.0%) |
| 25 to 29 Years | 1,139 (94.4%) | 83 (7.3%) |
| 30 to 34 Years | 949 (90.7%) | 0 (0.0%) |
| 35 to 44 Years | 1,900 (87.0%) | 30 (1.6%) |
| 45 to 54 Years | 2,472 (83.7%) | 74 (3.0%) |
| 55 to 59 Years | 1,552 (78.1%) | 40 (2.6%) |
| 60 to 64 Years | 877 (59.0%) | 79 (9.0%) |
| 65 to 74 Years | 697 (35.4%) | 54 (7.7%) |
| 75 Years and over | 102 (6.6%) | 5 (4.9%) |
| Total | 11,344 (67.1%) | 579 (5.1%) |
Employment Status by Educational Attainment in Hauppauge
According to labor force statistics for Hauppauge, 81.8% of individuals (8,887) out of the total population between 25 and 64 years of age (10,864) are in the labor force, with 3.5% or 311 of them being unemployed. The group with the highest labor force participation rate are those with the educational attainment of bachelor's degree or higher, with 88.7% or 4,957 individuals in the labor force. Within the labor force, individuals with high school diploma education have the highest percentage of unemployment, with 6.3% or 90 of them being unemployed.
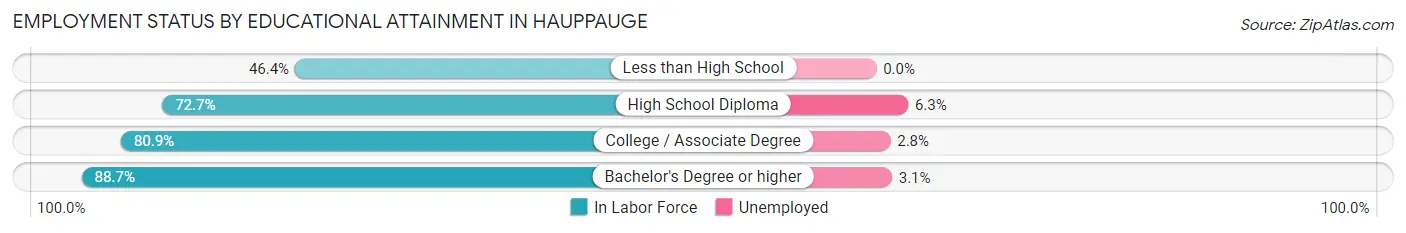
| Educational Attainment | In Labor Force | Unemployed |
| Less than High School | 232 (46.4%) | 0 (0.0%) |
| High School Diploma | 1,422 (72.7%) | 123 (6.3%) |
| College / Associate Degree | 2,281 (80.9%) | 79 (2.8%) |
| Bachelor's Degree or higher | 4,957 (88.7%) | 173 (3.1%) |
| Total | 8,887 (81.8%) | 380 (3.5%) |
Employment Occupations by Sex in Hauppauge
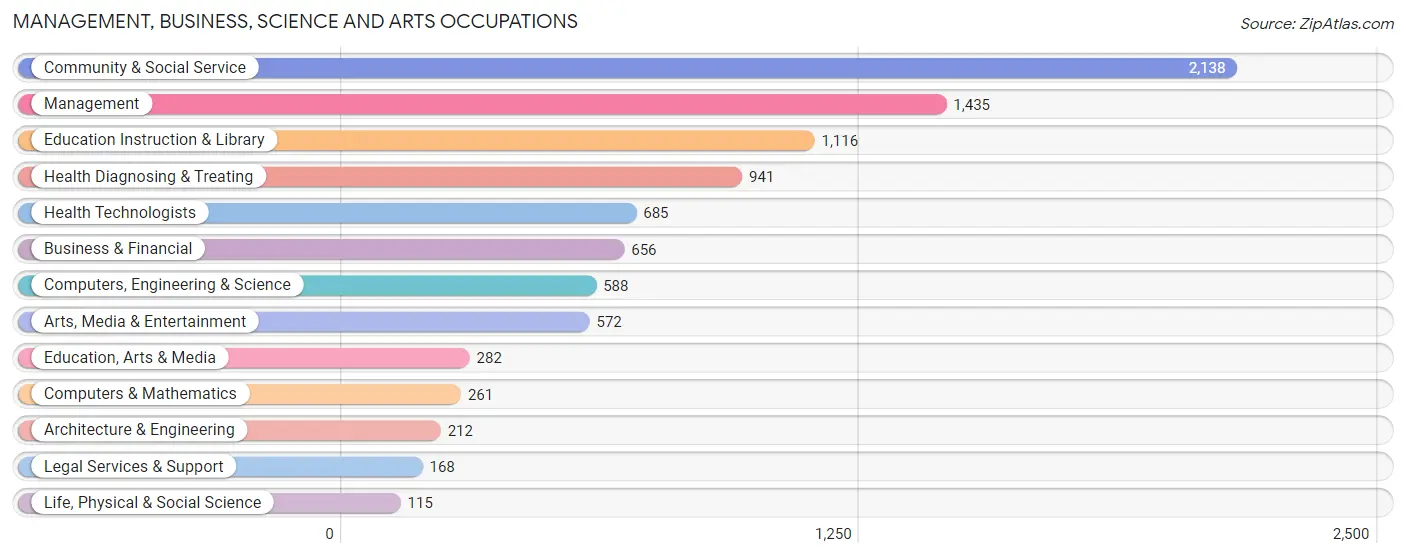
Management, Business, Science and Arts Occupations
The most common Management, Business, Science and Arts occupations in Hauppauge are Community & Social Service (2,138 | 19.9%), Management (1,435 | 13.3%), Education Instruction & Library (1,116 | 10.4%), Health Diagnosing & Treating (941 | 8.7%), and Health Technologists (685 | 6.4%).
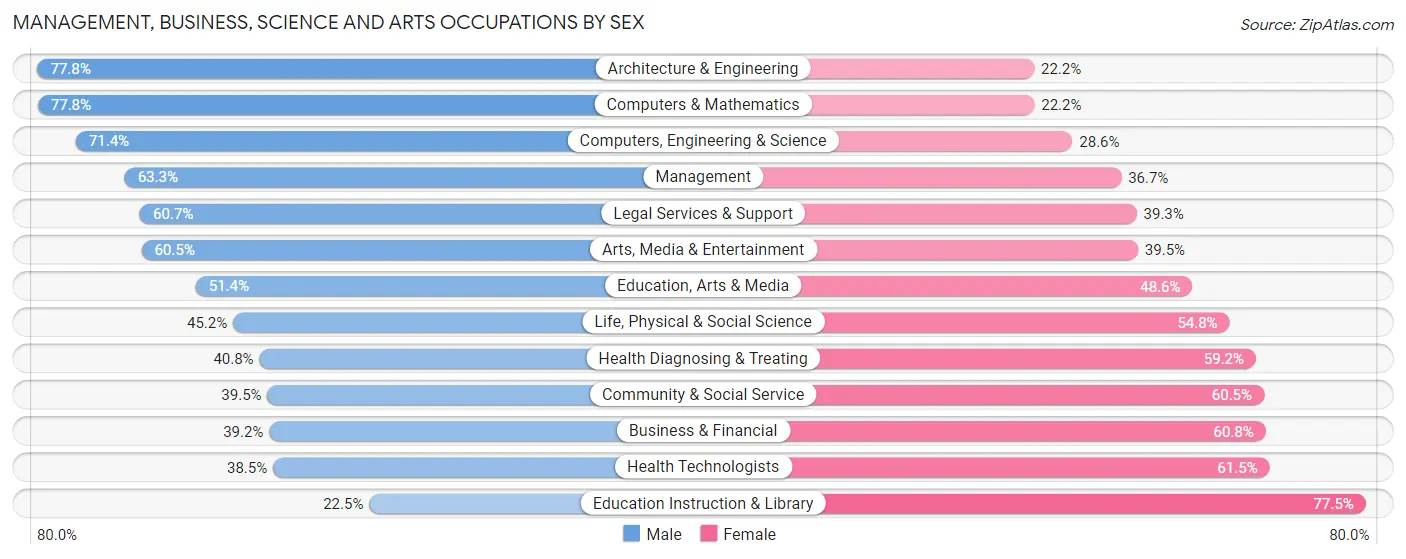
Management, Business, Science and Arts Occupations by Sex
Within the Management, Business, Science and Arts occupations in Hauppauge, the most male-oriented occupations are Architecture & Engineering (77.8%), Computers & Mathematics (77.8%), and Computers, Engineering & Science (71.4%), while the most female-oriented occupations are Education Instruction & Library (77.5%), Health Technologists (61.5%), and Business & Financial (60.8%).
| Occupation | Male | Female |
| Management | 908 (63.3%) | 527 (36.7%) |
| Business & Financial | 257 (39.2%) | 399 (60.8%) |
| Computers, Engineering & Science | 420 (71.4%) | 168 (28.6%) |
| Computers & Mathematics | 203 (77.8%) | 58 (22.2%) |
| Architecture & Engineering | 165 (77.8%) | 47 (22.2%) |
| Life, Physical & Social Science | 52 (45.2%) | 63 (54.8%) |
| Community & Social Service | 844 (39.5%) | 1,294 (60.5%) |
| Education, Arts & Media | 145 (51.4%) | 137 (48.6%) |
| Legal Services & Support | 102 (60.7%) | 66 (39.3%) |
| Education Instruction & Library | 251 (22.5%) | 865 (77.5%) |
| Arts, Media & Entertainment | 346 (60.5%) | 226 (39.5%) |
| Health Diagnosing & Treating | 384 (40.8%) | 557 (59.2%) |
| Health Technologists | 264 (38.5%) | 421 (61.5%) |
| Total (Category) | 2,813 (48.8%) | 2,945 (51.1%) |
| Total (Overall) | 5,599 (52.0%) | 5,172 (48.0%) |
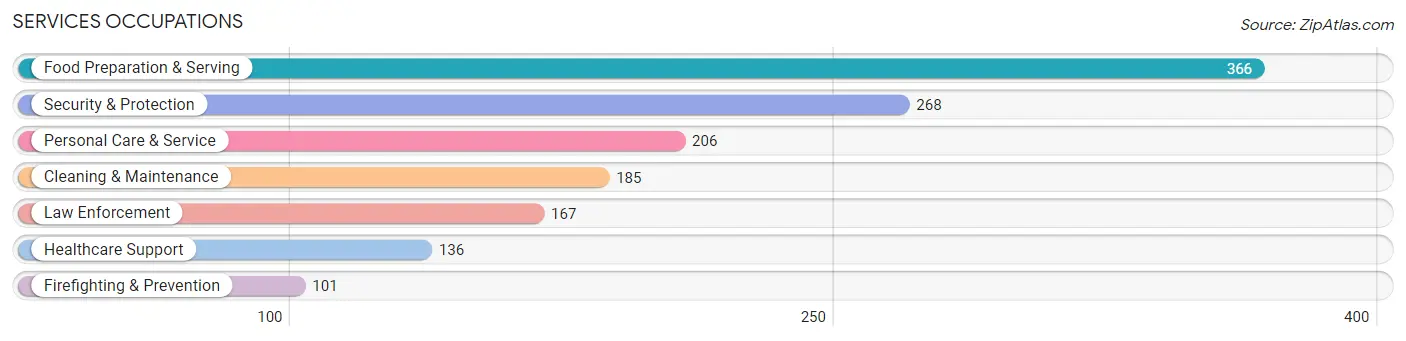
Services Occupations
The most common Services occupations in Hauppauge are Food Preparation & Serving (366 | 3.4%), Security & Protection (268 | 2.5%), Personal Care & Service (206 | 1.9%), Cleaning & Maintenance (185 | 1.7%), and Law Enforcement (167 | 1.5%).
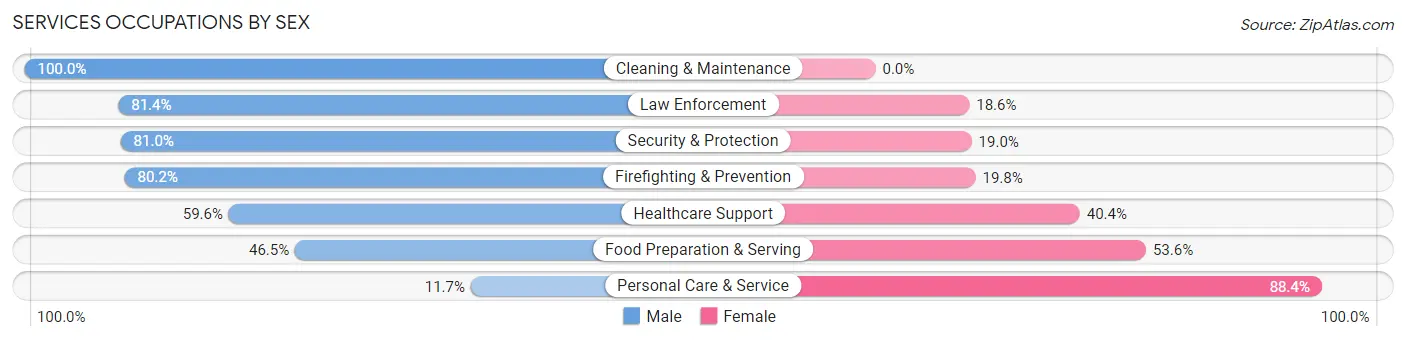
Services Occupations by Sex
Within the Services occupations in Hauppauge, the most male-oriented occupations are Cleaning & Maintenance (100.0%), Law Enforcement (81.4%), and Security & Protection (81.0%), while the most female-oriented occupations are Personal Care & Service (88.3%), Food Preparation & Serving (53.5%), and Healthcare Support (40.4%).
| Occupation | Male | Female |
| Healthcare Support | 81 (59.6%) | 55 (40.4%) |
| Security & Protection | 217 (81.0%) | 51 (19.0%) |
| Firefighting & Prevention | 81 (80.2%) | 20 (19.8%) |
| Law Enforcement | 136 (81.4%) | 31 (18.6%) |
| Food Preparation & Serving | 170 (46.5%) | 196 (53.5%) |
| Cleaning & Maintenance | 185 (100.0%) | 0 (0.0%) |
| Personal Care & Service | 24 (11.7%) | 182 (88.3%) |
| Total (Category) | 677 (58.3%) | 484 (41.7%) |
| Total (Overall) | 5,599 (52.0%) | 5,172 (48.0%) |
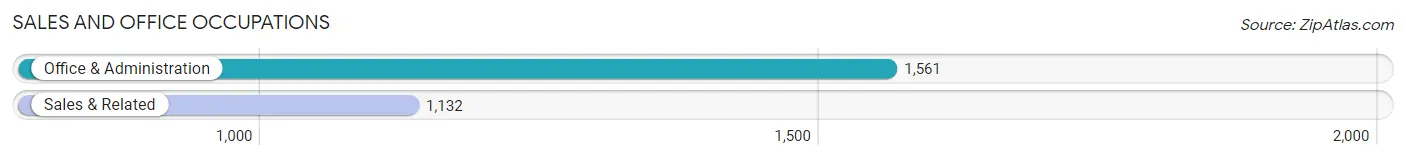
Sales and Office Occupations
The most common Sales and Office occupations in Hauppauge are Office & Administration (1,561 | 14.5%), and Sales & Related (1,132 | 10.5%).
Sales and Office Occupations by Sex
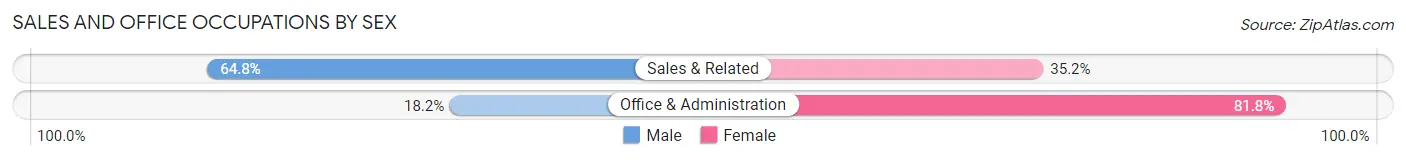
| Occupation | Male | Female |
| Sales & Related | 734 (64.8%) | 398 (35.2%) |
| Office & Administration | 284 (18.2%) | 1,277 (81.8%) |
| Total (Category) | 1,018 (37.8%) | 1,675 (62.2%) |
| Total (Overall) | 5,599 (52.0%) | 5,172 (48.0%) |
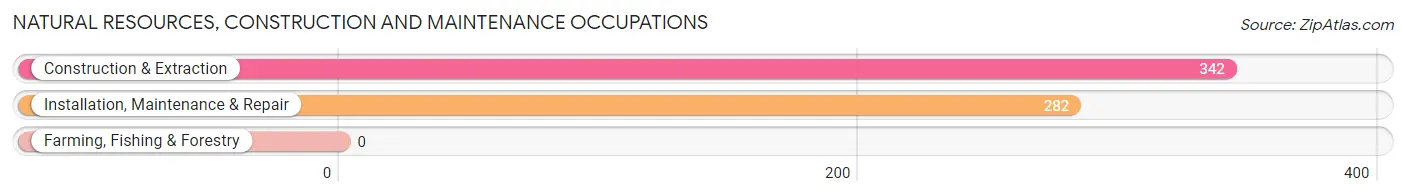
Natural Resources, Construction and Maintenance Occupations
The most common Natural Resources, Construction and Maintenance occupations in Hauppauge are Construction & Extraction (342 | 3.2%), and Installation, Maintenance & Repair (282 | 2.6%).
Natural Resources, Construction and Maintenance Occupations by Sex
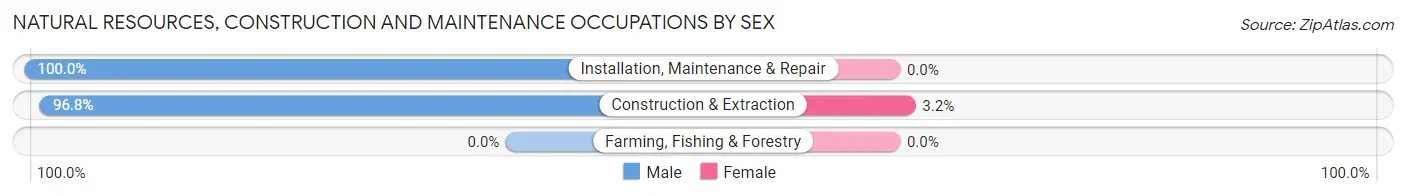
| Occupation | Male | Female |
| Farming, Fishing & Forestry | 0 (0.0%) | 0 (0.0%) |
| Construction & Extraction | 331 (96.8%) | 11 (3.2%) |
| Installation, Maintenance & Repair | 282 (100.0%) | 0 (0.0%) |
| Total (Category) | 613 (98.2%) | 11 (1.8%) |
| Total (Overall) | 5,599 (52.0%) | 5,172 (48.0%) |
Production, Transportation and Moving Occupations
The most common Production, Transportation and Moving occupations in Hauppauge are Transportation (242 | 2.2%), Production (211 | 2.0%), and Material Moving (82 | 0.8%).
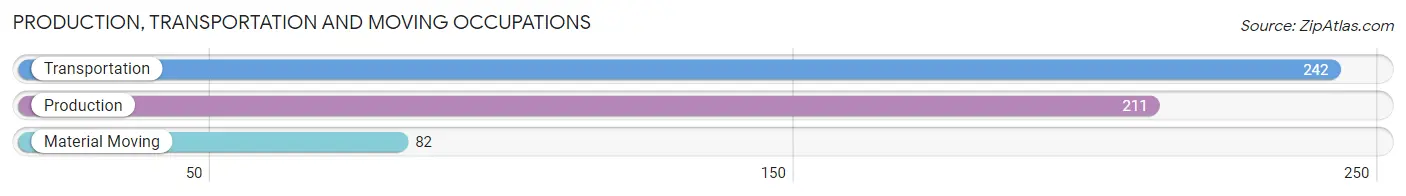
Production, Transportation and Moving Occupations by Sex
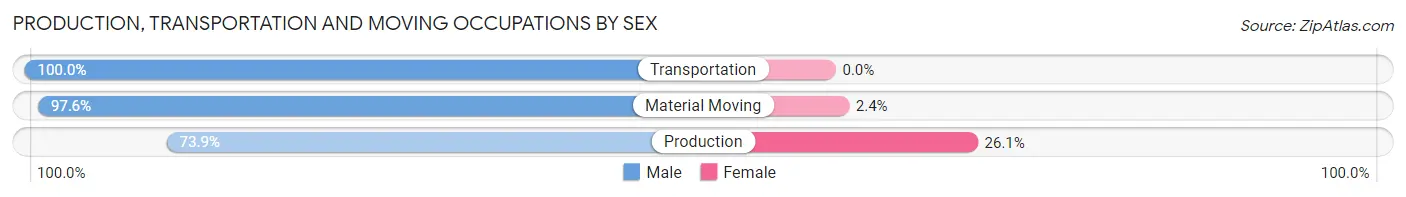
| Occupation | Male | Female |
| Production | 156 (73.9%) | 55 (26.1%) |
| Transportation | 242 (100.0%) | 0 (0.0%) |
| Material Moving | 80 (97.6%) | 2 (2.4%) |
| Total (Category) | 478 (89.3%) | 57 (10.6%) |
| Total (Overall) | 5,599 (52.0%) | 5,172 (48.0%) |
Employment Industries by Sex in Hauppauge
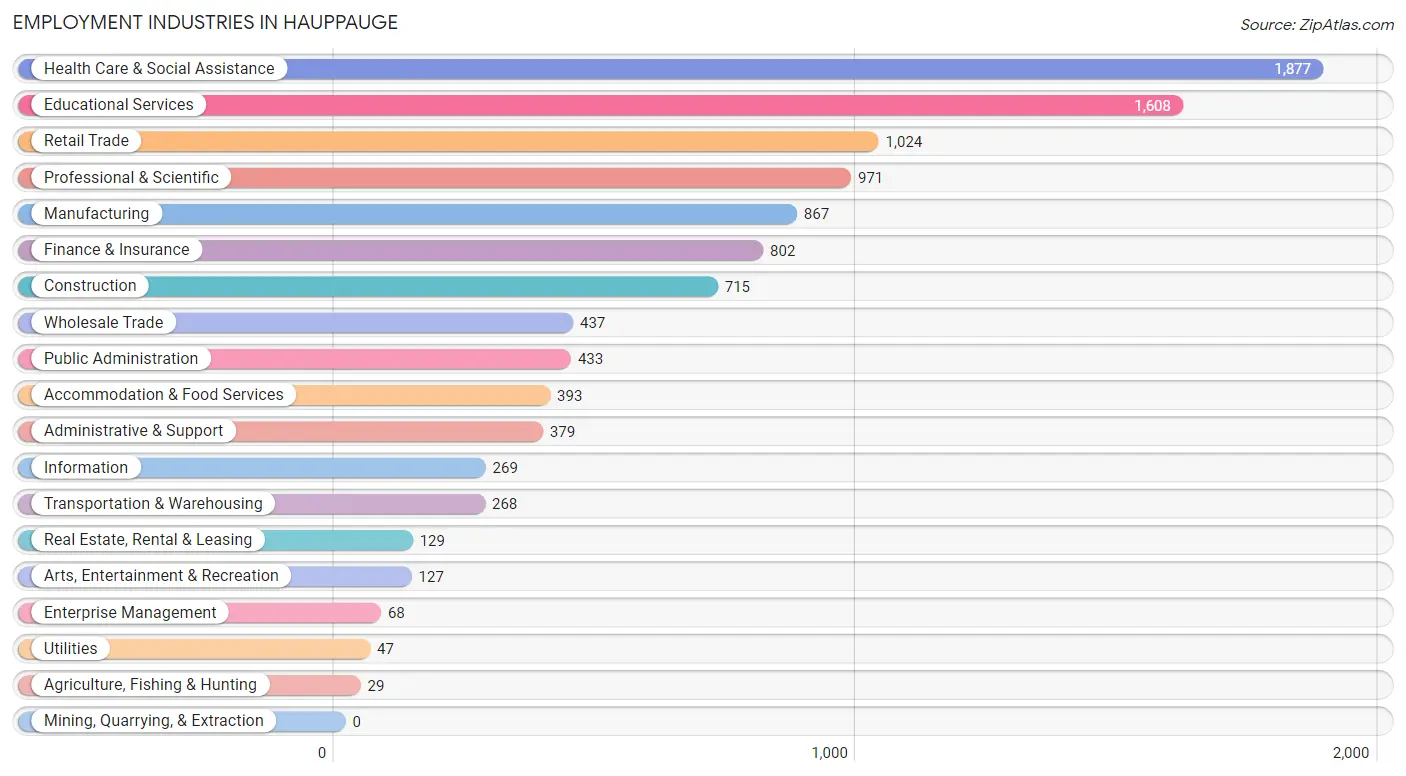
Employment Industries in Hauppauge
The major employment industries in Hauppauge include Health Care & Social Assistance (1,877 | 17.4%), Educational Services (1,608 | 14.9%), Retail Trade (1,024 | 9.5%), Professional & Scientific (971 | 9.0%), and Manufacturing (867 | 8.1%).
Employment Industries by Sex in Hauppauge
The Hauppauge industries that see more men than women are Agriculture, Fishing & Hunting (100.0%), Transportation & Warehousing (88.4%), and Construction (84.8%), whereas the industries that tend to have a higher number of women are Enterprise Management (94.1%), Educational Services (71.0%), and Health Care & Social Assistance (70.6%).
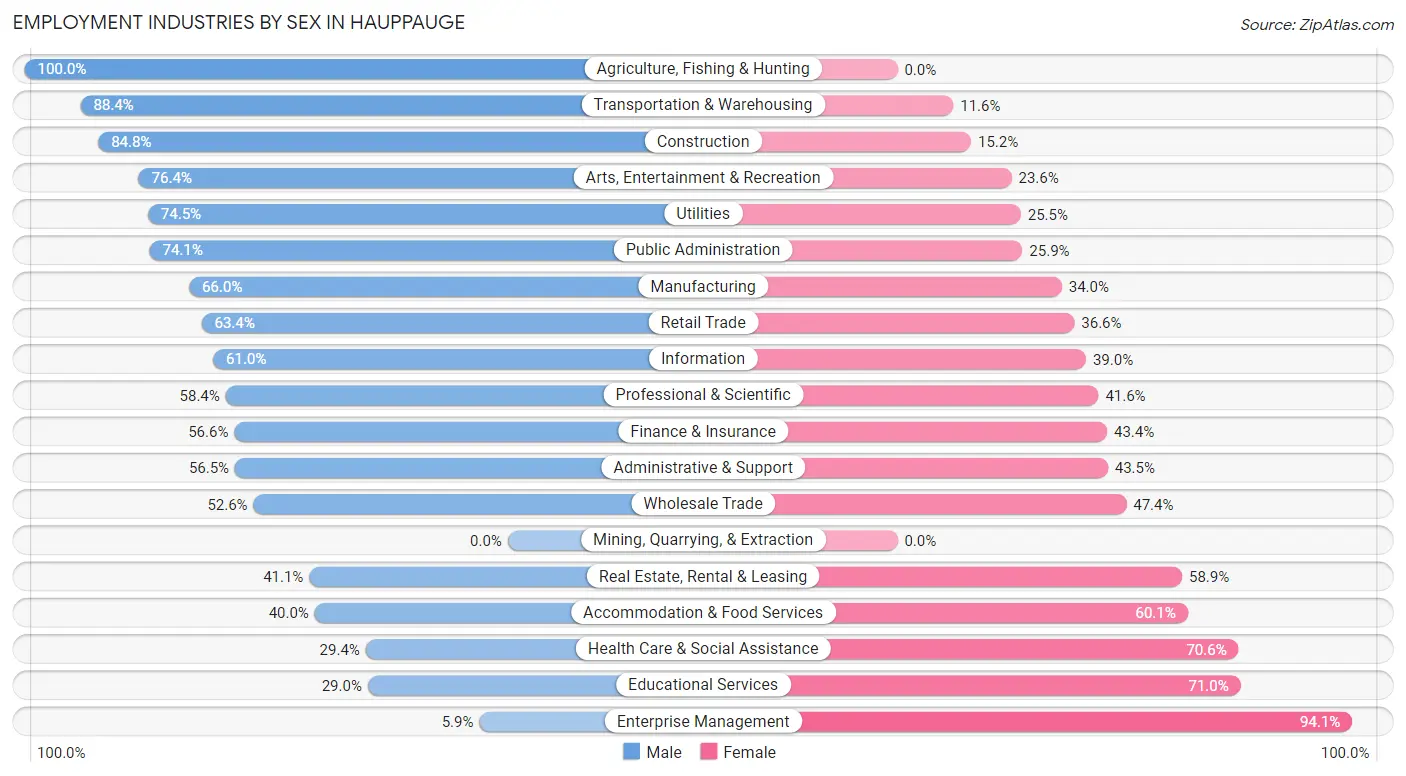
| Industry | Male | Female |
| Agriculture, Fishing & Hunting | 29 (100.0%) | 0 (0.0%) |
| Mining, Quarrying, & Extraction | 0 (0.0%) | 0 (0.0%) |
| Construction | 606 (84.8%) | 109 (15.2%) |
| Manufacturing | 572 (66.0%) | 295 (34.0%) |
| Wholesale Trade | 230 (52.6%) | 207 (47.4%) |
| Retail Trade | 649 (63.4%) | 375 (36.6%) |
| Transportation & Warehousing | 237 (88.4%) | 31 (11.6%) |
| Utilities | 35 (74.5%) | 12 (25.5%) |
| Information | 164 (61.0%) | 105 (39.0%) |
| Finance & Insurance | 454 (56.6%) | 348 (43.4%) |
| Real Estate, Rental & Leasing | 53 (41.1%) | 76 (58.9%) |
| Professional & Scientific | 567 (58.4%) | 404 (41.6%) |
| Enterprise Management | 4 (5.9%) | 64 (94.1%) |
| Administrative & Support | 214 (56.5%) | 165 (43.5%) |
| Educational Services | 466 (29.0%) | 1,142 (71.0%) |
| Health Care & Social Assistance | 552 (29.4%) | 1,325 (70.6%) |
| Arts, Entertainment & Recreation | 97 (76.4%) | 30 (23.6%) |
| Accommodation & Food Services | 157 (40.0%) | 236 (60.1%) |
| Public Administration | 321 (74.1%) | 112 (25.9%) |
| Total | 5,599 (52.0%) | 5,172 (48.0%) |
Education in Hauppauge
School Enrollment in Hauppauge
The most common levels of schooling among the 4,322 students in Hauppauge are high school (1,093 | 25.3%), college / undergraduate (975 | 22.6%), and elementary school (825 | 19.1%).
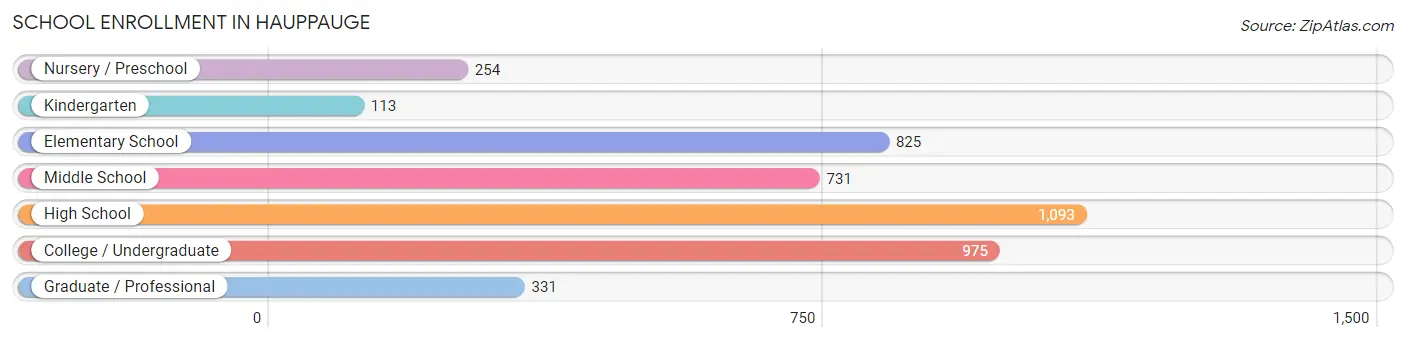
| School Level | # Students | % Students |
| Nursery / Preschool | 254 | 5.9% |
| Kindergarten | 113 | 2.6% |
| Elementary School | 825 | 19.1% |
| Middle School | 731 | 16.9% |
| High School | 1,093 | 25.3% |
| College / Undergraduate | 975 | 22.6% |
| Graduate / Professional | 331 | 7.7% |
| Total | 4,322 | 100.0% |
School Enrollment by Age by Funding Source in Hauppauge
Out of a total of 4,322 students who are enrolled in schools in Hauppauge, 609 (14.1%) attend a private institution, while the remaining 3,713 (85.9%) are enrolled in public schools. The age group of 3 to 4 year olds has the highest likelihood of being enrolled in private schools, with 152 (62.3% in the age bracket) enrolled. Conversely, the age group of 10 to 14 year olds has the lowest likelihood of being enrolled in a private school, with 922 (98.1% in the age bracket) attending a public institution.
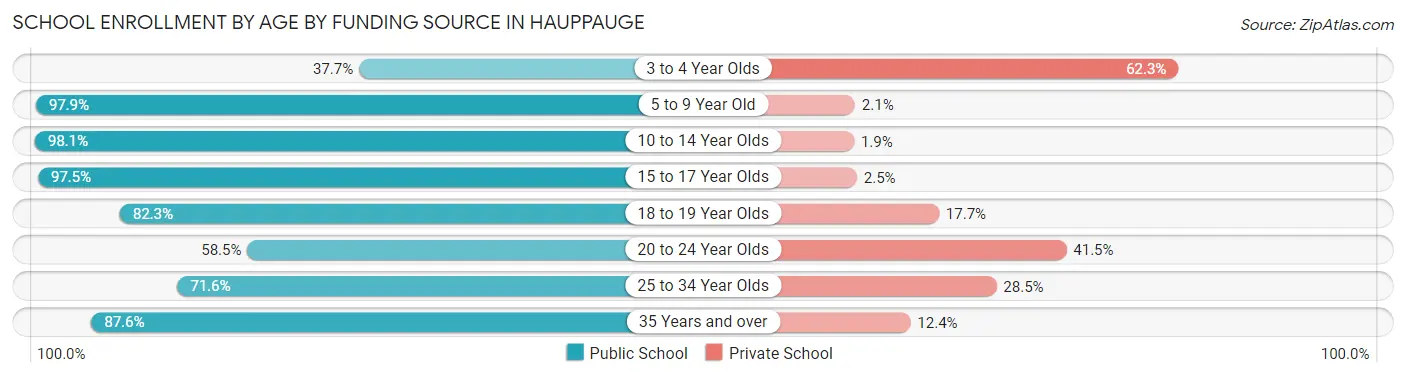
| Age Bracket | Public School | Private School |
| 3 to 4 Year Olds | 92 (37.7%) | 152 (62.3%) |
| 5 to 9 Year Old | 889 (97.9%) | 19 (2.1%) |
| 10 to 14 Year Olds | 922 (98.1%) | 18 (1.9%) |
| 15 to 17 Year Olds | 794 (97.5%) | 20 (2.5%) |
| 18 to 19 Year Olds | 422 (82.3%) | 91 (17.7%) |
| 20 to 24 Year Olds | 357 (58.5%) | 253 (41.5%) |
| 25 to 34 Year Olds | 83 (71.6%) | 33 (28.4%) |
| 35 Years and over | 155 (87.6%) | 22 (12.4%) |
| Total | 3,713 (85.9%) | 609 (14.1%) |
Educational Attainment by Field of Study in Hauppauge
Business (1,650 | 22.8%), education (1,068 | 14.8%), science & technology (835 | 11.6%), social sciences (530 | 7.3%), and bio, nature & agricultural (512 | 7.1%) are the most common fields of study among 7,232 individuals in Hauppauge who have obtained a bachelor's degree or higher.
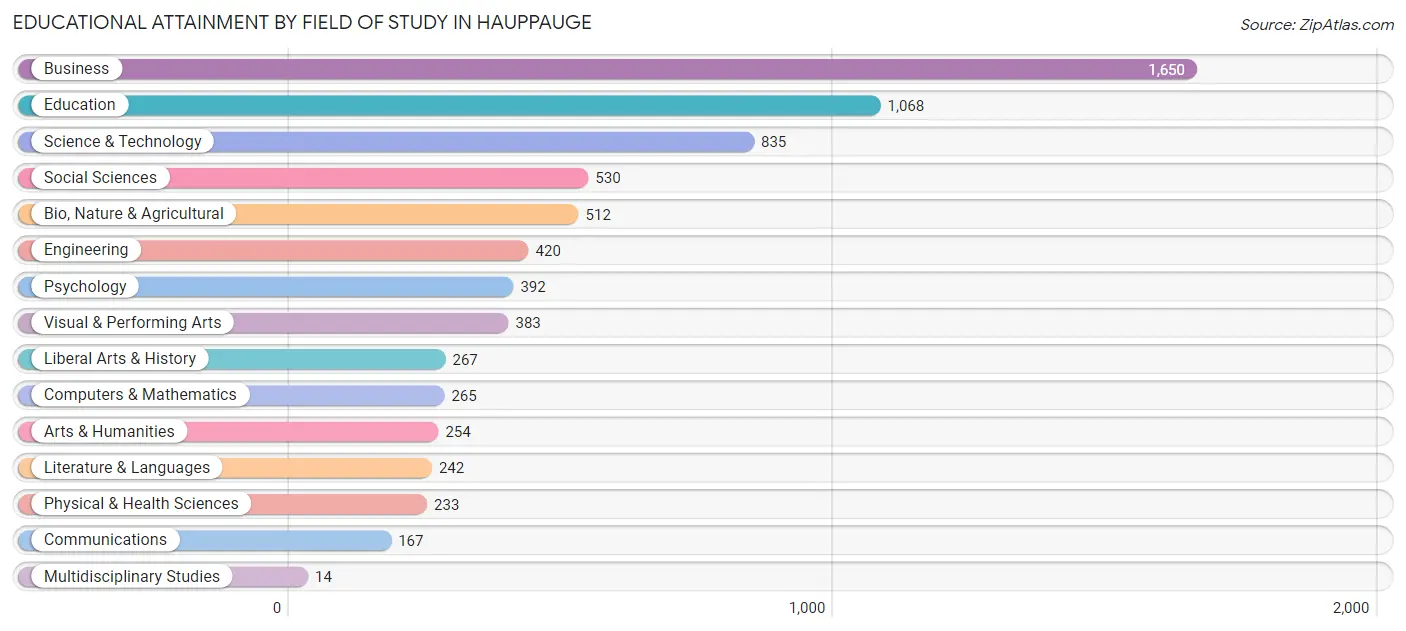
| Field of Study | # Graduates | % Graduates |
| Computers & Mathematics | 265 | 3.7% |
| Bio, Nature & Agricultural | 512 | 7.1% |
| Physical & Health Sciences | 233 | 3.2% |
| Psychology | 392 | 5.4% |
| Social Sciences | 530 | 7.3% |
| Engineering | 420 | 5.8% |
| Multidisciplinary Studies | 14 | 0.2% |
| Science & Technology | 835 | 11.6% |
| Business | 1,650 | 22.8% |
| Education | 1,068 | 14.8% |
| Literature & Languages | 242 | 3.4% |
| Liberal Arts & History | 267 | 3.7% |
| Visual & Performing Arts | 383 | 5.3% |
| Communications | 167 | 2.3% |
| Arts & Humanities | 254 | 3.5% |
| Total | 7,232 | 100.0% |
Transportation & Commute in Hauppauge
Vehicle Availability by Sex in Hauppauge
The most prevalent vehicle ownership categories in Hauppauge are males with 2 vehicles (2,291, accounting for 42.1%) and females with 2 vehicles (1,716, making up 45.3%).
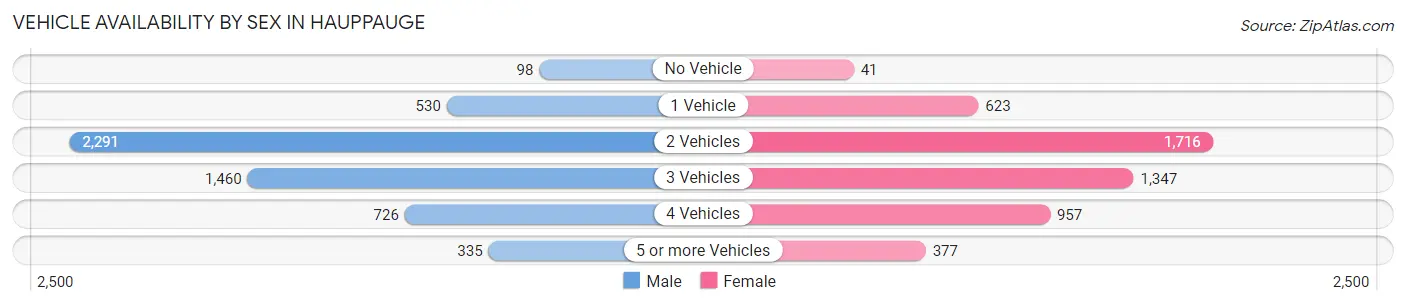
| Vehicles Available | Male | Female |
| No Vehicle | 98 (1.8%) | 41 (0.8%) |
| 1 Vehicle | 530 (9.7%) | 623 (12.3%) |
| 2 Vehicles | 2,291 (42.1%) | 1,716 (33.9%) |
| 3 Vehicles | 1,460 (26.8%) | 1,347 (26.6%) |
| 4 Vehicles | 726 (13.4%) | 957 (18.9%) |
| 5 or more Vehicles | 335 (6.2%) | 377 (7.4%) |
| Total | 5,440 (100.0%) | 5,061 (100.0%) |
Commute Time in Hauppauge
The most frequently occuring commute durations in Hauppauge are 30 to 34 minutes (1,850 commuters, 19.4%), 15 to 19 minutes (1,274 commuters, 13.4%), and 20 to 24 minutes (1,163 commuters, 12.2%).
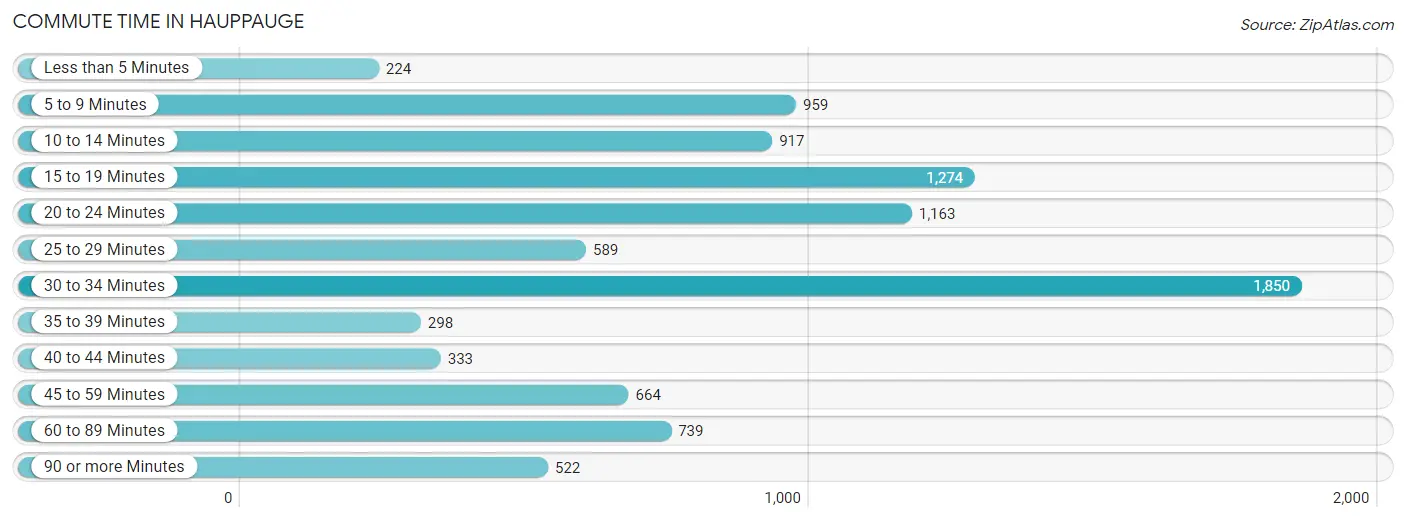
| Commute Time | # Commuters | % Commuters |
| Less than 5 Minutes | 224 | 2.4% |
| 5 to 9 Minutes | 959 | 10.1% |
| 10 to 14 Minutes | 917 | 9.6% |
| 15 to 19 Minutes | 1,274 | 13.4% |
| 20 to 24 Minutes | 1,163 | 12.2% |
| 25 to 29 Minutes | 589 | 6.2% |
| 30 to 34 Minutes | 1,850 | 19.4% |
| 35 to 39 Minutes | 298 | 3.1% |
| 40 to 44 Minutes | 333 | 3.5% |
| 45 to 59 Minutes | 664 | 7.0% |
| 60 to 89 Minutes | 739 | 7.7% |
| 90 or more Minutes | 522 | 5.5% |
Commute Time by Sex in Hauppauge
The most common commute times in Hauppauge are 30 to 34 minutes (825 commuters, 16.8%) for males and 30 to 34 minutes (1,025 commuters, 22.1%) for females.
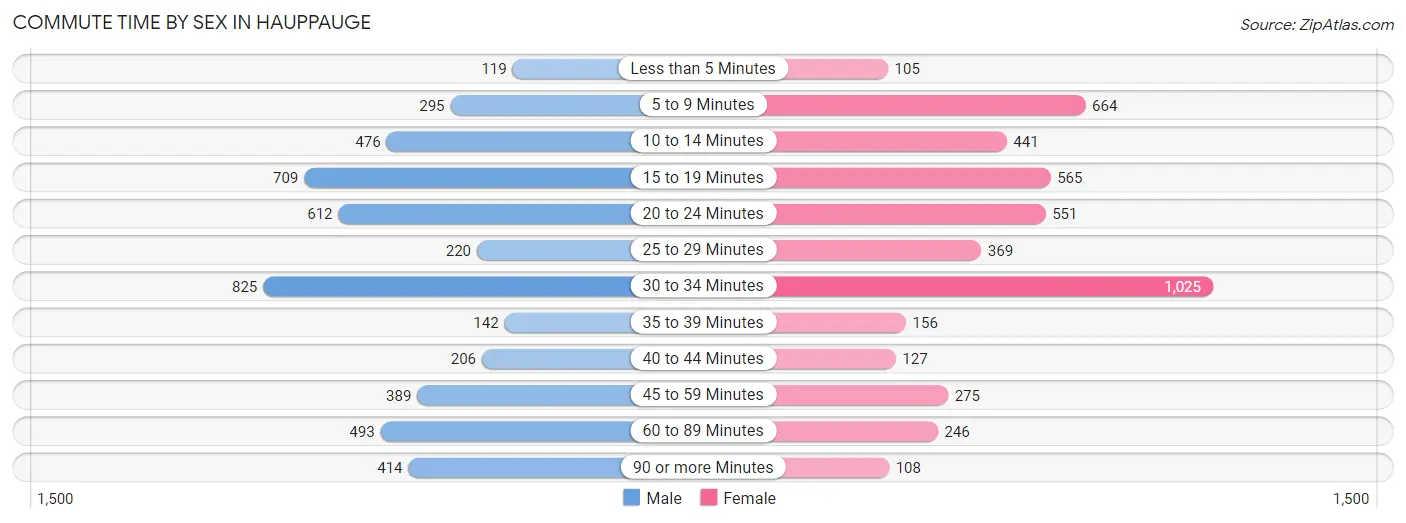
| Commute Time | Male | Female |
| Less than 5 Minutes | 119 (2.4%) | 105 (2.3%) |
| 5 to 9 Minutes | 295 (6.0%) | 664 (14.3%) |
| 10 to 14 Minutes | 476 (9.7%) | 441 (9.5%) |
| 15 to 19 Minutes | 709 (14.5%) | 565 (12.2%) |
| 20 to 24 Minutes | 612 (12.5%) | 551 (11.9%) |
| 25 to 29 Minutes | 220 (4.5%) | 369 (8.0%) |
| 30 to 34 Minutes | 825 (16.8%) | 1,025 (22.1%) |
| 35 to 39 Minutes | 142 (2.9%) | 156 (3.4%) |
| 40 to 44 Minutes | 206 (4.2%) | 127 (2.7%) |
| 45 to 59 Minutes | 389 (7.9%) | 275 (5.9%) |
| 60 to 89 Minutes | 493 (10.1%) | 246 (5.3%) |
| 90 or more Minutes | 414 (8.5%) | 108 (2.3%) |
Time of Departure to Work by Sex in Hauppauge
The most frequent times of departure to work in Hauppauge are 8:00 AM to 8:29 AM (1,148, 23.4%) for males and 8:00 AM to 8:29 AM (901, 19.5%) for females.
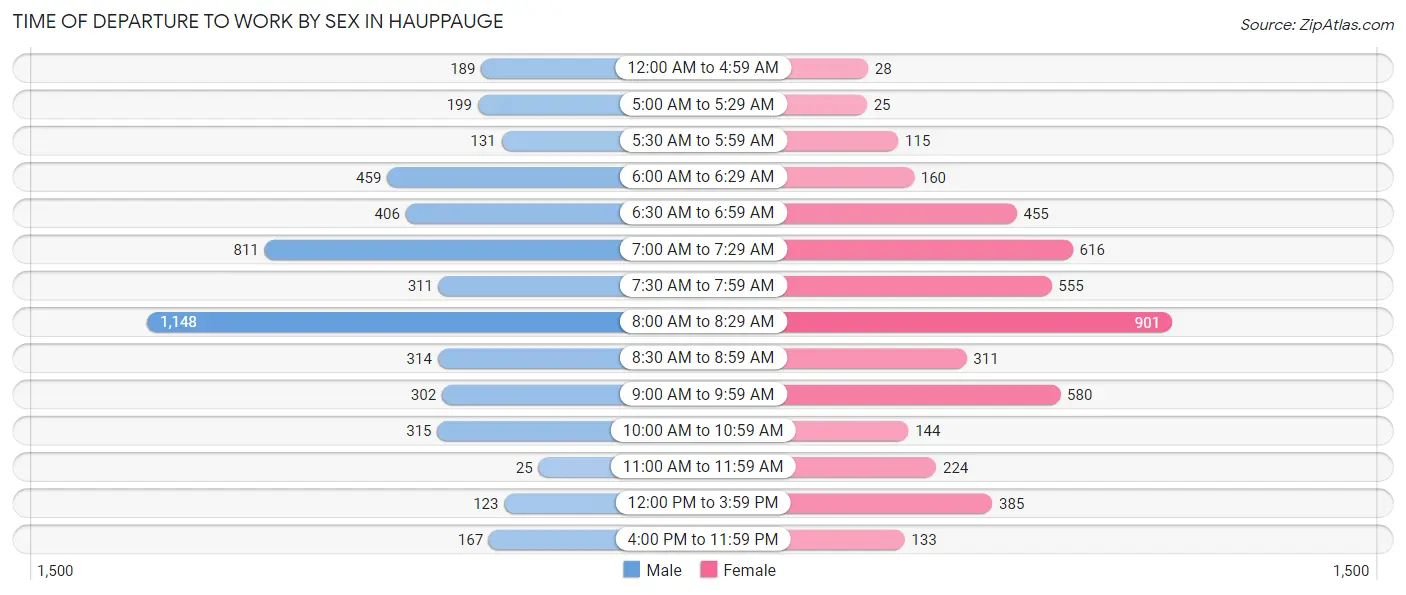
| Time of Departure | Male | Female |
| 12:00 AM to 4:59 AM | 189 (3.9%) | 28 (0.6%) |
| 5:00 AM to 5:29 AM | 199 (4.1%) | 25 (0.5%) |
| 5:30 AM to 5:59 AM | 131 (2.7%) | 115 (2.5%) |
| 6:00 AM to 6:29 AM | 459 (9.4%) | 160 (3.5%) |
| 6:30 AM to 6:59 AM | 406 (8.3%) | 455 (9.8%) |
| 7:00 AM to 7:29 AM | 811 (16.6%) | 616 (13.3%) |
| 7:30 AM to 7:59 AM | 311 (6.4%) | 555 (12.0%) |
| 8:00 AM to 8:29 AM | 1,148 (23.4%) | 901 (19.5%) |
| 8:30 AM to 8:59 AM | 314 (6.4%) | 311 (6.7%) |
| 9:00 AM to 9:59 AM | 302 (6.2%) | 580 (12.5%) |
| 10:00 AM to 10:59 AM | 315 (6.4%) | 144 (3.1%) |
| 11:00 AM to 11:59 AM | 25 (0.5%) | 224 (4.8%) |
| 12:00 PM to 3:59 PM | 123 (2.5%) | 385 (8.3%) |
| 4:00 PM to 11:59 PM | 167 (3.4%) | 133 (2.9%) |
| Total | 4,900 (100.0%) | 4,632 (100.0%) |
Housing Occupancy in Hauppauge
Occupancy by Ownership in Hauppauge
Of the total 6,830 dwellings in Hauppauge, owner-occupied units account for 5,657 (82.8%), while renter-occupied units make up 1,173 (17.2%).
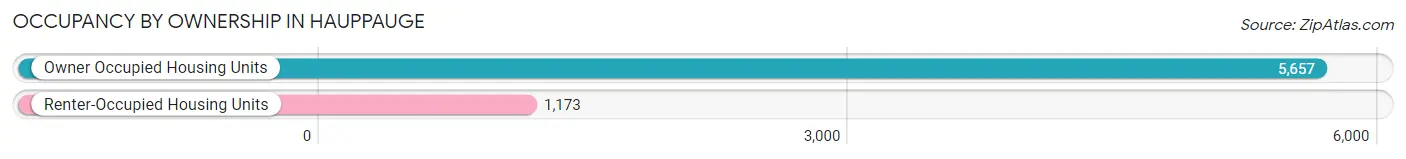
| Occupancy | # Housing Units | % Housing Units |
| Owner Occupied Housing Units | 5,657 | 82.8% |
| Renter-Occupied Housing Units | 1,173 | 17.2% |
| Total Occupied Housing Units | 6,830 | 100.0% |
Occupancy by Household Size in Hauppauge
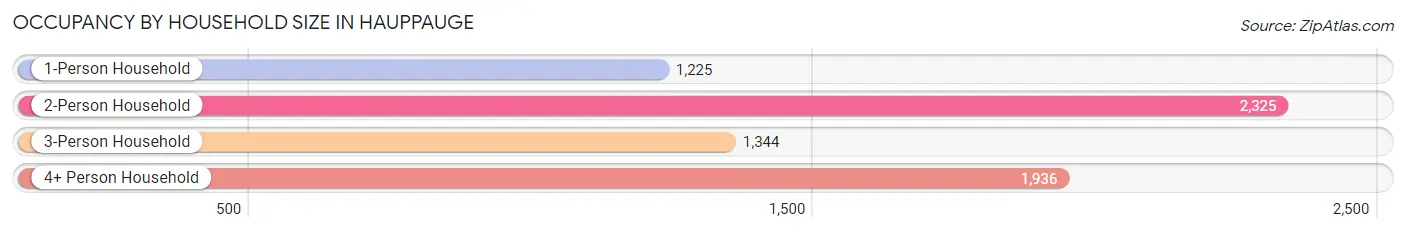
| Household Size | # Housing Units | % Housing Units |
| 1-Person Household | 1,225 | 17.9% |
| 2-Person Household | 2,325 | 34.0% |
| 3-Person Household | 1,344 | 19.7% |
| 4+ Person Household | 1,936 | 28.3% |
| Total Housing Units | 6,830 | 100.0% |
Occupancy by Ownership by Household Size in Hauppauge
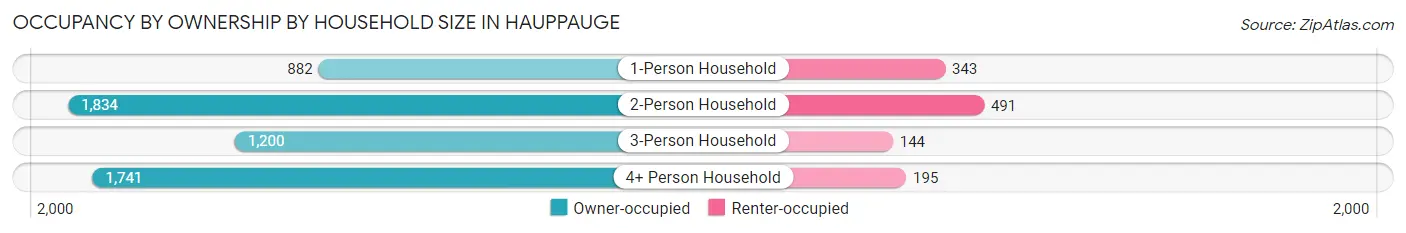
| Household Size | Owner-occupied | Renter-occupied |
| 1-Person Household | 882 (72.0%) | 343 (28.0%) |
| 2-Person Household | 1,834 (78.9%) | 491 (21.1%) |
| 3-Person Household | 1,200 (89.3%) | 144 (10.7%) |
| 4+ Person Household | 1,741 (89.9%) | 195 (10.1%) |
| Total Housing Units | 5,657 (82.8%) | 1,173 (17.2%) |
Occupancy by Educational Attainment in Hauppauge
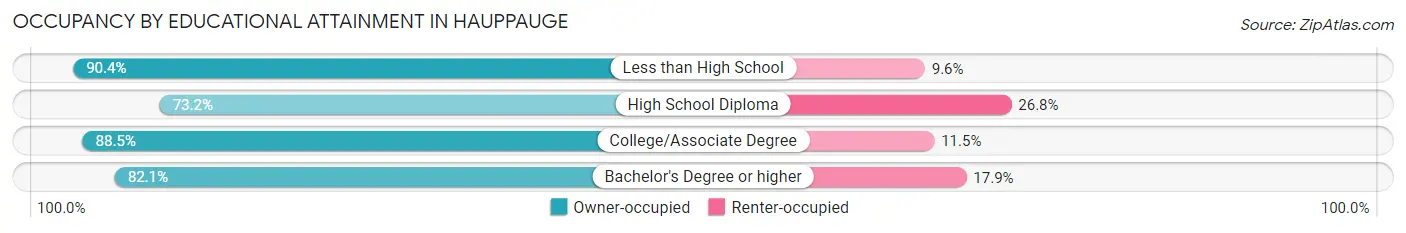
| Household Size | Owner-occupied | Renter-occupied |
| Less than High School | 225 (90.4%) | 24 (9.6%) |
| High School Diploma | 825 (73.2%) | 302 (26.8%) |
| College/Associate Degree | 1,784 (88.5%) | 232 (11.5%) |
| Bachelor's Degree or higher | 2,823 (82.1%) | 615 (17.9%) |
Occupancy by Age of Householder in Hauppauge
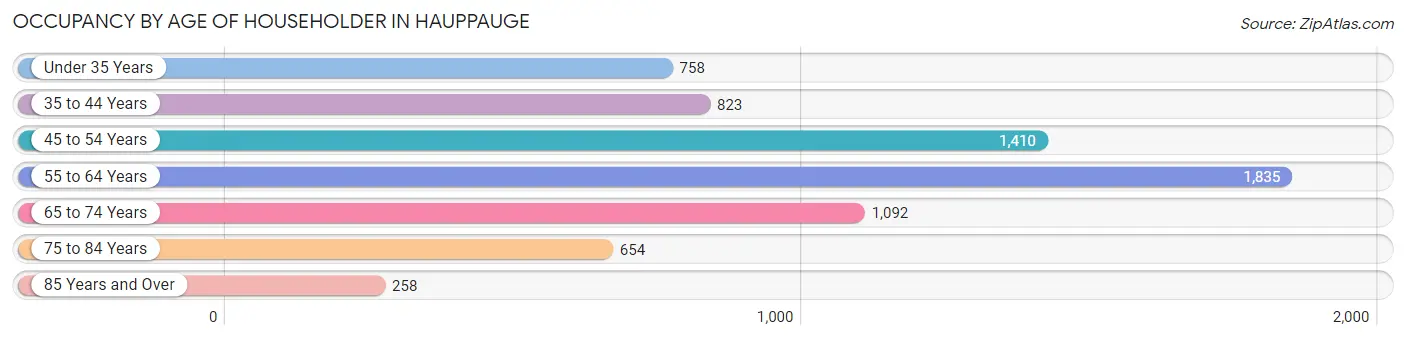
| Age Bracket | # Households | % Households |
| Under 35 Years | 758 | 11.1% |
| 35 to 44 Years | 823 | 12.0% |
| 45 to 54 Years | 1,410 | 20.6% |
| 55 to 64 Years | 1,835 | 26.9% |
| 65 to 74 Years | 1,092 | 16.0% |
| 75 to 84 Years | 654 | 9.6% |
| 85 Years and Over | 258 | 3.8% |
| Total | 6,830 | 100.0% |
Housing Finances in Hauppauge
Median Income by Occupancy in Hauppauge
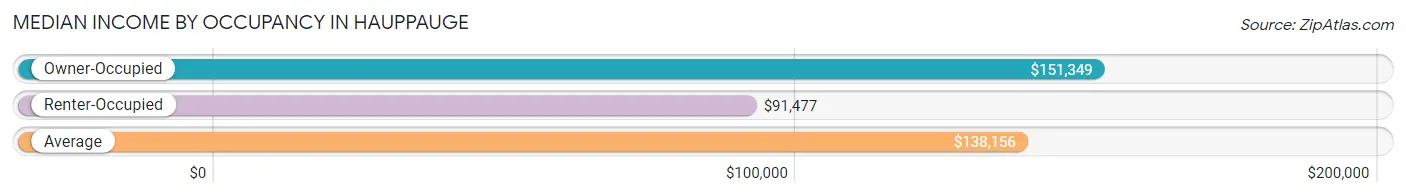
| Occupancy Type | # Households | Median Income |
| Owner-Occupied | 5,657 (82.8%) | $151,349 |
| Renter-Occupied | 1,173 (17.2%) | $91,477 |
| Average | 6,830 (100.0%) | $138,156 |
Occupancy by Householder Income Bracket in Hauppauge
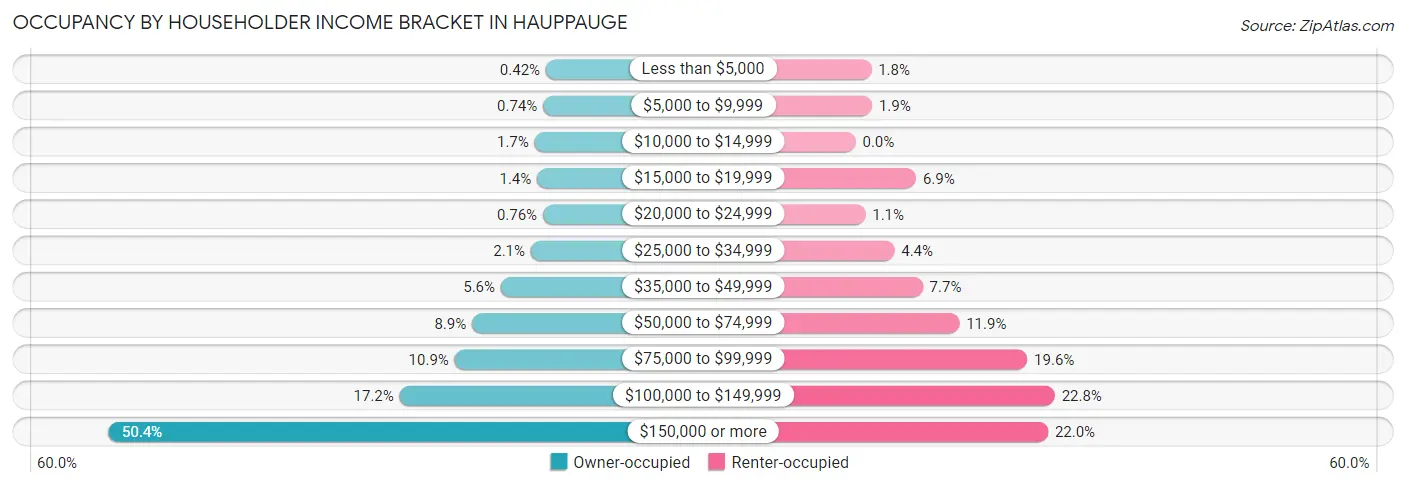
| Income Bracket | Owner-occupied | Renter-occupied |
| Less than $5,000 | 24 (0.4%) | 21 (1.8%) |
| $5,000 to $9,999 | 42 (0.7%) | 22 (1.9%) |
| $10,000 to $14,999 | 97 (1.7%) | 0 (0.0%) |
| $15,000 to $19,999 | 81 (1.4%) | 81 (6.9%) |
| $20,000 to $24,999 | 43 (0.8%) | 13 (1.1%) |
| $25,000 to $34,999 | 121 (2.1%) | 52 (4.4%) |
| $35,000 to $49,999 | 315 (5.6%) | 90 (7.7%) |
| $50,000 to $74,999 | 501 (8.9%) | 139 (11.8%) |
| $75,000 to $99,999 | 614 (10.8%) | 230 (19.6%) |
| $100,000 to $149,999 | 970 (17.2%) | 267 (22.8%) |
| $150,000 or more | 2,849 (50.4%) | 258 (22.0%) |
| Total | 5,657 (100.0%) | 1,173 (100.0%) |
Monthly Housing Cost Tiers in Hauppauge
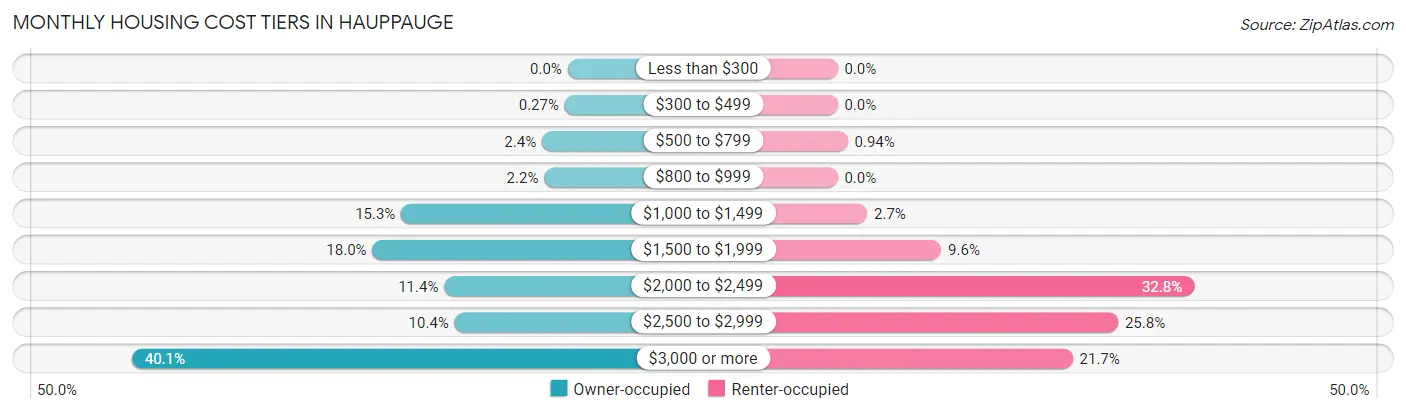
| Monthly Cost | Owner-occupied | Renter-occupied |
| Less than $300 | 0 (0.0%) | 0 (0.0%) |
| $300 to $499 | 15 (0.3%) | 0 (0.0%) |
| $500 to $799 | 134 (2.4%) | 11 (0.9%) |
| $800 to $999 | 122 (2.2%) | 0 (0.0%) |
| $1,000 to $1,499 | 867 (15.3%) | 32 (2.7%) |
| $1,500 to $1,999 | 1,017 (18.0%) | 112 (9.6%) |
| $2,000 to $2,499 | 643 (11.4%) | 385 (32.8%) |
| $2,500 to $2,999 | 589 (10.4%) | 303 (25.8%) |
| $3,000 or more | 2,270 (40.1%) | 254 (21.6%) |
| Total | 5,657 (100.0%) | 1,173 (100.0%) |
Physical Housing Characteristics in Hauppauge
Housing Structures in Hauppauge
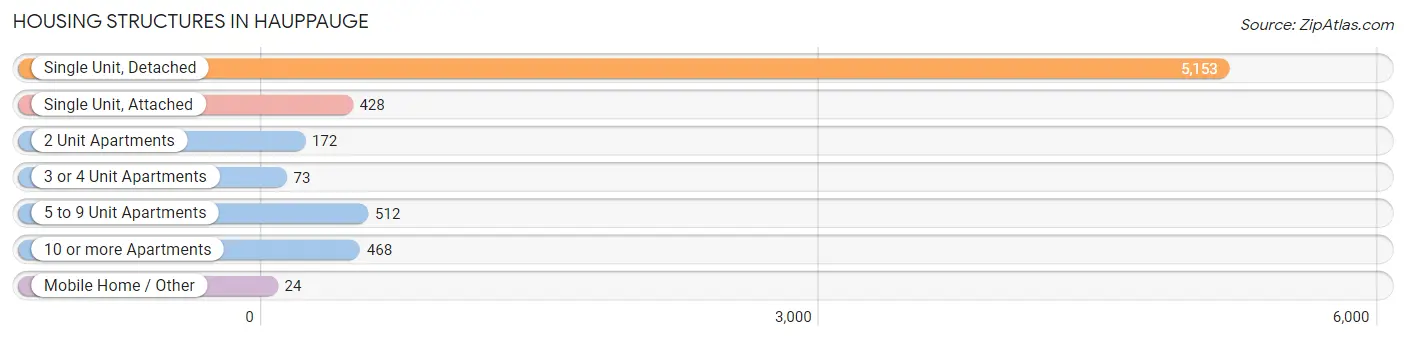
| Structure Type | # Housing Units | % Housing Units |
| Single Unit, Detached | 5,153 | 75.4% |
| Single Unit, Attached | 428 | 6.3% |
| 2 Unit Apartments | 172 | 2.5% |
| 3 or 4 Unit Apartments | 73 | 1.1% |
| 5 to 9 Unit Apartments | 512 | 7.5% |
| 10 or more Apartments | 468 | 6.9% |
| Mobile Home / Other | 24 | 0.4% |
| Total | 6,830 | 100.0% |
Housing Structures by Occupancy in Hauppauge
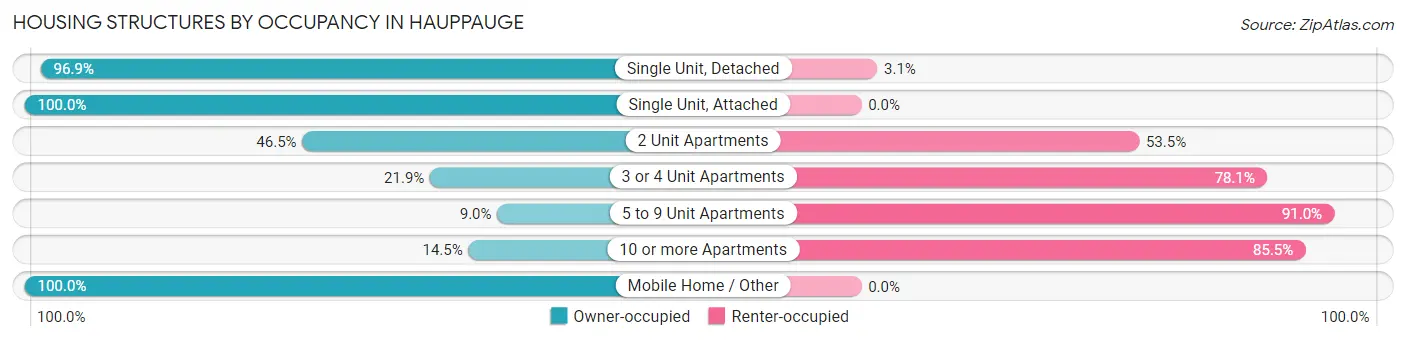
| Structure Type | Owner-occupied | Renter-occupied |
| Single Unit, Detached | 4,995 (96.9%) | 158 (3.1%) |
| Single Unit, Attached | 428 (100.0%) | 0 (0.0%) |
| 2 Unit Apartments | 80 (46.5%) | 92 (53.5%) |
| 3 or 4 Unit Apartments | 16 (21.9%) | 57 (78.1%) |
| 5 to 9 Unit Apartments | 46 (9.0%) | 466 (91.0%) |
| 10 or more Apartments | 68 (14.5%) | 400 (85.5%) |
| Mobile Home / Other | 24 (100.0%) | 0 (0.0%) |
| Total | 5,657 (82.8%) | 1,173 (17.2%) |
Housing Structures by Number of Rooms in Hauppauge
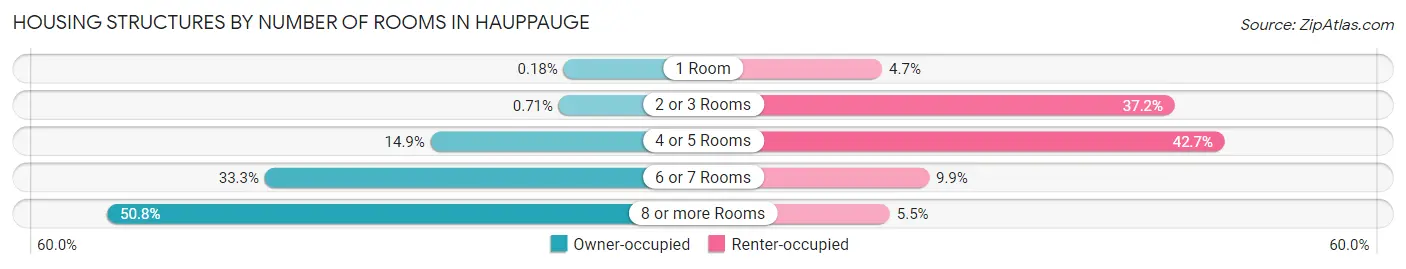
| Number of Rooms | Owner-occupied | Renter-occupied |
| 1 Room | 10 (0.2%) | 55 (4.7%) |
| 2 or 3 Rooms | 40 (0.7%) | 436 (37.2%) |
| 4 or 5 Rooms | 845 (14.9%) | 501 (42.7%) |
| 6 or 7 Rooms | 1,886 (33.3%) | 116 (9.9%) |
| 8 or more Rooms | 2,876 (50.8%) | 65 (5.5%) |
| Total | 5,657 (100.0%) | 1,173 (100.0%) |
Housing Structure by Heating Type in Hauppauge
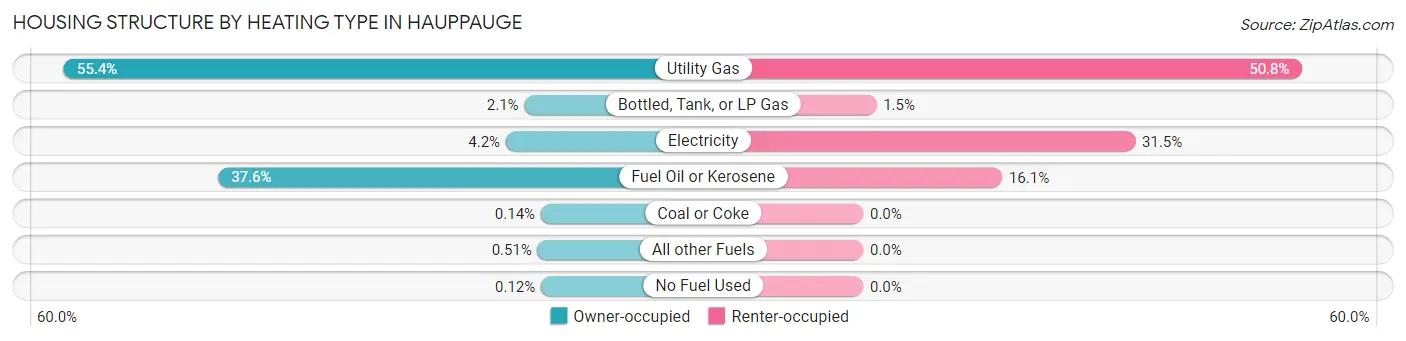
| Heating Type | Owner-occupied | Renter-occupied |
| Utility Gas | 3,136 (55.4%) | 596 (50.8%) |
| Bottled, Tank, or LP Gas | 116 (2.1%) | 18 (1.5%) |
| Electricity | 237 (4.2%) | 370 (31.5%) |
| Fuel Oil or Kerosene | 2,124 (37.6%) | 189 (16.1%) |
| Coal or Coke | 8 (0.1%) | 0 (0.0%) |
| All other Fuels | 29 (0.5%) | 0 (0.0%) |
| No Fuel Used | 7 (0.1%) | 0 (0.0%) |
| Total | 5,657 (100.0%) | 1,173 (100.0%) |
Household Vehicle Usage in Hauppauge
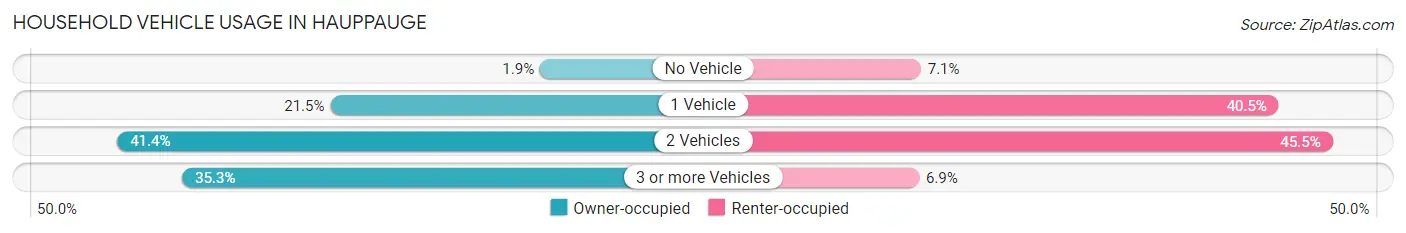
| Vehicles per Household | Owner-occupied | Renter-occupied |
| No Vehicle | 107 (1.9%) | 83 (7.1%) |
| 1 Vehicle | 1,214 (21.5%) | 475 (40.5%) |
| 2 Vehicles | 2,339 (41.3%) | 534 (45.5%) |
| 3 or more Vehicles | 1,997 (35.3%) | 81 (6.9%) |
| Total | 5,657 (100.0%) | 1,173 (100.0%) |
Real Estate & Mortgages in Hauppauge
Real Estate and Mortgage Overview in Hauppauge
| Characteristic | Without Mortgage | With Mortgage |
| Housing Units | 2,183 | 3,474 |
| Median Property Value | $605,100 | $627,000 |
| Median Household Income | $123,807 | $1,959 |
| Monthly Housing Costs | $1,501 | $2,265 |
| Real Estate Taxes | $10,001 | $84 |
Property Value by Mortgage Status in Hauppauge
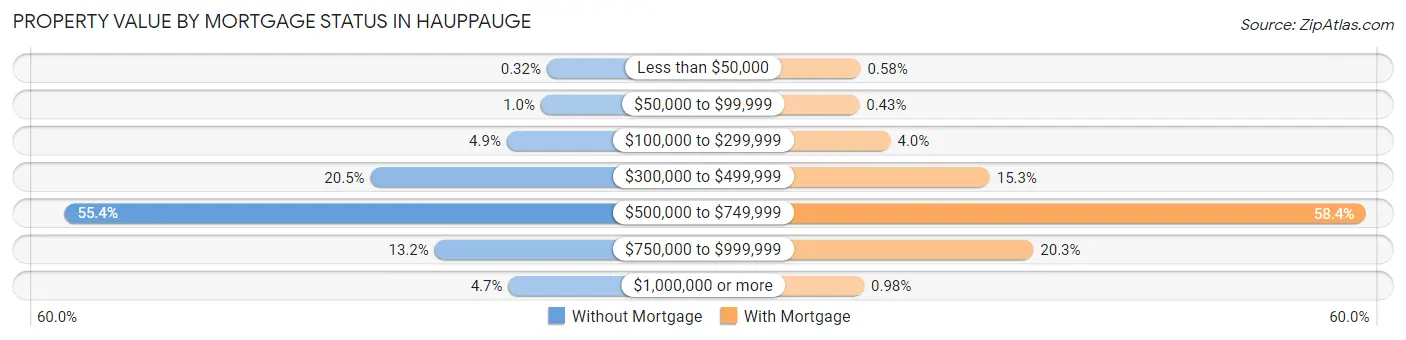
| Property Value | Without Mortgage | With Mortgage |
| Less than $50,000 | 7 (0.3%) | 20 (0.6%) |
| $50,000 to $99,999 | 22 (1.0%) | 15 (0.4%) |
| $100,000 to $299,999 | 107 (4.9%) | 139 (4.0%) |
| $300,000 to $499,999 | 447 (20.5%) | 533 (15.3%) |
| $500,000 to $749,999 | 1,210 (55.4%) | 2,027 (58.4%) |
| $750,000 to $999,999 | 287 (13.2%) | 706 (20.3%) |
| $1,000,000 or more | 103 (4.7%) | 34 (1.0%) |
| Total | 2,183 (100.0%) | 3,474 (100.0%) |
Household Income by Mortgage Status in Hauppauge
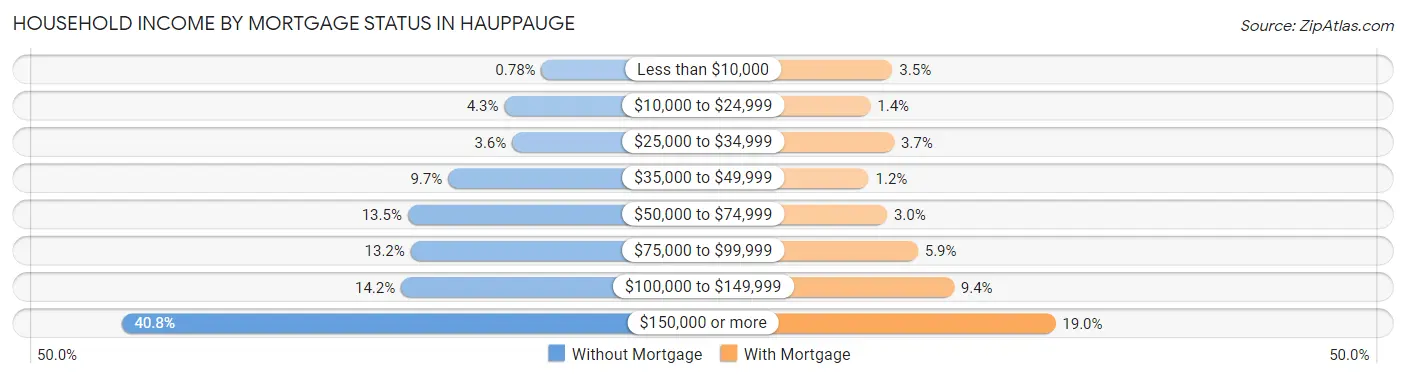
| Household Income | Without Mortgage | With Mortgage |
| Less than $10,000 | 17 (0.8%) | 122 (3.5%) |
| $10,000 to $24,999 | 94 (4.3%) | 49 (1.4%) |
| $25,000 to $34,999 | 78 (3.6%) | 127 (3.7%) |
| $35,000 to $49,999 | 211 (9.7%) | 43 (1.2%) |
| $50,000 to $74,999 | 295 (13.5%) | 104 (3.0%) |
| $75,000 to $99,999 | 289 (13.2%) | 206 (5.9%) |
| $100,000 to $149,999 | 309 (14.1%) | 325 (9.4%) |
| $150,000 or more | 890 (40.8%) | 661 (19.0%) |
| Total | 2,183 (100.0%) | 3,474 (100.0%) |
Property Value to Household Income Ratio in Hauppauge
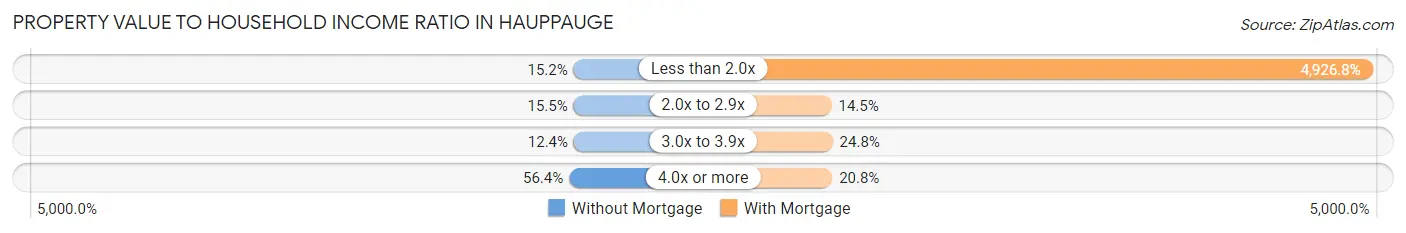
| Value-to-Income Ratio | Without Mortgage | With Mortgage |
| Less than 2.0x | 331 (15.2%) | 171,157 (4,926.8%) |
| 2.0x to 2.9x | 338 (15.5%) | 502 (14.4%) |
| 3.0x to 3.9x | 270 (12.4%) | 860 (24.8%) |
| 4.0x or more | 1,231 (56.4%) | 721 (20.7%) |
| Total | 2,183 (100.0%) | 3,474 (100.0%) |
Real Estate Taxes by Mortgage Status in Hauppauge
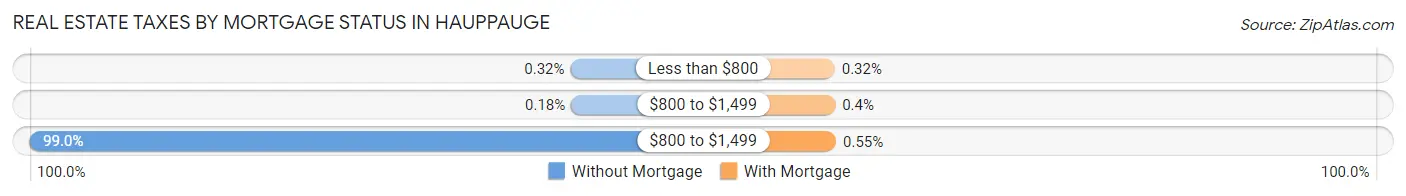
| Property Taxes | Without Mortgage | With Mortgage |
| Less than $800 | 7 (0.3%) | 11 (0.3%) |
| $800 to $1,499 | 4 (0.2%) | 14 (0.4%) |
| $800 to $1,499 | 2,161 (99.0%) | 19 (0.5%) |
| Total | 2,183 (100.0%) | 3,474 (100.0%) |
Health & Disability in Hauppauge
Health Insurance Coverage by Age in Hauppauge
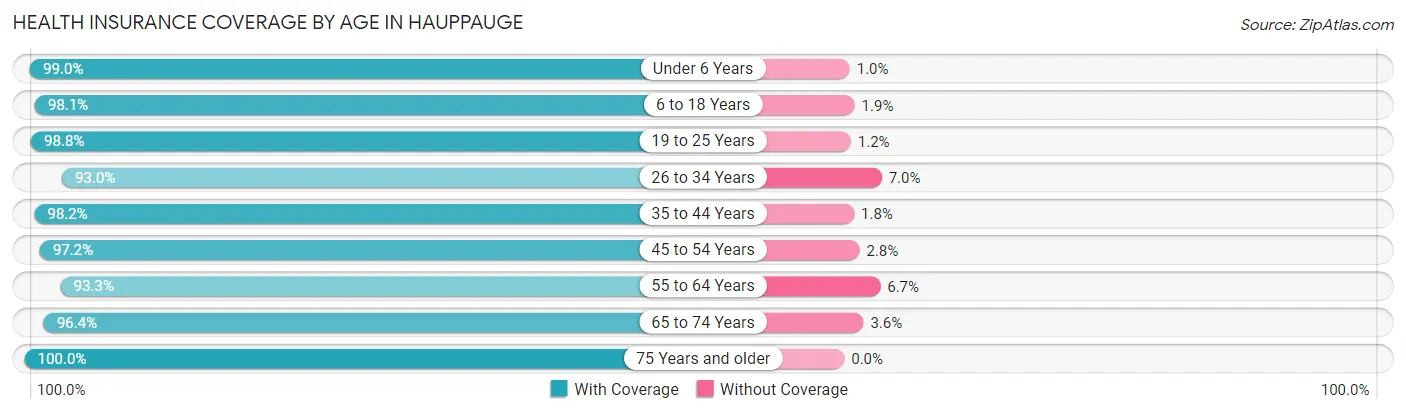
| Age Bracket | With Coverage | Without Coverage |
| Under 6 Years | 1,258 (99.0%) | 13 (1.0%) |
| 6 to 18 Years | 2,903 (98.1%) | 57 (1.9%) |
| 19 to 25 Years | 1,943 (98.8%) | 24 (1.2%) |
| 26 to 34 Years | 1,933 (93.0%) | 145 (7.0%) |
| 35 to 44 Years | 2,144 (98.2%) | 40 (1.8%) |
| 45 to 54 Years | 2,870 (97.2%) | 84 (2.8%) |
| 55 to 64 Years | 3,240 (93.3%) | 233 (6.7%) |
| 65 to 74 Years | 1,893 (96.4%) | 70 (3.6%) |
| 75 Years and older | 1,538 (100.0%) | 0 (0.0%) |
| Total | 19,722 (96.7%) | 666 (3.3%) |
Health Insurance Coverage by Citizenship Status in Hauppauge
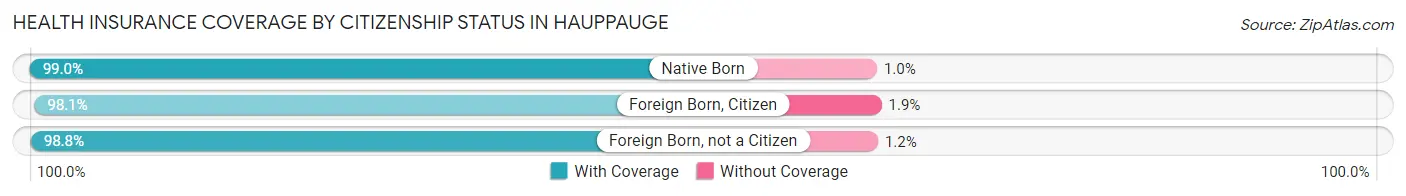
| Citizenship Status | With Coverage | Without Coverage |
| Native Born | 1,258 (99.0%) | 13 (1.0%) |
| Foreign Born, Citizen | 2,903 (98.1%) | 57 (1.9%) |
| Foreign Born, not a Citizen | 1,943 (98.8%) | 24 (1.2%) |
Health Insurance Coverage by Household Income in Hauppauge
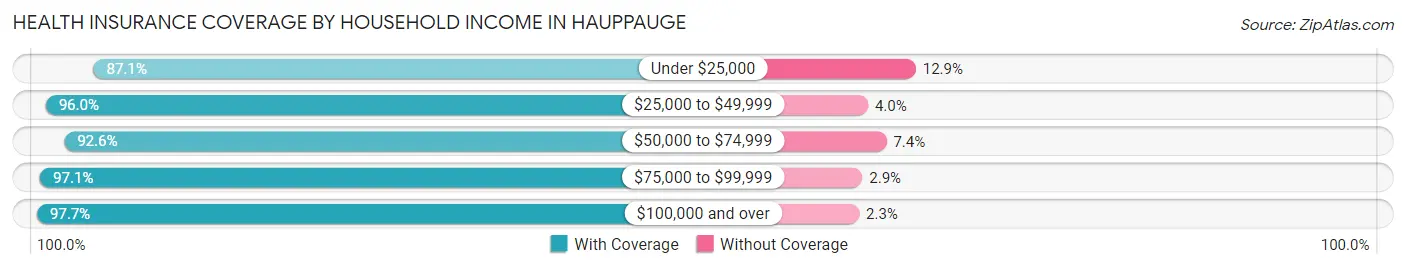
| Household Income | With Coverage | Without Coverage |
| Under $25,000 | 781 (87.1%) | 116 (12.9%) |
| $25,000 to $49,999 | 995 (96.0%) | 41 (4.0%) |
| $50,000 to $74,999 | 1,333 (92.6%) | 107 (7.4%) |
| $75,000 to $99,999 | 1,865 (97.1%) | 56 (2.9%) |
| $100,000 and over | 14,607 (97.7%) | 346 (2.3%) |
Public vs Private Health Insurance Coverage by Age in Hauppauge
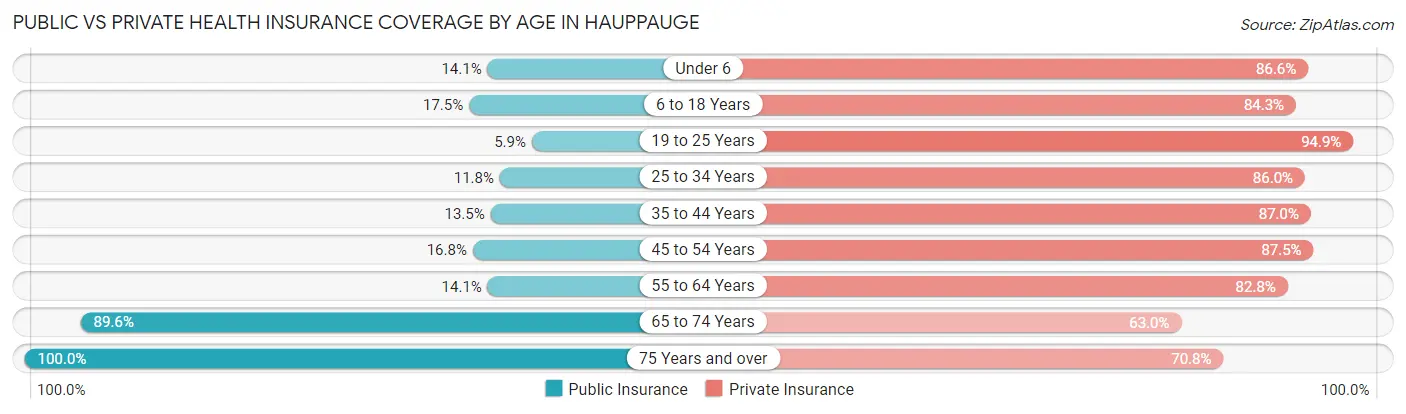
| Age Bracket | Public Insurance | Private Insurance |
| Under 6 | 179 (14.1%) | 1,100 (86.6%) |
| 6 to 18 Years | 518 (17.5%) | 2,495 (84.3%) |
| 19 to 25 Years | 115 (5.9%) | 1,867 (94.9%) |
| 25 to 34 Years | 245 (11.8%) | 1,786 (86.0%) |
| 35 to 44 Years | 295 (13.5%) | 1,901 (87.0%) |
| 45 to 54 Years | 497 (16.8%) | 2,586 (87.5%) |
| 55 to 64 Years | 488 (14.1%) | 2,874 (82.8%) |
| 65 to 74 Years | 1,759 (89.6%) | 1,237 (63.0%) |
| 75 Years and over | 1,538 (100.0%) | 1,089 (70.8%) |
| Total | 5,634 (27.6%) | 16,935 (83.1%) |
Disability Status by Sex by Age in Hauppauge
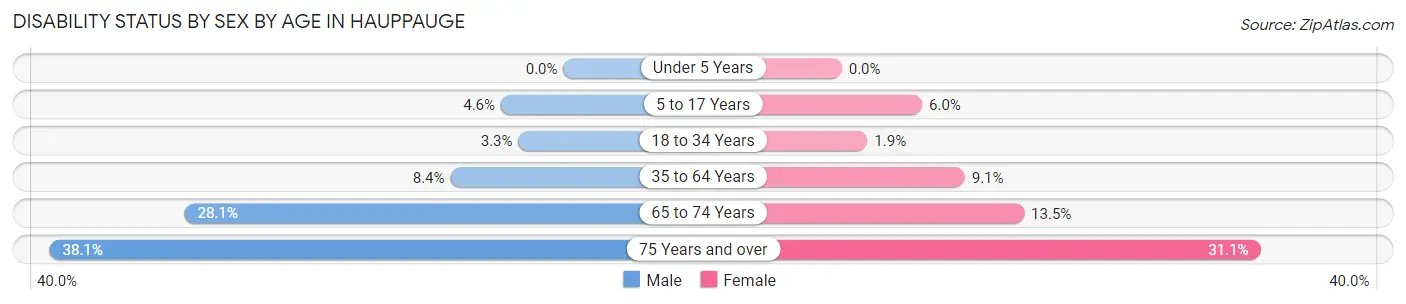
| Age Bracket | Male | Female |
| Under 5 Years | 0 (0.0%) | 0 (0.0%) |
| 5 to 17 Years | 62 (4.6%) | 86 (6.0%) |
| 18 to 34 Years | 72 (3.3%) | 40 (1.9%) |
| 35 to 64 Years | 364 (8.4%) | 390 (9.1%) |
| 65 to 74 Years | 311 (28.1%) | 116 (13.5%) |
| 75 Years and over | 254 (38.1%) | 271 (31.1%) |
Disability Class by Sex by Age in Hauppauge
Disability Class: Hearing Difficulty
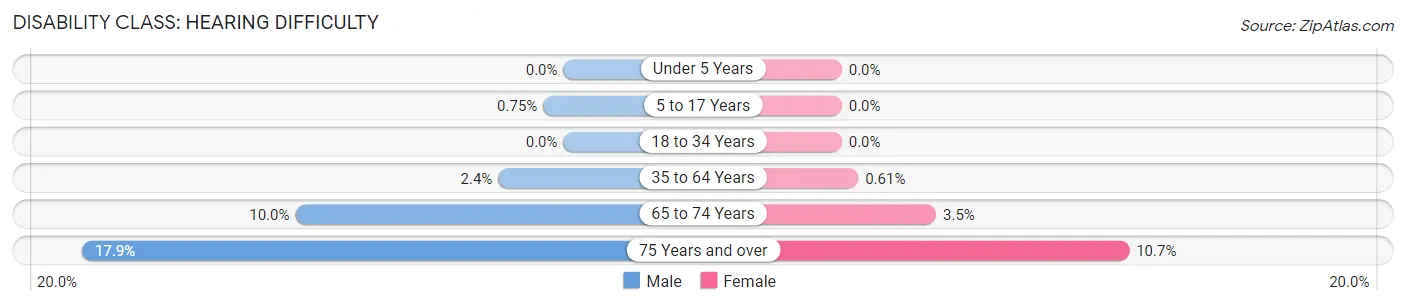
| Age Bracket | Male | Female |
| Under 5 Years | 0 (0.0%) | 0 (0.0%) |
| 5 to 17 Years | 10 (0.7%) | 0 (0.0%) |
| 18 to 34 Years | 0 (0.0%) | 0 (0.0%) |
| 35 to 64 Years | 105 (2.4%) | 26 (0.6%) |
| 65 to 74 Years | 110 (10.0%) | 30 (3.5%) |
| 75 Years and over | 119 (17.9%) | 93 (10.7%) |
Disability Class: Vision Difficulty
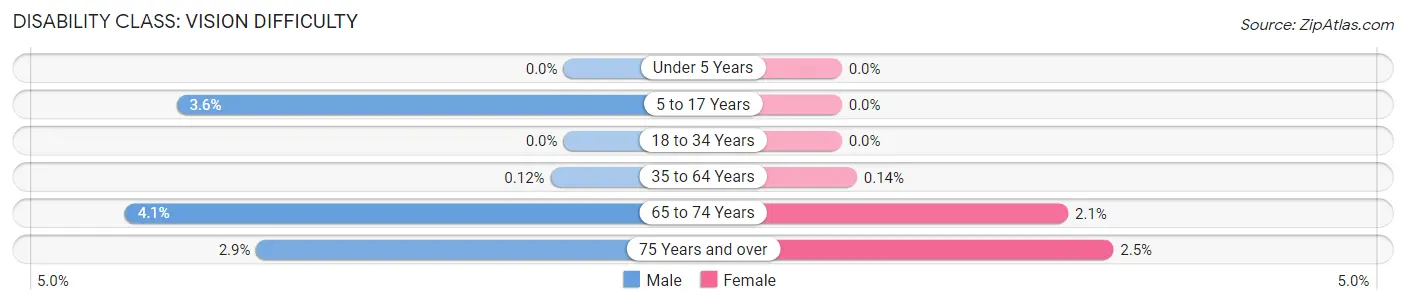
| Age Bracket | Male | Female |
| Under 5 Years | 0 (0.0%) | 0 (0.0%) |
| 5 to 17 Years | 48 (3.6%) | 0 (0.0%) |
| 18 to 34 Years | 0 (0.0%) | 0 (0.0%) |
| 35 to 64 Years | 5 (0.1%) | 6 (0.1%) |
| 65 to 74 Years | 45 (4.1%) | 18 (2.1%) |
| 75 Years and over | 19 (2.9%) | 22 (2.5%) |
Disability Class: Cognitive Difficulty
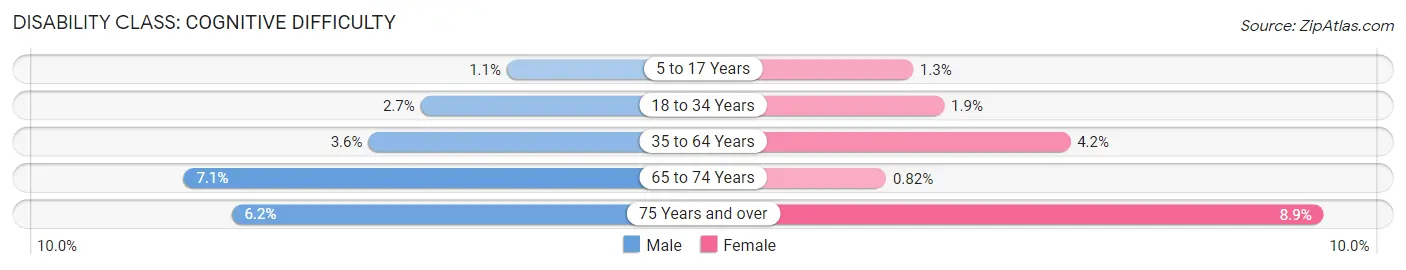
| Age Bracket | Male | Female |
| 5 to 17 Years | 14 (1.1%) | 19 (1.3%) |
| 18 to 34 Years | 57 (2.6%) | 40 (1.9%) |
| 35 to 64 Years | 157 (3.6%) | 181 (4.2%) |
| 65 to 74 Years | 78 (7.0%) | 7 (0.8%) |
| 75 Years and over | 41 (6.2%) | 78 (8.9%) |
Disability Class: Ambulatory Difficulty
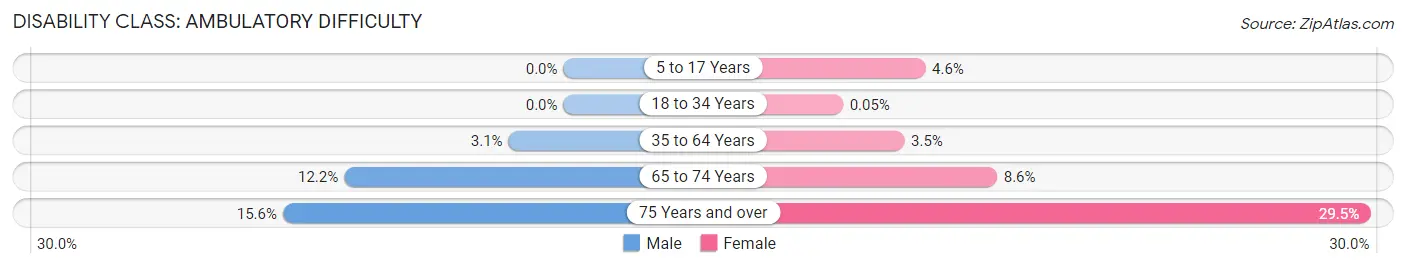
| Age Bracket | Male | Female |
| 5 to 17 Years | 0 (0.0%) | 67 (4.6%) |
| 18 to 34 Years | 0 (0.0%) | 1 (0.1%) |
| 35 to 64 Years | 133 (3.1%) | 148 (3.5%) |
| 65 to 74 Years | 135 (12.2%) | 74 (8.6%) |
| 75 Years and over | 104 (15.6%) | 257 (29.5%) |
Disability Class: Self-Care Difficulty
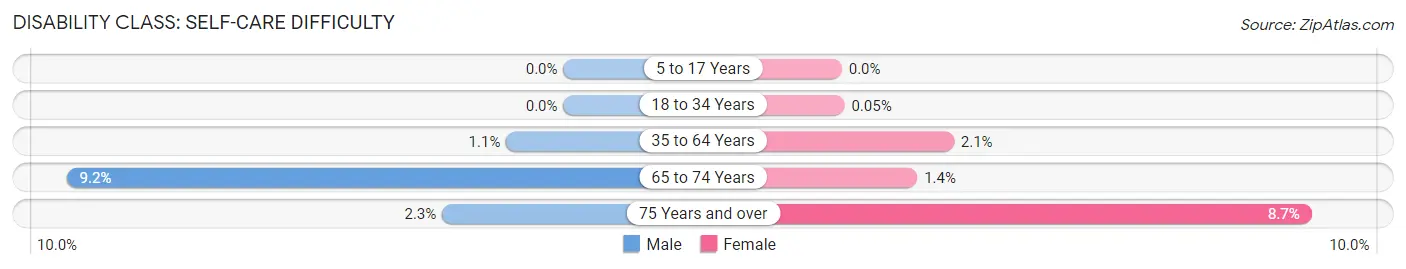
| Age Bracket | Male | Female |
| 5 to 17 Years | 0 (0.0%) | 0 (0.0%) |
| 18 to 34 Years | 0 (0.0%) | 1 (0.1%) |
| 35 to 64 Years | 46 (1.1%) | 89 (2.1%) |
| 65 to 74 Years | 102 (9.2%) | 12 (1.4%) |
| 75 Years and over | 15 (2.2%) | 76 (8.7%) |
Technology Access in Hauppauge
Computing Device Access in Hauppauge
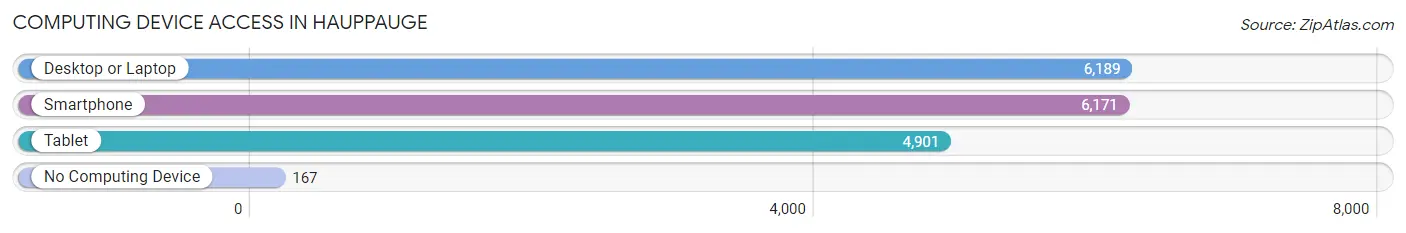
| Device Type | # Households | % Households |
| Desktop or Laptop | 6,189 | 90.6% |
| Smartphone | 6,171 | 90.3% |
| Tablet | 4,901 | 71.8% |
| No Computing Device | 167 | 2.5% |
| Total | 6,830 | 100.0% |
Internet Access in Hauppauge
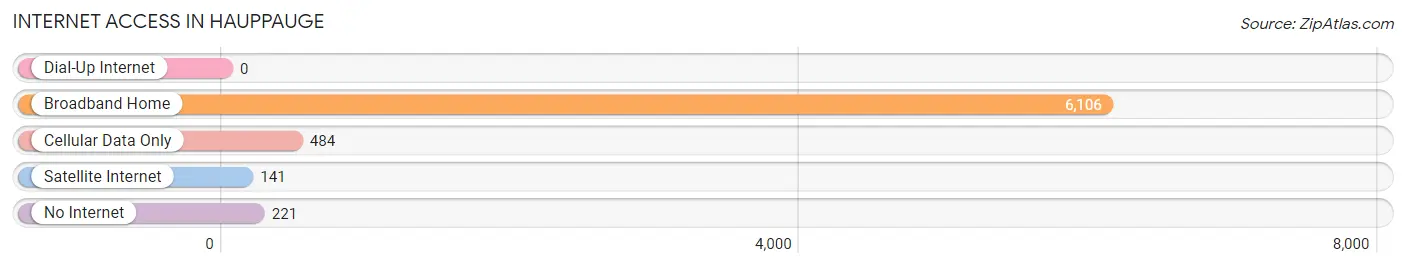
| Internet Type | # Households | % Households |
| Dial-Up Internet | 0 | 0.0% |
| Broadband Home | 6,106 | 89.4% |
| Cellular Data Only | 484 | 7.1% |
| Satellite Internet | 141 | 2.1% |
| No Internet | 221 | 3.2% |
| Total | 6,830 | 100.0% |
Hauppauge Summary
Hauppauge is a hamlet located in the Town of Islip in Suffolk County, New York. It is located on the South Shore of Long Island, approximately 50 miles east of New York City. The hamlet is home to a population of approximately 20,000 people, and is a popular destination for commuters due to its proximity to New York City.
History
Hauppauge was originally inhabited by the Secatogue Native American tribe. The area was first settled by Europeans in 1653, when a group of English settlers purchased land from the Secatogue tribe. The hamlet was originally known as Smithtown, after the Smith family who owned much of the land in the area. The name was changed to Hauppauge in 1844, after the Hauppauge family, who had purchased the land from the Smiths.
The hamlet was largely agricultural until the 1950s, when the Long Island Expressway was built through the area. This made Hauppauge a popular destination for commuters, and the hamlet experienced a population boom. The hamlet was officially incorporated in 1967.
Geography
Hauppauge is located in the Town of Islip in Suffolk County, New York. It is located on the South Shore of Long Island, approximately 50 miles east of New York City. The hamlet is bordered by the hamlets of Commack to the north, Smithtown to the east, and Islip to the south. The hamlet is located in the Peconic Bay watershed.
The hamlet has a total area of 8.3 square miles, of which 8.2 square miles is land and 0.1 square miles is water. The hamlet is located on the South Shore of Long Island, and is home to several parks and nature preserves.
Economy
Hauppauge is a popular destination for commuters due to its proximity to New York City. The hamlet is home to several large businesses, including the Hauppauge Industrial Park, which is home to over 1,300 businesses. The hamlet is also home to several technology companies, including CA Technologies, Canon USA, and Symbol Technologies.
The hamlet is also home to several retail and dining establishments, including the Smith Haven Mall and the Hauppauge Plaza Shopping Center. The hamlet is also home to several hotels, including the Holiday Inn Express and the Marriott Residence Inn.
Demographics
As of the 2010 census, Hauppauge had a population of 20,882. The racial makeup of the hamlet was 79.2% White, 8.3% African American, 0.2% Native American, 6.2% Asian, and 4.2% from other races. Hispanic or Latino of any race were 11.7% of the population.
The median household income in the hamlet was $87,813, and the median family income was $97,917. The per capita income in the hamlet was $37,945. About 4.2% of families and 5.7% of the population were below the poverty line.
Common Questions
What is Per Capita Income in Hauppauge?
Per Capita income in Hauppauge is $59,784.
What is the Median Family Income in Hauppauge?
Median Family Income in Hauppauge is $161,053.
What is the Median Household income in Hauppauge?
Median Household Income in Hauppauge is $138,156.
What is Income or Wage Gap in Hauppauge?
Income or Wage Gap in Hauppauge is 32.4%.
Women in Hauppauge earn 67.6 cents for every dollar earned by a man.
What is Inequality or Gini Index in Hauppauge?
Inequality or Gini Index in Hauppauge is 0.41.
What is the Total Population of Hauppauge?
Total Population of Hauppauge is 20,401.
What is the Total Male Population of Hauppauge?
Total Male Population of Hauppauge is 10,240.
What is the Total Female Population of Hauppauge?
Total Female Population of Hauppauge is 10,161.
What is the Ratio of Males per 100 Females in Hauppauge?
There are 100.78 Males per 100 Females in Hauppauge.
What is the Ratio of Females per 100 Males in Hauppauge?
There are 99.23 Females per 100 Males in Hauppauge.
What is the Median Population Age in Hauppauge?
Median Population Age in Hauppauge is 43.4 Years.
What is the Average Family Size in Hauppauge
Average Family Size in Hauppauge is 3.4 People.
What is the Average Household Size in Hauppauge
Average Household Size in Hauppauge is 3.0 People.
How Large is the Labor Force in Hauppauge?
There are 11,344 People in the Labor Forcein in Hauppauge.
What is the Percentage of People in the Labor Force in Hauppauge?
67.1% of People are in the Labor Force in Hauppauge.
What is the Unemployment Rate in Hauppauge?
Unemployment Rate in Hauppauge is 5.1%.