Fair Haven, NY Map & Demographics
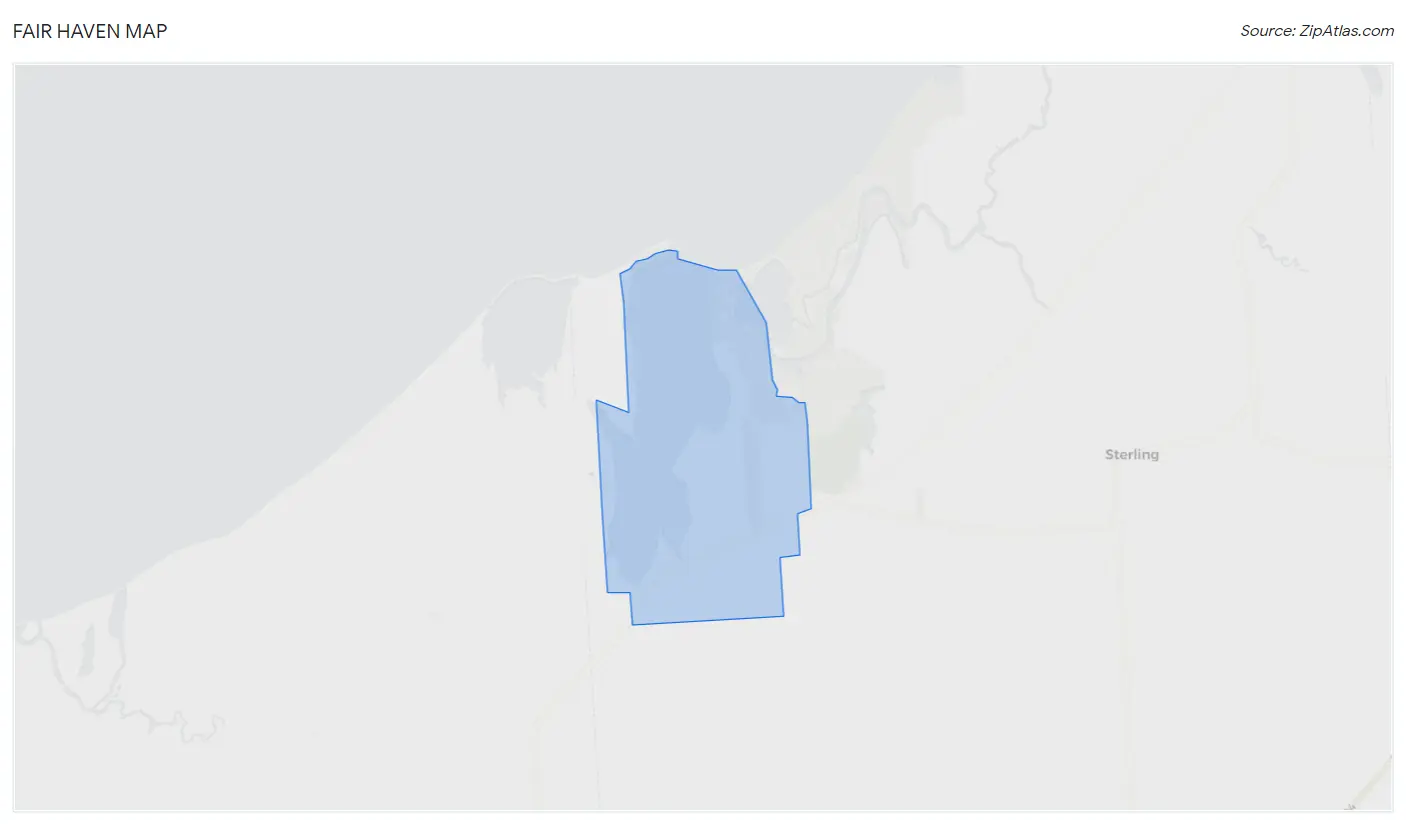
Fair Haven Map
Fair Haven Overview
$33,079
PER CAPITA INCOME
$70,455
AVG FAMILY INCOME
$59,018
AVG HOUSEHOLD INCOME
44.7%
WAGE / INCOME GAP [ % ]
55.3¢/ $1
WAGE / INCOME GAP [ $ ]
0.40
INEQUALITY / GINI INDEX
1,151
TOTAL POPULATION
591
MALE POPULATION
560
FEMALE POPULATION
105.54
MALES / 100 FEMALES
94.75
FEMALES / 100 MALES
49.5
MEDIAN AGE
2.9
AVG FAMILY SIZE
2.4
AVG HOUSEHOLD SIZE
615
LABOR FORCE [ PEOPLE ]
64.4%
PERCENT IN LABOR FORCE
2.4%
UNEMPLOYMENT RATE
Fair Haven Area Codes
Income in Fair Haven
Income Overview in Fair Haven
Per Capita Income in Fair Haven is $33,079, while median incomes of families and households are $70,455 and $59,018 respectively.
| Characteristic | Number | Measure |
| Per Capita Income | 1,151 | $33,079 |
| Median Family Income | 316 | $70,455 |
| Mean Family Income | 316 | $91,743 |
| Median Household Income | 485 | $59,018 |
| Mean Household Income | 485 | $79,047 |
| Income Deficit | 316 | $0 |
| Wage / Income Gap (%) | 1,151 | 44.69% |
| Wage / Income Gap ($) | 1,151 | 55.31¢ per $1 |
| Gini / Inequality Index | 1,151 | 0.40 |
Earnings by Sex in Fair Haven
Average Earnings in Fair Haven are $30,513, $45,000 for men and $24,891 for women, a difference of 44.7%.
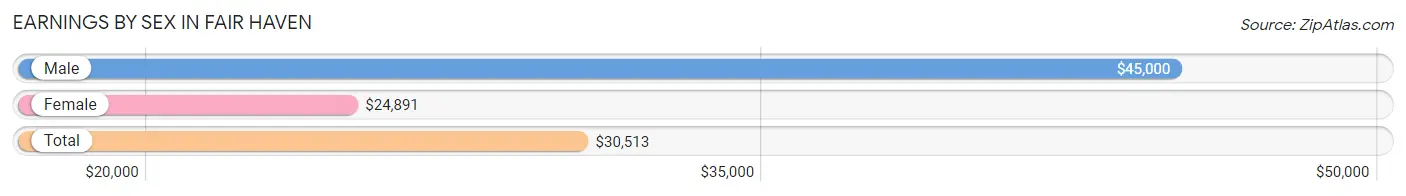
| Sex | Number | Average Earnings |
| Male | 336 (52.7%) | $45,000 |
| Female | 302 (47.3%) | $24,891 |
| Total | 638 (100.0%) | $30,513 |
Earnings by Sex by Income Bracket in Fair Haven
The most common earnings brackets in Fair Haven are $65,000 to $74,999 for men (58 | 17.3%) and $10,000 to $12,499 for women (49 | 16.2%).
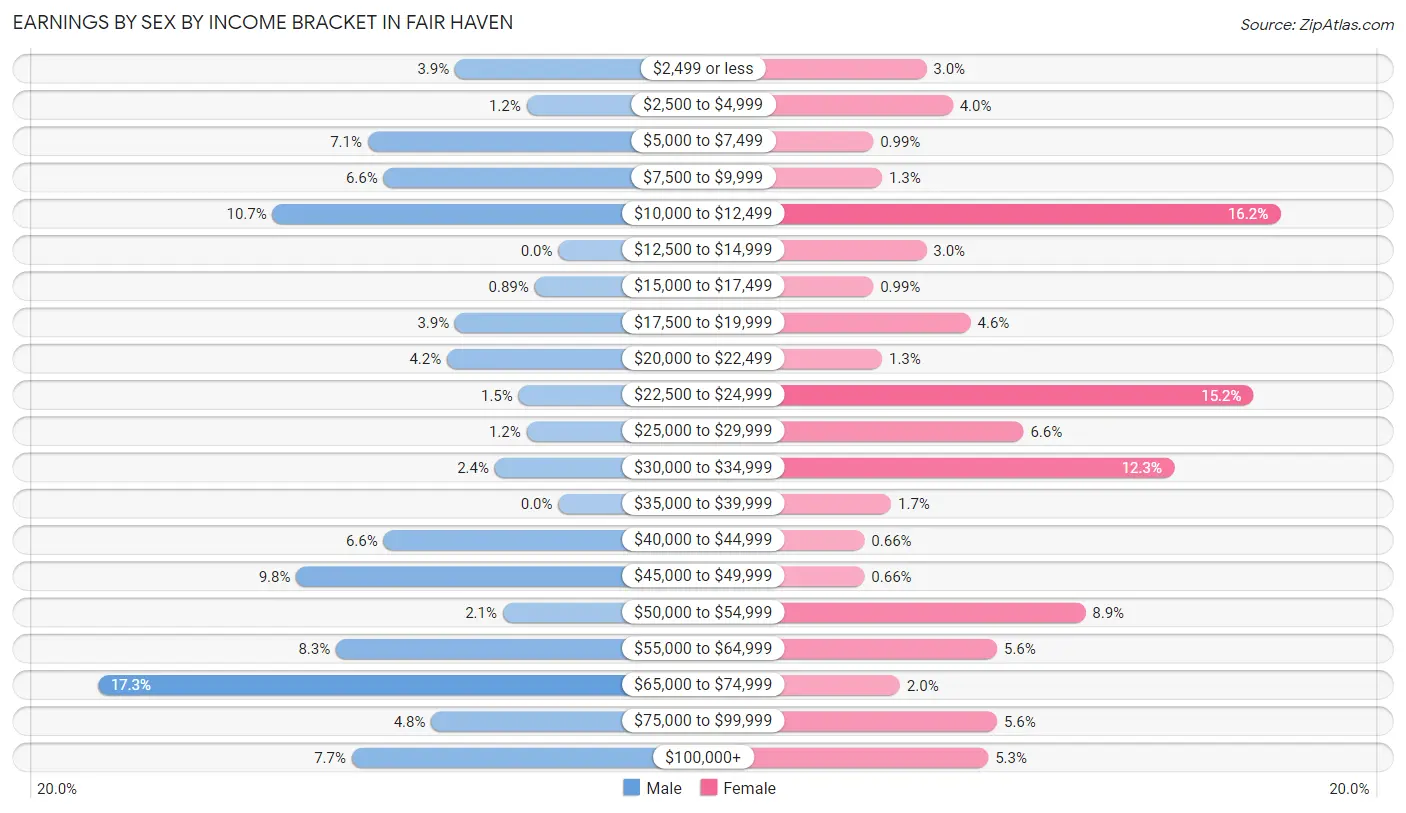
| Income | Male | Female |
| $2,499 or less | 13 (3.9%) | 9 (3.0%) |
| $2,500 to $4,999 | 4 (1.2%) | 12 (4.0%) |
| $5,000 to $7,499 | 24 (7.1%) | 3 (1.0%) |
| $7,500 to $9,999 | 22 (6.6%) | 4 (1.3%) |
| $10,000 to $12,499 | 36 (10.7%) | 49 (16.2%) |
| $12,500 to $14,999 | 0 (0.0%) | 9 (3.0%) |
| $15,000 to $17,499 | 3 (0.9%) | 3 (1.0%) |
| $17,500 to $19,999 | 13 (3.9%) | 14 (4.6%) |
| $20,000 to $22,499 | 14 (4.2%) | 4 (1.3%) |
| $22,500 to $24,999 | 5 (1.5%) | 46 (15.2%) |
| $25,000 to $29,999 | 4 (1.2%) | 20 (6.6%) |
| $30,000 to $34,999 | 8 (2.4%) | 37 (12.2%) |
| $35,000 to $39,999 | 0 (0.0%) | 5 (1.7%) |
| $40,000 to $44,999 | 22 (6.6%) | 2 (0.7%) |
| $45,000 to $49,999 | 33 (9.8%) | 2 (0.7%) |
| $50,000 to $54,999 | 7 (2.1%) | 27 (8.9%) |
| $55,000 to $64,999 | 28 (8.3%) | 17 (5.6%) |
| $65,000 to $74,999 | 58 (17.3%) | 6 (2.0%) |
| $75,000 to $99,999 | 16 (4.8%) | 17 (5.6%) |
| $100,000+ | 26 (7.7%) | 16 (5.3%) |
| Total | 336 (100.0%) | 302 (100.0%) |
Earnings by Sex by Educational Attainment in Fair Haven
Average earnings in Fair Haven are $49,545 for men and $30,772 for women, a difference of 37.9%. Men with an educational attainment of graduate degree enjoy the highest average annual earnings of $75,000, while those with less than high school education earn the least with $9,044. Women with an educational attainment of graduate degree earn the most with the average annual earnings of $61,875, while those with college or associate's degree education have the smallest earnings of $30,121.
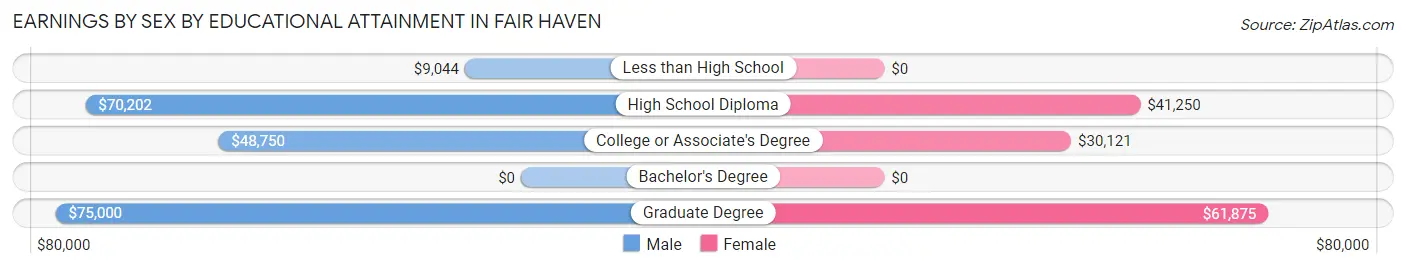
| Educational Attainment | Male Income | Female Income |
| Less than High School | $9,044 | $0 |
| High School Diploma | $70,202 | $41,250 |
| College or Associate's Degree | $48,750 | $30,121 |
| Bachelor's Degree | - | - |
| Graduate Degree | $75,000 | $61,875 |
| Total | $49,545 | $30,772 |
Family Income in Fair Haven
Family Income Brackets in Fair Haven
According to the Fair Haven family income data, there are 102 families falling into the $50,000 to $74,999 income range, which is the most common income bracket and makes up 32.3% of all families.
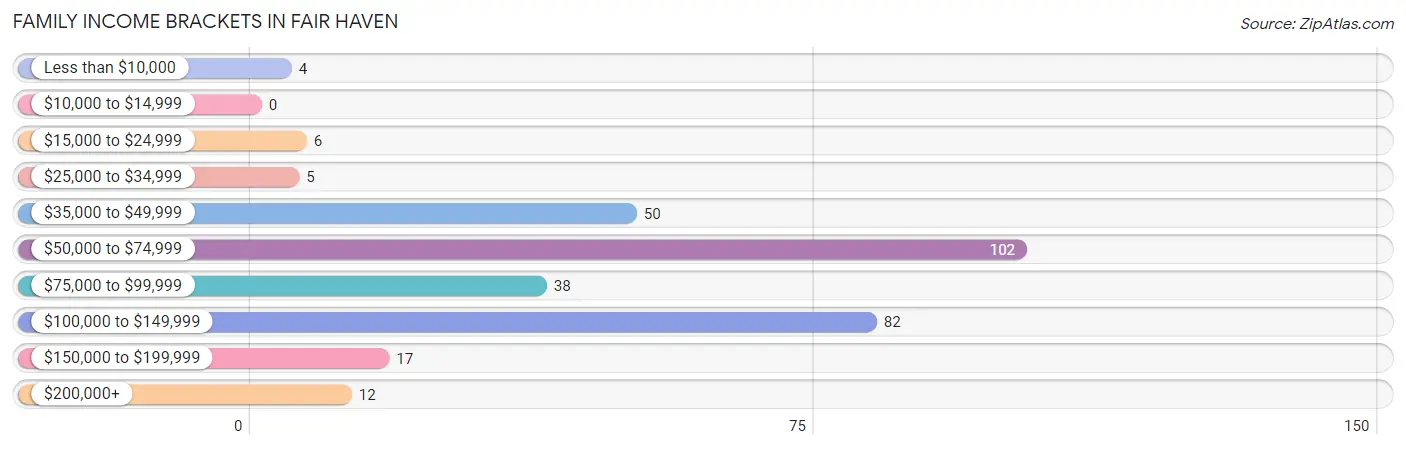
| Income Bracket | # Families | % Families |
| Less than $10,000 | 4 | 1.3% |
| $10,000 to $14,999 | 0 | 0.0% |
| $15,000 to $24,999 | 6 | 1.9% |
| $25,000 to $34,999 | 5 | 1.6% |
| $35,000 to $49,999 | 50 | 15.8% |
| $50,000 to $74,999 | 102 | 32.3% |
| $75,000 to $99,999 | 38 | 12.0% |
| $100,000 to $149,999 | 82 | 25.9% |
| $150,000 to $199,999 | 17 | 5.4% |
| $200,000+ | 12 | 3.8% |
Family Income by Famaliy Size in Fair Haven
4-person families (54 | 17.1%) account for the highest median family income in Fair Haven with $128,393 per family, while 2-person families (176 | 55.7%) have the highest median income of $32,159 per family member.
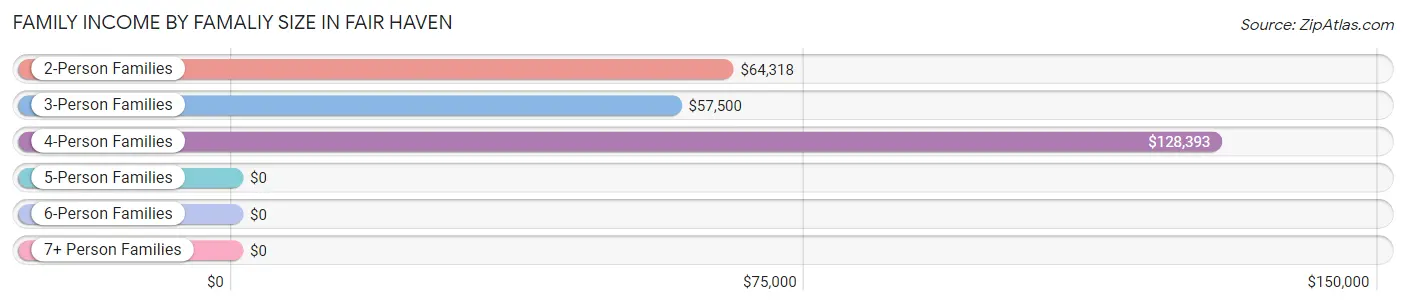
| Income Bracket | # Families | Median Income |
| 2-Person Families | 176 (55.7%) | $64,318 |
| 3-Person Families | 50 (15.8%) | $57,500 |
| 4-Person Families | 54 (17.1%) | $128,393 |
| 5-Person Families | 17 (5.4%) | $0 |
| 6-Person Families | 19 (6.0%) | $0 |
| 7+ Person Families | 0 (0.0%) | $0 |
| Total | 316 (100.0%) | $70,455 |
Family Income by Number of Earners in Fair Haven
The median family income in Fair Haven is $70,455, with families comprising 3+ earners (47) having the highest median family income of $129,152, while families with no earners (66) have the lowest median family income of $51,736, accounting for 14.9% and 20.9% of families, respectively.
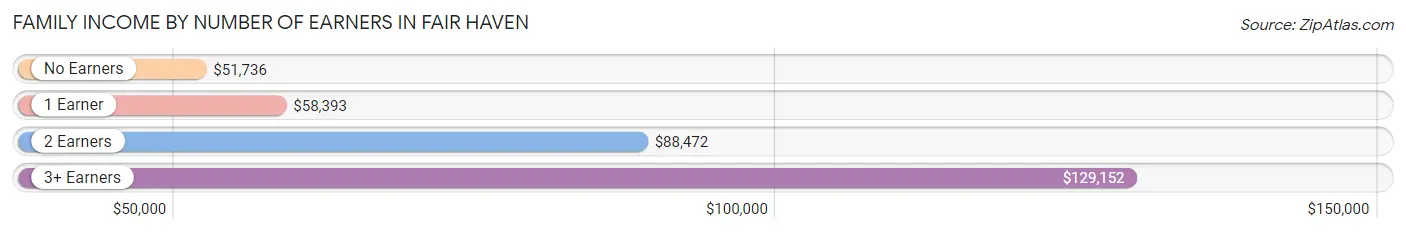
| Number of Earners | # Families | Median Income |
| No Earners | 66 (20.9%) | $51,736 |
| 1 Earner | 98 (31.0%) | $58,393 |
| 2 Earners | 105 (33.2%) | $88,472 |
| 3+ Earners | 47 (14.9%) | $129,152 |
| Total | 316 (100.0%) | $70,455 |
Household Income in Fair Haven
Household Income Brackets in Fair Haven
With 145 households falling in the category, the $50,000 to $74,999 income range is the most frequent in Fair Haven, accounting for 29.9% of all households. In contrast, only 7 households (1.4%) fall into the $10,000 to $14,999 income bracket, making it the least populous group.
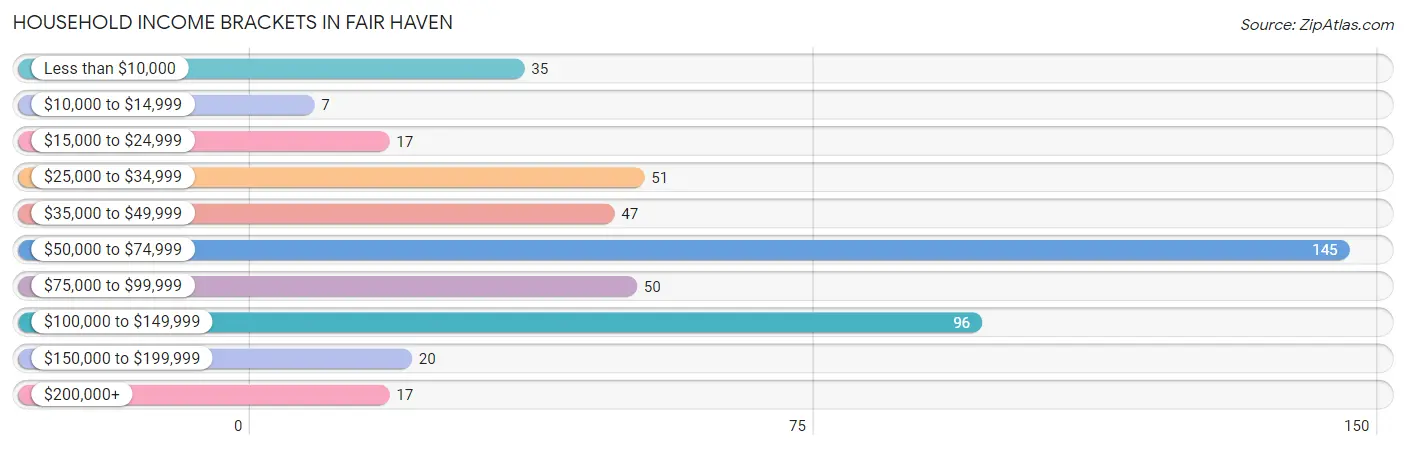
| Income Bracket | # Households | % Households |
| Less than $10,000 | 35 | 7.2% |
| $10,000 to $14,999 | 7 | 1.4% |
| $15,000 to $24,999 | 17 | 3.5% |
| $25,000 to $34,999 | 51 | 10.5% |
| $35,000 to $49,999 | 47 | 9.7% |
| $50,000 to $74,999 | 145 | 29.9% |
| $75,000 to $99,999 | 50 | 10.3% |
| $100,000 to $149,999 | 96 | 19.8% |
| $150,000 to $199,999 | 20 | 4.1% |
| $200,000+ | 17 | 3.5% |
Household Income by Householder Age in Fair Haven
The median household income in Fair Haven is $59,018, with the highest median household income of $88,906 found in the 45 to 64 years age bracket for the primary householder. A total of 224 households (46.2%) fall into this category.
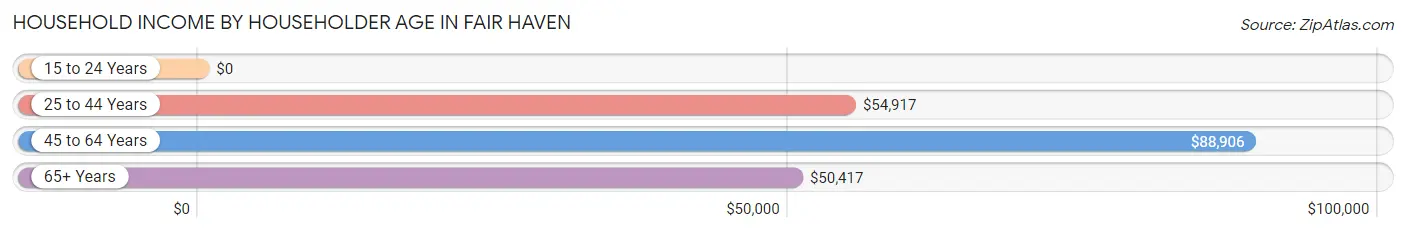
| Income Bracket | # Households | Median Income |
| 15 to 24 Years | 0 (0.0%) | $0 |
| 25 to 44 Years | 113 (23.3%) | $54,917 |
| 45 to 64 Years | 224 (46.2%) | $88,906 |
| 65+ Years | 148 (30.5%) | $50,417 |
| Total | 485 (100.0%) | $59,018 |
Poverty in Fair Haven
Income Below Poverty by Sex and Age in Fair Haven
With 13.3% poverty level for males and 5.2% for females among the residents of Fair Haven, 16 and 17 year old males and 12 to 14 year old females are the most vulnerable to poverty, with 7 males (100.0%) and 4 females (66.7%) in their respective age groups living below the poverty level.
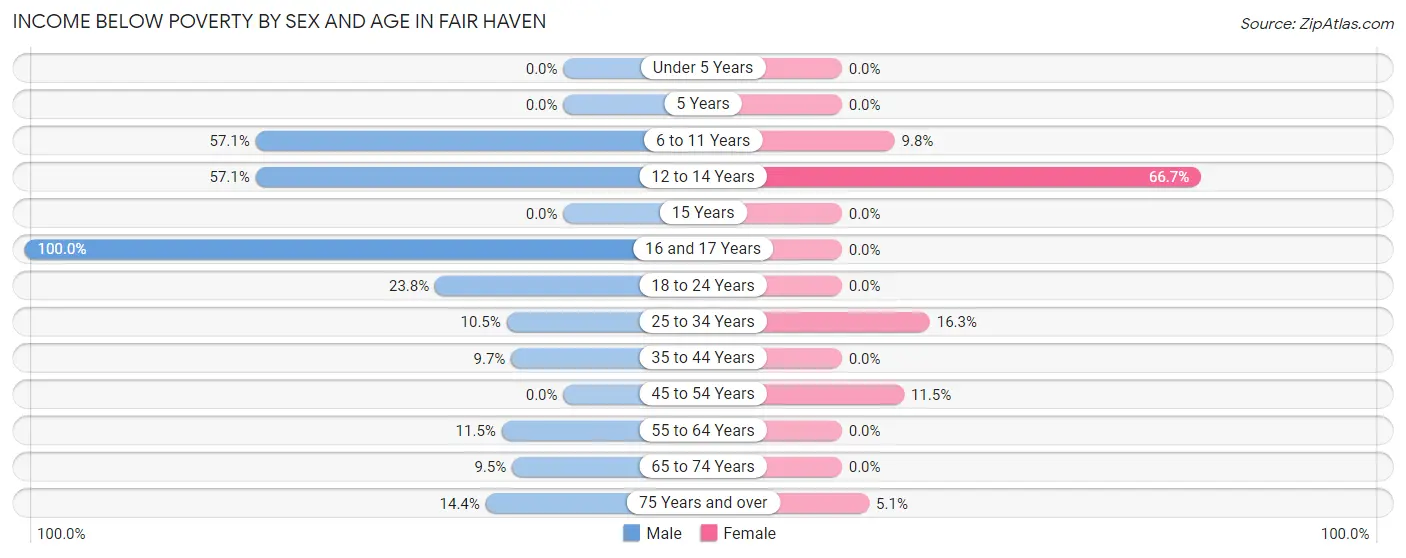
| Age Bracket | Male | Female |
| Under 5 Years | 0 (0.0%) | 0 (0.0%) |
| 5 Years | 0 (0.0%) | 0 (0.0%) |
| 6 to 11 Years | 4 (57.1%) | 5 (9.8%) |
| 12 to 14 Years | 8 (57.1%) | 4 (66.7%) |
| 15 Years | 0 (0.0%) | 0 (0.0%) |
| 16 and 17 Years | 7 (100.0%) | 0 (0.0%) |
| 18 to 24 Years | 15 (23.8%) | 0 (0.0%) |
| 25 to 34 Years | 4 (10.5%) | 8 (16.3%) |
| 35 to 44 Years | 6 (9.7%) | 0 (0.0%) |
| 45 to 54 Years | 0 (0.0%) | 9 (11.5%) |
| 55 to 64 Years | 15 (11.5%) | 0 (0.0%) |
| 65 to 74 Years | 4 (9.5%) | 0 (0.0%) |
| 75 Years and over | 14 (14.4%) | 3 (5.1%) |
| Total | 77 (13.3%) | 29 (5.2%) |
Income Above Poverty by Sex and Age in Fair Haven
According to the poverty statistics in Fair Haven, males aged under 5 years and females aged under 5 years are the age groups that are most secure financially, with 100.0% of males and 100.0% of females in these age groups living above the poverty line.
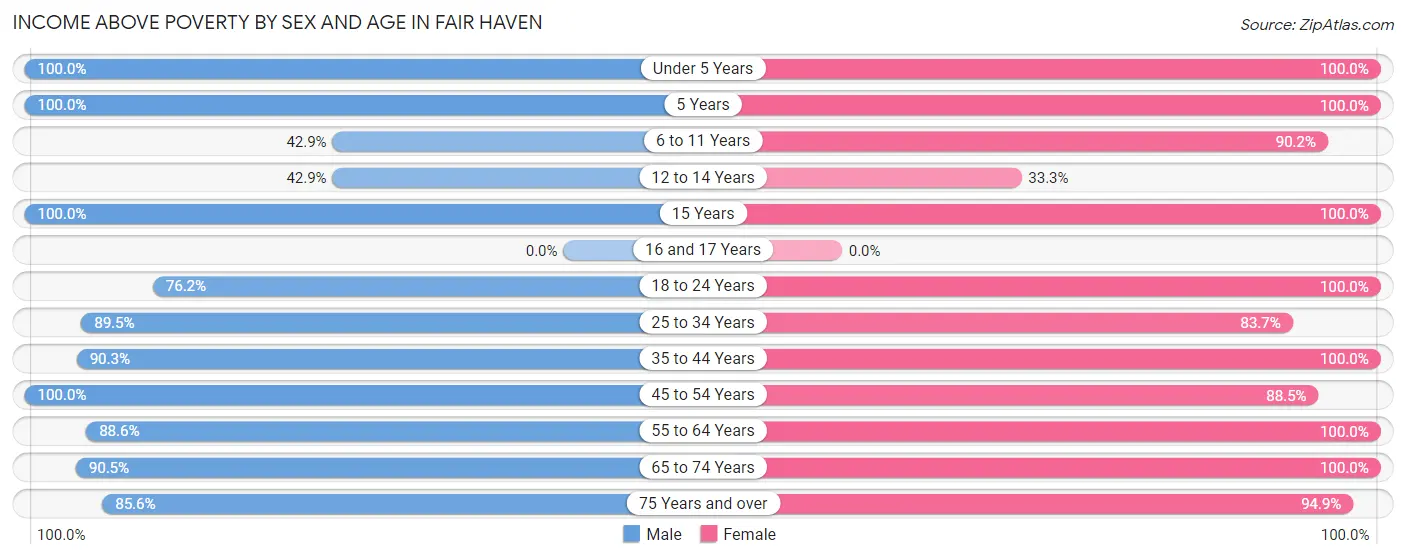
| Age Bracket | Male | Female |
| Under 5 Years | 53 (100.0%) | 25 (100.0%) |
| 5 Years | 5 (100.0%) | 14 (100.0%) |
| 6 to 11 Years | 3 (42.9%) | 46 (90.2%) |
| 12 to 14 Years | 6 (42.9%) | 2 (33.3%) |
| 15 Years | 12 (100.0%) | 4 (100.0%) |
| 16 and 17 Years | 0 (0.0%) | 0 (0.0%) |
| 18 to 24 Years | 48 (76.2%) | 65 (100.0%) |
| 25 to 34 Years | 34 (89.5%) | 41 (83.7%) |
| 35 to 44 Years | 56 (90.3%) | 51 (100.0%) |
| 45 to 54 Years | 50 (100.0%) | 69 (88.5%) |
| 55 to 64 Years | 116 (88.5%) | 108 (100.0%) |
| 65 to 74 Years | 38 (90.5%) | 45 (100.0%) |
| 75 Years and over | 83 (85.6%) | 56 (94.9%) |
| Total | 504 (86.8%) | 526 (94.8%) |
Income Below Poverty Among Married-Couple Families in Fair Haven
The poverty statistics for married-couple families in Fair Haven show that 2.9% or 8 of the total 271 families live below the poverty line. Families with 3 or 4 children have the highest poverty rate of 12.1%, comprising of 4 families. On the other hand, families with 1 or 2 children have the lowest poverty rate of 0.0%, which includes 0 families.
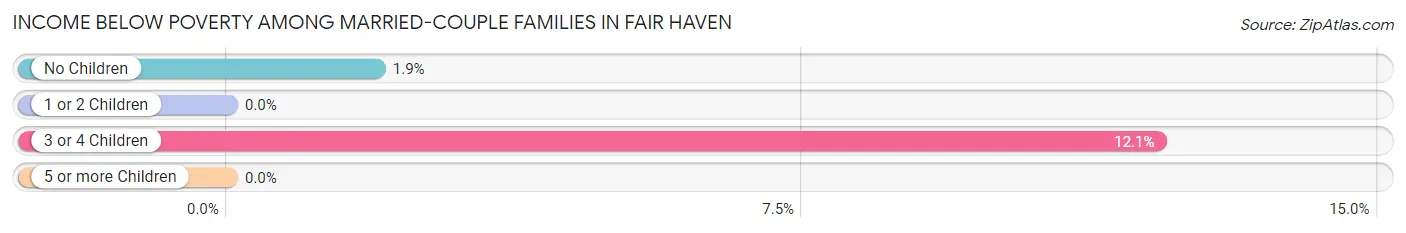
| Children | Above Poverty | Below Poverty |
| No Children | 203 (98.1%) | 4 (1.9%) |
| 1 or 2 Children | 31 (100.0%) | 0 (0.0%) |
| 3 or 4 Children | 29 (87.9%) | 4 (12.1%) |
| 5 or more Children | 0 (0.0%) | 0 (0.0%) |
| Total | 263 (97.1%) | 8 (2.9%) |
Income Below Poverty Among Single-Parent Households in Fair Haven
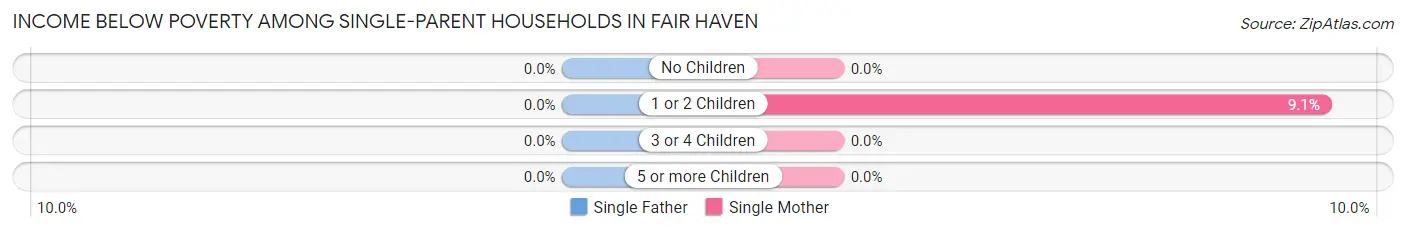
| Children | Single Father | Single Mother |
| No Children | 0 (0.0%) | 0 (0.0%) |
| 1 or 2 Children | 0 (0.0%) | 3 (9.1%) |
| 3 or 4 Children | 0 (0.0%) | 0 (0.0%) |
| 5 or more Children | 0 (0.0%) | 0 (0.0%) |
| Total | 0 (0.0%) | 3 (7.5%) |
Income Below Poverty Among Married-Couple vs Single-Parent Households in Fair Haven
The poverty data for Fair Haven shows that 8 of the married-couple family households (2.9%) and 3 of the single-parent households (6.7%) are living below the poverty level. Within the married-couple family households, those with 3 or 4 children have the highest poverty rate, with 4 households (12.1%) falling below the poverty line. Among the single-parent households, those with 1 or 2 children have the highest poverty rate, with 3 household (9.1%) living below poverty.
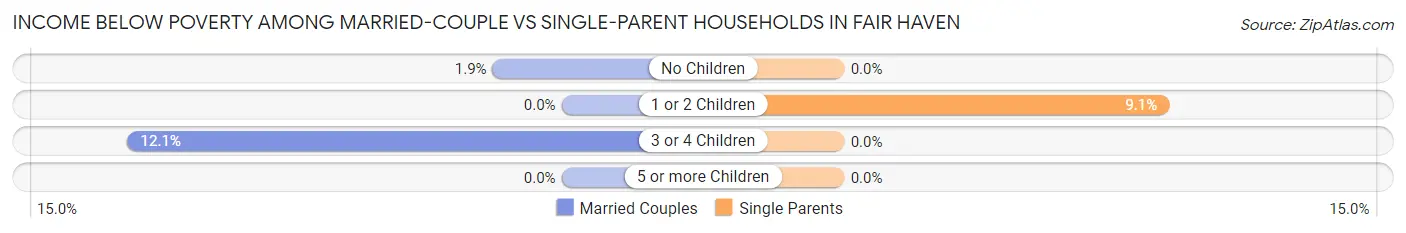
| Children | Married-Couple Families | Single-Parent Households |
| No Children | 4 (1.9%) | 0 (0.0%) |
| 1 or 2 Children | 0 (0.0%) | 3 (9.1%) |
| 3 or 4 Children | 4 (12.1%) | 0 (0.0%) |
| 5 or more Children | 0 (0.0%) | 0 (0.0%) |
| Total | 8 (2.9%) | 3 (6.7%) |
Race in Fair Haven
The most populous races in Fair Haven are White / Caucasian (1,102 | 95.7%), Two or more Races (32 | 2.8%), and Black / African American (10 | 0.9%).
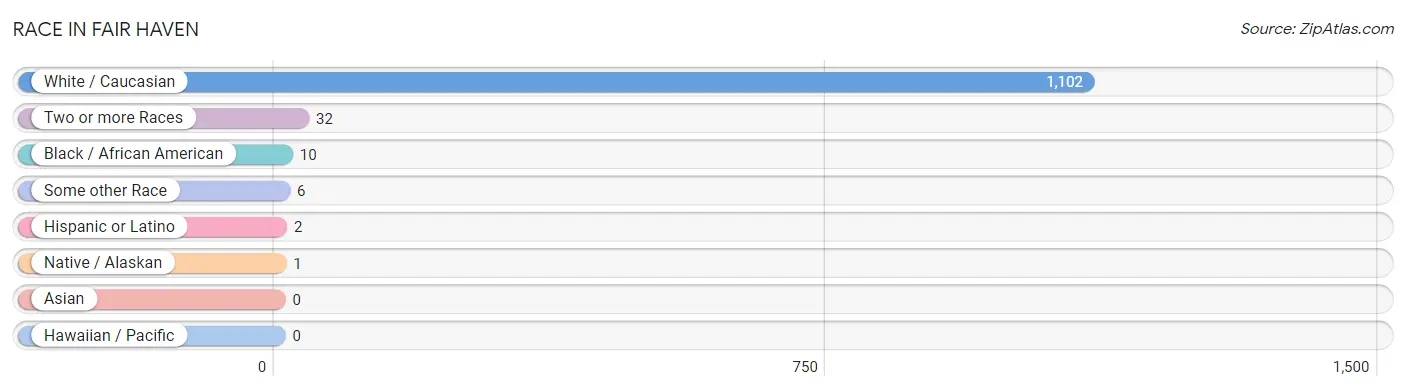
| Race | # Population | % Population |
| Asian | 0 | 0.0% |
| Black / African American | 10 | 0.9% |
| Hawaiian / Pacific | 0 | 0.0% |
| Hispanic or Latino | 2 | 0.2% |
| Native / Alaskan | 1 | 0.1% |
| White / Caucasian | 1,102 | 95.7% |
| Two or more Races | 32 | 2.8% |
| Some other Race | 6 | 0.5% |
| Total | 1,151 | 100.0% |
Ancestry in Fair Haven
The most populous ancestries reported in Fair Haven are German (357 | 31.0%), Irish (226 | 19.6%), English (203 | 17.6%), Italian (119 | 10.3%), and Polish (83 | 7.2%), together accounting for 85.9% of all Fair Haven residents.
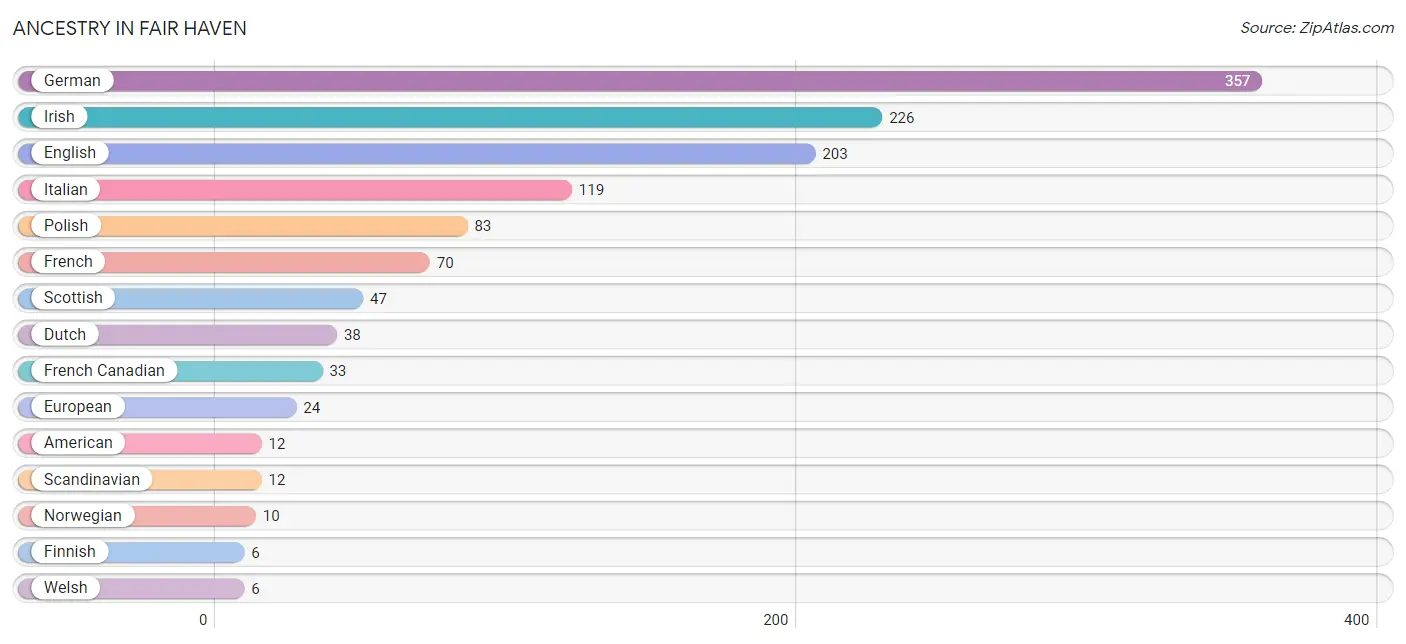
| Ancestry | # Population | % Population |
| American | 12 | 1.0% |
| Armenian | 3 | 0.3% |
| British | 2 | 0.2% |
| Chippewa | 1 | 0.1% |
| Danish | 2 | 0.2% |
| Dutch | 38 | 3.3% |
| English | 203 | 17.6% |
| European | 24 | 2.1% |
| Finnish | 6 | 0.5% |
| French | 70 | 6.1% |
| French Canadian | 33 | 2.9% |
| German | 357 | 31.0% |
| Irish | 226 | 19.6% |
| Italian | 119 | 10.3% |
| Latvian | 3 | 0.3% |
| Lumbee | 1 | 0.1% |
| Norwegian | 10 | 0.9% |
| Pennsylvania German | 4 | 0.4% |
| Polish | 83 | 7.2% |
| Scandinavian | 12 | 1.0% |
| Scotch-Irish | 5 | 0.4% |
| Scottish | 47 | 4.1% |
| Swedish | 3 | 0.3% |
| Ukrainian | 5 | 0.4% |
| Welsh | 6 | 0.5% | View All 25 Rows |
Immigrants in Fair Haven
The most numerous immigrant groups reported in Fair Haven came from Europe (30 | 2.6%), Germany (30 | 2.6%), Western Europe (30 | 2.6%), and Canada (2 | 0.2%), together accounting for 8.0% of all Fair Haven residents.
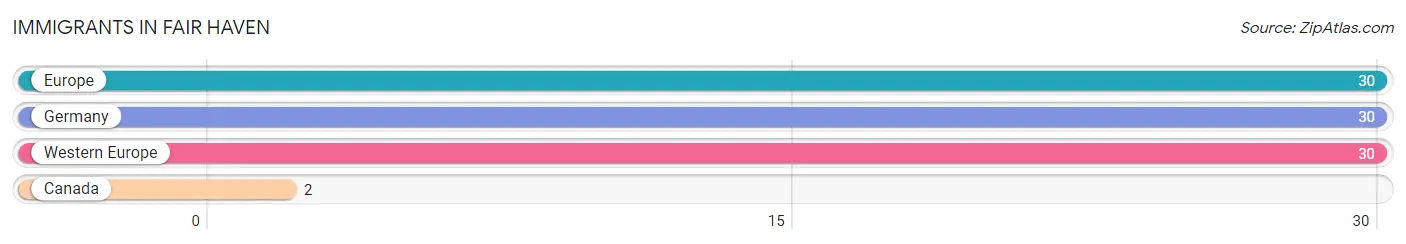
| Immigration Origin | # Population | % Population |
| Canada | 2 | 0.2% |
| Europe | 30 | 2.6% |
| Germany | 30 | 2.6% |
| Western Europe | 30 | 2.6% | View All 4 Rows |
Sex and Age in Fair Haven
Sex and Age in Fair Haven
The most populous age groups in Fair Haven are 60 to 64 Years (75 | 12.7%) for men and 20 to 24 Years (65 | 11.6%) for women.
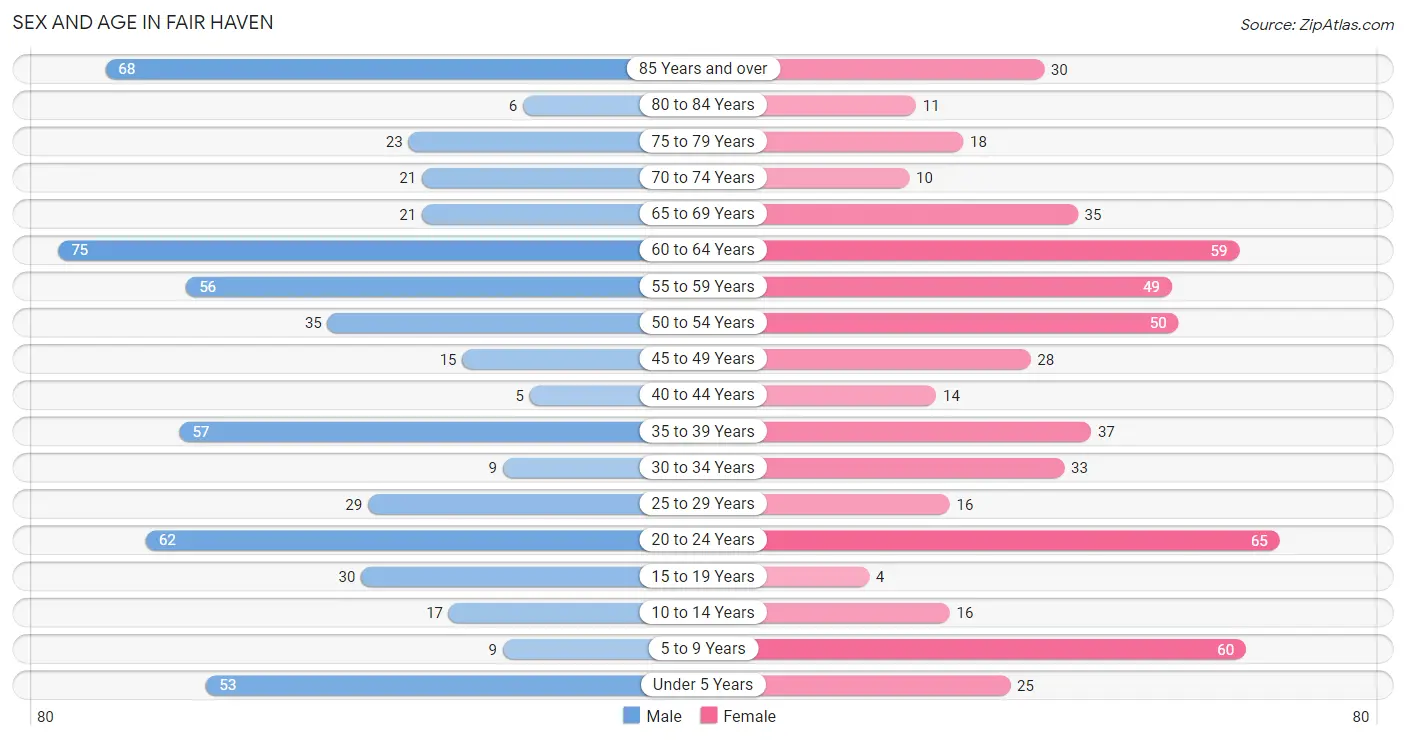
| Age Bracket | Male | Female |
| Under 5 Years | 53 (9.0%) | 25 (4.5%) |
| 5 to 9 Years | 9 (1.5%) | 60 (10.7%) |
| 10 to 14 Years | 17 (2.9%) | 16 (2.9%) |
| 15 to 19 Years | 30 (5.1%) | 4 (0.7%) |
| 20 to 24 Years | 62 (10.5%) | 65 (11.6%) |
| 25 to 29 Years | 29 (4.9%) | 16 (2.9%) |
| 30 to 34 Years | 9 (1.5%) | 33 (5.9%) |
| 35 to 39 Years | 57 (9.6%) | 37 (6.6%) |
| 40 to 44 Years | 5 (0.9%) | 14 (2.5%) |
| 45 to 49 Years | 15 (2.5%) | 28 (5.0%) |
| 50 to 54 Years | 35 (5.9%) | 50 (8.9%) |
| 55 to 59 Years | 56 (9.5%) | 49 (8.7%) |
| 60 to 64 Years | 75 (12.7%) | 59 (10.5%) |
| 65 to 69 Years | 21 (3.5%) | 35 (6.2%) |
| 70 to 74 Years | 21 (3.5%) | 10 (1.8%) |
| 75 to 79 Years | 23 (3.9%) | 18 (3.2%) |
| 80 to 84 Years | 6 (1.0%) | 11 (2.0%) |
| 85 Years and over | 68 (11.5%) | 30 (5.4%) |
| Total | 591 (100.0%) | 560 (100.0%) |
Families and Households in Fair Haven
Median Family Size in Fair Haven
The median family size in Fair Haven is 2.88 persons per family, with married-couple families (271 | 85.8%) accounting for the largest median family size of 2.94 persons per family. On the other hand, single male/father families (5 | 1.6%) represent the smallest median family size with 2.20 persons per family.
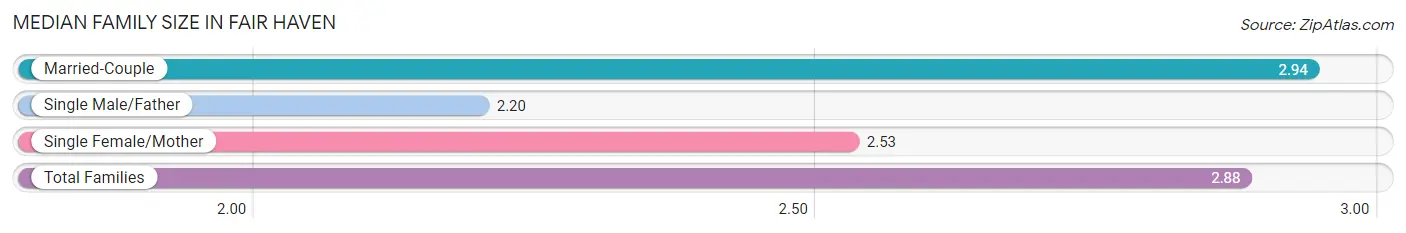
| Family Type | # Families | Family Size |
| Married-Couple | 271 (85.8%) | 2.94 |
| Single Male/Father | 5 (1.6%) | 2.20 |
| Single Female/Mother | 40 (12.7%) | 2.53 |
| Total Families | 316 (100.0%) | 2.88 |
Median Household Size in Fair Haven
The median household size in Fair Haven is 2.35 persons per household, with married-couple households (271 | 55.9%) accounting for the largest median household size of 2.96 persons per household. non-family households (169 | 34.8%) represent the smallest median household size with 1.27 persons per household.
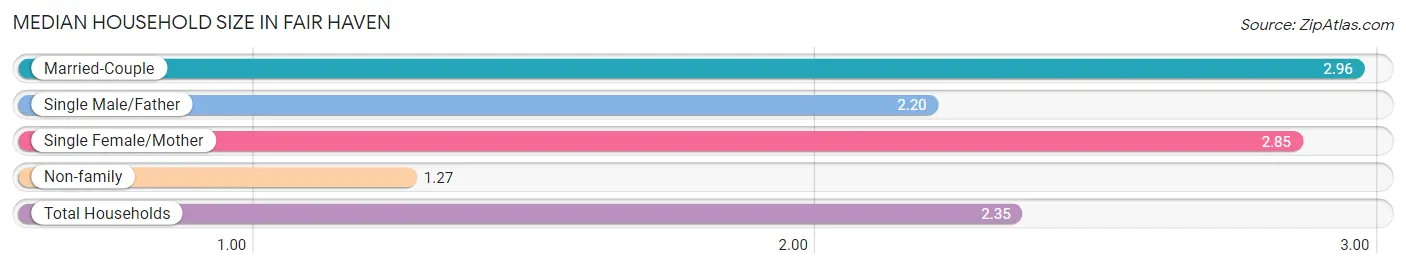
| Household Type | # Households | Household Size |
| Married-Couple | 271 (55.9%) | 2.96 |
| Single Male/Father | 5 (1.0%) | 2.20 |
| Single Female/Mother | 40 (8.3%) | 2.85 |
| Non-family | 169 (34.8%) | 1.27 |
| Total Households | 485 (100.0%) | 2.35 |
Household Size by Marriage Status in Fair Haven
Out of a total of 485 households in Fair Haven, 316 (65.1%) are family households, while 169 (34.8%) are nonfamily households. The most numerous type of family households are 2-person households, comprising 176, and the most common type of nonfamily households are 1-person households, comprising 129.
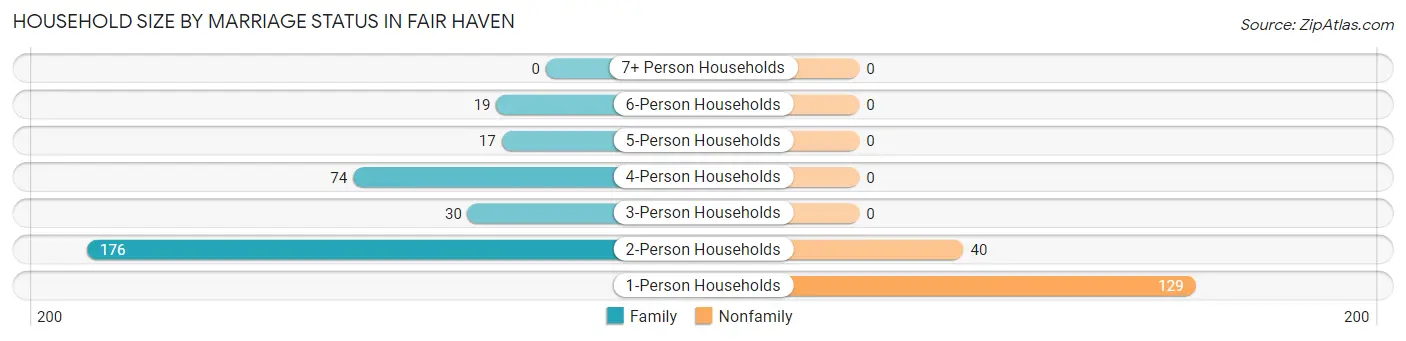
| Household Size | Family Households | Nonfamily Households |
| 1-Person Households | - | 129 (26.6%) |
| 2-Person Households | 176 (36.3%) | 40 (8.3%) |
| 3-Person Households | 30 (6.2%) | 0 (0.0%) |
| 4-Person Households | 74 (15.3%) | 0 (0.0%) |
| 5-Person Households | 17 (3.5%) | 0 (0.0%) |
| 6-Person Households | 19 (3.9%) | 0 (0.0%) |
| 7+ Person Households | 0 (0.0%) | 0 (0.0%) |
| Total | 316 (65.1%) | 169 (34.8%) |
Female Fertility in Fair Haven
Fertility by Age in Fair Haven
Average fertility rate in Fair Haven is 191.0 births per 1,000 women. Women in the age bracket of 35 to 50 years have the highest fertility rate with 291.0 births per 1,000 women. Women in the age bracket of 35 to 50 years acount for 64.1% of all women with births.
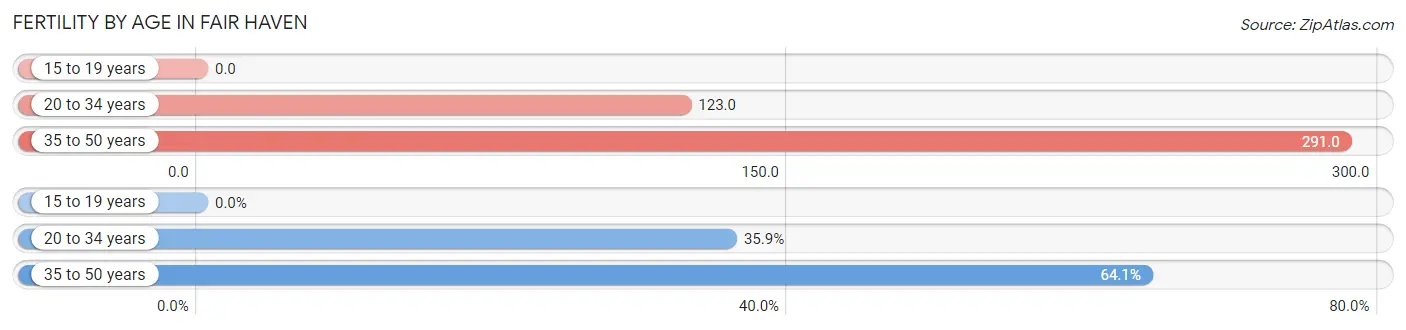
| Age Bracket | Women with Births | Births / 1,000 Women |
| 15 to 19 years | 0 (0.0%) | 0.0 |
| 20 to 34 years | 14 (35.9%) | 123.0 |
| 35 to 50 years | 25 (64.1%) | 291.0 |
| Total | 39 (100.0%) | 191.0 |
Fertility by Age by Marriage Status in Fair Haven
69.2% of women with births (39) in Fair Haven are married. The highest percentage of unmarried women with births falls into 35 to 50 years age bracket with 48.0% of them unmarried at the time of birth, while the lowest percentage of unmarried women with births belong to 20 to 34 years age bracket with 0.0% of them unmarried.
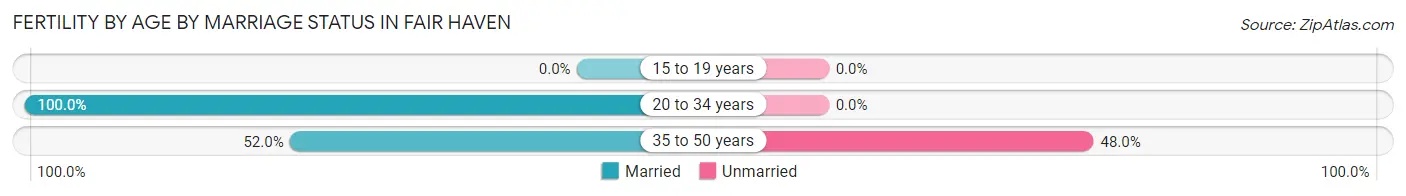
| Age Bracket | Married | Unmarried |
| 15 to 19 years | 0 (0.0%) | 0 (0.0%) |
| 20 to 34 years | 14 (100.0%) | 0 (0.0%) |
| 35 to 50 years | 13 (52.0%) | 12 (48.0%) |
| Total | 27 (69.2%) | 12 (30.8%) |
Fertility by Education in Fair Haven
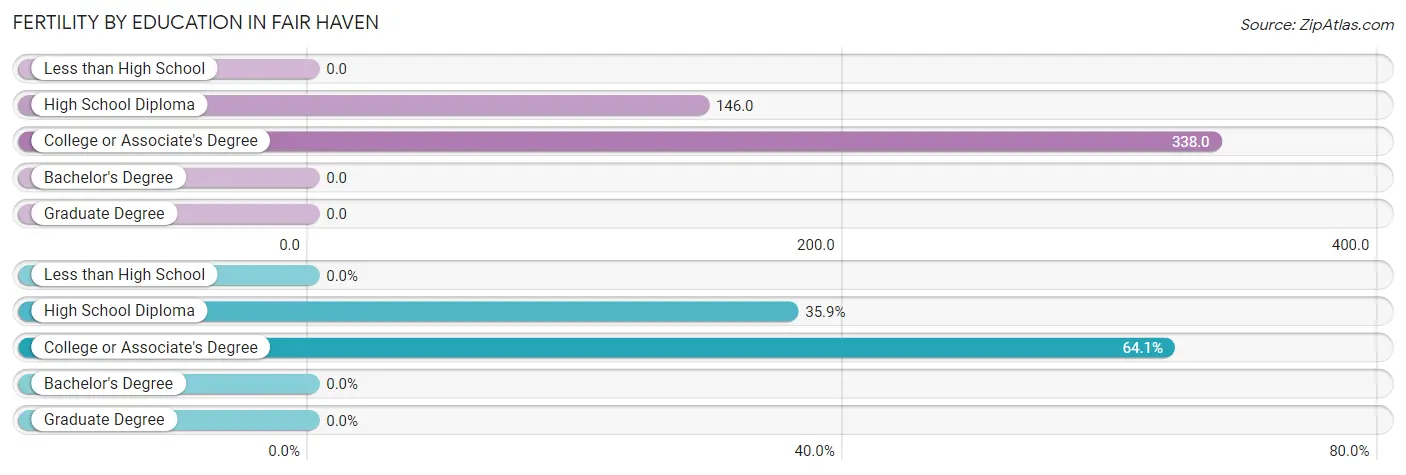
| Educational Attainment | Women with Births | Births / 1,000 Women |
| Less than High School | 0 (0.0%) | 0.0 |
| High School Diploma | 14 (35.9%) | 146.0 |
| College or Associate's Degree | 25 (64.1%) | 338.0 |
| Bachelor's Degree | 0 (0.0%) | 0.0 |
| Graduate Degree | 0 (0.0%) | 0.0 |
| Total | 39 (100.0%) | 191.0 |
Fertility by Education by Marriage Status in Fair Haven
30.8% of women with births in Fair Haven are unmarried. Women with the educational attainment of high school diploma are most likely to be married with 100.0% of them married at childbirth, while women with the educational attainment of college or associate's degree are least likely to be married with 48.0% of them unmarried at childbirth.
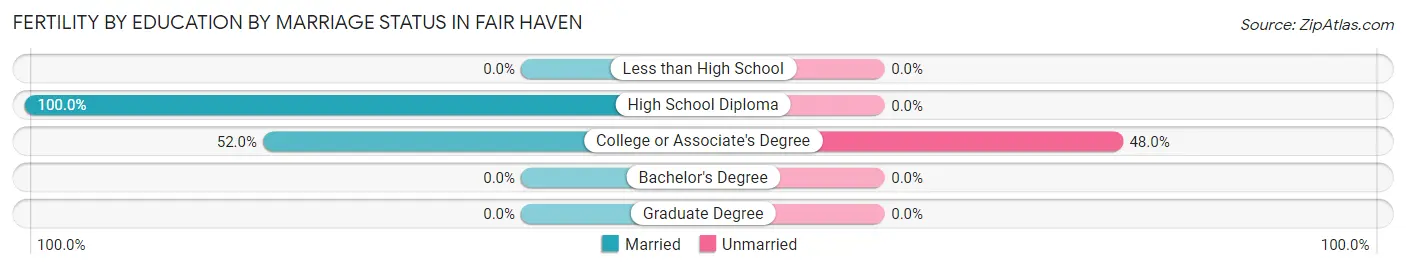
| Educational Attainment | Married | Unmarried |
| Less than High School | 0 (0.0%) | 0 (0.0%) |
| High School Diploma | 14 (100.0%) | 0 (0.0%) |
| College or Associate's Degree | 13 (52.0%) | 12 (48.0%) |
| Bachelor's Degree | 0 (0.0%) | 0 (0.0%) |
| Graduate Degree | 0 (0.0%) | 0 (0.0%) |
| Total | 27 (69.2%) | 12 (30.8%) |
Employment Characteristics in Fair Haven
Employment by Class of Employer in Fair Haven
Among the 592 employed individuals in Fair Haven, private company employees (361 | 61.0%), local government employees (63 | 10.6%), and state government employees (53 | 8.9%) make up the most common classes of employment.
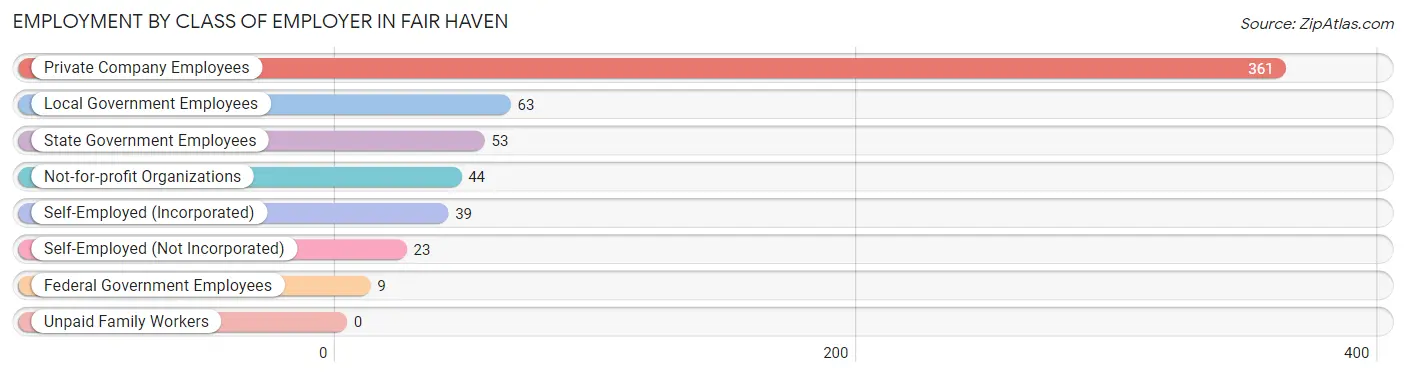
| Employer Class | # Employees | % Employees |
| Private Company Employees | 361 | 61.0% |
| Self-Employed (Incorporated) | 39 | 6.6% |
| Self-Employed (Not Incorporated) | 23 | 3.9% |
| Not-for-profit Organizations | 44 | 7.4% |
| Local Government Employees | 63 | 10.6% |
| State Government Employees | 53 | 8.9% |
| Federal Government Employees | 9 | 1.5% |
| Unpaid Family Workers | 0 | 0.0% |
| Total | 592 | 100.0% |
Employment Status by Age in Fair Haven
According to the labor force statistics for Fair Haven, out of the total population over 16 years of age (955), 64.4% or 615 individuals are in the labor force, with 2.4% or 15 of them unemployed. The age group with the highest labor force participation rate is 20 to 24 years, with 90.6% or 115 individuals in the labor force. Within the labor force, the 25 to 29 years age range has the highest percentage of unemployed individuals, with 11.1% or 4 of them being unemployed.
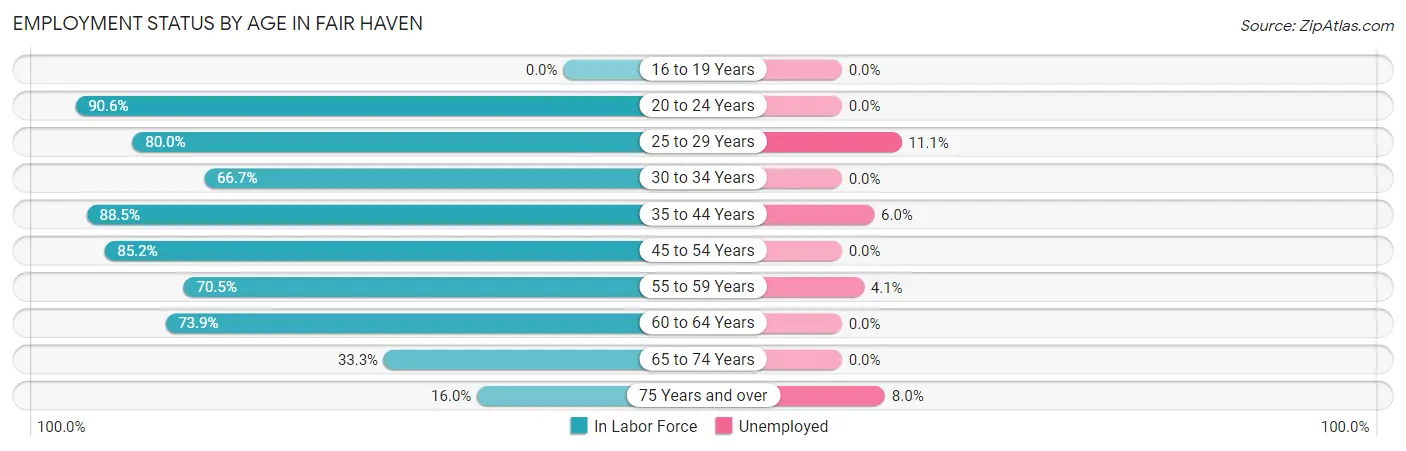
| Age Bracket | In Labor Force | Unemployed |
| 16 to 19 Years | 0 (0.0%) | 0 (0.0%) |
| 20 to 24 Years | 115 (90.6%) | 0 (0.0%) |
| 25 to 29 Years | 36 (80.0%) | 4 (11.1%) |
| 30 to 34 Years | 28 (66.7%) | 0 (0.0%) |
| 35 to 44 Years | 100 (88.5%) | 6 (6.0%) |
| 45 to 54 Years | 109 (85.2%) | 0 (0.0%) |
| 55 to 59 Years | 74 (70.5%) | 3 (4.1%) |
| 60 to 64 Years | 99 (73.9%) | 0 (0.0%) |
| 65 to 74 Years | 29 (33.3%) | 0 (0.0%) |
| 75 Years and over | 25 (16.0%) | 2 (8.0%) |
| Total | 615 (64.4%) | 15 (2.4%) |
Employment Status by Educational Attainment in Fair Haven
According to labor force statistics for Fair Haven, 78.7% of individuals (446) out of the total population between 25 and 64 years of age (567) are in the labor force, with 2.9% or 13 of them being unemployed. The group with the highest labor force participation rate are those with the educational attainment of less than high school, with 100.0% or 10 individuals in the labor force. Within the labor force, individuals with less than high school education have the highest percentage of unemployment, with 30.0% or 3 of them being unemployed.
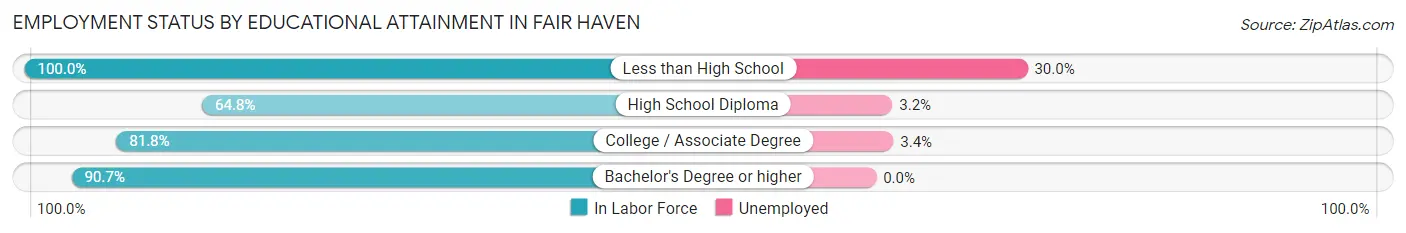
| Educational Attainment | In Labor Force | Unemployed |
| Less than High School | 10 (100.0%) | 3 (30.0%) |
| High School Diploma | 125 (64.8%) | 6 (3.2%) |
| College / Associate Degree | 175 (81.8%) | 7 (3.4%) |
| Bachelor's Degree or higher | 136 (90.7%) | 0 (0.0%) |
| Total | 446 (78.7%) | 16 (2.9%) |
Employment Occupations by Sex in Fair Haven
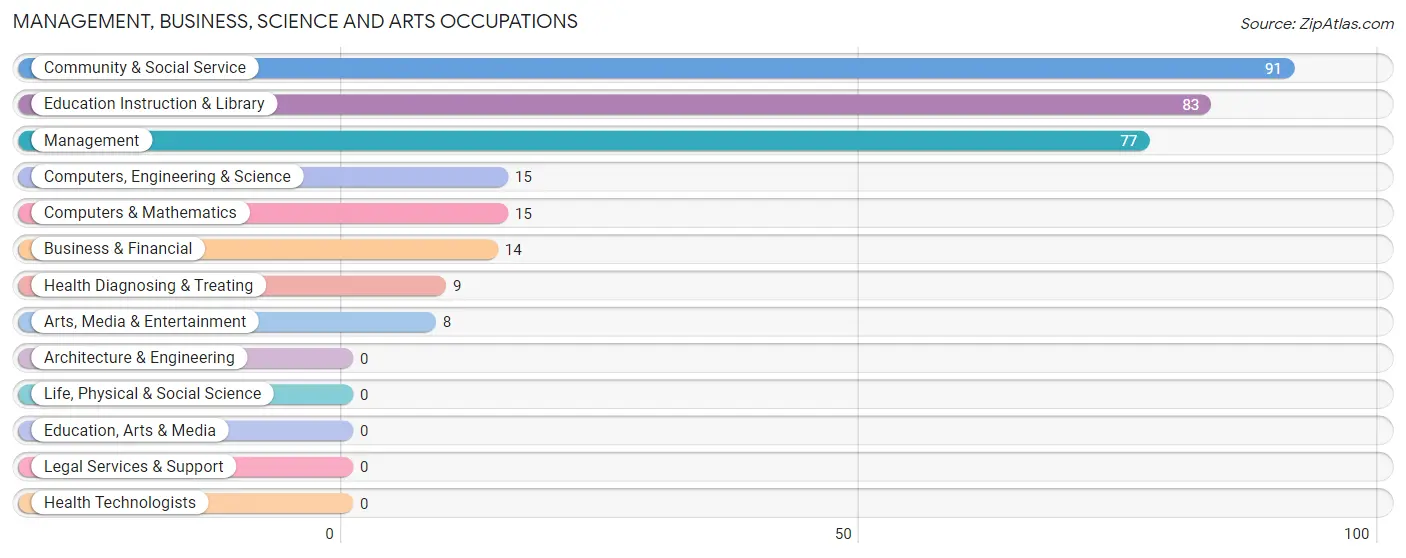
Management, Business, Science and Arts Occupations
The most common Management, Business, Science and Arts occupations in Fair Haven are Community & Social Service (91 | 15.2%), Education Instruction & Library (83 | 13.8%), Management (77 | 12.8%), Computers, Engineering & Science (15 | 2.5%), and Computers & Mathematics (15 | 2.5%).
Management, Business, Science and Arts Occupations by Sex
Within the Management, Business, Science and Arts occupations in Fair Haven, the most male-oriented occupations are Business & Financial (100.0%), Computers, Engineering & Science (86.7%), and Computers & Mathematics (86.7%), while the most female-oriented occupations are Health Diagnosing & Treating (100.0%), Education Instruction & Library (74.7%), and Community & Social Service (70.3%).
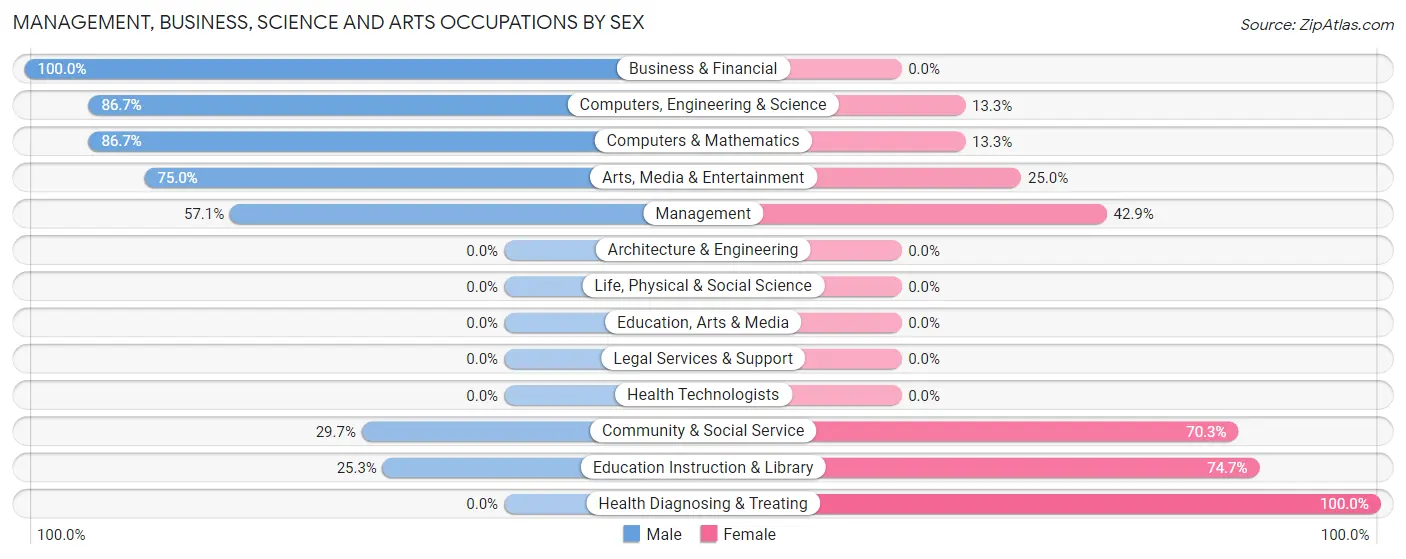
| Occupation | Male | Female |
| Management | 44 (57.1%) | 33 (42.9%) |
| Business & Financial | 14 (100.0%) | 0 (0.0%) |
| Computers, Engineering & Science | 13 (86.7%) | 2 (13.3%) |
| Computers & Mathematics | 13 (86.7%) | 2 (13.3%) |
| Architecture & Engineering | 0 (0.0%) | 0 (0.0%) |
| Life, Physical & Social Science | 0 (0.0%) | 0 (0.0%) |
| Community & Social Service | 27 (29.7%) | 64 (70.3%) |
| Education, Arts & Media | 0 (0.0%) | 0 (0.0%) |
| Legal Services & Support | 0 (0.0%) | 0 (0.0%) |
| Education Instruction & Library | 21 (25.3%) | 62 (74.7%) |
| Arts, Media & Entertainment | 6 (75.0%) | 2 (25.0%) |
| Health Diagnosing & Treating | 0 (0.0%) | 9 (100.0%) |
| Health Technologists | 0 (0.0%) | 0 (0.0%) |
| Total (Category) | 98 (47.6%) | 108 (52.4%) |
| Total (Overall) | 305 (50.8%) | 295 (49.2%) |
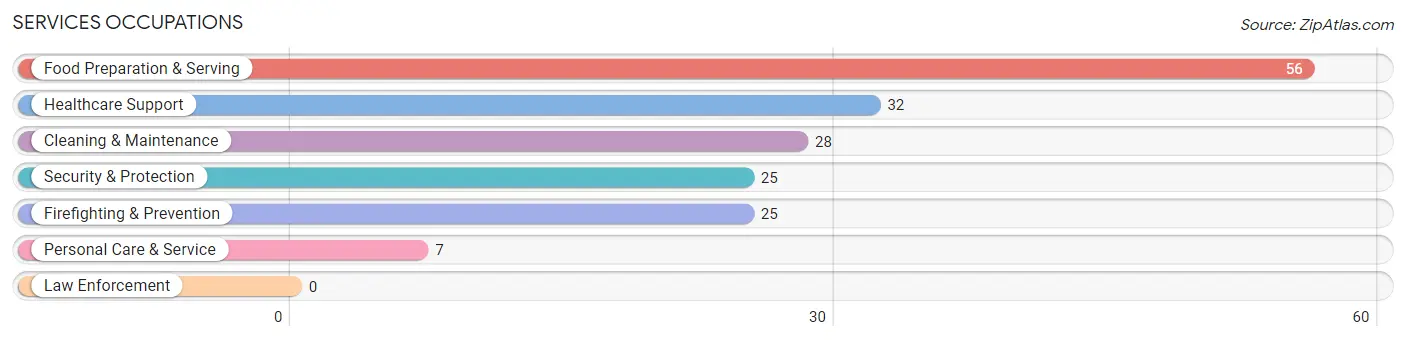
Services Occupations
The most common Services occupations in Fair Haven are Food Preparation & Serving (56 | 9.3%), Healthcare Support (32 | 5.3%), Cleaning & Maintenance (28 | 4.7%), Security & Protection (25 | 4.2%), and Firefighting & Prevention (25 | 4.2%).
Services Occupations by Sex
Within the Services occupations in Fair Haven, the most male-oriented occupations are Security & Protection (100.0%), Firefighting & Prevention (100.0%), and Cleaning & Maintenance (85.7%), while the most female-oriented occupations are Healthcare Support (100.0%), Food Preparation & Serving (82.1%), and Personal Care & Service (71.4%).
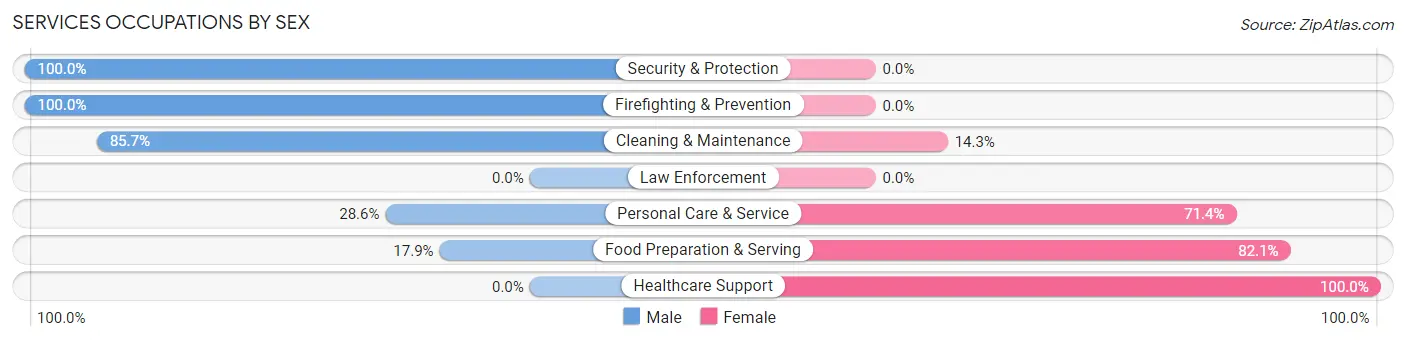
| Occupation | Male | Female |
| Healthcare Support | 0 (0.0%) | 32 (100.0%) |
| Security & Protection | 25 (100.0%) | 0 (0.0%) |
| Firefighting & Prevention | 25 (100.0%) | 0 (0.0%) |
| Law Enforcement | 0 (0.0%) | 0 (0.0%) |
| Food Preparation & Serving | 10 (17.9%) | 46 (82.1%) |
| Cleaning & Maintenance | 24 (85.7%) | 4 (14.3%) |
| Personal Care & Service | 2 (28.6%) | 5 (71.4%) |
| Total (Category) | 61 (41.2%) | 87 (58.8%) |
| Total (Overall) | 305 (50.8%) | 295 (49.2%) |
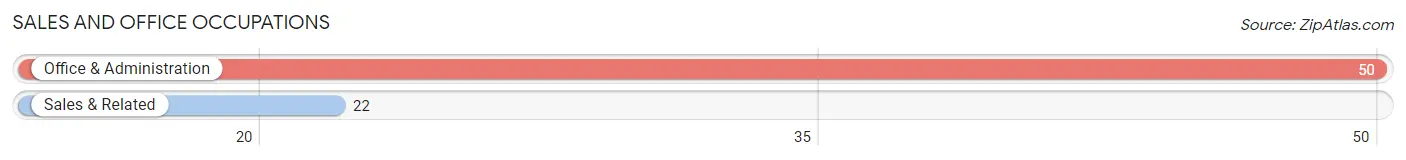
Sales and Office Occupations
The most common Sales and Office occupations in Fair Haven are Office & Administration (50 | 8.3%), and Sales & Related (22 | 3.7%).
Sales and Office Occupations by Sex
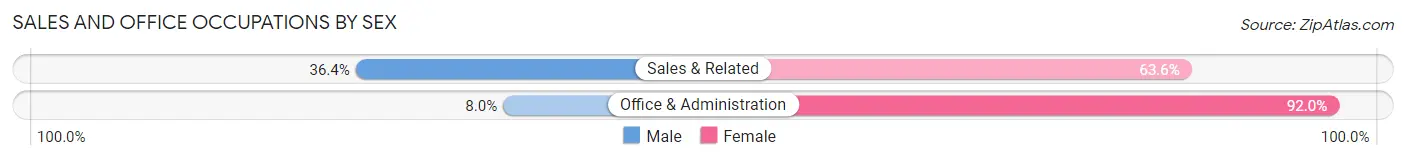
| Occupation | Male | Female |
| Sales & Related | 8 (36.4%) | 14 (63.6%) |
| Office & Administration | 4 (8.0%) | 46 (92.0%) |
| Total (Category) | 12 (16.7%) | 60 (83.3%) |
| Total (Overall) | 305 (50.8%) | 295 (49.2%) |
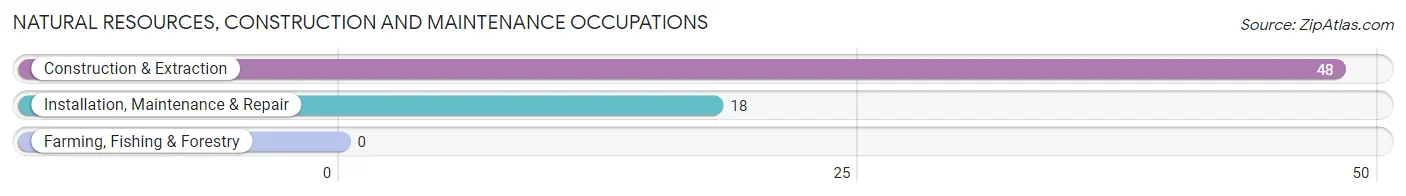
Natural Resources, Construction and Maintenance Occupations
The most common Natural Resources, Construction and Maintenance occupations in Fair Haven are Construction & Extraction (48 | 8.0%), and Installation, Maintenance & Repair (18 | 3.0%).
Natural Resources, Construction and Maintenance Occupations by Sex
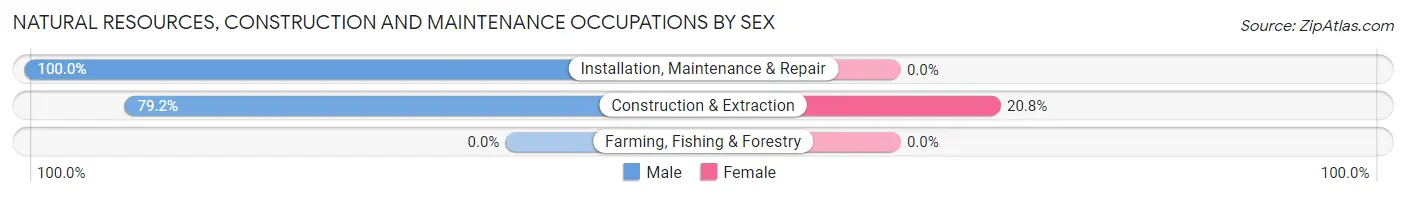
| Occupation | Male | Female |
| Farming, Fishing & Forestry | 0 (0.0%) | 0 (0.0%) |
| Construction & Extraction | 38 (79.2%) | 10 (20.8%) |
| Installation, Maintenance & Repair | 18 (100.0%) | 0 (0.0%) |
| Total (Category) | 56 (84.9%) | 10 (15.1%) |
| Total (Overall) | 305 (50.8%) | 295 (49.2%) |
Production, Transportation and Moving Occupations
The most common Production, Transportation and Moving occupations in Fair Haven are Material Moving (71 | 11.8%), Transportation (19 | 3.2%), and Production (18 | 3.0%).
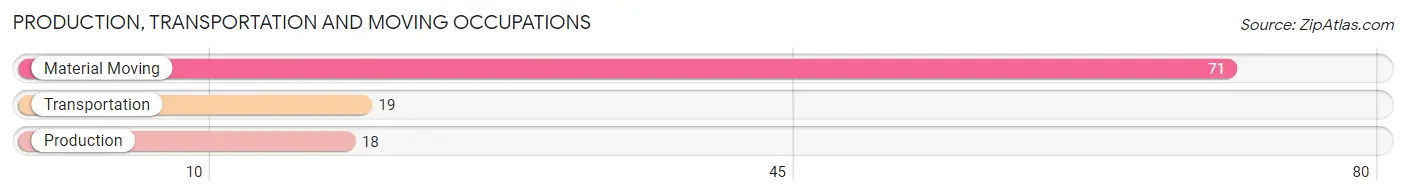
Production, Transportation and Moving Occupations by Sex
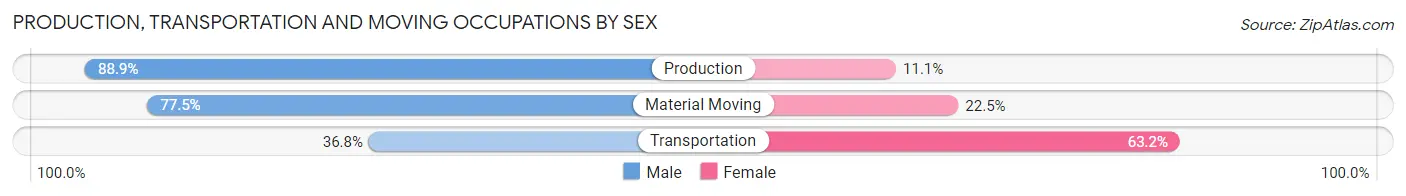
| Occupation | Male | Female |
| Production | 16 (88.9%) | 2 (11.1%) |
| Transportation | 7 (36.8%) | 12 (63.2%) |
| Material Moving | 55 (77.5%) | 16 (22.5%) |
| Total (Category) | 78 (72.2%) | 30 (27.8%) |
| Total (Overall) | 305 (50.8%) | 295 (49.2%) |
Employment Industries by Sex in Fair Haven
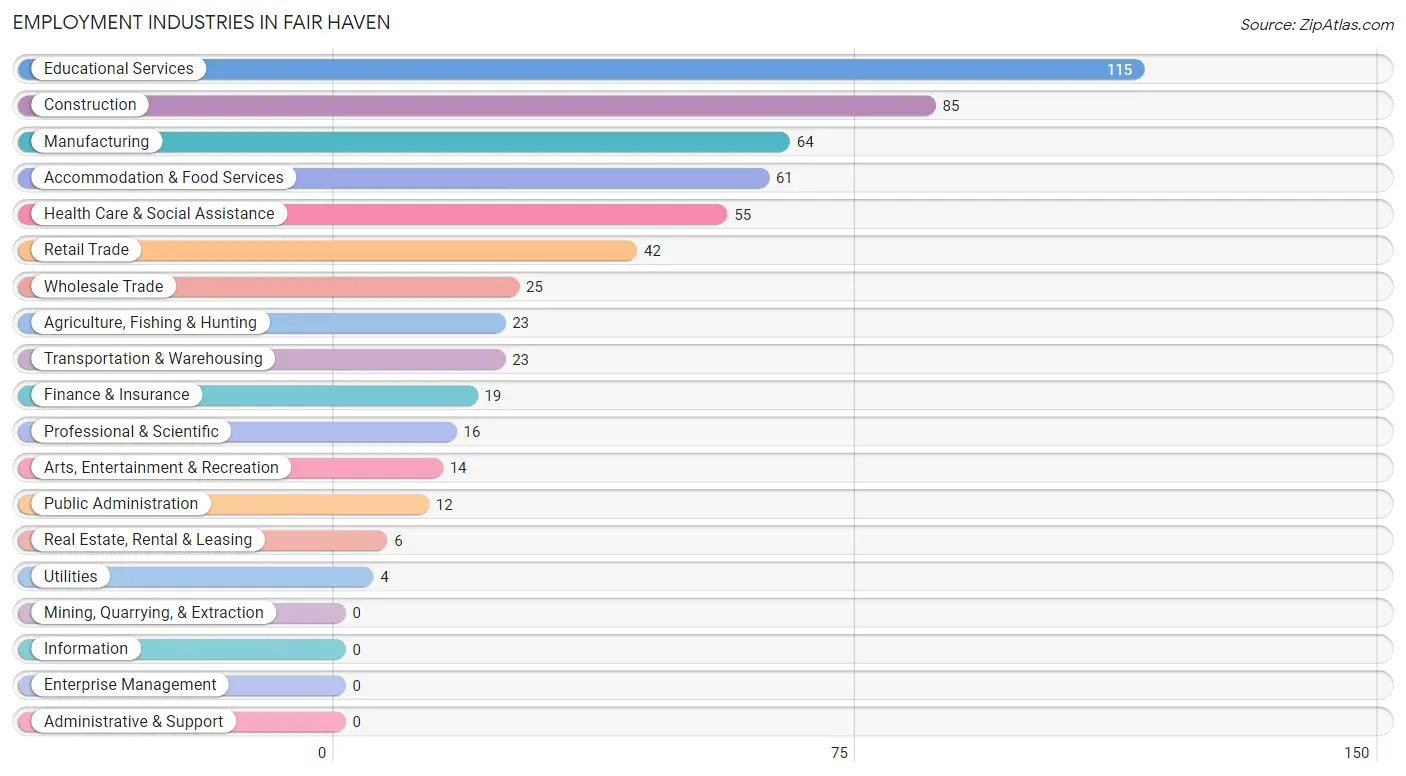
Employment Industries in Fair Haven
The major employment industries in Fair Haven include Educational Services (115 | 19.2%), Construction (85 | 14.2%), Manufacturing (64 | 10.7%), Accommodation & Food Services (61 | 10.2%), and Health Care & Social Assistance (55 | 9.2%).
Employment Industries by Sex in Fair Haven
The Fair Haven industries that see more men than women are Agriculture, Fishing & Hunting (100.0%), Wholesale Trade (100.0%), and Professional & Scientific (100.0%), whereas the industries that tend to have a higher number of women are Utilities (100.0%), Health Care & Social Assistance (100.0%), and Finance & Insurance (84.2%).
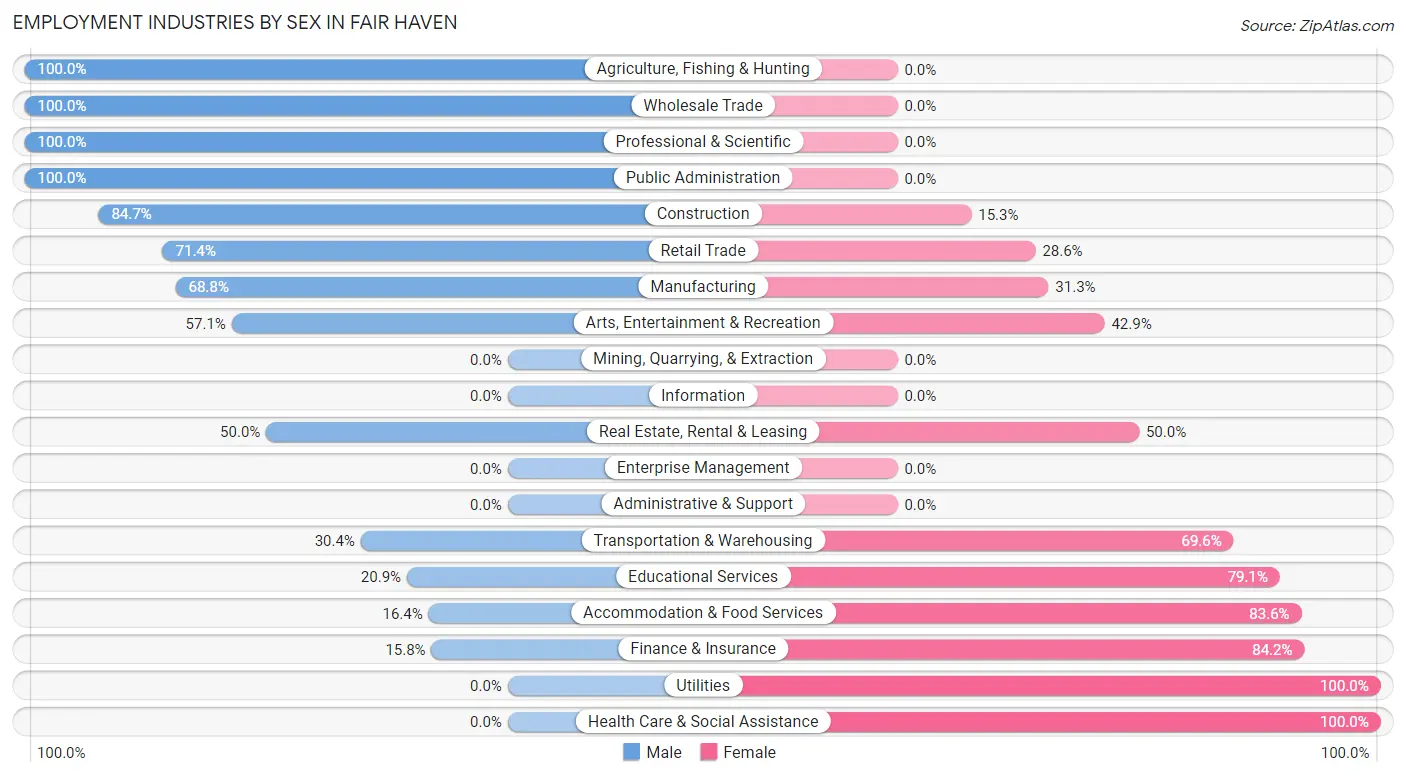
| Industry | Male | Female |
| Agriculture, Fishing & Hunting | 23 (100.0%) | 0 (0.0%) |
| Mining, Quarrying, & Extraction | 0 (0.0%) | 0 (0.0%) |
| Construction | 72 (84.7%) | 13 (15.3%) |
| Manufacturing | 44 (68.8%) | 20 (31.2%) |
| Wholesale Trade | 25 (100.0%) | 0 (0.0%) |
| Retail Trade | 30 (71.4%) | 12 (28.6%) |
| Transportation & Warehousing | 7 (30.4%) | 16 (69.6%) |
| Utilities | 0 (0.0%) | 4 (100.0%) |
| Information | 0 (0.0%) | 0 (0.0%) |
| Finance & Insurance | 3 (15.8%) | 16 (84.2%) |
| Real Estate, Rental & Leasing | 3 (50.0%) | 3 (50.0%) |
| Professional & Scientific | 16 (100.0%) | 0 (0.0%) |
| Enterprise Management | 0 (0.0%) | 0 (0.0%) |
| Administrative & Support | 0 (0.0%) | 0 (0.0%) |
| Educational Services | 24 (20.9%) | 91 (79.1%) |
| Health Care & Social Assistance | 0 (0.0%) | 55 (100.0%) |
| Arts, Entertainment & Recreation | 8 (57.1%) | 6 (42.9%) |
| Accommodation & Food Services | 10 (16.4%) | 51 (83.6%) |
| Public Administration | 12 (100.0%) | 0 (0.0%) |
| Total | 305 (50.8%) | 295 (49.2%) |
Education in Fair Haven
School Enrollment in Fair Haven
The most common levels of schooling among the 230 students in Fair Haven are college / undergraduate (84 | 36.5%), high school (43 | 18.7%), and elementary school (36 | 15.7%).
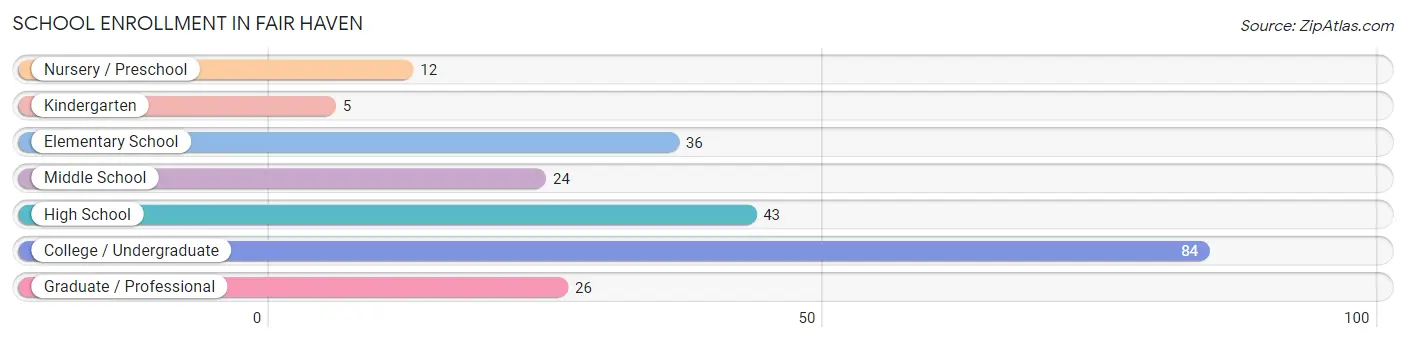
| School Level | # Students | % Students |
| Nursery / Preschool | 12 | 5.2% |
| Kindergarten | 5 | 2.2% |
| Elementary School | 36 | 15.7% |
| Middle School | 24 | 10.4% |
| High School | 43 | 18.7% |
| College / Undergraduate | 84 | 36.5% |
| Graduate / Professional | 26 | 11.3% |
| Total | 230 | 100.0% |
School Enrollment by Age by Funding Source in Fair Haven
Out of a total of 230 students who are enrolled in schools in Fair Haven, 58 (25.2%) attend a private institution, while the remaining 172 (74.8%) are enrolled in public schools. The age group of 3 to 4 year olds has the highest likelihood of being enrolled in private schools, with 12 (100.0% in the age bracket) enrolled. Conversely, the age group of 15 to 17 year olds has the lowest likelihood of being enrolled in a private school, with 23 (100.0% in the age bracket) attending a public institution.
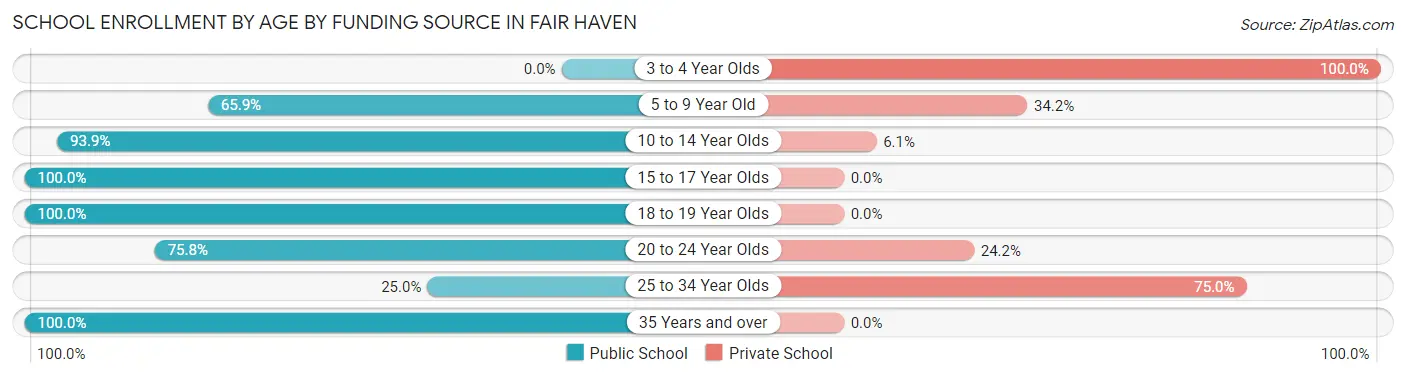
| Age Bracket | Public School | Private School |
| 3 to 4 Year Olds | 0 (0.0%) | 12 (100.0%) |
| 5 to 9 Year Old | 27 (65.8%) | 14 (34.2%) |
| 10 to 14 Year Olds | 31 (93.9%) | 2 (6.1%) |
| 15 to 17 Year Olds | 23 (100.0%) | 0 (0.0%) |
| 18 to 19 Year Olds | 11 (100.0%) | 0 (0.0%) |
| 20 to 24 Year Olds | 75 (75.8%) | 24 (24.2%) |
| 25 to 34 Year Olds | 2 (25.0%) | 6 (75.0%) |
| 35 Years and over | 3 (100.0%) | 0 (0.0%) |
| Total | 172 (74.8%) | 58 (25.2%) |
Educational Attainment by Field of Study in Fair Haven
Education (73 | 29.7%), liberal arts & history (44 | 17.9%), science & technology (31 | 12.6%), bio, nature & agricultural (27 | 11.0%), and social sciences (12 | 4.9%) are the most common fields of study among 246 individuals in Fair Haven who have obtained a bachelor's degree or higher.
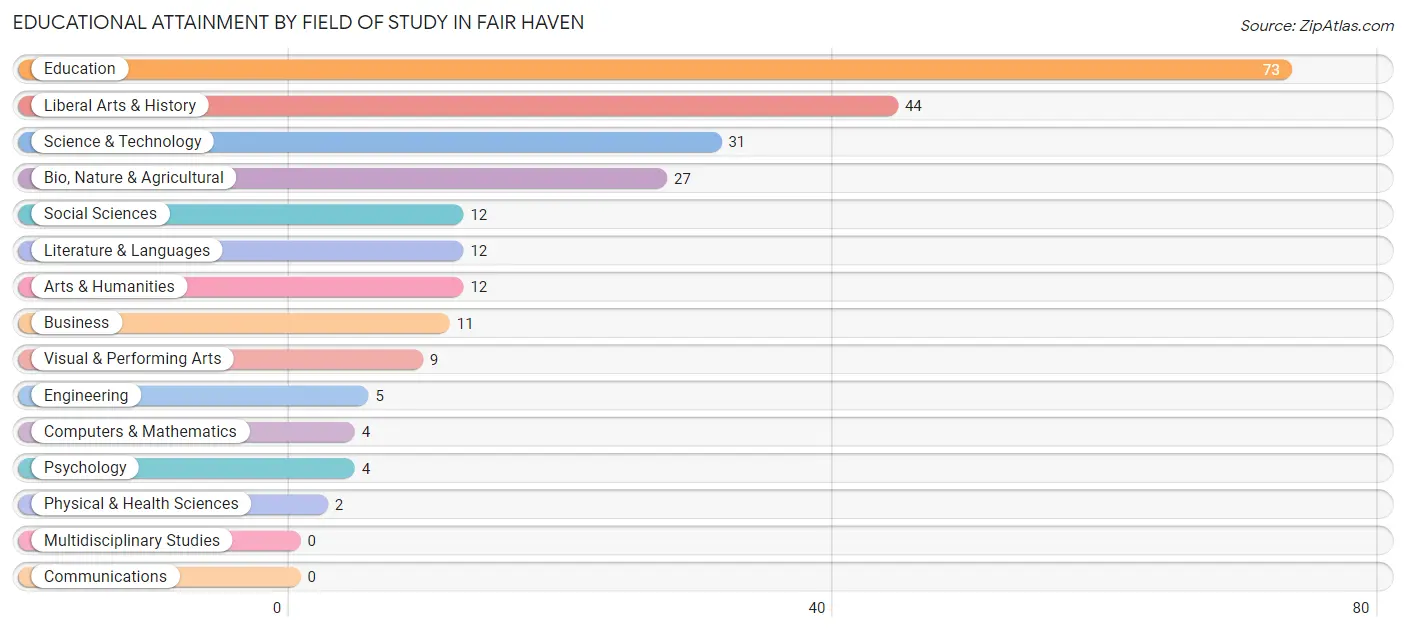
| Field of Study | # Graduates | % Graduates |
| Computers & Mathematics | 4 | 1.6% |
| Bio, Nature & Agricultural | 27 | 11.0% |
| Physical & Health Sciences | 2 | 0.8% |
| Psychology | 4 | 1.6% |
| Social Sciences | 12 | 4.9% |
| Engineering | 5 | 2.0% |
| Multidisciplinary Studies | 0 | 0.0% |
| Science & Technology | 31 | 12.6% |
| Business | 11 | 4.5% |
| Education | 73 | 29.7% |
| Literature & Languages | 12 | 4.9% |
| Liberal Arts & History | 44 | 17.9% |
| Visual & Performing Arts | 9 | 3.7% |
| Communications | 0 | 0.0% |
| Arts & Humanities | 12 | 4.9% |
| Total | 246 | 100.0% |
Transportation & Commute in Fair Haven
Vehicle Availability by Sex in Fair Haven
The most prevalent vehicle ownership categories in Fair Haven are males with 2 vehicles (207, accounting for 69.2%) and females with 2 vehicles (212, making up 70.7%).
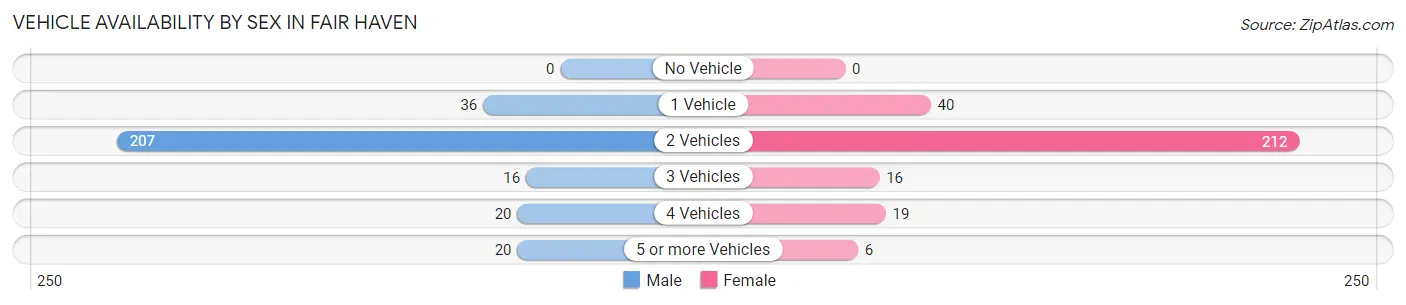
| Vehicles Available | Male | Female |
| No Vehicle | 0 (0.0%) | 0 (0.0%) |
| 1 Vehicle | 36 (12.0%) | 40 (13.7%) |
| 2 Vehicles | 207 (69.2%) | 212 (72.4%) |
| 3 Vehicles | 16 (5.3%) | 16 (5.5%) |
| 4 Vehicles | 20 (6.7%) | 19 (6.5%) |
| 5 or more Vehicles | 20 (6.7%) | 6 (2.1%) |
| Total | 299 (100.0%) | 293 (100.0%) |
Commute Time in Fair Haven
The most frequently occuring commute durations in Fair Haven are 10 to 14 minutes (110 commuters, 19.8%), 5 to 9 minutes (78 commuters, 14.0%), and 20 to 24 minutes (73 commuters, 13.1%).
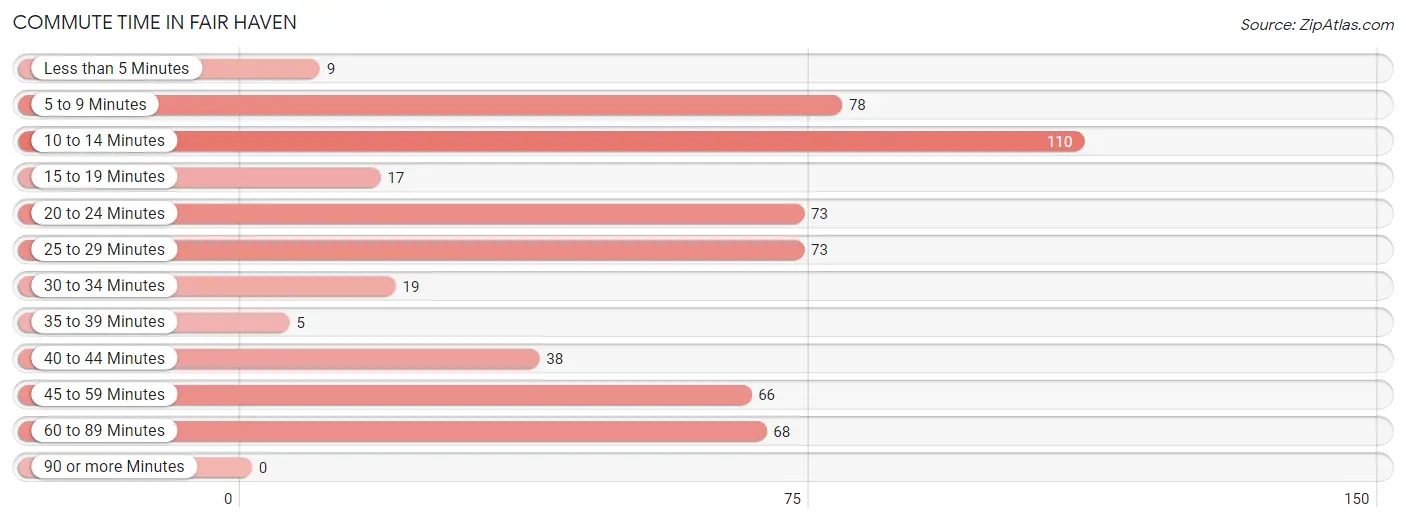
| Commute Time | # Commuters | % Commuters |
| Less than 5 Minutes | 9 | 1.6% |
| 5 to 9 Minutes | 78 | 14.0% |
| 10 to 14 Minutes | 110 | 19.8% |
| 15 to 19 Minutes | 17 | 3.1% |
| 20 to 24 Minutes | 73 | 13.1% |
| 25 to 29 Minutes | 73 | 13.1% |
| 30 to 34 Minutes | 19 | 3.4% |
| 35 to 39 Minutes | 5 | 0.9% |
| 40 to 44 Minutes | 38 | 6.8% |
| 45 to 59 Minutes | 66 | 11.9% |
| 60 to 89 Minutes | 68 | 12.2% |
| 90 or more Minutes | 0 | 0.0% |
Commute Time by Sex in Fair Haven
The most common commute times in Fair Haven are 10 to 14 minutes (62 commuters, 21.1%) for males and 5 to 9 minutes (55 commuters, 21.0%) for females.
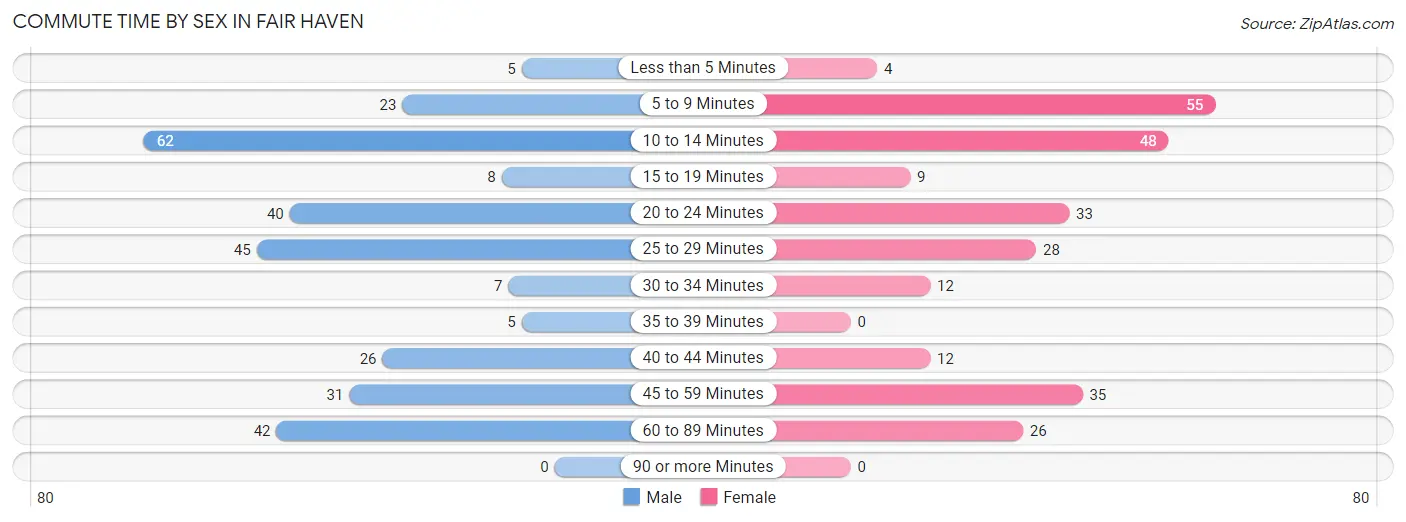
| Commute Time | Male | Female |
| Less than 5 Minutes | 5 (1.7%) | 4 (1.5%) |
| 5 to 9 Minutes | 23 (7.8%) | 55 (21.0%) |
| 10 to 14 Minutes | 62 (21.1%) | 48 (18.3%) |
| 15 to 19 Minutes | 8 (2.7%) | 9 (3.4%) |
| 20 to 24 Minutes | 40 (13.6%) | 33 (12.6%) |
| 25 to 29 Minutes | 45 (15.3%) | 28 (10.7%) |
| 30 to 34 Minutes | 7 (2.4%) | 12 (4.6%) |
| 35 to 39 Minutes | 5 (1.7%) | 0 (0.0%) |
| 40 to 44 Minutes | 26 (8.8%) | 12 (4.6%) |
| 45 to 59 Minutes | 31 (10.5%) | 35 (13.4%) |
| 60 to 89 Minutes | 42 (14.3%) | 26 (9.9%) |
| 90 or more Minutes | 0 (0.0%) | 0 (0.0%) |
Time of Departure to Work by Sex in Fair Haven
The most frequent times of departure to work in Fair Haven are 6:30 AM to 6:59 AM (82, 27.9%) for males and 7:30 AM to 7:59 AM (76, 29.0%) for females.
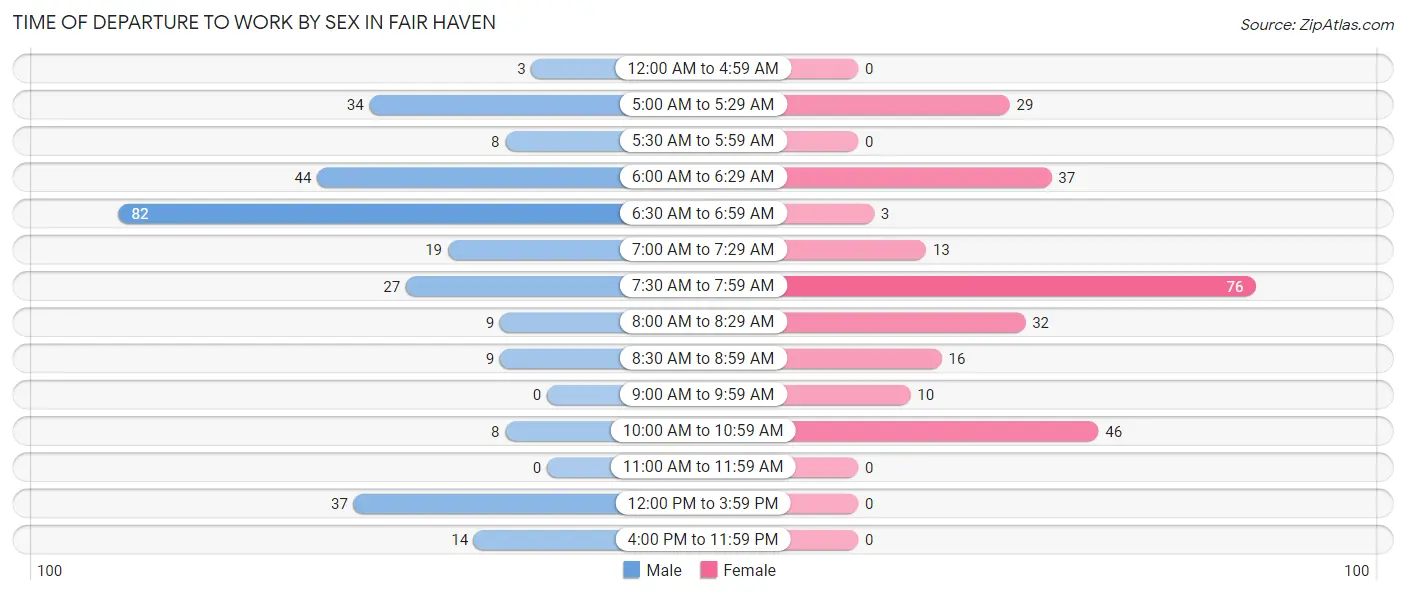
| Time of Departure | Male | Female |
| 12:00 AM to 4:59 AM | 3 (1.0%) | 0 (0.0%) |
| 5:00 AM to 5:29 AM | 34 (11.6%) | 29 (11.1%) |
| 5:30 AM to 5:59 AM | 8 (2.7%) | 0 (0.0%) |
| 6:00 AM to 6:29 AM | 44 (15.0%) | 37 (14.1%) |
| 6:30 AM to 6:59 AM | 82 (27.9%) | 3 (1.1%) |
| 7:00 AM to 7:29 AM | 19 (6.5%) | 13 (5.0%) |
| 7:30 AM to 7:59 AM | 27 (9.2%) | 76 (29.0%) |
| 8:00 AM to 8:29 AM | 9 (3.1%) | 32 (12.2%) |
| 8:30 AM to 8:59 AM | 9 (3.1%) | 16 (6.1%) |
| 9:00 AM to 9:59 AM | 0 (0.0%) | 10 (3.8%) |
| 10:00 AM to 10:59 AM | 8 (2.7%) | 46 (17.6%) |
| 11:00 AM to 11:59 AM | 0 (0.0%) | 0 (0.0%) |
| 12:00 PM to 3:59 PM | 37 (12.6%) | 0 (0.0%) |
| 4:00 PM to 11:59 PM | 14 (4.8%) | 0 (0.0%) |
| Total | 294 (100.0%) | 262 (100.0%) |
Housing Occupancy in Fair Haven
Occupancy by Ownership in Fair Haven
Of the total 485 dwellings in Fair Haven, owner-occupied units account for 376 (77.5%), while renter-occupied units make up 109 (22.5%).
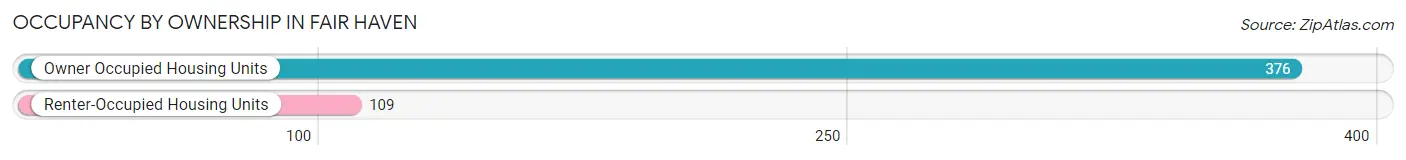
| Occupancy | # Housing Units | % Housing Units |
| Owner Occupied Housing Units | 376 | 77.5% |
| Renter-Occupied Housing Units | 109 | 22.5% |
| Total Occupied Housing Units | 485 | 100.0% |
Occupancy by Household Size in Fair Haven
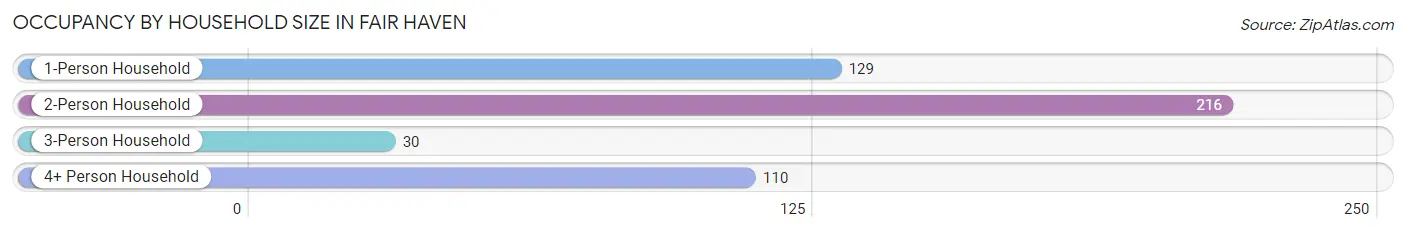
| Household Size | # Housing Units | % Housing Units |
| 1-Person Household | 129 | 26.6% |
| 2-Person Household | 216 | 44.5% |
| 3-Person Household | 30 | 6.2% |
| 4+ Person Household | 110 | 22.7% |
| Total Housing Units | 485 | 100.0% |
Occupancy by Ownership by Household Size in Fair Haven
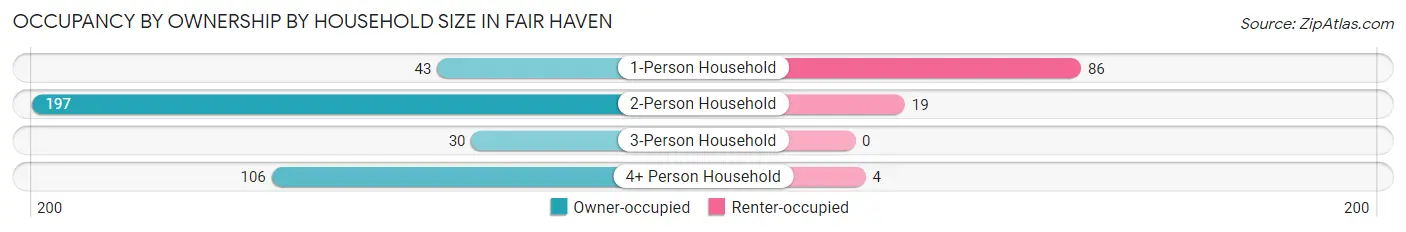
| Household Size | Owner-occupied | Renter-occupied |
| 1-Person Household | 43 (33.3%) | 86 (66.7%) |
| 2-Person Household | 197 (91.2%) | 19 (8.8%) |
| 3-Person Household | 30 (100.0%) | 0 (0.0%) |
| 4+ Person Household | 106 (96.4%) | 4 (3.6%) |
| Total Housing Units | 376 (77.5%) | 109 (22.5%) |
Occupancy by Educational Attainment in Fair Haven
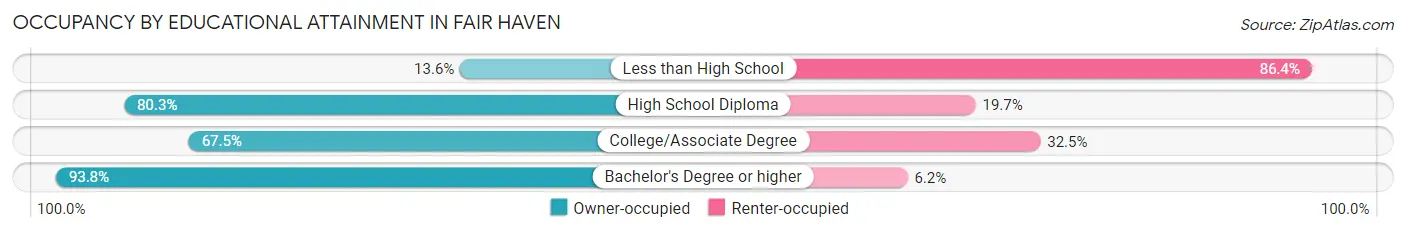
| Household Size | Owner-occupied | Renter-occupied |
| Less than High School | 3 (13.6%) | 19 (86.4%) |
| High School Diploma | 167 (80.3%) | 41 (19.7%) |
| College/Associate Degree | 85 (67.5%) | 41 (32.5%) |
| Bachelor's Degree or higher | 121 (93.8%) | 8 (6.2%) |
Occupancy by Age of Householder in Fair Haven
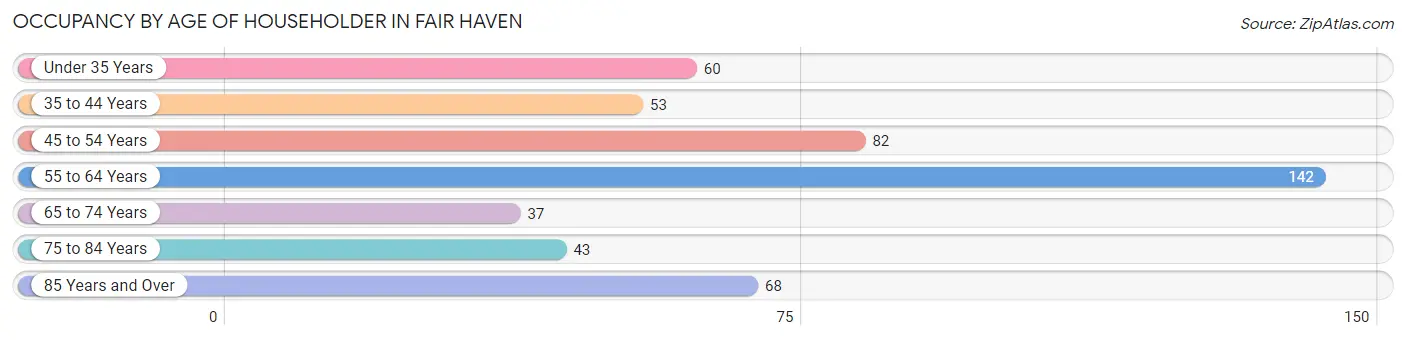
| Age Bracket | # Households | % Households |
| Under 35 Years | 60 | 12.4% |
| 35 to 44 Years | 53 | 10.9% |
| 45 to 54 Years | 82 | 16.9% |
| 55 to 64 Years | 142 | 29.3% |
| 65 to 74 Years | 37 | 7.6% |
| 75 to 84 Years | 43 | 8.9% |
| 85 Years and Over | 68 | 14.0% |
| Total | 485 | 100.0% |
Housing Finances in Fair Haven
Median Income by Occupancy in Fair Haven
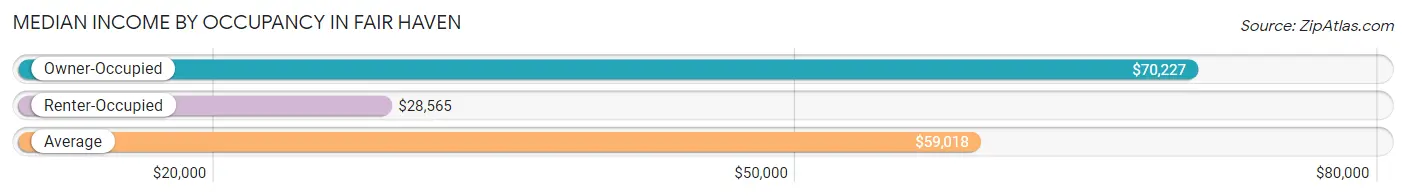
| Occupancy Type | # Households | Median Income |
| Owner-Occupied | 376 (77.5%) | $70,227 |
| Renter-Occupied | 109 (22.5%) | $28,565 |
| Average | 485 (100.0%) | $59,018 |
Occupancy by Householder Income Bracket in Fair Haven
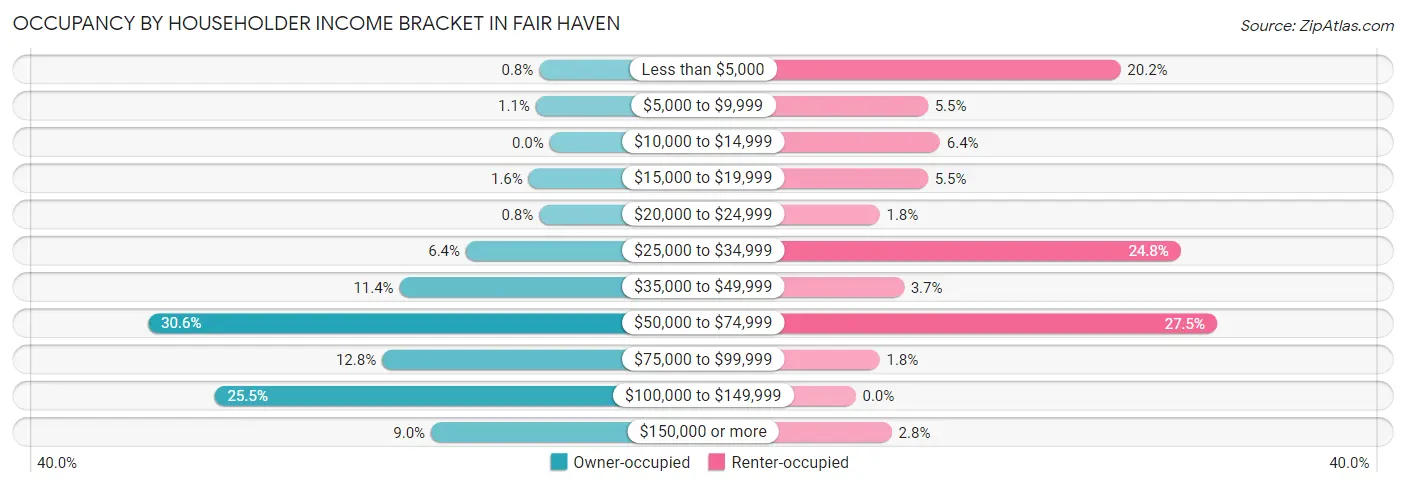
| Income Bracket | Owner-occupied | Renter-occupied |
| Less than $5,000 | 3 (0.8%) | 22 (20.2%) |
| $5,000 to $9,999 | 4 (1.1%) | 6 (5.5%) |
| $10,000 to $14,999 | 0 (0.0%) | 7 (6.4%) |
| $15,000 to $19,999 | 6 (1.6%) | 6 (5.5%) |
| $20,000 to $24,999 | 3 (0.8%) | 2 (1.8%) |
| $25,000 to $34,999 | 24 (6.4%) | 27 (24.8%) |
| $35,000 to $49,999 | 43 (11.4%) | 4 (3.7%) |
| $50,000 to $74,999 | 115 (30.6%) | 30 (27.5%) |
| $75,000 to $99,999 | 48 (12.8%) | 2 (1.8%) |
| $100,000 to $149,999 | 96 (25.5%) | 0 (0.0%) |
| $150,000 or more | 34 (9.0%) | 3 (2.8%) |
| Total | 376 (100.0%) | 109 (100.0%) |
Monthly Housing Cost Tiers in Fair Haven
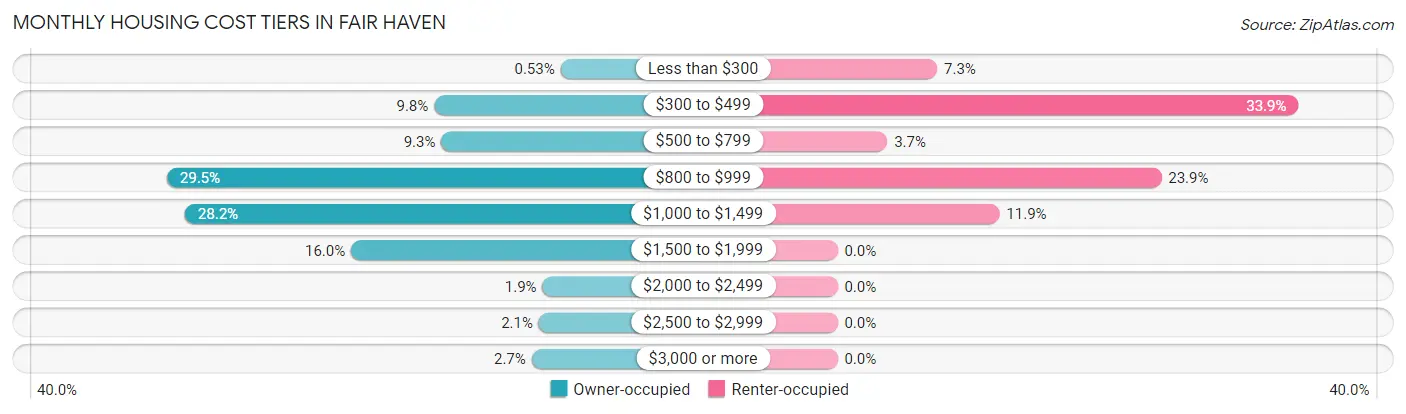
| Monthly Cost | Owner-occupied | Renter-occupied |
| Less than $300 | 2 (0.5%) | 8 (7.3%) |
| $300 to $499 | 37 (9.8%) | 37 (33.9%) |
| $500 to $799 | 35 (9.3%) | 4 (3.7%) |
| $800 to $999 | 111 (29.5%) | 26 (23.8%) |
| $1,000 to $1,499 | 106 (28.2%) | 13 (11.9%) |
| $1,500 to $1,999 | 60 (16.0%) | 0 (0.0%) |
| $2,000 to $2,499 | 7 (1.9%) | 0 (0.0%) |
| $2,500 to $2,999 | 8 (2.1%) | 0 (0.0%) |
| $3,000 or more | 10 (2.7%) | 0 (0.0%) |
| Total | 376 (100.0%) | 109 (100.0%) |
Physical Housing Characteristics in Fair Haven
Housing Structures in Fair Haven
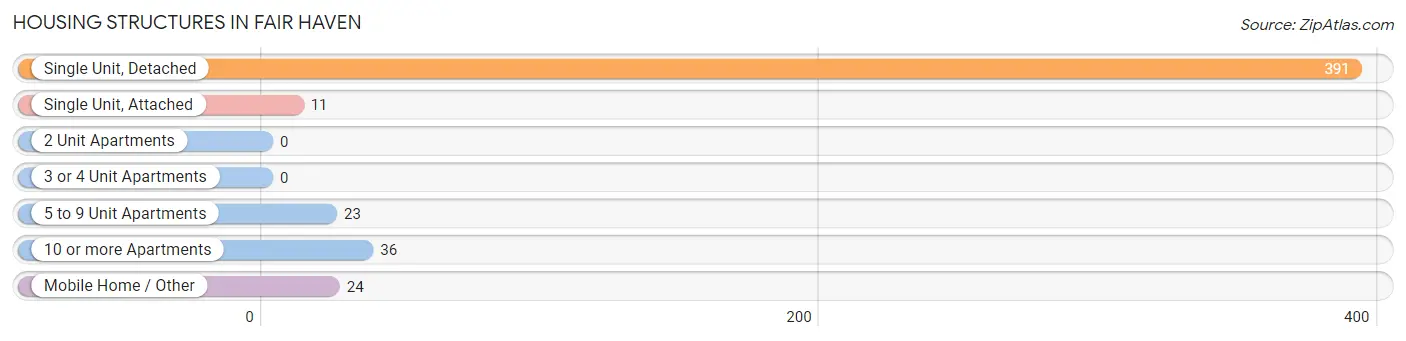
| Structure Type | # Housing Units | % Housing Units |
| Single Unit, Detached | 391 | 80.6% |
| Single Unit, Attached | 11 | 2.3% |
| 2 Unit Apartments | 0 | 0.0% |
| 3 or 4 Unit Apartments | 0 | 0.0% |
| 5 to 9 Unit Apartments | 23 | 4.7% |
| 10 or more Apartments | 36 | 7.4% |
| Mobile Home / Other | 24 | 5.0% |
| Total | 485 | 100.0% |
Housing Structures by Occupancy in Fair Haven
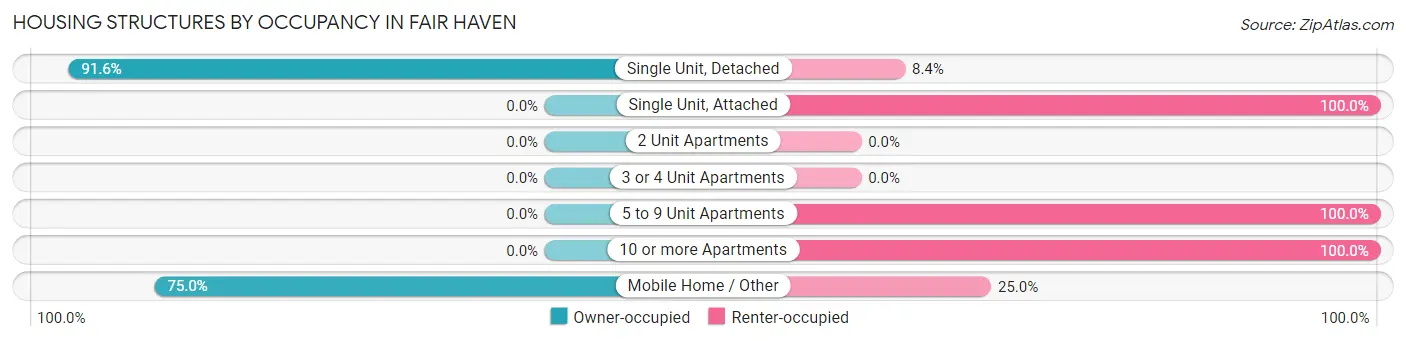
| Structure Type | Owner-occupied | Renter-occupied |
| Single Unit, Detached | 358 (91.6%) | 33 (8.4%) |
| Single Unit, Attached | 0 (0.0%) | 11 (100.0%) |
| 2 Unit Apartments | 0 (0.0%) | 0 (0.0%) |
| 3 or 4 Unit Apartments | 0 (0.0%) | 0 (0.0%) |
| 5 to 9 Unit Apartments | 0 (0.0%) | 23 (100.0%) |
| 10 or more Apartments | 0 (0.0%) | 36 (100.0%) |
| Mobile Home / Other | 18 (75.0%) | 6 (25.0%) |
| Total | 376 (77.5%) | 109 (22.5%) |
Housing Structures by Number of Rooms in Fair Haven
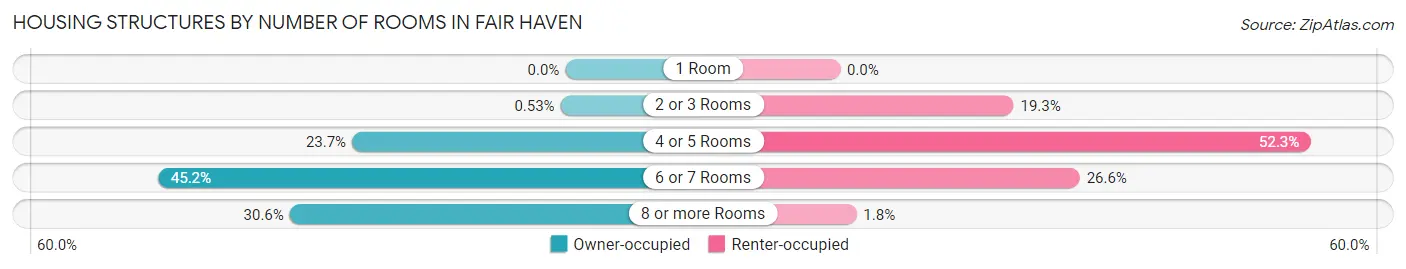
| Number of Rooms | Owner-occupied | Renter-occupied |
| 1 Room | 0 (0.0%) | 0 (0.0%) |
| 2 or 3 Rooms | 2 (0.5%) | 21 (19.3%) |
| 4 or 5 Rooms | 89 (23.7%) | 57 (52.3%) |
| 6 or 7 Rooms | 170 (45.2%) | 29 (26.6%) |
| 8 or more Rooms | 115 (30.6%) | 2 (1.8%) |
| Total | 376 (100.0%) | 109 (100.0%) |
Housing Structure by Heating Type in Fair Haven
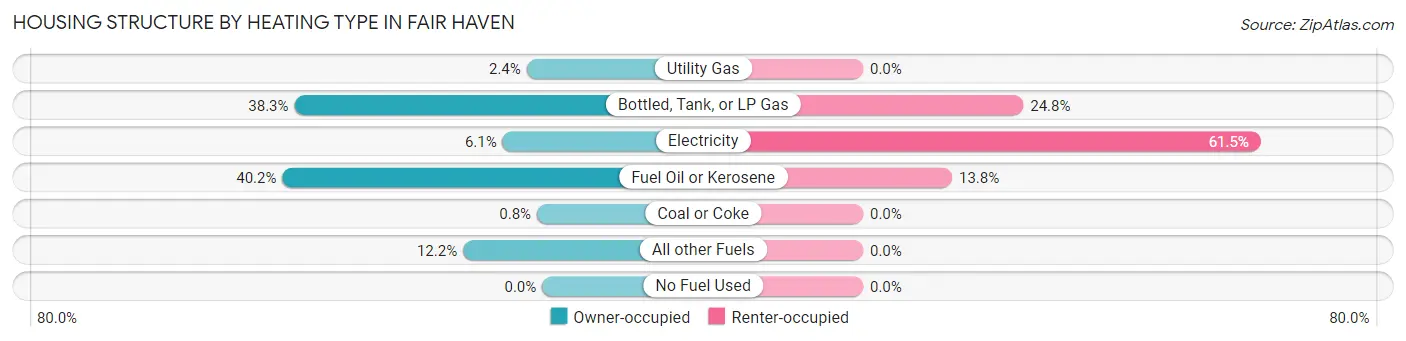
| Heating Type | Owner-occupied | Renter-occupied |
| Utility Gas | 9 (2.4%) | 0 (0.0%) |
| Bottled, Tank, or LP Gas | 144 (38.3%) | 27 (24.8%) |
| Electricity | 23 (6.1%) | 67 (61.5%) |
| Fuel Oil or Kerosene | 151 (40.2%) | 15 (13.8%) |
| Coal or Coke | 3 (0.8%) | 0 (0.0%) |
| All other Fuels | 46 (12.2%) | 0 (0.0%) |
| No Fuel Used | 0 (0.0%) | 0 (0.0%) |
| Total | 376 (100.0%) | 109 (100.0%) |
Household Vehicle Usage in Fair Haven
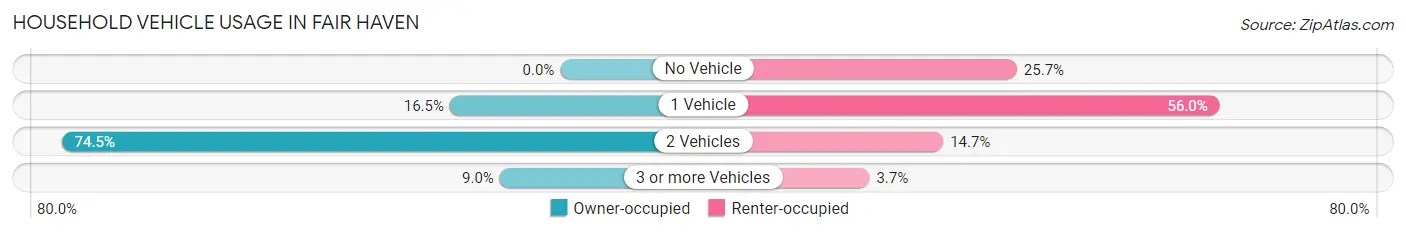
| Vehicles per Household | Owner-occupied | Renter-occupied |
| No Vehicle | 0 (0.0%) | 28 (25.7%) |
| 1 Vehicle | 62 (16.5%) | 61 (56.0%) |
| 2 Vehicles | 280 (74.5%) | 16 (14.7%) |
| 3 or more Vehicles | 34 (9.0%) | 4 (3.7%) |
| Total | 376 (100.0%) | 109 (100.0%) |
Real Estate & Mortgages in Fair Haven
Real Estate and Mortgage Overview in Fair Haven
| Characteristic | Without Mortgage | With Mortgage |
| Housing Units | 157 | 219 |
| Median Property Value | $158,900 | $137,200 |
| Median Household Income | $54,479 | $23 |
| Monthly Housing Costs | $897 | $10 |
| Real Estate Taxes | $4,349 | $4 |
Property Value by Mortgage Status in Fair Haven
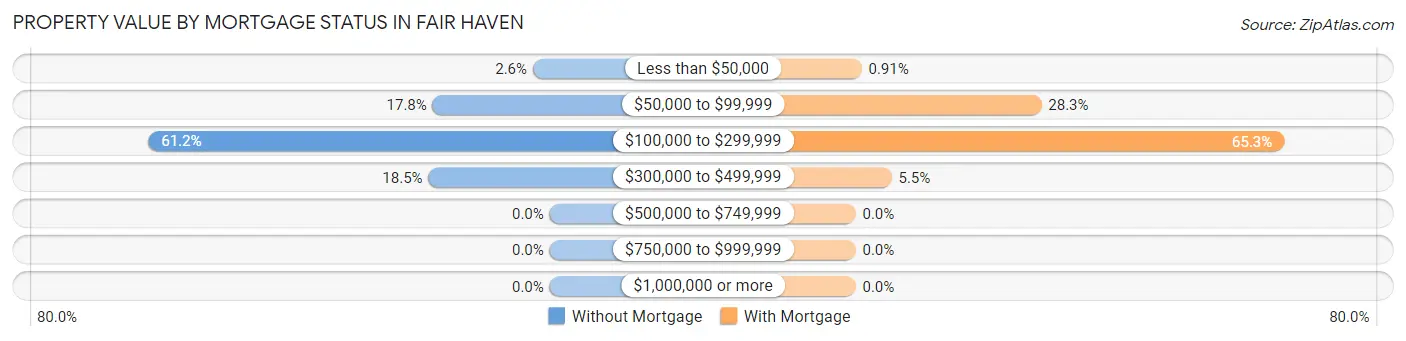
| Property Value | Without Mortgage | With Mortgage |
| Less than $50,000 | 4 (2.5%) | 2 (0.9%) |
| $50,000 to $99,999 | 28 (17.8%) | 62 (28.3%) |
| $100,000 to $299,999 | 96 (61.2%) | 143 (65.3%) |
| $300,000 to $499,999 | 29 (18.5%) | 12 (5.5%) |
| $500,000 to $749,999 | 0 (0.0%) | 0 (0.0%) |
| $750,000 to $999,999 | 0 (0.0%) | 0 (0.0%) |
| $1,000,000 or more | 0 (0.0%) | 0 (0.0%) |
| Total | 157 (100.0%) | 219 (100.0%) |
Household Income by Mortgage Status in Fair Haven
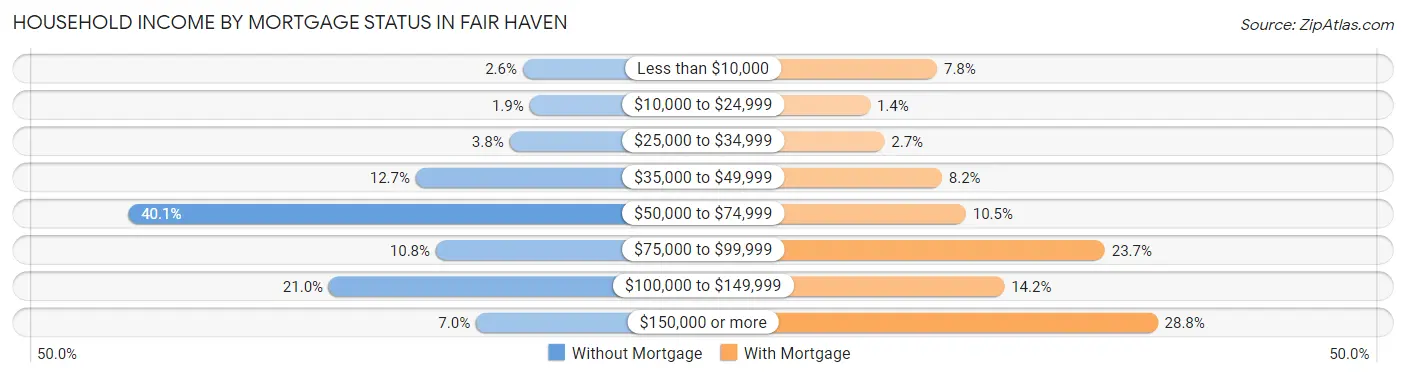
| Household Income | Without Mortgage | With Mortgage |
| Less than $10,000 | 4 (2.5%) | 17 (7.8%) |
| $10,000 to $24,999 | 3 (1.9%) | 3 (1.4%) |
| $25,000 to $34,999 | 6 (3.8%) | 6 (2.7%) |
| $35,000 to $49,999 | 20 (12.7%) | 18 (8.2%) |
| $50,000 to $74,999 | 63 (40.1%) | 23 (10.5%) |
| $75,000 to $99,999 | 17 (10.8%) | 52 (23.7%) |
| $100,000 to $149,999 | 33 (21.0%) | 31 (14.2%) |
| $150,000 or more | 11 (7.0%) | 63 (28.8%) |
| Total | 157 (100.0%) | 219 (100.0%) |
Property Value to Household Income Ratio in Fair Haven
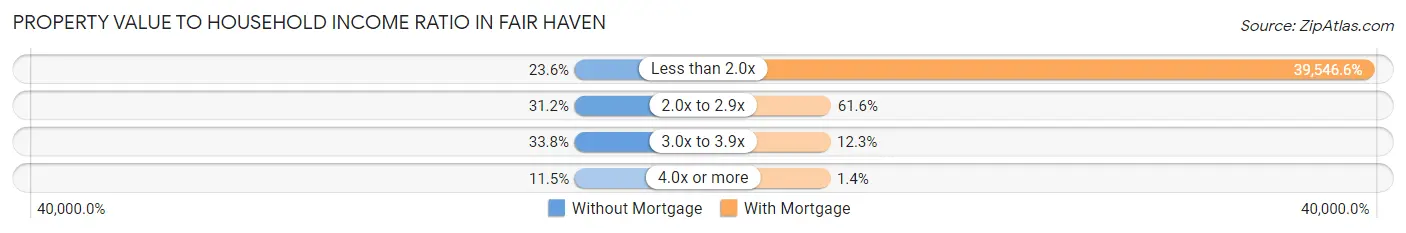
| Value-to-Income Ratio | Without Mortgage | With Mortgage |
| Less than 2.0x | 37 (23.6%) | 86,607 (39,546.6%) |
| 2.0x to 2.9x | 49 (31.2%) | 135 (61.6%) |
| 3.0x to 3.9x | 53 (33.8%) | 27 (12.3%) |
| 4.0x or more | 18 (11.5%) | 3 (1.4%) |
| Total | 157 (100.0%) | 219 (100.0%) |
Real Estate Taxes by Mortgage Status in Fair Haven
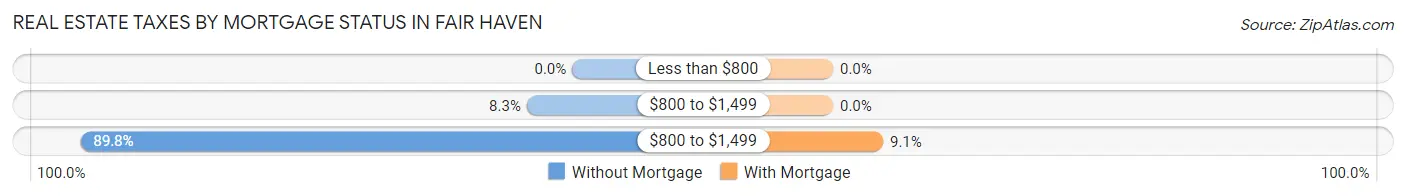
| Property Taxes | Without Mortgage | With Mortgage |
| Less than $800 | 0 (0.0%) | 0 (0.0%) |
| $800 to $1,499 | 13 (8.3%) | 0 (0.0%) |
| $800 to $1,499 | 141 (89.8%) | 20 (9.1%) |
| Total | 157 (100.0%) | 219 (100.0%) |
Health & Disability in Fair Haven
Health Insurance Coverage by Age in Fair Haven
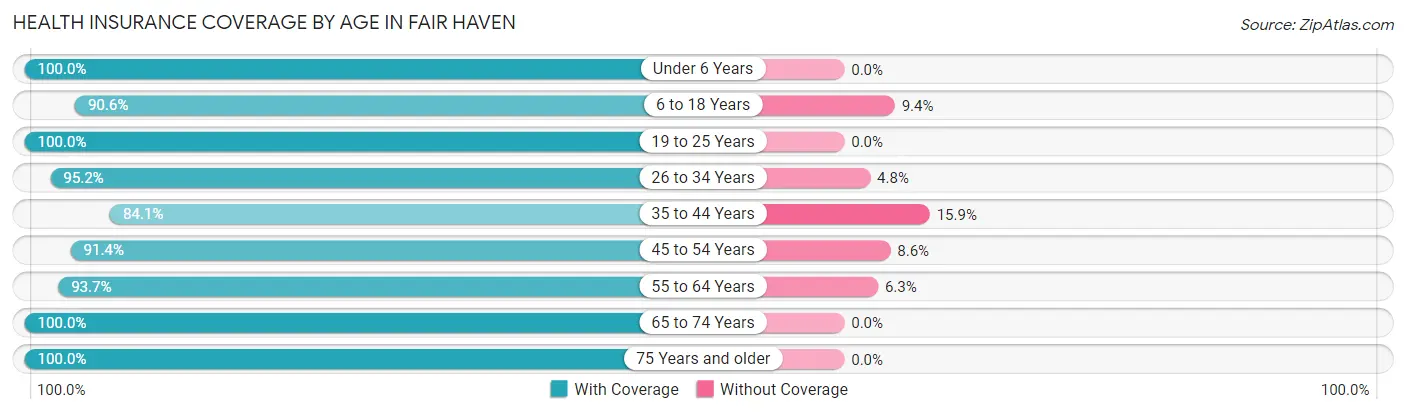
| Age Bracket | With Coverage | Without Coverage |
| Under 6 Years | 97 (100.0%) | 0 (0.0%) |
| 6 to 18 Years | 106 (90.6%) | 11 (9.4%) |
| 19 to 25 Years | 121 (100.0%) | 0 (0.0%) |
| 26 to 34 Years | 79 (95.2%) | 4 (4.8%) |
| 35 to 44 Years | 95 (84.1%) | 18 (15.9%) |
| 45 to 54 Years | 117 (91.4%) | 11 (8.6%) |
| 55 to 64 Years | 224 (93.7%) | 15 (6.3%) |
| 65 to 74 Years | 87 (100.0%) | 0 (0.0%) |
| 75 Years and older | 156 (100.0%) | 0 (0.0%) |
| Total | 1,082 (94.8%) | 59 (5.2%) |
Health Insurance Coverage by Citizenship Status in Fair Haven
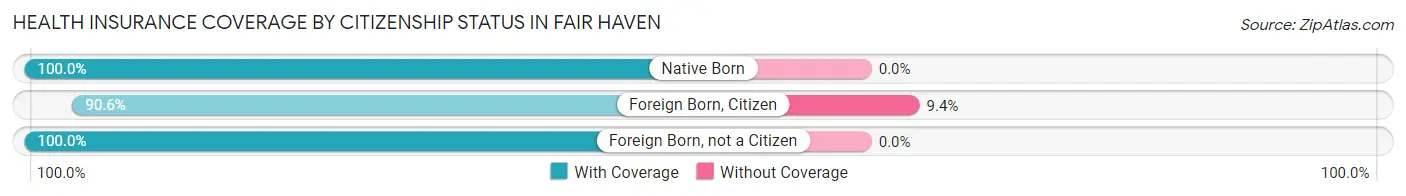
| Citizenship Status | With Coverage | Without Coverage |
| Native Born | 97 (100.0%) | 0 (0.0%) |
| Foreign Born, Citizen | 106 (90.6%) | 11 (9.4%) |
| Foreign Born, not a Citizen | 121 (100.0%) | 0 (0.0%) |
Health Insurance Coverage by Household Income in Fair Haven
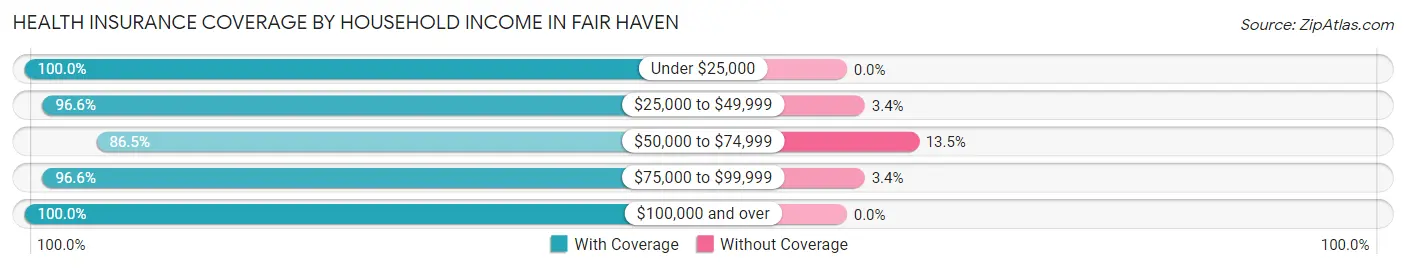
| Household Income | With Coverage | Without Coverage |
| Under $25,000 | 75 (100.0%) | 0 (0.0%) |
| $25,000 to $49,999 | 229 (96.6%) | 8 (3.4%) |
| $50,000 to $74,999 | 302 (86.5%) | 47 (13.5%) |
| $75,000 to $99,999 | 115 (96.6%) | 4 (3.4%) |
| $100,000 and over | 361 (100.0%) | 0 (0.0%) |
Public vs Private Health Insurance Coverage by Age in Fair Haven
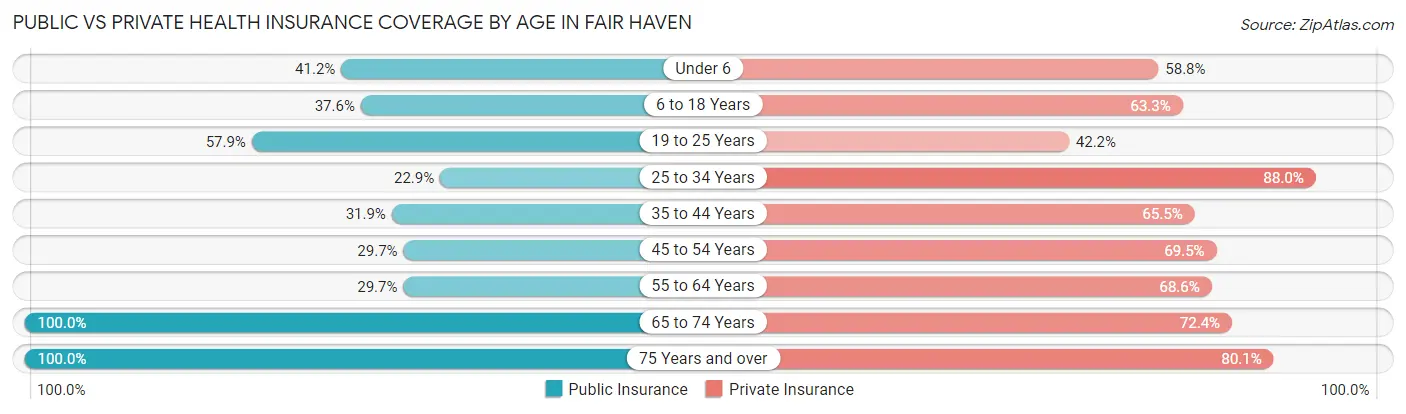
| Age Bracket | Public Insurance | Private Insurance |
| Under 6 | 40 (41.2%) | 57 (58.8%) |
| 6 to 18 Years | 44 (37.6%) | 74 (63.2%) |
| 19 to 25 Years | 70 (57.9%) | 51 (42.1%) |
| 25 to 34 Years | 19 (22.9%) | 73 (87.9%) |
| 35 to 44 Years | 36 (31.9%) | 74 (65.5%) |
| 45 to 54 Years | 38 (29.7%) | 89 (69.5%) |
| 55 to 64 Years | 71 (29.7%) | 164 (68.6%) |
| 65 to 74 Years | 87 (100.0%) | 63 (72.4%) |
| 75 Years and over | 156 (100.0%) | 125 (80.1%) |
| Total | 561 (49.2%) | 770 (67.5%) |
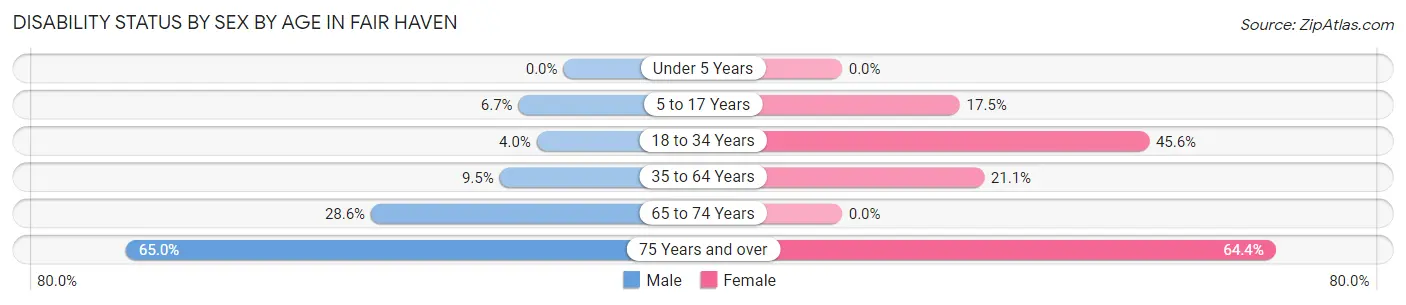
Disability Status by Sex by Age in Fair Haven
| Age Bracket | Male | Female |
| Under 5 Years | 0 (0.0%) | 0 (0.0%) |
| 5 to 17 Years | 3 (6.7%) | 14 (17.5%) |
| 18 to 34 Years | 4 (4.0%) | 52 (45.6%) |
| 35 to 64 Years | 23 (9.5%) | 50 (21.1%) |
| 65 to 74 Years | 12 (28.6%) | 0 (0.0%) |
| 75 Years and over | 63 (64.9%) | 38 (64.4%) |
Disability Class by Sex by Age in Fair Haven
Disability Class: Hearing Difficulty
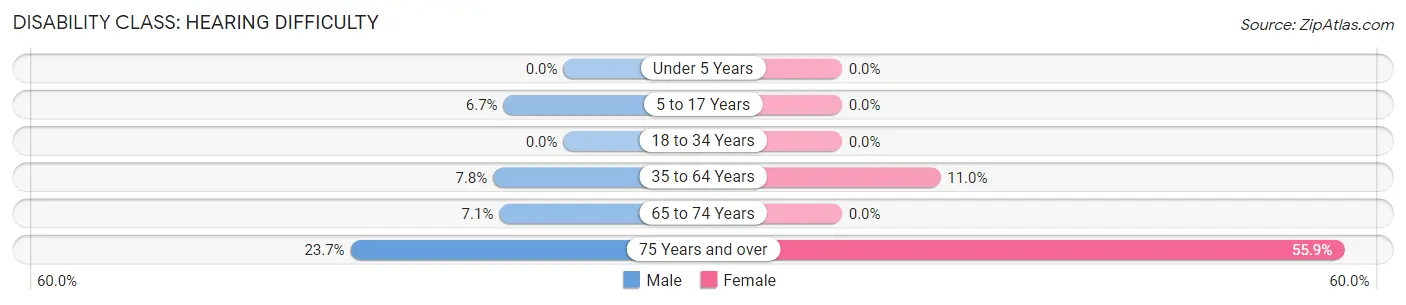
| Age Bracket | Male | Female |
| Under 5 Years | 0 (0.0%) | 0 (0.0%) |
| 5 to 17 Years | 3 (6.7%) | 0 (0.0%) |
| 18 to 34 Years | 0 (0.0%) | 0 (0.0%) |
| 35 to 64 Years | 19 (7.8%) | 26 (11.0%) |
| 65 to 74 Years | 3 (7.1%) | 0 (0.0%) |
| 75 Years and over | 23 (23.7%) | 33 (55.9%) |
Disability Class: Vision Difficulty
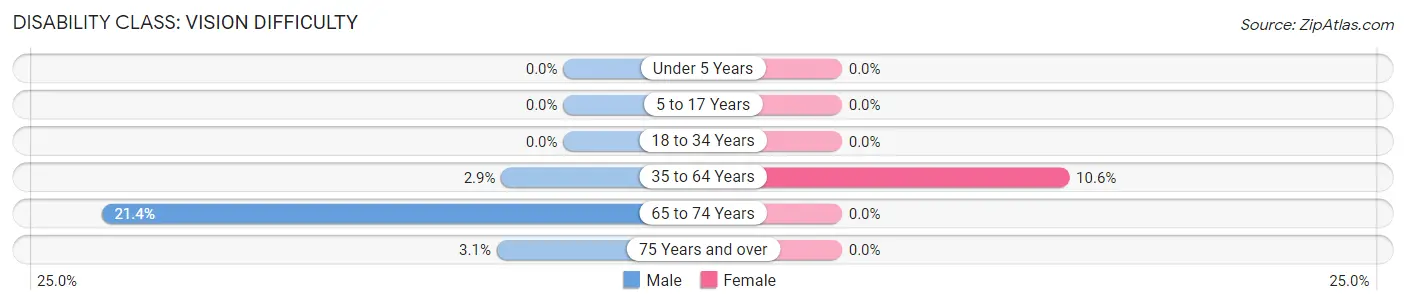
| Age Bracket | Male | Female |
| Under 5 Years | 0 (0.0%) | 0 (0.0%) |
| 5 to 17 Years | 0 (0.0%) | 0 (0.0%) |
| 18 to 34 Years | 0 (0.0%) | 0 (0.0%) |
| 35 to 64 Years | 7 (2.9%) | 25 (10.5%) |
| 65 to 74 Years | 9 (21.4%) | 0 (0.0%) |
| 75 Years and over | 3 (3.1%) | 0 (0.0%) |
Disability Class: Cognitive Difficulty
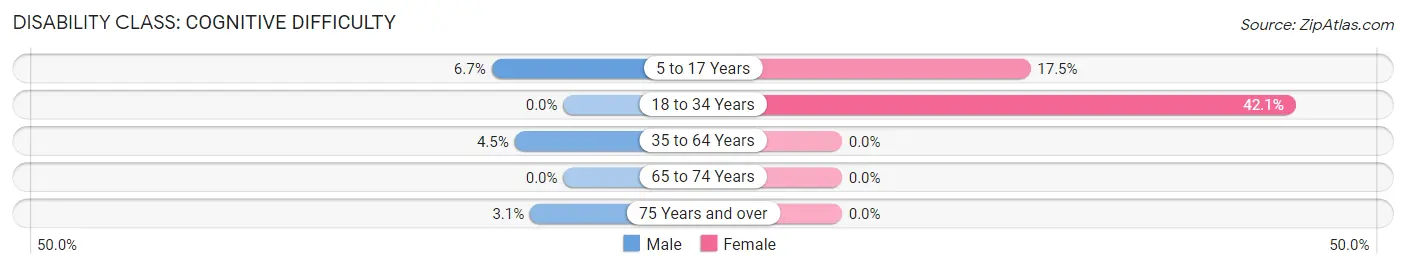
| Age Bracket | Male | Female |
| 5 to 17 Years | 3 (6.7%) | 14 (17.5%) |
| 18 to 34 Years | 0 (0.0%) | 48 (42.1%) |
| 35 to 64 Years | 11 (4.5%) | 0 (0.0%) |
| 65 to 74 Years | 0 (0.0%) | 0 (0.0%) |
| 75 Years and over | 3 (3.1%) | 0 (0.0%) |
Disability Class: Ambulatory Difficulty
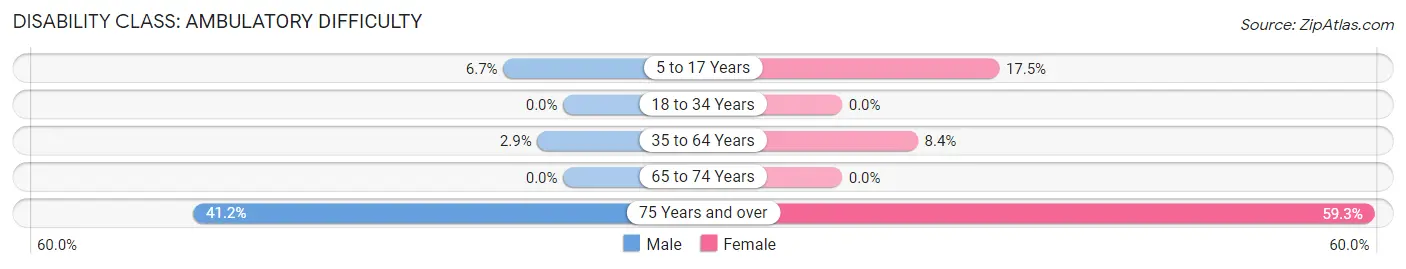
| Age Bracket | Male | Female |
| 5 to 17 Years | 3 (6.7%) | 14 (17.5%) |
| 18 to 34 Years | 0 (0.0%) | 0 (0.0%) |
| 35 to 64 Years | 7 (2.9%) | 20 (8.4%) |
| 65 to 74 Years | 0 (0.0%) | 0 (0.0%) |
| 75 Years and over | 40 (41.2%) | 35 (59.3%) |
Disability Class: Self-Care Difficulty
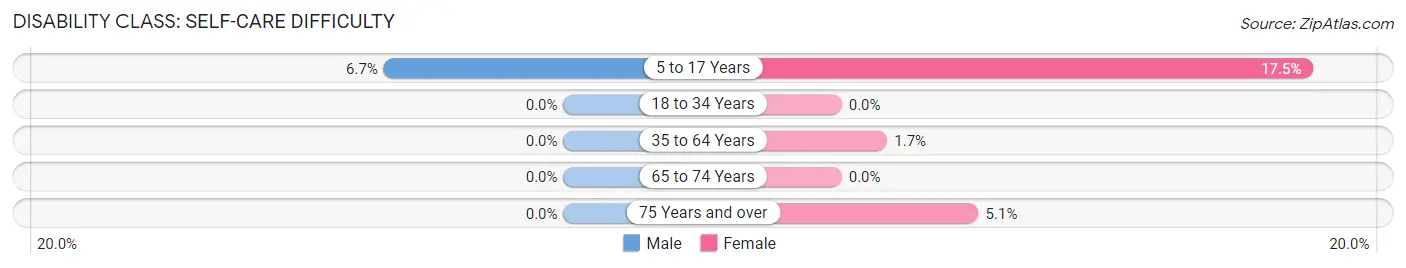
| Age Bracket | Male | Female |
| 5 to 17 Years | 3 (6.7%) | 14 (17.5%) |
| 18 to 34 Years | 0 (0.0%) | 0 (0.0%) |
| 35 to 64 Years | 0 (0.0%) | 4 (1.7%) |
| 65 to 74 Years | 0 (0.0%) | 0 (0.0%) |
| 75 Years and over | 0 (0.0%) | 3 (5.1%) |
Technology Access in Fair Haven
Computing Device Access in Fair Haven
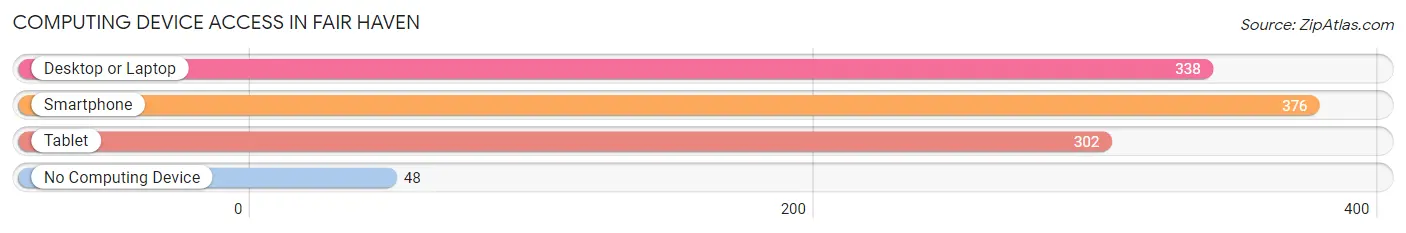
| Device Type | # Households | % Households |
| Desktop or Laptop | 338 | 69.7% |
| Smartphone | 376 | 77.5% |
| Tablet | 302 | 62.3% |
| No Computing Device | 48 | 9.9% |
| Total | 485 | 100.0% |
Internet Access in Fair Haven
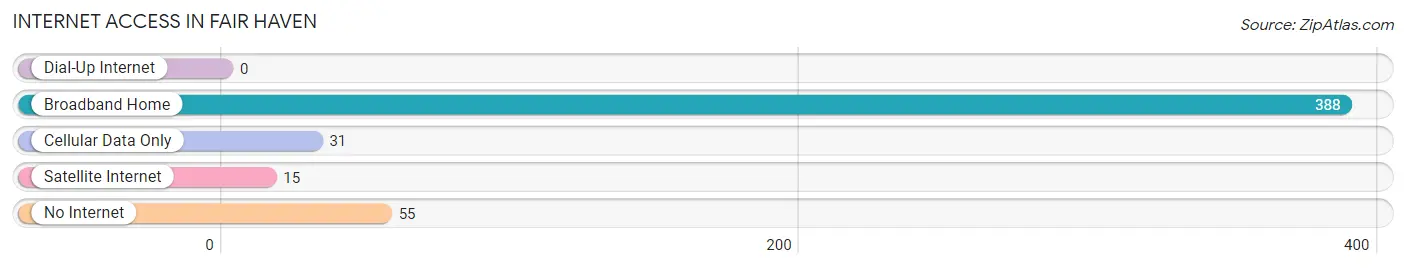
| Internet Type | # Households | % Households |
| Dial-Up Internet | 0 | 0.0% |
| Broadband Home | 388 | 80.0% |
| Cellular Data Only | 31 | 6.4% |
| Satellite Internet | 15 | 3.1% |
| No Internet | 55 | 11.3% |
| Total | 485 | 100.0% |
Fair Haven Summary
History
Fair Haven, New York is a small village located in Cayuga County, New York. It is situated on the eastern shore of Lake Ontario, and is part of the Finger Lakes region. The village was first settled in 1810 by a group of settlers from Connecticut, and was originally known as “Fair Haven Corners”. The name was changed to Fair Haven in 1817.
The village was an important port for the shipping of grain and other goods from the Finger Lakes region to the rest of the country. The village was also a popular destination for tourists, who came to enjoy the beautiful scenery and the many recreational activities available in the area.
In the late 19th century, the village was home to several industries, including a paper mill, a flour mill, a sawmill, and a tannery. The village also had a number of stores, hotels, and other businesses.
In the early 20th century, the village experienced a period of decline, as the industries that had been the mainstay of the village’s economy began to close. The village was also affected by the Great Depression, and many of the businesses in the village closed.
In the late 20th century, the village experienced a resurgence, as new businesses opened and the village began to attract tourists again. The village is now home to several restaurants, shops, and other businesses, as well as a number of historic buildings.
Geography
Fair Haven is located in the Finger Lakes region of New York, on the eastern shore of Lake Ontario. The village is situated on the north side of the lake, and is bordered by the towns of Sterling and Sodus. The village is located approximately 25 miles north of Syracuse, and is about a two-hour drive from Rochester.
The village is situated on a flat plain, with the highest point in the village being just over 500 feet above sea level. The village is located in a temperate climate, with hot summers and cold winters. The average annual temperature is around 50 degrees Fahrenheit.
Economy
The economy of Fair Haven is largely based on tourism and retail. The village is home to several restaurants, shops, and other businesses, as well as a number of historic buildings. The village is also home to a number of wineries, which attract tourists from all over the region.
The village is also home to a number of small businesses, including a number of farms and other agricultural businesses. The village is also home to a number of manufacturing businesses, including a paper mill and a flour mill.
Demographics
As of the 2010 census, the population of Fair Haven was 1,845. The population is largely white, with a small percentage of African Americans and other minorities. The median age of the population is 44.7 years, and the median household income is $45,000.
The village is home to a number of churches, including the Fair Haven United Methodist Church, the Fair Haven Baptist Church, and the Fair Haven Presbyterian Church. The village is also home to a number of schools, including the Fair Haven Elementary School and the Fair Haven High School.
Common Questions
What is Per Capita Income in Fair Haven?
Per Capita income in Fair Haven is $33,079.
What is the Median Family Income in Fair Haven?
Median Family Income in Fair Haven is $70,455.
What is the Median Household income in Fair Haven?
Median Household Income in Fair Haven is $59,018.
What is Income or Wage Gap in Fair Haven?
Income or Wage Gap in Fair Haven is 44.7%.
Women in Fair Haven earn 55.3 cents for every dollar earned by a man.
What is Inequality or Gini Index in Fair Haven?
Inequality or Gini Index in Fair Haven is 0.40.
What is the Total Population of Fair Haven?
Total Population of Fair Haven is 1,151.
What is the Total Male Population of Fair Haven?
Total Male Population of Fair Haven is 591.
What is the Total Female Population of Fair Haven?
Total Female Population of Fair Haven is 560.
What is the Ratio of Males per 100 Females in Fair Haven?
There are 105.54 Males per 100 Females in Fair Haven.
What is the Ratio of Females per 100 Males in Fair Haven?
There are 94.75 Females per 100 Males in Fair Haven.
What is the Median Population Age in Fair Haven?
Median Population Age in Fair Haven is 49.5 Years.
What is the Average Family Size in Fair Haven
Average Family Size in Fair Haven is 2.9 People.
What is the Average Household Size in Fair Haven
Average Household Size in Fair Haven is 2.4 People.
How Large is the Labor Force in Fair Haven?
There are 615 People in the Labor Forcein in Fair Haven.
What is the Percentage of People in the Labor Force in Fair Haven?
64.4% of People are in the Labor Force in Fair Haven.
What is the Unemployment Rate in Fair Haven?
Unemployment Rate in Fair Haven is 2.4%.