Northlake, IL Map & Demographics
Northlake Map
Northlake Overview
$28,950
PER CAPITA INCOME
$87,782
AVG FAMILY INCOME
$71,767
AVG HOUSEHOLD INCOME
14.4%
WAGE / INCOME GAP [ % ]
85.6¢/ $1
WAGE / INCOME GAP [ $ ]
$8,289
FAMILY INCOME DEFICIT
0.38
INEQUALITY / GINI INDEX
12,683
TOTAL POPULATION
6,128
MALE POPULATION
6,555
FEMALE POPULATION
93.49
MALES / 100 FEMALES
106.97
FEMALES / 100 MALES
39.5
MEDIAN AGE
3.3
AVG FAMILY SIZE
2.7
AVG HOUSEHOLD SIZE
6,285
LABOR FORCE [ PEOPLE ]
62.6%
PERCENT IN LABOR FORCE
4.8%
UNEMPLOYMENT RATE
Northlake Area Codes
Income in Northlake
Income Overview in Northlake
Per Capita Income in Northlake is $28,950, while median incomes of families and households are $87,782 and $71,767 respectively.
| Characteristic | Number | Measure |
| Per Capita Income | 12,683 | $28,950 |
| Median Family Income | 3,134 | $87,782 |
| Mean Family Income | 3,134 | $92,149 |
| Median Household Income | 4,539 | $71,767 |
| Mean Household Income | 4,539 | $79,728 |
| Income Deficit | 3,134 | $8,289 |
| Wage / Income Gap (%) | 12,683 | 14.37% |
| Wage / Income Gap ($) | 12,683 | 85.63¢ per $1 |
| Gini / Inequality Index | 12,683 | 0.38 |
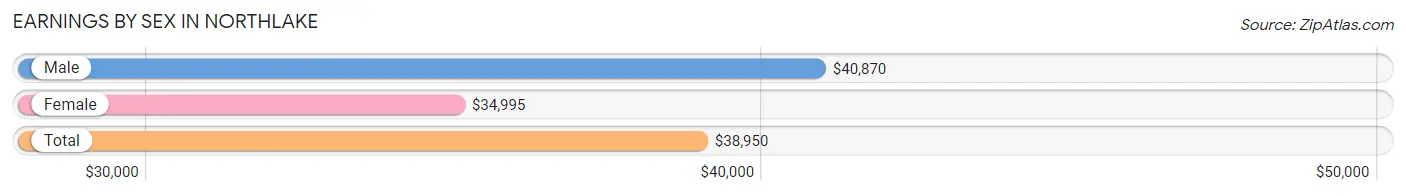
Earnings by Sex in Northlake
Average Earnings in Northlake are $38,950, $40,870 for men and $34,995 for women, a difference of 14.4%.
| Sex | Number | Average Earnings |
| Male | 3,496 (53.3%) | $40,870 |
| Female | 3,057 (46.7%) | $34,995 |
| Total | 6,553 (100.0%) | $38,950 |
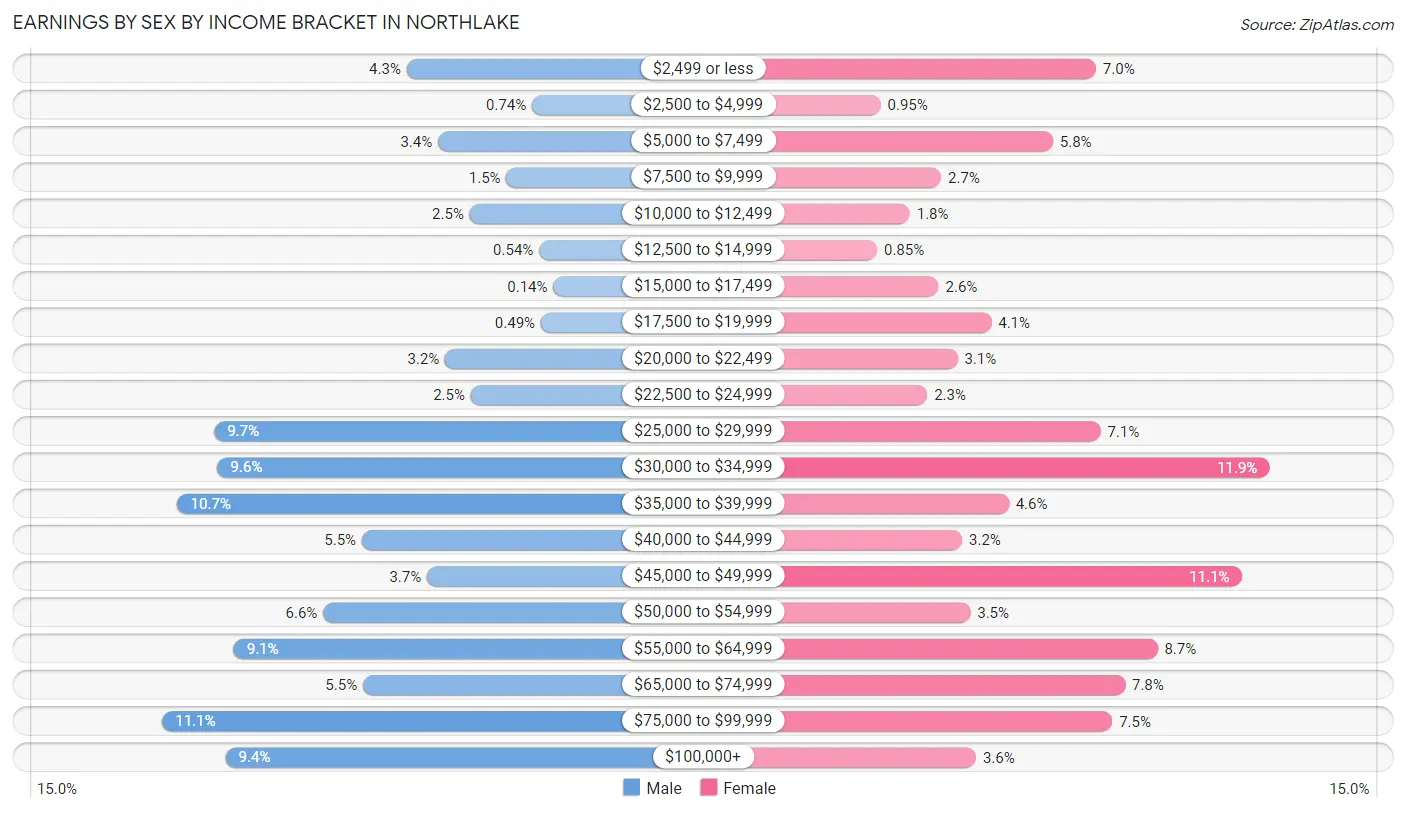
Earnings by Sex by Income Bracket in Northlake
The most common earnings brackets in Northlake are $75,000 to $99,999 for men (389 | 11.1%) and $30,000 to $34,999 for women (363 | 11.9%).
| Income | Male | Female |
| $2,499 or less | 149 (4.3%) | 214 (7.0%) |
| $2,500 to $4,999 | 26 (0.7%) | 29 (0.9%) |
| $5,000 to $7,499 | 118 (3.4%) | 177 (5.8%) |
| $7,500 to $9,999 | 51 (1.5%) | 81 (2.6%) |
| $10,000 to $12,499 | 87 (2.5%) | 54 (1.8%) |
| $12,500 to $14,999 | 19 (0.5%) | 26 (0.9%) |
| $15,000 to $17,499 | 5 (0.1%) | 79 (2.6%) |
| $17,500 to $19,999 | 17 (0.5%) | 124 (4.1%) |
| $20,000 to $22,499 | 111 (3.2%) | 95 (3.1%) |
| $22,500 to $24,999 | 86 (2.5%) | 69 (2.3%) |
| $25,000 to $29,999 | 338 (9.7%) | 218 (7.1%) |
| $30,000 to $34,999 | 335 (9.6%) | 363 (11.9%) |
| $35,000 to $39,999 | 374 (10.7%) | 139 (4.5%) |
| $40,000 to $44,999 | 193 (5.5%) | 99 (3.2%) |
| $45,000 to $49,999 | 129 (3.7%) | 339 (11.1%) |
| $50,000 to $54,999 | 231 (6.6%) | 106 (3.5%) |
| $55,000 to $64,999 | 319 (9.1%) | 267 (8.7%) |
| $65,000 to $74,999 | 192 (5.5%) | 239 (7.8%) |
| $75,000 to $99,999 | 389 (11.1%) | 228 (7.5%) |
| $100,000+ | 327 (9.3%) | 111 (3.6%) |
| Total | 3,496 (100.0%) | 3,057 (100.0%) |
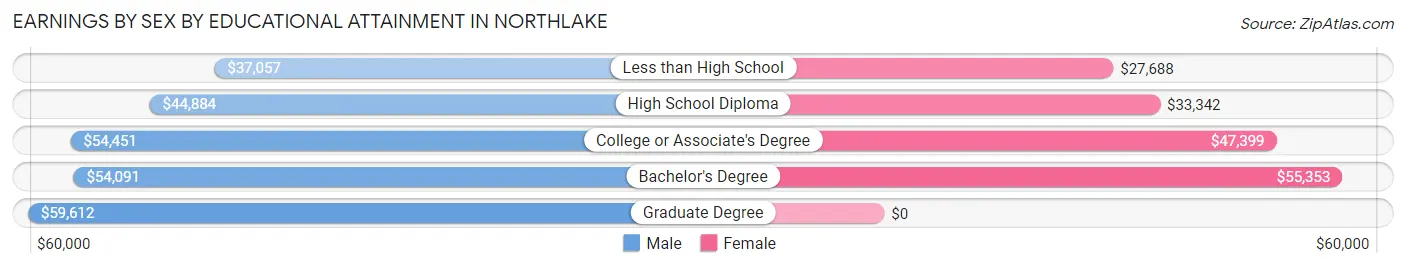
Earnings by Sex by Educational Attainment in Northlake
Average earnings in Northlake are $45,079 for men and $40,720 for women, a difference of 9.7%. Men with an educational attainment of graduate degree enjoy the highest average annual earnings of $59,612, while those with less than high school education earn the least with $37,057. Women with an educational attainment of bachelor's degree earn the most with the average annual earnings of $55,353, while those with less than high school education have the smallest earnings of $27,688.
| Educational Attainment | Male Income | Female Income |
| Less than High School | $37,057 | $27,688 |
| High School Diploma | $44,884 | $33,342 |
| College or Associate's Degree | $54,451 | $47,399 |
| Bachelor's Degree | $54,091 | $55,353 |
| Graduate Degree | $59,612 | $0 |
| Total | $45,079 | $40,720 |
Family Income in Northlake
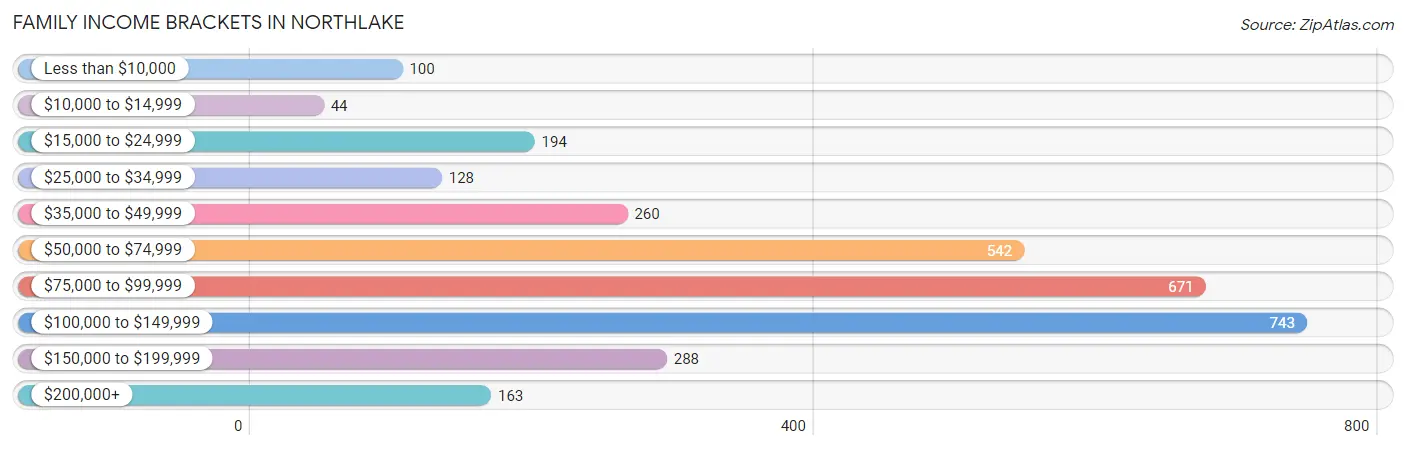
Family Income Brackets in Northlake
According to the Northlake family income data, there are 743 families falling into the $100,000 to $149,999 income range, which is the most common income bracket and makes up 23.7% of all families. Conversely, the $10,000 to $14,999 income bracket is the least frequent group with only 44 families (1.4%) belonging to this category.
| Income Bracket | # Families | % Families |
| Less than $10,000 | 100 | 3.2% |
| $10,000 to $14,999 | 44 | 1.4% |
| $15,000 to $24,999 | 194 | 6.2% |
| $25,000 to $34,999 | 128 | 4.1% |
| $35,000 to $49,999 | 260 | 8.3% |
| $50,000 to $74,999 | 542 | 17.3% |
| $75,000 to $99,999 | 671 | 21.4% |
| $100,000 to $149,999 | 743 | 23.7% |
| $150,000 to $199,999 | 288 | 9.2% |
| $200,000+ | 163 | 5.2% |
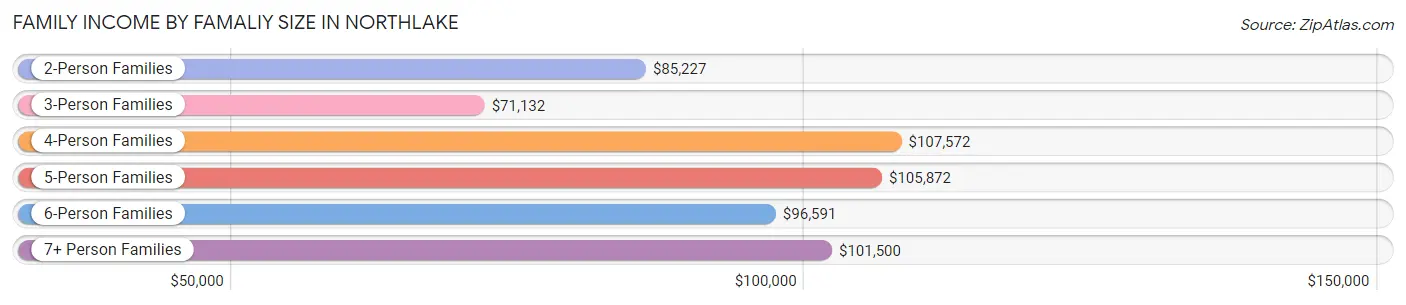
Family Income by Famaliy Size in Northlake
4-person families (521 | 16.6%) account for the highest median family income in Northlake with $107,572 per family, while 2-person families (1,212 | 38.7%) have the highest median income of $42,614 per family member.
| Income Bracket | # Families | Median Income |
| 2-Person Families | 1,212 (38.7%) | $85,227 |
| 3-Person Families | 757 (24.1%) | $71,132 |
| 4-Person Families | 521 (16.6%) | $107,572 |
| 5-Person Families | 456 (14.5%) | $105,872 |
| 6-Person Families | 174 (5.6%) | $96,591 |
| 7+ Person Families | 14 (0.4%) | $101,500 |
| Total | 3,134 (100.0%) | $87,782 |
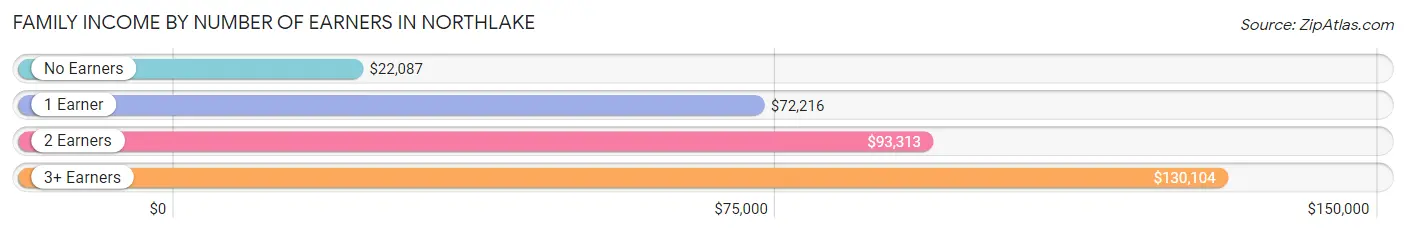
Family Income by Number of Earners in Northlake
The median family income in Northlake is $87,782, with families comprising 3+ earners (545) having the highest median family income of $130,104, while families with no earners (351) have the lowest median family income of $22,087, accounting for 17.4% and 11.2% of families, respectively.
| Number of Earners | # Families | Median Income |
| No Earners | 351 (11.2%) | $22,087 |
| 1 Earner | 973 (31.0%) | $72,216 |
| 2 Earners | 1,265 (40.4%) | $93,313 |
| 3+ Earners | 545 (17.4%) | $130,104 |
| Total | 3,134 (100.0%) | $87,782 |
Household Income in Northlake
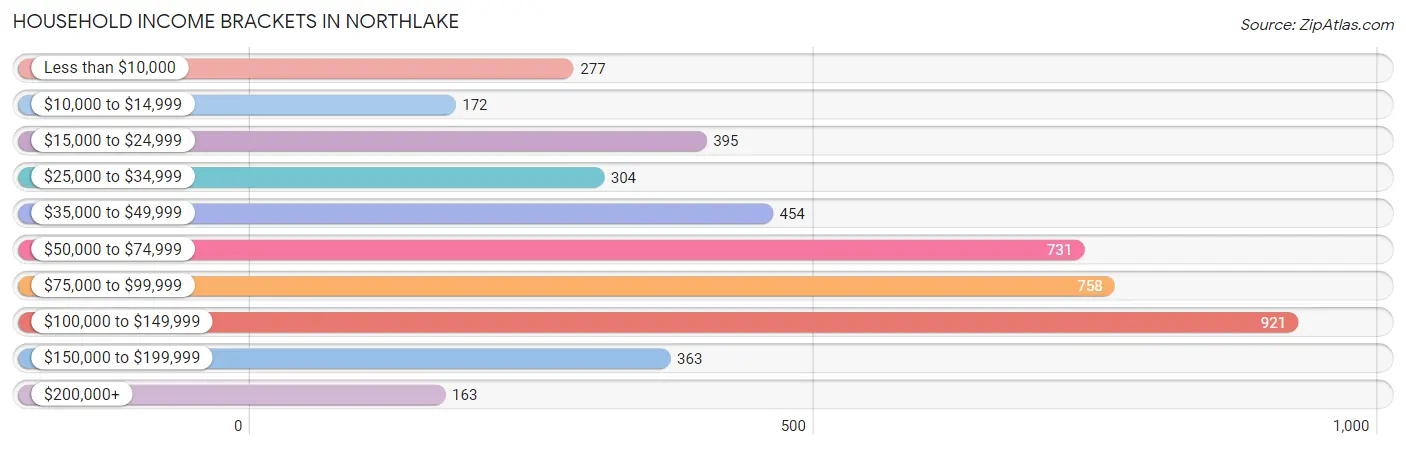
Household Income Brackets in Northlake
With 921 households falling in the category, the $100,000 to $149,999 income range is the most frequent in Northlake, accounting for 20.3% of all households. In contrast, only 163 households (3.6%) fall into the $200,000+ income bracket, making it the least populous group.
| Income Bracket | # Households | % Households |
| Less than $10,000 | 277 | 6.1% |
| $10,000 to $14,999 | 172 | 3.8% |
| $15,000 to $24,999 | 395 | 8.7% |
| $25,000 to $34,999 | 304 | 6.7% |
| $35,000 to $49,999 | 454 | 10.0% |
| $50,000 to $74,999 | 731 | 16.1% |
| $75,000 to $99,999 | 758 | 16.7% |
| $100,000 to $149,999 | 921 | 20.3% |
| $150,000 to $199,999 | 363 | 8.0% |
| $200,000+ | 163 | 3.6% |
Household Income by Householder Age in Northlake
The median household income in Northlake is $71,767, with the highest median household income of $87,097 found in the 45 to 64 years age bracket for the primary householder. A total of 1,800 households (39.7%) fall into this category. Meanwhile, the 15 to 24 years age bracket for the primary householder has the lowest median household income of $0, with 77 households (1.7%) in this group.
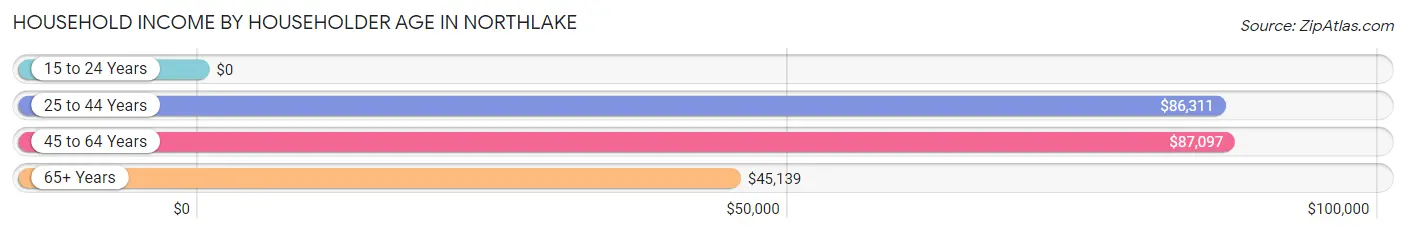
| Income Bracket | # Households | Median Income |
| 15 to 24 Years | 77 (1.7%) | $0 |
| 25 to 44 Years | 1,467 (32.3%) | $86,311 |
| 45 to 64 Years | 1,800 (39.7%) | $87,097 |
| 65+ Years | 1,195 (26.3%) | $45,139 |
| Total | 4,539 (100.0%) | $71,767 |
Poverty in Northlake
Income Below Poverty by Sex and Age in Northlake
With 8.6% poverty level for males and 12.5% for females among the residents of Northlake, 75 year old and over males and under 5 year old females are the most vulnerable to poverty, with 107 males (47.3%) and 62 females (33.7%) in their respective age groups living below the poverty level.
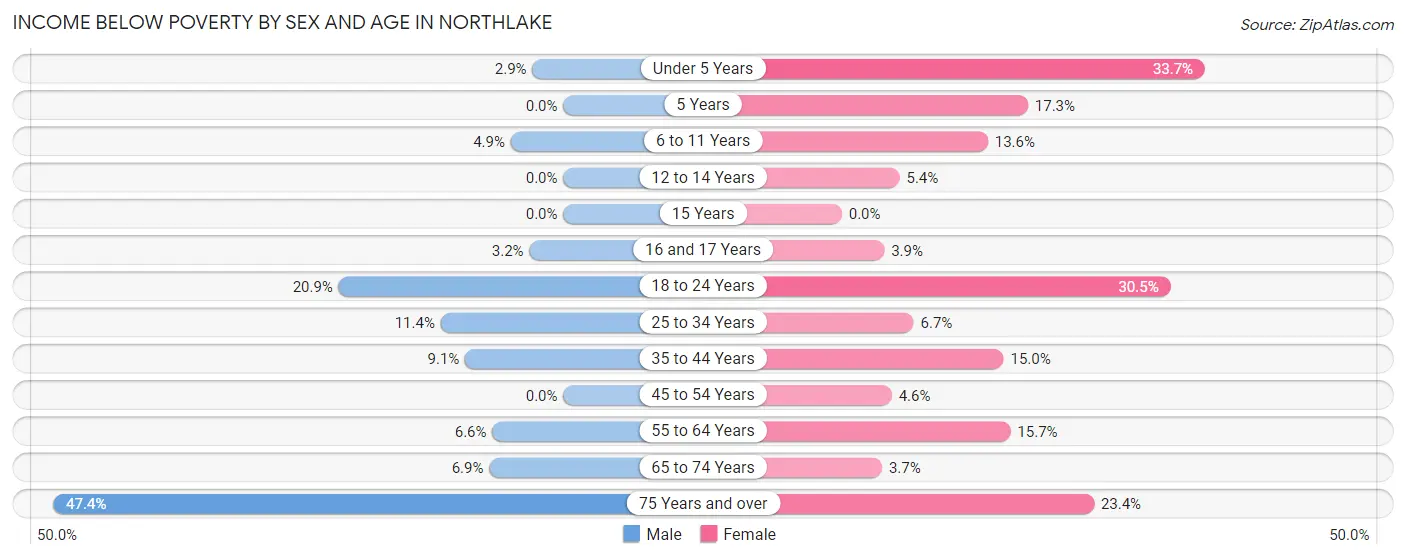
| Age Bracket | Male | Female |
| Under 5 Years | 5 (2.9%) | 62 (33.7%) |
| 5 Years | 0 (0.0%) | 19 (17.3%) |
| 6 to 11 Years | 36 (4.9%) | 63 (13.6%) |
| 12 to 14 Years | 0 (0.0%) | 17 (5.4%) |
| 15 Years | 0 (0.0%) | 0 (0.0%) |
| 16 and 17 Years | 4 (3.2%) | 5 (3.9%) |
| 18 to 24 Years | 98 (20.8%) | 172 (30.5%) |
| 25 to 34 Years | 88 (11.4%) | 53 (6.7%) |
| 35 to 44 Years | 81 (9.1%) | 148 (15.0%) |
| 45 to 54 Years | 0 (0.0%) | 38 (4.6%) |
| 55 to 64 Years | 68 (6.6%) | 126 (15.7%) |
| 65 to 74 Years | 32 (6.9%) | 26 (3.7%) |
| 75 Years and over | 107 (47.3%) | 73 (23.4%) |
| Total | 519 (8.6%) | 802 (12.5%) |
Income Above Poverty by Sex and Age in Northlake
According to the poverty statistics in Northlake, males aged 5 years and females aged 15 years are the age groups that are most secure financially, with 100.0% of males and 100.0% of females in these age groups living above the poverty line.
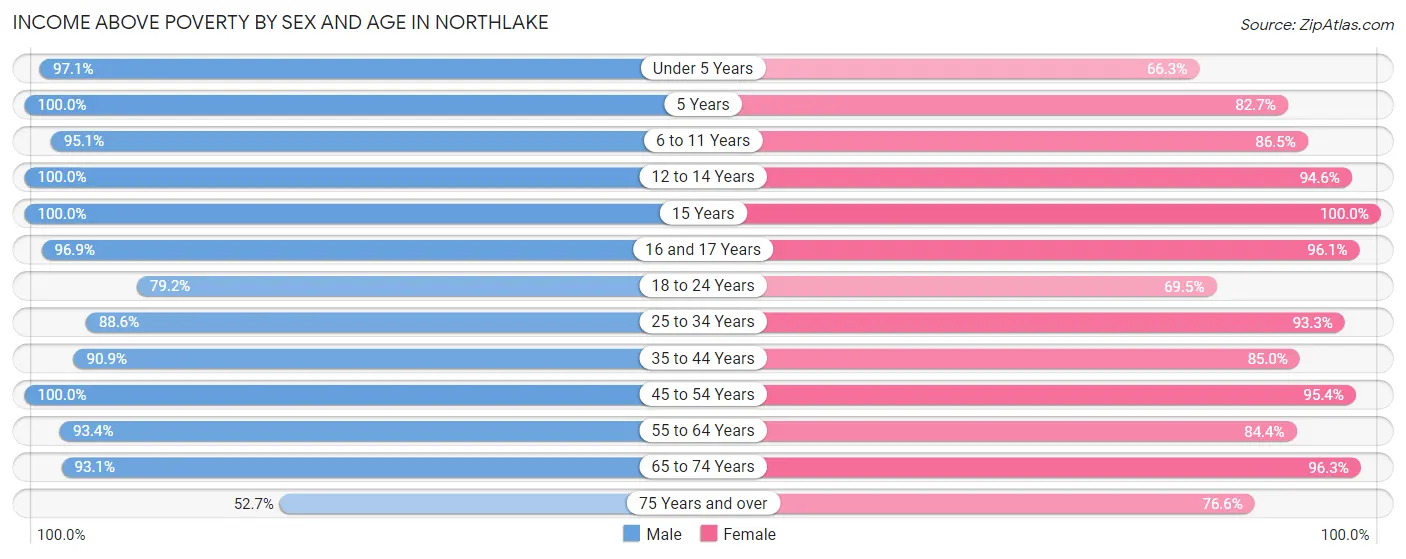
| Age Bracket | Male | Female |
| Under 5 Years | 169 (97.1%) | 122 (66.3%) |
| 5 Years | 79 (100.0%) | 91 (82.7%) |
| 6 to 11 Years | 701 (95.1%) | 402 (86.5%) |
| 12 to 14 Years | 246 (100.0%) | 300 (94.6%) |
| 15 Years | 88 (100.0%) | 218 (100.0%) |
| 16 and 17 Years | 123 (96.9%) | 122 (96.1%) |
| 18 to 24 Years | 372 (79.1%) | 392 (69.5%) |
| 25 to 34 Years | 685 (88.6%) | 743 (93.3%) |
| 35 to 44 Years | 808 (90.9%) | 838 (85.0%) |
| 45 to 54 Years | 716 (100.0%) | 783 (95.4%) |
| 55 to 64 Years | 964 (93.4%) | 679 (84.4%) |
| 65 to 74 Years | 434 (93.1%) | 671 (96.3%) |
| 75 Years and over | 119 (52.6%) | 239 (76.6%) |
| Total | 5,504 (91.4%) | 5,600 (87.5%) |
Income Below Poverty Among Married-Couple Families in Northlake
The poverty statistics for married-couple families in Northlake show that 5.7% or 106 of the total 1,848 families live below the poverty line. Families with no children have the highest poverty rate of 7.4%, comprising of 83 families. On the other hand, families with 3 or 4 children have the lowest poverty rate of 2.5%, which includes 5 families.
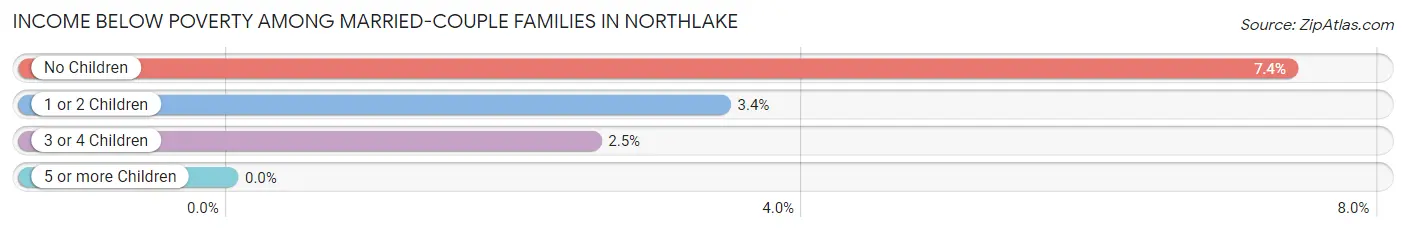
| Children | Above Poverty | Below Poverty |
| No Children | 1,042 (92.6%) | 83 (7.4%) |
| 1 or 2 Children | 507 (96.6%) | 18 (3.4%) |
| 3 or 4 Children | 193 (97.5%) | 5 (2.5%) |
| 5 or more Children | 0 (0.0%) | 0 (0.0%) |
| Total | 1,742 (94.3%) | 106 (5.7%) |
Income Below Poverty Among Single-Parent Households in Northlake
According to the poverty data in Northlake, 11.1% or 48 single-father households and 17.8% or 152 single-mother households are living below the poverty line. Among single-father households, those with 3 or 4 children have the highest poverty rate, with 25 households (19.8%) experiencing poverty. Likewise, among single-mother households, those with 1 or 2 children have the highest poverty rate, with 57 households (25.0%) falling below the poverty line.
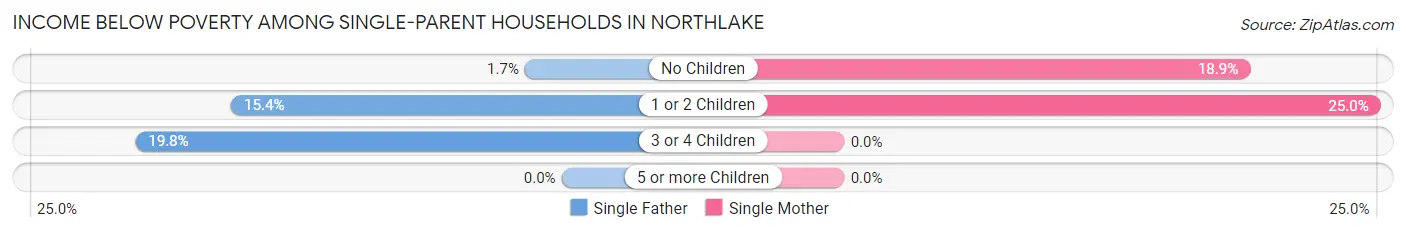
| Children | Single Father | Single Mother |
| No Children | 3 (1.7%) | 95 (18.9%) |
| 1 or 2 Children | 20 (15.4%) | 57 (25.0%) |
| 3 or 4 Children | 25 (19.8%) | 0 (0.0%) |
| 5 or more Children | 0 (0.0%) | 0 (0.0%) |
| Total | 48 (11.1%) | 152 (17.8%) |
Income Below Poverty Among Married-Couple vs Single-Parent Households in Northlake
The poverty data for Northlake shows that 106 of the married-couple family households (5.7%) and 200 of the single-parent households (15.5%) are living below the poverty level. Within the married-couple family households, those with no children have the highest poverty rate, with 83 households (7.4%) falling below the poverty line. Among the single-parent households, those with 1 or 2 children have the highest poverty rate, with 77 household (21.5%) living below poverty.
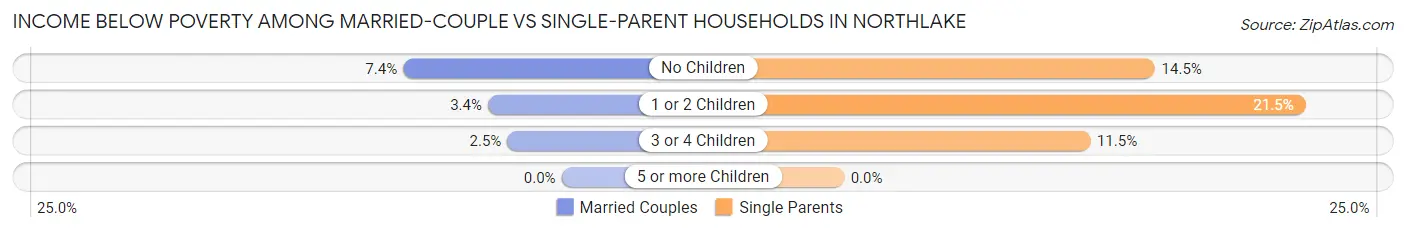
| Children | Married-Couple Families | Single-Parent Households |
| No Children | 83 (7.4%) | 98 (14.5%) |
| 1 or 2 Children | 18 (3.4%) | 77 (21.5%) |
| 3 or 4 Children | 5 (2.5%) | 25 (11.5%) |
| 5 or more Children | 0 (0.0%) | 0 (0.0%) |
| Total | 106 (5.7%) | 200 (15.5%) |
Race in Northlake
The most populous races in Northlake are Hispanic or Latino (7,712 | 60.8%), White / Caucasian (5,570 | 43.9%), and Some other Race (3,687 | 29.1%).
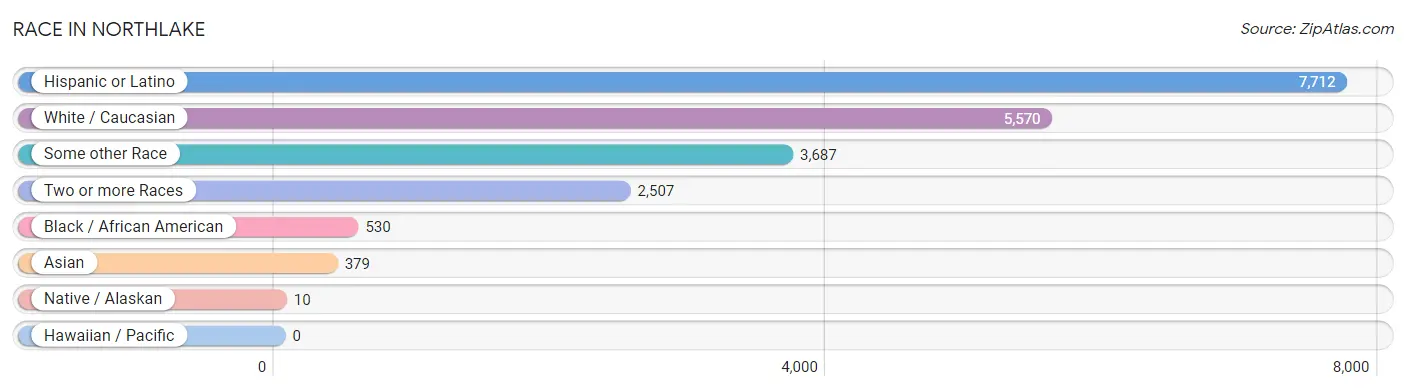
| Race | # Population | % Population |
| Asian | 379 | 3.0% |
| Black / African American | 530 | 4.2% |
| Hawaiian / Pacific | 0 | 0.0% |
| Hispanic or Latino | 7,712 | 60.8% |
| Native / Alaskan | 10 | 0.1% |
| White / Caucasian | 5,570 | 43.9% |
| Two or more Races | 2,507 | 19.8% |
| Some other Race | 3,687 | 29.1% |
| Total | 12,683 | 100.0% |
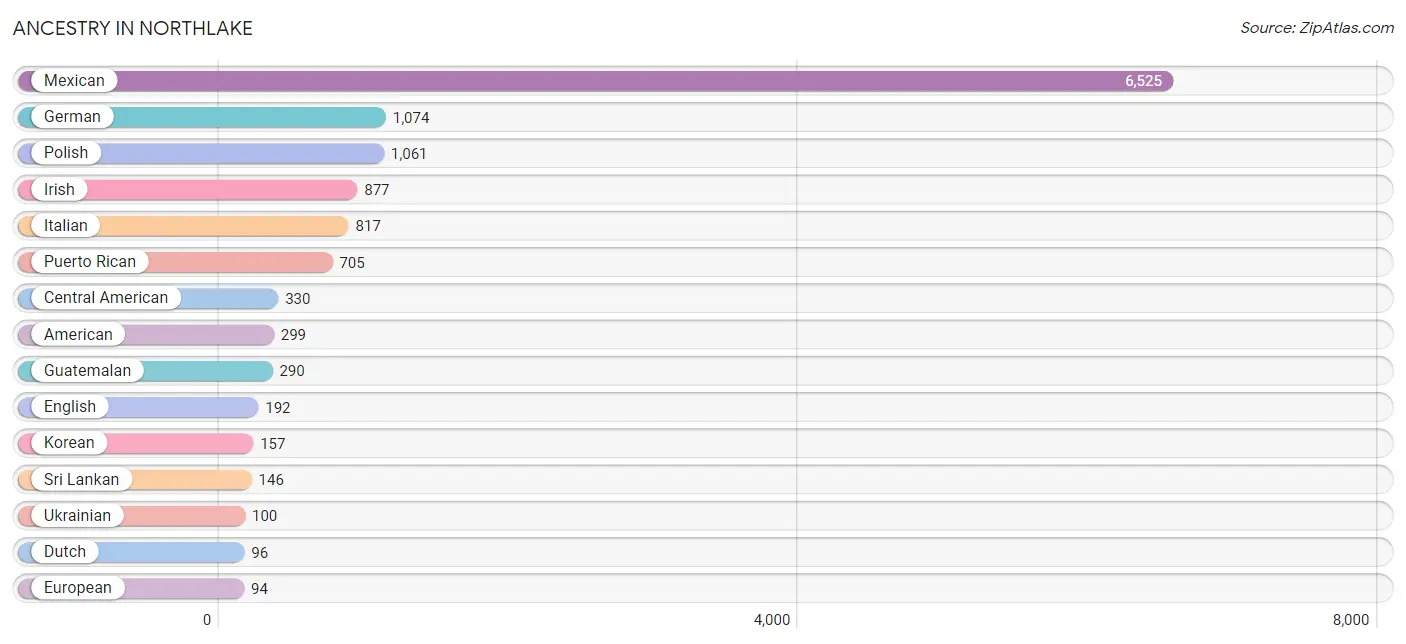
Ancestry in Northlake
The most populous ancestries reported in Northlake are Mexican (6,525 | 51.4%), German (1,074 | 8.5%), Polish (1,061 | 8.4%), Irish (877 | 6.9%), and Italian (817 | 6.4%), together accounting for 81.6% of all Northlake residents.
| Ancestry | # Population | % Population |
| African | 53 | 0.4% |
| American | 299 | 2.4% |
| Arab | 64 | 0.5% |
| Australian | 11 | 0.1% |
| Austrian | 31 | 0.2% |
| Bhutanese | 21 | 0.2% |
| Blackfeet | 6 | 0.1% |
| Burmese | 12 | 0.1% |
| Canadian | 9 | 0.1% |
| Central American | 330 | 2.6% |
| Central American Indian | 22 | 0.2% |
| Cherokee | 34 | 0.3% |
| Croatian | 38 | 0.3% |
| Cuban | 41 | 0.3% |
| Czech | 10 | 0.1% |
| Dutch | 96 | 0.8% |
| Eastern European | 51 | 0.4% |
| Ecuadorian | 11 | 0.1% |
| English | 192 | 1.5% |
| European | 94 | 0.7% |
| Finnish | 14 | 0.1% |
| French | 54 | 0.4% |
| French Canadian | 40 | 0.3% |
| German | 1,074 | 8.5% |
| Greek | 4 | 0.0% |
| Guatemalan | 290 | 2.3% |
| Hungarian | 28 | 0.2% |
| Indian (Asian) | 22 | 0.2% |
| Irish | 877 | 6.9% |
| Italian | 817 | 6.4% |
| Korean | 157 | 1.2% |
| Lithuanian | 8 | 0.1% |
| Mexican | 6,525 | 51.4% |
| Mexican American Indian | 28 | 0.2% |
| Moroccan | 17 | 0.1% |
| Nicaraguan | 19 | 0.2% |
| Norwegian | 20 | 0.2% |
| Pakistani | 33 | 0.3% |
| Peruvian | 27 | 0.2% |
| Polish | 1,061 | 8.4% |
| Puerto Rican | 705 | 5.6% |
| Russian | 6 | 0.1% |
| Salvadoran | 21 | 0.2% |
| Scandinavian | 5 | 0.0% |
| Scotch-Irish | 31 | 0.2% |
| Scottish | 50 | 0.4% |
| Slovak | 11 | 0.1% |
| South American | 51 | 0.4% |
| Spaniard | 11 | 0.1% |
| Spanish | 11 | 0.1% |
| Sri Lankan | 146 | 1.1% |
| Subsaharan African | 53 | 0.4% |
| Swedish | 47 | 0.4% |
| Ukrainian | 100 | 0.8% |
| Welsh | 5 | 0.0% | View All 55 Rows |
Immigrants in Northlake
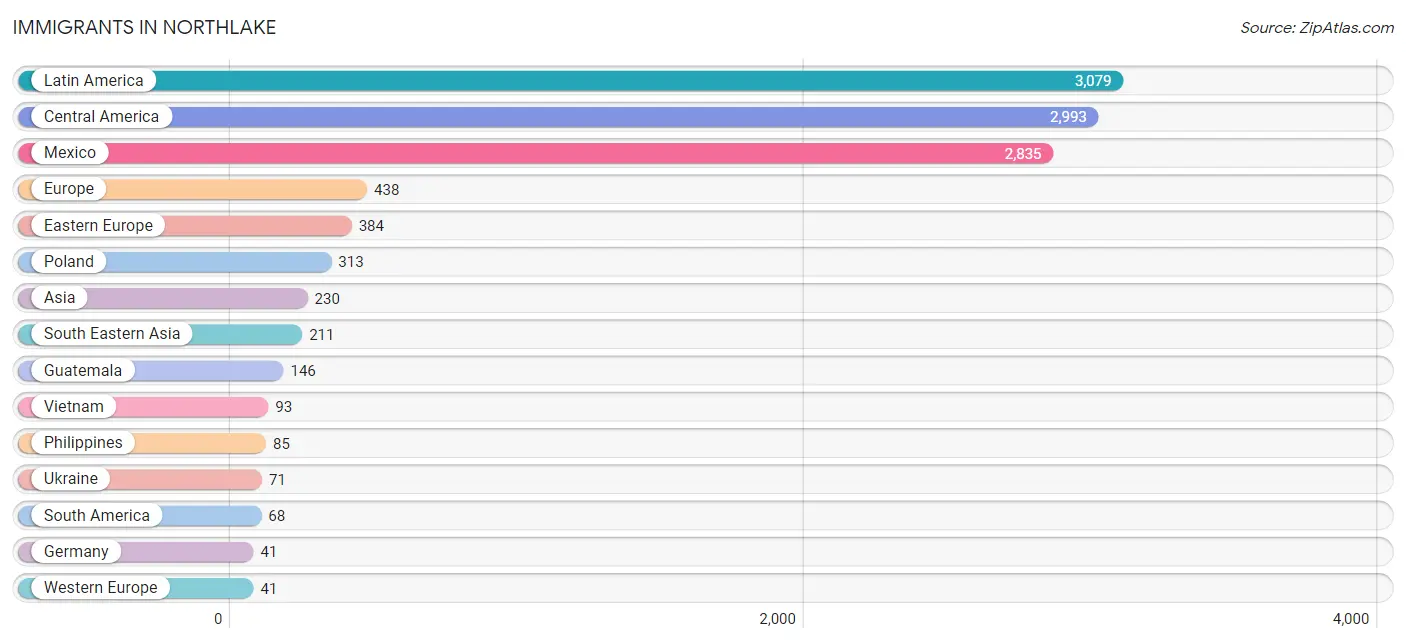
The most numerous immigrant groups reported in Northlake came from Latin America (3,079 | 24.3%), Central America (2,993 | 23.6%), Mexico (2,835 | 22.4%), Europe (438 | 3.5%), and Eastern Europe (384 | 3.0%), together accounting for 76.7% of all Northlake residents.
| Immigration Origin | # Population | % Population |
| Asia | 230 | 1.8% |
| Brazil | 21 | 0.2% |
| Canada | 17 | 0.1% |
| Caribbean | 18 | 0.1% |
| Central America | 2,993 | 23.6% |
| China | 19 | 0.2% |
| Cuba | 18 | 0.1% |
| Eastern Asia | 19 | 0.2% |
| Eastern Europe | 384 | 3.0% |
| Ecuador | 39 | 0.3% |
| El Salvador | 12 | 0.1% |
| Europe | 438 | 3.5% |
| Germany | 41 | 0.3% |
| Guatemala | 146 | 1.1% |
| Italy | 13 | 0.1% |
| Latin America | 3,079 | 24.3% |
| Mexico | 2,835 | 22.4% |
| Peru | 8 | 0.1% |
| Philippines | 85 | 0.7% |
| Poland | 313 | 2.5% |
| South America | 68 | 0.5% |
| South Eastern Asia | 211 | 1.7% |
| Southern Europe | 13 | 0.1% |
| Thailand | 33 | 0.3% |
| Ukraine | 71 | 0.6% |
| Vietnam | 93 | 0.7% |
| Western Europe | 41 | 0.3% | View All 27 Rows |
Sex and Age in Northlake
Sex and Age in Northlake
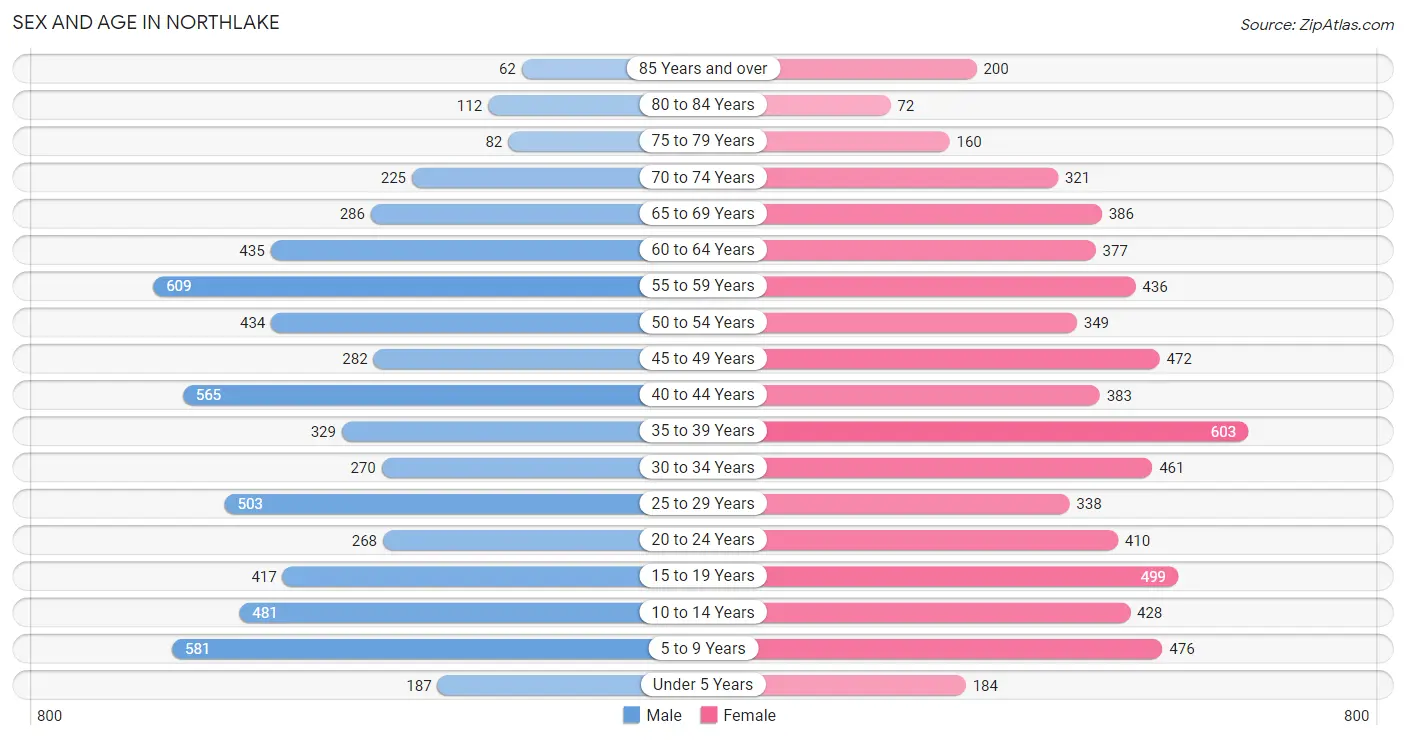
The most populous age groups in Northlake are 55 to 59 Years (609 | 9.9%) for men and 35 to 39 Years (603 | 9.2%) for women.
| Age Bracket | Male | Female |
| Under 5 Years | 187 (3.0%) | 184 (2.8%) |
| 5 to 9 Years | 581 (9.5%) | 476 (7.3%) |
| 10 to 14 Years | 481 (7.9%) | 428 (6.5%) |
| 15 to 19 Years | 417 (6.8%) | 499 (7.6%) |
| 20 to 24 Years | 268 (4.4%) | 410 (6.2%) |
| 25 to 29 Years | 503 (8.2%) | 338 (5.2%) |
| 30 to 34 Years | 270 (4.4%) | 461 (7.0%) |
| 35 to 39 Years | 329 (5.4%) | 603 (9.2%) |
| 40 to 44 Years | 565 (9.2%) | 383 (5.8%) |
| 45 to 49 Years | 282 (4.6%) | 472 (7.2%) |
| 50 to 54 Years | 434 (7.1%) | 349 (5.3%) |
| 55 to 59 Years | 609 (9.9%) | 436 (6.7%) |
| 60 to 64 Years | 435 (7.1%) | 377 (5.8%) |
| 65 to 69 Years | 286 (4.7%) | 386 (5.9%) |
| 70 to 74 Years | 225 (3.7%) | 321 (4.9%) |
| 75 to 79 Years | 82 (1.3%) | 160 (2.4%) |
| 80 to 84 Years | 112 (1.8%) | 72 (1.1%) |
| 85 Years and over | 62 (1.0%) | 200 (3.0%) |
| Total | 6,128 (100.0%) | 6,555 (100.0%) |
Families and Households in Northlake
Median Family Size in Northlake
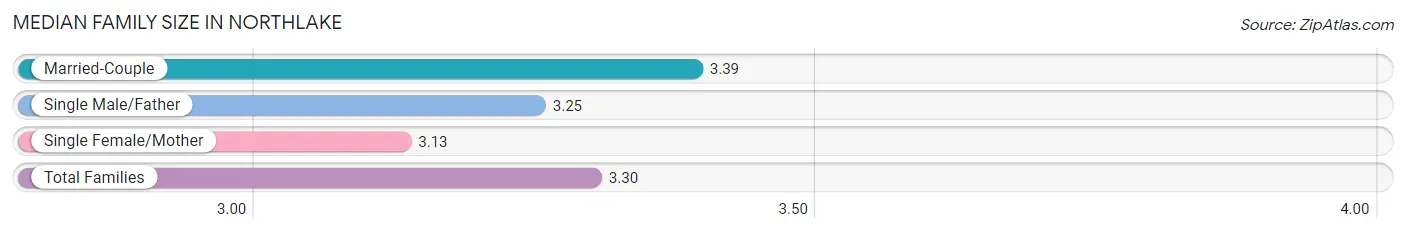
The median family size in Northlake is 3.30 persons per family, with married-couple families (1,848 | 59.0%) accounting for the largest median family size of 3.39 persons per family. On the other hand, single female/mother families (855 | 27.3%) represent the smallest median family size with 3.13 persons per family.
| Family Type | # Families | Family Size |
| Married-Couple | 1,848 (59.0%) | 3.39 |
| Single Male/Father | 431 (13.8%) | 3.25 |
| Single Female/Mother | 855 (27.3%) | 3.13 |
| Total Families | 3,134 (100.0%) | 3.30 |
Median Household Size in Northlake
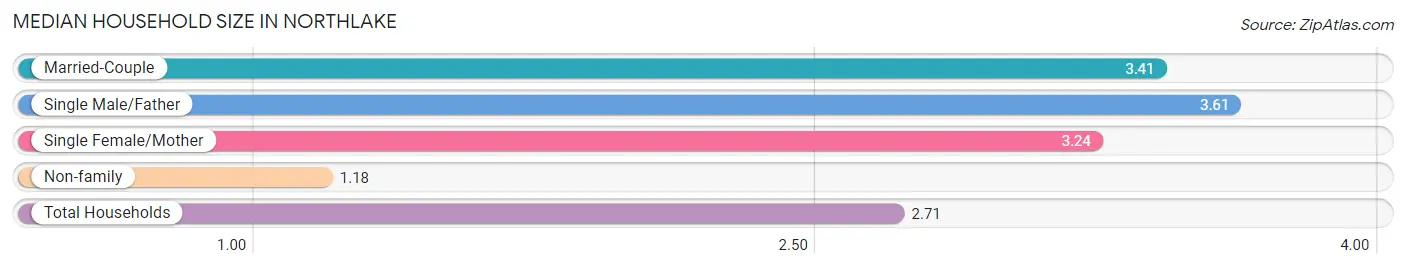
The median household size in Northlake is 2.71 persons per household, with single male/father households (431 | 9.5%) accounting for the largest median household size of 3.61 persons per household. non-family households (1,405 | 30.9%) represent the smallest median household size with 1.18 persons per household.
| Household Type | # Households | Household Size |
| Married-Couple | 1,848 (40.7%) | 3.41 |
| Single Male/Father | 431 (9.5%) | 3.61 |
| Single Female/Mother | 855 (18.8%) | 3.24 |
| Non-family | 1,405 (30.9%) | 1.18 |
| Total Households | 4,539 (100.0%) | 2.71 |
Household Size by Marriage Status in Northlake
Out of a total of 4,539 households in Northlake, 3,134 (69.1%) are family households, while 1,405 (30.9%) are nonfamily households. The most numerous type of family households are 2-person households, comprising 1,202, and the most common type of nonfamily households are 1-person households, comprising 1,144.
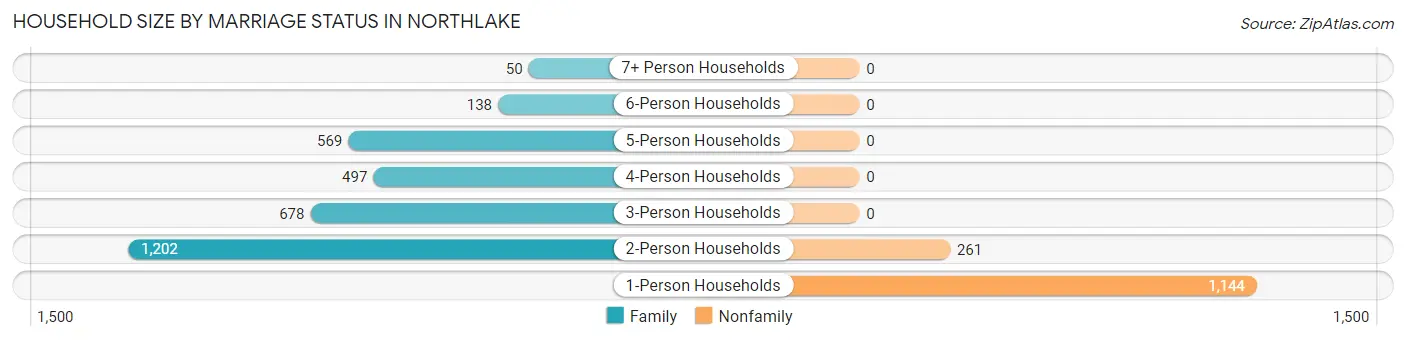
| Household Size | Family Households | Nonfamily Households |
| 1-Person Households | - | 1,144 (25.2%) |
| 2-Person Households | 1,202 (26.5%) | 261 (5.8%) |
| 3-Person Households | 678 (14.9%) | 0 (0.0%) |
| 4-Person Households | 497 (11.0%) | 0 (0.0%) |
| 5-Person Households | 569 (12.5%) | 0 (0.0%) |
| 6-Person Households | 138 (3.0%) | 0 (0.0%) |
| 7+ Person Households | 50 (1.1%) | 0 (0.0%) |
| Total | 3,134 (69.1%) | 1,405 (30.9%) |
Female Fertility in Northlake
Fertility by Age in Northlake
Average fertility rate in Northlake is 11.0 births per 1,000 women. Women in the age bracket of 35 to 50 years have the highest fertility rate with 24.0 births per 1,000 women. Women in the age bracket of 35 to 50 years acount for 100.0% of all women with births.
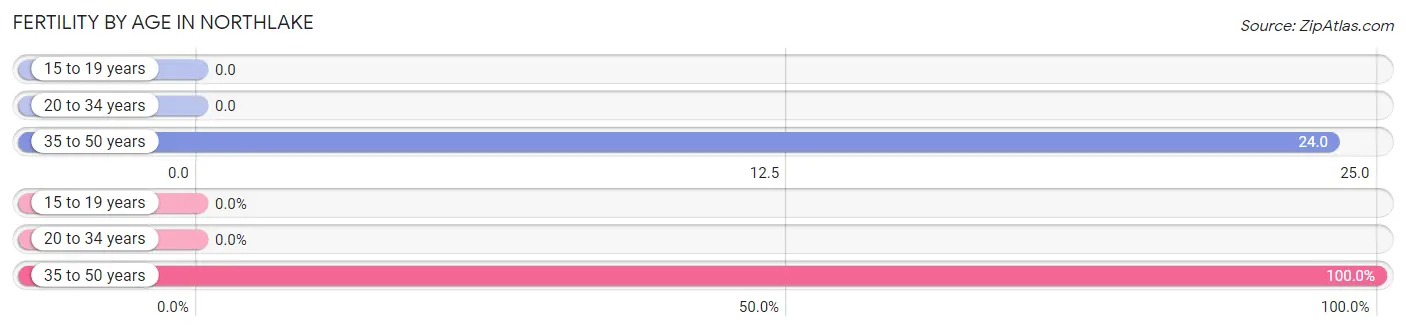
| Age Bracket | Women with Births | Births / 1,000 Women |
| 15 to 19 years | 0 (0.0%) | 0.0 |
| 20 to 34 years | 0 (0.0%) | 0.0 |
| 35 to 50 years | 37 (100.0%) | 24.0 |
| Total | 37 (100.0%) | 11.0 |
Fertility by Age by Marriage Status in Northlake
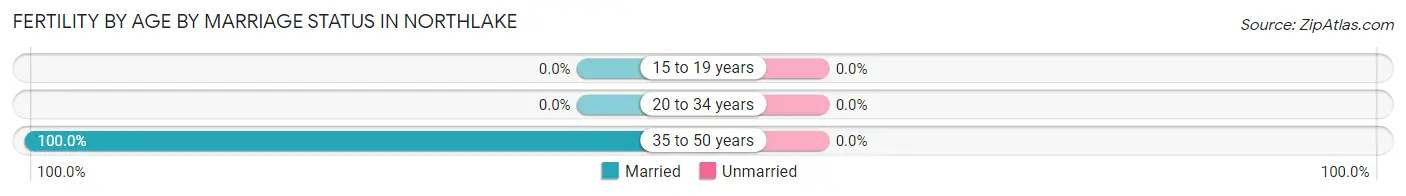
| Age Bracket | Married | Unmarried |
| 15 to 19 years | 0 (0.0%) | 0 (0.0%) |
| 20 to 34 years | 0 (0.0%) | 0 (0.0%) |
| 35 to 50 years | 37 (100.0%) | 0 (0.0%) |
| Total | 37 (100.0%) | 0 (0.0%) |
Fertility by Education in Northlake
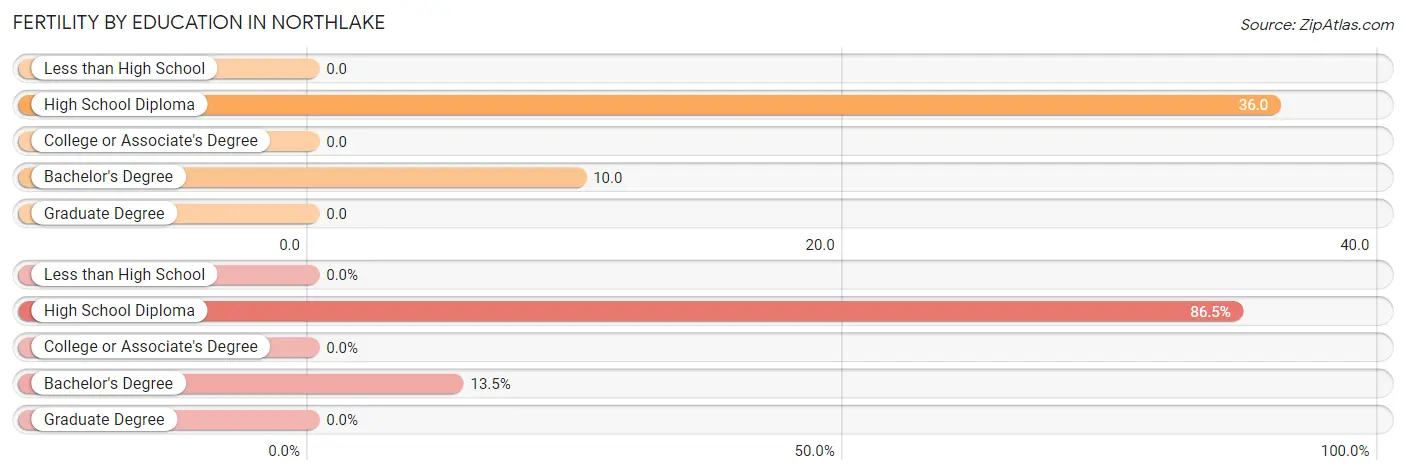
| Educational Attainment | Women with Births | Births / 1,000 Women |
| Less than High School | 0 (0.0%) | 0.0 |
| High School Diploma | 32 (86.5%) | 36.0 |
| College or Associate's Degree | 0 (0.0%) | 0.0 |
| Bachelor's Degree | 5 (13.5%) | 10.0 |
| Graduate Degree | 0 (0.0%) | 0.0 |
| Total | 37 (100.0%) | 11.0 |
Fertility by Education by Marriage Status in Northlake
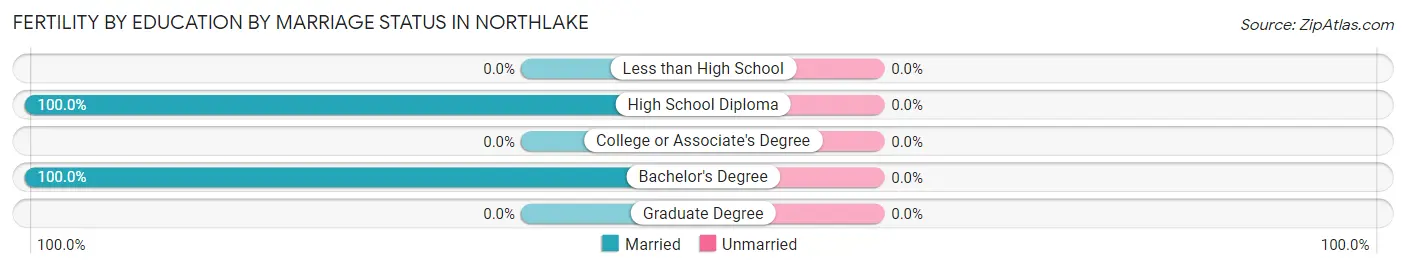
| Educational Attainment | Married | Unmarried |
| Less than High School | 0 (0.0%) | 0 (0.0%) |
| High School Diploma | 32 (100.0%) | 0 (0.0%) |
| College or Associate's Degree | 0 (0.0%) | 0 (0.0%) |
| Bachelor's Degree | 5 (100.0%) | 0 (0.0%) |
| Graduate Degree | 0 (0.0%) | 0 (0.0%) |
| Total | 37 (100.0%) | 0 (0.0%) |
Employment Characteristics in Northlake
Employment by Class of Employer in Northlake
Among the 5,920 employed individuals in Northlake, private company employees (4,680 | 79.0%), self-employed (not incorporated) (411 | 6.9%), and not-for-profit organizations (407 | 6.9%) make up the most common classes of employment.
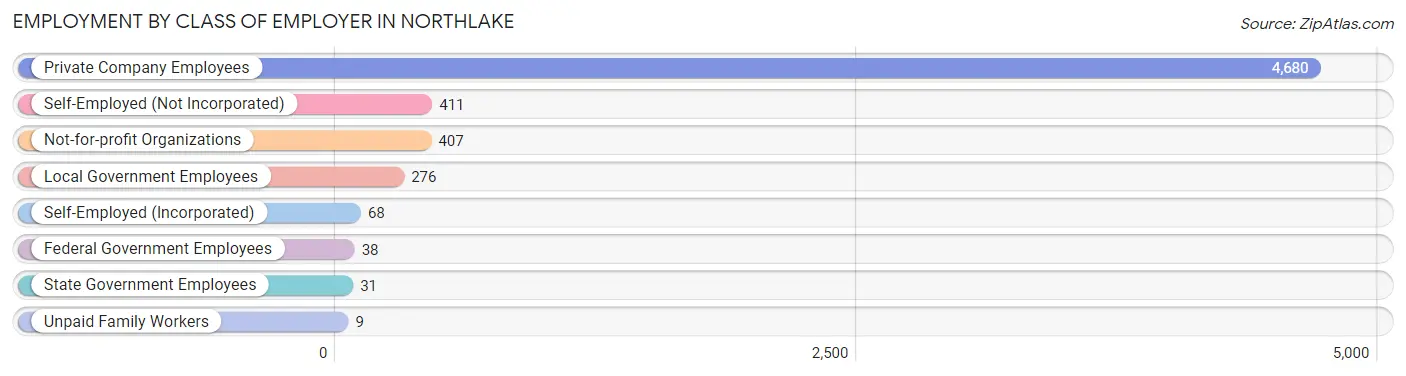
| Employer Class | # Employees | % Employees |
| Private Company Employees | 4,680 | 79.0% |
| Self-Employed (Incorporated) | 68 | 1.1% |
| Self-Employed (Not Incorporated) | 411 | 6.9% |
| Not-for-profit Organizations | 407 | 6.9% |
| Local Government Employees | 276 | 4.7% |
| State Government Employees | 31 | 0.5% |
| Federal Government Employees | 38 | 0.6% |
| Unpaid Family Workers | 9 | 0.2% |
| Total | 5,920 | 100.0% |
Employment Status by Age in Northlake
According to the labor force statistics for Northlake, out of the total population over 16 years of age (10,040), 62.6% or 6,285 individuals are in the labor force, with 4.8% or 302 of them unemployed. The age group with the highest labor force participation rate is 30 to 34 years, with 89.1% or 651 individuals in the labor force. Within the labor force, the 16 to 19 years age range has the highest percentage of unemployed individuals, with 10.7% or 20 of them being unemployed.
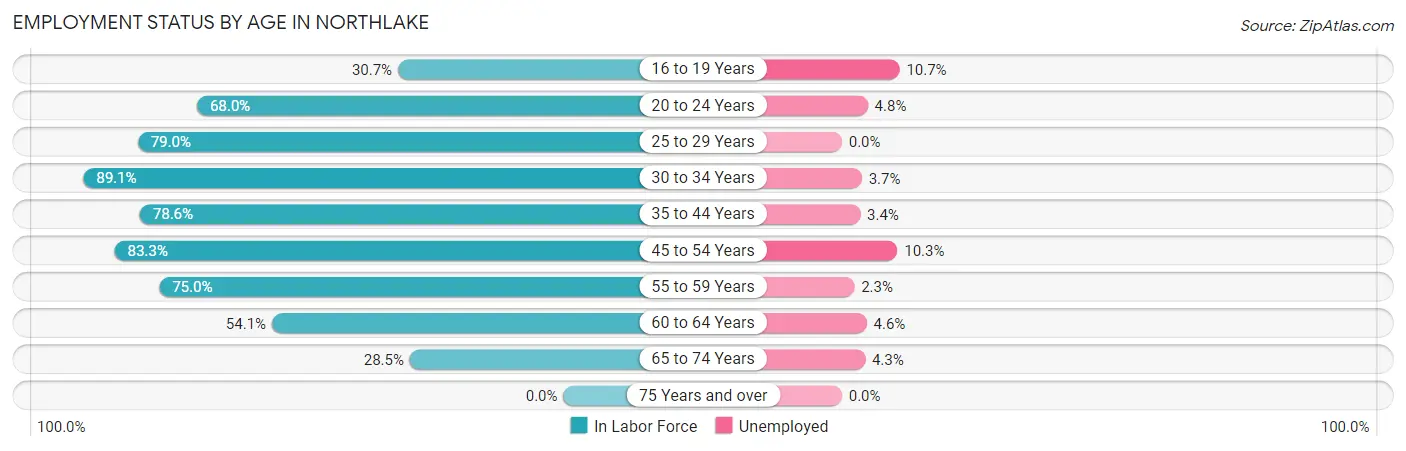
| Age Bracket | In Labor Force | Unemployed |
| 16 to 19 Years | 187 (30.7%) | 20 (10.7%) |
| 20 to 24 Years | 461 (68.0%) | 22 (4.8%) |
| 25 to 29 Years | 664 (79.0%) | 0 (0.0%) |
| 30 to 34 Years | 651 (89.1%) | 24 (3.7%) |
| 35 to 44 Years | 1,478 (78.6%) | 50 (3.4%) |
| 45 to 54 Years | 1,280 (83.3%) | 132 (10.3%) |
| 55 to 59 Years | 784 (75.0%) | 18 (2.3%) |
| 60 to 64 Years | 439 (54.1%) | 20 (4.6%) |
| 65 to 74 Years | 347 (28.5%) | 15 (4.3%) |
| 75 Years and over | 0 (0.0%) | 0 (0.0%) |
| Total | 6,285 (62.6%) | 302 (4.8%) |
Employment Status by Educational Attainment in Northlake
According to labor force statistics for Northlake, 77.3% of individuals (5,292) out of the total population between 25 and 64 years of age (6,846) are in the labor force, with 4.6% or 243 of them being unemployed. The group with the highest labor force participation rate are those with the educational attainment of bachelor's degree or higher, with 81.5% or 838 individuals in the labor force. Within the labor force, individuals with college / associate degree education have the highest percentage of unemployment, with 6.0% or 88 of them being unemployed.
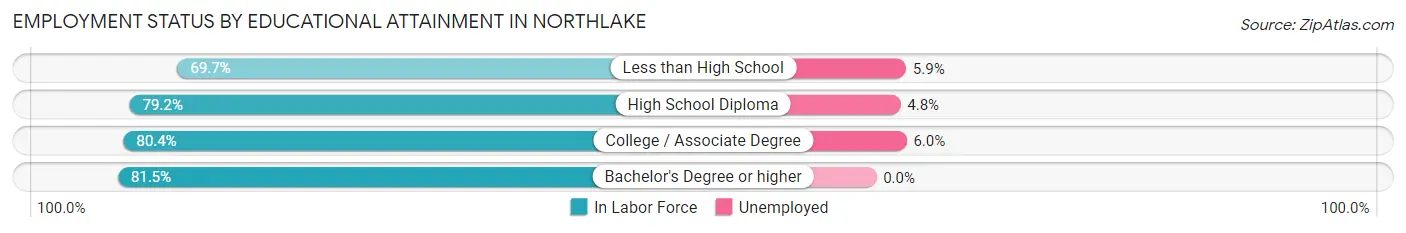
| Educational Attainment | In Labor Force | Unemployed |
| Less than High School | 1,276 (69.7%) | 108 (5.9%) |
| High School Diploma | 1,708 (79.2%) | 103 (4.8%) |
| College / Associate Degree | 1,473 (80.4%) | 110 (6.0%) |
| Bachelor's Degree or higher | 838 (81.5%) | 0 (0.0%) |
| Total | 5,292 (77.3%) | 315 (4.6%) |
Employment Occupations by Sex in Northlake
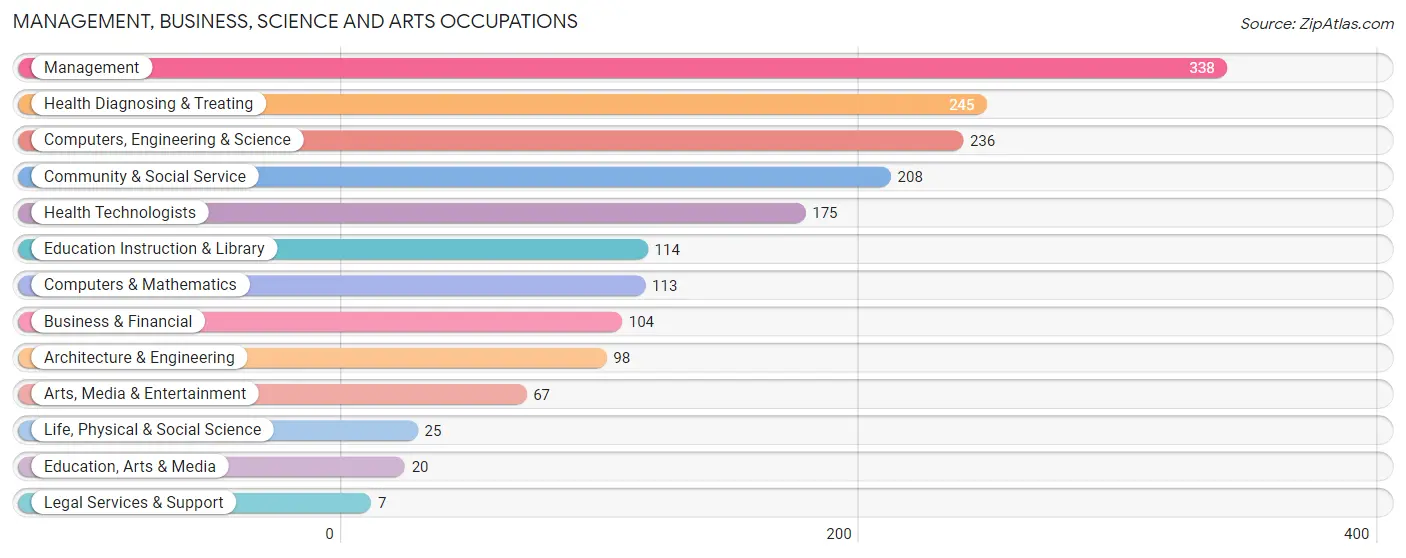
Management, Business, Science and Arts Occupations
The most common Management, Business, Science and Arts occupations in Northlake are Management (338 | 5.7%), Health Diagnosing & Treating (245 | 4.1%), Computers, Engineering & Science (236 | 3.9%), Community & Social Service (208 | 3.5%), and Health Technologists (175 | 2.9%).
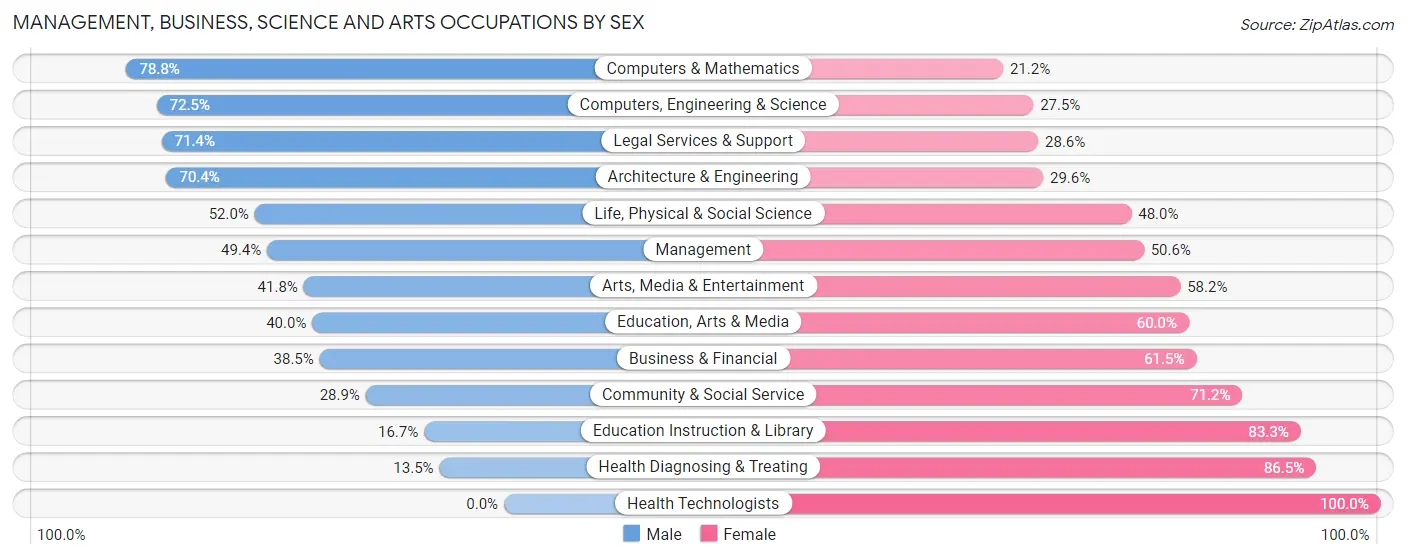
Management, Business, Science and Arts Occupations by Sex
Within the Management, Business, Science and Arts occupations in Northlake, the most male-oriented occupations are Computers & Mathematics (78.8%), Computers, Engineering & Science (72.5%), and Legal Services & Support (71.4%), while the most female-oriented occupations are Health Technologists (100.0%), Health Diagnosing & Treating (86.5%), and Education Instruction & Library (83.3%).
| Occupation | Male | Female |
| Management | 167 (49.4%) | 171 (50.6%) |
| Business & Financial | 40 (38.5%) | 64 (61.5%) |
| Computers, Engineering & Science | 171 (72.5%) | 65 (27.5%) |
| Computers & Mathematics | 89 (78.8%) | 24 (21.2%) |
| Architecture & Engineering | 69 (70.4%) | 29 (29.6%) |
| Life, Physical & Social Science | 13 (52.0%) | 12 (48.0%) |
| Community & Social Service | 60 (28.8%) | 148 (71.2%) |
| Education, Arts & Media | 8 (40.0%) | 12 (60.0%) |
| Legal Services & Support | 5 (71.4%) | 2 (28.6%) |
| Education Instruction & Library | 19 (16.7%) | 95 (83.3%) |
| Arts, Media & Entertainment | 28 (41.8%) | 39 (58.2%) |
| Health Diagnosing & Treating | 33 (13.5%) | 212 (86.5%) |
| Health Technologists | 0 (0.0%) | 175 (100.0%) |
| Total (Category) | 471 (41.6%) | 660 (58.4%) |
| Total (Overall) | 3,106 (51.9%) | 2,880 (48.1%) |
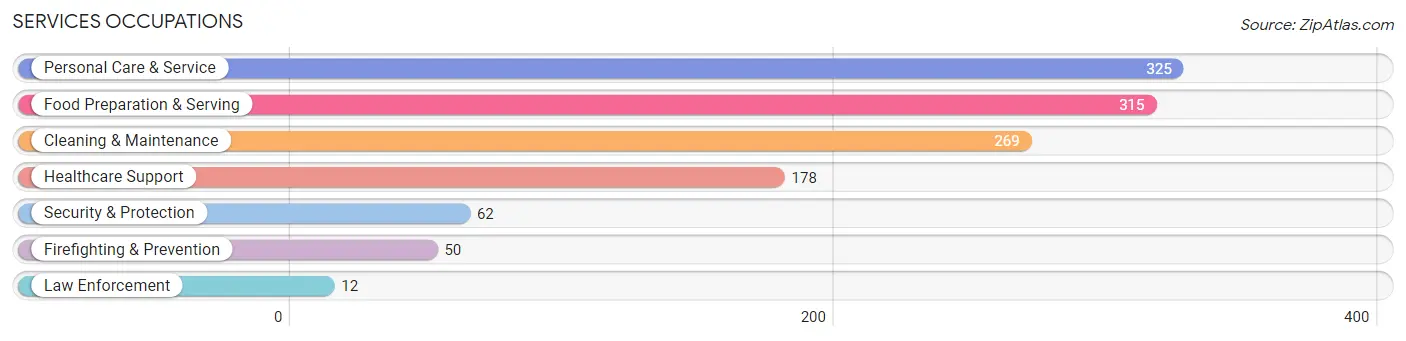
Services Occupations
The most common Services occupations in Northlake are Personal Care & Service (325 | 5.4%), Food Preparation & Serving (315 | 5.3%), Cleaning & Maintenance (269 | 4.5%), Healthcare Support (178 | 3.0%), and Security & Protection (62 | 1.0%).
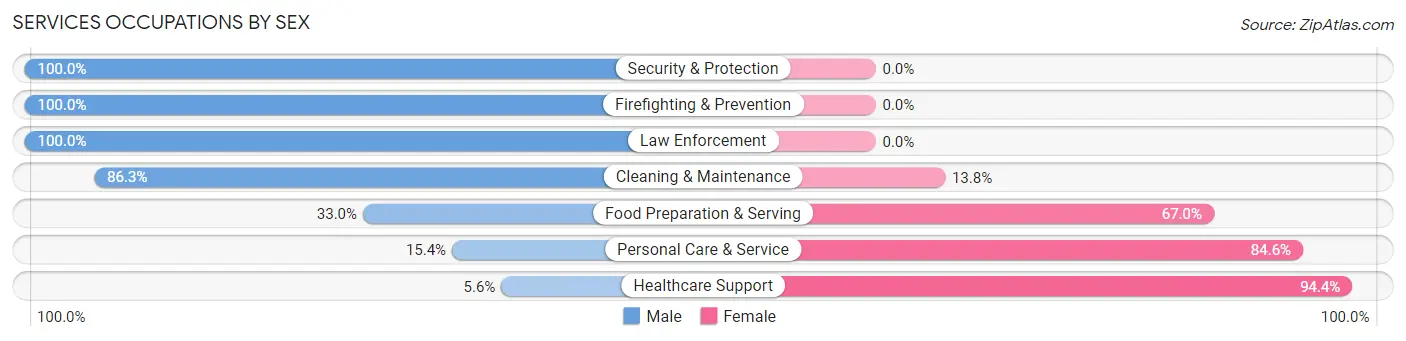
Services Occupations by Sex
Within the Services occupations in Northlake, the most male-oriented occupations are Security & Protection (100.0%), Firefighting & Prevention (100.0%), and Law Enforcement (100.0%), while the most female-oriented occupations are Healthcare Support (94.4%), Personal Care & Service (84.6%), and Food Preparation & Serving (67.0%).
| Occupation | Male | Female |
| Healthcare Support | 10 (5.6%) | 168 (94.4%) |
| Security & Protection | 62 (100.0%) | 0 (0.0%) |
| Firefighting & Prevention | 50 (100.0%) | 0 (0.0%) |
| Law Enforcement | 12 (100.0%) | 0 (0.0%) |
| Food Preparation & Serving | 104 (33.0%) | 211 (67.0%) |
| Cleaning & Maintenance | 232 (86.3%) | 37 (13.8%) |
| Personal Care & Service | 50 (15.4%) | 275 (84.6%) |
| Total (Category) | 458 (39.9%) | 691 (60.1%) |
| Total (Overall) | 3,106 (51.9%) | 2,880 (48.1%) |
Sales and Office Occupations
The most common Sales and Office occupations in Northlake are Office & Administration (881 | 14.7%), and Sales & Related (556 | 9.3%).
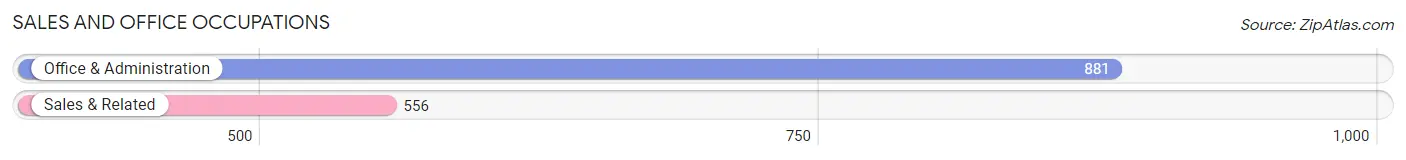
Sales and Office Occupations by Sex
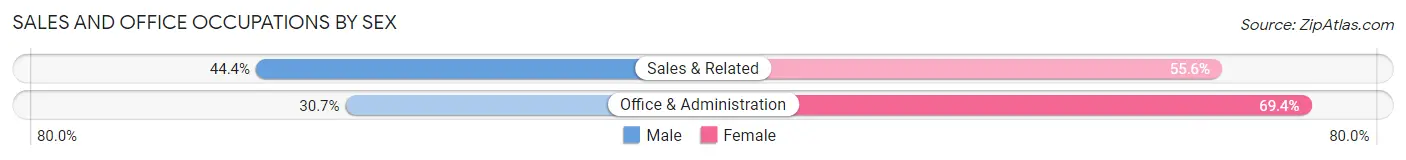
| Occupation | Male | Female |
| Sales & Related | 247 (44.4%) | 309 (55.6%) |
| Office & Administration | 270 (30.6%) | 611 (69.4%) |
| Total (Category) | 517 (36.0%) | 920 (64.0%) |
| Total (Overall) | 3,106 (51.9%) | 2,880 (48.1%) |
Natural Resources, Construction and Maintenance Occupations
The most common Natural Resources, Construction and Maintenance occupations in Northlake are Installation, Maintenance & Repair (240 | 4.0%), and Construction & Extraction (210 | 3.5%).
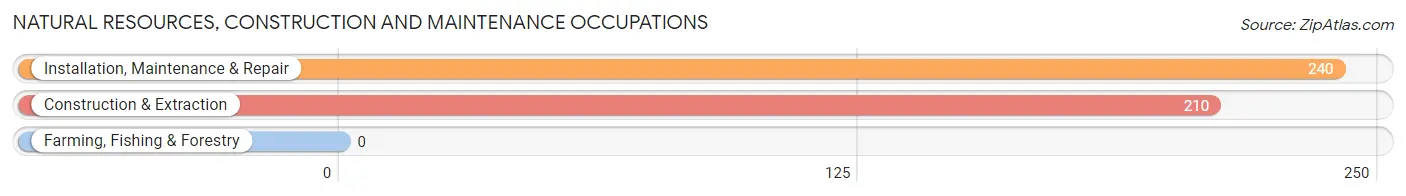
Natural Resources, Construction and Maintenance Occupations by Sex
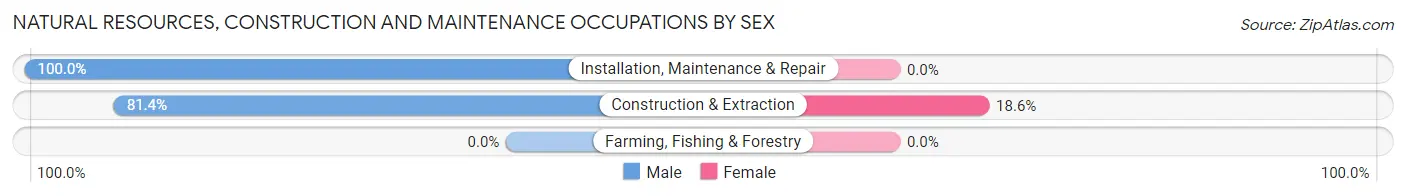
| Occupation | Male | Female |
| Farming, Fishing & Forestry | 0 (0.0%) | 0 (0.0%) |
| Construction & Extraction | 171 (81.4%) | 39 (18.6%) |
| Installation, Maintenance & Repair | 240 (100.0%) | 0 (0.0%) |
| Total (Category) | 411 (91.3%) | 39 (8.7%) |
| Total (Overall) | 3,106 (51.9%) | 2,880 (48.1%) |
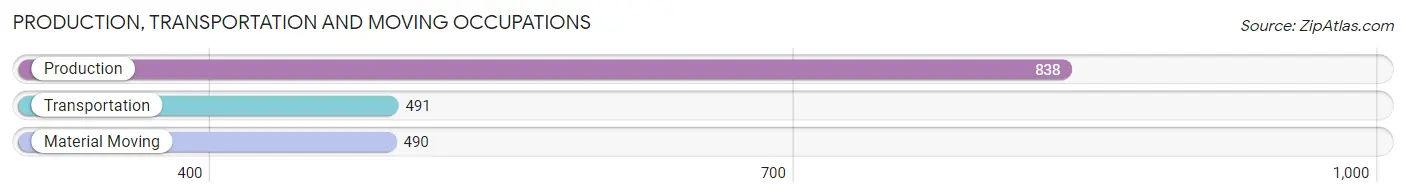
Production, Transportation and Moving Occupations
The most common Production, Transportation and Moving occupations in Northlake are Production (838 | 14.0%), Transportation (491 | 8.2%), and Material Moving (490 | 8.2%).
Production, Transportation and Moving Occupations by Sex
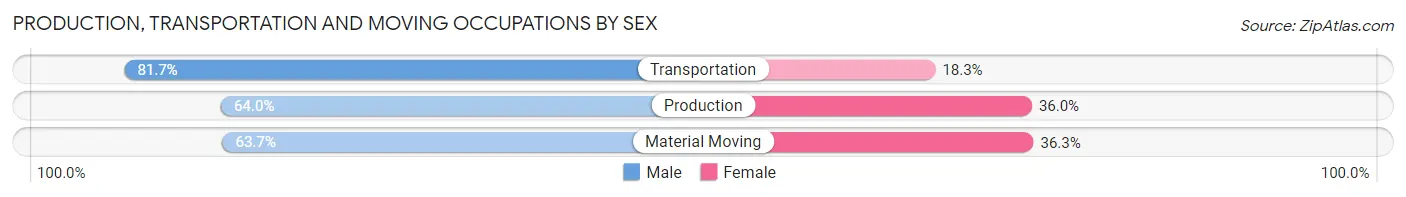
| Occupation | Male | Female |
| Production | 536 (64.0%) | 302 (36.0%) |
| Transportation | 401 (81.7%) | 90 (18.3%) |
| Material Moving | 312 (63.7%) | 178 (36.3%) |
| Total (Category) | 1,249 (68.7%) | 570 (31.3%) |
| Total (Overall) | 3,106 (51.9%) | 2,880 (48.1%) |
Employment Industries by Sex in Northlake
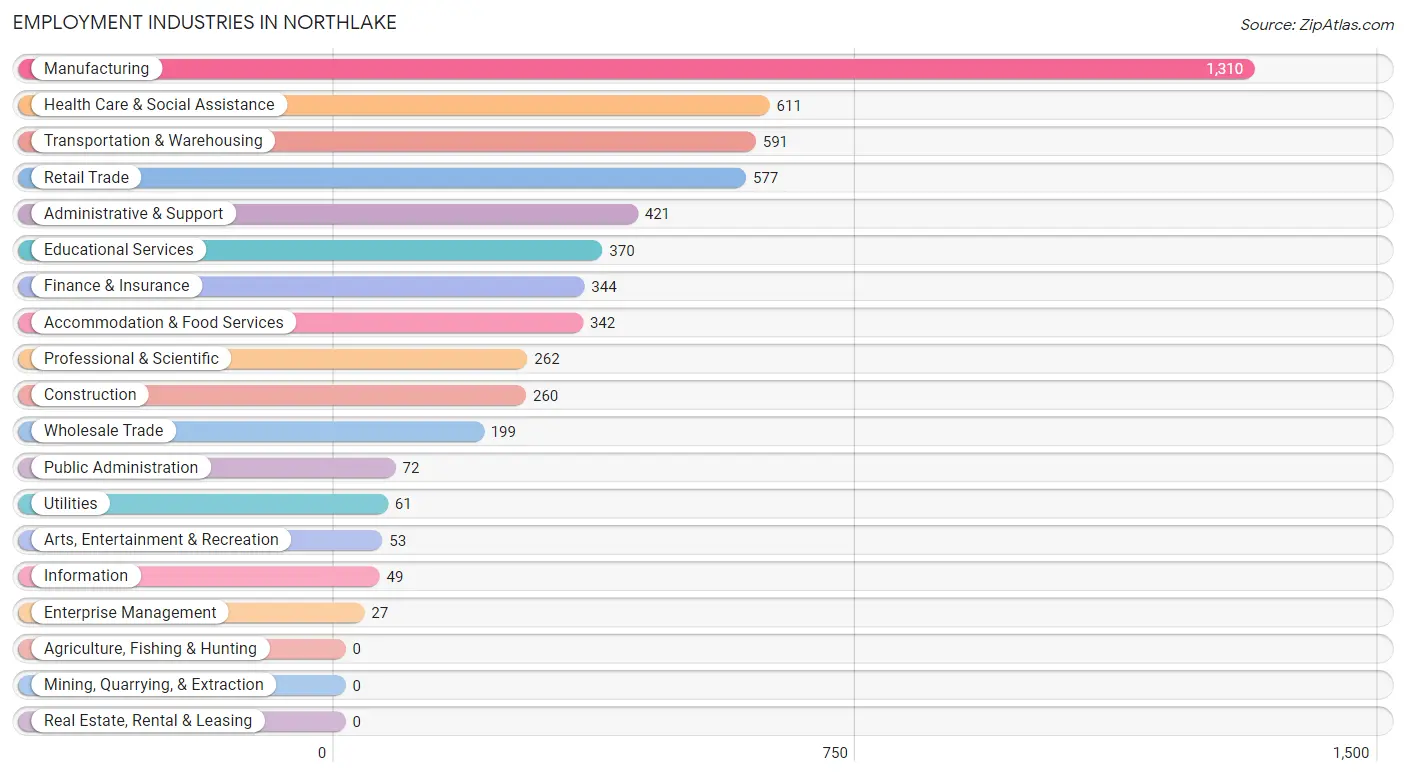
Employment Industries in Northlake
The major employment industries in Northlake include Manufacturing (1,310 | 21.9%), Health Care & Social Assistance (611 | 10.2%), Transportation & Warehousing (591 | 9.9%), Retail Trade (577 | 9.6%), and Administrative & Support (421 | 7.0%).
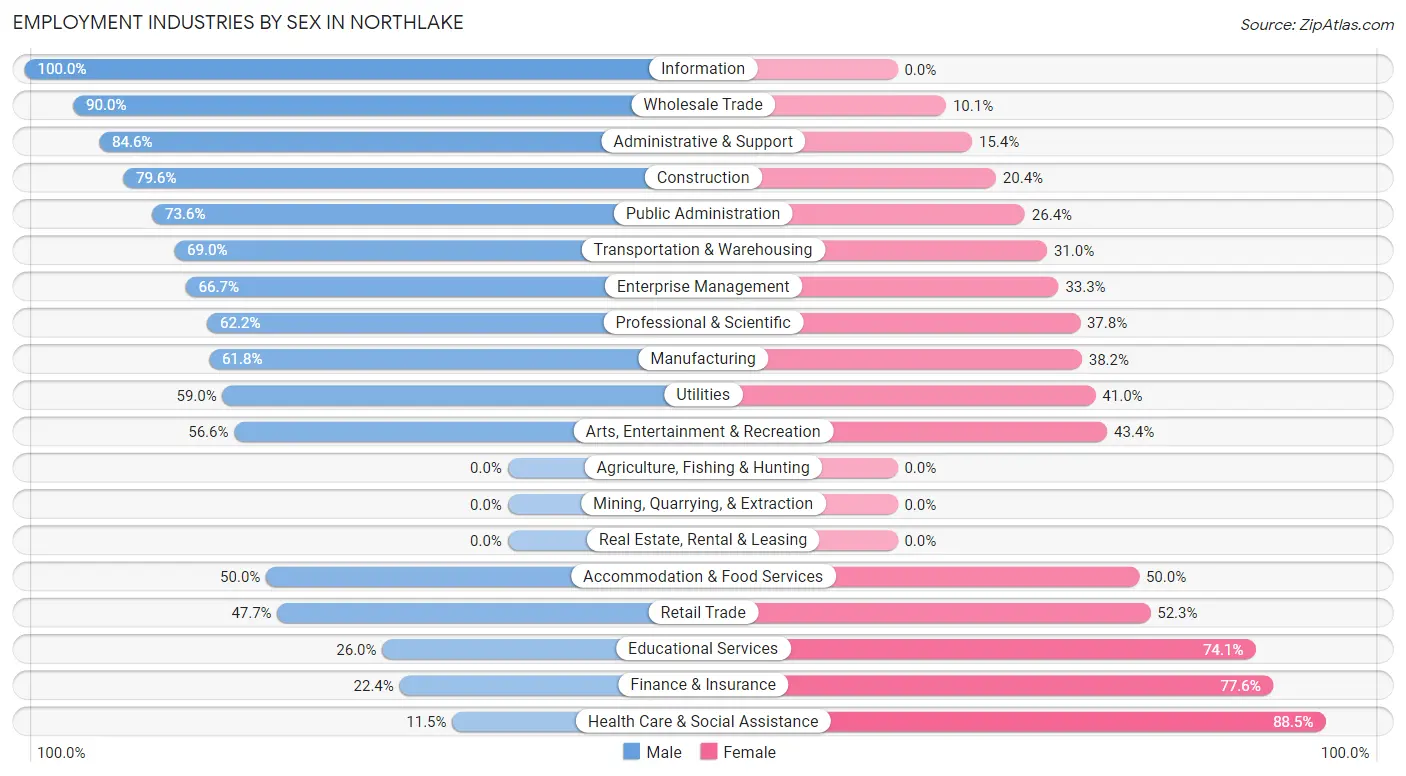
Employment Industries by Sex in Northlake
The Northlake industries that see more men than women are Information (100.0%), Wholesale Trade (89.9%), and Administrative & Support (84.6%), whereas the industries that tend to have a higher number of women are Health Care & Social Assistance (88.5%), Finance & Insurance (77.6%), and Educational Services (74.1%).
| Industry | Male | Female |
| Agriculture, Fishing & Hunting | 0 (0.0%) | 0 (0.0%) |
| Mining, Quarrying, & Extraction | 0 (0.0%) | 0 (0.0%) |
| Construction | 207 (79.6%) | 53 (20.4%) |
| Manufacturing | 810 (61.8%) | 500 (38.2%) |
| Wholesale Trade | 179 (89.9%) | 20 (10.1%) |
| Retail Trade | 275 (47.7%) | 302 (52.3%) |
| Transportation & Warehousing | 408 (69.0%) | 183 (31.0%) |
| Utilities | 36 (59.0%) | 25 (41.0%) |
| Information | 49 (100.0%) | 0 (0.0%) |
| Finance & Insurance | 77 (22.4%) | 267 (77.6%) |
| Real Estate, Rental & Leasing | 0 (0.0%) | 0 (0.0%) |
| Professional & Scientific | 163 (62.2%) | 99 (37.8%) |
| Enterprise Management | 18 (66.7%) | 9 (33.3%) |
| Administrative & Support | 356 (84.6%) | 65 (15.4%) |
| Educational Services | 96 (26.0%) | 274 (74.1%) |
| Health Care & Social Assistance | 70 (11.5%) | 541 (88.5%) |
| Arts, Entertainment & Recreation | 30 (56.6%) | 23 (43.4%) |
| Accommodation & Food Services | 171 (50.0%) | 171 (50.0%) |
| Public Administration | 53 (73.6%) | 19 (26.4%) |
| Total | 3,106 (51.9%) | 2,880 (48.1%) |
Education in Northlake
School Enrollment in Northlake
The most common levels of schooling among the 3,595 students in Northlake are middle school (827 | 23.0%), elementary school (809 | 22.5%), and college / undergraduate (800 | 22.3%).
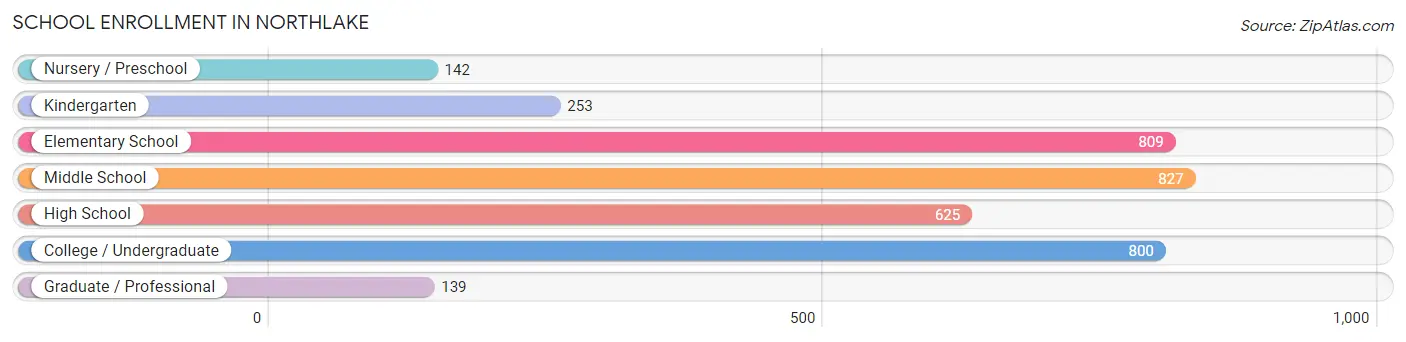
| School Level | # Students | % Students |
| Nursery / Preschool | 142 | 4.0% |
| Kindergarten | 253 | 7.0% |
| Elementary School | 809 | 22.5% |
| Middle School | 827 | 23.0% |
| High School | 625 | 17.4% |
| College / Undergraduate | 800 | 22.3% |
| Graduate / Professional | 139 | 3.9% |
| Total | 3,595 | 100.0% |
School Enrollment by Age by Funding Source in Northlake
Out of a total of 3,595 students who are enrolled in schools in Northlake, 370 (10.3%) attend a private institution, while the remaining 3,225 (89.7%) are enrolled in public schools. The age group of 25 to 34 year olds has the highest likelihood of being enrolled in private schools, with 106 (58.9% in the age bracket) enrolled. Conversely, the age group of 3 to 4 year olds has the lowest likelihood of being enrolled in a private school, with 123 (100.0% in the age bracket) attending a public institution.
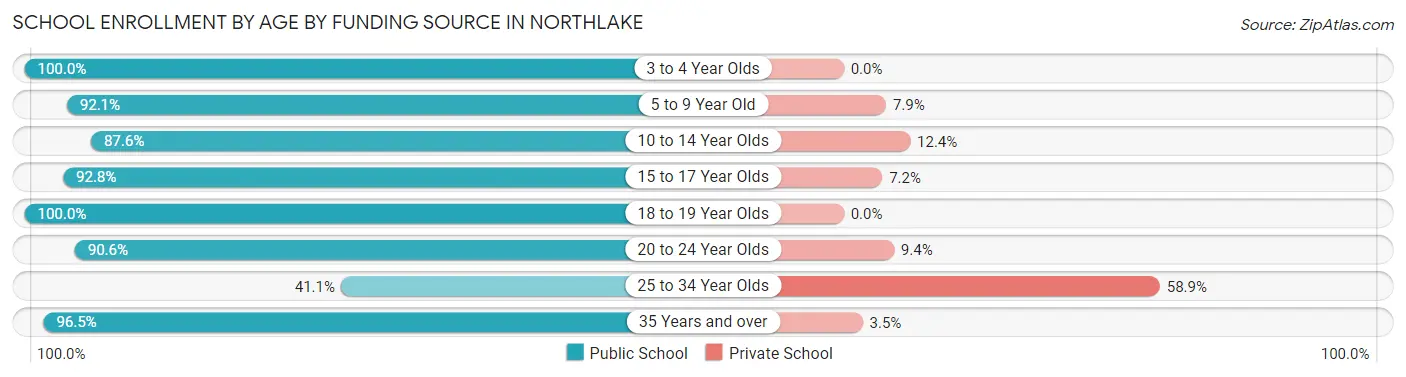
| Age Bracket | Public School | Private School |
| 3 to 4 Year Olds | 123 (100.0%) | 0 (0.0%) |
| 5 to 9 Year Old | 959 (92.1%) | 82 (7.9%) |
| 10 to 14 Year Olds | 786 (87.6%) | 111 (12.4%) |
| 15 to 17 Year Olds | 478 (92.8%) | 37 (7.2%) |
| 18 to 19 Year Olds | 316 (100.0%) | 0 (0.0%) |
| 20 to 24 Year Olds | 242 (90.6%) | 25 (9.4%) |
| 25 to 34 Year Olds | 74 (41.1%) | 106 (58.9%) |
| 35 Years and over | 247 (96.5%) | 9 (3.5%) |
| Total | 3,225 (89.7%) | 370 (10.3%) |
Educational Attainment by Field of Study in Northlake
Business (311 | 20.9%), science & technology (233 | 15.7%), education (215 | 14.4%), visual & performing arts (132 | 8.9%), and social sciences (129 | 8.7%) are the most common fields of study among 1,489 individuals in Northlake who have obtained a bachelor's degree or higher.
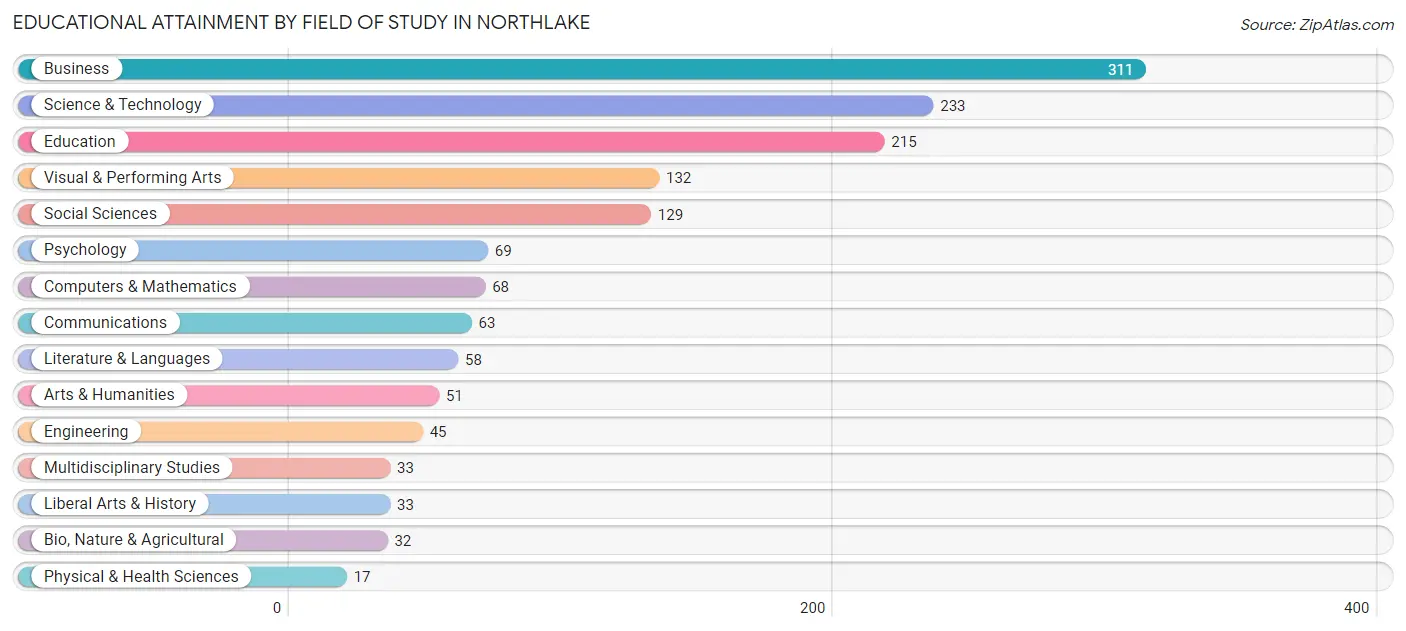
| Field of Study | # Graduates | % Graduates |
| Computers & Mathematics | 68 | 4.6% |
| Bio, Nature & Agricultural | 32 | 2.1% |
| Physical & Health Sciences | 17 | 1.1% |
| Psychology | 69 | 4.6% |
| Social Sciences | 129 | 8.7% |
| Engineering | 45 | 3.0% |
| Multidisciplinary Studies | 33 | 2.2% |
| Science & Technology | 233 | 15.7% |
| Business | 311 | 20.9% |
| Education | 215 | 14.4% |
| Literature & Languages | 58 | 3.9% |
| Liberal Arts & History | 33 | 2.2% |
| Visual & Performing Arts | 132 | 8.9% |
| Communications | 63 | 4.2% |
| Arts & Humanities | 51 | 3.4% |
| Total | 1,489 | 100.0% |
Transportation & Commute in Northlake
Vehicle Availability by Sex in Northlake
The most prevalent vehicle ownership categories in Northlake are males with 3 vehicles (973, accounting for 31.6%) and females with 3 vehicles (652, making up 34.8%).
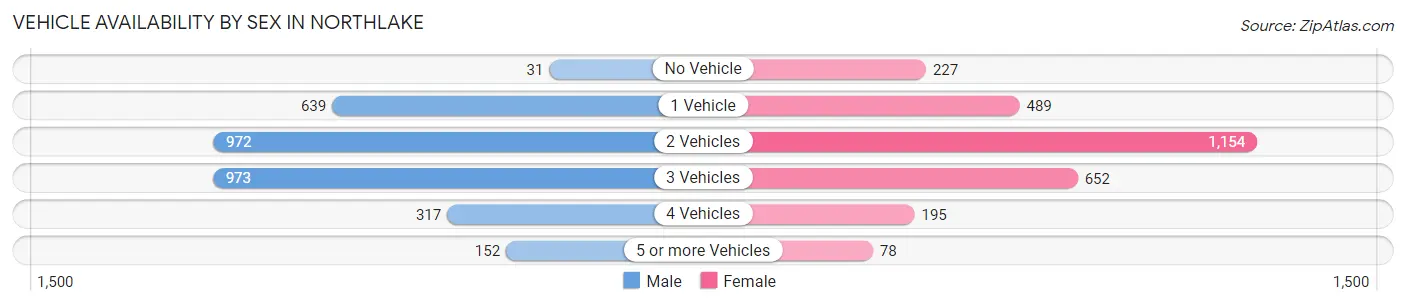
| Vehicles Available | Male | Female |
| No Vehicle | 31 (1.0%) | 227 (8.1%) |
| 1 Vehicle | 639 (20.7%) | 489 (17.5%) |
| 2 Vehicles | 972 (31.5%) | 1,154 (41.3%) |
| 3 Vehicles | 973 (31.6%) | 652 (23.3%) |
| 4 Vehicles | 317 (10.3%) | 195 (7.0%) |
| 5 or more Vehicles | 152 (4.9%) | 78 (2.8%) |
| Total | 3,084 (100.0%) | 2,795 (100.0%) |
Commute Time in Northlake
The most frequently occuring commute durations in Northlake are 30 to 34 minutes (1,087 commuters, 20.0%), 20 to 24 minutes (939 commuters, 17.2%), and 15 to 19 minutes (639 commuters, 11.7%).
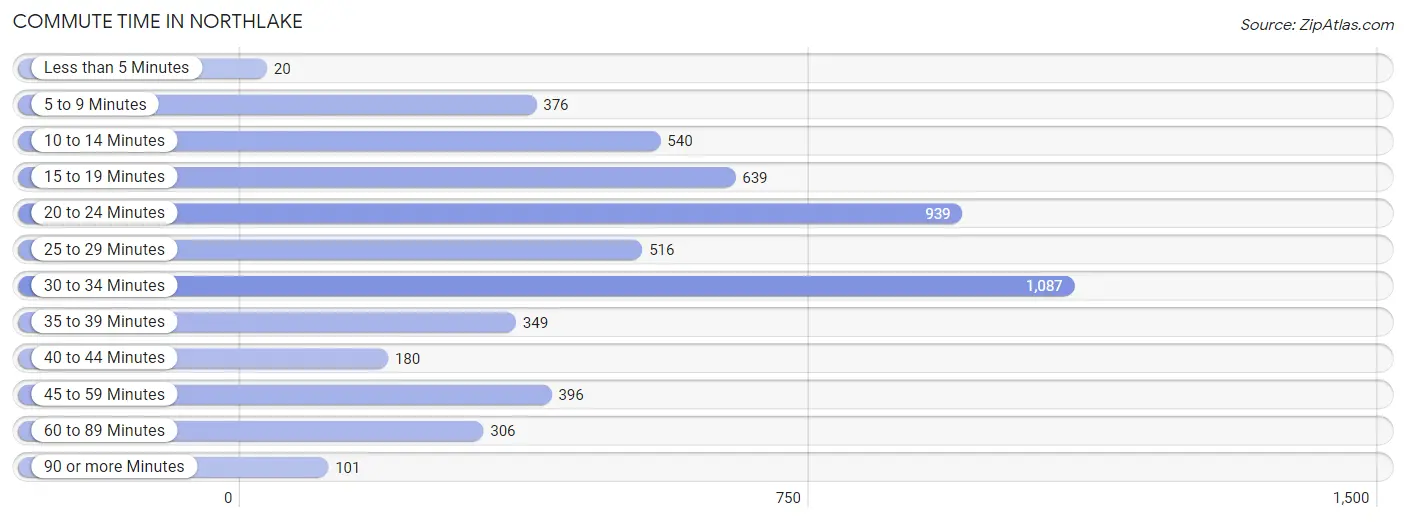
| Commute Time | # Commuters | % Commuters |
| Less than 5 Minutes | 20 | 0.4% |
| 5 to 9 Minutes | 376 | 6.9% |
| 10 to 14 Minutes | 540 | 9.9% |
| 15 to 19 Minutes | 639 | 11.7% |
| 20 to 24 Minutes | 939 | 17.2% |
| 25 to 29 Minutes | 516 | 9.5% |
| 30 to 34 Minutes | 1,087 | 20.0% |
| 35 to 39 Minutes | 349 | 6.4% |
| 40 to 44 Minutes | 180 | 3.3% |
| 45 to 59 Minutes | 396 | 7.3% |
| 60 to 89 Minutes | 306 | 5.6% |
| 90 or more Minutes | 101 | 1.8% |
Commute Time by Sex in Northlake
The most common commute times in Northlake are 30 to 34 minutes (728 commuters, 24.9%) for males and 20 to 24 minutes (417 commuters, 16.5%) for females.
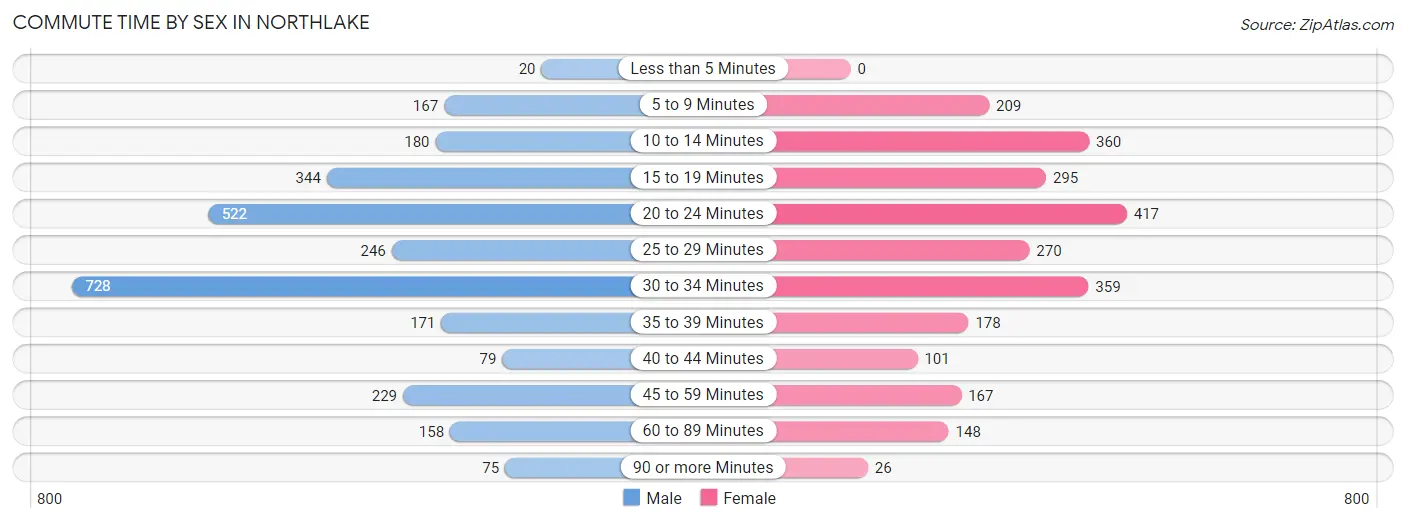
| Commute Time | Male | Female |
| Less than 5 Minutes | 20 (0.7%) | 0 (0.0%) |
| 5 to 9 Minutes | 167 (5.7%) | 209 (8.3%) |
| 10 to 14 Minutes | 180 (6.2%) | 360 (14.2%) |
| 15 to 19 Minutes | 344 (11.8%) | 295 (11.7%) |
| 20 to 24 Minutes | 522 (17.9%) | 417 (16.5%) |
| 25 to 29 Minutes | 246 (8.4%) | 270 (10.7%) |
| 30 to 34 Minutes | 728 (24.9%) | 359 (14.2%) |
| 35 to 39 Minutes | 171 (5.9%) | 178 (7.0%) |
| 40 to 44 Minutes | 79 (2.7%) | 101 (4.0%) |
| 45 to 59 Minutes | 229 (7.9%) | 167 (6.6%) |
| 60 to 89 Minutes | 158 (5.4%) | 148 (5.9%) |
| 90 or more Minutes | 75 (2.6%) | 26 (1.0%) |
Time of Departure to Work by Sex in Northlake
The most frequent times of departure to work in Northlake are 6:00 AM to 6:29 AM (536, 18.4%) for males and 7:00 AM to 7:29 AM (460, 18.2%) for females.
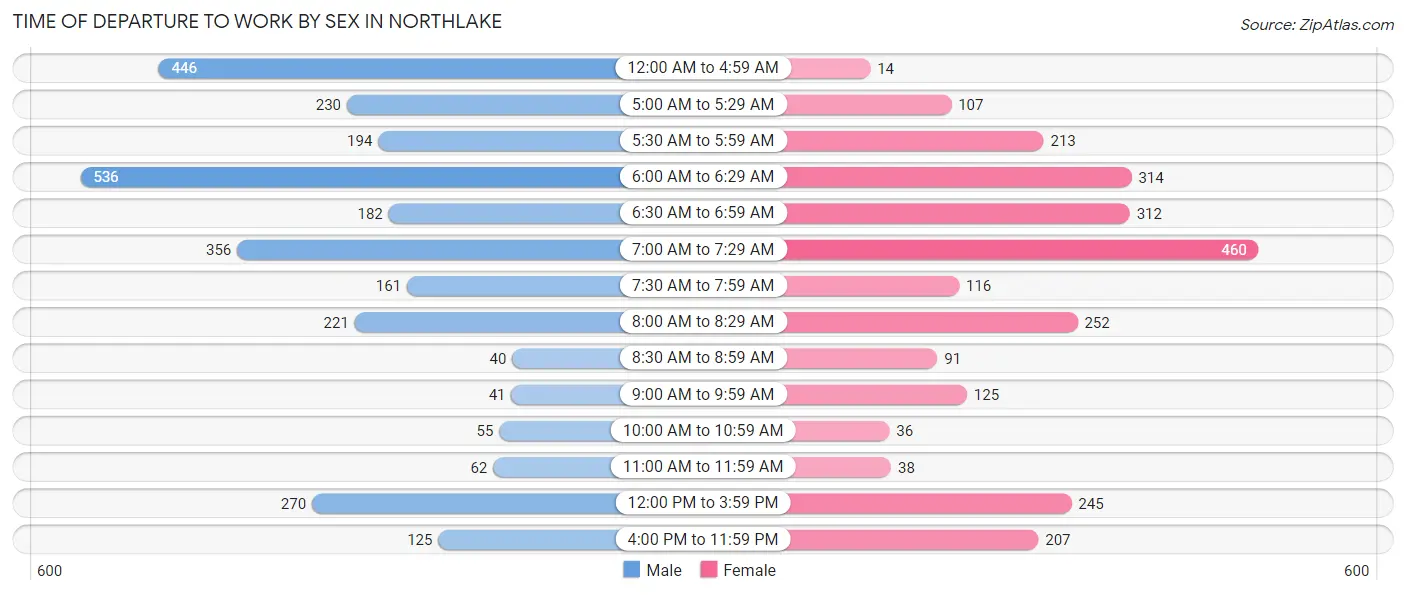
| Time of Departure | Male | Female |
| 12:00 AM to 4:59 AM | 446 (15.3%) | 14 (0.5%) |
| 5:00 AM to 5:29 AM | 230 (7.9%) | 107 (4.2%) |
| 5:30 AM to 5:59 AM | 194 (6.7%) | 213 (8.4%) |
| 6:00 AM to 6:29 AM | 536 (18.4%) | 314 (12.4%) |
| 6:30 AM to 6:59 AM | 182 (6.2%) | 312 (12.3%) |
| 7:00 AM to 7:29 AM | 356 (12.2%) | 460 (18.2%) |
| 7:30 AM to 7:59 AM | 161 (5.5%) | 116 (4.6%) |
| 8:00 AM to 8:29 AM | 221 (7.6%) | 252 (10.0%) |
| 8:30 AM to 8:59 AM | 40 (1.4%) | 91 (3.6%) |
| 9:00 AM to 9:59 AM | 41 (1.4%) | 125 (4.9%) |
| 10:00 AM to 10:59 AM | 55 (1.9%) | 36 (1.4%) |
| 11:00 AM to 11:59 AM | 62 (2.1%) | 38 (1.5%) |
| 12:00 PM to 3:59 PM | 270 (9.2%) | 245 (9.7%) |
| 4:00 PM to 11:59 PM | 125 (4.3%) | 207 (8.2%) |
| Total | 2,919 (100.0%) | 2,530 (100.0%) |
Housing Occupancy in Northlake
Occupancy by Ownership in Northlake
Of the total 4,539 dwellings in Northlake, owner-occupied units account for 3,049 (67.2%), while renter-occupied units make up 1,490 (32.8%).
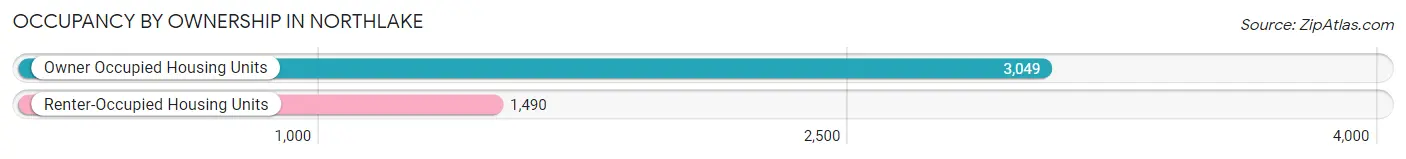
| Occupancy | # Housing Units | % Housing Units |
| Owner Occupied Housing Units | 3,049 | 67.2% |
| Renter-Occupied Housing Units | 1,490 | 32.8% |
| Total Occupied Housing Units | 4,539 | 100.0% |
Occupancy by Household Size in Northlake
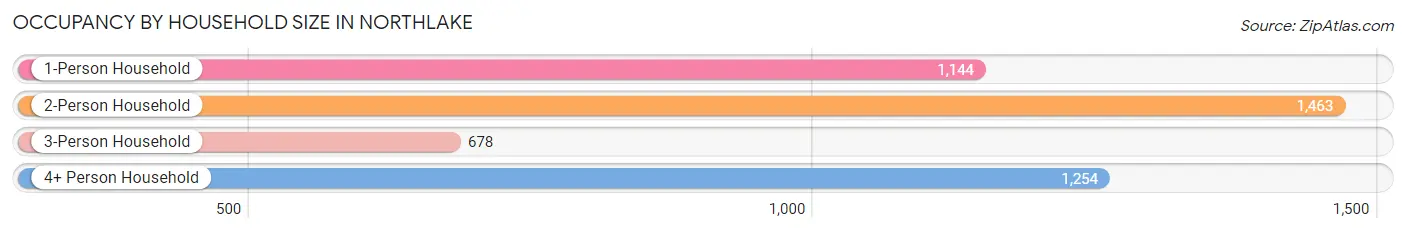
| Household Size | # Housing Units | % Housing Units |
| 1-Person Household | 1,144 | 25.2% |
| 2-Person Household | 1,463 | 32.2% |
| 3-Person Household | 678 | 14.9% |
| 4+ Person Household | 1,254 | 27.6% |
| Total Housing Units | 4,539 | 100.0% |
Occupancy by Ownership by Household Size in Northlake
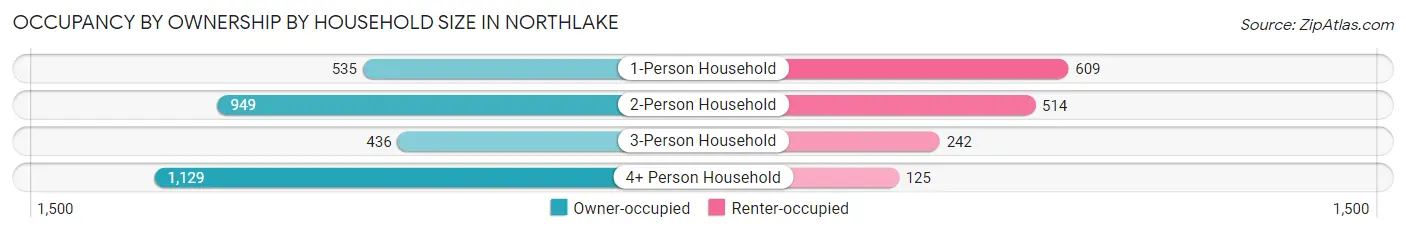
| Household Size | Owner-occupied | Renter-occupied |
| 1-Person Household | 535 (46.8%) | 609 (53.2%) |
| 2-Person Household | 949 (64.9%) | 514 (35.1%) |
| 3-Person Household | 436 (64.3%) | 242 (35.7%) |
| 4+ Person Household | 1,129 (90.0%) | 125 (10.0%) |
| Total Housing Units | 3,049 (67.2%) | 1,490 (32.8%) |
Occupancy by Educational Attainment in Northlake
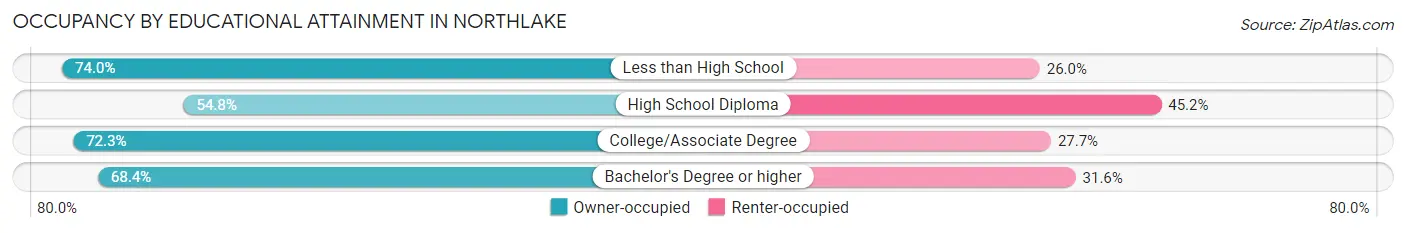
| Household Size | Owner-occupied | Renter-occupied |
| Less than High School | 907 (74.0%) | 318 (26.0%) |
| High School Diploma | 711 (54.8%) | 587 (45.2%) |
| College/Associate Degree | 975 (72.3%) | 374 (27.7%) |
| Bachelor's Degree or higher | 456 (68.4%) | 211 (31.6%) |
Occupancy by Age of Householder in Northlake
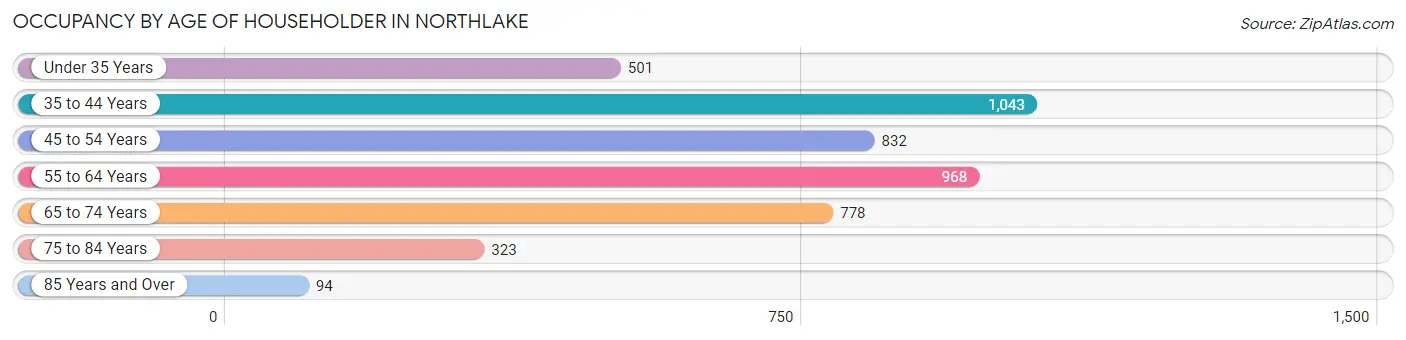
| Age Bracket | # Households | % Households |
| Under 35 Years | 501 | 11.0% |
| 35 to 44 Years | 1,043 | 23.0% |
| 45 to 54 Years | 832 | 18.3% |
| 55 to 64 Years | 968 | 21.3% |
| 65 to 74 Years | 778 | 17.1% |
| 75 to 84 Years | 323 | 7.1% |
| 85 Years and Over | 94 | 2.1% |
| Total | 4,539 | 100.0% |
Housing Finances in Northlake
Median Income by Occupancy in Northlake
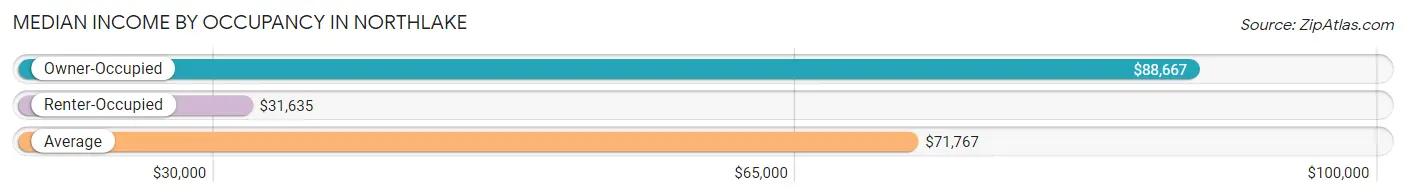
| Occupancy Type | # Households | Median Income |
| Owner-Occupied | 3,049 (67.2%) | $88,667 |
| Renter-Occupied | 1,490 (32.8%) | $31,635 |
| Average | 4,539 (100.0%) | $71,767 |
Occupancy by Householder Income Bracket in Northlake
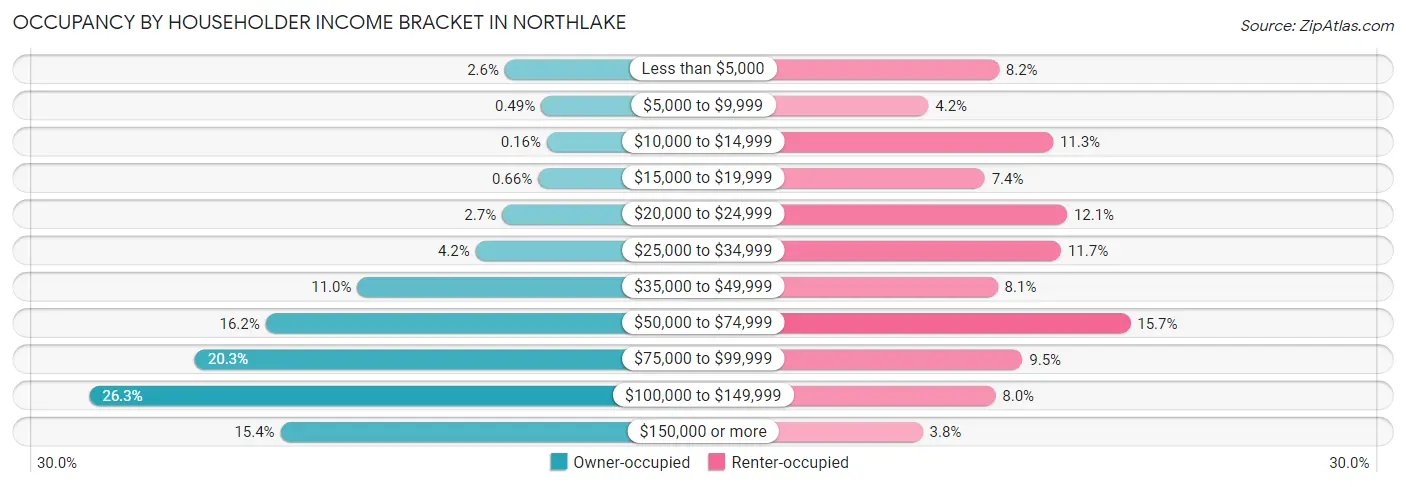
| Income Bracket | Owner-occupied | Renter-occupied |
| Less than $5,000 | 78 (2.6%) | 122 (8.2%) |
| $5,000 to $9,999 | 15 (0.5%) | 62 (4.2%) |
| $10,000 to $14,999 | 5 (0.2%) | 168 (11.3%) |
| $15,000 to $19,999 | 20 (0.7%) | 110 (7.4%) |
| $20,000 to $24,999 | 83 (2.7%) | 180 (12.1%) |
| $25,000 to $34,999 | 129 (4.2%) | 175 (11.7%) |
| $35,000 to $49,999 | 335 (11.0%) | 121 (8.1%) |
| $50,000 to $74,999 | 495 (16.2%) | 234 (15.7%) |
| $75,000 to $99,999 | 618 (20.3%) | 142 (9.5%) |
| $100,000 to $149,999 | 802 (26.3%) | 119 (8.0%) |
| $150,000 or more | 469 (15.4%) | 57 (3.8%) |
| Total | 3,049 (100.0%) | 1,490 (100.0%) |
Monthly Housing Cost Tiers in Northlake
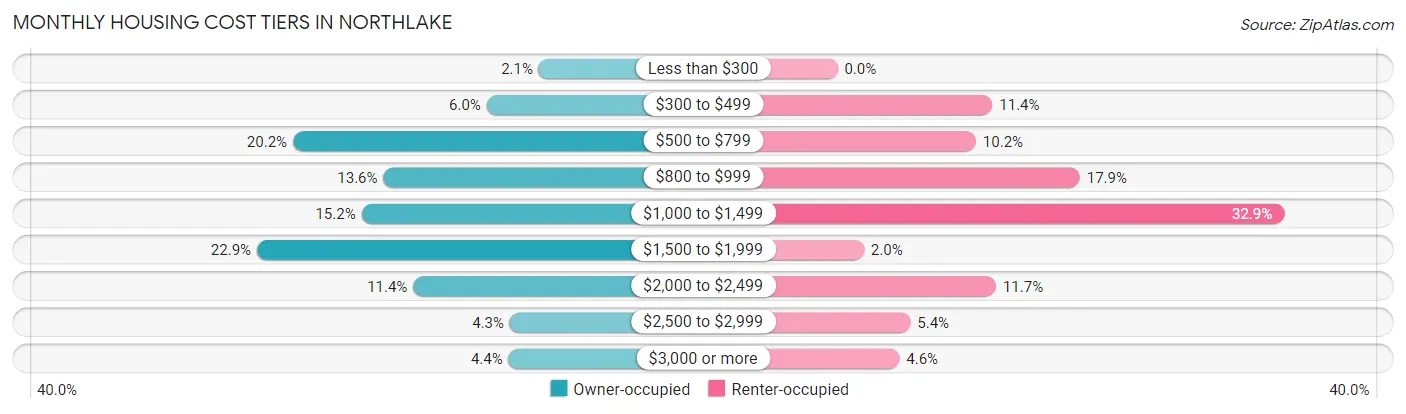
| Monthly Cost | Owner-occupied | Renter-occupied |
| Less than $300 | 65 (2.1%) | 0 (0.0%) |
| $300 to $499 | 182 (6.0%) | 170 (11.4%) |
| $500 to $799 | 617 (20.2%) | 152 (10.2%) |
| $800 to $999 | 414 (13.6%) | 266 (17.8%) |
| $1,000 to $1,499 | 463 (15.2%) | 490 (32.9%) |
| $1,500 to $1,999 | 698 (22.9%) | 29 (1.9%) |
| $2,000 to $2,499 | 347 (11.4%) | 174 (11.7%) |
| $2,500 to $2,999 | 130 (4.3%) | 80 (5.4%) |
| $3,000 or more | 133 (4.4%) | 68 (4.6%) |
| Total | 3,049 (100.0%) | 1,490 (100.0%) |
Physical Housing Characteristics in Northlake
Housing Structures in Northlake
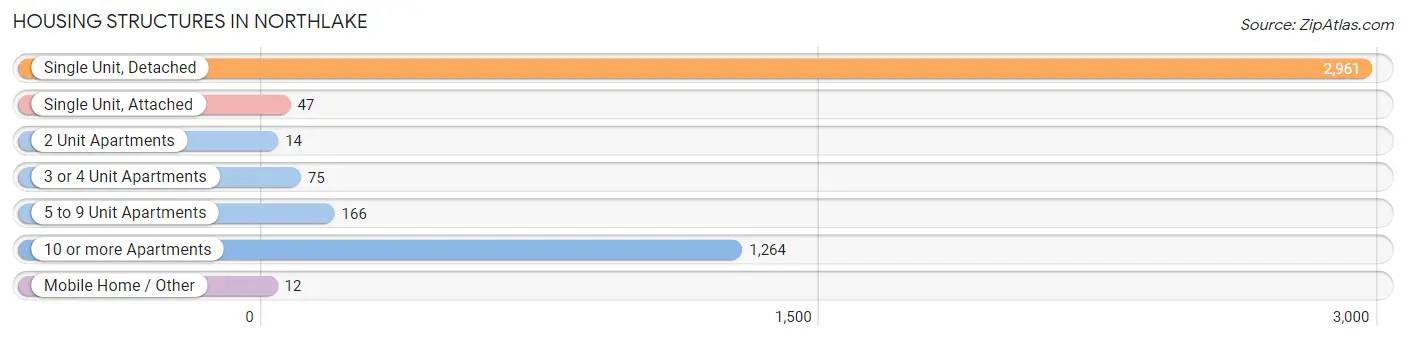
| Structure Type | # Housing Units | % Housing Units |
| Single Unit, Detached | 2,961 | 65.2% |
| Single Unit, Attached | 47 | 1.0% |
| 2 Unit Apartments | 14 | 0.3% |
| 3 or 4 Unit Apartments | 75 | 1.7% |
| 5 to 9 Unit Apartments | 166 | 3.7% |
| 10 or more Apartments | 1,264 | 27.9% |
| Mobile Home / Other | 12 | 0.3% |
| Total | 4,539 | 100.0% |
Housing Structures by Occupancy in Northlake
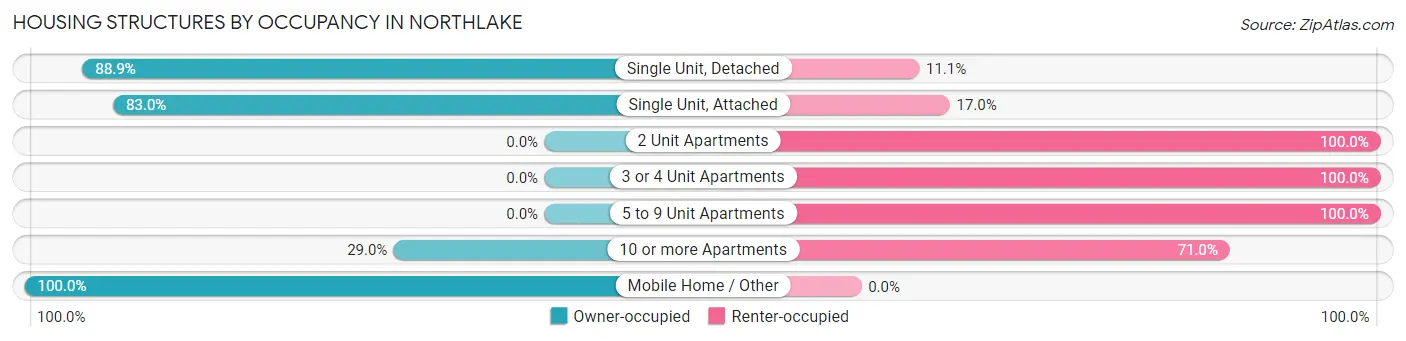
| Structure Type | Owner-occupied | Renter-occupied |
| Single Unit, Detached | 2,631 (88.9%) | 330 (11.1%) |
| Single Unit, Attached | 39 (83.0%) | 8 (17.0%) |
| 2 Unit Apartments | 0 (0.0%) | 14 (100.0%) |
| 3 or 4 Unit Apartments | 0 (0.0%) | 75 (100.0%) |
| 5 to 9 Unit Apartments | 0 (0.0%) | 166 (100.0%) |
| 10 or more Apartments | 367 (29.0%) | 897 (71.0%) |
| Mobile Home / Other | 12 (100.0%) | 0 (0.0%) |
| Total | 3,049 (67.2%) | 1,490 (32.8%) |
Housing Structures by Number of Rooms in Northlake
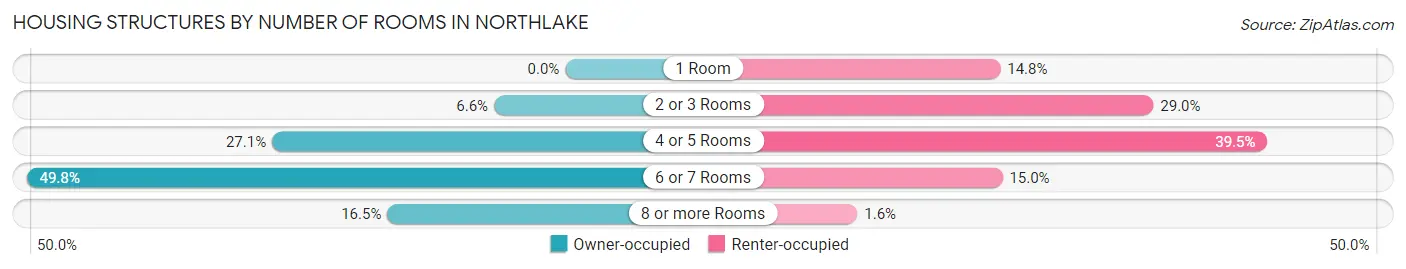
| Number of Rooms | Owner-occupied | Renter-occupied |
| 1 Room | 0 (0.0%) | 221 (14.8%) |
| 2 or 3 Rooms | 201 (6.6%) | 432 (29.0%) |
| 4 or 5 Rooms | 827 (27.1%) | 589 (39.5%) |
| 6 or 7 Rooms | 1,519 (49.8%) | 224 (15.0%) |
| 8 or more Rooms | 502 (16.5%) | 24 (1.6%) |
| Total | 3,049 (100.0%) | 1,490 (100.0%) |
Housing Structure by Heating Type in Northlake
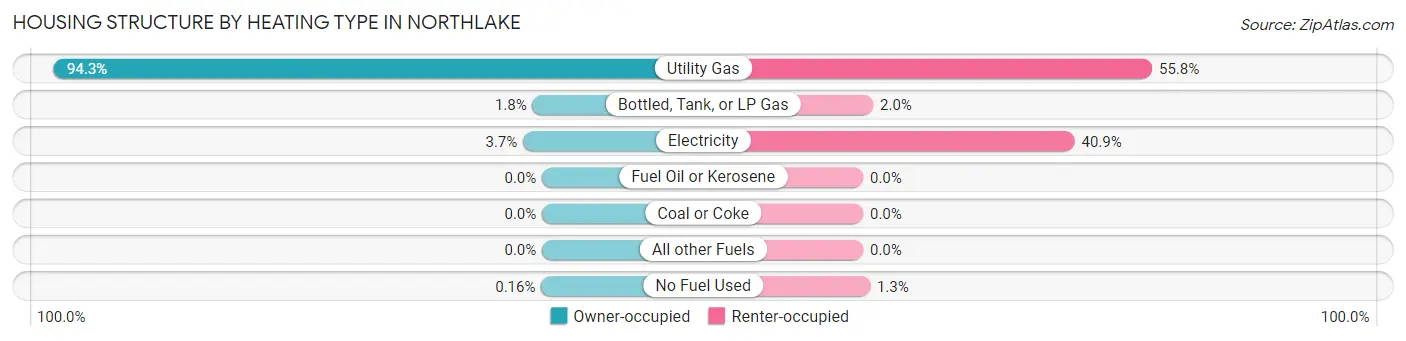
| Heating Type | Owner-occupied | Renter-occupied |
| Utility Gas | 2,876 (94.3%) | 832 (55.8%) |
| Bottled, Tank, or LP Gas | 56 (1.8%) | 29 (1.9%) |
| Electricity | 112 (3.7%) | 609 (40.9%) |
| Fuel Oil or Kerosene | 0 (0.0%) | 0 (0.0%) |
| Coal or Coke | 0 (0.0%) | 0 (0.0%) |
| All other Fuels | 0 (0.0%) | 0 (0.0%) |
| No Fuel Used | 5 (0.2%) | 20 (1.3%) |
| Total | 3,049 (100.0%) | 1,490 (100.0%) |
Household Vehicle Usage in Northlake
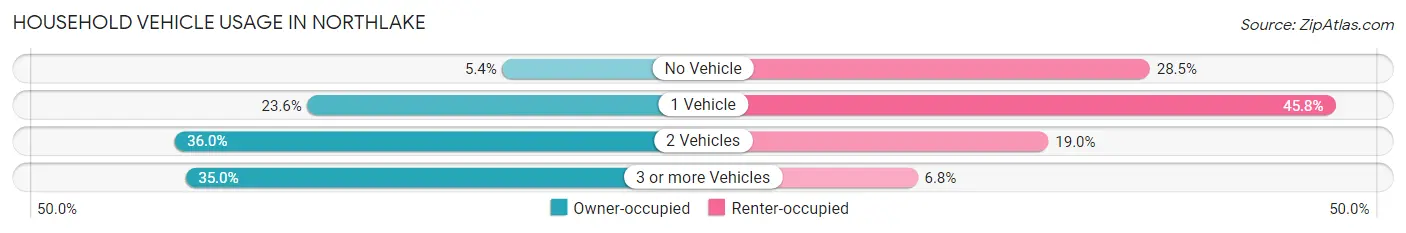
| Vehicles per Household | Owner-occupied | Renter-occupied |
| No Vehicle | 164 (5.4%) | 424 (28.5%) |
| 1 Vehicle | 719 (23.6%) | 682 (45.8%) |
| 2 Vehicles | 1,099 (36.0%) | 283 (19.0%) |
| 3 or more Vehicles | 1,067 (35.0%) | 101 (6.8%) |
| Total | 3,049 (100.0%) | 1,490 (100.0%) |
Real Estate & Mortgages in Northlake
Real Estate and Mortgage Overview in Northlake
| Characteristic | Without Mortgage | With Mortgage |
| Housing Units | 1,307 | 1,742 |
| Median Property Value | $219,700 | $233,000 |
| Median Household Income | $87,576 | $234 |
| Monthly Housing Costs | $743 | $133 |
| Real Estate Taxes | $5,694 | $11 |
Property Value by Mortgage Status in Northlake
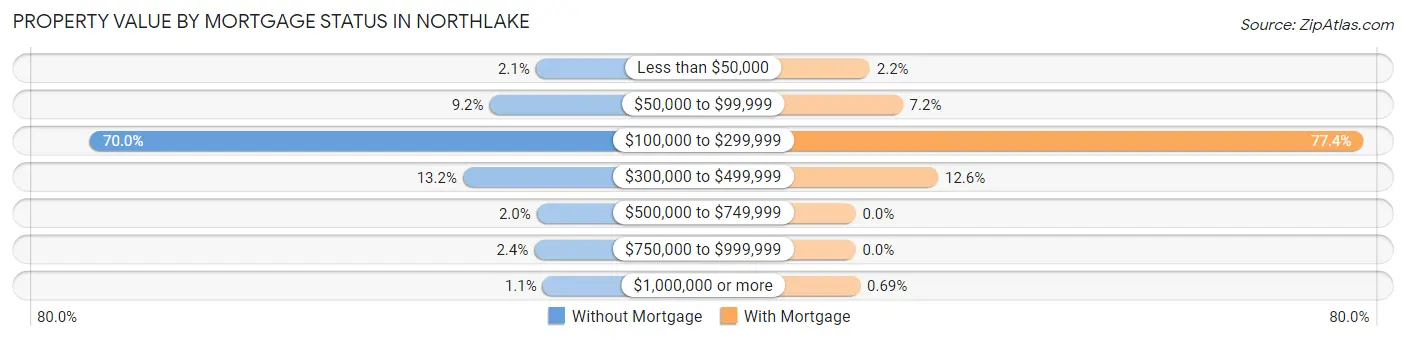
| Property Value | Without Mortgage | With Mortgage |
| Less than $50,000 | 28 (2.1%) | 38 (2.2%) |
| $50,000 to $99,999 | 120 (9.2%) | 125 (7.2%) |
| $100,000 to $299,999 | 915 (70.0%) | 1,348 (77.4%) |
| $300,000 to $499,999 | 173 (13.2%) | 219 (12.6%) |
| $500,000 to $749,999 | 26 (2.0%) | 0 (0.0%) |
| $750,000 to $999,999 | 31 (2.4%) | 0 (0.0%) |
| $1,000,000 or more | 14 (1.1%) | 12 (0.7%) |
| Total | 1,307 (100.0%) | 1,742 (100.0%) |
Household Income by Mortgage Status in Northlake
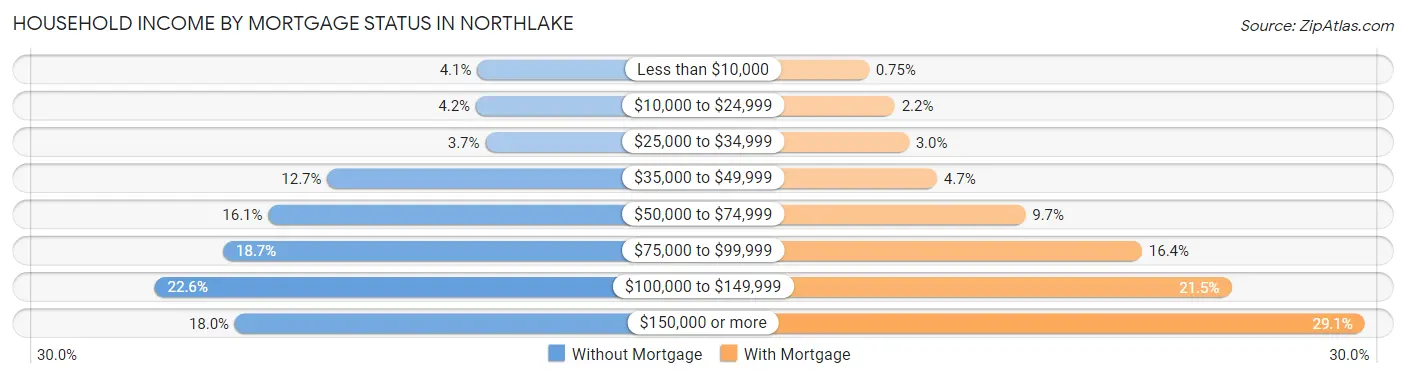
| Household Income | Without Mortgage | With Mortgage |
| Less than $10,000 | 54 (4.1%) | 13 (0.7%) |
| $10,000 to $24,999 | 55 (4.2%) | 39 (2.2%) |
| $25,000 to $34,999 | 48 (3.7%) | 53 (3.0%) |
| $35,000 to $49,999 | 166 (12.7%) | 81 (4.6%) |
| $50,000 to $74,999 | 210 (16.1%) | 169 (9.7%) |
| $75,000 to $99,999 | 244 (18.7%) | 285 (16.4%) |
| $100,000 to $149,999 | 295 (22.6%) | 374 (21.5%) |
| $150,000 or more | 235 (18.0%) | 507 (29.1%) |
| Total | 1,307 (100.0%) | 1,742 (100.0%) |
Property Value to Household Income Ratio in Northlake
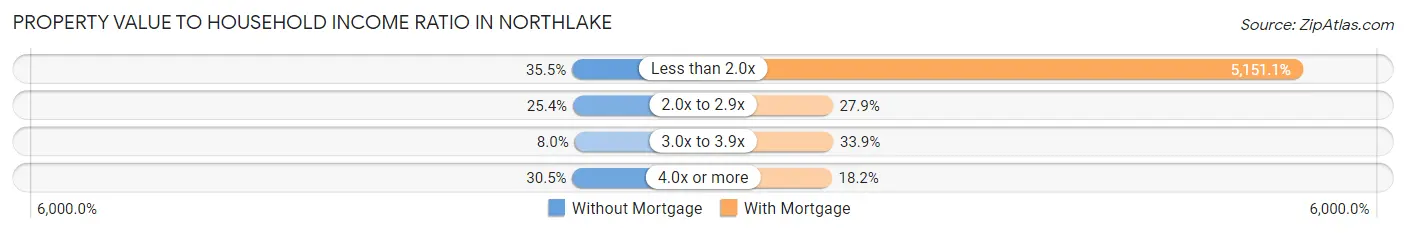
| Value-to-Income Ratio | Without Mortgage | With Mortgage |
| Less than 2.0x | 464 (35.5%) | 89,732 (5,151.1%) |
| 2.0x to 2.9x | 332 (25.4%) | 486 (27.9%) |
| 3.0x to 3.9x | 105 (8.0%) | 590 (33.9%) |
| 4.0x or more | 398 (30.4%) | 317 (18.2%) |
| Total | 1,307 (100.0%) | 1,742 (100.0%) |
Real Estate Taxes by Mortgage Status in Northlake
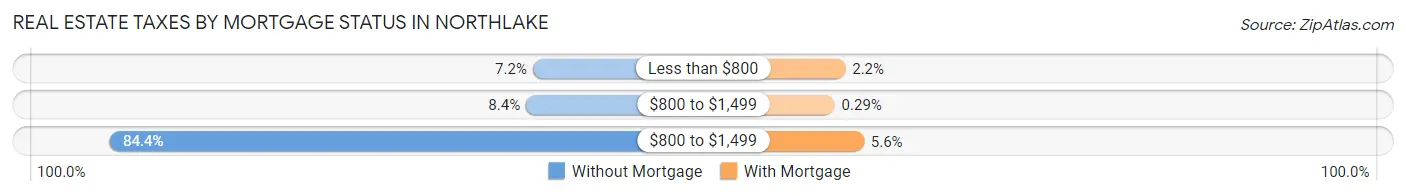
| Property Taxes | Without Mortgage | With Mortgage |
| Less than $800 | 94 (7.2%) | 39 (2.2%) |
| $800 to $1,499 | 110 (8.4%) | 5 (0.3%) |
| $800 to $1,499 | 1,103 (84.4%) | 98 (5.6%) |
| Total | 1,307 (100.0%) | 1,742 (100.0%) |
Health & Disability in Northlake
Health Insurance Coverage by Age in Northlake
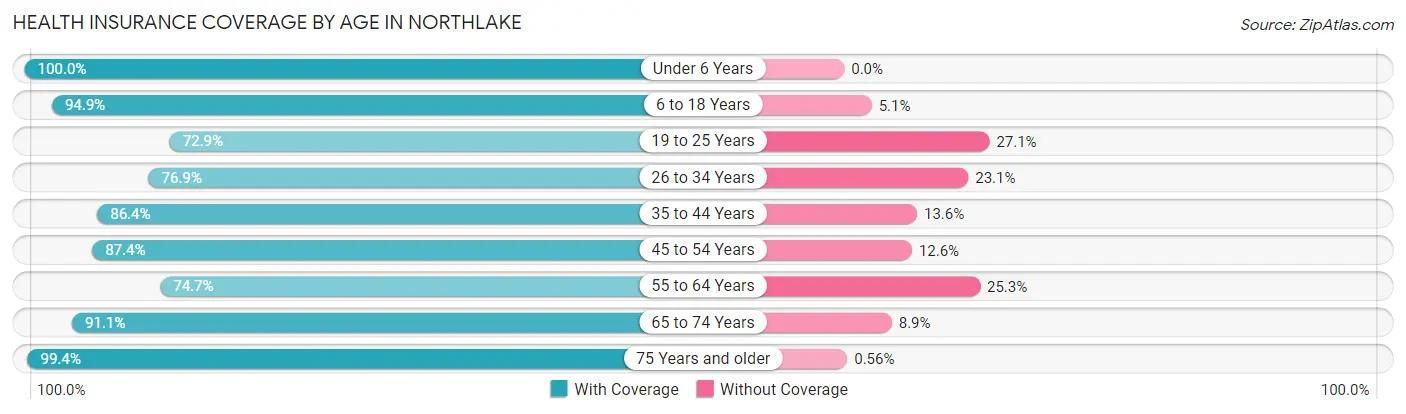
| Age Bracket | With Coverage | Without Coverage |
| Under 6 Years | 560 (100.0%) | 0 (0.0%) |
| 6 to 18 Years | 2,375 (94.9%) | 128 (5.1%) |
| 19 to 25 Years | 765 (72.9%) | 284 (27.1%) |
| 26 to 34 Years | 1,067 (76.9%) | 321 (23.1%) |
| 35 to 44 Years | 1,618 (86.4%) | 254 (13.6%) |
| 45 to 54 Years | 1,343 (87.4%) | 194 (12.6%) |
| 55 to 64 Years | 1,372 (74.7%) | 465 (25.3%) |
| 65 to 74 Years | 1,060 (91.1%) | 103 (8.9%) |
| 75 Years and older | 535 (99.4%) | 3 (0.6%) |
| Total | 10,695 (85.9%) | 1,752 (14.1%) |
Health Insurance Coverage by Citizenship Status in Northlake
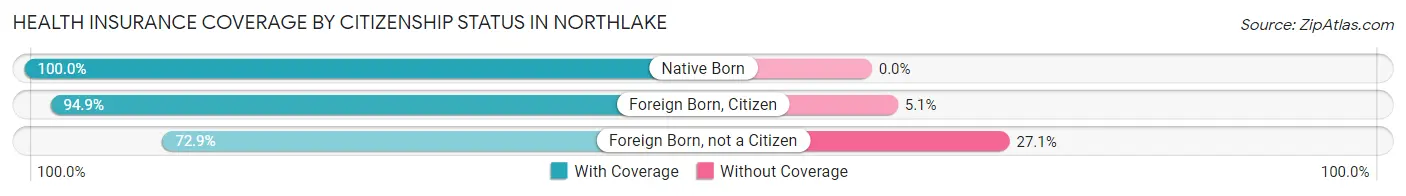
| Citizenship Status | With Coverage | Without Coverage |
| Native Born | 560 (100.0%) | 0 (0.0%) |
| Foreign Born, Citizen | 2,375 (94.9%) | 128 (5.1%) |
| Foreign Born, not a Citizen | 765 (72.9%) | 284 (27.1%) |
Health Insurance Coverage by Household Income in Northlake
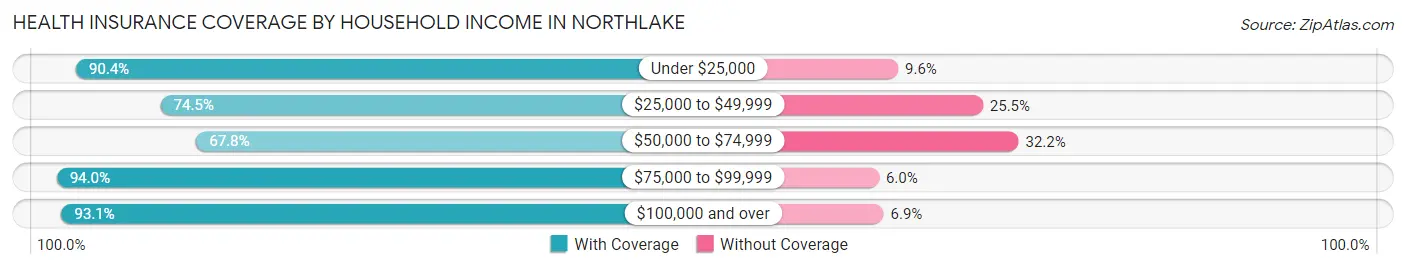
| Household Income | With Coverage | Without Coverage |
| Under $25,000 | 1,249 (90.4%) | 133 (9.6%) |
| $25,000 to $49,999 | 1,266 (74.5%) | 433 (25.5%) |
| $50,000 to $74,999 | 1,450 (67.8%) | 688 (32.2%) |
| $75,000 to $99,999 | 1,869 (94.0%) | 120 (6.0%) |
| $100,000 and over | 4,725 (93.1%) | 350 (6.9%) |
Public vs Private Health Insurance Coverage by Age in Northlake
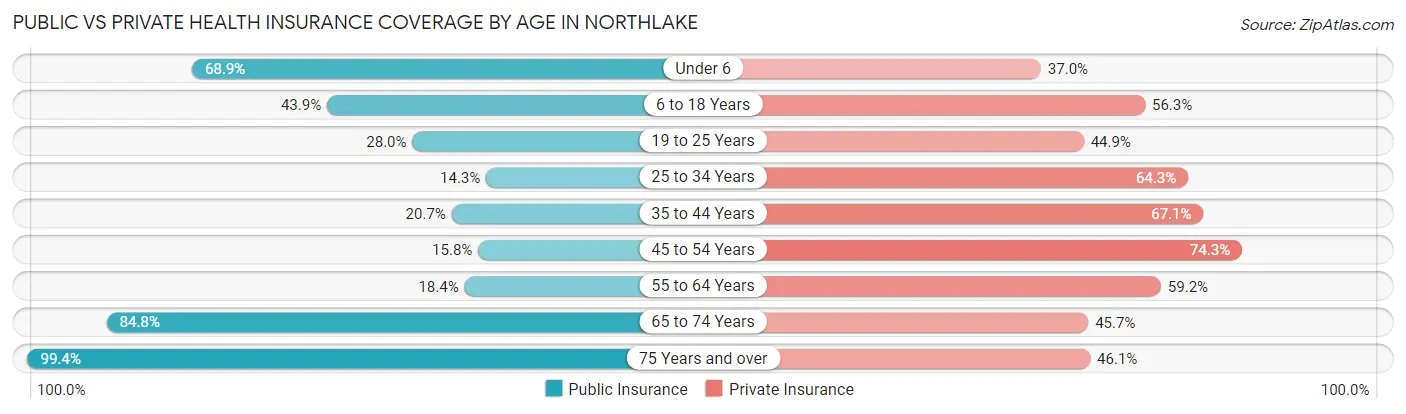
| Age Bracket | Public Insurance | Private Insurance |
| Under 6 | 386 (68.9%) | 207 (37.0%) |
| 6 to 18 Years | 1,098 (43.9%) | 1,409 (56.3%) |
| 19 to 25 Years | 294 (28.0%) | 471 (44.9%) |
| 25 to 34 Years | 199 (14.3%) | 892 (64.3%) |
| 35 to 44 Years | 388 (20.7%) | 1,256 (67.1%) |
| 45 to 54 Years | 243 (15.8%) | 1,142 (74.3%) |
| 55 to 64 Years | 337 (18.3%) | 1,088 (59.2%) |
| 65 to 74 Years | 986 (84.8%) | 532 (45.7%) |
| 75 Years and over | 535 (99.4%) | 248 (46.1%) |
| Total | 4,466 (35.9%) | 7,245 (58.2%) |
Disability Status by Sex by Age in Northlake
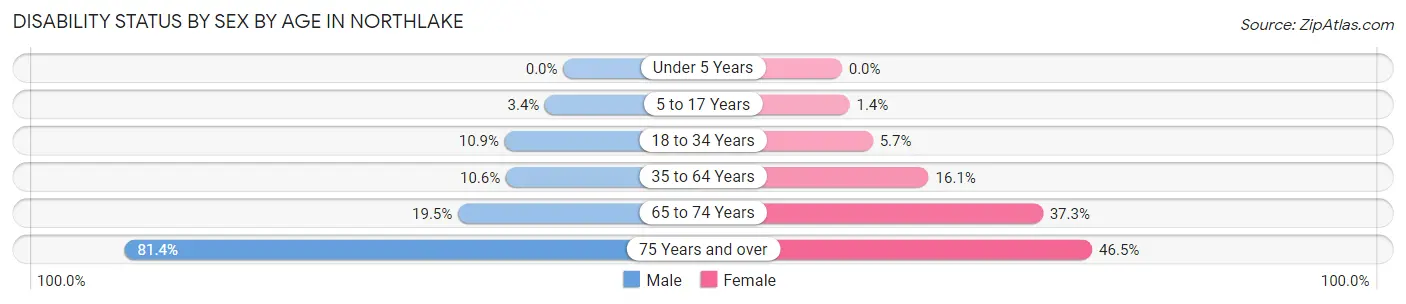
| Age Bracket | Male | Female |
| Under 5 Years | 0 (0.0%) | 0 (0.0%) |
| 5 to 17 Years | 43 (3.4%) | 18 (1.4%) |
| 18 to 34 Years | 135 (10.9%) | 78 (5.7%) |
| 35 to 64 Years | 280 (10.6%) | 421 (16.1%) |
| 65 to 74 Years | 91 (19.5%) | 260 (37.3%) |
| 75 Years and over | 184 (81.4%) | 145 (46.5%) |
Disability Class by Sex by Age in Northlake
Disability Class: Hearing Difficulty
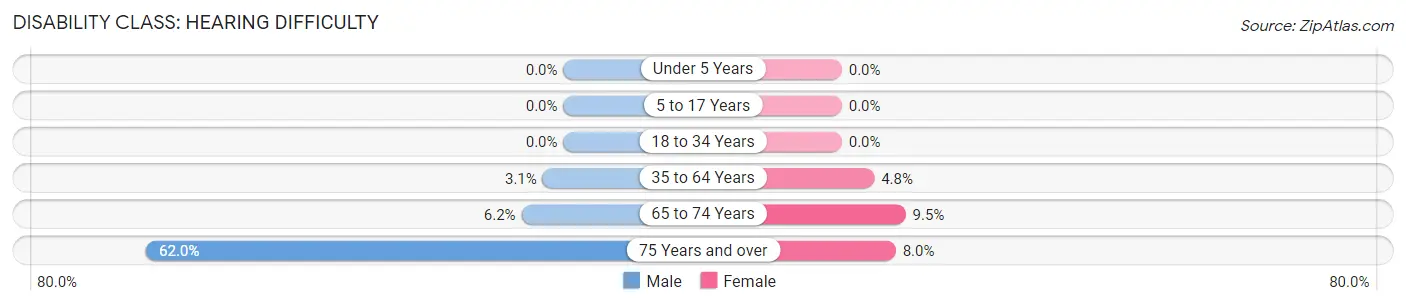
| Age Bracket | Male | Female |
| Under 5 Years | 0 (0.0%) | 0 (0.0%) |
| 5 to 17 Years | 0 (0.0%) | 0 (0.0%) |
| 18 to 34 Years | 0 (0.0%) | 0 (0.0%) |
| 35 to 64 Years | 81 (3.1%) | 126 (4.8%) |
| 65 to 74 Years | 29 (6.2%) | 66 (9.5%) |
| 75 Years and over | 140 (62.0%) | 25 (8.0%) |
Disability Class: Vision Difficulty
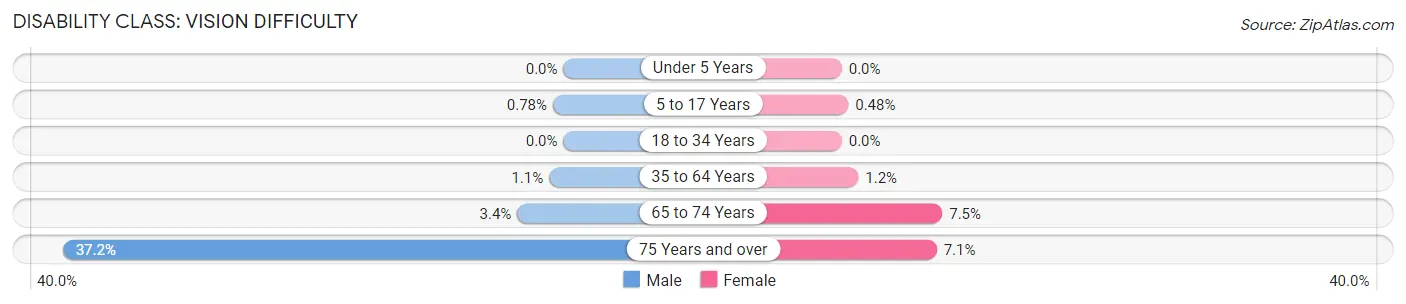
| Age Bracket | Male | Female |
| Under 5 Years | 0 (0.0%) | 0 (0.0%) |
| 5 to 17 Years | 10 (0.8%) | 6 (0.5%) |
| 18 to 34 Years | 0 (0.0%) | 0 (0.0%) |
| 35 to 64 Years | 28 (1.1%) | 32 (1.2%) |
| 65 to 74 Years | 16 (3.4%) | 52 (7.5%) |
| 75 Years and over | 84 (37.2%) | 22 (7.0%) |
Disability Class: Cognitive Difficulty
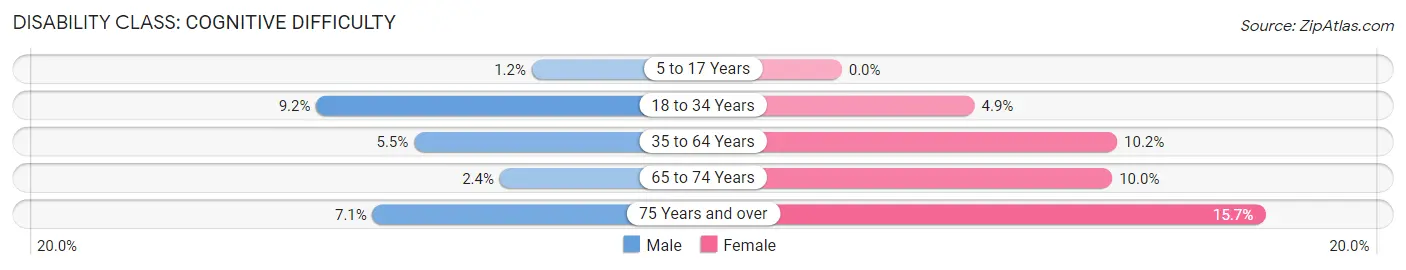
| Age Bracket | Male | Female |
| 5 to 17 Years | 15 (1.2%) | 0 (0.0%) |
| 18 to 34 Years | 114 (9.2%) | 67 (4.9%) |
| 35 to 64 Years | 146 (5.5%) | 267 (10.2%) |
| 65 to 74 Years | 11 (2.4%) | 70 (10.0%) |
| 75 Years and over | 16 (7.1%) | 49 (15.7%) |
Disability Class: Ambulatory Difficulty
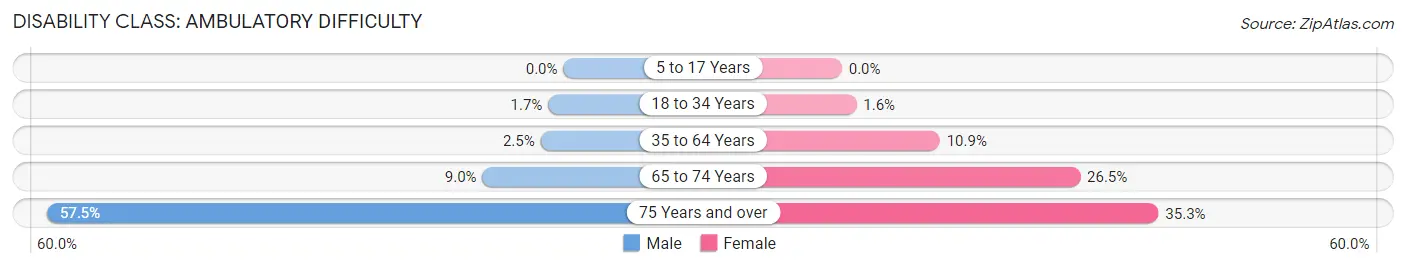
| Age Bracket | Male | Female |
| 5 to 17 Years | 0 (0.0%) | 0 (0.0%) |
| 18 to 34 Years | 21 (1.7%) | 22 (1.6%) |
| 35 to 64 Years | 67 (2.5%) | 285 (10.9%) |
| 65 to 74 Years | 42 (9.0%) | 185 (26.5%) |
| 75 Years and over | 130 (57.5%) | 110 (35.3%) |
Disability Class: Self-Care Difficulty
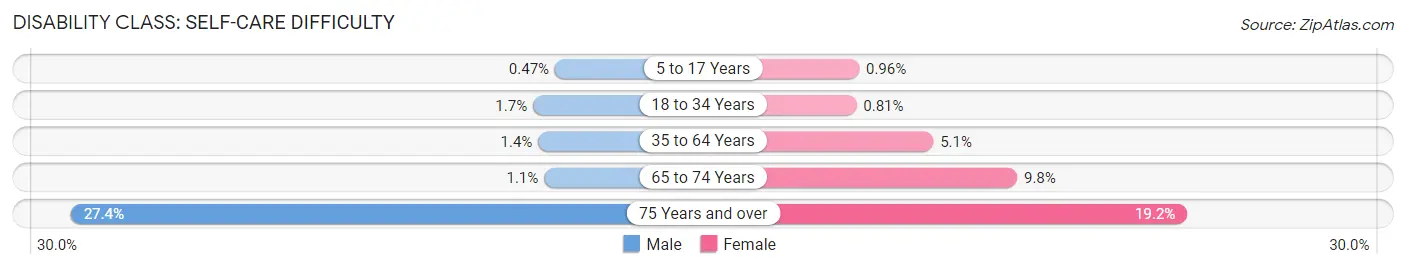
| Age Bracket | Male | Female |
| 5 to 17 Years | 6 (0.5%) | 12 (1.0%) |
| 18 to 34 Years | 21 (1.7%) | 11 (0.8%) |
| 35 to 64 Years | 37 (1.4%) | 133 (5.1%) |
| 65 to 74 Years | 5 (1.1%) | 68 (9.8%) |
| 75 Years and over | 62 (27.4%) | 60 (19.2%) |
Technology Access in Northlake
Computing Device Access in Northlake
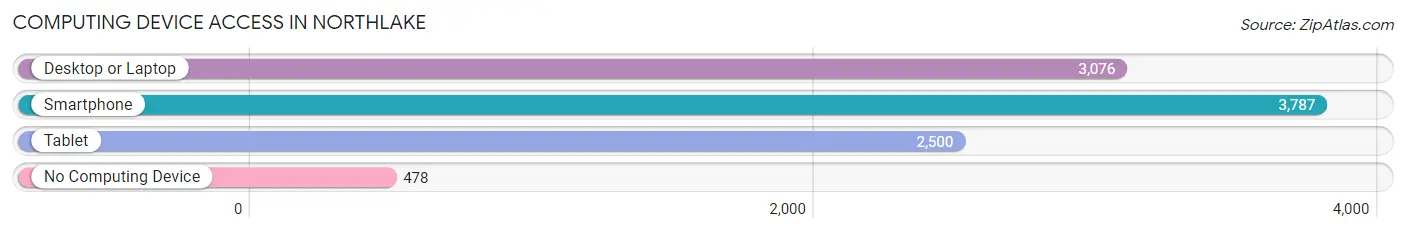
| Device Type | # Households | % Households |
| Desktop or Laptop | 3,076 | 67.8% |
| Smartphone | 3,787 | 83.4% |
| Tablet | 2,500 | 55.1% |
| No Computing Device | 478 | 10.5% |
| Total | 4,539 | 100.0% |
Internet Access in Northlake
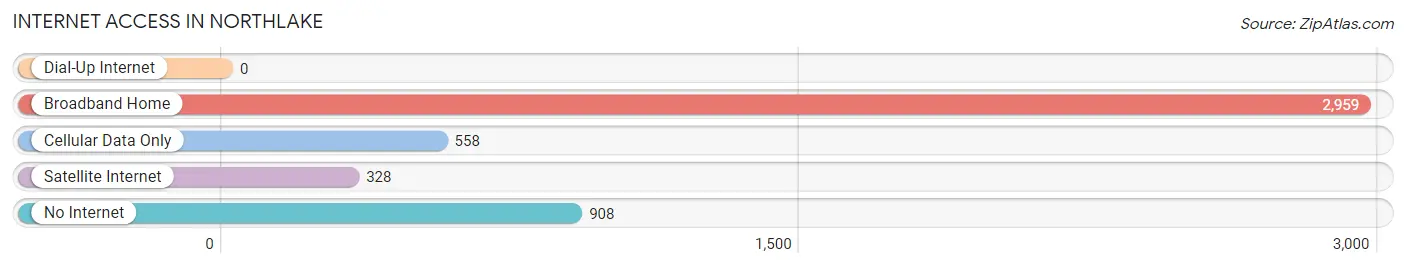
| Internet Type | # Households | % Households |
| Dial-Up Internet | 0 | 0.0% |
| Broadband Home | 2,959 | 65.2% |
| Cellular Data Only | 558 | 12.3% |
| Satellite Internet | 328 | 7.2% |
| No Internet | 908 | 20.0% |
| Total | 4,539 | 100.0% |
Northlake Summary
Lake Northlake is a village located in Cook County, Illinois, United States. It is a suburb of Chicago, located approximately 25 miles northwest of the city. The population was 12,323 at the 2010 census.
History
The area that is now Northlake was first settled in the early 1800s by German immigrants. The first settlers were the families of John and Henry Schubert, who arrived in 1835. The Schubert family built a log cabin on the banks of the Des Plaines River, which is now the site of the Northlake Public Library.
In 1845, the first post office was established in the area, and the village was officially incorporated in 1872. The village was named after the nearby lake, which was named for its northern location.
In the late 19th century, Northlake was a popular destination for Chicagoans looking to escape the city. The village was home to several resorts, including the Northlake Hotel, which was built in 1891.
Geography
Northlake is located at 41°54′17″N 87°51′17″W (41.904722, -87.854722). According to the 2010 census, Northlake has a total area of 4.7 square miles (12.2 km2), of which 4.6 square miles (11.9 km2) is land and 0.1 square miles (0.3 km2) is water.
Economy
Northlake is home to a variety of businesses, including manufacturing, retail, and service industries. The village is also home to several corporate headquarters, including the headquarters of the Northlake-based company, Northlake Industries.
The village is also home to several shopping centers, including the Northlake Mall, which is the largest shopping center in the area.
Demographics
As of the 2010 census, there were 12,323 people, 4,845 households, and 3,092 families residing in the village. The population density was 2,664.3 people per square mile (1,030.2/km2). There were 5,093 housing units at an average density of 1,097.3 per square mile (423.7/km2). The racial makeup of the village was 79.2% White, 4.2% African American, 0.3% Native American, 4.2% Asian, 0.1% Pacific Islander, 8.7% from other races, and 3.3% from two or more races. Hispanic or Latino of any race were 22.2% of the population.
There were 4,845 households, out of which 32.2% had children under the age of 18 living with them, 46.2% were married couples living together, 13.7% had a female householder with no husband present, and 33.7% were non-families. 28.2% of all households were made up of individuals, and 10.2% had someone living alone who was 65 years of age or older. The average household size was 2.53 and the average family size was 3.14.
In the village, the population was spread out, with 24.7% under the age of 18, 9.2% from 18 to 24, 32.2% from 25 to 44, 21.2% from 45 to 64, and 12.7% who were 65 years of age or older. The median age was 35 years. For every 100 females, there were 95.2 males. For every 100 females age 18 and over, there were 92.2 males.
The median income for a household in the village was $45,945, and the median income for a family was $54,945. Males had a median income of $41,945 versus $30,945 for females. The per capita income for the village was $21,945. About 6.2% of families and 8.2% of the population were below the poverty line, including 10.2% of those under age 18 and 6.2% of those age 65 or over.
Common Questions
What is Per Capita Income in Northlake?
Per Capita income in Northlake is $28,950.
What is the Median Family Income in Northlake?
Median Family Income in Northlake is $87,782.
What is the Median Household income in Northlake?
Median Household Income in Northlake is $71,767.
What is Income or Wage Gap in Northlake?
Income or Wage Gap in Northlake is 14.4%.
Women in Northlake earn 85.6 cents for every dollar earned by a man.
What is Family Income Deficit in Northlake?
Family Income Deficit in Northlake is $8,289.
Families that are below poverty line in Northlake earn $8,289 less on average than the poverty threshold level.
What is Inequality or Gini Index in Northlake?
Inequality or Gini Index in Northlake is 0.38.
What is the Total Population of Northlake?
Total Population of Northlake is 12,683.
What is the Total Male Population of Northlake?
Total Male Population of Northlake is 6,128.
What is the Total Female Population of Northlake?
Total Female Population of Northlake is 6,555.
What is the Ratio of Males per 100 Females in Northlake?
There are 93.49 Males per 100 Females in Northlake.
What is the Ratio of Females per 100 Males in Northlake?
There are 106.97 Females per 100 Males in Northlake.
What is the Median Population Age in Northlake?
Median Population Age in Northlake is 39.5 Years.
What is the Average Family Size in Northlake
Average Family Size in Northlake is 3.3 People.
What is the Average Household Size in Northlake
Average Household Size in Northlake is 2.7 People.
How Large is the Labor Force in Northlake?
There are 6,285 People in the Labor Forcein in Northlake.
What is the Percentage of People in the Labor Force in Northlake?
62.6% of People are in the Labor Force in Northlake.
What is the Unemployment Rate in Northlake?
Unemployment Rate in Northlake is 4.8%.