Chemung, IL Map & Demographics
Chemung Map
Chemung Overview
$23,880
PER CAPITA INCOME
$63,403
AVG FAMILY INCOME
$63,069
AVG HOUSEHOLD INCOME
0.15
INEQUALITY / GINI INDEX
386
TOTAL POPULATION
224
MALE POPULATION
162
FEMALE POPULATION
138.27
MALES / 100 FEMALES
72.32
FEMALES / 100 MALES
69.3
MEDIAN AGE
2.4
AVG FAMILY SIZE
2.2
AVG HOUSEHOLD SIZE
43
LABOR FORCE [ PEOPLE ]
14.1%
PERCENT IN LABOR FORCE
7.0%
UNEMPLOYMENT RATE
Income in Chemung
Income Overview in Chemung
Per Capita Income in Chemung is $23,880, while median incomes of families and households are $63,403 and $63,069 respectively.
| Characteristic | Number | Measure |
| Per Capita Income | 386 | $23,880 |
| Median Family Income | 147 | $63,403 |
| Mean Family Income | 147 | $57,975 |
| Median Household Income | 174 | $63,069 |
| Mean Household Income | 174 | $55,121 |
| Income Deficit | 147 | $0 |
| Wage / Income Gap (%) | 386 | 0.00% |
| Wage / Income Gap ($) | 386 | 100.00¢ per $1 |
| Gini / Inequality Index | 386 | 0.15 |
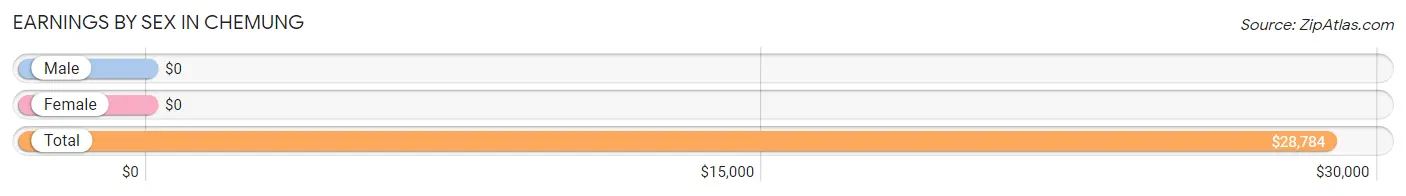
Earnings by Sex in Chemung
| Sex | Number | Average Earnings |
| Male | 33 (68.8%) | $0 |
| Female | 15 (31.2%) | $0 |
| Total | 48 (100.0%) | $28,784 |
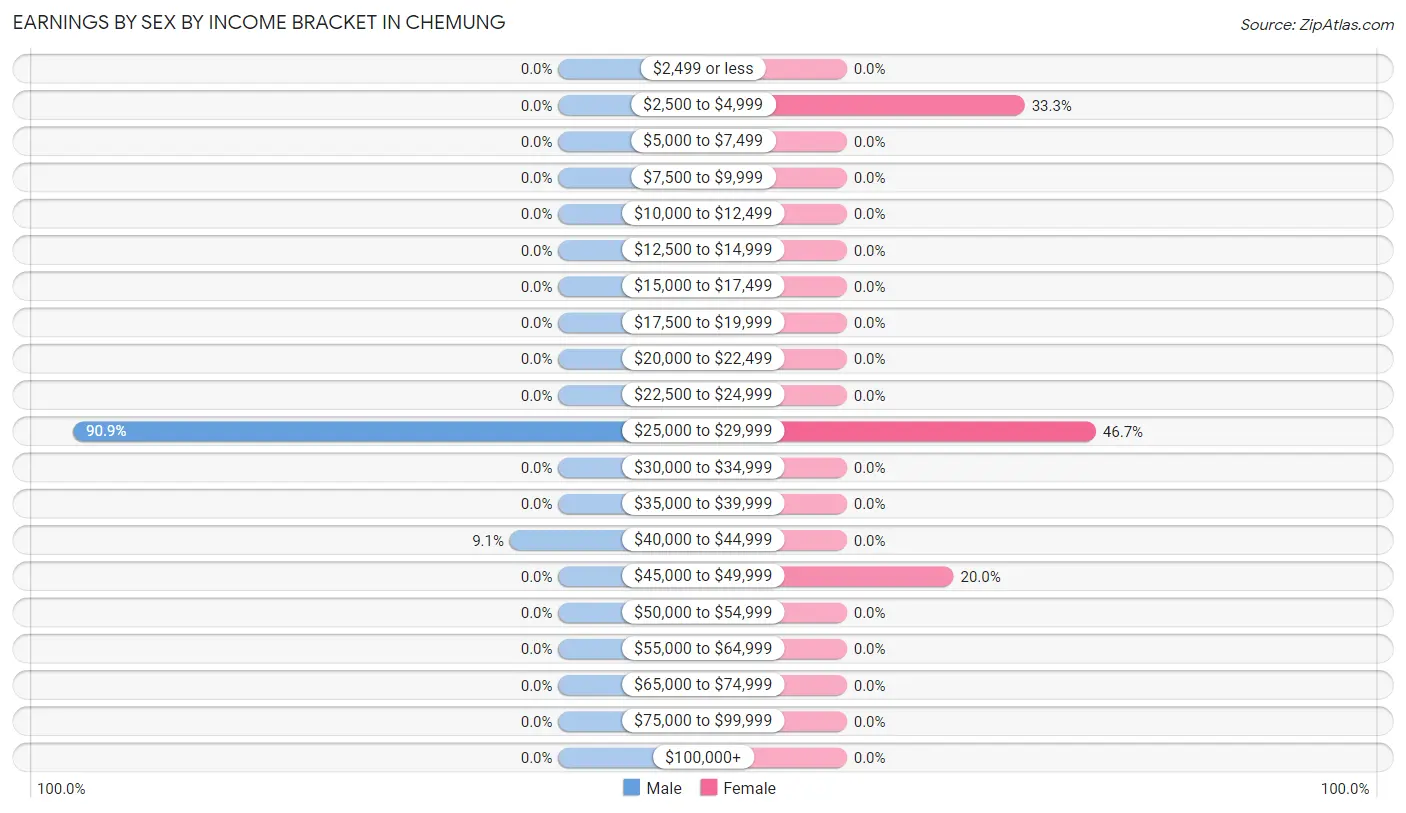
Earnings by Sex by Income Bracket in Chemung
The most common earnings brackets in Chemung are $25,000 to $29,999 for men (30 | 90.9%) and $25,000 to $29,999 for women (7 | 46.7%).
| Income | Male | Female |
| $2,499 or less | 0 (0.0%) | 0 (0.0%) |
| $2,500 to $4,999 | 0 (0.0%) | 5 (33.3%) |
| $5,000 to $7,499 | 0 (0.0%) | 0 (0.0%) |
| $7,500 to $9,999 | 0 (0.0%) | 0 (0.0%) |
| $10,000 to $12,499 | 0 (0.0%) | 0 (0.0%) |
| $12,500 to $14,999 | 0 (0.0%) | 0 (0.0%) |
| $15,000 to $17,499 | 0 (0.0%) | 0 (0.0%) |
| $17,500 to $19,999 | 0 (0.0%) | 0 (0.0%) |
| $20,000 to $22,499 | 0 (0.0%) | 0 (0.0%) |
| $22,500 to $24,999 | 0 (0.0%) | 0 (0.0%) |
| $25,000 to $29,999 | 30 (90.9%) | 7 (46.7%) |
| $30,000 to $34,999 | 0 (0.0%) | 0 (0.0%) |
| $35,000 to $39,999 | 0 (0.0%) | 0 (0.0%) |
| $40,000 to $44,999 | 3 (9.1%) | 0 (0.0%) |
| $45,000 to $49,999 | 0 (0.0%) | 3 (20.0%) |
| $50,000 to $54,999 | 0 (0.0%) | 0 (0.0%) |
| $55,000 to $64,999 | 0 (0.0%) | 0 (0.0%) |
| $65,000 to $74,999 | 0 (0.0%) | 0 (0.0%) |
| $75,000 to $99,999 | 0 (0.0%) | 0 (0.0%) |
| $100,000+ | 0 (0.0%) | 0 (0.0%) |
| Total | 33 (100.0%) | 15 (100.0%) |
Earnings by Sex by Educational Attainment in Chemung
| Educational Attainment | Male Income | Female Income |
| Less than High School | - | - |
| High School Diploma | - | - |
| College or Associate's Degree | - | - |
| Bachelor's Degree | - | - |
| Graduate Degree | - | - |
| Total | - | - |
Family Income in Chemung
Family Income Brackets in Chemung
According to the Chemung family income data, there are 101 families falling into the $50,000 to $74,999 income range, which is the most common income bracket and makes up 68.7% of all families.
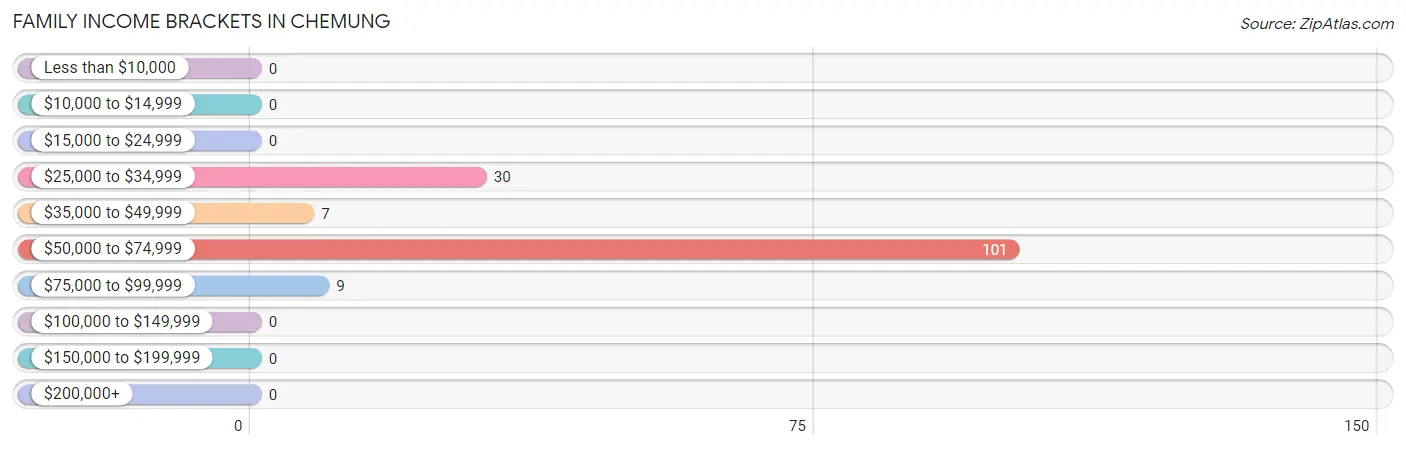
| Income Bracket | # Families | % Families |
| Less than $10,000 | 0 | 0.0% |
| $10,000 to $14,999 | 0 | 0.0% |
| $15,000 to $24,999 | 0 | 0.0% |
| $25,000 to $34,999 | 30 | 20.4% |
| $35,000 to $49,999 | 7 | 4.8% |
| $50,000 to $74,999 | 101 | 68.7% |
| $75,000 to $99,999 | 9 | 6.1% |
| $100,000 to $149,999 | 0 | 0.0% |
| $150,000 to $199,999 | 0 | 0.0% |
| $200,000+ | 0 | 0.0% |
Family Income by Famaliy Size in Chemung
2-person families (117 | 79.6%) account for the highest median family income in Chemung with $63,775 per family, while 2-person families (117 | 79.6%) have the highest median income of $31,888 per family member.
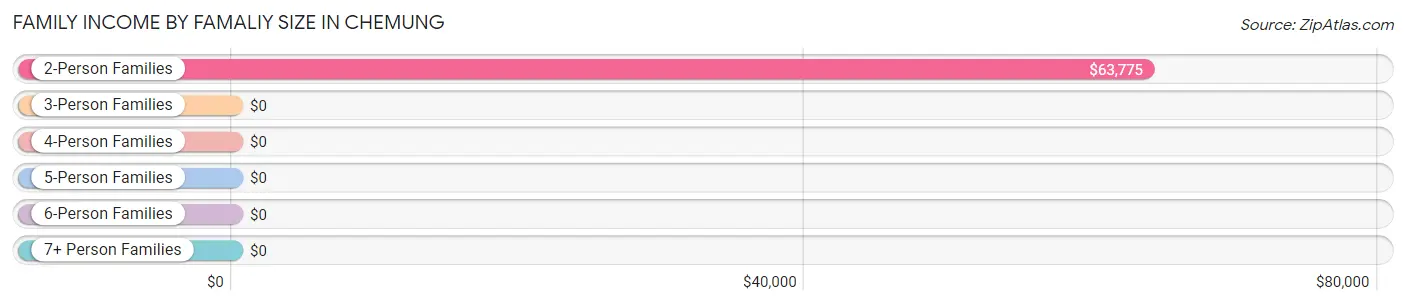
| Income Bracket | # Families | Median Income |
| 2-Person Families | 117 (79.6%) | $63,775 |
| 3-Person Families | 0 (0.0%) | $0 |
| 4-Person Families | 0 (0.0%) | $0 |
| 5-Person Families | 30 (20.4%) | $0 |
| 6-Person Families | 0 (0.0%) | $0 |
| 7+ Person Families | 0 (0.0%) | $0 |
| Total | 147 (100.0%) | $63,403 |
Family Income by Number of Earners in Chemung
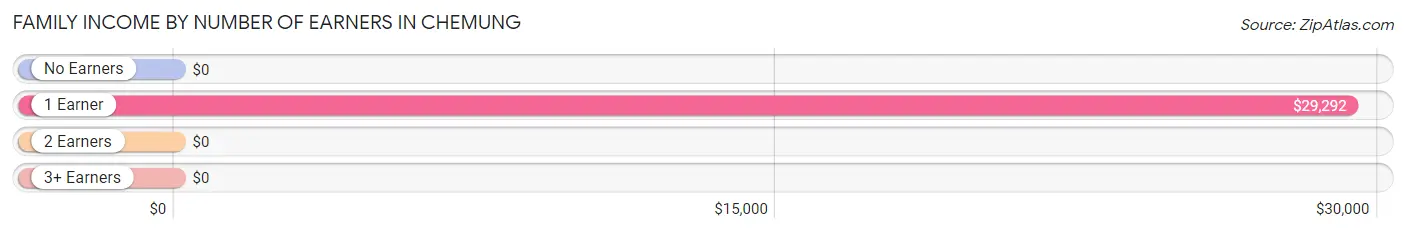
| Number of Earners | # Families | Median Income |
| No Earners | 101 (68.7%) | $0 |
| 1 Earner | 43 (29.2%) | $29,292 |
| 2 Earners | 3 (2.0%) | $0 |
| 3+ Earners | 0 (0.0%) | $0 |
| Total | 147 (100.0%) | $63,403 |
Household Income in Chemung
Household Income Brackets in Chemung
With 112 households falling in the category, the $50,000 to $74,999 income range is the most frequent in Chemung, accounting for 64.4% of all households.
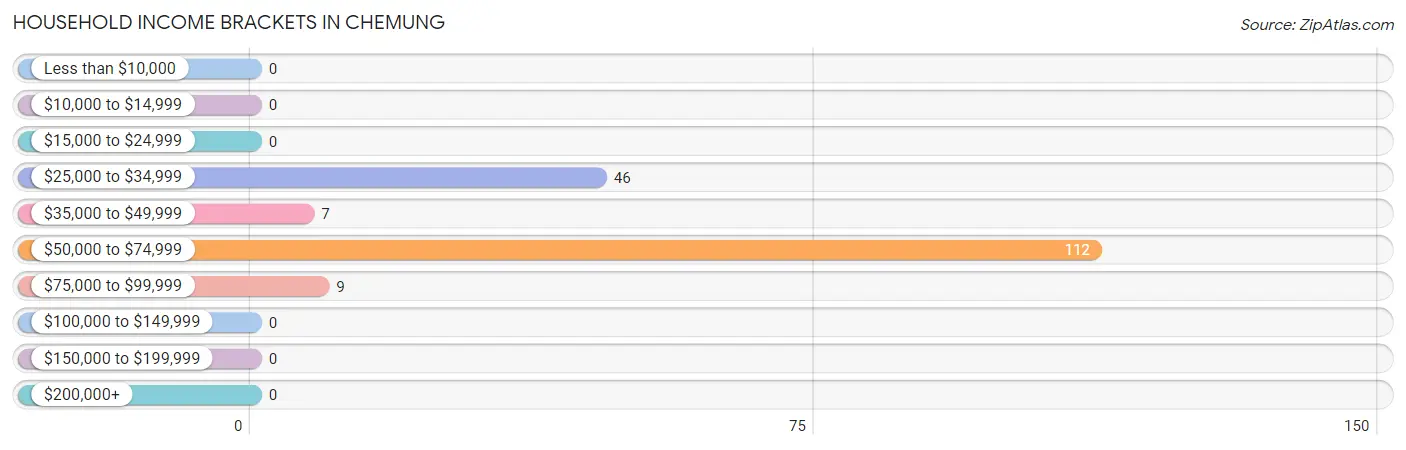
| Income Bracket | # Households | % Households |
| Less than $10,000 | 0 | 0.0% |
| $10,000 to $14,999 | 0 | 0.0% |
| $15,000 to $24,999 | 0 | 0.0% |
| $25,000 to $34,999 | 46 | 26.4% |
| $35,000 to $49,999 | 7 | 4.0% |
| $50,000 to $74,999 | 112 | 64.4% |
| $75,000 to $99,999 | 9 | 5.2% |
| $100,000 to $149,999 | 0 | 0.0% |
| $150,000 to $199,999 | 0 | 0.0% |
| $200,000+ | 0 | 0.0% |
Household Income by Householder Age in Chemung
The median household income in Chemung is $63,069, with the highest median household income of $63,626 found in the 65+ years age bracket for the primary householder. A total of 123 households (70.7%) fall into this category.
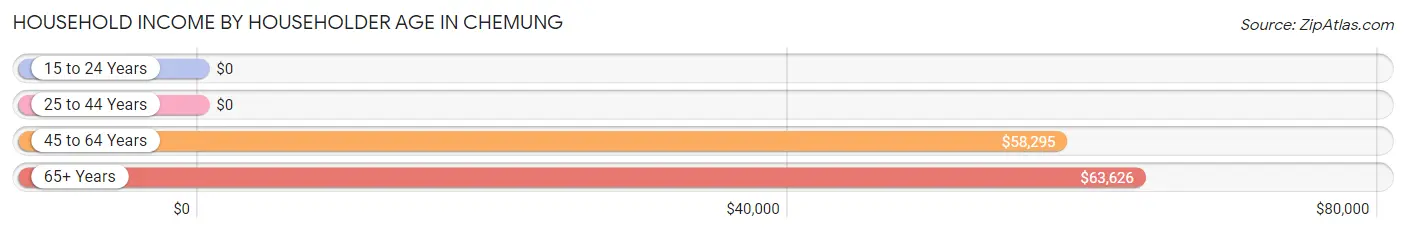
| Income Bracket | # Households | Median Income |
| 15 to 24 Years | 0 (0.0%) | $0 |
| 25 to 44 Years | 30 (17.2%) | $0 |
| 45 to 64 Years | 21 (12.1%) | $58,295 |
| 65+ Years | 123 (70.7%) | $63,626 |
| Total | 174 (100.0%) | $63,069 |
Poverty in Chemung
Income Below Poverty by Sex and Age in Chemung
With 36.2% poverty level for males and 35.8% for females among the residents of Chemung, 12 to 14 year old males and 5 year old females are the most vulnerable to poverty, with 51 males (100.0%) and 29 females (100.0%) in their respective age groups living below the poverty level.
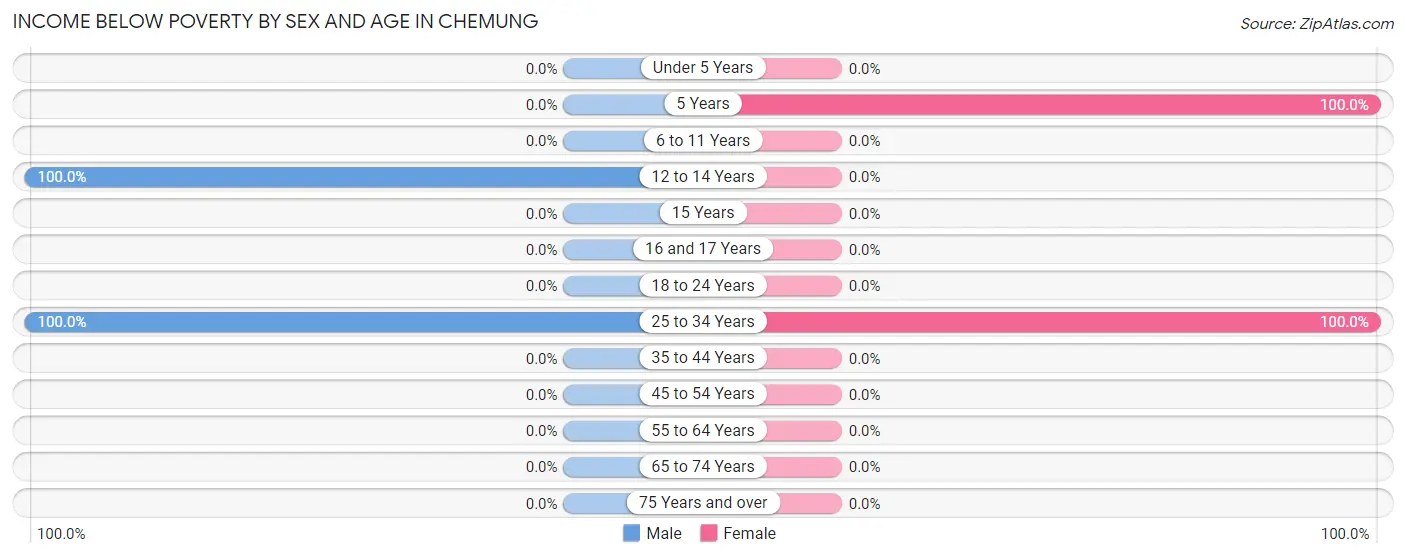
| Age Bracket | Male | Female |
| Under 5 Years | 0 (0.0%) | 0 (0.0%) |
| 5 Years | 0 (0.0%) | 29 (100.0%) |
| 6 to 11 Years | 0 (0.0%) | 0 (0.0%) |
| 12 to 14 Years | 51 (100.0%) | 0 (0.0%) |
| 15 Years | 0 (0.0%) | 0 (0.0%) |
| 16 and 17 Years | 0 (0.0%) | 0 (0.0%) |
| 18 to 24 Years | 0 (0.0%) | 0 (0.0%) |
| 25 to 34 Years | 30 (100.0%) | 29 (100.0%) |
| 35 to 44 Years | 0 (0.0%) | 0 (0.0%) |
| 45 to 54 Years | 0 (0.0%) | 0 (0.0%) |
| 55 to 64 Years | 0 (0.0%) | 0 (0.0%) |
| 65 to 74 Years | 0 (0.0%) | 0 (0.0%) |
| 75 Years and over | 0 (0.0%) | 0 (0.0%) |
| Total | 81 (36.2%) | 58 (35.8%) |
Income Above Poverty by Sex and Age in Chemung
According to the poverty statistics in Chemung, males aged 55 to 64 years and females aged 55 to 64 years are the age groups that are most secure financially, with 100.0% of males and 100.0% of females in these age groups living above the poverty line.
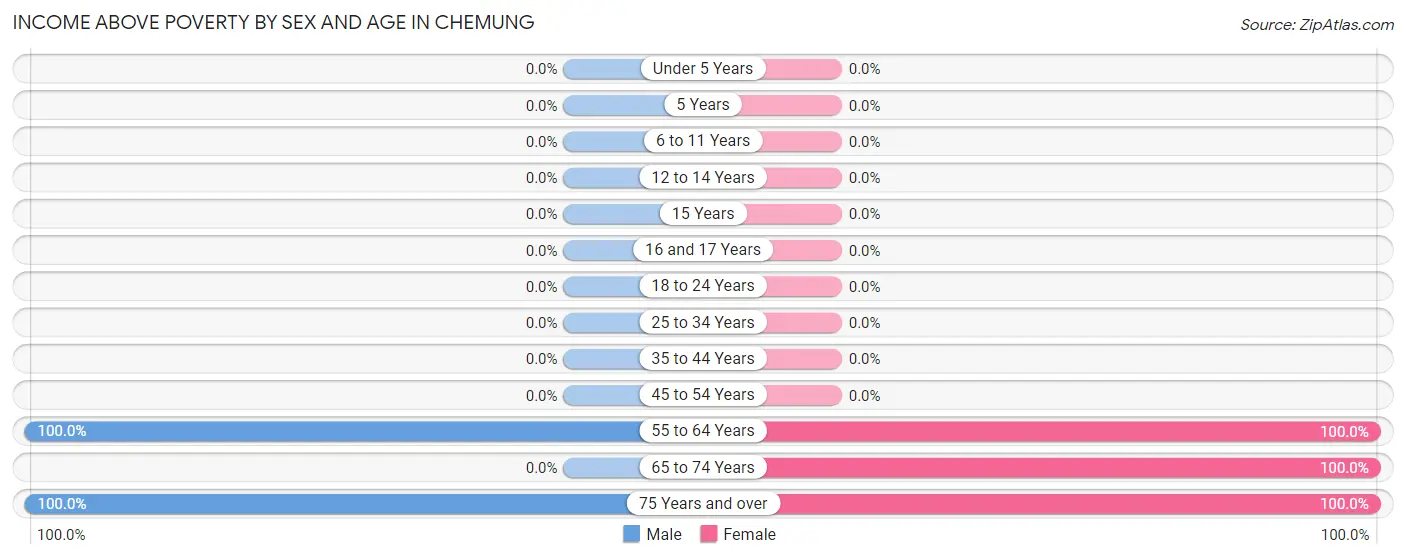
| Age Bracket | Male | Female |
| Under 5 Years | 0 (0.0%) | 0 (0.0%) |
| 5 Years | 0 (0.0%) | 0 (0.0%) |
| 6 to 11 Years | 0 (0.0%) | 0 (0.0%) |
| 12 to 14 Years | 0 (0.0%) | 0 (0.0%) |
| 15 Years | 0 (0.0%) | 0 (0.0%) |
| 16 and 17 Years | 0 (0.0%) | 0 (0.0%) |
| 18 to 24 Years | 0 (0.0%) | 0 (0.0%) |
| 25 to 34 Years | 0 (0.0%) | 0 (0.0%) |
| 35 to 44 Years | 0 (0.0%) | 0 (0.0%) |
| 45 to 54 Years | 0 (0.0%) | 0 (0.0%) |
| 55 to 64 Years | 20 (100.0%) | 10 (100.0%) |
| 65 to 74 Years | 0 (0.0%) | 89 (100.0%) |
| 75 Years and over | 123 (100.0%) | 5 (100.0%) |
| Total | 143 (63.8%) | 104 (64.2%) |
Income Below Poverty Among Married-Couple Families in Chemung
The poverty statistics for married-couple families in Chemung show that 20.4% or 30 of the total 147 families live below the poverty line. Families with 3 or 4 children have the highest poverty rate of 100.0%, comprising of 30 families. On the other hand, families with no children have the lowest poverty rate of 0.0%, which includes 0 families.
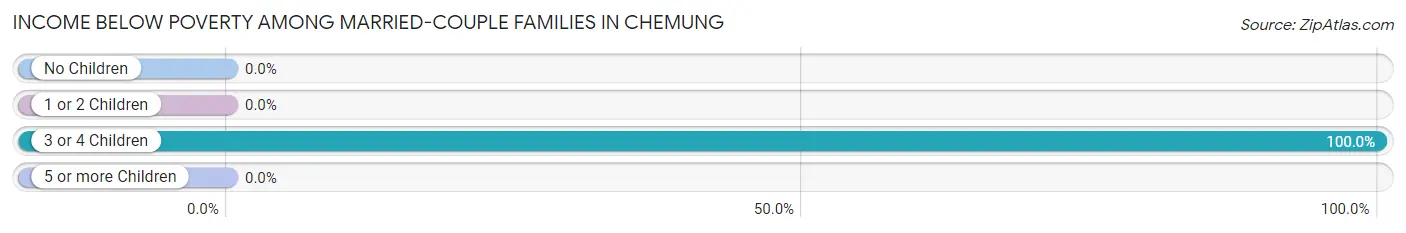
| Children | Above Poverty | Below Poverty |
| No Children | 117 (100.0%) | 0 (0.0%) |
| 1 or 2 Children | 0 (0.0%) | 0 (0.0%) |
| 3 or 4 Children | 0 (0.0%) | 30 (100.0%) |
| 5 or more Children | 0 (0.0%) | 0 (0.0%) |
| Total | 117 (79.6%) | 30 (20.4%) |
Income Below Poverty Among Single-Parent Households in Chemung
| Children | Single Father | Single Mother |
| No Children | 0 (0.0%) | 0 (0.0%) |
| 1 or 2 Children | 0 (0.0%) | 0 (0.0%) |
| 3 or 4 Children | 0 (0.0%) | 0 (0.0%) |
| 5 or more Children | 0 (0.0%) | 0 (0.0%) |
| Total | 0 (0.0%) | 0 (0.0%) |
Income Below Poverty Among Married-Couple vs Single-Parent Households in Chemung
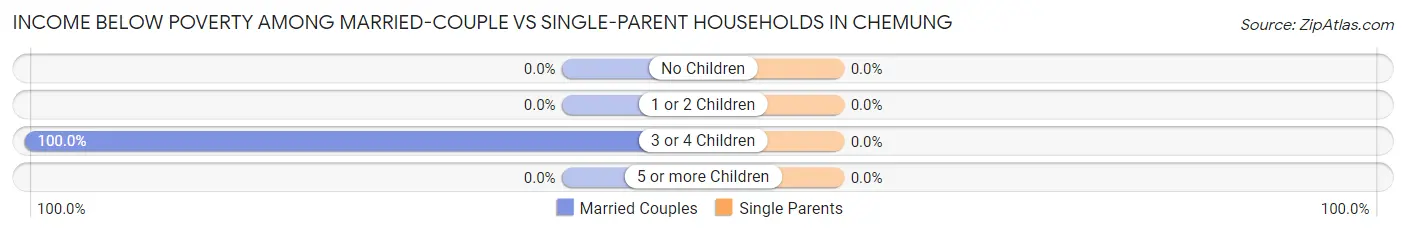
| Children | Married-Couple Families | Single-Parent Households |
| No Children | 0 (0.0%) | 0 (0.0%) |
| 1 or 2 Children | 0 (0.0%) | 0 (0.0%) |
| 3 or 4 Children | 30 (100.0%) | 0 (0.0%) |
| 5 or more Children | 0 (0.0%) | 0 (0.0%) |
| Total | 30 (20.4%) | 0 (0.0%) |
Race in Chemung
The most populous races in Chemung are White / Caucasian (386 | 100.0%), and Hispanic or Latino (139 | 36.0%).
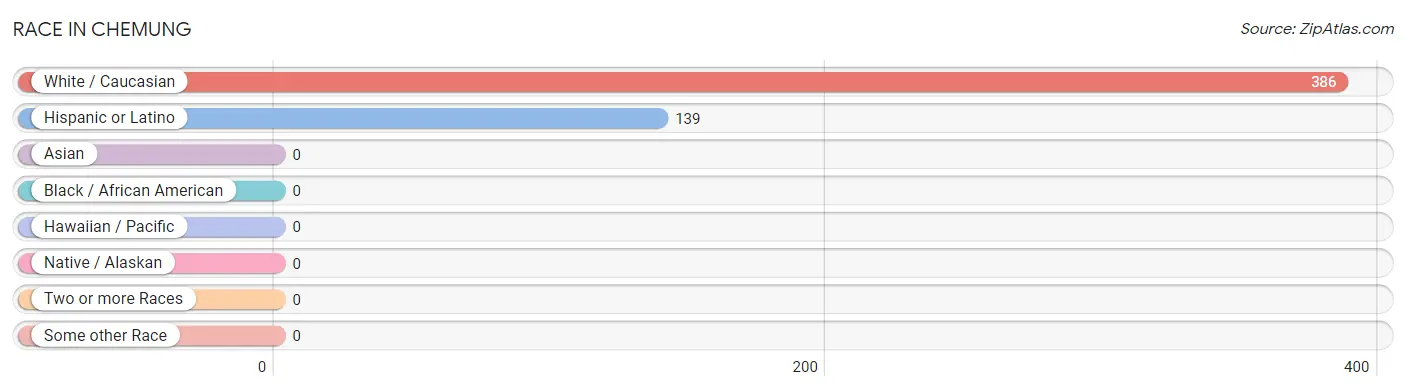
| Race | # Population | % Population |
| Asian | 0 | 0.0% |
| Black / African American | 0 | 0.0% |
| Hawaiian / Pacific | 0 | 0.0% |
| Hispanic or Latino | 139 | 36.0% |
| Native / Alaskan | 0 | 0.0% |
| White / Caucasian | 386 | 100.0% |
| Two or more Races | 0 | 0.0% |
| Some other Race | 0 | 0.0% |
| Total | 386 | 100.0% |
Ancestry in Chemung
The most populous ancestries reported in Chemung are Irish (204 | 52.8%), Mexican (139 | 36.0%), Swiss (101 | 26.2%), English (27 | 7.0%), and German (20 | 5.2%), together accounting for 127.2% of all Chemung residents.
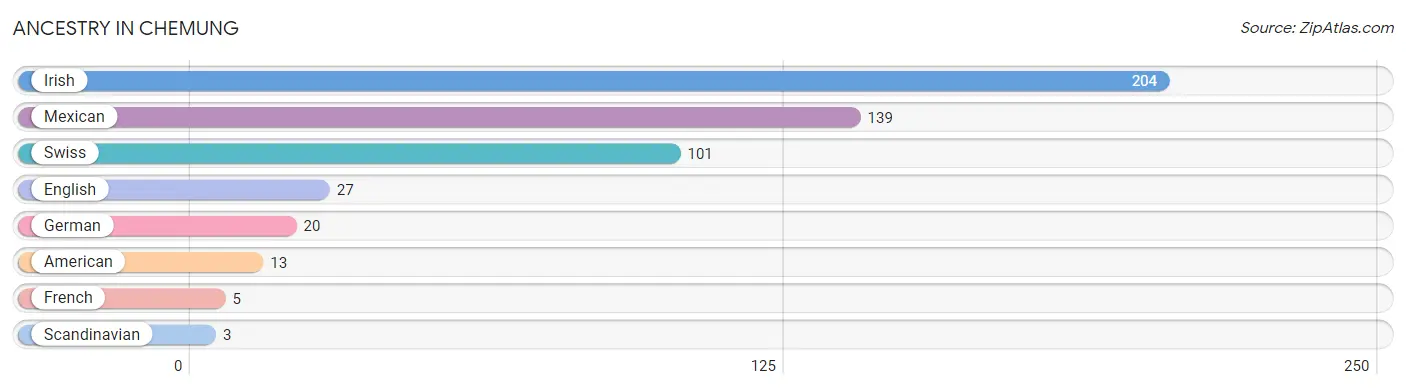
| Ancestry | # Population | % Population |
| American | 13 | 3.4% |
| English | 27 | 7.0% |
| French | 5 | 1.3% |
| German | 20 | 5.2% |
| Irish | 204 | 52.8% |
| Mexican | 139 | 36.0% |
| Scandinavian | 3 | 0.8% |
| Swiss | 101 | 26.2% | View All 8 Rows |
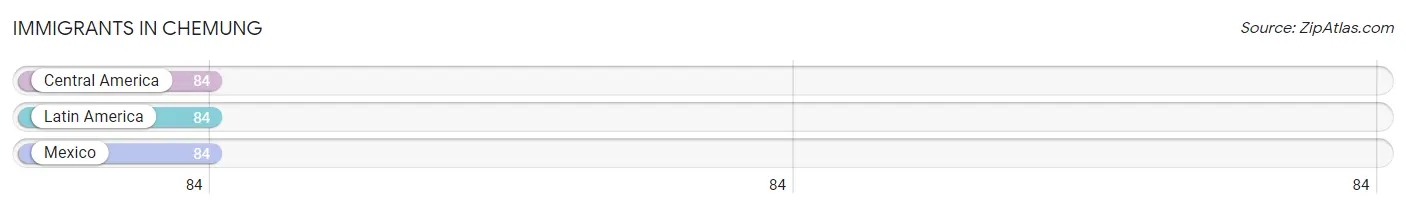
Immigrants in Chemung
The most numerous immigrant groups reported in Chemung came from Central America (84 | 21.8%), Latin America (84 | 21.8%), and Mexico (84 | 21.8%), together accounting for 65.3% of all Chemung residents.
| Immigration Origin | # Population | % Population |
| Central America | 84 | 21.8% |
| Latin America | 84 | 21.8% |
| Mexico | 84 | 21.8% | View All 3 Rows |
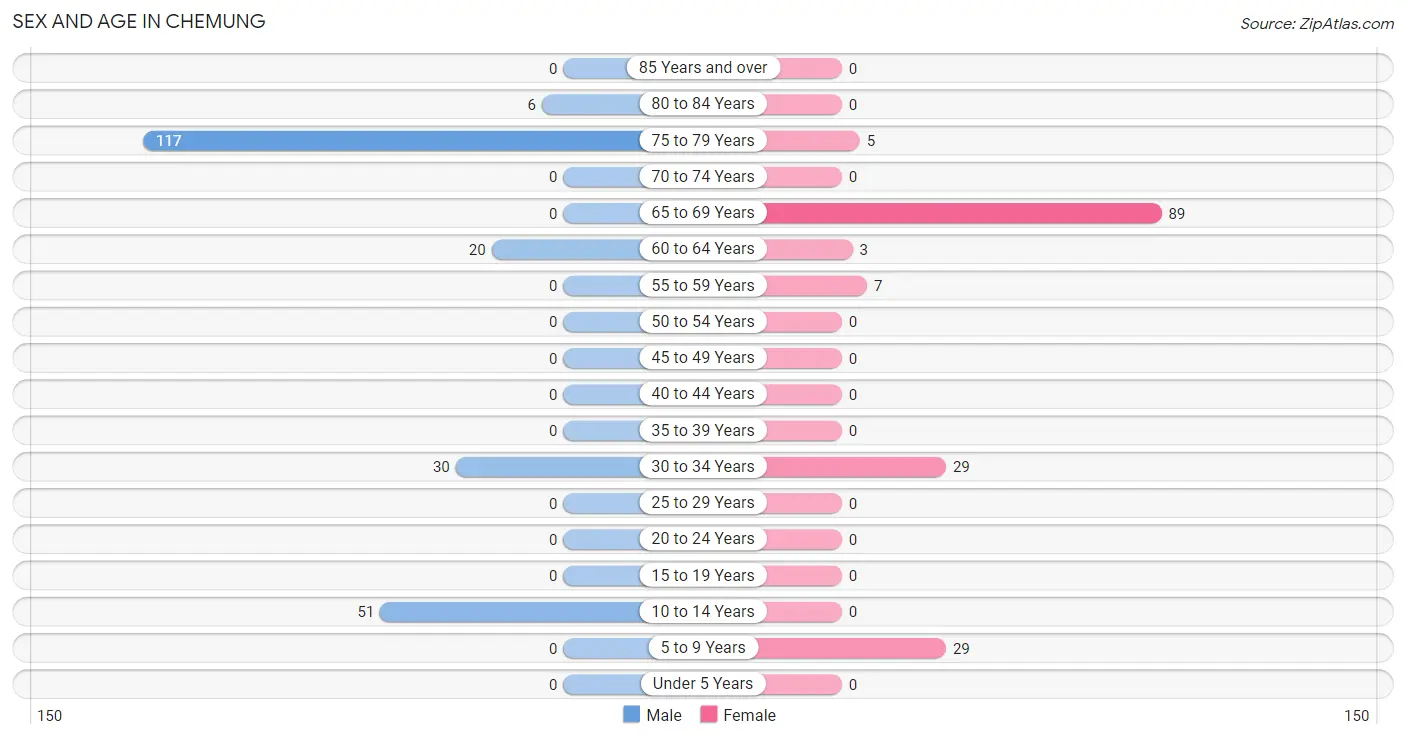
Sex and Age in Chemung
Sex and Age in Chemung
The most populous age groups in Chemung are 75 to 79 Years (117 | 52.2%) for men and 65 to 69 Years (89 | 54.9%) for women.
| Age Bracket | Male | Female |
| Under 5 Years | 0 (0.0%) | 0 (0.0%) |
| 5 to 9 Years | 0 (0.0%) | 29 (17.9%) |
| 10 to 14 Years | 51 (22.8%) | 0 (0.0%) |
| 15 to 19 Years | 0 (0.0%) | 0 (0.0%) |
| 20 to 24 Years | 0 (0.0%) | 0 (0.0%) |
| 25 to 29 Years | 0 (0.0%) | 0 (0.0%) |
| 30 to 34 Years | 30 (13.4%) | 29 (17.9%) |
| 35 to 39 Years | 0 (0.0%) | 0 (0.0%) |
| 40 to 44 Years | 0 (0.0%) | 0 (0.0%) |
| 45 to 49 Years | 0 (0.0%) | 0 (0.0%) |
| 50 to 54 Years | 0 (0.0%) | 0 (0.0%) |
| 55 to 59 Years | 0 (0.0%) | 7 (4.3%) |
| 60 to 64 Years | 20 (8.9%) | 3 (1.8%) |
| 65 to 69 Years | 0 (0.0%) | 89 (54.9%) |
| 70 to 74 Years | 0 (0.0%) | 0 (0.0%) |
| 75 to 79 Years | 117 (52.2%) | 5 (3.1%) |
| 80 to 84 Years | 6 (2.7%) | 0 (0.0%) |
| 85 Years and over | 0 (0.0%) | 0 (0.0%) |
| Total | 224 (100.0%) | 162 (100.0%) |
Families and Households in Chemung
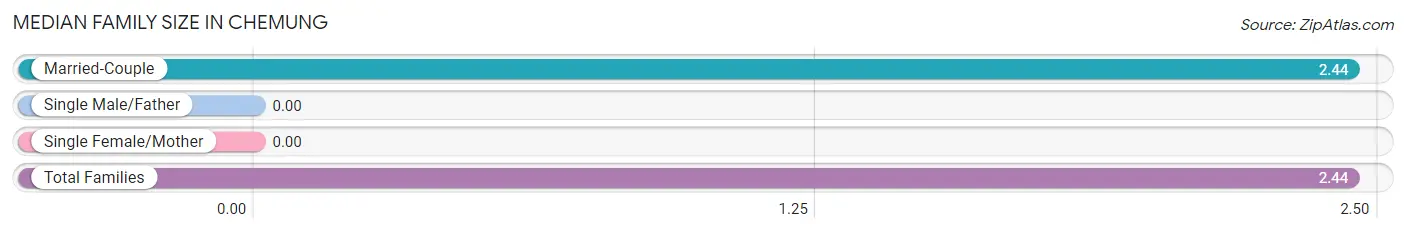
Median Family Size in Chemung
| Family Type | # Families | Family Size |
| Married-Couple | 147 (100.0%) | 2.44 |
| Single Male/Father | 0 (0.0%) | - |
| Single Female/Mother | 0 (0.0%) | - |
| Total Families | 147 (100.0%) | 2.44 |
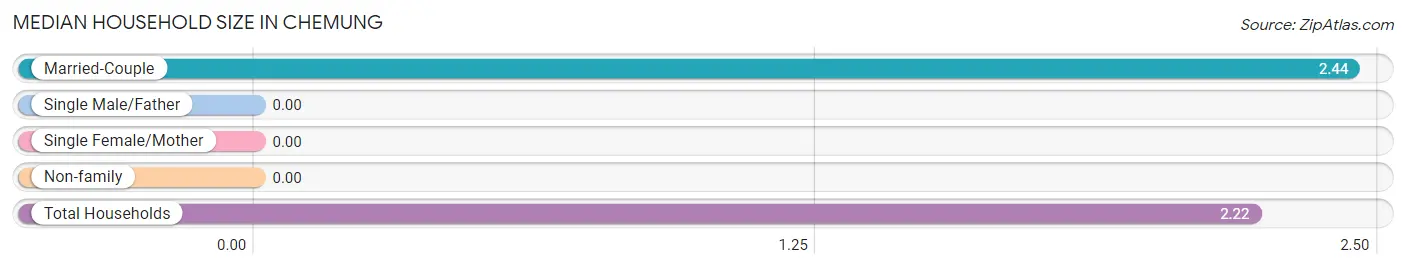
Median Household Size in Chemung
| Household Type | # Households | Household Size |
| Married-Couple | 147 (84.5%) | 2.44 |
| Single Male/Father | 0 (0.0%) | - |
| Single Female/Mother | 0 (0.0%) | - |
| Non-family | 27 (15.5%) | - |
| Total Households | 174 (100.0%) | 2.22 |
Household Size by Marriage Status in Chemung
Out of a total of 174 households in Chemung, 147 (84.5%) are family households, while 27 (15.5%) are nonfamily households. The most numerous type of family households are 2-person households, comprising 117, and the most common type of nonfamily households are 1-person households, comprising 27.
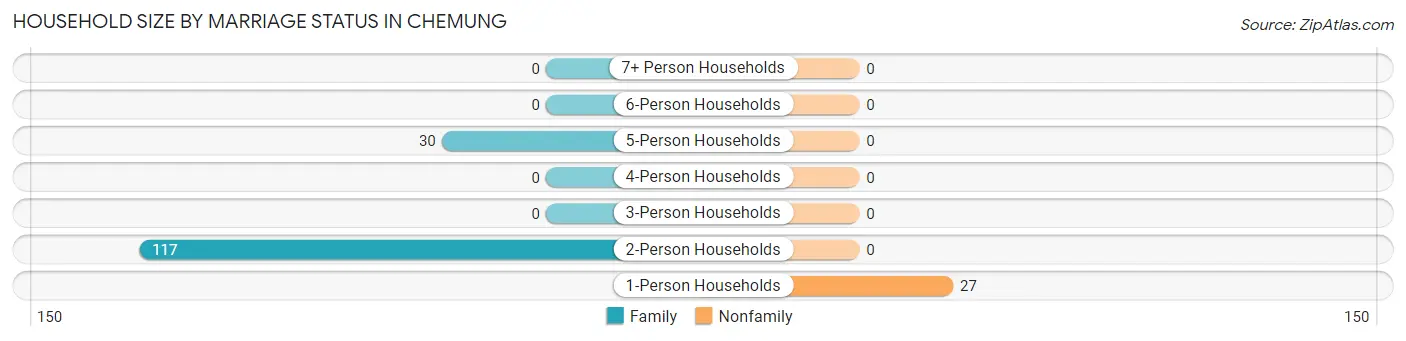
| Household Size | Family Households | Nonfamily Households |
| 1-Person Households | - | 27 (15.5%) |
| 2-Person Households | 117 (67.2%) | 0 (0.0%) |
| 3-Person Households | 0 (0.0%) | 0 (0.0%) |
| 4-Person Households | 0 (0.0%) | 0 (0.0%) |
| 5-Person Households | 30 (17.2%) | 0 (0.0%) |
| 6-Person Households | 0 (0.0%) | 0 (0.0%) |
| 7+ Person Households | 0 (0.0%) | 0 (0.0%) |
| Total | 147 (84.5%) | 27 (15.5%) |
Female Fertility in Chemung
Fertility by Age in Chemung
| Age Bracket | Women with Births | Births / 1,000 Women |
| 15 to 19 years | 0 (0.0%) | 0.0 |
| 20 to 34 years | 0 (0.0%) | 0.0 |
| 35 to 50 years | 0 (0.0%) | 0.0 |
| Total | 0 (0.0%) | 0.0 |
Fertility by Age by Marriage Status in Chemung
| Age Bracket | Married | Unmarried |
| 15 to 19 years | 0 (0.0%) | 0 (0.0%) |
| 20 to 34 years | 0 (0.0%) | 0 (0.0%) |
| 35 to 50 years | 0 (0.0%) | 0 (0.0%) |
| Total | 0 (0.0%) | 0 (0.0%) |
Fertility by Education in Chemung
| Educational Attainment | Women with Births | Births / 1,000 Women |
| Less than High School | 0 (0.0%) | 0.0 |
| High School Diploma | 0 (0.0%) | 0.0 |
| College or Associate's Degree | 0 (0.0%) | 0.0 |
| Bachelor's Degree | 0 (0.0%) | 0.0 |
| Graduate Degree | 0 (0.0%) | 0.0 |
| Total | 0 (0.0%) | 0.0 |
Fertility by Education by Marriage Status in Chemung
| Educational Attainment | Married | Unmarried |
| Less than High School | 0 (0.0%) | 0 (0.0%) |
| High School Diploma | 0 (0.0%) | 0 (0.0%) |
| College or Associate's Degree | 0 (0.0%) | 0 (0.0%) |
| Bachelor's Degree | 0 (0.0%) | 0 (0.0%) |
| Graduate Degree | 0 (0.0%) | 0 (0.0%) |
| Total | 0 (0.0%) | 0 (0.0%) |
Employment Characteristics in Chemung
Employment by Class of Employer in Chemung
Among the 40 employed individuals in Chemung, self-employed (incorporated) (30 | 75.0%), private company employees (7 | 17.5%), and local government employees (3 | 7.5%) make up the most common classes of employment.
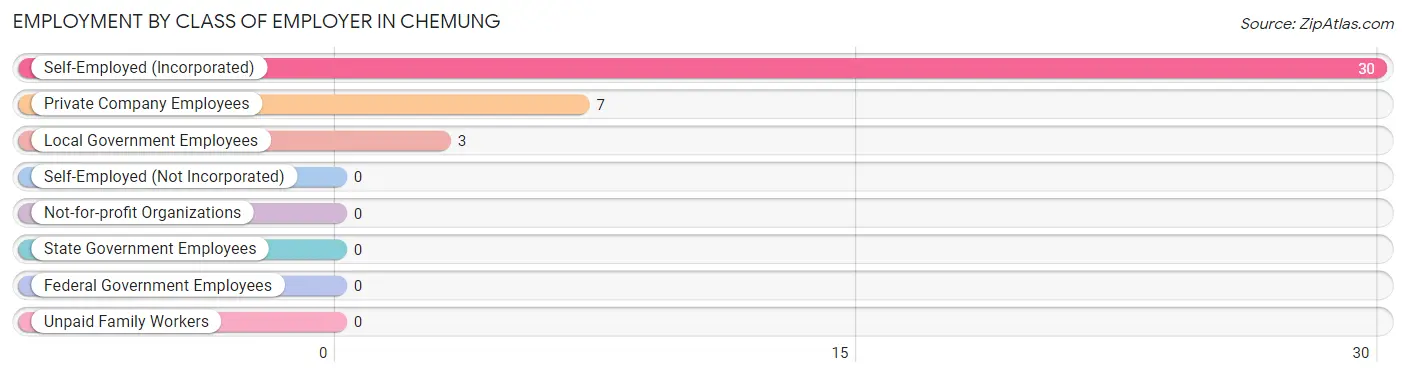
| Employer Class | # Employees | % Employees |
| Private Company Employees | 7 | 17.5% |
| Self-Employed (Incorporated) | 30 | 75.0% |
| Self-Employed (Not Incorporated) | 0 | 0.0% |
| Not-for-profit Organizations | 0 | 0.0% |
| Local Government Employees | 3 | 7.5% |
| State Government Employees | 0 | 0.0% |
| Federal Government Employees | 0 | 0.0% |
| Unpaid Family Workers | 0 | 0.0% |
| Total | 40 | 100.0% |
Employment Status by Age in Chemung
According to the labor force statistics for Chemung, out of the total population over 16 years of age (306), 14.1% or 43 individuals are in the labor force, with 7.0% or 3 of them unemployed. The age group with the highest labor force participation rate is 55 to 59 years, with 100.0% or 7 individuals in the labor force. Within the labor force, the 60 to 64 years age range has the highest percentage of unemployed individuals, with 50.0% or 3 of them being unemployed.
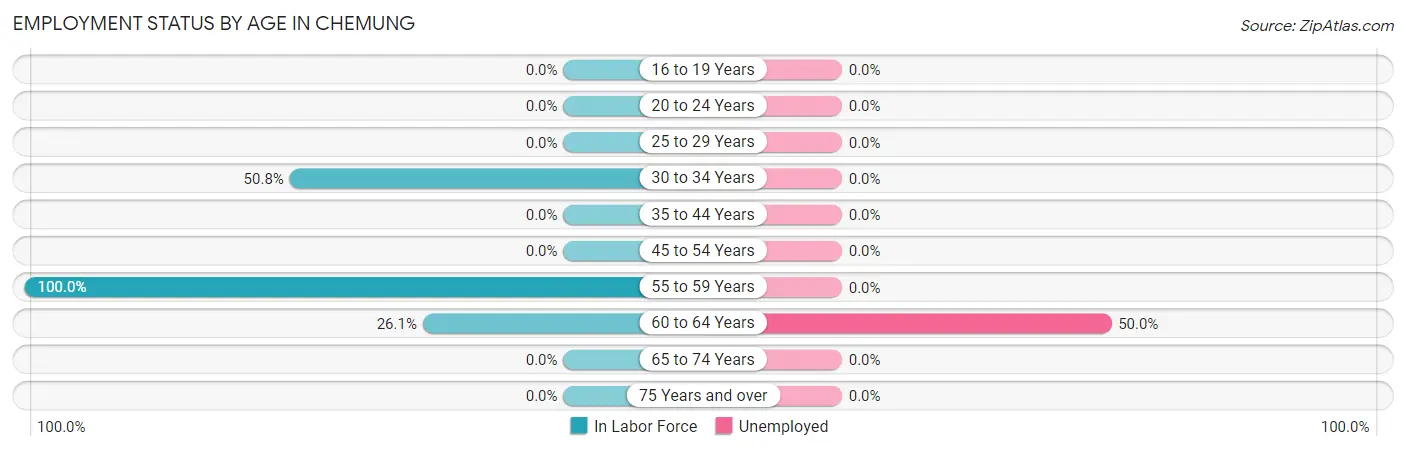
| Age Bracket | In Labor Force | Unemployed |
| 16 to 19 Years | 0 (0.0%) | 0 (0.0%) |
| 20 to 24 Years | 0 (0.0%) | 0 (0.0%) |
| 25 to 29 Years | 0 (0.0%) | 0 (0.0%) |
| 30 to 34 Years | 30 (50.8%) | 0 (0.0%) |
| 35 to 44 Years | 0 (0.0%) | 0 (0.0%) |
| 45 to 54 Years | 0 (0.0%) | 0 (0.0%) |
| 55 to 59 Years | 7 (100.0%) | 0 (0.0%) |
| 60 to 64 Years | 6 (26.1%) | 3 (50.0%) |
| 65 to 74 Years | 0 (0.0%) | 0 (0.0%) |
| 75 Years and over | 0 (0.0%) | 0 (0.0%) |
| Total | 43 (14.1%) | 3 (7.0%) |
Employment Status by Educational Attainment in Chemung
According to labor force statistics for Chemung, 48.3% of individuals (43) out of the total population between 25 and 64 years of age (89) are in the labor force, with 7.0% or 3 of them being unemployed. The group with the highest labor force participation rate are those with the educational attainment of bachelor's degree or higher, with 100.0% or 3 individuals in the labor force. Within the labor force, individuals with bachelor's degree or higher education have the highest percentage of unemployment, with 100.0% or 3 of them being unemployed.
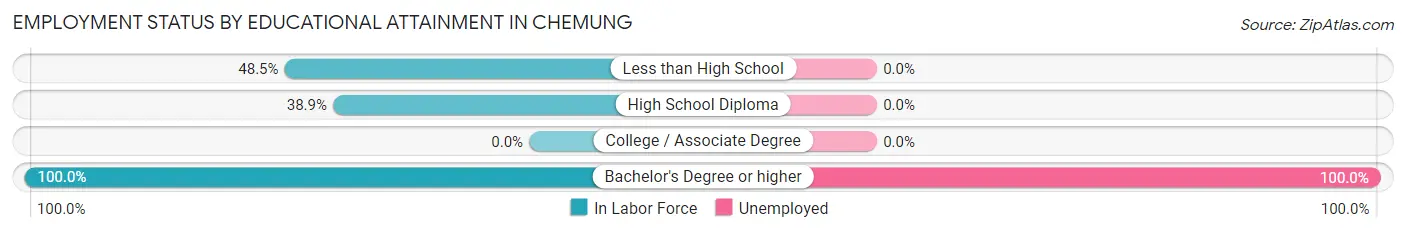
| Educational Attainment | In Labor Force | Unemployed |
| Less than High School | 33 (48.5%) | 0 (0.0%) |
| High School Diploma | 7 (38.9%) | 0 (0.0%) |
| College / Associate Degree | 0 (0.0%) | 0 (0.0%) |
| Bachelor's Degree or higher | 3 (100.0%) | 3 (100.0%) |
| Total | 43 (48.3%) | 6 (7.0%) |
Employment Occupations by Sex in Chemung
Management, Business, Science and Arts Occupations
Management, Business, Science and Arts Occupations by Sex
| Occupation | Male | Female |
| Management | 0 (0.0%) | 0 (0.0%) |
| Business & Financial | 0 (0.0%) | 0 (0.0%) |
| Computers, Engineering & Science | 0 (0.0%) | 0 (0.0%) |
| Computers & Mathematics | 0 (0.0%) | 0 (0.0%) |
| Architecture & Engineering | 0 (0.0%) | 0 (0.0%) |
| Life, Physical & Social Science | 0 (0.0%) | 0 (0.0%) |
| Community & Social Service | 0 (0.0%) | 0 (0.0%) |
| Education, Arts & Media | 0 (0.0%) | 0 (0.0%) |
| Legal Services & Support | 0 (0.0%) | 0 (0.0%) |
| Education Instruction & Library | 0 (0.0%) | 0 (0.0%) |
| Arts, Media & Entertainment | 0 (0.0%) | 0 (0.0%) |
| Health Diagnosing & Treating | 0 (0.0%) | 0 (0.0%) |
| Health Technologists | 0 (0.0%) | 0 (0.0%) |
| Total (Category) | 0 (0.0%) | 0 (0.0%) |
| Total (Overall) | 33 (82.5%) | 7 (17.5%) |
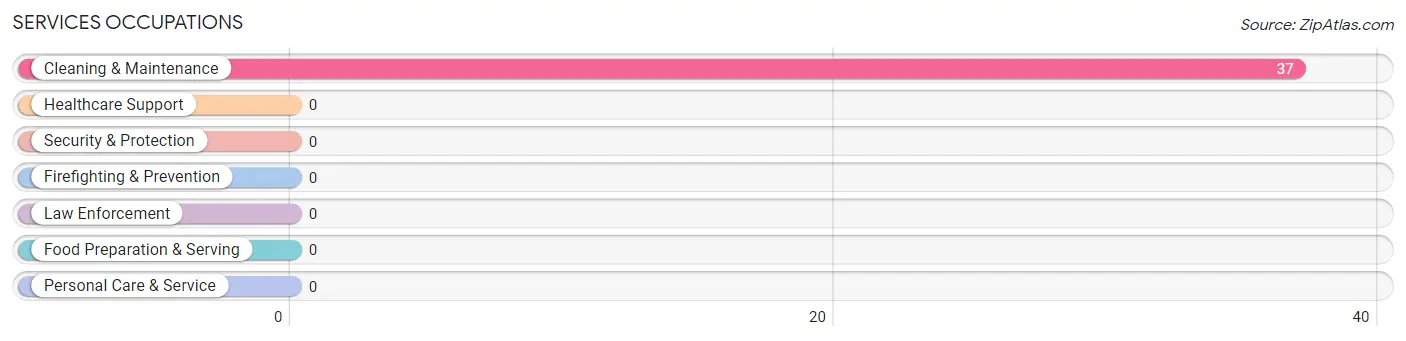
Services Occupations
The most common Services occupations in Chemung are , and Cleaning & Maintenance (37 | 92.5%).
Services Occupations by Sex
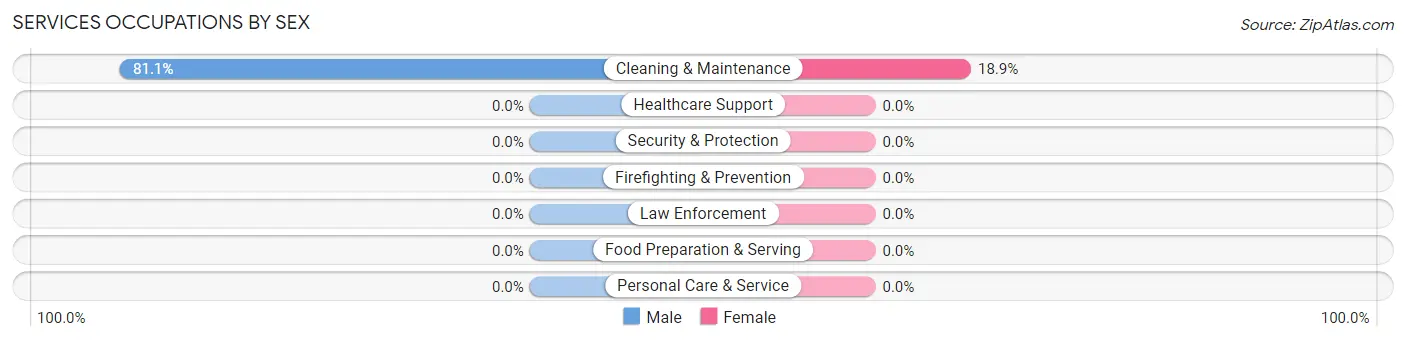
| Occupation | Male | Female |
| Healthcare Support | 0 (0.0%) | 0 (0.0%) |
| Security & Protection | 0 (0.0%) | 0 (0.0%) |
| Firefighting & Prevention | 0 (0.0%) | 0 (0.0%) |
| Law Enforcement | 0 (0.0%) | 0 (0.0%) |
| Food Preparation & Serving | 0 (0.0%) | 0 (0.0%) |
| Cleaning & Maintenance | 30 (81.1%) | 7 (18.9%) |
| Personal Care & Service | 0 (0.0%) | 0 (0.0%) |
| Total (Category) | 30 (81.1%) | 7 (18.9%) |
| Total (Overall) | 33 (82.5%) | 7 (17.5%) |
Sales and Office Occupations
Sales and Office Occupations by Sex
| Occupation | Male | Female |
| Sales & Related | 0 (0.0%) | 0 (0.0%) |
| Office & Administration | 0 (0.0%) | 0 (0.0%) |
| Total (Category) | 0 (0.0%) | 0 (0.0%) |
| Total (Overall) | 33 (82.5%) | 7 (17.5%) |
Natural Resources, Construction and Maintenance Occupations
The most common Natural Resources, Construction and Maintenance occupations in Chemung are , and Construction & Extraction (3 | 7.5%).
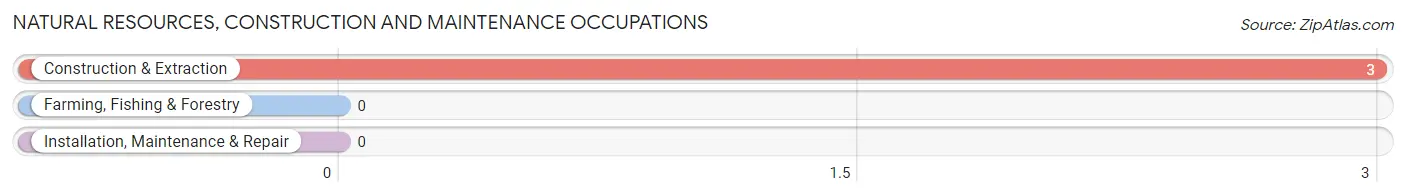
Natural Resources, Construction and Maintenance Occupations by Sex
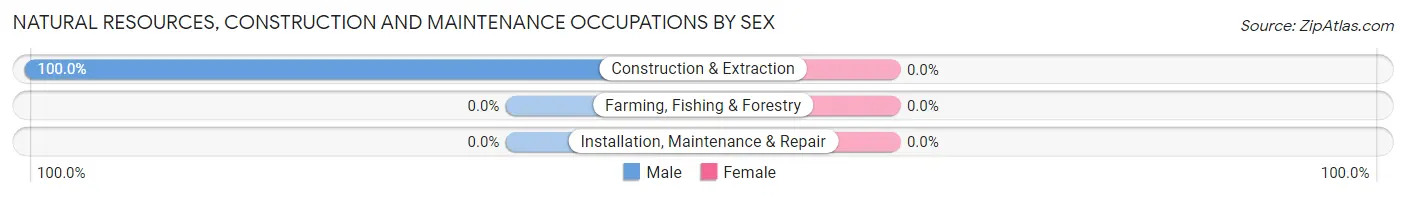
| Occupation | Male | Female |
| Farming, Fishing & Forestry | 0 (0.0%) | 0 (0.0%) |
| Construction & Extraction | 3 (100.0%) | 0 (0.0%) |
| Installation, Maintenance & Repair | 0 (0.0%) | 0 (0.0%) |
| Total (Category) | 3 (100.0%) | 0 (0.0%) |
| Total (Overall) | 33 (82.5%) | 7 (17.5%) |
Production, Transportation and Moving Occupations
Production, Transportation and Moving Occupations by Sex
| Occupation | Male | Female |
| Production | 0 (0.0%) | 0 (0.0%) |
| Transportation | 0 (0.0%) | 0 (0.0%) |
| Material Moving | 0 (0.0%) | 0 (0.0%) |
| Total (Category) | 0 (0.0%) | 0 (0.0%) |
| Total (Overall) | 33 (82.5%) | 7 (17.5%) |
Employment Industries by Sex in Chemung
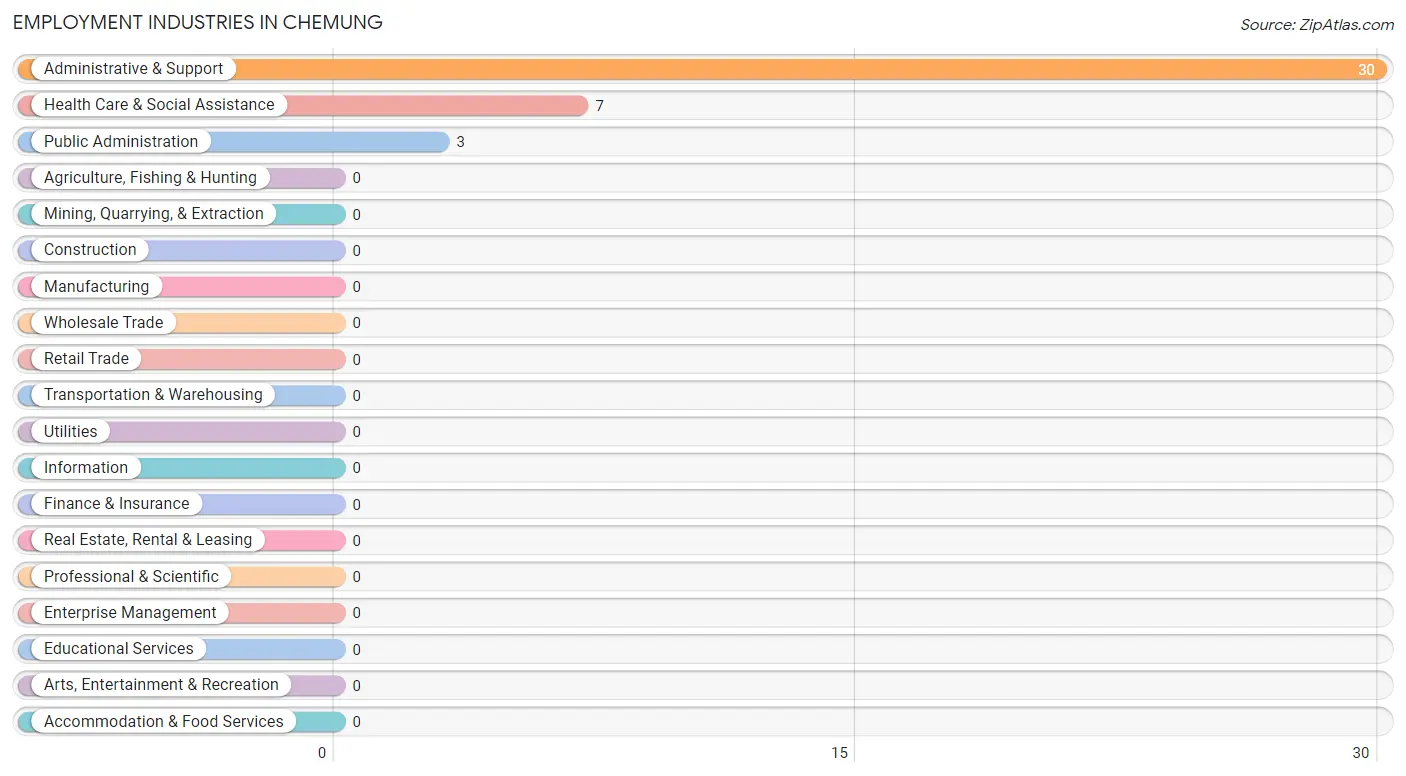
Employment Industries in Chemung
The major employment industries in Chemung include Administrative & Support (30 | 75.0%), Health Care & Social Assistance (7 | 17.5%), and Public Administration (3 | 7.5%).
Employment Industries by Sex in Chemung
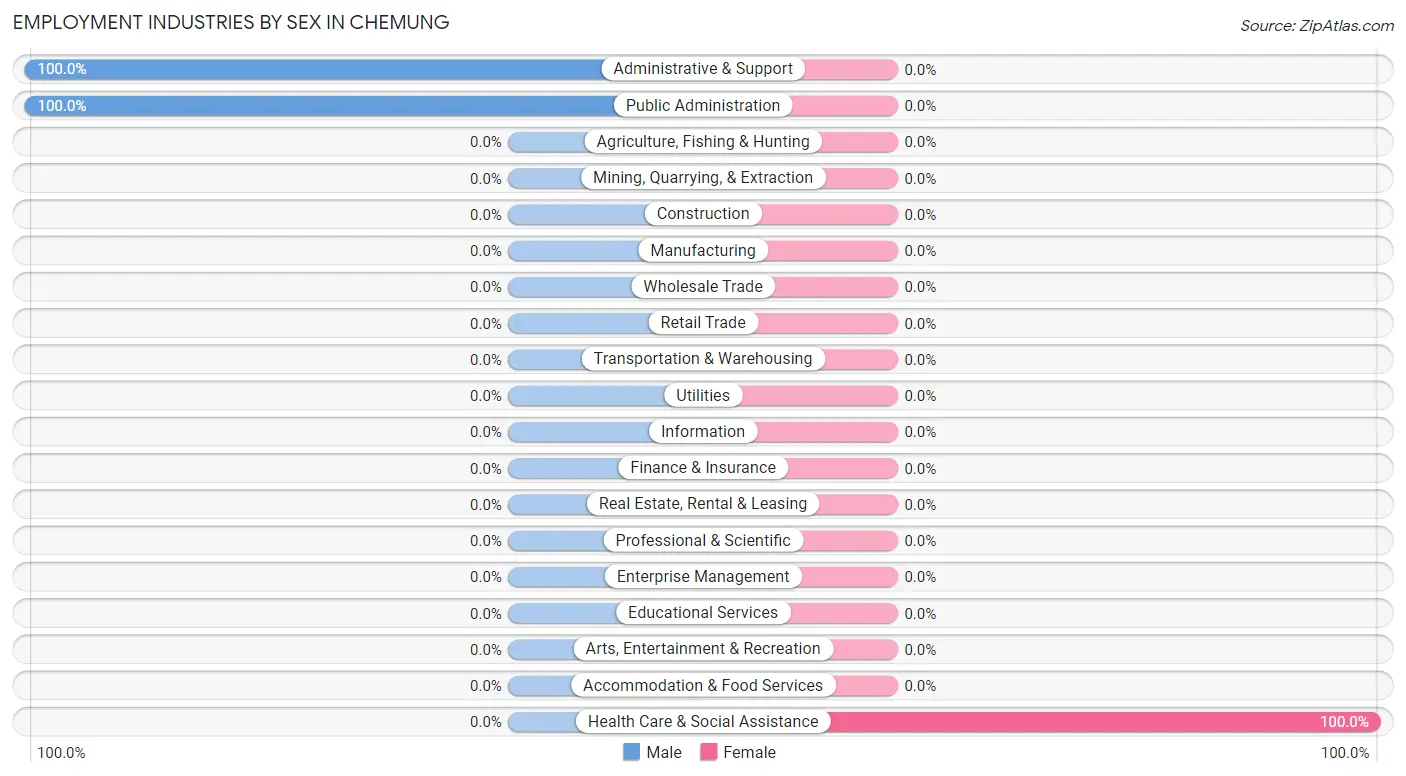
| Industry | Male | Female |
| Agriculture, Fishing & Hunting | 0 (0.0%) | 0 (0.0%) |
| Mining, Quarrying, & Extraction | 0 (0.0%) | 0 (0.0%) |
| Construction | 0 (0.0%) | 0 (0.0%) |
| Manufacturing | 0 (0.0%) | 0 (0.0%) |
| Wholesale Trade | 0 (0.0%) | 0 (0.0%) |
| Retail Trade | 0 (0.0%) | 0 (0.0%) |
| Transportation & Warehousing | 0 (0.0%) | 0 (0.0%) |
| Utilities | 0 (0.0%) | 0 (0.0%) |
| Information | 0 (0.0%) | 0 (0.0%) |
| Finance & Insurance | 0 (0.0%) | 0 (0.0%) |
| Real Estate, Rental & Leasing | 0 (0.0%) | 0 (0.0%) |
| Professional & Scientific | 0 (0.0%) | 0 (0.0%) |
| Enterprise Management | 0 (0.0%) | 0 (0.0%) |
| Administrative & Support | 30 (100.0%) | 0 (0.0%) |
| Educational Services | 0 (0.0%) | 0 (0.0%) |
| Health Care & Social Assistance | 0 (0.0%) | 7 (100.0%) |
| Arts, Entertainment & Recreation | 0 (0.0%) | 0 (0.0%) |
| Accommodation & Food Services | 0 (0.0%) | 0 (0.0%) |
| Public Administration | 3 (100.0%) | 0 (0.0%) |
| Total | 33 (82.5%) | 7 (17.5%) |
Education in Chemung
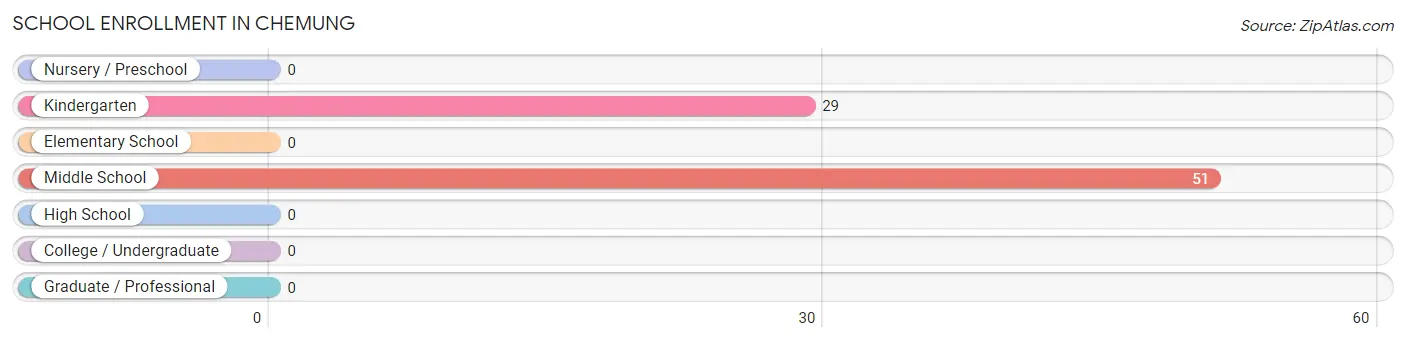
School Enrollment in Chemung
The most common levels of schooling among the 80 students in Chemung are middle school (51 | 63.7%), and kindergarten (29 | 36.2%).
| School Level | # Students | % Students |
| Nursery / Preschool | 0 | 0.0% |
| Kindergarten | 29 | 36.2% |
| Elementary School | 0 | 0.0% |
| Middle School | 51 | 63.7% |
| High School | 0 | 0.0% |
| College / Undergraduate | 0 | 0.0% |
| Graduate / Professional | 0 | 0.0% |
| Total | 80 | 100.0% |
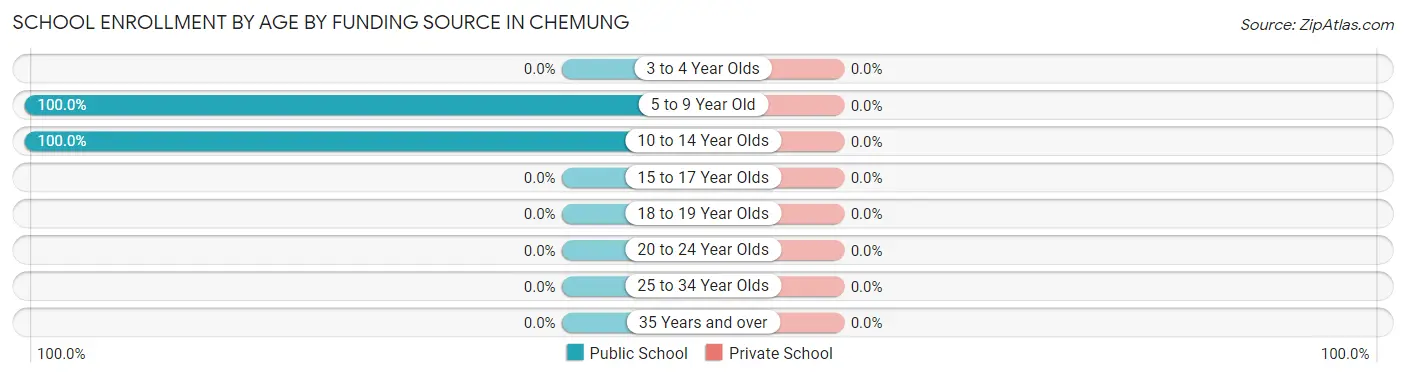
School Enrollment by Age by Funding Source in Chemung
| Age Bracket | Public School | Private School |
| 3 to 4 Year Olds | 0 (0.0%) | 0 (0.0%) |
| 5 to 9 Year Old | 29 (100.0%) | 0 (0.0%) |
| 10 to 14 Year Olds | 51 (100.0%) | 0 (0.0%) |
| 15 to 17 Year Olds | 0 (0.0%) | 0 (0.0%) |
| 18 to 19 Year Olds | 0 (0.0%) | 0 (0.0%) |
| 20 to 24 Year Olds | 0 (0.0%) | 0 (0.0%) |
| 25 to 34 Year Olds | 0 (0.0%) | 0 (0.0%) |
| 35 Years and over | 0 (0.0%) | 0 (0.0%) |
| Total | 80 (100.0%) | 0 (0.0%) |
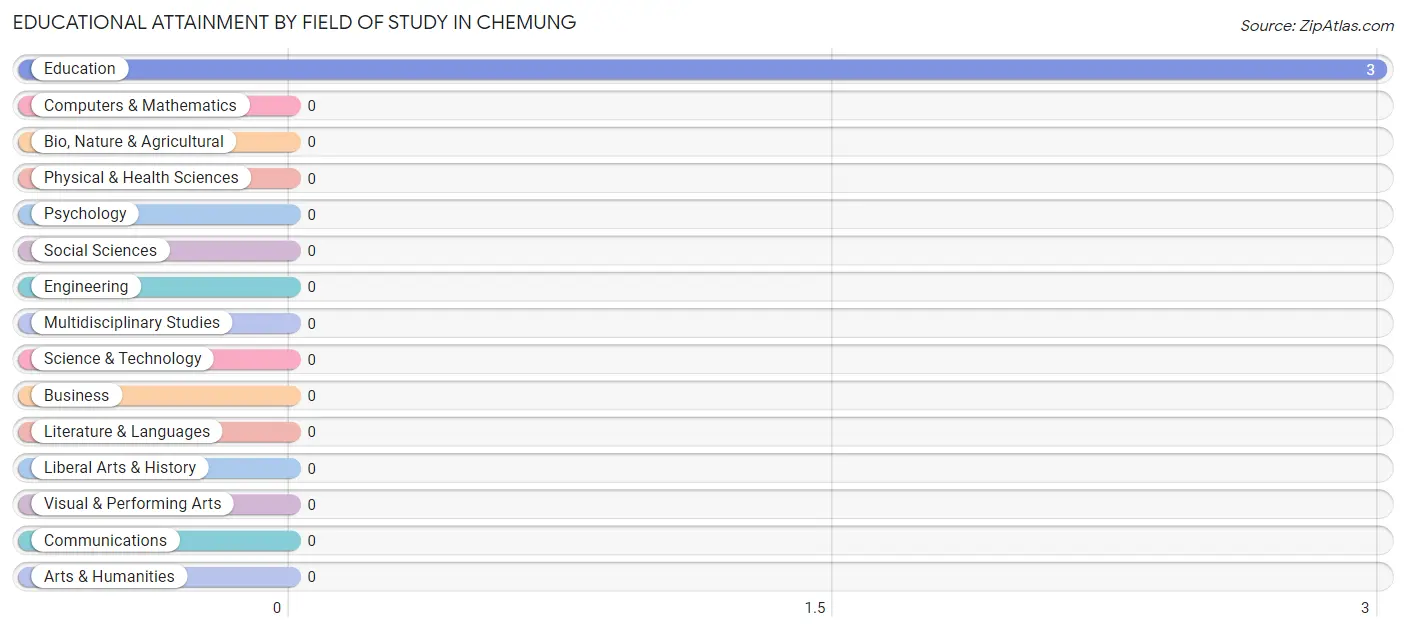
Educational Attainment by Field of Study in Chemung
, and education (3 | 100.0%) are the most common fields of study among 3 individuals in Chemung who have obtained a bachelor's degree or higher.
| Field of Study | # Graduates | % Graduates |
| Computers & Mathematics | 0 | 0.0% |
| Bio, Nature & Agricultural | 0 | 0.0% |
| Physical & Health Sciences | 0 | 0.0% |
| Psychology | 0 | 0.0% |
| Social Sciences | 0 | 0.0% |
| Engineering | 0 | 0.0% |
| Multidisciplinary Studies | 0 | 0.0% |
| Science & Technology | 0 | 0.0% |
| Business | 0 | 0.0% |
| Education | 3 | 100.0% |
| Literature & Languages | 0 | 0.0% |
| Liberal Arts & History | 0 | 0.0% |
| Visual & Performing Arts | 0 | 0.0% |
| Communications | 0 | 0.0% |
| Arts & Humanities | 0 | 0.0% |
| Total | 3 | 100.0% |
Transportation & Commute in Chemung
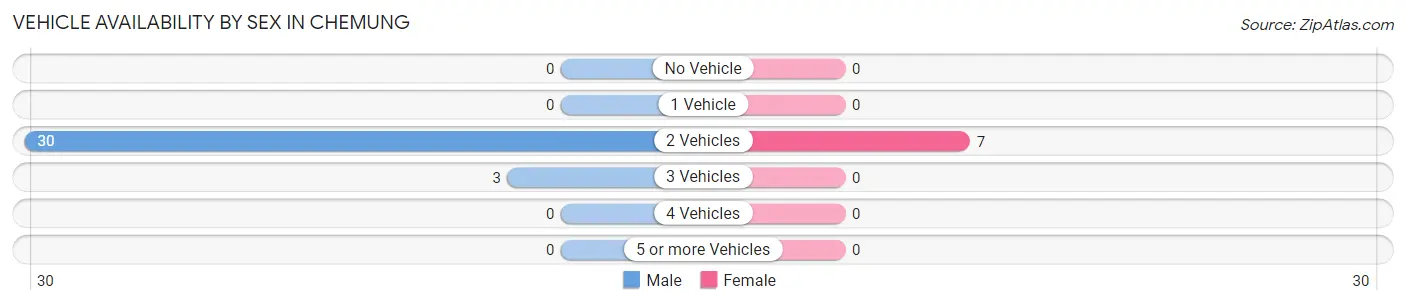
Vehicle Availability by Sex in Chemung
The most prevalent vehicle ownership categories in Chemung are males with 2 vehicles (30, accounting for 90.9%) and females with 2 vehicles (7, making up 428.6%).
| Vehicles Available | Male | Female |
| No Vehicle | 0 (0.0%) | 0 (0.0%) |
| 1 Vehicle | 0 (0.0%) | 0 (0.0%) |
| 2 Vehicles | 30 (90.9%) | 7 (100.0%) |
| 3 Vehicles | 3 (9.1%) | 0 (0.0%) |
| 4 Vehicles | 0 (0.0%) | 0 (0.0%) |
| 5 or more Vehicles | 0 (0.0%) | 0 (0.0%) |
| Total | 33 (100.0%) | 7 (100.0%) |
Commute Time in Chemung
The most frequently occuring commute durations in Chemung are 10 to 14 minutes (10 commuters, 100.0%), less than 5 minutes (0 commuters, 0.0%), and 5 to 9 minutes (0 commuters, 0.0%).
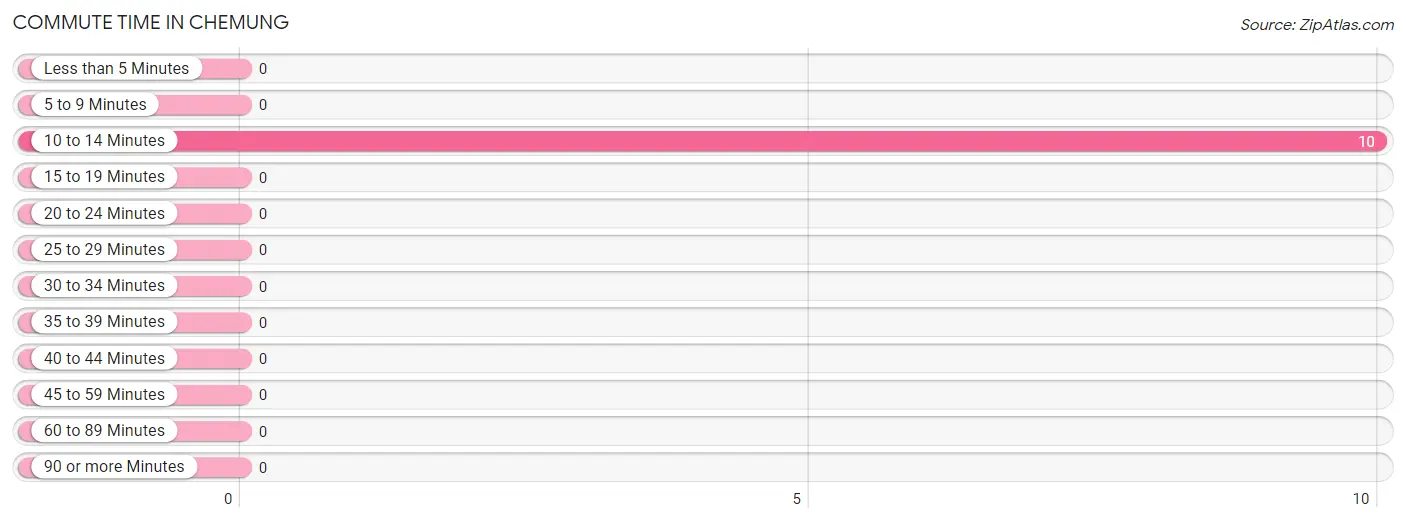
| Commute Time | # Commuters | % Commuters |
| Less than 5 Minutes | 0 | 0.0% |
| 5 to 9 Minutes | 0 | 0.0% |
| 10 to 14 Minutes | 10 | 100.0% |
| 15 to 19 Minutes | 0 | 0.0% |
| 20 to 24 Minutes | 0 | 0.0% |
| 25 to 29 Minutes | 0 | 0.0% |
| 30 to 34 Minutes | 0 | 0.0% |
| 35 to 39 Minutes | 0 | 0.0% |
| 40 to 44 Minutes | 0 | 0.0% |
| 45 to 59 Minutes | 0 | 0.0% |
| 60 to 89 Minutes | 0 | 0.0% |
| 90 or more Minutes | 0 | 0.0% |
Commute Time by Sex in Chemung
The most common commute times in Chemung are 10 to 14 minutes (3 commuters, 100.0%) for males and 10 to 14 minutes (7 commuters, 100.0%) for females.
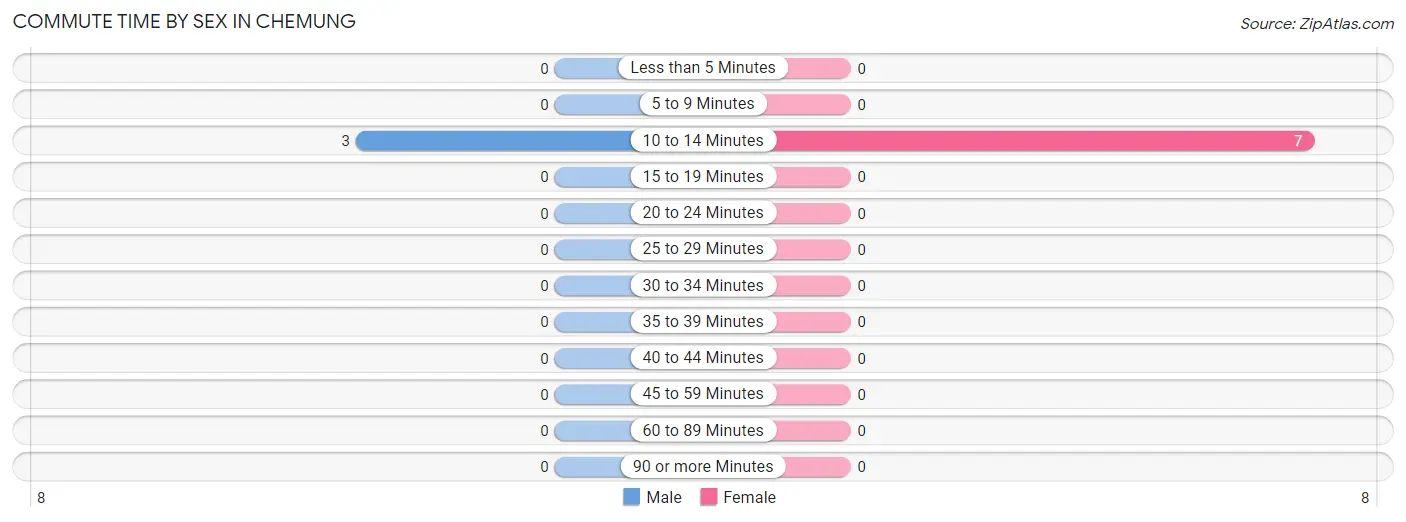
| Commute Time | Male | Female |
| Less than 5 Minutes | 0 (0.0%) | 0 (0.0%) |
| 5 to 9 Minutes | 0 (0.0%) | 0 (0.0%) |
| 10 to 14 Minutes | 3 (100.0%) | 7 (100.0%) |
| 15 to 19 Minutes | 0 (0.0%) | 0 (0.0%) |
| 20 to 24 Minutes | 0 (0.0%) | 0 (0.0%) |
| 25 to 29 Minutes | 0 (0.0%) | 0 (0.0%) |
| 30 to 34 Minutes | 0 (0.0%) | 0 (0.0%) |
| 35 to 39 Minutes | 0 (0.0%) | 0 (0.0%) |
| 40 to 44 Minutes | 0 (0.0%) | 0 (0.0%) |
| 45 to 59 Minutes | 0 (0.0%) | 0 (0.0%) |
| 60 to 89 Minutes | 0 (0.0%) | 0 (0.0%) |
| 90 or more Minutes | 0 (0.0%) | 0 (0.0%) |
Time of Departure to Work by Sex in Chemung
The most frequent times of departure to work in Chemung are 5:30 AM to 5:59 AM (3, 100.0%) for males and 6:30 AM to 6:59 AM (7, 100.0%) for females.
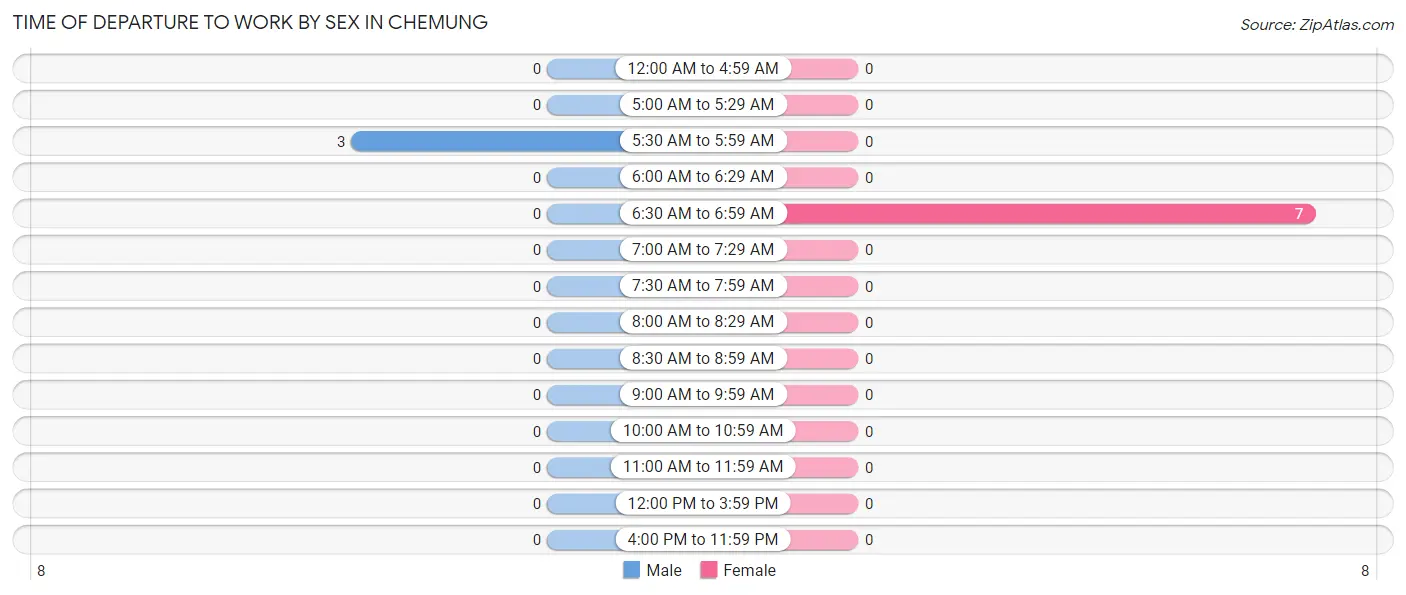
| Time of Departure | Male | Female |
| 12:00 AM to 4:59 AM | 0 (0.0%) | 0 (0.0%) |
| 5:00 AM to 5:29 AM | 0 (0.0%) | 0 (0.0%) |
| 5:30 AM to 5:59 AM | 3 (100.0%) | 0 (0.0%) |
| 6:00 AM to 6:29 AM | 0 (0.0%) | 0 (0.0%) |
| 6:30 AM to 6:59 AM | 0 (0.0%) | 7 (100.0%) |
| 7:00 AM to 7:29 AM | 0 (0.0%) | 0 (0.0%) |
| 7:30 AM to 7:59 AM | 0 (0.0%) | 0 (0.0%) |
| 8:00 AM to 8:29 AM | 0 (0.0%) | 0 (0.0%) |
| 8:30 AM to 8:59 AM | 0 (0.0%) | 0 (0.0%) |
| 9:00 AM to 9:59 AM | 0 (0.0%) | 0 (0.0%) |
| 10:00 AM to 10:59 AM | 0 (0.0%) | 0 (0.0%) |
| 11:00 AM to 11:59 AM | 0 (0.0%) | 0 (0.0%) |
| 12:00 PM to 3:59 PM | 0 (0.0%) | 0 (0.0%) |
| 4:00 PM to 11:59 PM | 0 (0.0%) | 0 (0.0%) |
| Total | 3 (100.0%) | 7 (100.0%) |
Housing Occupancy in Chemung
Occupancy by Ownership in Chemung
Of the total 174 dwellings in Chemung, owner-occupied units account for 174 (100.0%), while renter-occupied units make up 0 (0.0%).
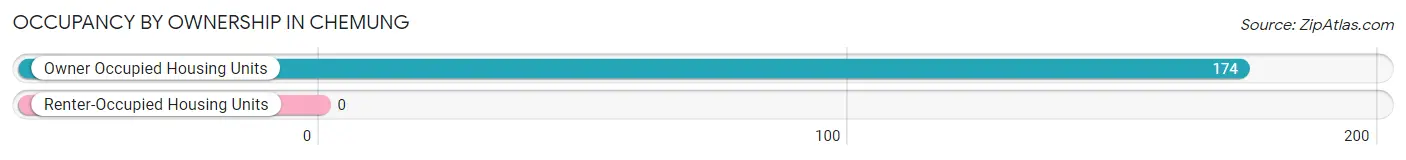
| Occupancy | # Housing Units | % Housing Units |
| Owner Occupied Housing Units | 174 | 100.0% |
| Renter-Occupied Housing Units | 0 | 0.0% |
| Total Occupied Housing Units | 174 | 100.0% |
Occupancy by Household Size in Chemung
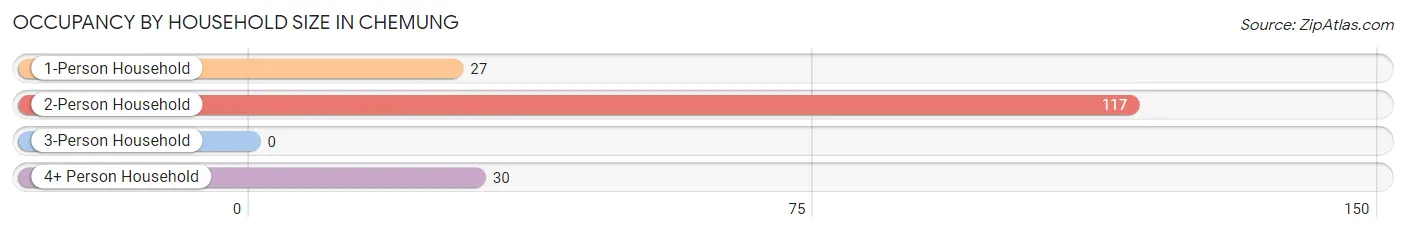
| Household Size | # Housing Units | % Housing Units |
| 1-Person Household | 27 | 15.5% |
| 2-Person Household | 117 | 67.2% |
| 3-Person Household | 0 | 0.0% |
| 4+ Person Household | 30 | 17.2% |
| Total Housing Units | 174 | 100.0% |
Occupancy by Ownership by Household Size in Chemung
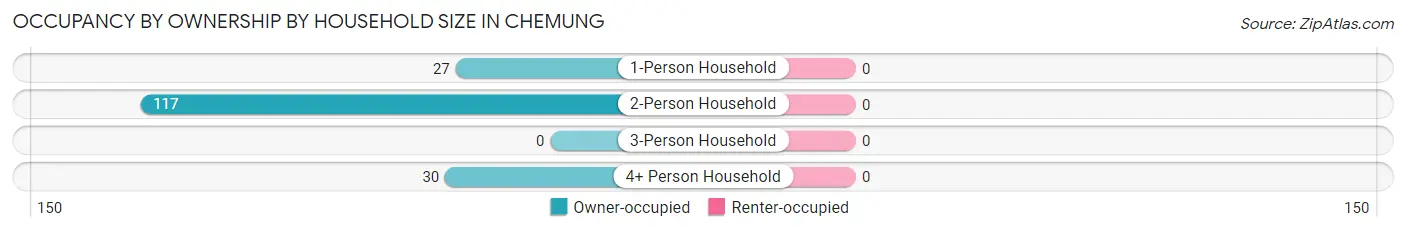
| Household Size | Owner-occupied | Renter-occupied |
| 1-Person Household | 27 (100.0%) | 0 (0.0%) |
| 2-Person Household | 117 (100.0%) | 0 (0.0%) |
| 3-Person Household | 0 (0.0%) | 0 (0.0%) |
| 4+ Person Household | 30 (100.0%) | 0 (0.0%) |
| Total Housing Units | 174 (100.0%) | 0 (0.0%) |
Occupancy by Educational Attainment in Chemung
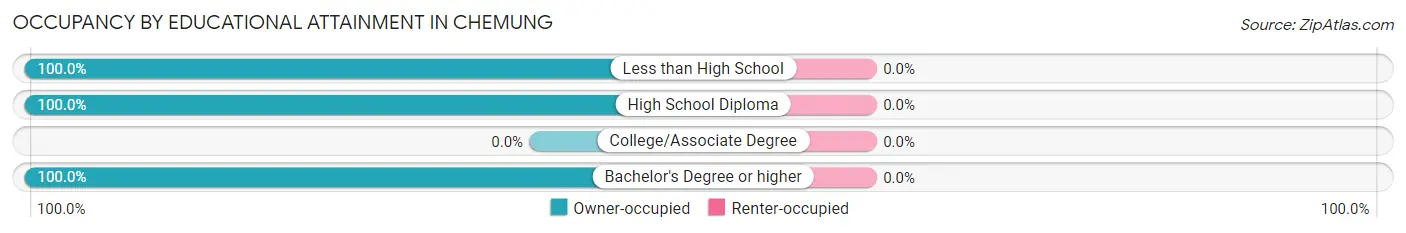
| Household Size | Owner-occupied | Renter-occupied |
| Less than High School | 30 (100.0%) | 0 (0.0%) |
| High School Diploma | 141 (100.0%) | 0 (0.0%) |
| College/Associate Degree | 0 (0.0%) | 0 (0.0%) |
| Bachelor's Degree or higher | 3 (100.0%) | 0 (0.0%) |
Occupancy by Age of Householder in Chemung
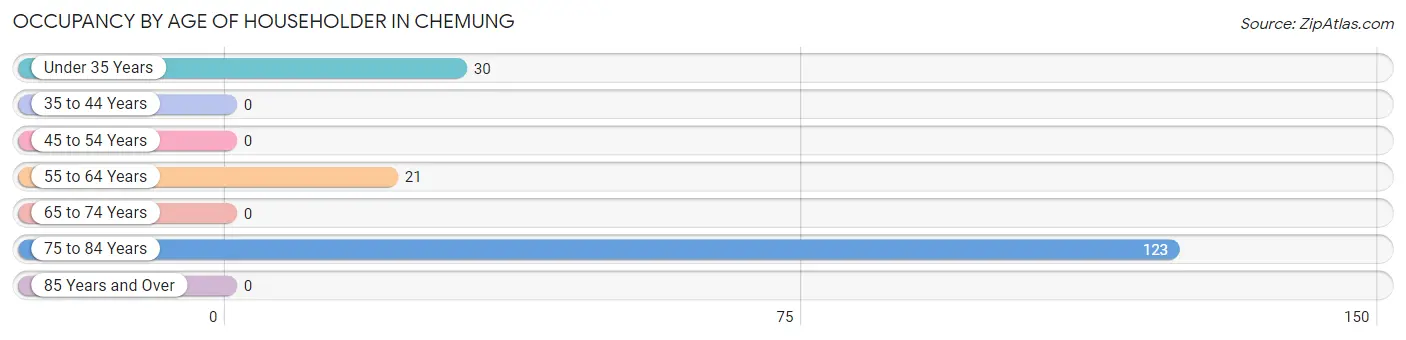
| Age Bracket | # Households | % Households |
| Under 35 Years | 30 | 17.2% |
| 35 to 44 Years | 0 | 0.0% |
| 45 to 54 Years | 0 | 0.0% |
| 55 to 64 Years | 21 | 12.1% |
| 65 to 74 Years | 0 | 0.0% |
| 75 to 84 Years | 123 | 70.7% |
| 85 Years and Over | 0 | 0.0% |
| Total | 174 | 100.0% |
Housing Finances in Chemung
Median Income by Occupancy in Chemung
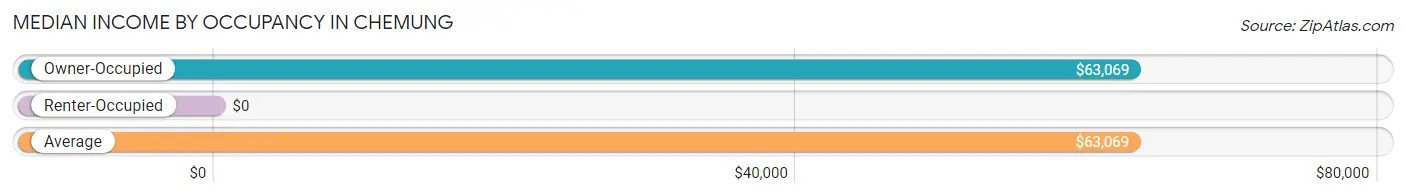
| Occupancy Type | # Households | Median Income |
| Owner-Occupied | 174 (100.0%) | $63,069 |
| Renter-Occupied | 0 (0.0%) | $0 |
| Average | 174 (100.0%) | $63,069 |
Occupancy by Householder Income Bracket in Chemung
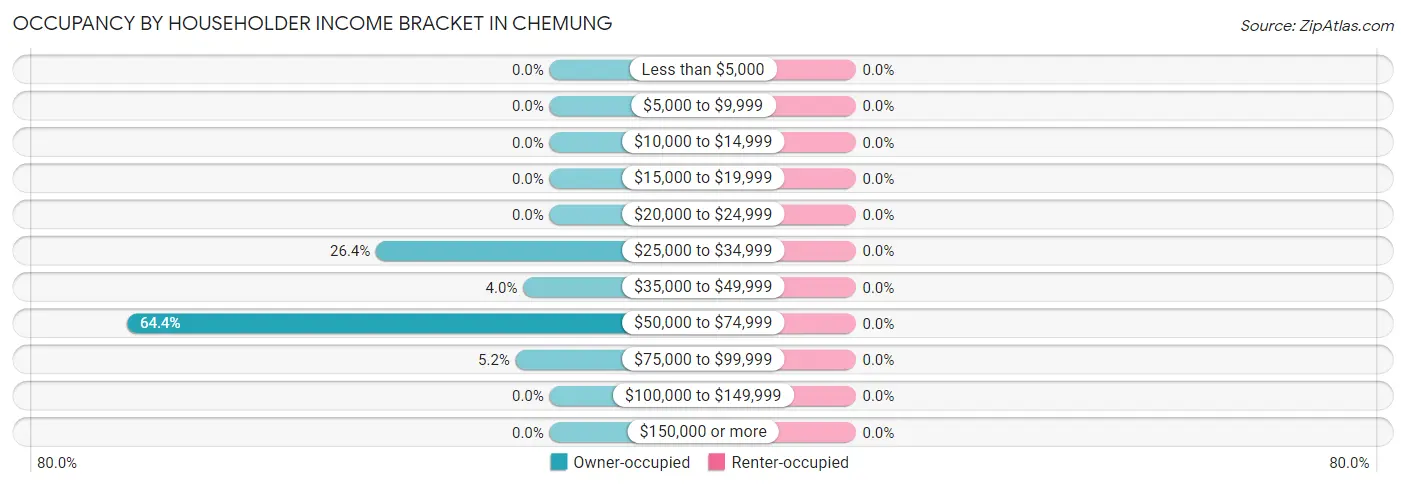
| Income Bracket | Owner-occupied | Renter-occupied |
| Less than $5,000 | 0 (0.0%) | 0 (0.0%) |
| $5,000 to $9,999 | 0 (0.0%) | 0 (0.0%) |
| $10,000 to $14,999 | 0 (0.0%) | 0 (0.0%) |
| $15,000 to $19,999 | 0 (0.0%) | 0 (0.0%) |
| $20,000 to $24,999 | 0 (0.0%) | 0 (0.0%) |
| $25,000 to $34,999 | 46 (26.4%) | 0 (0.0%) |
| $35,000 to $49,999 | 7 (4.0%) | 0 (0.0%) |
| $50,000 to $74,999 | 112 (64.4%) | 0 (0.0%) |
| $75,000 to $99,999 | 9 (5.2%) | 0 (0.0%) |
| $100,000 to $149,999 | 0 (0.0%) | 0 (0.0%) |
| $150,000 or more | 0 (0.0%) | 0 (0.0%) |
| Total | 174 (100.0%) | 0 (0.0%) |
Monthly Housing Cost Tiers in Chemung
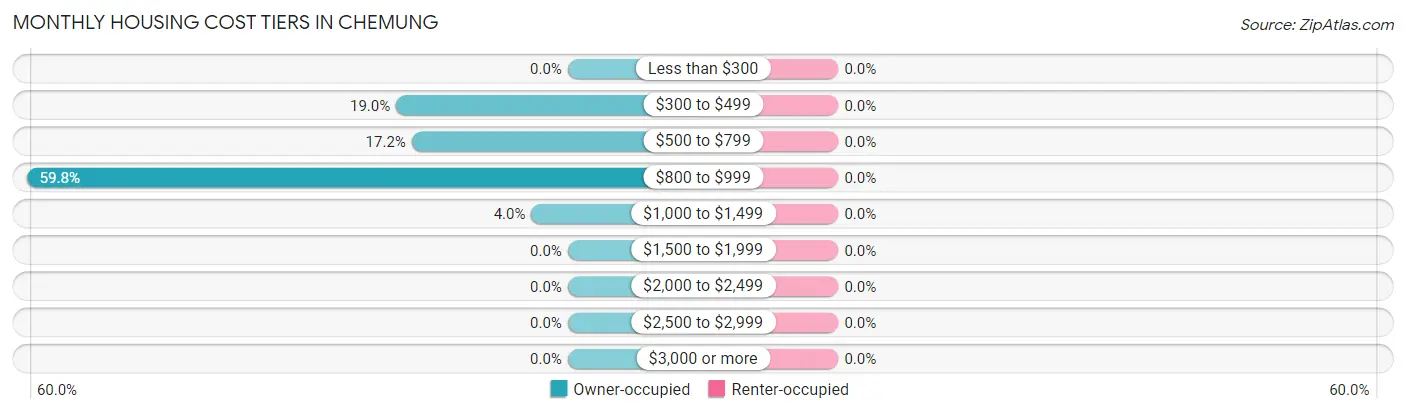
| Monthly Cost | Owner-occupied | Renter-occupied |
| Less than $300 | 0 (0.0%) | 0 (0.0%) |
| $300 to $499 | 33 (19.0%) | 0 (0.0%) |
| $500 to $799 | 30 (17.2%) | 0 (0.0%) |
| $800 to $999 | 104 (59.8%) | 0 (0.0%) |
| $1,000 to $1,499 | 7 (4.0%) | 0 (0.0%) |
| $1,500 to $1,999 | 0 (0.0%) | 0 (0.0%) |
| $2,000 to $2,499 | 0 (0.0%) | 0 (0.0%) |
| $2,500 to $2,999 | 0 (0.0%) | 0 (0.0%) |
| $3,000 or more | 0 (0.0%) | 0 (0.0%) |
| Total | 174 (100.0%) | 0 (0.0%) |
Physical Housing Characteristics in Chemung
Housing Structures in Chemung
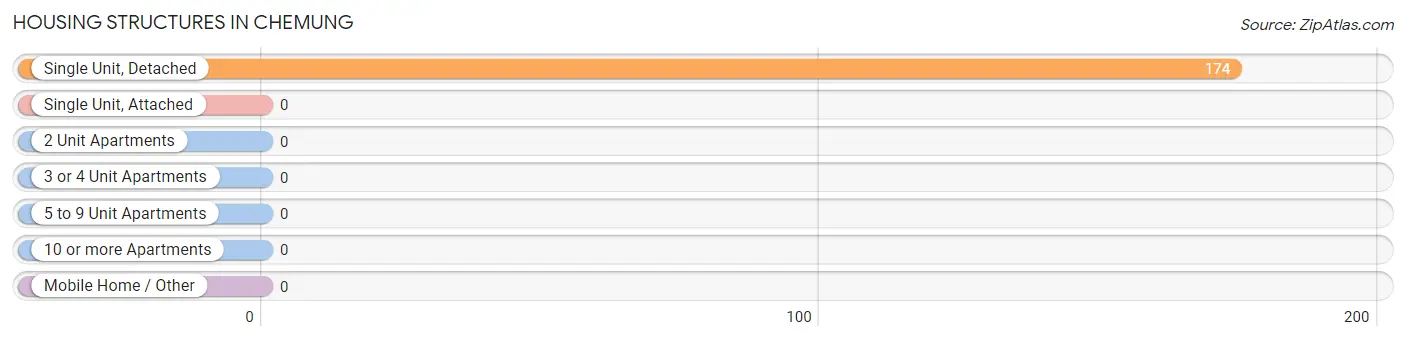
| Structure Type | # Housing Units | % Housing Units |
| Single Unit, Detached | 174 | 100.0% |
| Single Unit, Attached | 0 | 0.0% |
| 2 Unit Apartments | 0 | 0.0% |
| 3 or 4 Unit Apartments | 0 | 0.0% |
| 5 to 9 Unit Apartments | 0 | 0.0% |
| 10 or more Apartments | 0 | 0.0% |
| Mobile Home / Other | 0 | 0.0% |
| Total | 174 | 100.0% |
Housing Structures by Occupancy in Chemung
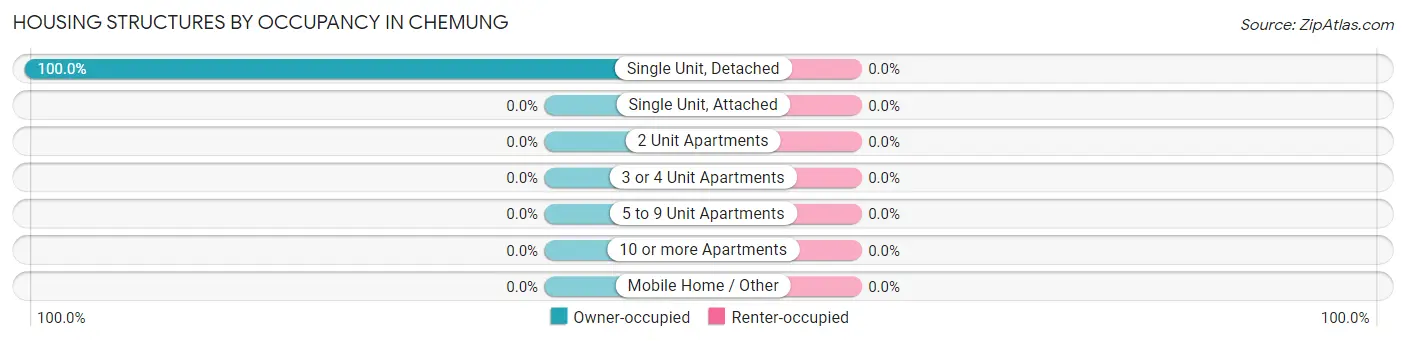
| Structure Type | Owner-occupied | Renter-occupied |
| Single Unit, Detached | 174 (100.0%) | 0 (0.0%) |
| Single Unit, Attached | 0 (0.0%) | 0 (0.0%) |
| 2 Unit Apartments | 0 (0.0%) | 0 (0.0%) |
| 3 or 4 Unit Apartments | 0 (0.0%) | 0 (0.0%) |
| 5 to 9 Unit Apartments | 0 (0.0%) | 0 (0.0%) |
| 10 or more Apartments | 0 (0.0%) | 0 (0.0%) |
| Mobile Home / Other | 0 (0.0%) | 0 (0.0%) |
| Total | 174 (100.0%) | 0 (0.0%) |
Housing Structures by Number of Rooms in Chemung
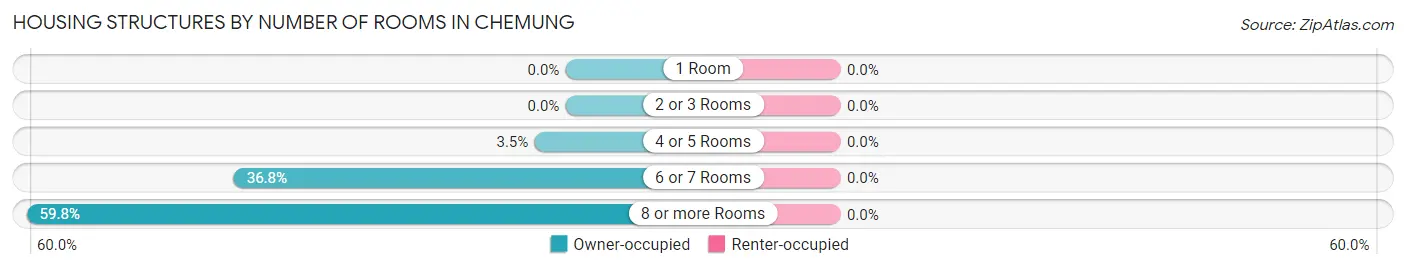
| Number of Rooms | Owner-occupied | Renter-occupied |
| 1 Room | 0 (0.0%) | 0 (0.0%) |
| 2 or 3 Rooms | 0 (0.0%) | 0 (0.0%) |
| 4 or 5 Rooms | 6 (3.5%) | 0 (0.0%) |
| 6 or 7 Rooms | 64 (36.8%) | 0 (0.0%) |
| 8 or more Rooms | 104 (59.8%) | 0 (0.0%) |
| Total | 174 (100.0%) | 0 (0.0%) |
Housing Structure by Heating Type in Chemung
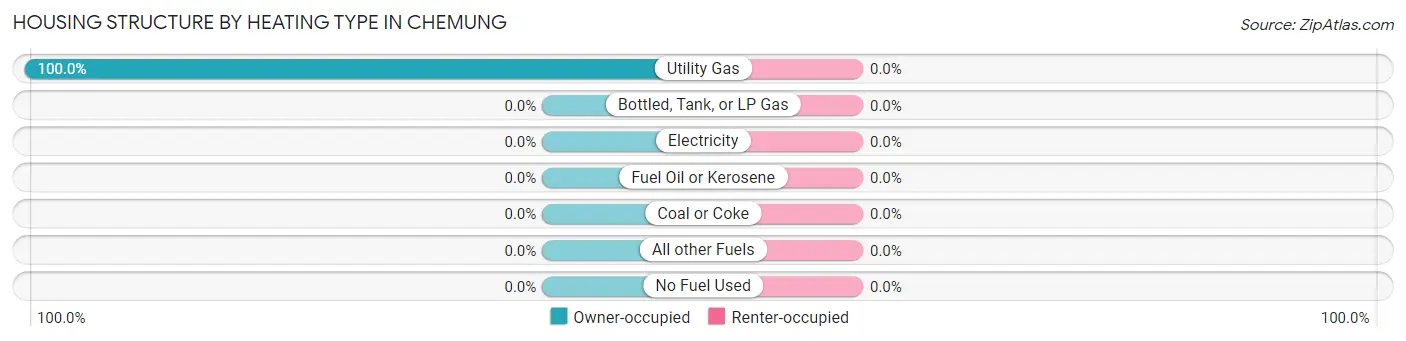
| Heating Type | Owner-occupied | Renter-occupied |
| Utility Gas | 174 (100.0%) | 0 (0.0%) |
| Bottled, Tank, or LP Gas | 0 (0.0%) | 0 (0.0%) |
| Electricity | 0 (0.0%) | 0 (0.0%) |
| Fuel Oil or Kerosene | 0 (0.0%) | 0 (0.0%) |
| Coal or Coke | 0 (0.0%) | 0 (0.0%) |
| All other Fuels | 0 (0.0%) | 0 (0.0%) |
| No Fuel Used | 0 (0.0%) | 0 (0.0%) |
| Total | 174 (100.0%) | 0 (0.0%) |
Household Vehicle Usage in Chemung
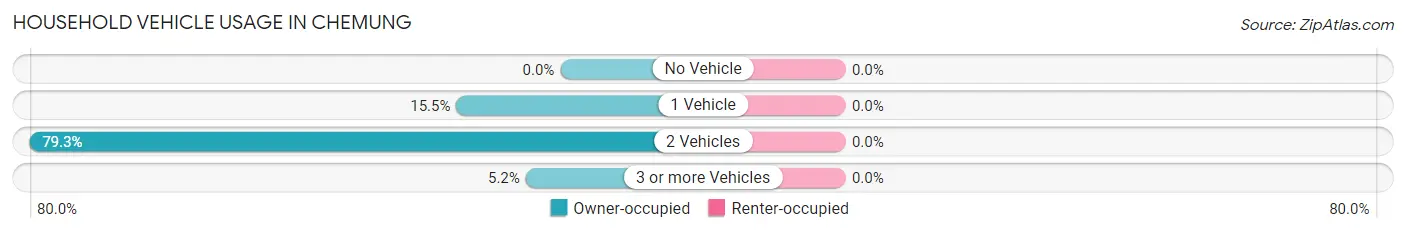
| Vehicles per Household | Owner-occupied | Renter-occupied |
| No Vehicle | 0 (0.0%) | 0 (0.0%) |
| 1 Vehicle | 27 (15.5%) | 0 (0.0%) |
| 2 Vehicles | 138 (79.3%) | 0 (0.0%) |
| 3 or more Vehicles | 9 (5.2%) | 0 (0.0%) |
| Total | 174 (100.0%) | 0 (0.0%) |
Real Estate & Mortgages in Chemung
Real Estate and Mortgage Overview in Chemung
| Characteristic | Without Mortgage | With Mortgage |
| Housing Units | 156 | 18 |
| Median Property Value | $163,500 | $0 |
| Median Household Income | $63,292 | $0 |
| Monthly Housing Costs | $925 | $0 |
| Real Estate Taxes | $2,510 | $0 |
Property Value by Mortgage Status in Chemung
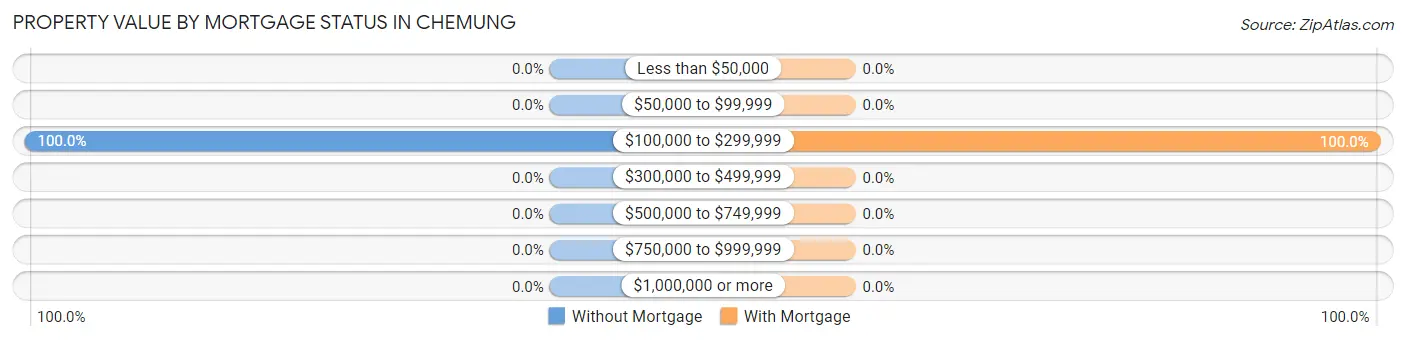
| Property Value | Without Mortgage | With Mortgage |
| Less than $50,000 | 0 (0.0%) | 0 (0.0%) |
| $50,000 to $99,999 | 0 (0.0%) | 0 (0.0%) |
| $100,000 to $299,999 | 156 (100.0%) | 18 (100.0%) |
| $300,000 to $499,999 | 0 (0.0%) | 0 (0.0%) |
| $500,000 to $749,999 | 0 (0.0%) | 0 (0.0%) |
| $750,000 to $999,999 | 0 (0.0%) | 0 (0.0%) |
| $1,000,000 or more | 0 (0.0%) | 0 (0.0%) |
| Total | 156 (100.0%) | 18 (100.0%) |
Household Income by Mortgage Status in Chemung
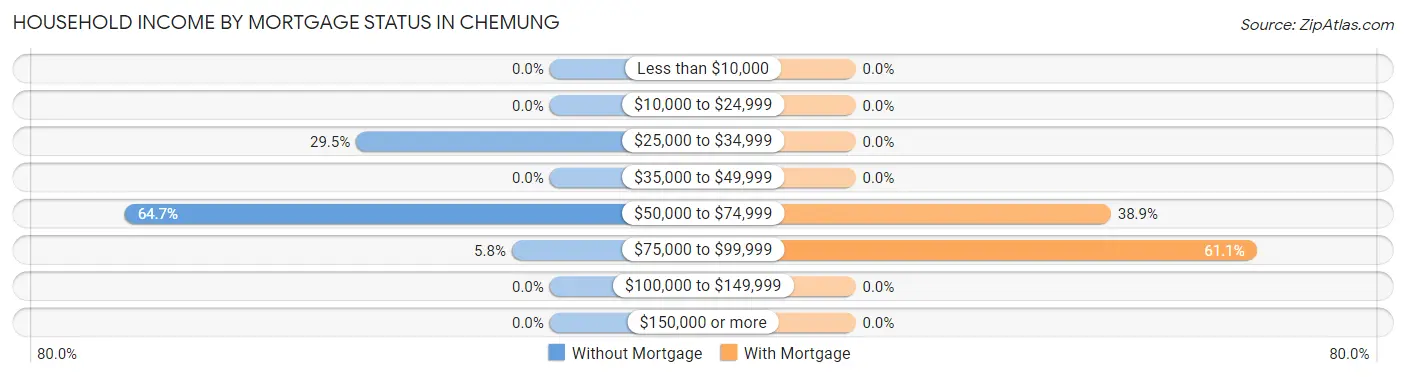
| Household Income | Without Mortgage | With Mortgage |
| Less than $10,000 | 0 (0.0%) | 0 (0.0%) |
| $10,000 to $24,999 | 0 (0.0%) | 0 (0.0%) |
| $25,000 to $34,999 | 46 (29.5%) | 0 (0.0%) |
| $35,000 to $49,999 | 0 (0.0%) | 0 (0.0%) |
| $50,000 to $74,999 | 101 (64.7%) | 7 (38.9%) |
| $75,000 to $99,999 | 9 (5.8%) | 11 (61.1%) |
| $100,000 to $149,999 | 0 (0.0%) | 0 (0.0%) |
| $150,000 or more | 0 (0.0%) | 0 (0.0%) |
| Total | 156 (100.0%) | 18 (100.0%) |
Property Value to Household Income Ratio in Chemung
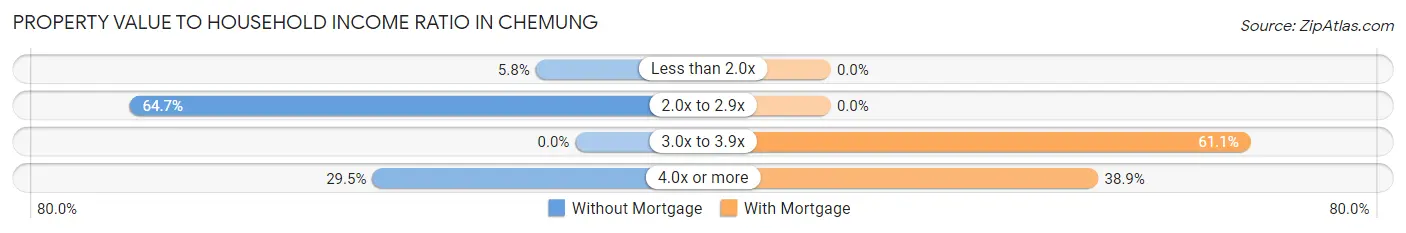
| Value-to-Income Ratio | Without Mortgage | With Mortgage |
| Less than 2.0x | 9 (5.8%) | 0 (0.0%) |
| 2.0x to 2.9x | 101 (64.7%) | 0 (0.0%) |
| 3.0x to 3.9x | 0 (0.0%) | 11 (61.1%) |
| 4.0x or more | 46 (29.5%) | 7 (38.9%) |
| Total | 156 (100.0%) | 18 (100.0%) |
Real Estate Taxes by Mortgage Status in Chemung
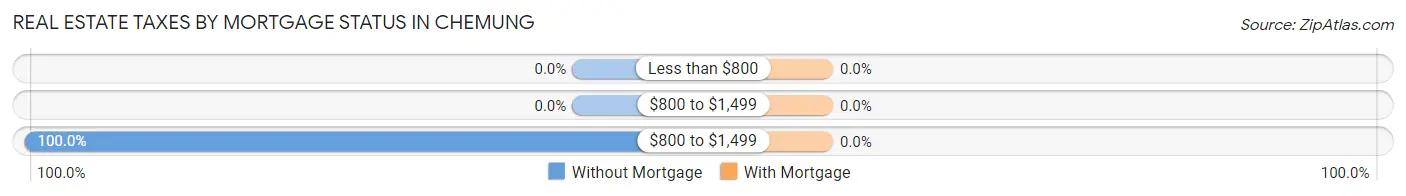
| Property Taxes | Without Mortgage | With Mortgage |
| Less than $800 | 0 (0.0%) | 0 (0.0%) |
| $800 to $1,499 | 0 (0.0%) | 0 (0.0%) |
| $800 to $1,499 | 156 (100.0%) | 0 (0.0%) |
| Total | 156 (100.0%) | 18 (100.0%) |
Health & Disability in Chemung
Health Insurance Coverage by Age in Chemung
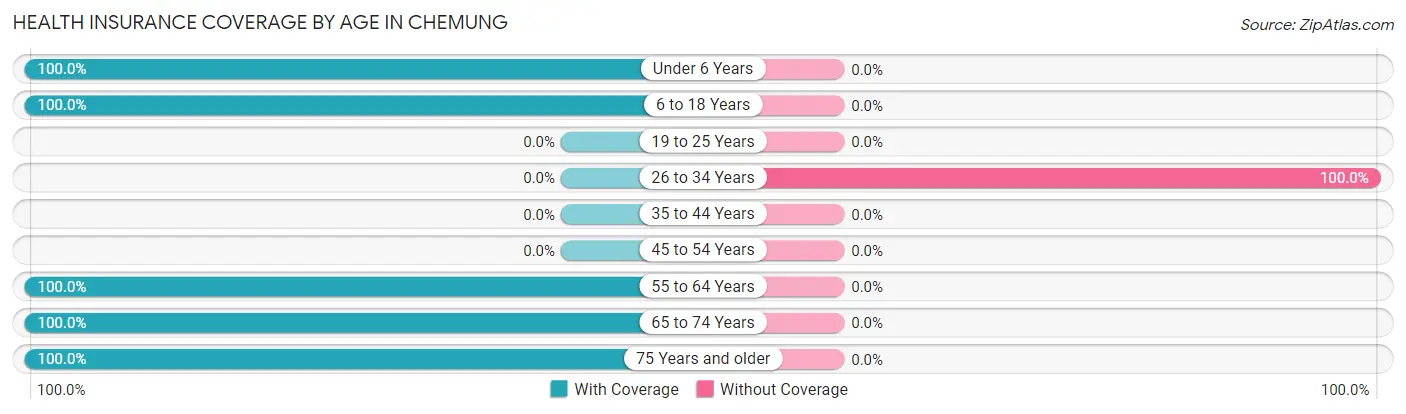
| Age Bracket | With Coverage | Without Coverage |
| Under 6 Years | 29 (100.0%) | 0 (0.0%) |
| 6 to 18 Years | 51 (100.0%) | 0 (0.0%) |
| 19 to 25 Years | 0 (0.0%) | 0 (0.0%) |
| 26 to 34 Years | 0 (0.0%) | 59 (100.0%) |
| 35 to 44 Years | 0 (0.0%) | 0 (0.0%) |
| 45 to 54 Years | 0 (0.0%) | 0 (0.0%) |
| 55 to 64 Years | 30 (100.0%) | 0 (0.0%) |
| 65 to 74 Years | 89 (100.0%) | 0 (0.0%) |
| 75 Years and older | 128 (100.0%) | 0 (0.0%) |
| Total | 327 (84.7%) | 59 (15.3%) |
Health Insurance Coverage by Citizenship Status in Chemung
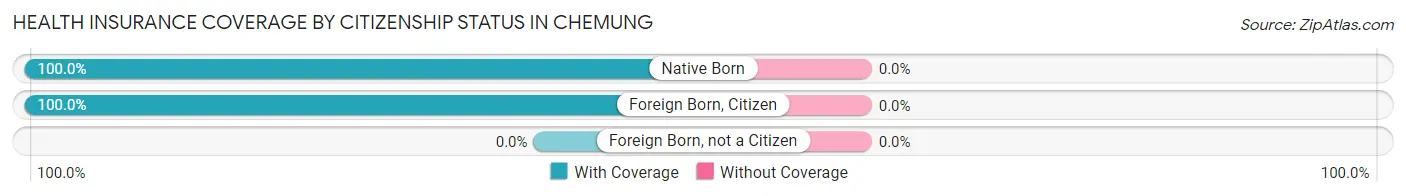
| Citizenship Status | With Coverage | Without Coverage |
| Native Born | 29 (100.0%) | 0 (0.0%) |
| Foreign Born, Citizen | 51 (100.0%) | 0 (0.0%) |
| Foreign Born, not a Citizen | 0 (0.0%) | 0 (0.0%) |
Health Insurance Coverage by Household Income in Chemung
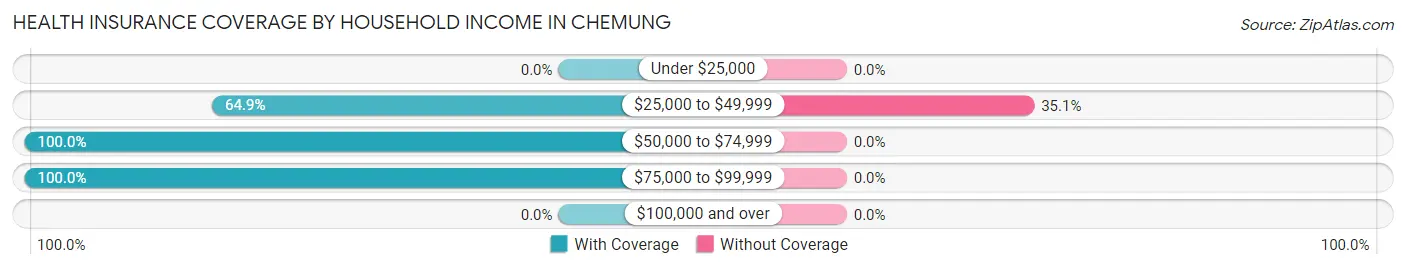
| Household Income | With Coverage | Without Coverage |
| Under $25,000 | 0 (0.0%) | 0 (0.0%) |
| $25,000 to $49,999 | 109 (64.9%) | 59 (35.1%) |
| $50,000 to $74,999 | 201 (100.0%) | 0 (0.0%) |
| $75,000 to $99,999 | 17 (100.0%) | 0 (0.0%) |
| $100,000 and over | 0 (0.0%) | 0 (0.0%) |
Public vs Private Health Insurance Coverage by Age in Chemung
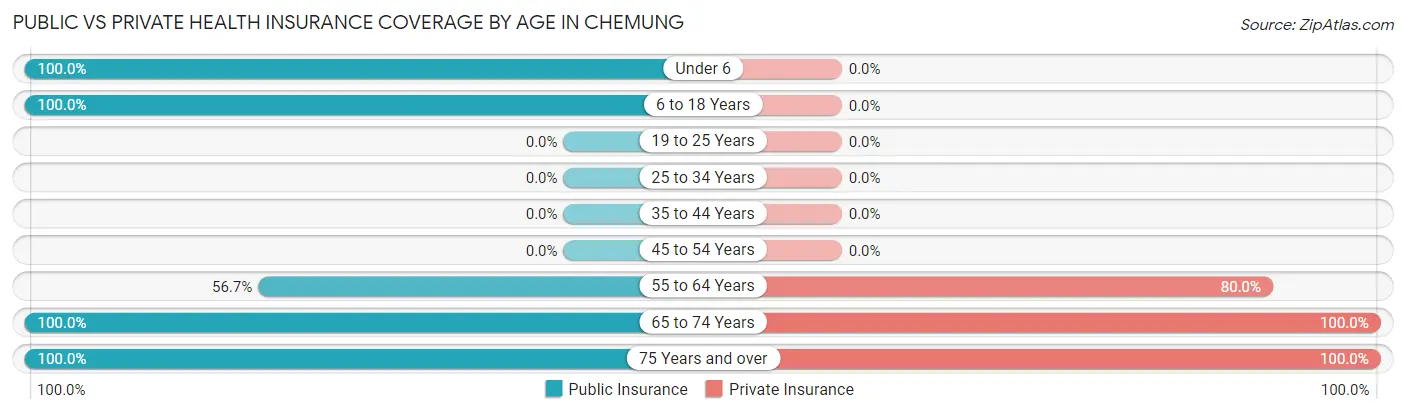
| Age Bracket | Public Insurance | Private Insurance |
| Under 6 | 29 (100.0%) | 0 (0.0%) |
| 6 to 18 Years | 51 (100.0%) | 0 (0.0%) |
| 19 to 25 Years | 0 (0.0%) | 0 (0.0%) |
| 25 to 34 Years | 0 (0.0%) | 0 (0.0%) |
| 35 to 44 Years | 0 (0.0%) | 0 (0.0%) |
| 45 to 54 Years | 0 (0.0%) | 0 (0.0%) |
| 55 to 64 Years | 17 (56.7%) | 24 (80.0%) |
| 65 to 74 Years | 89 (100.0%) | 89 (100.0%) |
| 75 Years and over | 128 (100.0%) | 128 (100.0%) |
| Total | 314 (81.4%) | 241 (62.4%) |
Disability Status by Sex by Age in Chemung
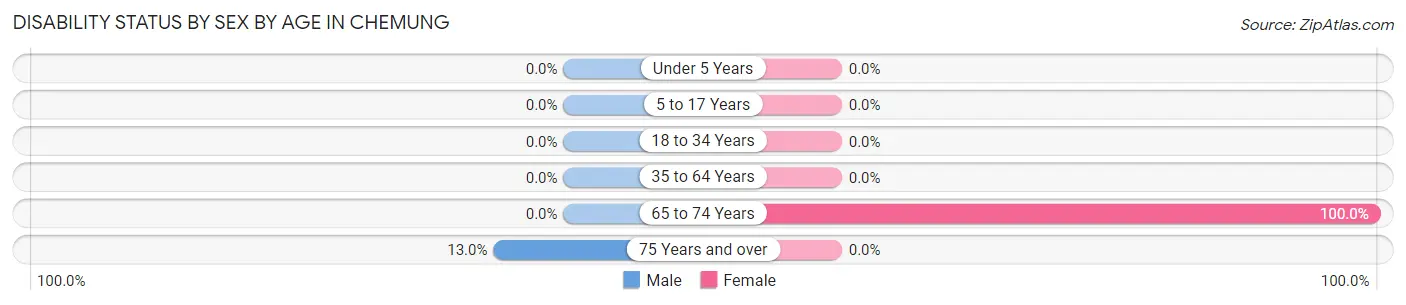
| Age Bracket | Male | Female |
| Under 5 Years | 0 (0.0%) | 0 (0.0%) |
| 5 to 17 Years | 0 (0.0%) | 0 (0.0%) |
| 18 to 34 Years | 0 (0.0%) | 0 (0.0%) |
| 35 to 64 Years | 0 (0.0%) | 0 (0.0%) |
| 65 to 74 Years | 0 (0.0%) | 89 (100.0%) |
| 75 Years and over | 16 (13.0%) | 0 (0.0%) |
Disability Class by Sex by Age in Chemung
Disability Class: Hearing Difficulty
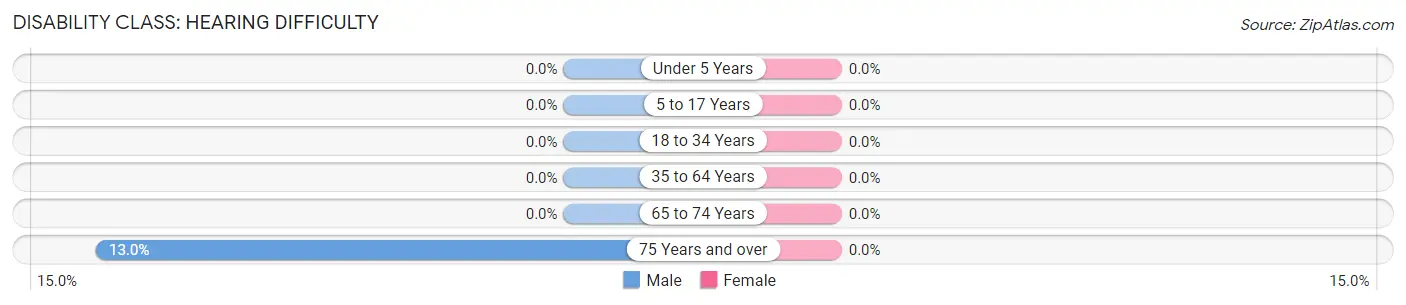
| Age Bracket | Male | Female |
| Under 5 Years | 0 (0.0%) | 0 (0.0%) |
| 5 to 17 Years | 0 (0.0%) | 0 (0.0%) |
| 18 to 34 Years | 0 (0.0%) | 0 (0.0%) |
| 35 to 64 Years | 0 (0.0%) | 0 (0.0%) |
| 65 to 74 Years | 0 (0.0%) | 0 (0.0%) |
| 75 Years and over | 16 (13.0%) | 0 (0.0%) |
Disability Class: Vision Difficulty
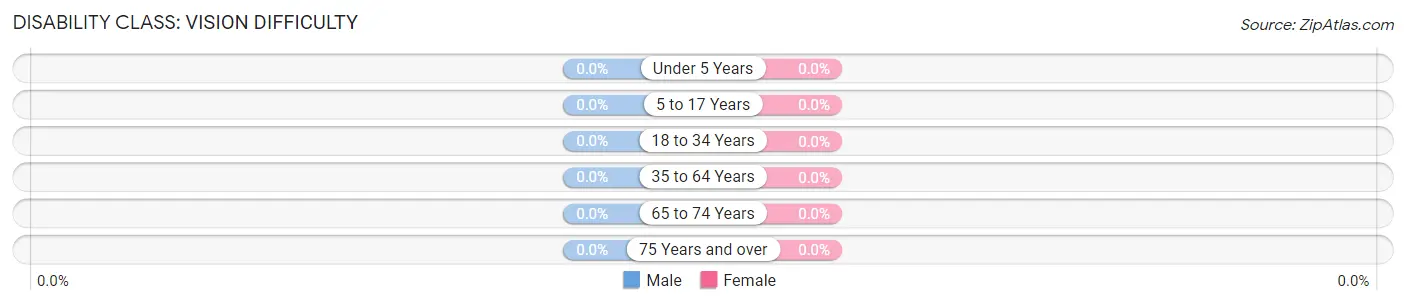
| Age Bracket | Male | Female |
| Under 5 Years | 0 (0.0%) | 0 (0.0%) |
| 5 to 17 Years | 0 (0.0%) | 0 (0.0%) |
| 18 to 34 Years | 0 (0.0%) | 0 (0.0%) |
| 35 to 64 Years | 0 (0.0%) | 0 (0.0%) |
| 65 to 74 Years | 0 (0.0%) | 0 (0.0%) |
| 75 Years and over | 0 (0.0%) | 0 (0.0%) |
Disability Class: Cognitive Difficulty
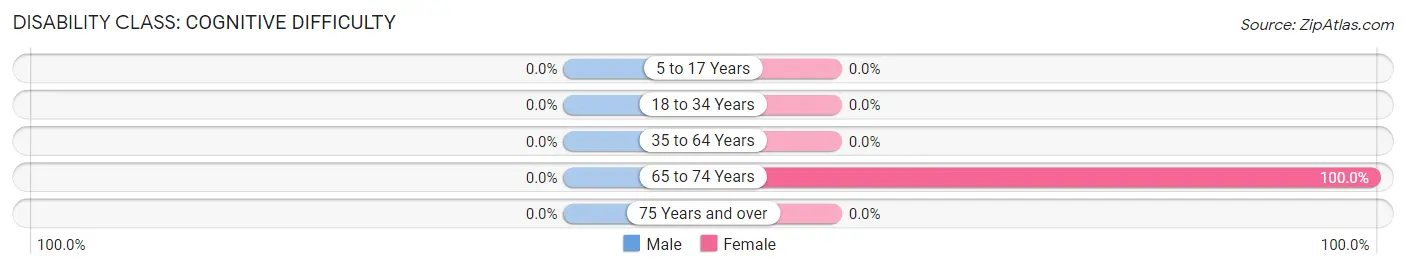
| Age Bracket | Male | Female |
| 5 to 17 Years | 0 (0.0%) | 0 (0.0%) |
| 18 to 34 Years | 0 (0.0%) | 0 (0.0%) |
| 35 to 64 Years | 0 (0.0%) | 0 (0.0%) |
| 65 to 74 Years | 0 (0.0%) | 89 (100.0%) |
| 75 Years and over | 0 (0.0%) | 0 (0.0%) |
Disability Class: Ambulatory Difficulty
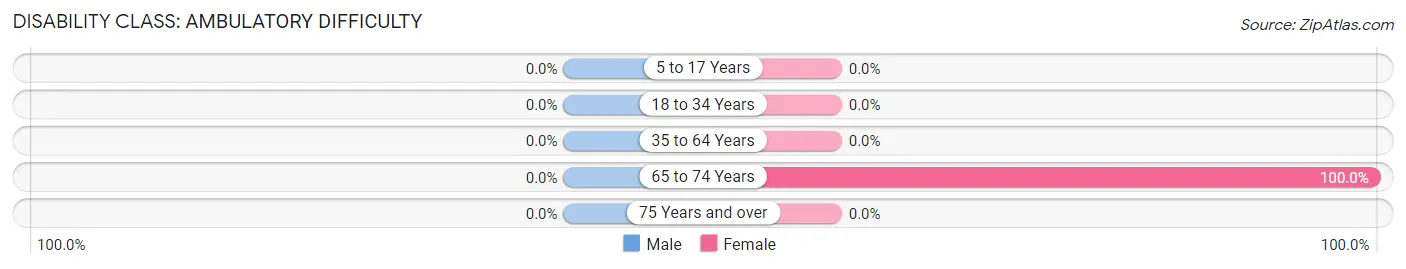
| Age Bracket | Male | Female |
| 5 to 17 Years | 0 (0.0%) | 0 (0.0%) |
| 18 to 34 Years | 0 (0.0%) | 0 (0.0%) |
| 35 to 64 Years | 0 (0.0%) | 0 (0.0%) |
| 65 to 74 Years | 0 (0.0%) | 89 (100.0%) |
| 75 Years and over | 0 (0.0%) | 0 (0.0%) |
Disability Class: Self-Care Difficulty
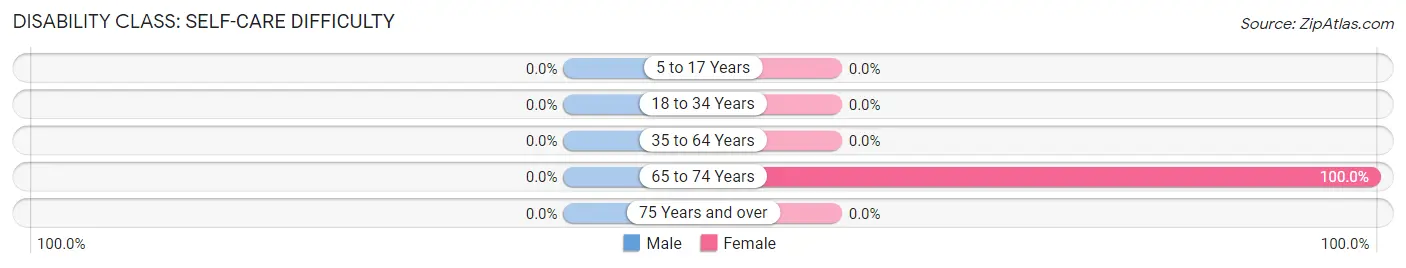
| Age Bracket | Male | Female |
| 5 to 17 Years | 0 (0.0%) | 0 (0.0%) |
| 18 to 34 Years | 0 (0.0%) | 0 (0.0%) |
| 35 to 64 Years | 0 (0.0%) | 0 (0.0%) |
| 65 to 74 Years | 0 (0.0%) | 89 (100.0%) |
| 75 Years and over | 0 (0.0%) | 0 (0.0%) |
Technology Access in Chemung
Computing Device Access in Chemung
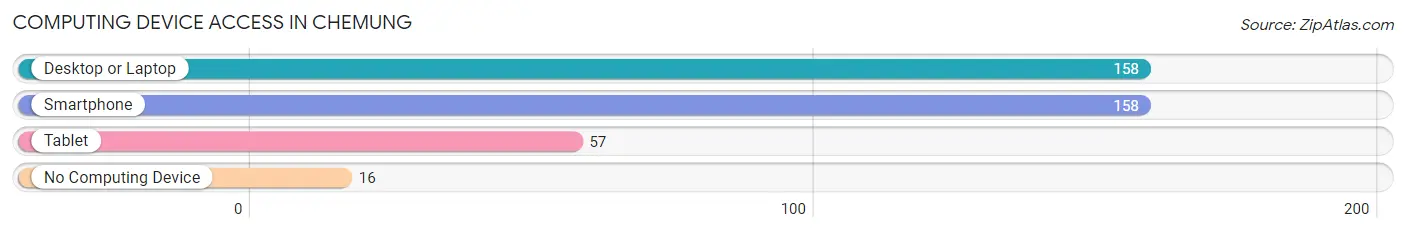
| Device Type | # Households | % Households |
| Desktop or Laptop | 158 | 90.8% |
| Smartphone | 158 | 90.8% |
| Tablet | 57 | 32.8% |
| No Computing Device | 16 | 9.2% |
| Total | 174 | 100.0% |
Internet Access in Chemung
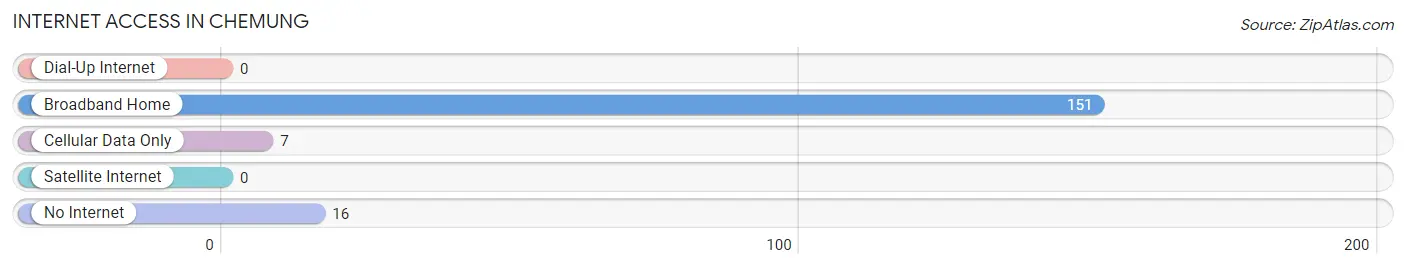
| Internet Type | # Households | % Households |
| Dial-Up Internet | 0 | 0.0% |
| Broadband Home | 151 | 86.8% |
| Cellular Data Only | 7 | 4.0% |
| Satellite Internet | 0 | 0.0% |
| No Internet | 16 | 9.2% |
| Total | 174 | 100.0% |
Chemung Summary
History
Chemung is a small village located in McLean County, Illinois. It is situated on the banks of the Sangamon River, approximately 10 miles south of Bloomington. The village was founded in 1854 by a group of settlers from New York, who named it after the Chemung River in their home state. The village was incorporated in 1859 and has remained a small, rural community ever since.
The first settlers of Chemung were primarily farmers, and the village quickly became a center of agricultural activity. The village was home to several grain elevators, a flour mill, and a sawmill. In the late 19th century, the village also had a blacksmith, a harness shop, a general store, and a post office.
In the early 20th century, the village began to experience a period of growth and development. The railroad arrived in Chemung in 1906, and the village was connected to the national rail network. This allowed for the shipment of goods and materials to and from the village, and it also allowed for the growth of the local economy.
The village also experienced a period of industrial growth in the early 20th century. The Chemung Manufacturing Company was established in 1912, and it produced a variety of products, including farm implements, wagons, and furniture. The company was a major employer in the village, and it provided jobs for many of the local residents.
Geography
Chemung is located in McLean County, Illinois, approximately 10 miles south of Bloomington. The village is situated on the banks of the Sangamon River, and it is surrounded by rolling hills and farmland. The village is located in the Central Till Plain region of Illinois, and it is part of the larger Central Corn Belt Plains ecoregion.
The village has a total area of 0.7 square miles, all of which is land. The village is located at an elevation of 690 feet above sea level. The climate in Chemung is classified as humid continental, with hot, humid summers and cold, snowy winters.
Economy
The economy of Chemung is largely based on agriculture. The village is surrounded by farmland, and many of the local residents are employed in the agricultural sector. The village is also home to several grain elevators, which are used to store and ship grain and other agricultural products.
In addition to agriculture, the village is also home to several small businesses. These include a general store, a hardware store, a restaurant, and a gas station. The village also has a post office, a bank, and a library.
Demographics
As of the 2010 census, the population of Chemung was 545. The village has a total area of 0.7 square miles, and the population density is 778.3 people per square mile. The median age in the village is 43.7 years, and the median household income is $45,000.
The racial makeup of the village is 97.3% White, 0.7% African American, 0.2% Native American, 0.2% Asian, and 1.6% from other races. The village is also home to a small Hispanic population, which makes up 1.1% of the total population.
Conclusion
Chemung is a small village located in McLean County, Illinois. It was founded in 1854 by a group of settlers from New York, and it has remained a small, rural community ever since. The village is surrounded by farmland, and the economy is largely based on agriculture. The population of the village is 545, and the median age is 43.7 years. The village is home to several small businesses, and it is connected to the national rail network. Chemung is a small, rural community that has remained largely unchanged for over 150 years.
Common Questions
What is Per Capita Income in Chemung?
Per Capita income in Chemung is $23,880.
What is the Median Family Income in Chemung?
Median Family Income in Chemung is $63,403.
What is the Median Household income in Chemung?
Median Household Income in Chemung is $63,069.
What is Inequality or Gini Index in Chemung?
Inequality or Gini Index in Chemung is 0.15.
What is the Total Population of Chemung?
Total Population of Chemung is 386.
What is the Total Male Population of Chemung?
Total Male Population of Chemung is 224.
What is the Total Female Population of Chemung?
Total Female Population of Chemung is 162.
What is the Ratio of Males per 100 Females in Chemung?
There are 138.27 Males per 100 Females in Chemung.
What is the Ratio of Females per 100 Males in Chemung?
There are 72.32 Females per 100 Males in Chemung.
What is the Median Population Age in Chemung?
Median Population Age in Chemung is 69.3 Years.
What is the Average Family Size in Chemung
Average Family Size in Chemung is 2.4 People.
What is the Average Household Size in Chemung
Average Household Size in Chemung is 2.2 People.
How Large is the Labor Force in Chemung?
There are 43 People in the Labor Forcein in Chemung.
What is the Percentage of People in the Labor Force in Chemung?
14.1% of People are in the Labor Force in Chemung.
What is the Unemployment Rate in Chemung?
Unemployment Rate in Chemung is 7.0%.