Aurora, IL Map & Demographics
Aurora Map
Aurora Overview
$38,064
PER CAPITA INCOME
$97,491
AVG FAMILY INCOME
$85,943
AVG HOUSEHOLD INCOME
27.7%
WAGE / INCOME GAP [ % ]
72.3¢/ $1
WAGE / INCOME GAP [ $ ]
$9,560
FAMILY INCOME DEFICIT
0.42
INEQUALITY / GINI INDEX
181,405
TOTAL POPULATION
90,255
MALE POPULATION
91,150
FEMALE POPULATION
99.02
MALES / 100 FEMALES
100.99
FEMALES / 100 MALES
35.4
MEDIAN AGE
3.4
AVG FAMILY SIZE
3.0
AVG HOUSEHOLD SIZE
101,279
LABOR FORCE [ PEOPLE ]
72.7%
PERCENT IN LABOR FORCE
5.6%
UNEMPLOYMENT RATE
Income in Aurora
Income Overview in Aurora
Per Capita Income in Aurora is $38,064, while median incomes of families and households are $97,491 and $85,943 respectively.
| Characteristic | Number | Measure |
| Per Capita Income | 181,405 | $38,064 |
| Median Family Income | 44,723 | $97,491 |
| Mean Family Income | 44,723 | $121,881 |
| Median Household Income | 60,492 | $85,943 |
| Mean Household Income | 60,492 | $112,069 |
| Income Deficit | 44,723 | $9,560 |
| Wage / Income Gap (%) | 181,405 | 27.73% |
| Wage / Income Gap ($) | 181,405 | 72.27¢ per $1 |
| Gini / Inequality Index | 181,405 | 0.42 |
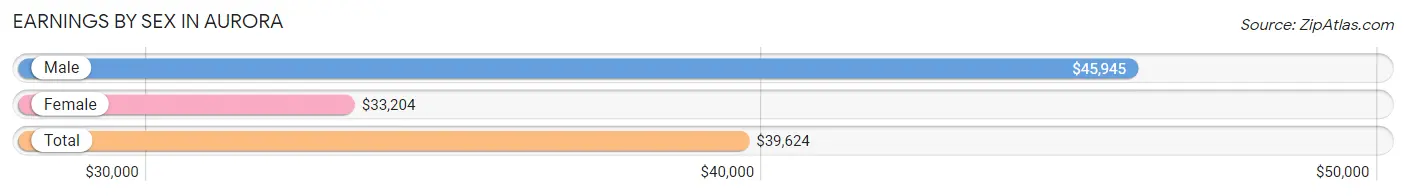
Earnings by Sex in Aurora
Average Earnings in Aurora are $39,624, $45,945 for men and $33,204 for women, a difference of 27.7%.
| Sex | Number | Average Earnings |
| Male | 55,337 (52.7%) | $45,945 |
| Female | 49,575 (47.2%) | $33,204 |
| Total | 104,912 (100.0%) | $39,624 |
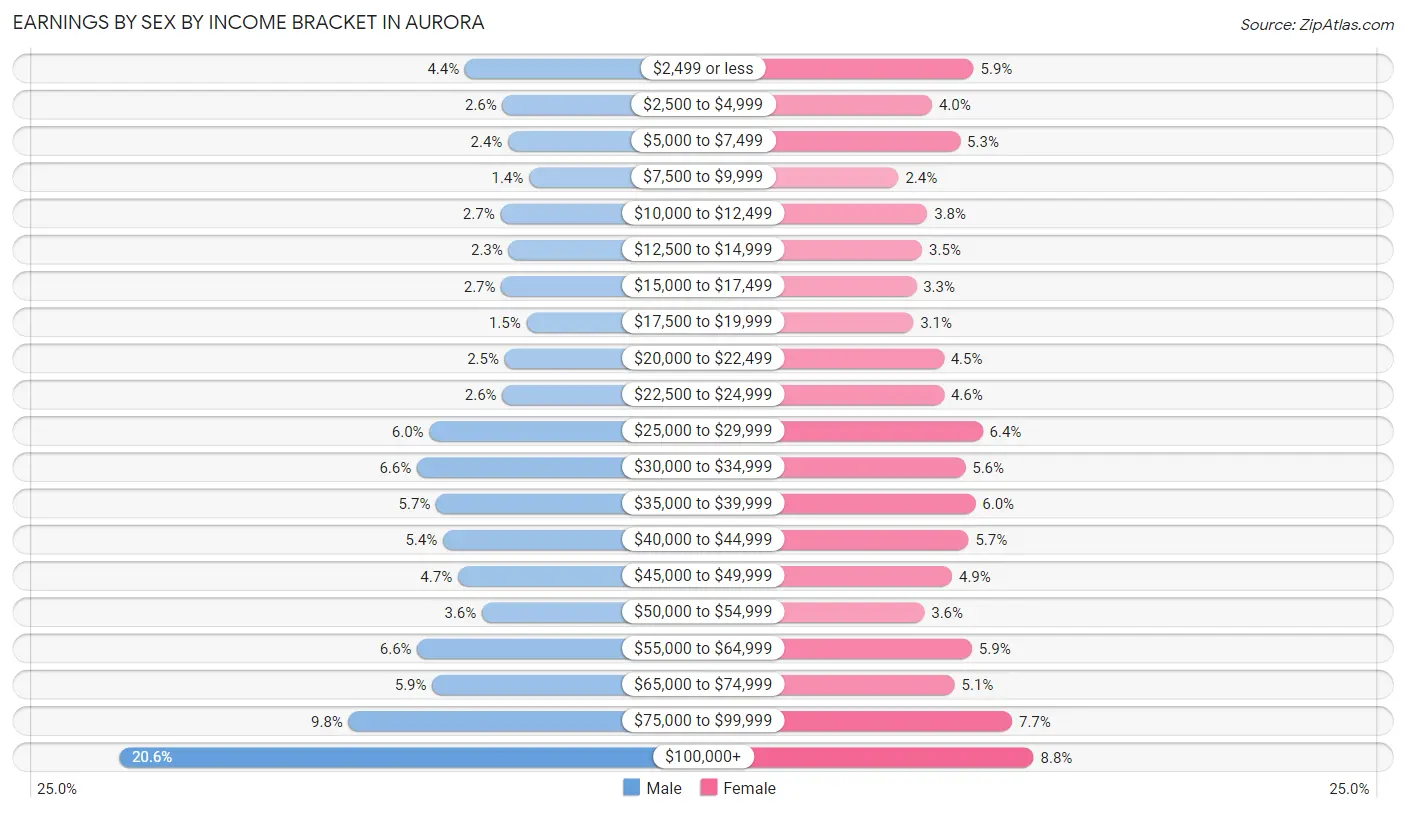
Earnings by Sex by Income Bracket in Aurora
The most common earnings brackets in Aurora are $100,000+ for men (11,391 | 20.6%) and $100,000+ for women (4,336 | 8.7%).
| Income | Male | Female |
| $2,499 or less | 2,418 (4.4%) | 2,943 (5.9%) |
| $2,500 to $4,999 | 1,447 (2.6%) | 1,979 (4.0%) |
| $5,000 to $7,499 | 1,300 (2.4%) | 2,630 (5.3%) |
| $7,500 to $9,999 | 759 (1.4%) | 1,199 (2.4%) |
| $10,000 to $12,499 | 1,501 (2.7%) | 1,868 (3.8%) |
| $12,500 to $14,999 | 1,292 (2.3%) | 1,752 (3.5%) |
| $15,000 to $17,499 | 1,479 (2.7%) | 1,609 (3.3%) |
| $17,500 to $19,999 | 823 (1.5%) | 1,541 (3.1%) |
| $20,000 to $22,499 | 1,391 (2.5%) | 2,252 (4.5%) |
| $22,500 to $24,999 | 1,448 (2.6%) | 2,258 (4.5%) |
| $25,000 to $29,999 | 3,340 (6.0%) | 3,151 (6.4%) |
| $30,000 to $34,999 | 3,661 (6.6%) | 2,750 (5.6%) |
| $35,000 to $39,999 | 3,168 (5.7%) | 2,986 (6.0%) |
| $40,000 to $44,999 | 2,987 (5.4%) | 2,824 (5.7%) |
| $45,000 to $49,999 | 2,599 (4.7%) | 2,446 (4.9%) |
| $50,000 to $54,999 | 1,978 (3.6%) | 1,802 (3.6%) |
| $55,000 to $64,999 | 3,653 (6.6%) | 2,904 (5.9%) |
| $65,000 to $74,999 | 3,267 (5.9%) | 2,506 (5.1%) |
| $75,000 to $99,999 | 5,435 (9.8%) | 3,839 (7.7%) |
| $100,000+ | 11,391 (20.6%) | 4,336 (8.7%) |
| Total | 55,337 (100.0%) | 49,575 (100.0%) |
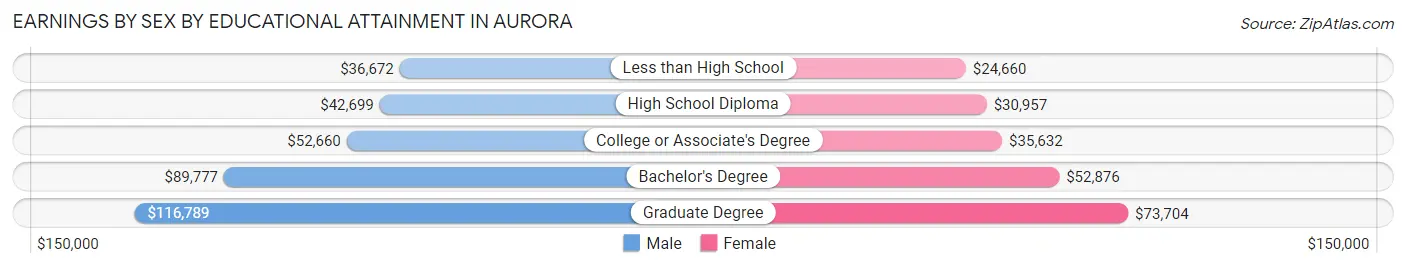
Earnings by Sex by Educational Attainment in Aurora
Average earnings in Aurora are $55,442 for men and $38,867 for women, a difference of 29.9%. Men with an educational attainment of graduate degree enjoy the highest average annual earnings of $116,789, while those with less than high school education earn the least with $36,672. Women with an educational attainment of graduate degree earn the most with the average annual earnings of $73,704, while those with less than high school education have the smallest earnings of $24,660.
| Educational Attainment | Male Income | Female Income |
| Less than High School | $36,672 | $24,660 |
| High School Diploma | $42,699 | $30,957 |
| College or Associate's Degree | $52,660 | $35,632 |
| Bachelor's Degree | $89,777 | $52,876 |
| Graduate Degree | $116,789 | $73,704 |
| Total | $55,442 | $38,867 |
Family Income in Aurora
Family Income Brackets in Aurora
According to the Aurora family income data, there are 9,481 families falling into the $100,000 to $149,999 income range, which is the most common income bracket and makes up 21.2% of all families. Conversely, the $10,000 to $14,999 income bracket is the least frequent group with only 805 families (1.8%) belonging to this category.
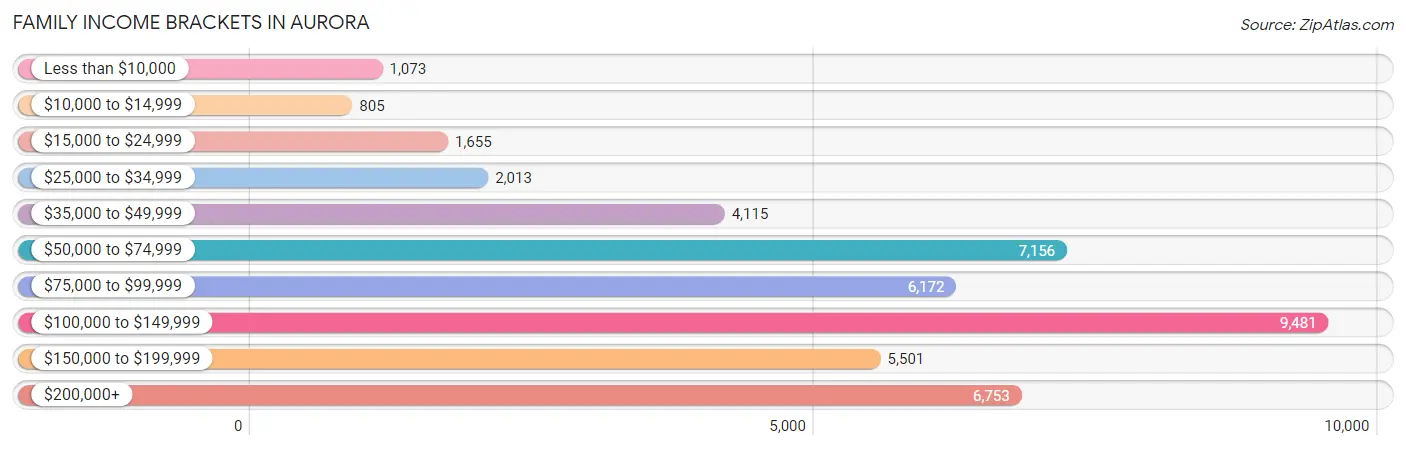
| Income Bracket | # Families | % Families |
| Less than $10,000 | 1,073 | 2.4% |
| $10,000 to $14,999 | 805 | 1.8% |
| $15,000 to $24,999 | 1,655 | 3.7% |
| $25,000 to $34,999 | 2,013 | 4.5% |
| $35,000 to $49,999 | 4,115 | 9.2% |
| $50,000 to $74,999 | 7,156 | 16.0% |
| $75,000 to $99,999 | 6,172 | 13.8% |
| $100,000 to $149,999 | 9,481 | 21.2% |
| $150,000 to $199,999 | 5,501 | 12.3% |
| $200,000+ | 6,753 | 15.1% |
Family Income by Famaliy Size in Aurora
4-person families (10,301 | 23.0%) account for the highest median family income in Aurora with $119,908 per family, while 2-person families (14,975 | 33.5%) have the highest median income of $42,841 per family member.
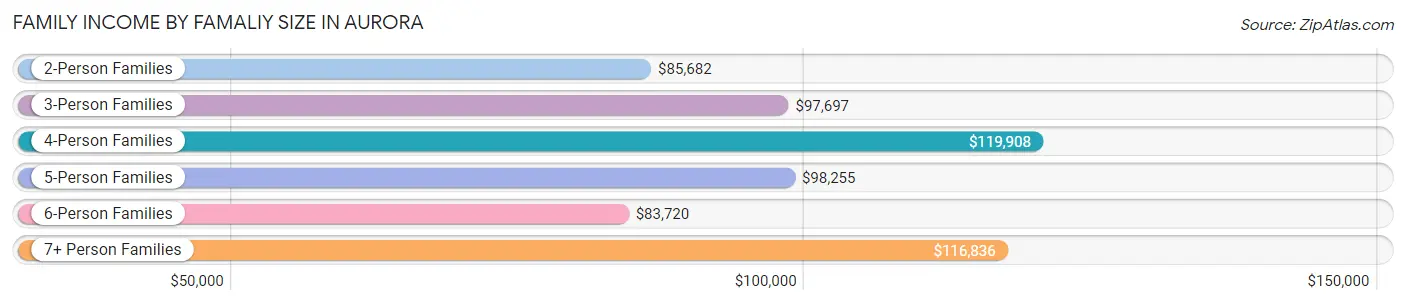
| Income Bracket | # Families | Median Income |
| 2-Person Families | 14,975 (33.5%) | $85,682 |
| 3-Person Families | 10,768 (24.1%) | $97,697 |
| 4-Person Families | 10,301 (23.0%) | $119,908 |
| 5-Person Families | 5,536 (12.4%) | $98,255 |
| 6-Person Families | 2,042 (4.6%) | $83,720 |
| 7+ Person Families | 1,101 (2.5%) | $116,836 |
| Total | 44,723 (100.0%) | $97,491 |
Family Income by Number of Earners in Aurora
The median family income in Aurora is $97,491, with families comprising 3+ earners (9,223) having the highest median family income of $130,144, while families with no earners (2,940) have the lowest median family income of $43,836, accounting for 20.6% and 6.6% of families, respectively.
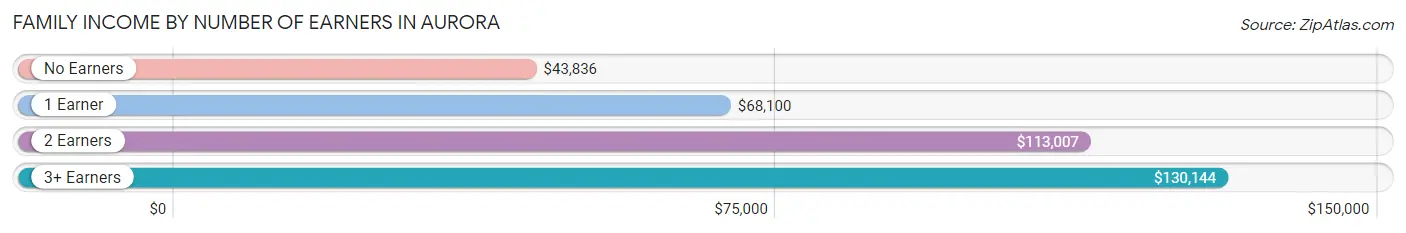
| Number of Earners | # Families | Median Income |
| No Earners | 2,940 (6.6%) | $43,836 |
| 1 Earner | 12,859 (28.7%) | $68,100 |
| 2 Earners | 19,701 (44.1%) | $113,007 |
| 3+ Earners | 9,223 (20.6%) | $130,144 |
| Total | 44,723 (100.0%) | $97,491 |
Household Income in Aurora
Household Income Brackets in Aurora
With 11,796 households falling in the category, the $100,000 to $149,999 income range is the most frequent in Aurora, accounting for 19.5% of all households. In contrast, only 1,149 households (1.9%) fall into the $10,000 to $14,999 income bracket, making it the least populous group.
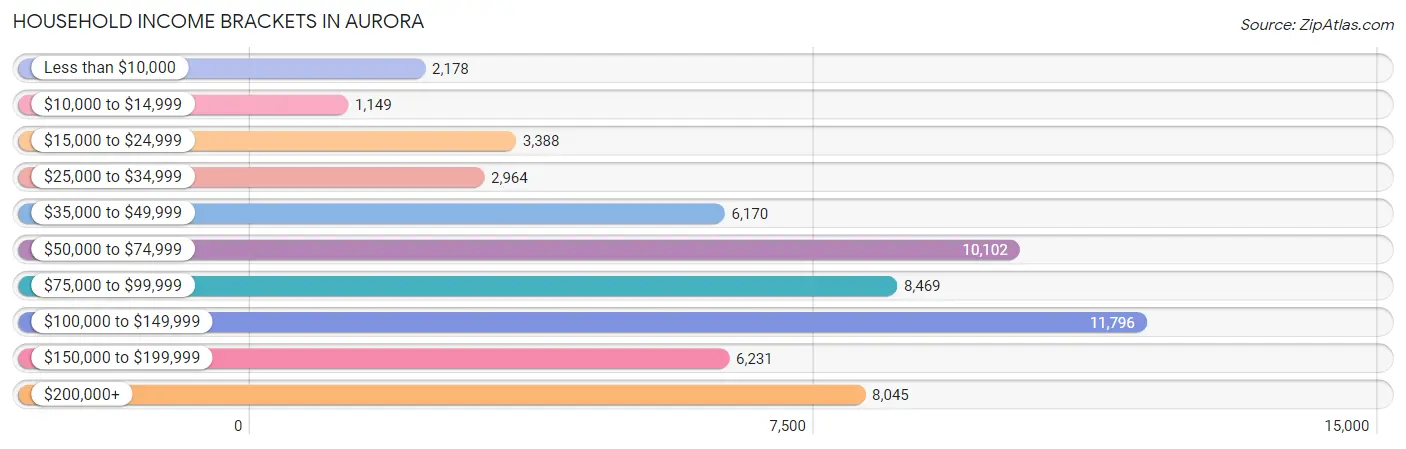
| Income Bracket | # Households | % Households |
| Less than $10,000 | 2,178 | 3.6% |
| $10,000 to $14,999 | 1,149 | 1.9% |
| $15,000 to $24,999 | 3,388 | 5.6% |
| $25,000 to $34,999 | 2,964 | 4.9% |
| $35,000 to $49,999 | 6,170 | 10.2% |
| $50,000 to $74,999 | 10,102 | 16.7% |
| $75,000 to $99,999 | 8,469 | 14.0% |
| $100,000 to $149,999 | 11,796 | 19.5% |
| $150,000 to $199,999 | 6,231 | 10.3% |
| $200,000+ | 8,045 | 13.3% |
Household Income by Householder Age in Aurora
The median household income in Aurora is $85,943, with the highest median household income of $104,603 found in the 45 to 64 years age bracket for the primary householder. A total of 24,573 households (40.6%) fall into this category. Meanwhile, the 15 to 24 years age bracket for the primary householder has the lowest median household income of $55,994, with 1,893 households (3.1%) in this group.
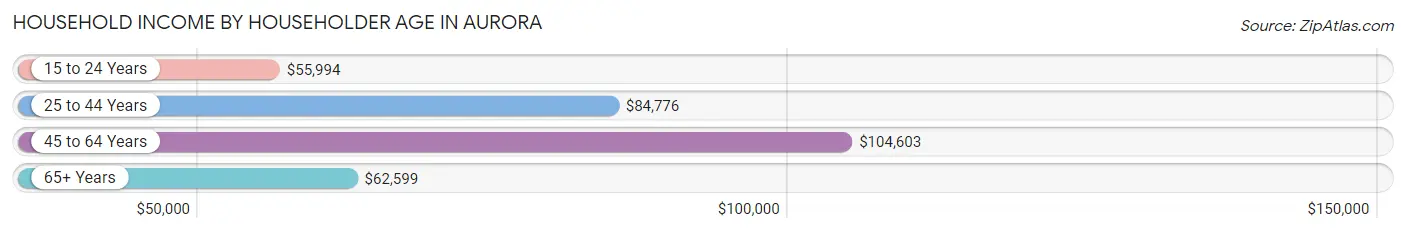
| Income Bracket | # Households | Median Income |
| 15 to 24 Years | 1,893 (3.1%) | $55,994 |
| 25 to 44 Years | 23,447 (38.8%) | $84,776 |
| 45 to 64 Years | 24,573 (40.6%) | $104,603 |
| 65+ Years | 10,579 (17.5%) | $62,599 |
| Total | 60,492 (100.0%) | $85,943 |
Poverty in Aurora
Income Below Poverty by Sex and Age in Aurora
With 9.0% poverty level for males and 11.3% for females among the residents of Aurora, 5 year old males and 5 year old females are the most vulnerable to poverty, with 324 males (31.8%) and 199 females (18.4%) in their respective age groups living below the poverty level.
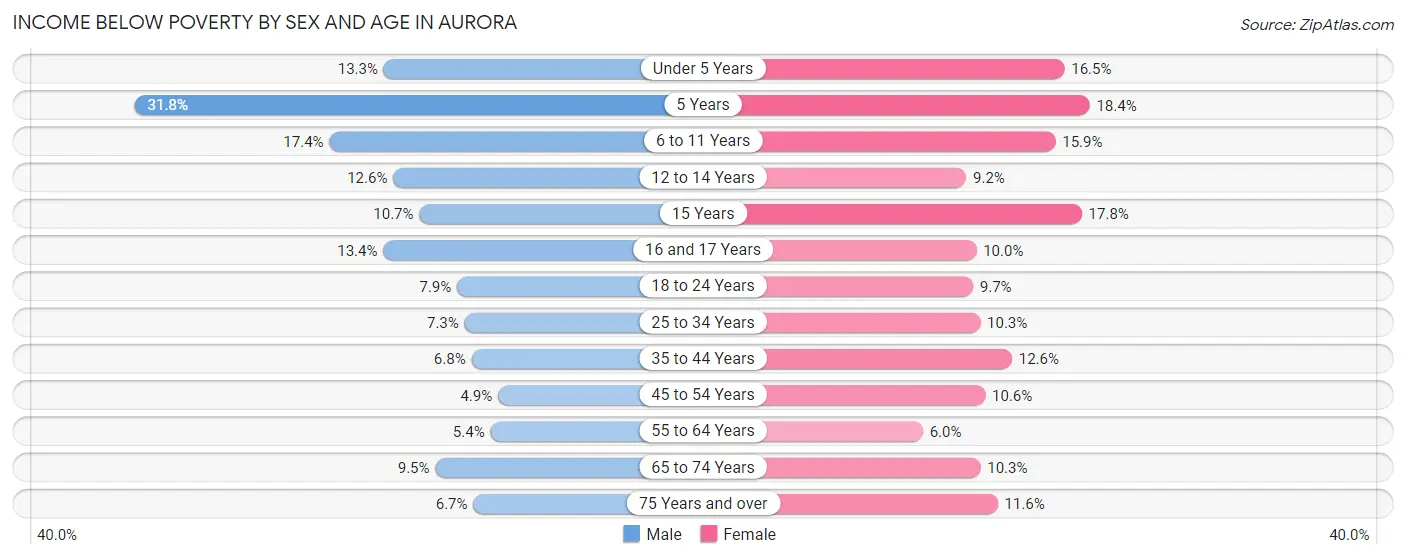
| Age Bracket | Male | Female |
| Under 5 Years | 831 (13.3%) | 872 (16.5%) |
| 5 Years | 324 (31.8%) | 199 (18.4%) |
| 6 to 11 Years | 1,466 (17.4%) | 1,201 (15.9%) |
| 12 to 14 Years | 549 (12.6%) | 410 (9.2%) |
| 15 Years | 168 (10.7%) | 276 (17.8%) |
| 16 and 17 Years | 412 (13.4%) | 329 (10.0%) |
| 18 to 24 Years | 728 (7.9%) | 826 (9.7%) |
| 25 to 34 Years | 848 (7.3%) | 1,162 (10.3%) |
| 35 to 44 Years | 962 (6.8%) | 1,801 (12.6%) |
| 45 to 54 Years | 648 (4.9%) | 1,373 (10.6%) |
| 55 to 64 Years | 470 (5.4%) | 554 (6.0%) |
| 65 to 74 Years | 512 (9.5%) | 697 (10.3%) |
| 75 Years and over | 159 (6.7%) | 460 (11.6%) |
| Total | 8,077 (9.0%) | 10,160 (11.3%) |
Income Above Poverty by Sex and Age in Aurora
According to the poverty statistics in Aurora, males aged 45 to 54 years and females aged 55 to 64 years are the age groups that are most secure financially, with 95.2% of males and 94.0% of females in these age groups living above the poverty line.
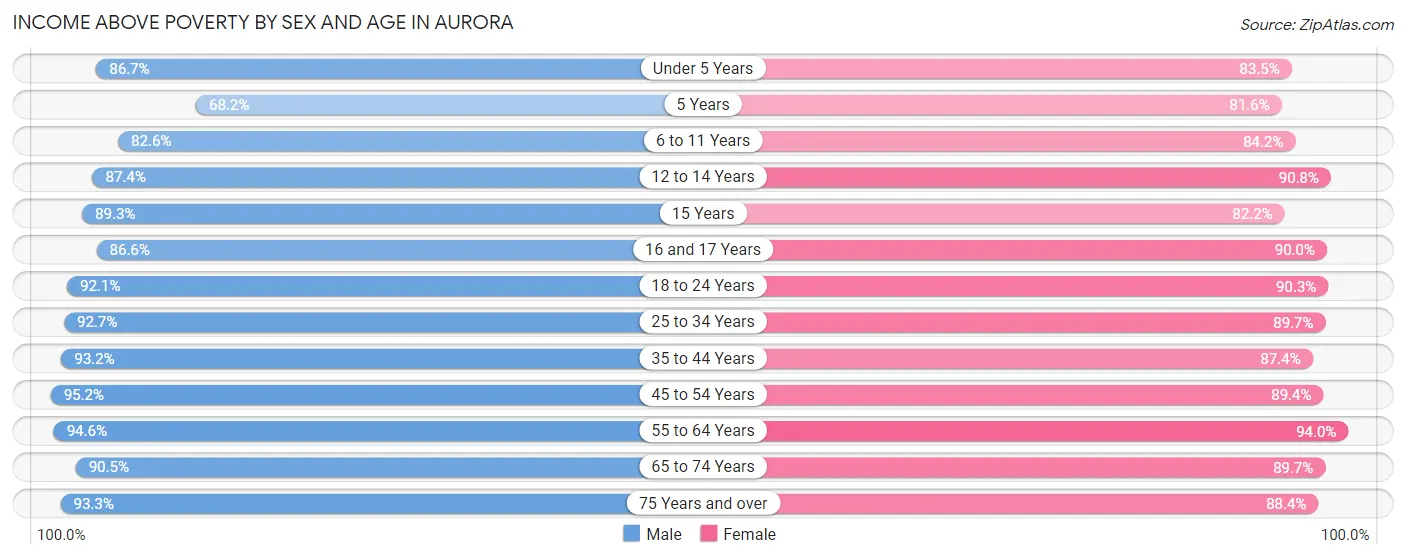
| Age Bracket | Male | Female |
| Under 5 Years | 5,402 (86.7%) | 4,405 (83.5%) |
| 5 Years | 694 (68.2%) | 883 (81.6%) |
| 6 to 11 Years | 6,973 (82.6%) | 6,378 (84.2%) |
| 12 to 14 Years | 3,798 (87.4%) | 4,030 (90.8%) |
| 15 Years | 1,403 (89.3%) | 1,274 (82.2%) |
| 16 and 17 Years | 2,669 (86.6%) | 2,969 (90.0%) |
| 18 to 24 Years | 8,503 (92.1%) | 7,665 (90.3%) |
| 25 to 34 Years | 10,727 (92.7%) | 10,148 (89.7%) |
| 35 to 44 Years | 13,148 (93.2%) | 12,470 (87.4%) |
| 45 to 54 Years | 12,706 (95.2%) | 11,534 (89.4%) |
| 55 to 64 Years | 8,219 (94.6%) | 8,663 (94.0%) |
| 65 to 74 Years | 4,876 (90.5%) | 6,086 (89.7%) |
| 75 Years and over | 2,222 (93.3%) | 3,516 (88.4%) |
| Total | 81,340 (91.0%) | 80,021 (88.7%) |
Income Below Poverty Among Married-Couple Families in Aurora
The poverty statistics for married-couple families in Aurora show that 4.7% or 1,470 of the total 31,105 families live below the poverty line. Families with 5 or more children have the highest poverty rate of 69.0%, comprising of 100 families. On the other hand, families with 1 or 2 children have the lowest poverty rate of 2.9%, which includes 392 families.
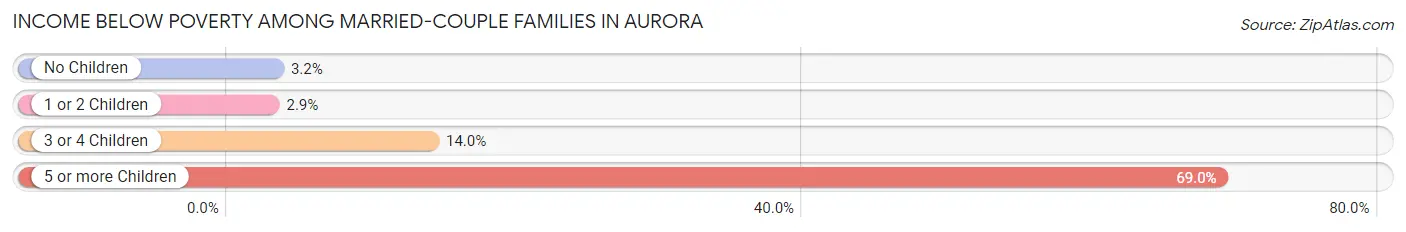
| Children | Above Poverty | Below Poverty |
| No Children | 13,053 (96.8%) | 432 (3.2%) |
| 1 or 2 Children | 13,184 (97.1%) | 392 (2.9%) |
| 3 or 4 Children | 3,353 (86.0%) | 546 (14.0%) |
| 5 or more Children | 45 (31.0%) | 100 (69.0%) |
| Total | 29,635 (95.3%) | 1,470 (4.7%) |
Income Below Poverty Among Single-Parent Households in Aurora
According to the poverty data in Aurora, 8.3% or 371 single-father households and 21.8% or 1,999 single-mother households are living below the poverty line. Among single-father households, those with 5 or more children have the highest poverty rate, with 8 households (34.8%) experiencing poverty. Likewise, among single-mother households, those with 5 or more children have the highest poverty rate, with 56 households (53.8%) falling below the poverty line.
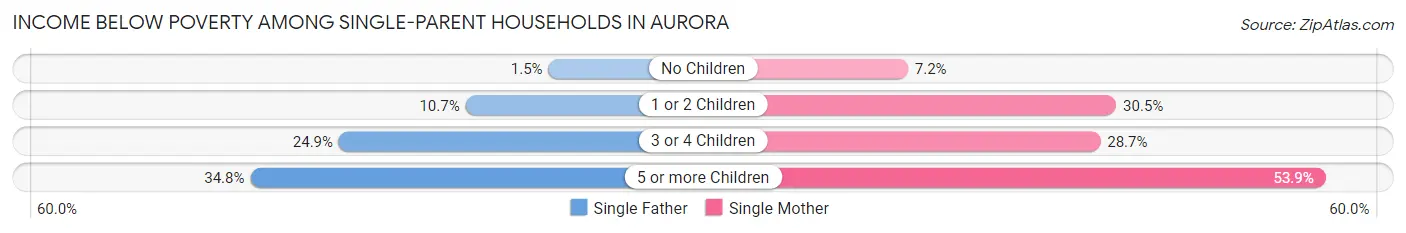
| Children | Single Father | Single Mother |
| No Children | 27 (1.5%) | 245 (7.2%) |
| 1 or 2 Children | 235 (10.7%) | 1,427 (30.4%) |
| 3 or 4 Children | 101 (24.9%) | 271 (28.7%) |
| 5 or more Children | 8 (34.8%) | 56 (53.8%) |
| Total | 371 (8.3%) | 1,999 (21.8%) |
Income Below Poverty Among Married-Couple vs Single-Parent Households in Aurora
The poverty data for Aurora shows that 1,470 of the married-couple family households (4.7%) and 2,370 of the single-parent households (17.4%) are living below the poverty level. Within the married-couple family households, those with 5 or more children have the highest poverty rate, with 100 households (69.0%) falling below the poverty line. Among the single-parent households, those with 5 or more children have the highest poverty rate, with 64 household (50.4%) living below poverty.
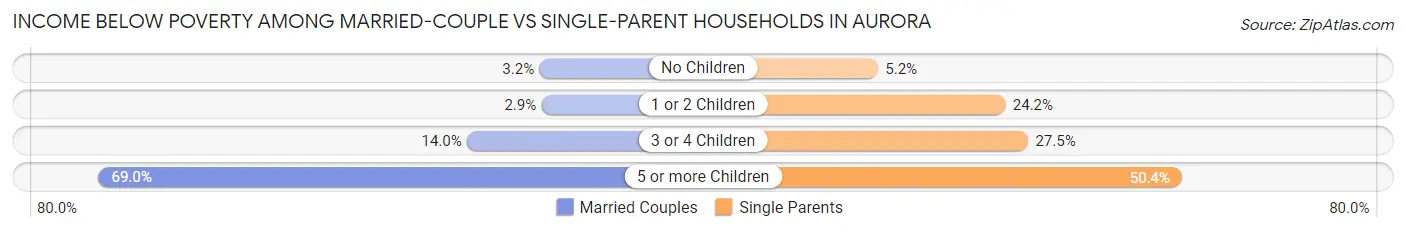
| Children | Married-Couple Families | Single-Parent Households |
| No Children | 432 (3.2%) | 272 (5.2%) |
| 1 or 2 Children | 392 (2.9%) | 1,662 (24.2%) |
| 3 or 4 Children | 546 (14.0%) | 372 (27.5%) |
| 5 or more Children | 100 (69.0%) | 64 (50.4%) |
| Total | 1,470 (4.7%) | 2,370 (17.4%) |
Race in Aurora
The most populous races in Aurora are White / Caucasian (87,853 | 48.4%), Hispanic or Latino (76,816 | 42.3%), and Two or more Races (30,037 | 16.6%).
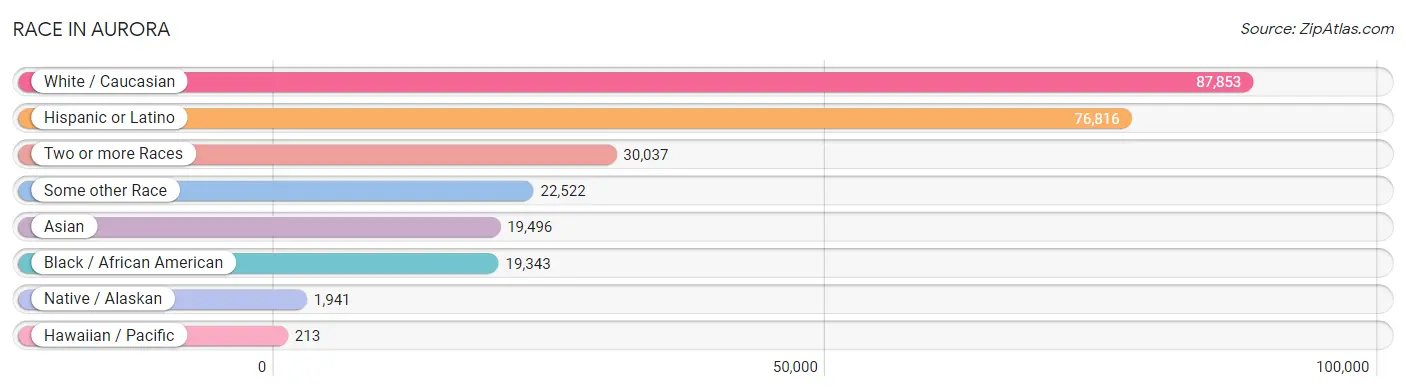
| Race | # Population | % Population |
| Asian | 19,496 | 10.7% |
| Black / African American | 19,343 | 10.7% |
| Hawaiian / Pacific | 213 | 0.1% |
| Hispanic or Latino | 76,816 | 42.3% |
| Native / Alaskan | 1,941 | 1.1% |
| White / Caucasian | 87,853 | 48.4% |
| Two or more Races | 30,037 | 16.6% |
| Some other Race | 22,522 | 12.4% |
| Total | 181,405 | 100.0% |
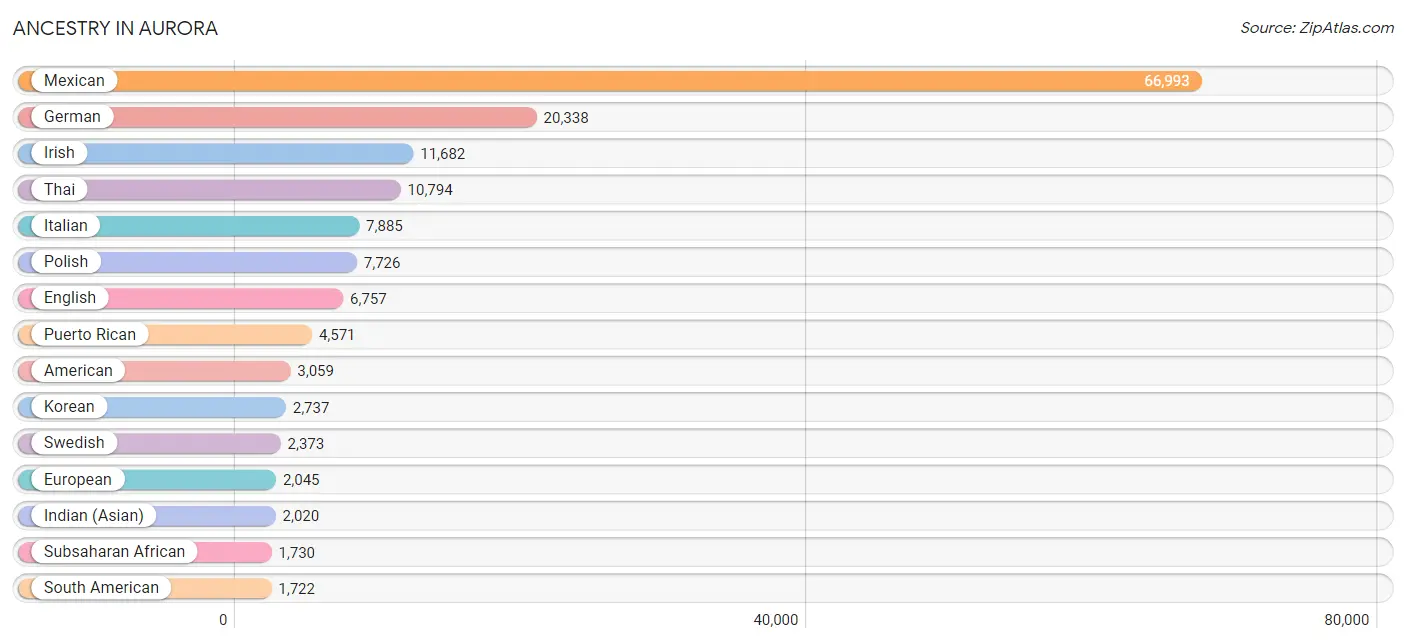
Ancestry in Aurora
The most populous ancestries reported in Aurora are Mexican (66,993 | 36.9%), German (20,338 | 11.2%), Irish (11,682 | 6.4%), Thai (10,794 | 5.9%), and Italian (7,885 | 4.3%), together accounting for 64.9% of all Aurora residents.
| Ancestry | # Population | % Population |
| Afghan | 39 | 0.0% |
| African | 729 | 0.4% |
| Alaska Native | 52 | 0.0% |
| Alaskan Athabascan | 28 | 0.0% |
| Albanian | 307 | 0.2% |
| American | 3,059 | 1.7% |
| Apache | 22 | 0.0% |
| Arab | 908 | 0.5% |
| Argentinean | 294 | 0.2% |
| Armenian | 12 | 0.0% |
| Australian | 6 | 0.0% |
| Austrian | 332 | 0.2% |
| Bangladeshi | 23 | 0.0% |
| Belgian | 158 | 0.1% |
| Belizean | 11 | 0.0% |
| Bhutanese | 308 | 0.2% |
| Blackfeet | 35 | 0.0% |
| Bolivian | 41 | 0.0% |
| Brazilian | 10 | 0.0% |
| British | 375 | 0.2% |
| British West Indian | 3 | 0.0% |
| Bulgarian | 324 | 0.2% |
| Burmese | 606 | 0.3% |
| Cambodian | 47 | 0.0% |
| Canadian | 116 | 0.1% |
| Cape Verdean | 38 | 0.0% |
| Central American | 1,277 | 0.7% |
| Central American Indian | 307 | 0.2% |
| Cherokee | 260 | 0.1% |
| Chilean | 102 | 0.1% |
| Chippewa | 94 | 0.1% |
| Colombian | 635 | 0.4% |
| Costa Rican | 18 | 0.0% |
| Croatian | 308 | 0.2% |
| Crow | 6 | 0.0% |
| Cuban | 498 | 0.3% |
| Cypriot | 51 | 0.0% |
| Czech | 1,003 | 0.5% |
| Czechoslovakian | 307 | 0.2% |
| Danish | 330 | 0.2% |
| Delaware | 4 | 0.0% |
| Dominican | 348 | 0.2% |
| Dutch | 951 | 0.5% |
| Eastern European | 465 | 0.3% |
| Ecuadorian | 212 | 0.1% |
| Egyptian | 28 | 0.0% |
| English | 6,757 | 3.7% |
| Estonian | 9 | 0.0% |
| Ethiopian | 35 | 0.0% |
| European | 2,045 | 1.1% |
| Fijian | 3 | 0.0% |
| Filipino | 17 | 0.0% |
| Finnish | 238 | 0.1% |
| French | 1,644 | 0.9% |
| French Canadian | 305 | 0.2% |
| German | 20,338 | 11.2% |
| Greek | 715 | 0.4% |
| Guamanian / Chamorro | 8 | 0.0% |
| Guatemalan | 629 | 0.4% |
| Guyanese | 10 | 0.0% |
| Honduran | 67 | 0.0% |
| Hungarian | 500 | 0.3% |
| Icelander | 26 | 0.0% |
| Indian (Asian) | 2,020 | 1.1% |
| Indonesian | 271 | 0.2% |
| Inupiat | 30 | 0.0% |
| Iranian | 108 | 0.1% |
| Iraqi | 137 | 0.1% |
| Irish | 11,682 | 6.4% |
| Italian | 7,885 | 4.3% |
| Jamaican | 264 | 0.2% |
| Jordanian | 79 | 0.0% |
| Korean | 2,737 | 1.5% |
| Laotian | 43 | 0.0% |
| Latvian | 11 | 0.0% |
| Lebanese | 96 | 0.1% |
| Lithuanian | 747 | 0.4% |
| Luxembourger | 399 | 0.2% |
| Macedonian | 43 | 0.0% |
| Malaysian | 354 | 0.2% |
| Maltese | 51 | 0.0% |
| Mexican | 66,993 | 36.9% |
| Mexican American Indian | 1,030 | 0.6% |
| Mongolian | 26 | 0.0% |
| Moroccan | 16 | 0.0% |
| Native Hawaiian | 64 | 0.0% |
| Navajo | 40 | 0.0% |
| New Zealander | 20 | 0.0% |
| Nicaraguan | 153 | 0.1% |
| Nigerian | 696 | 0.4% |
| Northern European | 126 | 0.1% |
| Norwegian | 1,657 | 0.9% |
| Okinawan | 22 | 0.0% |
| Pakistani | 216 | 0.1% |
| Palestinian | 88 | 0.1% |
| Pennsylvania German | 23 | 0.0% |
| Peruvian | 203 | 0.1% |
| Polish | 7,726 | 4.3% |
| Portuguese | 132 | 0.1% |
| Puerto Rican | 4,571 | 2.5% |
| Romanian | 1,003 | 0.5% |
| Russian | 1,080 | 0.6% |
| Salvadoran | 410 | 0.2% |
| Scandinavian | 319 | 0.2% |
| Scotch-Irish | 577 | 0.3% |
| Scottish | 1,282 | 0.7% |
| Serbian | 162 | 0.1% |
| Sioux | 44 | 0.0% |
| Slavic | 54 | 0.0% |
| Slovak | 185 | 0.1% |
| Slovene | 75 | 0.0% |
| South American | 1,722 | 0.9% |
| Spaniard | 409 | 0.2% |
| Spanish | 120 | 0.1% |
| Sri Lankan | 740 | 0.4% |
| Subsaharan African | 1,730 | 0.9% |
| Swedish | 2,373 | 1.3% |
| Swiss | 99 | 0.1% |
| Syrian | 429 | 0.2% |
| Thai | 10,794 | 5.9% |
| Trinidadian and Tobagonian | 30 | 0.0% |
| Turkish | 52 | 0.0% |
| Ugandan | 38 | 0.0% |
| Ukrainian | 370 | 0.2% |
| Venezuelan | 235 | 0.1% |
| Vietnamese | 102 | 0.1% |
| Welsh | 453 | 0.3% |
| Yugoslavian | 126 | 0.1% | View All 128 Rows |
Immigrants in Aurora
The most numerous immigrant groups reported in Aurora came from Latin America (28,336 | 15.6%), Central America (26,471 | 14.6%), Mexico (25,652 | 14.1%), Asia (13,800 | 7.6%), and South Central Asia (9,001 | 5.0%), together accounting for 56.9% of all Aurora residents.
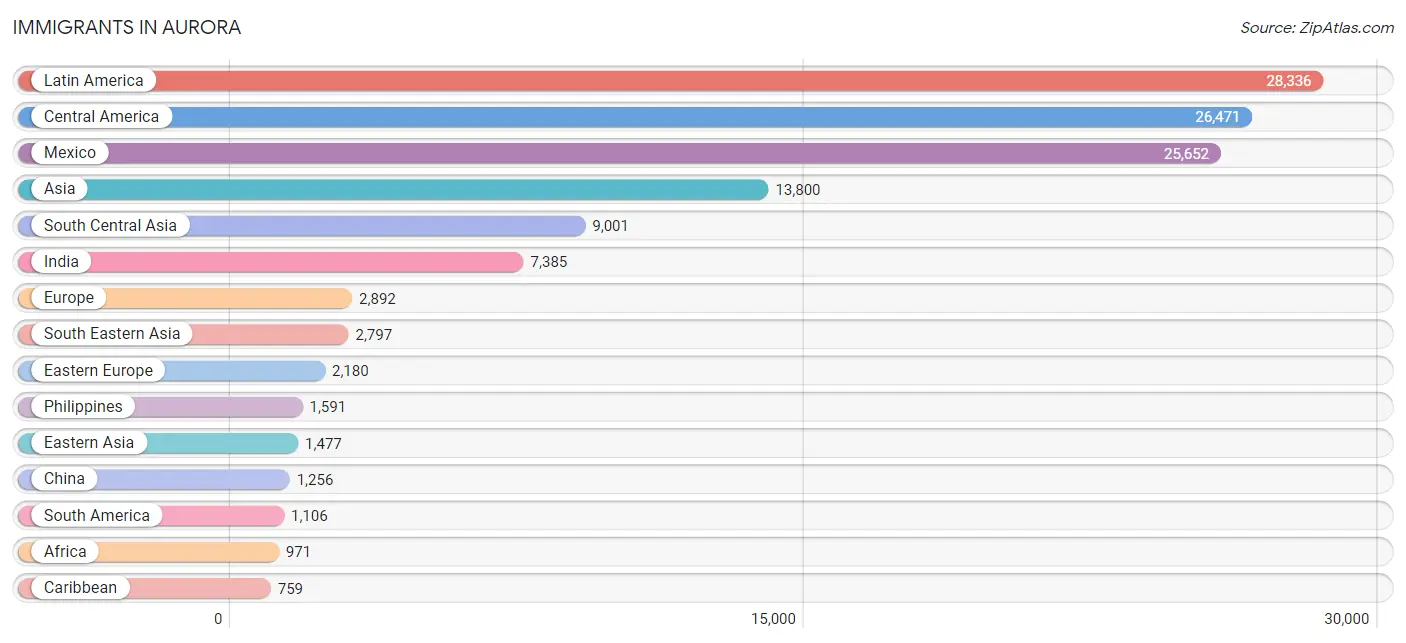
| Immigration Origin | # Population | % Population |
| Afghanistan | 123 | 0.1% |
| Africa | 971 | 0.5% |
| Albania | 219 | 0.1% |
| Argentina | 170 | 0.1% |
| Asia | 13,800 | 7.6% |
| Australia | 9 | 0.0% |
| Bangladesh | 135 | 0.1% |
| Belarus | 13 | 0.0% |
| Belize | 11 | 0.0% |
| Bolivia | 79 | 0.0% |
| Bosnia and Herzegovina | 7 | 0.0% |
| Brazil | 93 | 0.1% |
| Bulgaria | 201 | 0.1% |
| Canada | 267 | 0.2% |
| Caribbean | 759 | 0.4% |
| Central America | 26,471 | 14.6% |
| Chile | 42 | 0.0% |
| China | 1,256 | 0.7% |
| Colombia | 321 | 0.2% |
| Costa Rica | 5 | 0.0% |
| Croatia | 8 | 0.0% |
| Cuba | 420 | 0.2% |
| Czechoslovakia | 50 | 0.0% |
| Denmark | 15 | 0.0% |
| Dominican Republic | 132 | 0.1% |
| Eastern Africa | 173 | 0.1% |
| Eastern Asia | 1,477 | 0.8% |
| Eastern Europe | 2,180 | 1.2% |
| Ecuador | 155 | 0.1% |
| Egypt | 38 | 0.0% |
| El Salvador | 334 | 0.2% |
| England | 36 | 0.0% |
| Eritrea | 17 | 0.0% |
| Ethiopia | 18 | 0.0% |
| Europe | 2,892 | 1.6% |
| France | 21 | 0.0% |
| Germany | 245 | 0.1% |
| Greece | 47 | 0.0% |
| Guatemala | 224 | 0.1% |
| Guyana | 73 | 0.0% |
| Haiti | 6 | 0.0% |
| Honduras | 124 | 0.1% |
| Hong Kong | 94 | 0.1% |
| Hungary | 41 | 0.0% |
| India | 7,385 | 4.1% |
| Indonesia | 69 | 0.0% |
| Iran | 51 | 0.0% |
| Iraq | 93 | 0.1% |
| Ireland | 12 | 0.0% |
| Italy | 32 | 0.0% |
| Jamaica | 135 | 0.1% |
| Japan | 19 | 0.0% |
| Jordan | 27 | 0.0% |
| Kenya | 28 | 0.0% |
| Korea | 155 | 0.1% |
| Kuwait | 42 | 0.0% |
| Laos | 214 | 0.1% |
| Latin America | 28,336 | 15.6% |
| Lebanon | 19 | 0.0% |
| Liberia | 103 | 0.1% |
| Lithuania | 98 | 0.1% |
| Malaysia | 128 | 0.1% |
| Mexico | 25,652 | 14.1% |
| Middle Africa | 123 | 0.1% |
| Moldova | 396 | 0.2% |
| Morocco | 9 | 0.0% |
| Nepal | 212 | 0.1% |
| Nicaragua | 121 | 0.1% |
| Nigeria | 486 | 0.3% |
| North Macedonia | 68 | 0.0% |
| Northern Africa | 66 | 0.0% |
| Northern Europe | 336 | 0.2% |
| Oceania | 133 | 0.1% |
| Pakistan | 744 | 0.4% |
| Peru | 60 | 0.0% |
| Philippines | 1,591 | 0.9% |
| Poland | 415 | 0.2% |
| Romania | 33 | 0.0% |
| Russia | 478 | 0.3% |
| Saudi Arabia | 25 | 0.0% |
| Scotland | 94 | 0.1% |
| Serbia | 48 | 0.0% |
| Singapore | 57 | 0.0% |
| South America | 1,106 | 0.6% |
| South Central Asia | 9,001 | 5.0% |
| South Eastern Asia | 2,797 | 1.5% |
| Southern Europe | 110 | 0.1% |
| Spain | 31 | 0.0% |
| Sri Lanka | 32 | 0.0% |
| Sweden | 27 | 0.0% |
| Syria | 50 | 0.0% |
| Taiwan | 54 | 0.0% |
| Thailand | 132 | 0.1% |
| Trinidad and Tobago | 66 | 0.0% |
| Turkey | 7 | 0.0% |
| Uganda | 38 | 0.0% |
| Ukraine | 83 | 0.1% |
| Uzbekistan | 223 | 0.1% |
| Venezuela | 113 | 0.1% |
| Vietnam | 438 | 0.2% |
| Western Africa | 599 | 0.3% |
| Western Asia | 525 | 0.3% |
| Western Europe | 266 | 0.2% |
| Zaire | 112 | 0.1% | View All 104 Rows |
Sex and Age in Aurora
Sex and Age in Aurora
The most populous age groups in Aurora are 10 to 14 Years (7,759 | 8.6%) for men and 10 to 14 Years (7,572 | 8.3%) for women.
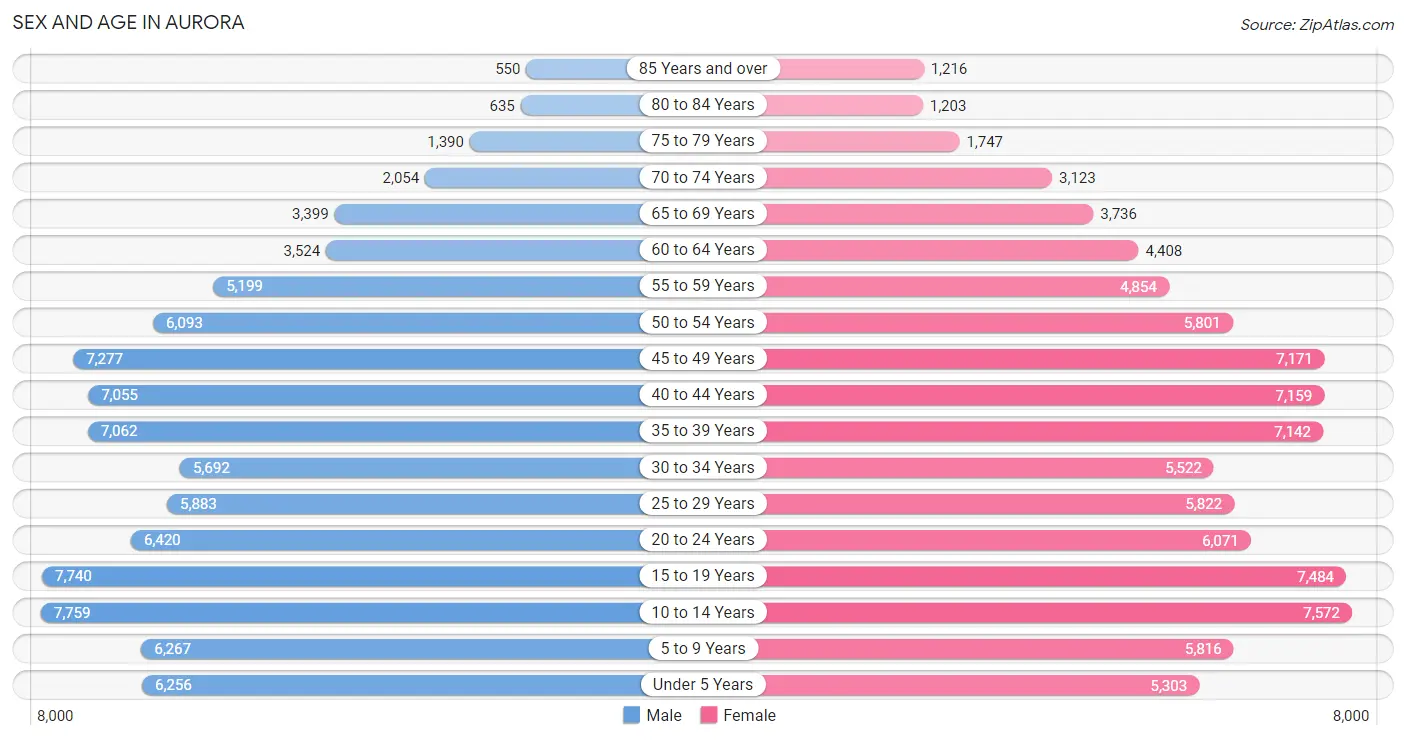
| Age Bracket | Male | Female |
| Under 5 Years | 6,256 (6.9%) | 5,303 (5.8%) |
| 5 to 9 Years | 6,267 (6.9%) | 5,816 (6.4%) |
| 10 to 14 Years | 7,759 (8.6%) | 7,572 (8.3%) |
| 15 to 19 Years | 7,740 (8.6%) | 7,484 (8.2%) |
| 20 to 24 Years | 6,420 (7.1%) | 6,071 (6.7%) |
| 25 to 29 Years | 5,883 (6.5%) | 5,822 (6.4%) |
| 30 to 34 Years | 5,692 (6.3%) | 5,522 (6.1%) |
| 35 to 39 Years | 7,062 (7.8%) | 7,142 (7.8%) |
| 40 to 44 Years | 7,055 (7.8%) | 7,159 (7.9%) |
| 45 to 49 Years | 7,277 (8.1%) | 7,171 (7.9%) |
| 50 to 54 Years | 6,093 (6.8%) | 5,801 (6.4%) |
| 55 to 59 Years | 5,199 (5.8%) | 4,854 (5.3%) |
| 60 to 64 Years | 3,524 (3.9%) | 4,408 (4.8%) |
| 65 to 69 Years | 3,399 (3.8%) | 3,736 (4.1%) |
| 70 to 74 Years | 2,054 (2.3%) | 3,123 (3.4%) |
| 75 to 79 Years | 1,390 (1.5%) | 1,747 (1.9%) |
| 80 to 84 Years | 635 (0.7%) | 1,203 (1.3%) |
| 85 Years and over | 550 (0.6%) | 1,216 (1.3%) |
| Total | 90,255 (100.0%) | 91,150 (100.0%) |
Families and Households in Aurora
Median Family Size in Aurora
The median family size in Aurora is 3.44 persons per family, with married-couple families (31,105 | 69.6%) accounting for the largest median family size of 3.61 persons per family. On the other hand, single male/father families (4,464 | 10.0%) represent the smallest median family size with 3.02 persons per family.
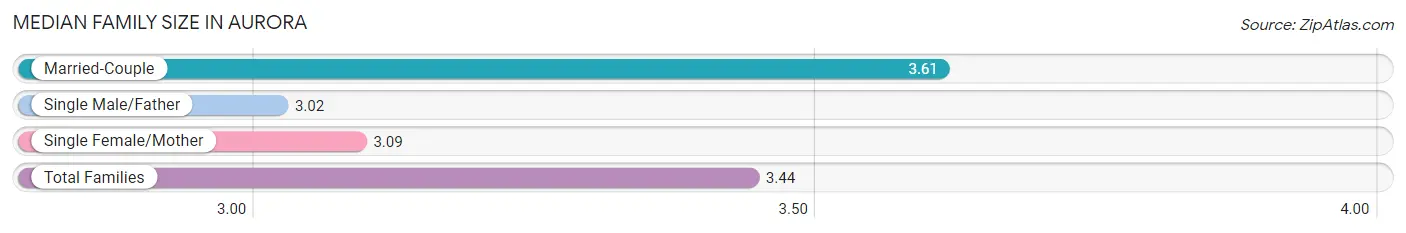
| Family Type | # Families | Family Size |
| Married-Couple | 31,105 (69.6%) | 3.61 |
| Single Male/Father | 4,464 (10.0%) | 3.02 |
| Single Female/Mother | 9,154 (20.5%) | 3.09 |
| Total Families | 44,723 (100.0%) | 3.44 |
Median Household Size in Aurora
The median household size in Aurora is 2.97 persons per household, with married-couple households (31,105 | 51.4%) accounting for the largest median household size of 3.65 persons per household. non-family households (15,769 | 26.1%) represent the smallest median household size with 1.27 persons per household.
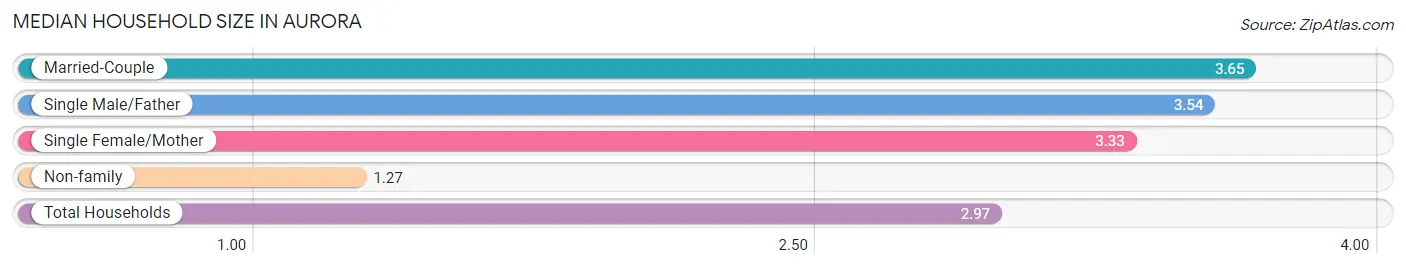
| Household Type | # Households | Household Size |
| Married-Couple | 31,105 (51.4%) | 3.65 |
| Single Male/Father | 4,464 (7.4%) | 3.54 |
| Single Female/Mother | 9,154 (15.1%) | 3.33 |
| Non-family | 15,769 (26.1%) | 1.27 |
| Total Households | 60,492 (100.0%) | 2.97 |
Household Size by Marriage Status in Aurora
Out of a total of 60,492 households in Aurora, 44,723 (73.9%) are family households, while 15,769 (26.1%) are nonfamily households. The most numerous type of family households are 2-person households, comprising 13,481, and the most common type of nonfamily households are 1-person households, comprising 12,166.
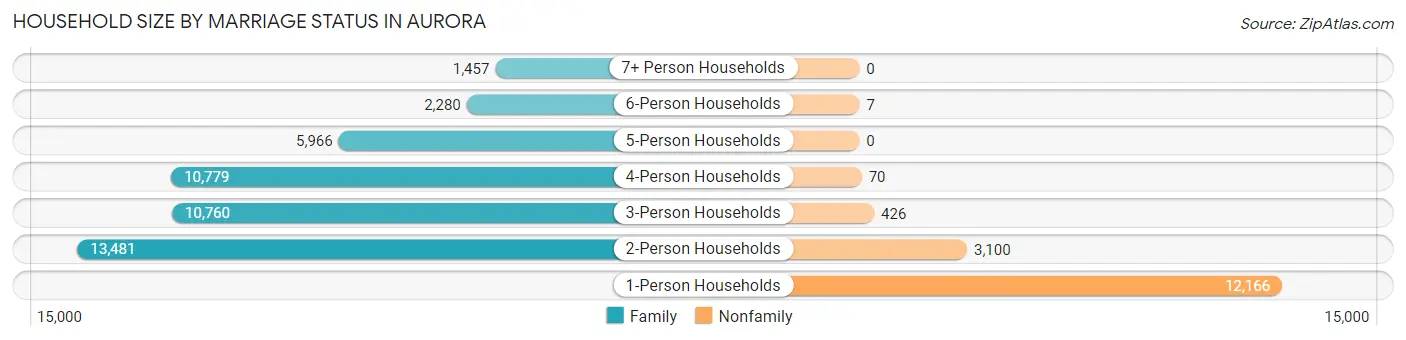
| Household Size | Family Households | Nonfamily Households |
| 1-Person Households | - | 12,166 (20.1%) |
| 2-Person Households | 13,481 (22.3%) | 3,100 (5.1%) |
| 3-Person Households | 10,760 (17.8%) | 426 (0.7%) |
| 4-Person Households | 10,779 (17.8%) | 70 (0.1%) |
| 5-Person Households | 5,966 (9.9%) | 0 (0.0%) |
| 6-Person Households | 2,280 (3.8%) | 7 (0.0%) |
| 7+ Person Households | 1,457 (2.4%) | 0 (0.0%) |
| Total | 44,723 (73.9%) | 15,769 (26.1%) |
Female Fertility in Aurora
Fertility by Age in Aurora
Average fertility rate in Aurora is 39.0 births per 1,000 women. Women in the age bracket of 20 to 34 years have the highest fertility rate with 78.0 births per 1,000 women. Women in the age bracket of 20 to 34 years acount for 72.1% of all women with births.
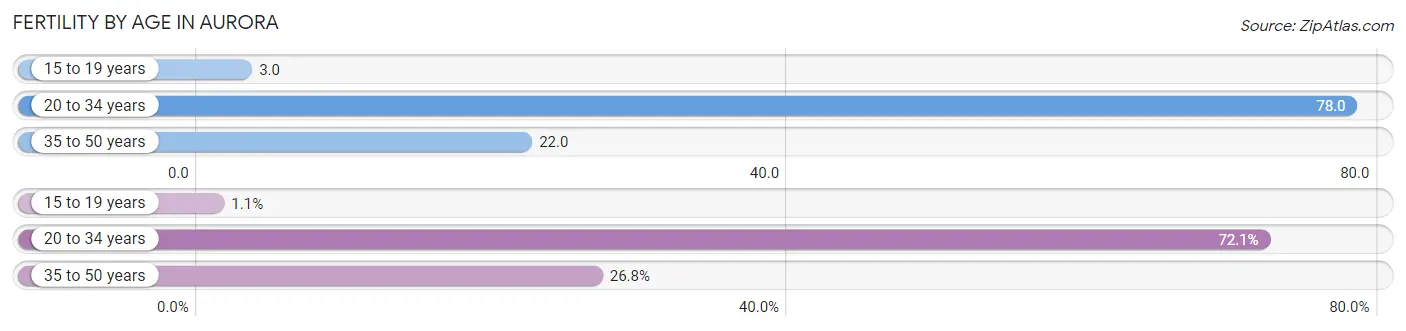
| Age Bracket | Women with Births | Births / 1,000 Women |
| 15 to 19 years | 21 (1.1%) | 3.0 |
| 20 to 34 years | 1,359 (72.1%) | 78.0 |
| 35 to 50 years | 505 (26.8%) | 22.0 |
| Total | 1,885 (100.0%) | 39.0 |
Fertility by Age by Marriage Status in Aurora
71.3% of women with births (1,885) in Aurora are married. The highest percentage of unmarried women with births falls into 15 to 19 years age bracket with 100.0% of them unmarried at the time of birth, while the lowest percentage of unmarried women with births belong to 35 to 50 years age bracket with 23.4% of them unmarried.
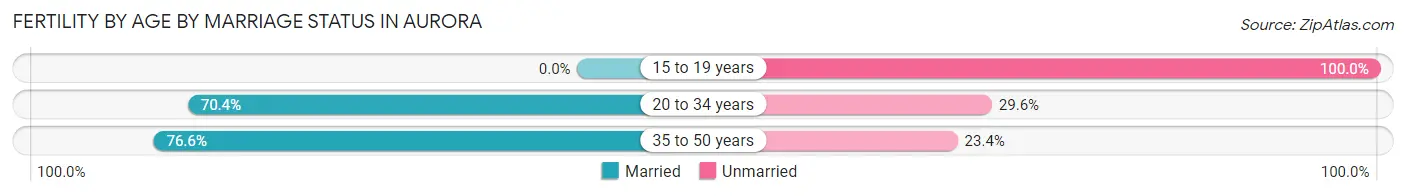
| Age Bracket | Married | Unmarried |
| 15 to 19 years | 0 (0.0%) | 21 (100.0%) |
| 20 to 34 years | 957 (70.4%) | 402 (29.6%) |
| 35 to 50 years | 387 (76.6%) | 118 (23.4%) |
| Total | 1,344 (71.3%) | 541 (28.7%) |
Fertility by Education in Aurora
Average fertility rate in Aurora is 39.0 births per 1,000 women. Women with the education attainment of high school diploma have the highest fertility rate of 58.0 births per 1,000 women, while women with the education attainment of less than high school have the lowest fertility at 23.0 births per 1,000 women. Women with the education attainment of high school diploma represent 30.0% of all women with births.
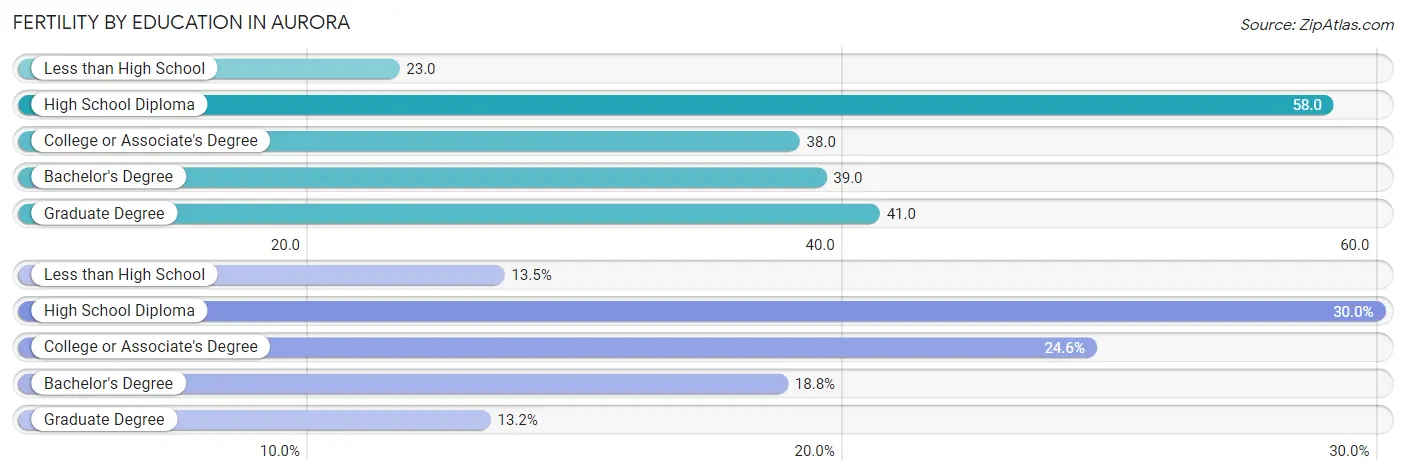
| Educational Attainment | Women with Births | Births / 1,000 Women |
| Less than High School | 254 (13.5%) | 23.0 |
| High School Diploma | 565 (30.0%) | 58.0 |
| College or Associate's Degree | 463 (24.6%) | 38.0 |
| Bachelor's Degree | 354 (18.8%) | 39.0 |
| Graduate Degree | 249 (13.2%) | 41.0 |
| Total | 1,885 (100.0%) | 39.0 |
Fertility by Education by Marriage Status in Aurora
28.7% of women with births in Aurora are unmarried. Women with the educational attainment of graduate degree are most likely to be married with 100.0% of them married at childbirth, while women with the educational attainment of less than high school are least likely to be married with 48.4% of them unmarried at childbirth.
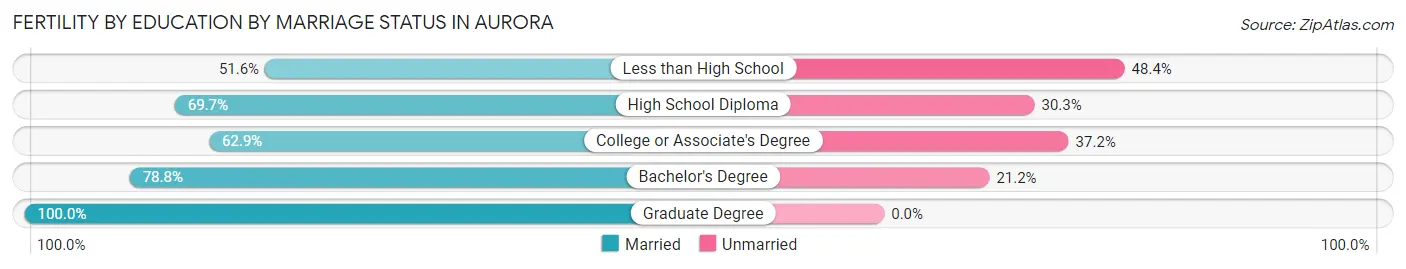
| Educational Attainment | Married | Unmarried |
| Less than High School | 131 (51.6%) | 123 (48.4%) |
| High School Diploma | 394 (69.7%) | 171 (30.3%) |
| College or Associate's Degree | 291 (62.8%) | 172 (37.1%) |
| Bachelor's Degree | 279 (78.8%) | 75 (21.2%) |
| Graduate Degree | 249 (100.0%) | 0 (0.0%) |
| Total | 1,344 (71.3%) | 541 (28.7%) |
Employment Characteristics in Aurora
Employment by Class of Employer in Aurora
Among the 93,743 employed individuals in Aurora, private company employees (72,880 | 77.7%), not-for-profit organizations (5,894 | 6.3%), and local government employees (4,921 | 5.2%) make up the most common classes of employment.
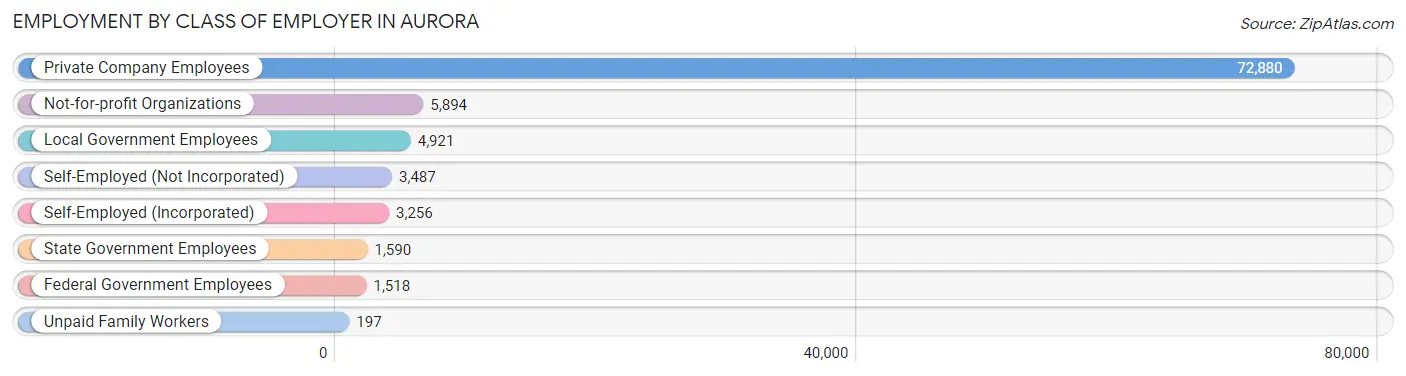
| Employer Class | # Employees | % Employees |
| Private Company Employees | 72,880 | 77.7% |
| Self-Employed (Incorporated) | 3,256 | 3.5% |
| Self-Employed (Not Incorporated) | 3,487 | 3.7% |
| Not-for-profit Organizations | 5,894 | 6.3% |
| Local Government Employees | 4,921 | 5.2% |
| State Government Employees | 1,590 | 1.7% |
| Federal Government Employees | 1,518 | 1.6% |
| Unpaid Family Workers | 197 | 0.2% |
| Total | 93,743 | 100.0% |
Employment Status by Age in Aurora
According to the labor force statistics for Aurora, out of the total population over 16 years of age (139,311), 72.7% or 101,279 individuals are in the labor force, with 5.6% or 5,672 of them unemployed. The age group with the highest labor force participation rate is 30 to 34 years, with 87.1% or 9,767 individuals in the labor force. Within the labor force, the 16 to 19 years age range has the highest percentage of unemployed individuals, with 10.4% or 612 of them being unemployed.
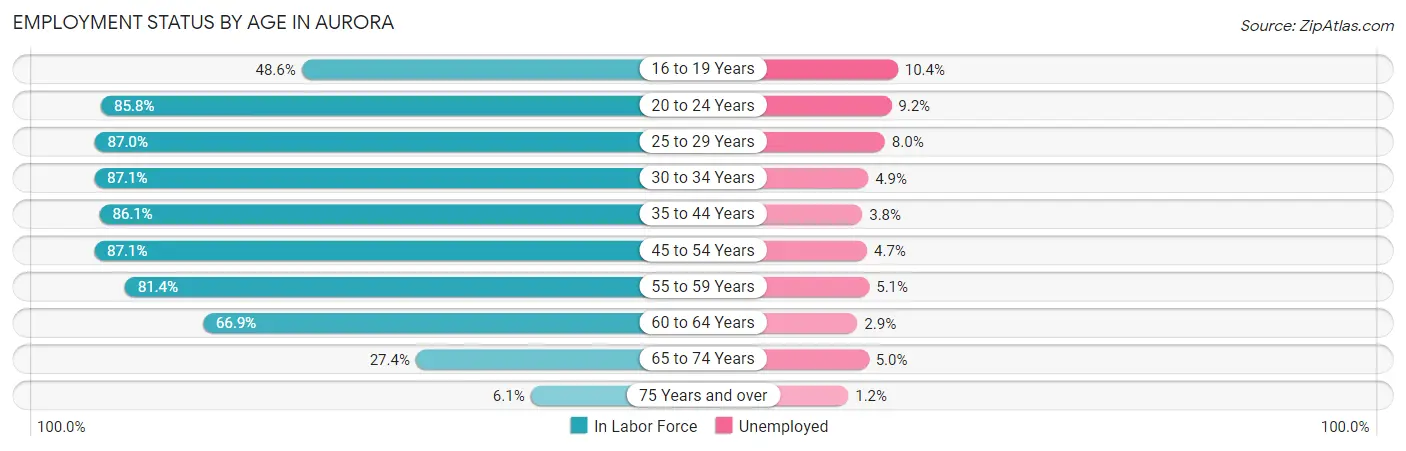
| Age Bracket | In Labor Force | Unemployed |
| 16 to 19 Years | 5,882 (48.6%) | 612 (10.4%) |
| 20 to 24 Years | 10,717 (85.8%) | 986 (9.2%) |
| 25 to 29 Years | 10,183 (87.0%) | 815 (8.0%) |
| 30 to 34 Years | 9,767 (87.1%) | 479 (4.9%) |
| 35 to 44 Years | 24,468 (86.1%) | 930 (3.8%) |
| 45 to 54 Years | 22,944 (87.1%) | 1,078 (4.7%) |
| 55 to 59 Years | 8,183 (81.4%) | 417 (5.1%) |
| 60 to 64 Years | 5,307 (66.9%) | 154 (2.9%) |
| 65 to 74 Years | 3,373 (27.4%) | 169 (5.0%) |
| 75 Years and over | 411 (6.1%) | 5 (1.2%) |
| Total | 101,279 (72.7%) | 5,672 (5.6%) |
Employment Status by Educational Attainment in Aurora
According to labor force statistics for Aurora, 84.5% of individuals (80,836) out of the total population between 25 and 64 years of age (95,664) are in the labor force, with 4.8% or 3,880 of them being unemployed. The group with the highest labor force participation rate are those with the educational attainment of bachelor's degree or higher, with 88.0% or 30,870 individuals in the labor force. Within the labor force, individuals with college / associate degree education have the highest percentage of unemployment, with 6.6% or 1,324 of them being unemployed.
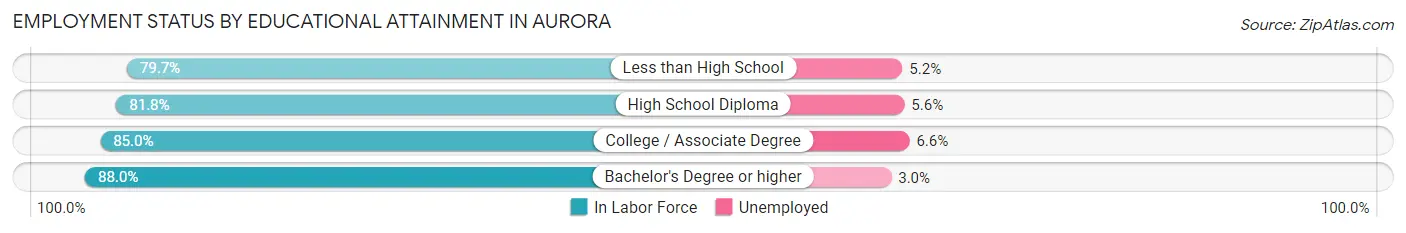
| Educational Attainment | In Labor Force | Unemployed |
| Less than High School | 13,928 (79.7%) | 909 (5.2%) |
| High School Diploma | 15,950 (81.8%) | 1,092 (5.6%) |
| College / Associate Degree | 20,068 (85.0%) | 1,558 (6.6%) |
| Bachelor's Degree or higher | 30,870 (88.0%) | 1,052 (3.0%) |
| Total | 80,836 (84.5%) | 4,592 (4.8%) |
Employment Occupations by Sex in Aurora
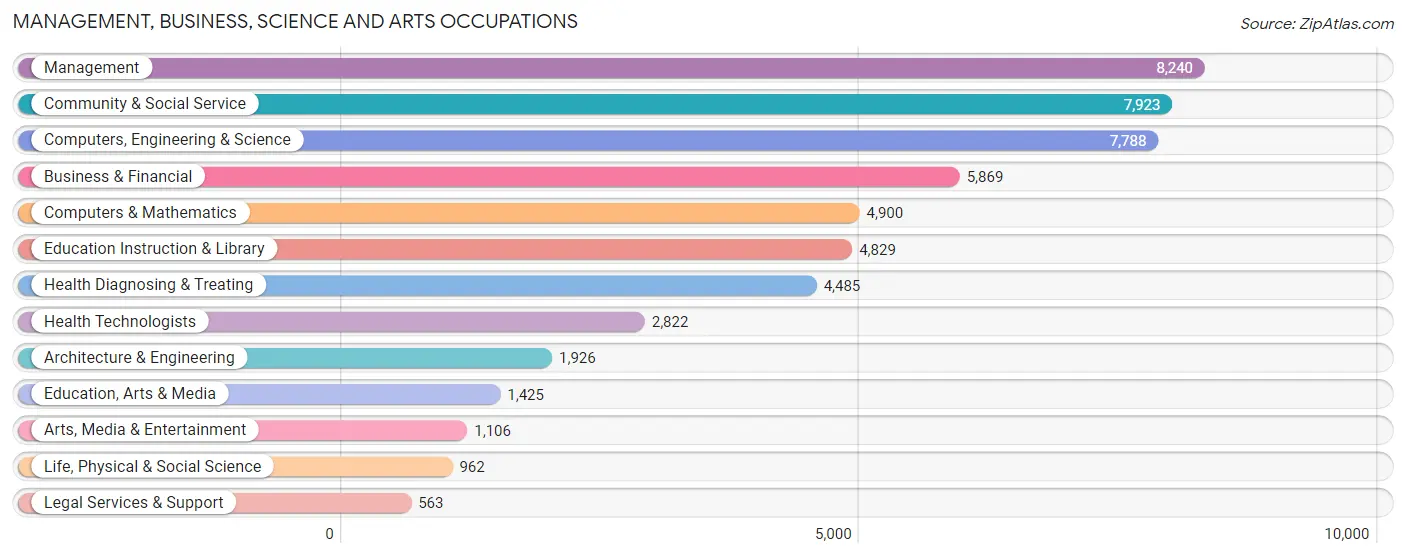
Management, Business, Science and Arts Occupations
The most common Management, Business, Science and Arts occupations in Aurora are Management (8,240 | 8.6%), Community & Social Service (7,923 | 8.3%), Computers, Engineering & Science (7,788 | 8.2%), Business & Financial (5,869 | 6.1%), and Computers & Mathematics (4,900 | 5.1%).
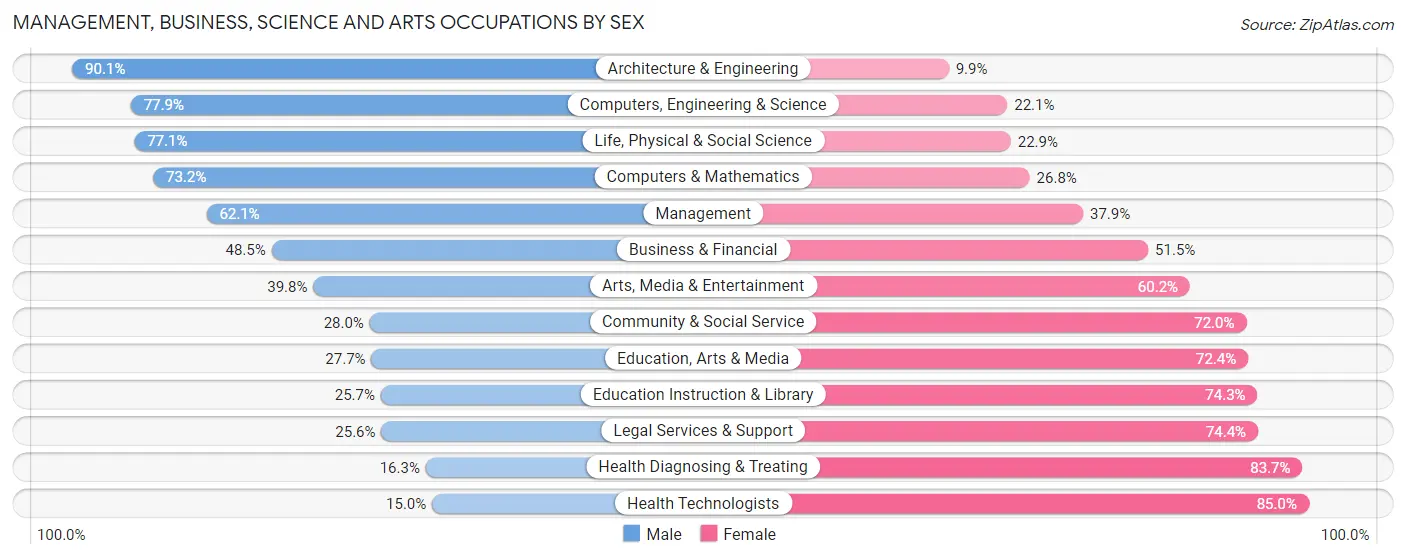
Management, Business, Science and Arts Occupations by Sex
Within the Management, Business, Science and Arts occupations in Aurora, the most male-oriented occupations are Architecture & Engineering (90.1%), Computers, Engineering & Science (77.9%), and Life, Physical & Social Science (77.1%), while the most female-oriented occupations are Health Technologists (85.0%), Health Diagnosing & Treating (83.7%), and Legal Services & Support (74.4%).
| Occupation | Male | Female |
| Management | 5,114 (62.1%) | 3,126 (37.9%) |
| Business & Financial | 2,845 (48.5%) | 3,024 (51.5%) |
| Computers, Engineering & Science | 6,064 (77.9%) | 1,724 (22.1%) |
| Computers & Mathematics | 3,587 (73.2%) | 1,313 (26.8%) |
| Architecture & Engineering | 1,735 (90.1%) | 191 (9.9%) |
| Life, Physical & Social Science | 742 (77.1%) | 220 (22.9%) |
| Community & Social Service | 2,219 (28.0%) | 5,704 (72.0%) |
| Education, Arts & Media | 394 (27.7%) | 1,031 (72.4%) |
| Legal Services & Support | 144 (25.6%) | 419 (74.4%) |
| Education Instruction & Library | 1,241 (25.7%) | 3,588 (74.3%) |
| Arts, Media & Entertainment | 440 (39.8%) | 666 (60.2%) |
| Health Diagnosing & Treating | 732 (16.3%) | 3,753 (83.7%) |
| Health Technologists | 423 (15.0%) | 2,399 (85.0%) |
| Total (Category) | 16,974 (49.5%) | 17,331 (50.5%) |
| Total (Overall) | 50,510 (52.9%) | 44,987 (47.1%) |
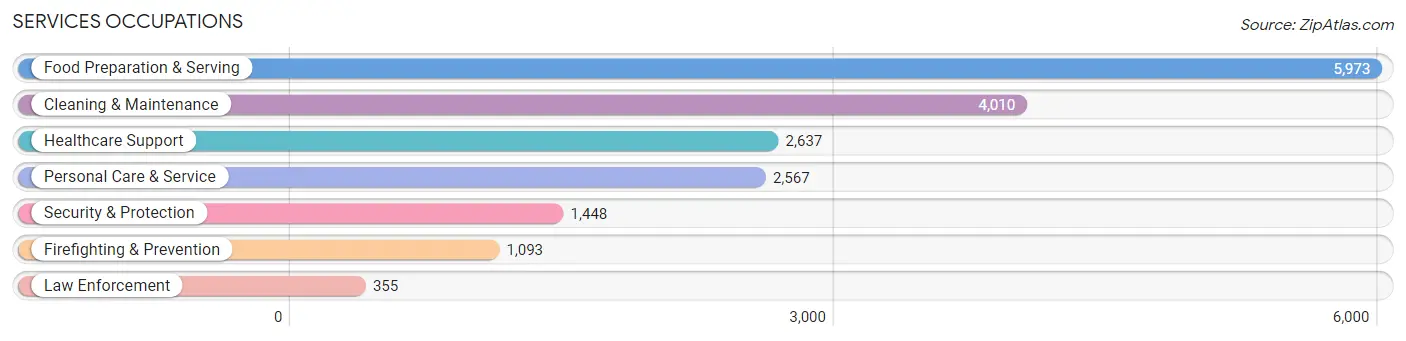
Services Occupations
The most common Services occupations in Aurora are Food Preparation & Serving (5,973 | 6.2%), Cleaning & Maintenance (4,010 | 4.2%), Healthcare Support (2,637 | 2.8%), Personal Care & Service (2,567 | 2.7%), and Security & Protection (1,448 | 1.5%).
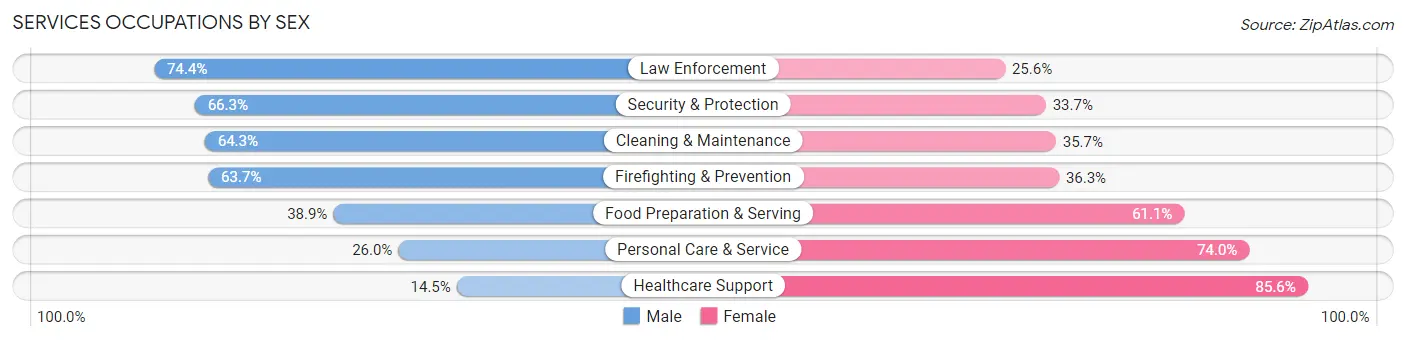
Services Occupations by Sex
Within the Services occupations in Aurora, the most male-oriented occupations are Law Enforcement (74.4%), Security & Protection (66.3%), and Cleaning & Maintenance (64.3%), while the most female-oriented occupations are Healthcare Support (85.6%), Personal Care & Service (74.0%), and Food Preparation & Serving (61.1%).
| Occupation | Male | Female |
| Healthcare Support | 381 (14.4%) | 2,256 (85.6%) |
| Security & Protection | 960 (66.3%) | 488 (33.7%) |
| Firefighting & Prevention | 696 (63.7%) | 397 (36.3%) |
| Law Enforcement | 264 (74.4%) | 91 (25.6%) |
| Food Preparation & Serving | 2,323 (38.9%) | 3,650 (61.1%) |
| Cleaning & Maintenance | 2,579 (64.3%) | 1,431 (35.7%) |
| Personal Care & Service | 668 (26.0%) | 1,899 (74.0%) |
| Total (Category) | 6,911 (41.5%) | 9,724 (58.5%) |
| Total (Overall) | 50,510 (52.9%) | 44,987 (47.1%) |
Sales and Office Occupations
The most common Sales and Office occupations in Aurora are Office & Administration (10,679 | 11.2%), and Sales & Related (8,930 | 9.3%).

Sales and Office Occupations by Sex
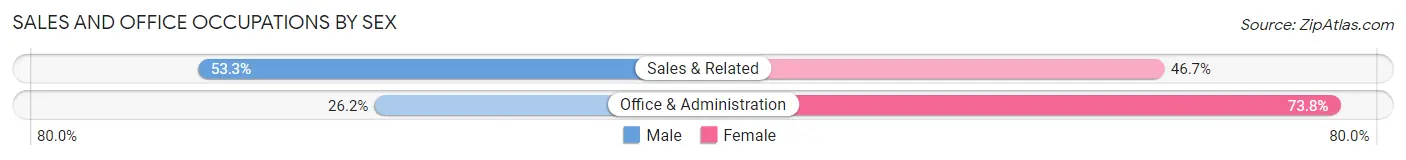
| Occupation | Male | Female |
| Sales & Related | 4,763 (53.3%) | 4,167 (46.7%) |
| Office & Administration | 2,800 (26.2%) | 7,879 (73.8%) |
| Total (Category) | 7,563 (38.6%) | 12,046 (61.4%) |
| Total (Overall) | 50,510 (52.9%) | 44,987 (47.1%) |
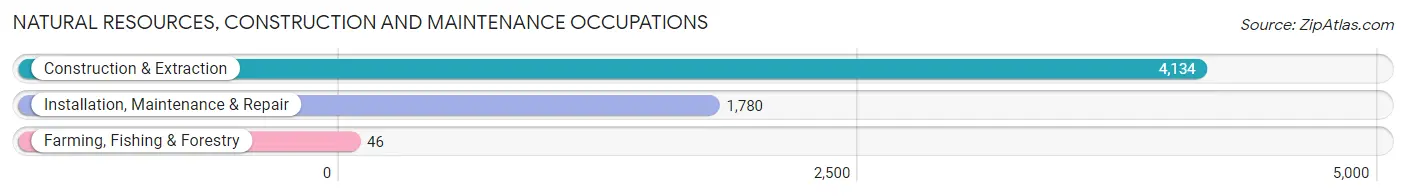
Natural Resources, Construction and Maintenance Occupations
The most common Natural Resources, Construction and Maintenance occupations in Aurora are Construction & Extraction (4,134 | 4.3%), Installation, Maintenance & Repair (1,780 | 1.9%), and Farming, Fishing & Forestry (46 | 0.1%).
Natural Resources, Construction and Maintenance Occupations by Sex
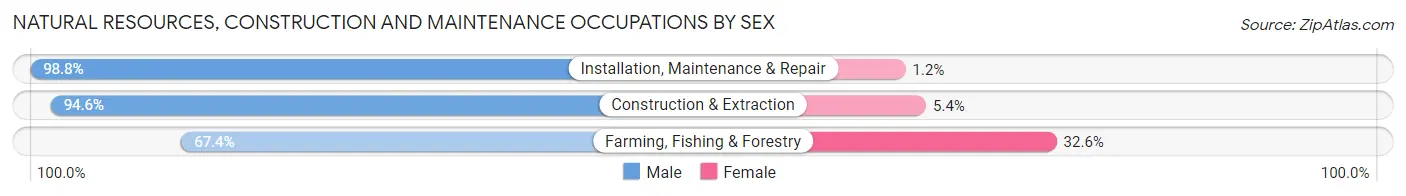
| Occupation | Male | Female |
| Farming, Fishing & Forestry | 31 (67.4%) | 15 (32.6%) |
| Construction & Extraction | 3,909 (94.6%) | 225 (5.4%) |
| Installation, Maintenance & Repair | 1,759 (98.8%) | 21 (1.2%) |
| Total (Category) | 5,699 (95.6%) | 261 (4.4%) |
| Total (Overall) | 50,510 (52.9%) | 44,987 (47.1%) |
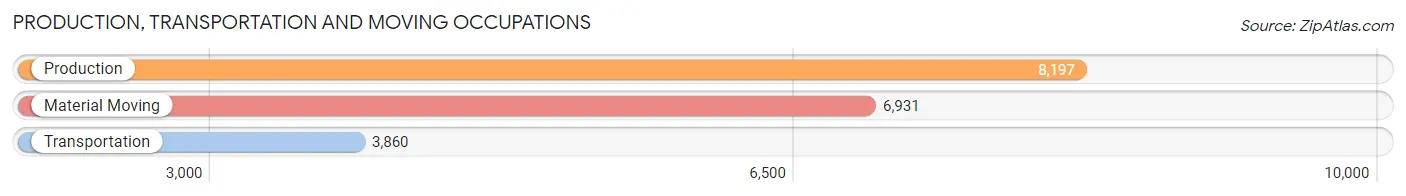
Production, Transportation and Moving Occupations
The most common Production, Transportation and Moving occupations in Aurora are Production (8,197 | 8.6%), Material Moving (6,931 | 7.3%), and Transportation (3,860 | 4.0%).
Production, Transportation and Moving Occupations by Sex
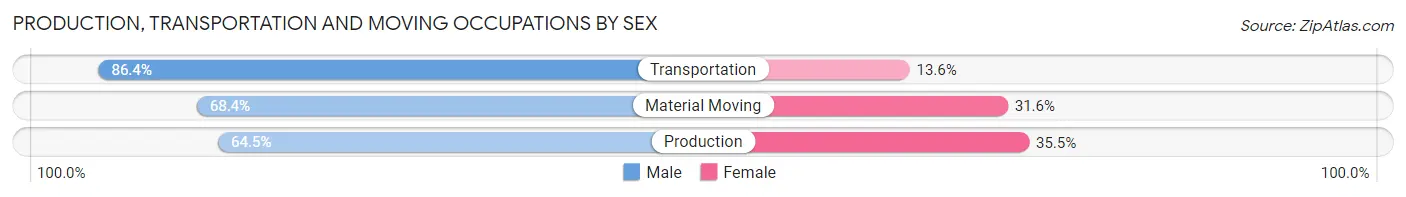
| Occupation | Male | Female |
| Production | 5,287 (64.5%) | 2,910 (35.5%) |
| Transportation | 3,336 (86.4%) | 524 (13.6%) |
| Material Moving | 4,740 (68.4%) | 2,191 (31.6%) |
| Total (Category) | 13,363 (70.4%) | 5,625 (29.6%) |
| Total (Overall) | 50,510 (52.9%) | 44,987 (47.1%) |
Employment Industries by Sex in Aurora
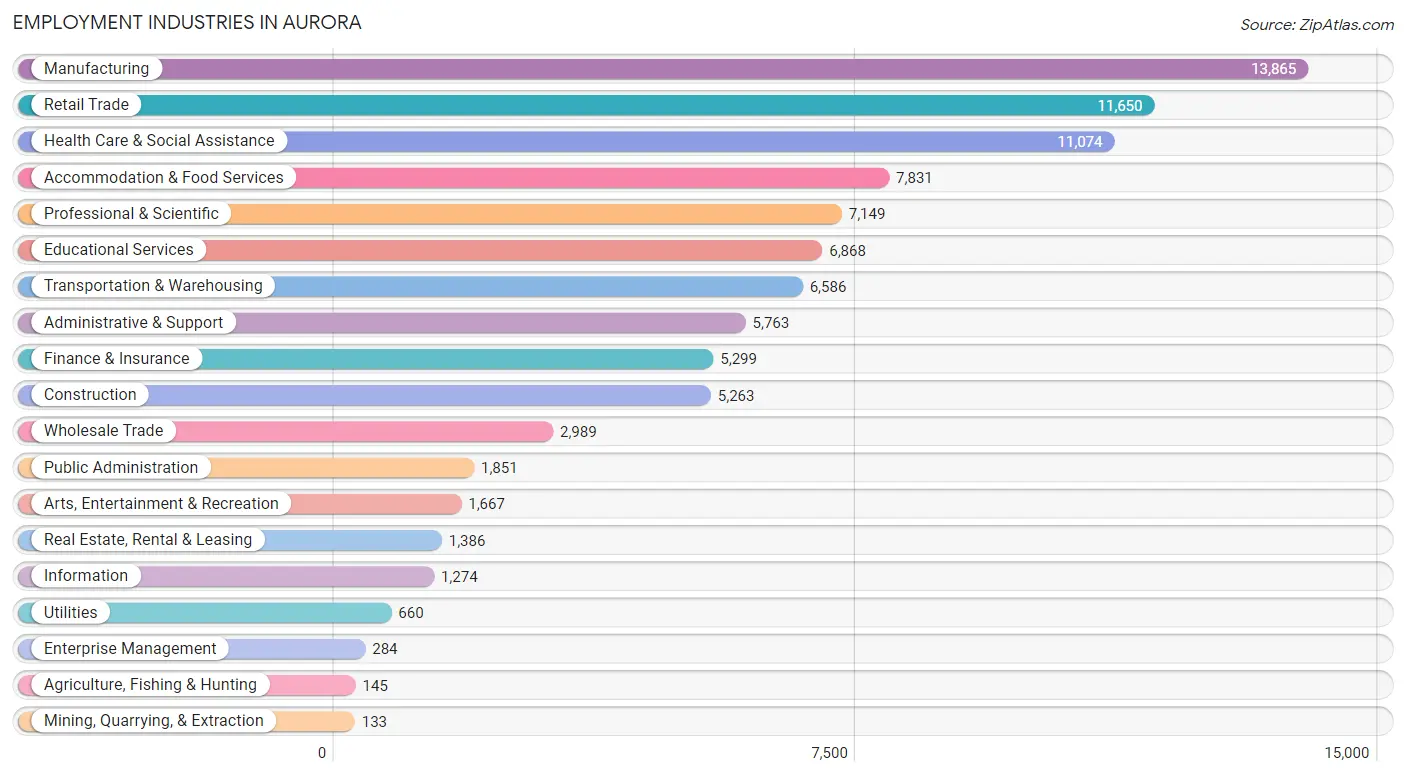
Employment Industries in Aurora
The major employment industries in Aurora include Manufacturing (13,865 | 14.5%), Retail Trade (11,650 | 12.2%), Health Care & Social Assistance (11,074 | 11.6%), Accommodation & Food Services (7,831 | 8.2%), and Professional & Scientific (7,149 | 7.5%).
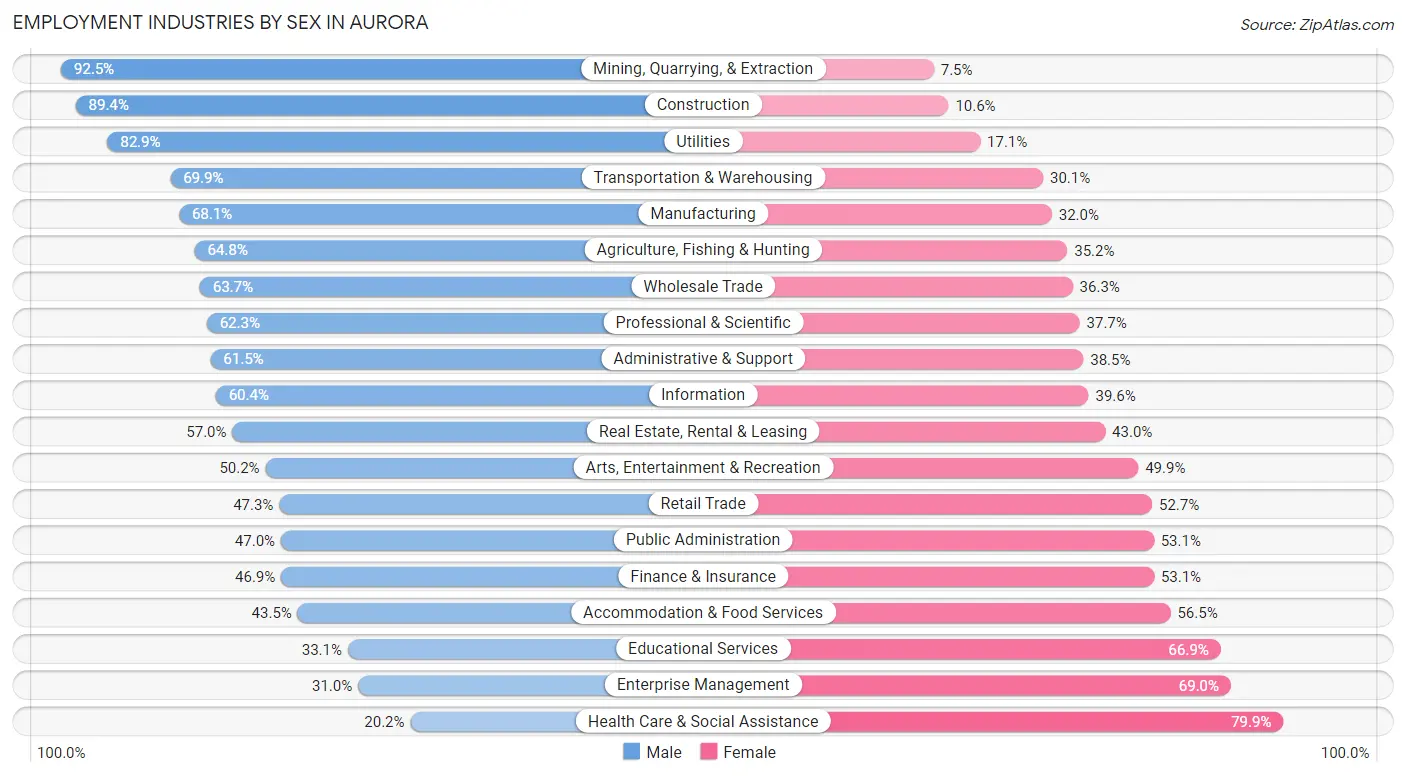
Employment Industries by Sex in Aurora
The Aurora industries that see more men than women are Mining, Quarrying, & Extraction (92.5%), Construction (89.4%), and Utilities (82.9%), whereas the industries that tend to have a higher number of women are Health Care & Social Assistance (79.8%), Enterprise Management (69.0%), and Educational Services (66.9%).
| Industry | Male | Female |
| Agriculture, Fishing & Hunting | 94 (64.8%) | 51 (35.2%) |
| Mining, Quarrying, & Extraction | 123 (92.5%) | 10 (7.5%) |
| Construction | 4,707 (89.4%) | 556 (10.6%) |
| Manufacturing | 9,435 (68.0%) | 4,430 (32.0%) |
| Wholesale Trade | 1,905 (63.7%) | 1,084 (36.3%) |
| Retail Trade | 5,511 (47.3%) | 6,139 (52.7%) |
| Transportation & Warehousing | 4,601 (69.9%) | 1,985 (30.1%) |
| Utilities | 547 (82.9%) | 113 (17.1%) |
| Information | 770 (60.4%) | 504 (39.6%) |
| Finance & Insurance | 2,485 (46.9%) | 2,814 (53.1%) |
| Real Estate, Rental & Leasing | 790 (57.0%) | 596 (43.0%) |
| Professional & Scientific | 4,453 (62.3%) | 2,696 (37.7%) |
| Enterprise Management | 88 (31.0%) | 196 (69.0%) |
| Administrative & Support | 3,546 (61.5%) | 2,217 (38.5%) |
| Educational Services | 2,273 (33.1%) | 4,595 (66.9%) |
| Health Care & Social Assistance | 2,231 (20.2%) | 8,843 (79.8%) |
| Arts, Entertainment & Recreation | 836 (50.1%) | 831 (49.8%) |
| Accommodation & Food Services | 3,405 (43.5%) | 4,426 (56.5%) |
| Public Administration | 869 (46.9%) | 982 (53.0%) |
| Total | 50,510 (52.9%) | 44,987 (47.1%) |
Education in Aurora
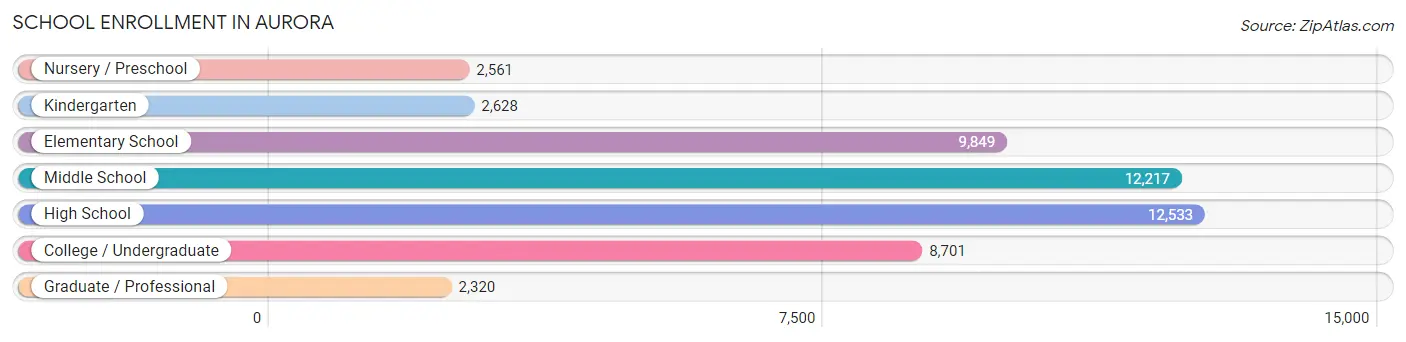
School Enrollment in Aurora
The most common levels of schooling among the 50,809 students in Aurora are high school (12,533 | 24.7%), middle school (12,217 | 24.0%), and elementary school (9,849 | 19.4%).
| School Level | # Students | % Students |
| Nursery / Preschool | 2,561 | 5.0% |
| Kindergarten | 2,628 | 5.2% |
| Elementary School | 9,849 | 19.4% |
| Middle School | 12,217 | 24.0% |
| High School | 12,533 | 24.7% |
| College / Undergraduate | 8,701 | 17.1% |
| Graduate / Professional | 2,320 | 4.6% |
| Total | 50,809 | 100.0% |
School Enrollment by Age by Funding Source in Aurora
Out of a total of 50,809 students who are enrolled in schools in Aurora, 6,961 (13.7%) attend a private institution, while the remaining 43,848 (86.3%) are enrolled in public schools. The age group of 25 to 34 year olds has the highest likelihood of being enrolled in private schools, with 977 (47.7% in the age bracket) enrolled. Conversely, the age group of 10 to 14 year olds has the lowest likelihood of being enrolled in a private school, with 14,417 (94.3% in the age bracket) attending a public institution.
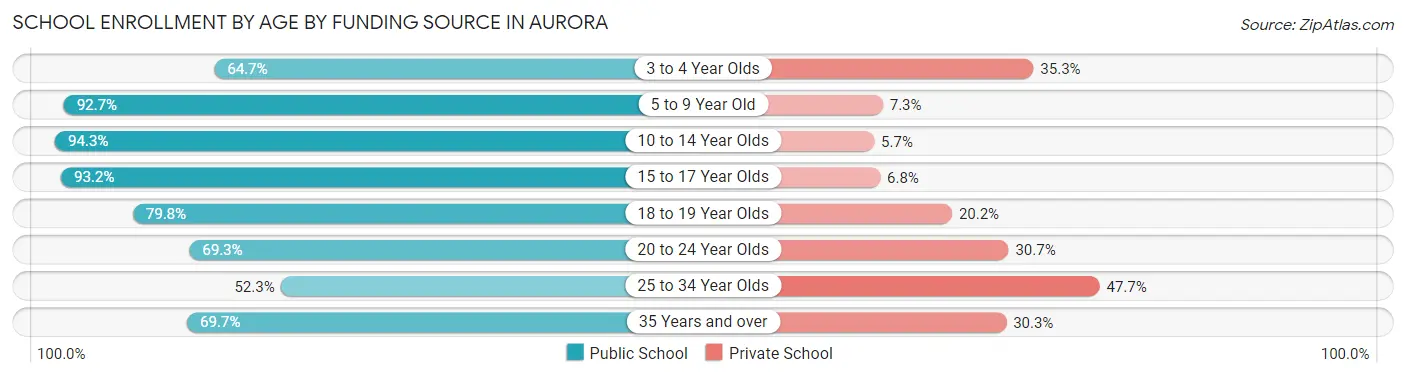
| Age Bracket | Public School | Private School |
| 3 to 4 Year Olds | 1,484 (64.7%) | 811 (35.3%) |
| 5 to 9 Year Old | 10,462 (92.7%) | 823 (7.3%) |
| 10 to 14 Year Olds | 14,417 (94.3%) | 869 (5.7%) |
| 15 to 17 Year Olds | 8,604 (93.2%) | 627 (6.8%) |
| 18 to 19 Year Olds | 3,072 (79.8%) | 776 (20.2%) |
| 20 to 24 Year Olds | 2,975 (69.3%) | 1,318 (30.7%) |
| 25 to 34 Year Olds | 1,073 (52.3%) | 977 (47.7%) |
| 35 Years and over | 1,758 (69.7%) | 763 (30.3%) |
| Total | 43,848 (86.3%) | 6,961 (13.7%) |
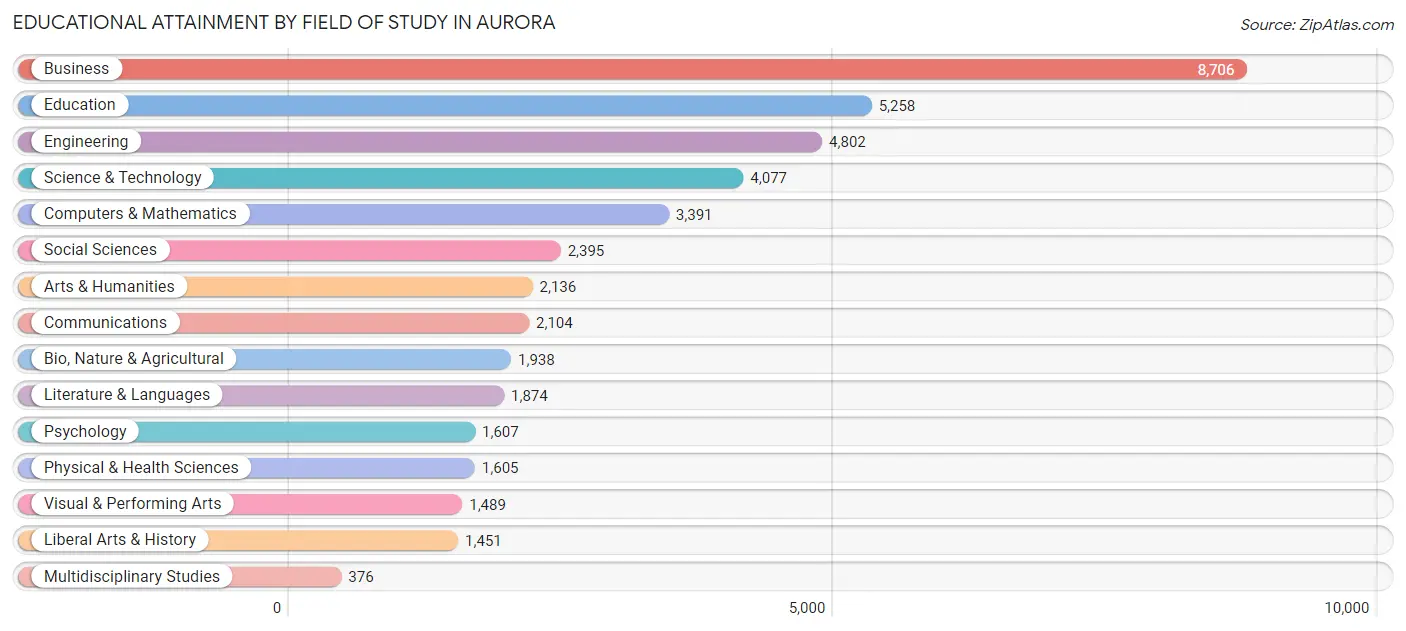
Educational Attainment by Field of Study in Aurora
Business (8,706 | 20.2%), education (5,258 | 12.2%), engineering (4,802 | 11.1%), science & technology (4,077 | 9.4%), and computers & mathematics (3,391 | 7.9%) are the most common fields of study among 43,209 individuals in Aurora who have obtained a bachelor's degree or higher.
| Field of Study | # Graduates | % Graduates |
| Computers & Mathematics | 3,391 | 7.9% |
| Bio, Nature & Agricultural | 1,938 | 4.5% |
| Physical & Health Sciences | 1,605 | 3.7% |
| Psychology | 1,607 | 3.7% |
| Social Sciences | 2,395 | 5.5% |
| Engineering | 4,802 | 11.1% |
| Multidisciplinary Studies | 376 | 0.9% |
| Science & Technology | 4,077 | 9.4% |
| Business | 8,706 | 20.2% |
| Education | 5,258 | 12.2% |
| Literature & Languages | 1,874 | 4.3% |
| Liberal Arts & History | 1,451 | 3.4% |
| Visual & Performing Arts | 1,489 | 3.5% |
| Communications | 2,104 | 4.9% |
| Arts & Humanities | 2,136 | 4.9% |
| Total | 43,209 | 100.0% |
Transportation & Commute in Aurora
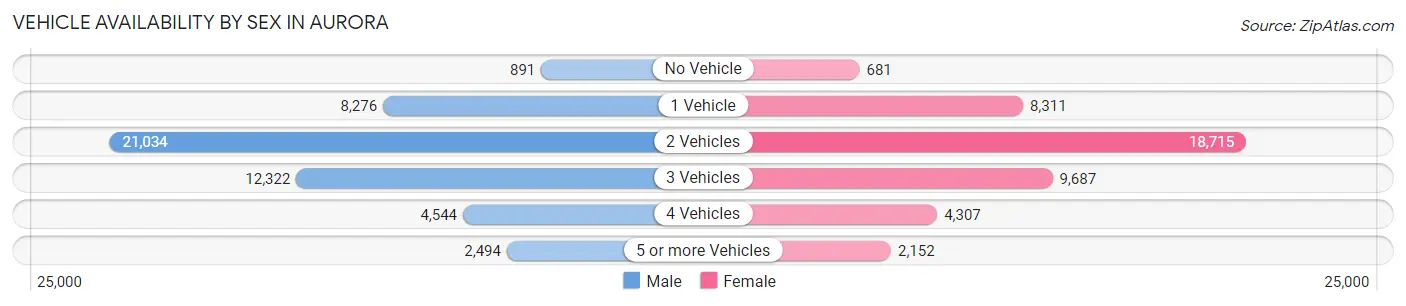
Vehicle Availability by Sex in Aurora
The most prevalent vehicle ownership categories in Aurora are males with 2 vehicles (21,034, accounting for 42.4%) and females with 2 vehicles (18,715, making up 48.0%).
| Vehicles Available | Male | Female |
| No Vehicle | 891 (1.8%) | 681 (1.5%) |
| 1 Vehicle | 8,276 (16.7%) | 8,311 (19.0%) |
| 2 Vehicles | 21,034 (42.4%) | 18,715 (42.7%) |
| 3 Vehicles | 12,322 (24.9%) | 9,687 (22.1%) |
| 4 Vehicles | 4,544 (9.2%) | 4,307 (9.8%) |
| 5 or more Vehicles | 2,494 (5.0%) | 2,152 (4.9%) |
| Total | 49,561 (100.0%) | 43,853 (100.0%) |
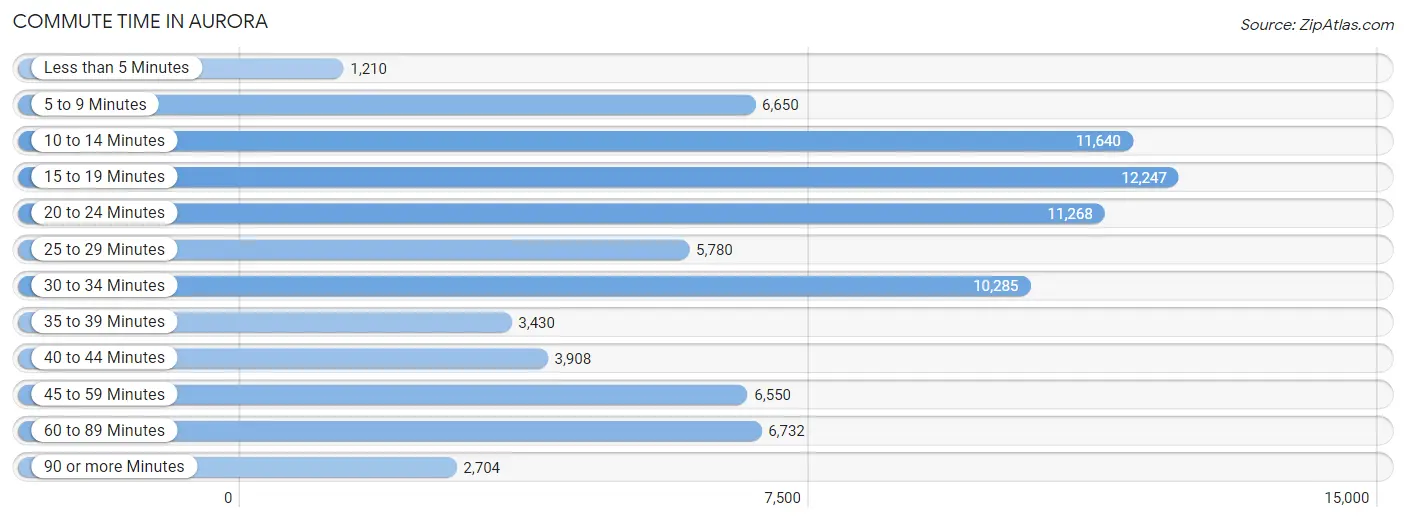
Commute Time in Aurora
The most frequently occuring commute durations in Aurora are 15 to 19 minutes (12,247 commuters, 14.9%), 10 to 14 minutes (11,640 commuters, 14.1%), and 20 to 24 minutes (11,268 commuters, 13.7%).
| Commute Time | # Commuters | % Commuters |
| Less than 5 Minutes | 1,210 | 1.5% |
| 5 to 9 Minutes | 6,650 | 8.1% |
| 10 to 14 Minutes | 11,640 | 14.1% |
| 15 to 19 Minutes | 12,247 | 14.9% |
| 20 to 24 Minutes | 11,268 | 13.7% |
| 25 to 29 Minutes | 5,780 | 7.0% |
| 30 to 34 Minutes | 10,285 | 12.5% |
| 35 to 39 Minutes | 3,430 | 4.2% |
| 40 to 44 Minutes | 3,908 | 4.7% |
| 45 to 59 Minutes | 6,550 | 8.0% |
| 60 to 89 Minutes | 6,732 | 8.2% |
| 90 or more Minutes | 2,704 | 3.3% |
Commute Time by Sex in Aurora
The most common commute times in Aurora are 20 to 24 minutes (6,282 commuters, 14.2%) for males and 15 to 19 minutes (6,243 commuters, 16.4%) for females.
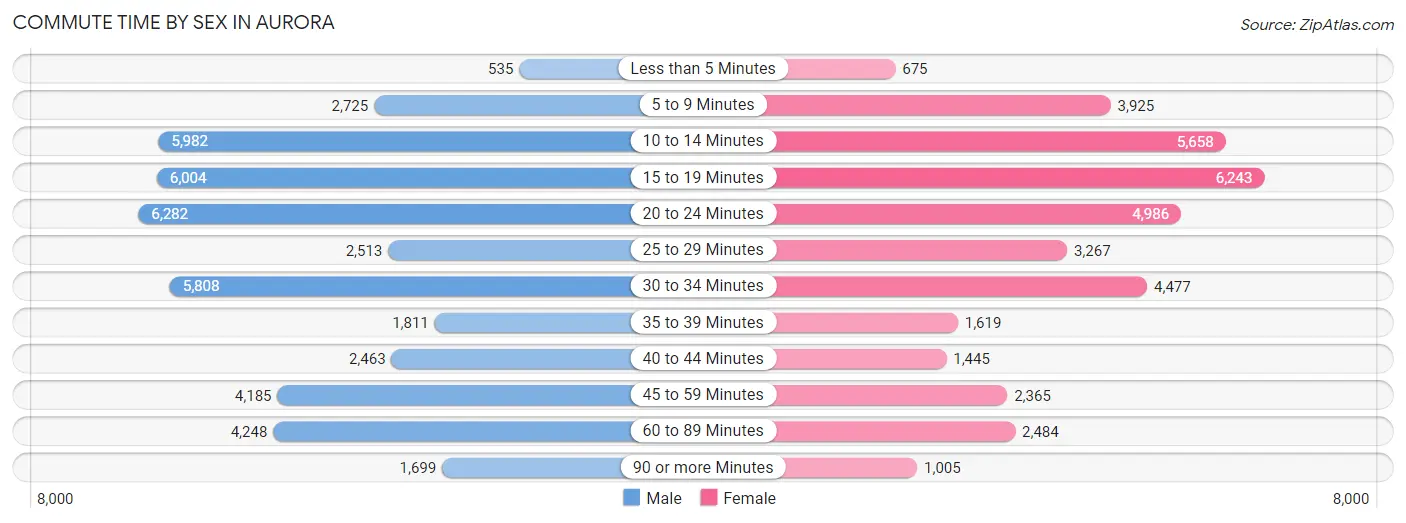
| Commute Time | Male | Female |
| Less than 5 Minutes | 535 (1.2%) | 675 (1.8%) |
| 5 to 9 Minutes | 2,725 (6.2%) | 3,925 (10.3%) |
| 10 to 14 Minutes | 5,982 (13.5%) | 5,658 (14.8%) |
| 15 to 19 Minutes | 6,004 (13.6%) | 6,243 (16.4%) |
| 20 to 24 Minutes | 6,282 (14.2%) | 4,986 (13.1%) |
| 25 to 29 Minutes | 2,513 (5.7%) | 3,267 (8.6%) |
| 30 to 34 Minutes | 5,808 (13.1%) | 4,477 (11.7%) |
| 35 to 39 Minutes | 1,811 (4.1%) | 1,619 (4.2%) |
| 40 to 44 Minutes | 2,463 (5.6%) | 1,445 (3.8%) |
| 45 to 59 Minutes | 4,185 (9.5%) | 2,365 (6.2%) |
| 60 to 89 Minutes | 4,248 (9.6%) | 2,484 (6.5%) |
| 90 or more Minutes | 1,699 (3.8%) | 1,005 (2.6%) |
Time of Departure to Work by Sex in Aurora
The most frequent times of departure to work in Aurora are 7:00 AM to 7:29 AM (5,708, 12.9%) for males and 7:00 AM to 7:29 AM (4,425, 11.6%) for females.
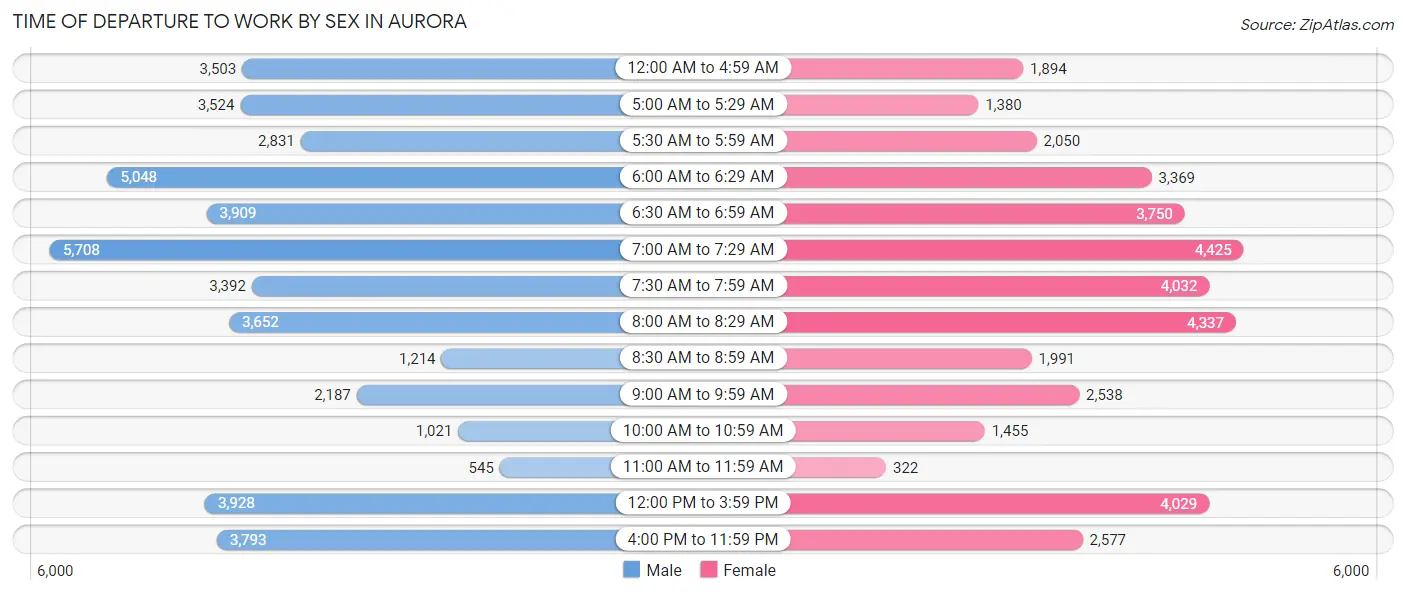
| Time of Departure | Male | Female |
| 12:00 AM to 4:59 AM | 3,503 (7.9%) | 1,894 (5.0%) |
| 5:00 AM to 5:29 AM | 3,524 (8.0%) | 1,380 (3.6%) |
| 5:30 AM to 5:59 AM | 2,831 (6.4%) | 2,050 (5.4%) |
| 6:00 AM to 6:29 AM | 5,048 (11.4%) | 3,369 (8.8%) |
| 6:30 AM to 6:59 AM | 3,909 (8.8%) | 3,750 (9.8%) |
| 7:00 AM to 7:29 AM | 5,708 (12.9%) | 4,425 (11.6%) |
| 7:30 AM to 7:59 AM | 3,392 (7.7%) | 4,032 (10.6%) |
| 8:00 AM to 8:29 AM | 3,652 (8.3%) | 4,337 (11.4%) |
| 8:30 AM to 8:59 AM | 1,214 (2.7%) | 1,991 (5.2%) |
| 9:00 AM to 9:59 AM | 2,187 (4.9%) | 2,538 (6.7%) |
| 10:00 AM to 10:59 AM | 1,021 (2.3%) | 1,455 (3.8%) |
| 11:00 AM to 11:59 AM | 545 (1.2%) | 322 (0.8%) |
| 12:00 PM to 3:59 PM | 3,928 (8.9%) | 4,029 (10.6%) |
| 4:00 PM to 11:59 PM | 3,793 (8.6%) | 2,577 (6.8%) |
| Total | 44,255 (100.0%) | 38,149 (100.0%) |
Housing Occupancy in Aurora
Occupancy by Ownership in Aurora
Of the total 60,492 dwellings in Aurora, owner-occupied units account for 40,402 (66.8%), while renter-occupied units make up 20,090 (33.2%).
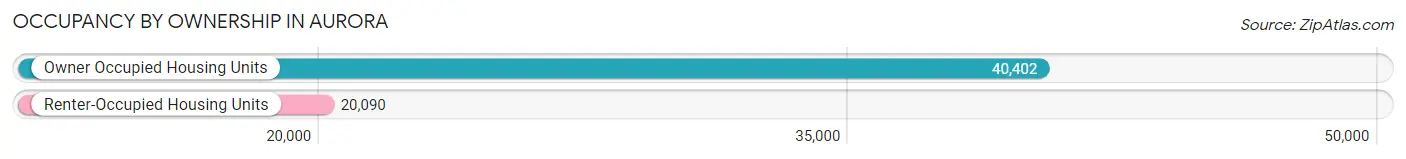
| Occupancy | # Housing Units | % Housing Units |
| Owner Occupied Housing Units | 40,402 | 66.8% |
| Renter-Occupied Housing Units | 20,090 | 33.2% |
| Total Occupied Housing Units | 60,492 | 100.0% |
Occupancy by Household Size in Aurora
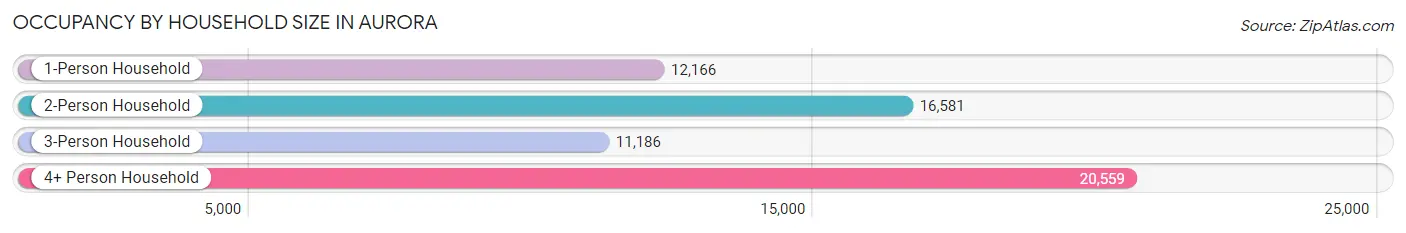
| Household Size | # Housing Units | % Housing Units |
| 1-Person Household | 12,166 | 20.1% |
| 2-Person Household | 16,581 | 27.4% |
| 3-Person Household | 11,186 | 18.5% |
| 4+ Person Household | 20,559 | 34.0% |
| Total Housing Units | 60,492 | 100.0% |
Occupancy by Ownership by Household Size in Aurora
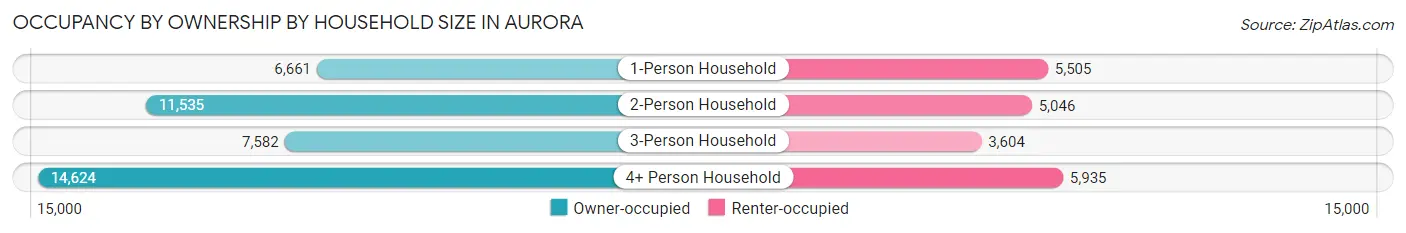
| Household Size | Owner-occupied | Renter-occupied |
| 1-Person Household | 6,661 (54.7%) | 5,505 (45.3%) |
| 2-Person Household | 11,535 (69.6%) | 5,046 (30.4%) |
| 3-Person Household | 7,582 (67.8%) | 3,604 (32.2%) |
| 4+ Person Household | 14,624 (71.1%) | 5,935 (28.9%) |
| Total Housing Units | 40,402 (66.8%) | 20,090 (33.2%) |
Occupancy by Educational Attainment in Aurora
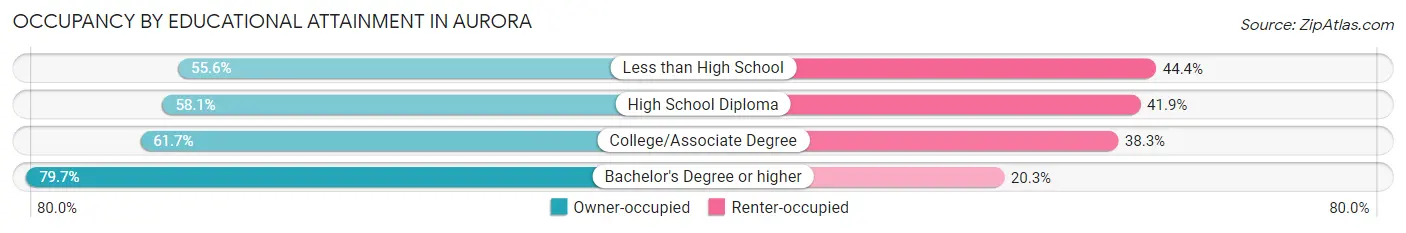
| Household Size | Owner-occupied | Renter-occupied |
| Less than High School | 5,195 (55.6%) | 4,142 (44.4%) |
| High School Diploma | 7,082 (58.1%) | 5,101 (41.9%) |
| College/Associate Degree | 10,069 (61.7%) | 6,260 (38.3%) |
| Bachelor's Degree or higher | 18,056 (79.7%) | 4,587 (20.3%) |
Occupancy by Age of Householder in Aurora
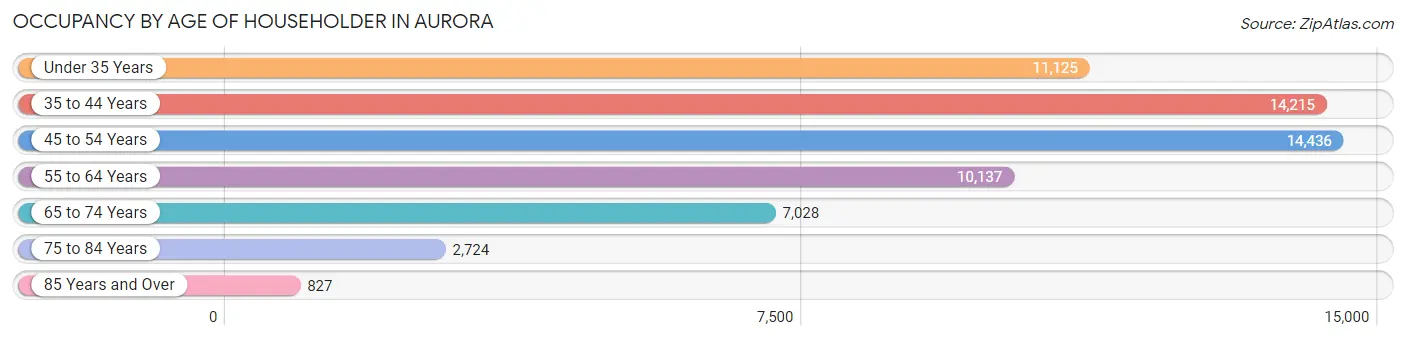
| Age Bracket | # Households | % Households |
| Under 35 Years | 11,125 | 18.4% |
| 35 to 44 Years | 14,215 | 23.5% |
| 45 to 54 Years | 14,436 | 23.9% |
| 55 to 64 Years | 10,137 | 16.8% |
| 65 to 74 Years | 7,028 | 11.6% |
| 75 to 84 Years | 2,724 | 4.5% |
| 85 Years and Over | 827 | 1.4% |
| Total | 60,492 | 100.0% |
Housing Finances in Aurora
Median Income by Occupancy in Aurora
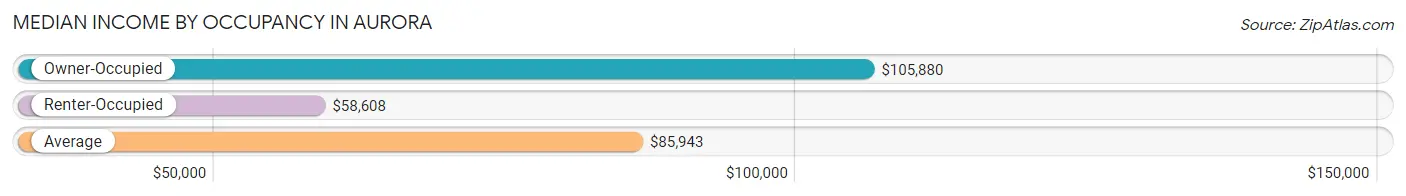
| Occupancy Type | # Households | Median Income |
| Owner-Occupied | 40,402 (66.8%) | $105,880 |
| Renter-Occupied | 20,090 (33.2%) | $58,608 |
| Average | 60,492 (100.0%) | $85,943 |
Occupancy by Householder Income Bracket in Aurora
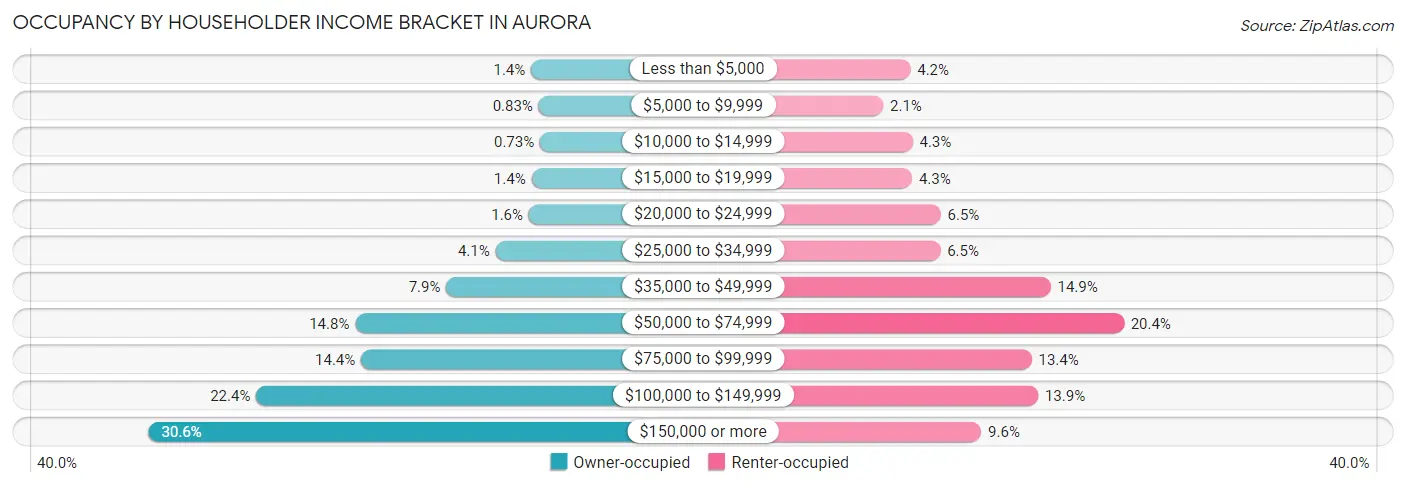
| Income Bracket | Owner-occupied | Renter-occupied |
| Less than $5,000 | 568 (1.4%) | 838 (4.2%) |
| $5,000 to $9,999 | 336 (0.8%) | 421 (2.1%) |
| $10,000 to $14,999 | 295 (0.7%) | 872 (4.3%) |
| $15,000 to $19,999 | 556 (1.4%) | 864 (4.3%) |
| $20,000 to $24,999 | 640 (1.6%) | 1,301 (6.5%) |
| $25,000 to $34,999 | 1,665 (4.1%) | 1,295 (6.5%) |
| $35,000 to $49,999 | 3,180 (7.9%) | 2,986 (14.9%) |
| $50,000 to $74,999 | 5,984 (14.8%) | 4,104 (20.4%) |
| $75,000 to $99,999 | 5,800 (14.4%) | 2,695 (13.4%) |
| $100,000 to $149,999 | 9,030 (22.4%) | 2,792 (13.9%) |
| $150,000 or more | 12,348 (30.6%) | 1,922 (9.6%) |
| Total | 40,402 (100.0%) | 20,090 (100.0%) |
Monthly Housing Cost Tiers in Aurora
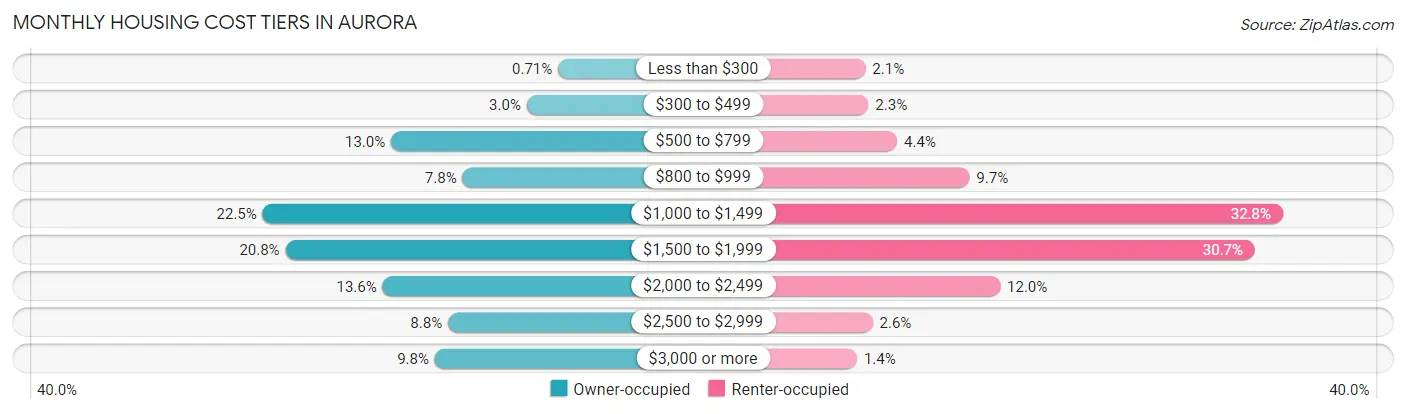
| Monthly Cost | Owner-occupied | Renter-occupied |
| Less than $300 | 286 (0.7%) | 414 (2.1%) |
| $300 to $499 | 1,219 (3.0%) | 458 (2.3%) |
| $500 to $799 | 5,257 (13.0%) | 883 (4.4%) |
| $800 to $999 | 3,133 (7.7%) | 1,953 (9.7%) |
| $1,000 to $1,499 | 9,077 (22.5%) | 6,589 (32.8%) |
| $1,500 to $1,999 | 8,399 (20.8%) | 6,175 (30.7%) |
| $2,000 to $2,499 | 5,511 (13.6%) | 2,406 (12.0%) |
| $2,500 to $2,999 | 3,565 (8.8%) | 521 (2.6%) |
| $3,000 or more | 3,955 (9.8%) | 289 (1.4%) |
| Total | 40,402 (100.0%) | 20,090 (100.0%) |
Physical Housing Characteristics in Aurora
Housing Structures in Aurora
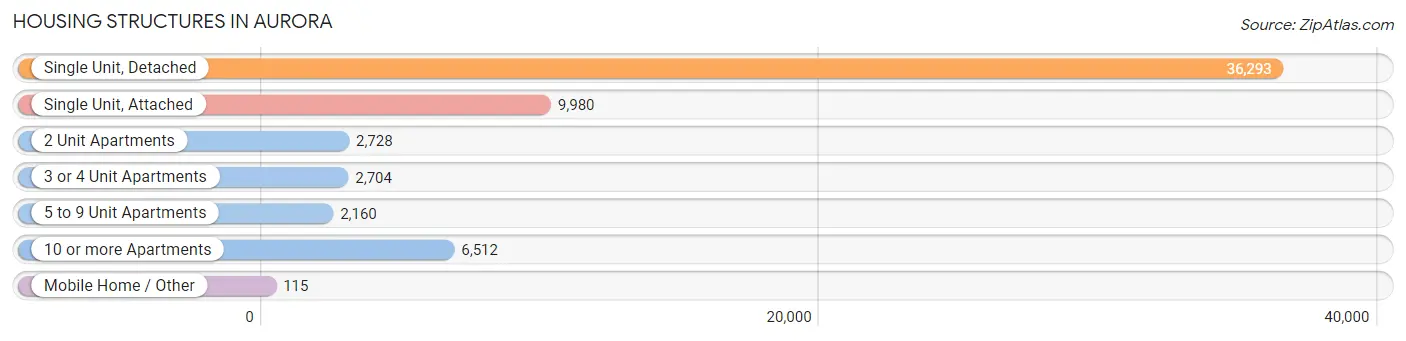
| Structure Type | # Housing Units | % Housing Units |
| Single Unit, Detached | 36,293 | 60.0% |
| Single Unit, Attached | 9,980 | 16.5% |
| 2 Unit Apartments | 2,728 | 4.5% |
| 3 or 4 Unit Apartments | 2,704 | 4.5% |
| 5 to 9 Unit Apartments | 2,160 | 3.6% |
| 10 or more Apartments | 6,512 | 10.8% |
| Mobile Home / Other | 115 | 0.2% |
| Total | 60,492 | 100.0% |
Housing Structures by Occupancy in Aurora
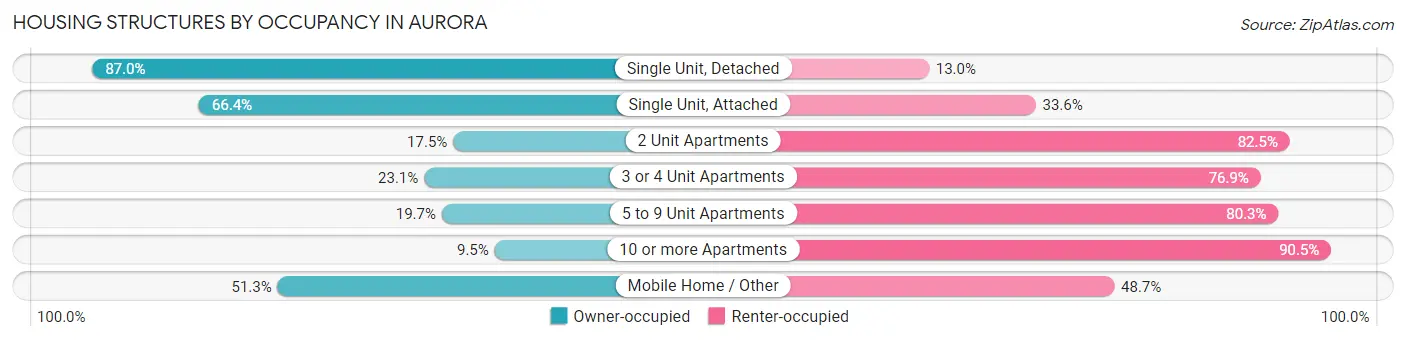
| Structure Type | Owner-occupied | Renter-occupied |
| Single Unit, Detached | 31,568 (87.0%) | 4,725 (13.0%) |
| Single Unit, Attached | 6,630 (66.4%) | 3,350 (33.6%) |
| 2 Unit Apartments | 477 (17.5%) | 2,251 (82.5%) |
| 3 or 4 Unit Apartments | 624 (23.1%) | 2,080 (76.9%) |
| 5 to 9 Unit Apartments | 425 (19.7%) | 1,735 (80.3%) |
| 10 or more Apartments | 619 (9.5%) | 5,893 (90.5%) |
| Mobile Home / Other | 59 (51.3%) | 56 (48.7%) |
| Total | 40,402 (66.8%) | 20,090 (33.2%) |
Housing Structures by Number of Rooms in Aurora
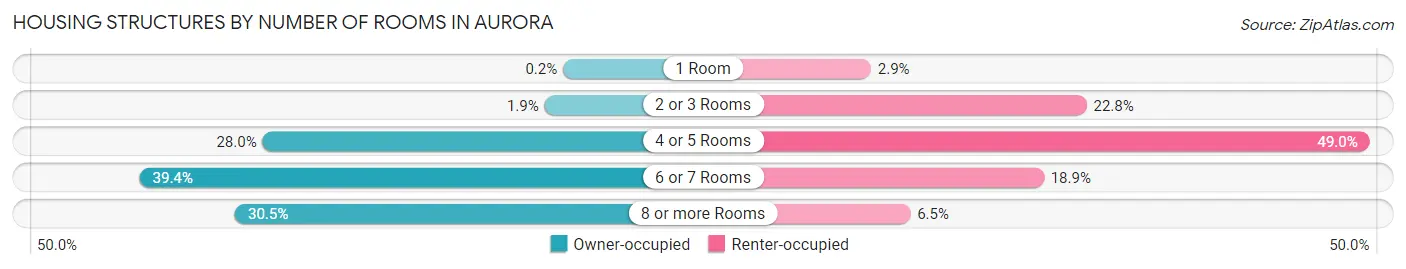
| Number of Rooms | Owner-occupied | Renter-occupied |
| 1 Room | 79 (0.2%) | 574 (2.9%) |
| 2 or 3 Rooms | 773 (1.9%) | 4,583 (22.8%) |
| 4 or 5 Rooms | 11,311 (28.0%) | 9,841 (49.0%) |
| 6 or 7 Rooms | 15,903 (39.4%) | 3,787 (18.9%) |
| 8 or more Rooms | 12,336 (30.5%) | 1,305 (6.5%) |
| Total | 40,402 (100.0%) | 20,090 (100.0%) |
Housing Structure by Heating Type in Aurora
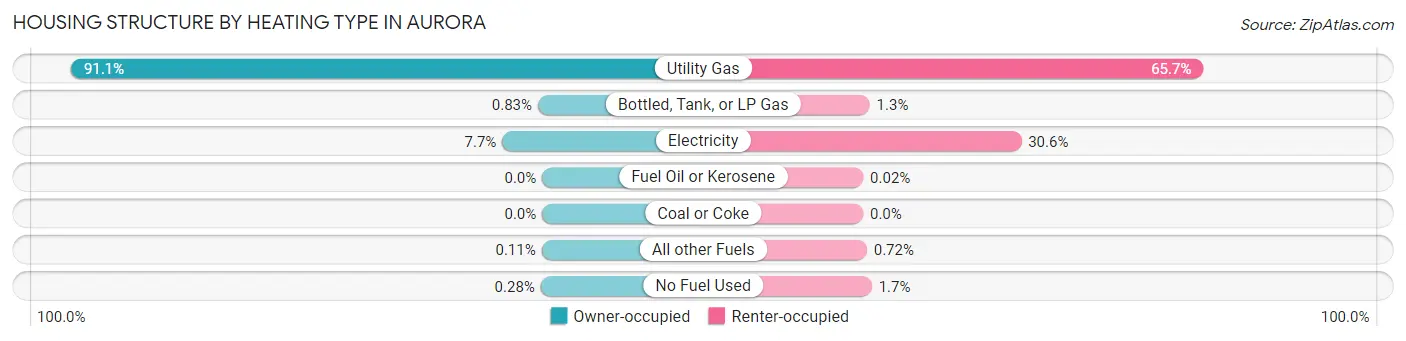
| Heating Type | Owner-occupied | Renter-occupied |
| Utility Gas | 36,787 (91.0%) | 13,206 (65.7%) |
| Bottled, Tank, or LP Gas | 335 (0.8%) | 257 (1.3%) |
| Electricity | 3,120 (7.7%) | 6,141 (30.6%) |
| Fuel Oil or Kerosene | 0 (0.0%) | 4 (0.0%) |
| Coal or Coke | 0 (0.0%) | 0 (0.0%) |
| All other Fuels | 46 (0.1%) | 145 (0.7%) |
| No Fuel Used | 114 (0.3%) | 337 (1.7%) |
| Total | 40,402 (100.0%) | 20,090 (100.0%) |
Household Vehicle Usage in Aurora
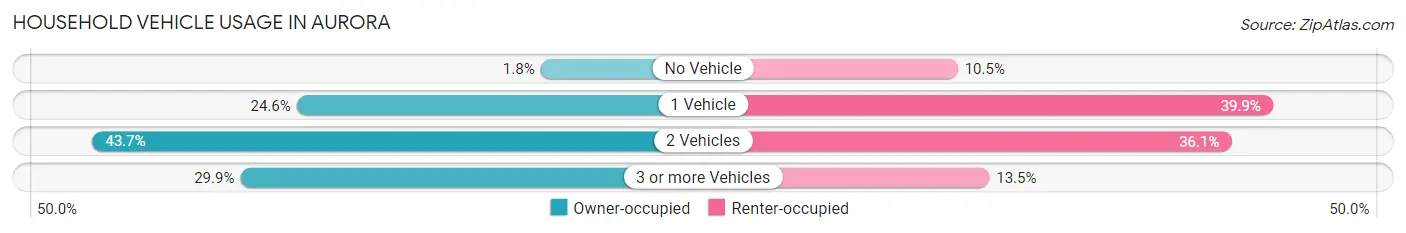
| Vehicles per Household | Owner-occupied | Renter-occupied |
| No Vehicle | 745 (1.8%) | 2,115 (10.5%) |
| 1 Vehicle | 9,942 (24.6%) | 8,022 (39.9%) |
| 2 Vehicles | 17,648 (43.7%) | 7,245 (36.1%) |
| 3 or more Vehicles | 12,067 (29.9%) | 2,708 (13.5%) |
| Total | 40,402 (100.0%) | 20,090 (100.0%) |
Real Estate & Mortgages in Aurora
Real Estate and Mortgage Overview in Aurora
| Characteristic | Without Mortgage | With Mortgage |
| Housing Units | 12,181 | 28,221 |
| Median Property Value | $225,100 | $248,300 |
| Median Household Income | $85,331 | $9,353 |
| Monthly Housing Costs | $794 | $3,828 |
| Real Estate Taxes | $5,050 | $463 |
Property Value by Mortgage Status in Aurora
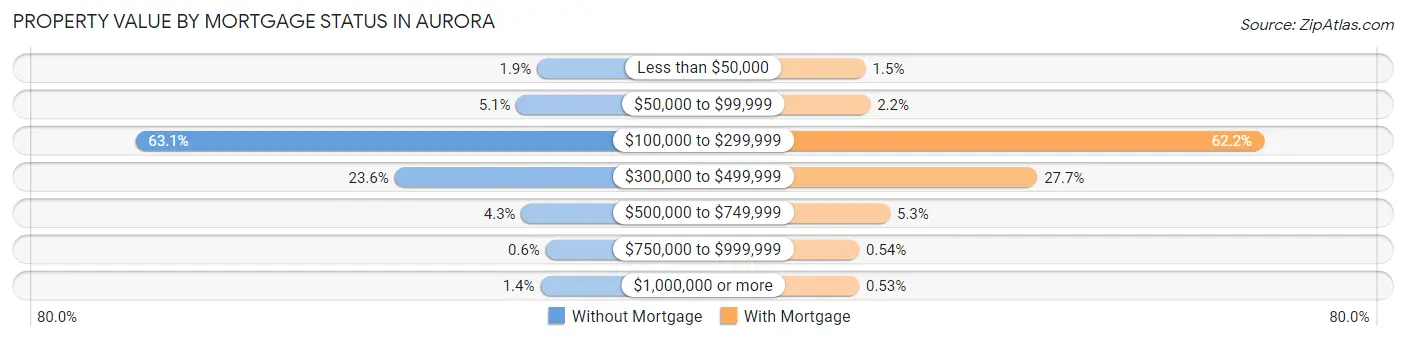
| Property Value | Without Mortgage | With Mortgage |
| Less than $50,000 | 232 (1.9%) | 434 (1.5%) |
| $50,000 to $99,999 | 616 (5.1%) | 633 (2.2%) |
| $100,000 to $299,999 | 7,687 (63.1%) | 17,558 (62.2%) |
| $300,000 to $499,999 | 2,878 (23.6%) | 7,812 (27.7%) |
| $500,000 to $749,999 | 522 (4.3%) | 1,483 (5.2%) |
| $750,000 to $999,999 | 73 (0.6%) | 152 (0.5%) |
| $1,000,000 or more | 173 (1.4%) | 149 (0.5%) |
| Total | 12,181 (100.0%) | 28,221 (100.0%) |
Household Income by Mortgage Status in Aurora
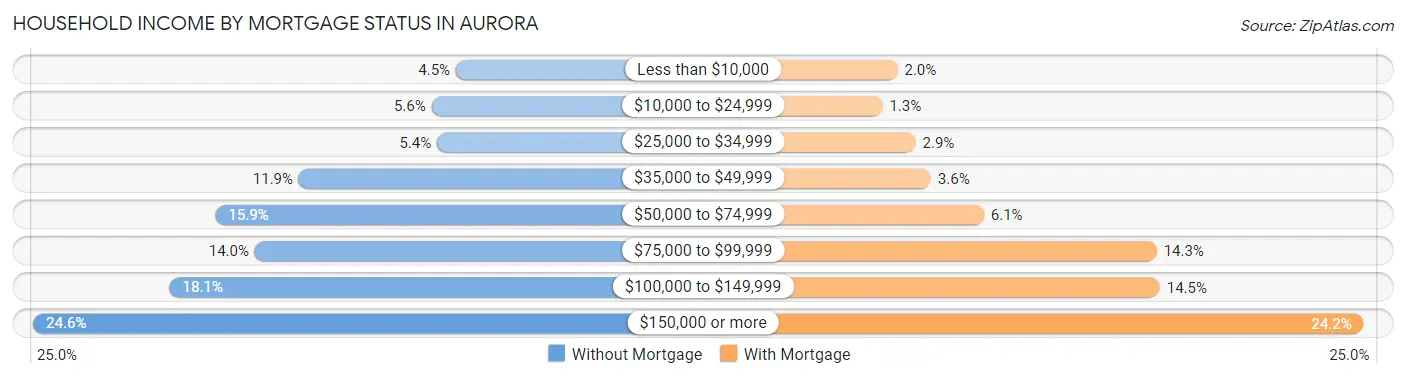
| Household Income | Without Mortgage | With Mortgage |
| Less than $10,000 | 543 (4.5%) | 565 (2.0%) |
| $10,000 to $24,999 | 684 (5.6%) | 361 (1.3%) |
| $25,000 to $34,999 | 653 (5.4%) | 807 (2.9%) |
| $35,000 to $49,999 | 1,455 (11.9%) | 1,012 (3.6%) |
| $50,000 to $74,999 | 1,938 (15.9%) | 1,725 (6.1%) |
| $75,000 to $99,999 | 1,710 (14.0%) | 4,046 (14.3%) |
| $100,000 to $149,999 | 2,203 (18.1%) | 4,090 (14.5%) |
| $150,000 or more | 2,995 (24.6%) | 6,827 (24.2%) |
| Total | 12,181 (100.0%) | 28,221 (100.0%) |
Property Value to Household Income Ratio in Aurora
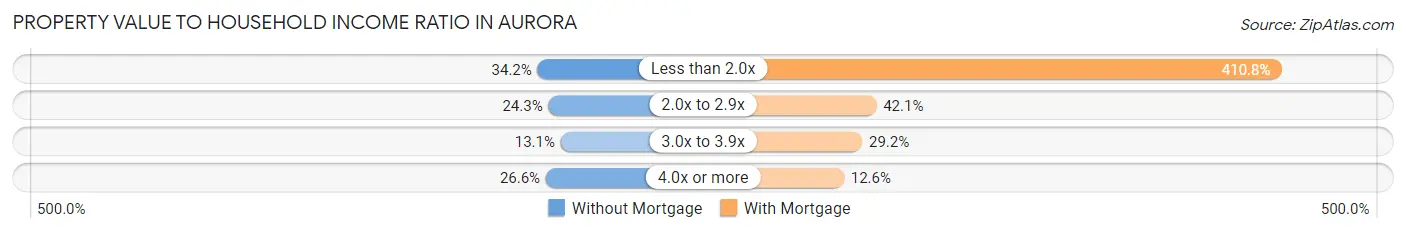
| Value-to-Income Ratio | Without Mortgage | With Mortgage |
| Less than 2.0x | 4,160 (34.2%) | 115,930 (410.8%) |
| 2.0x to 2.9x | 2,957 (24.3%) | 11,866 (42.0%) |
| 3.0x to 3.9x | 1,600 (13.1%) | 8,241 (29.2%) |
| 4.0x or more | 3,238 (26.6%) | 3,550 (12.6%) |
| Total | 12,181 (100.0%) | 28,221 (100.0%) |
Real Estate Taxes by Mortgage Status in Aurora
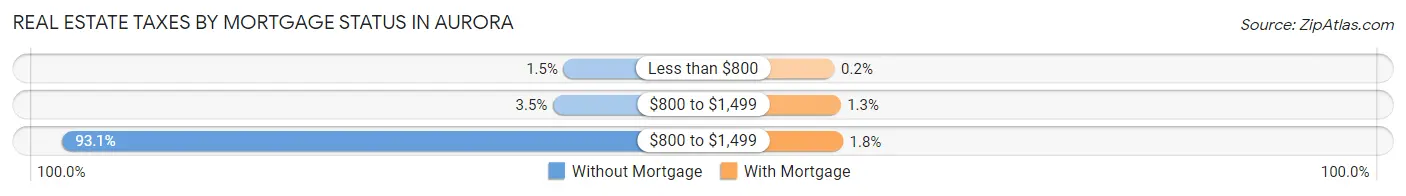
| Property Taxes | Without Mortgage | With Mortgage |
| Less than $800 | 185 (1.5%) | 56 (0.2%) |
| $800 to $1,499 | 420 (3.5%) | 369 (1.3%) |
| $800 to $1,499 | 11,341 (93.1%) | 495 (1.8%) |
| Total | 12,181 (100.0%) | 28,221 (100.0%) |
Health & Disability in Aurora
Health Insurance Coverage by Age in Aurora
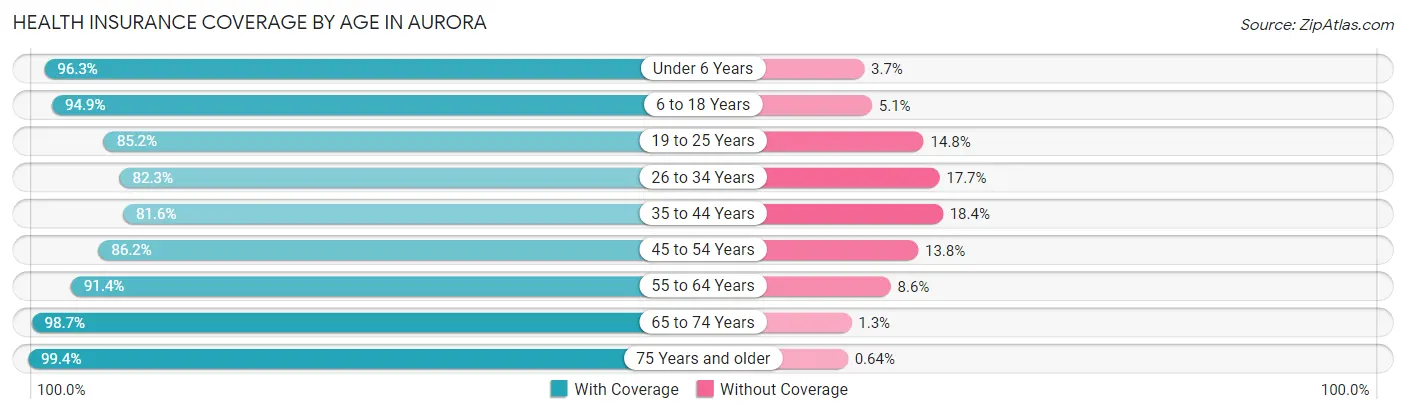
| Age Bracket | With Coverage | Without Coverage |
| Under 6 Years | 13,156 (96.3%) | 506 (3.7%) |
| 6 to 18 Years | 35,569 (94.9%) | 1,929 (5.1%) |
| 19 to 25 Years | 15,381 (85.2%) | 2,669 (14.8%) |
| 26 to 34 Years | 16,709 (82.3%) | 3,600 (17.7%) |
| 35 to 44 Years | 23,132 (81.6%) | 5,203 (18.4%) |
| 45 to 54 Years | 22,647 (86.2%) | 3,614 (13.8%) |
| 55 to 64 Years | 16,358 (91.4%) | 1,547 (8.6%) |
| 65 to 74 Years | 12,010 (98.7%) | 161 (1.3%) |
| 75 Years and older | 6,316 (99.4%) | 41 (0.6%) |
| Total | 161,278 (89.3%) | 19,270 (10.7%) |
Health Insurance Coverage by Citizenship Status in Aurora
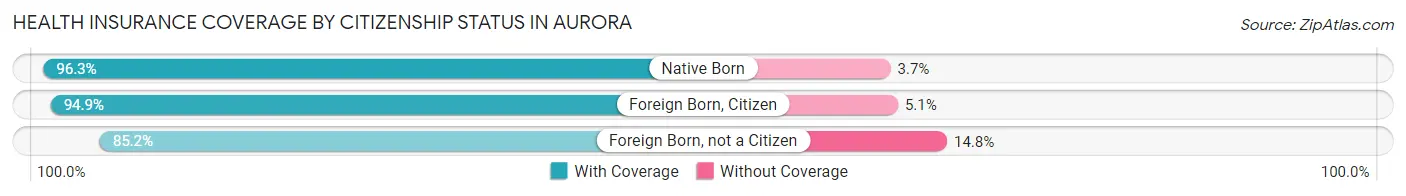
| Citizenship Status | With Coverage | Without Coverage |
| Native Born | 13,156 (96.3%) | 506 (3.7%) |
| Foreign Born, Citizen | 35,569 (94.9%) | 1,929 (5.1%) |
| Foreign Born, not a Citizen | 15,381 (85.2%) | 2,669 (14.8%) |
Health Insurance Coverage by Household Income in Aurora
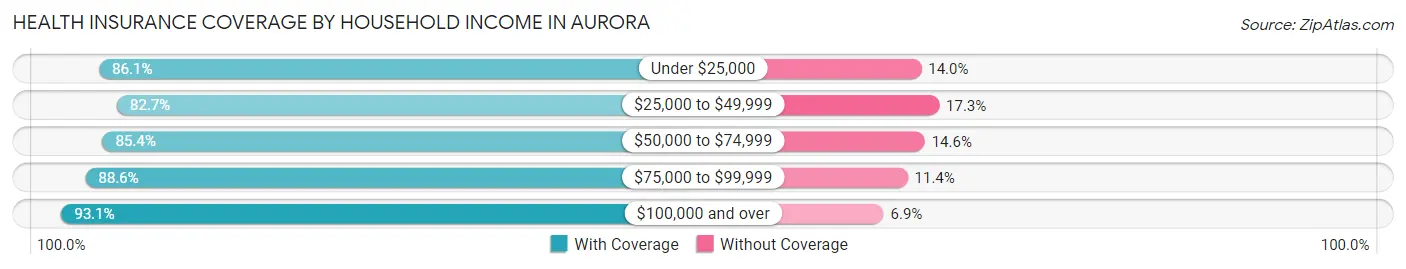
| Household Income | With Coverage | Without Coverage |
| Under $25,000 | 11,069 (86.1%) | 1,795 (14.0%) |
| $25,000 to $49,999 | 19,745 (82.7%) | 4,131 (17.3%) |
| $50,000 to $74,999 | 23,651 (85.4%) | 4,044 (14.6%) |
| $75,000 to $99,999 | 23,897 (88.6%) | 3,072 (11.4%) |
| $100,000 and over | 82,206 (93.1%) | 6,084 (6.9%) |
Public vs Private Health Insurance Coverage by Age in Aurora
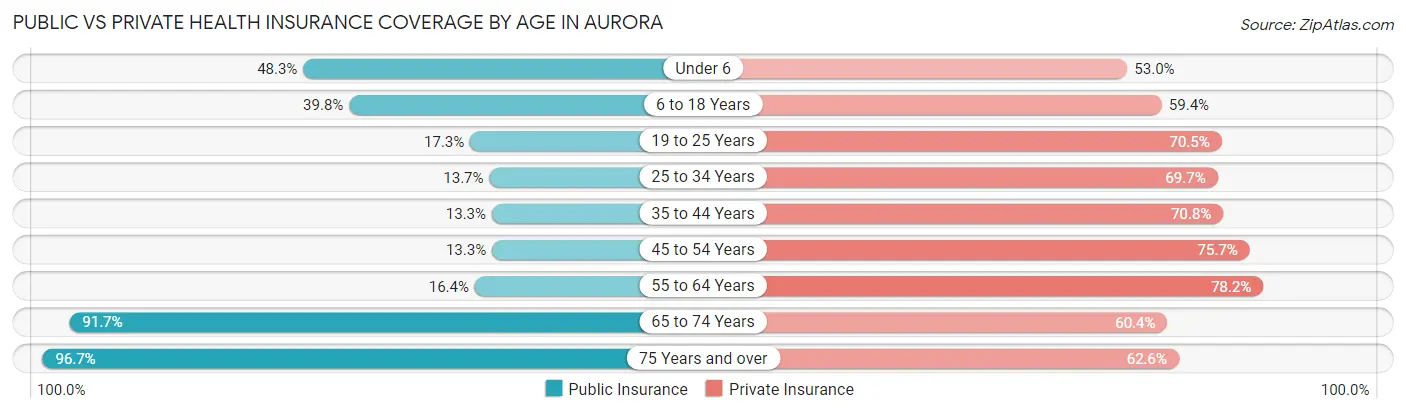
| Age Bracket | Public Insurance | Private Insurance |
| Under 6 | 6,598 (48.3%) | 7,242 (53.0%) |
| 6 to 18 Years | 14,909 (39.8%) | 22,283 (59.4%) |
| 19 to 25 Years | 3,124 (17.3%) | 12,721 (70.5%) |
| 25 to 34 Years | 2,789 (13.7%) | 14,162 (69.7%) |
| 35 to 44 Years | 3,759 (13.3%) | 20,057 (70.8%) |
| 45 to 54 Years | 3,480 (13.3%) | 19,879 (75.7%) |
| 55 to 64 Years | 2,943 (16.4%) | 14,004 (78.2%) |
| 65 to 74 Years | 11,160 (91.7%) | 7,353 (60.4%) |
| 75 Years and over | 6,146 (96.7%) | 3,976 (62.5%) |
| Total | 54,908 (30.4%) | 121,677 (67.4%) |
Disability Status by Sex by Age in Aurora
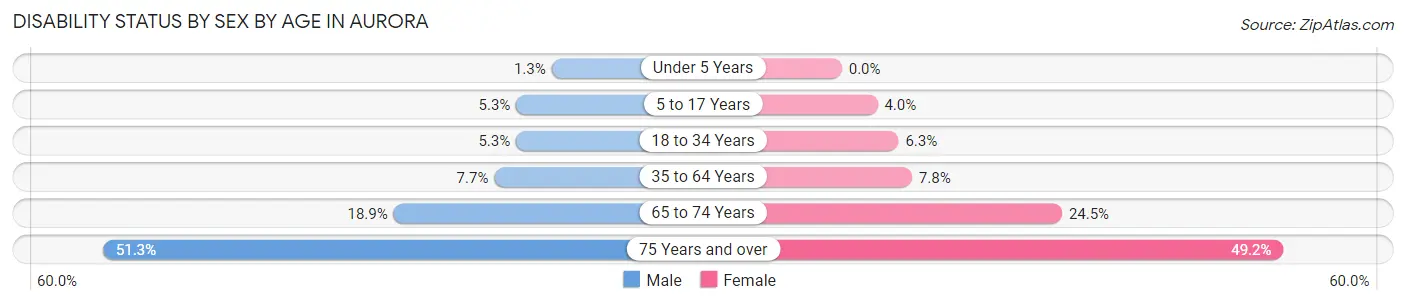
| Age Bracket | Male | Female |
| Under 5 Years | 82 (1.3%) | 0 (0.0%) |
| 5 to 17 Years | 981 (5.2%) | 724 (4.0%) |
| 18 to 34 Years | 1,110 (5.3%) | 1,261 (6.3%) |
| 35 to 64 Years | 2,785 (7.7%) | 2,840 (7.8%) |
| 65 to 74 Years | 1,019 (18.9%) | 1,663 (24.5%) |
| 75 Years and over | 1,221 (51.3%) | 1,955 (49.2%) |
Disability Class by Sex by Age in Aurora
Disability Class: Hearing Difficulty
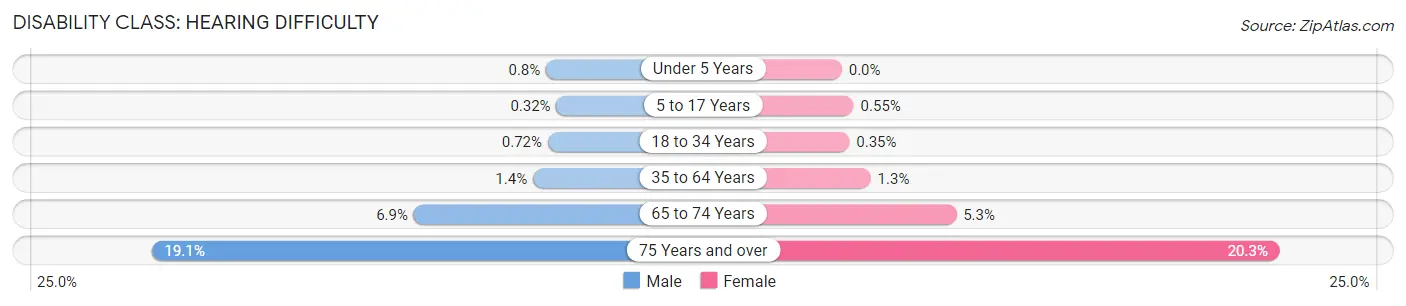
| Age Bracket | Male | Female |
| Under 5 Years | 50 (0.8%) | 0 (0.0%) |
| 5 to 17 Years | 60 (0.3%) | 100 (0.5%) |
| 18 to 34 Years | 151 (0.7%) | 70 (0.4%) |
| 35 to 64 Years | 508 (1.4%) | 487 (1.3%) |
| 65 to 74 Years | 374 (6.9%) | 360 (5.3%) |
| 75 Years and over | 455 (19.1%) | 808 (20.3%) |
Disability Class: Vision Difficulty
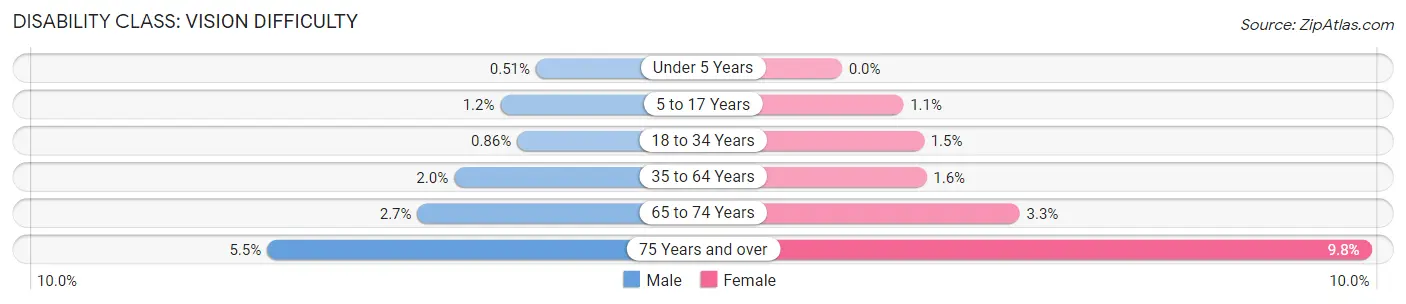
| Age Bracket | Male | Female |
| Under 5 Years | 32 (0.5%) | 0 (0.0%) |
| 5 to 17 Years | 219 (1.2%) | 208 (1.1%) |
| 18 to 34 Years | 180 (0.9%) | 304 (1.5%) |
| 35 to 64 Years | 733 (2.0%) | 569 (1.6%) |
| 65 to 74 Years | 146 (2.7%) | 224 (3.3%) |
| 75 Years and over | 131 (5.5%) | 391 (9.8%) |
Disability Class: Cognitive Difficulty
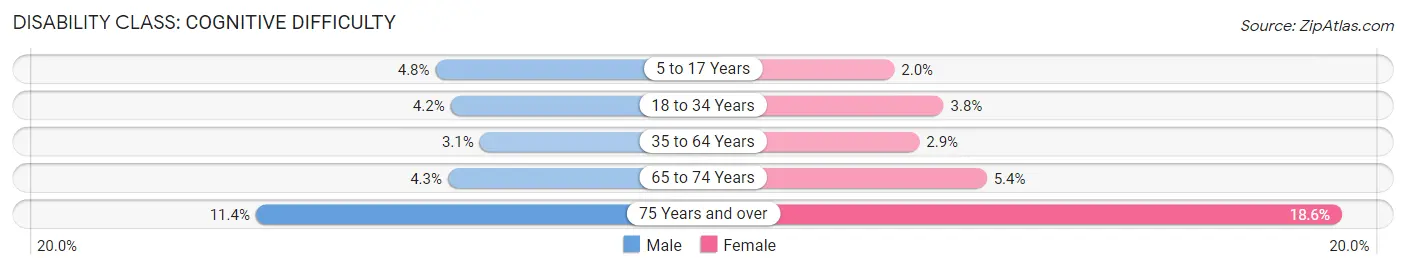
| Age Bracket | Male | Female |
| 5 to 17 Years | 888 (4.8%) | 356 (1.9%) |
| 18 to 34 Years | 883 (4.2%) | 755 (3.8%) |
| 35 to 64 Years | 1,124 (3.1%) | 1,047 (2.9%) |
| 65 to 74 Years | 231 (4.3%) | 365 (5.4%) |
| 75 Years and over | 272 (11.4%) | 738 (18.6%) |
Disability Class: Ambulatory Difficulty
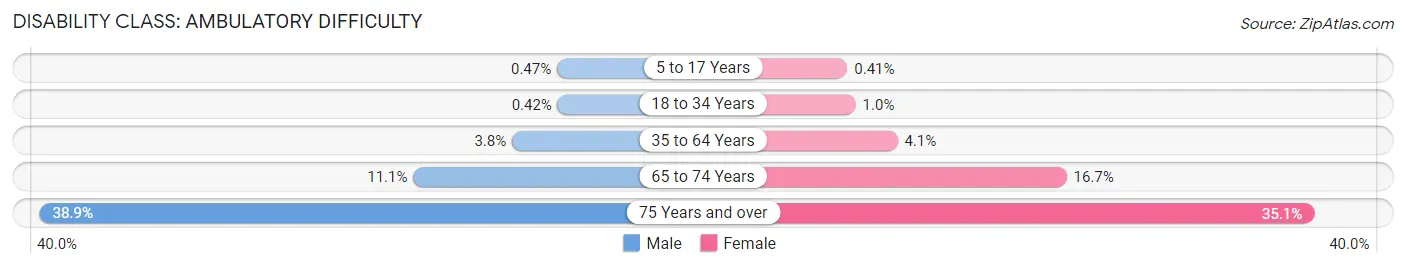
| Age Bracket | Male | Female |
| 5 to 17 Years | 88 (0.5%) | 75 (0.4%) |
| 18 to 34 Years | 89 (0.4%) | 205 (1.0%) |
| 35 to 64 Years | 1,379 (3.8%) | 1,502 (4.1%) |
| 65 to 74 Years | 600 (11.1%) | 1,132 (16.7%) |
| 75 Years and over | 926 (38.9%) | 1,394 (35.1%) |
Disability Class: Self-Care Difficulty
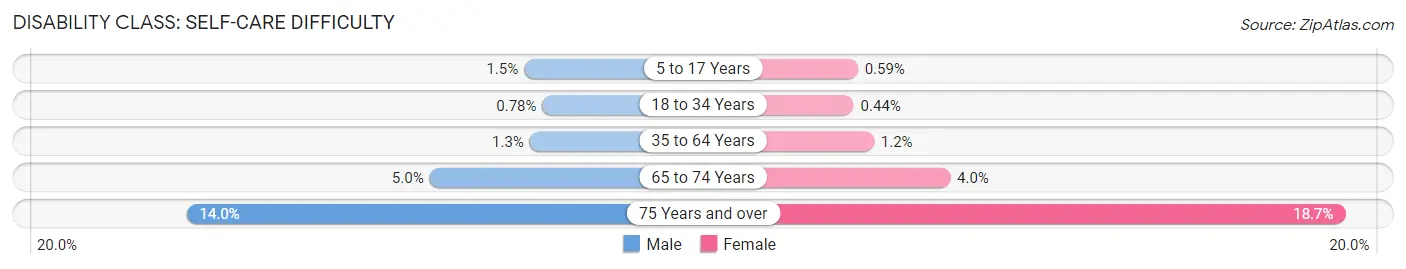
| Age Bracket | Male | Female |
| 5 to 17 Years | 273 (1.5%) | 108 (0.6%) |
| 18 to 34 Years | 165 (0.8%) | 88 (0.4%) |
| 35 to 64 Years | 451 (1.3%) | 432 (1.2%) |
| 65 to 74 Years | 268 (5.0%) | 273 (4.0%) |
| 75 Years and over | 333 (14.0%) | 743 (18.7%) |
Technology Access in Aurora
Computing Device Access in Aurora
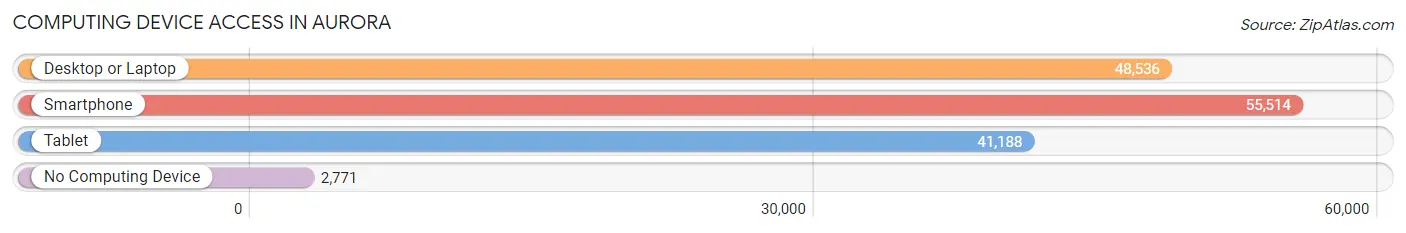
| Device Type | # Households | % Households |
| Desktop or Laptop | 48,536 | 80.2% |
| Smartphone | 55,514 | 91.8% |
| Tablet | 41,188 | 68.1% |
| No Computing Device | 2,771 | 4.6% |
| Total | 60,492 | 100.0% |
Internet Access in Aurora
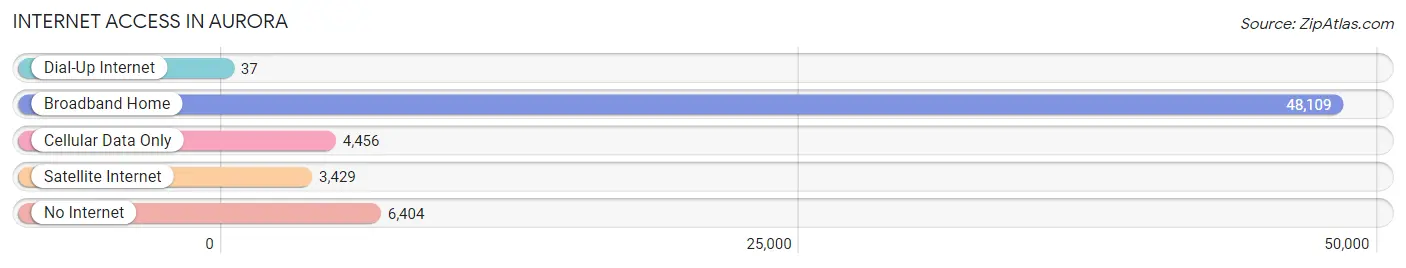
| Internet Type | # Households | % Households |
| Dial-Up Internet | 37 | 0.1% |
| Broadband Home | 48,109 | 79.5% |
| Cellular Data Only | 4,456 | 7.4% |
| Satellite Internet | 3,429 | 5.7% |
| No Internet | 6,404 | 10.6% |
| Total | 60,492 | 100.0% |
Aurora Summary
Aurora, Illinois is a city located in the western suburbs of Chicago, in Kane and DuPage counties. It is the second-largest city in the state of Illinois, with a population of over 200,000 people. Aurora is known for its diverse population, its vibrant economy, and its rich history.
Geography
Aurora is located in the Fox River Valley, about 40 miles west of Chicago. The city is situated on the Fox River, which runs through the center of the city. The city is bordered by the towns of North Aurora, Montgomery, Oswego, and Sugar Grove. The city is divided into three distinct regions: the East Side, the West Side, and the Far West Side. The East Side is the most populous and is home to the downtown area, while the West Side is more residential and is home to the Fox Valley Mall. The Far West Side is the least populated and is home to the Aurora University campus.
History
Aurora was first settled in 1834 by settlers from New York. The city was originally named McCartyville, after one of the settlers, John McCarty. In 1837, the city was renamed Aurora, after the Roman goddess of the dawn. The city was officially incorporated in 1845.
In the late 19th century, Aurora became a major industrial center, with several factories and mills located along the Fox River. The city was also home to several large companies, including the Aurora Watch Company, the Aurora Gasoline Company, and the Aurora Brewing Company.
In the early 20th century, Aurora experienced a period of rapid growth, as the city became a major transportation hub. The city was home to several railroads, including the Chicago, Aurora & Elgin Railroad, the Aurora, Elgin & Fox River Electric Company, and the Aurora, Joliet & Elgin Railroad.
Economy
Aurora is home to a diverse economy, with a variety of industries represented. The city is home to several large companies, including the Caterpillar Corporation, the Fox Valley Mall, and the Hollywood Casino. The city is also home to several smaller businesses, including restaurants, retail stores, and professional services.
The city is also home to several educational institutions, including Aurora University, Waubonsee Community College, and the Illinois Math and Science Academy.
Demographics
As of the 2010 census, the population of Aurora was 197,899. The city is racially and ethnically diverse, with a population that is 44.3% White, 28.2% Hispanic or Latino, 16.2% African American, and 5.3% Asian. The city is also home to a large immigrant population, with over 20% of the population being foreign-born.
The median household income in Aurora is $60,945, and the median home value is $182,400. The city has a poverty rate of 13.3%, which is slightly higher than the national average.
Conclusion
Aurora, Illinois is a vibrant city with a rich history and a diverse population. The city is home to a variety of industries, educational institutions, and businesses, and is a major transportation hub. The city is also home to a diverse population, with a variety of racial and ethnic backgrounds represented. Aurora is a great place to live, work, and play, and is a great example of the diversity and vibrancy of the state of Illinois.
Common Questions
What is Per Capita Income in Aurora?
Per Capita income in Aurora is $38,064.
What is the Median Family Income in Aurora?
Median Family Income in Aurora is $97,491.
What is the Median Household income in Aurora?
Median Household Income in Aurora is $85,943.
What is Income or Wage Gap in Aurora?
Income or Wage Gap in Aurora is 27.7%.
Women in Aurora earn 72.3 cents for every dollar earned by a man.
What is Family Income Deficit in Aurora?
Family Income Deficit in Aurora is $9,560.
Families that are below poverty line in Aurora earn $9,560 less on average than the poverty threshold level.
What is Inequality or Gini Index in Aurora?
Inequality or Gini Index in Aurora is 0.42.
What is the Total Population of Aurora?
Total Population of Aurora is 181,405.
What is the Total Male Population of Aurora?
Total Male Population of Aurora is 90,255.
What is the Total Female Population of Aurora?
Total Female Population of Aurora is 91,150.
What is the Ratio of Males per 100 Females in Aurora?
There are 99.02 Males per 100 Females in Aurora.
What is the Ratio of Females per 100 Males in Aurora?
There are 100.99 Females per 100 Males in Aurora.
What is the Median Population Age in Aurora?
Median Population Age in Aurora is 35.4 Years.
What is the Average Family Size in Aurora
Average Family Size in Aurora is 3.4 People.
What is the Average Household Size in Aurora
Average Household Size in Aurora is 3.0 People.
How Large is the Labor Force in Aurora?
There are 101,279 People in the Labor Forcein in Aurora.
What is the Percentage of People in the Labor Force in Aurora?
72.7% of People are in the Labor Force in Aurora.
What is the Unemployment Rate in Aurora?
Unemployment Rate in Aurora is 5.6%.