Summit, IL Map & Demographics
Summit Map
Summit Overview
$27,730
PER CAPITA INCOME
$63,438
AVG FAMILY INCOME
$51,040
AVG HOUSEHOLD INCOME
14.6%
WAGE / INCOME GAP [ % ]
85.4¢/ $1
WAGE / INCOME GAP [ $ ]
$8,046
FAMILY INCOME DEFICIT
0.50
INEQUALITY / GINI INDEX
11,036
TOTAL POPULATION
5,563
MALE POPULATION
5,473
FEMALE POPULATION
101.64
MALES / 100 FEMALES
98.38
FEMALES / 100 MALES
37.1
MEDIAN AGE
3.7
AVG FAMILY SIZE
3.1
AVG HOUSEHOLD SIZE
5,186
LABOR FORCE [ PEOPLE ]
58.6%
PERCENT IN LABOR FORCE
7.1%
UNEMPLOYMENT RATE
Income in Summit
Income Overview in Summit
Per Capita Income in Summit is $27,730, while median incomes of families and households are $63,438 and $51,040 respectively.
| Characteristic | Number | Measure |
| Per Capita Income | 11,036 | $27,730 |
| Median Family Income | 2,570 | $63,438 |
| Mean Family Income | 2,570 | $93,820 |
| Median Household Income | 3,600 | $51,040 |
| Mean Household Income | 3,600 | $82,115 |
| Income Deficit | 2,570 | $8,046 |
| Wage / Income Gap (%) | 11,036 | 14.62% |
| Wage / Income Gap ($) | 11,036 | 85.38¢ per $1 |
| Gini / Inequality Index | 11,036 | 0.50 |
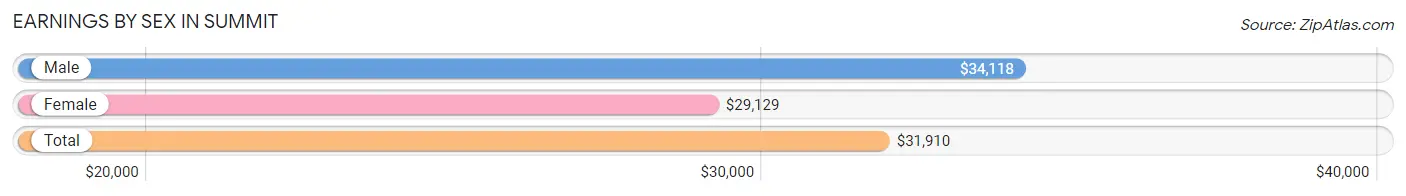
Earnings by Sex in Summit
Average Earnings in Summit are $31,910, $34,118 for men and $29,129 for women, a difference of 14.6%.
| Sex | Number | Average Earnings |
| Male | 3,162 (59.2%) | $34,118 |
| Female | 2,183 (40.8%) | $29,129 |
| Total | 5,345 (100.0%) | $31,910 |
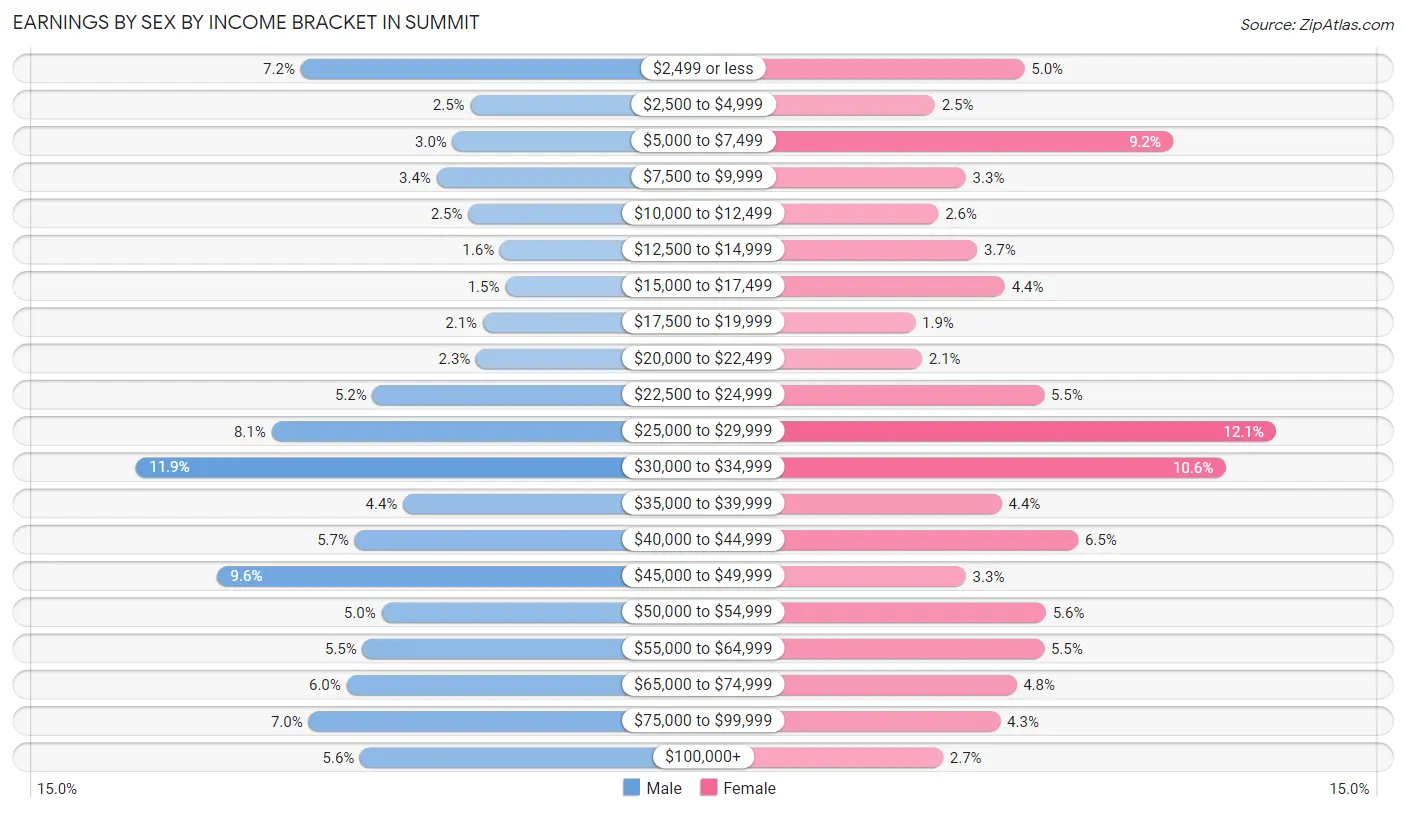
Earnings by Sex by Income Bracket in Summit
The most common earnings brackets in Summit are $30,000 to $34,999 for men (375 | 11.9%) and $25,000 to $29,999 for women (263 | 12.0%).
| Income | Male | Female |
| $2,499 or less | 229 (7.2%) | 109 (5.0%) |
| $2,500 to $4,999 | 78 (2.5%) | 54 (2.5%) |
| $5,000 to $7,499 | 94 (3.0%) | 200 (9.2%) |
| $7,500 to $9,999 | 108 (3.4%) | 73 (3.3%) |
| $10,000 to $12,499 | 80 (2.5%) | 56 (2.6%) |
| $12,500 to $14,999 | 52 (1.6%) | 80 (3.7%) |
| $15,000 to $17,499 | 47 (1.5%) | 97 (4.4%) |
| $17,500 to $19,999 | 67 (2.1%) | 42 (1.9%) |
| $20,000 to $22,499 | 73 (2.3%) | 46 (2.1%) |
| $22,500 to $24,999 | 165 (5.2%) | 121 (5.5%) |
| $25,000 to $29,999 | 255 (8.1%) | 263 (12.0%) |
| $30,000 to $34,999 | 375 (11.9%) | 232 (10.6%) |
| $35,000 to $39,999 | 138 (4.4%) | 95 (4.3%) |
| $40,000 to $44,999 | 181 (5.7%) | 142 (6.5%) |
| $45,000 to $49,999 | 303 (9.6%) | 73 (3.3%) |
| $50,000 to $54,999 | 157 (5.0%) | 122 (5.6%) |
| $55,000 to $64,999 | 174 (5.5%) | 121 (5.5%) |
| $65,000 to $74,999 | 188 (5.9%) | 104 (4.8%) |
| $75,000 to $99,999 | 222 (7.0%) | 94 (4.3%) |
| $100,000+ | 176 (5.6%) | 59 (2.7%) |
| Total | 3,162 (100.0%) | 2,183 (100.0%) |
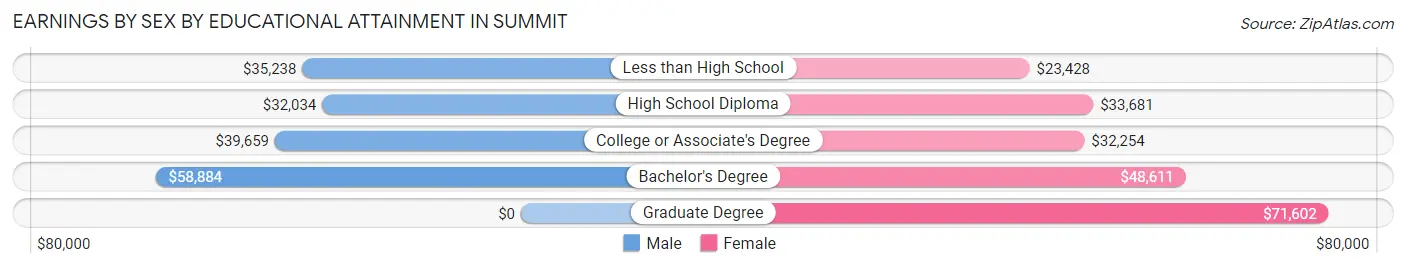
Earnings by Sex by Educational Attainment in Summit
Average earnings in Summit are $37,909 for men and $31,674 for women, a difference of 16.5%. Men with an educational attainment of bachelor's degree enjoy the highest average annual earnings of $58,884, while those with high school diploma education earn the least with $32,034. Women with an educational attainment of graduate degree earn the most with the average annual earnings of $71,602, while those with less than high school education have the smallest earnings of $23,428.
| Educational Attainment | Male Income | Female Income |
| Less than High School | $35,238 | $23,428 |
| High School Diploma | $32,034 | $33,681 |
| College or Associate's Degree | $39,659 | $32,254 |
| Bachelor's Degree | $58,884 | $48,611 |
| Graduate Degree | - | - |
| Total | $37,909 | $31,674 |
Family Income in Summit
Family Income Brackets in Summit
According to the Summit family income data, there are 439 families falling into the $100,000 to $149,999 income range, which is the most common income bracket and makes up 17.1% of all families. Conversely, the $10,000 to $14,999 income bracket is the least frequent group with only 10 families (0.4%) belonging to this category.
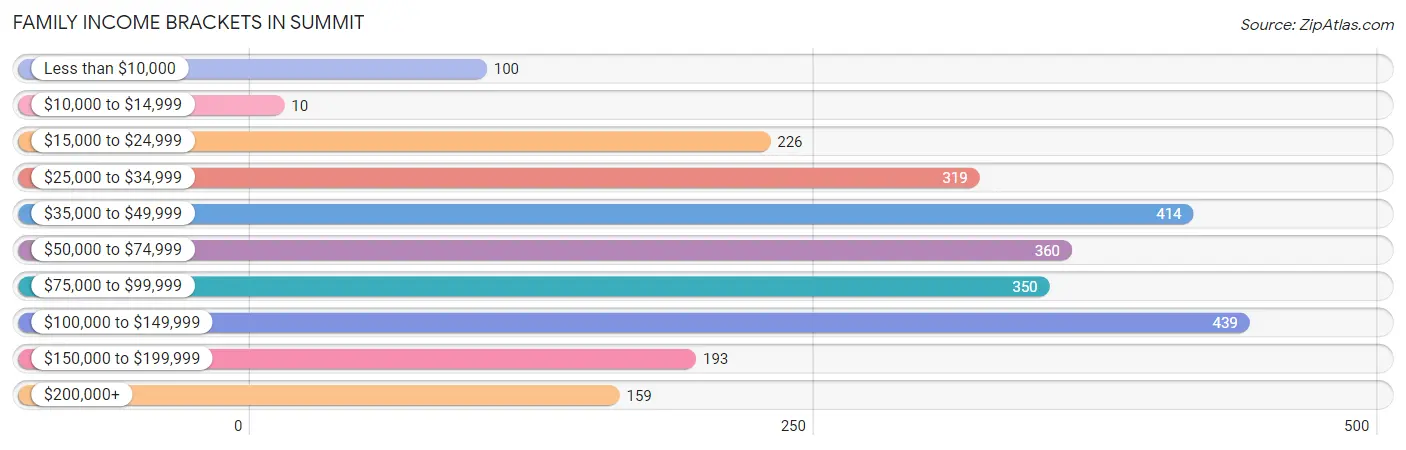
| Income Bracket | # Families | % Families |
| Less than $10,000 | 100 | 3.9% |
| $10,000 to $14,999 | 10 | 0.4% |
| $15,000 to $24,999 | 226 | 8.8% |
| $25,000 to $34,999 | 319 | 12.4% |
| $35,000 to $49,999 | 414 | 16.1% |
| $50,000 to $74,999 | 360 | 14.0% |
| $75,000 to $99,999 | 350 | 13.6% |
| $100,000 to $149,999 | 439 | 17.1% |
| $150,000 to $199,999 | 193 | 7.5% |
| $200,000+ | 159 | 6.2% |
Family Income by Famaliy Size in Summit
5-person families (258 | 10.0%) account for the highest median family income in Summit with $99,167 per family, while 2-person families (514 | 20.0%) have the highest median income of $20,698 per family member.
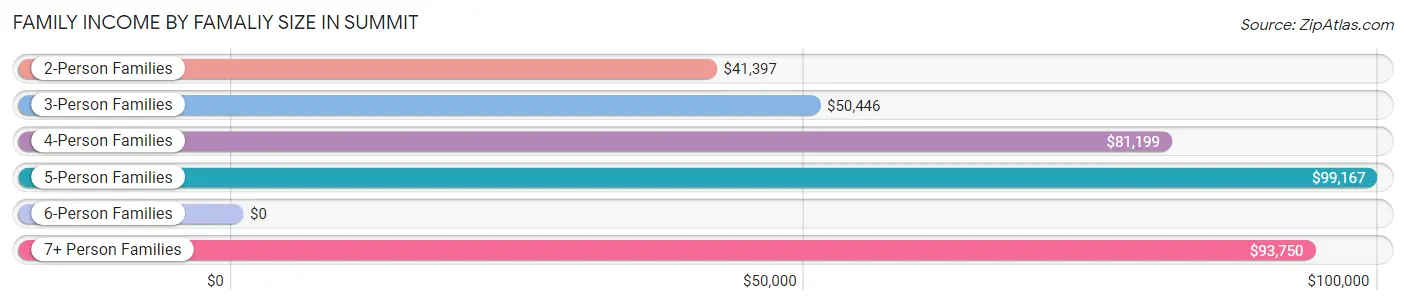
| Income Bracket | # Families | Median Income |
| 2-Person Families | 514 (20.0%) | $41,397 |
| 3-Person Families | 810 (31.5%) | $50,446 |
| 4-Person Families | 759 (29.5%) | $81,199 |
| 5-Person Families | 258 (10.0%) | $99,167 |
| 6-Person Families | 101 (3.9%) | $0 |
| 7+ Person Families | 128 (5.0%) | $93,750 |
| Total | 2,570 (100.0%) | $63,438 |
Family Income by Number of Earners in Summit
The median family income in Summit is $63,438, with families comprising 3+ earners (551) having the highest median family income of $117,875, while families with no earners (249) have the lowest median family income of $22,047, accounting for 21.4% and 9.7% of families, respectively.
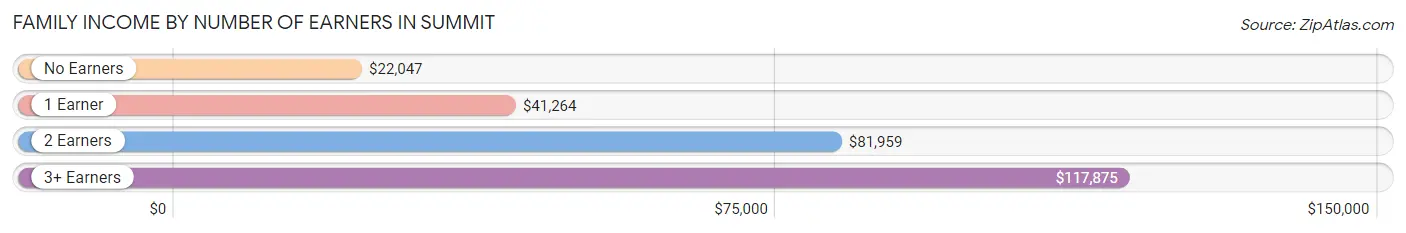
| Number of Earners | # Families | Median Income |
| No Earners | 249 (9.7%) | $22,047 |
| 1 Earner | 1,084 (42.2%) | $41,264 |
| 2 Earners | 686 (26.7%) | $81,959 |
| 3+ Earners | 551 (21.4%) | $117,875 |
| Total | 2,570 (100.0%) | $63,438 |
Household Income in Summit
Household Income Brackets in Summit
With 547 households falling in the category, the $100,000 to $149,999 income range is the most frequent in Summit, accounting for 15.2% of all households. In contrast, only 32 households (0.9%) fall into the $10,000 to $14,999 income bracket, making it the least populous group.
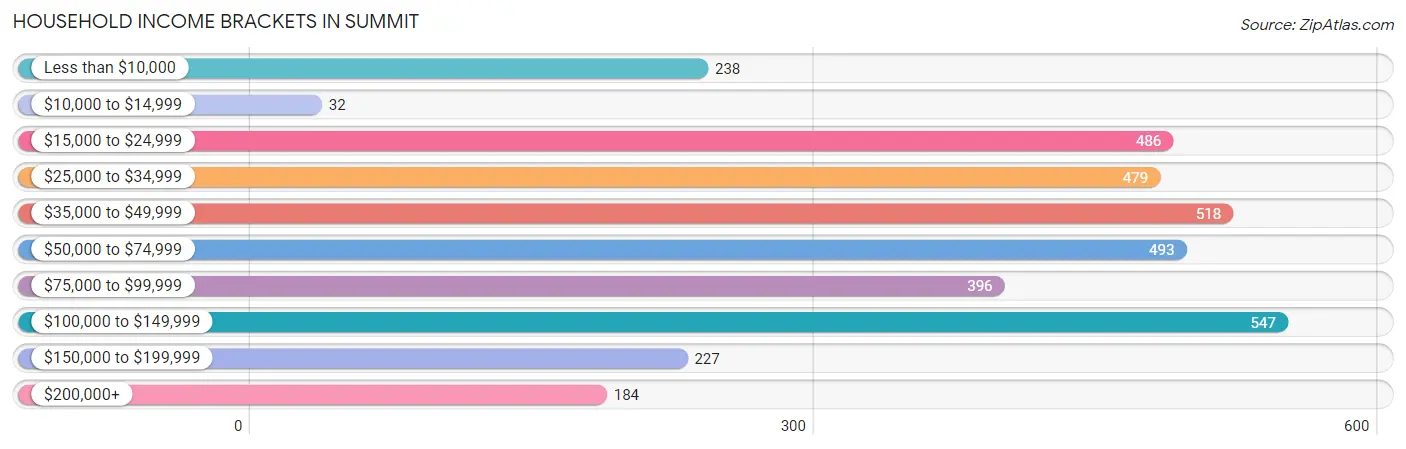
| Income Bracket | # Households | % Households |
| Less than $10,000 | 238 | 6.6% |
| $10,000 to $14,999 | 32 | 0.9% |
| $15,000 to $24,999 | 486 | 13.5% |
| $25,000 to $34,999 | 479 | 13.3% |
| $35,000 to $49,999 | 518 | 14.4% |
| $50,000 to $74,999 | 493 | 13.7% |
| $75,000 to $99,999 | 396 | 11.0% |
| $100,000 to $149,999 | 547 | 15.2% |
| $150,000 to $199,999 | 227 | 6.3% |
| $200,000+ | 184 | 5.1% |
Household Income by Householder Age in Summit
The median household income in Summit is $51,040, with the highest median household income of $86,369 found in the 45 to 64 years age bracket for the primary householder. A total of 1,316 households (36.6%) fall into this category. Meanwhile, the 15 to 24 years age bracket for the primary householder has the lowest median household income of $0, with 47 households (1.3%) in this group.
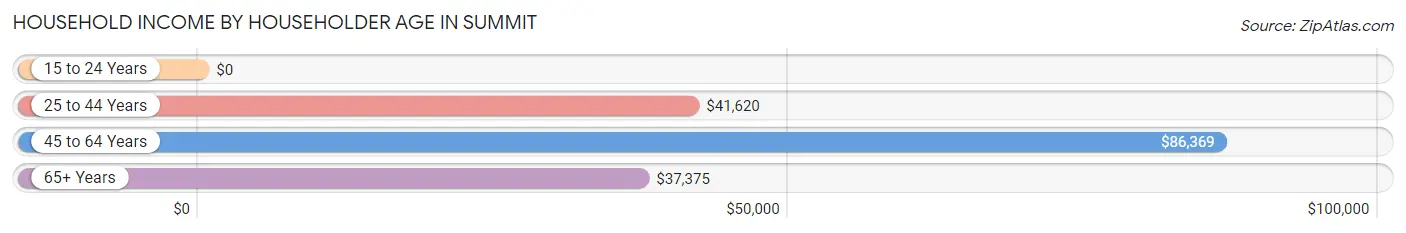
| Income Bracket | # Households | Median Income |
| 15 to 24 Years | 47 (1.3%) | $0 |
| 25 to 44 Years | 1,211 (33.6%) | $41,620 |
| 45 to 64 Years | 1,316 (36.6%) | $86,369 |
| 65+ Years | 1,026 (28.5%) | $37,375 |
| Total | 3,600 (100.0%) | $51,040 |
Poverty in Summit
Income Below Poverty by Sex and Age in Summit
With 14.5% poverty level for males and 12.2% for females among the residents of Summit, 12 to 14 year old males and 16 and 17 year old females are the most vulnerable to poverty, with 52 males (30.2%) and 63 females (32.8%) in their respective age groups living below the poverty level.
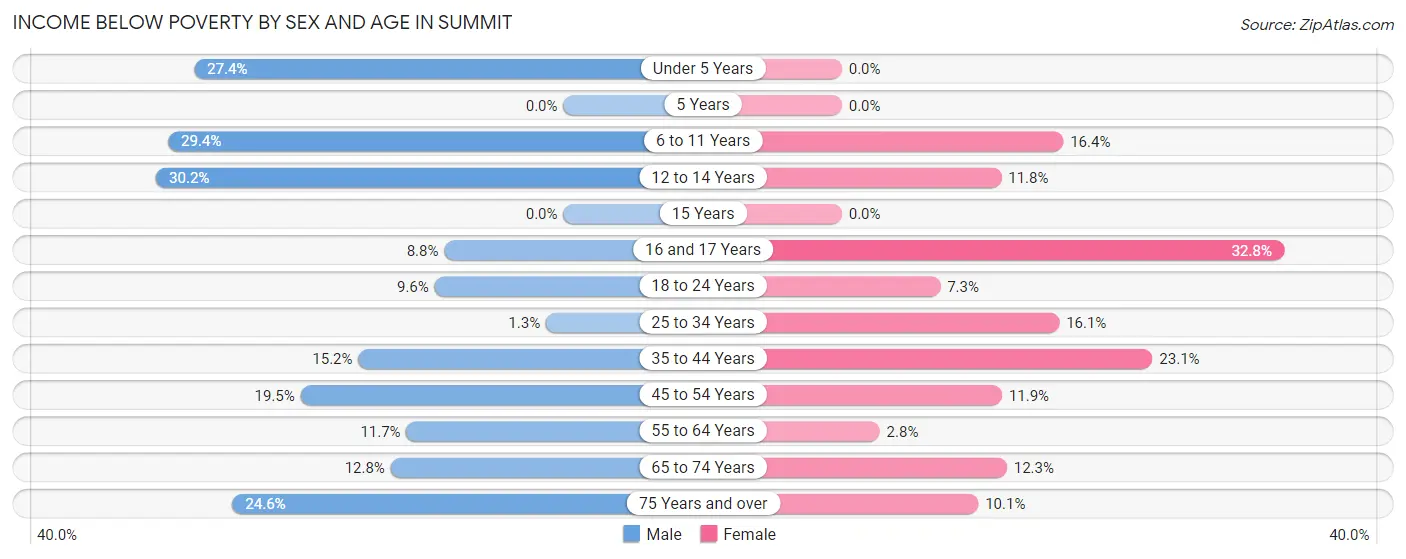
| Age Bracket | Male | Female |
| Under 5 Years | 37 (27.4%) | 0 (0.0%) |
| 5 Years | 0 (0.0%) | 0 (0.0%) |
| 6 to 11 Years | 157 (29.3%) | 72 (16.4%) |
| 12 to 14 Years | 52 (30.2%) | 29 (11.8%) |
| 15 Years | 0 (0.0%) | 0 (0.0%) |
| 16 and 17 Years | 16 (8.8%) | 63 (32.8%) |
| 18 to 24 Years | 48 (9.6%) | 40 (7.3%) |
| 25 to 34 Years | 10 (1.3%) | 139 (16.1%) |
| 35 to 44 Years | 146 (15.2%) | 122 (23.1%) |
| 45 to 54 Years | 119 (19.5%) | 75 (11.9%) |
| 55 to 64 Years | 87 (11.7%) | 17 (2.8%) |
| 65 to 74 Years | 61 (12.8%) | 75 (12.2%) |
| 75 Years and over | 72 (24.6%) | 32 (10.1%) |
| Total | 805 (14.5%) | 664 (12.2%) |
Income Above Poverty by Sex and Age in Summit
According to the poverty statistics in Summit, males aged 5 years and females aged under 5 years are the age groups that are most secure financially, with 100.0% of males and 100.0% of females in these age groups living above the poverty line.
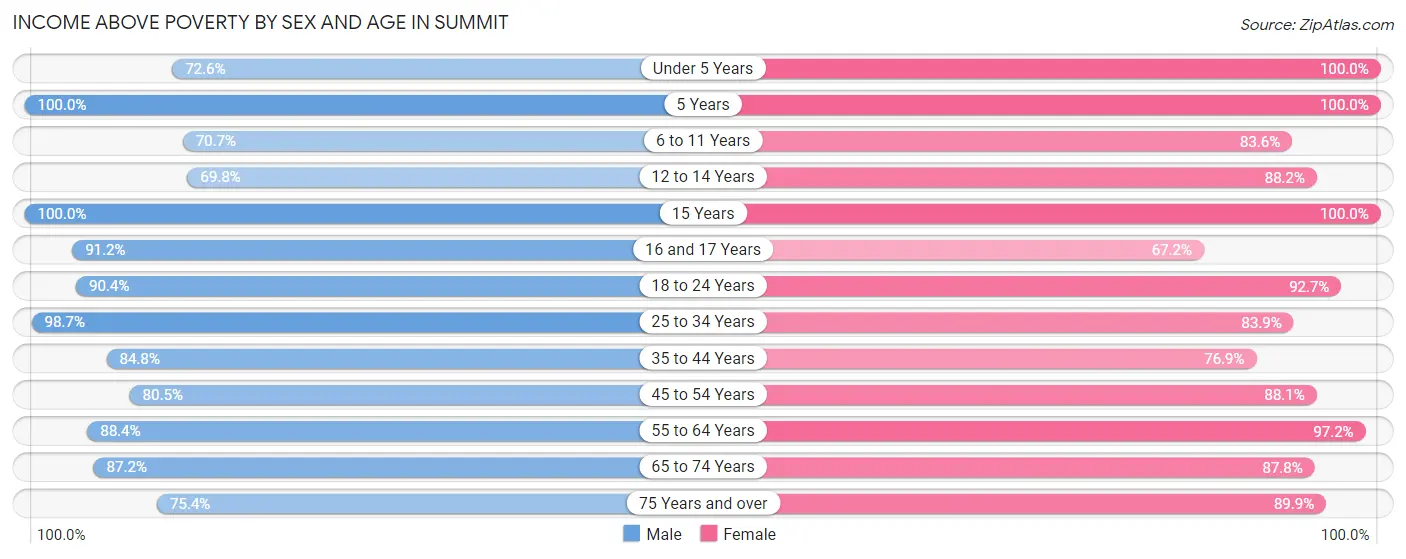
| Age Bracket | Male | Female |
| Under 5 Years | 98 (72.6%) | 338 (100.0%) |
| 5 Years | 78 (100.0%) | 64 (100.0%) |
| 6 to 11 Years | 378 (70.7%) | 366 (83.6%) |
| 12 to 14 Years | 120 (69.8%) | 216 (88.2%) |
| 15 Years | 81 (100.0%) | 68 (100.0%) |
| 16 and 17 Years | 165 (91.2%) | 129 (67.2%) |
| 18 to 24 Years | 454 (90.4%) | 507 (92.7%) |
| 25 to 34 Years | 764 (98.7%) | 722 (83.9%) |
| 35 to 44 Years | 813 (84.8%) | 407 (76.9%) |
| 45 to 54 Years | 491 (80.5%) | 556 (88.1%) |
| 55 to 64 Years | 660 (88.3%) | 589 (97.2%) |
| 65 to 74 Years | 415 (87.2%) | 537 (87.7%) |
| 75 Years and over | 221 (75.4%) | 284 (89.9%) |
| Total | 4,738 (85.5%) | 4,783 (87.8%) |
Income Below Poverty Among Married-Couple Families in Summit
The poverty statistics for married-couple families in Summit show that 7.9% or 134 of the total 1,702 families live below the poverty line. Families with 3 or 4 children have the highest poverty rate of 11.8%, comprising of 19 families. On the other hand, families with 5 or more children have the lowest poverty rate of 0.0%, which includes 0 families.
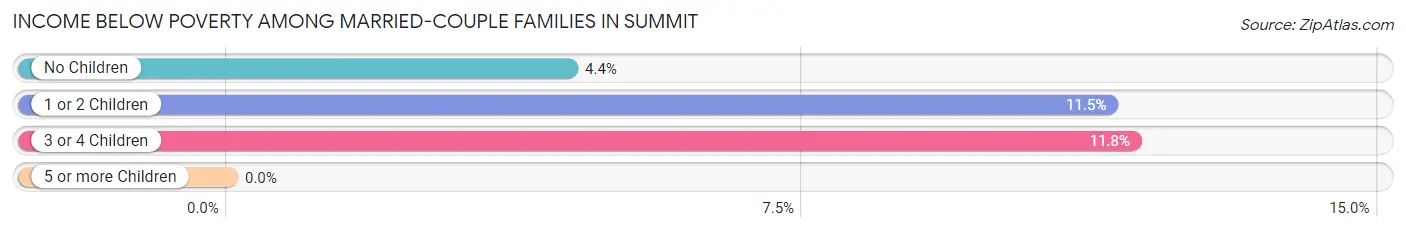
| Children | Above Poverty | Below Poverty |
| No Children | 817 (95.6%) | 38 (4.4%) |
| 1 or 2 Children | 593 (88.5%) | 77 (11.5%) |
| 3 or 4 Children | 142 (88.2%) | 19 (11.8%) |
| 5 or more Children | 16 (100.0%) | 0 (0.0%) |
| Total | 1,568 (92.1%) | 134 (7.9%) |
Income Below Poverty Among Single-Parent Households in Summit
According to the poverty data in Summit, 26.2% or 81 single-father households and 22.4% or 125 single-mother households are living below the poverty line. Among single-father households, those with no children have the highest poverty rate, with 81 households (46.6%) experiencing poverty. Likewise, among single-mother households, those with 3 or 4 children have the highest poverty rate, with 48 households (80.0%) falling below the poverty line.
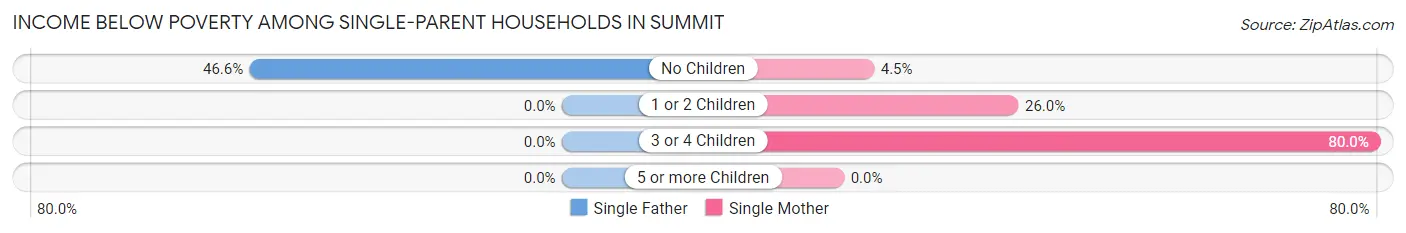
| Children | Single Father | Single Mother |
| No Children | 81 (46.6%) | 11 (4.5%) |
| 1 or 2 Children | 0 (0.0%) | 66 (26.0%) |
| 3 or 4 Children | 0 (0.0%) | 48 (80.0%) |
| 5 or more Children | 0 (0.0%) | 0 (0.0%) |
| Total | 81 (26.2%) | 125 (22.4%) |
Income Below Poverty Among Married-Couple vs Single-Parent Households in Summit
The poverty data for Summit shows that 134 of the married-couple family households (7.9%) and 206 of the single-parent households (23.7%) are living below the poverty level. Within the married-couple family households, those with 3 or 4 children have the highest poverty rate, with 19 households (11.8%) falling below the poverty line. Among the single-parent households, those with 3 or 4 children have the highest poverty rate, with 48 household (65.7%) living below poverty.
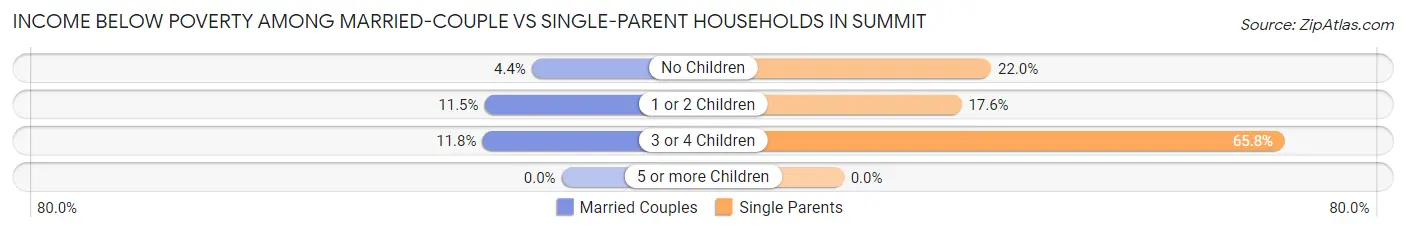
| Children | Married-Couple Families | Single-Parent Households |
| No Children | 38 (4.4%) | 92 (22.0%) |
| 1 or 2 Children | 77 (11.5%) | 66 (17.5%) |
| 3 or 4 Children | 19 (11.8%) | 48 (65.7%) |
| 5 or more Children | 0 (0.0%) | 0 (0.0%) |
| Total | 134 (7.9%) | 206 (23.7%) |
Race in Summit
The most populous races in Summit are Hispanic or Latino (8,156 | 73.9%), White / Caucasian (4,320 | 39.1%), and Some other Race (3,354 | 30.4%).
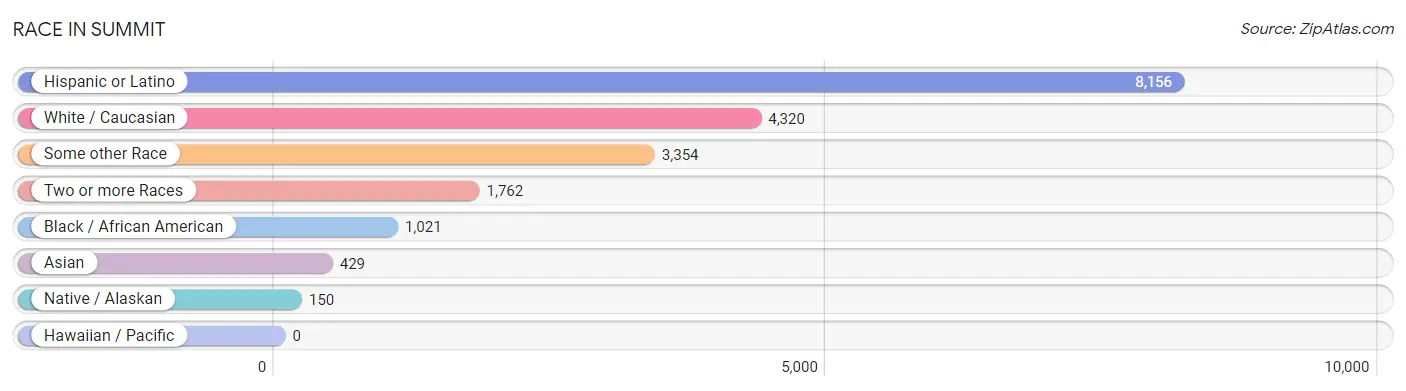
| Race | # Population | % Population |
| Asian | 429 | 3.9% |
| Black / African American | 1,021 | 9.2% |
| Hawaiian / Pacific | 0 | 0.0% |
| Hispanic or Latino | 8,156 | 73.9% |
| Native / Alaskan | 150 | 1.4% |
| White / Caucasian | 4,320 | 39.1% |
| Two or more Races | 1,762 | 16.0% |
| Some other Race | 3,354 | 30.4% |
| Total | 11,036 | 100.0% |
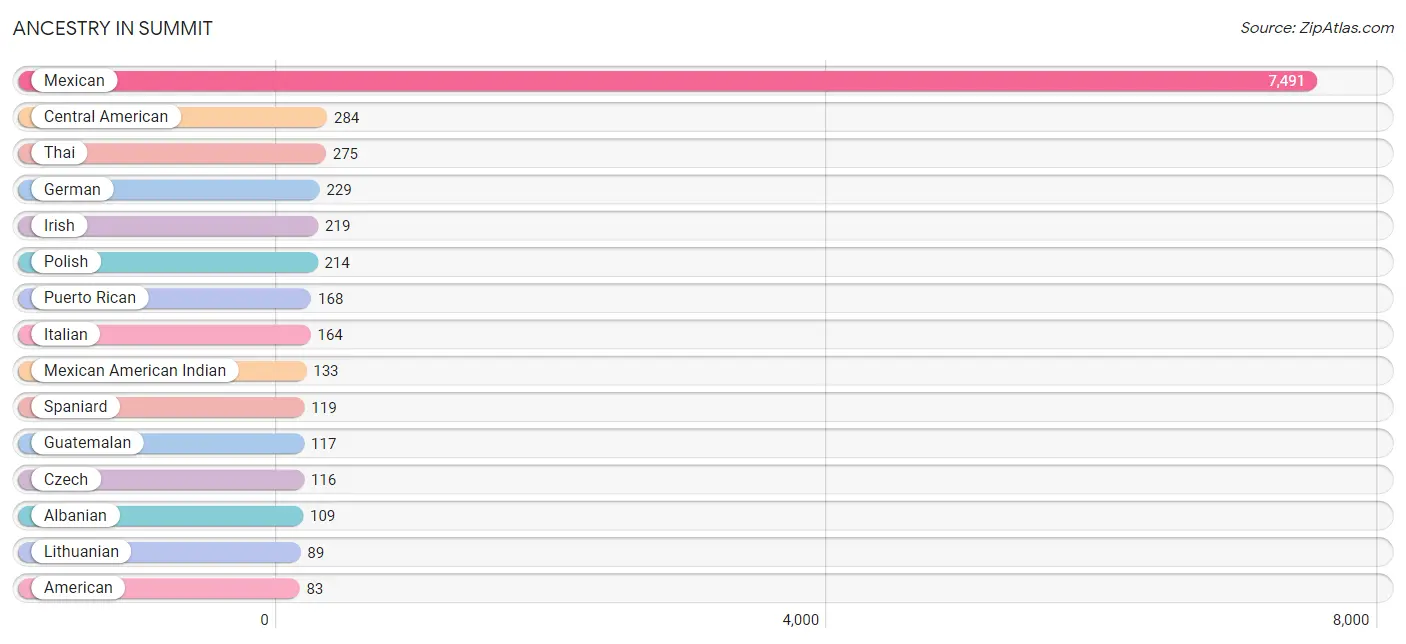
Ancestry in Summit
The most populous ancestries reported in Summit are Mexican (7,491 | 67.9%), Central American (284 | 2.6%), Thai (275 | 2.5%), German (229 | 2.1%), and Irish (219 | 2.0%), together accounting for 77.0% of all Summit residents.
| Ancestry | # Population | % Population |
| African | 11 | 0.1% |
| Albanian | 109 | 1.0% |
| American | 83 | 0.7% |
| Arab | 67 | 0.6% |
| Austrian | 43 | 0.4% |
| Burmese | 67 | 0.6% |
| Central American | 284 | 2.6% |
| Cherokee | 12 | 0.1% |
| Chickasaw | 33 | 0.3% |
| Colombian | 22 | 0.2% |
| Croatian | 8 | 0.1% |
| Czech | 116 | 1.1% |
| Dutch | 21 | 0.2% |
| English | 25 | 0.2% |
| European | 1 | 0.0% |
| French | 73 | 0.7% |
| German | 229 | 2.1% |
| Greek | 13 | 0.1% |
| Guatemalan | 117 | 1.1% |
| Indian (Asian) | 39 | 0.4% |
| Iranian | 16 | 0.1% |
| Irish | 219 | 2.0% |
| Italian | 164 | 1.5% |
| Jordanian | 67 | 0.6% |
| Korean | 53 | 0.5% |
| Lithuanian | 89 | 0.8% |
| Mexican | 7,491 | 67.9% |
| Mexican American Indian | 133 | 1.2% |
| Nicaraguan | 15 | 0.1% |
| Polish | 214 | 1.9% |
| Puerto Rican | 168 | 1.5% |
| Russian | 42 | 0.4% |
| Salvadoran | 75 | 0.7% |
| Scotch-Irish | 1 | 0.0% |
| Scottish | 35 | 0.3% |
| Slovak | 16 | 0.1% |
| Slovene | 11 | 0.1% |
| South American | 22 | 0.2% |
| Spaniard | 119 | 1.1% |
| Sri Lankan | 2 | 0.0% |
| Subsaharan African | 11 | 0.1% |
| Thai | 275 | 2.5% |
| Ukrainian | 11 | 0.1% | View All 43 Rows |
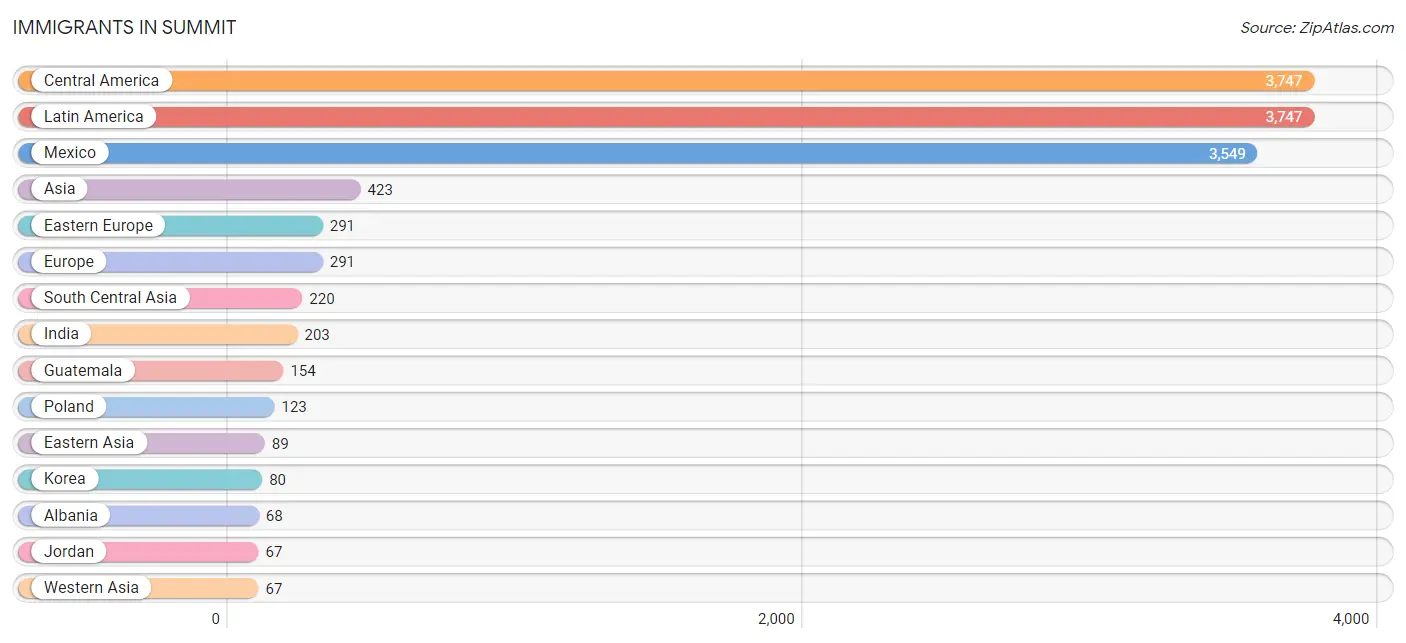
Immigrants in Summit
The most numerous immigrant groups reported in Summit came from Central America (3,747 | 34.0%), Latin America (3,747 | 34.0%), Mexico (3,549 | 32.2%), Asia (423 | 3.8%), and Eastern Europe (291 | 2.6%), together accounting for 106.5% of all Summit residents.
| Immigration Origin | # Population | % Population |
| Albania | 68 | 0.6% |
| Asia | 423 | 3.8% |
| Central America | 3,747 | 34.0% |
| China | 9 | 0.1% |
| Czechoslovakia | 23 | 0.2% |
| Eastern Asia | 89 | 0.8% |
| Eastern Europe | 291 | 2.6% |
| El Salvador | 29 | 0.3% |
| Europe | 291 | 2.6% |
| Guatemala | 154 | 1.4% |
| India | 203 | 1.8% |
| Iran | 16 | 0.1% |
| Jordan | 67 | 0.6% |
| Korea | 80 | 0.7% |
| Latin America | 3,747 | 34.0% |
| Lithuania | 19 | 0.2% |
| Mexico | 3,549 | 32.2% |
| Nicaragua | 15 | 0.1% |
| Pakistan | 1 | 0.0% |
| Philippines | 45 | 0.4% |
| Poland | 123 | 1.1% |
| Russia | 32 | 0.3% |
| South Central Asia | 220 | 2.0% |
| South Eastern Asia | 47 | 0.4% |
| Ukraine | 1 | 0.0% |
| Vietnam | 2 | 0.0% |
| Western Asia | 67 | 0.6% | View All 27 Rows |
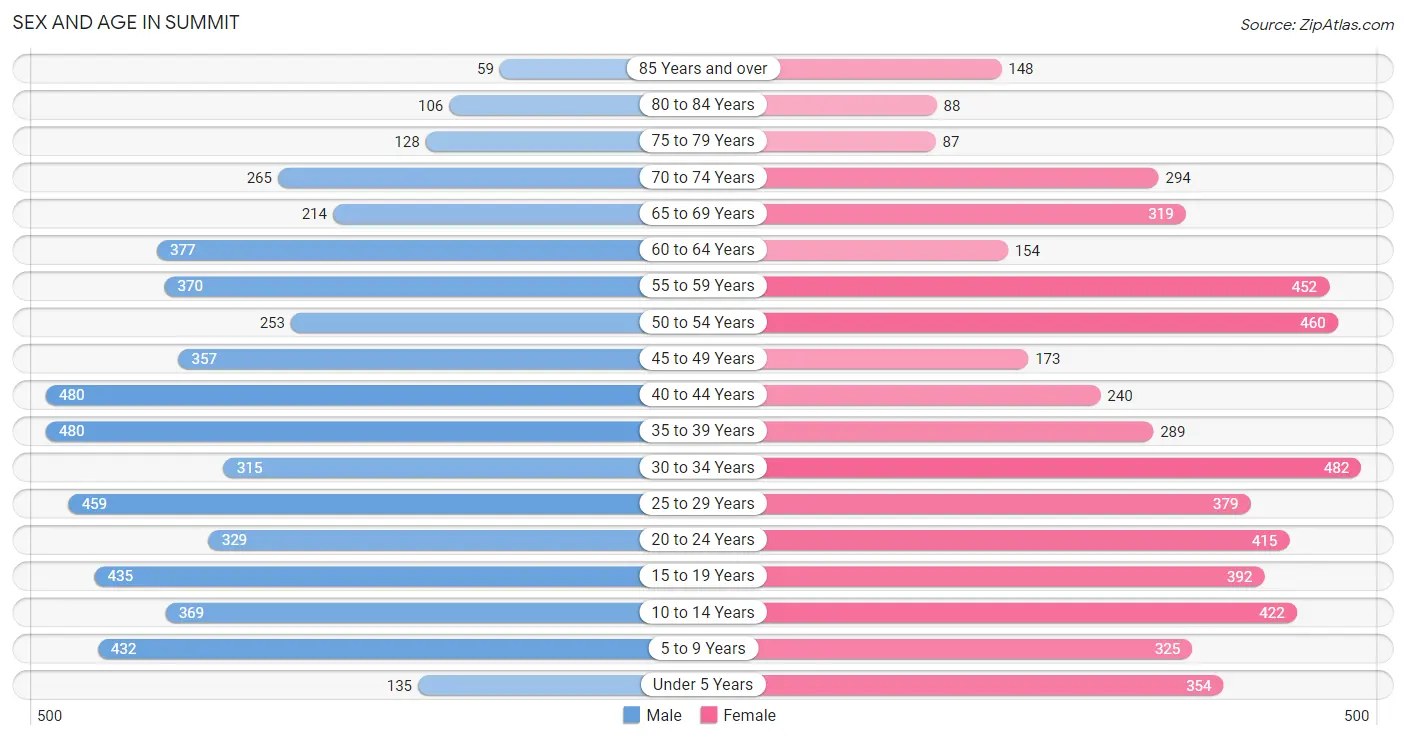
Sex and Age in Summit
Sex and Age in Summit
The most populous age groups in Summit are 35 to 39 Years (480 | 8.6%) for men and 30 to 34 Years (482 | 8.8%) for women.
| Age Bracket | Male | Female |
| Under 5 Years | 135 (2.4%) | 354 (6.5%) |
| 5 to 9 Years | 432 (7.8%) | 325 (5.9%) |
| 10 to 14 Years | 369 (6.6%) | 422 (7.7%) |
| 15 to 19 Years | 435 (7.8%) | 392 (7.2%) |
| 20 to 24 Years | 329 (5.9%) | 415 (7.6%) |
| 25 to 29 Years | 459 (8.3%) | 379 (6.9%) |
| 30 to 34 Years | 315 (5.7%) | 482 (8.8%) |
| 35 to 39 Years | 480 (8.6%) | 289 (5.3%) |
| 40 to 44 Years | 480 (8.6%) | 240 (4.4%) |
| 45 to 49 Years | 357 (6.4%) | 173 (3.2%) |
| 50 to 54 Years | 253 (4.5%) | 460 (8.4%) |
| 55 to 59 Years | 370 (6.7%) | 452 (8.3%) |
| 60 to 64 Years | 377 (6.8%) | 154 (2.8%) |
| 65 to 69 Years | 214 (3.8%) | 319 (5.8%) |
| 70 to 74 Years | 265 (4.8%) | 294 (5.4%) |
| 75 to 79 Years | 128 (2.3%) | 87 (1.6%) |
| 80 to 84 Years | 106 (1.9%) | 88 (1.6%) |
| 85 Years and over | 59 (1.1%) | 148 (2.7%) |
| Total | 5,563 (100.0%) | 5,473 (100.0%) |
Families and Households in Summit
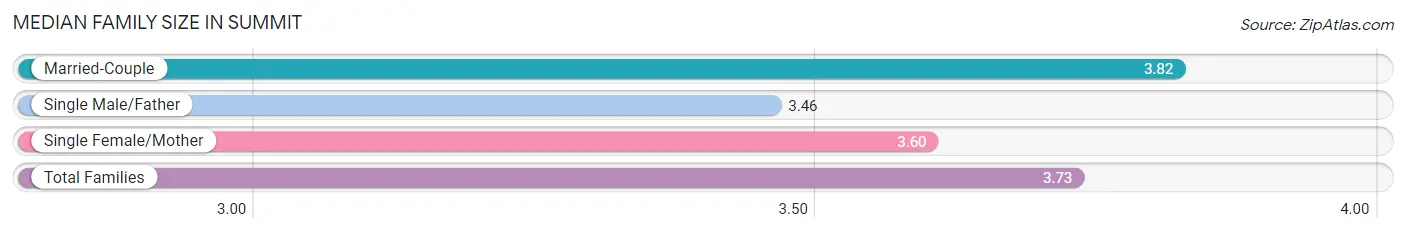
Median Family Size in Summit
The median family size in Summit is 3.73 persons per family, with married-couple families (1,702 | 66.2%) accounting for the largest median family size of 3.82 persons per family. On the other hand, single male/father families (309 | 12.0%) represent the smallest median family size with 3.46 persons per family.
| Family Type | # Families | Family Size |
| Married-Couple | 1,702 (66.2%) | 3.82 |
| Single Male/Father | 309 (12.0%) | 3.46 |
| Single Female/Mother | 559 (21.7%) | 3.60 |
| Total Families | 2,570 (100.0%) | 3.73 |
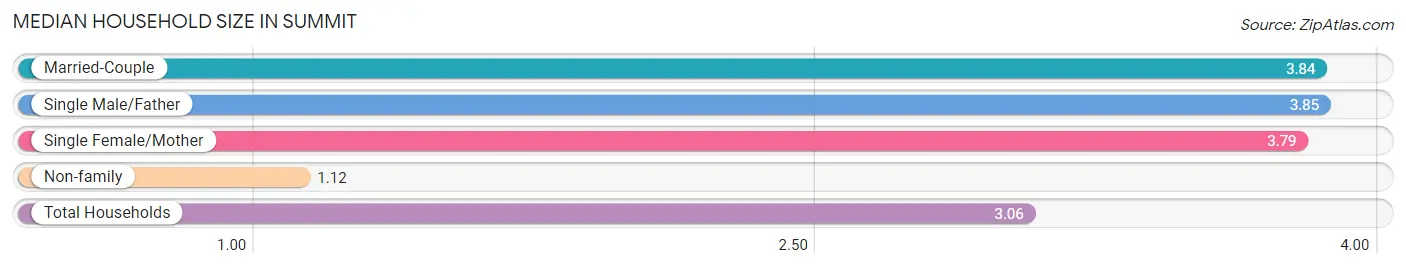
Median Household Size in Summit
The median household size in Summit is 3.06 persons per household, with single male/father households (309 | 8.6%) accounting for the largest median household size of 3.85 persons per household. non-family households (1,030 | 28.6%) represent the smallest median household size with 1.12 persons per household.
| Household Type | # Households | Household Size |
| Married-Couple | 1,702 (47.3%) | 3.84 |
| Single Male/Father | 309 (8.6%) | 3.85 |
| Single Female/Mother | 559 (15.5%) | 3.79 |
| Non-family | 1,030 (28.6%) | 1.12 |
| Total Households | 3,600 (100.0%) | 3.06 |
Household Size by Marriage Status in Summit
Out of a total of 3,600 households in Summit, 2,570 (71.4%) are family households, while 1,030 (28.6%) are nonfamily households. The most numerous type of family households are 3-person households, comprising 861, and the most common type of nonfamily households are 1-person households, comprising 981.
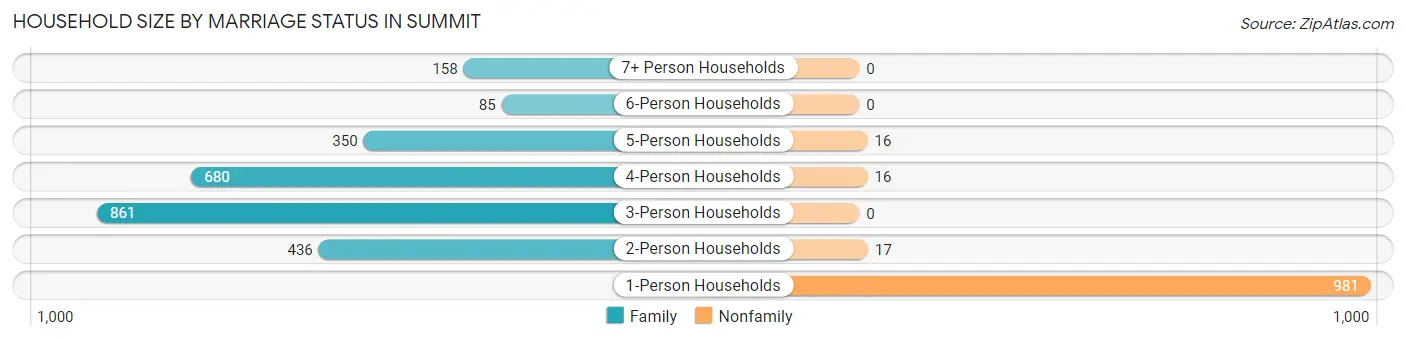
| Household Size | Family Households | Nonfamily Households |
| 1-Person Households | - | 981 (27.3%) |
| 2-Person Households | 436 (12.1%) | 17 (0.5%) |
| 3-Person Households | 861 (23.9%) | 0 (0.0%) |
| 4-Person Households | 680 (18.9%) | 16 (0.4%) |
| 5-Person Households | 350 (9.7%) | 16 (0.4%) |
| 6-Person Households | 85 (2.4%) | 0 (0.0%) |
| 7+ Person Households | 158 (4.4%) | 0 (0.0%) |
| Total | 2,570 (71.4%) | 1,030 (28.6%) |
Female Fertility in Summit
Fertility by Age in Summit
Average fertility rate in Summit is 29.0 births per 1,000 women. Women in the age bracket of 20 to 34 years have the highest fertility rate with 49.0 births per 1,000 women. Women in the age bracket of 20 to 34 years acount for 86.1% of all women with births.
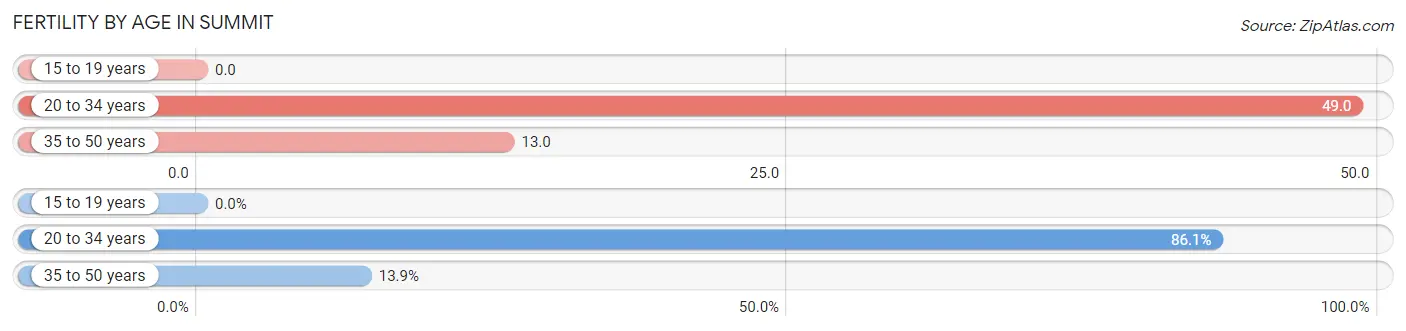
| Age Bracket | Women with Births | Births / 1,000 Women |
| 15 to 19 years | 0 (0.0%) | 0.0 |
| 20 to 34 years | 62 (86.1%) | 49.0 |
| 35 to 50 years | 10 (13.9%) | 13.0 |
| Total | 72 (100.0%) | 29.0 |
Fertility by Age by Marriage Status in Summit
86.1% of women with births (72) in Summit are married. The highest percentage of unmarried women with births falls into 35 to 50 years age bracket with 100.0% of them unmarried at the time of birth, while the lowest percentage of unmarried women with births belong to 20 to 34 years age bracket with 0.0% of them unmarried.
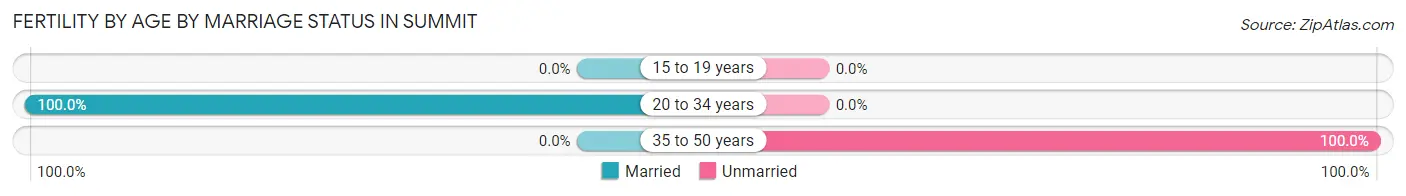
| Age Bracket | Married | Unmarried |
| 15 to 19 years | 0 (0.0%) | 0 (0.0%) |
| 20 to 34 years | 62 (100.0%) | 0 (0.0%) |
| 35 to 50 years | 0 (0.0%) | 10 (100.0%) |
| Total | 62 (86.1%) | 10 (13.9%) |
Fertility by Education in Summit
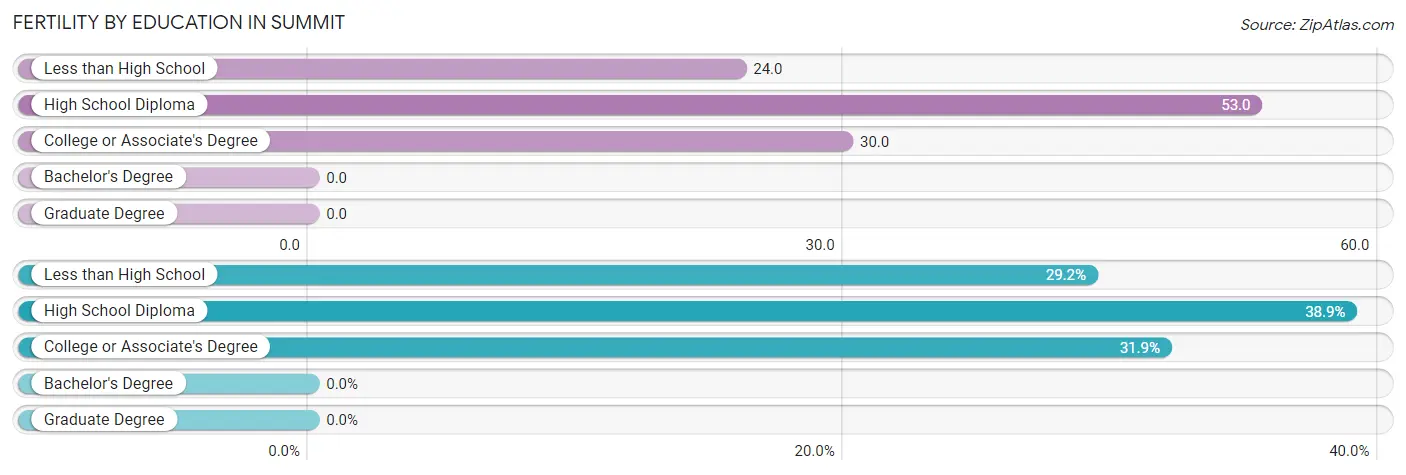
| Educational Attainment | Women with Births | Births / 1,000 Women |
| Less than High School | 21 (29.2%) | 24.0 |
| High School Diploma | 28 (38.9%) | 53.0 |
| College or Associate's Degree | 23 (31.9%) | 30.0 |
| Bachelor's Degree | 0 (0.0%) | 0.0 |
| Graduate Degree | 0 (0.0%) | 0.0 |
| Total | 72 (100.0%) | 29.0 |
Fertility by Education by Marriage Status in Summit
13.9% of women with births in Summit are unmarried. Women with the educational attainment of less than high school are most likely to be married with 100.0% of them married at childbirth, while women with the educational attainment of high school diploma are least likely to be married with 35.7% of them unmarried at childbirth.
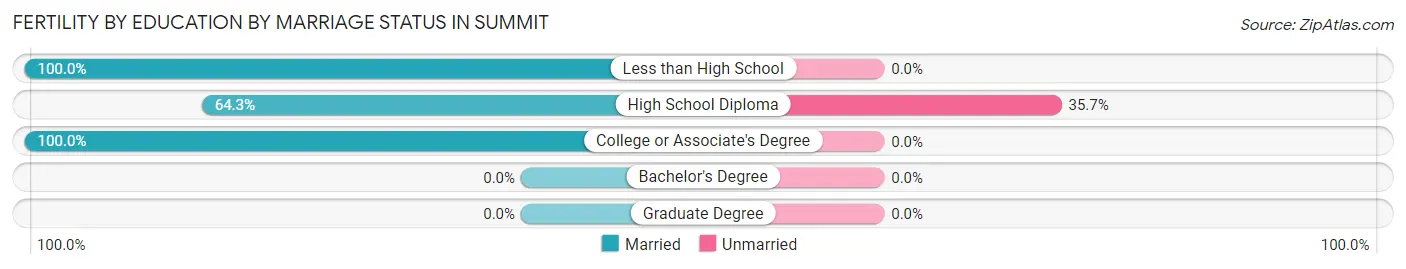
| Educational Attainment | Married | Unmarried |
| Less than High School | 21 (100.0%) | 0 (0.0%) |
| High School Diploma | 18 (64.3%) | 10 (35.7%) |
| College or Associate's Degree | 23 (100.0%) | 0 (0.0%) |
| Bachelor's Degree | 0 (0.0%) | 0 (0.0%) |
| Graduate Degree | 0 (0.0%) | 0 (0.0%) |
| Total | 62 (86.1%) | 10 (13.9%) |
Employment Characteristics in Summit
Employment by Class of Employer in Summit
Among the 4,687 employed individuals in Summit, private company employees (3,443 | 73.5%), not-for-profit organizations (448 | 9.6%), and self-employed (not incorporated) (394 | 8.4%) make up the most common classes of employment.
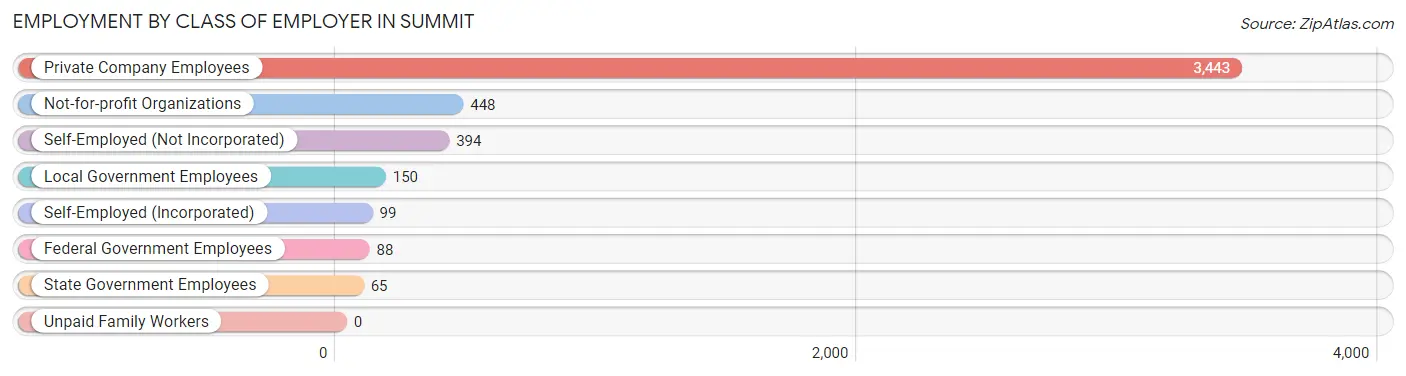
| Employer Class | # Employees | % Employees |
| Private Company Employees | 3,443 | 73.5% |
| Self-Employed (Incorporated) | 99 | 2.1% |
| Self-Employed (Not Incorporated) | 394 | 8.4% |
| Not-for-profit Organizations | 448 | 9.6% |
| Local Government Employees | 150 | 3.2% |
| State Government Employees | 65 | 1.4% |
| Federal Government Employees | 88 | 1.9% |
| Unpaid Family Workers | 0 | 0.0% |
| Total | 4,687 | 100.0% |
Employment Status by Age in Summit
According to the labor force statistics for Summit, out of the total population over 16 years of age (8,850), 58.6% or 5,186 individuals are in the labor force, with 7.1% or 368 of them unemployed. The age group with the highest labor force participation rate is 25 to 29 years, with 81.6% or 684 individuals in the labor force. Within the labor force, the 16 to 19 years age range has the highest percentage of unemployed individuals, with 27.1% or 57 of them being unemployed.
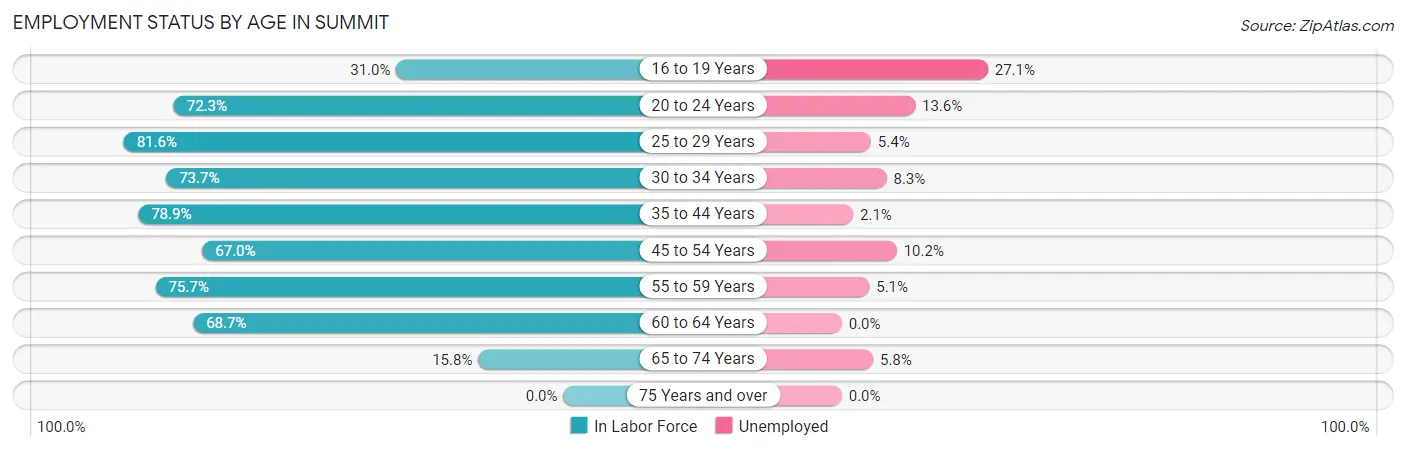
| Age Bracket | In Labor Force | Unemployed |
| 16 to 19 Years | 210 (31.0%) | 57 (27.1%) |
| 20 to 24 Years | 538 (72.3%) | 73 (13.6%) |
| 25 to 29 Years | 684 (81.6%) | 37 (5.4%) |
| 30 to 34 Years | 587 (73.7%) | 49 (8.3%) |
| 35 to 44 Years | 1,175 (78.9%) | 25 (2.1%) |
| 45 to 54 Years | 833 (67.0%) | 85 (10.2%) |
| 55 to 59 Years | 622 (75.7%) | 32 (5.1%) |
| 60 to 64 Years | 365 (68.7%) | 0 (0.0%) |
| 65 to 74 Years | 173 (15.8%) | 10 (5.8%) |
| 75 Years and over | 0 (0.0%) | 0 (0.0%) |
| Total | 5,186 (58.6%) | 368 (7.1%) |
Employment Status by Educational Attainment in Summit
According to labor force statistics for Summit, 74.6% of individuals (4,267) out of the total population between 25 and 64 years of age (5,720) are in the labor force, with 5.3% or 226 of them being unemployed. The group with the highest labor force participation rate are those with the educational attainment of college / associate degree, with 86.3% or 1,257 individuals in the labor force. Within the labor force, individuals with less than high school education have the highest percentage of unemployment, with 8.5% or 91 of them being unemployed.
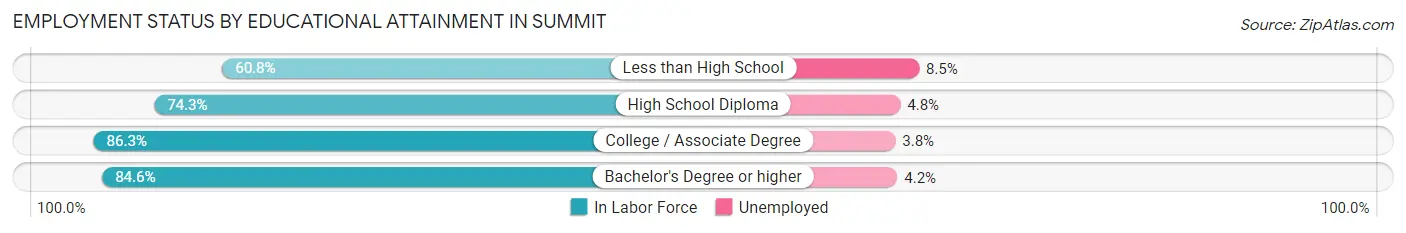
| Educational Attainment | In Labor Force | Unemployed |
| Less than High School | 1,068 (60.8%) | 149 (8.5%) |
| High School Diploma | 1,297 (74.3%) | 84 (4.8%) |
| College / Associate Degree | 1,257 (86.3%) | 55 (3.8%) |
| Bachelor's Degree or higher | 645 (84.6%) | 32 (4.2%) |
| Total | 4,267 (74.6%) | 303 (5.3%) |
Employment Occupations by Sex in Summit
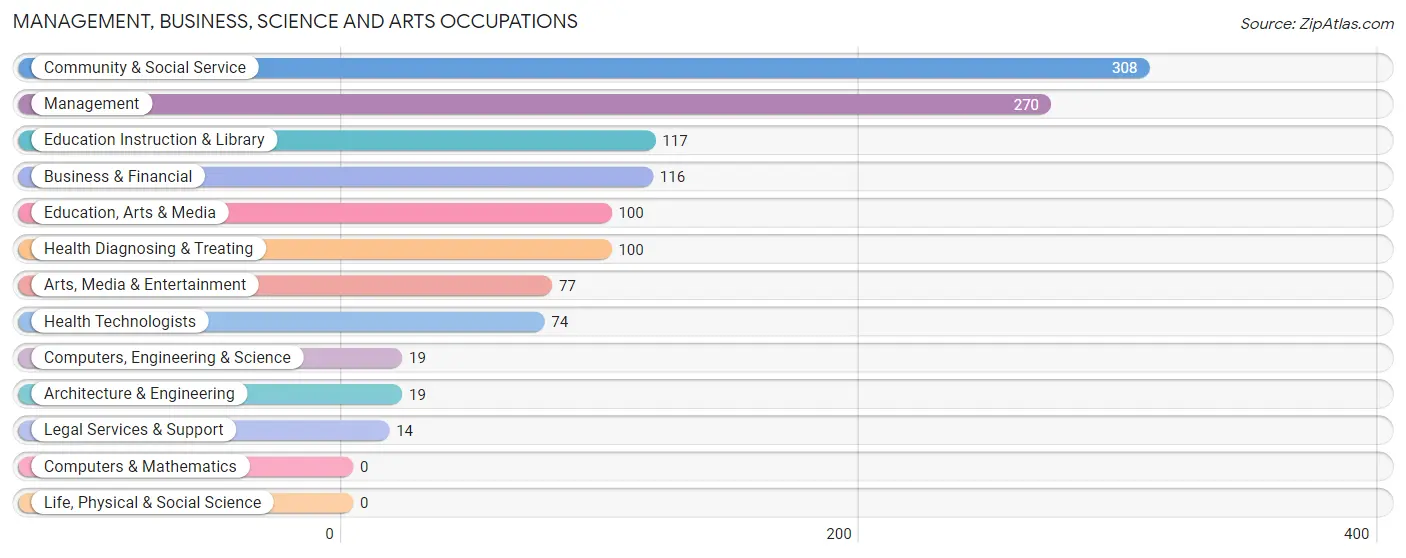
Management, Business, Science and Arts Occupations
The most common Management, Business, Science and Arts occupations in Summit are Community & Social Service (308 | 6.4%), Management (270 | 5.6%), Education Instruction & Library (117 | 2.4%), Business & Financial (116 | 2.4%), and Education, Arts & Media (100 | 2.1%).
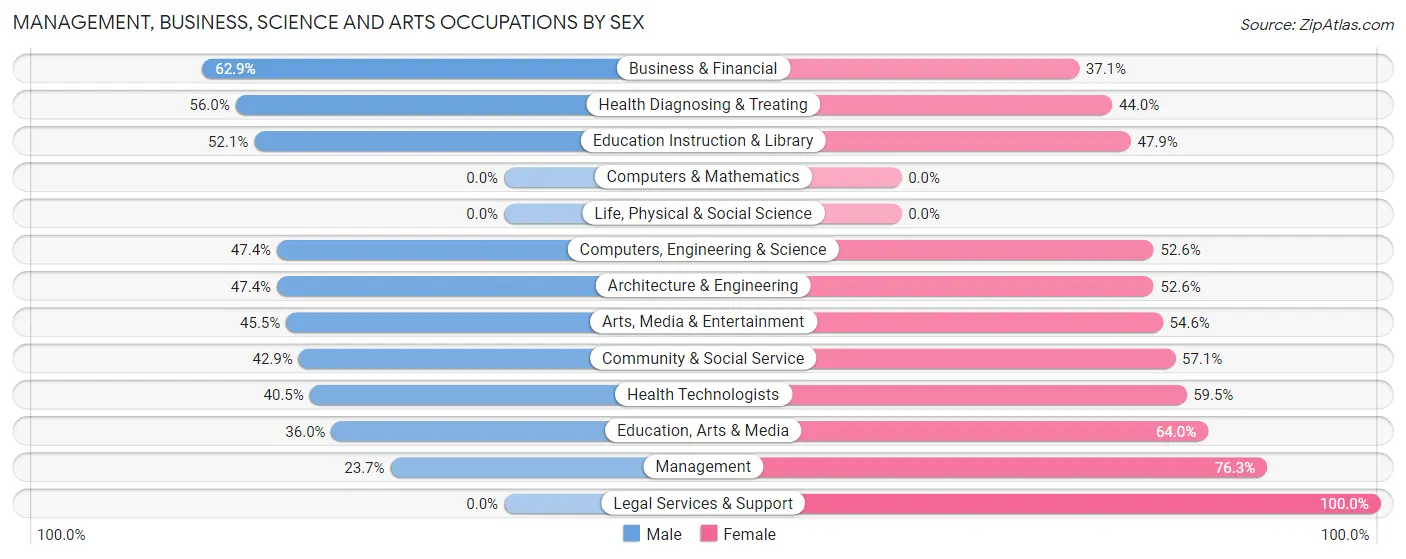
Management, Business, Science and Arts Occupations by Sex
Within the Management, Business, Science and Arts occupations in Summit, the most male-oriented occupations are Business & Financial (62.9%), Health Diagnosing & Treating (56.0%), and Education Instruction & Library (52.1%), while the most female-oriented occupations are Legal Services & Support (100.0%), Management (76.3%), and Education, Arts & Media (64.0%).
| Occupation | Male | Female |
| Management | 64 (23.7%) | 206 (76.3%) |
| Business & Financial | 73 (62.9%) | 43 (37.1%) |
| Computers, Engineering & Science | 9 (47.4%) | 10 (52.6%) |
| Computers & Mathematics | 0 (0.0%) | 0 (0.0%) |
| Architecture & Engineering | 9 (47.4%) | 10 (52.6%) |
| Life, Physical & Social Science | 0 (0.0%) | 0 (0.0%) |
| Community & Social Service | 132 (42.9%) | 176 (57.1%) |
| Education, Arts & Media | 36 (36.0%) | 64 (64.0%) |
| Legal Services & Support | 0 (0.0%) | 14 (100.0%) |
| Education Instruction & Library | 61 (52.1%) | 56 (47.9%) |
| Arts, Media & Entertainment | 35 (45.5%) | 42 (54.5%) |
| Health Diagnosing & Treating | 56 (56.0%) | 44 (44.0%) |
| Health Technologists | 30 (40.5%) | 44 (59.5%) |
| Total (Category) | 334 (41.1%) | 479 (58.9%) |
| Total (Overall) | 2,820 (58.5%) | 1,998 (41.5%) |
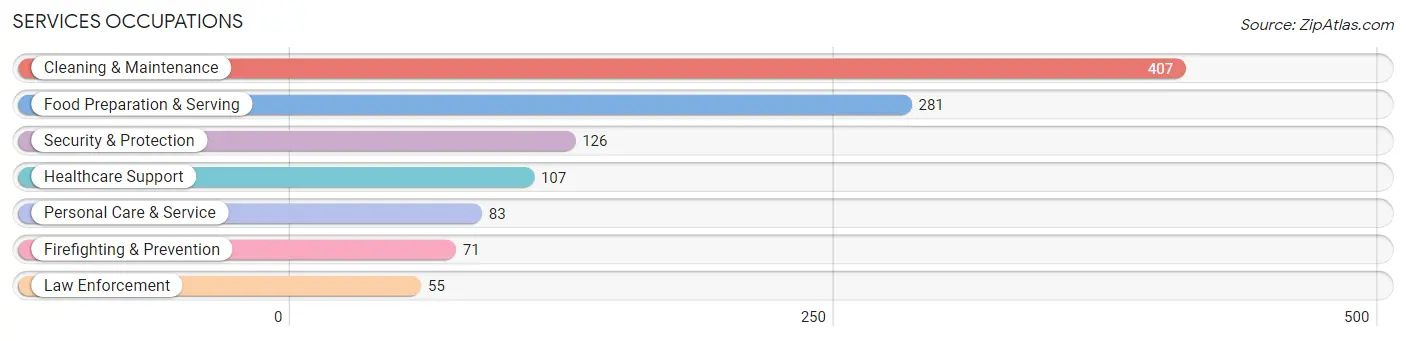
Services Occupations
The most common Services occupations in Summit are Cleaning & Maintenance (407 | 8.5%), Food Preparation & Serving (281 | 5.8%), Security & Protection (126 | 2.6%), Healthcare Support (107 | 2.2%), and Personal Care & Service (83 | 1.7%).
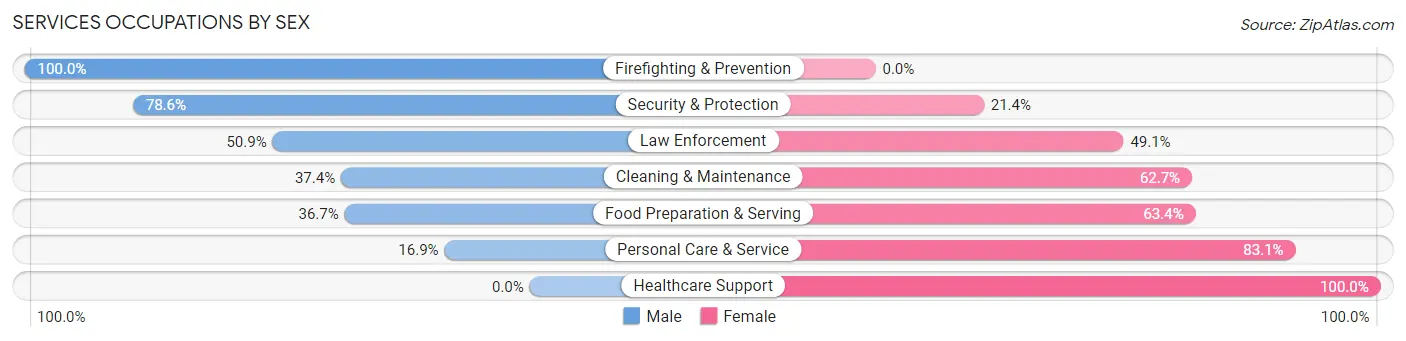
Services Occupations by Sex
Within the Services occupations in Summit, the most male-oriented occupations are Firefighting & Prevention (100.0%), Security & Protection (78.6%), and Law Enforcement (50.9%), while the most female-oriented occupations are Healthcare Support (100.0%), Personal Care & Service (83.1%), and Food Preparation & Serving (63.3%).
| Occupation | Male | Female |
| Healthcare Support | 0 (0.0%) | 107 (100.0%) |
| Security & Protection | 99 (78.6%) | 27 (21.4%) |
| Firefighting & Prevention | 71 (100.0%) | 0 (0.0%) |
| Law Enforcement | 28 (50.9%) | 27 (49.1%) |
| Food Preparation & Serving | 103 (36.6%) | 178 (63.3%) |
| Cleaning & Maintenance | 152 (37.3%) | 255 (62.6%) |
| Personal Care & Service | 14 (16.9%) | 69 (83.1%) |
| Total (Category) | 368 (36.6%) | 636 (63.3%) |
| Total (Overall) | 2,820 (58.5%) | 1,998 (41.5%) |
Sales and Office Occupations
The most common Sales and Office occupations in Summit are Office & Administration (463 | 9.6%), and Sales & Related (270 | 5.6%).
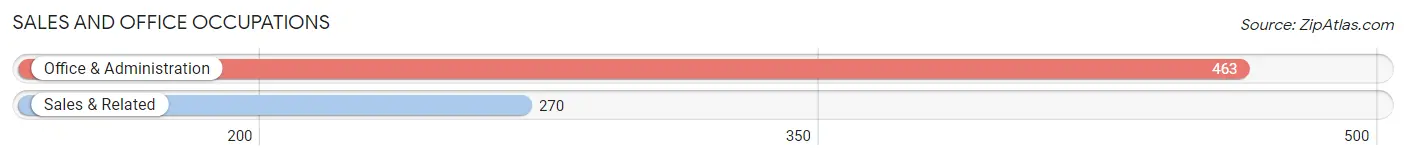
Sales and Office Occupations by Sex
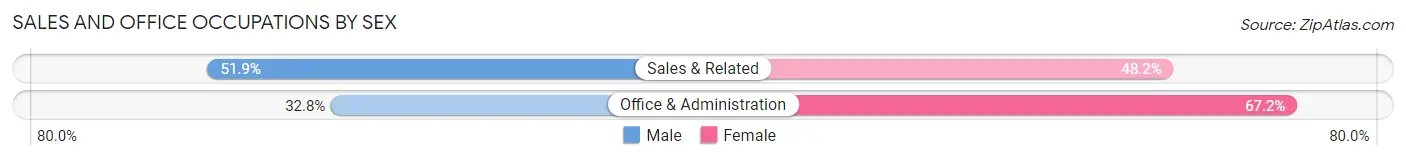
| Occupation | Male | Female |
| Sales & Related | 140 (51.8%) | 130 (48.1%) |
| Office & Administration | 152 (32.8%) | 311 (67.2%) |
| Total (Category) | 292 (39.8%) | 441 (60.2%) |
| Total (Overall) | 2,820 (58.5%) | 1,998 (41.5%) |
Natural Resources, Construction and Maintenance Occupations
The most common Natural Resources, Construction and Maintenance occupations in Summit are Construction & Extraction (375 | 7.8%), Installation, Maintenance & Repair (86 | 1.8%), and Farming, Fishing & Forestry (33 | 0.7%).
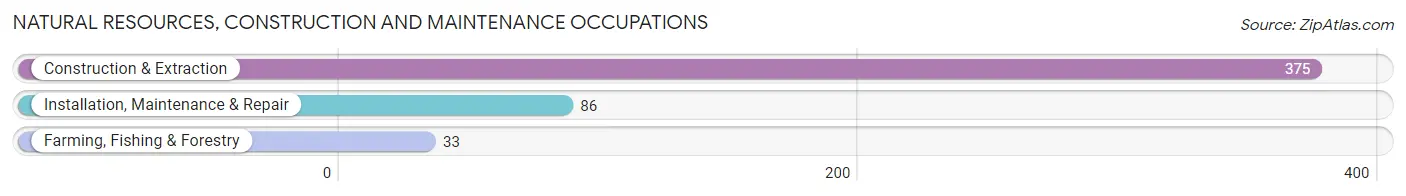
Natural Resources, Construction and Maintenance Occupations by Sex
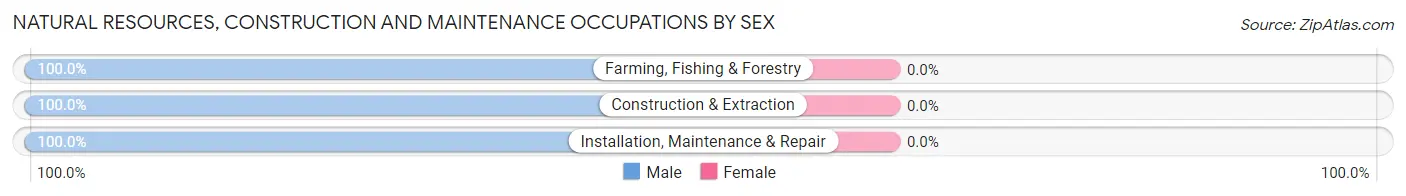
| Occupation | Male | Female |
| Farming, Fishing & Forestry | 33 (100.0%) | 0 (0.0%) |
| Construction & Extraction | 375 (100.0%) | 0 (0.0%) |
| Installation, Maintenance & Repair | 86 (100.0%) | 0 (0.0%) |
| Total (Category) | 494 (100.0%) | 0 (0.0%) |
| Total (Overall) | 2,820 (58.5%) | 1,998 (41.5%) |
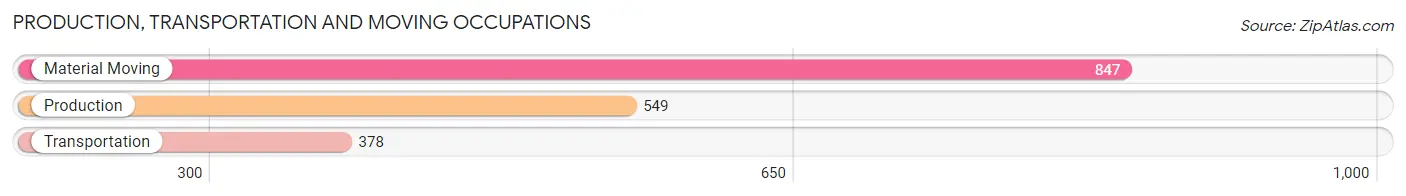
Production, Transportation and Moving Occupations
The most common Production, Transportation and Moving occupations in Summit are Material Moving (847 | 17.6%), Production (549 | 11.4%), and Transportation (378 | 7.9%).
Production, Transportation and Moving Occupations by Sex
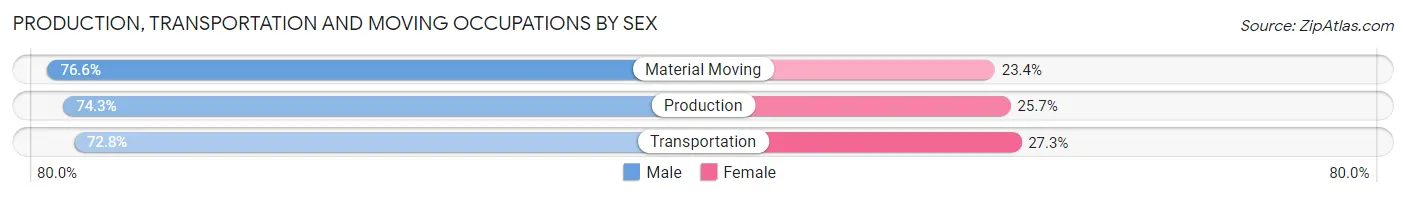
| Occupation | Male | Female |
| Production | 408 (74.3%) | 141 (25.7%) |
| Transportation | 275 (72.8%) | 103 (27.3%) |
| Material Moving | 649 (76.6%) | 198 (23.4%) |
| Total (Category) | 1,332 (75.1%) | 442 (24.9%) |
| Total (Overall) | 2,820 (58.5%) | 1,998 (41.5%) |
Employment Industries by Sex in Summit
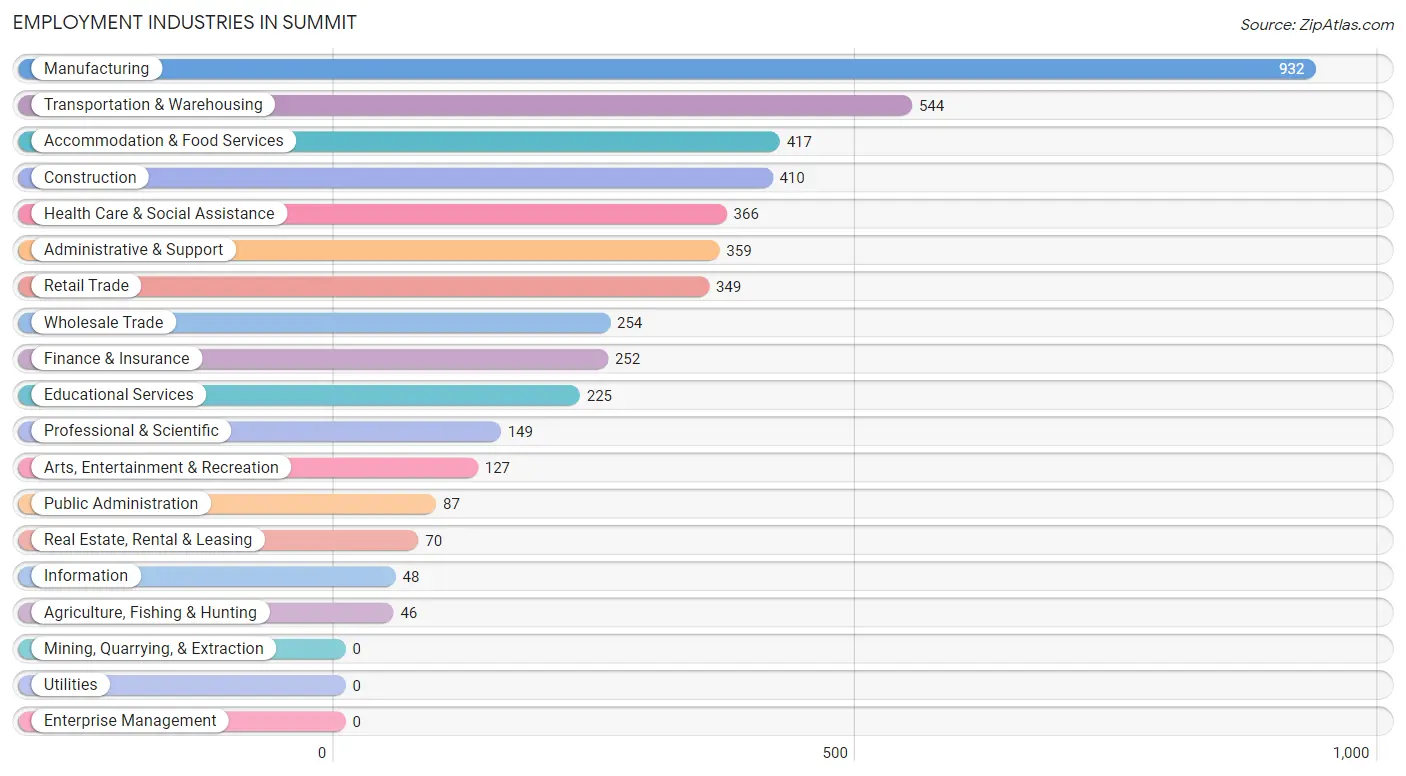
Employment Industries in Summit
The major employment industries in Summit include Manufacturing (932 | 19.3%), Transportation & Warehousing (544 | 11.3%), Accommodation & Food Services (417 | 8.7%), Construction (410 | 8.5%), and Health Care & Social Assistance (366 | 7.6%).
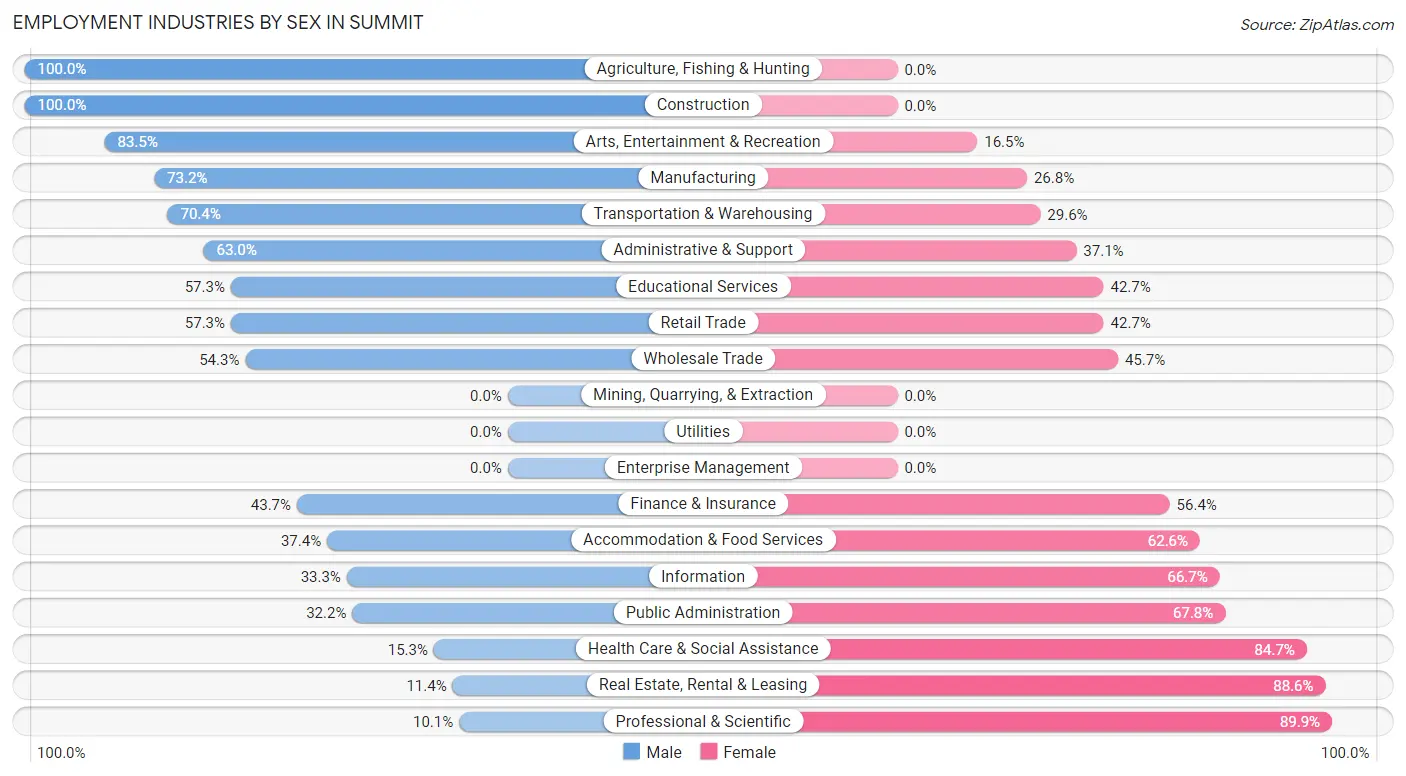
Employment Industries by Sex in Summit
The Summit industries that see more men than women are Agriculture, Fishing & Hunting (100.0%), Construction (100.0%), and Arts, Entertainment & Recreation (83.5%), whereas the industries that tend to have a higher number of women are Professional & Scientific (89.9%), Real Estate, Rental & Leasing (88.6%), and Health Care & Social Assistance (84.7%).
| Industry | Male | Female |
| Agriculture, Fishing & Hunting | 46 (100.0%) | 0 (0.0%) |
| Mining, Quarrying, & Extraction | 0 (0.0%) | 0 (0.0%) |
| Construction | 410 (100.0%) | 0 (0.0%) |
| Manufacturing | 682 (73.2%) | 250 (26.8%) |
| Wholesale Trade | 138 (54.3%) | 116 (45.7%) |
| Retail Trade | 200 (57.3%) | 149 (42.7%) |
| Transportation & Warehousing | 383 (70.4%) | 161 (29.6%) |
| Utilities | 0 (0.0%) | 0 (0.0%) |
| Information | 16 (33.3%) | 32 (66.7%) |
| Finance & Insurance | 110 (43.6%) | 142 (56.4%) |
| Real Estate, Rental & Leasing | 8 (11.4%) | 62 (88.6%) |
| Professional & Scientific | 15 (10.1%) | 134 (89.9%) |
| Enterprise Management | 0 (0.0%) | 0 (0.0%) |
| Administrative & Support | 226 (62.9%) | 133 (37.0%) |
| Educational Services | 129 (57.3%) | 96 (42.7%) |
| Health Care & Social Assistance | 56 (15.3%) | 310 (84.7%) |
| Arts, Entertainment & Recreation | 106 (83.5%) | 21 (16.5%) |
| Accommodation & Food Services | 156 (37.4%) | 261 (62.6%) |
| Public Administration | 28 (32.2%) | 59 (67.8%) |
| Total | 2,820 (58.5%) | 1,998 (41.5%) |
Education in Summit
School Enrollment in Summit
The most common levels of schooling among the 2,902 students in Summit are high school (705 | 24.3%), elementary school (623 | 21.5%), and college / undergraduate (584 | 20.1%).
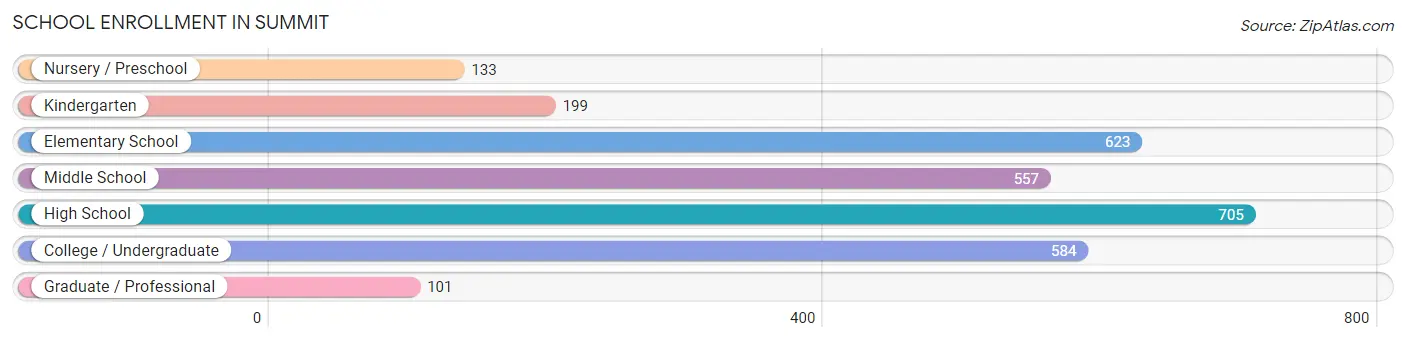
| School Level | # Students | % Students |
| Nursery / Preschool | 133 | 4.6% |
| Kindergarten | 199 | 6.9% |
| Elementary School | 623 | 21.5% |
| Middle School | 557 | 19.2% |
| High School | 705 | 24.3% |
| College / Undergraduate | 584 | 20.1% |
| Graduate / Professional | 101 | 3.5% |
| Total | 2,902 | 100.0% |
School Enrollment by Age by Funding Source in Summit
Out of a total of 2,902 students who are enrolled in schools in Summit, 302 (10.4%) attend a private institution, while the remaining 2,600 (89.6%) are enrolled in public schools. The age group of 35 years and over has the highest likelihood of being enrolled in private schools, with 30 (34.9% in the age bracket) enrolled. Conversely, the age group of 3 to 4 year olds has the lowest likelihood of being enrolled in a private school, with 100 (100.0% in the age bracket) attending a public institution.
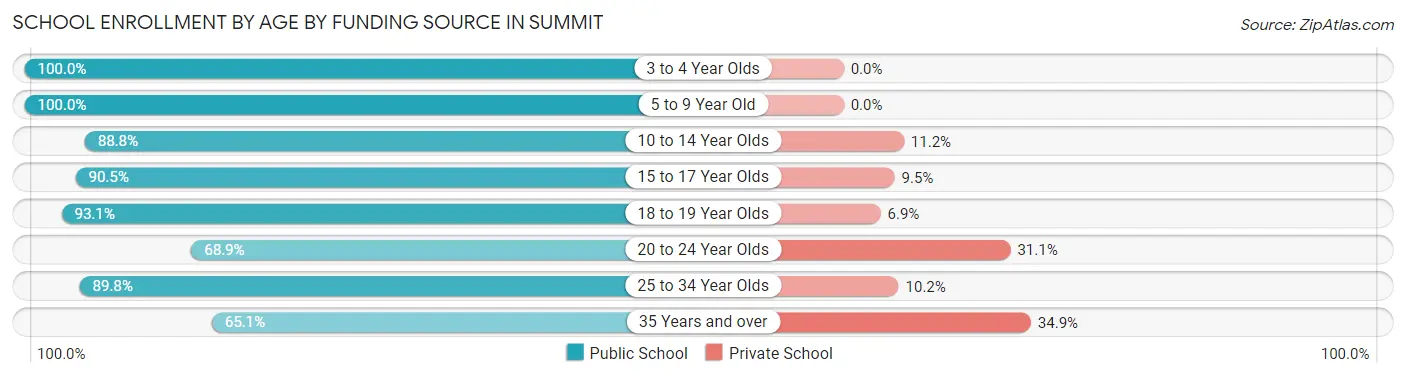
| Age Bracket | Public School | Private School |
| 3 to 4 Year Olds | 100 (100.0%) | 0 (0.0%) |
| 5 to 9 Year Old | 757 (100.0%) | 0 (0.0%) |
| 10 to 14 Year Olds | 617 (88.8%) | 78 (11.2%) |
| 15 to 17 Year Olds | 458 (90.5%) | 48 (9.5%) |
| 18 to 19 Year Olds | 176 (93.1%) | 13 (6.9%) |
| 20 to 24 Year Olds | 244 (68.9%) | 110 (31.1%) |
| 25 to 34 Year Olds | 193 (89.8%) | 22 (10.2%) |
| 35 Years and over | 56 (65.1%) | 30 (34.9%) |
| Total | 2,600 (89.6%) | 302 (10.4%) |
Educational Attainment by Field of Study in Summit
Science & technology (283 | 29.2%), business (137 | 14.1%), arts & humanities (129 | 13.3%), physical & health sciences (83 | 8.6%), and engineering (69 | 7.1%) are the most common fields of study among 968 individuals in Summit who have obtained a bachelor's degree or higher.
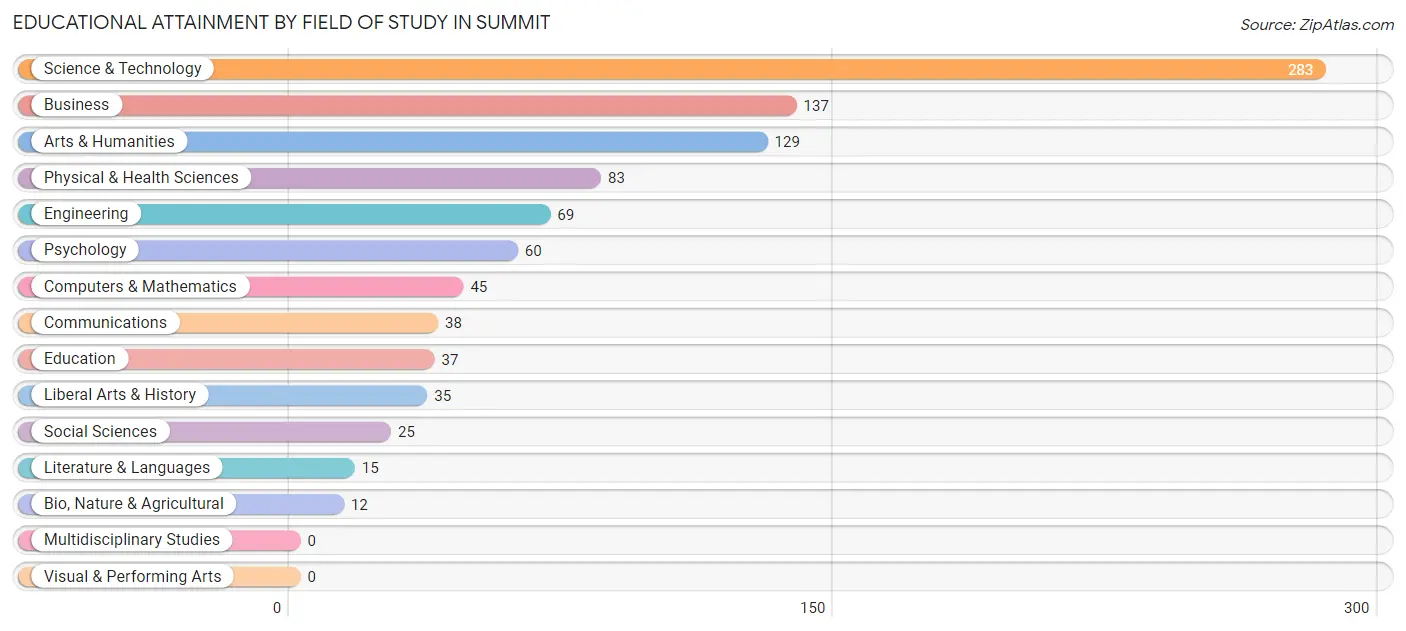
| Field of Study | # Graduates | % Graduates |
| Computers & Mathematics | 45 | 4.6% |
| Bio, Nature & Agricultural | 12 | 1.2% |
| Physical & Health Sciences | 83 | 8.6% |
| Psychology | 60 | 6.2% |
| Social Sciences | 25 | 2.6% |
| Engineering | 69 | 7.1% |
| Multidisciplinary Studies | 0 | 0.0% |
| Science & Technology | 283 | 29.2% |
| Business | 137 | 14.1% |
| Education | 37 | 3.8% |
| Literature & Languages | 15 | 1.5% |
| Liberal Arts & History | 35 | 3.6% |
| Visual & Performing Arts | 0 | 0.0% |
| Communications | 38 | 3.9% |
| Arts & Humanities | 129 | 13.3% |
| Total | 968 | 100.0% |
Transportation & Commute in Summit
Vehicle Availability by Sex in Summit
The most prevalent vehicle ownership categories in Summit are males with 3 vehicles (883, accounting for 31.9%) and females with 3 vehicles (595, making up 46.1%).
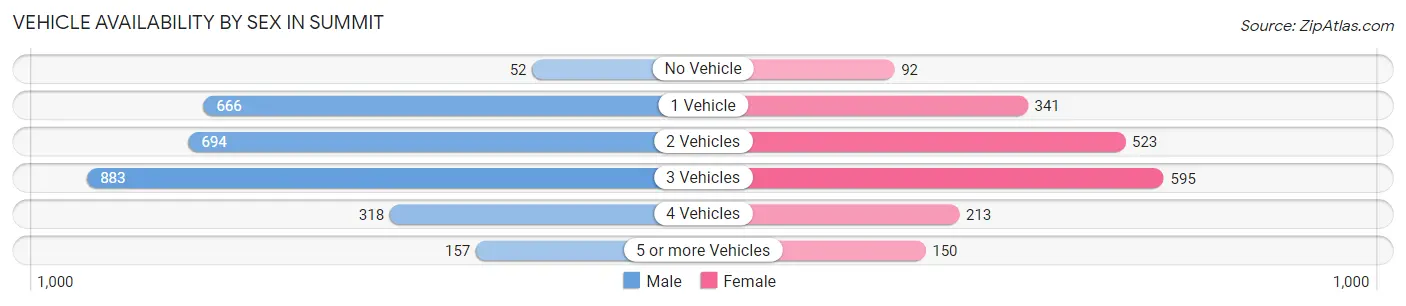
| Vehicles Available | Male | Female |
| No Vehicle | 52 (1.9%) | 92 (4.8%) |
| 1 Vehicle | 666 (24.0%) | 341 (17.8%) |
| 2 Vehicles | 694 (25.1%) | 523 (27.3%) |
| 3 Vehicles | 883 (31.9%) | 595 (31.1%) |
| 4 Vehicles | 318 (11.5%) | 213 (11.1%) |
| 5 or more Vehicles | 157 (5.7%) | 150 (7.8%) |
| Total | 2,770 (100.0%) | 1,914 (100.0%) |
Commute Time in Summit
The most frequently occuring commute durations in Summit are 30 to 34 minutes (728 commuters, 16.0%), 45 to 59 minutes (579 commuters, 12.7%), and 10 to 14 minutes (562 commuters, 12.3%).
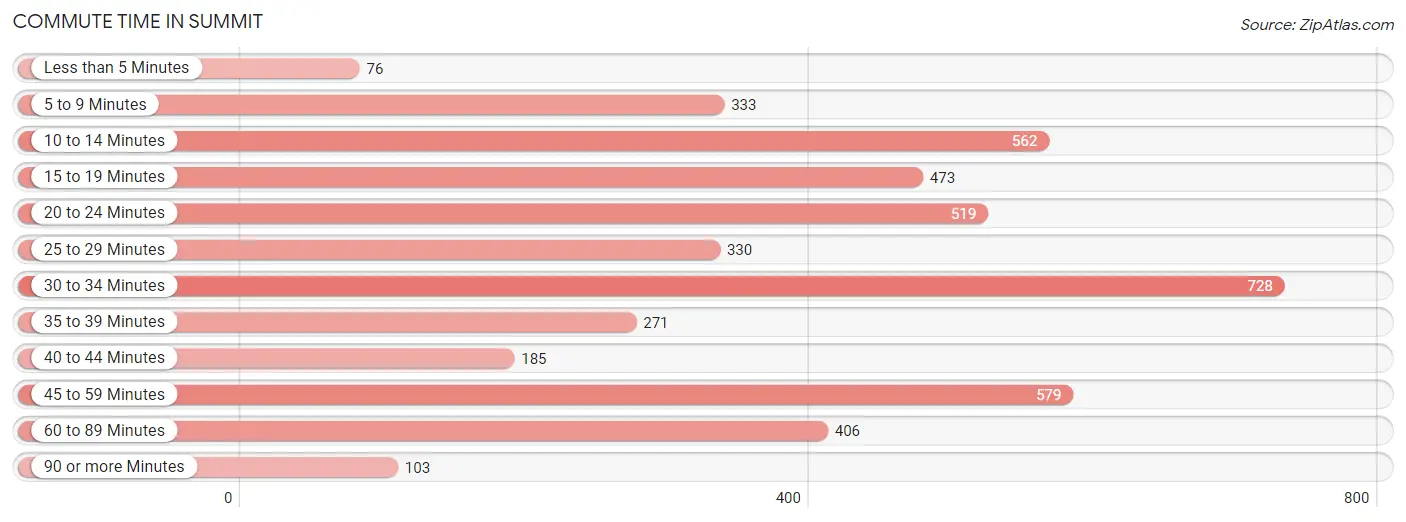
| Commute Time | # Commuters | % Commuters |
| Less than 5 Minutes | 76 | 1.7% |
| 5 to 9 Minutes | 333 | 7.3% |
| 10 to 14 Minutes | 562 | 12.3% |
| 15 to 19 Minutes | 473 | 10.4% |
| 20 to 24 Minutes | 519 | 11.4% |
| 25 to 29 Minutes | 330 | 7.2% |
| 30 to 34 Minutes | 728 | 16.0% |
| 35 to 39 Minutes | 271 | 5.9% |
| 40 to 44 Minutes | 185 | 4.1% |
| 45 to 59 Minutes | 579 | 12.7% |
| 60 to 89 Minutes | 406 | 8.9% |
| 90 or more Minutes | 103 | 2.3% |
Commute Time by Sex in Summit
The most common commute times in Summit are 30 to 34 minutes (504 commuters, 18.7%) for males and 10 to 14 minutes (325 commuters, 17.3%) for females.
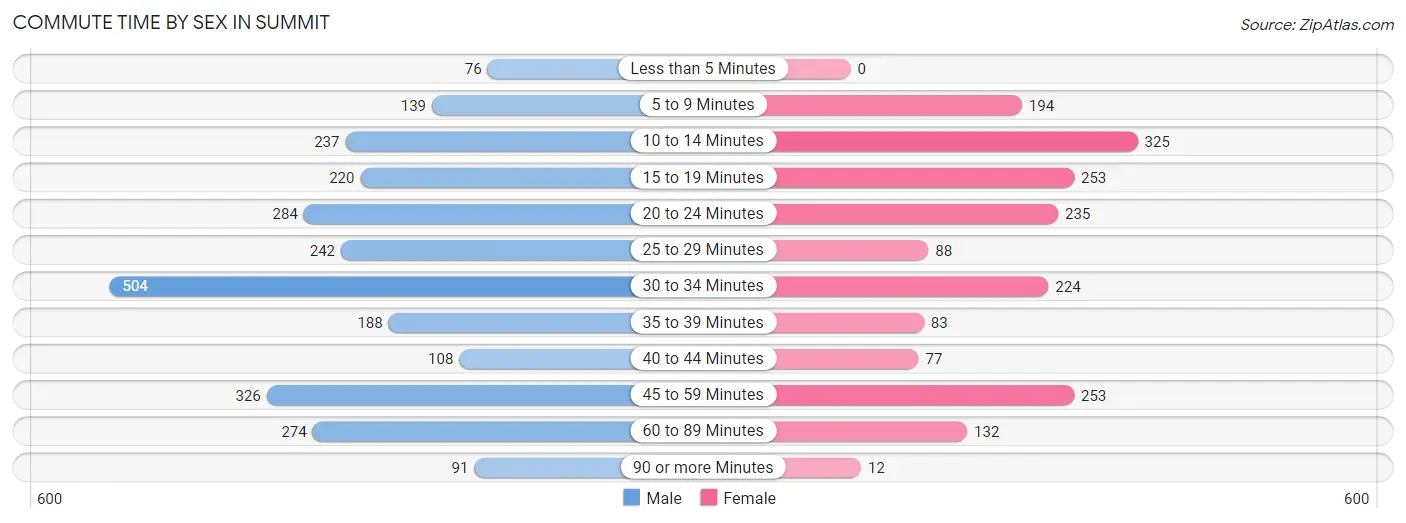
| Commute Time | Male | Female |
| Less than 5 Minutes | 76 (2.8%) | 0 (0.0%) |
| 5 to 9 Minutes | 139 (5.2%) | 194 (10.3%) |
| 10 to 14 Minutes | 237 (8.8%) | 325 (17.3%) |
| 15 to 19 Minutes | 220 (8.2%) | 253 (13.5%) |
| 20 to 24 Minutes | 284 (10.6%) | 235 (12.5%) |
| 25 to 29 Minutes | 242 (9.0%) | 88 (4.7%) |
| 30 to 34 Minutes | 504 (18.7%) | 224 (11.9%) |
| 35 to 39 Minutes | 188 (7.0%) | 83 (4.4%) |
| 40 to 44 Minutes | 108 (4.0%) | 77 (4.1%) |
| 45 to 59 Minutes | 326 (12.1%) | 253 (13.5%) |
| 60 to 89 Minutes | 274 (10.2%) | 132 (7.0%) |
| 90 or more Minutes | 91 (3.4%) | 12 (0.6%) |
Time of Departure to Work by Sex in Summit
The most frequent times of departure to work in Summit are 7:00 AM to 7:29 AM (471, 17.5%) for males and 7:00 AM to 7:29 AM (316, 16.8%) for females.
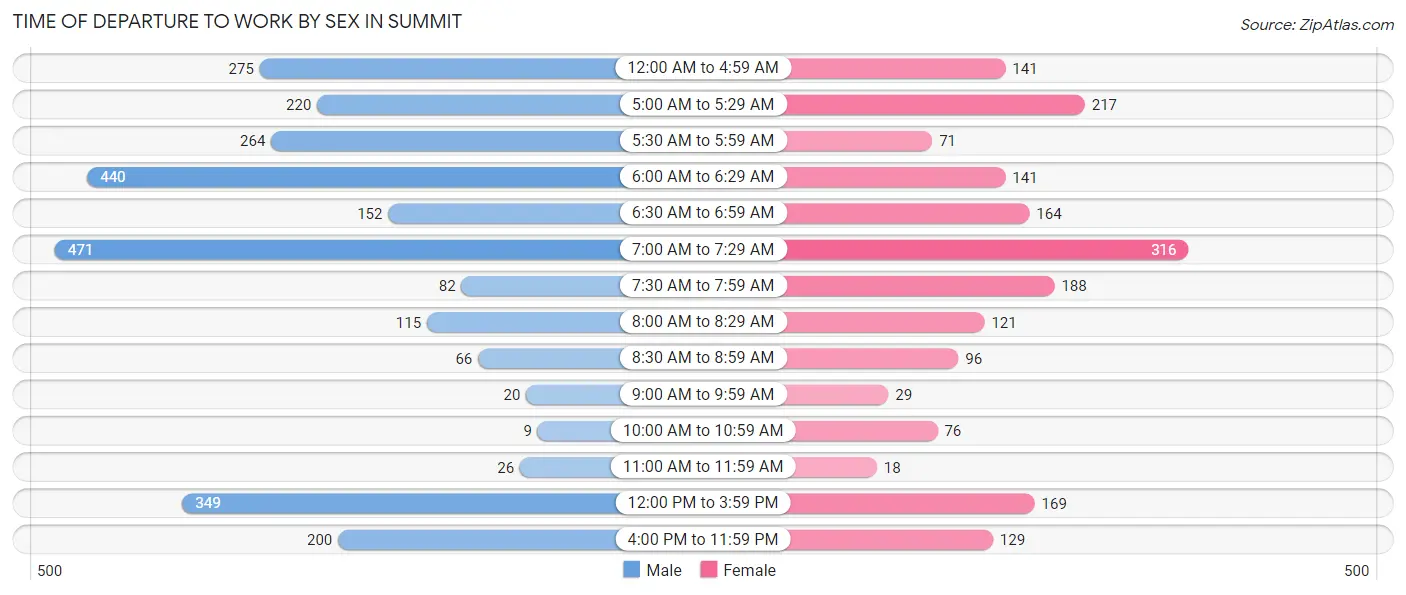
| Time of Departure | Male | Female |
| 12:00 AM to 4:59 AM | 275 (10.2%) | 141 (7.5%) |
| 5:00 AM to 5:29 AM | 220 (8.2%) | 217 (11.6%) |
| 5:30 AM to 5:59 AM | 264 (9.8%) | 71 (3.8%) |
| 6:00 AM to 6:29 AM | 440 (16.4%) | 141 (7.5%) |
| 6:30 AM to 6:59 AM | 152 (5.7%) | 164 (8.7%) |
| 7:00 AM to 7:29 AM | 471 (17.5%) | 316 (16.8%) |
| 7:30 AM to 7:59 AM | 82 (3.0%) | 188 (10.0%) |
| 8:00 AM to 8:29 AM | 115 (4.3%) | 121 (6.5%) |
| 8:30 AM to 8:59 AM | 66 (2.5%) | 96 (5.1%) |
| 9:00 AM to 9:59 AM | 20 (0.7%) | 29 (1.5%) |
| 10:00 AM to 10:59 AM | 9 (0.3%) | 76 (4.1%) |
| 11:00 AM to 11:59 AM | 26 (1.0%) | 18 (1.0%) |
| 12:00 PM to 3:59 PM | 349 (13.0%) | 169 (9.0%) |
| 4:00 PM to 11:59 PM | 200 (7.4%) | 129 (6.9%) |
| Total | 2,689 (100.0%) | 1,876 (100.0%) |
Housing Occupancy in Summit
Occupancy by Ownership in Summit
Of the total 3,600 dwellings in Summit, owner-occupied units account for 2,072 (57.6%), while renter-occupied units make up 1,528 (42.4%).
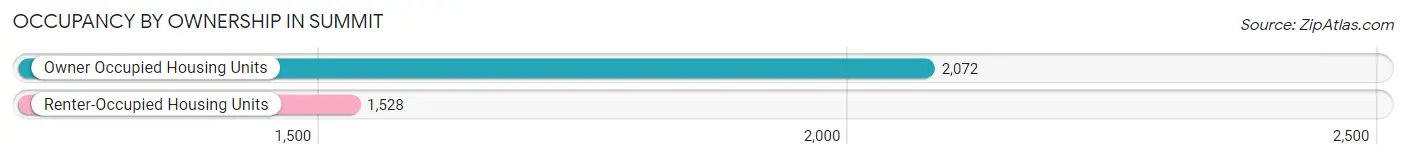
| Occupancy | # Housing Units | % Housing Units |
| Owner Occupied Housing Units | 2,072 | 57.6% |
| Renter-Occupied Housing Units | 1,528 | 42.4% |
| Total Occupied Housing Units | 3,600 | 100.0% |
Occupancy by Household Size in Summit
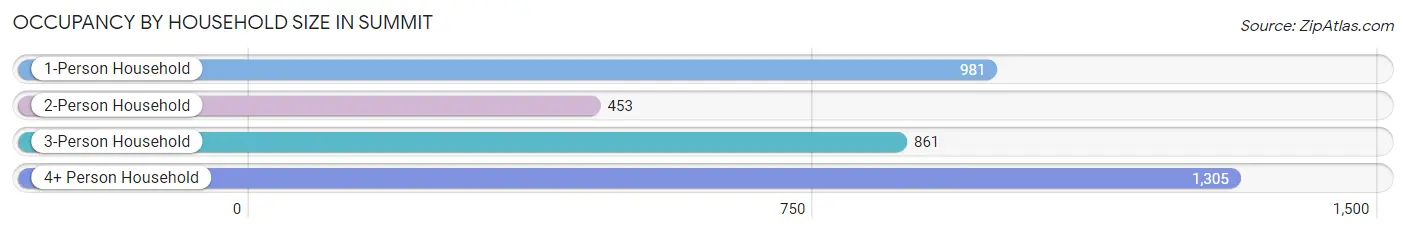
| Household Size | # Housing Units | % Housing Units |
| 1-Person Household | 981 | 27.3% |
| 2-Person Household | 453 | 12.6% |
| 3-Person Household | 861 | 23.9% |
| 4+ Person Household | 1,305 | 36.2% |
| Total Housing Units | 3,600 | 100.0% |
Occupancy by Ownership by Household Size in Summit
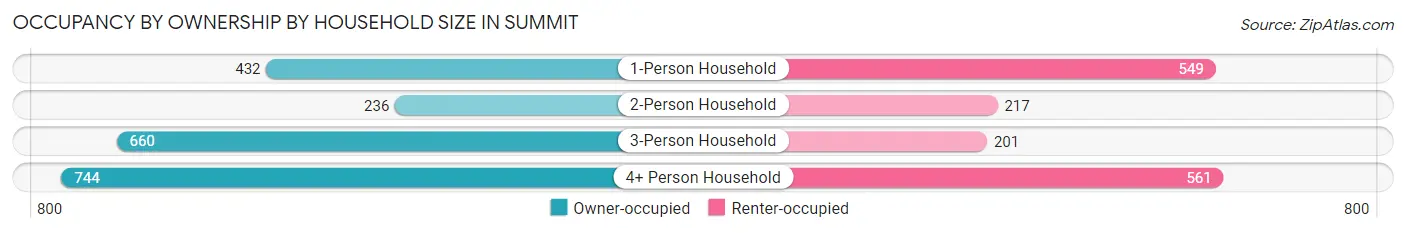
| Household Size | Owner-occupied | Renter-occupied |
| 1-Person Household | 432 (44.0%) | 549 (56.0%) |
| 2-Person Household | 236 (52.1%) | 217 (47.9%) |
| 3-Person Household | 660 (76.7%) | 201 (23.3%) |
| 4+ Person Household | 744 (57.0%) | 561 (43.0%) |
| Total Housing Units | 2,072 (57.6%) | 1,528 (42.4%) |
Occupancy by Educational Attainment in Summit
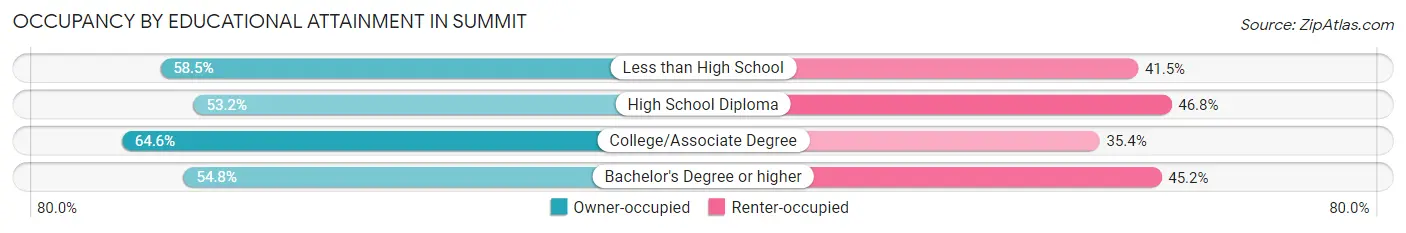
| Household Size | Owner-occupied | Renter-occupied |
| Less than High School | 745 (58.5%) | 529 (41.5%) |
| High School Diploma | 583 (53.2%) | 513 (46.8%) |
| College/Associate Degree | 463 (64.6%) | 254 (35.4%) |
| Bachelor's Degree or higher | 281 (54.8%) | 232 (45.2%) |
Occupancy by Age of Householder in Summit
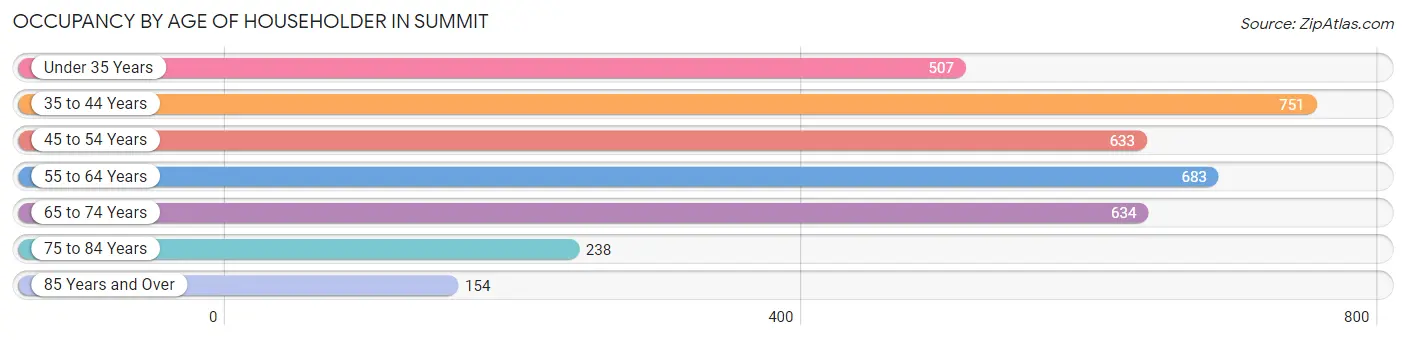
| Age Bracket | # Households | % Households |
| Under 35 Years | 507 | 14.1% |
| 35 to 44 Years | 751 | 20.9% |
| 45 to 54 Years | 633 | 17.6% |
| 55 to 64 Years | 683 | 19.0% |
| 65 to 74 Years | 634 | 17.6% |
| 75 to 84 Years | 238 | 6.6% |
| 85 Years and Over | 154 | 4.3% |
| Total | 3,600 | 100.0% |
Housing Finances in Summit
Median Income by Occupancy in Summit
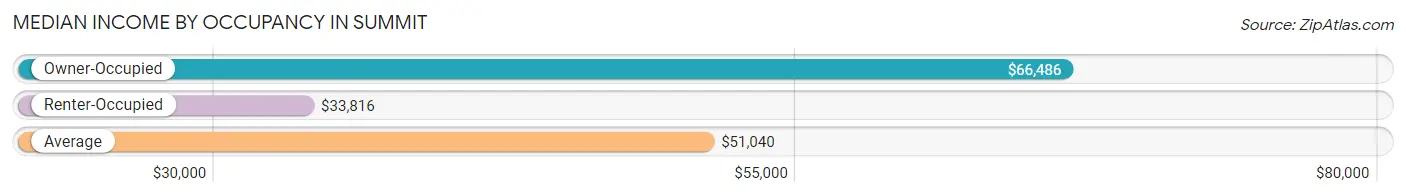
| Occupancy Type | # Households | Median Income |
| Owner-Occupied | 2,072 (57.6%) | $66,486 |
| Renter-Occupied | 1,528 (42.4%) | $33,816 |
| Average | 3,600 (100.0%) | $51,040 |
Occupancy by Householder Income Bracket in Summit
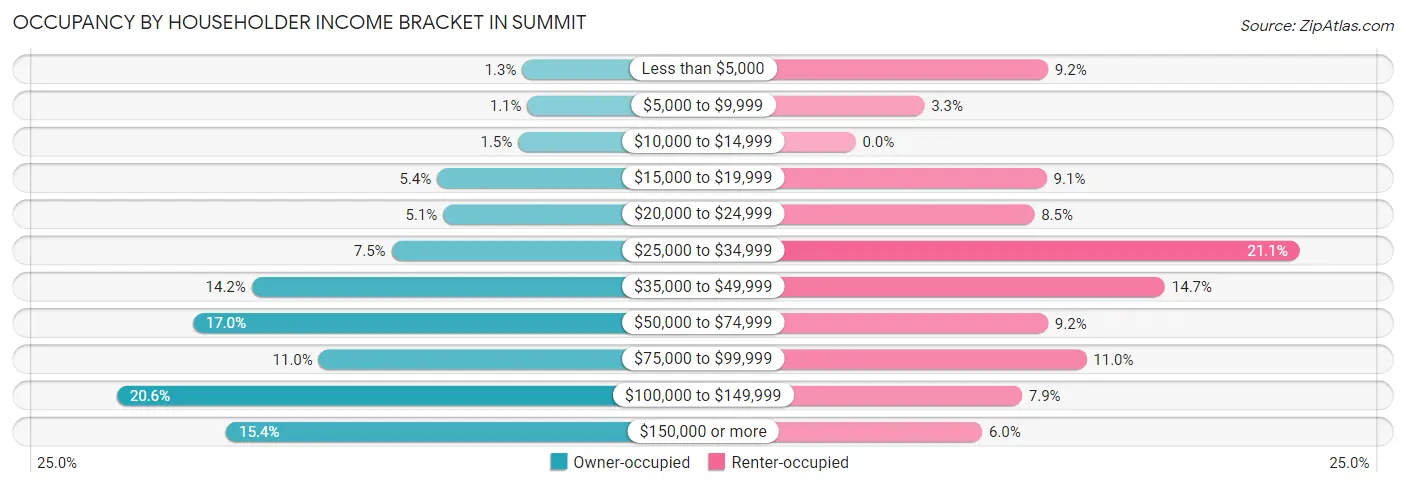
| Income Bracket | Owner-occupied | Renter-occupied |
| Less than $5,000 | 27 (1.3%) | 140 (9.2%) |
| $5,000 to $9,999 | 22 (1.1%) | 50 (3.3%) |
| $10,000 to $14,999 | 31 (1.5%) | 0 (0.0%) |
| $15,000 to $19,999 | 111 (5.4%) | 139 (9.1%) |
| $20,000 to $24,999 | 105 (5.1%) | 130 (8.5%) |
| $25,000 to $34,999 | 156 (7.5%) | 323 (21.1%) |
| $35,000 to $49,999 | 294 (14.2%) | 225 (14.7%) |
| $50,000 to $74,999 | 352 (17.0%) | 140 (9.2%) |
| $75,000 to $99,999 | 228 (11.0%) | 168 (11.0%) |
| $100,000 to $149,999 | 427 (20.6%) | 121 (7.9%) |
| $150,000 or more | 319 (15.4%) | 92 (6.0%) |
| Total | 2,072 (100.0%) | 1,528 (100.0%) |
Monthly Housing Cost Tiers in Summit
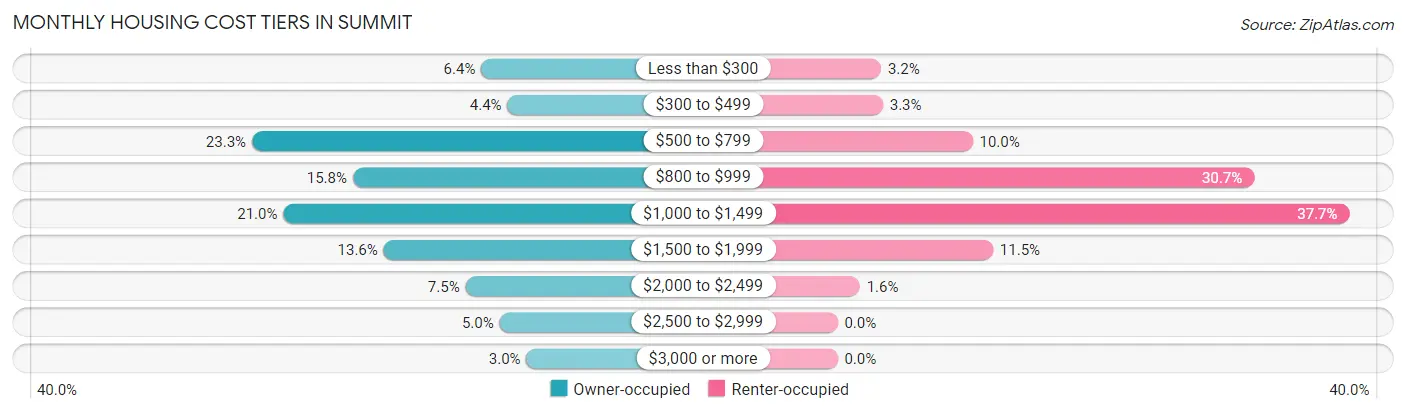
| Monthly Cost | Owner-occupied | Renter-occupied |
| Less than $300 | 132 (6.4%) | 49 (3.2%) |
| $300 to $499 | 92 (4.4%) | 51 (3.3%) |
| $500 to $799 | 482 (23.3%) | 152 (10.0%) |
| $800 to $999 | 328 (15.8%) | 469 (30.7%) |
| $1,000 to $1,499 | 434 (20.9%) | 576 (37.7%) |
| $1,500 to $1,999 | 281 (13.6%) | 175 (11.5%) |
| $2,000 to $2,499 | 156 (7.5%) | 25 (1.6%) |
| $2,500 to $2,999 | 104 (5.0%) | 0 (0.0%) |
| $3,000 or more | 63 (3.0%) | 0 (0.0%) |
| Total | 2,072 (100.0%) | 1,528 (100.0%) |
Physical Housing Characteristics in Summit
Housing Structures in Summit
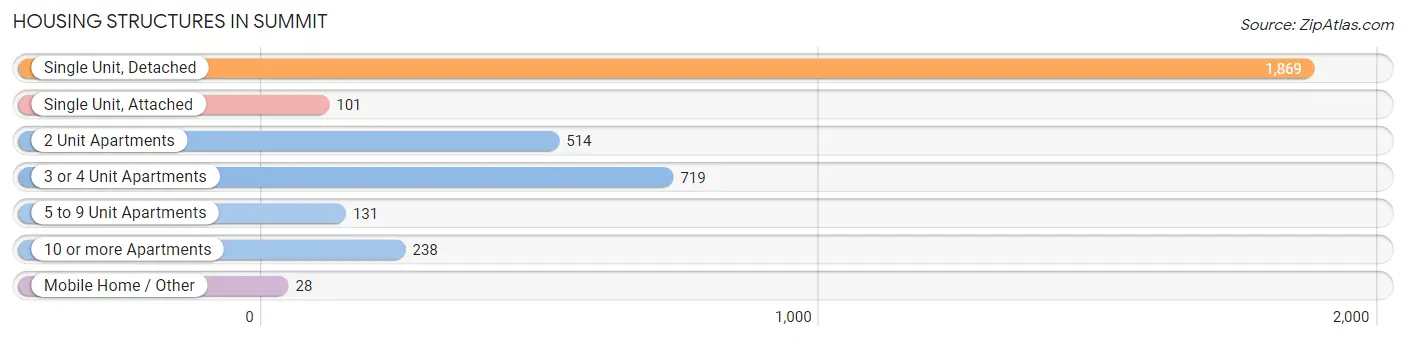
| Structure Type | # Housing Units | % Housing Units |
| Single Unit, Detached | 1,869 | 51.9% |
| Single Unit, Attached | 101 | 2.8% |
| 2 Unit Apartments | 514 | 14.3% |
| 3 or 4 Unit Apartments | 719 | 20.0% |
| 5 to 9 Unit Apartments | 131 | 3.6% |
| 10 or more Apartments | 238 | 6.6% |
| Mobile Home / Other | 28 | 0.8% |
| Total | 3,600 | 100.0% |
Housing Structures by Occupancy in Summit
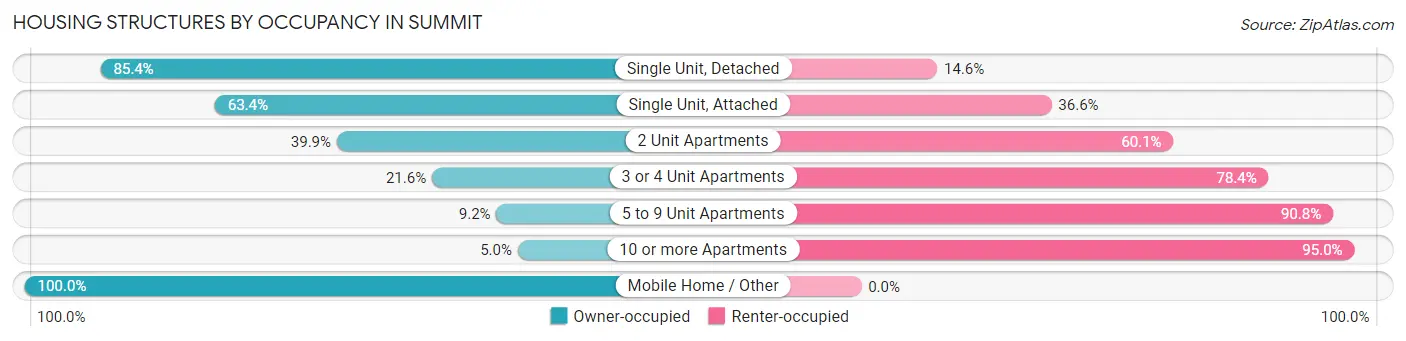
| Structure Type | Owner-occupied | Renter-occupied |
| Single Unit, Detached | 1,596 (85.4%) | 273 (14.6%) |
| Single Unit, Attached | 64 (63.4%) | 37 (36.6%) |
| 2 Unit Apartments | 205 (39.9%) | 309 (60.1%) |
| 3 or 4 Unit Apartments | 155 (21.6%) | 564 (78.4%) |
| 5 to 9 Unit Apartments | 12 (9.2%) | 119 (90.8%) |
| 10 or more Apartments | 12 (5.0%) | 226 (95.0%) |
| Mobile Home / Other | 28 (100.0%) | 0 (0.0%) |
| Total | 2,072 (57.6%) | 1,528 (42.4%) |
Housing Structures by Number of Rooms in Summit
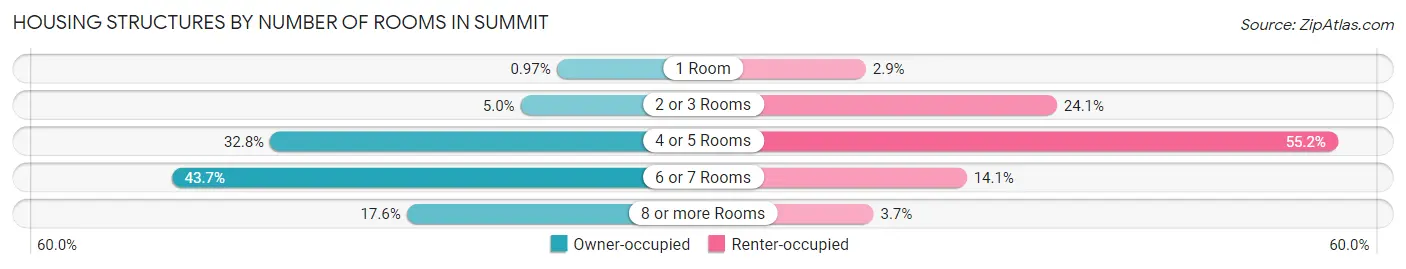
| Number of Rooms | Owner-occupied | Renter-occupied |
| 1 Room | 20 (1.0%) | 44 (2.9%) |
| 2 or 3 Rooms | 103 (5.0%) | 368 (24.1%) |
| 4 or 5 Rooms | 679 (32.8%) | 844 (55.2%) |
| 6 or 7 Rooms | 905 (43.7%) | 215 (14.1%) |
| 8 or more Rooms | 365 (17.6%) | 57 (3.7%) |
| Total | 2,072 (100.0%) | 1,528 (100.0%) |
Housing Structure by Heating Type in Summit
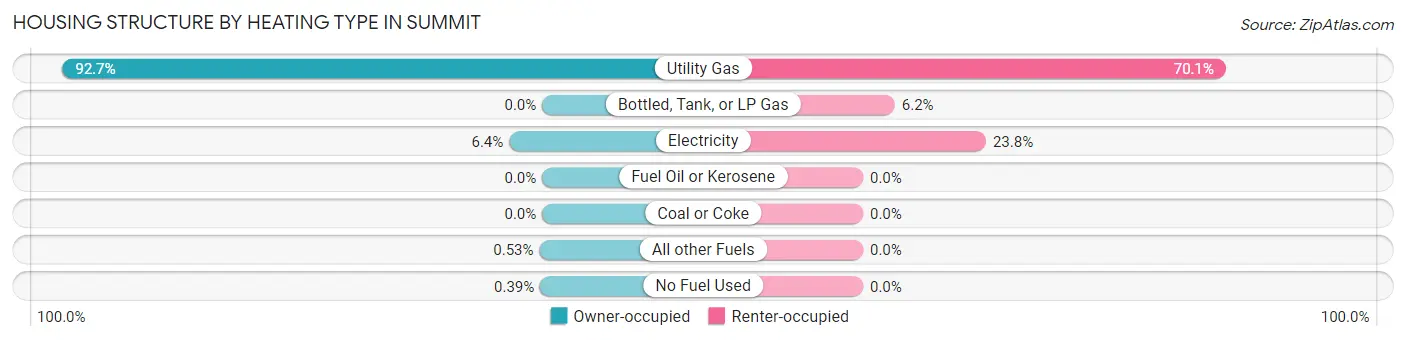
| Heating Type | Owner-occupied | Renter-occupied |
| Utility Gas | 1,921 (92.7%) | 1,071 (70.1%) |
| Bottled, Tank, or LP Gas | 0 (0.0%) | 94 (6.1%) |
| Electricity | 132 (6.4%) | 363 (23.8%) |
| Fuel Oil or Kerosene | 0 (0.0%) | 0 (0.0%) |
| Coal or Coke | 0 (0.0%) | 0 (0.0%) |
| All other Fuels | 11 (0.5%) | 0 (0.0%) |
| No Fuel Used | 8 (0.4%) | 0 (0.0%) |
| Total | 2,072 (100.0%) | 1,528 (100.0%) |
Household Vehicle Usage in Summit
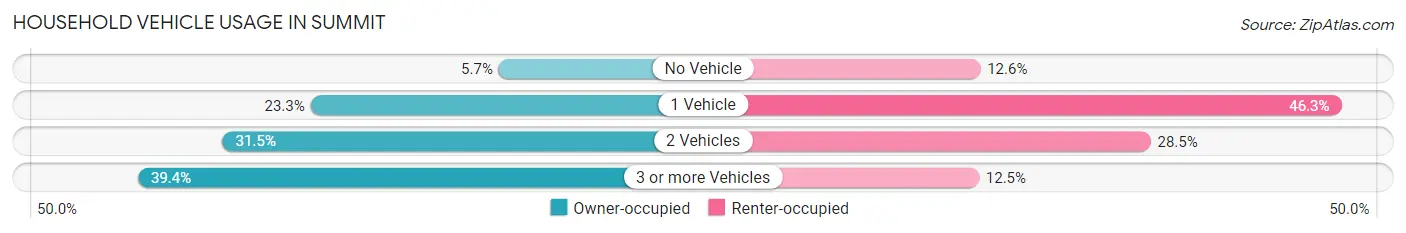
| Vehicles per Household | Owner-occupied | Renter-occupied |
| No Vehicle | 119 (5.7%) | 193 (12.6%) |
| 1 Vehicle | 483 (23.3%) | 708 (46.3%) |
| 2 Vehicles | 653 (31.5%) | 436 (28.5%) |
| 3 or more Vehicles | 817 (39.4%) | 191 (12.5%) |
| Total | 2,072 (100.0%) | 1,528 (100.0%) |
Real Estate & Mortgages in Summit
Real Estate and Mortgage Overview in Summit
| Characteristic | Without Mortgage | With Mortgage |
| Housing Units | 1,165 | 907 |
| Median Property Value | $216,600 | $208,300 |
| Median Household Income | $66,339 | $121 |
| Monthly Housing Costs | $737 | $63 |
| Real Estate Taxes | $5,000 | $62 |
Property Value by Mortgage Status in Summit
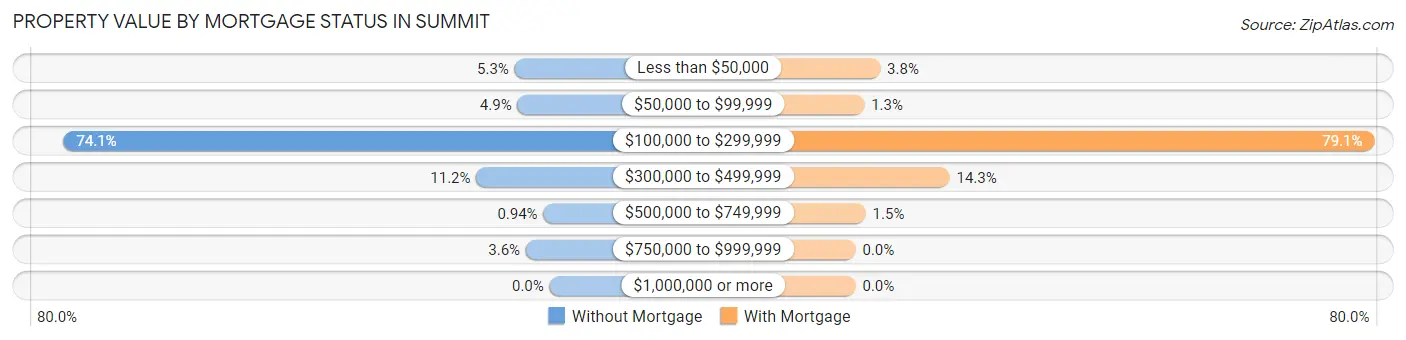
| Property Value | Without Mortgage | With Mortgage |
| Less than $50,000 | 62 (5.3%) | 34 (3.7%) |
| $50,000 to $99,999 | 57 (4.9%) | 12 (1.3%) |
| $100,000 to $299,999 | 863 (74.1%) | 717 (79.0%) |
| $300,000 to $499,999 | 130 (11.2%) | 130 (14.3%) |
| $500,000 to $749,999 | 11 (0.9%) | 14 (1.5%) |
| $750,000 to $999,999 | 42 (3.6%) | 0 (0.0%) |
| $1,000,000 or more | 0 (0.0%) | 0 (0.0%) |
| Total | 1,165 (100.0%) | 907 (100.0%) |
Household Income by Mortgage Status in Summit
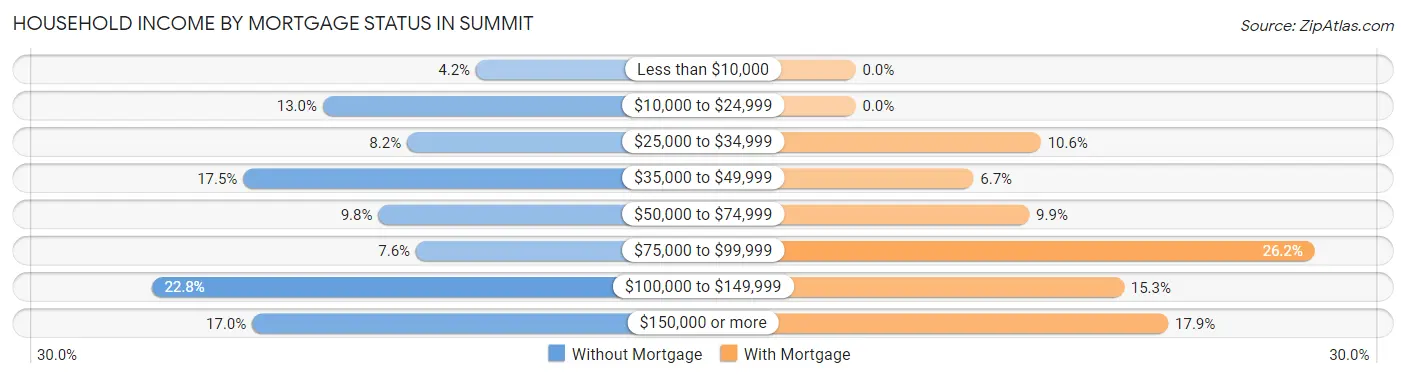
| Household Income | Without Mortgage | With Mortgage |
| Less than $10,000 | 49 (4.2%) | 0 (0.0%) |
| $10,000 to $24,999 | 151 (13.0%) | 0 (0.0%) |
| $25,000 to $34,999 | 95 (8.2%) | 96 (10.6%) |
| $35,000 to $49,999 | 204 (17.5%) | 61 (6.7%) |
| $50,000 to $74,999 | 114 (9.8%) | 90 (9.9%) |
| $75,000 to $99,999 | 89 (7.6%) | 238 (26.2%) |
| $100,000 to $149,999 | 265 (22.8%) | 139 (15.3%) |
| $150,000 or more | 198 (17.0%) | 162 (17.9%) |
| Total | 1,165 (100.0%) | 907 (100.0%) |
Property Value to Household Income Ratio in Summit
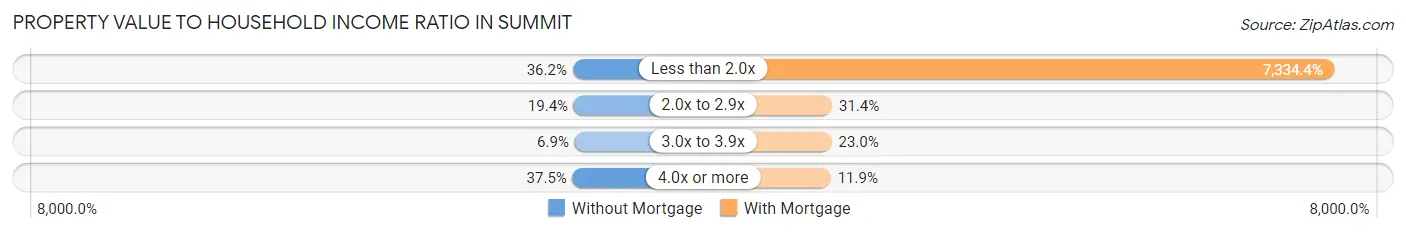
| Value-to-Income Ratio | Without Mortgage | With Mortgage |
| Less than 2.0x | 422 (36.2%) | 66,523 (7,334.4%) |
| 2.0x to 2.9x | 226 (19.4%) | 285 (31.4%) |
| 3.0x to 3.9x | 80 (6.9%) | 209 (23.0%) |
| 4.0x or more | 437 (37.5%) | 108 (11.9%) |
| Total | 1,165 (100.0%) | 907 (100.0%) |
Real Estate Taxes by Mortgage Status in Summit
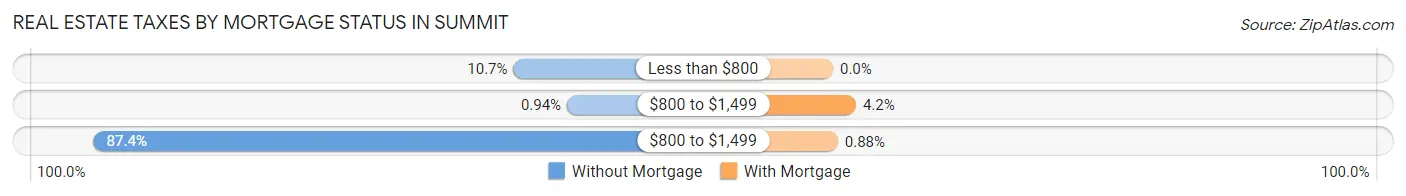
| Property Taxes | Without Mortgage | With Mortgage |
| Less than $800 | 125 (10.7%) | 0 (0.0%) |
| $800 to $1,499 | 11 (0.9%) | 38 (4.2%) |
| $800 to $1,499 | 1,018 (87.4%) | 8 (0.9%) |
| Total | 1,165 (100.0%) | 907 (100.0%) |
Health & Disability in Summit
Health Insurance Coverage by Age in Summit
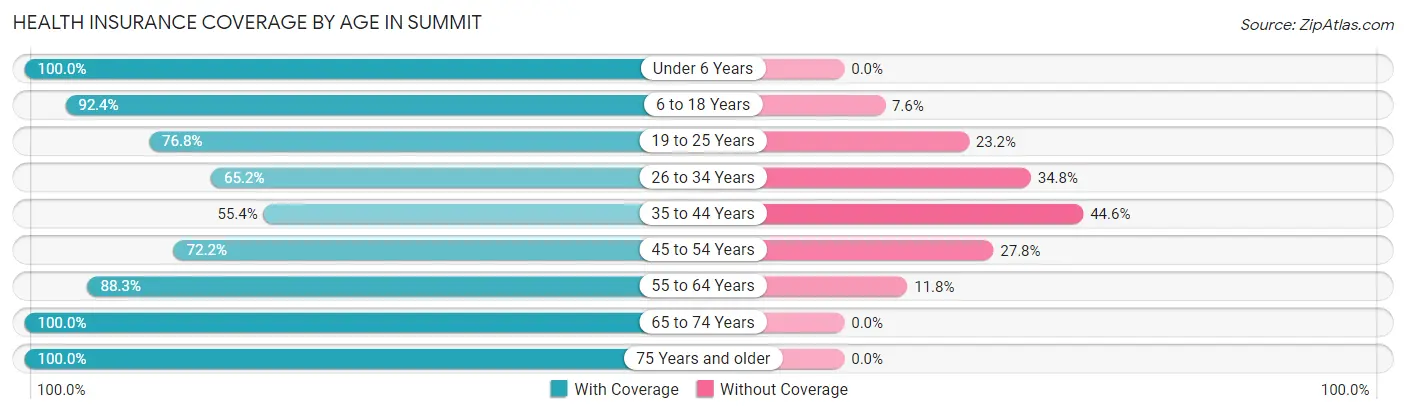
| Age Bracket | With Coverage | Without Coverage |
| Under 6 Years | 631 (100.0%) | 0 (0.0%) |
| 6 to 18 Years | 1,972 (92.4%) | 162 (7.6%) |
| 19 to 25 Years | 737 (76.8%) | 223 (23.2%) |
| 26 to 34 Years | 990 (65.2%) | 528 (34.8%) |
| 35 to 44 Years | 825 (55.4%) | 663 (44.6%) |
| 45 to 54 Years | 896 (72.2%) | 345 (27.8%) |
| 55 to 64 Years | 1,194 (88.2%) | 159 (11.7%) |
| 65 to 74 Years | 1,088 (100.0%) | 0 (0.0%) |
| 75 Years and older | 609 (100.0%) | 0 (0.0%) |
| Total | 8,942 (81.1%) | 2,080 (18.9%) |
Health Insurance Coverage by Citizenship Status in Summit
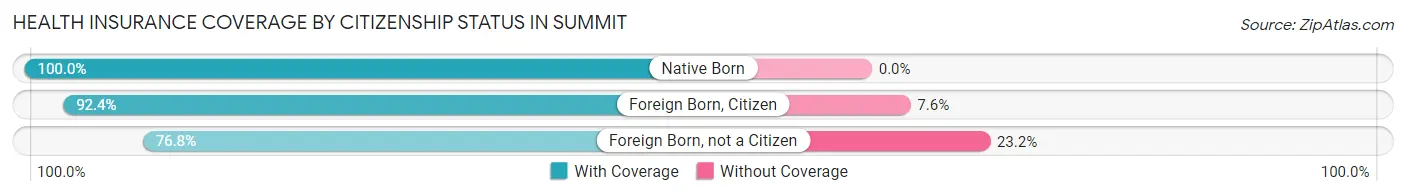
| Citizenship Status | With Coverage | Without Coverage |
| Native Born | 631 (100.0%) | 0 (0.0%) |
| Foreign Born, Citizen | 1,972 (92.4%) | 162 (7.6%) |
| Foreign Born, not a Citizen | 737 (76.8%) | 223 (23.2%) |
Health Insurance Coverage by Household Income in Summit
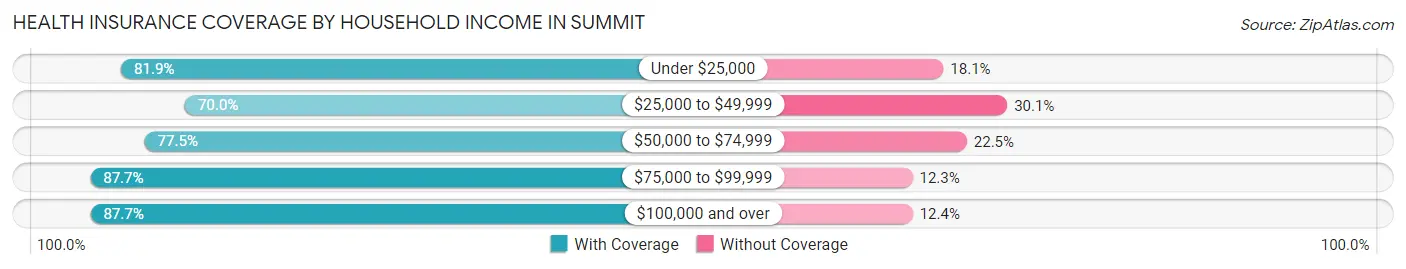
| Household Income | With Coverage | Without Coverage |
| Under $25,000 | 1,095 (81.9%) | 242 (18.1%) |
| $25,000 to $49,999 | 1,934 (70.0%) | 831 (30.0%) |
| $50,000 to $74,999 | 1,185 (77.5%) | 344 (22.5%) |
| $75,000 to $99,999 | 1,295 (87.7%) | 182 (12.3%) |
| $100,000 and over | 3,415 (87.6%) | 481 (12.3%) |
Public vs Private Health Insurance Coverage by Age in Summit
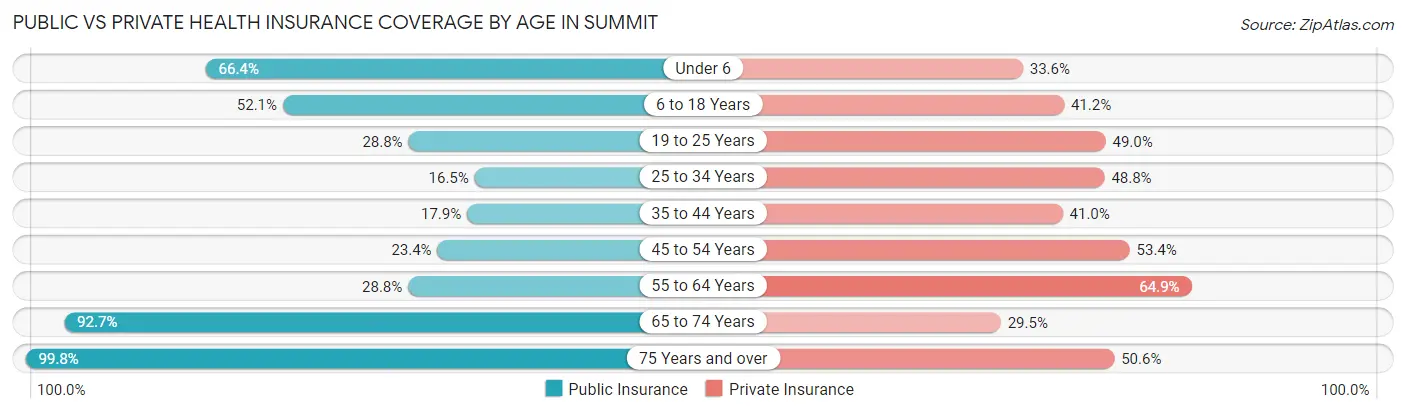
| Age Bracket | Public Insurance | Private Insurance |
| Under 6 | 419 (66.4%) | 212 (33.6%) |
| 6 to 18 Years | 1,111 (52.1%) | 880 (41.2%) |
| 19 to 25 Years | 276 (28.7%) | 470 (49.0%) |
| 25 to 34 Years | 250 (16.5%) | 740 (48.7%) |
| 35 to 44 Years | 266 (17.9%) | 610 (41.0%) |
| 45 to 54 Years | 290 (23.4%) | 663 (53.4%) |
| 55 to 64 Years | 390 (28.8%) | 878 (64.9%) |
| 65 to 74 Years | 1,008 (92.6%) | 321 (29.5%) |
| 75 Years and over | 608 (99.8%) | 308 (50.6%) |
| Total | 4,618 (41.9%) | 5,082 (46.1%) |
Disability Status by Sex by Age in Summit
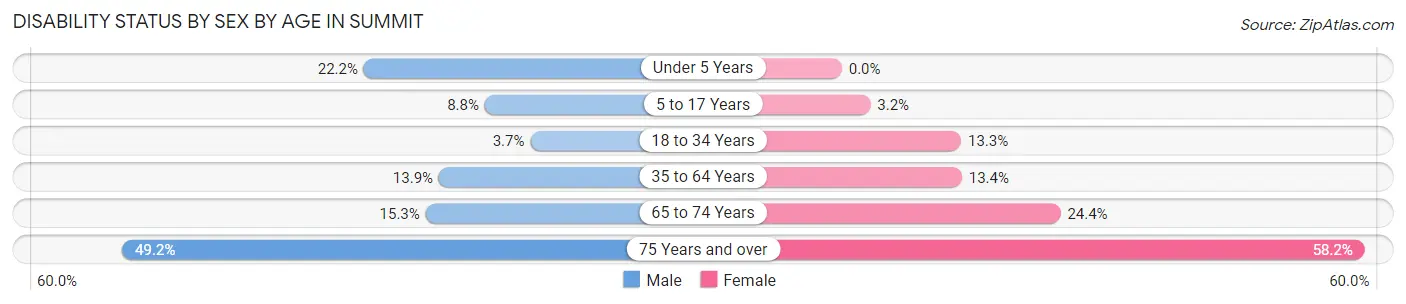
| Age Bracket | Male | Female |
| Under 5 Years | 30 (22.2%) | 0 (0.0%) |
| 5 to 17 Years | 93 (8.7%) | 32 (3.2%) |
| 18 to 34 Years | 47 (3.7%) | 187 (13.3%) |
| 35 to 64 Years | 321 (13.9%) | 236 (13.4%) |
| 65 to 74 Years | 73 (15.3%) | 149 (24.3%) |
| 75 Years and over | 144 (49.1%) | 184 (58.2%) |
Disability Class by Sex by Age in Summit
Disability Class: Hearing Difficulty
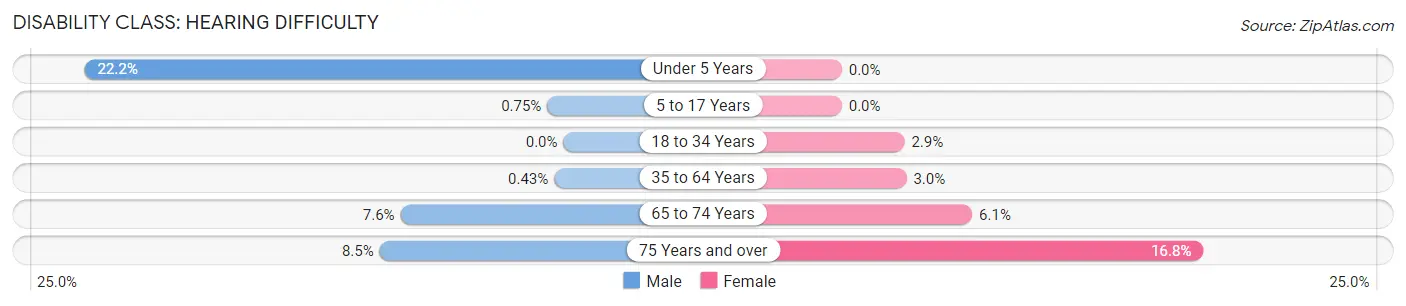
| Age Bracket | Male | Female |
| Under 5 Years | 30 (22.2%) | 0 (0.0%) |
| 5 to 17 Years | 8 (0.7%) | 0 (0.0%) |
| 18 to 34 Years | 0 (0.0%) | 41 (2.9%) |
| 35 to 64 Years | 10 (0.4%) | 53 (3.0%) |
| 65 to 74 Years | 36 (7.6%) | 37 (6.0%) |
| 75 Years and over | 25 (8.5%) | 53 (16.8%) |
Disability Class: Vision Difficulty
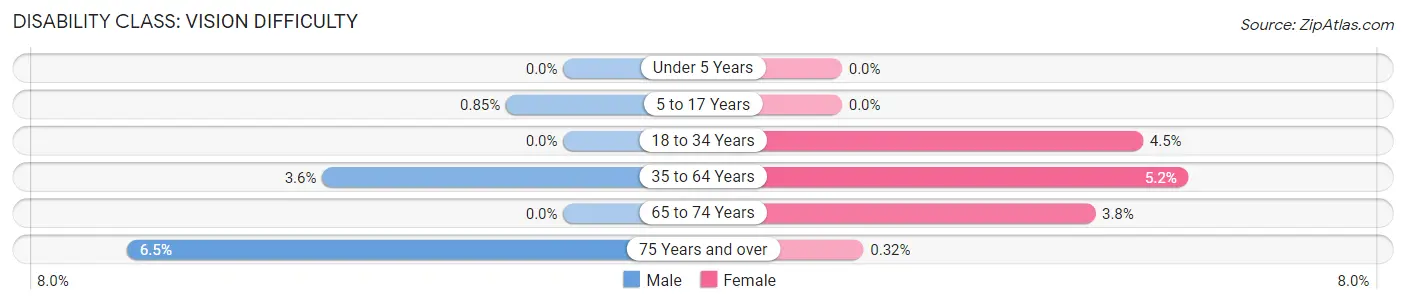
| Age Bracket | Male | Female |
| Under 5 Years | 0 (0.0%) | 0 (0.0%) |
| 5 to 17 Years | 9 (0.9%) | 0 (0.0%) |
| 18 to 34 Years | 0 (0.0%) | 63 (4.5%) |
| 35 to 64 Years | 83 (3.6%) | 91 (5.1%) |
| 65 to 74 Years | 0 (0.0%) | 23 (3.8%) |
| 75 Years and over | 19 (6.5%) | 1 (0.3%) |
Disability Class: Cognitive Difficulty
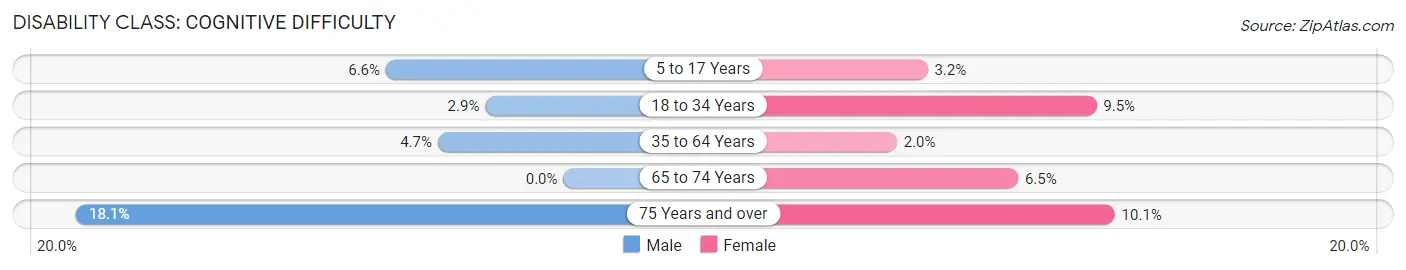
| Age Bracket | Male | Female |
| 5 to 17 Years | 70 (6.6%) | 32 (3.2%) |
| 18 to 34 Years | 37 (2.9%) | 133 (9.5%) |
| 35 to 64 Years | 108 (4.7%) | 36 (2.0%) |
| 65 to 74 Years | 0 (0.0%) | 40 (6.5%) |
| 75 Years and over | 53 (18.1%) | 32 (10.1%) |
Disability Class: Ambulatory Difficulty
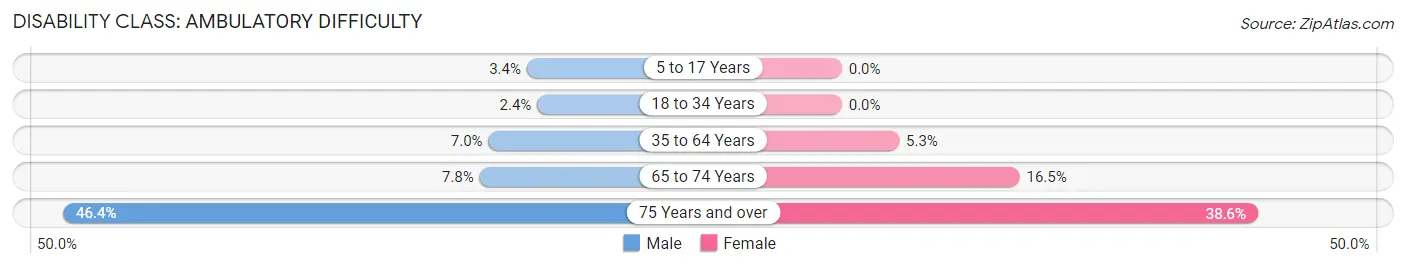
| Age Bracket | Male | Female |
| 5 to 17 Years | 36 (3.4%) | 0 (0.0%) |
| 18 to 34 Years | 31 (2.4%) | 0 (0.0%) |
| 35 to 64 Years | 161 (7.0%) | 94 (5.3%) |
| 65 to 74 Years | 37 (7.8%) | 101 (16.5%) |
| 75 Years and over | 136 (46.4%) | 122 (38.6%) |
Disability Class: Self-Care Difficulty
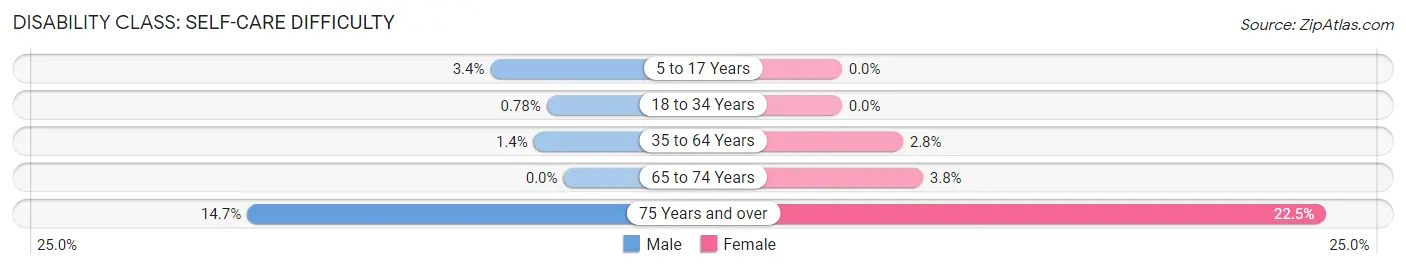
| Age Bracket | Male | Female |
| 5 to 17 Years | 36 (3.4%) | 0 (0.0%) |
| 18 to 34 Years | 10 (0.8%) | 0 (0.0%) |
| 35 to 64 Years | 32 (1.4%) | 50 (2.8%) |
| 65 to 74 Years | 0 (0.0%) | 23 (3.8%) |
| 75 Years and over | 43 (14.7%) | 71 (22.5%) |
Technology Access in Summit
Computing Device Access in Summit
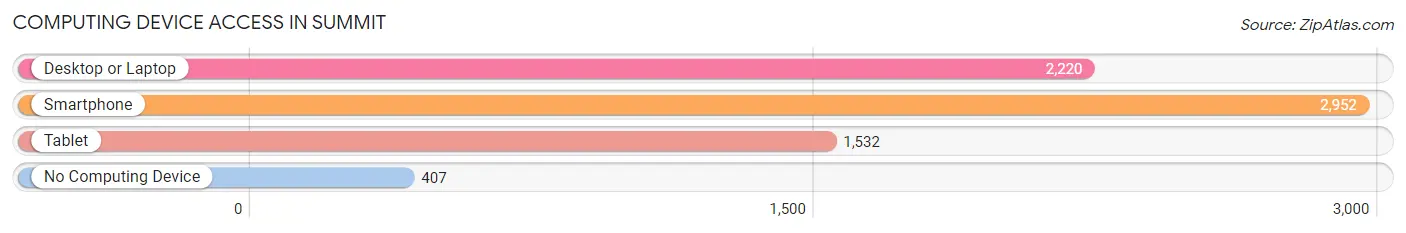
| Device Type | # Households | % Households |
| Desktop or Laptop | 2,220 | 61.7% |
| Smartphone | 2,952 | 82.0% |
| Tablet | 1,532 | 42.6% |
| No Computing Device | 407 | 11.3% |
| Total | 3,600 | 100.0% |
Internet Access in Summit
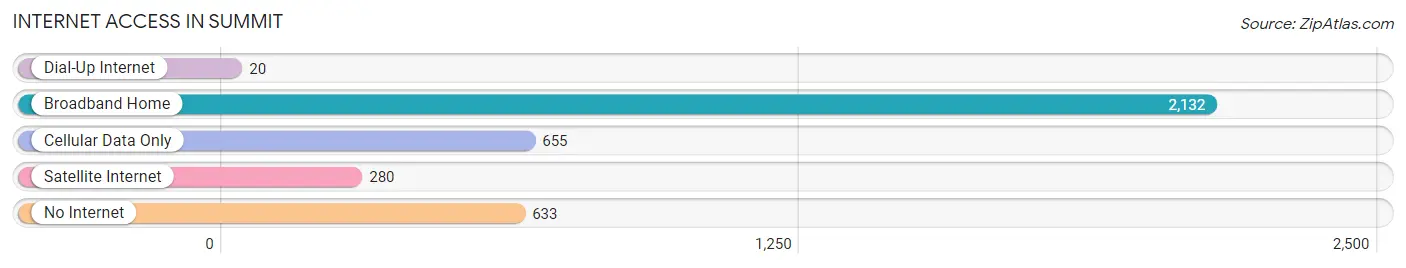
| Internet Type | # Households | % Households |
| Dial-Up Internet | 20 | 0.6% |
| Broadband Home | 2,132 | 59.2% |
| Cellular Data Only | 655 | 18.2% |
| Satellite Internet | 280 | 7.8% |
| No Internet | 633 | 17.6% |
| Total | 3,600 | 100.0% |
Summit Summary
Summit is a village located in Cook County, Illinois, United States. The population was 11,054 at the 2010 census. It is located approximately 25 miles southwest of Chicago's Loop.
History
The area that is now Summit was first settled in the 1830s by German immigrants. The village was originally known as "Witt" and was incorporated in 1889. The name was changed to Summit in 1892, after the nearby Summit Grove, a popular picnic spot.
In the late 19th century, Summit was a popular destination for wealthy Chicagoans looking to escape the city. The village was home to several large estates, including the former home of the late Chicago mayor, Richard J. Daley.
Geography
Summit is located at 41°44'17" North, 87°48'17" West (41.738, -87.804). According to the 2010 census, Summit has a total area of 4.3 square miles, all land.
Economy
Summit is home to a variety of businesses, including manufacturing, retail, and service industries. The village is also home to several large employers, including the Kraft Foods plant, which employs over 1,000 people.
Demographics
As of the 2010 census, there were 11,054 people, 4,072 households, and 2,845 families residing in the village. The population density was 2,567.3 people per square mile. The racial makeup of the village was 79.2% White, 8.3% African American, 0.3% Native American, 4.2% Asian, 0.1% Pacific Islander, 5.2% from other races, and 2.7% from two or more races. Hispanic or Latino of any race were 13.3% of the population.
The median income for a household in the village was $54,917, and the median income for a family was $63,917. Males had a median income of $45,917 versus $35,917 for females. The per capita income for the village was $25,917. About 4.2% of families and 6.2% of the population were below the poverty line, including 8.2% of those under age 18 and 4.2% of those age 65 or over.
Conclusion
Summit is a village located in Cook County, Illinois, United States. The population was 11,054 at the 2010 census. It is located approximately 25 miles southwest of Chicago's Loop. The area was first settled in the 1830s by German immigrants and was incorporated in 1889. The village is home to a variety of businesses, including manufacturing, retail, and service industries. The racial makeup of the village was 79.2% White, 8.3% African American, 0.3% Native American, 4.2% Asian, 0.1% Pacific Islander, 5.2% from other races, and 2.7% from two or more races. The median income for a household in the village was $54,917, and the median income for a family was $63,917. About 4.2% of families and 6.2% of the population were below the poverty line.
Common Questions
What is Per Capita Income in Summit?
Per Capita income in Summit is $27,730.
What is the Median Family Income in Summit?
Median Family Income in Summit is $63,438.
What is the Median Household income in Summit?
Median Household Income in Summit is $51,040.
What is Income or Wage Gap in Summit?
Income or Wage Gap in Summit is 14.6%.
Women in Summit earn 85.4 cents for every dollar earned by a man.
What is Family Income Deficit in Summit?
Family Income Deficit in Summit is $8,046.
Families that are below poverty line in Summit earn $8,046 less on average than the poverty threshold level.
What is Inequality or Gini Index in Summit?
Inequality or Gini Index in Summit is 0.50.
What is the Total Population of Summit?
Total Population of Summit is 11,036.
What is the Total Male Population of Summit?
Total Male Population of Summit is 5,563.
What is the Total Female Population of Summit?
Total Female Population of Summit is 5,473.
What is the Ratio of Males per 100 Females in Summit?
There are 101.64 Males per 100 Females in Summit.
What is the Ratio of Females per 100 Males in Summit?
There are 98.38 Females per 100 Males in Summit.
What is the Median Population Age in Summit?
Median Population Age in Summit is 37.1 Years.
What is the Average Family Size in Summit
Average Family Size in Summit is 3.7 People.
What is the Average Household Size in Summit
Average Household Size in Summit is 3.1 People.
How Large is the Labor Force in Summit?
There are 5,186 People in the Labor Forcein in Summit.
What is the Percentage of People in the Labor Force in Summit?
58.6% of People are in the Labor Force in Summit.
What is the Unemployment Rate in Summit?
Unemployment Rate in Summit is 7.1%.