Wonder Lake, IL Map & Demographics
Wonder Lake Map
Wonder Lake Overview
$44,168
PER CAPITA INCOME
$106,973
AVG FAMILY INCOME
$99,844
AVG HOUSEHOLD INCOME
62.9%
WAGE / INCOME GAP [ % ]
37.1¢/ $1
WAGE / INCOME GAP [ $ ]
0.37
INEQUALITY / GINI INDEX
3,833
TOTAL POPULATION
1,936
MALE POPULATION
1,897
FEMALE POPULATION
102.06
MALES / 100 FEMALES
97.99
FEMALES / 100 MALES
36.8
MEDIAN AGE
2.9
AVG FAMILY SIZE
2.6
AVG HOUSEHOLD SIZE
2,035
LABOR FORCE [ PEOPLE ]
69.8%
PERCENT IN LABOR FORCE
7.5%
UNEMPLOYMENT RATE
Wonder Lake Zip Codes
Income in Wonder Lake
Income Overview in Wonder Lake
Per Capita Income in Wonder Lake is $44,168, while median incomes of families and households are $106,973 and $99,844 respectively.
| Characteristic | Number | Measure |
| Per Capita Income | 3,833 | $44,168 |
| Median Family Income | 1,161 | $106,973 |
| Mean Family Income | 1,161 | $111,614 |
| Median Household Income | 1,461 | $99,844 |
| Mean Household Income | 1,461 | $114,310 |
| Income Deficit | 1,161 | $0 |
| Wage / Income Gap (%) | 3,833 | 62.92% |
| Wage / Income Gap ($) | 3,833 | 37.08¢ per $1 |
| Gini / Inequality Index | 3,833 | 0.37 |
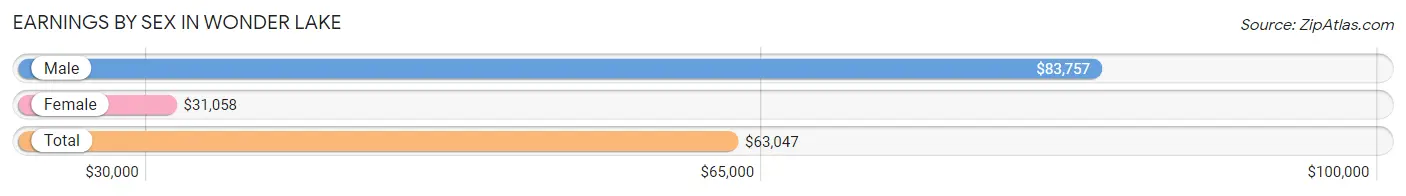
Earnings by Sex in Wonder Lake
Average Earnings in Wonder Lake are $63,047, $83,757 for men and $31,058 for women, a difference of 62.9%.
| Sex | Number | Average Earnings |
| Male | 1,090 (53.3%) | $83,757 |
| Female | 955 (46.7%) | $31,058 |
| Total | 2,045 (100.0%) | $63,047 |
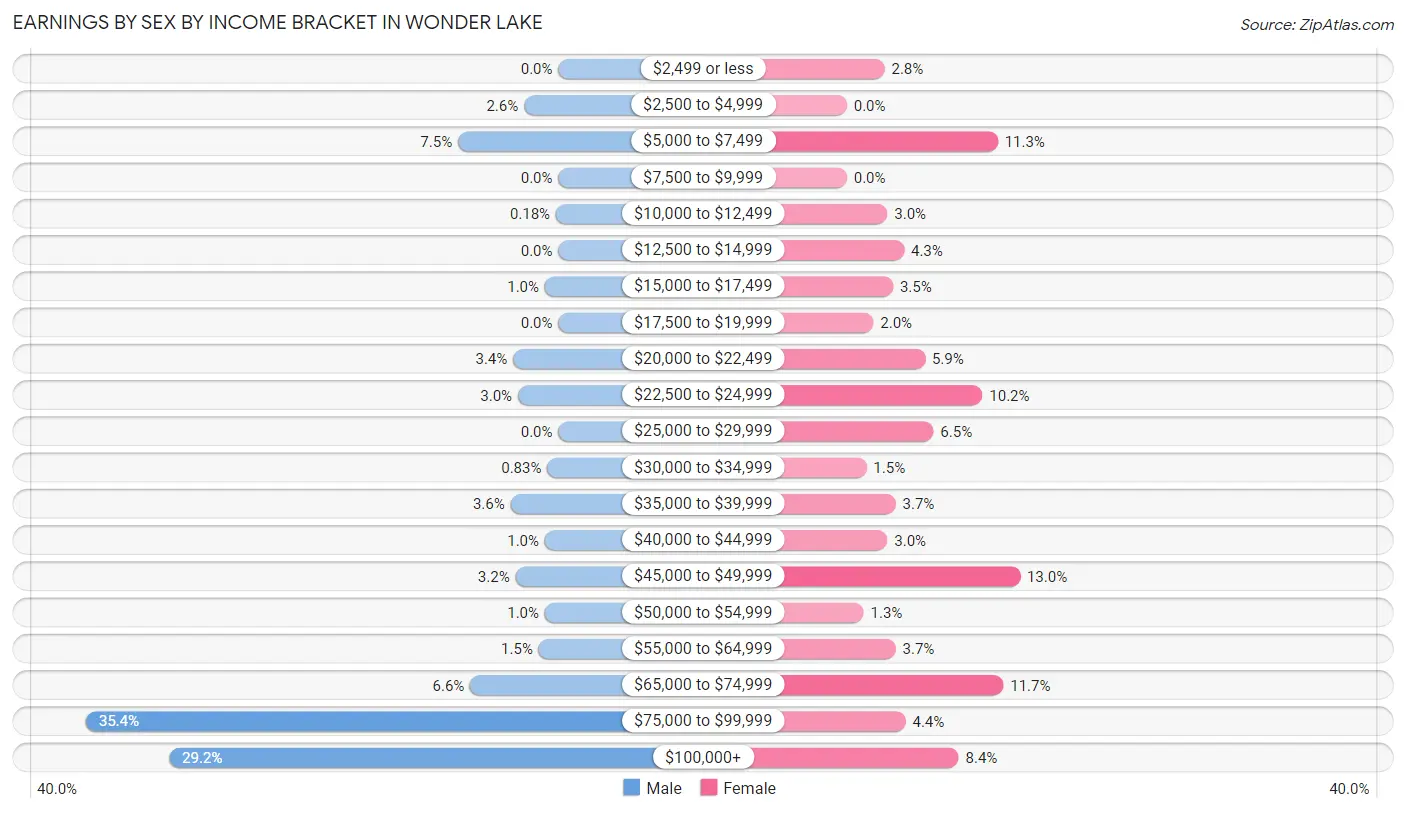
Earnings by Sex by Income Bracket in Wonder Lake
The most common earnings brackets in Wonder Lake are $75,000 to $99,999 for men (386 | 35.4%) and $45,000 to $49,999 for women (124 | 13.0%).
| Income | Male | Female |
| $2,499 or less | 0 (0.0%) | 27 (2.8%) |
| $2,500 to $4,999 | 28 (2.6%) | 0 (0.0%) |
| $5,000 to $7,499 | 82 (7.5%) | 108 (11.3%) |
| $7,500 to $9,999 | 0 (0.0%) | 0 (0.0%) |
| $10,000 to $12,499 | 2 (0.2%) | 29 (3.0%) |
| $12,500 to $14,999 | 0 (0.0%) | 41 (4.3%) |
| $15,000 to $17,499 | 11 (1.0%) | 33 (3.5%) |
| $17,500 to $19,999 | 0 (0.0%) | 19 (2.0%) |
| $20,000 to $22,499 | 37 (3.4%) | 56 (5.9%) |
| $22,500 to $24,999 | 33 (3.0%) | 97 (10.2%) |
| $25,000 to $29,999 | 0 (0.0%) | 62 (6.5%) |
| $30,000 to $34,999 | 9 (0.8%) | 14 (1.5%) |
| $35,000 to $39,999 | 39 (3.6%) | 35 (3.7%) |
| $40,000 to $44,999 | 11 (1.0%) | 29 (3.0%) |
| $45,000 to $49,999 | 35 (3.2%) | 124 (13.0%) |
| $50,000 to $54,999 | 11 (1.0%) | 12 (1.3%) |
| $55,000 to $64,999 | 16 (1.5%) | 35 (3.7%) |
| $65,000 to $74,999 | 72 (6.6%) | 112 (11.7%) |
| $75,000 to $99,999 | 386 (35.4%) | 42 (4.4%) |
| $100,000+ | 318 (29.2%) | 80 (8.4%) |
| Total | 1,090 (100.0%) | 955 (100.0%) |
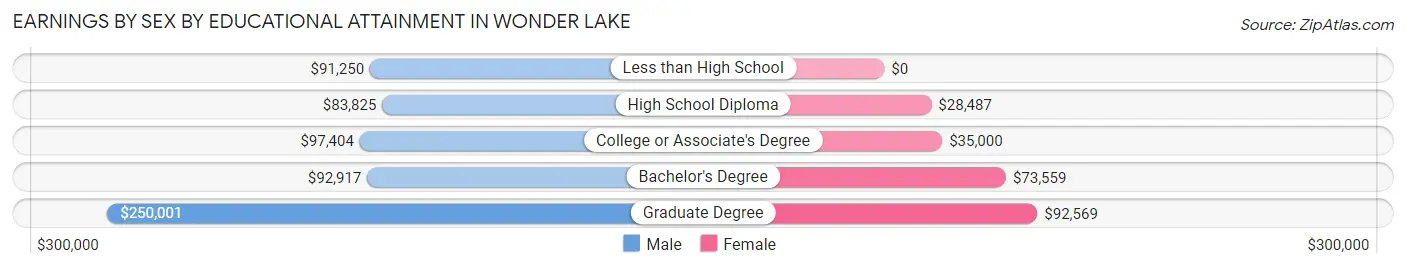
Earnings by Sex by Educational Attainment in Wonder Lake
Average earnings in Wonder Lake are $84,523 for men and $47,782 for women, a difference of 43.5%. Men with an educational attainment of graduate degree enjoy the highest average annual earnings of $250,001, while those with high school diploma education earn the least with $83,825. Women with an educational attainment of graduate degree earn the most with the average annual earnings of $92,569, while those with high school diploma education have the smallest earnings of $28,487.
| Educational Attainment | Male Income | Female Income |
| Less than High School | $91,250 | $0 |
| High School Diploma | $83,825 | $28,487 |
| College or Associate's Degree | $97,404 | $35,000 |
| Bachelor's Degree | $92,917 | $73,559 |
| Graduate Degree | $250,001 | $92,569 |
| Total | $84,523 | $47,782 |
Family Income in Wonder Lake
Family Income Brackets in Wonder Lake
According to the Wonder Lake family income data, there are 421 families falling into the $100,000 to $149,999 income range, which is the most common income bracket and makes up 36.3% of all families.
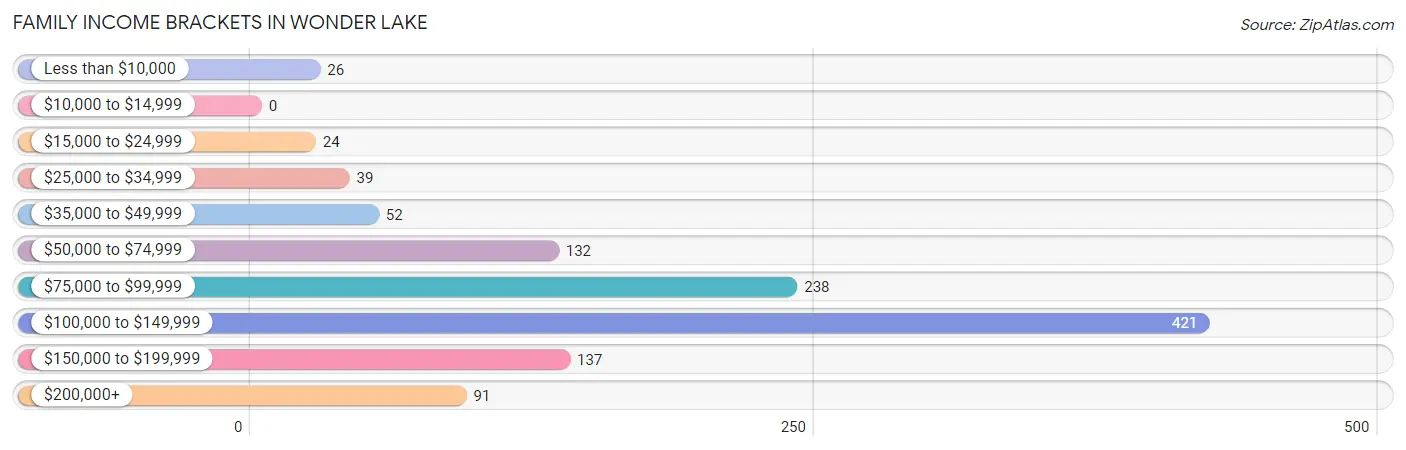
| Income Bracket | # Families | % Families |
| Less than $10,000 | 26 | 2.2% |
| $10,000 to $14,999 | 0 | 0.0% |
| $15,000 to $24,999 | 24 | 2.1% |
| $25,000 to $34,999 | 39 | 3.4% |
| $35,000 to $49,999 | 52 | 4.5% |
| $50,000 to $74,999 | 132 | 11.4% |
| $75,000 to $99,999 | 238 | 20.5% |
| $100,000 to $149,999 | 421 | 36.3% |
| $150,000 to $199,999 | 137 | 11.8% |
| $200,000+ | 91 | 7.8% |
Family Income by Famaliy Size in Wonder Lake
5-person families (77 | 6.6%) account for the highest median family income in Wonder Lake with $165,529 per family, while 2-person families (513 | 44.2%) have the highest median income of $52,682 per family member.
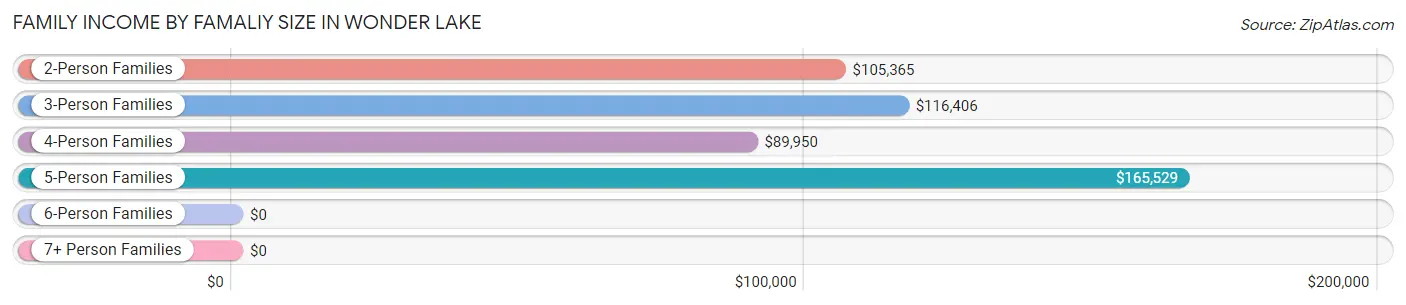
| Income Bracket | # Families | Median Income |
| 2-Person Families | 513 (44.2%) | $105,365 |
| 3-Person Families | 255 (22.0%) | $116,406 |
| 4-Person Families | 316 (27.2%) | $89,950 |
| 5-Person Families | 77 (6.6%) | $165,529 |
| 6-Person Families | 0 (0.0%) | $0 |
| 7+ Person Families | 0 (0.0%) | $0 |
| Total | 1,161 (100.0%) | $106,973 |
Family Income by Number of Earners in Wonder Lake
The median family income in Wonder Lake is $106,973, with families comprising 3+ earners (137) having the highest median family income of $163,533, while families with no earners (177) have the lowest median family income of $62,847, accounting for 11.8% and 15.2% of families, respectively.
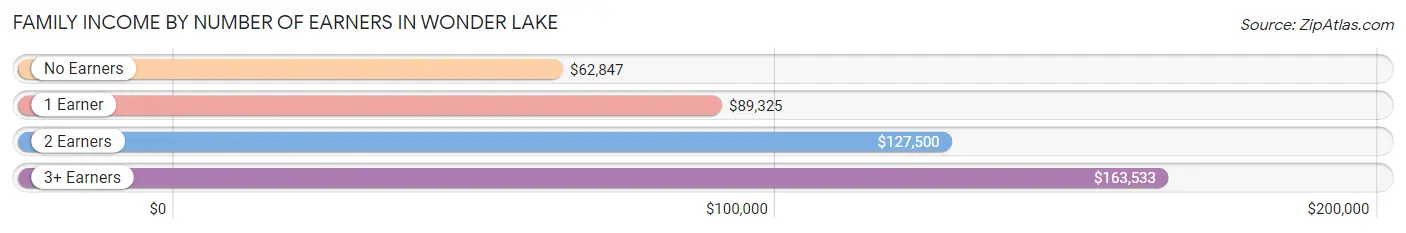
| Number of Earners | # Families | Median Income |
| No Earners | 177 (15.2%) | $62,847 |
| 1 Earner | 423 (36.4%) | $89,325 |
| 2 Earners | 424 (36.5%) | $127,500 |
| 3+ Earners | 137 (11.8%) | $163,533 |
| Total | 1,161 (100.0%) | $106,973 |
Household Income in Wonder Lake
Household Income Brackets in Wonder Lake
With 421 households falling in the category, the $100,000 to $149,999 income range is the most frequent in Wonder Lake, accounting for 28.8% of all households.
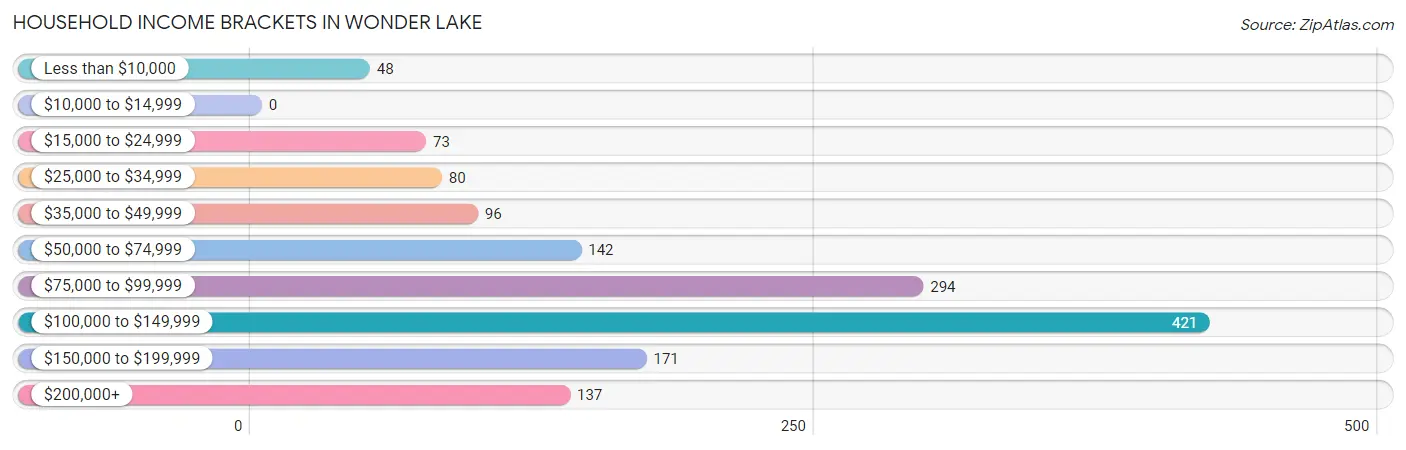
| Income Bracket | # Households | % Households |
| Less than $10,000 | 48 | 3.3% |
| $10,000 to $14,999 | 0 | 0.0% |
| $15,000 to $24,999 | 73 | 5.0% |
| $25,000 to $34,999 | 80 | 5.5% |
| $35,000 to $49,999 | 96 | 6.6% |
| $50,000 to $74,999 | 142 | 9.7% |
| $75,000 to $99,999 | 294 | 20.1% |
| $100,000 to $149,999 | 421 | 28.8% |
| $150,000 to $199,999 | 171 | 11.7% |
| $200,000+ | 137 | 9.4% |
Household Income by Householder Age in Wonder Lake
The median household income in Wonder Lake is $99,844, with the highest median household income of $115,764 found in the 45 to 64 years age bracket for the primary householder. A total of 583 households (39.9%) fall into this category. Meanwhile, the 15 to 24 years age bracket for the primary householder has the lowest median household income of $0, with 22 households (1.5%) in this group.
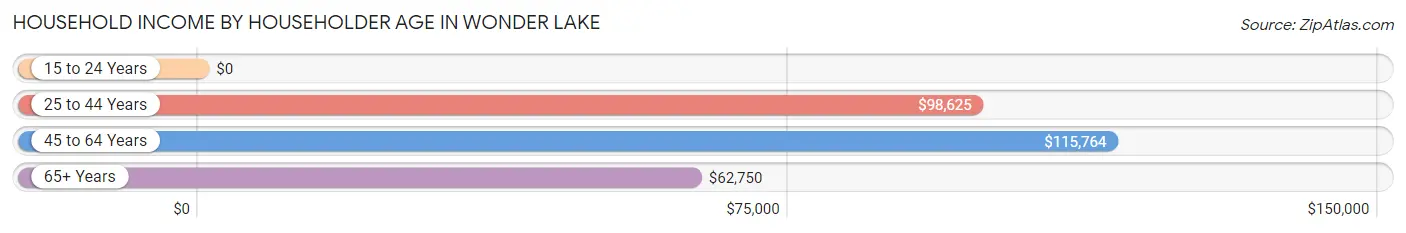
| Income Bracket | # Households | Median Income |
| 15 to 24 Years | 22 (1.5%) | $0 |
| 25 to 44 Years | 547 (37.4%) | $98,625 |
| 45 to 64 Years | 583 (39.9%) | $115,764 |
| 65+ Years | 309 (21.1%) | $62,750 |
| Total | 1,461 (100.0%) | $99,844 |
Poverty in Wonder Lake
Income Below Poverty by Sex and Age in Wonder Lake
With 3.1% poverty level for males and 6.5% for females among the residents of Wonder Lake, 16 and 17 year old males and 18 to 24 year old females are the most vulnerable to poverty, with 42 males (66.7%) and 64 females (30.8%) in their respective age groups living below the poverty level.
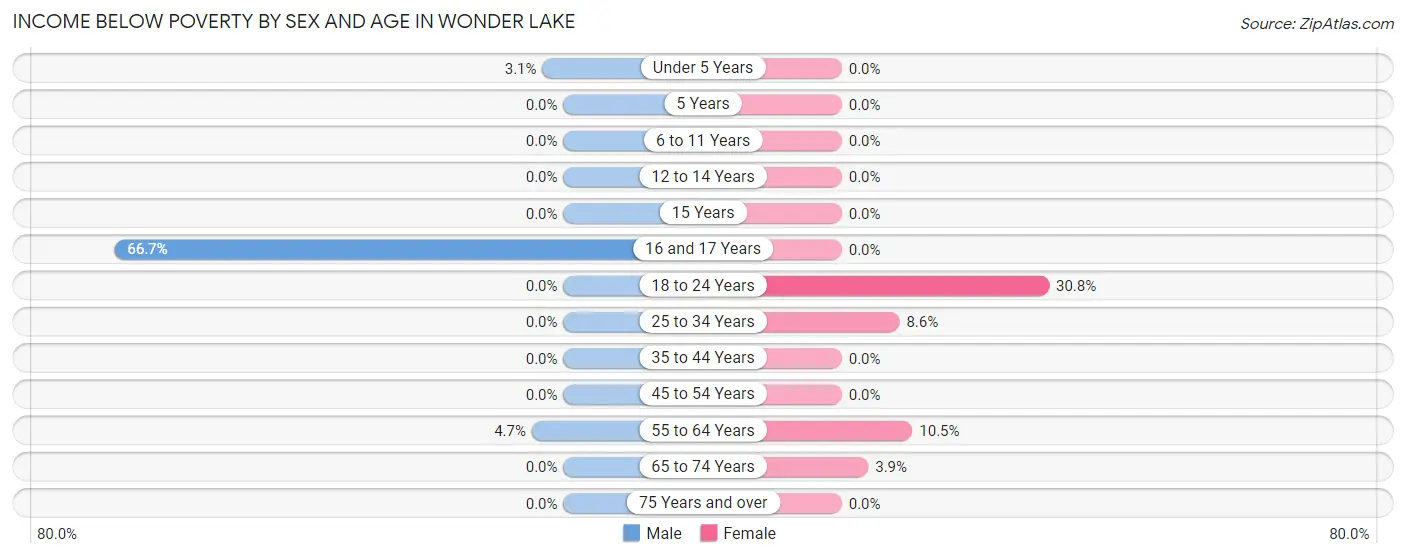
| Age Bracket | Male | Female |
| Under 5 Years | 6 (3.1%) | 0 (0.0%) |
| 5 Years | 0 (0.0%) | 0 (0.0%) |
| 6 to 11 Years | 0 (0.0%) | 0 (0.0%) |
| 12 to 14 Years | 0 (0.0%) | 0 (0.0%) |
| 15 Years | 0 (0.0%) | 0 (0.0%) |
| 16 and 17 Years | 42 (66.7%) | 0 (0.0%) |
| 18 to 24 Years | 0 (0.0%) | 64 (30.8%) |
| 25 to 34 Years | 0 (0.0%) | 21 (8.6%) |
| 35 to 44 Years | 0 (0.0%) | 0 (0.0%) |
| 45 to 54 Years | 0 (0.0%) | 0 (0.0%) |
| 55 to 64 Years | 11 (4.7%) | 26 (10.5%) |
| 65 to 74 Years | 0 (0.0%) | 11 (3.9%) |
| 75 Years and over | 0 (0.0%) | 0 (0.0%) |
| Total | 59 (3.1%) | 122 (6.5%) |
Income Above Poverty by Sex and Age in Wonder Lake
According to the poverty statistics in Wonder Lake, males aged 5 years and females aged under 5 years are the age groups that are most secure financially, with 100.0% of males and 100.0% of females in these age groups living above the poverty line.
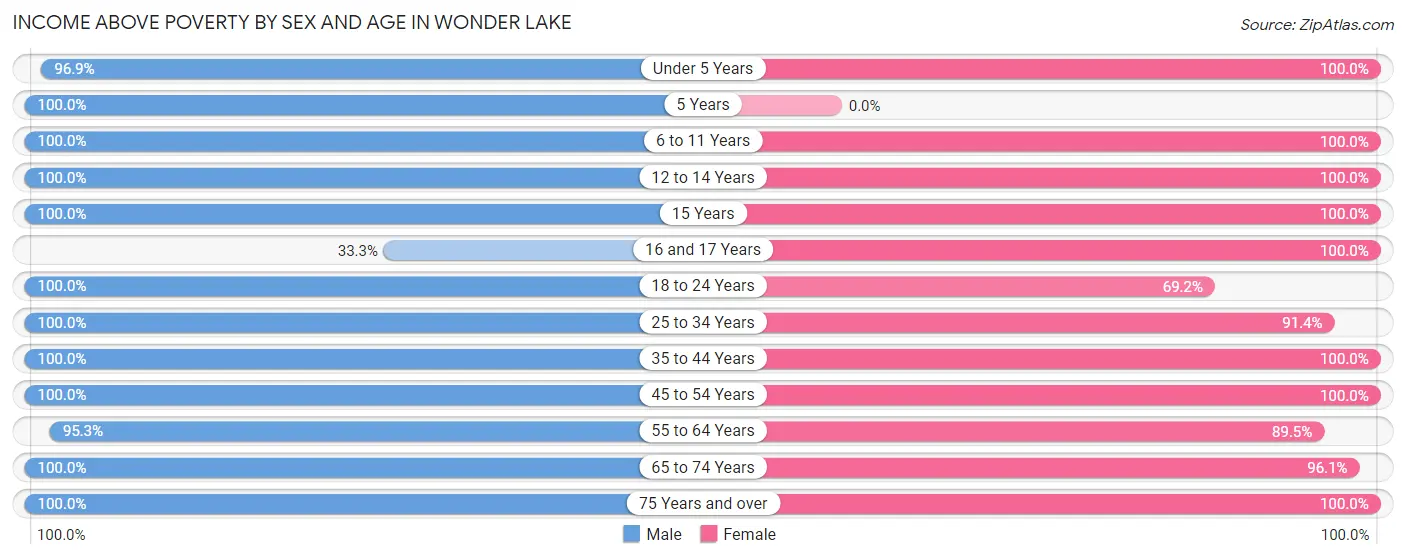
| Age Bracket | Male | Female |
| Under 5 Years | 186 (96.9%) | 36 (100.0%) |
| 5 Years | 118 (100.0%) | 0 (0.0%) |
| 6 to 11 Years | 88 (100.0%) | 285 (100.0%) |
| 12 to 14 Years | 92 (100.0%) | 29 (100.0%) |
| 15 Years | 22 (100.0%) | 38 (100.0%) |
| 16 and 17 Years | 21 (33.3%) | 49 (100.0%) |
| 18 to 24 Years | 88 (100.0%) | 144 (69.2%) |
| 25 to 34 Years | 294 (100.0%) | 224 (91.4%) |
| 35 to 44 Years | 243 (100.0%) | 198 (100.0%) |
| 45 to 54 Years | 229 (100.0%) | 250 (100.0%) |
| 55 to 64 Years | 224 (95.3%) | 222 (89.5%) |
| 65 to 74 Years | 222 (100.0%) | 269 (96.1%) |
| 75 Years and over | 42 (100.0%) | 21 (100.0%) |
| Total | 1,869 (96.9%) | 1,765 (93.5%) |
Income Below Poverty Among Married-Couple Families in Wonder Lake
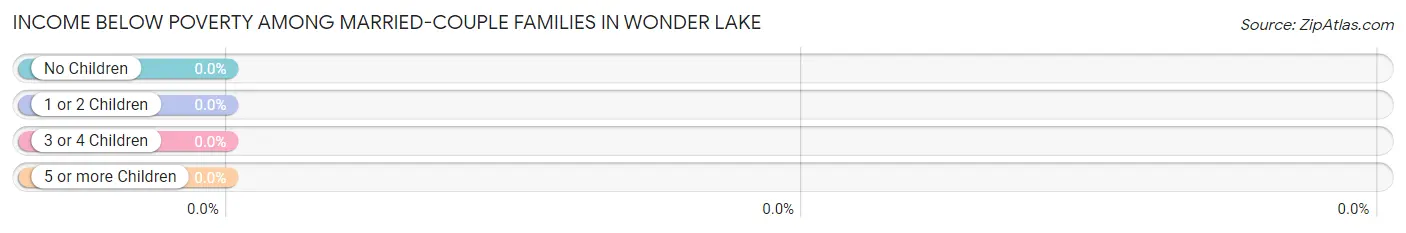
| Children | Above Poverty | Below Poverty |
| No Children | 468 (100.0%) | 0 (0.0%) |
| 1 or 2 Children | 464 (100.0%) | 0 (0.0%) |
| 3 or 4 Children | 59 (100.0%) | 0 (0.0%) |
| 5 or more Children | 0 (0.0%) | 0 (0.0%) |
| Total | 991 (100.0%) | 0 (0.0%) |
Income Below Poverty Among Single-Parent Households in Wonder Lake
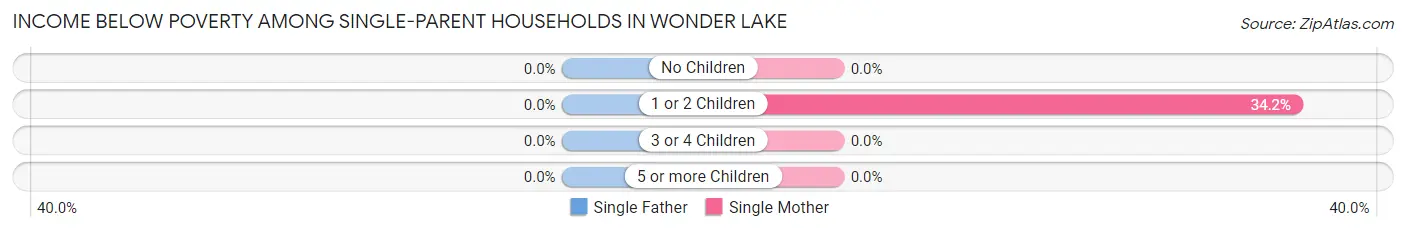
| Children | Single Father | Single Mother |
| No Children | 0 (0.0%) | 0 (0.0%) |
| 1 or 2 Children | 0 (0.0%) | 26 (34.2%) |
| 3 or 4 Children | 0 (0.0%) | 0 (0.0%) |
| 5 or more Children | 0 (0.0%) | 0 (0.0%) |
| Total | 0 (0.0%) | 26 (17.0%) |
Income Below Poverty Among Married-Couple vs Single-Parent Households in Wonder Lake
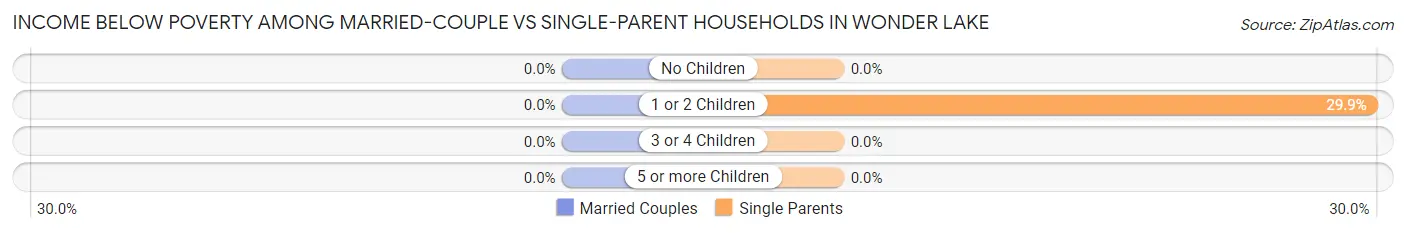
| Children | Married-Couple Families | Single-Parent Households |
| No Children | 0 (0.0%) | 0 (0.0%) |
| 1 or 2 Children | 0 (0.0%) | 26 (29.9%) |
| 3 or 4 Children | 0 (0.0%) | 0 (0.0%) |
| 5 or more Children | 0 (0.0%) | 0 (0.0%) |
| Total | 0 (0.0%) | 26 (15.3%) |
Race in Wonder Lake
The most populous races in Wonder Lake are White / Caucasian (3,133 | 81.7%), Hispanic or Latino (977 | 25.5%), and Two or more Races (470 | 12.3%).
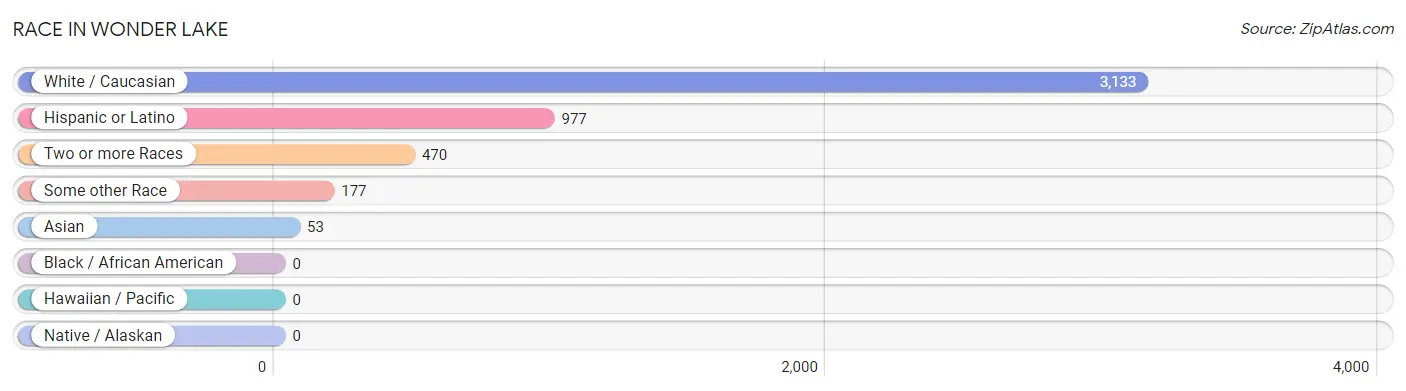
| Race | # Population | % Population |
| Asian | 53 | 1.4% |
| Black / African American | 0 | 0.0% |
| Hawaiian / Pacific | 0 | 0.0% |
| Hispanic or Latino | 977 | 25.5% |
| Native / Alaskan | 0 | 0.0% |
| White / Caucasian | 3,133 | 81.7% |
| Two or more Races | 470 | 12.3% |
| Some other Race | 177 | 4.6% |
| Total | 3,833 | 100.0% |
Ancestry in Wonder Lake
The most populous ancestries reported in Wonder Lake are German (1,565 | 40.8%), Mexican (838 | 21.9%), Irish (653 | 17.0%), English (429 | 11.2%), and Norwegian (301 | 7.9%), together accounting for 98.8% of all Wonder Lake residents.
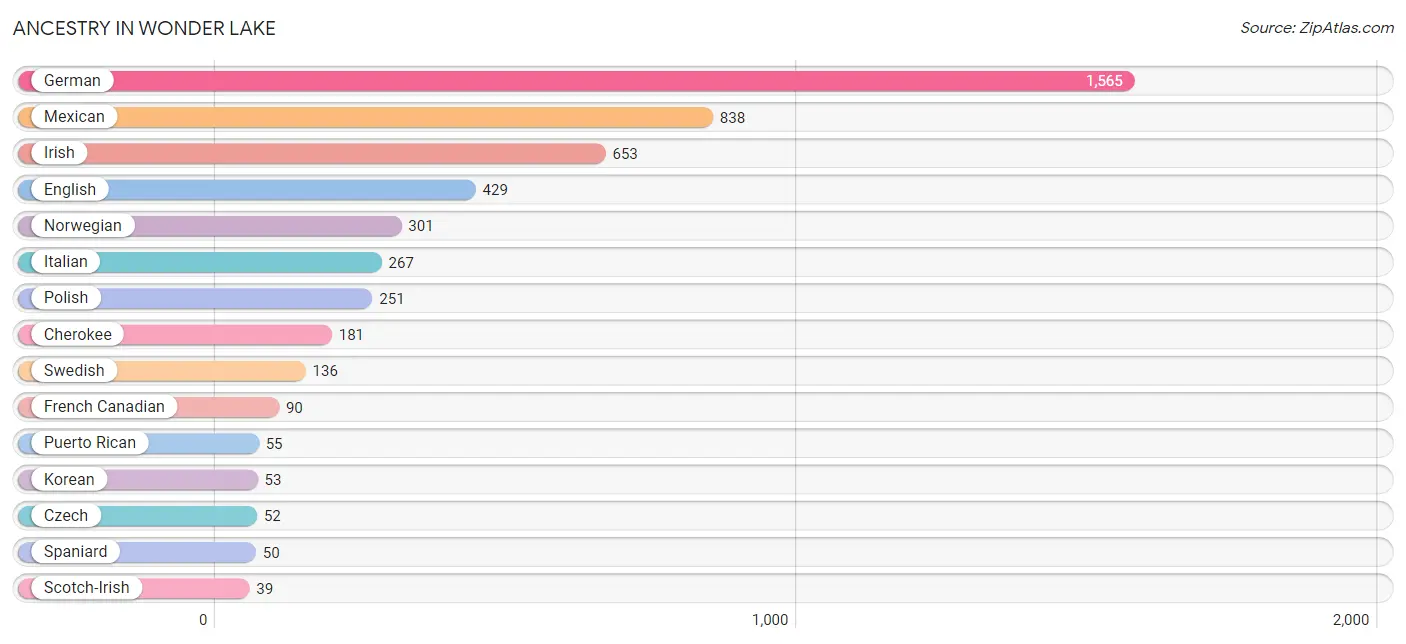
| Ancestry | # Population | % Population |
| American | 31 | 0.8% |
| Austrian | 10 | 0.3% |
| Basque | 1 | 0.0% |
| British | 18 | 0.5% |
| Cherokee | 181 | 4.7% |
| Czech | 52 | 1.4% |
| Danish | 31 | 0.8% |
| Dutch | 10 | 0.3% |
| English | 429 | 11.2% |
| European | 6 | 0.2% |
| French | 12 | 0.3% |
| French Canadian | 90 | 2.4% |
| German | 1,565 | 40.8% |
| Irish | 653 | 17.0% |
| Italian | 267 | 7.0% |
| Korean | 53 | 1.4% |
| Lithuanian | 22 | 0.6% |
| Mexican | 838 | 21.9% |
| Northern European | 6 | 0.2% |
| Norwegian | 301 | 7.9% |
| Pennsylvania German | 15 | 0.4% |
| Polish | 251 | 6.6% |
| Puerto Rican | 55 | 1.4% |
| Scotch-Irish | 39 | 1.0% |
| Scottish | 9 | 0.2% |
| Spaniard | 50 | 1.3% |
| Swedish | 136 | 3.5% |
| Swiss | 9 | 0.2% |
| Ukrainian | 23 | 0.6% | View All 29 Rows |
Immigrants in Wonder Lake
The most numerous immigrant groups reported in Wonder Lake came from Europe (41 | 1.1%), Asia (32 | 0.8%), Philippines (32 | 0.8%), South Eastern Asia (32 | 0.8%), and Eastern Europe (23 | 0.6%), together accounting for 4.2% of all Wonder Lake residents.
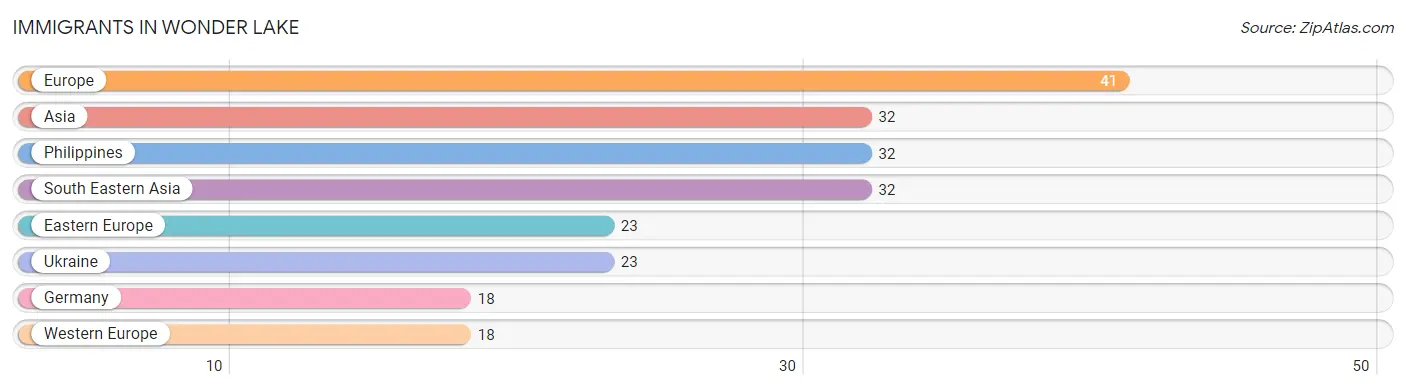
| Immigration Origin | # Population | % Population |
| Asia | 32 | 0.8% |
| Eastern Europe | 23 | 0.6% |
| Europe | 41 | 1.1% |
| Germany | 18 | 0.5% |
| Philippines | 32 | 0.8% |
| South Eastern Asia | 32 | 0.8% |
| Ukraine | 23 | 0.6% |
| Western Europe | 18 | 0.5% | View All 8 Rows |
Sex and Age in Wonder Lake
Sex and Age in Wonder Lake
The most populous age groups in Wonder Lake are 30 to 34 Years (248 | 12.8%) for men and 30 to 34 Years (191 | 10.1%) for women.
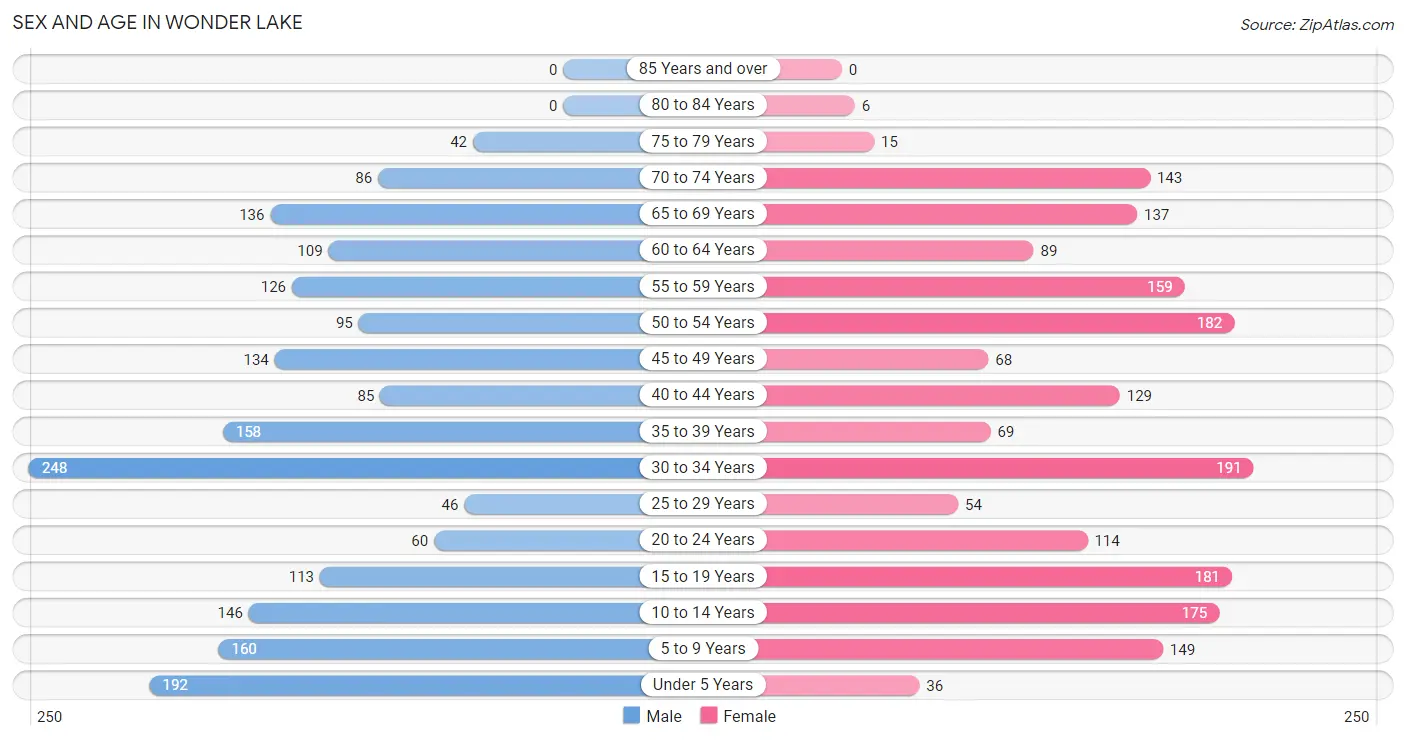
| Age Bracket | Male | Female |
| Under 5 Years | 192 (9.9%) | 36 (1.9%) |
| 5 to 9 Years | 160 (8.3%) | 149 (7.9%) |
| 10 to 14 Years | 146 (7.5%) | 175 (9.2%) |
| 15 to 19 Years | 113 (5.8%) | 181 (9.5%) |
| 20 to 24 Years | 60 (3.1%) | 114 (6.0%) |
| 25 to 29 Years | 46 (2.4%) | 54 (2.9%) |
| 30 to 34 Years | 248 (12.8%) | 191 (10.1%) |
| 35 to 39 Years | 158 (8.2%) | 69 (3.6%) |
| 40 to 44 Years | 85 (4.4%) | 129 (6.8%) |
| 45 to 49 Years | 134 (6.9%) | 68 (3.6%) |
| 50 to 54 Years | 95 (4.9%) | 182 (9.6%) |
| 55 to 59 Years | 126 (6.5%) | 159 (8.4%) |
| 60 to 64 Years | 109 (5.6%) | 89 (4.7%) |
| 65 to 69 Years | 136 (7.0%) | 137 (7.2%) |
| 70 to 74 Years | 86 (4.4%) | 143 (7.5%) |
| 75 to 79 Years | 42 (2.2%) | 15 (0.8%) |
| 80 to 84 Years | 0 (0.0%) | 6 (0.3%) |
| 85 Years and over | 0 (0.0%) | 0 (0.0%) |
| Total | 1,936 (100.0%) | 1,897 (100.0%) |
Families and Households in Wonder Lake
Median Family Size in Wonder Lake
The median family size in Wonder Lake is 2.87 persons per family, with married-couple families (991 | 85.4%) accounting for the largest median family size of 2.96 persons per family. On the other hand, single male/father families (17 | 1.5%) represent the smallest median family size with 2.29 persons per family.
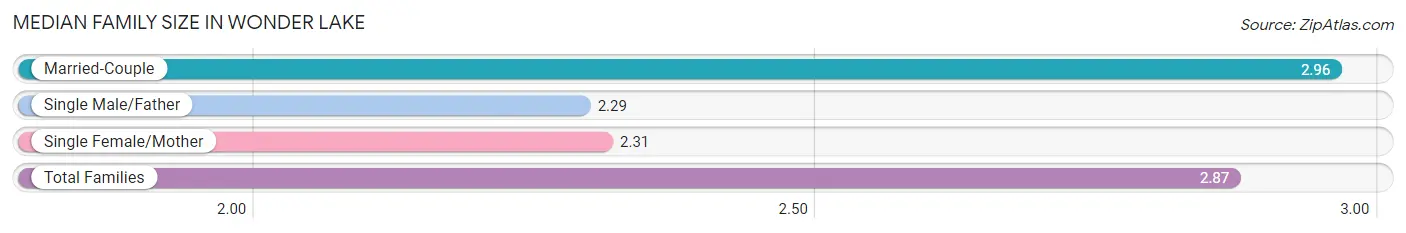
| Family Type | # Families | Family Size |
| Married-Couple | 991 (85.4%) | 2.96 |
| Single Male/Father | 17 (1.5%) | 2.29 |
| Single Female/Mother | 153 (13.2%) | 2.31 |
| Total Families | 1,161 (100.0%) | 2.87 |
Median Household Size in Wonder Lake
The median household size in Wonder Lake is 2.62 persons per household, with single male/father households (17 | 1.2%) accounting for the largest median household size of 3.88 persons per household. non-family households (300 | 20.5%) represent the smallest median household size with 1.50 persons per household.
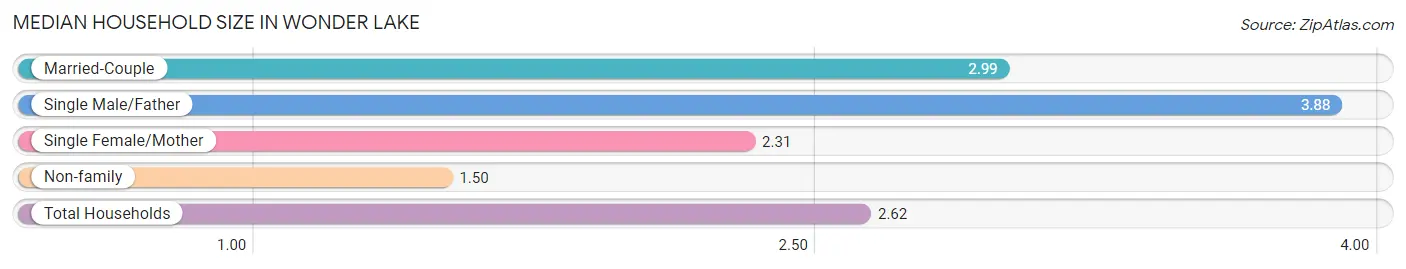
| Household Type | # Households | Household Size |
| Married-Couple | 991 (67.8%) | 2.99 |
| Single Male/Father | 17 (1.2%) | 3.88 |
| Single Female/Mother | 153 (10.5%) | 2.31 |
| Non-family | 300 (20.5%) | 1.50 |
| Total Households | 1,461 (100.0%) | 2.62 |
Household Size by Marriage Status in Wonder Lake
Out of a total of 1,461 households in Wonder Lake, 1,161 (79.5%) are family households, while 300 (20.5%) are nonfamily households. The most numerous type of family households are 2-person households, comprising 513, and the most common type of nonfamily households are 1-person households, comprising 234.
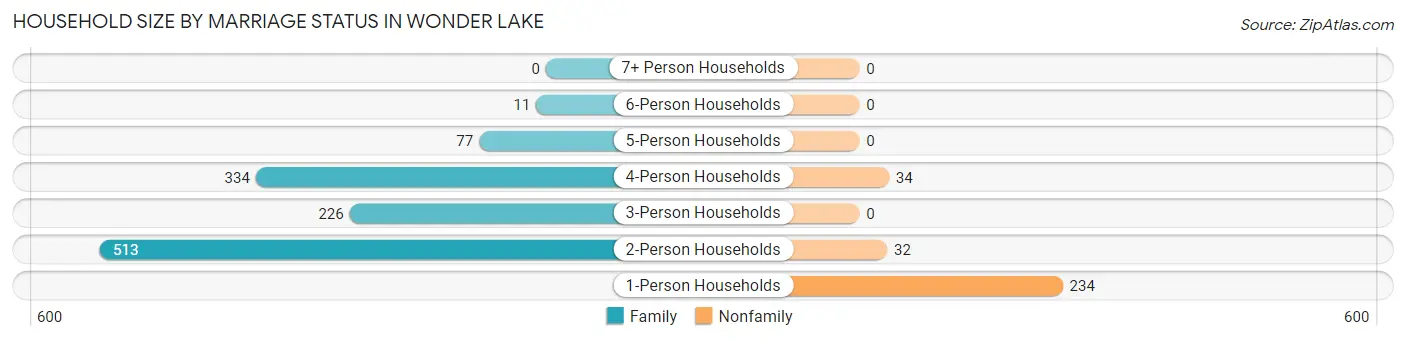
| Household Size | Family Households | Nonfamily Households |
| 1-Person Households | - | 234 (16.0%) |
| 2-Person Households | 513 (35.1%) | 32 (2.2%) |
| 3-Person Households | 226 (15.5%) | 0 (0.0%) |
| 4-Person Households | 334 (22.9%) | 34 (2.3%) |
| 5-Person Households | 77 (5.3%) | 0 (0.0%) |
| 6-Person Households | 11 (0.7%) | 0 (0.0%) |
| 7+ Person Households | 0 (0.0%) | 0 (0.0%) |
| Total | 1,161 (79.5%) | 300 (20.5%) |
Female Fertility in Wonder Lake
Fertility by Age in Wonder Lake
Average fertility rate in Wonder Lake is 99.0 births per 1,000 women. Women in the age bracket of 20 to 34 years have the highest fertility rate with 220.0 births per 1,000 women. Women in the age bracket of 20 to 34 years acount for 97.5% of all women with births.
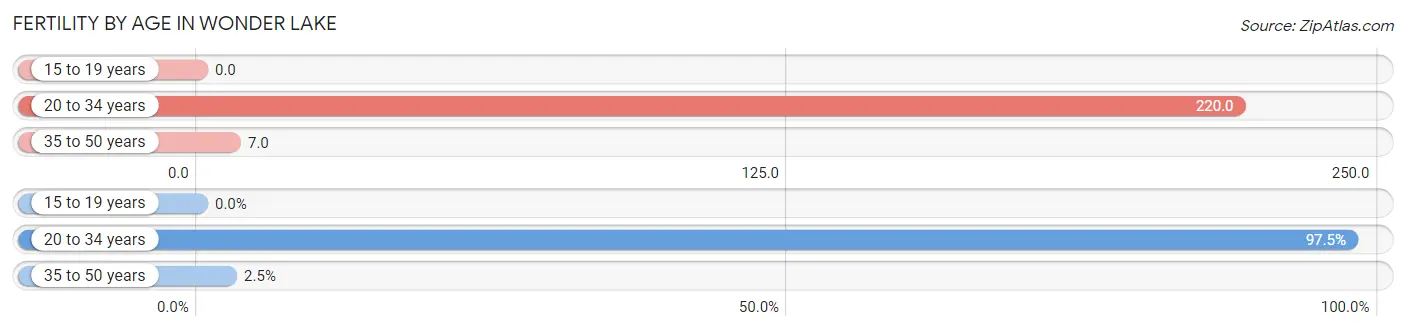
| Age Bracket | Women with Births | Births / 1,000 Women |
| 15 to 19 years | 0 (0.0%) | 0.0 |
| 20 to 34 years | 79 (97.5%) | 220.0 |
| 35 to 50 years | 2 (2.5%) | 7.0 |
| Total | 81 (100.0%) | 99.0 |
Fertility by Age by Marriage Status in Wonder Lake
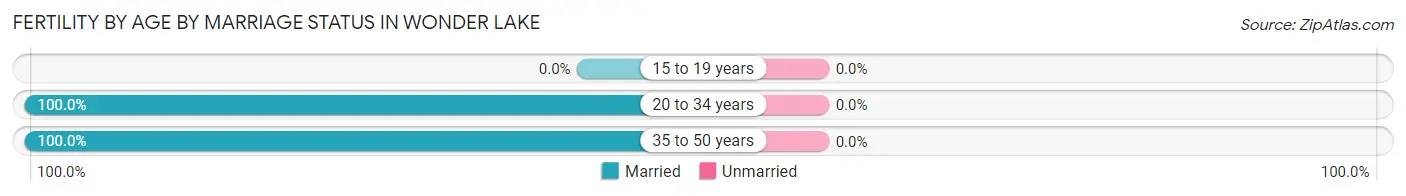
| Age Bracket | Married | Unmarried |
| 15 to 19 years | 0 (0.0%) | 0 (0.0%) |
| 20 to 34 years | 79 (100.0%) | 0 (0.0%) |
| 35 to 50 years | 2 (100.0%) | 0 (0.0%) |
| Total | 81 (100.0%) | 0 (0.0%) |
Fertility by Education in Wonder Lake
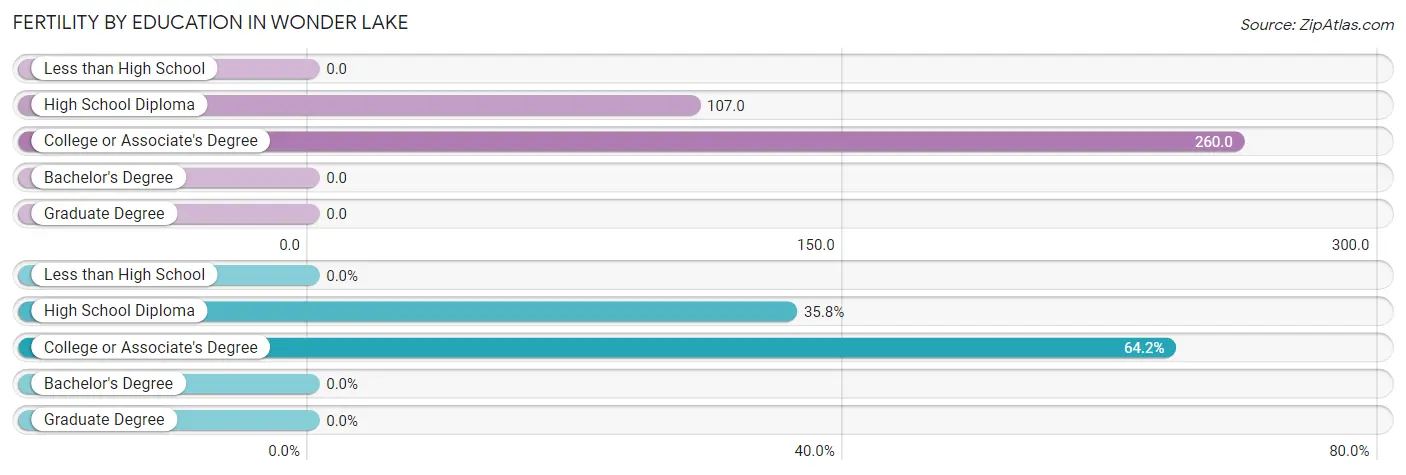
| Educational Attainment | Women with Births | Births / 1,000 Women |
| Less than High School | 0 (0.0%) | 0.0 |
| High School Diploma | 29 (35.8%) | 107.0 |
| College or Associate's Degree | 52 (64.2%) | 260.0 |
| Bachelor's Degree | 0 (0.0%) | 0.0 |
| Graduate Degree | 0 (0.0%) | 0.0 |
| Total | 81 (100.0%) | 99.0 |
Fertility by Education by Marriage Status in Wonder Lake
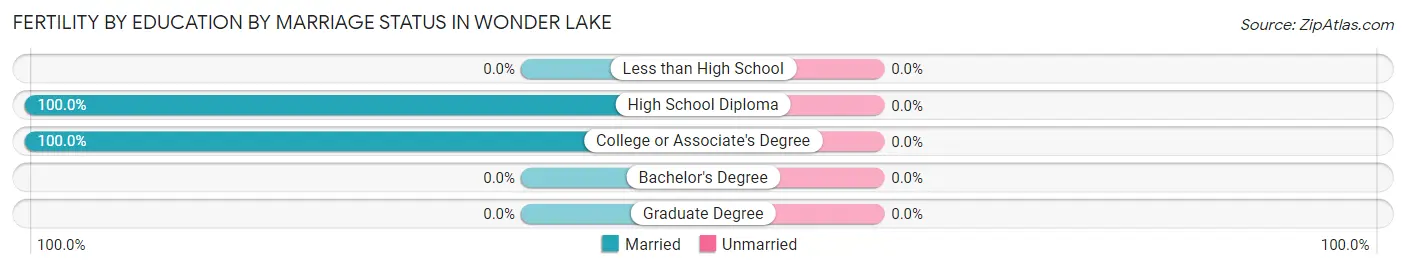
| Educational Attainment | Married | Unmarried |
| Less than High School | 0 (0.0%) | 0 (0.0%) |
| High School Diploma | 29 (100.0%) | 0 (0.0%) |
| College or Associate's Degree | 52 (100.0%) | 0 (0.0%) |
| Bachelor's Degree | 0 (0.0%) | 0 (0.0%) |
| Graduate Degree | 0 (0.0%) | 0 (0.0%) |
| Total | 81 (100.0%) | 0 (0.0%) |
Employment Characteristics in Wonder Lake
Employment by Class of Employer in Wonder Lake
Among the 1,850 employed individuals in Wonder Lake, private company employees (1,444 | 78.0%), not-for-profit organizations (192 | 10.4%), and self-employed (not incorporated) (81 | 4.4%) make up the most common classes of employment.
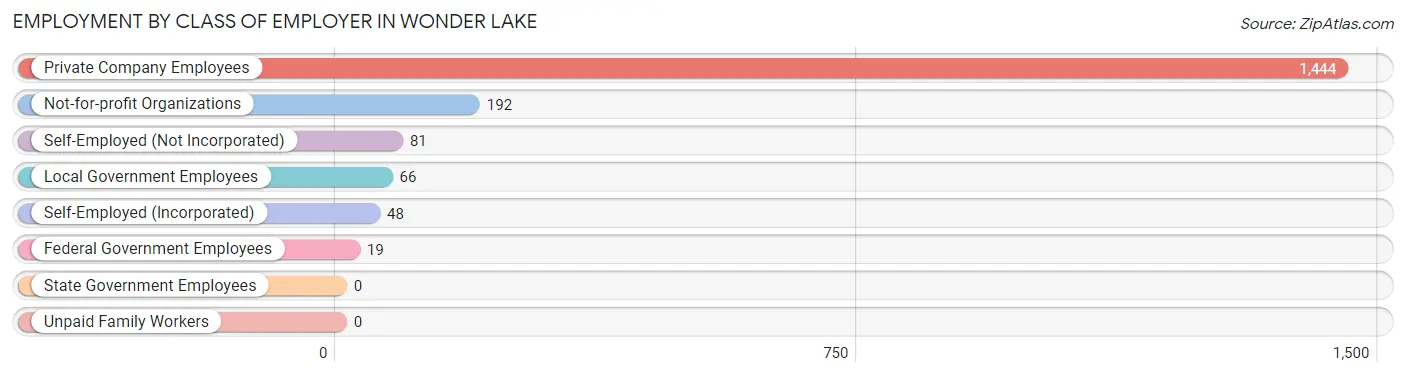
| Employer Class | # Employees | % Employees |
| Private Company Employees | 1,444 | 78.0% |
| Self-Employed (Incorporated) | 48 | 2.6% |
| Self-Employed (Not Incorporated) | 81 | 4.4% |
| Not-for-profit Organizations | 192 | 10.4% |
| Local Government Employees | 66 | 3.6% |
| State Government Employees | 0 | 0.0% |
| Federal Government Employees | 19 | 1.0% |
| Unpaid Family Workers | 0 | 0.0% |
| Total | 1,850 | 100.0% |
Employment Status by Age in Wonder Lake
According to the labor force statistics for Wonder Lake, out of the total population over 16 years of age (2,915), 69.8% or 2,035 individuals are in the labor force, with 7.5% or 153 of them unemployed. The age group with the highest labor force participation rate is 25 to 29 years, with 100.0% or 100 individuals in the labor force. Within the labor force, the 16 to 19 years age range has the highest percentage of unemployed individuals, with 27.1% or 39 of them being unemployed.
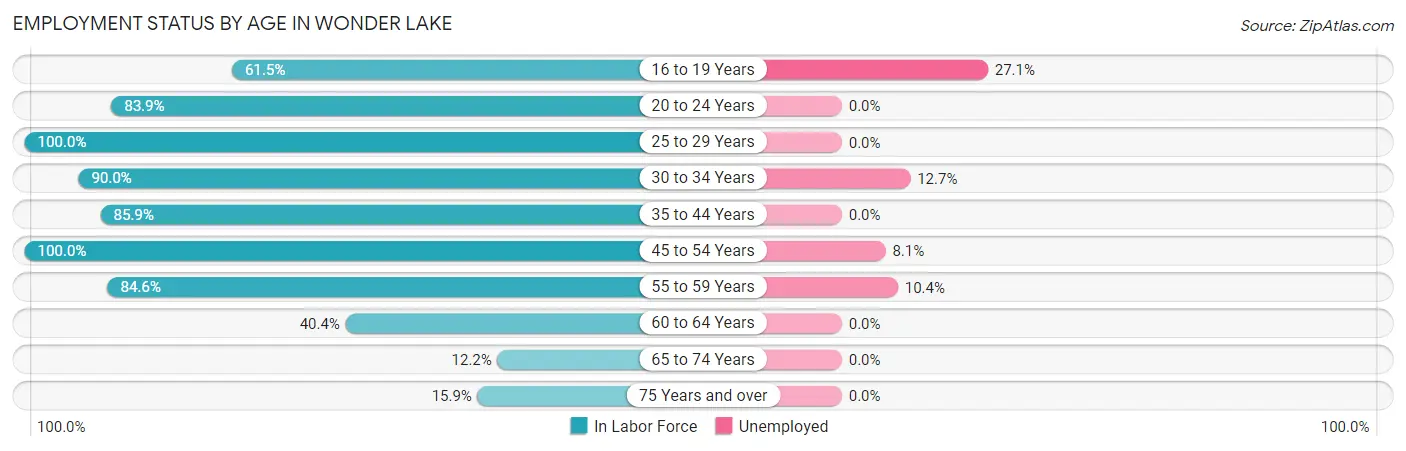
| Age Bracket | In Labor Force | Unemployed |
| 16 to 19 Years | 144 (61.5%) | 39 (27.1%) |
| 20 to 24 Years | 146 (83.9%) | 0 (0.0%) |
| 25 to 29 Years | 100 (100.0%) | 0 (0.0%) |
| 30 to 34 Years | 395 (90.0%) | 50 (12.7%) |
| 35 to 44 Years | 379 (85.9%) | 0 (0.0%) |
| 45 to 54 Years | 479 (100.0%) | 39 (8.1%) |
| 55 to 59 Years | 241 (84.6%) | 25 (10.4%) |
| 60 to 64 Years | 80 (40.4%) | 0 (0.0%) |
| 65 to 74 Years | 61 (12.2%) | 0 (0.0%) |
| 75 Years and over | 10 (15.9%) | 0 (0.0%) |
| Total | 2,035 (69.8%) | 153 (7.5%) |
Employment Status by Educational Attainment in Wonder Lake
According to labor force statistics for Wonder Lake, 86.2% of individuals (1,674) out of the total population between 25 and 64 years of age (1,942) are in the labor force, with 6.8% or 114 of them being unemployed. The group with the highest labor force participation rate are those with the educational attainment of less than high school, with 100.0% or 108 individuals in the labor force. Within the labor force, individuals with college / associate degree education have the highest percentage of unemployment, with 19.7% or 100 of them being unemployed.
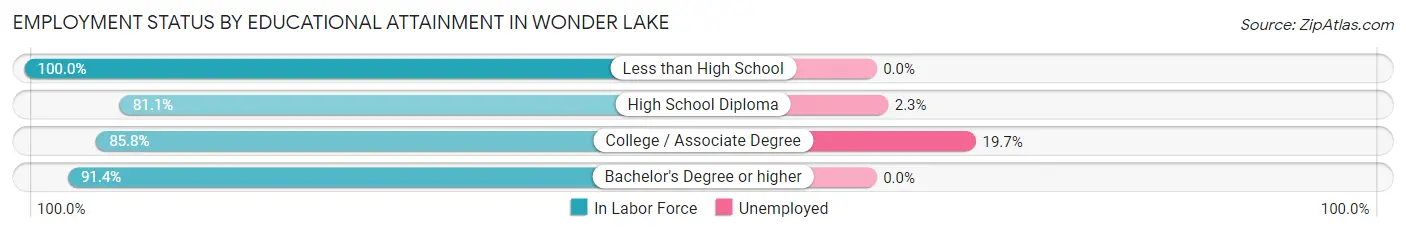
| Educational Attainment | In Labor Force | Unemployed |
| Less than High School | 108 (100.0%) | 0 (0.0%) |
| High School Diploma | 611 (81.1%) | 17 (2.3%) |
| College / Associate Degree | 508 (85.8%) | 117 (19.7%) |
| Bachelor's Degree or higher | 447 (91.4%) | 0 (0.0%) |
| Total | 1,674 (86.2%) | 132 (6.8%) |
Employment Occupations by Sex in Wonder Lake
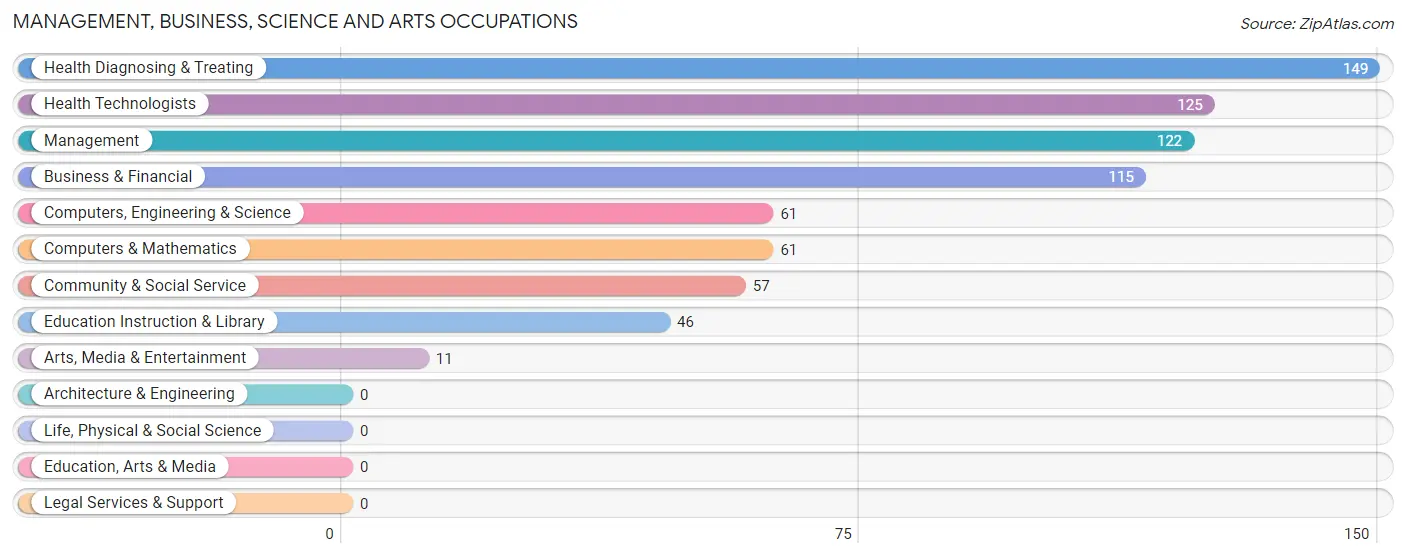
Management, Business, Science and Arts Occupations
The most common Management, Business, Science and Arts occupations in Wonder Lake are Health Diagnosing & Treating (149 | 7.9%), Health Technologists (125 | 6.6%), Management (122 | 6.5%), Business & Financial (115 | 6.1%), and Computers, Engineering & Science (61 | 3.2%).
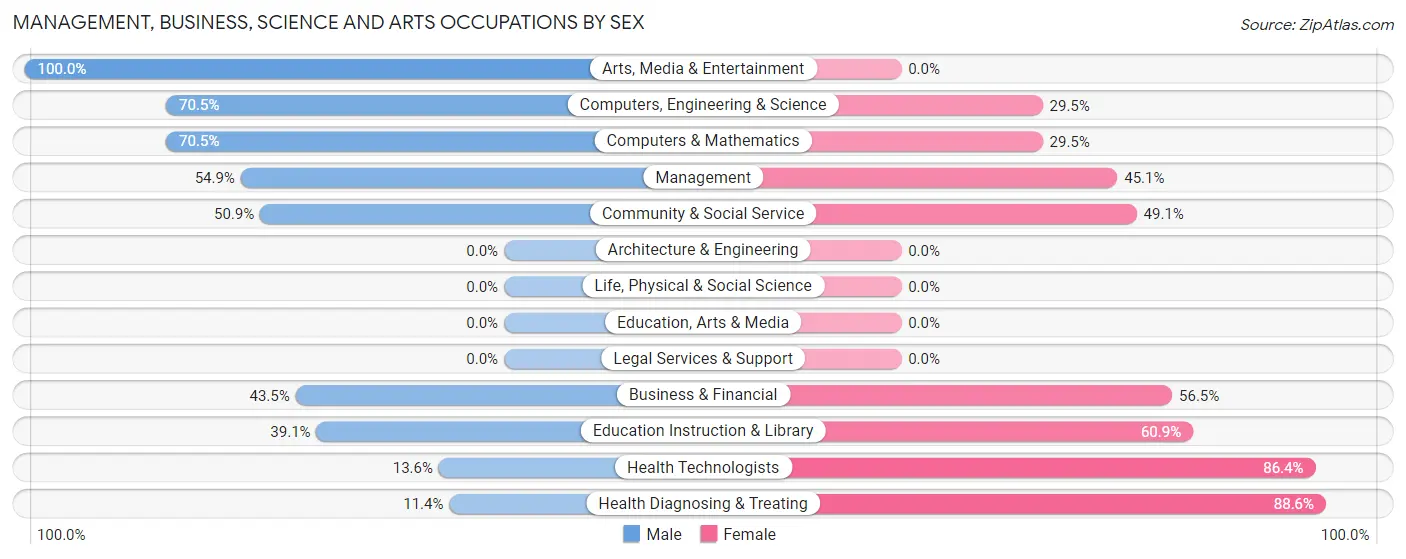
Management, Business, Science and Arts Occupations by Sex
Within the Management, Business, Science and Arts occupations in Wonder Lake, the most male-oriented occupations are Arts, Media & Entertainment (100.0%), Computers, Engineering & Science (70.5%), and Computers & Mathematics (70.5%), while the most female-oriented occupations are Health Diagnosing & Treating (88.6%), Health Technologists (86.4%), and Education Instruction & Library (60.9%).
| Occupation | Male | Female |
| Management | 67 (54.9%) | 55 (45.1%) |
| Business & Financial | 50 (43.5%) | 65 (56.5%) |
| Computers, Engineering & Science | 43 (70.5%) | 18 (29.5%) |
| Computers & Mathematics | 43 (70.5%) | 18 (29.5%) |
| Architecture & Engineering | 0 (0.0%) | 0 (0.0%) |
| Life, Physical & Social Science | 0 (0.0%) | 0 (0.0%) |
| Community & Social Service | 29 (50.9%) | 28 (49.1%) |
| Education, Arts & Media | 0 (0.0%) | 0 (0.0%) |
| Legal Services & Support | 0 (0.0%) | 0 (0.0%) |
| Education Instruction & Library | 18 (39.1%) | 28 (60.9%) |
| Arts, Media & Entertainment | 11 (100.0%) | 0 (0.0%) |
| Health Diagnosing & Treating | 17 (11.4%) | 132 (88.6%) |
| Health Technologists | 17 (13.6%) | 108 (86.4%) |
| Total (Category) | 206 (40.9%) | 298 (59.1%) |
| Total (Overall) | 978 (52.0%) | 904 (48.0%) |
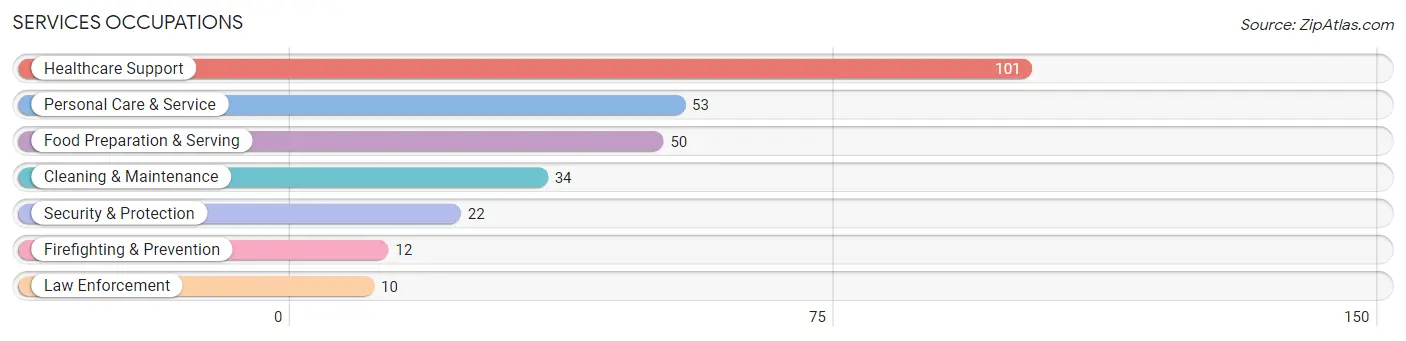
Services Occupations
The most common Services occupations in Wonder Lake are Healthcare Support (101 | 5.4%), Personal Care & Service (53 | 2.8%), Food Preparation & Serving (50 | 2.7%), Cleaning & Maintenance (34 | 1.8%), and Security & Protection (22 | 1.2%).
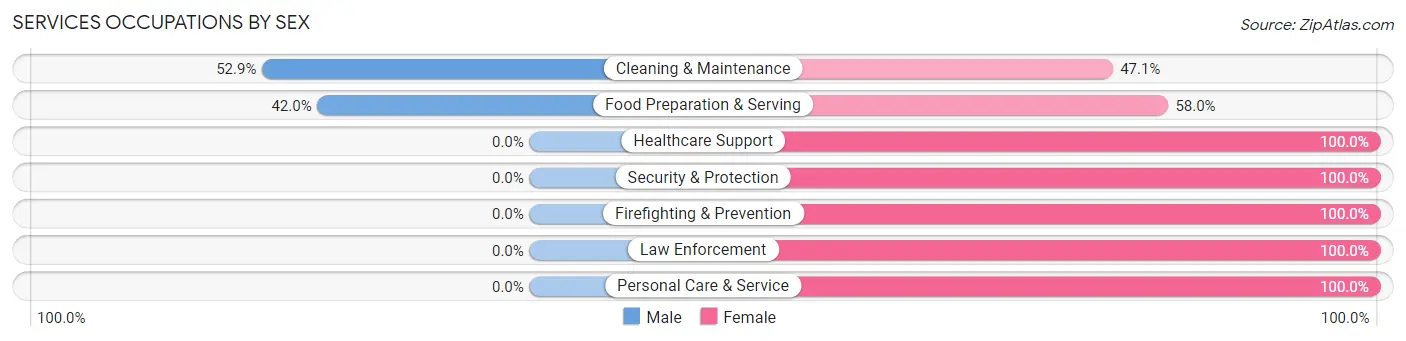
Services Occupations by Sex
Within the Services occupations in Wonder Lake, the most male-oriented occupations are Cleaning & Maintenance (52.9%), and Food Preparation & Serving (42.0%), while the most female-oriented occupations are Healthcare Support (100.0%), Security & Protection (100.0%), and Firefighting & Prevention (100.0%).
| Occupation | Male | Female |
| Healthcare Support | 0 (0.0%) | 101 (100.0%) |
| Security & Protection | 0 (0.0%) | 22 (100.0%) |
| Firefighting & Prevention | 0 (0.0%) | 12 (100.0%) |
| Law Enforcement | 0 (0.0%) | 10 (100.0%) |
| Food Preparation & Serving | 21 (42.0%) | 29 (58.0%) |
| Cleaning & Maintenance | 18 (52.9%) | 16 (47.1%) |
| Personal Care & Service | 0 (0.0%) | 53 (100.0%) |
| Total (Category) | 39 (15.0%) | 221 (85.0%) |
| Total (Overall) | 978 (52.0%) | 904 (48.0%) |
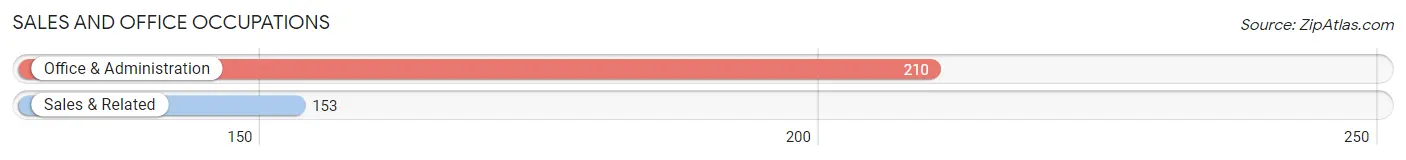
Sales and Office Occupations
The most common Sales and Office occupations in Wonder Lake are Office & Administration (210 | 11.2%), and Sales & Related (153 | 8.1%).
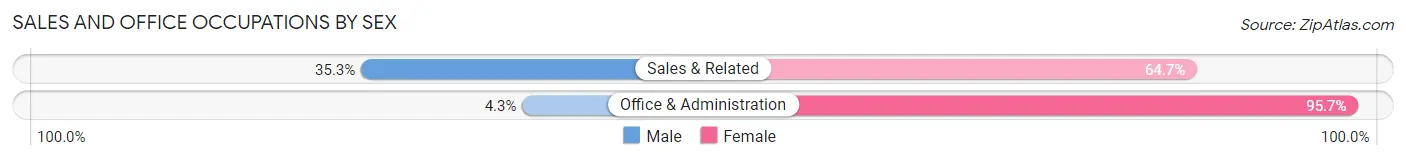
Sales and Office Occupations by Sex
| Occupation | Male | Female |
| Sales & Related | 54 (35.3%) | 99 (64.7%) |
| Office & Administration | 9 (4.3%) | 201 (95.7%) |
| Total (Category) | 63 (17.4%) | 300 (82.6%) |
| Total (Overall) | 978 (52.0%) | 904 (48.0%) |
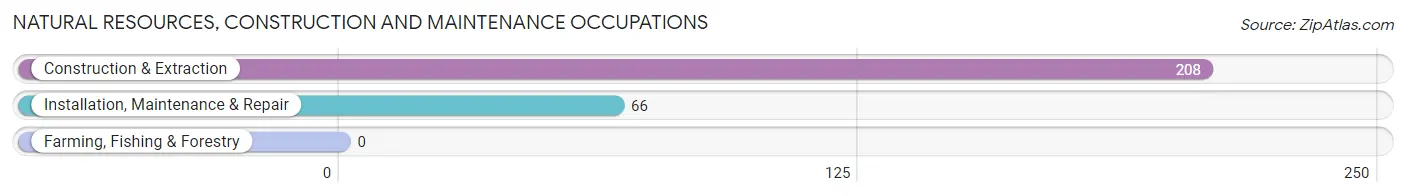
Natural Resources, Construction and Maintenance Occupations
The most common Natural Resources, Construction and Maintenance occupations in Wonder Lake are Construction & Extraction (208 | 11.1%), and Installation, Maintenance & Repair (66 | 3.5%).
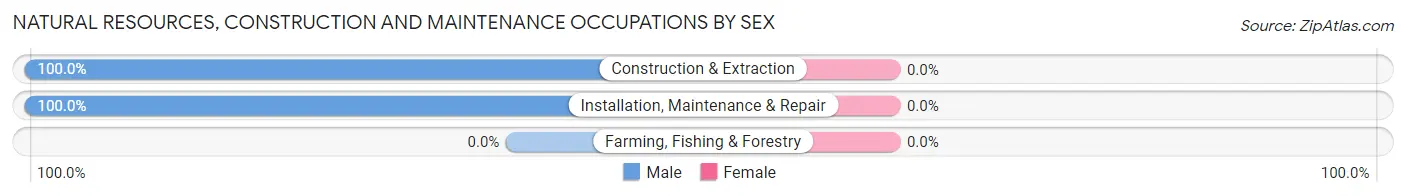
Natural Resources, Construction and Maintenance Occupations by Sex
| Occupation | Male | Female |
| Farming, Fishing & Forestry | 0 (0.0%) | 0 (0.0%) |
| Construction & Extraction | 208 (100.0%) | 0 (0.0%) |
| Installation, Maintenance & Repair | 66 (100.0%) | 0 (0.0%) |
| Total (Category) | 274 (100.0%) | 0 (0.0%) |
| Total (Overall) | 978 (52.0%) | 904 (48.0%) |
Production, Transportation and Moving Occupations
The most common Production, Transportation and Moving occupations in Wonder Lake are Production (364 | 19.3%), Transportation (65 | 3.5%), and Material Moving (52 | 2.8%).
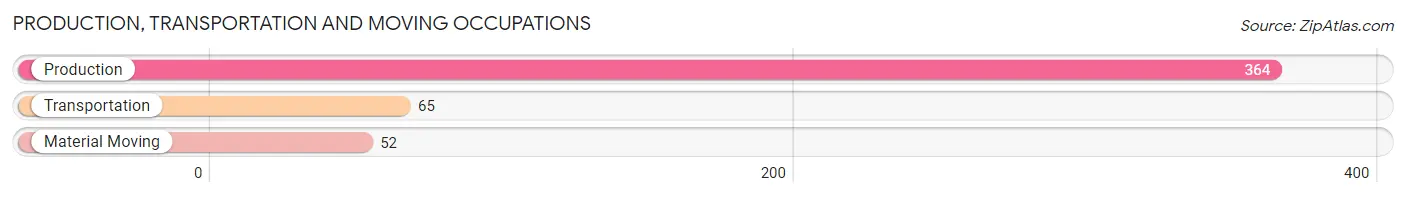
Production, Transportation and Moving Occupations by Sex
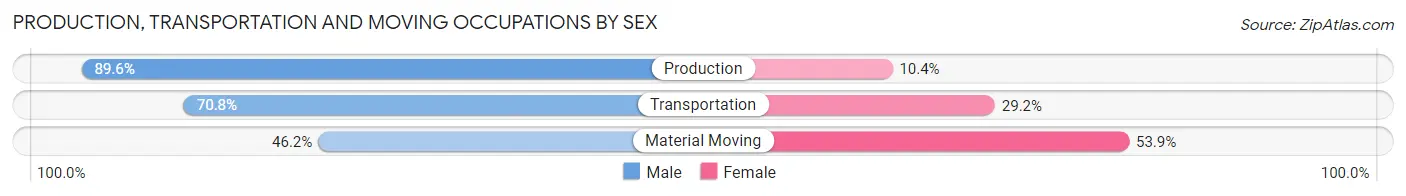
| Occupation | Male | Female |
| Production | 326 (89.6%) | 38 (10.4%) |
| Transportation | 46 (70.8%) | 19 (29.2%) |
| Material Moving | 24 (46.2%) | 28 (53.8%) |
| Total (Category) | 396 (82.3%) | 85 (17.7%) |
| Total (Overall) | 978 (52.0%) | 904 (48.0%) |
Employment Industries by Sex in Wonder Lake
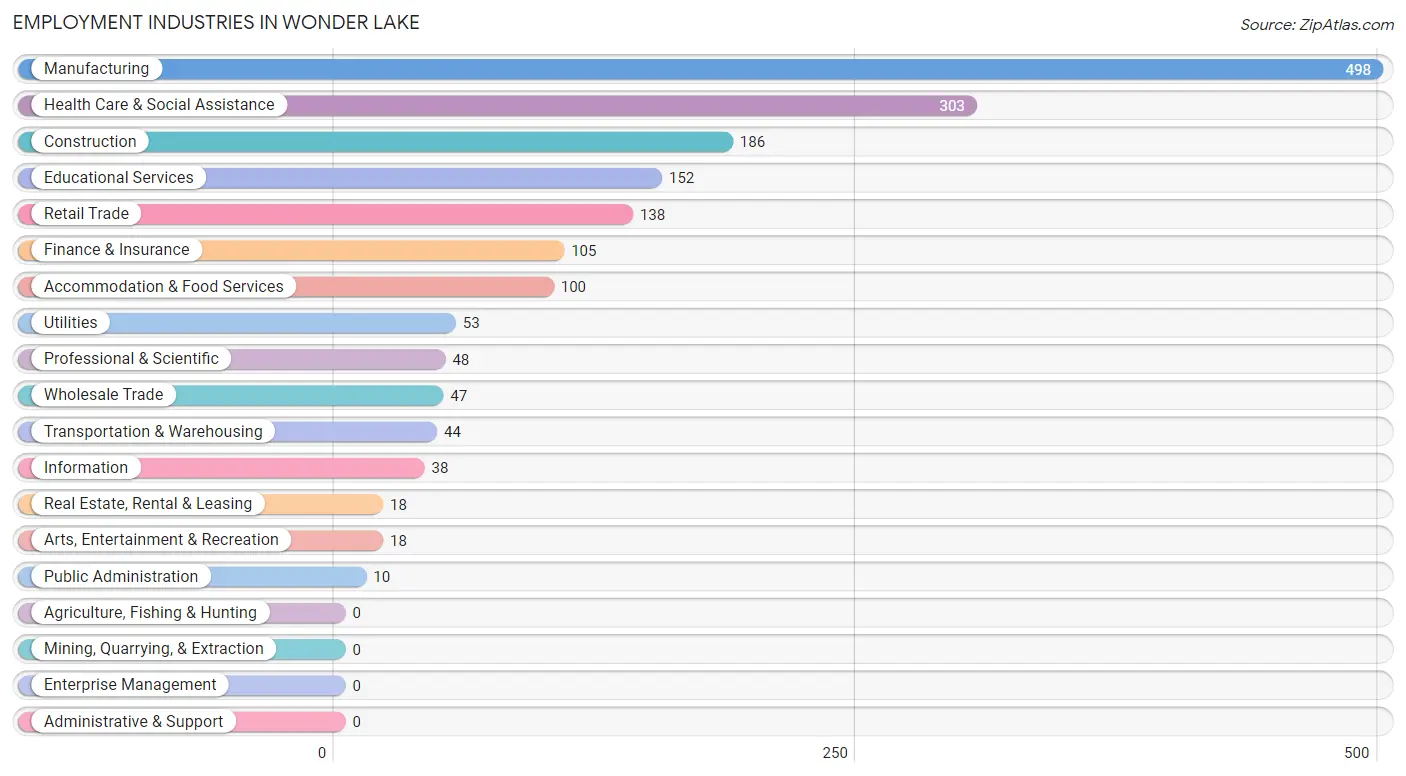
Employment Industries in Wonder Lake
The major employment industries in Wonder Lake include Manufacturing (498 | 26.5%), Health Care & Social Assistance (303 | 16.1%), Construction (186 | 9.9%), Educational Services (152 | 8.1%), and Retail Trade (138 | 7.3%).
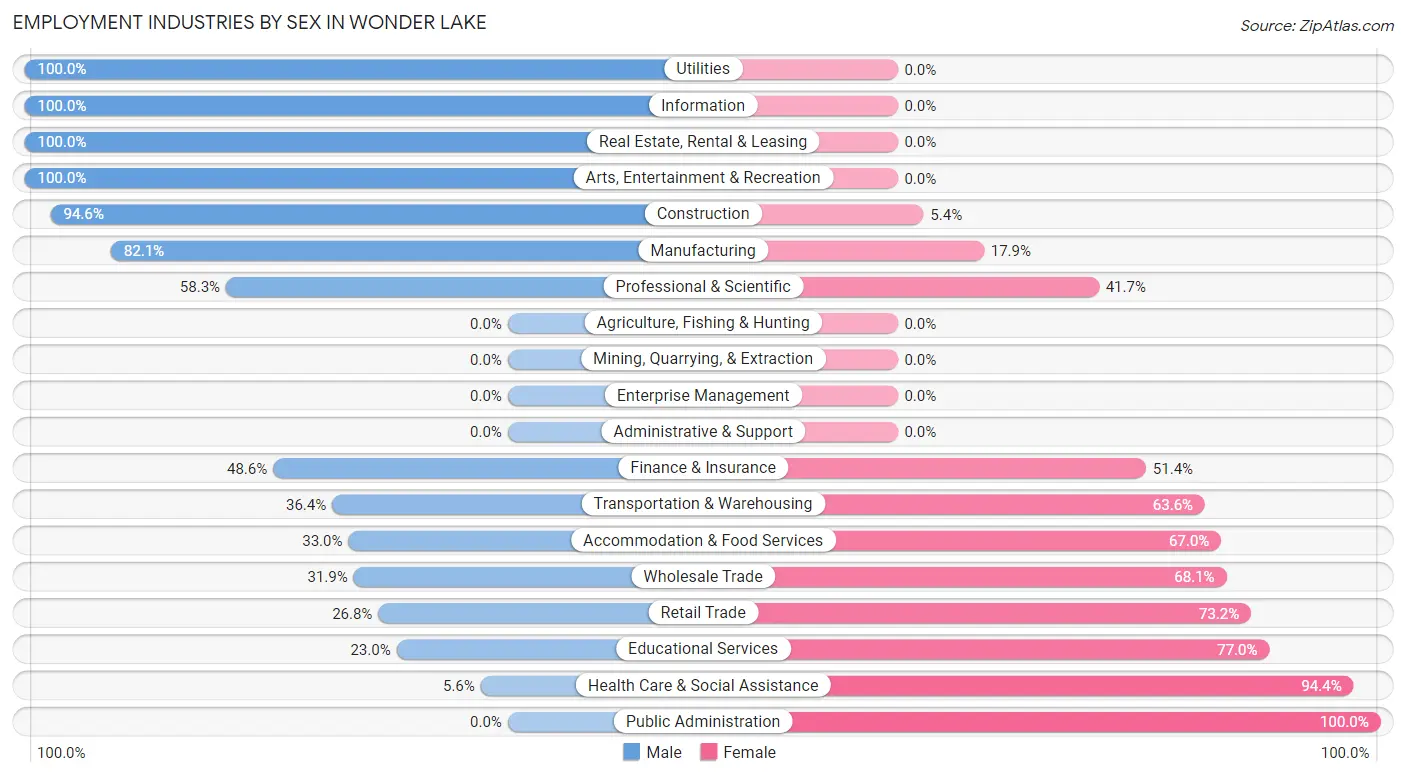
Employment Industries by Sex in Wonder Lake
The Wonder Lake industries that see more men than women are Utilities (100.0%), Information (100.0%), and Real Estate, Rental & Leasing (100.0%), whereas the industries that tend to have a higher number of women are Public Administration (100.0%), Health Care & Social Assistance (94.4%), and Educational Services (77.0%).
| Industry | Male | Female |
| Agriculture, Fishing & Hunting | 0 (0.0%) | 0 (0.0%) |
| Mining, Quarrying, & Extraction | 0 (0.0%) | 0 (0.0%) |
| Construction | 176 (94.6%) | 10 (5.4%) |
| Manufacturing | 409 (82.1%) | 89 (17.9%) |
| Wholesale Trade | 15 (31.9%) | 32 (68.1%) |
| Retail Trade | 37 (26.8%) | 101 (73.2%) |
| Transportation & Warehousing | 16 (36.4%) | 28 (63.6%) |
| Utilities | 53 (100.0%) | 0 (0.0%) |
| Information | 38 (100.0%) | 0 (0.0%) |
| Finance & Insurance | 51 (48.6%) | 54 (51.4%) |
| Real Estate, Rental & Leasing | 18 (100.0%) | 0 (0.0%) |
| Professional & Scientific | 28 (58.3%) | 20 (41.7%) |
| Enterprise Management | 0 (0.0%) | 0 (0.0%) |
| Administrative & Support | 0 (0.0%) | 0 (0.0%) |
| Educational Services | 35 (23.0%) | 117 (77.0%) |
| Health Care & Social Assistance | 17 (5.6%) | 286 (94.4%) |
| Arts, Entertainment & Recreation | 18 (100.0%) | 0 (0.0%) |
| Accommodation & Food Services | 33 (33.0%) | 67 (67.0%) |
| Public Administration | 0 (0.0%) | 10 (100.0%) |
| Total | 978 (52.0%) | 904 (48.0%) |
Education in Wonder Lake
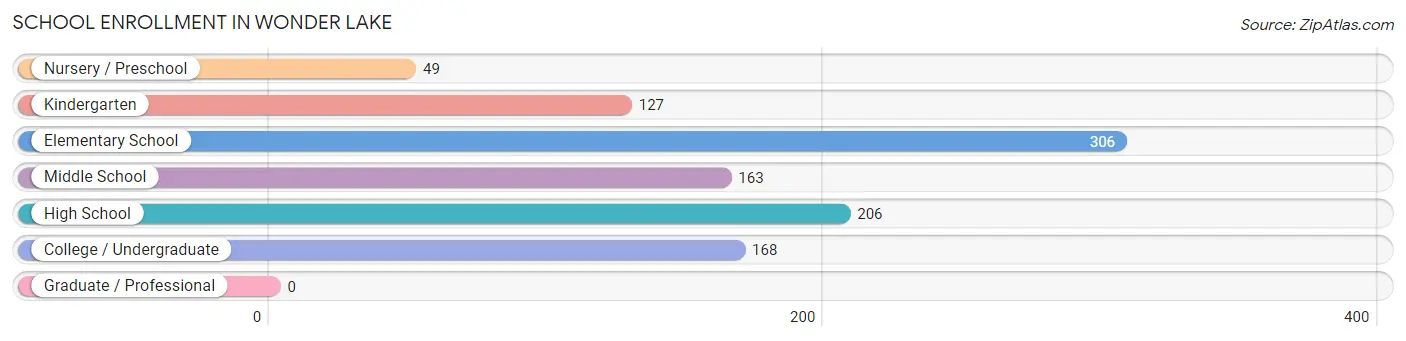
School Enrollment in Wonder Lake
The most common levels of schooling among the 1,019 students in Wonder Lake are elementary school (306 | 30.0%), high school (206 | 20.2%), and college / undergraduate (168 | 16.5%).
| School Level | # Students | % Students |
| Nursery / Preschool | 49 | 4.8% |
| Kindergarten | 127 | 12.5% |
| Elementary School | 306 | 30.0% |
| Middle School | 163 | 16.0% |
| High School | 206 | 20.2% |
| College / Undergraduate | 168 | 16.5% |
| Graduate / Professional | 0 | 0.0% |
| Total | 1,019 | 100.0% |
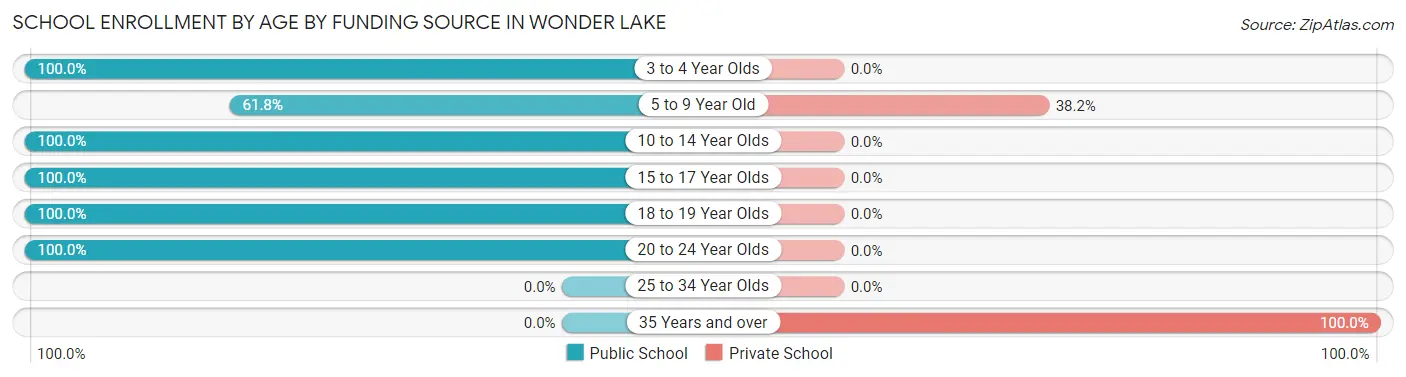
School Enrollment by Age by Funding Source in Wonder Lake
Out of a total of 1,019 students who are enrolled in schools in Wonder Lake, 137 (13.4%) attend a private institution, while the remaining 882 (86.6%) are enrolled in public schools. The age group of 35 years and over has the highest likelihood of being enrolled in private schools, with 19 (100.0% in the age bracket) enrolled. Conversely, the age group of 3 to 4 year olds has the lowest likelihood of being enrolled in a private school, with 49 (100.0% in the age bracket) attending a public institution.
| Age Bracket | Public School | Private School |
| 3 to 4 Year Olds | 49 (100.0%) | 0 (0.0%) |
| 5 to 9 Year Old | 191 (61.8%) | 118 (38.2%) |
| 10 to 14 Year Olds | 321 (100.0%) | 0 (0.0%) |
| 15 to 17 Year Olds | 172 (100.0%) | 0 (0.0%) |
| 18 to 19 Year Olds | 66 (100.0%) | 0 (0.0%) |
| 20 to 24 Year Olds | 83 (100.0%) | 0 (0.0%) |
| 25 to 34 Year Olds | 0 (0.0%) | 0 (0.0%) |
| 35 Years and over | 0 (0.0%) | 19 (100.0%) |
| Total | 882 (86.6%) | 137 (13.4%) |
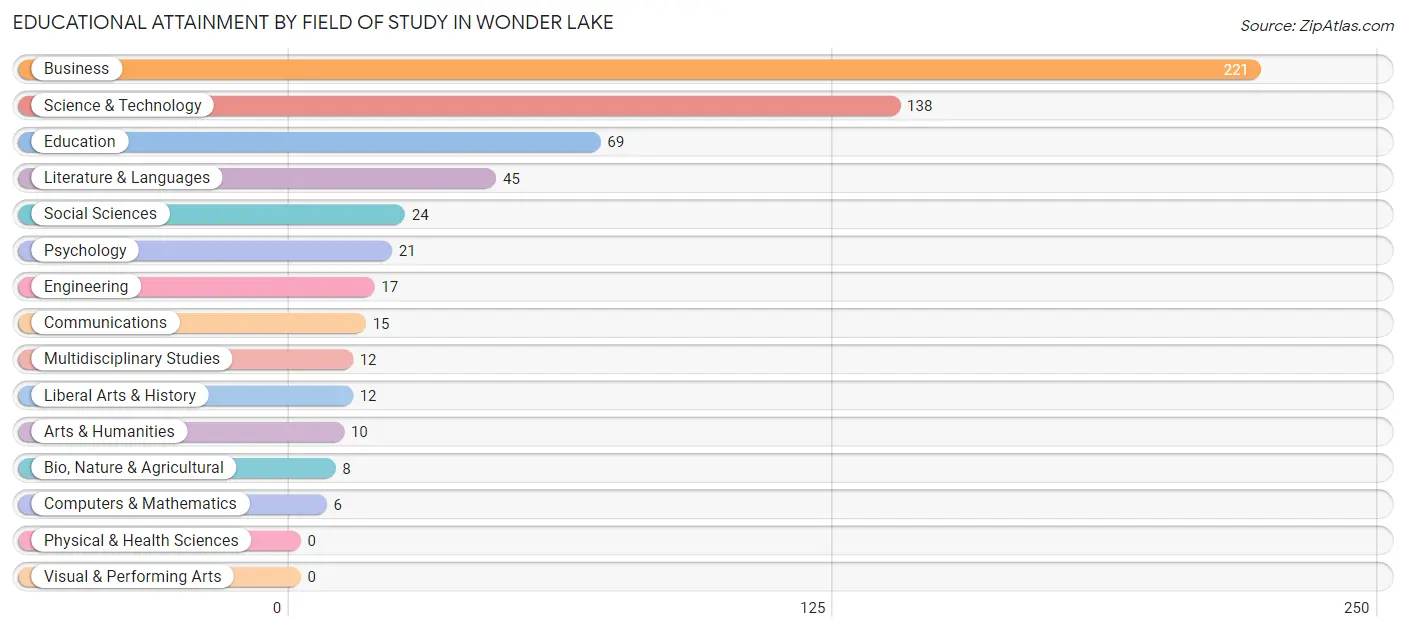
Educational Attainment by Field of Study in Wonder Lake
Business (221 | 37.0%), science & technology (138 | 23.1%), education (69 | 11.5%), literature & languages (45 | 7.5%), and social sciences (24 | 4.0%) are the most common fields of study among 598 individuals in Wonder Lake who have obtained a bachelor's degree or higher.
| Field of Study | # Graduates | % Graduates |
| Computers & Mathematics | 6 | 1.0% |
| Bio, Nature & Agricultural | 8 | 1.3% |
| Physical & Health Sciences | 0 | 0.0% |
| Psychology | 21 | 3.5% |
| Social Sciences | 24 | 4.0% |
| Engineering | 17 | 2.8% |
| Multidisciplinary Studies | 12 | 2.0% |
| Science & Technology | 138 | 23.1% |
| Business | 221 | 37.0% |
| Education | 69 | 11.5% |
| Literature & Languages | 45 | 7.5% |
| Liberal Arts & History | 12 | 2.0% |
| Visual & Performing Arts | 0 | 0.0% |
| Communications | 15 | 2.5% |
| Arts & Humanities | 10 | 1.7% |
| Total | 598 | 100.0% |
Transportation & Commute in Wonder Lake
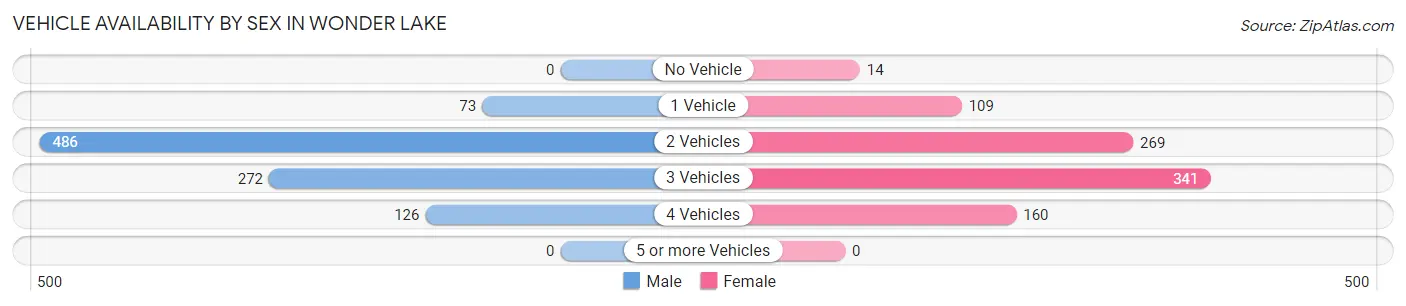
Vehicle Availability by Sex in Wonder Lake
The most prevalent vehicle ownership categories in Wonder Lake are males with 2 vehicles (486, accounting for 50.8%) and females with 2 vehicles (269, making up 54.4%).
| Vehicles Available | Male | Female |
| No Vehicle | 0 (0.0%) | 14 (1.6%) |
| 1 Vehicle | 73 (7.6%) | 109 (12.2%) |
| 2 Vehicles | 486 (50.8%) | 269 (30.1%) |
| 3 Vehicles | 272 (28.4%) | 341 (38.2%) |
| 4 Vehicles | 126 (13.2%) | 160 (17.9%) |
| 5 or more Vehicles | 0 (0.0%) | 0 (0.0%) |
| Total | 957 (100.0%) | 893 (100.0%) |
Commute Time in Wonder Lake
The most frequently occuring commute durations in Wonder Lake are 60 to 89 minutes (264 commuters, 16.0%), 20 to 24 minutes (249 commuters, 15.1%), and 15 to 19 minutes (234 commuters, 14.2%).
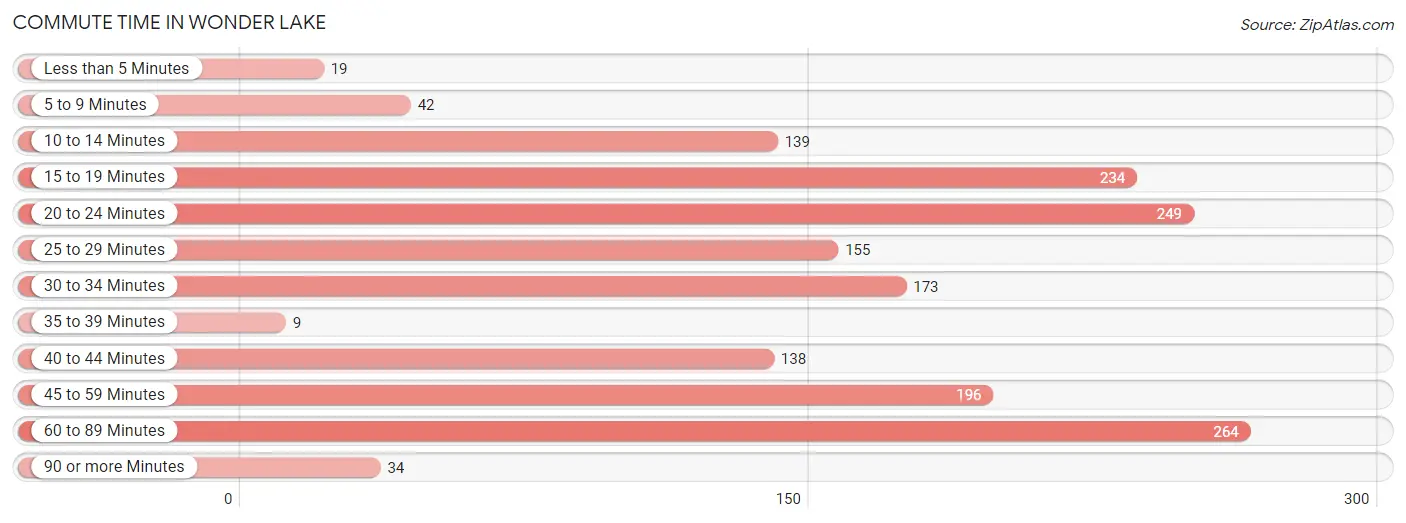
| Commute Time | # Commuters | % Commuters |
| Less than 5 Minutes | 19 | 1.1% |
| 5 to 9 Minutes | 42 | 2.5% |
| 10 to 14 Minutes | 139 | 8.4% |
| 15 to 19 Minutes | 234 | 14.2% |
| 20 to 24 Minutes | 249 | 15.1% |
| 25 to 29 Minutes | 155 | 9.4% |
| 30 to 34 Minutes | 173 | 10.5% |
| 35 to 39 Minutes | 9 | 0.5% |
| 40 to 44 Minutes | 138 | 8.4% |
| 45 to 59 Minutes | 196 | 11.9% |
| 60 to 89 Minutes | 264 | 16.0% |
| 90 or more Minutes | 34 | 2.1% |
Commute Time by Sex in Wonder Lake
The most common commute times in Wonder Lake are 60 to 89 minutes (251 commuters, 29.1%) for males and 15 to 19 minutes (171 commuters, 21.6%) for females.
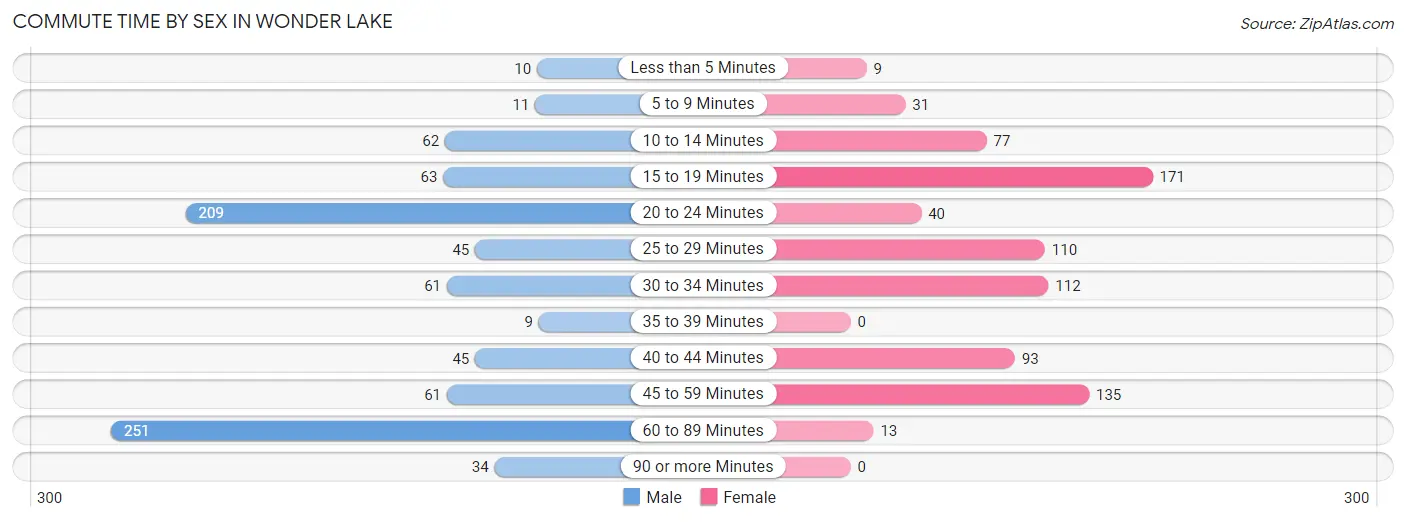
| Commute Time | Male | Female |
| Less than 5 Minutes | 10 (1.2%) | 9 (1.1%) |
| 5 to 9 Minutes | 11 (1.3%) | 31 (3.9%) |
| 10 to 14 Minutes | 62 (7.2%) | 77 (9.7%) |
| 15 to 19 Minutes | 63 (7.3%) | 171 (21.6%) |
| 20 to 24 Minutes | 209 (24.3%) | 40 (5.1%) |
| 25 to 29 Minutes | 45 (5.2%) | 110 (13.9%) |
| 30 to 34 Minutes | 61 (7.1%) | 112 (14.2%) |
| 35 to 39 Minutes | 9 (1.1%) | 0 (0.0%) |
| 40 to 44 Minutes | 45 (5.2%) | 93 (11.8%) |
| 45 to 59 Minutes | 61 (7.1%) | 135 (17.1%) |
| 60 to 89 Minutes | 251 (29.1%) | 13 (1.6%) |
| 90 or more Minutes | 34 (4.0%) | 0 (0.0%) |
Time of Departure to Work by Sex in Wonder Lake
The most frequent times of departure to work in Wonder Lake are 5:30 AM to 5:59 AM (251, 29.1%) for males and 7:30 AM to 7:59 AM (155, 19.6%) for females.
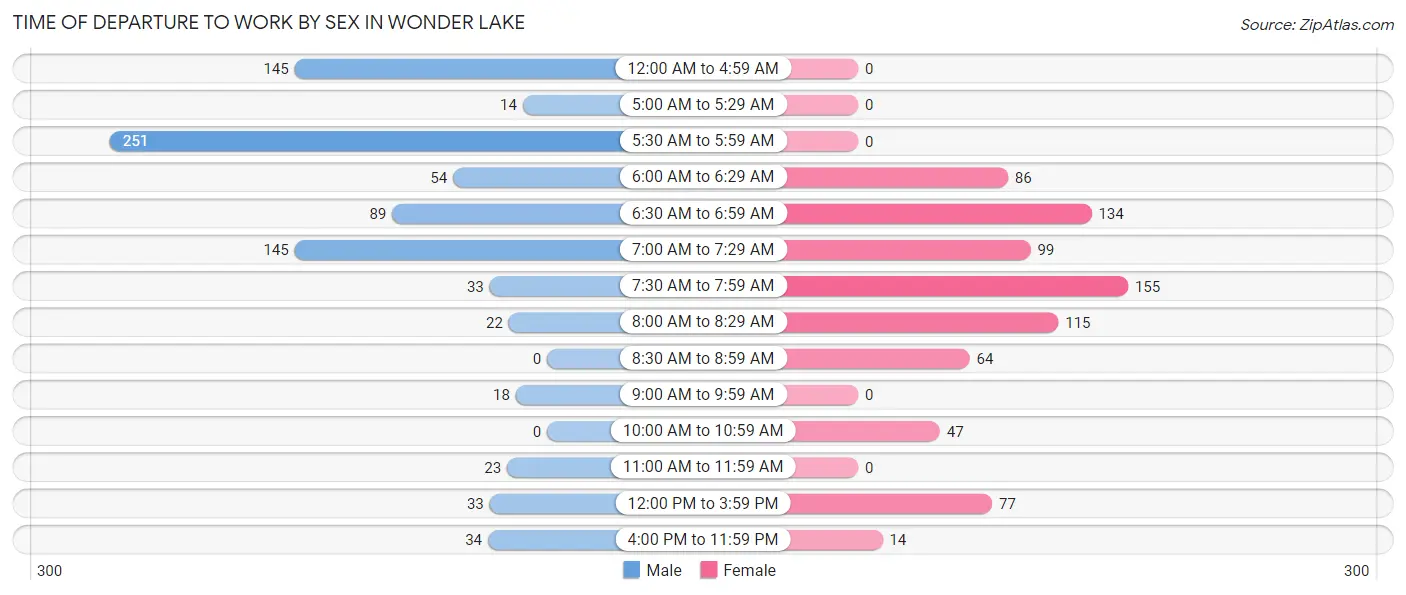
| Time of Departure | Male | Female |
| 12:00 AM to 4:59 AM | 145 (16.8%) | 0 (0.0%) |
| 5:00 AM to 5:29 AM | 14 (1.6%) | 0 (0.0%) |
| 5:30 AM to 5:59 AM | 251 (29.1%) | 0 (0.0%) |
| 6:00 AM to 6:29 AM | 54 (6.3%) | 86 (10.9%) |
| 6:30 AM to 6:59 AM | 89 (10.3%) | 134 (16.9%) |
| 7:00 AM to 7:29 AM | 145 (16.8%) | 99 (12.5%) |
| 7:30 AM to 7:59 AM | 33 (3.8%) | 155 (19.6%) |
| 8:00 AM to 8:29 AM | 22 (2.6%) | 115 (14.5%) |
| 8:30 AM to 8:59 AM | 0 (0.0%) | 64 (8.1%) |
| 9:00 AM to 9:59 AM | 18 (2.1%) | 0 (0.0%) |
| 10:00 AM to 10:59 AM | 0 (0.0%) | 47 (5.9%) |
| 11:00 AM to 11:59 AM | 23 (2.7%) | 0 (0.0%) |
| 12:00 PM to 3:59 PM | 33 (3.8%) | 77 (9.7%) |
| 4:00 PM to 11:59 PM | 34 (4.0%) | 14 (1.8%) |
| Total | 861 (100.0%) | 791 (100.0%) |
Housing Occupancy in Wonder Lake
Occupancy by Ownership in Wonder Lake
Of the total 1,461 dwellings in Wonder Lake, owner-occupied units account for 1,368 (93.6%), while renter-occupied units make up 93 (6.4%).
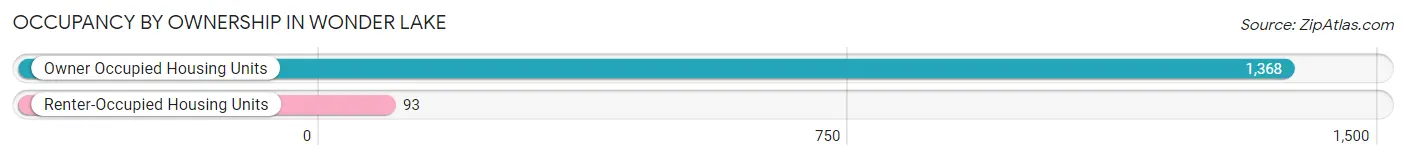
| Occupancy | # Housing Units | % Housing Units |
| Owner Occupied Housing Units | 1,368 | 93.6% |
| Renter-Occupied Housing Units | 93 | 6.4% |
| Total Occupied Housing Units | 1,461 | 100.0% |
Occupancy by Household Size in Wonder Lake
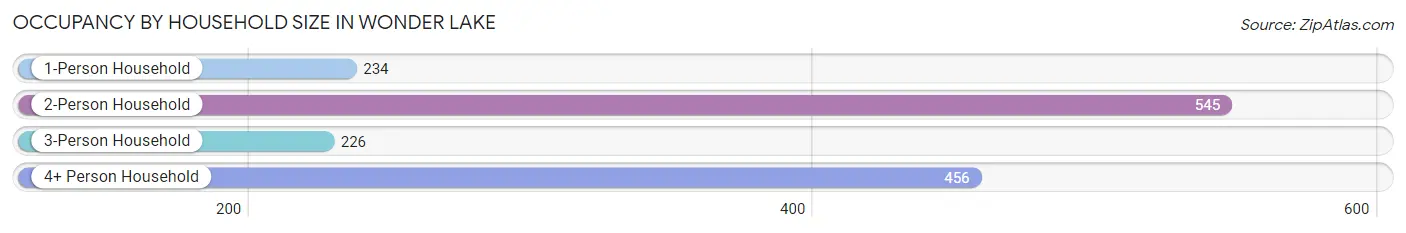
| Household Size | # Housing Units | % Housing Units |
| 1-Person Household | 234 | 16.0% |
| 2-Person Household | 545 | 37.3% |
| 3-Person Household | 226 | 15.5% |
| 4+ Person Household | 456 | 31.2% |
| Total Housing Units | 1,461 | 100.0% |
Occupancy by Ownership by Household Size in Wonder Lake
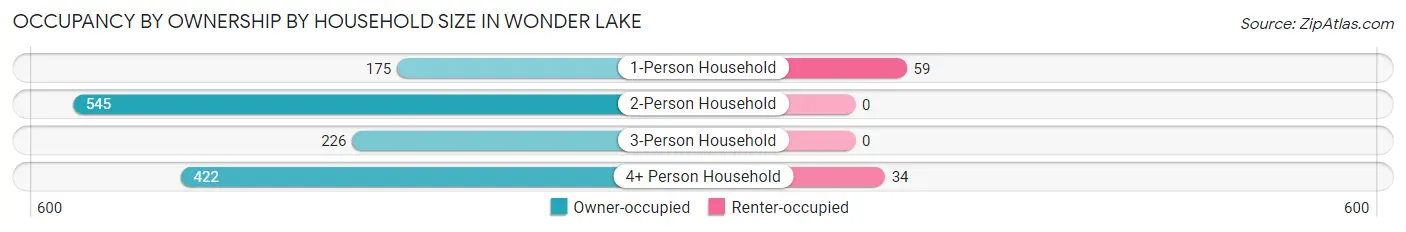
| Household Size | Owner-occupied | Renter-occupied |
| 1-Person Household | 175 (74.8%) | 59 (25.2%) |
| 2-Person Household | 545 (100.0%) | 0 (0.0%) |
| 3-Person Household | 226 (100.0%) | 0 (0.0%) |
| 4+ Person Household | 422 (92.5%) | 34 (7.5%) |
| Total Housing Units | 1,368 (93.6%) | 93 (6.4%) |
Occupancy by Educational Attainment in Wonder Lake
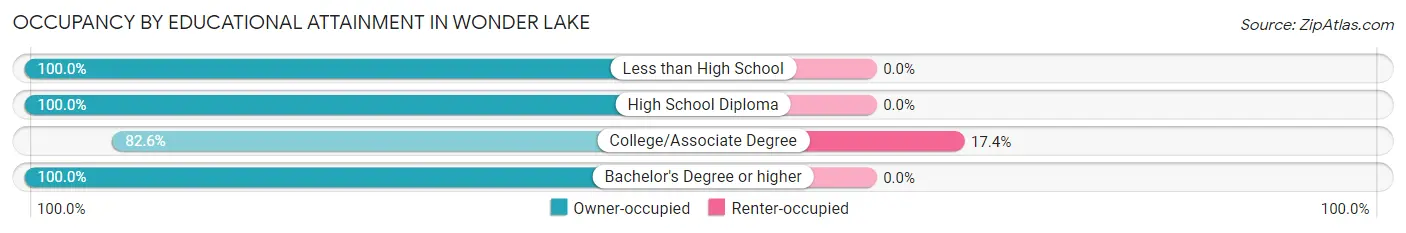
| Household Size | Owner-occupied | Renter-occupied |
| Less than High School | 114 (100.0%) | 0 (0.0%) |
| High School Diploma | 452 (100.0%) | 0 (0.0%) |
| College/Associate Degree | 441 (82.6%) | 93 (17.4%) |
| Bachelor's Degree or higher | 361 (100.0%) | 0 (0.0%) |
Occupancy by Age of Householder in Wonder Lake
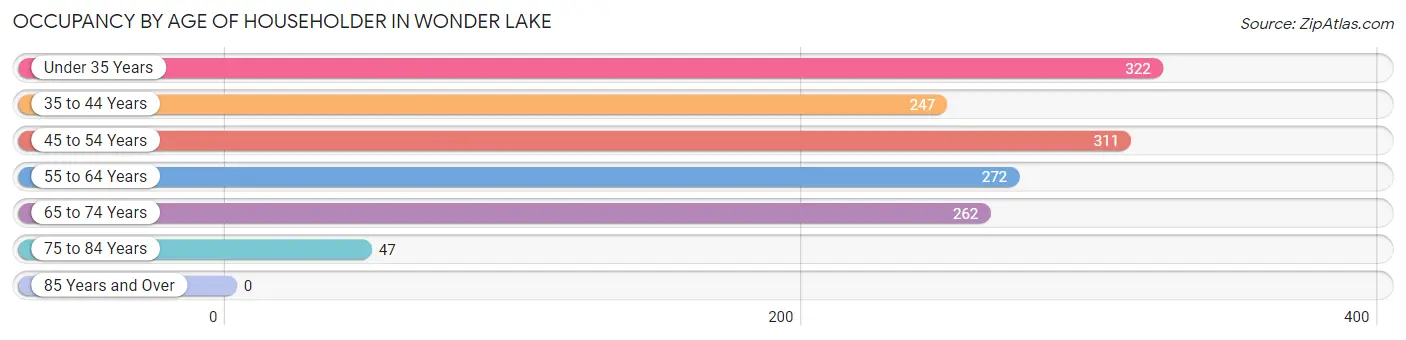
| Age Bracket | # Households | % Households |
| Under 35 Years | 322 | 22.0% |
| 35 to 44 Years | 247 | 16.9% |
| 45 to 54 Years | 311 | 21.3% |
| 55 to 64 Years | 272 | 18.6% |
| 65 to 74 Years | 262 | 17.9% |
| 75 to 84 Years | 47 | 3.2% |
| 85 Years and Over | 0 | 0.0% |
| Total | 1,461 | 100.0% |
Housing Finances in Wonder Lake
Median Income by Occupancy in Wonder Lake
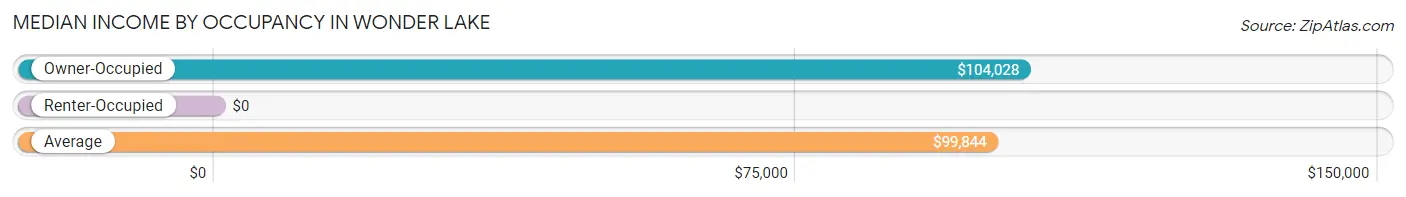
| Occupancy Type | # Households | Median Income |
| Owner-Occupied | 1,368 (93.6%) | $104,028 |
| Renter-Occupied | 93 (6.4%) | $0 |
| Average | 1,461 (100.0%) | $99,844 |
Occupancy by Householder Income Bracket in Wonder Lake
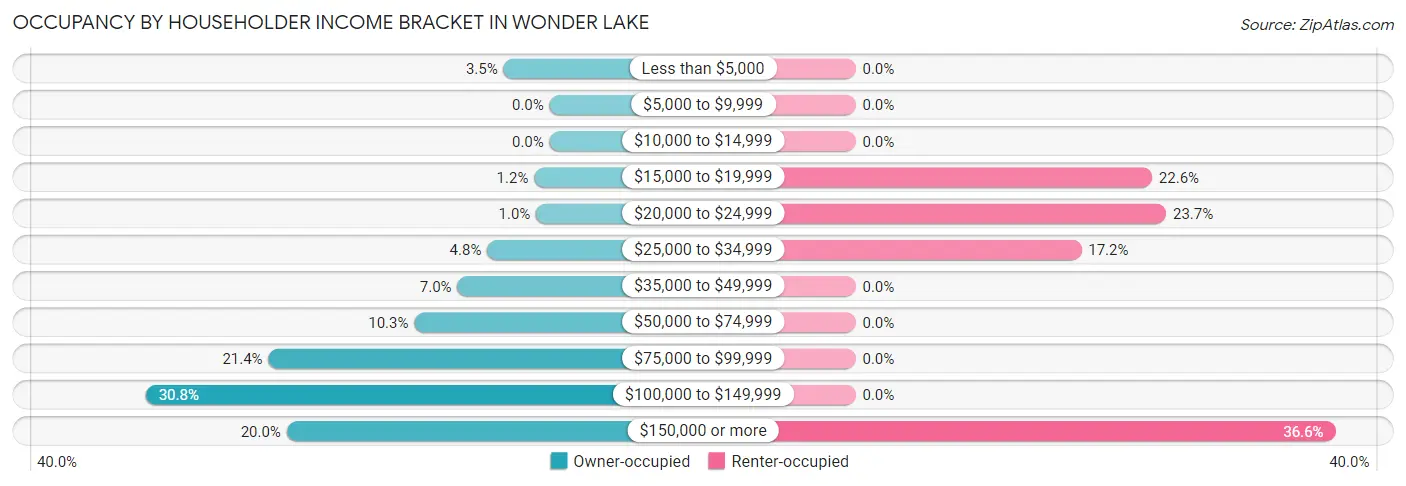
| Income Bracket | Owner-occupied | Renter-occupied |
| Less than $5,000 | 48 (3.5%) | 0 (0.0%) |
| $5,000 to $9,999 | 0 (0.0%) | 0 (0.0%) |
| $10,000 to $14,999 | 0 (0.0%) | 0 (0.0%) |
| $15,000 to $19,999 | 16 (1.2%) | 21 (22.6%) |
| $20,000 to $24,999 | 14 (1.0%) | 22 (23.7%) |
| $25,000 to $34,999 | 65 (4.8%) | 16 (17.2%) |
| $35,000 to $49,999 | 96 (7.0%) | 0 (0.0%) |
| $50,000 to $74,999 | 141 (10.3%) | 0 (0.0%) |
| $75,000 to $99,999 | 293 (21.4%) | 0 (0.0%) |
| $100,000 to $149,999 | 421 (30.8%) | 0 (0.0%) |
| $150,000 or more | 274 (20.0%) | 34 (36.6%) |
| Total | 1,368 (100.0%) | 93 (100.0%) |
Monthly Housing Cost Tiers in Wonder Lake
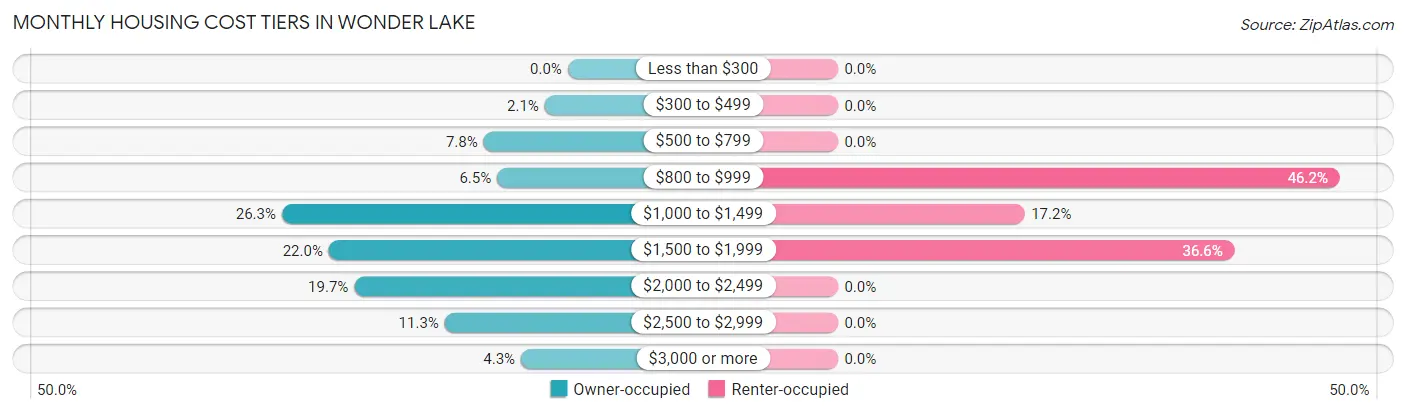
| Monthly Cost | Owner-occupied | Renter-occupied |
| Less than $300 | 0 (0.0%) | 0 (0.0%) |
| $300 to $499 | 29 (2.1%) | 0 (0.0%) |
| $500 to $799 | 106 (7.7%) | 0 (0.0%) |
| $800 to $999 | 89 (6.5%) | 43 (46.2%) |
| $1,000 to $1,499 | 360 (26.3%) | 16 (17.2%) |
| $1,500 to $1,999 | 301 (22.0%) | 34 (36.6%) |
| $2,000 to $2,499 | 269 (19.7%) | 0 (0.0%) |
| $2,500 to $2,999 | 155 (11.3%) | 0 (0.0%) |
| $3,000 or more | 59 (4.3%) | 0 (0.0%) |
| Total | 1,368 (100.0%) | 93 (100.0%) |
Physical Housing Characteristics in Wonder Lake
Housing Structures in Wonder Lake
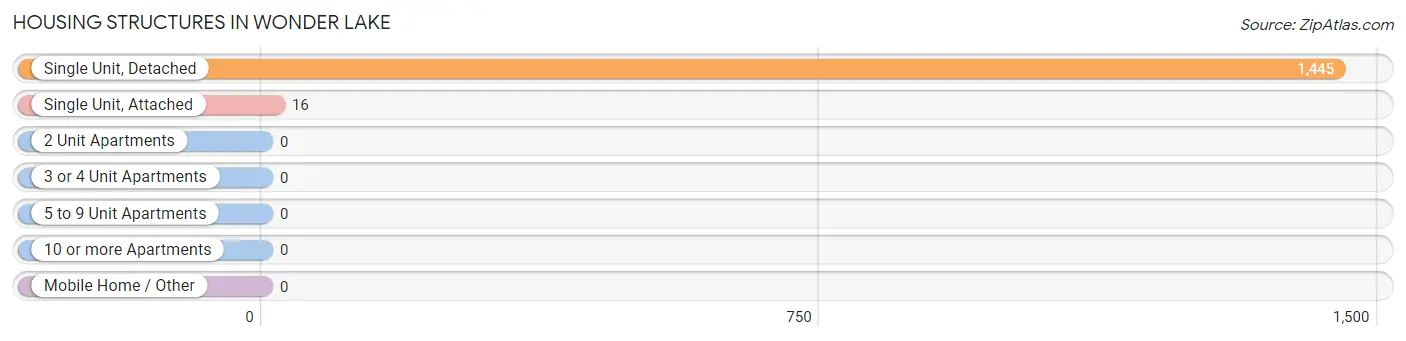
| Structure Type | # Housing Units | % Housing Units |
| Single Unit, Detached | 1,445 | 98.9% |
| Single Unit, Attached | 16 | 1.1% |
| 2 Unit Apartments | 0 | 0.0% |
| 3 or 4 Unit Apartments | 0 | 0.0% |
| 5 to 9 Unit Apartments | 0 | 0.0% |
| 10 or more Apartments | 0 | 0.0% |
| Mobile Home / Other | 0 | 0.0% |
| Total | 1,461 | 100.0% |
Housing Structures by Occupancy in Wonder Lake
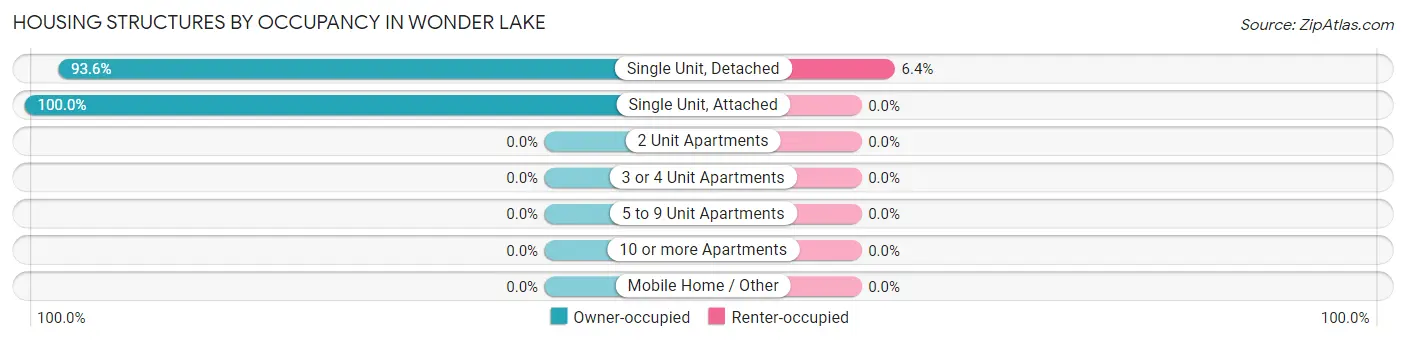
| Structure Type | Owner-occupied | Renter-occupied |
| Single Unit, Detached | 1,352 (93.6%) | 93 (6.4%) |
| Single Unit, Attached | 16 (100.0%) | 0 (0.0%) |
| 2 Unit Apartments | 0 (0.0%) | 0 (0.0%) |
| 3 or 4 Unit Apartments | 0 (0.0%) | 0 (0.0%) |
| 5 to 9 Unit Apartments | 0 (0.0%) | 0 (0.0%) |
| 10 or more Apartments | 0 (0.0%) | 0 (0.0%) |
| Mobile Home / Other | 0 (0.0%) | 0 (0.0%) |
| Total | 1,368 (93.6%) | 93 (6.4%) |
Housing Structures by Number of Rooms in Wonder Lake
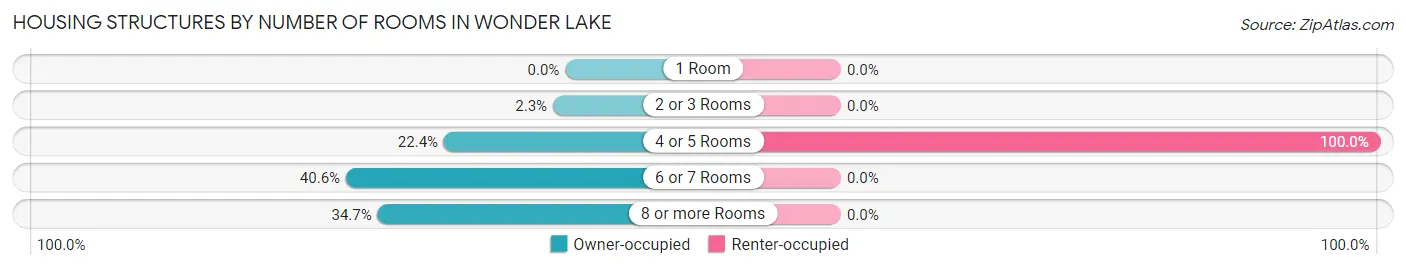
| Number of Rooms | Owner-occupied | Renter-occupied |
| 1 Room | 0 (0.0%) | 0 (0.0%) |
| 2 or 3 Rooms | 31 (2.3%) | 0 (0.0%) |
| 4 or 5 Rooms | 307 (22.4%) | 93 (100.0%) |
| 6 or 7 Rooms | 555 (40.6%) | 0 (0.0%) |
| 8 or more Rooms | 475 (34.7%) | 0 (0.0%) |
| Total | 1,368 (100.0%) | 93 (100.0%) |
Housing Structure by Heating Type in Wonder Lake
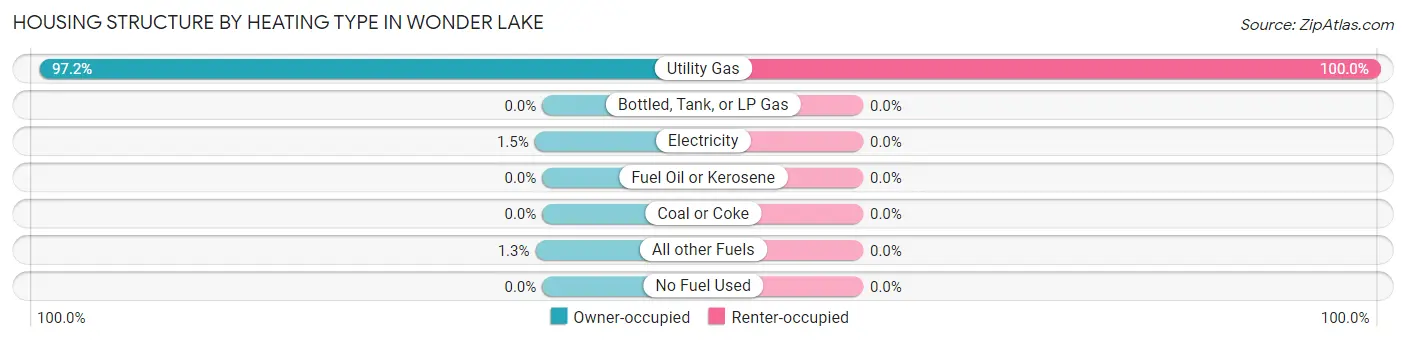
| Heating Type | Owner-occupied | Renter-occupied |
| Utility Gas | 1,330 (97.2%) | 93 (100.0%) |
| Bottled, Tank, or LP Gas | 0 (0.0%) | 0 (0.0%) |
| Electricity | 20 (1.5%) | 0 (0.0%) |
| Fuel Oil or Kerosene | 0 (0.0%) | 0 (0.0%) |
| Coal or Coke | 0 (0.0%) | 0 (0.0%) |
| All other Fuels | 18 (1.3%) | 0 (0.0%) |
| No Fuel Used | 0 (0.0%) | 0 (0.0%) |
| Total | 1,368 (100.0%) | 93 (100.0%) |
Household Vehicle Usage in Wonder Lake
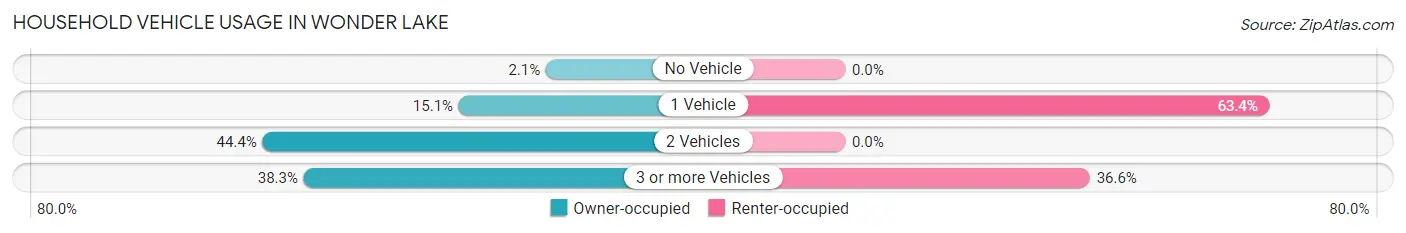
| Vehicles per Household | Owner-occupied | Renter-occupied |
| No Vehicle | 29 (2.1%) | 0 (0.0%) |
| 1 Vehicle | 207 (15.1%) | 59 (63.4%) |
| 2 Vehicles | 608 (44.4%) | 0 (0.0%) |
| 3 or more Vehicles | 524 (38.3%) | 34 (36.6%) |
| Total | 1,368 (100.0%) | 93 (100.0%) |
Real Estate & Mortgages in Wonder Lake
Real Estate and Mortgage Overview in Wonder Lake
| Characteristic | Without Mortgage | With Mortgage |
| Housing Units | 180 | 1,188 |
| Median Property Value | $250,900 | $224,700 |
| Median Household Income | $102,778 | $245 |
| Monthly Housing Costs | $896 | $59 |
| Real Estate Taxes | $6,156 | $23 |
Property Value by Mortgage Status in Wonder Lake
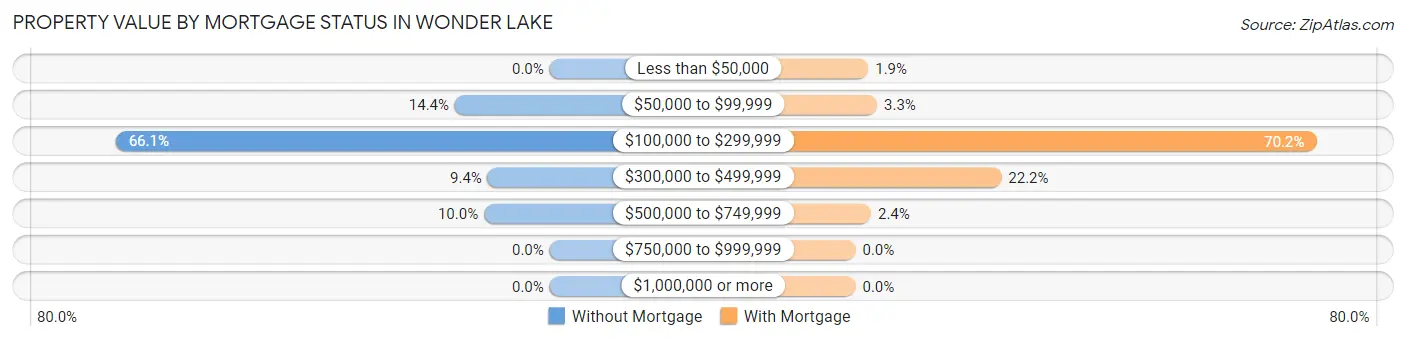
| Property Value | Without Mortgage | With Mortgage |
| Less than $50,000 | 0 (0.0%) | 23 (1.9%) |
| $50,000 to $99,999 | 26 (14.4%) | 39 (3.3%) |
| $100,000 to $299,999 | 119 (66.1%) | 834 (70.2%) |
| $300,000 to $499,999 | 17 (9.4%) | 264 (22.2%) |
| $500,000 to $749,999 | 18 (10.0%) | 28 (2.4%) |
| $750,000 to $999,999 | 0 (0.0%) | 0 (0.0%) |
| $1,000,000 or more | 0 (0.0%) | 0 (0.0%) |
| Total | 180 (100.0%) | 1,188 (100.0%) |
Household Income by Mortgage Status in Wonder Lake
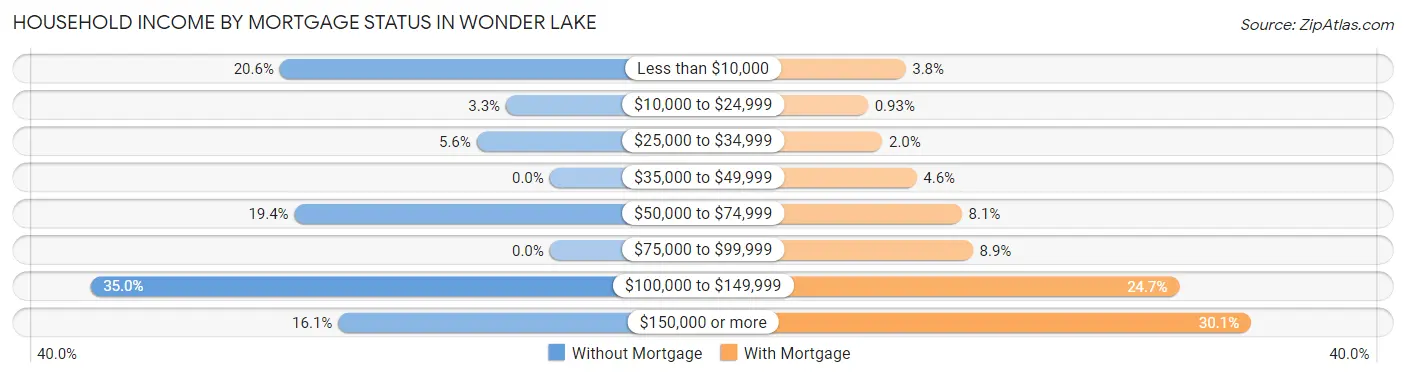
| Household Income | Without Mortgage | With Mortgage |
| Less than $10,000 | 37 (20.6%) | 45 (3.8%) |
| $10,000 to $24,999 | 6 (3.3%) | 11 (0.9%) |
| $25,000 to $34,999 | 10 (5.6%) | 24 (2.0%) |
| $35,000 to $49,999 | 0 (0.0%) | 55 (4.6%) |
| $50,000 to $74,999 | 35 (19.4%) | 96 (8.1%) |
| $75,000 to $99,999 | 0 (0.0%) | 106 (8.9%) |
| $100,000 to $149,999 | 63 (35.0%) | 293 (24.7%) |
| $150,000 or more | 29 (16.1%) | 358 (30.1%) |
| Total | 180 (100.0%) | 1,188 (100.0%) |
Property Value to Household Income Ratio in Wonder Lake
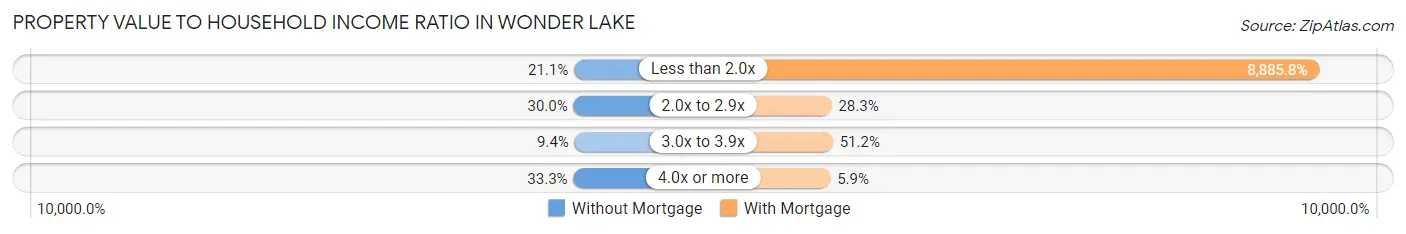
| Value-to-Income Ratio | Without Mortgage | With Mortgage |
| Less than 2.0x | 38 (21.1%) | 105,563 (8,885.8%) |
| 2.0x to 2.9x | 54 (30.0%) | 336 (28.3%) |
| 3.0x to 3.9x | 17 (9.4%) | 608 (51.2%) |
| 4.0x or more | 60 (33.3%) | 70 (5.9%) |
| Total | 180 (100.0%) | 1,188 (100.0%) |
Real Estate Taxes by Mortgage Status in Wonder Lake
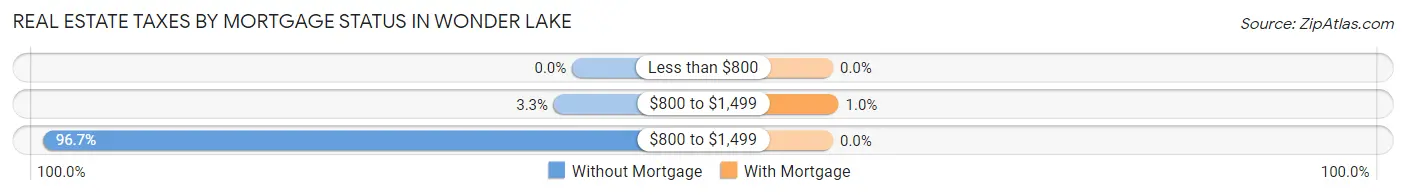
| Property Taxes | Without Mortgage | With Mortgage |
| Less than $800 | 0 (0.0%) | 0 (0.0%) |
| $800 to $1,499 | 6 (3.3%) | 12 (1.0%) |
| $800 to $1,499 | 174 (96.7%) | 0 (0.0%) |
| Total | 180 (100.0%) | 1,188 (100.0%) |
Health & Disability in Wonder Lake
Health Insurance Coverage by Age in Wonder Lake
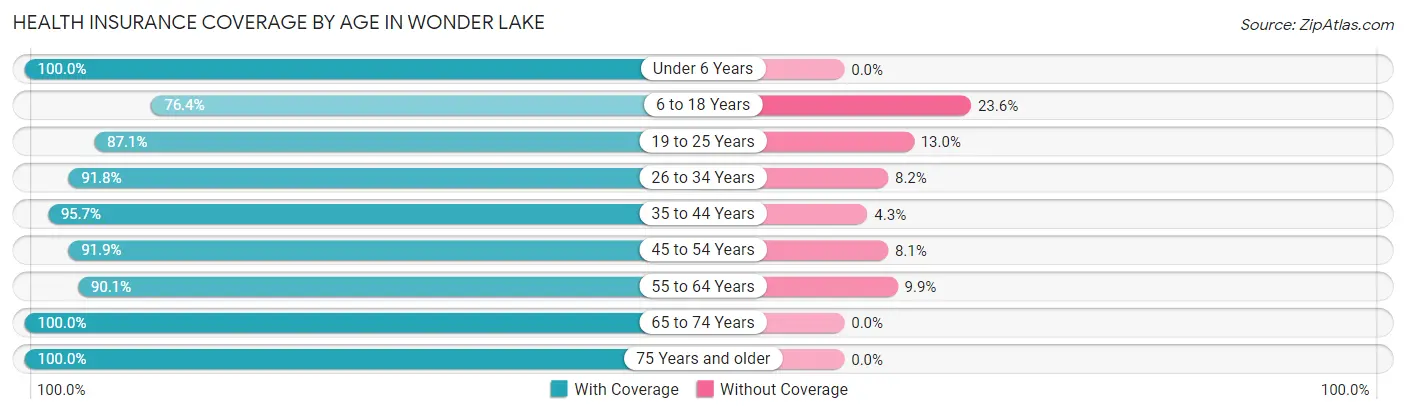
| Age Bracket | With Coverage | Without Coverage |
| Under 6 Years | 346 (100.0%) | 0 (0.0%) |
| 6 to 18 Years | 601 (76.4%) | 186 (23.6%) |
| 19 to 25 Years | 168 (87.1%) | 25 (13.0%) |
| 26 to 34 Years | 495 (91.8%) | 44 (8.2%) |
| 35 to 44 Years | 422 (95.7%) | 19 (4.3%) |
| 45 to 54 Years | 440 (91.9%) | 39 (8.1%) |
| 55 to 64 Years | 435 (90.1%) | 48 (9.9%) |
| 65 to 74 Years | 502 (100.0%) | 0 (0.0%) |
| 75 Years and older | 63 (100.0%) | 0 (0.0%) |
| Total | 3,472 (90.6%) | 361 (9.4%) |
Health Insurance Coverage by Citizenship Status in Wonder Lake
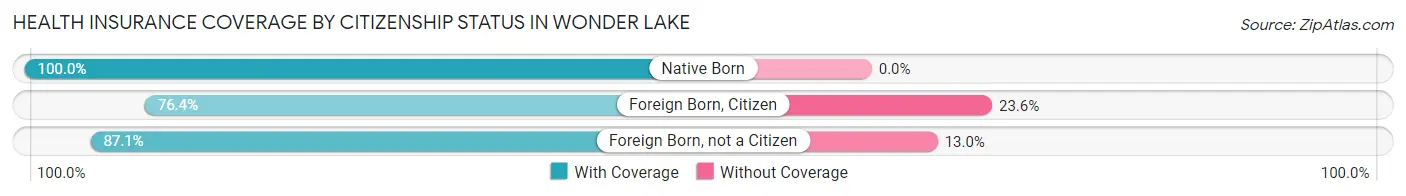
| Citizenship Status | With Coverage | Without Coverage |
| Native Born | 346 (100.0%) | 0 (0.0%) |
| Foreign Born, Citizen | 601 (76.4%) | 186 (23.6%) |
| Foreign Born, not a Citizen | 168 (87.1%) | 25 (13.0%) |
Health Insurance Coverage by Household Income in Wonder Lake
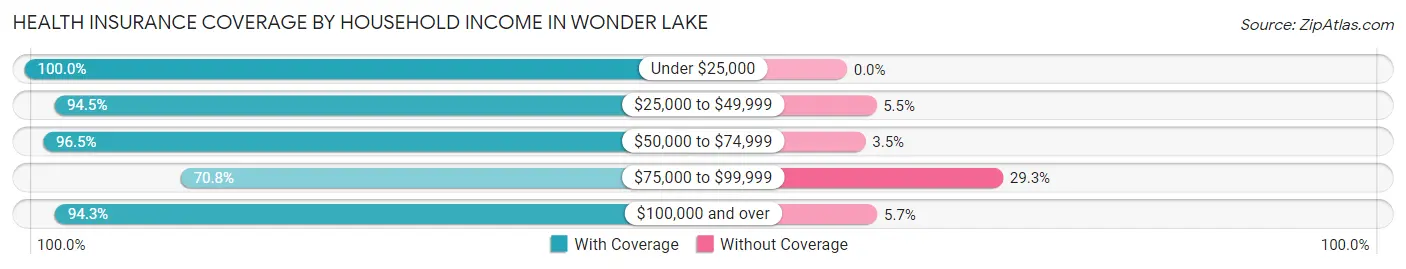
| Household Income | With Coverage | Without Coverage |
| Under $25,000 | 151 (100.0%) | 0 (0.0%) |
| $25,000 to $49,999 | 360 (94.5%) | 21 (5.5%) |
| $50,000 to $74,999 | 305 (96.5%) | 11 (3.5%) |
| $75,000 to $99,999 | 479 (70.8%) | 198 (29.2%) |
| $100,000 and over | 2,177 (94.3%) | 131 (5.7%) |
Public vs Private Health Insurance Coverage by Age in Wonder Lake
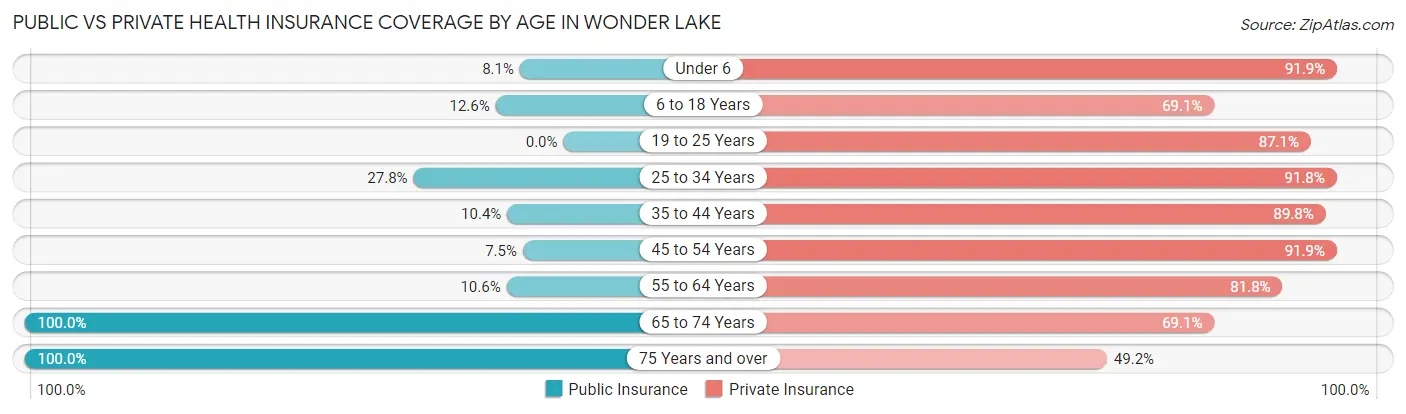
| Age Bracket | Public Insurance | Private Insurance |
| Under 6 | 28 (8.1%) | 318 (91.9%) |
| 6 to 18 Years | 99 (12.6%) | 544 (69.1%) |
| 19 to 25 Years | 0 (0.0%) | 168 (87.1%) |
| 25 to 34 Years | 150 (27.8%) | 495 (91.8%) |
| 35 to 44 Years | 46 (10.4%) | 396 (89.8%) |
| 45 to 54 Years | 36 (7.5%) | 440 (91.9%) |
| 55 to 64 Years | 51 (10.6%) | 395 (81.8%) |
| 65 to 74 Years | 502 (100.0%) | 347 (69.1%) |
| 75 Years and over | 63 (100.0%) | 31 (49.2%) |
| Total | 975 (25.4%) | 3,134 (81.8%) |
Disability Status by Sex by Age in Wonder Lake
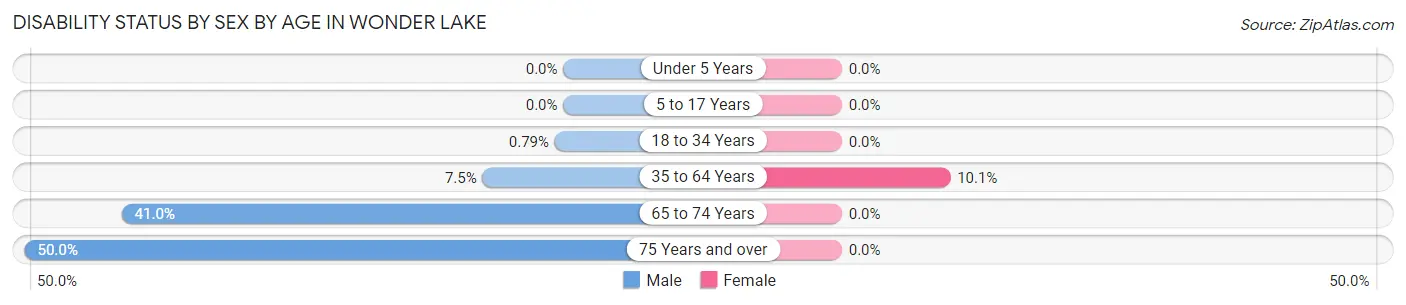
| Age Bracket | Male | Female |
| Under 5 Years | 0 (0.0%) | 0 (0.0%) |
| 5 to 17 Years | 0 (0.0%) | 0 (0.0%) |
| 18 to 34 Years | 3 (0.8%) | 0 (0.0%) |
| 35 to 64 Years | 53 (7.5%) | 70 (10.1%) |
| 65 to 74 Years | 91 (41.0%) | 0 (0.0%) |
| 75 Years and over | 21 (50.0%) | 0 (0.0%) |
Disability Class by Sex by Age in Wonder Lake
Disability Class: Hearing Difficulty
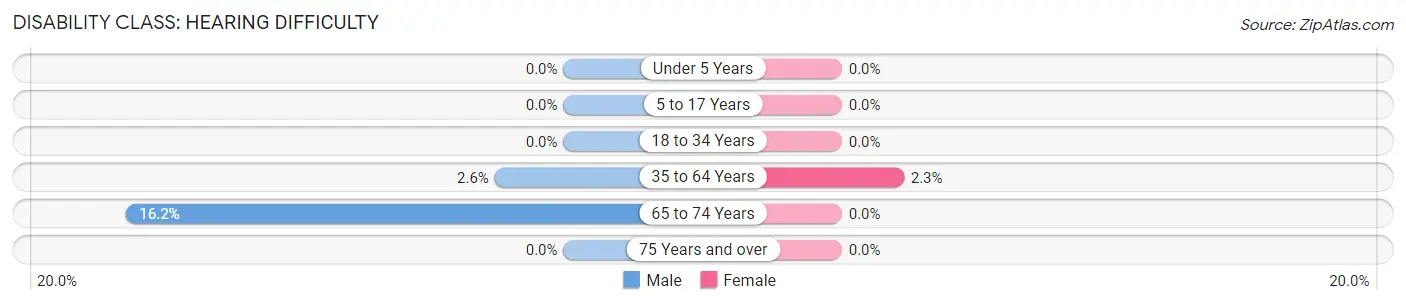
| Age Bracket | Male | Female |
| Under 5 Years | 0 (0.0%) | 0 (0.0%) |
| 5 to 17 Years | 0 (0.0%) | 0 (0.0%) |
| 18 to 34 Years | 0 (0.0%) | 0 (0.0%) |
| 35 to 64 Years | 18 (2.5%) | 16 (2.3%) |
| 65 to 74 Years | 36 (16.2%) | 0 (0.0%) |
| 75 Years and over | 0 (0.0%) | 0 (0.0%) |
Disability Class: Vision Difficulty
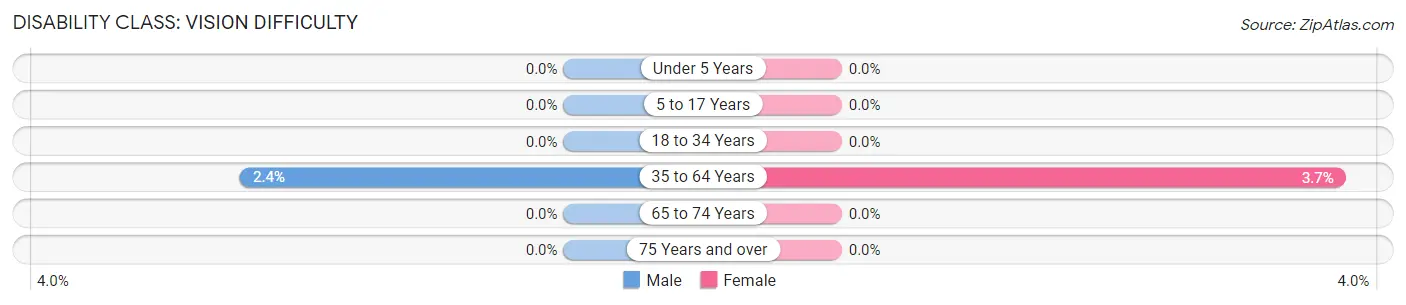
| Age Bracket | Male | Female |
| Under 5 Years | 0 (0.0%) | 0 (0.0%) |
| 5 to 17 Years | 0 (0.0%) | 0 (0.0%) |
| 18 to 34 Years | 0 (0.0%) | 0 (0.0%) |
| 35 to 64 Years | 17 (2.4%) | 26 (3.7%) |
| 65 to 74 Years | 0 (0.0%) | 0 (0.0%) |
| 75 Years and over | 0 (0.0%) | 0 (0.0%) |
Disability Class: Cognitive Difficulty
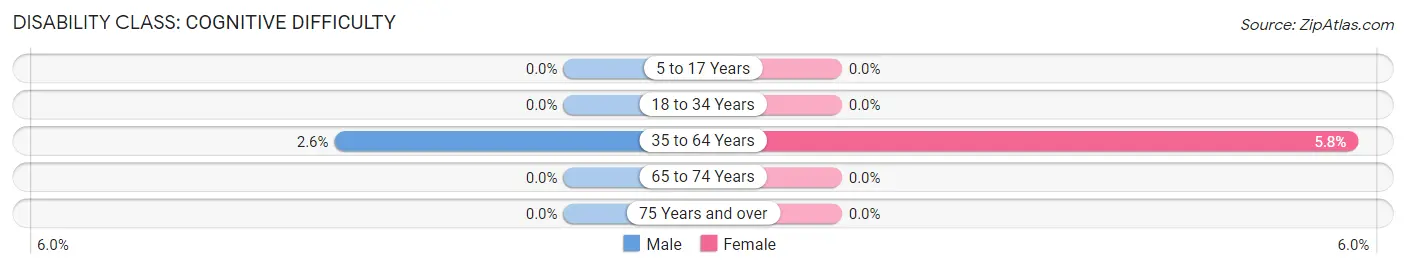
| Age Bracket | Male | Female |
| 5 to 17 Years | 0 (0.0%) | 0 (0.0%) |
| 18 to 34 Years | 0 (0.0%) | 0 (0.0%) |
| 35 to 64 Years | 18 (2.5%) | 40 (5.8%) |
| 65 to 74 Years | 0 (0.0%) | 0 (0.0%) |
| 75 Years and over | 0 (0.0%) | 0 (0.0%) |
Disability Class: Ambulatory Difficulty
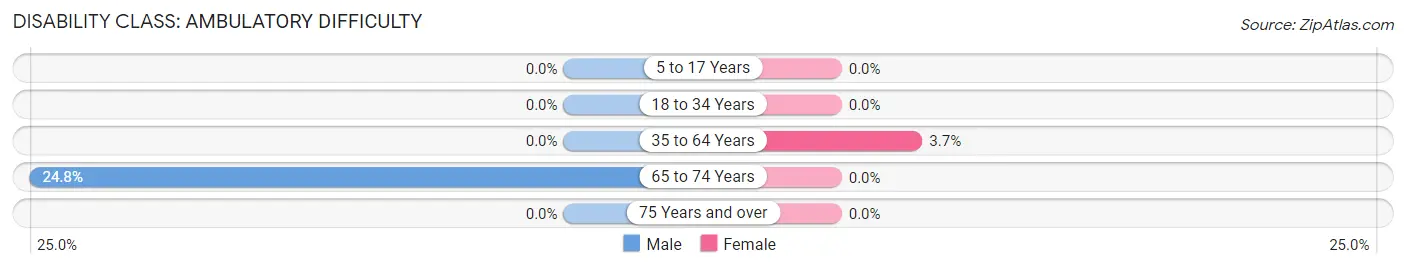
| Age Bracket | Male | Female |
| 5 to 17 Years | 0 (0.0%) | 0 (0.0%) |
| 18 to 34 Years | 0 (0.0%) | 0 (0.0%) |
| 35 to 64 Years | 0 (0.0%) | 26 (3.7%) |
| 65 to 74 Years | 55 (24.8%) | 0 (0.0%) |
| 75 Years and over | 0 (0.0%) | 0 (0.0%) |
Disability Class: Self-Care Difficulty
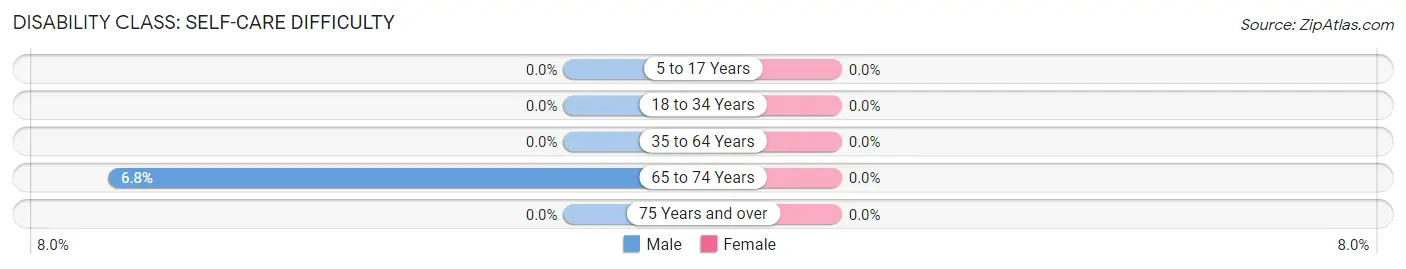
| Age Bracket | Male | Female |
| 5 to 17 Years | 0 (0.0%) | 0 (0.0%) |
| 18 to 34 Years | 0 (0.0%) | 0 (0.0%) |
| 35 to 64 Years | 0 (0.0%) | 0 (0.0%) |
| 65 to 74 Years | 15 (6.8%) | 0 (0.0%) |
| 75 Years and over | 0 (0.0%) | 0 (0.0%) |
Technology Access in Wonder Lake
Computing Device Access in Wonder Lake
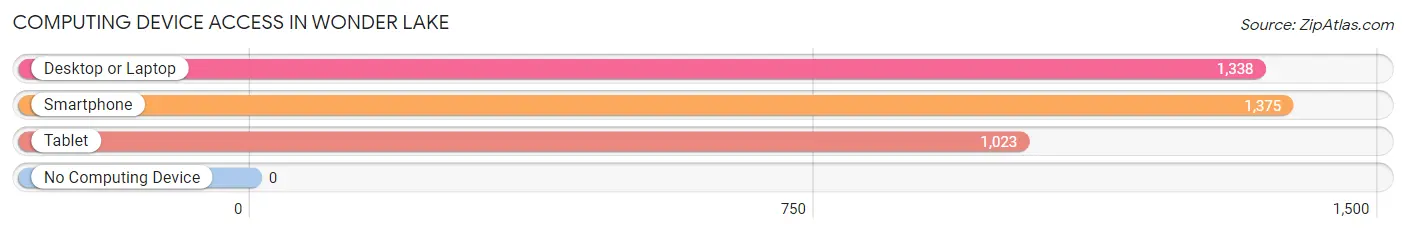
| Device Type | # Households | % Households |
| Desktop or Laptop | 1,338 | 91.6% |
| Smartphone | 1,375 | 94.1% |
| Tablet | 1,023 | 70.0% |
| No Computing Device | 0 | 0.0% |
| Total | 1,461 | 100.0% |
Internet Access in Wonder Lake
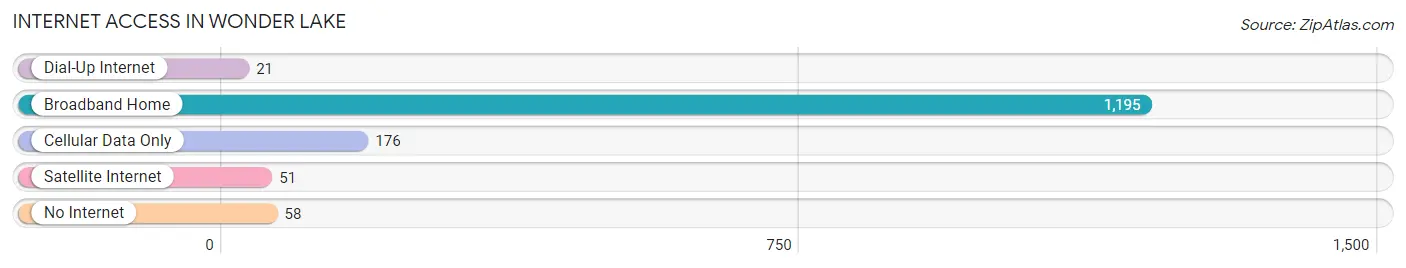
| Internet Type | # Households | % Households |
| Dial-Up Internet | 21 | 1.4% |
| Broadband Home | 1,195 | 81.8% |
| Cellular Data Only | 176 | 12.0% |
| Satellite Internet | 51 | 3.5% |
| No Internet | 58 | 4.0% |
| Total | 1,461 | 100.0% |
Wonder Lake Summary
History
Wonder Lake is a village located in McHenry County, Illinois. It is situated on the shores of Wonder Lake, a natural glacial lake. The area was first settled in the late 19th century by farmers and fishermen. The village was officially incorporated in 1959.
The area was originally inhabited by the Potawatomi Native American tribe. The first settlers to the area were farmers and fishermen who arrived in the late 19th century. The village was officially incorporated in 1959.
The village was named after the lake, which was named by a settler who was amazed by the beauty of the lake. The lake was also known as "Wonderful Lake" and "Wonderful Pond" in the early days.
Geography
Wonder Lake is located in McHenry County, Illinois. It is situated on the shores of Wonder Lake, a natural glacial lake. The village is located about 40 miles northwest of Chicago. The village is bordered by the cities of Woodstock, McHenry, and Johnsburg.
The village has a total area of 2.2 square miles, all of which is land. The village is located at an elevation of 830 feet above sea level. The lake is the main feature of the village, and it is surrounded by residential neighborhoods.
Economy
The economy of Wonder Lake is largely based on tourism and recreation. The village is home to several marinas, boat launches, and other recreational facilities. The village also has several restaurants, bars, and other businesses that cater to tourists.
The village is also home to several manufacturing and industrial businesses. These businesses include a plastics manufacturer, a metal fabrication company, and a printing company.
Demographics
As of the 2010 census, the population of Wonder Lake was 6,856. The racial makeup of the village was 94.3% White, 0.7% African American, 0.2% Native American, 1.2% Asian, 0.1% Pacific Islander, 1.7% from other races, and 1.9% from two or more races. Hispanic or Latino of any race were 4.3% of the population.
The median income for a household in the village was $60,938, and the median income for a family was $68,958. The per capita income for the village was $27,945. About 4.2% of families and 5.3% of the population were below the poverty line, including 6.3% of those under age 18 and 4.2% of those age 65 or over.
Common Questions
What is Per Capita Income in Wonder Lake?
Per Capita income in Wonder Lake is $44,168.
What is the Median Family Income in Wonder Lake?
Median Family Income in Wonder Lake is $106,973.
What is the Median Household income in Wonder Lake?
Median Household Income in Wonder Lake is $99,844.
What is Income or Wage Gap in Wonder Lake?
Income or Wage Gap in Wonder Lake is 62.9%.
Women in Wonder Lake earn 37.1 cents for every dollar earned by a man.
What is Inequality or Gini Index in Wonder Lake?
Inequality or Gini Index in Wonder Lake is 0.37.
What is the Total Population of Wonder Lake?
Total Population of Wonder Lake is 3,833.
What is the Total Male Population of Wonder Lake?
Total Male Population of Wonder Lake is 1,936.
What is the Total Female Population of Wonder Lake?
Total Female Population of Wonder Lake is 1,897.
What is the Ratio of Males per 100 Females in Wonder Lake?
There are 102.06 Males per 100 Females in Wonder Lake.
What is the Ratio of Females per 100 Males in Wonder Lake?
There are 97.99 Females per 100 Males in Wonder Lake.
What is the Median Population Age in Wonder Lake?
Median Population Age in Wonder Lake is 36.8 Years.
What is the Average Family Size in Wonder Lake
Average Family Size in Wonder Lake is 2.9 People.
What is the Average Household Size in Wonder Lake
Average Household Size in Wonder Lake is 2.6 People.
How Large is the Labor Force in Wonder Lake?
There are 2,035 People in the Labor Forcein in Wonder Lake.
What is the Percentage of People in the Labor Force in Wonder Lake?
69.8% of People are in the Labor Force in Wonder Lake.
What is the Unemployment Rate in Wonder Lake?
Unemployment Rate in Wonder Lake is 7.5%.