Waukegan, IL Map & Demographics
Waukegan Map
Waukegan Overview
$30,089
PER CAPITA INCOME
$76,143
AVG FAMILY INCOME
$66,077
AVG HOUSEHOLD INCOME
20.1%
WAGE / INCOME GAP [ % ]
79.9¢/ $1
WAGE / INCOME GAP [ $ ]
$9,593
FAMILY INCOME DEFICIT
0.44
INEQUALITY / GINI INDEX
89,435
TOTAL POPULATION
45,050
MALE POPULATION
44,385
FEMALE POPULATION
101.50
MALES / 100 FEMALES
98.52
FEMALES / 100 MALES
34.5
MEDIAN AGE
3.5
AVG FAMILY SIZE
2.8
AVG HOUSEHOLD SIZE
46,850
LABOR FORCE [ PEOPLE ]
67.0%
PERCENT IN LABOR FORCE
5.3%
UNEMPLOYMENT RATE
Income in Waukegan
Income Overview in Waukegan
Per Capita Income in Waukegan is $30,089, while median incomes of families and households are $76,143 and $66,077 respectively.
| Characteristic | Number | Measure |
| Per Capita Income | 89,435 | $30,089 |
| Median Family Income | 20,964 | $76,143 |
| Mean Family Income | 20,964 | $96,357 |
| Median Household Income | 31,195 | $66,077 |
| Mean Household Income | 31,195 | $83,964 |
| Income Deficit | 20,964 | $9,593 |
| Wage / Income Gap (%) | 89,435 | 20.06% |
| Wage / Income Gap ($) | 89,435 | 79.94¢ per $1 |
| Gini / Inequality Index | 89,435 | 0.44 |
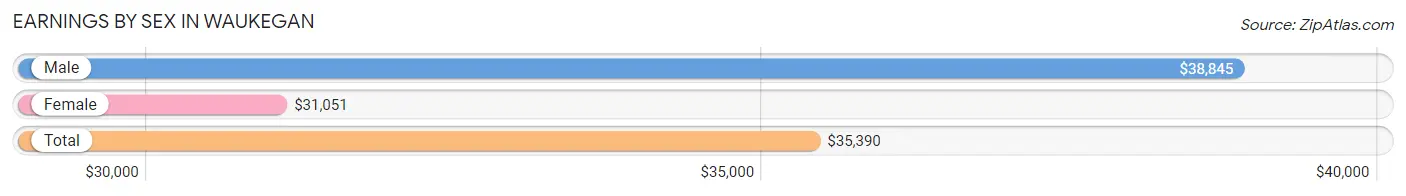
Earnings by Sex in Waukegan
Average Earnings in Waukegan are $35,390, $38,845 for men and $31,051 for women, a difference of 20.1%.
| Sex | Number | Average Earnings |
| Male | 27,087 (55.4%) | $38,845 |
| Female | 21,793 (44.6%) | $31,051 |
| Total | 48,880 (100.0%) | $35,390 |
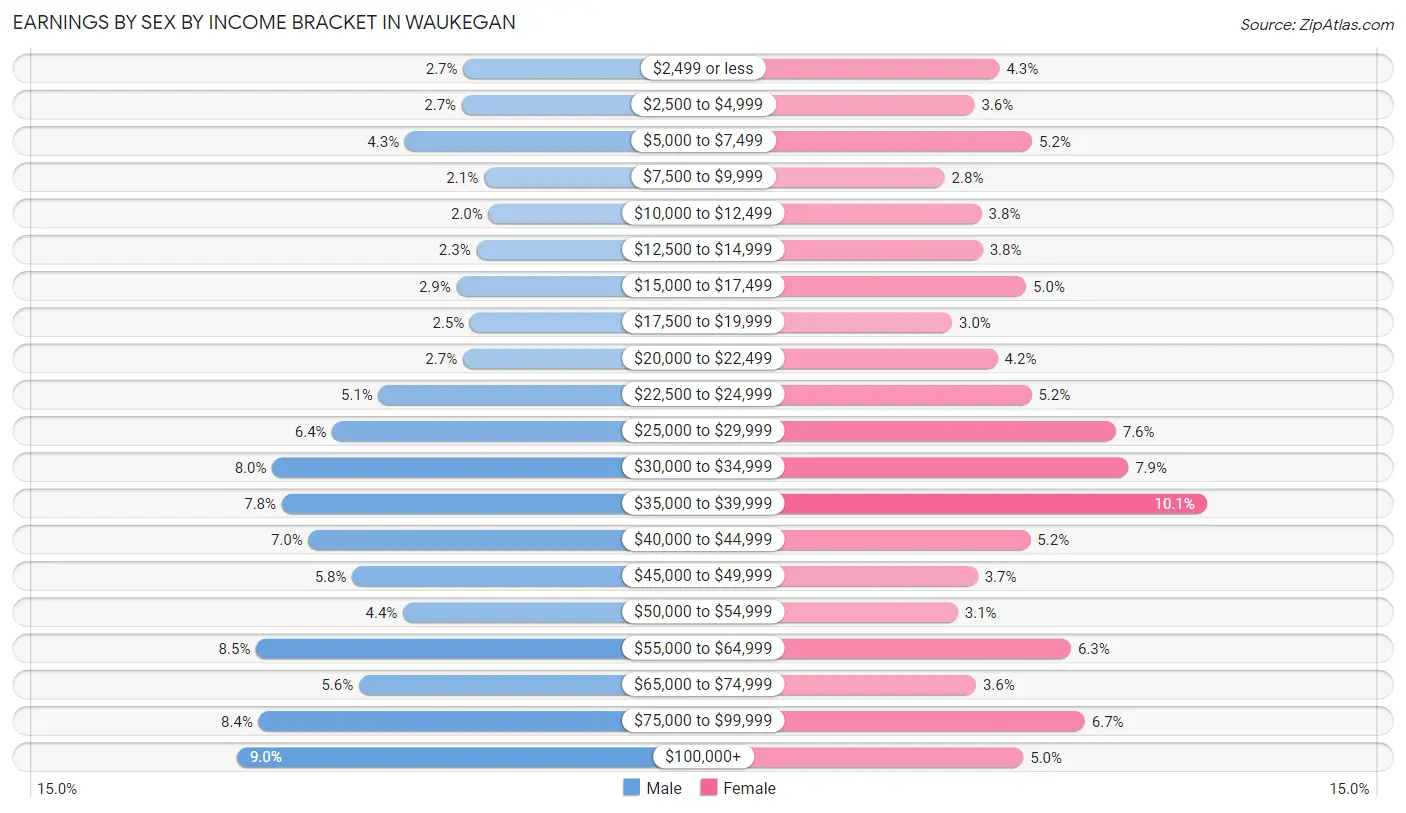
Earnings by Sex by Income Bracket in Waukegan
The most common earnings brackets in Waukegan are $100,000+ for men (2,446 | 9.0%) and $35,000 to $39,999 for women (2,203 | 10.1%).
| Income | Male | Female |
| $2,499 or less | 724 (2.7%) | 934 (4.3%) |
| $2,500 to $4,999 | 734 (2.7%) | 782 (3.6%) |
| $5,000 to $7,499 | 1,168 (4.3%) | 1,135 (5.2%) |
| $7,500 to $9,999 | 567 (2.1%) | 600 (2.8%) |
| $10,000 to $12,499 | 530 (2.0%) | 825 (3.8%) |
| $12,500 to $14,999 | 622 (2.3%) | 833 (3.8%) |
| $15,000 to $17,499 | 776 (2.9%) | 1,099 (5.0%) |
| $17,500 to $19,999 | 671 (2.5%) | 645 (3.0%) |
| $20,000 to $22,499 | 727 (2.7%) | 923 (4.2%) |
| $22,500 to $24,999 | 1,368 (5.1%) | 1,132 (5.2%) |
| $25,000 to $29,999 | 1,721 (6.4%) | 1,647 (7.6%) |
| $30,000 to $34,999 | 2,179 (8.0%) | 1,724 (7.9%) |
| $35,000 to $39,999 | 2,104 (7.8%) | 2,203 (10.1%) |
| $40,000 to $44,999 | 1,901 (7.0%) | 1,125 (5.2%) |
| $45,000 to $49,999 | 1,569 (5.8%) | 801 (3.7%) |
| $50,000 to $54,999 | 1,180 (4.4%) | 681 (3.1%) |
| $55,000 to $64,999 | 2,301 (8.5%) | 1,373 (6.3%) |
| $65,000 to $74,999 | 1,518 (5.6%) | 792 (3.6%) |
| $75,000 to $99,999 | 2,281 (8.4%) | 1,457 (6.7%) |
| $100,000+ | 2,446 (9.0%) | 1,082 (5.0%) |
| Total | 27,087 (100.0%) | 21,793 (100.0%) |
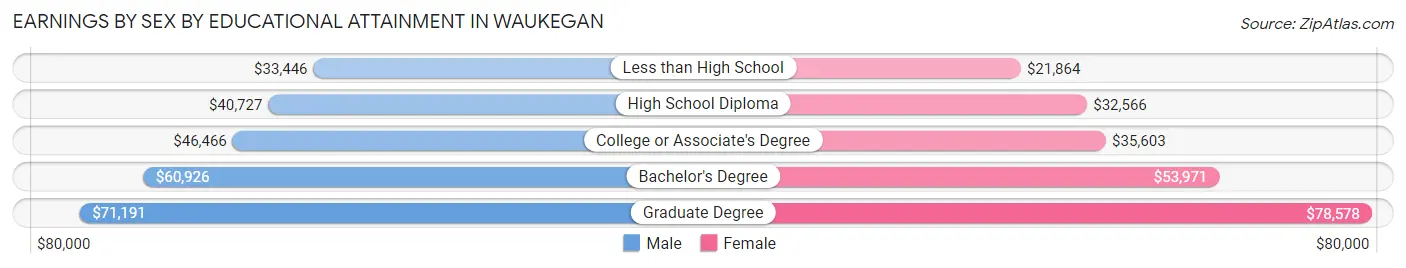
Earnings by Sex by Educational Attainment in Waukegan
Average earnings in Waukegan are $43,590 for men and $35,153 for women, a difference of 19.4%. Men with an educational attainment of graduate degree enjoy the highest average annual earnings of $71,191, while those with less than high school education earn the least with $33,446. Women with an educational attainment of graduate degree earn the most with the average annual earnings of $78,578, while those with less than high school education have the smallest earnings of $21,864.
| Educational Attainment | Male Income | Female Income |
| Less than High School | $33,446 | $21,864 |
| High School Diploma | $40,727 | $32,566 |
| College or Associate's Degree | $46,466 | $35,603 |
| Bachelor's Degree | $60,926 | $53,971 |
| Graduate Degree | $71,191 | $78,578 |
| Total | $43,590 | $35,153 |
Family Income in Waukegan
Family Income Brackets in Waukegan
According to the Waukegan family income data, there are 3,753 families falling into the $50,000 to $74,999 income range, which is the most common income bracket and makes up 17.9% of all families. Conversely, the less than $10,000 income bracket is the least frequent group with only 398 families (1.9%) belonging to this category.
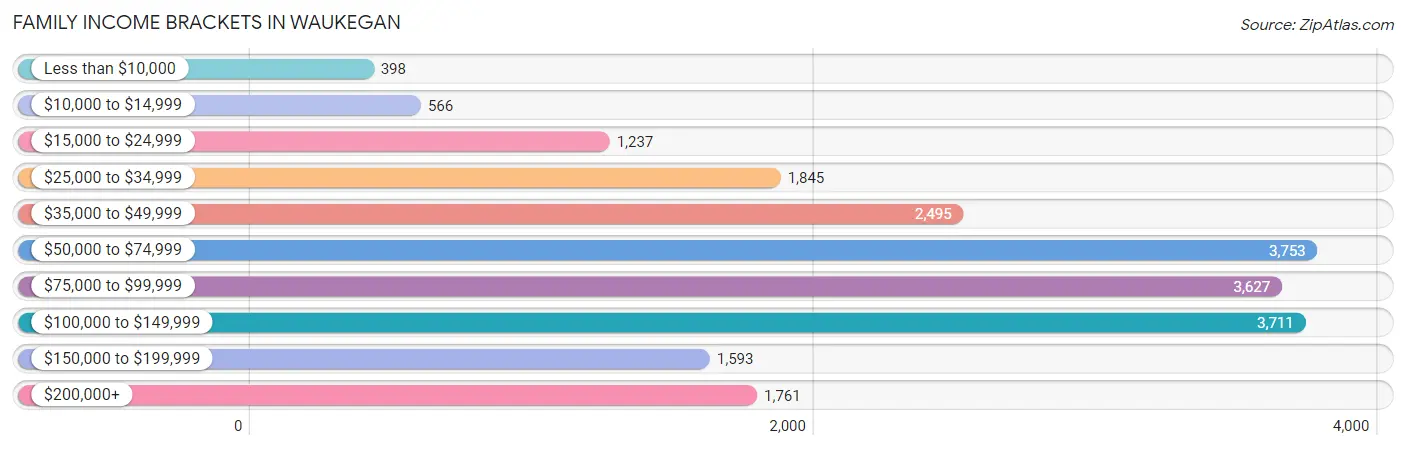
| Income Bracket | # Families | % Families |
| Less than $10,000 | 398 | 1.9% |
| $10,000 to $14,999 | 566 | 2.7% |
| $15,000 to $24,999 | 1,237 | 5.9% |
| $25,000 to $34,999 | 1,845 | 8.8% |
| $35,000 to $49,999 | 2,495 | 11.9% |
| $50,000 to $74,999 | 3,753 | 17.9% |
| $75,000 to $99,999 | 3,627 | 17.3% |
| $100,000 to $149,999 | 3,711 | 17.7% |
| $150,000 to $199,999 | 1,593 | 7.6% |
| $200,000+ | 1,761 | 8.4% |
Family Income by Famaliy Size in Waukegan
7+ person families (475 | 2.3%) account for the highest median family income in Waukegan with $124,306 per family, while 2-person families (7,540 | 36.0%) have the highest median income of $37,469 per family member.
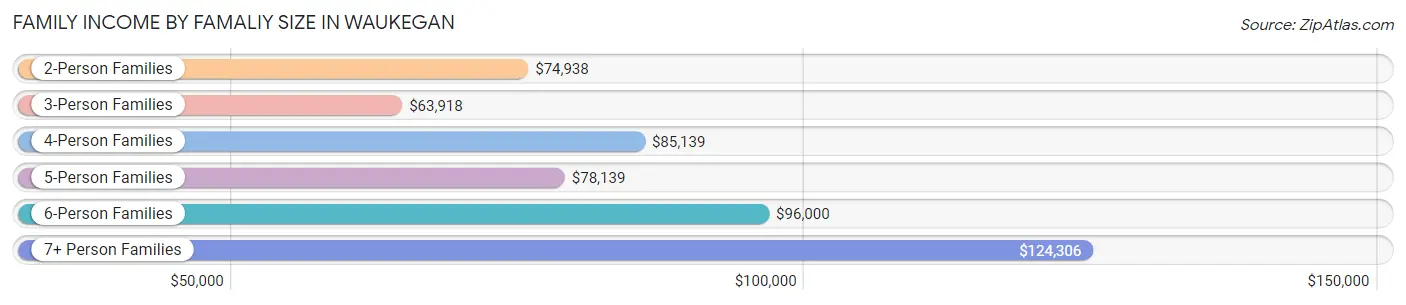
| Income Bracket | # Families | Median Income |
| 2-Person Families | 7,540 (36.0%) | $74,938 |
| 3-Person Families | 5,014 (23.9%) | $63,918 |
| 4-Person Families | 4,488 (21.4%) | $85,139 |
| 5-Person Families | 2,775 (13.2%) | $78,139 |
| 6-Person Families | 672 (3.2%) | $96,000 |
| 7+ Person Families | 475 (2.3%) | $124,306 |
| Total | 20,964 (100.0%) | $76,143 |
Family Income by Number of Earners in Waukegan
The median family income in Waukegan is $76,143, with families comprising 3+ earners (3,665) having the highest median family income of $123,079, while families with no earners (1,855) have the lowest median family income of $29,978, accounting for 17.5% and 8.8% of families, respectively.
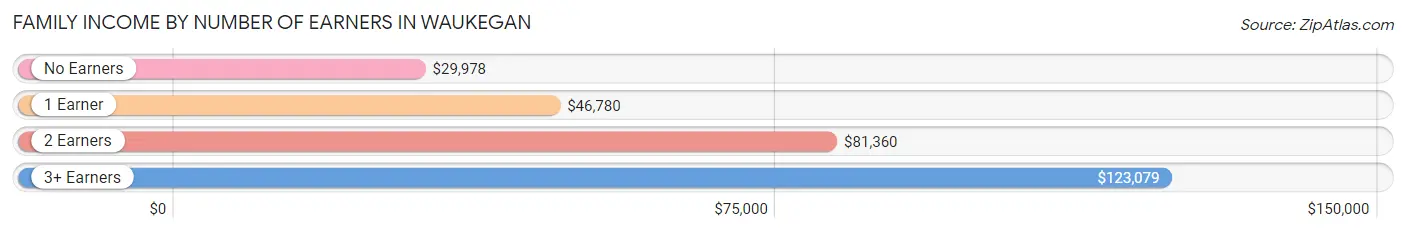
| Number of Earners | # Families | Median Income |
| No Earners | 1,855 (8.8%) | $29,978 |
| 1 Earner | 6,312 (30.1%) | $46,780 |
| 2 Earners | 9,132 (43.6%) | $81,360 |
| 3+ Earners | 3,665 (17.5%) | $123,079 |
| Total | 20,964 (100.0%) | $76,143 |
Household Income in Waukegan
Household Income Brackets in Waukegan
With 5,272 households falling in the category, the $50,000 to $74,999 income range is the most frequent in Waukegan, accounting for 16.9% of all households. In contrast, only 1,279 households (4.1%) fall into the $10,000 to $14,999 income bracket, making it the least populous group.
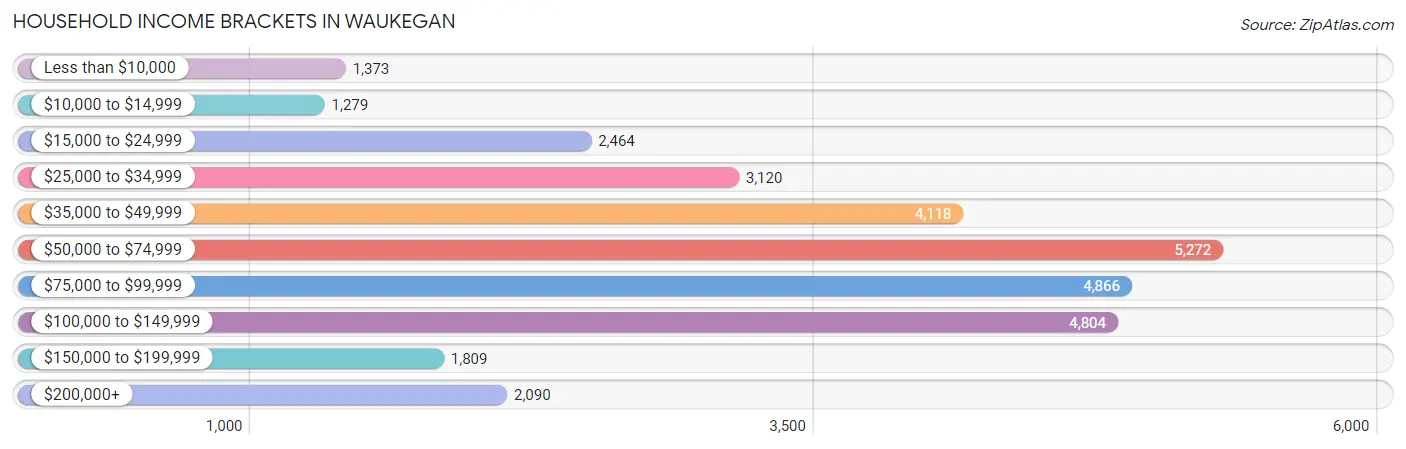
| Income Bracket | # Households | % Households |
| Less than $10,000 | 1,373 | 4.4% |
| $10,000 to $14,999 | 1,279 | 4.1% |
| $15,000 to $24,999 | 2,464 | 7.9% |
| $25,000 to $34,999 | 3,120 | 10.0% |
| $35,000 to $49,999 | 4,118 | 13.2% |
| $50,000 to $74,999 | 5,272 | 16.9% |
| $75,000 to $99,999 | 4,866 | 15.6% |
| $100,000 to $149,999 | 4,804 | 15.4% |
| $150,000 to $199,999 | 1,809 | 5.8% |
| $200,000+ | 2,090 | 6.7% |
Household Income by Householder Age in Waukegan
The median household income in Waukegan is $66,077, with the highest median household income of $77,862 found in the 45 to 64 years age bracket for the primary householder. A total of 11,585 households (37.1%) fall into this category. Meanwhile, the 15 to 24 years age bracket for the primary householder has the lowest median household income of $43,707, with 1,584 households (5.1%) in this group.
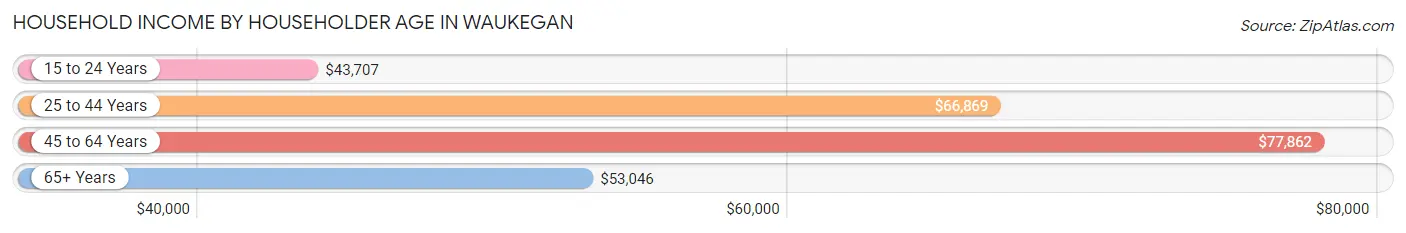
| Income Bracket | # Households | Median Income |
| 15 to 24 Years | 1,584 (5.1%) | $43,707 |
| 25 to 44 Years | 11,680 (37.4%) | $66,869 |
| 45 to 64 Years | 11,585 (37.1%) | $77,862 |
| 65+ Years | 6,346 (20.3%) | $53,046 |
| Total | 31,195 (100.0%) | $66,077 |
Poverty in Waukegan
Income Below Poverty by Sex and Age in Waukegan
With 13.2% poverty level for males and 16.8% for females among the residents of Waukegan, under 5 year old males and 5 year old females are the most vulnerable to poverty, with 675 males (27.8%) and 281 females (36.1%) in their respective age groups living below the poverty level.
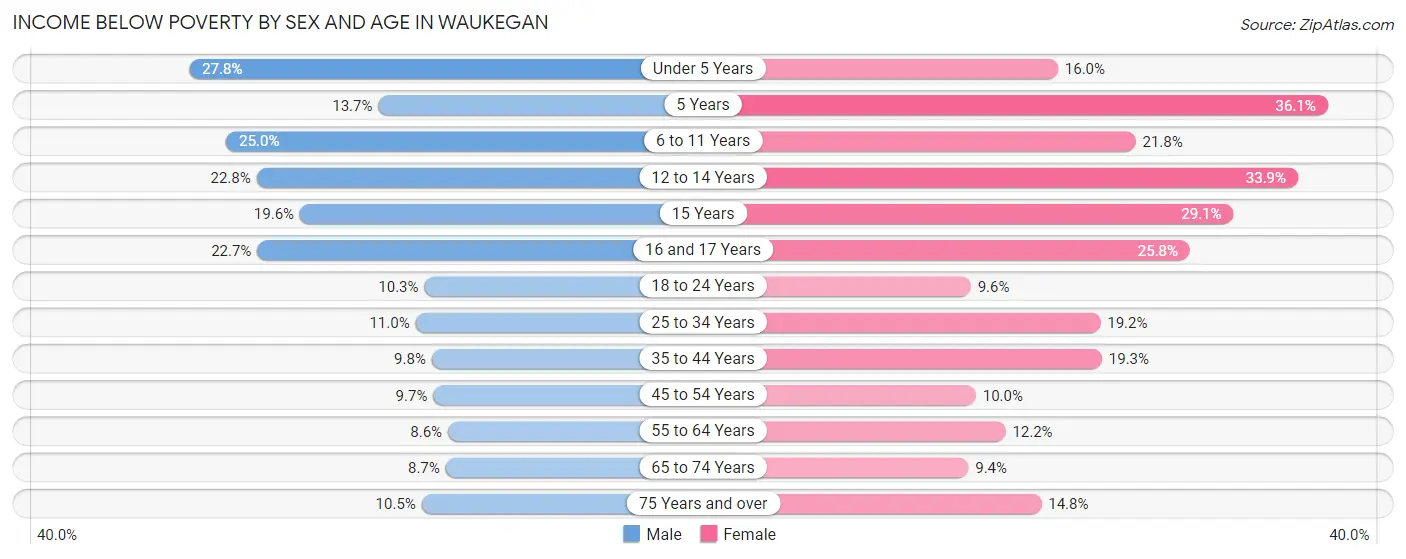
| Age Bracket | Male | Female |
| Under 5 Years | 675 (27.8%) | 451 (16.0%) |
| 5 Years | 98 (13.7%) | 281 (36.1%) |
| 6 to 11 Years | 915 (25.0%) | 792 (21.8%) |
| 12 to 14 Years | 374 (22.8%) | 744 (33.9%) |
| 15 Years | 115 (19.6%) | 273 (29.1%) |
| 16 and 17 Years | 365 (22.7%) | 308 (25.8%) |
| 18 to 24 Years | 532 (10.3%) | 456 (9.6%) |
| 25 to 34 Years | 711 (11.0%) | 1,157 (19.2%) |
| 35 to 44 Years | 647 (9.8%) | 1,149 (19.3%) |
| 45 to 54 Years | 540 (9.7%) | 532 (10.0%) |
| 55 to 64 Years | 420 (8.6%) | 626 (12.1%) |
| 65 to 74 Years | 277 (8.7%) | 298 (9.4%) |
| 75 Years and over | 137 (10.5%) | 305 (14.8%) |
| Total | 5,806 (13.2%) | 7,372 (16.8%) |
Income Above Poverty by Sex and Age in Waukegan
According to the poverty statistics in Waukegan, males aged 55 to 64 years and females aged 65 to 74 years are the age groups that are most secure financially, with 91.4% of males and 90.6% of females in these age groups living above the poverty line.
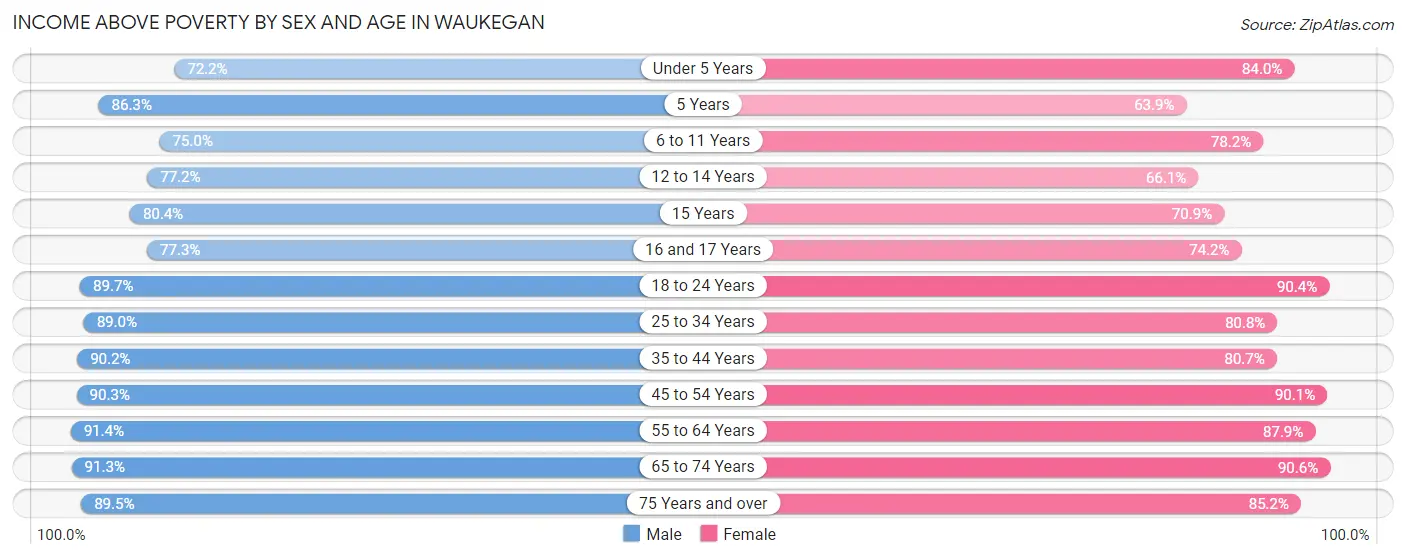
| Age Bracket | Male | Female |
| Under 5 Years | 1,754 (72.2%) | 2,360 (84.0%) |
| 5 Years | 615 (86.3%) | 498 (63.9%) |
| 6 to 11 Years | 2,739 (75.0%) | 2,839 (78.2%) |
| 12 to 14 Years | 1,268 (77.2%) | 1,453 (66.1%) |
| 15 Years | 473 (80.4%) | 666 (70.9%) |
| 16 and 17 Years | 1,241 (77.3%) | 884 (74.2%) |
| 18 to 24 Years | 4,624 (89.7%) | 4,309 (90.4%) |
| 25 to 34 Years | 5,762 (89.0%) | 4,871 (80.8%) |
| 35 to 44 Years | 5,973 (90.2%) | 4,801 (80.7%) |
| 45 to 54 Years | 5,051 (90.3%) | 4,817 (90.0%) |
| 55 to 64 Years | 4,481 (91.4%) | 4,525 (87.8%) |
| 65 to 74 Years | 2,892 (91.3%) | 2,876 (90.6%) |
| 75 Years and over | 1,165 (89.5%) | 1,754 (85.2%) |
| Total | 38,038 (86.8%) | 36,653 (83.3%) |
Income Below Poverty Among Married-Couple Families in Waukegan
The poverty statistics for married-couple families in Waukegan show that 6.1% or 816 of the total 13,329 families live below the poverty line. Families with 5 or more children have the highest poverty rate of 48.9%, comprising of 23 families. On the other hand, families with no children have the lowest poverty rate of 2.9%, which includes 202 families.
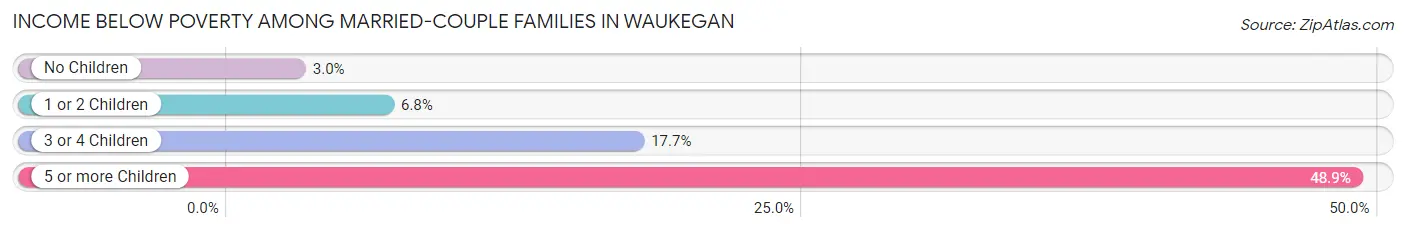
| Children | Above Poverty | Below Poverty |
| No Children | 6,641 (97.1%) | 202 (2.9%) |
| 1 or 2 Children | 4,684 (93.2%) | 341 (6.8%) |
| 3 or 4 Children | 1,164 (82.3%) | 250 (17.7%) |
| 5 or more Children | 24 (51.1%) | 23 (48.9%) |
| Total | 12,513 (93.9%) | 816 (6.1%) |
Income Below Poverty Among Single-Parent Households in Waukegan
According to the poverty data in Waukegan, 6.1% or 123 single-father households and 24.6% or 1,387 single-mother households are living below the poverty line. Among single-father households, those with 3 or 4 children have the highest poverty rate, with 72 households (56.7%) experiencing poverty. Likewise, among single-mother households, those with 3 or 4 children have the highest poverty rate, with 704 households (74.8%) falling below the poverty line.
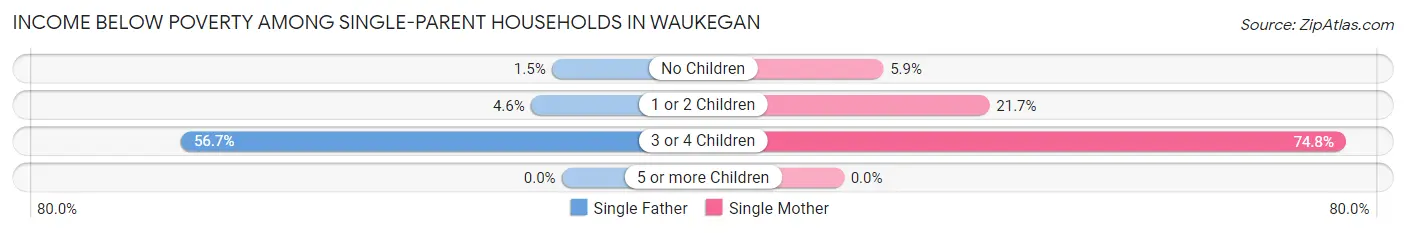
| Children | Single Father | Single Mother |
| No Children | 17 (1.5%) | 123 (5.9%) |
| 1 or 2 Children | 34 (4.6%) | 560 (21.7%) |
| 3 or 4 Children | 72 (56.7%) | 704 (74.8%) |
| 5 or more Children | 0 (0.0%) | 0 (0.0%) |
| Total | 123 (6.1%) | 1,387 (24.6%) |
Income Below Poverty Among Married-Couple vs Single-Parent Households in Waukegan
The poverty data for Waukegan shows that 816 of the married-couple family households (6.1%) and 1,510 of the single-parent households (19.8%) are living below the poverty level. Within the married-couple family households, those with 5 or more children have the highest poverty rate, with 23 households (48.9%) falling below the poverty line. Among the single-parent households, those with 3 or 4 children have the highest poverty rate, with 776 household (72.7%) living below poverty.
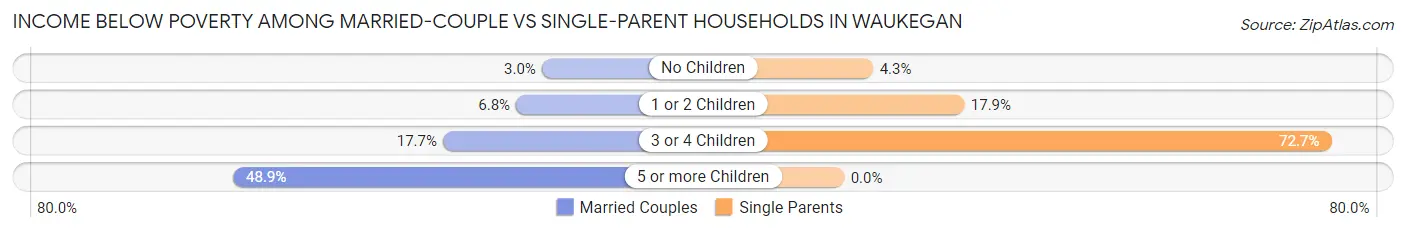
| Children | Married-Couple Families | Single-Parent Households |
| No Children | 202 (2.9%) | 140 (4.3%) |
| 1 or 2 Children | 341 (6.8%) | 594 (17.9%) |
| 3 or 4 Children | 250 (17.7%) | 776 (72.7%) |
| 5 or more Children | 23 (48.9%) | 0 (0.0%) |
| Total | 816 (6.1%) | 1,510 (19.8%) |
Race in Waukegan
The most populous races in Waukegan are Hispanic or Latino (47,070 | 52.6%), White / Caucasian (31,420 | 35.1%), and Some other Race (18,514 | 20.7%).
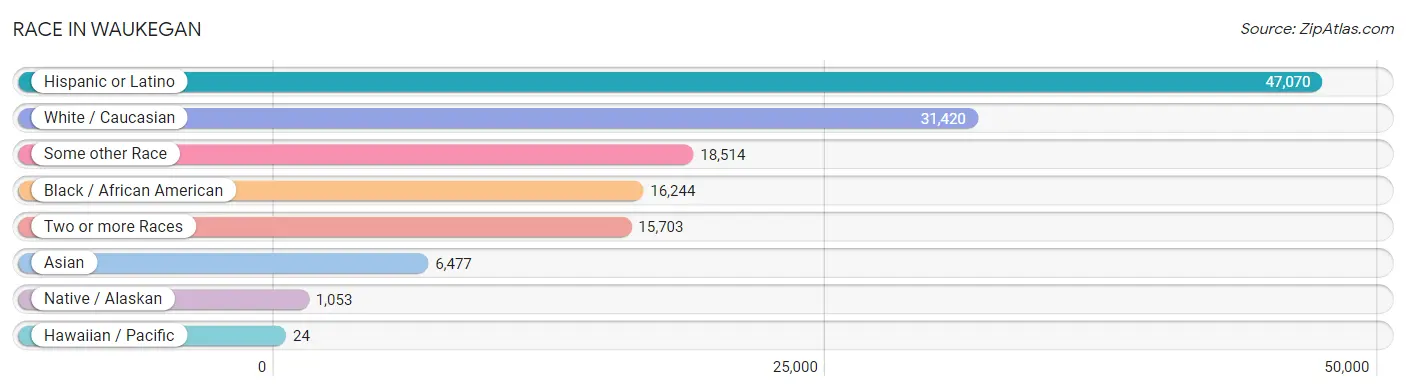
| Race | # Population | % Population |
| Asian | 6,477 | 7.2% |
| Black / African American | 16,244 | 18.2% |
| Hawaiian / Pacific | 24 | 0.0% |
| Hispanic or Latino | 47,070 | 52.6% |
| Native / Alaskan | 1,053 | 1.2% |
| White / Caucasian | 31,420 | 35.1% |
| Two or more Races | 15,703 | 17.6% |
| Some other Race | 18,514 | 20.7% |
| Total | 89,435 | 100.0% |
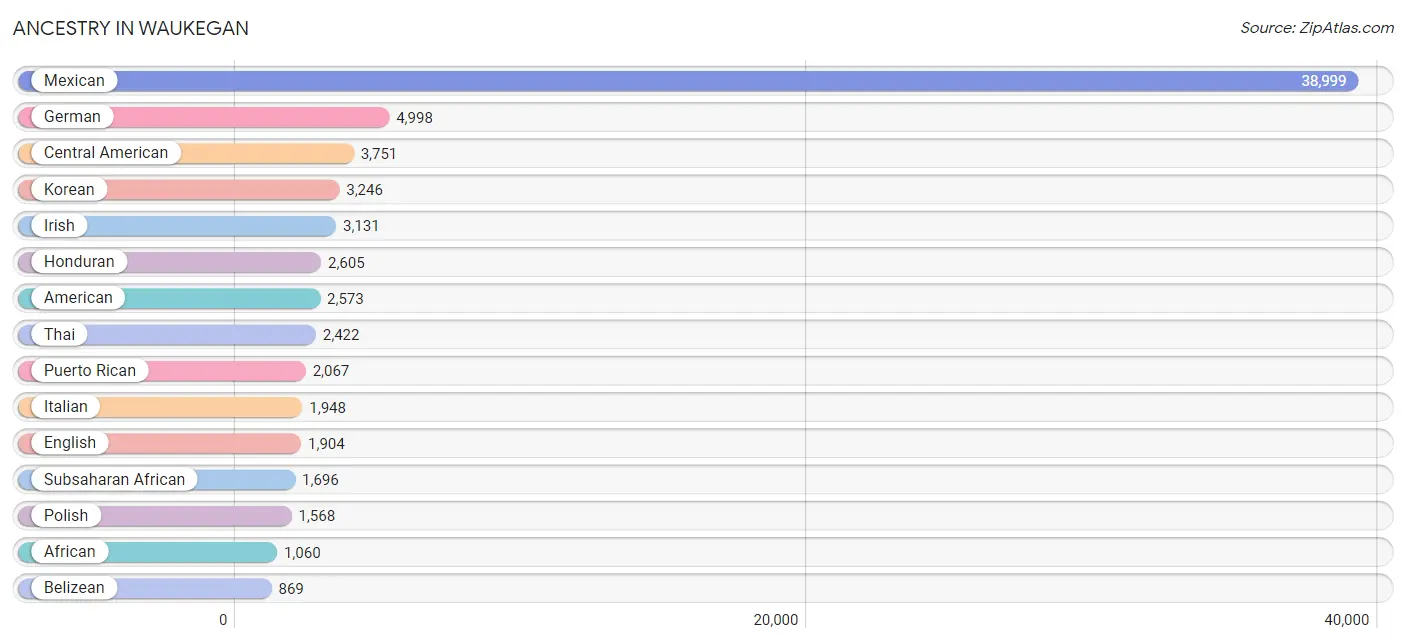
Ancestry in Waukegan
The most populous ancestries reported in Waukegan are Mexican (38,999 | 43.6%), German (4,998 | 5.6%), Central American (3,751 | 4.2%), Korean (3,246 | 3.6%), and Irish (3,131 | 3.5%), together accounting for 60.5% of all Waukegan residents.
| Ancestry | # Population | % Population |
| African | 1,060 | 1.2% |
| Alaska Native | 20 | 0.0% |
| American | 2,573 | 2.9% |
| Arab | 437 | 0.5% |
| Armenian | 168 | 0.2% |
| Assyrian / Chaldean / Syriac | 47 | 0.1% |
| Austrian | 93 | 0.1% |
| Belgian | 54 | 0.1% |
| Belizean | 869 | 1.0% |
| Bhutanese | 194 | 0.2% |
| Blackfeet | 10 | 0.0% |
| Bolivian | 46 | 0.1% |
| Brazilian | 52 | 0.1% |
| British | 321 | 0.4% |
| Burmese | 183 | 0.2% |
| Canadian | 30 | 0.0% |
| Celtic | 19 | 0.0% |
| Central American | 3,751 | 4.2% |
| Central American Indian | 99 | 0.1% |
| Cherokee | 209 | 0.2% |
| Chickasaw | 23 | 0.0% |
| Chilean | 28 | 0.0% |
| Choctaw | 41 | 0.1% |
| Colombian | 212 | 0.2% |
| Comanche | 31 | 0.0% |
| Croatian | 186 | 0.2% |
| Crow | 58 | 0.1% |
| Cuban | 95 | 0.1% |
| Czech | 149 | 0.2% |
| Czechoslovakian | 44 | 0.1% |
| Danish | 131 | 0.2% |
| Delaware | 1 | 0.0% |
| Dominican | 340 | 0.4% |
| Dutch | 228 | 0.3% |
| Eastern European | 268 | 0.3% |
| Ecuadorian | 187 | 0.2% |
| Egyptian | 22 | 0.0% |
| English | 1,904 | 2.1% |
| Ethiopian | 10 | 0.0% |
| European | 405 | 0.4% |
| Filipino | 11 | 0.0% |
| Finnish | 174 | 0.2% |
| French | 400 | 0.4% |
| French Canadian | 36 | 0.0% |
| German | 4,998 | 5.6% |
| Ghanaian | 318 | 0.4% |
| Greek | 265 | 0.3% |
| Guamanian / Chamorro | 18 | 0.0% |
| Guatemalan | 355 | 0.4% |
| Haitian | 115 | 0.1% |
| Honduran | 2,605 | 2.9% |
| Hungarian | 71 | 0.1% |
| Indian (Asian) | 455 | 0.5% |
| Iranian | 88 | 0.1% |
| Iraqi | 40 | 0.0% |
| Irish | 3,131 | 3.5% |
| Israeli | 12 | 0.0% |
| Italian | 1,948 | 2.2% |
| Jamaican | 416 | 0.5% |
| Japanese | 243 | 0.3% |
| Jordanian | 111 | 0.1% |
| Kenyan | 57 | 0.1% |
| Korean | 3,246 | 3.6% |
| Laotian | 81 | 0.1% |
| Latvian | 24 | 0.0% |
| Lebanese | 22 | 0.0% |
| Lithuanian | 155 | 0.2% |
| Luxembourger | 74 | 0.1% |
| Mexican | 38,999 | 43.6% |
| Mexican American Indian | 687 | 0.8% |
| Moroccan | 10 | 0.0% |
| Native Hawaiian | 48 | 0.1% |
| Nicaraguan | 68 | 0.1% |
| Nigerian | 71 | 0.1% |
| Northern European | 12 | 0.0% |
| Norwegian | 711 | 0.8% |
| Pakistani | 76 | 0.1% |
| Palestinian | 281 | 0.3% |
| Peruvian | 219 | 0.2% |
| Polish | 1,568 | 1.8% |
| Portuguese | 83 | 0.1% |
| Puerto Rican | 2,067 | 2.3% |
| Romanian | 99 | 0.1% |
| Russian | 283 | 0.3% |
| Salvadoran | 679 | 0.8% |
| Scandinavian | 68 | 0.1% |
| Scotch-Irish | 286 | 0.3% |
| Scottish | 609 | 0.7% |
| Serbian | 5 | 0.0% |
| Slovak | 69 | 0.1% |
| Slovene | 328 | 0.4% |
| South American | 692 | 0.8% |
| Spaniard | 193 | 0.2% |
| Spanish | 33 | 0.0% |
| Sri Lankan | 204 | 0.2% |
| Subsaharan African | 1,696 | 1.9% |
| Swedish | 571 | 0.6% |
| Swiss | 68 | 0.1% |
| Syrian | 12 | 0.0% |
| Thai | 2,422 | 2.7% |
| Trinidadian and Tobagonian | 30 | 0.0% |
| Turkish | 33 | 0.0% |
| Ukrainian | 112 | 0.1% |
| Ute | 14 | 0.0% |
| Welsh | 108 | 0.1% |
| West Indian | 33 | 0.0% |
| Yugoslavian | 114 | 0.1% | View All 107 Rows |
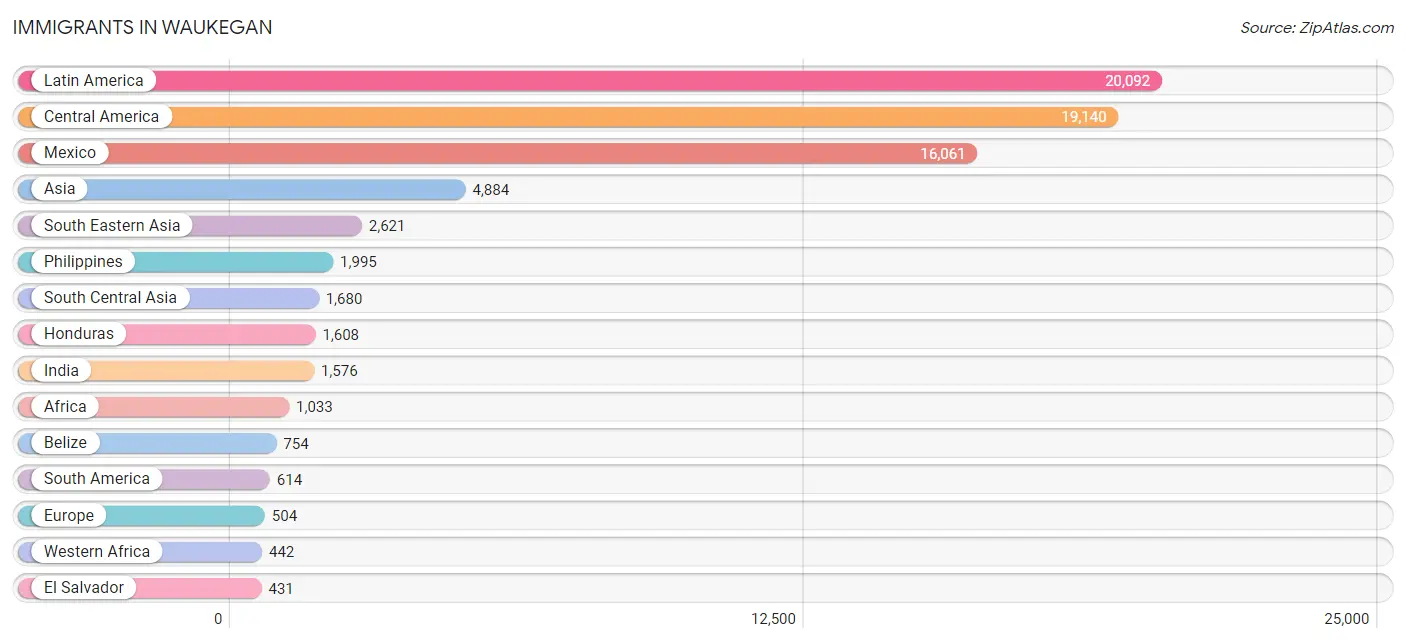
Immigrants in Waukegan
The most numerous immigrant groups reported in Waukegan came from Latin America (20,092 | 22.5%), Central America (19,140 | 21.4%), Mexico (16,061 | 18.0%), Asia (4,884 | 5.5%), and South Eastern Asia (2,621 | 2.9%), together accounting for 70.2% of all Waukegan residents.
| Immigration Origin | # Population | % Population |
| Africa | 1,033 | 1.2% |
| Asia | 4,884 | 5.5% |
| Bangladesh | 41 | 0.1% |
| Belize | 754 | 0.8% |
| Bolivia | 46 | 0.1% |
| Brazil | 76 | 0.1% |
| Cambodia | 189 | 0.2% |
| Cameroon | 31 | 0.0% |
| Canada | 50 | 0.1% |
| Caribbean | 338 | 0.4% |
| Central America | 19,140 | 21.4% |
| Chile | 36 | 0.0% |
| China | 229 | 0.3% |
| Colombia | 203 | 0.2% |
| Costa Rica | 12 | 0.0% |
| Cuba | 54 | 0.1% |
| Czechoslovakia | 27 | 0.0% |
| Dominican Republic | 89 | 0.1% |
| Eastern Africa | 96 | 0.1% |
| Eastern Asia | 379 | 0.4% |
| Eastern Europe | 287 | 0.3% |
| Ecuador | 155 | 0.2% |
| Egypt | 3 | 0.0% |
| El Salvador | 431 | 0.5% |
| England | 39 | 0.0% |
| Ethiopia | 18 | 0.0% |
| Europe | 504 | 0.6% |
| Germany | 85 | 0.1% |
| Ghana | 117 | 0.1% |
| Greece | 27 | 0.0% |
| Guatemala | 269 | 0.3% |
| Haiti | 49 | 0.1% |
| Honduras | 1,608 | 1.8% |
| Hong Kong | 16 | 0.0% |
| India | 1,576 | 1.8% |
| Indonesia | 81 | 0.1% |
| Iran | 49 | 0.1% |
| Iraq | 64 | 0.1% |
| Ireland | 37 | 0.0% |
| Israel | 12 | 0.0% |
| Italy | 29 | 0.0% |
| Jamaica | 131 | 0.2% |
| Japan | 34 | 0.0% |
| Jordan | 27 | 0.0% |
| Kenya | 29 | 0.0% |
| Korea | 116 | 0.1% |
| Latin America | 20,092 | 22.5% |
| Liberia | 11 | 0.0% |
| Mexico | 16,061 | 18.0% |
| Middle Africa | 414 | 0.5% |
| Morocco | 10 | 0.0% |
| Nigeria | 64 | 0.1% |
| Northern Africa | 13 | 0.0% |
| Northern Europe | 76 | 0.1% |
| Pakistan | 14 | 0.0% |
| Panama | 5 | 0.0% |
| Peru | 98 | 0.1% |
| Philippines | 1,995 | 2.2% |
| Poland | 58 | 0.1% |
| Romania | 114 | 0.1% |
| Russia | 88 | 0.1% |
| Singapore | 58 | 0.1% |
| South Africa | 68 | 0.1% |
| South America | 614 | 0.7% |
| South Central Asia | 1,680 | 1.9% |
| South Eastern Asia | 2,621 | 2.9% |
| Southern Europe | 56 | 0.1% |
| Syria | 12 | 0.0% |
| Taiwan | 11 | 0.0% |
| Thailand | 100 | 0.1% |
| Trinidad and Tobago | 15 | 0.0% |
| Vietnam | 198 | 0.2% |
| Western Africa | 442 | 0.5% |
| Western Asia | 175 | 0.2% |
| Western Europe | 85 | 0.1% |
| Zaire | 383 | 0.4% | View All 76 Rows |
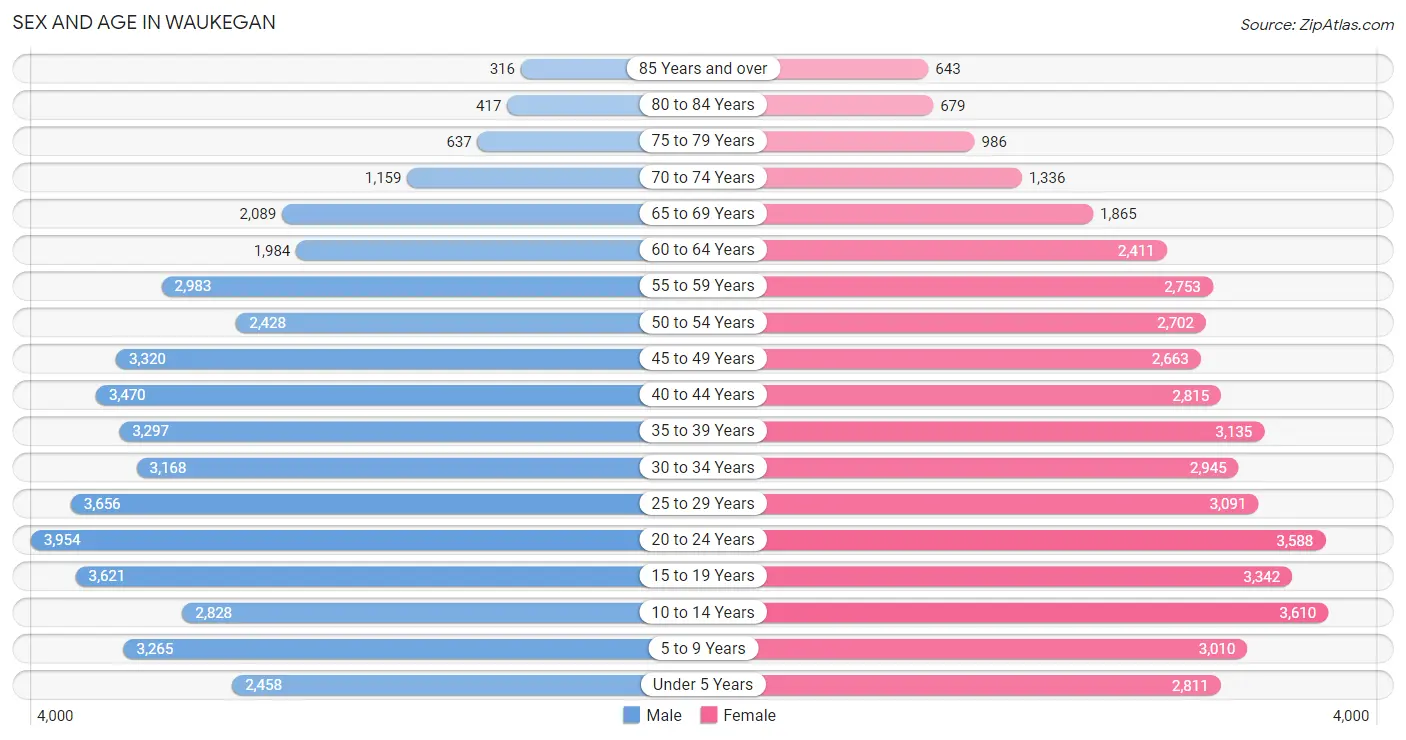
Sex and Age in Waukegan
Sex and Age in Waukegan
The most populous age groups in Waukegan are 20 to 24 Years (3,954 | 8.8%) for men and 10 to 14 Years (3,610 | 8.1%) for women.
| Age Bracket | Male | Female |
| Under 5 Years | 2,458 (5.5%) | 2,811 (6.3%) |
| 5 to 9 Years | 3,265 (7.2%) | 3,010 (6.8%) |
| 10 to 14 Years | 2,828 (6.3%) | 3,610 (8.1%) |
| 15 to 19 Years | 3,621 (8.0%) | 3,342 (7.5%) |
| 20 to 24 Years | 3,954 (8.8%) | 3,588 (8.1%) |
| 25 to 29 Years | 3,656 (8.1%) | 3,091 (7.0%) |
| 30 to 34 Years | 3,168 (7.0%) | 2,945 (6.6%) |
| 35 to 39 Years | 3,297 (7.3%) | 3,135 (7.1%) |
| 40 to 44 Years | 3,470 (7.7%) | 2,815 (6.3%) |
| 45 to 49 Years | 3,320 (7.4%) | 2,663 (6.0%) |
| 50 to 54 Years | 2,428 (5.4%) | 2,702 (6.1%) |
| 55 to 59 Years | 2,983 (6.6%) | 2,753 (6.2%) |
| 60 to 64 Years | 1,984 (4.4%) | 2,411 (5.4%) |
| 65 to 69 Years | 2,089 (4.6%) | 1,865 (4.2%) |
| 70 to 74 Years | 1,159 (2.6%) | 1,336 (3.0%) |
| 75 to 79 Years | 637 (1.4%) | 986 (2.2%) |
| 80 to 84 Years | 417 (0.9%) | 679 (1.5%) |
| 85 Years and over | 316 (0.7%) | 643 (1.5%) |
| Total | 45,050 (100.0%) | 44,385 (100.0%) |
Families and Households in Waukegan
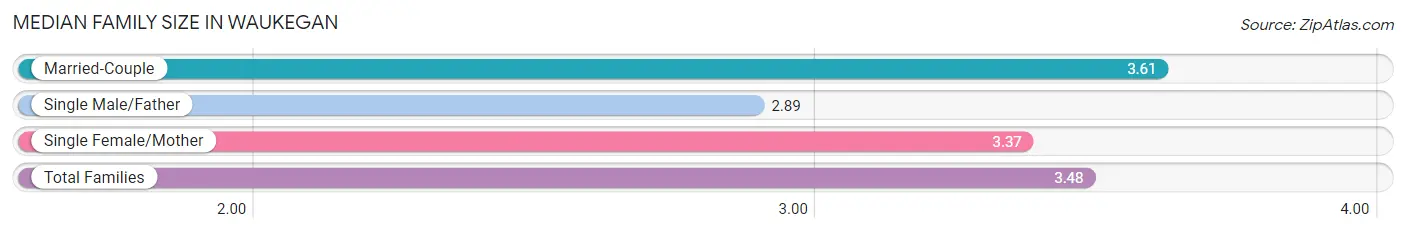
Median Family Size in Waukegan
The median family size in Waukegan is 3.48 persons per family, with married-couple families (13,329 | 63.6%) accounting for the largest median family size of 3.61 persons per family. On the other hand, single male/father families (2,005 | 9.6%) represent the smallest median family size with 2.89 persons per family.
| Family Type | # Families | Family Size |
| Married-Couple | 13,329 (63.6%) | 3.61 |
| Single Male/Father | 2,005 (9.6%) | 2.89 |
| Single Female/Mother | 5,630 (26.9%) | 3.37 |
| Total Families | 20,964 (100.0%) | 3.48 |
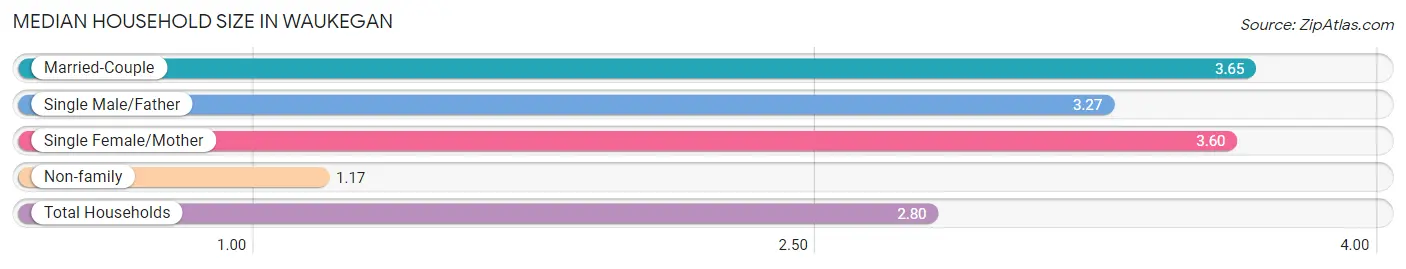
Median Household Size in Waukegan
The median household size in Waukegan is 2.80 persons per household, with married-couple households (13,329 | 42.7%) accounting for the largest median household size of 3.65 persons per household. non-family households (10,231 | 32.8%) represent the smallest median household size with 1.17 persons per household.
| Household Type | # Households | Household Size |
| Married-Couple | 13,329 (42.7%) | 3.65 |
| Single Male/Father | 2,005 (6.4%) | 3.27 |
| Single Female/Mother | 5,630 (18.0%) | 3.60 |
| Non-family | 10,231 (32.8%) | 1.17 |
| Total Households | 31,195 (100.0%) | 2.80 |
Household Size by Marriage Status in Waukegan
Out of a total of 31,195 households in Waukegan, 20,964 (67.2%) are family households, while 10,231 (32.8%) are nonfamily households. The most numerous type of family households are 2-person households, comprising 6,788, and the most common type of nonfamily households are 1-person households, comprising 8,558.
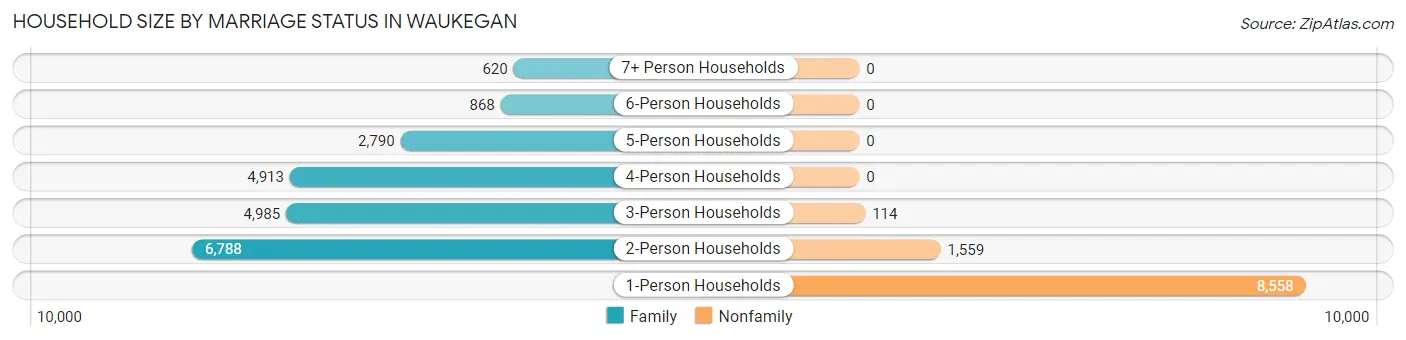
| Household Size | Family Households | Nonfamily Households |
| 1-Person Households | - | 8,558 (27.4%) |
| 2-Person Households | 6,788 (21.8%) | 1,559 (5.0%) |
| 3-Person Households | 4,985 (16.0%) | 114 (0.4%) |
| 4-Person Households | 4,913 (15.8%) | 0 (0.0%) |
| 5-Person Households | 2,790 (8.9%) | 0 (0.0%) |
| 6-Person Households | 868 (2.8%) | 0 (0.0%) |
| 7+ Person Households | 620 (2.0%) | 0 (0.0%) |
| Total | 20,964 (67.2%) | 10,231 (32.8%) |
Female Fertility in Waukegan
Fertility by Age in Waukegan
Average fertility rate in Waukegan is 38.0 births per 1,000 women. Women in the age bracket of 20 to 34 years have the highest fertility rate with 63.0 births per 1,000 women. Women in the age bracket of 20 to 34 years acount for 73.3% of all women with births.
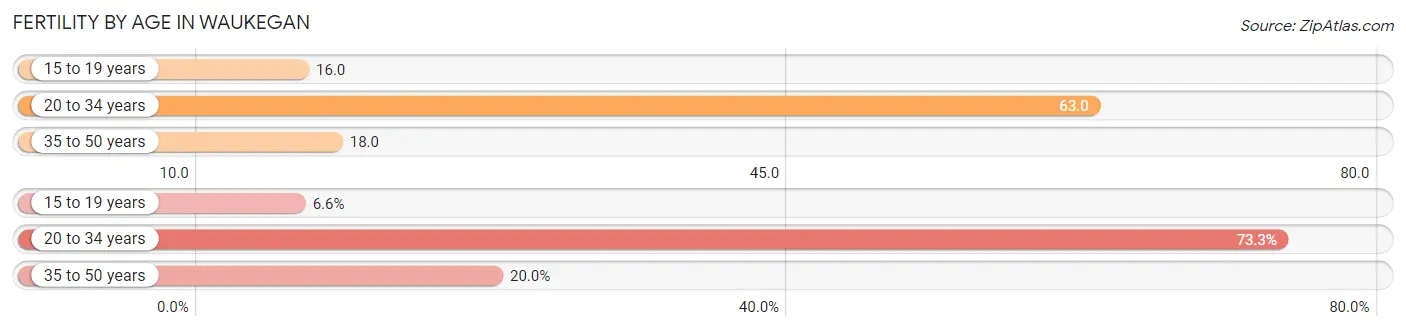
| Age Bracket | Women with Births | Births / 1,000 Women |
| 15 to 19 years | 55 (6.6%) | 16.0 |
| 20 to 34 years | 608 (73.3%) | 63.0 |
| 35 to 50 years | 166 (20.0%) | 18.0 |
| Total | 829 (100.0%) | 38.0 |
Fertility by Age by Marriage Status in Waukegan
59.8% of women with births (829) in Waukegan are married. The highest percentage of unmarried women with births falls into 15 to 19 years age bracket with 100.0% of them unmarried at the time of birth, while the lowest percentage of unmarried women with births belong to 35 to 50 years age bracket with 19.3% of them unmarried.
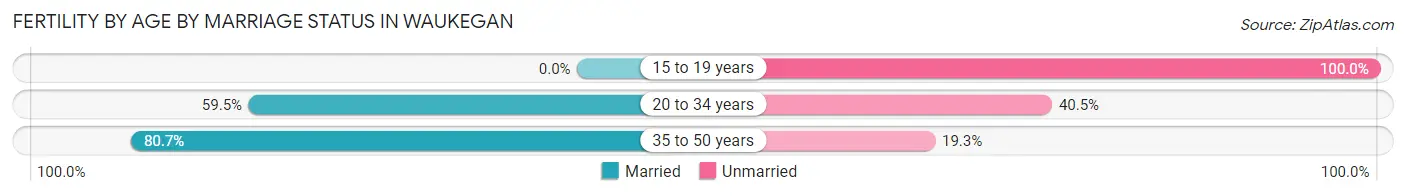
| Age Bracket | Married | Unmarried |
| 15 to 19 years | 0 (0.0%) | 55 (100.0%) |
| 20 to 34 years | 362 (59.5%) | 246 (40.5%) |
| 35 to 50 years | 134 (80.7%) | 32 (19.3%) |
| Total | 496 (59.8%) | 333 (40.2%) |
Fertility by Education in Waukegan
Average fertility rate in Waukegan is 38.0 births per 1,000 women. Women with the education attainment of graduate degree have the highest fertility rate of 70.0 births per 1,000 women, while women with the education attainment of less than high school have the lowest fertility at 30.0 births per 1,000 women. Women with the education attainment of high school diploma represent 31.1% of all women with births.
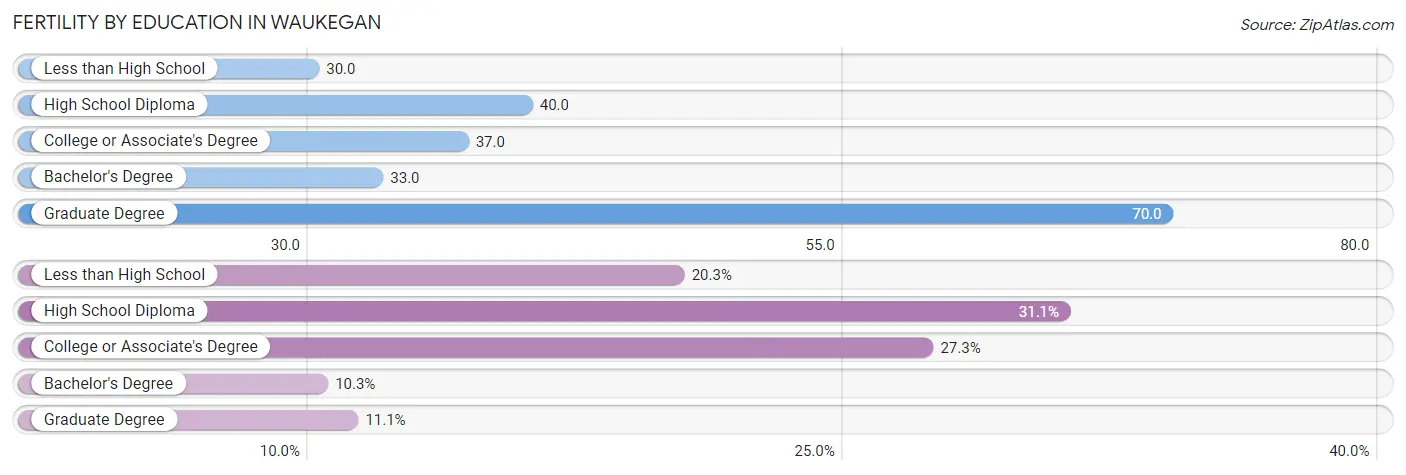
| Educational Attainment | Women with Births | Births / 1,000 Women |
| Less than High School | 168 (20.3%) | 30.0 |
| High School Diploma | 258 (31.1%) | 40.0 |
| College or Associate's Degree | 226 (27.3%) | 37.0 |
| Bachelor's Degree | 85 (10.2%) | 33.0 |
| Graduate Degree | 92 (11.1%) | 70.0 |
| Total | 829 (100.0%) | 38.0 |
Fertility by Education by Marriage Status in Waukegan
40.2% of women with births in Waukegan are unmarried. Women with the educational attainment of bachelor's degree are most likely to be married with 100.0% of them married at childbirth, while women with the educational attainment of high school diploma are least likely to be married with 51.9% of them unmarried at childbirth.
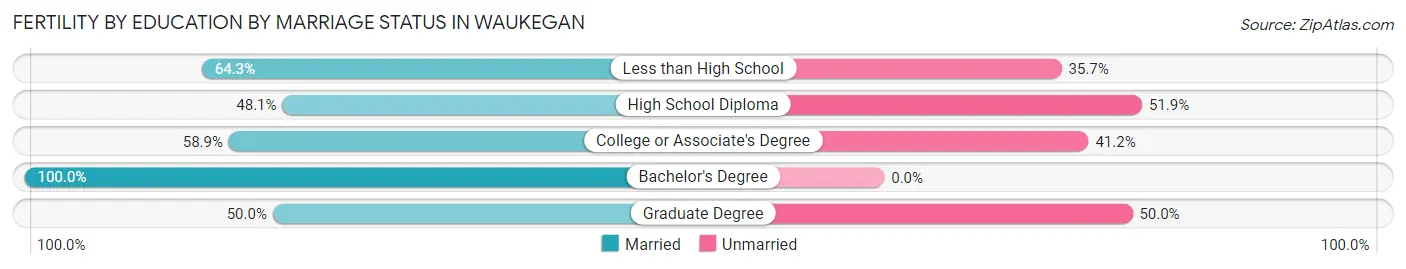
| Educational Attainment | Married | Unmarried |
| Less than High School | 108 (64.3%) | 60 (35.7%) |
| High School Diploma | 124 (48.1%) | 134 (51.9%) |
| College or Associate's Degree | 133 (58.9%) | 93 (41.1%) |
| Bachelor's Degree | 85 (100.0%) | 0 (0.0%) |
| Graduate Degree | 46 (50.0%) | 46 (50.0%) |
| Total | 496 (59.8%) | 333 (40.2%) |
Employment Characteristics in Waukegan
Employment by Class of Employer in Waukegan
Among the 42,896 employed individuals in Waukegan, private company employees (31,767 | 74.1%), not-for-profit organizations (2,729 | 6.4%), and federal government employees (2,695 | 6.3%) make up the most common classes of employment.
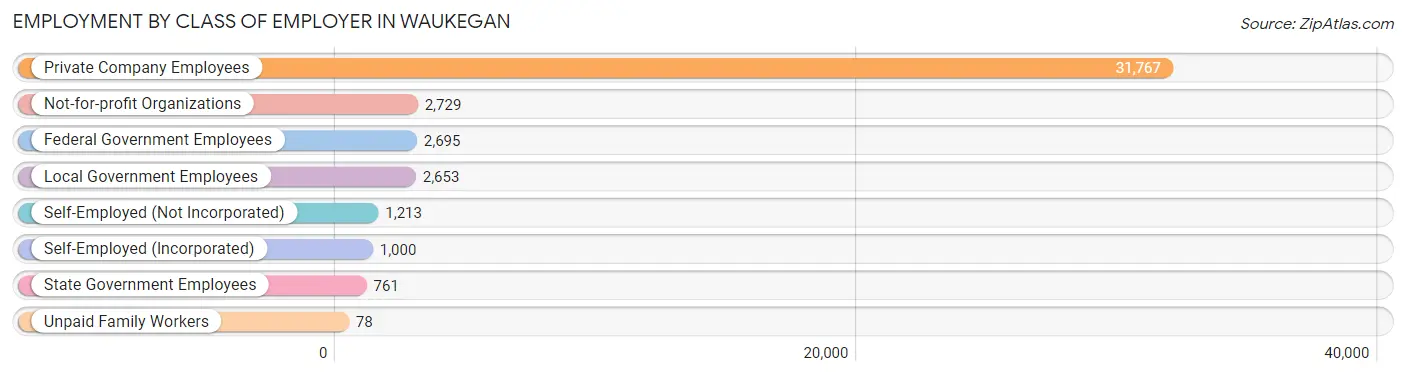
| Employer Class | # Employees | % Employees |
| Private Company Employees | 31,767 | 74.1% |
| Self-Employed (Incorporated) | 1,000 | 2.3% |
| Self-Employed (Not Incorporated) | 1,213 | 2.8% |
| Not-for-profit Organizations | 2,729 | 6.4% |
| Local Government Employees | 2,653 | 6.2% |
| State Government Employees | 761 | 1.8% |
| Federal Government Employees | 2,695 | 6.3% |
| Unpaid Family Workers | 78 | 0.2% |
| Total | 42,896 | 100.0% |
Employment Status by Age in Waukegan
According to the labor force statistics for Waukegan, out of the total population over 16 years of age (69,925), 67.0% or 46,850 individuals are in the labor force, with 5.3% or 2,483 of them unemployed. The age group with the highest labor force participation rate is 35 to 44 years, with 84.4% or 10,733 individuals in the labor force. Within the labor force, the 20 to 24 years age range has the highest percentage of unemployed individuals, with 13.0% or 765 of them being unemployed.
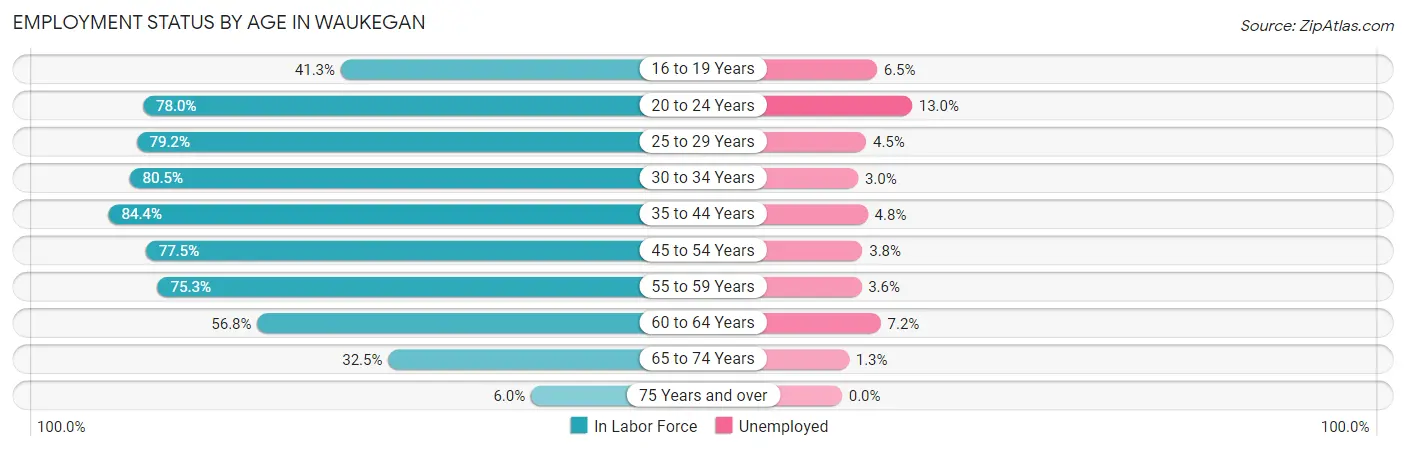
| Age Bracket | In Labor Force | Unemployed |
| 16 to 19 Years | 2,245 (41.3%) | 146 (6.5%) |
| 20 to 24 Years | 5,883 (78.0%) | 765 (13.0%) |
| 25 to 29 Years | 5,344 (79.2%) | 240 (4.5%) |
| 30 to 34 Years | 4,921 (80.5%) | 148 (3.0%) |
| 35 to 44 Years | 10,733 (84.4%) | 515 (4.8%) |
| 45 to 54 Years | 8,613 (77.5%) | 327 (3.8%) |
| 55 to 59 Years | 4,319 (75.3%) | 155 (3.6%) |
| 60 to 64 Years | 2,496 (56.8%) | 180 (7.2%) |
| 65 to 74 Years | 2,096 (32.5%) | 27 (1.3%) |
| 75 Years and over | 221 (6.0%) | 0 (0.0%) |
| Total | 46,850 (67.0%) | 2,483 (5.3%) |
Employment Status by Educational Attainment in Waukegan
According to labor force statistics for Waukegan, 77.8% of individuals (36,427) out of the total population between 25 and 64 years of age (46,821) are in the labor force, with 4.3% or 1,566 of them being unemployed. The group with the highest labor force participation rate are those with the educational attainment of bachelor's degree or higher, with 85.6% or 8,504 individuals in the labor force. Within the labor force, individuals with less than high school education have the highest percentage of unemployment, with 5.8% or 441 of them being unemployed.
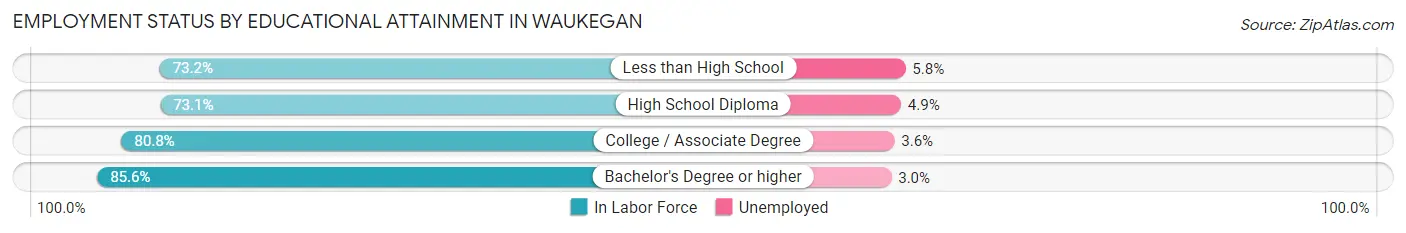
| Educational Attainment | In Labor Force | Unemployed |
| Less than High School | 7,606 (73.2%) | 603 (5.8%) |
| High School Diploma | 10,511 (73.1%) | 705 (4.9%) |
| College / Associate Degree | 9,790 (80.8%) | 436 (3.6%) |
| Bachelor's Degree or higher | 8,504 (85.6%) | 298 (3.0%) |
| Total | 36,427 (77.8%) | 2,013 (4.3%) |
Employment Occupations by Sex in Waukegan
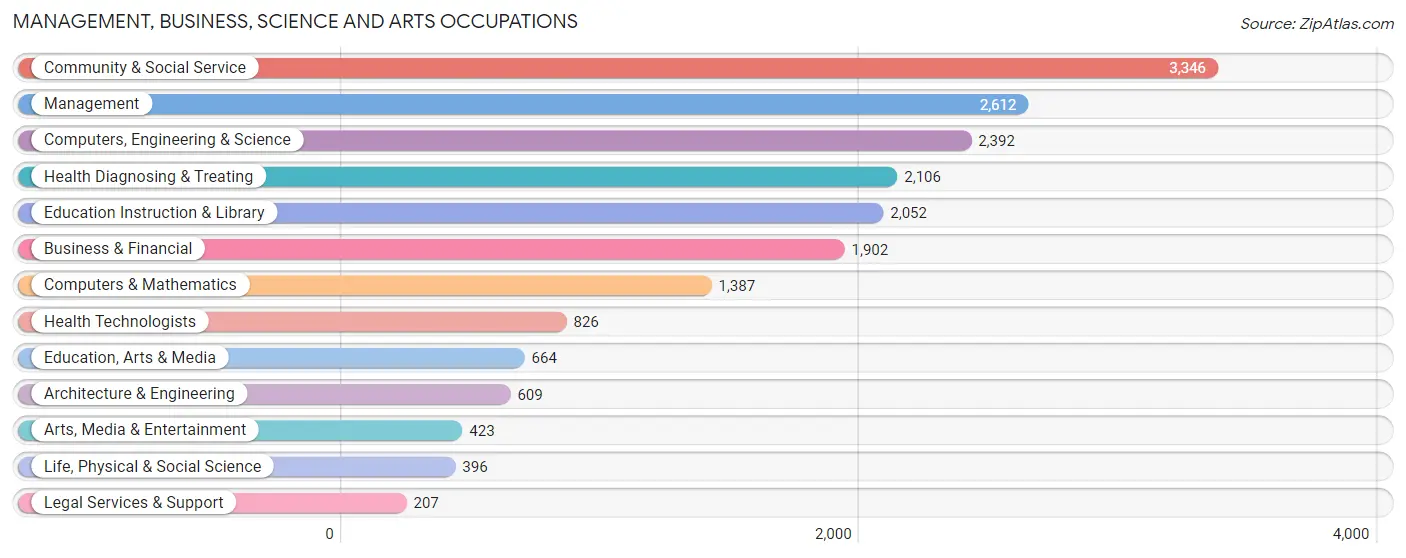
Management, Business, Science and Arts Occupations
The most common Management, Business, Science and Arts occupations in Waukegan are Community & Social Service (3,346 | 7.6%), Management (2,612 | 5.9%), Computers, Engineering & Science (2,392 | 5.4%), Health Diagnosing & Treating (2,106 | 4.8%), and Education Instruction & Library (2,052 | 4.7%).
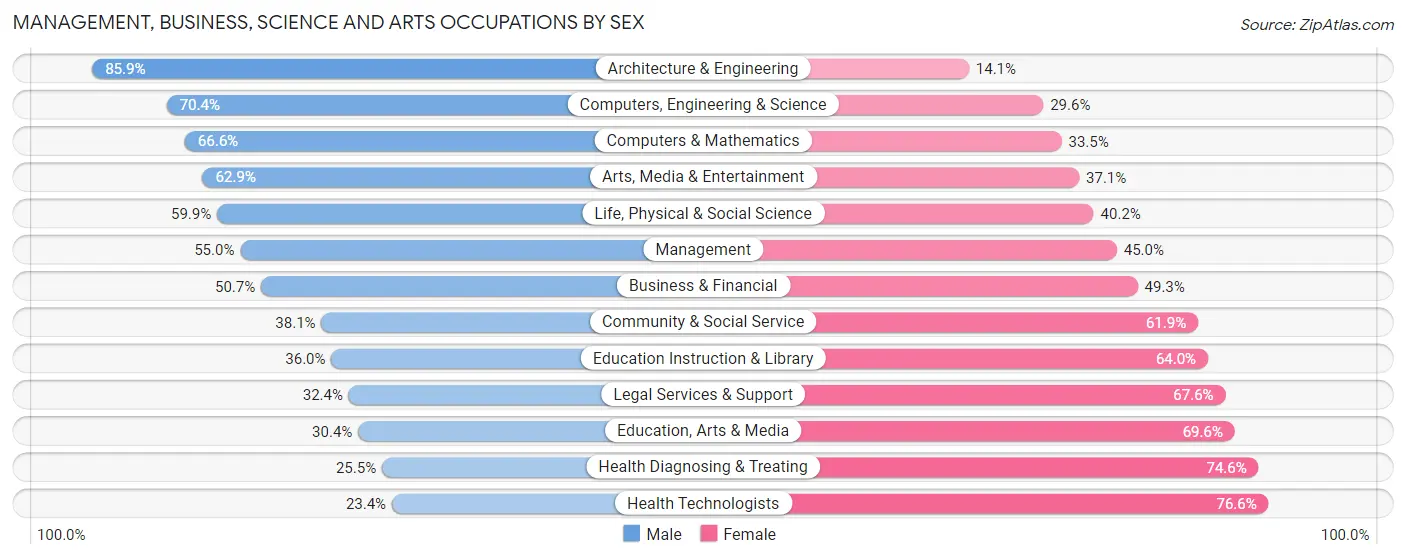
Management, Business, Science and Arts Occupations by Sex
Within the Management, Business, Science and Arts occupations in Waukegan, the most male-oriented occupations are Architecture & Engineering (85.9%), Computers, Engineering & Science (70.4%), and Computers & Mathematics (66.5%), while the most female-oriented occupations are Health Technologists (76.6%), Health Diagnosing & Treating (74.6%), and Education, Arts & Media (69.6%).
| Occupation | Male | Female |
| Management | 1,437 (55.0%) | 1,175 (45.0%) |
| Business & Financial | 964 (50.7%) | 938 (49.3%) |
| Computers, Engineering & Science | 1,683 (70.4%) | 709 (29.6%) |
| Computers & Mathematics | 923 (66.5%) | 464 (33.5%) |
| Architecture & Engineering | 523 (85.9%) | 86 (14.1%) |
| Life, Physical & Social Science | 237 (59.9%) | 159 (40.2%) |
| Community & Social Service | 1,274 (38.1%) | 2,072 (61.9%) |
| Education, Arts & Media | 202 (30.4%) | 462 (69.6%) |
| Legal Services & Support | 67 (32.4%) | 140 (67.6%) |
| Education Instruction & Library | 739 (36.0%) | 1,313 (64.0%) |
| Arts, Media & Entertainment | 266 (62.9%) | 157 (37.1%) |
| Health Diagnosing & Treating | 536 (25.5%) | 1,570 (74.6%) |
| Health Technologists | 193 (23.4%) | 633 (76.6%) |
| Total (Category) | 5,894 (47.7%) | 6,464 (52.3%) |
| Total (Overall) | 24,203 (55.2%) | 19,666 (44.8%) |
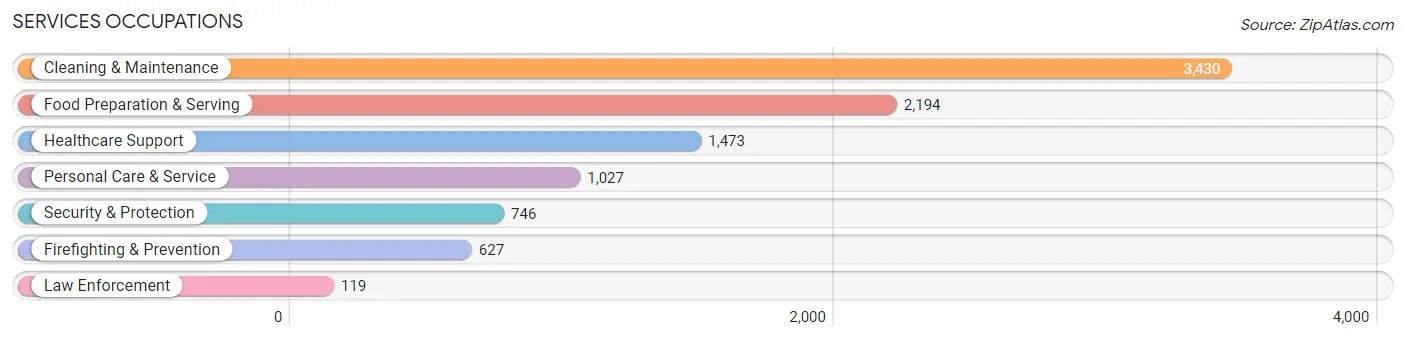
Services Occupations
The most common Services occupations in Waukegan are Cleaning & Maintenance (3,430 | 7.8%), Food Preparation & Serving (2,194 | 5.0%), Healthcare Support (1,473 | 3.4%), Personal Care & Service (1,027 | 2.3%), and Security & Protection (746 | 1.7%).
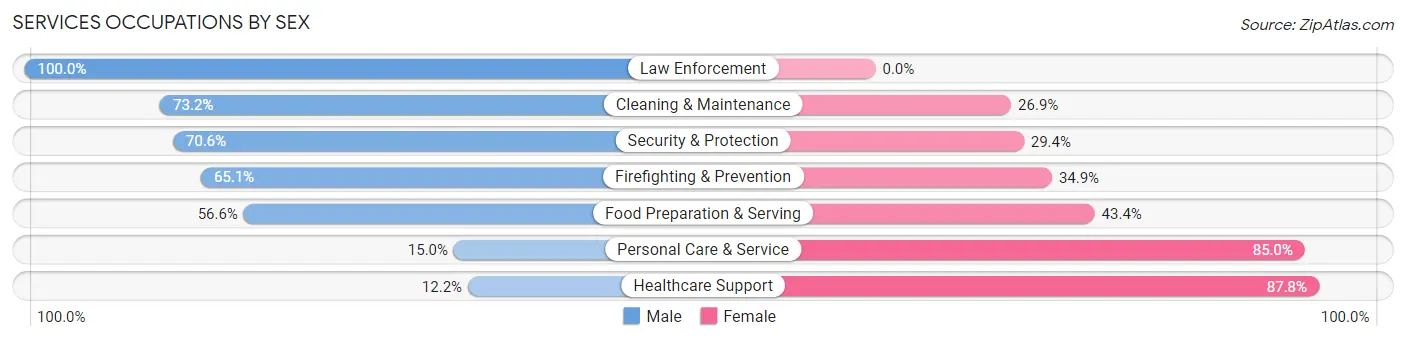
Services Occupations by Sex
Within the Services occupations in Waukegan, the most male-oriented occupations are Law Enforcement (100.0%), Cleaning & Maintenance (73.2%), and Security & Protection (70.6%), while the most female-oriented occupations are Healthcare Support (87.8%), Personal Care & Service (85.0%), and Food Preparation & Serving (43.4%).
| Occupation | Male | Female |
| Healthcare Support | 180 (12.2%) | 1,293 (87.8%) |
| Security & Protection | 527 (70.6%) | 219 (29.4%) |
| Firefighting & Prevention | 408 (65.1%) | 219 (34.9%) |
| Law Enforcement | 119 (100.0%) | 0 (0.0%) |
| Food Preparation & Serving | 1,242 (56.6%) | 952 (43.4%) |
| Cleaning & Maintenance | 2,509 (73.2%) | 921 (26.9%) |
| Personal Care & Service | 154 (15.0%) | 873 (85.0%) |
| Total (Category) | 4,612 (52.0%) | 4,258 (48.0%) |
| Total (Overall) | 24,203 (55.2%) | 19,666 (44.8%) |
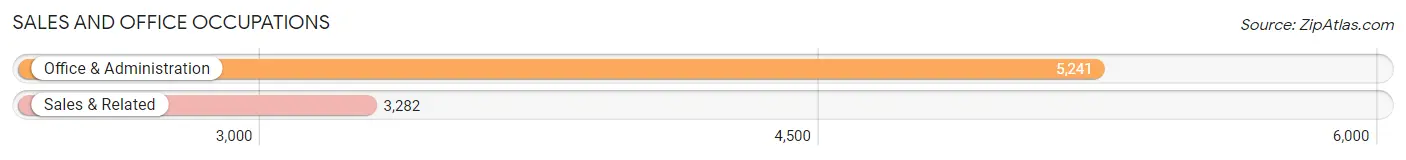
Sales and Office Occupations
The most common Sales and Office occupations in Waukegan are Office & Administration (5,241 | 11.9%), and Sales & Related (3,282 | 7.5%).
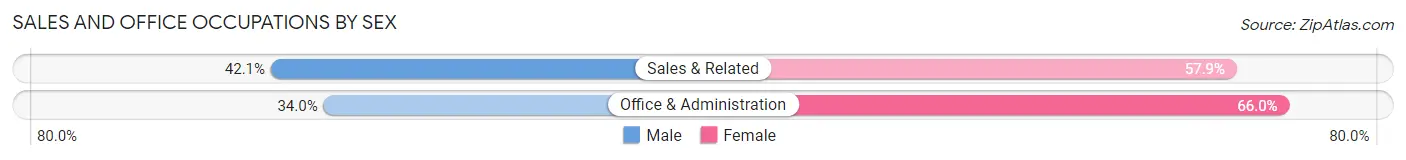
Sales and Office Occupations by Sex
| Occupation | Male | Female |
| Sales & Related | 1,382 (42.1%) | 1,900 (57.9%) |
| Office & Administration | 1,783 (34.0%) | 3,458 (66.0%) |
| Total (Category) | 3,165 (37.1%) | 5,358 (62.9%) |
| Total (Overall) | 24,203 (55.2%) | 19,666 (44.8%) |
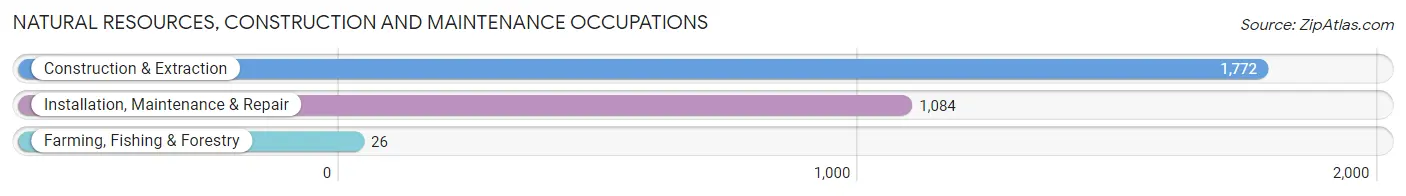
Natural Resources, Construction and Maintenance Occupations
The most common Natural Resources, Construction and Maintenance occupations in Waukegan are Construction & Extraction (1,772 | 4.0%), Installation, Maintenance & Repair (1,084 | 2.5%), and Farming, Fishing & Forestry (26 | 0.1%).
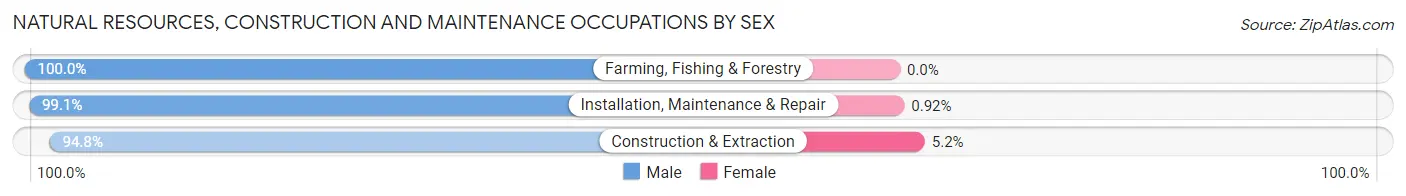
Natural Resources, Construction and Maintenance Occupations by Sex
| Occupation | Male | Female |
| Farming, Fishing & Forestry | 26 (100.0%) | 0 (0.0%) |
| Construction & Extraction | 1,680 (94.8%) | 92 (5.2%) |
| Installation, Maintenance & Repair | 1,074 (99.1%) | 10 (0.9%) |
| Total (Category) | 2,780 (96.5%) | 102 (3.5%) |
| Total (Overall) | 24,203 (55.2%) | 19,666 (44.8%) |
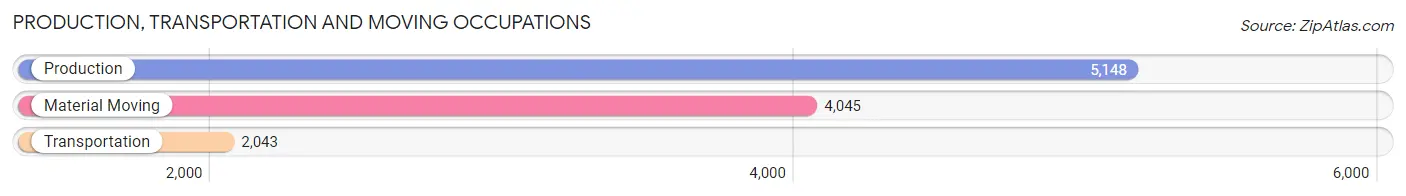
Production, Transportation and Moving Occupations
The most common Production, Transportation and Moving occupations in Waukegan are Production (5,148 | 11.7%), Material Moving (4,045 | 9.2%), and Transportation (2,043 | 4.7%).
Production, Transportation and Moving Occupations by Sex
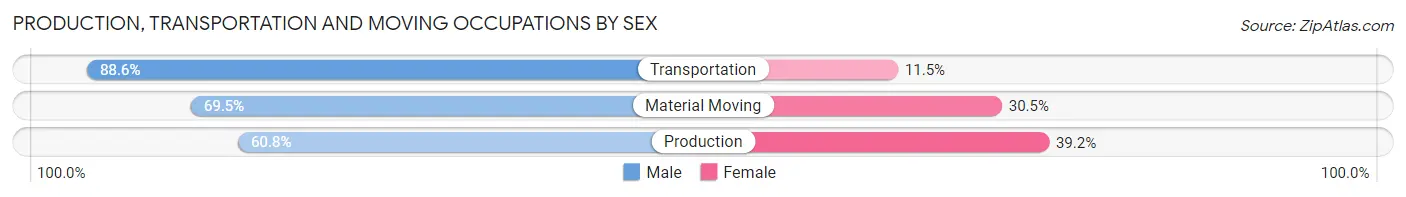
| Occupation | Male | Female |
| Production | 3,132 (60.8%) | 2,016 (39.2%) |
| Transportation | 1,809 (88.5%) | 234 (11.5%) |
| Material Moving | 2,811 (69.5%) | 1,234 (30.5%) |
| Total (Category) | 7,752 (69.0%) | 3,484 (31.0%) |
| Total (Overall) | 24,203 (55.2%) | 19,666 (44.8%) |
Employment Industries by Sex in Waukegan
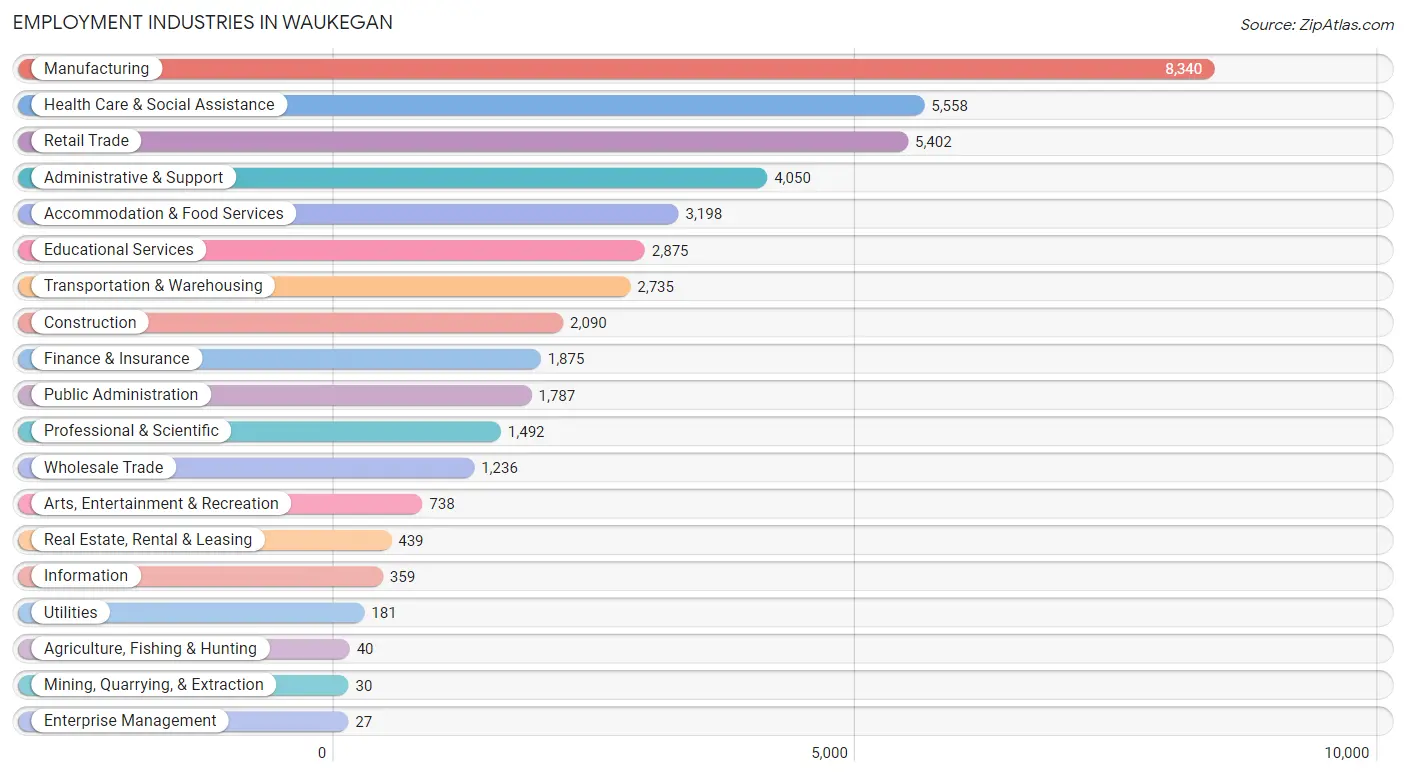
Employment Industries in Waukegan
The major employment industries in Waukegan include Manufacturing (8,340 | 19.0%), Health Care & Social Assistance (5,558 | 12.7%), Retail Trade (5,402 | 12.3%), Administrative & Support (4,050 | 9.2%), and Accommodation & Food Services (3,198 | 7.3%).
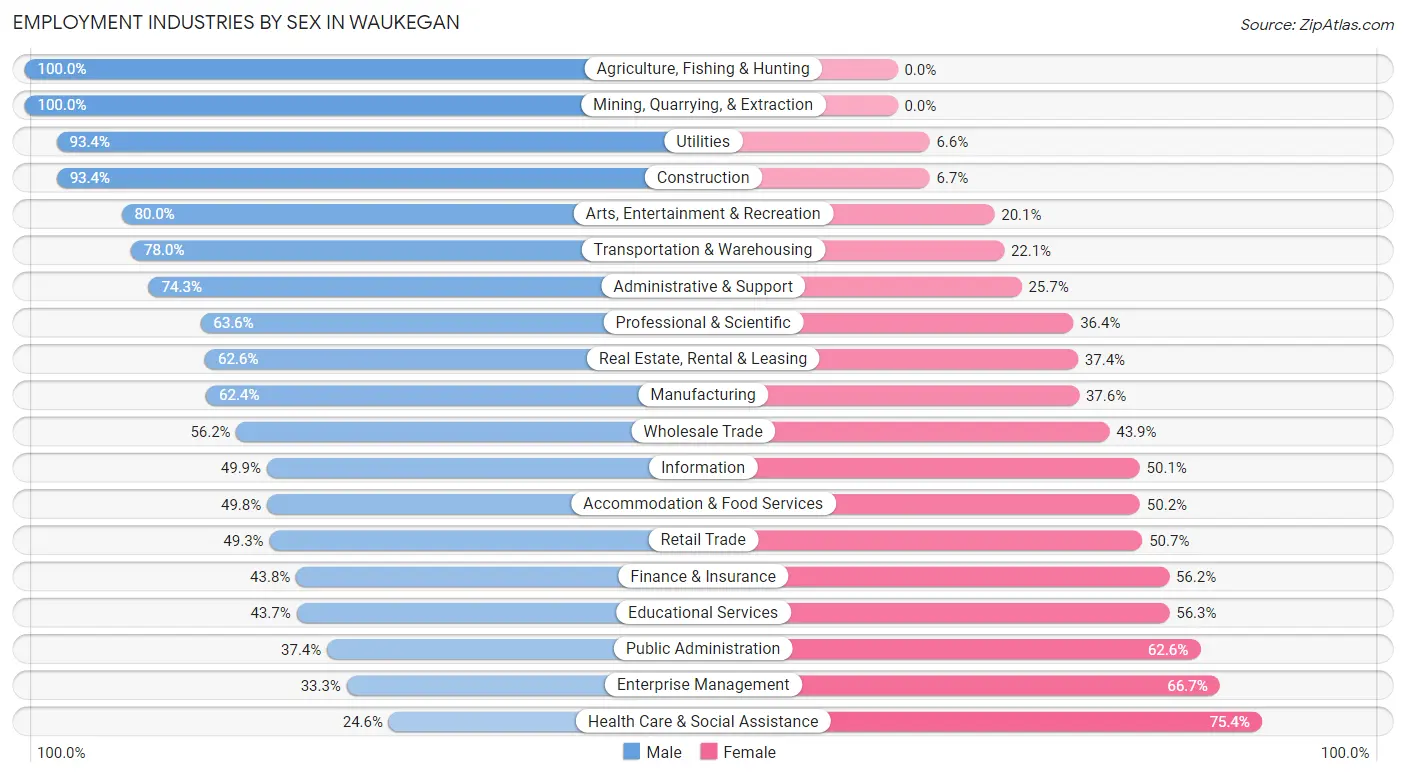
Employment Industries by Sex in Waukegan
The Waukegan industries that see more men than women are Agriculture, Fishing & Hunting (100.0%), Mining, Quarrying, & Extraction (100.0%), and Utilities (93.4%), whereas the industries that tend to have a higher number of women are Health Care & Social Assistance (75.4%), Enterprise Management (66.7%), and Public Administration (62.6%).
| Industry | Male | Female |
| Agriculture, Fishing & Hunting | 40 (100.0%) | 0 (0.0%) |
| Mining, Quarrying, & Extraction | 30 (100.0%) | 0 (0.0%) |
| Construction | 1,951 (93.3%) | 139 (6.7%) |
| Manufacturing | 5,206 (62.4%) | 3,134 (37.6%) |
| Wholesale Trade | 694 (56.1%) | 542 (43.9%) |
| Retail Trade | 2,665 (49.3%) | 2,737 (50.7%) |
| Transportation & Warehousing | 2,132 (77.9%) | 603 (22.1%) |
| Utilities | 169 (93.4%) | 12 (6.6%) |
| Information | 179 (49.9%) | 180 (50.1%) |
| Finance & Insurance | 821 (43.8%) | 1,054 (56.2%) |
| Real Estate, Rental & Leasing | 275 (62.6%) | 164 (37.4%) |
| Professional & Scientific | 949 (63.6%) | 543 (36.4%) |
| Enterprise Management | 9 (33.3%) | 18 (66.7%) |
| Administrative & Support | 3,010 (74.3%) | 1,040 (25.7%) |
| Educational Services | 1,257 (43.7%) | 1,618 (56.3%) |
| Health Care & Social Assistance | 1,368 (24.6%) | 4,190 (75.4%) |
| Arts, Entertainment & Recreation | 590 (79.9%) | 148 (20.1%) |
| Accommodation & Food Services | 1,593 (49.8%) | 1,605 (50.2%) |
| Public Administration | 668 (37.4%) | 1,119 (62.6%) |
| Total | 24,203 (55.2%) | 19,666 (44.8%) |
Education in Waukegan
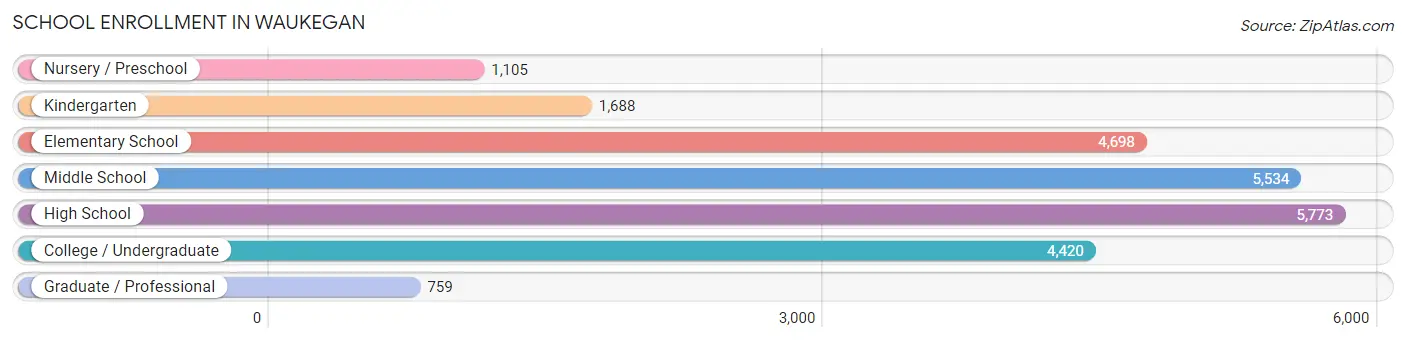
School Enrollment in Waukegan
The most common levels of schooling among the 23,977 students in Waukegan are high school (5,773 | 24.1%), middle school (5,534 | 23.1%), and elementary school (4,698 | 19.6%).
| School Level | # Students | % Students |
| Nursery / Preschool | 1,105 | 4.6% |
| Kindergarten | 1,688 | 7.0% |
| Elementary School | 4,698 | 19.6% |
| Middle School | 5,534 | 23.1% |
| High School | 5,773 | 24.1% |
| College / Undergraduate | 4,420 | 18.4% |
| Graduate / Professional | 759 | 3.2% |
| Total | 23,977 | 100.0% |
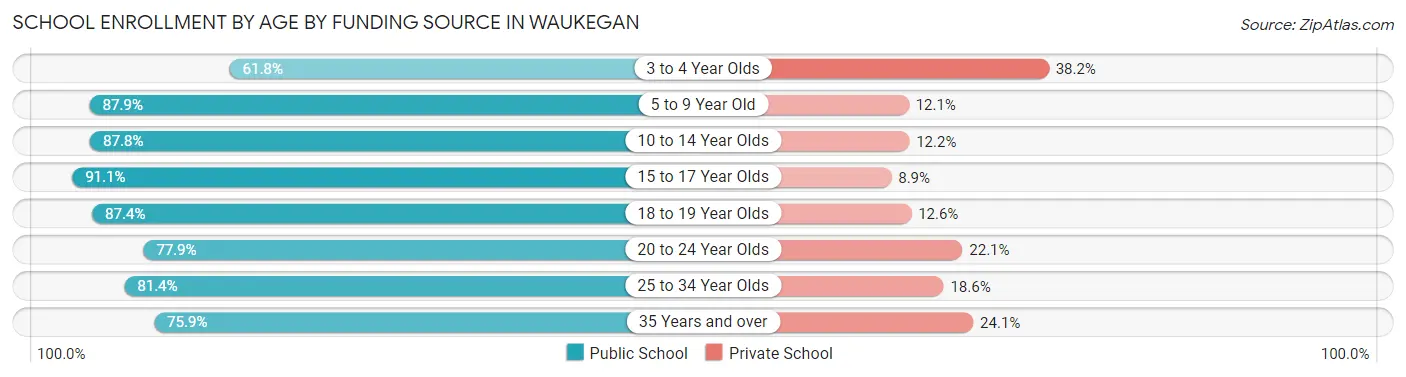
School Enrollment by Age by Funding Source in Waukegan
Out of a total of 23,977 students who are enrolled in schools in Waukegan, 3,477 (14.5%) attend a private institution, while the remaining 20,500 (85.5%) are enrolled in public schools. The age group of 3 to 4 year olds has the highest likelihood of being enrolled in private schools, with 351 (38.2% in the age bracket) enrolled. Conversely, the age group of 15 to 17 year olds has the lowest likelihood of being enrolled in a private school, with 3,779 (91.1% in the age bracket) attending a public institution.
| Age Bracket | Public School | Private School |
| 3 to 4 Year Olds | 568 (61.8%) | 351 (38.2%) |
| 5 to 9 Year Old | 5,319 (87.9%) | 733 (12.1%) |
| 10 to 14 Year Olds | 5,610 (87.8%) | 780 (12.2%) |
| 15 to 17 Year Olds | 3,779 (91.1%) | 368 (8.9%) |
| 18 to 19 Year Olds | 1,334 (87.4%) | 192 (12.6%) |
| 20 to 24 Year Olds | 1,952 (77.9%) | 554 (22.1%) |
| 25 to 34 Year Olds | 1,147 (81.4%) | 262 (18.6%) |
| 35 Years and over | 780 (75.9%) | 248 (24.1%) |
| Total | 20,500 (85.5%) | 3,477 (14.5%) |
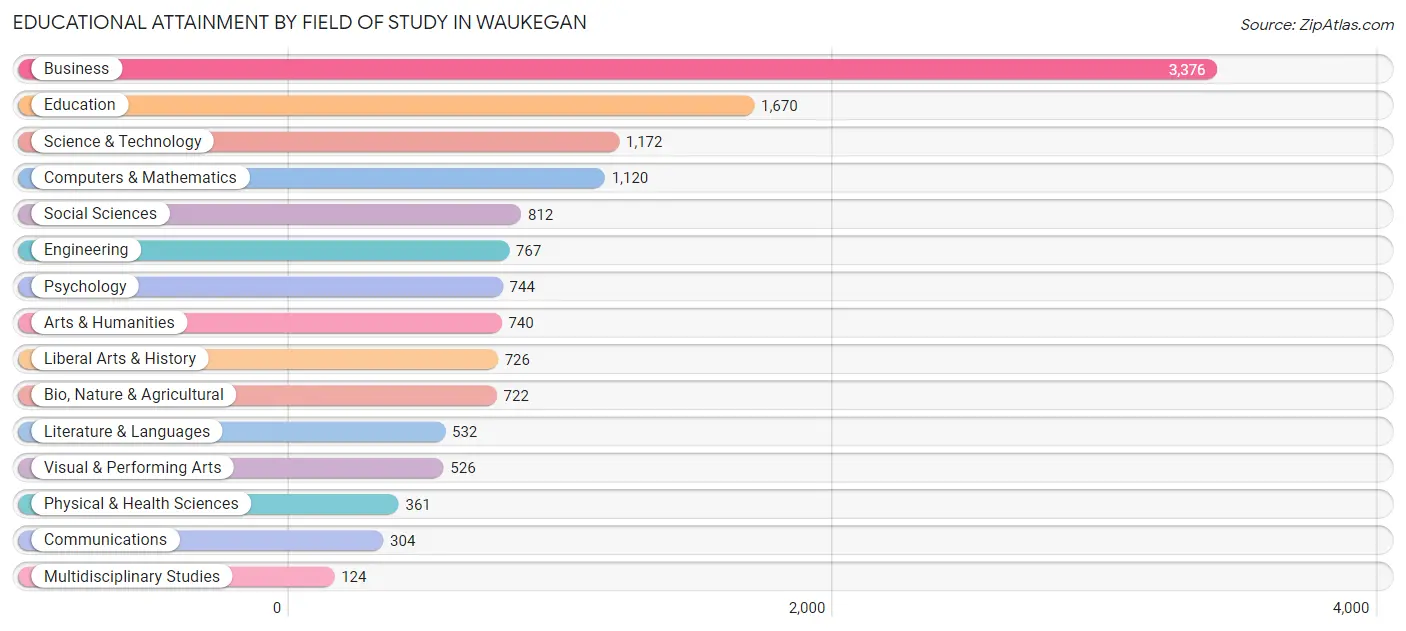
Educational Attainment by Field of Study in Waukegan
Business (3,376 | 24.6%), education (1,670 | 12.2%), science & technology (1,172 | 8.6%), computers & mathematics (1,120 | 8.2%), and social sciences (812 | 5.9%) are the most common fields of study among 13,696 individuals in Waukegan who have obtained a bachelor's degree or higher.
| Field of Study | # Graduates | % Graduates |
| Computers & Mathematics | 1,120 | 8.2% |
| Bio, Nature & Agricultural | 722 | 5.3% |
| Physical & Health Sciences | 361 | 2.6% |
| Psychology | 744 | 5.4% |
| Social Sciences | 812 | 5.9% |
| Engineering | 767 | 5.6% |
| Multidisciplinary Studies | 124 | 0.9% |
| Science & Technology | 1,172 | 8.6% |
| Business | 3,376 | 24.6% |
| Education | 1,670 | 12.2% |
| Literature & Languages | 532 | 3.9% |
| Liberal Arts & History | 726 | 5.3% |
| Visual & Performing Arts | 526 | 3.8% |
| Communications | 304 | 2.2% |
| Arts & Humanities | 740 | 5.4% |
| Total | 13,696 | 100.0% |
Transportation & Commute in Waukegan
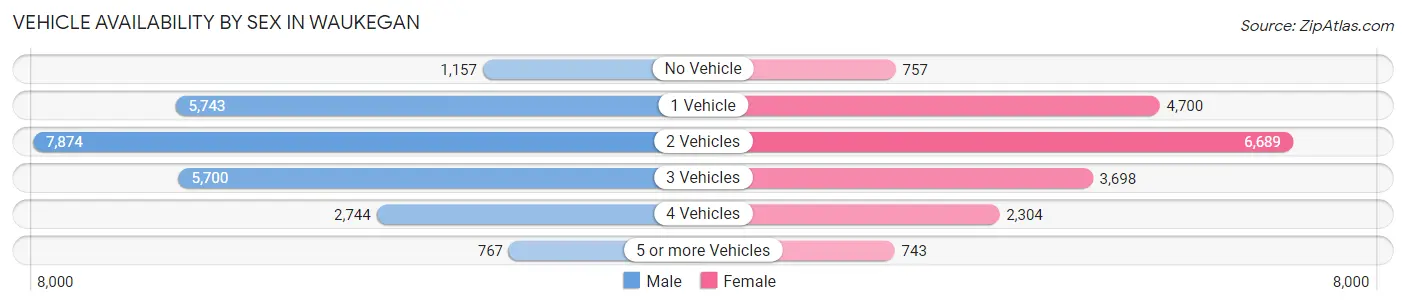
Vehicle Availability by Sex in Waukegan
The most prevalent vehicle ownership categories in Waukegan are males with 2 vehicles (7,874, accounting for 32.8%) and females with 2 vehicles (6,689, making up 41.7%).
| Vehicles Available | Male | Female |
| No Vehicle | 1,157 (4.8%) | 757 (4.0%) |
| 1 Vehicle | 5,743 (23.9%) | 4,700 (24.9%) |
| 2 Vehicles | 7,874 (32.8%) | 6,689 (35.4%) |
| 3 Vehicles | 5,700 (23.8%) | 3,698 (19.6%) |
| 4 Vehicles | 2,744 (11.4%) | 2,304 (12.2%) |
| 5 or more Vehicles | 767 (3.2%) | 743 (3.9%) |
| Total | 23,985 (100.0%) | 18,891 (100.0%) |
Commute Time in Waukegan
The most frequently occuring commute durations in Waukegan are 30 to 34 minutes (6,851 commuters, 16.9%), 15 to 19 minutes (6,207 commuters, 15.3%), and 20 to 24 minutes (5,729 commuters, 14.2%).
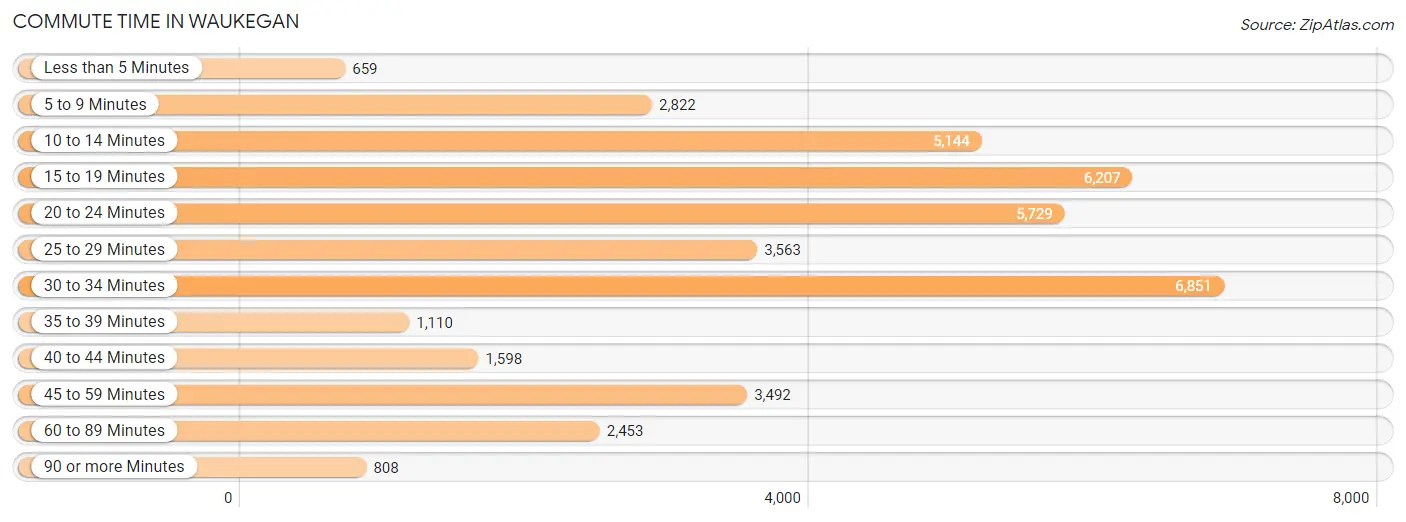
| Commute Time | # Commuters | % Commuters |
| Less than 5 Minutes | 659 | 1.6% |
| 5 to 9 Minutes | 2,822 | 7.0% |
| 10 to 14 Minutes | 5,144 | 12.7% |
| 15 to 19 Minutes | 6,207 | 15.3% |
| 20 to 24 Minutes | 5,729 | 14.2% |
| 25 to 29 Minutes | 3,563 | 8.8% |
| 30 to 34 Minutes | 6,851 | 16.9% |
| 35 to 39 Minutes | 1,110 | 2.8% |
| 40 to 44 Minutes | 1,598 | 4.0% |
| 45 to 59 Minutes | 3,492 | 8.6% |
| 60 to 89 Minutes | 2,453 | 6.1% |
| 90 or more Minutes | 808 | 2.0% |
Commute Time by Sex in Waukegan
The most common commute times in Waukegan are 30 to 34 minutes (4,154 commuters, 18.2%) for males and 15 to 19 minutes (2,816 commuters, 15.9%) for females.
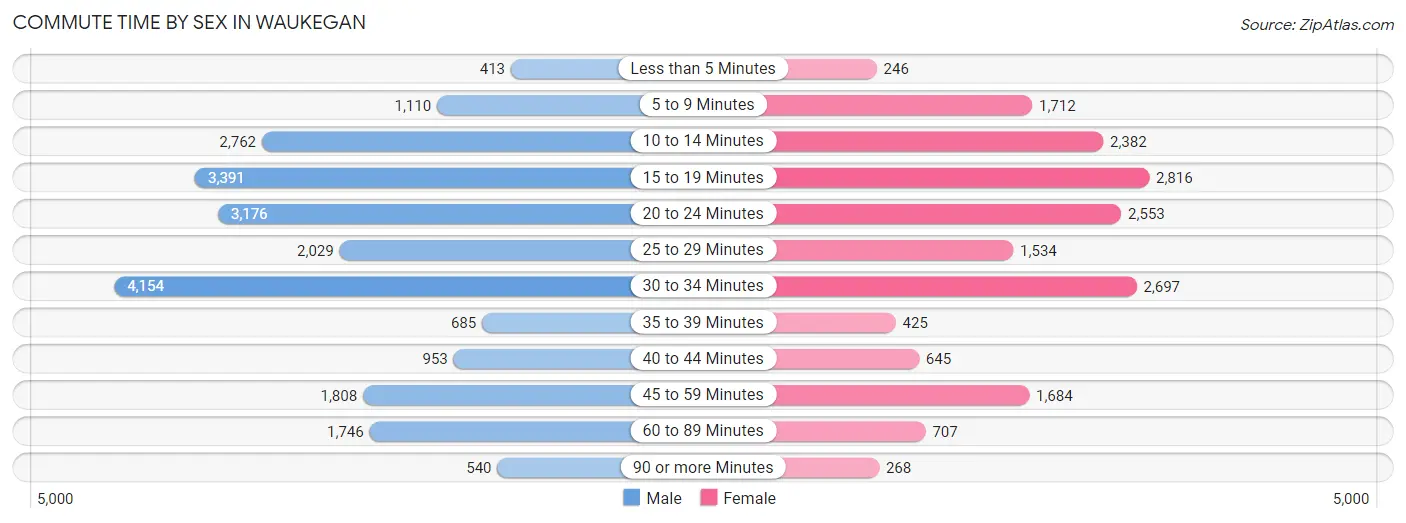
| Commute Time | Male | Female |
| Less than 5 Minutes | 413 (1.8%) | 246 (1.4%) |
| 5 to 9 Minutes | 1,110 (4.9%) | 1,712 (9.7%) |
| 10 to 14 Minutes | 2,762 (12.1%) | 2,382 (13.5%) |
| 15 to 19 Minutes | 3,391 (14.9%) | 2,816 (15.9%) |
| 20 to 24 Minutes | 3,176 (14.0%) | 2,553 (14.4%) |
| 25 to 29 Minutes | 2,029 (8.9%) | 1,534 (8.7%) |
| 30 to 34 Minutes | 4,154 (18.2%) | 2,697 (15.3%) |
| 35 to 39 Minutes | 685 (3.0%) | 425 (2.4%) |
| 40 to 44 Minutes | 953 (4.2%) | 645 (3.6%) |
| 45 to 59 Minutes | 1,808 (7.9%) | 1,684 (9.5%) |
| 60 to 89 Minutes | 1,746 (7.7%) | 707 (4.0%) |
| 90 or more Minutes | 540 (2.4%) | 268 (1.5%) |
Time of Departure to Work by Sex in Waukegan
The most frequent times of departure to work in Waukegan are 6:00 AM to 6:29 AM (2,944, 12.9%) for males and 7:30 AM to 7:59 AM (2,156, 12.2%) for females.
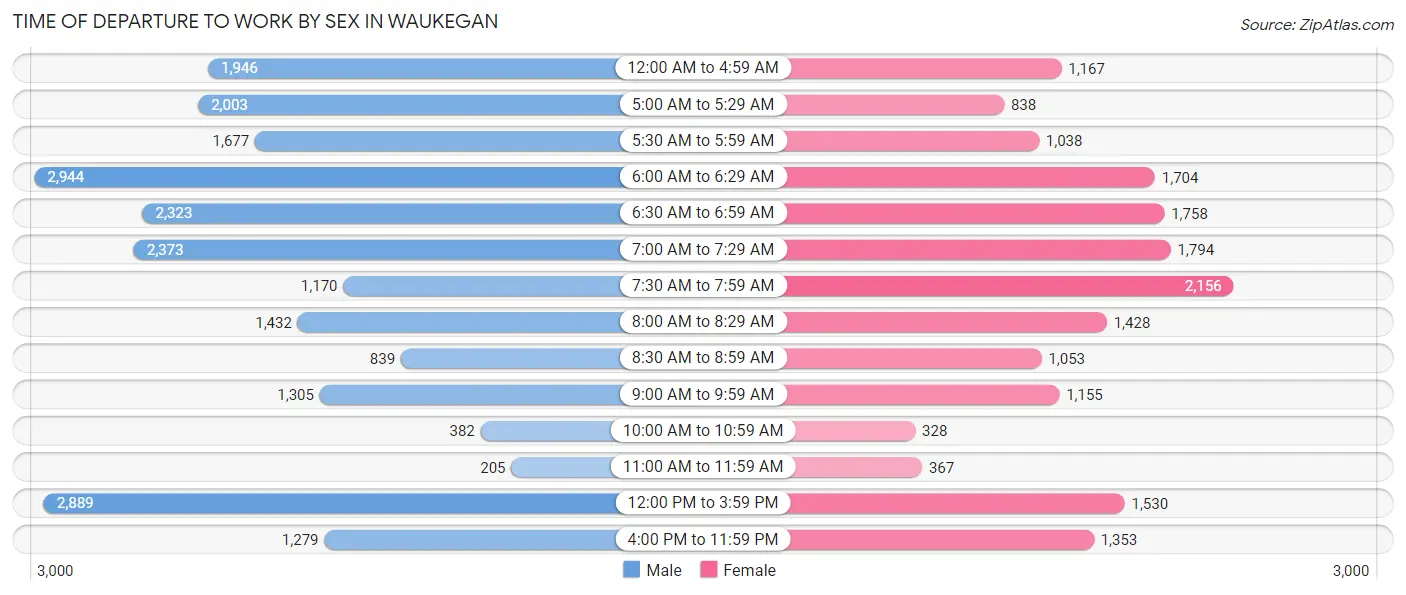
| Time of Departure | Male | Female |
| 12:00 AM to 4:59 AM | 1,946 (8.6%) | 1,167 (6.6%) |
| 5:00 AM to 5:29 AM | 2,003 (8.8%) | 838 (4.7%) |
| 5:30 AM to 5:59 AM | 1,677 (7.4%) | 1,038 (5.9%) |
| 6:00 AM to 6:29 AM | 2,944 (12.9%) | 1,704 (9.6%) |
| 6:30 AM to 6:59 AM | 2,323 (10.2%) | 1,758 (10.0%) |
| 7:00 AM to 7:29 AM | 2,373 (10.4%) | 1,794 (10.2%) |
| 7:30 AM to 7:59 AM | 1,170 (5.1%) | 2,156 (12.2%) |
| 8:00 AM to 8:29 AM | 1,432 (6.3%) | 1,428 (8.1%) |
| 8:30 AM to 8:59 AM | 839 (3.7%) | 1,053 (6.0%) |
| 9:00 AM to 9:59 AM | 1,305 (5.7%) | 1,155 (6.5%) |
| 10:00 AM to 10:59 AM | 382 (1.7%) | 328 (1.9%) |
| 11:00 AM to 11:59 AM | 205 (0.9%) | 367 (2.1%) |
| 12:00 PM to 3:59 PM | 2,889 (12.7%) | 1,530 (8.7%) |
| 4:00 PM to 11:59 PM | 1,279 (5.6%) | 1,353 (7.7%) |
| Total | 22,767 (100.0%) | 17,669 (100.0%) |
Housing Occupancy in Waukegan
Occupancy by Ownership in Waukegan
Of the total 31,195 dwellings in Waukegan, owner-occupied units account for 15,249 (48.9%), while renter-occupied units make up 15,946 (51.1%).
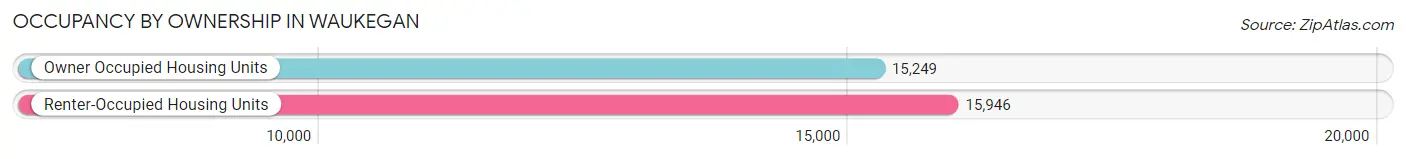
| Occupancy | # Housing Units | % Housing Units |
| Owner Occupied Housing Units | 15,249 | 48.9% |
| Renter-Occupied Housing Units | 15,946 | 51.1% |
| Total Occupied Housing Units | 31,195 | 100.0% |
Occupancy by Household Size in Waukegan
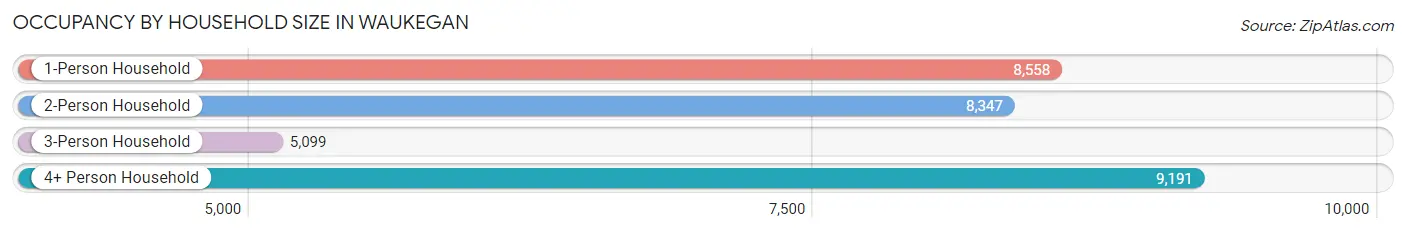
| Household Size | # Housing Units | % Housing Units |
| 1-Person Household | 8,558 | 27.4% |
| 2-Person Household | 8,347 | 26.8% |
| 3-Person Household | 5,099 | 16.4% |
| 4+ Person Household | 9,191 | 29.5% |
| Total Housing Units | 31,195 | 100.0% |
Occupancy by Ownership by Household Size in Waukegan
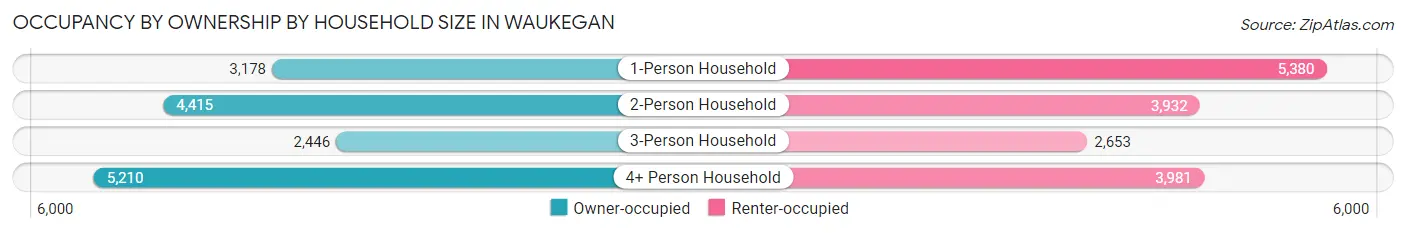
| Household Size | Owner-occupied | Renter-occupied |
| 1-Person Household | 3,178 (37.1%) | 5,380 (62.9%) |
| 2-Person Household | 4,415 (52.9%) | 3,932 (47.1%) |
| 3-Person Household | 2,446 (48.0%) | 2,653 (52.0%) |
| 4+ Person Household | 5,210 (56.7%) | 3,981 (43.3%) |
| Total Housing Units | 15,249 (48.9%) | 15,946 (51.1%) |
Occupancy by Educational Attainment in Waukegan
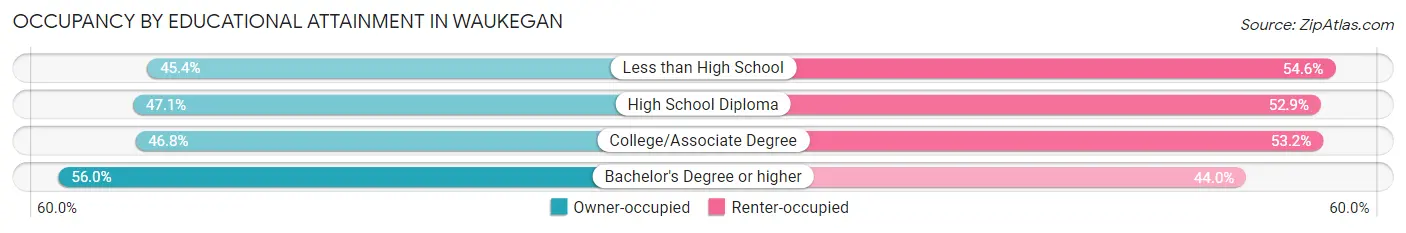
| Household Size | Owner-occupied | Renter-occupied |
| Less than High School | 2,647 (45.4%) | 3,182 (54.6%) |
| High School Diploma | 4,116 (47.1%) | 4,621 (52.9%) |
| College/Associate Degree | 4,219 (46.8%) | 4,789 (53.2%) |
| Bachelor's Degree or higher | 4,267 (56.0%) | 3,354 (44.0%) |
Occupancy by Age of Householder in Waukegan
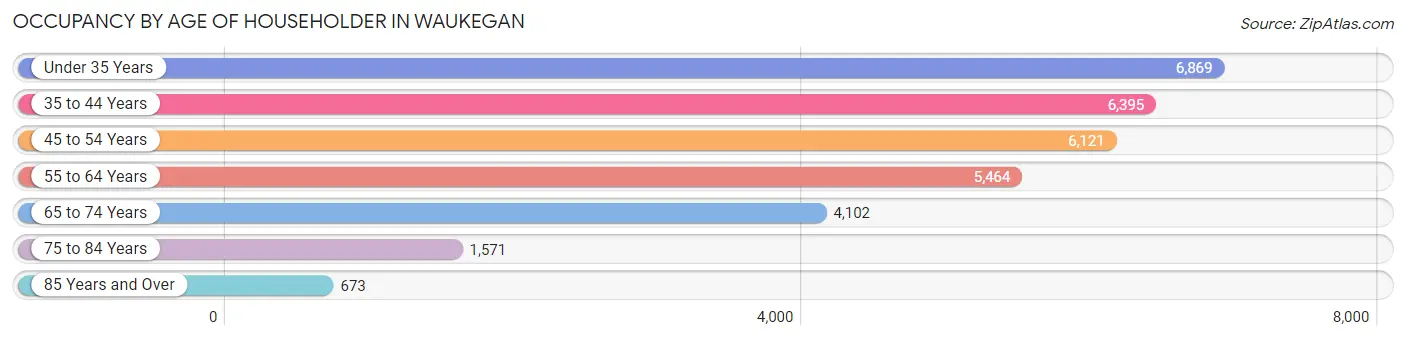
| Age Bracket | # Households | % Households |
| Under 35 Years | 6,869 | 22.0% |
| 35 to 44 Years | 6,395 | 20.5% |
| 45 to 54 Years | 6,121 | 19.6% |
| 55 to 64 Years | 5,464 | 17.5% |
| 65 to 74 Years | 4,102 | 13.2% |
| 75 to 84 Years | 1,571 | 5.0% |
| 85 Years and Over | 673 | 2.2% |
| Total | 31,195 | 100.0% |
Housing Finances in Waukegan
Median Income by Occupancy in Waukegan
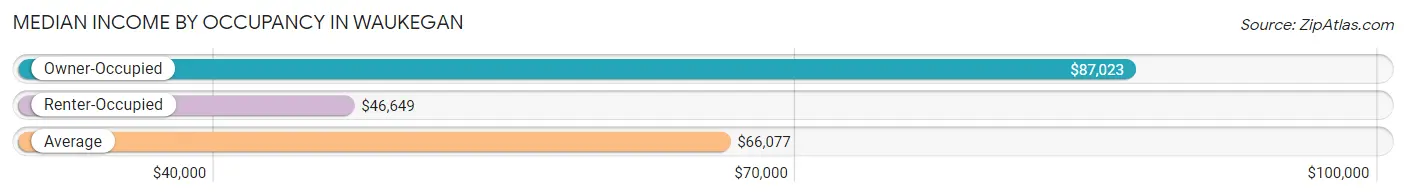
| Occupancy Type | # Households | Median Income |
| Owner-Occupied | 15,249 (48.9%) | $87,023 |
| Renter-Occupied | 15,946 (51.1%) | $46,649 |
| Average | 31,195 (100.0%) | $66,077 |
Occupancy by Householder Income Bracket in Waukegan
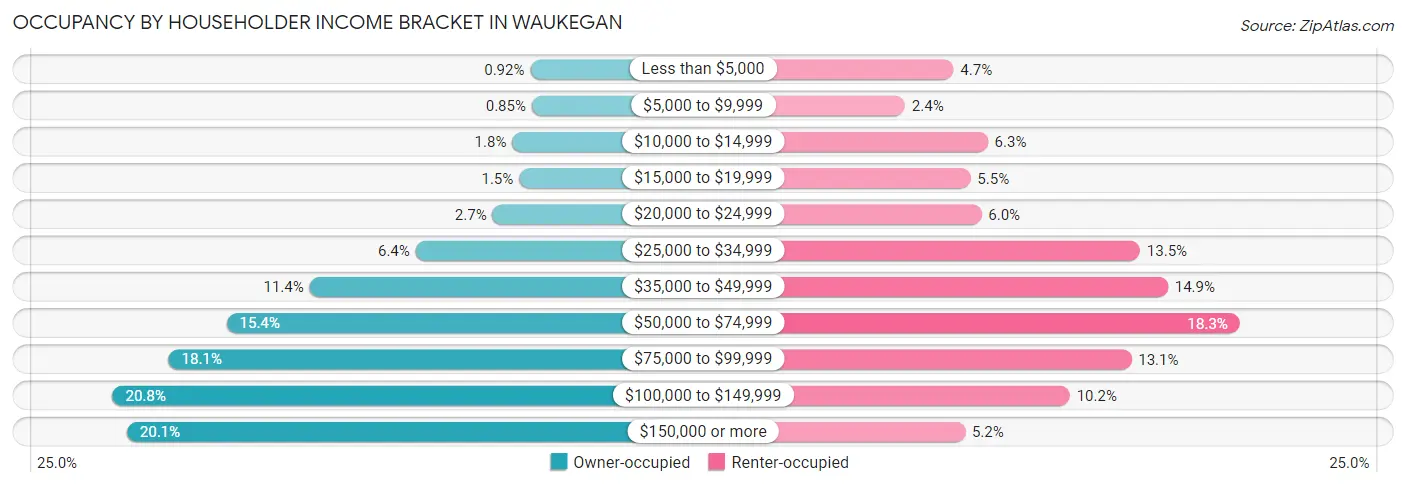
| Income Bracket | Owner-occupied | Renter-occupied |
| Less than $5,000 | 141 (0.9%) | 743 (4.7%) |
| $5,000 to $9,999 | 129 (0.9%) | 375 (2.4%) |
| $10,000 to $14,999 | 271 (1.8%) | 1,003 (6.3%) |
| $15,000 to $19,999 | 221 (1.5%) | 873 (5.5%) |
| $20,000 to $24,999 | 415 (2.7%) | 955 (6.0%) |
| $25,000 to $34,999 | 973 (6.4%) | 2,159 (13.5%) |
| $35,000 to $49,999 | 1,743 (11.4%) | 2,371 (14.9%) |
| $50,000 to $74,999 | 2,346 (15.4%) | 2,917 (18.3%) |
| $75,000 to $99,999 | 2,766 (18.1%) | 2,093 (13.1%) |
| $100,000 to $149,999 | 3,174 (20.8%) | 1,627 (10.2%) |
| $150,000 or more | 3,070 (20.1%) | 830 (5.2%) |
| Total | 15,249 (100.0%) | 15,946 (100.0%) |
Monthly Housing Cost Tiers in Waukegan
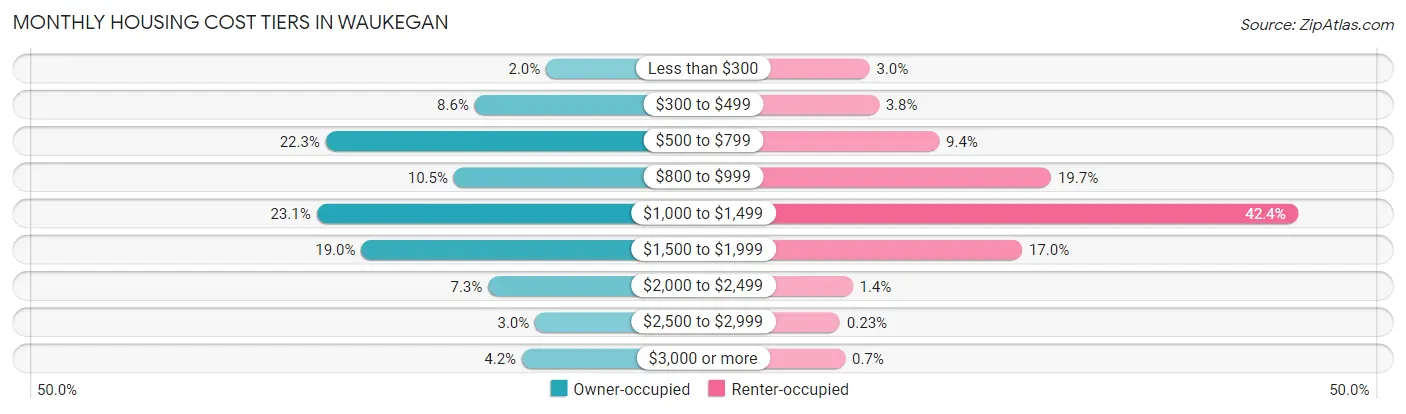
| Monthly Cost | Owner-occupied | Renter-occupied |
| Less than $300 | 303 (2.0%) | 471 (2.9%) |
| $300 to $499 | 1,306 (8.6%) | 606 (3.8%) |
| $500 to $799 | 3,398 (22.3%) | 1,493 (9.4%) |
| $800 to $999 | 1,600 (10.5%) | 3,135 (19.7%) |
| $1,000 to $1,499 | 3,527 (23.1%) | 6,754 (42.4%) |
| $1,500 to $1,999 | 2,897 (19.0%) | 2,710 (17.0%) |
| $2,000 to $2,499 | 1,118 (7.3%) | 221 (1.4%) |
| $2,500 to $2,999 | 457 (3.0%) | 36 (0.2%) |
| $3,000 or more | 643 (4.2%) | 112 (0.7%) |
| Total | 15,249 (100.0%) | 15,946 (100.0%) |
Physical Housing Characteristics in Waukegan
Housing Structures in Waukegan
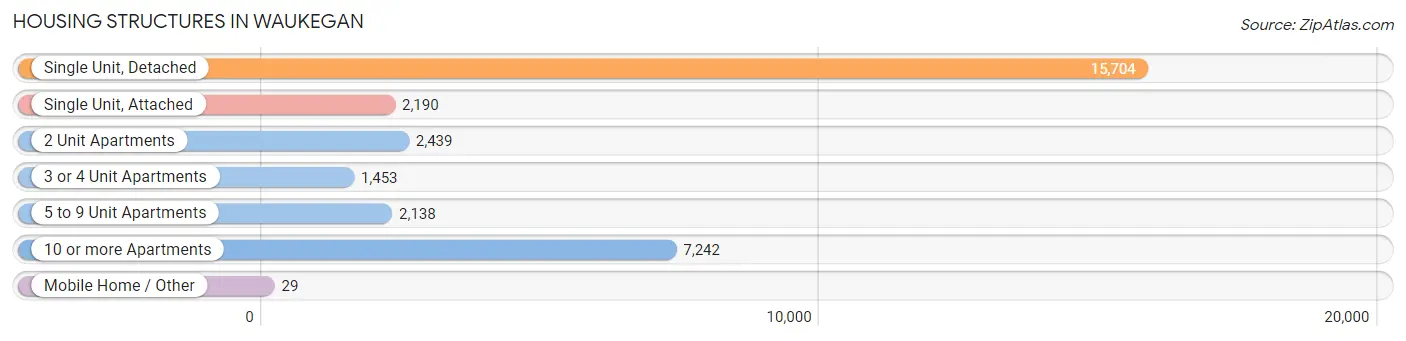
| Structure Type | # Housing Units | % Housing Units |
| Single Unit, Detached | 15,704 | 50.3% |
| Single Unit, Attached | 2,190 | 7.0% |
| 2 Unit Apartments | 2,439 | 7.8% |
| 3 or 4 Unit Apartments | 1,453 | 4.7% |
| 5 to 9 Unit Apartments | 2,138 | 6.9% |
| 10 or more Apartments | 7,242 | 23.2% |
| Mobile Home / Other | 29 | 0.1% |
| Total | 31,195 | 100.0% |
Housing Structures by Occupancy in Waukegan
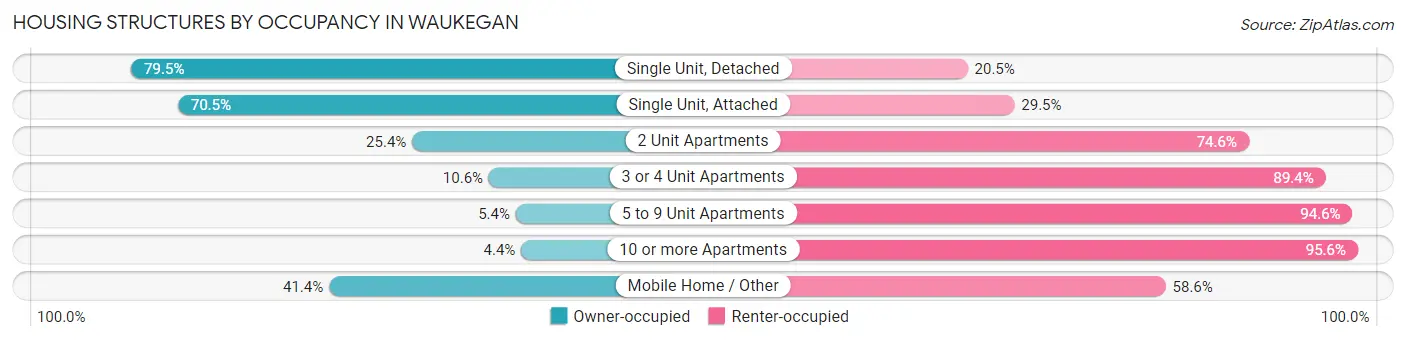
| Structure Type | Owner-occupied | Renter-occupied |
| Single Unit, Detached | 12,486 (79.5%) | 3,218 (20.5%) |
| Single Unit, Attached | 1,544 (70.5%) | 646 (29.5%) |
| 2 Unit Apartments | 619 (25.4%) | 1,820 (74.6%) |
| 3 or 4 Unit Apartments | 154 (10.6%) | 1,299 (89.4%) |
| 5 to 9 Unit Apartments | 116 (5.4%) | 2,022 (94.6%) |
| 10 or more Apartments | 318 (4.4%) | 6,924 (95.6%) |
| Mobile Home / Other | 12 (41.4%) | 17 (58.6%) |
| Total | 15,249 (48.9%) | 15,946 (51.1%) |
Housing Structures by Number of Rooms in Waukegan
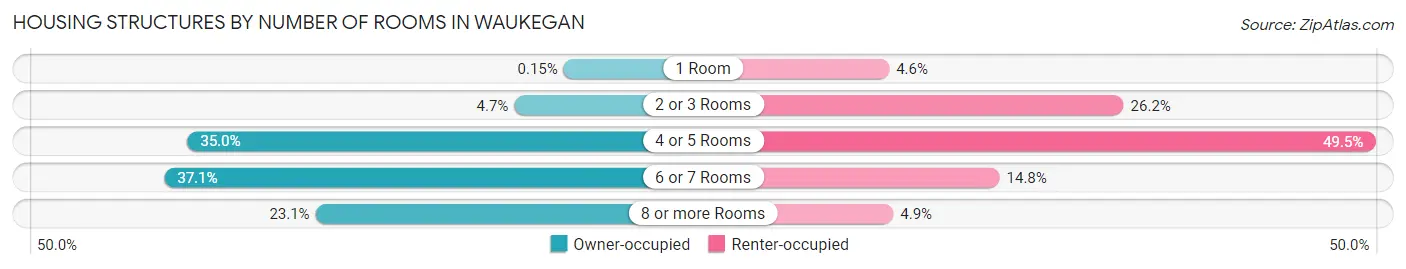
| Number of Rooms | Owner-occupied | Renter-occupied |
| 1 Room | 23 (0.2%) | 727 (4.6%) |
| 2 or 3 Rooms | 719 (4.7%) | 4,184 (26.2%) |
| 4 or 5 Rooms | 5,330 (34.9%) | 7,893 (49.5%) |
| 6 or 7 Rooms | 5,655 (37.1%) | 2,355 (14.8%) |
| 8 or more Rooms | 3,522 (23.1%) | 787 (4.9%) |
| Total | 15,249 (100.0%) | 15,946 (100.0%) |
Housing Structure by Heating Type in Waukegan
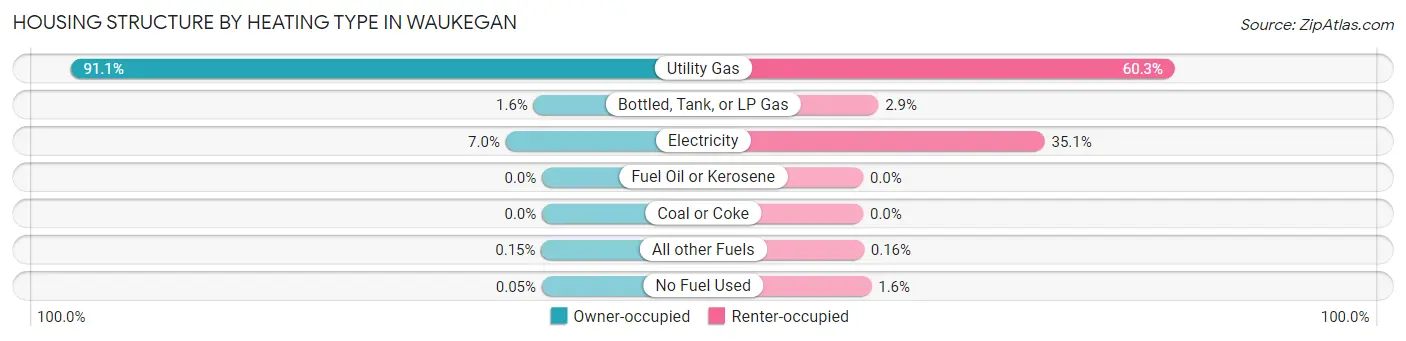
| Heating Type | Owner-occupied | Renter-occupied |
| Utility Gas | 13,897 (91.1%) | 9,608 (60.3%) |
| Bottled, Tank, or LP Gas | 249 (1.6%) | 467 (2.9%) |
| Electricity | 1,072 (7.0%) | 5,592 (35.1%) |
| Fuel Oil or Kerosene | 0 (0.0%) | 0 (0.0%) |
| Coal or Coke | 0 (0.0%) | 0 (0.0%) |
| All other Fuels | 23 (0.2%) | 25 (0.2%) |
| No Fuel Used | 8 (0.1%) | 254 (1.6%) |
| Total | 15,249 (100.0%) | 15,946 (100.0%) |
Household Vehicle Usage in Waukegan
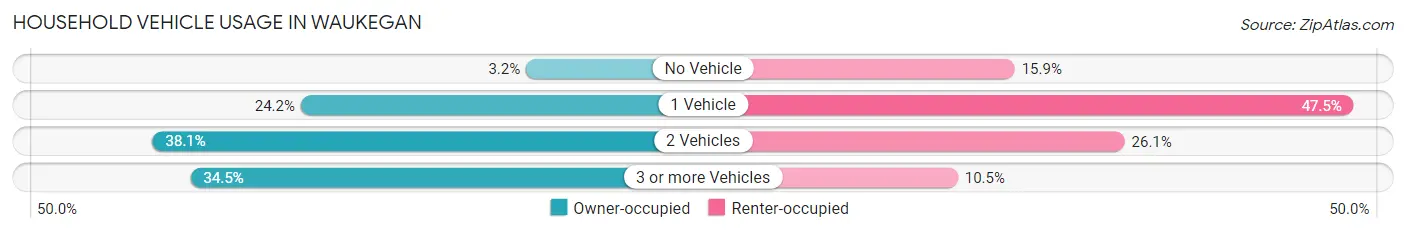
| Vehicles per Household | Owner-occupied | Renter-occupied |
| No Vehicle | 487 (3.2%) | 2,528 (15.9%) |
| 1 Vehicle | 3,693 (24.2%) | 7,573 (47.5%) |
| 2 Vehicles | 5,805 (38.1%) | 4,164 (26.1%) |
| 3 or more Vehicles | 5,264 (34.5%) | 1,681 (10.5%) |
| Total | 15,249 (100.0%) | 15,946 (100.0%) |
Real Estate & Mortgages in Waukegan
Real Estate and Mortgage Overview in Waukegan
| Characteristic | Without Mortgage | With Mortgage |
| Housing Units | 6,600 | 8,649 |
| Median Property Value | $158,500 | $168,000 |
| Median Household Income | $77,513 | $2,152 |
| Monthly Housing Costs | $669 | $591 |
| Real Estate Taxes | $4,128 | $233 |
Property Value by Mortgage Status in Waukegan
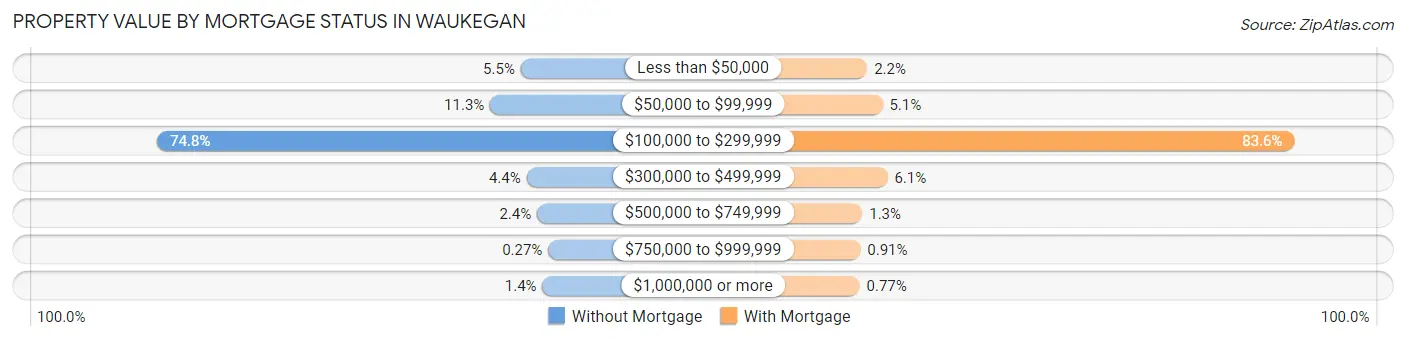
| Property Value | Without Mortgage | With Mortgage |
| Less than $50,000 | 363 (5.5%) | 193 (2.2%) |
| $50,000 to $99,999 | 747 (11.3%) | 444 (5.1%) |
| $100,000 to $299,999 | 4,934 (74.8%) | 7,229 (83.6%) |
| $300,000 to $499,999 | 290 (4.4%) | 526 (6.1%) |
| $500,000 to $749,999 | 158 (2.4%) | 111 (1.3%) |
| $750,000 to $999,999 | 18 (0.3%) | 79 (0.9%) |
| $1,000,000 or more | 90 (1.4%) | 67 (0.8%) |
| Total | 6,600 (100.0%) | 8,649 (100.0%) |
Household Income by Mortgage Status in Waukegan
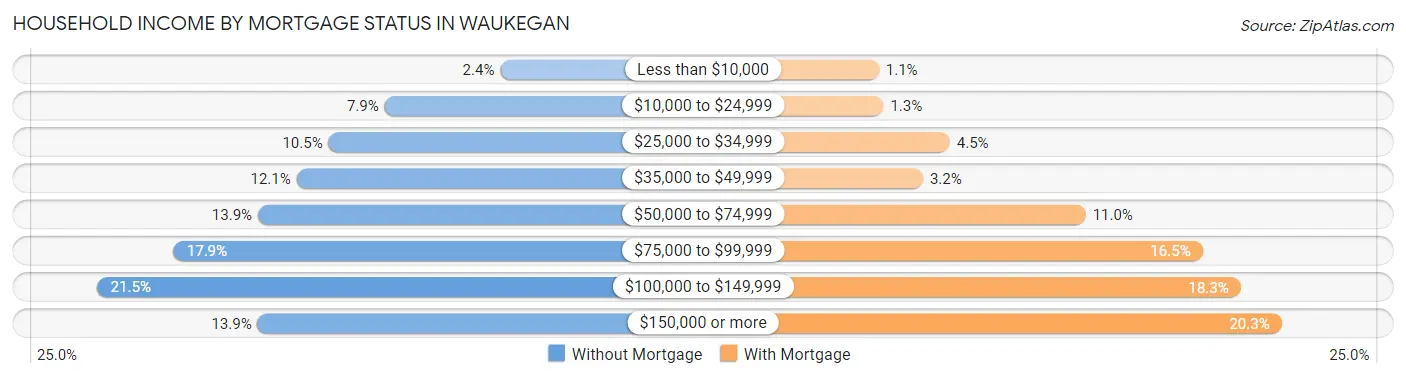
| Household Income | Without Mortgage | With Mortgage |
| Less than $10,000 | 155 (2.4%) | 96 (1.1%) |
| $10,000 to $24,999 | 519 (7.9%) | 115 (1.3%) |
| $25,000 to $34,999 | 695 (10.5%) | 388 (4.5%) |
| $35,000 to $49,999 | 795 (12.0%) | 278 (3.2%) |
| $50,000 to $74,999 | 917 (13.9%) | 948 (11.0%) |
| $75,000 to $99,999 | 1,181 (17.9%) | 1,429 (16.5%) |
| $100,000 to $149,999 | 1,420 (21.5%) | 1,585 (18.3%) |
| $150,000 or more | 918 (13.9%) | 1,754 (20.3%) |
| Total | 6,600 (100.0%) | 8,649 (100.0%) |
Property Value to Household Income Ratio in Waukegan
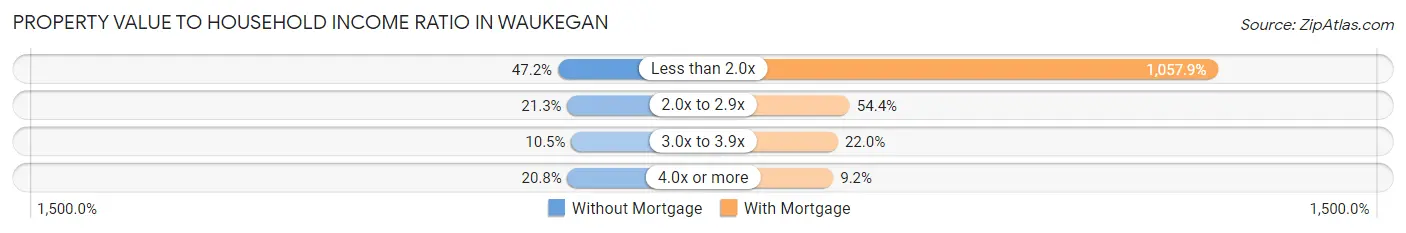
| Value-to-Income Ratio | Without Mortgage | With Mortgage |
| Less than 2.0x | 3,115 (47.2%) | 91,495 (1,057.9%) |
| 2.0x to 2.9x | 1,404 (21.3%) | 4,708 (54.4%) |
| 3.0x to 3.9x | 693 (10.5%) | 1,901 (22.0%) |
| 4.0x or more | 1,370 (20.8%) | 792 (9.2%) |
| Total | 6,600 (100.0%) | 8,649 (100.0%) |
Real Estate Taxes by Mortgage Status in Waukegan
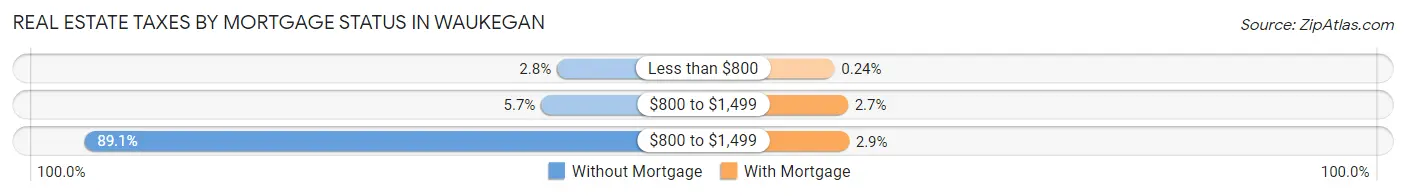
| Property Taxes | Without Mortgage | With Mortgage |
| Less than $800 | 182 (2.8%) | 21 (0.2%) |
| $800 to $1,499 | 373 (5.7%) | 232 (2.7%) |
| $800 to $1,499 | 5,880 (89.1%) | 248 (2.9%) |
| Total | 6,600 (100.0%) | 8,649 (100.0%) |
Health & Disability in Waukegan
Health Insurance Coverage by Age in Waukegan
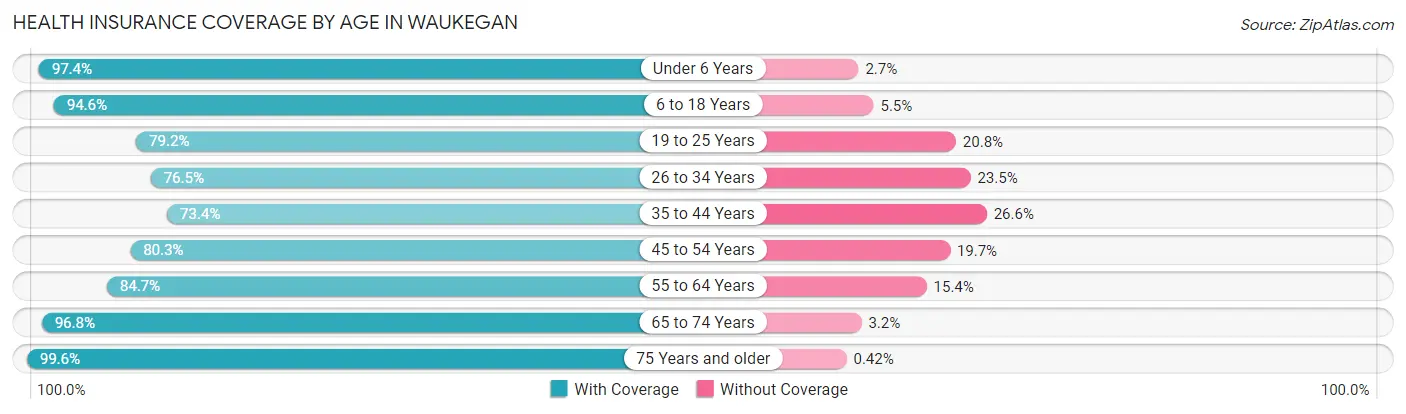
| Age Bracket | With Coverage | Without Coverage |
| Under 6 Years | 6,581 (97.4%) | 179 (2.6%) |
| 6 to 18 Years | 16,208 (94.6%) | 934 (5.4%) |
| 19 to 25 Years | 7,948 (79.2%) | 2,088 (20.8%) |
| 26 to 34 Years | 7,977 (76.5%) | 2,455 (23.5%) |
| 35 to 44 Years | 9,144 (73.4%) | 3,307 (26.6%) |
| 45 to 54 Years | 8,747 (80.3%) | 2,146 (19.7%) |
| 55 to 64 Years | 8,508 (84.7%) | 1,543 (15.3%) |
| 65 to 74 Years | 6,140 (96.8%) | 203 (3.2%) |
| 75 Years and older | 3,347 (99.6%) | 14 (0.4%) |
| Total | 74,600 (85.3%) | 12,869 (14.7%) |
Health Insurance Coverage by Citizenship Status in Waukegan
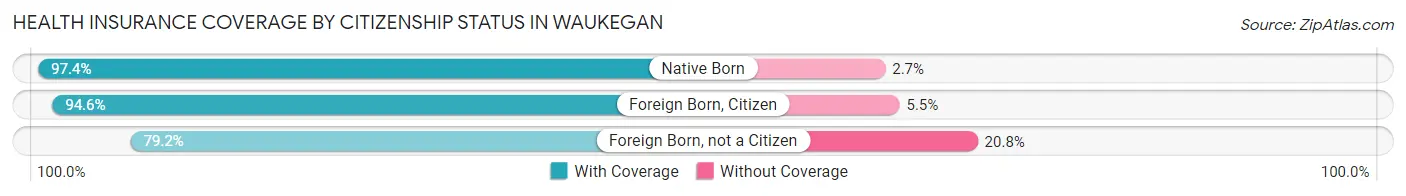
| Citizenship Status | With Coverage | Without Coverage |
| Native Born | 6,581 (97.4%) | 179 (2.6%) |
| Foreign Born, Citizen | 16,208 (94.6%) | 934 (5.4%) |
| Foreign Born, not a Citizen | 7,948 (79.2%) | 2,088 (20.8%) |
Health Insurance Coverage by Household Income in Waukegan
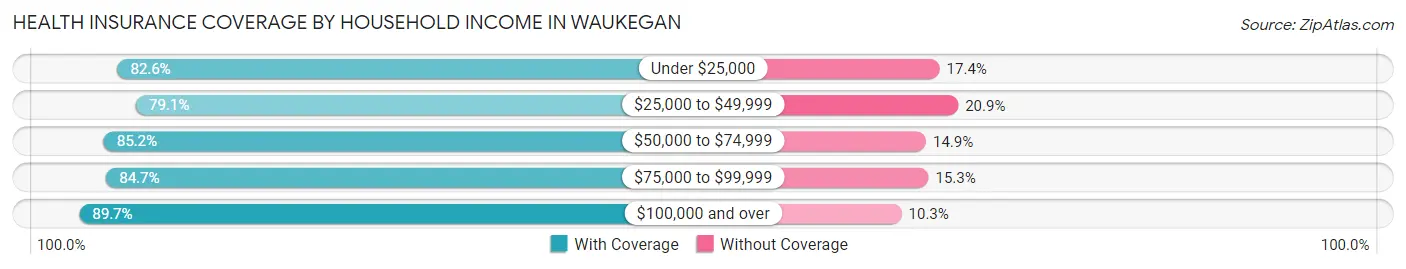
| Household Income | With Coverage | Without Coverage |
| Under $25,000 | 8,647 (82.6%) | 1,821 (17.4%) |
| $25,000 to $49,999 | 13,463 (79.1%) | 3,552 (20.9%) |
| $50,000 to $74,999 | 12,415 (85.2%) | 2,166 (14.8%) |
| $75,000 to $99,999 | 12,031 (84.7%) | 2,177 (15.3%) |
| $100,000 and over | 27,458 (89.7%) | 3,144 (10.3%) |
Public vs Private Health Insurance Coverage by Age in Waukegan
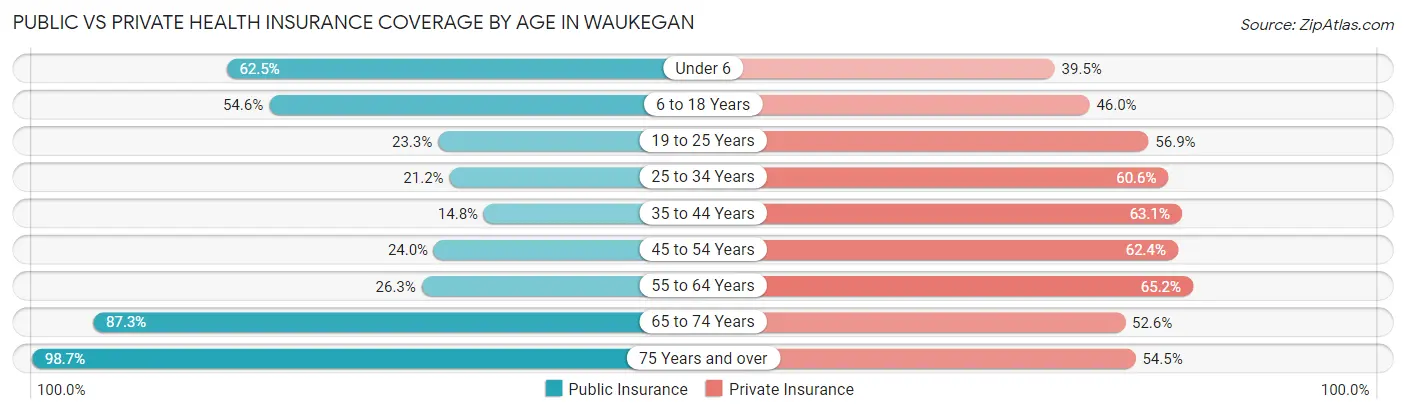
| Age Bracket | Public Insurance | Private Insurance |
| Under 6 | 4,227 (62.5%) | 2,671 (39.5%) |
| 6 to 18 Years | 9,366 (54.6%) | 7,880 (46.0%) |
| 19 to 25 Years | 2,334 (23.3%) | 5,711 (56.9%) |
| 25 to 34 Years | 2,206 (21.1%) | 6,322 (60.6%) |
| 35 to 44 Years | 1,837 (14.7%) | 7,855 (63.1%) |
| 45 to 54 Years | 2,617 (24.0%) | 6,793 (62.4%) |
| 55 to 64 Years | 2,644 (26.3%) | 6,549 (65.2%) |
| 65 to 74 Years | 5,538 (87.3%) | 3,335 (52.6%) |
| 75 Years and over | 3,316 (98.7%) | 1,832 (54.5%) |
| Total | 34,085 (39.0%) | 48,948 (56.0%) |
Disability Status by Sex by Age in Waukegan
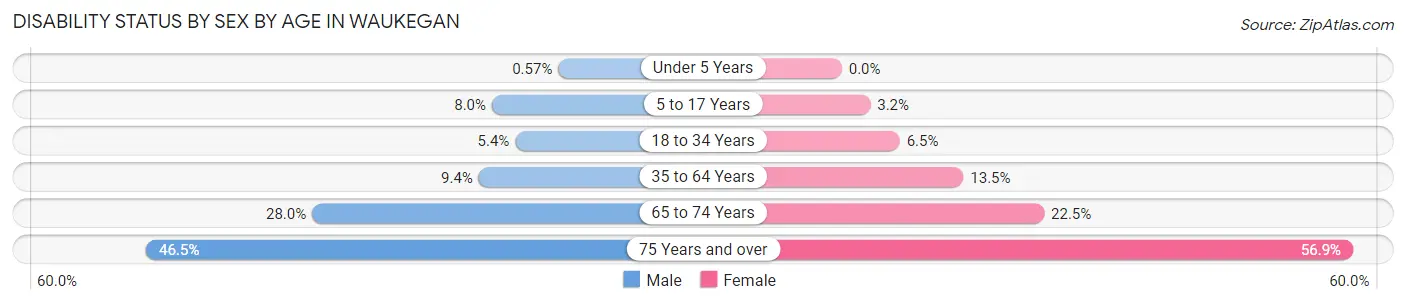
| Age Bracket | Male | Female |
| Under 5 Years | 14 (0.6%) | 0 (0.0%) |
| 5 to 17 Years | 659 (8.0%) | 277 (3.2%) |
| 18 to 34 Years | 607 (5.4%) | 694 (6.5%) |
| 35 to 64 Years | 1,609 (9.4%) | 2,211 (13.5%) |
| 65 to 74 Years | 887 (28.0%) | 715 (22.5%) |
| 75 Years and over | 605 (46.5%) | 1,172 (56.9%) |
Disability Class by Sex by Age in Waukegan
Disability Class: Hearing Difficulty
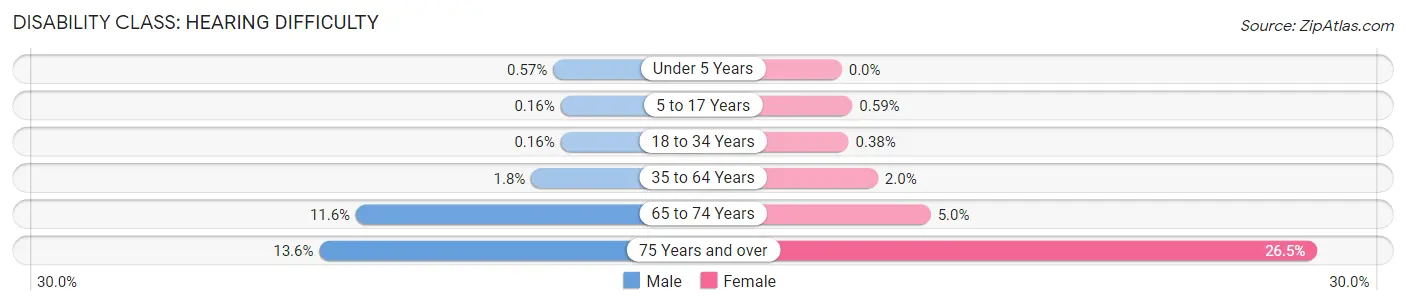
| Age Bracket | Male | Female |
| Under 5 Years | 14 (0.6%) | 0 (0.0%) |
| 5 to 17 Years | 13 (0.2%) | 52 (0.6%) |
| 18 to 34 Years | 18 (0.2%) | 41 (0.4%) |
| 35 to 64 Years | 306 (1.8%) | 329 (2.0%) |
| 65 to 74 Years | 366 (11.6%) | 157 (5.0%) |
| 75 Years and over | 177 (13.6%) | 545 (26.5%) |
Disability Class: Vision Difficulty
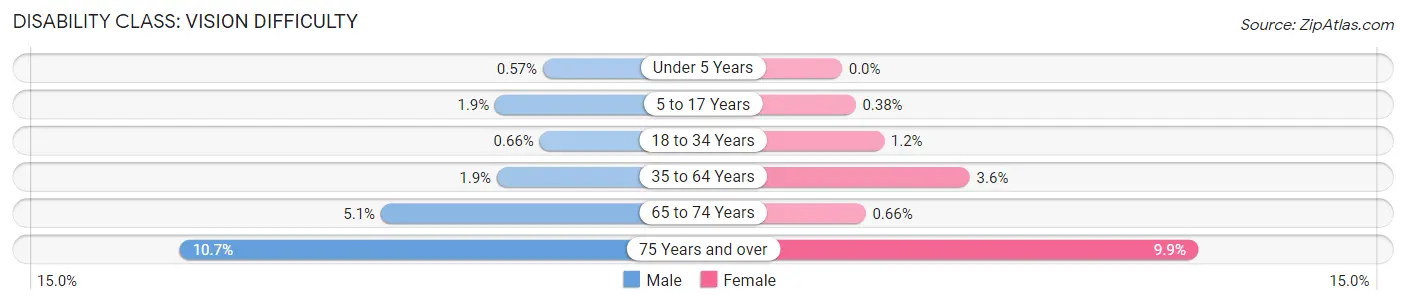
| Age Bracket | Male | Female |
| Under 5 Years | 14 (0.6%) | 0 (0.0%) |
| 5 to 17 Years | 157 (1.9%) | 33 (0.4%) |
| 18 to 34 Years | 75 (0.7%) | 126 (1.2%) |
| 35 to 64 Years | 315 (1.8%) | 582 (3.6%) |
| 65 to 74 Years | 161 (5.1%) | 21 (0.7%) |
| 75 Years and over | 139 (10.7%) | 204 (9.9%) |
Disability Class: Cognitive Difficulty
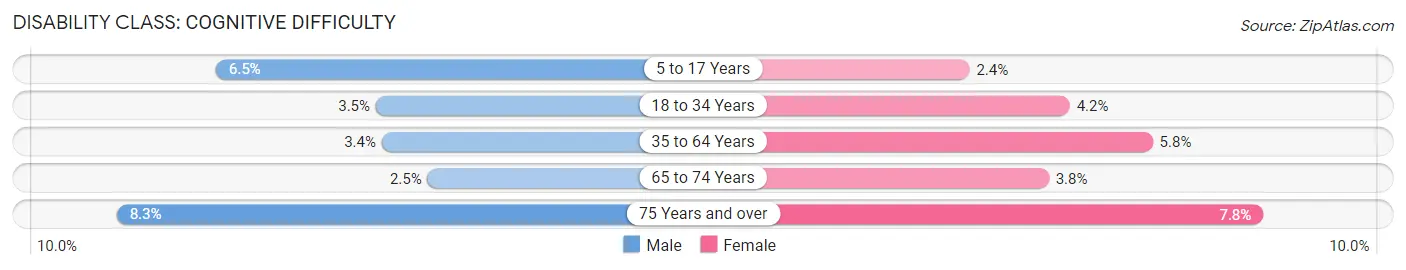
| Age Bracket | Male | Female |
| 5 to 17 Years | 534 (6.5%) | 207 (2.4%) |
| 18 to 34 Years | 394 (3.5%) | 455 (4.2%) |
| 35 to 64 Years | 575 (3.4%) | 943 (5.8%) |
| 65 to 74 Years | 80 (2.5%) | 122 (3.8%) |
| 75 Years and over | 108 (8.3%) | 161 (7.8%) |
Disability Class: Ambulatory Difficulty
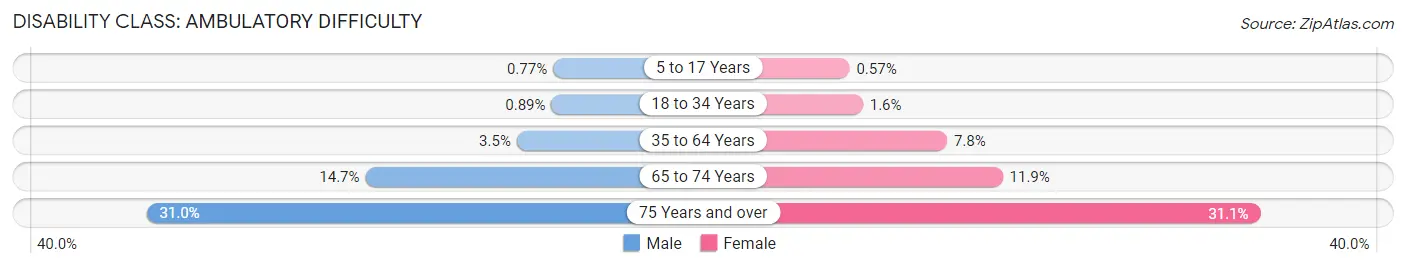
| Age Bracket | Male | Female |
| 5 to 17 Years | 64 (0.8%) | 50 (0.6%) |
| 18 to 34 Years | 101 (0.9%) | 168 (1.6%) |
| 35 to 64 Years | 591 (3.5%) | 1,275 (7.8%) |
| 65 to 74 Years | 466 (14.7%) | 379 (11.9%) |
| 75 Years and over | 403 (30.9%) | 640 (31.1%) |
Disability Class: Self-Care Difficulty
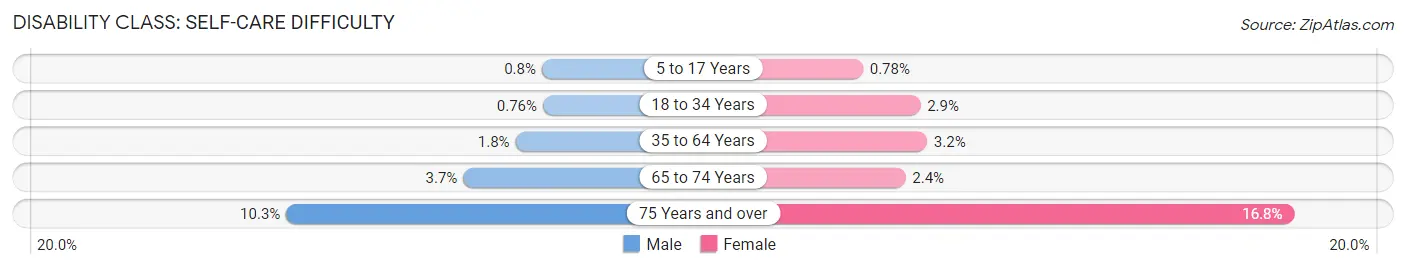
| Age Bracket | Male | Female |
| 5 to 17 Years | 66 (0.8%) | 68 (0.8%) |
| 18 to 34 Years | 86 (0.8%) | 313 (2.9%) |
| 35 to 64 Years | 304 (1.8%) | 516 (3.2%) |
| 65 to 74 Years | 118 (3.7%) | 75 (2.4%) |
| 75 Years and over | 134 (10.3%) | 346 (16.8%) |
Technology Access in Waukegan
Computing Device Access in Waukegan
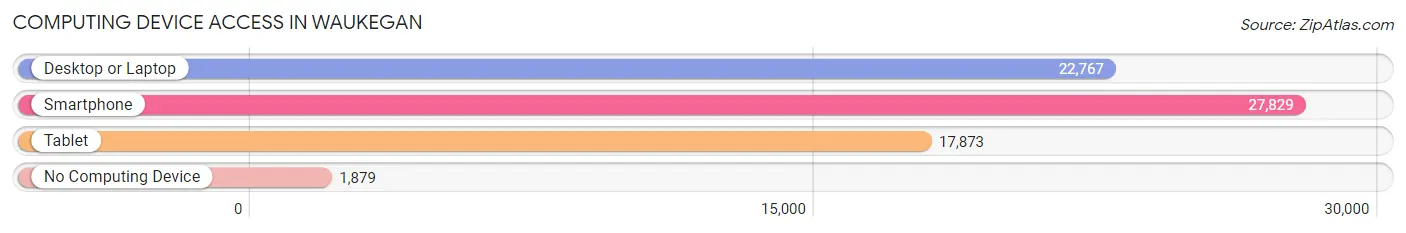
| Device Type | # Households | % Households |
| Desktop or Laptop | 22,767 | 73.0% |
| Smartphone | 27,829 | 89.2% |
| Tablet | 17,873 | 57.3% |
| No Computing Device | 1,879 | 6.0% |
| Total | 31,195 | 100.0% |
Internet Access in Waukegan
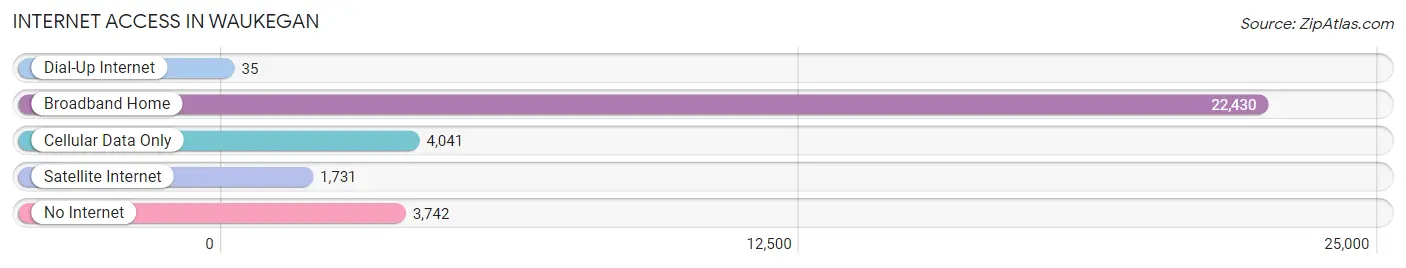
| Internet Type | # Households | % Households |
| Dial-Up Internet | 35 | 0.1% |
| Broadband Home | 22,430 | 71.9% |
| Cellular Data Only | 4,041 | 13.0% |
| Satellite Internet | 1,731 | 5.6% |
| No Internet | 3,742 | 12.0% |
| Total | 31,195 | 100.0% |
Waukegan Summary
Waukegan is a city located in Lake County, Illinois, United States. It is the county seat of Lake County and is located on the western shore of Lake Michigan. The population of Waukegan was 89,078 at the 2010 census, making it the ninth-largest city in Illinois. It is the fourth-largest city in the Chicago metropolitan area, after Chicago, Aurora, and Rockford.
History
The area that is now Waukegan was originally inhabited by the Potawatomi people. The first non-native settlers arrived in the area in 1835, and the city was officially incorporated in 1859. The city was named after the Potawatomi word for "fort".
The city was an important port on Lake Michigan in the late 19th and early 20th centuries. It was the site of the first commercial fishing fleet on the lake, and the first commercial ice harvesting operation. The city was also home to several large manufacturing companies, including the Waukegan Foundry and Machine Company, which produced the first steam locomotives in the United States.
Geography
Waukegan is located at 42°22′53″N 87°51′17″W (42.3814, -87.8547). According to the 2010 census, Waukegan has a total area of 24.9 square miles (64.5 km2), of which 24.7 square miles (63.9 km2) (or 99.17%) is land and 0.2 square miles (0.6 km2) (or 0.83%) is water.
Economy
Waukegan is home to several large companies, including Abbott Laboratories, Baxter International, and Medline Industries. The city is also home to several smaller businesses, including a number of restaurants, retail stores, and professional services.
Demographics
As of the 2010 census, there were 89,078 people, 33,845 households, and 21,945 families residing in the city. The population density was 3,611.3 people per square mile (1,395.2/km2). There were 36,845 housing units at an average density of 1,491.3 per square mile (575.3/km2). The racial makeup of the city was 57.2% White, 24.2% African American, 0.5% Native American, 3.2% Asian, 0.1% Pacific Islander, 11.7% from other races, and 3.1% from two or more races. Hispanic or Latino of any race were 28.2% of the population.
There were 33,845 households, out of which 33.2% had children under the age of 18 living with them, 41.2% were married couples living together, 17.2% had a female householder with no husband present, and 35.7% were non-families. 28.7% of all households were made up of individuals, and 9.2% had someone living alone who was 65 years of age or older. The average household size was 2.63 and the average family size was 3.25.
In the city, the population was spread out, with 25.7% under the age of 18, 9.7% from 18 to 24, 30.2% from 25 to 44, 22.2% from 45 to 64, and 12.2% who were 65 years of age or older. The median age was 34 years. For every 100 females, there were 95.2 males. For every 100 females age 18 and over, there were 91.7 males.
The median income for a household in the city was $41,939, and the median income for a family was $50,919. Males had a median income of $37,813 versus $30,835 for females. The per capita income for the city was $20,945. About 11.2% of families and 14.2% of the population were below the poverty line, including 19.2% of those under age 18 and 8.7% of those age 65 or over.
Common Questions
What is Per Capita Income in Waukegan?
Per Capita income in Waukegan is $30,089.
What is the Median Family Income in Waukegan?
Median Family Income in Waukegan is $76,143.
What is the Median Household income in Waukegan?
Median Household Income in Waukegan is $66,077.
What is Income or Wage Gap in Waukegan?
Income or Wage Gap in Waukegan is 20.1%.
Women in Waukegan earn 79.9 cents for every dollar earned by a man.
What is Family Income Deficit in Waukegan?
Family Income Deficit in Waukegan is $9,593.
Families that are below poverty line in Waukegan earn $9,593 less on average than the poverty threshold level.
What is Inequality or Gini Index in Waukegan?
Inequality or Gini Index in Waukegan is 0.44.
What is the Total Population of Waukegan?
Total Population of Waukegan is 89,435.
What is the Total Male Population of Waukegan?
Total Male Population of Waukegan is 45,050.
What is the Total Female Population of Waukegan?
Total Female Population of Waukegan is 44,385.
What is the Ratio of Males per 100 Females in Waukegan?
There are 101.50 Males per 100 Females in Waukegan.
What is the Ratio of Females per 100 Males in Waukegan?
There are 98.52 Females per 100 Males in Waukegan.
What is the Median Population Age in Waukegan?
Median Population Age in Waukegan is 34.5 Years.
What is the Average Family Size in Waukegan
Average Family Size in Waukegan is 3.5 People.
What is the Average Household Size in Waukegan
Average Household Size in Waukegan is 2.8 People.
How Large is the Labor Force in Waukegan?
There are 46,850 People in the Labor Forcein in Waukegan.
What is the Percentage of People in the Labor Force in Waukegan?
67.0% of People are in the Labor Force in Waukegan.
What is the Unemployment Rate in Waukegan?
Unemployment Rate in Waukegan is 5.3%.