Zip Codes with the Highest Percentage of Hispanic or Latino Population in Rockford, IL
RELATED REPORTS & OPTIONS
Hispanic or Latino
Rockford
Compare Zip Codes
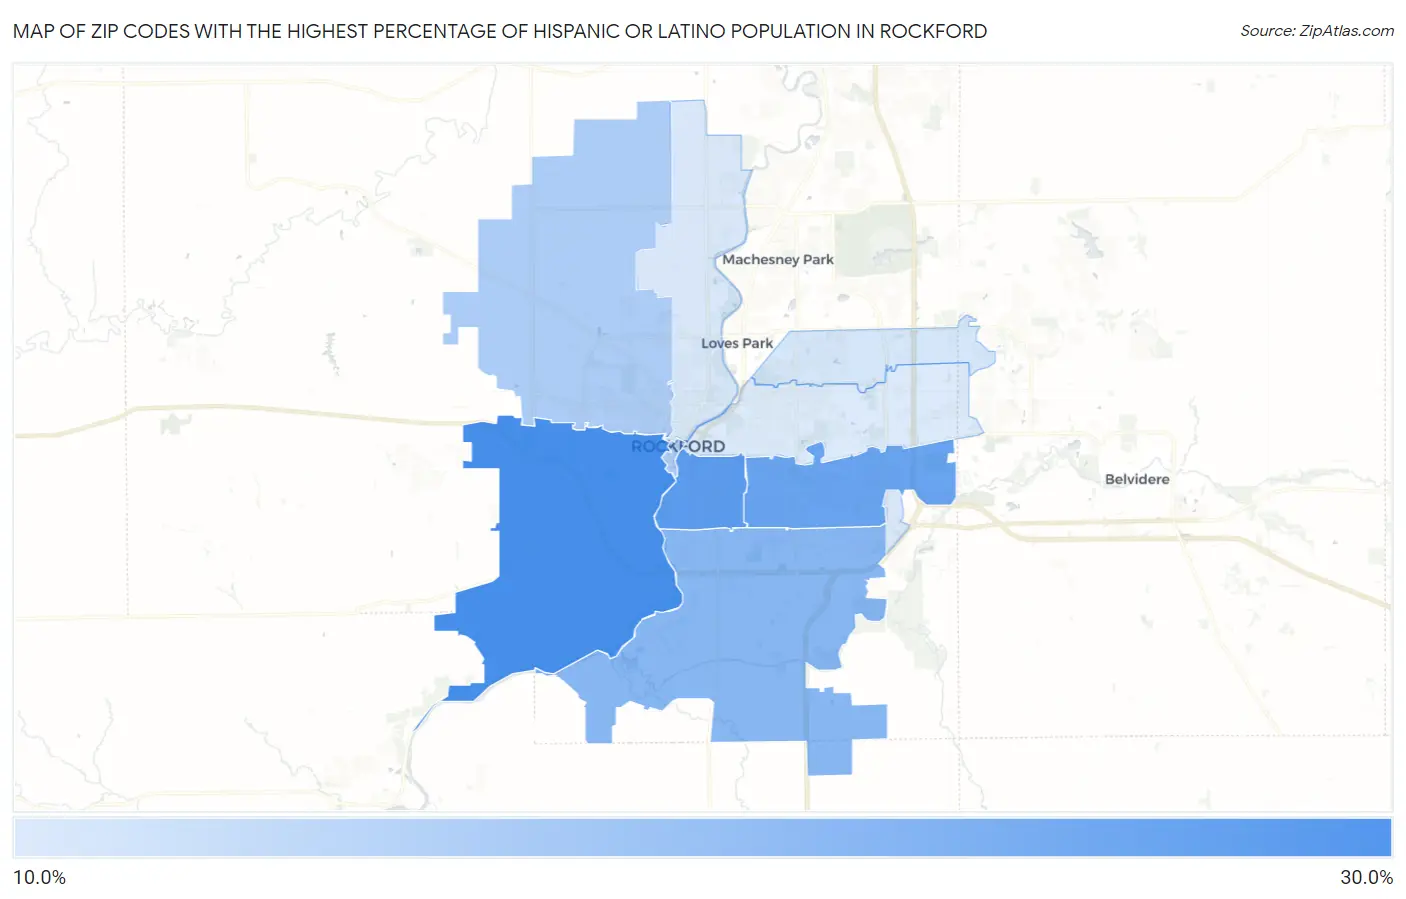
Map of Zip Codes with the Highest Percentage of Hispanic or Latino Population in Rockford
11.1%
27.0%
Zip Codes with the Highest Percentage of Hispanic or Latino Population in Rockford, IL
| Zip Code | Hispanic or Latino | vs State | vs National | |
| 1. | 61102 | 27.0% | 17.8%(+9.20)#84 | 18.7%(+8.39)#3,484 |
| 2. | 61104 | 24.6% | 17.8%(+6.78)#93 | 18.7%(+5.96)#3,876 |
| 3. | 61108 | 23.2% | 17.8%(+5.37)#104 | 18.7%(+4.56)#4,134 |
| 4. | 61109 | 19.9% | 17.8%(+2.06)#122 | 18.7%(+1.25)#4,835 |
| 5. | 61101 | 15.9% | 17.8%(-1.89)#159 | 18.7%(-2.71)#5,986 |
| 6. | 61114 | 11.8% | 17.8%(-6.01)#239 | 18.7%(-6.83)#7,840 |
| 7. | 61112 | 11.5% | 17.8%(-6.33)#247 | 18.7%(-7.15)#8,025 |
| 8. | 61103 | 11.5% | 17.8%(-6.38)#249 | 18.7%(-7.20)#8,051 |
| 9. | 61107 | 11.1% | 17.8%(-6.75)#260 | 18.7%(-7.56)#8,240 |
1
Common Questions
What are the Top 5 Zip Codes with the Highest Percentage of Hispanic or Latino Population in Rockford, IL?
Top 5 Zip Codes with the Highest Percentage of Hispanic or Latino Population in Rockford, IL are:
What zip code has the Highest Percentage of Hispanic or Latino Population in Rockford, IL?
61102 has the Highest Percentage of Hispanic or Latino Population in Rockford, IL with 27.0%.
What is the Percentage of Hispanic or Latino Population in Rockford, IL?
Percentage of Hispanic or Latino Population in Rockford is 19.1%.
What is the Percentage of Hispanic or Latino Population in Illinois?
Percentage of Hispanic or Latino Population in Illinois is 17.8%.
What is the Percentage of Hispanic or Latino Population in the United States?
Percentage of Hispanic or Latino Population in the United States is 18.7%.