Bolingbrook, IL Map & Demographics
Bolingbrook Map
Bolingbrook Overview
$40,369
PER CAPITA INCOME
$115,249
AVG FAMILY INCOME
$102,057
AVG HOUSEHOLD INCOME
26.6%
WAGE / INCOME GAP [ % ]
73.4¢/ $1
WAGE / INCOME GAP [ $ ]
$14,290
FAMILY INCOME DEFICIT
0.39
INEQUALITY / GINI INDEX
73,755
TOTAL POPULATION
36,379
MALE POPULATION
37,376
FEMALE POPULATION
97.33
MALES / 100 FEMALES
102.74
FEMALES / 100 MALES
37.9
MEDIAN AGE
3.5
AVG FAMILY SIZE
3.1
AVG HOUSEHOLD SIZE
41,779
LABOR FORCE [ PEOPLE ]
71.5%
PERCENT IN LABOR FORCE
5.2%
UNEMPLOYMENT RATE
Income in Bolingbrook
Income Overview in Bolingbrook
Per Capita Income in Bolingbrook is $40,369, while median incomes of families and households are $115,249 and $102,057 respectively.
| Characteristic | Number | Measure |
| Per Capita Income | 73,755 | $40,369 |
| Median Family Income | 18,500 | $115,249 |
| Mean Family Income | 18,500 | $131,519 |
| Median Household Income | 23,950 | $102,057 |
| Mean Household Income | 23,950 | $119,768 |
| Income Deficit | 18,500 | $14,290 |
| Wage / Income Gap (%) | 73,755 | 26.56% |
| Wage / Income Gap ($) | 73,755 | 73.44¢ per $1 |
| Gini / Inequality Index | 73,755 | 0.39 |
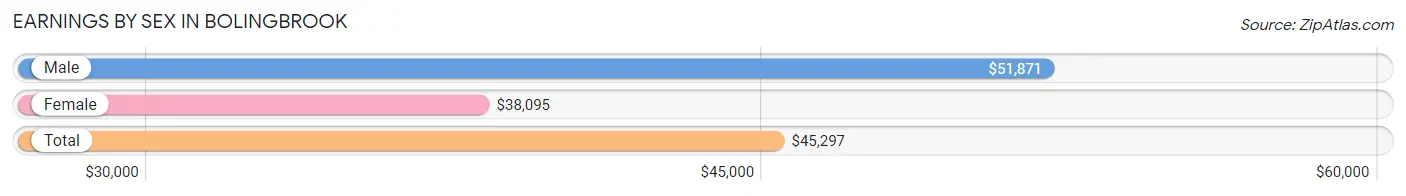
Earnings by Sex in Bolingbrook
Average Earnings in Bolingbrook are $45,297, $51,871 for men and $38,095 for women, a difference of 26.6%.
| Sex | Number | Average Earnings |
| Male | 22,392 (52.1%) | $51,871 |
| Female | 20,614 (47.9%) | $38,095 |
| Total | 43,006 (100.0%) | $45,297 |
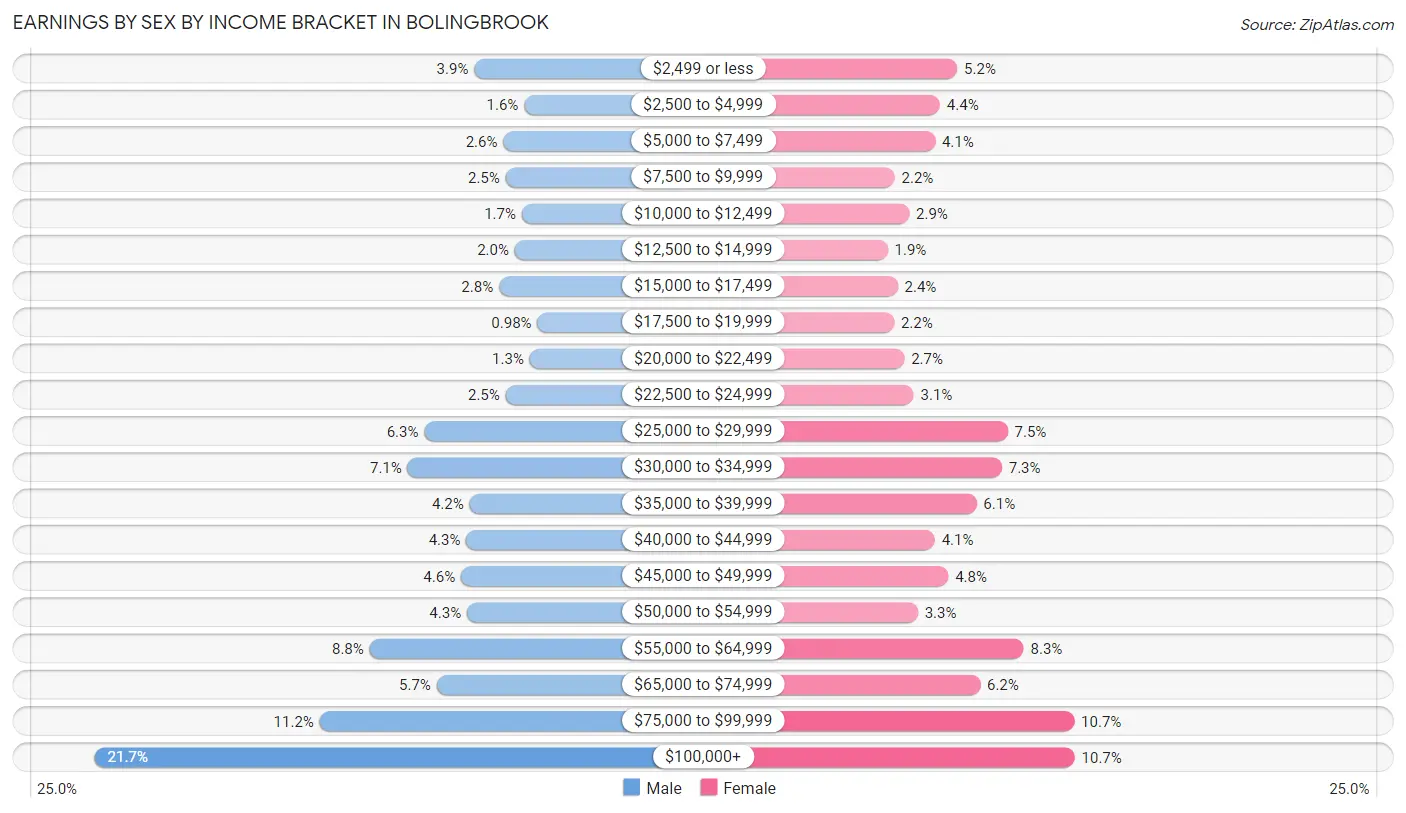
Earnings by Sex by Income Bracket in Bolingbrook
The most common earnings brackets in Bolingbrook are $100,000+ for men (4,864 | 21.7%) and $100,000+ for women (2,200 | 10.7%).
| Income | Male | Female |
| $2,499 or less | 882 (3.9%) | 1,065 (5.2%) |
| $2,500 to $4,999 | 358 (1.6%) | 898 (4.4%) |
| $5,000 to $7,499 | 577 (2.6%) | 851 (4.1%) |
| $7,500 to $9,999 | 552 (2.5%) | 461 (2.2%) |
| $10,000 to $12,499 | 382 (1.7%) | 601 (2.9%) |
| $12,500 to $14,999 | 457 (2.0%) | 393 (1.9%) |
| $15,000 to $17,499 | 622 (2.8%) | 490 (2.4%) |
| $17,500 to $19,999 | 220 (1.0%) | 455 (2.2%) |
| $20,000 to $22,499 | 301 (1.3%) | 554 (2.7%) |
| $22,500 to $24,999 | 552 (2.5%) | 646 (3.1%) |
| $25,000 to $29,999 | 1,407 (6.3%) | 1,552 (7.5%) |
| $30,000 to $34,999 | 1,581 (7.1%) | 1,497 (7.3%) |
| $35,000 to $39,999 | 931 (4.2%) | 1,251 (6.1%) |
| $40,000 to $44,999 | 965 (4.3%) | 849 (4.1%) |
| $45,000 to $49,999 | 1,022 (4.6%) | 979 (4.8%) |
| $50,000 to $54,999 | 958 (4.3%) | 684 (3.3%) |
| $55,000 to $64,999 | 1,980 (8.8%) | 1,706 (8.3%) |
| $65,000 to $74,999 | 1,277 (5.7%) | 1,286 (6.2%) |
| $75,000 to $99,999 | 2,504 (11.2%) | 2,196 (10.6%) |
| $100,000+ | 4,864 (21.7%) | 2,200 (10.7%) |
| Total | 22,392 (100.0%) | 20,614 (100.0%) |
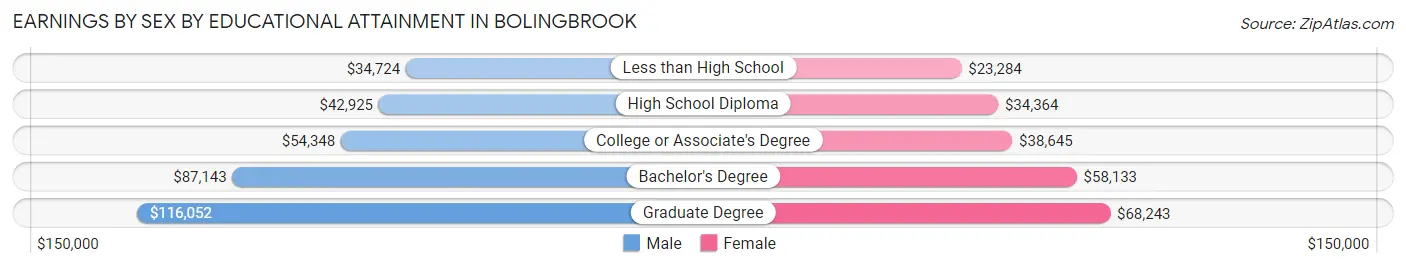
Earnings by Sex by Educational Attainment in Bolingbrook
Average earnings in Bolingbrook are $60,104 for men and $46,511 for women, a difference of 22.6%. Men with an educational attainment of graduate degree enjoy the highest average annual earnings of $116,052, while those with less than high school education earn the least with $34,724. Women with an educational attainment of graduate degree earn the most with the average annual earnings of $68,243, while those with less than high school education have the smallest earnings of $23,284.
| Educational Attainment | Male Income | Female Income |
| Less than High School | $34,724 | $23,284 |
| High School Diploma | $42,925 | $34,364 |
| College or Associate's Degree | $54,348 | $38,645 |
| Bachelor's Degree | $87,143 | $58,133 |
| Graduate Degree | $116,052 | $68,243 |
| Total | $60,104 | $46,511 |
Family Income in Bolingbrook
Family Income Brackets in Bolingbrook
According to the Bolingbrook family income data, there are 5,032 families falling into the $100,000 to $149,999 income range, which is the most common income bracket and makes up 27.2% of all families. Conversely, the $10,000 to $14,999 income bracket is the least frequent group with only 314 families (1.7%) belonging to this category.
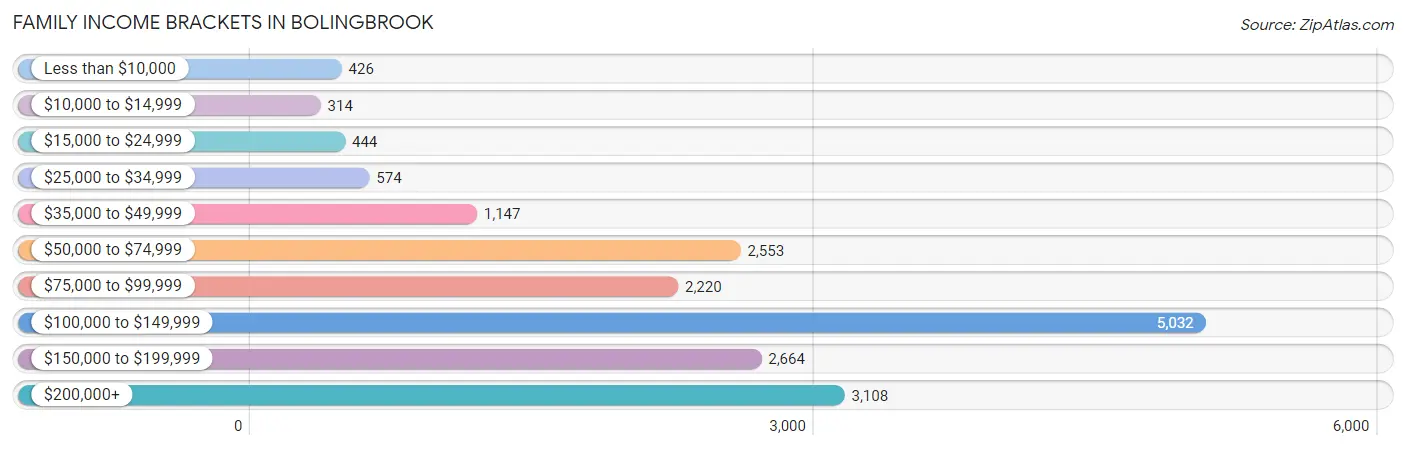
| Income Bracket | # Families | % Families |
| Less than $10,000 | 426 | 2.3% |
| $10,000 to $14,999 | 314 | 1.7% |
| $15,000 to $24,999 | 444 | 2.4% |
| $25,000 to $34,999 | 574 | 3.1% |
| $35,000 to $49,999 | 1,147 | 6.2% |
| $50,000 to $74,999 | 2,553 | 13.8% |
| $75,000 to $99,999 | 2,220 | 12.0% |
| $100,000 to $149,999 | 5,032 | 27.2% |
| $150,000 to $199,999 | 2,664 | 14.4% |
| $200,000+ | 3,108 | 16.8% |
Family Income by Famaliy Size in Bolingbrook
7+ person families (580 | 3.1%) account for the highest median family income in Bolingbrook with $141,667 per family, while 2-person families (6,780 | 36.6%) have the highest median income of $51,910 per family member.
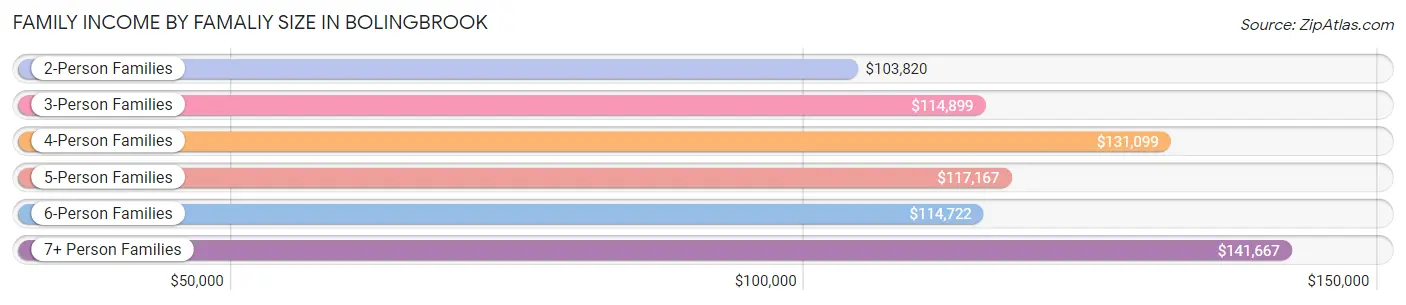
| Income Bracket | # Families | Median Income |
| 2-Person Families | 6,780 (36.6%) | $103,820 |
| 3-Person Families | 4,253 (23.0%) | $114,899 |
| 4-Person Families | 4,137 (22.4%) | $131,099 |
| 5-Person Families | 1,868 (10.1%) | $117,167 |
| 6-Person Families | 882 (4.8%) | $114,722 |
| 7+ Person Families | 580 (3.1%) | $141,667 |
| Total | 18,500 (100.0%) | $115,249 |
Family Income by Number of Earners in Bolingbrook
The median family income in Bolingbrook is $115,249, with families comprising 3+ earners (3,632) having the highest median family income of $153,750, while families with no earners (1,383) have the lowest median family income of $52,145, accounting for 19.6% and 7.5% of families, respectively.
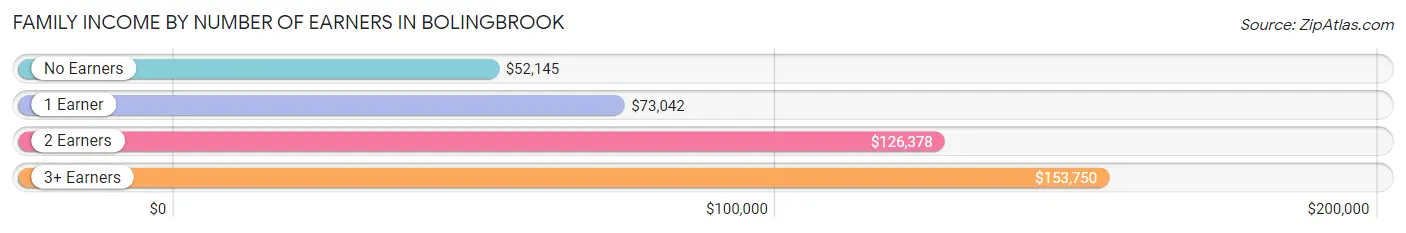
| Number of Earners | # Families | Median Income |
| No Earners | 1,383 (7.5%) | $52,145 |
| 1 Earner | 4,604 (24.9%) | $73,042 |
| 2 Earners | 8,881 (48.0%) | $126,378 |
| 3+ Earners | 3,632 (19.6%) | $153,750 |
| Total | 18,500 (100.0%) | $115,249 |
Household Income in Bolingbrook
Household Income Brackets in Bolingbrook
With 5,940 households falling in the category, the $100,000 to $149,999 income range is the most frequent in Bolingbrook, accounting for 24.8% of all households. In contrast, only 407 households (1.7%) fall into the $10,000 to $14,999 income bracket, making it the least populous group.
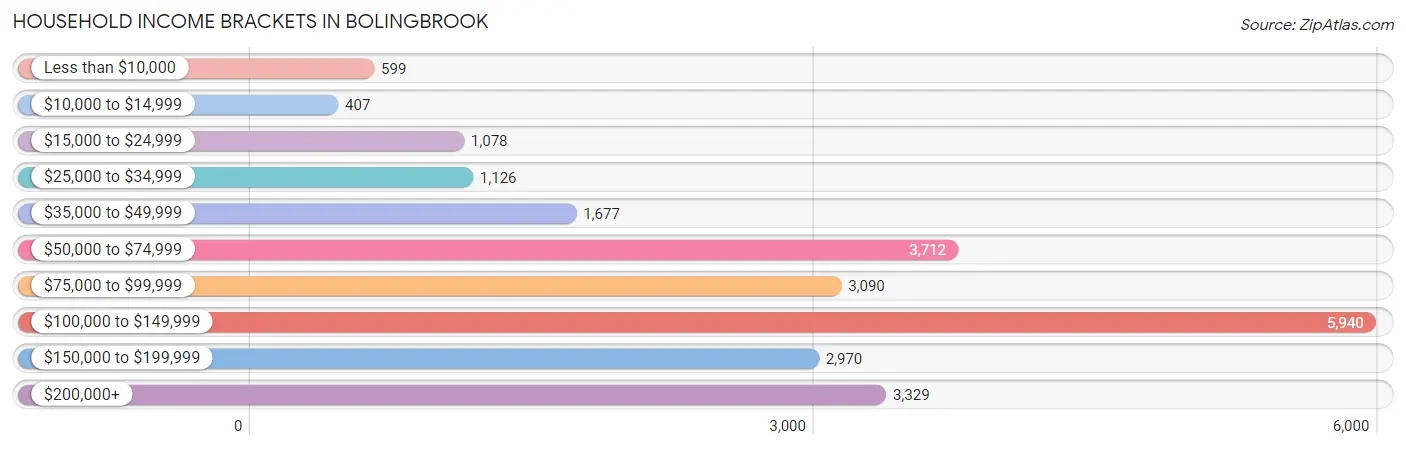
| Income Bracket | # Households | % Households |
| Less than $10,000 | 599 | 2.5% |
| $10,000 to $14,999 | 407 | 1.7% |
| $15,000 to $24,999 | 1,078 | 4.5% |
| $25,000 to $34,999 | 1,126 | 4.7% |
| $35,000 to $49,999 | 1,677 | 7.0% |
| $50,000 to $74,999 | 3,712 | 15.5% |
| $75,000 to $99,999 | 3,090 | 12.9% |
| $100,000 to $149,999 | 5,940 | 24.8% |
| $150,000 to $199,999 | 2,970 | 12.4% |
| $200,000+ | 3,329 | 13.9% |
Household Income by Householder Age in Bolingbrook
The median household income in Bolingbrook is $102,057, with the highest median household income of $118,994 found in the 45 to 64 years age bracket for the primary householder. A total of 9,971 households (41.6%) fall into this category. Meanwhile, the 15 to 24 years age bracket for the primary householder has the lowest median household income of $64,375, with 644 households (2.7%) in this group.
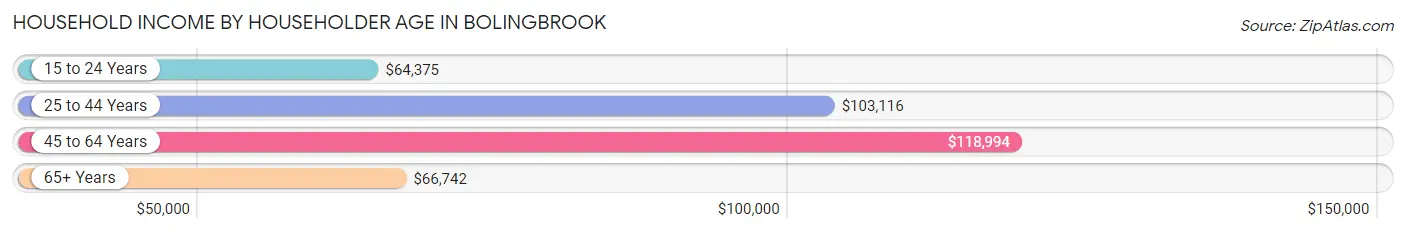
| Income Bracket | # Households | Median Income |
| 15 to 24 Years | 644 (2.7%) | $64,375 |
| 25 to 44 Years | 8,187 (34.2%) | $103,116 |
| 45 to 64 Years | 9,971 (41.6%) | $118,994 |
| 65+ Years | 5,148 (21.5%) | $66,742 |
| Total | 23,950 (100.0%) | $102,057 |
Poverty in Bolingbrook
Income Below Poverty by Sex and Age in Bolingbrook
With 5.9% poverty level for males and 9.8% for females among the residents of Bolingbrook, 5 year old males and 5 year old females are the most vulnerable to poverty, with 96 males (23.1%) and 161 females (32.3%) in their respective age groups living below the poverty level.
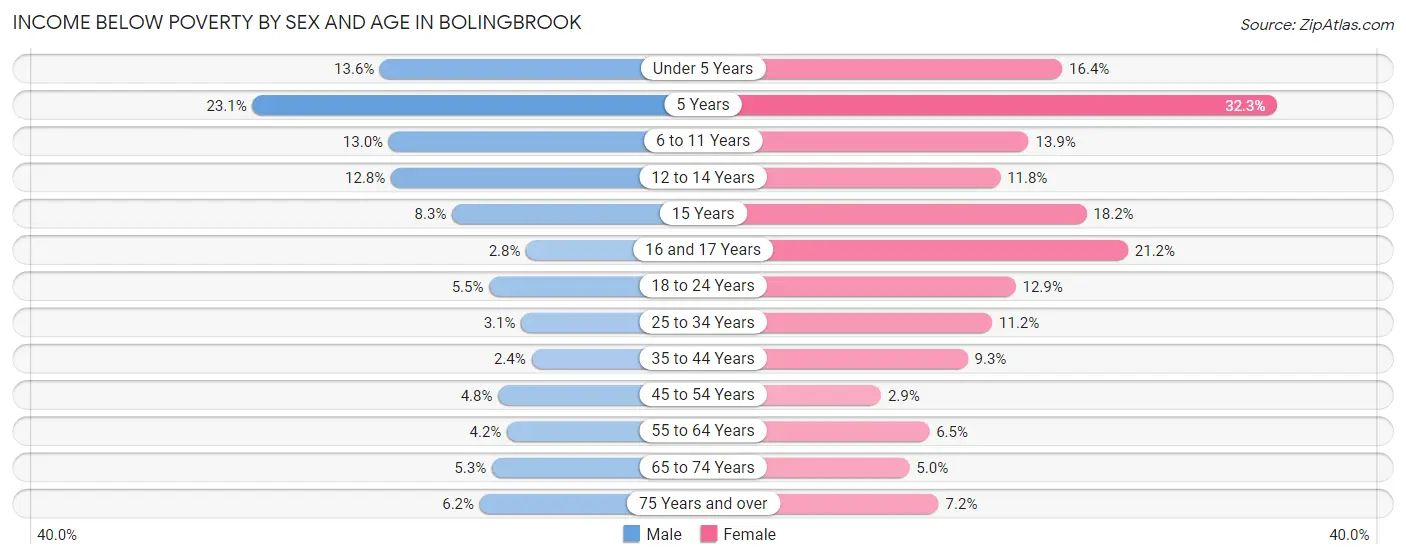
| Age Bracket | Male | Female |
| Under 5 Years | 216 (13.6%) | 338 (16.4%) |
| 5 Years | 96 (23.1%) | 161 (32.3%) |
| 6 to 11 Years | 409 (13.0%) | 389 (13.9%) |
| 12 to 14 Years | 198 (12.8%) | 228 (11.8%) |
| 15 Years | 32 (8.3%) | 144 (18.2%) |
| 16 and 17 Years | 32 (2.8%) | 196 (21.2%) |
| 18 to 24 Years | 224 (5.5%) | 507 (12.9%) |
| 25 to 34 Years | 153 (3.1%) | 450 (11.2%) |
| 35 to 44 Years | 120 (2.4%) | 502 (9.3%) |
| 45 to 54 Years | 248 (4.8%) | 160 (2.9%) |
| 55 to 64 Years | 188 (4.2%) | 302 (6.5%) |
| 65 to 74 Years | 146 (5.3%) | 163 (5.0%) |
| 75 Years and over | 91 (6.2%) | 94 (7.2%) |
| Total | 2,153 (5.9%) | 3,634 (9.8%) |
Income Above Poverty by Sex and Age in Bolingbrook
According to the poverty statistics in Bolingbrook, males aged 35 to 44 years and females aged 45 to 54 years are the age groups that are most secure financially, with 97.6% of males and 97.1% of females in these age groups living above the poverty line.
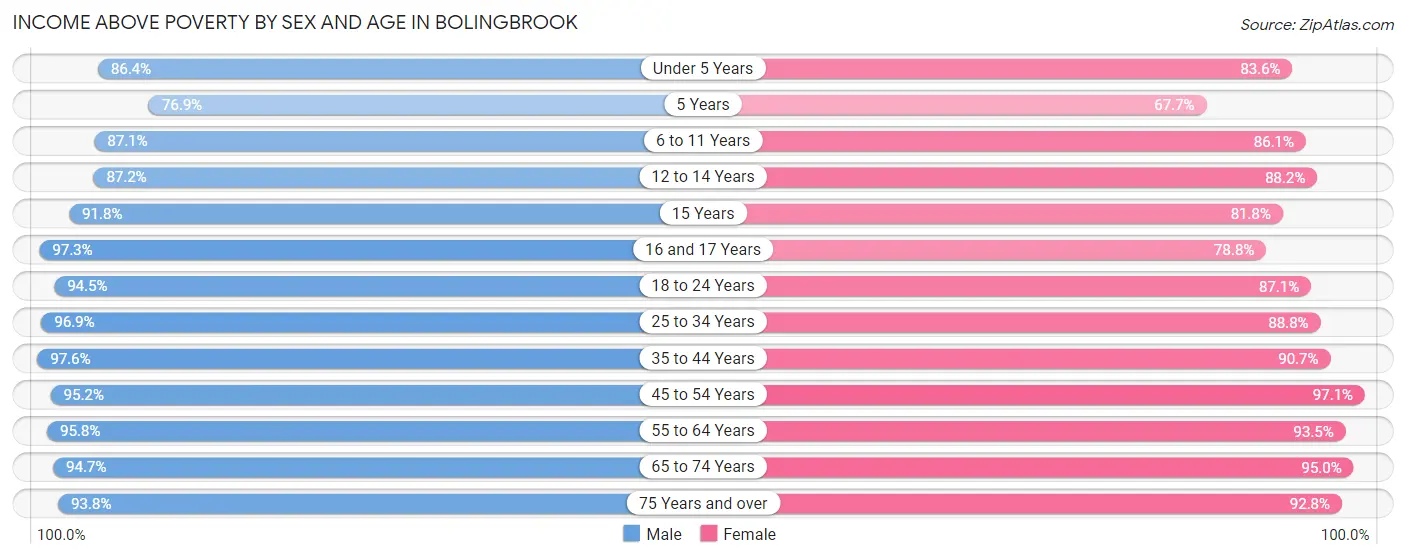
| Age Bracket | Male | Female |
| Under 5 Years | 1,372 (86.4%) | 1,728 (83.6%) |
| 5 Years | 320 (76.9%) | 337 (67.7%) |
| 6 to 11 Years | 2,749 (87.1%) | 2,416 (86.1%) |
| 12 to 14 Years | 1,350 (87.2%) | 1,711 (88.2%) |
| 15 Years | 356 (91.7%) | 649 (81.8%) |
| 16 and 17 Years | 1,130 (97.3%) | 727 (78.8%) |
| 18 to 24 Years | 3,852 (94.5%) | 3,424 (87.1%) |
| 25 to 34 Years | 4,747 (96.9%) | 3,584 (88.8%) |
| 35 to 44 Years | 4,970 (97.6%) | 4,872 (90.7%) |
| 45 to 54 Years | 4,889 (95.2%) | 5,332 (97.1%) |
| 55 to 64 Years | 4,324 (95.8%) | 4,348 (93.5%) |
| 65 to 74 Years | 2,607 (94.7%) | 3,082 (95.0%) |
| 75 Years and over | 1,376 (93.8%) | 1,214 (92.8%) |
| Total | 34,042 (94.1%) | 33,424 (90.2%) |
Income Below Poverty Among Married-Couple Families in Bolingbrook
The poverty statistics for married-couple families in Bolingbrook show that 2.4% or 326 of the total 13,780 families live below the poverty line. Families with 3 or 4 children have the highest poverty rate of 6.0%, comprising of 78 families. On the other hand, families with 5 or more children have the lowest poverty rate of 0.0%, which includes 0 families.
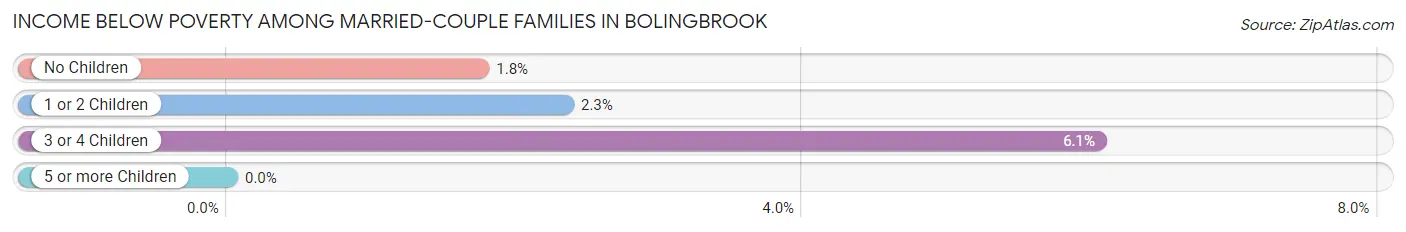
| Children | Above Poverty | Below Poverty |
| No Children | 7,252 (98.3%) | 129 (1.8%) |
| 1 or 2 Children | 4,959 (97.7%) | 119 (2.3%) |
| 3 or 4 Children | 1,212 (94.0%) | 78 (6.0%) |
| 5 or more Children | 31 (100.0%) | 0 (0.0%) |
| Total | 13,454 (97.6%) | 326 (2.4%) |
Income Below Poverty Among Single-Parent Households in Bolingbrook
According to the poverty data in Bolingbrook, 8.6% or 114 single-father households and 23.6% or 804 single-mother households are living below the poverty line. Among single-father households, those with no children have the highest poverty rate, with 97 households (14.6%) experiencing poverty. Likewise, among single-mother households, those with 5 or more children have the highest poverty rate, with 99 households (93.4%) falling below the poverty line.
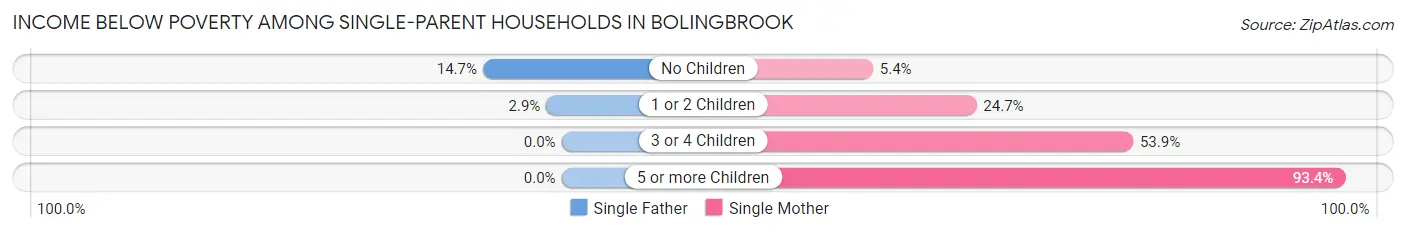
| Children | Single Father | Single Mother |
| No Children | 97 (14.6%) | 74 (5.4%) |
| 1 or 2 Children | 17 (2.9%) | 347 (24.7%) |
| 3 or 4 Children | 0 (0.0%) | 284 (53.9%) |
| 5 or more Children | 0 (0.0%) | 99 (93.4%) |
| Total | 114 (8.6%) | 804 (23.6%) |
Income Below Poverty Among Married-Couple vs Single-Parent Households in Bolingbrook
The poverty data for Bolingbrook shows that 326 of the married-couple family households (2.4%) and 918 of the single-parent households (19.5%) are living below the poverty level. Within the married-couple family households, those with 3 or 4 children have the highest poverty rate, with 78 households (6.0%) falling below the poverty line. Among the single-parent households, those with 5 or more children have the highest poverty rate, with 99 household (93.4%) living below poverty.
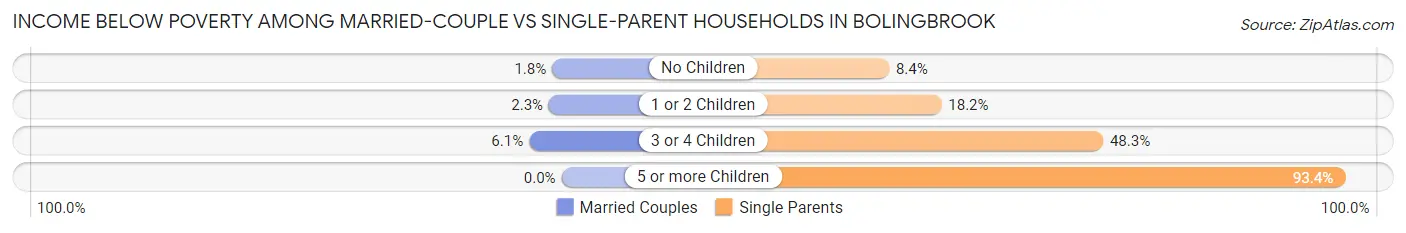
| Children | Married-Couple Families | Single-Parent Households |
| No Children | 129 (1.8%) | 171 (8.4%) |
| 1 or 2 Children | 119 (2.3%) | 364 (18.2%) |
| 3 or 4 Children | 78 (6.0%) | 284 (48.3%) |
| 5 or more Children | 0 (0.0%) | 99 (93.4%) |
| Total | 326 (2.4%) | 918 (19.5%) |
Race in Bolingbrook
The most populous races in Bolingbrook are White / Caucasian (34,865 | 47.3%), Hispanic or Latino (20,044 | 27.2%), and Black / African American (13,192 | 17.9%).
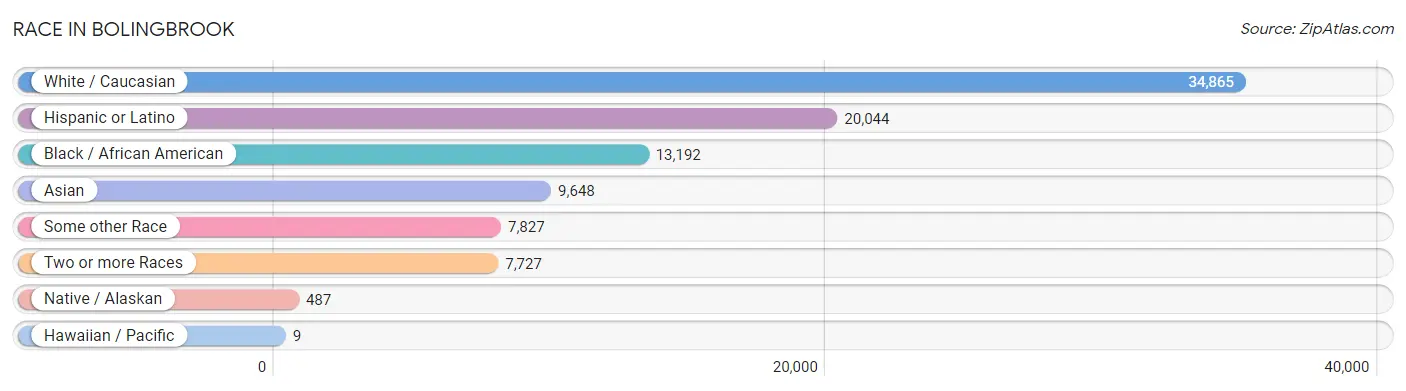
| Race | # Population | % Population |
| Asian | 9,648 | 13.1% |
| Black / African American | 13,192 | 17.9% |
| Hawaiian / Pacific | 9 | 0.0% |
| Hispanic or Latino | 20,044 | 27.2% |
| Native / Alaskan | 487 | 0.7% |
| White / Caucasian | 34,865 | 47.3% |
| Two or more Races | 7,727 | 10.5% |
| Some other Race | 7,827 | 10.6% |
| Total | 73,755 | 100.0% |
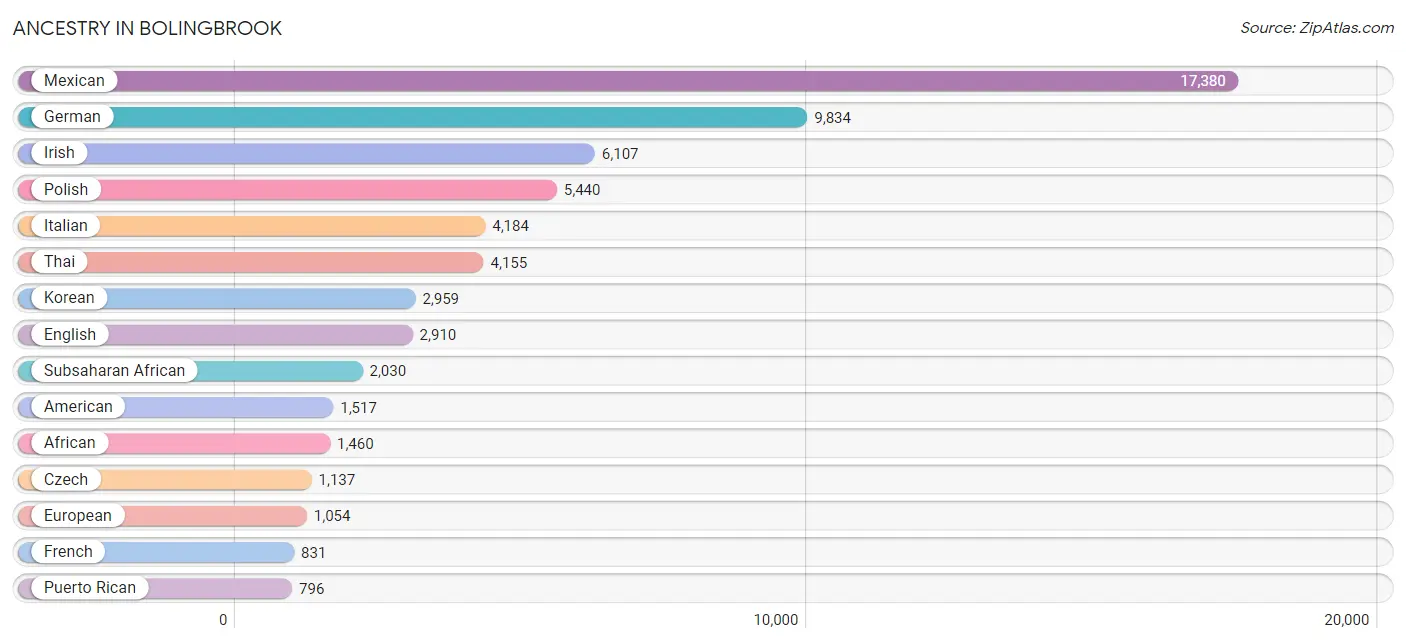
Ancestry in Bolingbrook
The most populous ancestries reported in Bolingbrook are Mexican (17,380 | 23.6%), German (9,834 | 13.3%), Irish (6,107 | 8.3%), Polish (5,440 | 7.4%), and Italian (4,184 | 5.7%), together accounting for 58.2% of all Bolingbrook residents.
| Ancestry | # Population | % Population |
| Afghan | 255 | 0.4% |
| African | 1,460 | 2.0% |
| Albanian | 47 | 0.1% |
| Alsatian | 12 | 0.0% |
| American | 1,517 | 2.1% |
| Apache | 55 | 0.1% |
| Arab | 336 | 0.5% |
| Argentinean | 14 | 0.0% |
| Armenian | 13 | 0.0% |
| Assyrian / Chaldean / Syriac | 35 | 0.1% |
| Austrian | 169 | 0.2% |
| Belgian | 32 | 0.0% |
| Belizean | 60 | 0.1% |
| Bhutanese | 182 | 0.3% |
| Bolivian | 38 | 0.1% |
| British | 81 | 0.1% |
| British West Indian | 15 | 0.0% |
| Bulgarian | 39 | 0.1% |
| Burmese | 489 | 0.7% |
| Cambodian | 95 | 0.1% |
| Canadian | 39 | 0.1% |
| Central American | 355 | 0.5% |
| Central American Indian | 31 | 0.0% |
| Cherokee | 115 | 0.2% |
| Chickasaw | 9 | 0.0% |
| Chippewa | 5 | 0.0% |
| Choctaw | 24 | 0.0% |
| Colombian | 69 | 0.1% |
| Croatian | 168 | 0.2% |
| Cuban | 98 | 0.1% |
| Czech | 1,137 | 1.5% |
| Czechoslovakian | 114 | 0.2% |
| Danish | 93 | 0.1% |
| Dominican | 166 | 0.2% |
| Dutch | 539 | 0.7% |
| Eastern European | 130 | 0.2% |
| Ecuadorian | 133 | 0.2% |
| Egyptian | 62 | 0.1% |
| English | 2,910 | 4.0% |
| Ethiopian | 7 | 0.0% |
| European | 1,054 | 1.4% |
| Filipino | 26 | 0.0% |
| Finnish | 39 | 0.1% |
| French | 831 | 1.1% |
| French Canadian | 169 | 0.2% |
| German | 9,834 | 13.3% |
| Ghanaian | 192 | 0.3% |
| Greek | 410 | 0.6% |
| Guatemalan | 274 | 0.4% |
| Haitian | 132 | 0.2% |
| Honduran | 12 | 0.0% |
| Hungarian | 83 | 0.1% |
| Indian (Asian) | 702 | 0.9% |
| Indonesian | 54 | 0.1% |
| Iranian | 3 | 0.0% |
| Irish | 6,107 | 8.3% |
| Israeli | 7 | 0.0% |
| Italian | 4,184 | 5.7% |
| Jamaican | 218 | 0.3% |
| Japanese | 15 | 0.0% |
| Jordanian | 30 | 0.0% |
| Kenyan | 34 | 0.1% |
| Korean | 2,959 | 4.0% |
| Latvian | 24 | 0.0% |
| Lebanese | 161 | 0.2% |
| Lithuanian | 737 | 1.0% |
| Macedonian | 54 | 0.1% |
| Malaysian | 84 | 0.1% |
| Mexican | 17,380 | 23.6% |
| Mexican American Indian | 337 | 0.5% |
| Native Hawaiian | 41 | 0.1% |
| Navajo | 11 | 0.0% |
| Nicaraguan | 30 | 0.0% |
| Nigerian | 257 | 0.4% |
| Northern European | 62 | 0.1% |
| Norwegian | 466 | 0.6% |
| Paiute | 19 | 0.0% |
| Pakistani | 11 | 0.0% |
| Palestinian | 52 | 0.1% |
| Panamanian | 29 | 0.0% |
| Pennsylvania German | 16 | 0.0% |
| Peruvian | 120 | 0.2% |
| Polish | 5,440 | 7.4% |
| Portuguese | 91 | 0.1% |
| Puerto Rican | 796 | 1.1% |
| Romanian | 498 | 0.7% |
| Russian | 404 | 0.5% |
| Salvadoran | 10 | 0.0% |
| Scandinavian | 198 | 0.3% |
| Scotch-Irish | 103 | 0.1% |
| Scottish | 356 | 0.5% |
| Serbian | 165 | 0.2% |
| Slavic | 49 | 0.1% |
| Slovak | 199 | 0.3% |
| Slovene | 89 | 0.1% |
| South American | 423 | 0.6% |
| South American Indian | 10 | 0.0% |
| Spaniard | 236 | 0.3% |
| Spanish | 422 | 0.6% |
| Sri Lankan | 109 | 0.2% |
| Subsaharan African | 2,030 | 2.8% |
| Swedish | 477 | 0.6% |
| Swiss | 295 | 0.4% |
| Thai | 4,155 | 5.6% |
| Trinidadian and Tobagonian | 16 | 0.0% |
| Turkish | 18 | 0.0% |
| Ukrainian | 119 | 0.2% |
| Venezuelan | 49 | 0.1% |
| Welsh | 115 | 0.2% |
| West Indian | 16 | 0.0% |
| Yugoslavian | 208 | 0.3% | View All 111 Rows |
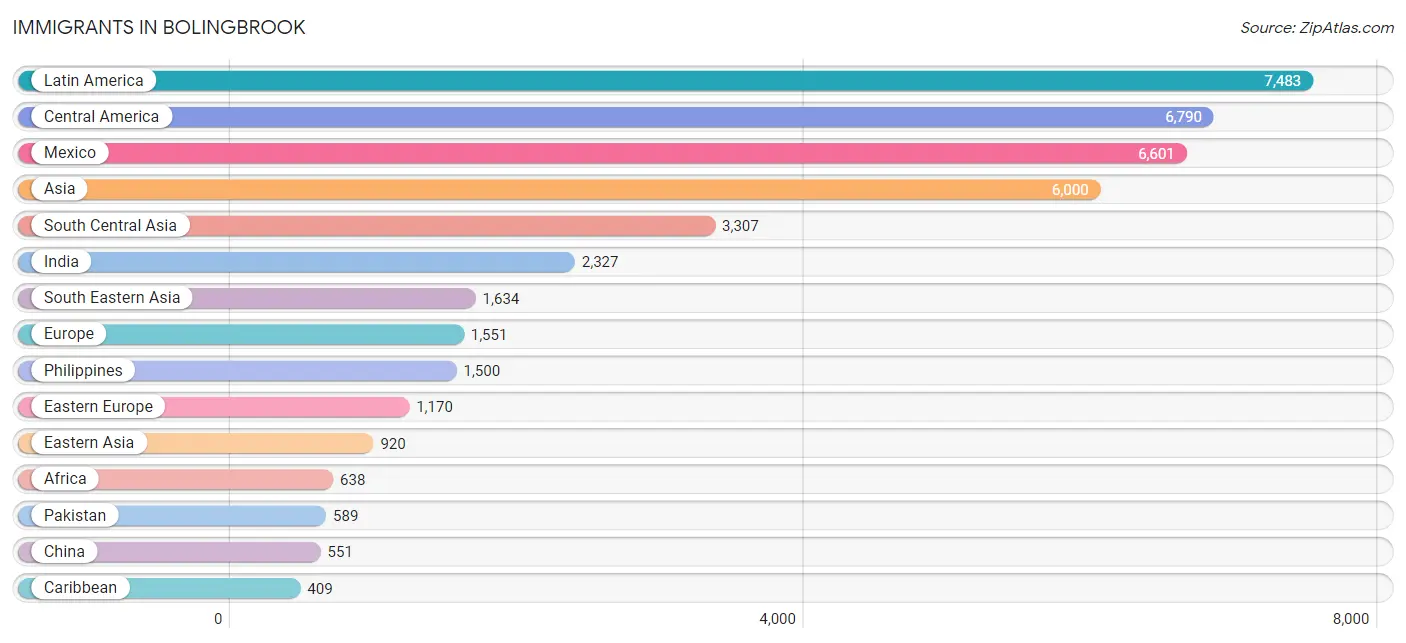
Immigrants in Bolingbrook
The most numerous immigrant groups reported in Bolingbrook came from Latin America (7,483 | 10.2%), Central America (6,790 | 9.2%), Mexico (6,601 | 8.9%), Asia (6,000 | 8.1%), and South Central Asia (3,307 | 4.5%), together accounting for 40.9% of all Bolingbrook residents.
| Immigration Origin | # Population | % Population |
| Afghanistan | 147 | 0.2% |
| Africa | 638 | 0.9% |
| Argentina | 14 | 0.0% |
| Asia | 6,000 | 8.1% |
| Belarus | 13 | 0.0% |
| Belize | 10 | 0.0% |
| Bolivia | 76 | 0.1% |
| Bosnia and Herzegovina | 114 | 0.2% |
| Bulgaria | 15 | 0.0% |
| Cambodia | 15 | 0.0% |
| Canada | 77 | 0.1% |
| Caribbean | 409 | 0.5% |
| Central America | 6,790 | 9.2% |
| China | 551 | 0.7% |
| Colombia | 68 | 0.1% |
| Czechoslovakia | 11 | 0.0% |
| Dominican Republic | 172 | 0.2% |
| Eastern Africa | 189 | 0.3% |
| Eastern Asia | 920 | 1.3% |
| Eastern Europe | 1,170 | 1.6% |
| Ecuador | 49 | 0.1% |
| Egypt | 10 | 0.0% |
| El Salvador | 3 | 0.0% |
| England | 56 | 0.1% |
| Ethiopia | 1 | 0.0% |
| Europe | 1,551 | 2.1% |
| France | 55 | 0.1% |
| Germany | 45 | 0.1% |
| Ghana | 132 | 0.2% |
| Greece | 19 | 0.0% |
| Guatemala | 115 | 0.2% |
| Haiti | 71 | 0.1% |
| Honduras | 33 | 0.0% |
| India | 2,327 | 3.2% |
| Ireland | 6 | 0.0% |
| Israel | 7 | 0.0% |
| Italy | 13 | 0.0% |
| Jamaica | 128 | 0.2% |
| Japan | 157 | 0.2% |
| Jordan | 46 | 0.1% |
| Kazakhstan | 132 | 0.2% |
| Kenya | 101 | 0.1% |
| Korea | 174 | 0.2% |
| Laos | 50 | 0.1% |
| Latin America | 7,483 | 10.2% |
| Lebanon | 30 | 0.0% |
| Lithuania | 71 | 0.1% |
| Mexico | 6,601 | 8.9% |
| Middle Africa | 29 | 0.0% |
| Moldova | 211 | 0.3% |
| Nicaragua | 7 | 0.0% |
| Nigeria | 167 | 0.2% |
| North Macedonia | 8 | 0.0% |
| Northern Africa | 10 | 0.0% |
| Northern Europe | 98 | 0.1% |
| Pakistan | 589 | 0.8% |
| Panama | 21 | 0.0% |
| Peru | 28 | 0.0% |
| Philippines | 1,500 | 2.0% |
| Poland | 303 | 0.4% |
| Romania | 213 | 0.3% |
| Russia | 62 | 0.1% |
| Saudi Arabia | 34 | 0.1% |
| Scotland | 28 | 0.0% |
| Senegal | 64 | 0.1% |
| Serbia | 45 | 0.1% |
| South America | 284 | 0.4% |
| South Central Asia | 3,307 | 4.5% |
| South Eastern Asia | 1,634 | 2.2% |
| Southern Europe | 32 | 0.0% |
| Sri Lanka | 22 | 0.0% |
| Taiwan | 138 | 0.2% |
| Thailand | 11 | 0.0% |
| Trinidad and Tobago | 23 | 0.0% |
| Turkey | 18 | 0.0% |
| Ukraine | 58 | 0.1% |
| Uzbekistan | 90 | 0.1% |
| Venezuela | 49 | 0.1% |
| Vietnam | 58 | 0.1% |
| Western Africa | 363 | 0.5% |
| Western Asia | 139 | 0.2% |
| Western Europe | 100 | 0.1% |
| Yemen | 4 | 0.0% |
| Zaire | 29 | 0.0% | View All 84 Rows |
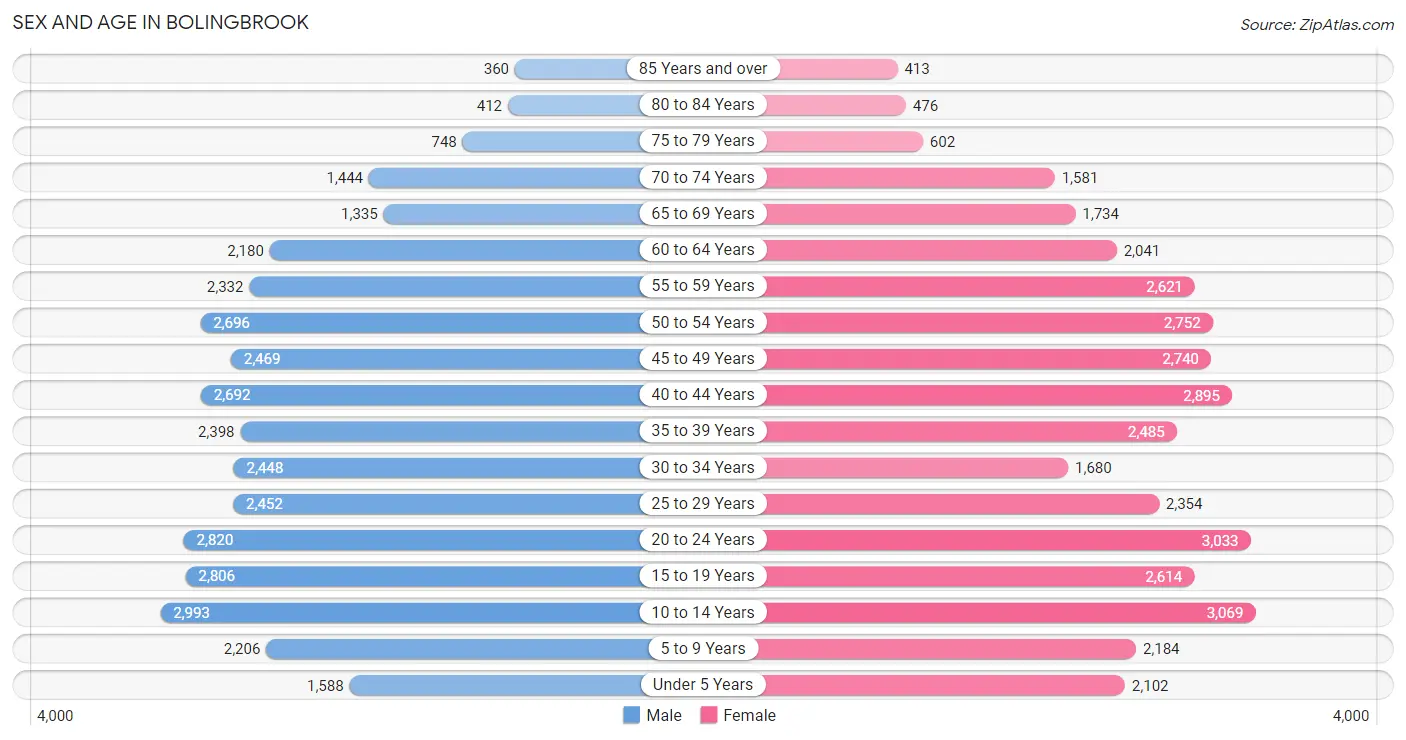
Sex and Age in Bolingbrook
Sex and Age in Bolingbrook
The most populous age groups in Bolingbrook are 10 to 14 Years (2,993 | 8.2%) for men and 10 to 14 Years (3,069 | 8.2%) for women.
| Age Bracket | Male | Female |
| Under 5 Years | 1,588 (4.4%) | 2,102 (5.6%) |
| 5 to 9 Years | 2,206 (6.1%) | 2,184 (5.8%) |
| 10 to 14 Years | 2,993 (8.2%) | 3,069 (8.2%) |
| 15 to 19 Years | 2,806 (7.7%) | 2,614 (7.0%) |
| 20 to 24 Years | 2,820 (7.7%) | 3,033 (8.1%) |
| 25 to 29 Years | 2,452 (6.7%) | 2,354 (6.3%) |
| 30 to 34 Years | 2,448 (6.7%) | 1,680 (4.5%) |
| 35 to 39 Years | 2,398 (6.6%) | 2,485 (6.7%) |
| 40 to 44 Years | 2,692 (7.4%) | 2,895 (7.7%) |
| 45 to 49 Years | 2,469 (6.8%) | 2,740 (7.3%) |
| 50 to 54 Years | 2,696 (7.4%) | 2,752 (7.4%) |
| 55 to 59 Years | 2,332 (6.4%) | 2,621 (7.0%) |
| 60 to 64 Years | 2,180 (6.0%) | 2,041 (5.5%) |
| 65 to 69 Years | 1,335 (3.7%) | 1,734 (4.6%) |
| 70 to 74 Years | 1,444 (4.0%) | 1,581 (4.2%) |
| 75 to 79 Years | 748 (2.1%) | 602 (1.6%) |
| 80 to 84 Years | 412 (1.1%) | 476 (1.3%) |
| 85 Years and over | 360 (1.0%) | 413 (1.1%) |
| Total | 36,379 (100.0%) | 37,376 (100.0%) |
Families and Households in Bolingbrook
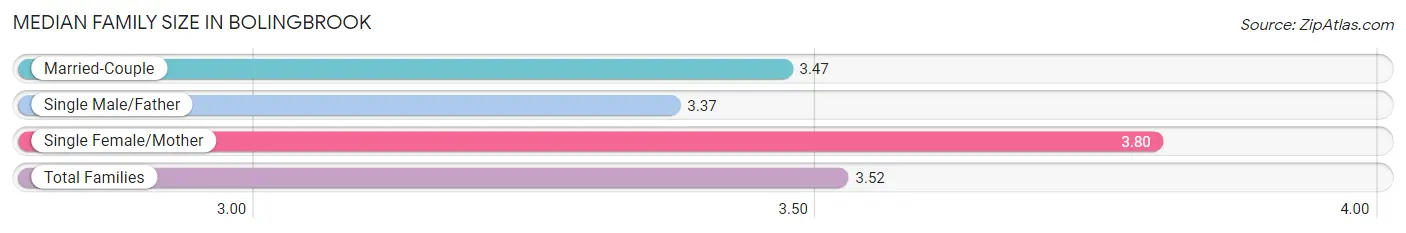
Median Family Size in Bolingbrook
The median family size in Bolingbrook is 3.52 persons per family, with single female/mother families (3,401 | 18.4%) accounting for the largest median family size of 3.8 persons per family. On the other hand, single male/father families (1,319 | 7.1%) represent the smallest median family size with 3.37 persons per family.
| Family Type | # Families | Family Size |
| Married-Couple | 13,780 (74.5%) | 3.47 |
| Single Male/Father | 1,319 (7.1%) | 3.37 |
| Single Female/Mother | 3,401 (18.4%) | 3.80 |
| Total Families | 18,500 (100.0%) | 3.52 |
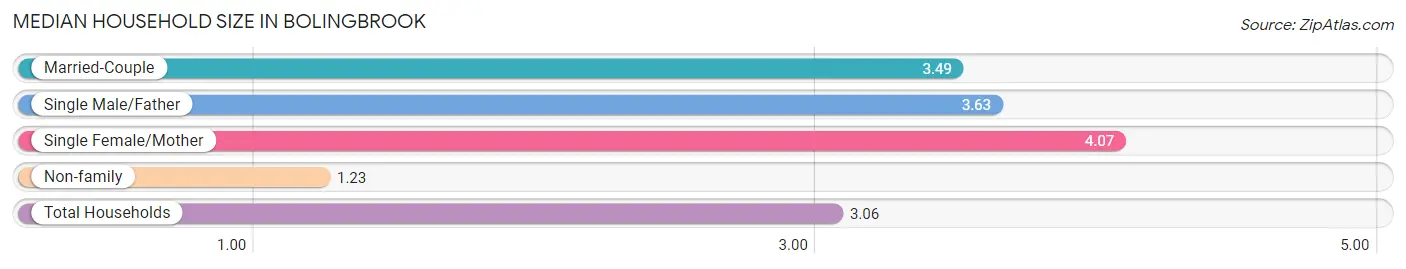
Median Household Size in Bolingbrook
The median household size in Bolingbrook is 3.06 persons per household, with single female/mother households (3,401 | 14.2%) accounting for the largest median household size of 4.07 persons per household. non-family households (5,450 | 22.8%) represent the smallest median household size with 1.23 persons per household.
| Household Type | # Households | Household Size |
| Married-Couple | 13,780 (57.5%) | 3.49 |
| Single Male/Father | 1,319 (5.5%) | 3.63 |
| Single Female/Mother | 3,401 (14.2%) | 4.07 |
| Non-family | 5,450 (22.8%) | 1.23 |
| Total Households | 23,950 (100.0%) | 3.06 |
Household Size by Marriage Status in Bolingbrook
Out of a total of 23,950 households in Bolingbrook, 18,500 (77.2%) are family households, while 5,450 (22.8%) are nonfamily households. The most numerous type of family households are 2-person households, comprising 6,381, and the most common type of nonfamily households are 1-person households, comprising 4,458.
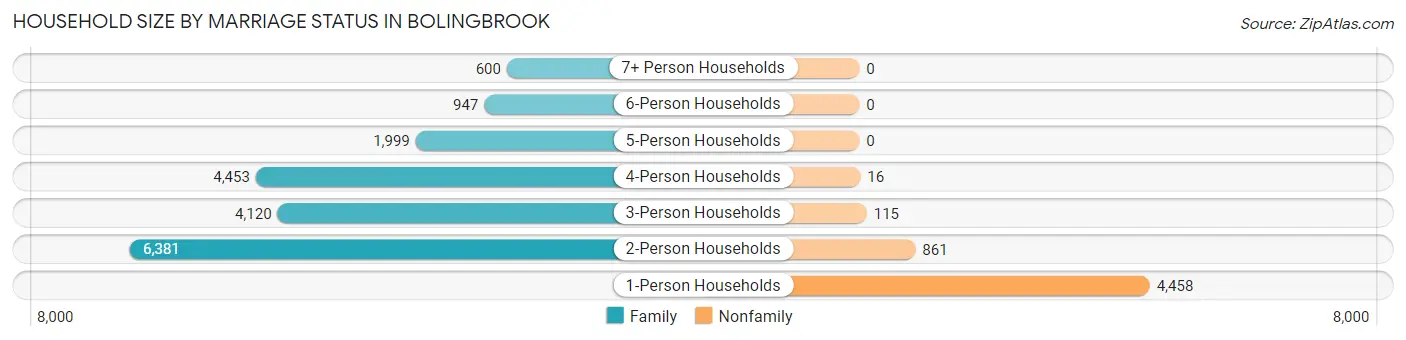
| Household Size | Family Households | Nonfamily Households |
| 1-Person Households | - | 4,458 (18.6%) |
| 2-Person Households | 6,381 (26.6%) | 861 (3.6%) |
| 3-Person Households | 4,120 (17.2%) | 115 (0.5%) |
| 4-Person Households | 4,453 (18.6%) | 16 (0.1%) |
| 5-Person Households | 1,999 (8.4%) | 0 (0.0%) |
| 6-Person Households | 947 (4.0%) | 0 (0.0%) |
| 7+ Person Households | 600 (2.5%) | 0 (0.0%) |
| Total | 18,500 (77.2%) | 5,450 (22.8%) |
Female Fertility in Bolingbrook
Fertility by Age in Bolingbrook
Average fertility rate in Bolingbrook is 66.0 births per 1,000 women. Women in the age bracket of 20 to 34 years have the highest fertility rate with 103.0 births per 1,000 women. Women in the age bracket of 20 to 34 years acount for 59.9% of all women with births.
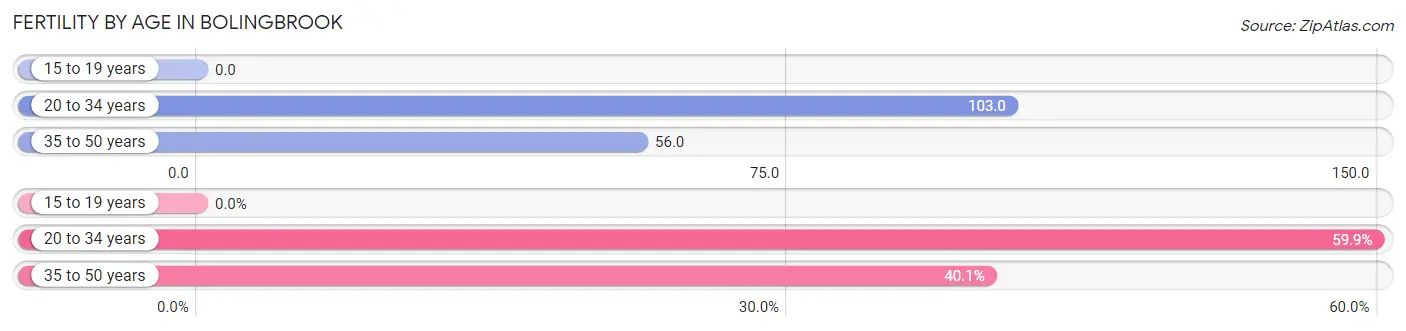
| Age Bracket | Women with Births | Births / 1,000 Women |
| 15 to 19 years | 0 (0.0%) | 0.0 |
| 20 to 34 years | 731 (59.9%) | 103.0 |
| 35 to 50 years | 490 (40.1%) | 56.0 |
| Total | 1,221 (100.0%) | 66.0 |
Fertility by Age by Marriage Status in Bolingbrook
83.0% of women with births (1,221) in Bolingbrook are married. The highest percentage of unmarried women with births falls into 20 to 34 years age bracket with 26.7% of them unmarried at the time of birth, while the lowest percentage of unmarried women with births belong to 35 to 50 years age bracket with 2.6% of them unmarried.
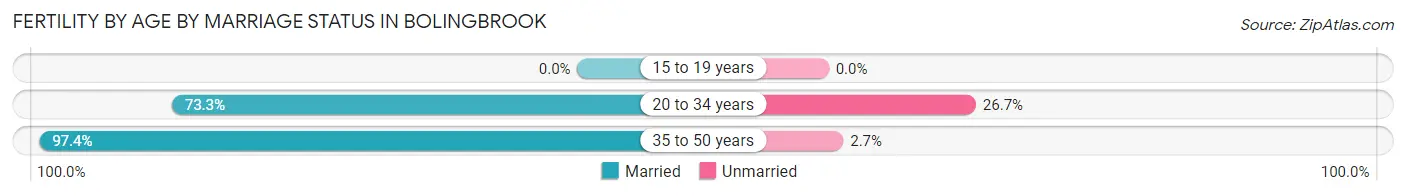
| Age Bracket | Married | Unmarried |
| 15 to 19 years | 0 (0.0%) | 0 (0.0%) |
| 20 to 34 years | 536 (73.3%) | 195 (26.7%) |
| 35 to 50 years | 477 (97.4%) | 13 (2.6%) |
| Total | 1,013 (83.0%) | 208 (17.0%) |
Fertility by Education in Bolingbrook
Average fertility rate in Bolingbrook is 66.0 births per 1,000 women. Women with the education attainment of bachelor's degree have the highest fertility rate of 92.0 births per 1,000 women, while women with the education attainment of high school diploma have the lowest fertility at 30.0 births per 1,000 women. Women with the education attainment of bachelor's degree represent 32.7% of all women with births.
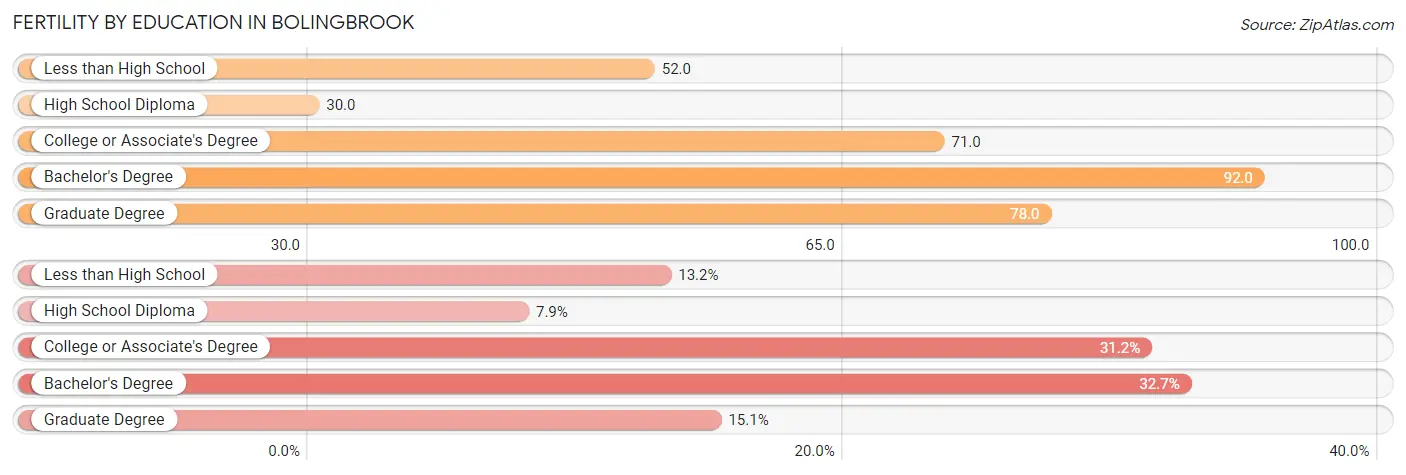
| Educational Attainment | Women with Births | Births / 1,000 Women |
| Less than High School | 161 (13.2%) | 52.0 |
| High School Diploma | 96 (7.9%) | 30.0 |
| College or Associate's Degree | 381 (31.2%) | 71.0 |
| Bachelor's Degree | 399 (32.7%) | 92.0 |
| Graduate Degree | 184 (15.1%) | 78.0 |
| Total | 1,221 (100.0%) | 66.0 |
Fertility by Education by Marriage Status in Bolingbrook
17.0% of women with births in Bolingbrook are unmarried. Women with the educational attainment of less than high school are most likely to be married with 100.0% of them married at childbirth, while women with the educational attainment of college or associate's degree are least likely to be married with 44.6% of them unmarried at childbirth.
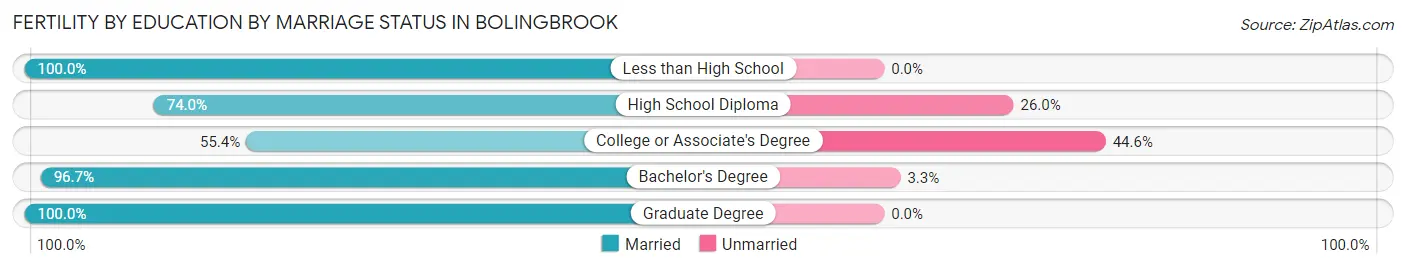
| Educational Attainment | Married | Unmarried |
| Less than High School | 161 (100.0%) | 0 (0.0%) |
| High School Diploma | 71 (74.0%) | 25 (26.0%) |
| College or Associate's Degree | 211 (55.4%) | 170 (44.6%) |
| Bachelor's Degree | 386 (96.7%) | 13 (3.3%) |
| Graduate Degree | 184 (100.0%) | 0 (0.0%) |
| Total | 1,013 (83.0%) | 208 (17.0%) |
Employment Characteristics in Bolingbrook
Employment by Class of Employer in Bolingbrook
Among the 38,699 employed individuals in Bolingbrook, private company employees (29,229 | 75.5%), not-for-profit organizations (2,738 | 7.1%), and local government employees (2,346 | 6.1%) make up the most common classes of employment.
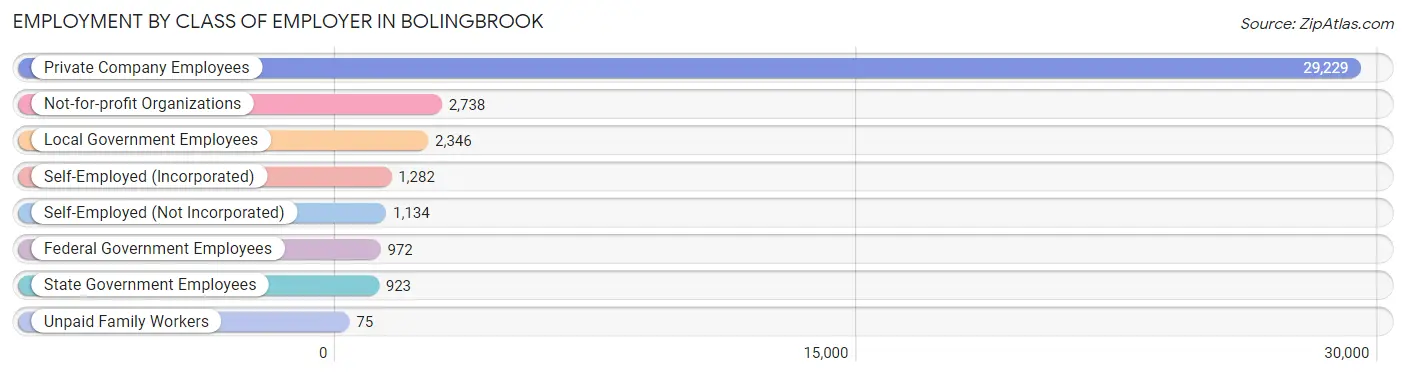
| Employer Class | # Employees | % Employees |
| Private Company Employees | 29,229 | 75.5% |
| Self-Employed (Incorporated) | 1,282 | 3.3% |
| Self-Employed (Not Incorporated) | 1,134 | 2.9% |
| Not-for-profit Organizations | 2,738 | 7.1% |
| Local Government Employees | 2,346 | 6.1% |
| State Government Employees | 923 | 2.4% |
| Federal Government Employees | 972 | 2.5% |
| Unpaid Family Workers | 75 | 0.2% |
| Total | 38,699 | 100.0% |
Employment Status by Age in Bolingbrook
According to the labor force statistics for Bolingbrook, out of the total population over 16 years of age (58,432), 71.5% or 41,779 individuals are in the labor force, with 5.2% or 2,173 of them unemployed. The age group with the highest labor force participation rate is 30 to 34 years, with 91.2% or 3,765 individuals in the labor force. Within the labor force, the 16 to 19 years age range has the highest percentage of unemployed individuals, with 14.6% or 261 of them being unemployed.
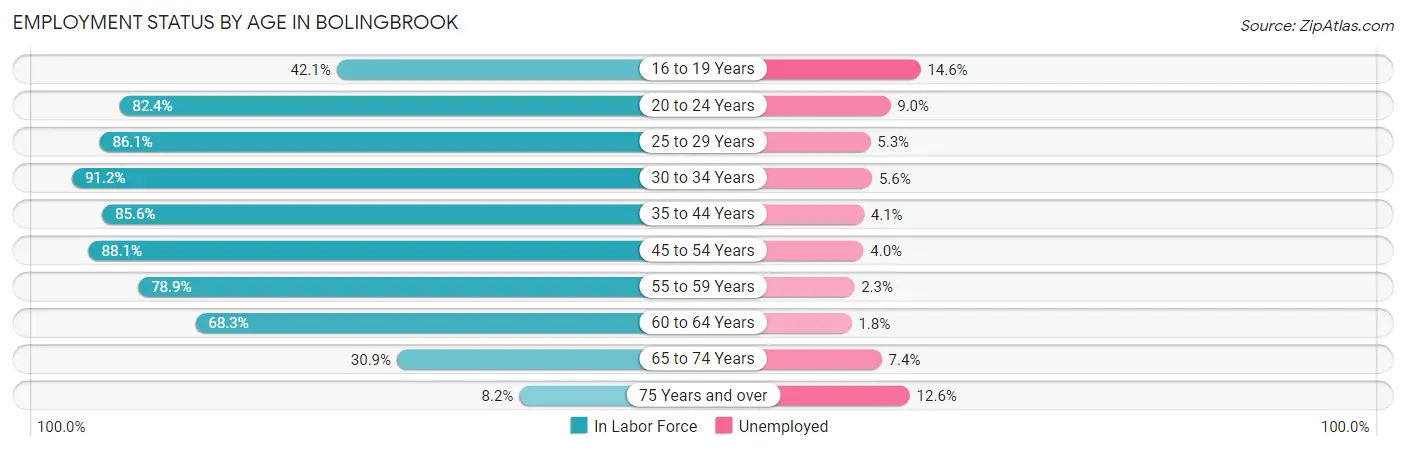
| Age Bracket | In Labor Force | Unemployed |
| 16 to 19 Years | 1,785 (42.1%) | 261 (14.6%) |
| 20 to 24 Years | 4,823 (82.4%) | 434 (9.0%) |
| 25 to 29 Years | 4,138 (86.1%) | 219 (5.3%) |
| 30 to 34 Years | 3,765 (91.2%) | 211 (5.6%) |
| 35 to 44 Years | 8,962 (85.6%) | 367 (4.1%) |
| 45 to 54 Years | 9,389 (88.1%) | 376 (4.0%) |
| 55 to 59 Years | 3,908 (78.9%) | 90 (2.3%) |
| 60 to 64 Years | 2,883 (68.3%) | 52 (1.8%) |
| 65 to 74 Years | 1,883 (30.9%) | 139 (7.4%) |
| 75 Years and over | 247 (8.2%) | 31 (12.6%) |
| Total | 41,779 (71.5%) | 2,173 (5.2%) |
Employment Status by Educational Attainment in Bolingbrook
According to labor force statistics for Bolingbrook, 84.2% of individuals (33,036) out of the total population between 25 and 64 years of age (39,235) are in the labor force, with 4.0% or 1,321 of them being unemployed. The group with the highest labor force participation rate are those with the educational attainment of bachelor's degree or higher, with 90.3% or 14,197 individuals in the labor force. Within the labor force, individuals with less than high school education have the highest percentage of unemployment, with 7.2% or 180 of them being unemployed.
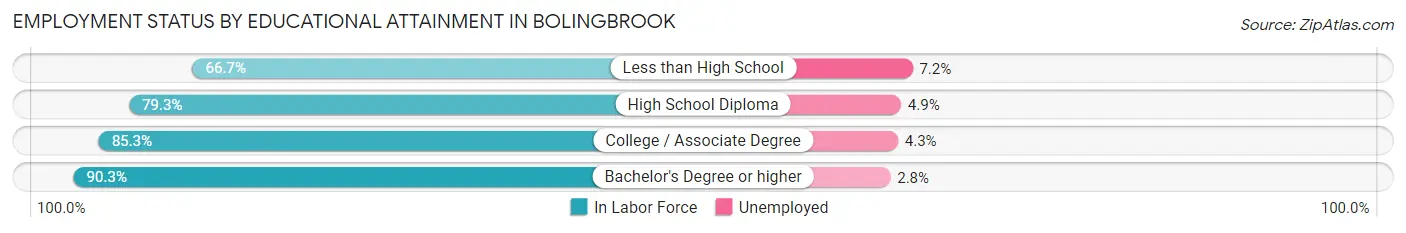
| Educational Attainment | In Labor Force | Unemployed |
| Less than High School | 2,499 (66.7%) | 270 (7.2%) |
| High School Diploma | 6,778 (79.3%) | 419 (4.9%) |
| College / Associate Degree | 9,571 (85.3%) | 482 (4.3%) |
| Bachelor's Degree or higher | 14,197 (90.3%) | 440 (2.8%) |
| Total | 33,036 (84.2%) | 1,569 (4.0%) |
Employment Occupations by Sex in Bolingbrook
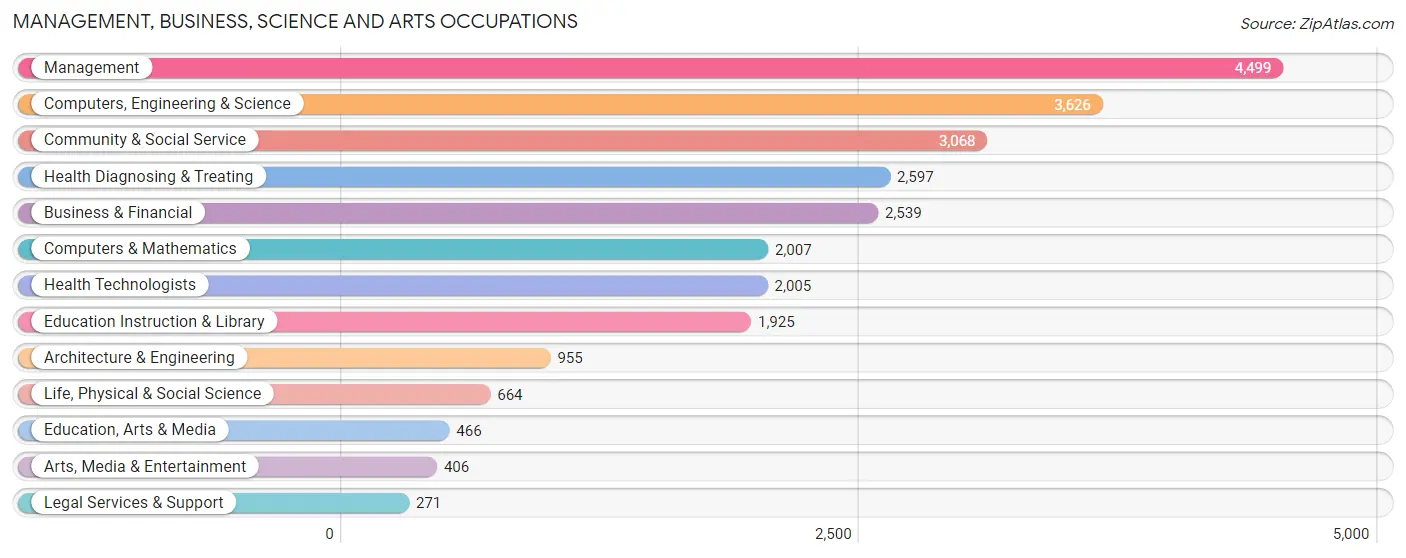
Management, Business, Science and Arts Occupations
The most common Management, Business, Science and Arts occupations in Bolingbrook are Management (4,499 | 11.4%), Computers, Engineering & Science (3,626 | 9.2%), Community & Social Service (3,068 | 7.7%), Health Diagnosing & Treating (2,597 | 6.6%), and Business & Financial (2,539 | 6.4%).
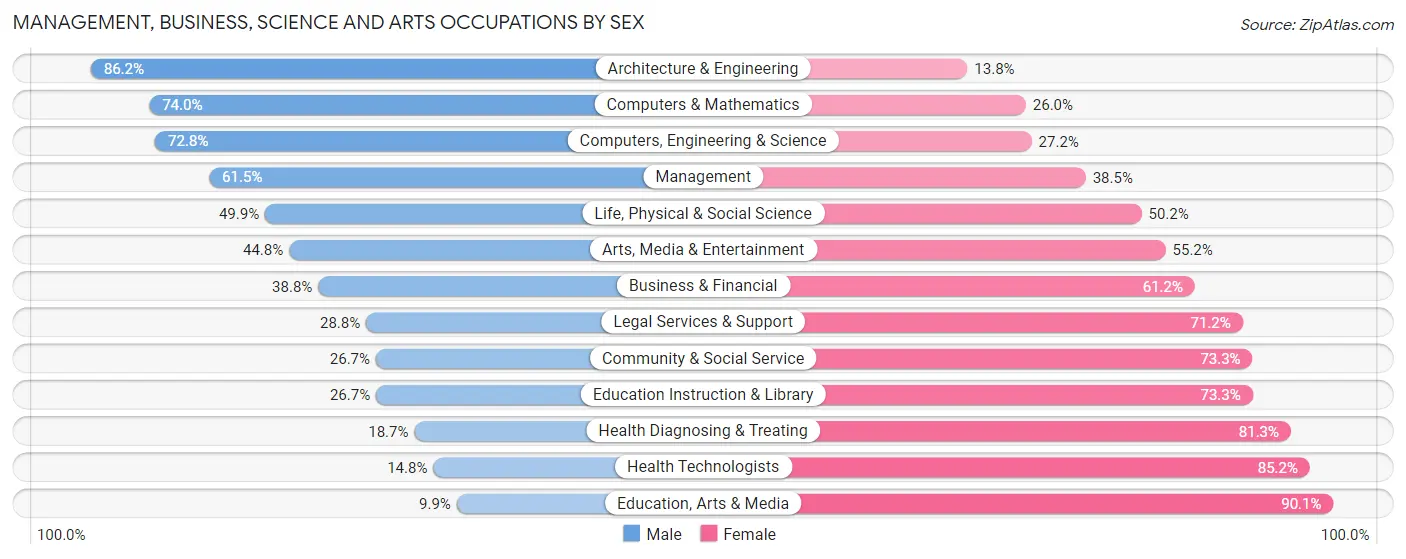
Management, Business, Science and Arts Occupations by Sex
Within the Management, Business, Science and Arts occupations in Bolingbrook, the most male-oriented occupations are Architecture & Engineering (86.2%), Computers & Mathematics (74.0%), and Computers, Engineering & Science (72.8%), while the most female-oriented occupations are Education, Arts & Media (90.1%), Health Technologists (85.2%), and Health Diagnosing & Treating (81.3%).
| Occupation | Male | Female |
| Management | 2,767 (61.5%) | 1,732 (38.5%) |
| Business & Financial | 984 (38.8%) | 1,555 (61.2%) |
| Computers, Engineering & Science | 2,639 (72.8%) | 987 (27.2%) |
| Computers & Mathematics | 1,485 (74.0%) | 522 (26.0%) |
| Architecture & Engineering | 823 (86.2%) | 132 (13.8%) |
| Life, Physical & Social Science | 331 (49.8%) | 333 (50.1%) |
| Community & Social Service | 820 (26.7%) | 2,248 (73.3%) |
| Education, Arts & Media | 46 (9.9%) | 420 (90.1%) |
| Legal Services & Support | 78 (28.8%) | 193 (71.2%) |
| Education Instruction & Library | 514 (26.7%) | 1,411 (73.3%) |
| Arts, Media & Entertainment | 182 (44.8%) | 224 (55.2%) |
| Health Diagnosing & Treating | 486 (18.7%) | 2,111 (81.3%) |
| Health Technologists | 296 (14.8%) | 1,709 (85.2%) |
| Total (Category) | 7,696 (47.1%) | 8,633 (52.9%) |
| Total (Overall) | 20,810 (52.6%) | 18,783 (47.4%) |
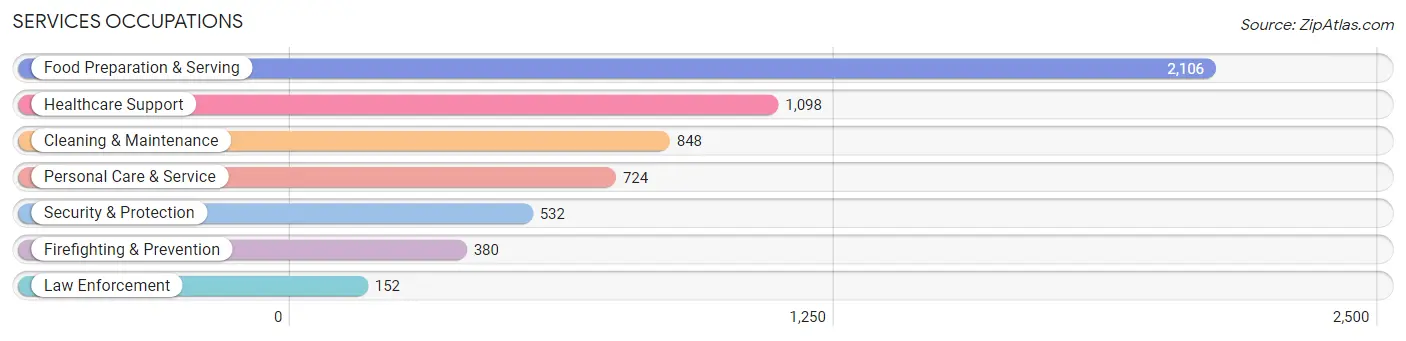
Services Occupations
The most common Services occupations in Bolingbrook are Food Preparation & Serving (2,106 | 5.3%), Healthcare Support (1,098 | 2.8%), Cleaning & Maintenance (848 | 2.1%), Personal Care & Service (724 | 1.8%), and Security & Protection (532 | 1.3%).
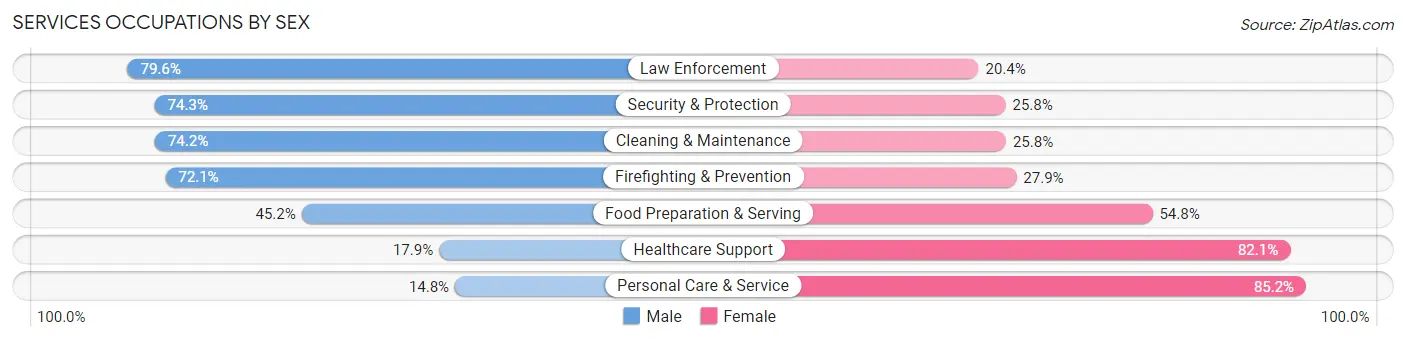
Services Occupations by Sex
Within the Services occupations in Bolingbrook, the most male-oriented occupations are Law Enforcement (79.6%), Security & Protection (74.3%), and Cleaning & Maintenance (74.2%), while the most female-oriented occupations are Personal Care & Service (85.2%), Healthcare Support (82.1%), and Food Preparation & Serving (54.8%).
| Occupation | Male | Female |
| Healthcare Support | 197 (17.9%) | 901 (82.1%) |
| Security & Protection | 395 (74.3%) | 137 (25.8%) |
| Firefighting & Prevention | 274 (72.1%) | 106 (27.9%) |
| Law Enforcement | 121 (79.6%) | 31 (20.4%) |
| Food Preparation & Serving | 951 (45.2%) | 1,155 (54.8%) |
| Cleaning & Maintenance | 629 (74.2%) | 219 (25.8%) |
| Personal Care & Service | 107 (14.8%) | 617 (85.2%) |
| Total (Category) | 2,279 (42.9%) | 3,029 (57.1%) |
| Total (Overall) | 20,810 (52.6%) | 18,783 (47.4%) |
Sales and Office Occupations
The most common Sales and Office occupations in Bolingbrook are Office & Administration (4,713 | 11.9%), and Sales & Related (4,226 | 10.7%).

Sales and Office Occupations by Sex
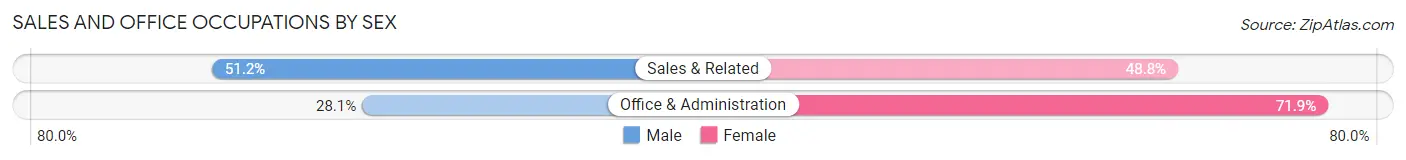
| Occupation | Male | Female |
| Sales & Related | 2,163 (51.2%) | 2,063 (48.8%) |
| Office & Administration | 1,324 (28.1%) | 3,389 (71.9%) |
| Total (Category) | 3,487 (39.0%) | 5,452 (61.0%) |
| Total (Overall) | 20,810 (52.6%) | 18,783 (47.4%) |
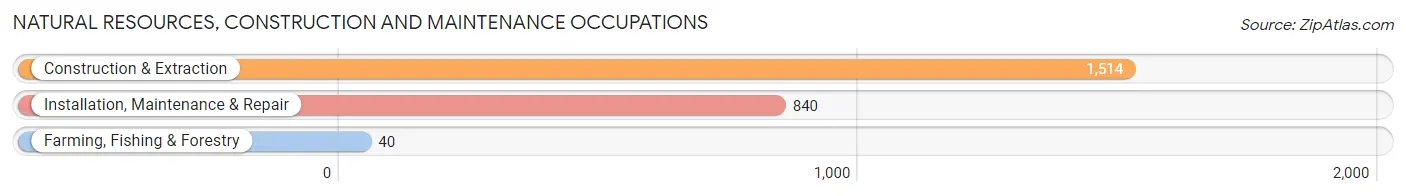
Natural Resources, Construction and Maintenance Occupations
The most common Natural Resources, Construction and Maintenance occupations in Bolingbrook are Construction & Extraction (1,514 | 3.8%), Installation, Maintenance & Repair (840 | 2.1%), and Farming, Fishing & Forestry (40 | 0.1%).
Natural Resources, Construction and Maintenance Occupations by Sex
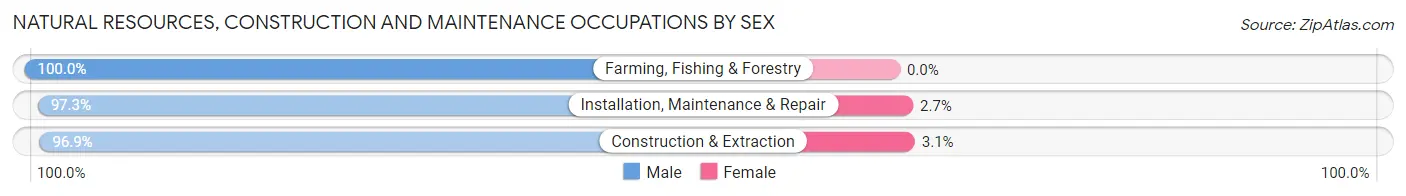
| Occupation | Male | Female |
| Farming, Fishing & Forestry | 40 (100.0%) | 0 (0.0%) |
| Construction & Extraction | 1,467 (96.9%) | 47 (3.1%) |
| Installation, Maintenance & Repair | 817 (97.3%) | 23 (2.7%) |
| Total (Category) | 2,324 (97.1%) | 70 (2.9%) |
| Total (Overall) | 20,810 (52.6%) | 18,783 (47.4%) |
Production, Transportation and Moving Occupations
The most common Production, Transportation and Moving occupations in Bolingbrook are Material Moving (2,575 | 6.5%), Production (2,486 | 6.3%), and Transportation (1,562 | 4.0%).
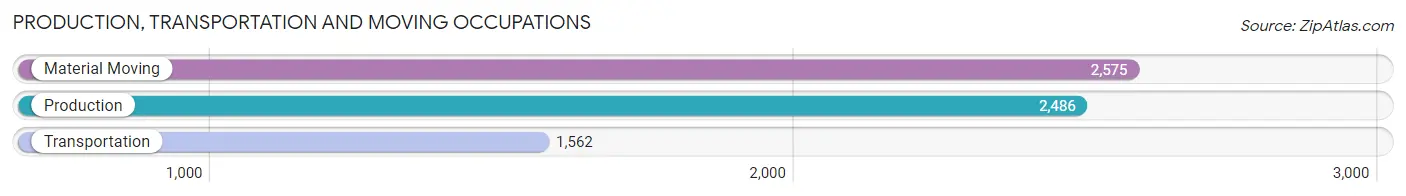
Production, Transportation and Moving Occupations by Sex
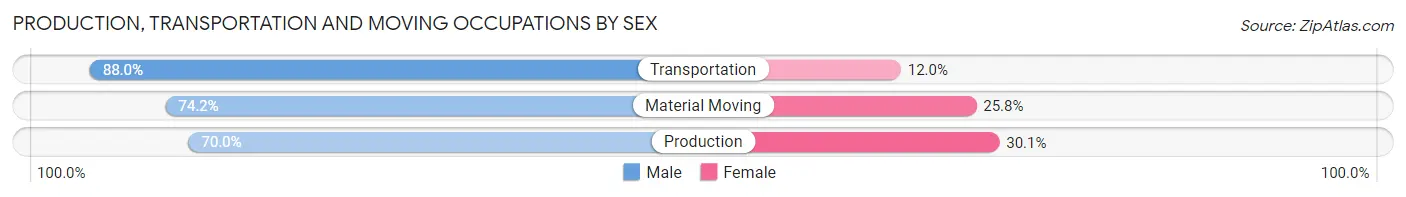
| Occupation | Male | Female |
| Production | 1,739 (70.0%) | 747 (30.0%) |
| Transportation | 1,375 (88.0%) | 187 (12.0%) |
| Material Moving | 1,910 (74.2%) | 665 (25.8%) |
| Total (Category) | 5,024 (75.9%) | 1,599 (24.1%) |
| Total (Overall) | 20,810 (52.6%) | 18,783 (47.4%) |
Employment Industries by Sex in Bolingbrook
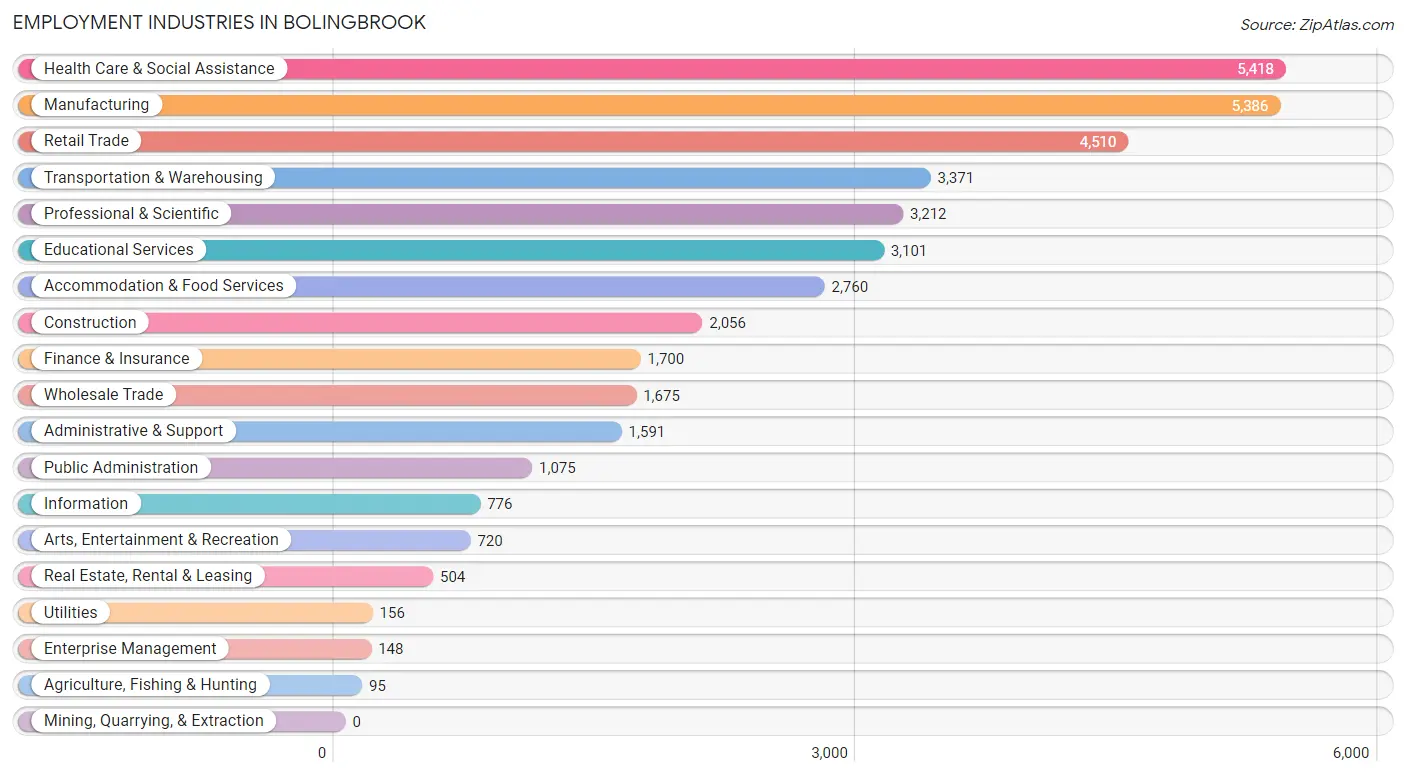
Employment Industries in Bolingbrook
The major employment industries in Bolingbrook include Health Care & Social Assistance (5,418 | 13.7%), Manufacturing (5,386 | 13.6%), Retail Trade (4,510 | 11.4%), Transportation & Warehousing (3,371 | 8.5%), and Professional & Scientific (3,212 | 8.1%).
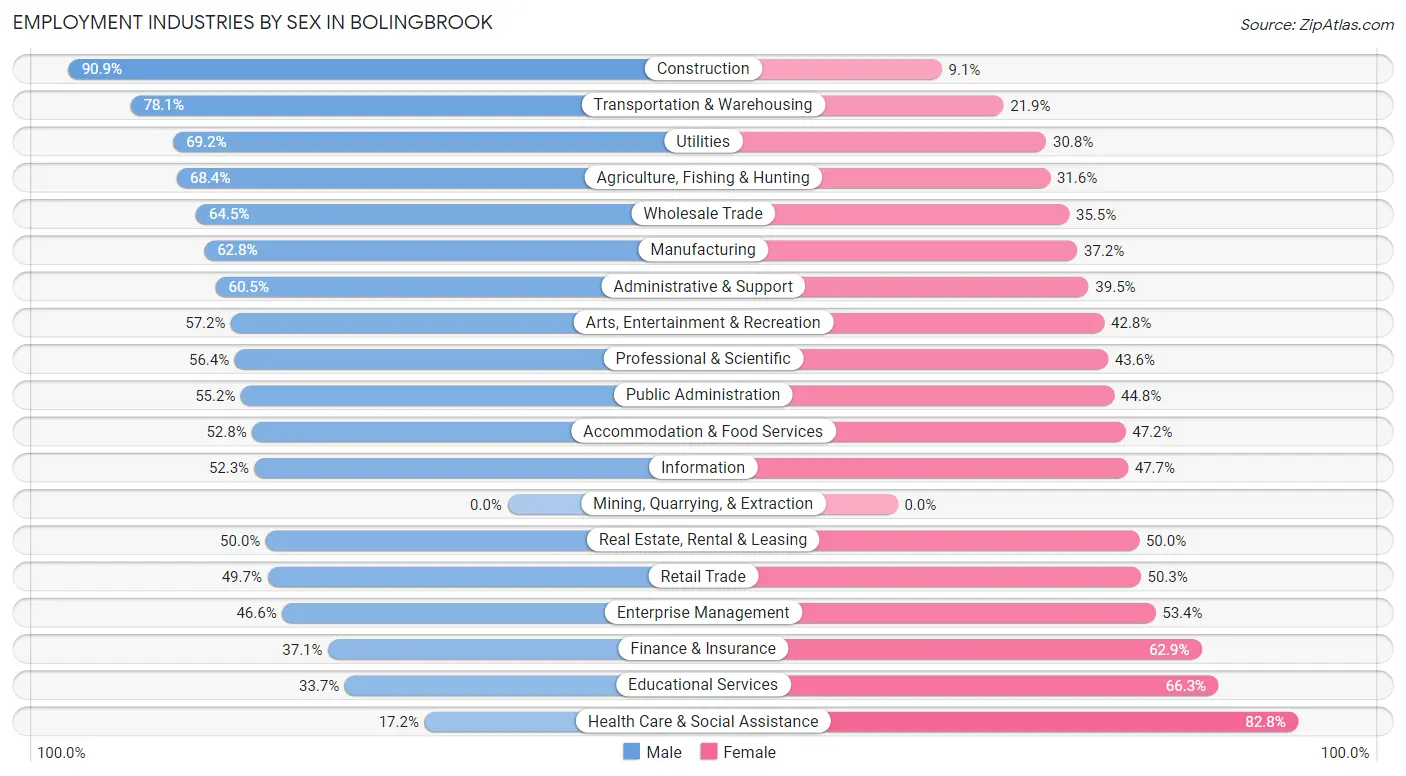
Employment Industries by Sex in Bolingbrook
The Bolingbrook industries that see more men than women are Construction (90.9%), Transportation & Warehousing (78.1%), and Utilities (69.2%), whereas the industries that tend to have a higher number of women are Health Care & Social Assistance (82.8%), Educational Services (66.3%), and Finance & Insurance (62.9%).
| Industry | Male | Female |
| Agriculture, Fishing & Hunting | 65 (68.4%) | 30 (31.6%) |
| Mining, Quarrying, & Extraction | 0 (0.0%) | 0 (0.0%) |
| Construction | 1,868 (90.9%) | 188 (9.1%) |
| Manufacturing | 3,383 (62.8%) | 2,003 (37.2%) |
| Wholesale Trade | 1,080 (64.5%) | 595 (35.5%) |
| Retail Trade | 2,240 (49.7%) | 2,270 (50.3%) |
| Transportation & Warehousing | 2,632 (78.1%) | 739 (21.9%) |
| Utilities | 108 (69.2%) | 48 (30.8%) |
| Information | 406 (52.3%) | 370 (47.7%) |
| Finance & Insurance | 631 (37.1%) | 1,069 (62.9%) |
| Real Estate, Rental & Leasing | 252 (50.0%) | 252 (50.0%) |
| Professional & Scientific | 1,813 (56.4%) | 1,399 (43.6%) |
| Enterprise Management | 69 (46.6%) | 79 (53.4%) |
| Administrative & Support | 962 (60.5%) | 629 (39.5%) |
| Educational Services | 1,044 (33.7%) | 2,057 (66.3%) |
| Health Care & Social Assistance | 931 (17.2%) | 4,487 (82.8%) |
| Arts, Entertainment & Recreation | 412 (57.2%) | 308 (42.8%) |
| Accommodation & Food Services | 1,458 (52.8%) | 1,302 (47.2%) |
| Public Administration | 593 (55.2%) | 482 (44.8%) |
| Total | 20,810 (52.6%) | 18,783 (47.4%) |
Education in Bolingbrook
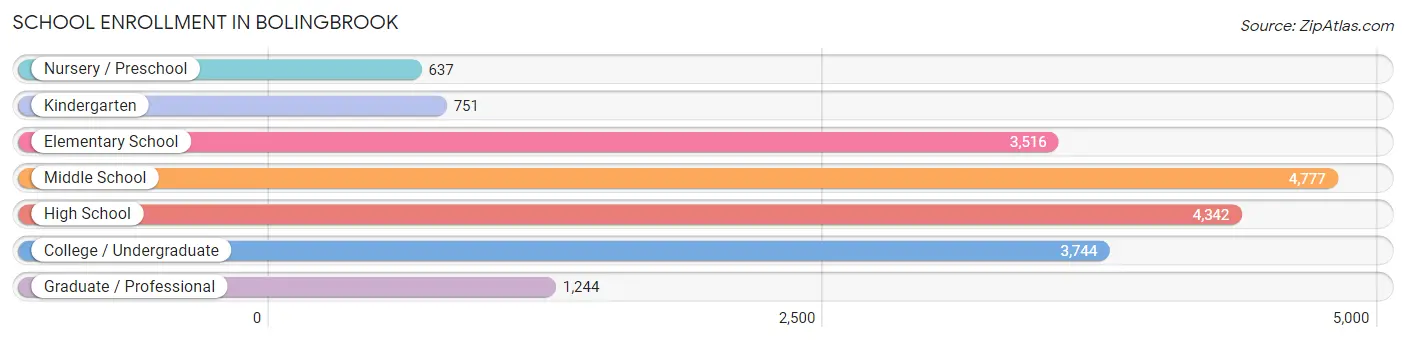
School Enrollment in Bolingbrook
The most common levels of schooling among the 19,011 students in Bolingbrook are middle school (4,777 | 25.1%), high school (4,342 | 22.8%), and college / undergraduate (3,744 | 19.7%).
| School Level | # Students | % Students |
| Nursery / Preschool | 637 | 3.4% |
| Kindergarten | 751 | 4.0% |
| Elementary School | 3,516 | 18.5% |
| Middle School | 4,777 | 25.1% |
| High School | 4,342 | 22.8% |
| College / Undergraduate | 3,744 | 19.7% |
| Graduate / Professional | 1,244 | 6.5% |
| Total | 19,011 | 100.0% |
School Enrollment by Age by Funding Source in Bolingbrook
Out of a total of 19,011 students who are enrolled in schools in Bolingbrook, 3,023 (15.9%) attend a private institution, while the remaining 15,988 (84.1%) are enrolled in public schools. The age group of 3 to 4 year olds has the highest likelihood of being enrolled in private schools, with 253 (62.6% in the age bracket) enrolled. Conversely, the age group of 15 to 17 year olds has the lowest likelihood of being enrolled in a private school, with 2,956 (93.8% in the age bracket) attending a public institution.
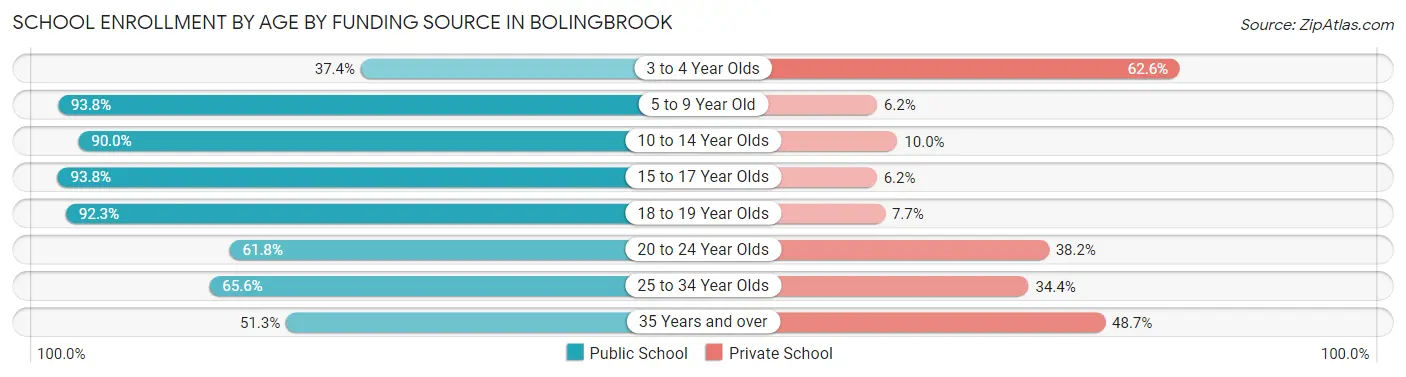
| Age Bracket | Public School | Private School |
| 3 to 4 Year Olds | 151 (37.4%) | 253 (62.6%) |
| 5 to 9 Year Old | 3,661 (93.8%) | 242 (6.2%) |
| 10 to 14 Year Olds | 5,400 (90.0%) | 601 (10.0%) |
| 15 to 17 Year Olds | 2,956 (93.8%) | 194 (6.2%) |
| 18 to 19 Year Olds | 1,416 (92.3%) | 118 (7.7%) |
| 20 to 24 Year Olds | 1,361 (61.8%) | 841 (38.2%) |
| 25 to 34 Year Olds | 537 (65.6%) | 282 (34.4%) |
| 35 Years and over | 512 (51.3%) | 486 (48.7%) |
| Total | 15,988 (84.1%) | 3,023 (15.9%) |
Educational Attainment by Field of Study in Bolingbrook
Business (4,240 | 21.3%), science & technology (2,711 | 13.6%), engineering (2,207 | 11.1%), education (2,014 | 10.1%), and computers & mathematics (1,498 | 7.5%) are the most common fields of study among 19,884 individuals in Bolingbrook who have obtained a bachelor's degree or higher.
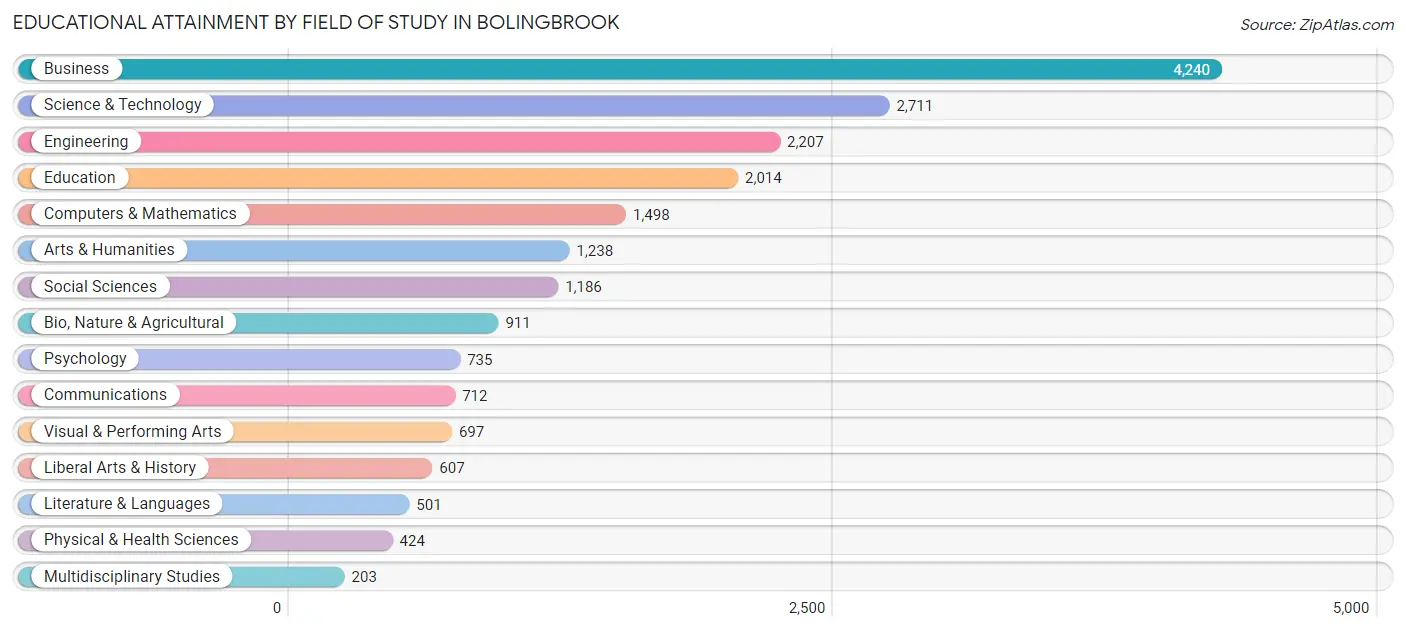
| Field of Study | # Graduates | % Graduates |
| Computers & Mathematics | 1,498 | 7.5% |
| Bio, Nature & Agricultural | 911 | 4.6% |
| Physical & Health Sciences | 424 | 2.1% |
| Psychology | 735 | 3.7% |
| Social Sciences | 1,186 | 6.0% |
| Engineering | 2,207 | 11.1% |
| Multidisciplinary Studies | 203 | 1.0% |
| Science & Technology | 2,711 | 13.6% |
| Business | 4,240 | 21.3% |
| Education | 2,014 | 10.1% |
| Literature & Languages | 501 | 2.5% |
| Liberal Arts & History | 607 | 3.0% |
| Visual & Performing Arts | 697 | 3.5% |
| Communications | 712 | 3.6% |
| Arts & Humanities | 1,238 | 6.2% |
| Total | 19,884 | 100.0% |
Transportation & Commute in Bolingbrook
Vehicle Availability by Sex in Bolingbrook
The most prevalent vehicle ownership categories in Bolingbrook are males with 2 vehicles (8,901, accounting for 43.5%) and females with 2 vehicles (7,873, making up 48.8%).
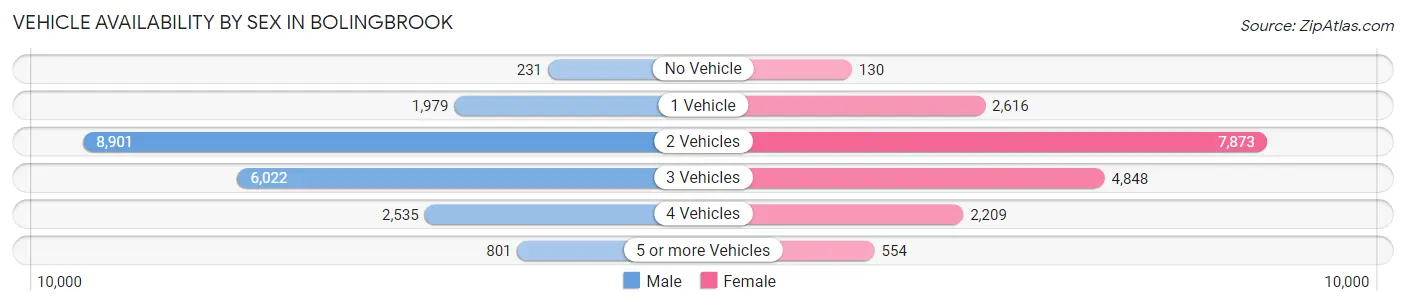
| Vehicles Available | Male | Female |
| No Vehicle | 231 (1.1%) | 130 (0.7%) |
| 1 Vehicle | 1,979 (9.7%) | 2,616 (14.3%) |
| 2 Vehicles | 8,901 (43.5%) | 7,873 (43.2%) |
| 3 Vehicles | 6,022 (29.4%) | 4,848 (26.6%) |
| 4 Vehicles | 2,535 (12.4%) | 2,209 (12.1%) |
| 5 or more Vehicles | 801 (3.9%) | 554 (3.0%) |
| Total | 20,469 (100.0%) | 18,230 (100.0%) |
Commute Time in Bolingbrook
The most frequently occuring commute durations in Bolingbrook are 30 to 34 minutes (4,732 commuters, 14.1%), 15 to 19 minutes (4,488 commuters, 13.4%), and 45 to 59 minutes (4,008 commuters, 11.9%).
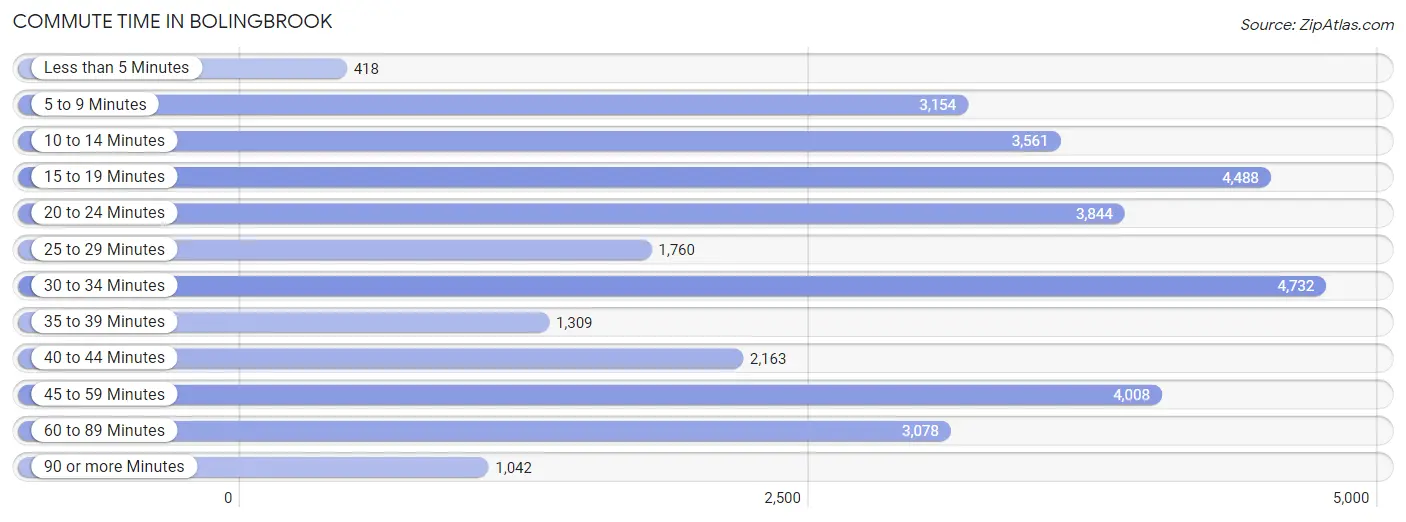
| Commute Time | # Commuters | % Commuters |
| Less than 5 Minutes | 418 | 1.3% |
| 5 to 9 Minutes | 3,154 | 9.4% |
| 10 to 14 Minutes | 3,561 | 10.6% |
| 15 to 19 Minutes | 4,488 | 13.4% |
| 20 to 24 Minutes | 3,844 | 11.5% |
| 25 to 29 Minutes | 1,760 | 5.2% |
| 30 to 34 Minutes | 4,732 | 14.1% |
| 35 to 39 Minutes | 1,309 | 3.9% |
| 40 to 44 Minutes | 2,163 | 6.5% |
| 45 to 59 Minutes | 4,008 | 11.9% |
| 60 to 89 Minutes | 3,078 | 9.2% |
| 90 or more Minutes | 1,042 | 3.1% |
Commute Time by Sex in Bolingbrook
The most common commute times in Bolingbrook are 30 to 34 minutes (2,649 commuters, 14.6%) for males and 30 to 34 minutes (2,083 commuters, 13.5%) for females.
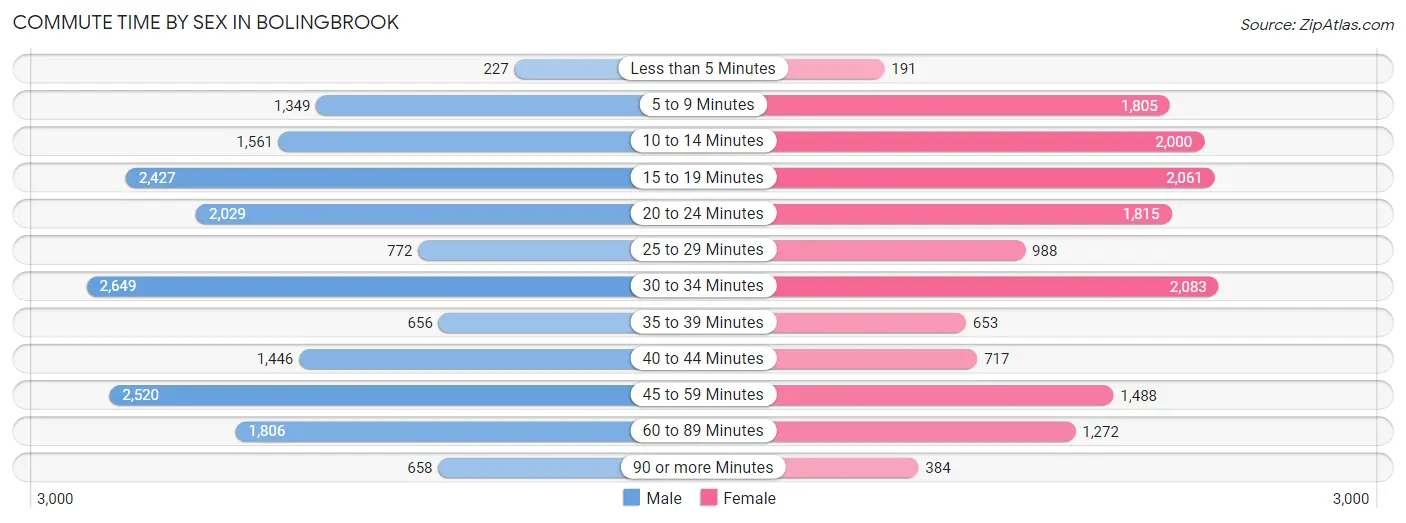
| Commute Time | Male | Female |
| Less than 5 Minutes | 227 (1.3%) | 191 (1.2%) |
| 5 to 9 Minutes | 1,349 (7.4%) | 1,805 (11.7%) |
| 10 to 14 Minutes | 1,561 (8.6%) | 2,000 (12.9%) |
| 15 to 19 Minutes | 2,427 (13.4%) | 2,061 (13.3%) |
| 20 to 24 Minutes | 2,029 (11.2%) | 1,815 (11.7%) |
| 25 to 29 Minutes | 772 (4.3%) | 988 (6.4%) |
| 30 to 34 Minutes | 2,649 (14.6%) | 2,083 (13.5%) |
| 35 to 39 Minutes | 656 (3.6%) | 653 (4.2%) |
| 40 to 44 Minutes | 1,446 (8.0%) | 717 (4.6%) |
| 45 to 59 Minutes | 2,520 (13.9%) | 1,488 (9.6%) |
| 60 to 89 Minutes | 1,806 (10.0%) | 1,272 (8.2%) |
| 90 or more Minutes | 658 (3.6%) | 384 (2.5%) |
Time of Departure to Work by Sex in Bolingbrook
The most frequent times of departure to work in Bolingbrook are 7:00 AM to 7:29 AM (2,387, 13.2%) for males and 7:00 AM to 7:29 AM (2,515, 16.3%) for females.
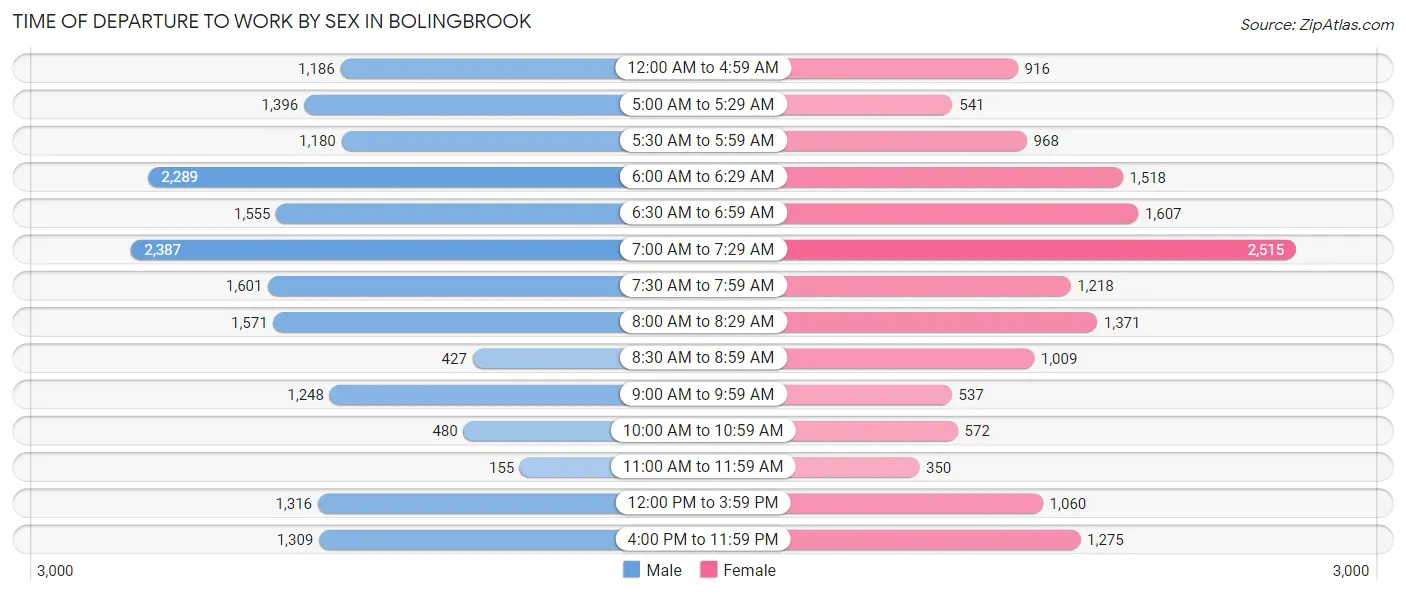
| Time of Departure | Male | Female |
| 12:00 AM to 4:59 AM | 1,186 (6.6%) | 916 (5.9%) |
| 5:00 AM to 5:29 AM | 1,396 (7.7%) | 541 (3.5%) |
| 5:30 AM to 5:59 AM | 1,180 (6.5%) | 968 (6.3%) |
| 6:00 AM to 6:29 AM | 2,289 (12.7%) | 1,518 (9.8%) |
| 6:30 AM to 6:59 AM | 1,555 (8.6%) | 1,607 (10.4%) |
| 7:00 AM to 7:29 AM | 2,387 (13.2%) | 2,515 (16.3%) |
| 7:30 AM to 7:59 AM | 1,601 (8.8%) | 1,218 (7.9%) |
| 8:00 AM to 8:29 AM | 1,571 (8.7%) | 1,371 (8.9%) |
| 8:30 AM to 8:59 AM | 427 (2.4%) | 1,009 (6.5%) |
| 9:00 AM to 9:59 AM | 1,248 (6.9%) | 537 (3.5%) |
| 10:00 AM to 10:59 AM | 480 (2.6%) | 572 (3.7%) |
| 11:00 AM to 11:59 AM | 155 (0.9%) | 350 (2.3%) |
| 12:00 PM to 3:59 PM | 1,316 (7.3%) | 1,060 (6.9%) |
| 4:00 PM to 11:59 PM | 1,309 (7.2%) | 1,275 (8.3%) |
| Total | 18,100 (100.0%) | 15,457 (100.0%) |
Housing Occupancy in Bolingbrook
Occupancy by Ownership in Bolingbrook
Of the total 23,950 dwellings in Bolingbrook, owner-occupied units account for 18,862 (78.8%), while renter-occupied units make up 5,088 (21.2%).
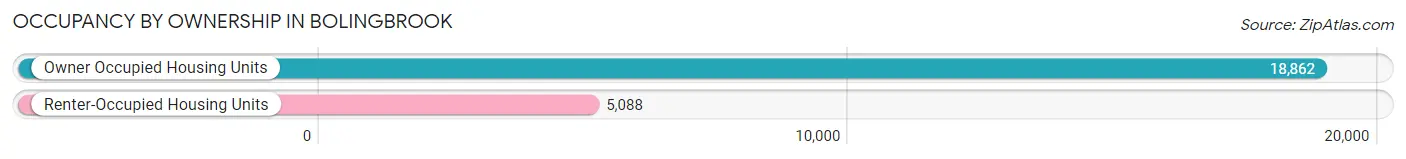
| Occupancy | # Housing Units | % Housing Units |
| Owner Occupied Housing Units | 18,862 | 78.8% |
| Renter-Occupied Housing Units | 5,088 | 21.2% |
| Total Occupied Housing Units | 23,950 | 100.0% |
Occupancy by Household Size in Bolingbrook
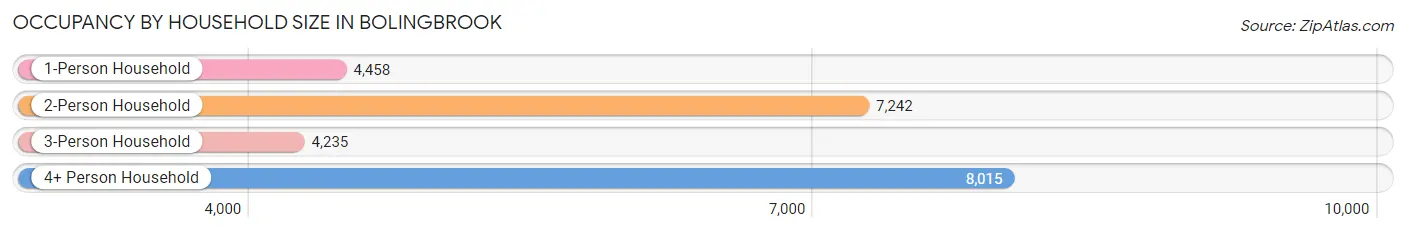
| Household Size | # Housing Units | % Housing Units |
| 1-Person Household | 4,458 | 18.6% |
| 2-Person Household | 7,242 | 30.2% |
| 3-Person Household | 4,235 | 17.7% |
| 4+ Person Household | 8,015 | 33.5% |
| Total Housing Units | 23,950 | 100.0% |
Occupancy by Ownership by Household Size in Bolingbrook
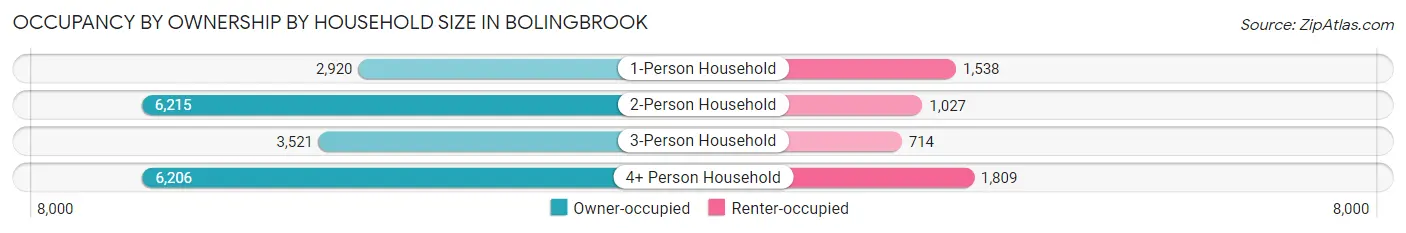
| Household Size | Owner-occupied | Renter-occupied |
| 1-Person Household | 2,920 (65.5%) | 1,538 (34.5%) |
| 2-Person Household | 6,215 (85.8%) | 1,027 (14.2%) |
| 3-Person Household | 3,521 (83.1%) | 714 (16.9%) |
| 4+ Person Household | 6,206 (77.4%) | 1,809 (22.6%) |
| Total Housing Units | 18,862 (78.8%) | 5,088 (21.2%) |
Occupancy by Educational Attainment in Bolingbrook
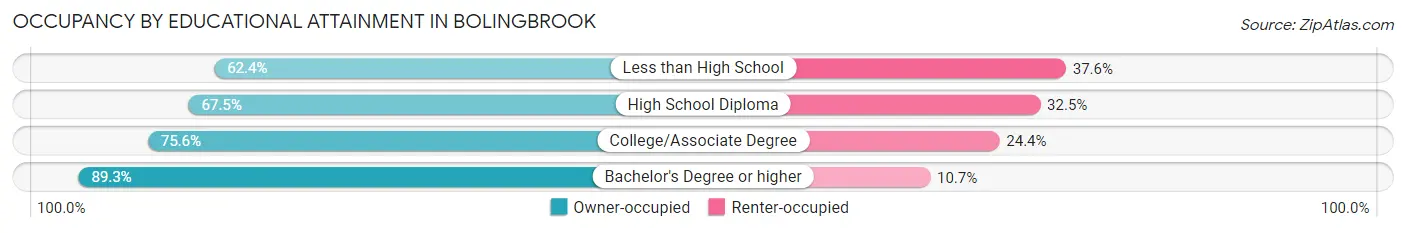
| Household Size | Owner-occupied | Renter-occupied |
| Less than High School | 1,042 (62.4%) | 628 (37.6%) |
| High School Diploma | 3,291 (67.5%) | 1,585 (32.5%) |
| College/Associate Degree | 5,583 (75.6%) | 1,805 (24.4%) |
| Bachelor's Degree or higher | 8,946 (89.3%) | 1,070 (10.7%) |
Occupancy by Age of Householder in Bolingbrook
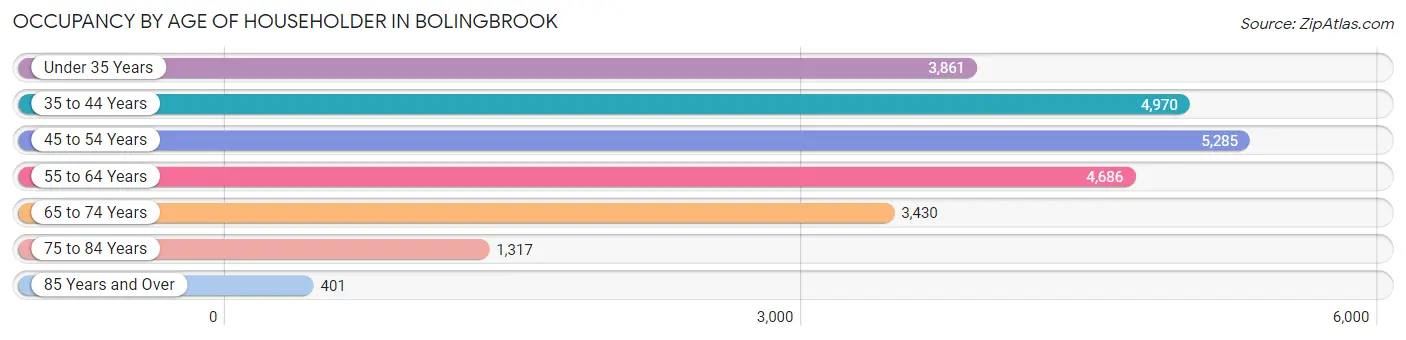
| Age Bracket | # Households | % Households |
| Under 35 Years | 3,861 | 16.1% |
| 35 to 44 Years | 4,970 | 20.7% |
| 45 to 54 Years | 5,285 | 22.1% |
| 55 to 64 Years | 4,686 | 19.6% |
| 65 to 74 Years | 3,430 | 14.3% |
| 75 to 84 Years | 1,317 | 5.5% |
| 85 Years and Over | 401 | 1.7% |
| Total | 23,950 | 100.0% |
Housing Finances in Bolingbrook
Median Income by Occupancy in Bolingbrook
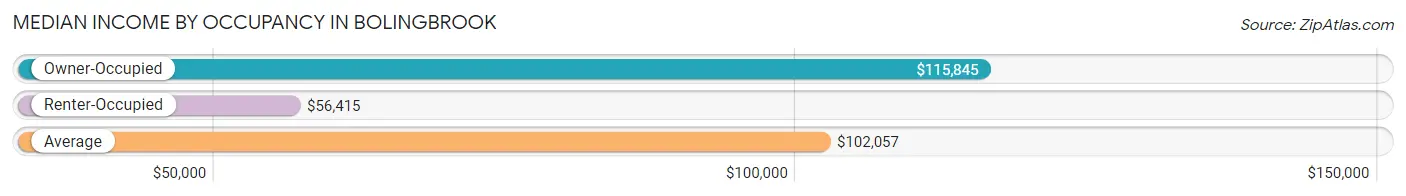
| Occupancy Type | # Households | Median Income |
| Owner-Occupied | 18,862 (78.8%) | $115,845 |
| Renter-Occupied | 5,088 (21.2%) | $56,415 |
| Average | 23,950 (100.0%) | $102,057 |
Occupancy by Householder Income Bracket in Bolingbrook
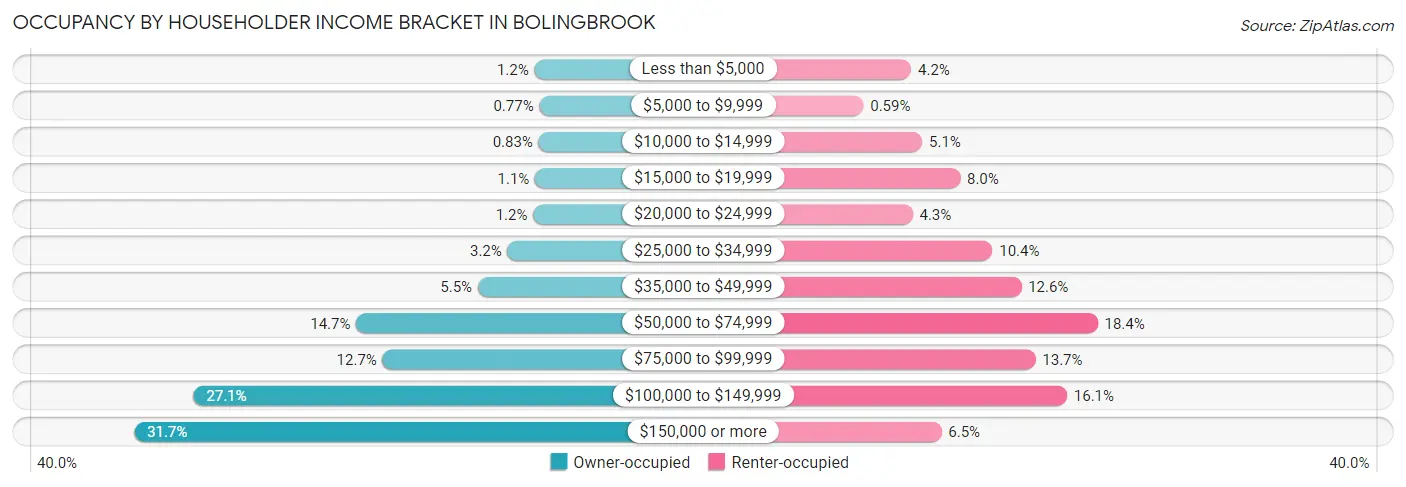
| Income Bracket | Owner-occupied | Renter-occupied |
| Less than $5,000 | 216 (1.1%) | 215 (4.2%) |
| $5,000 to $9,999 | 145 (0.8%) | 30 (0.6%) |
| $10,000 to $14,999 | 157 (0.8%) | 258 (5.1%) |
| $15,000 to $19,999 | 208 (1.1%) | 405 (8.0%) |
| $20,000 to $24,999 | 234 (1.2%) | 221 (4.3%) |
| $25,000 to $34,999 | 603 (3.2%) | 530 (10.4%) |
| $35,000 to $49,999 | 1,030 (5.5%) | 642 (12.6%) |
| $50,000 to $74,999 | 2,778 (14.7%) | 938 (18.4%) |
| $75,000 to $99,999 | 2,399 (12.7%) | 697 (13.7%) |
| $100,000 to $149,999 | 5,120 (27.1%) | 819 (16.1%) |
| $150,000 or more | 5,972 (31.7%) | 333 (6.5%) |
| Total | 18,862 (100.0%) | 5,088 (100.0%) |
Monthly Housing Cost Tiers in Bolingbrook
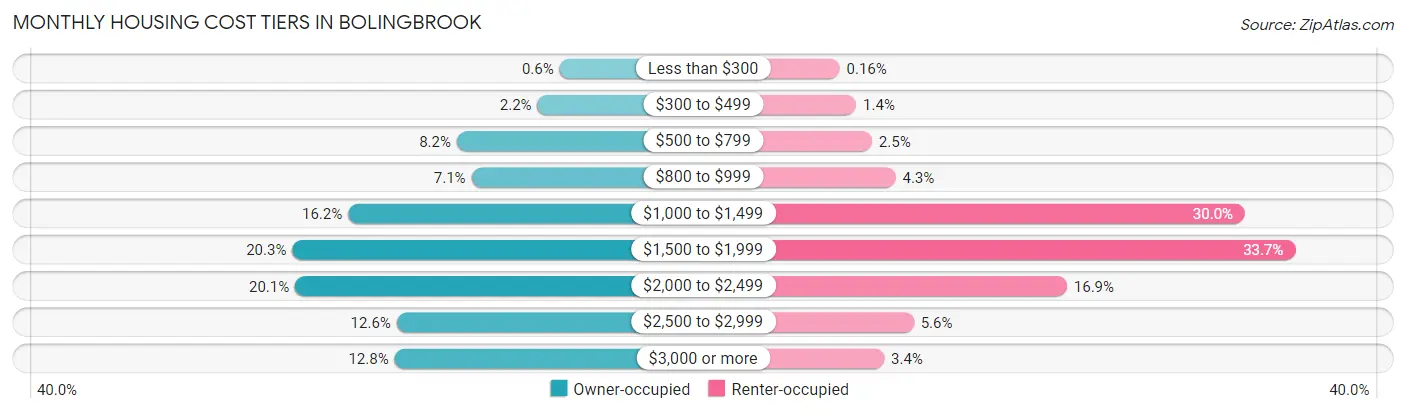
| Monthly Cost | Owner-occupied | Renter-occupied |
| Less than $300 | 113 (0.6%) | 8 (0.2%) |
| $300 to $499 | 420 (2.2%) | 70 (1.4%) |
| $500 to $799 | 1,541 (8.2%) | 129 (2.5%) |
| $800 to $999 | 1,338 (7.1%) | 218 (4.3%) |
| $1,000 to $1,499 | 3,052 (16.2%) | 1,527 (30.0%) |
| $1,500 to $1,999 | 3,827 (20.3%) | 1,715 (33.7%) |
| $2,000 to $2,499 | 3,787 (20.1%) | 860 (16.9%) |
| $2,500 to $2,999 | 2,377 (12.6%) | 286 (5.6%) |
| $3,000 or more | 2,407 (12.8%) | 175 (3.4%) |
| Total | 18,862 (100.0%) | 5,088 (100.0%) |
Physical Housing Characteristics in Bolingbrook
Housing Structures in Bolingbrook
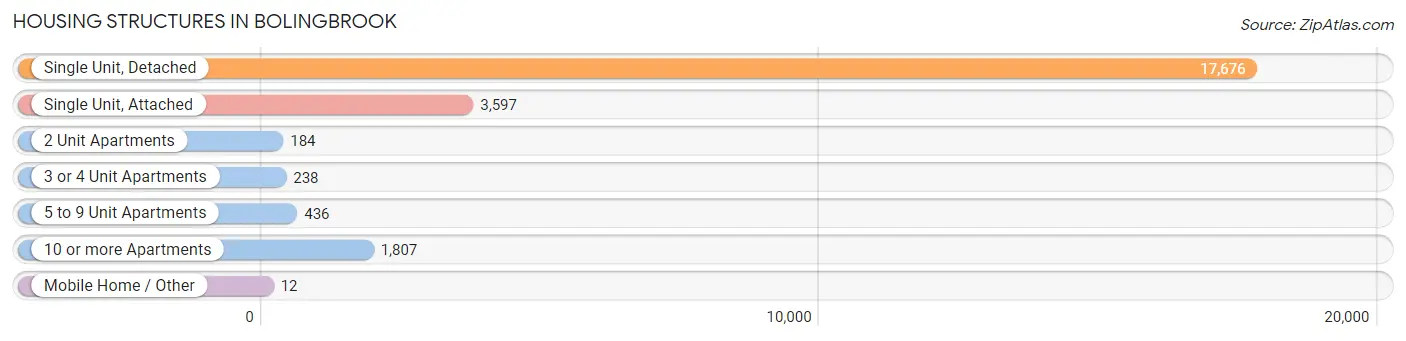
| Structure Type | # Housing Units | % Housing Units |
| Single Unit, Detached | 17,676 | 73.8% |
| Single Unit, Attached | 3,597 | 15.0% |
| 2 Unit Apartments | 184 | 0.8% |
| 3 or 4 Unit Apartments | 238 | 1.0% |
| 5 to 9 Unit Apartments | 436 | 1.8% |
| 10 or more Apartments | 1,807 | 7.5% |
| Mobile Home / Other | 12 | 0.1% |
| Total | 23,950 | 100.0% |
Housing Structures by Occupancy in Bolingbrook
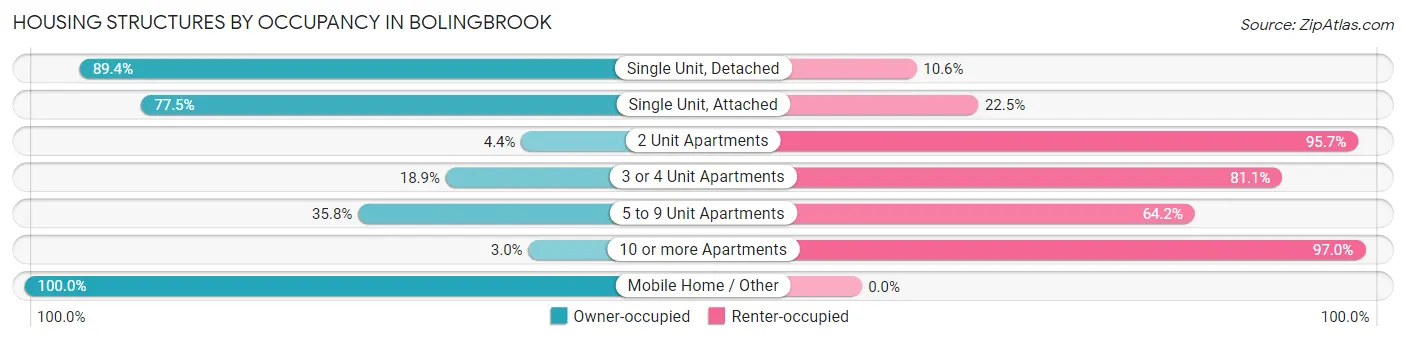
| Structure Type | Owner-occupied | Renter-occupied |
| Single Unit, Detached | 15,799 (89.4%) | 1,877 (10.6%) |
| Single Unit, Attached | 2,788 (77.5%) | 809 (22.5%) |
| 2 Unit Apartments | 8 (4.3%) | 176 (95.7%) |
| 3 or 4 Unit Apartments | 45 (18.9%) | 193 (81.1%) |
| 5 to 9 Unit Apartments | 156 (35.8%) | 280 (64.2%) |
| 10 or more Apartments | 54 (3.0%) | 1,753 (97.0%) |
| Mobile Home / Other | 12 (100.0%) | 0 (0.0%) |
| Total | 18,862 (78.8%) | 5,088 (21.2%) |
Housing Structures by Number of Rooms in Bolingbrook
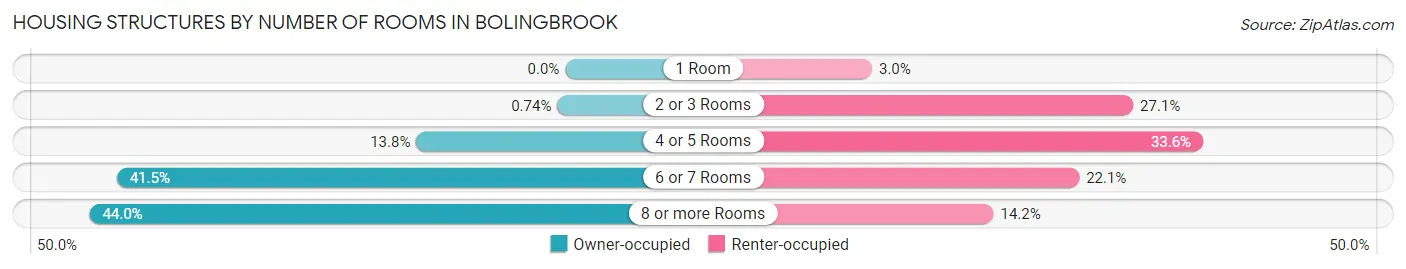
| Number of Rooms | Owner-occupied | Renter-occupied |
| 1 Room | 0 (0.0%) | 151 (3.0%) |
| 2 or 3 Rooms | 139 (0.7%) | 1,380 (27.1%) |
| 4 or 5 Rooms | 2,599 (13.8%) | 1,708 (33.6%) |
| 6 or 7 Rooms | 7,824 (41.5%) | 1,126 (22.1%) |
| 8 or more Rooms | 8,300 (44.0%) | 723 (14.2%) |
| Total | 18,862 (100.0%) | 5,088 (100.0%) |
Housing Structure by Heating Type in Bolingbrook
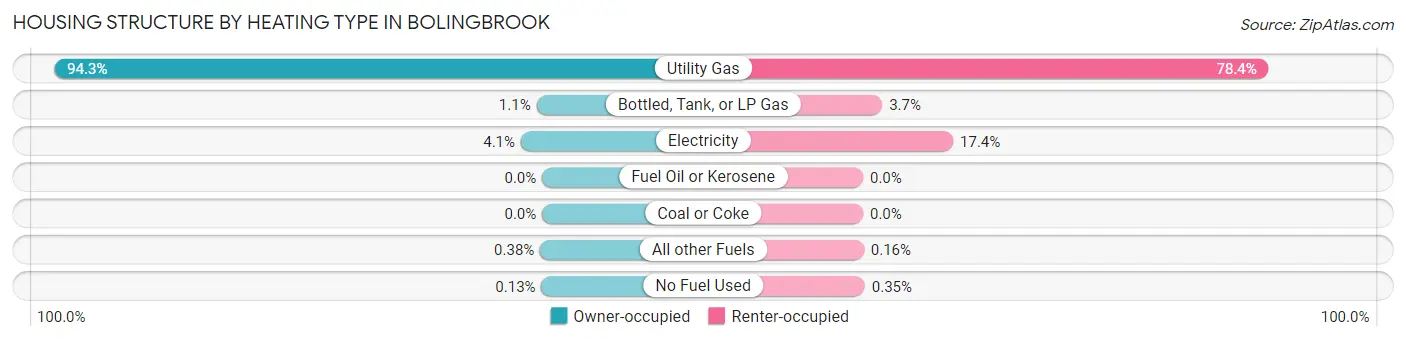
| Heating Type | Owner-occupied | Renter-occupied |
| Utility Gas | 17,785 (94.3%) | 3,987 (78.4%) |
| Bottled, Tank, or LP Gas | 204 (1.1%) | 189 (3.7%) |
| Electricity | 776 (4.1%) | 886 (17.4%) |
| Fuel Oil or Kerosene | 0 (0.0%) | 0 (0.0%) |
| Coal or Coke | 0 (0.0%) | 0 (0.0%) |
| All other Fuels | 72 (0.4%) | 8 (0.2%) |
| No Fuel Used | 25 (0.1%) | 18 (0.4%) |
| Total | 18,862 (100.0%) | 5,088 (100.0%) |
Household Vehicle Usage in Bolingbrook
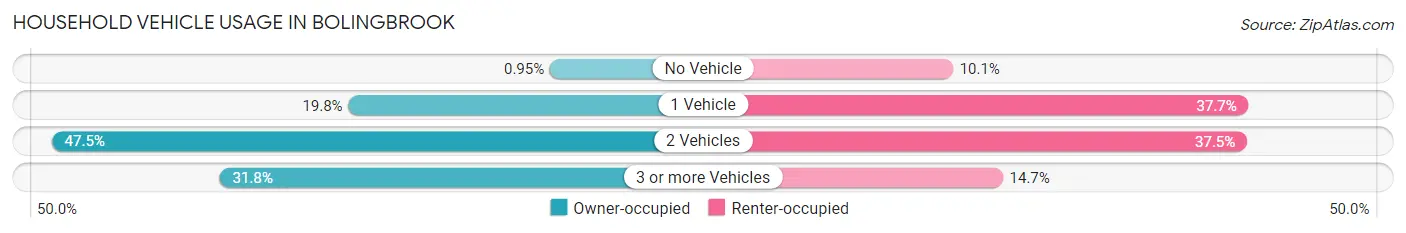
| Vehicles per Household | Owner-occupied | Renter-occupied |
| No Vehicle | 180 (0.9%) | 512 (10.1%) |
| 1 Vehicle | 3,729 (19.8%) | 1,917 (37.7%) |
| 2 Vehicles | 8,954 (47.5%) | 1,910 (37.5%) |
| 3 or more Vehicles | 5,999 (31.8%) | 749 (14.7%) |
| Total | 18,862 (100.0%) | 5,088 (100.0%) |
Real Estate & Mortgages in Bolingbrook
Real Estate and Mortgage Overview in Bolingbrook
| Characteristic | Without Mortgage | With Mortgage |
| Housing Units | 5,135 | 13,727 |
| Median Property Value | $263,100 | $281,700 |
| Median Household Income | $95,777 | $4,639 |
| Monthly Housing Costs | $910 | $2,363 |
| Real Estate Taxes | $6,682 | $74 |
Property Value by Mortgage Status in Bolingbrook
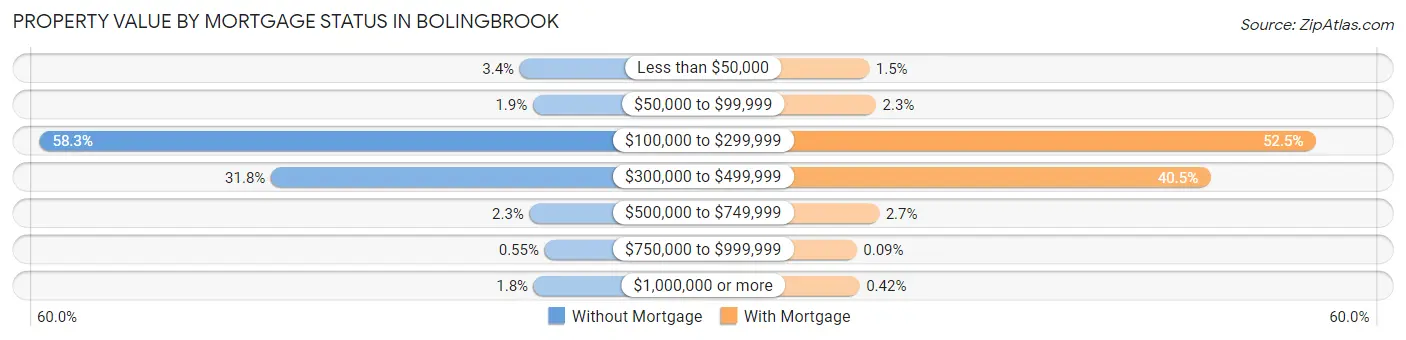
| Property Value | Without Mortgage | With Mortgage |
| Less than $50,000 | 174 (3.4%) | 209 (1.5%) |
| $50,000 to $99,999 | 97 (1.9%) | 314 (2.3%) |
| $100,000 to $299,999 | 2,993 (58.3%) | 7,211 (52.5%) |
| $300,000 to $499,999 | 1,634 (31.8%) | 5,559 (40.5%) |
| $500,000 to $749,999 | 117 (2.3%) | 364 (2.6%) |
| $750,000 to $999,999 | 28 (0.5%) | 12 (0.1%) |
| $1,000,000 or more | 92 (1.8%) | 58 (0.4%) |
| Total | 5,135 (100.0%) | 13,727 (100.0%) |
Household Income by Mortgage Status in Bolingbrook
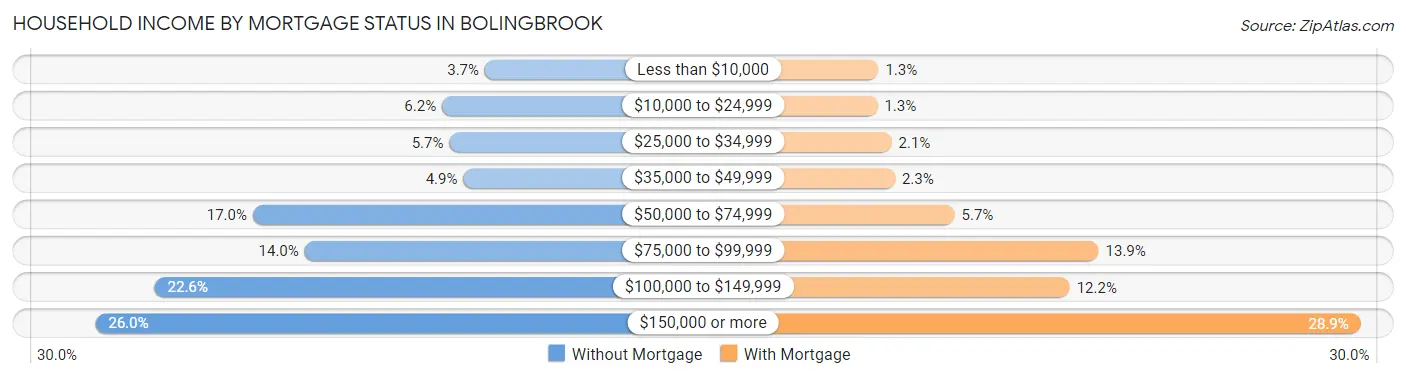
| Household Income | Without Mortgage | With Mortgage |
| Less than $10,000 | 190 (3.7%) | 180 (1.3%) |
| $10,000 to $24,999 | 316 (6.1%) | 171 (1.3%) |
| $25,000 to $34,999 | 294 (5.7%) | 283 (2.1%) |
| $35,000 to $49,999 | 253 (4.9%) | 309 (2.2%) |
| $50,000 to $74,999 | 871 (17.0%) | 777 (5.7%) |
| $75,000 to $99,999 | 719 (14.0%) | 1,907 (13.9%) |
| $100,000 to $149,999 | 1,159 (22.6%) | 1,680 (12.2%) |
| $150,000 or more | 1,333 (26.0%) | 3,961 (28.9%) |
| Total | 5,135 (100.0%) | 13,727 (100.0%) |
Property Value to Household Income Ratio in Bolingbrook
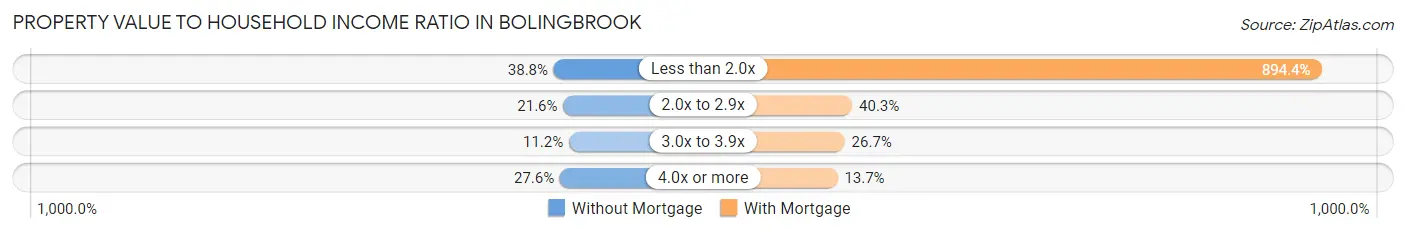
| Value-to-Income Ratio | Without Mortgage | With Mortgage |
| Less than 2.0x | 1,993 (38.8%) | 122,767 (894.4%) |
| 2.0x to 2.9x | 1,108 (21.6%) | 5,532 (40.3%) |
| 3.0x to 3.9x | 577 (11.2%) | 3,670 (26.7%) |
| 4.0x or more | 1,419 (27.6%) | 1,878 (13.7%) |
| Total | 5,135 (100.0%) | 13,727 (100.0%) |
Real Estate Taxes by Mortgage Status in Bolingbrook
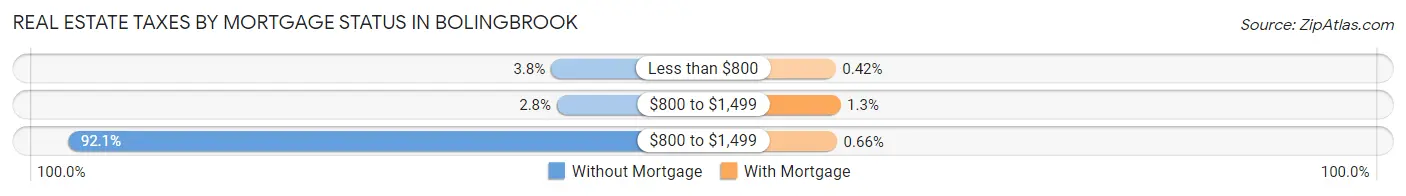
| Property Taxes | Without Mortgage | With Mortgage |
| Less than $800 | 197 (3.8%) | 58 (0.4%) |
| $800 to $1,499 | 143 (2.8%) | 179 (1.3%) |
| $800 to $1,499 | 4,730 (92.1%) | 90 (0.7%) |
| Total | 5,135 (100.0%) | 13,727 (100.0%) |
Health & Disability in Bolingbrook
Health Insurance Coverage by Age in Bolingbrook
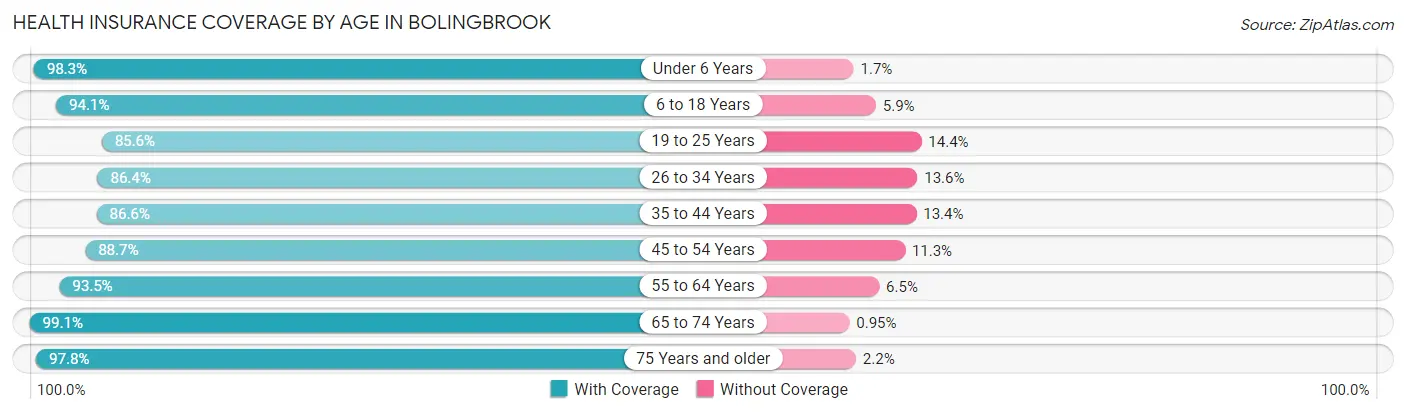
| Age Bracket | With Coverage | Without Coverage |
| Under 6 Years | 4,557 (98.3%) | 80 (1.7%) |
| 6 to 18 Years | 13,105 (94.1%) | 818 (5.9%) |
| 19 to 25 Years | 6,893 (85.6%) | 1,158 (14.4%) |
| 26 to 34 Years | 6,685 (86.4%) | 1,053 (13.6%) |
| 35 to 44 Years | 9,059 (86.6%) | 1,405 (13.4%) |
| 45 to 54 Years | 9,427 (88.7%) | 1,202 (11.3%) |
| 55 to 64 Years | 8,557 (93.5%) | 595 (6.5%) |
| 65 to 74 Years | 5,941 (99.1%) | 57 (0.9%) |
| 75 Years and older | 2,715 (97.8%) | 60 (2.2%) |
| Total | 66,939 (91.2%) | 6,428 (8.8%) |
Health Insurance Coverage by Citizenship Status in Bolingbrook
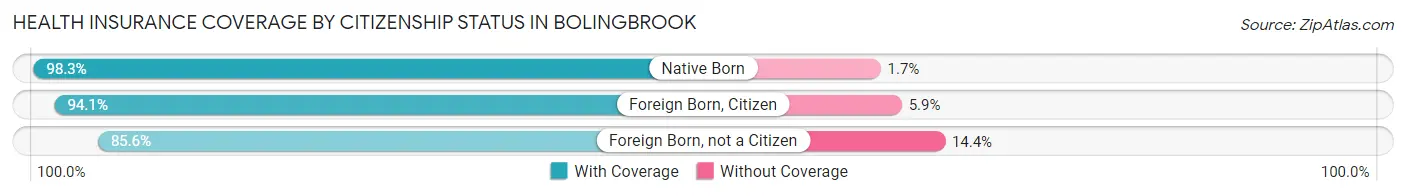
| Citizenship Status | With Coverage | Without Coverage |
| Native Born | 4,557 (98.3%) | 80 (1.7%) |
| Foreign Born, Citizen | 13,105 (94.1%) | 818 (5.9%) |
| Foreign Born, not a Citizen | 6,893 (85.6%) | 1,158 (14.4%) |
Health Insurance Coverage by Household Income in Bolingbrook
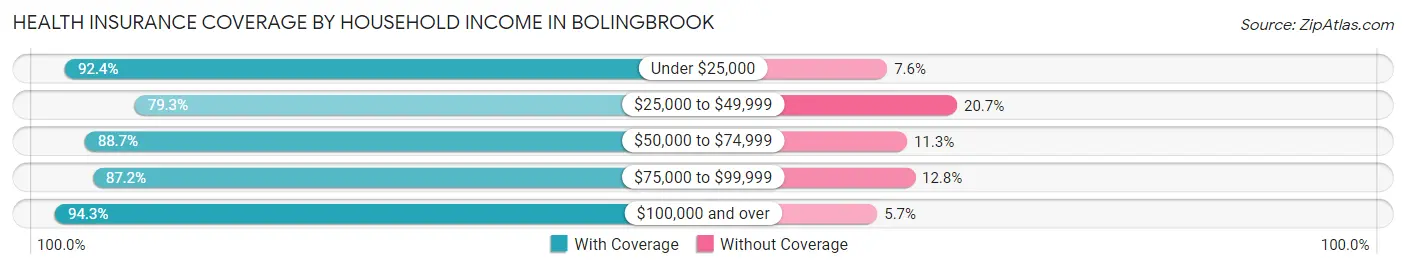
| Household Income | With Coverage | Without Coverage |
| Under $25,000 | 4,655 (92.4%) | 381 (7.6%) |
| $25,000 to $49,999 | 5,274 (79.3%) | 1,373 (20.7%) |
| $50,000 to $74,999 | 8,459 (88.7%) | 1,076 (11.3%) |
| $75,000 to $99,999 | 7,664 (87.2%) | 1,123 (12.8%) |
| $100,000 and over | 40,887 (94.3%) | 2,475 (5.7%) |
Public vs Private Health Insurance Coverage by Age in Bolingbrook
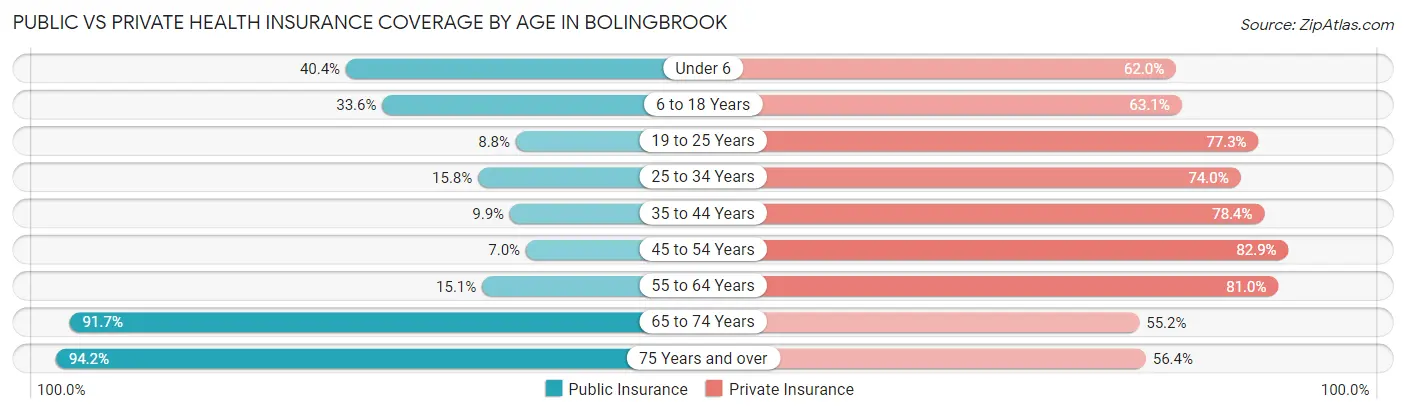
| Age Bracket | Public Insurance | Private Insurance |
| Under 6 | 1,871 (40.4%) | 2,877 (62.0%) |
| 6 to 18 Years | 4,678 (33.6%) | 8,783 (63.1%) |
| 19 to 25 Years | 710 (8.8%) | 6,226 (77.3%) |
| 25 to 34 Years | 1,224 (15.8%) | 5,726 (74.0%) |
| 35 to 44 Years | 1,037 (9.9%) | 8,207 (78.4%) |
| 45 to 54 Years | 739 (7.0%) | 8,811 (82.9%) |
| 55 to 64 Years | 1,380 (15.1%) | 7,415 (81.0%) |
| 65 to 74 Years | 5,498 (91.7%) | 3,312 (55.2%) |
| 75 Years and over | 2,614 (94.2%) | 1,566 (56.4%) |
| Total | 19,751 (26.9%) | 52,923 (72.1%) |
Disability Status by Sex by Age in Bolingbrook
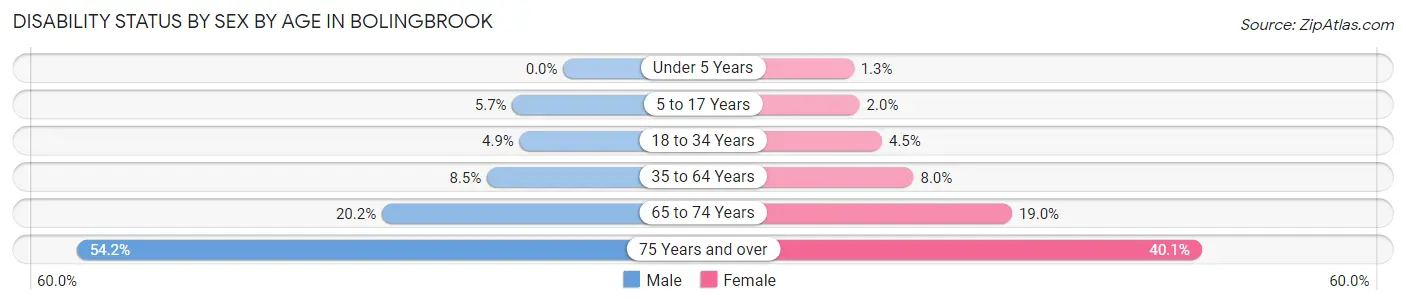
| Age Bracket | Male | Female |
| Under 5 Years | 0 (0.0%) | 28 (1.3%) |
| 5 to 17 Years | 383 (5.7%) | 139 (2.0%) |
| 18 to 34 Years | 436 (4.9%) | 357 (4.5%) |
| 35 to 64 Years | 1,251 (8.5%) | 1,239 (8.0%) |
| 65 to 74 Years | 556 (20.2%) | 615 (19.0%) |
| 75 Years and over | 795 (54.2%) | 524 (40.1%) |
Disability Class by Sex by Age in Bolingbrook
Disability Class: Hearing Difficulty
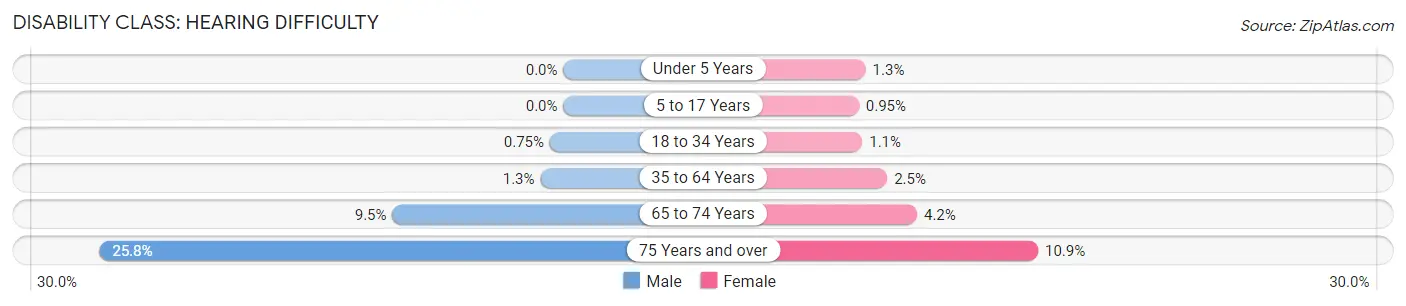
| Age Bracket | Male | Female |
| Under 5 Years | 0 (0.0%) | 28 (1.3%) |
| 5 to 17 Years | 0 (0.0%) | 66 (0.9%) |
| 18 to 34 Years | 67 (0.7%) | 91 (1.1%) |
| 35 to 64 Years | 188 (1.3%) | 392 (2.5%) |
| 65 to 74 Years | 262 (9.5%) | 136 (4.2%) |
| 75 Years and over | 379 (25.8%) | 143 (10.9%) |
Disability Class: Vision Difficulty
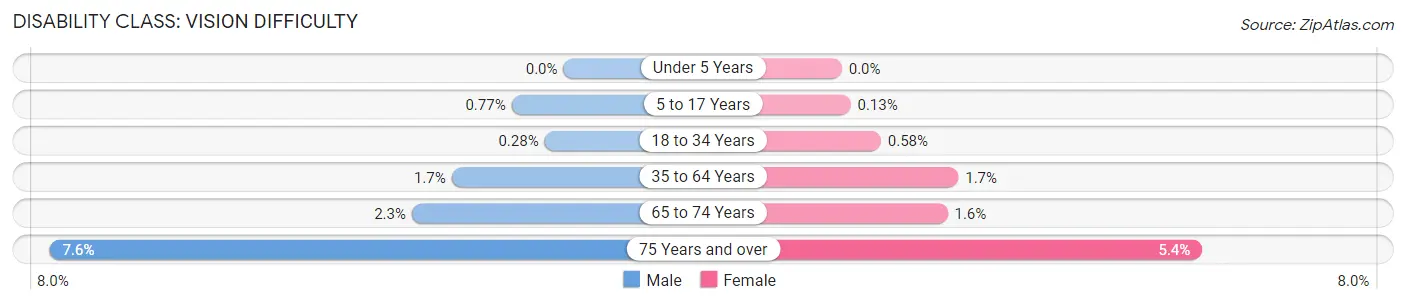
| Age Bracket | Male | Female |
| Under 5 Years | 0 (0.0%) | 0 (0.0%) |
| 5 to 17 Years | 52 (0.8%) | 9 (0.1%) |
| 18 to 34 Years | 25 (0.3%) | 46 (0.6%) |
| 35 to 64 Years | 245 (1.7%) | 269 (1.7%) |
| 65 to 74 Years | 62 (2.2%) | 51 (1.6%) |
| 75 Years and over | 112 (7.6%) | 70 (5.3%) |
Disability Class: Cognitive Difficulty
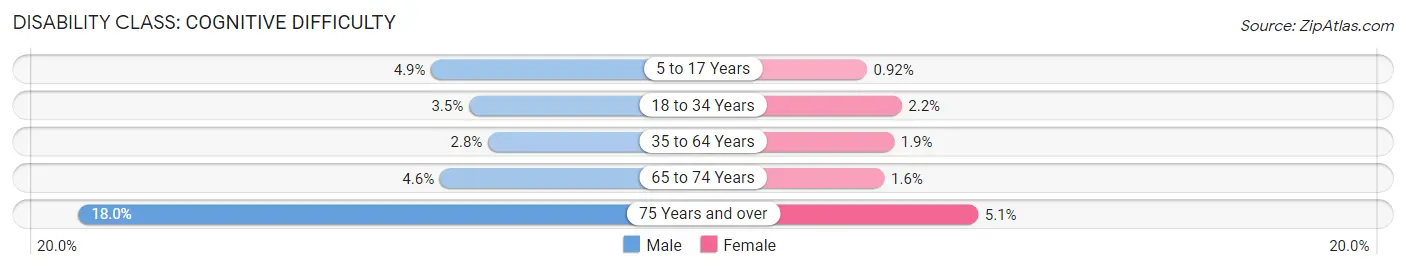
| Age Bracket | Male | Female |
| 5 to 17 Years | 331 (4.9%) | 64 (0.9%) |
| 18 to 34 Years | 314 (3.5%) | 176 (2.2%) |
| 35 to 64 Years | 411 (2.8%) | 300 (1.9%) |
| 65 to 74 Years | 126 (4.6%) | 51 (1.6%) |
| 75 Years and over | 264 (18.0%) | 66 (5.1%) |
Disability Class: Ambulatory Difficulty
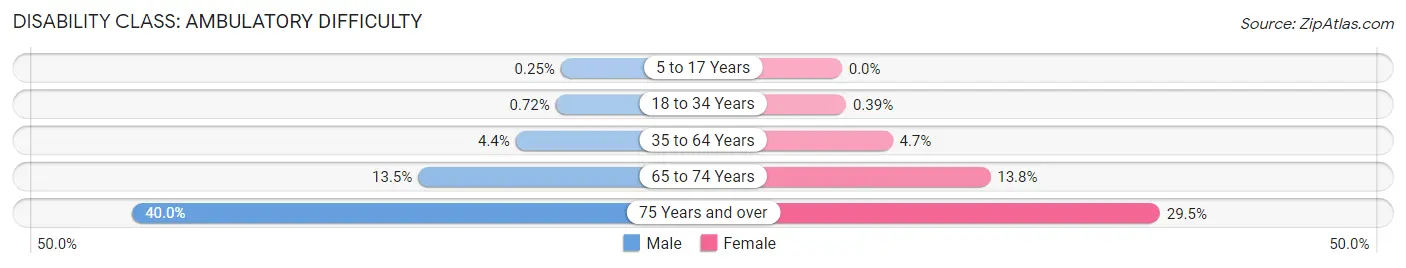
| Age Bracket | Male | Female |
| 5 to 17 Years | 17 (0.3%) | 0 (0.0%) |
| 18 to 34 Years | 65 (0.7%) | 31 (0.4%) |
| 35 to 64 Years | 652 (4.4%) | 731 (4.7%) |
| 65 to 74 Years | 371 (13.5%) | 447 (13.8%) |
| 75 Years and over | 587 (40.0%) | 386 (29.5%) |
Disability Class: Self-Care Difficulty
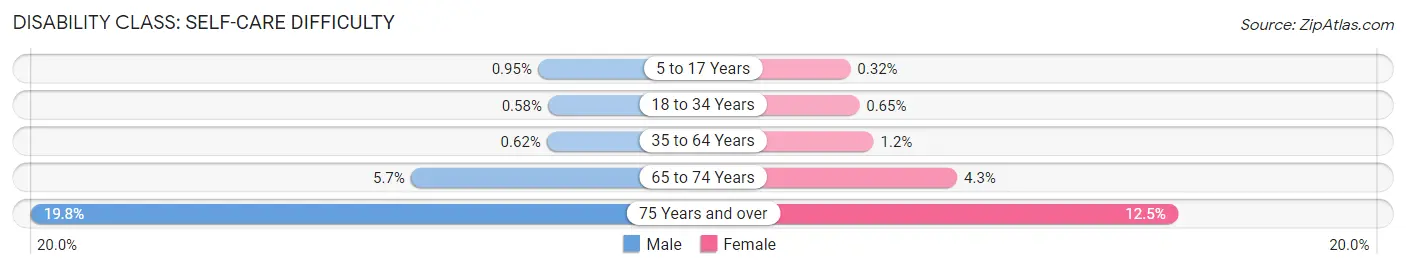
| Age Bracket | Male | Female |
| 5 to 17 Years | 64 (0.9%) | 22 (0.3%) |
| 18 to 34 Years | 52 (0.6%) | 52 (0.6%) |
| 35 to 64 Years | 91 (0.6%) | 183 (1.2%) |
| 65 to 74 Years | 156 (5.7%) | 139 (4.3%) |
| 75 Years and over | 290 (19.8%) | 163 (12.5%) |
Technology Access in Bolingbrook
Computing Device Access in Bolingbrook
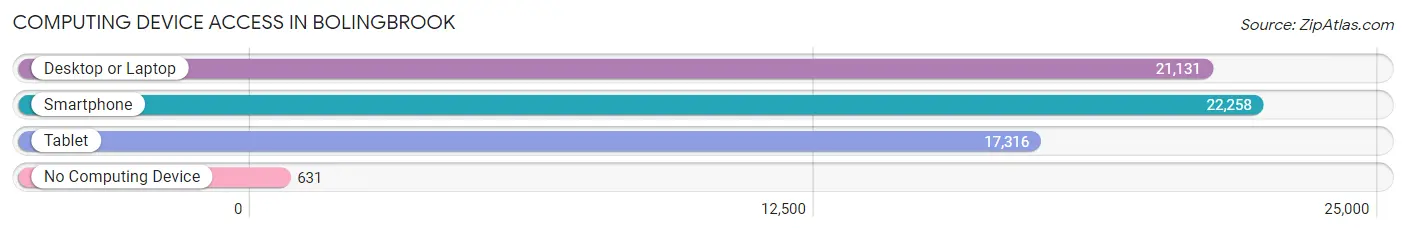
| Device Type | # Households | % Households |
| Desktop or Laptop | 21,131 | 88.2% |
| Smartphone | 22,258 | 92.9% |
| Tablet | 17,316 | 72.3% |
| No Computing Device | 631 | 2.6% |
| Total | 23,950 | 100.0% |
Internet Access in Bolingbrook
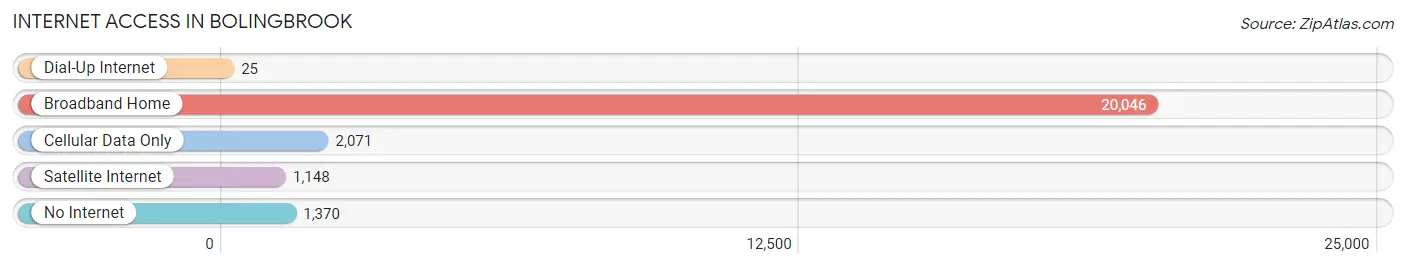
| Internet Type | # Households | % Households |
| Dial-Up Internet | 25 | 0.1% |
| Broadband Home | 20,046 | 83.7% |
| Cellular Data Only | 2,071 | 8.6% |
| Satellite Internet | 1,148 | 4.8% |
| No Internet | 1,370 | 5.7% |
| Total | 23,950 | 100.0% |
Bolingbrook Summary
Bolingbrook is a village located in Will and DuPage counties in the state of Illinois. It is a suburb of Chicago, located approximately 28 miles southwest of the city. The village is located in the Chicago metropolitan area and is part of the larger Naperville-Aurora-Elgin Combined Statistical Area. As of the 2010 census, the population of Bolingbrook was 73,366, making it the 13th largest community in Illinois.
History
The area that is now Bolingbrook was first settled in the 1830s by German and Irish immigrants. The village was officially incorporated in 1965, and was named after the Boling family, who were early settlers in the area. The village was initially developed as a planned community, with the first homes being built in the late 1960s.
Geography
Bolingbrook is located at 41°41'N 88°7'W (41.6833, -88.1167). According to the 2010 census, the village has a total area of 24.2 square miles, of which 24.1 square miles is land and 0.1 square miles is water.
The village is located in the Chicago metropolitan area and is part of the larger Naperville-Aurora-Elgin Combined Statistical Area. It is bordered by the villages of Romeoville to the north, Plainfield to the east, and Woodridge to the south.
Economy
Bolingbrook is home to a number of large employers, including the Clow International Airport, the Bolingbrook Golf Club, and the Bolingbrook Park District. The village is also home to a number of corporate headquarters, including the headquarters of the Ace Hardware Corporation, the Clow Valve Company, and the Bolingbrook-based office of the United Parcel Service.
Demographics
As of the 2010 census, there were 73,366 people, 25,945 households, and 20,845 families residing in the village. The population density was 3,039.2 people per square mile. The racial makeup of the village was 68.2% White, 15.3% African American, 0.3% Native American, 8.2% Asian, 0.1% Pacific Islander, 4.7% from other races, and 3.2% from two or more races. Hispanic or Latino of any race were 16.7% of the population.
The median income for a household in the village was $77,945, and the median income for a family was $87,945. The per capita income for the village was $31,945. About 4.2% of families and 5.3% of the population were below the poverty line, including 6.3% of those under age 18 and 4.2% of those age 65 or over.
Common Questions
What is Per Capita Income in Bolingbrook?
Per Capita income in Bolingbrook is $40,369.
What is the Median Family Income in Bolingbrook?
Median Family Income in Bolingbrook is $115,249.
What is the Median Household income in Bolingbrook?
Median Household Income in Bolingbrook is $102,057.
What is Income or Wage Gap in Bolingbrook?
Income or Wage Gap in Bolingbrook is 26.6%.
Women in Bolingbrook earn 73.4 cents for every dollar earned by a man.
What is Family Income Deficit in Bolingbrook?
Family Income Deficit in Bolingbrook is $14,290.
Families that are below poverty line in Bolingbrook earn $14,290 less on average than the poverty threshold level.
What is Inequality or Gini Index in Bolingbrook?
Inequality or Gini Index in Bolingbrook is 0.39.
What is the Total Population of Bolingbrook?
Total Population of Bolingbrook is 73,755.
What is the Total Male Population of Bolingbrook?
Total Male Population of Bolingbrook is 36,379.
What is the Total Female Population of Bolingbrook?
Total Female Population of Bolingbrook is 37,376.
What is the Ratio of Males per 100 Females in Bolingbrook?
There are 97.33 Males per 100 Females in Bolingbrook.
What is the Ratio of Females per 100 Males in Bolingbrook?
There are 102.74 Females per 100 Males in Bolingbrook.
What is the Median Population Age in Bolingbrook?
Median Population Age in Bolingbrook is 37.9 Years.
What is the Average Family Size in Bolingbrook
Average Family Size in Bolingbrook is 3.5 People.
What is the Average Household Size in Bolingbrook
Average Household Size in Bolingbrook is 3.1 People.
How Large is the Labor Force in Bolingbrook?
There are 41,779 People in the Labor Forcein in Bolingbrook.
What is the Percentage of People in the Labor Force in Bolingbrook?
71.5% of People are in the Labor Force in Bolingbrook.
What is the Unemployment Rate in Bolingbrook?
Unemployment Rate in Bolingbrook is 5.2%.