West Chicago, IL Map & Demographics
West Chicago Map
West Chicago Overview
$36,092
PER CAPITA INCOME
$106,534
AVG FAMILY INCOME
$92,335
AVG HOUSEHOLD INCOME
24.2%
WAGE / INCOME GAP [ % ]
75.8¢/ $1
WAGE / INCOME GAP [ $ ]
0.43
INEQUALITY / GINI INDEX
25,632
TOTAL POPULATION
12,970
MALE POPULATION
12,662
FEMALE POPULATION
102.43
MALES / 100 FEMALES
97.63
FEMALES / 100 MALES
35.8
MEDIAN AGE
3.8
AVG FAMILY SIZE
3.4
AVG HOUSEHOLD SIZE
14,641
LABOR FORCE [ PEOPLE ]
72.5%
PERCENT IN LABOR FORCE
10.4%
UNEMPLOYMENT RATE
West Chicago Zip Codes
Income in West Chicago
Income Overview in West Chicago
Per Capita Income in West Chicago is $36,092, while median incomes of families and households are $106,534 and $92,335 respectively.
| Characteristic | Number | Measure |
| Per Capita Income | 25,632 | $36,092 |
| Median Family Income | 5,824 | $106,534 |
| Mean Family Income | 5,824 | $132,322 |
| Median Household Income | 7,380 | $92,335 |
| Mean Household Income | 7,380 | $121,985 |
| Income Deficit | 5,824 | $0 |
| Wage / Income Gap (%) | 25,632 | 24.21% |
| Wage / Income Gap ($) | 25,632 | 75.79¢ per $1 |
| Gini / Inequality Index | 25,632 | 0.43 |
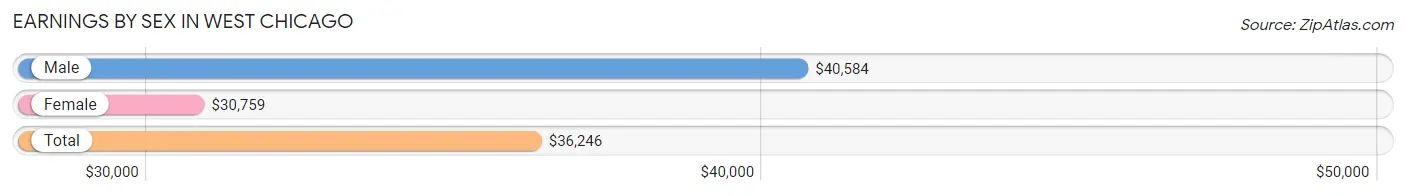
Earnings by Sex in West Chicago
Average Earnings in West Chicago are $36,246, $40,584 for men and $30,759 for women, a difference of 24.2%.
| Sex | Number | Average Earnings |
| Male | 8,125 (53.9%) | $40,584 |
| Female | 6,941 (46.1%) | $30,759 |
| Total | 15,066 (100.0%) | $36,246 |
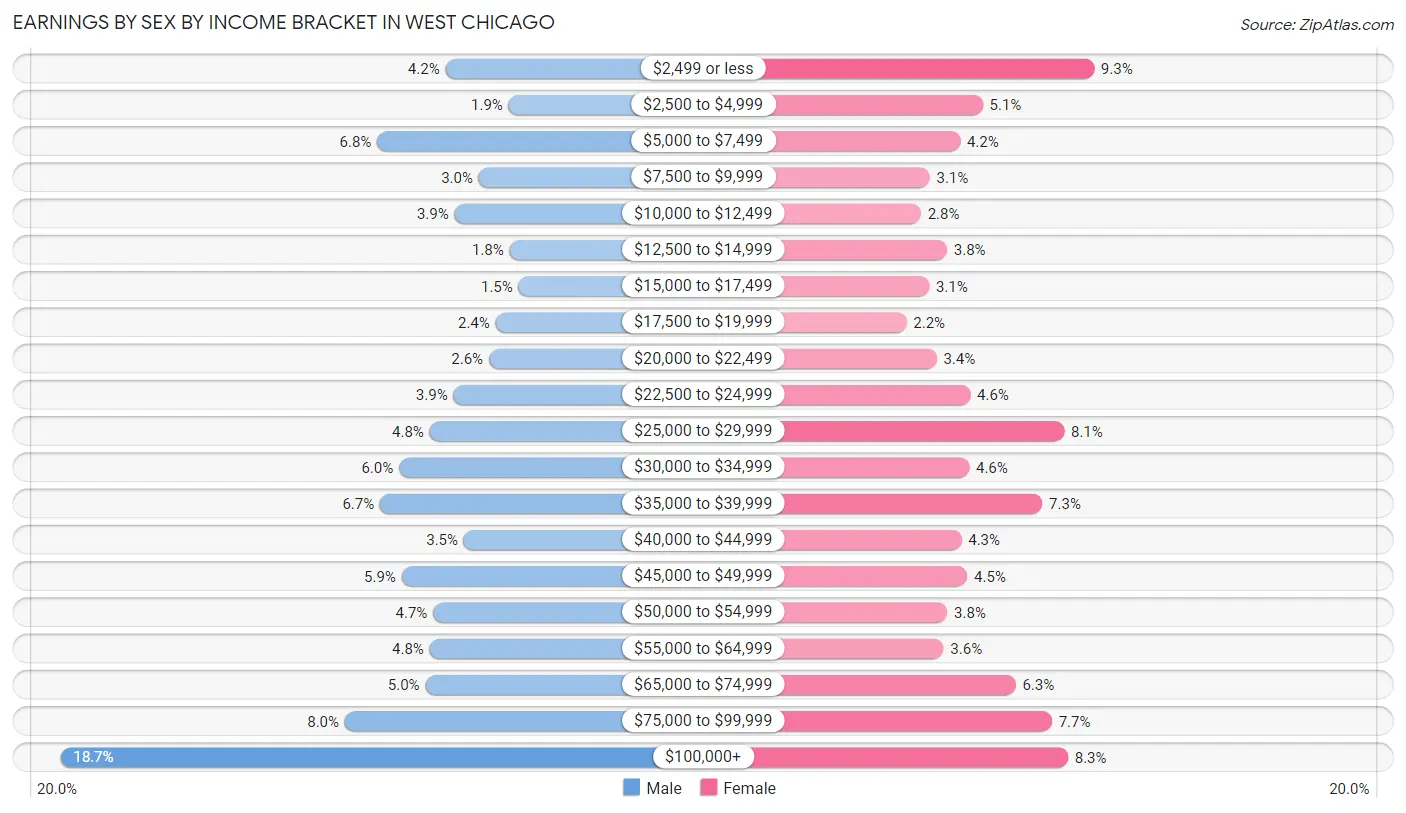
Earnings by Sex by Income Bracket in West Chicago
The most common earnings brackets in West Chicago are $100,000+ for men (1,516 | 18.7%) and $2,499 or less for women (643 | 9.3%).
| Income | Male | Female |
| $2,499 or less | 344 (4.2%) | 643 (9.3%) |
| $2,500 to $4,999 | 151 (1.9%) | 353 (5.1%) |
| $5,000 to $7,499 | 552 (6.8%) | 294 (4.2%) |
| $7,500 to $9,999 | 242 (3.0%) | 215 (3.1%) |
| $10,000 to $12,499 | 316 (3.9%) | 192 (2.8%) |
| $12,500 to $14,999 | 149 (1.8%) | 260 (3.7%) |
| $15,000 to $17,499 | 121 (1.5%) | 214 (3.1%) |
| $17,500 to $19,999 | 191 (2.4%) | 155 (2.2%) |
| $20,000 to $22,499 | 211 (2.6%) | 233 (3.4%) |
| $22,500 to $24,999 | 319 (3.9%) | 321 (4.6%) |
| $25,000 to $29,999 | 392 (4.8%) | 565 (8.1%) |
| $30,000 to $34,999 | 485 (6.0%) | 318 (4.6%) |
| $35,000 to $39,999 | 543 (6.7%) | 508 (7.3%) |
| $40,000 to $44,999 | 288 (3.5%) | 298 (4.3%) |
| $45,000 to $49,999 | 477 (5.9%) | 313 (4.5%) |
| $50,000 to $54,999 | 381 (4.7%) | 261 (3.8%) |
| $55,000 to $64,999 | 392 (4.8%) | 251 (3.6%) |
| $65,000 to $74,999 | 405 (5.0%) | 439 (6.3%) |
| $75,000 to $99,999 | 650 (8.0%) | 533 (7.7%) |
| $100,000+ | 1,516 (18.7%) | 575 (8.3%) |
| Total | 8,125 (100.0%) | 6,941 (100.0%) |
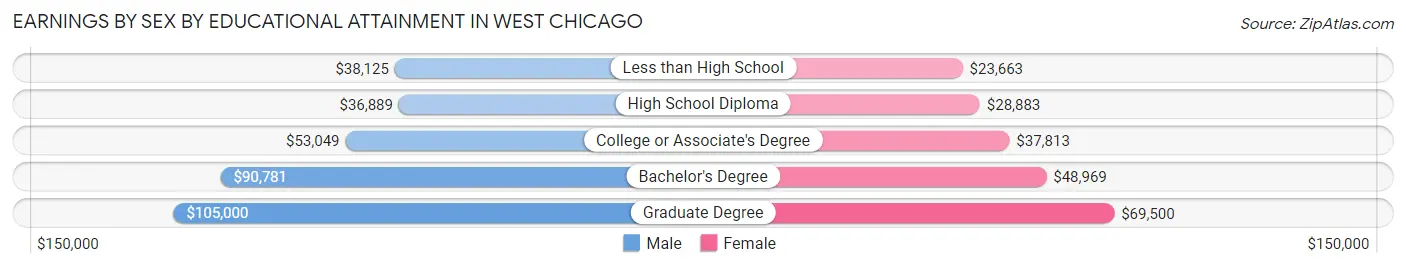
Earnings by Sex by Educational Attainment in West Chicago
Average earnings in West Chicago are $48,667 for men and $38,192 for women, a difference of 21.5%. Men with an educational attainment of graduate degree enjoy the highest average annual earnings of $105,000, while those with high school diploma education earn the least with $36,889. Women with an educational attainment of graduate degree earn the most with the average annual earnings of $69,500, while those with less than high school education have the smallest earnings of $23,663.
| Educational Attainment | Male Income | Female Income |
| Less than High School | $38,125 | $23,663 |
| High School Diploma | $36,889 | $28,883 |
| College or Associate's Degree | $53,049 | $37,813 |
| Bachelor's Degree | $90,781 | $48,969 |
| Graduate Degree | $105,000 | $69,500 |
| Total | $48,667 | $38,192 |
Family Income in West Chicago
Family Income Brackets in West Chicago
According to the West Chicago family income data, there are 1,241 families falling into the $100,000 to $149,999 income range, which is the most common income bracket and makes up 21.3% of all families. Conversely, the $10,000 to $14,999 income bracket is the least frequent group with only 64 families (1.1%) belonging to this category.
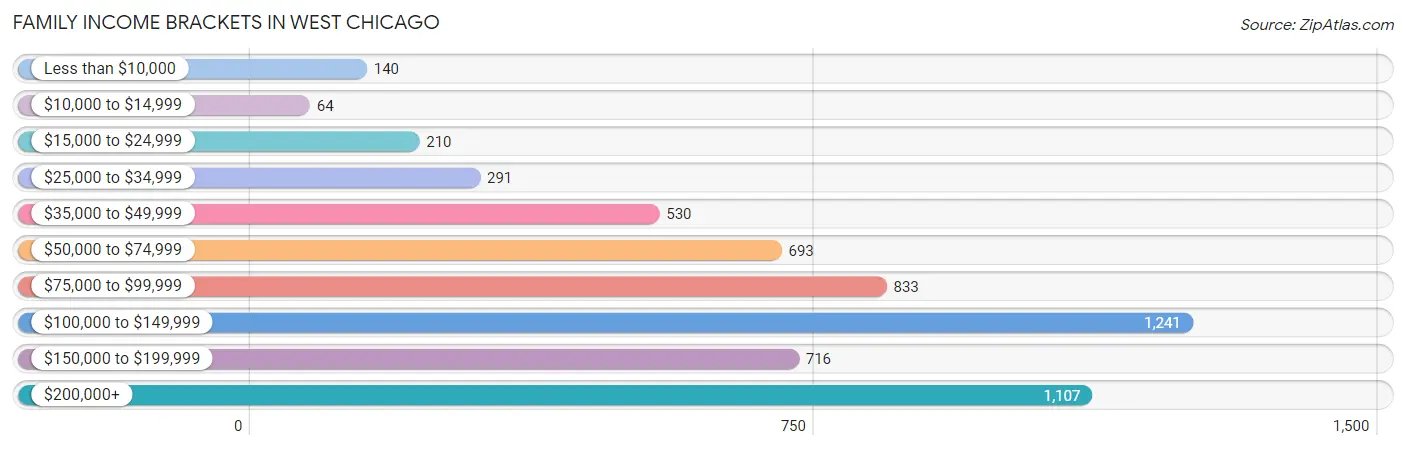
| Income Bracket | # Families | % Families |
| Less than $10,000 | 140 | 2.4% |
| $10,000 to $14,999 | 64 | 1.1% |
| $15,000 to $24,999 | 210 | 3.6% |
| $25,000 to $34,999 | 291 | 5.0% |
| $35,000 to $49,999 | 530 | 9.1% |
| $50,000 to $74,999 | 693 | 11.9% |
| $75,000 to $99,999 | 833 | 14.3% |
| $100,000 to $149,999 | 1,241 | 21.3% |
| $150,000 to $199,999 | 716 | 12.3% |
| $200,000+ | 1,107 | 19.0% |
Family Income by Famaliy Size in West Chicago
7+ person families (361 | 6.2%) account for the highest median family income in West Chicago with $158,456 per family, while 2-person families (1,617 | 27.8%) have the highest median income of $46,842 per family member.
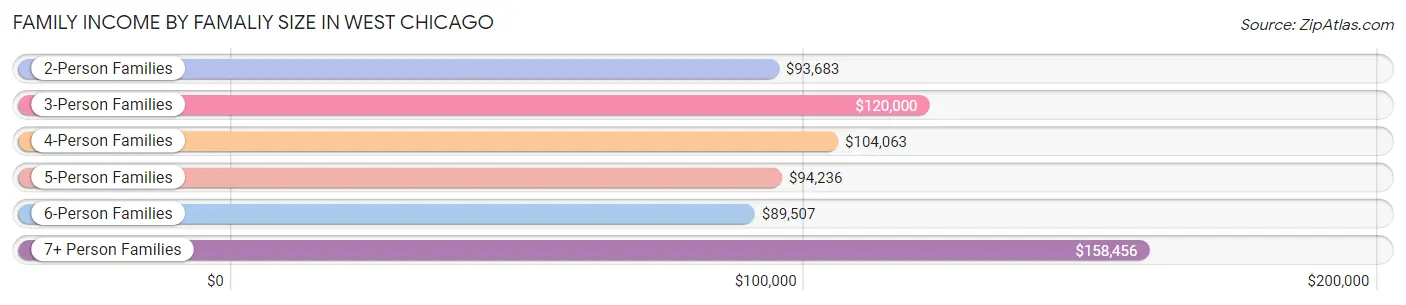
| Income Bracket | # Families | Median Income |
| 2-Person Families | 1,617 (27.8%) | $93,683 |
| 3-Person Families | 1,270 (21.8%) | $120,000 |
| 4-Person Families | 1,520 (26.1%) | $104,063 |
| 5-Person Families | 665 (11.4%) | $94,236 |
| 6-Person Families | 391 (6.7%) | $89,507 |
| 7+ Person Families | 361 (6.2%) | $158,456 |
| Total | 5,824 (100.0%) | $106,534 |
Family Income by Number of Earners in West Chicago
The median family income in West Chicago is $106,534, with families comprising 3+ earners (1,772) having the highest median family income of $145,000, while families with no earners (435) have the lowest median family income of $42,974, accounting for 30.4% and 7.5% of families, respectively.
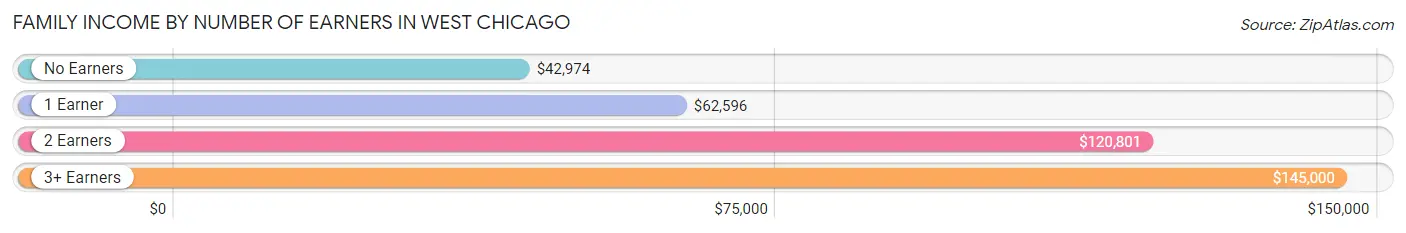
| Number of Earners | # Families | Median Income |
| No Earners | 435 (7.5%) | $42,974 |
| 1 Earner | 1,278 (21.9%) | $62,596 |
| 2 Earners | 2,339 (40.2%) | $120,801 |
| 3+ Earners | 1,772 (30.4%) | $145,000 |
| Total | 5,824 (100.0%) | $106,534 |
Household Income in West Chicago
Household Income Brackets in West Chicago
With 1,380 households falling in the category, the $100,000 to $149,999 income range is the most frequent in West Chicago, accounting for 18.7% of all households. In contrast, only 155 households (2.1%) fall into the $10,000 to $14,999 income bracket, making it the least populous group.
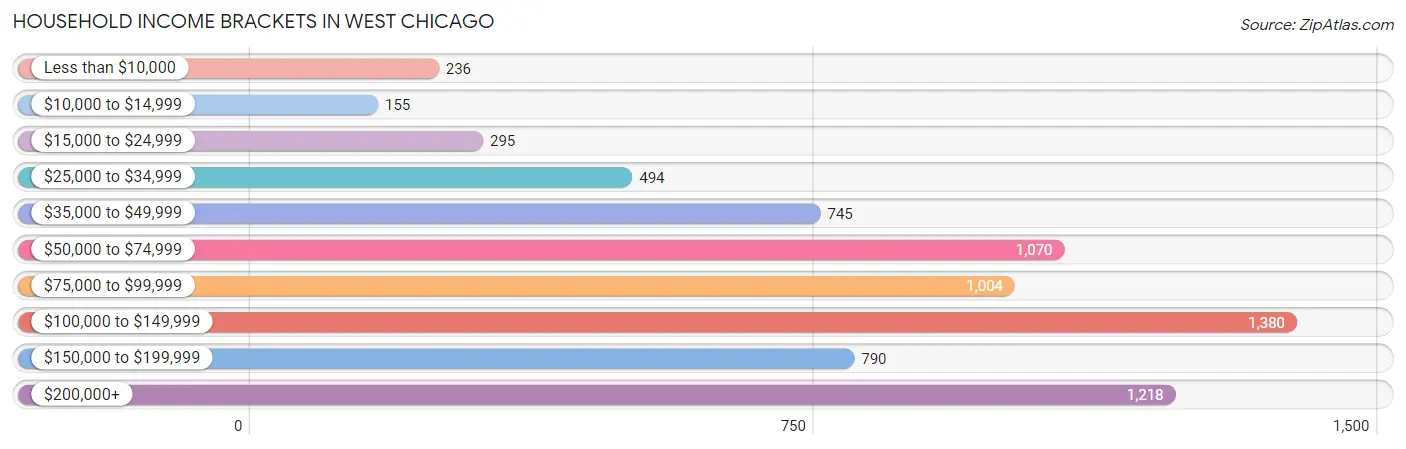
| Income Bracket | # Households | % Households |
| Less than $10,000 | 236 | 3.2% |
| $10,000 to $14,999 | 155 | 2.1% |
| $15,000 to $24,999 | 295 | 4.0% |
| $25,000 to $34,999 | 494 | 6.7% |
| $35,000 to $49,999 | 745 | 10.1% |
| $50,000 to $74,999 | 1,070 | 14.5% |
| $75,000 to $99,999 | 1,004 | 13.6% |
| $100,000 to $149,999 | 1,380 | 18.7% |
| $150,000 to $199,999 | 790 | 10.7% |
| $200,000+ | 1,218 | 16.5% |
Household Income by Householder Age in West Chicago
The median household income in West Chicago is $92,335, with the highest median household income of $118,938 found in the 45 to 64 years age bracket for the primary householder. A total of 3,572 households (48.4%) fall into this category. Meanwhile, the 65+ years age bracket for the primary householder has the lowest median household income of $73,173, with 1,330 households (18.0%) in this group.
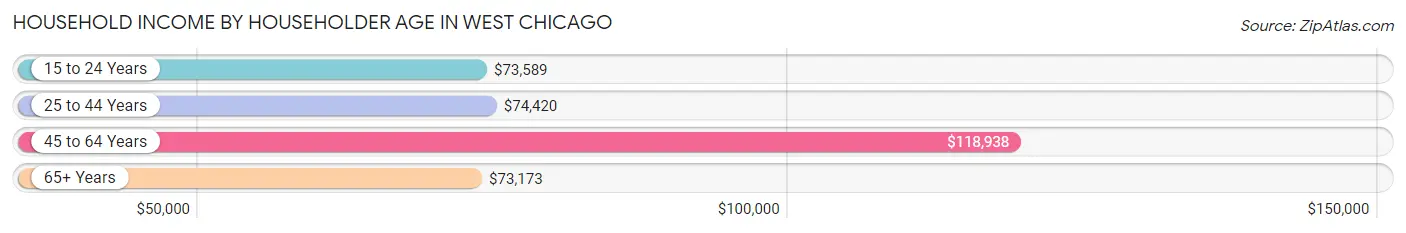
| Income Bracket | # Households | Median Income |
| 15 to 24 Years | 275 (3.7%) | $73,589 |
| 25 to 44 Years | 2,203 (29.8%) | $74,420 |
| 45 to 64 Years | 3,572 (48.4%) | $118,938 |
| 65+ Years | 1,330 (18.0%) | $73,173 |
| Total | 7,380 (100.0%) | $92,335 |
Poverty in West Chicago
Income Below Poverty by Sex and Age in West Chicago
With 12.1% poverty level for males and 12.0% for females among the residents of West Chicago, 6 to 11 year old males and 5 year old females are the most vulnerable to poverty, with 228 males (23.6%) and 70 females (32.1%) in their respective age groups living below the poverty level.
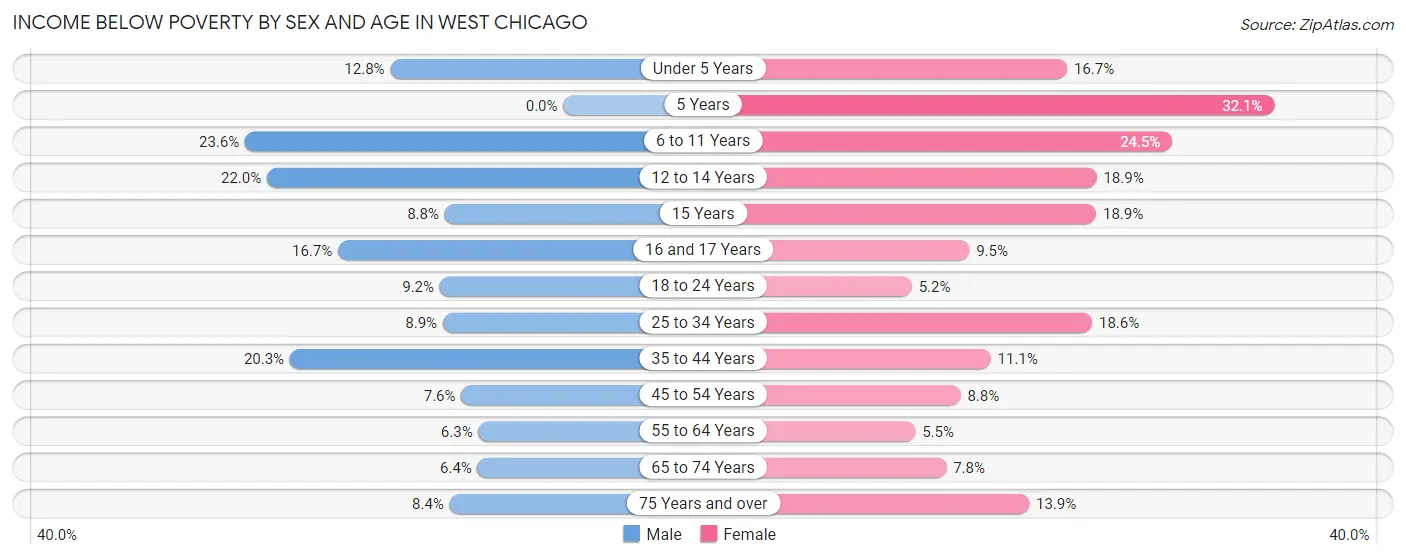
| Age Bracket | Male | Female |
| Under 5 Years | 71 (12.8%) | 113 (16.7%) |
| 5 Years | 0 (0.0%) | 70 (32.1%) |
| 6 to 11 Years | 228 (23.6%) | 209 (24.5%) |
| 12 to 14 Years | 191 (22.0%) | 125 (18.9%) |
| 15 Years | 19 (8.8%) | 27 (18.9%) |
| 16 and 17 Years | 86 (16.7%) | 63 (9.5%) |
| 18 to 24 Years | 121 (9.2%) | 79 (5.2%) |
| 25 to 34 Years | 148 (8.9%) | 259 (18.6%) |
| 35 to 44 Years | 337 (20.3%) | 175 (11.1%) |
| 45 to 54 Years | 151 (7.6%) | 178 (8.8%) |
| 55 to 64 Years | 106 (6.3%) | 82 (5.4%) |
| 65 to 74 Years | 45 (6.4%) | 59 (7.7%) |
| 75 Years and over | 41 (8.4%) | 51 (13.9%) |
| Total | 1,544 (12.1%) | 1,490 (12.0%) |
Income Above Poverty by Sex and Age in West Chicago
According to the poverty statistics in West Chicago, males aged 5 years and females aged 18 to 24 years are the age groups that are most secure financially, with 100.0% of males and 94.8% of females in these age groups living above the poverty line.
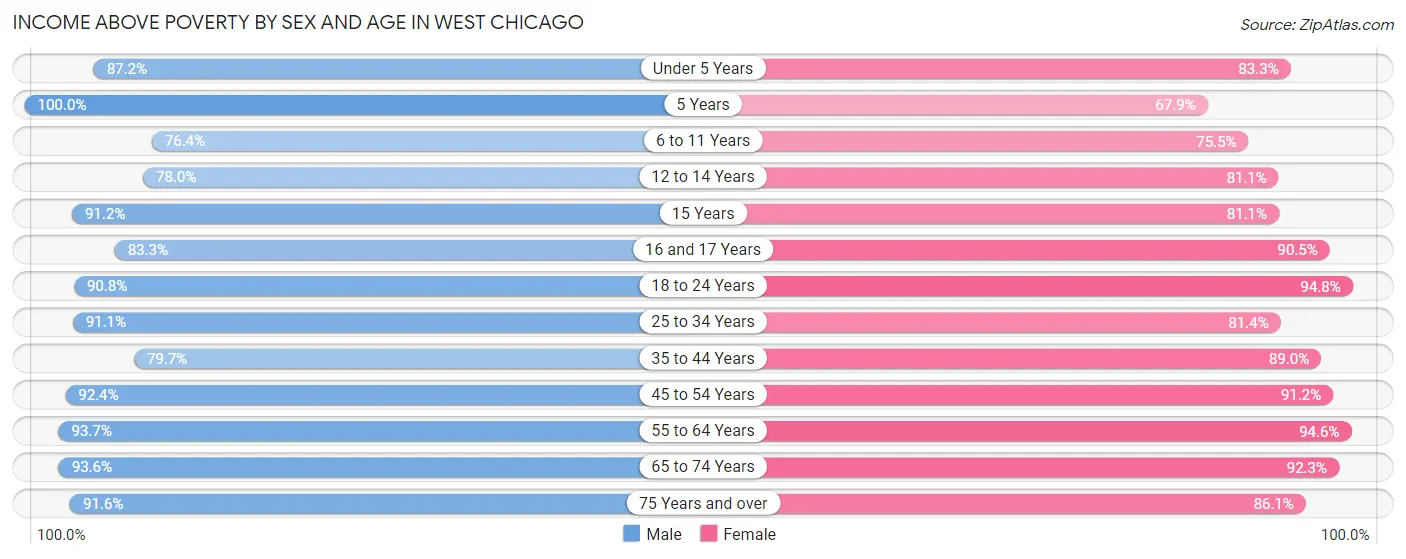
| Age Bracket | Male | Female |
| Under 5 Years | 482 (87.2%) | 563 (83.3%) |
| 5 Years | 148 (100.0%) | 148 (67.9%) |
| 6 to 11 Years | 737 (76.4%) | 643 (75.5%) |
| 12 to 14 Years | 677 (78.0%) | 536 (81.1%) |
| 15 Years | 197 (91.2%) | 116 (81.1%) |
| 16 and 17 Years | 428 (83.3%) | 603 (90.5%) |
| 18 to 24 Years | 1,198 (90.8%) | 1,444 (94.8%) |
| 25 to 34 Years | 1,507 (91.1%) | 1,135 (81.4%) |
| 35 to 44 Years | 1,323 (79.7%) | 1,409 (88.9%) |
| 45 to 54 Years | 1,843 (92.4%) | 1,842 (91.2%) |
| 55 to 64 Years | 1,576 (93.7%) | 1,423 (94.6%) |
| 65 to 74 Years | 662 (93.6%) | 702 (92.2%) |
| 75 Years and over | 445 (91.6%) | 316 (86.1%) |
| Total | 11,223 (87.9%) | 10,880 (87.9%) |
Income Below Poverty Among Married-Couple Families in West Chicago
The poverty statistics for married-couple families in West Chicago show that 5.3% or 234 of the total 4,414 families live below the poverty line. Families with 3 or 4 children have the highest poverty rate of 10.4%, comprising of 56 families. On the other hand, families with 5 or more children have the lowest poverty rate of 0.0%, which includes 0 families.
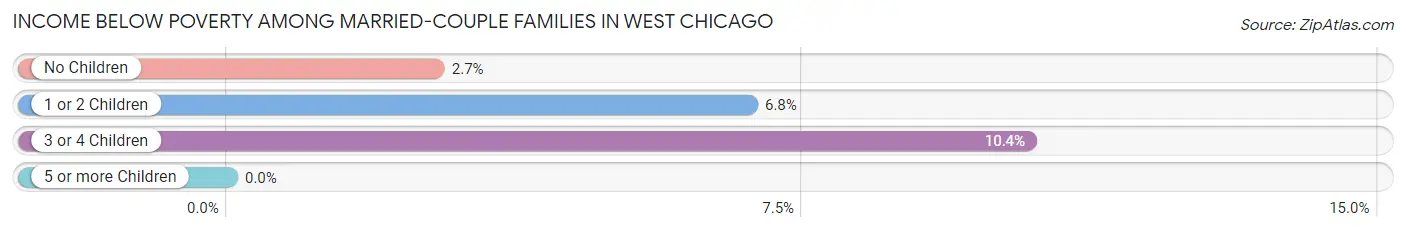
| Children | Above Poverty | Below Poverty |
| No Children | 1,949 (97.3%) | 54 (2.7%) |
| 1 or 2 Children | 1,703 (93.2%) | 124 (6.8%) |
| 3 or 4 Children | 481 (89.6%) | 56 (10.4%) |
| 5 or more Children | 47 (100.0%) | 0 (0.0%) |
| Total | 4,180 (94.7%) | 234 (5.3%) |
Income Below Poverty Among Single-Parent Households in West Chicago
According to the poverty data in West Chicago, 3.0% or 15 single-father households and 30.1% or 276 single-mother households are living below the poverty line. Among single-father households, those with 1 or 2 children have the highest poverty rate, with 15 households (8.4%) experiencing poverty. Likewise, among single-mother households, those with 3 or 4 children have the highest poverty rate, with 123 households (80.9%) falling below the poverty line.
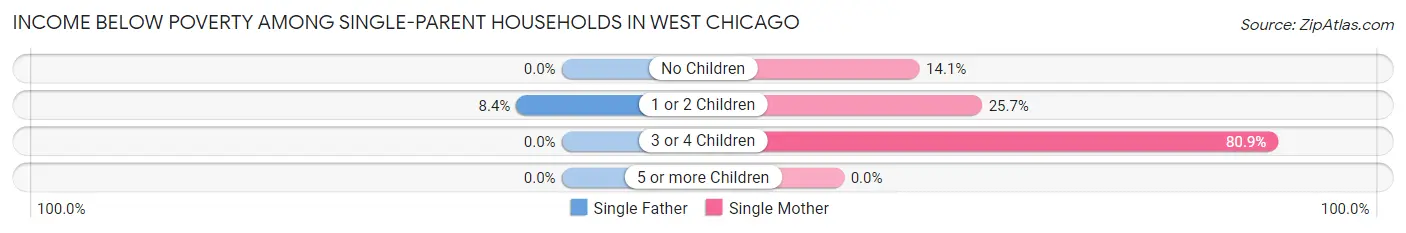
| Children | Single Father | Single Mother |
| No Children | 0 (0.0%) | 53 (14.1%) |
| 1 or 2 Children | 15 (8.4%) | 100 (25.7%) |
| 3 or 4 Children | 0 (0.0%) | 123 (80.9%) |
| 5 or more Children | 0 (0.0%) | 0 (0.0%) |
| Total | 15 (3.0%) | 276 (30.1%) |
Income Below Poverty Among Married-Couple vs Single-Parent Households in West Chicago
The poverty data for West Chicago shows that 234 of the married-couple family households (5.3%) and 291 of the single-parent households (20.6%) are living below the poverty level. Within the married-couple family households, those with 3 or 4 children have the highest poverty rate, with 56 households (10.4%) falling below the poverty line. Among the single-parent households, those with 3 or 4 children have the highest poverty rate, with 123 household (67.2%) living below poverty.
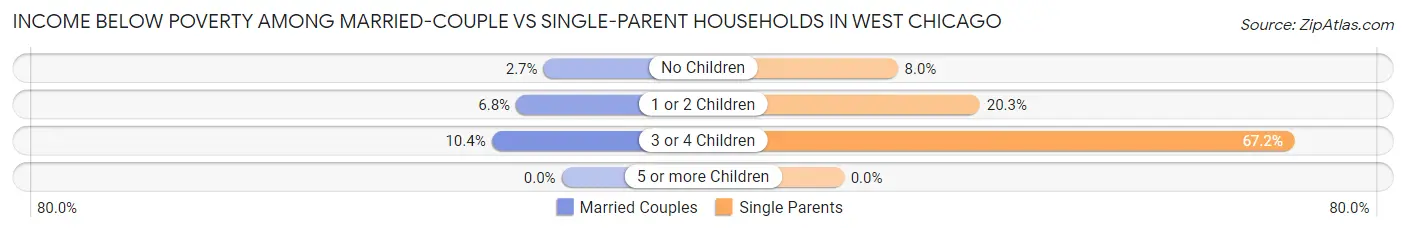
| Children | Married-Couple Families | Single-Parent Households |
| No Children | 54 (2.7%) | 53 (8.0%) |
| 1 or 2 Children | 124 (6.8%) | 115 (20.3%) |
| 3 or 4 Children | 56 (10.4%) | 123 (67.2%) |
| 5 or more Children | 0 (0.0%) | 0 (0.0%) |
| Total | 234 (5.3%) | 291 (20.6%) |
Race in West Chicago
The most populous races in West Chicago are White / Caucasian (12,759 | 49.8%), Hispanic or Latino (12,428 | 48.5%), and Some other Race (6,104 | 23.8%).
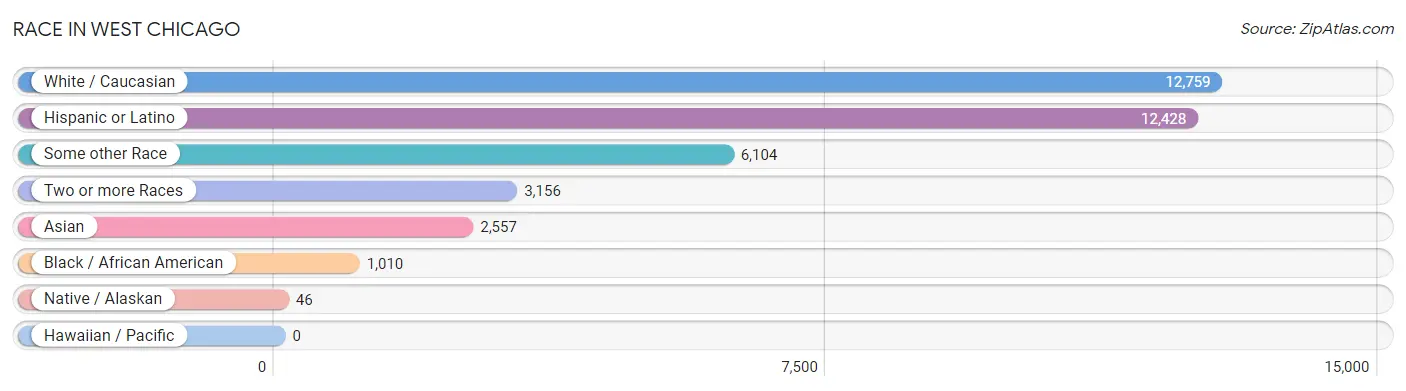
| Race | # Population | % Population |
| Asian | 2,557 | 10.0% |
| Black / African American | 1,010 | 3.9% |
| Hawaiian / Pacific | 0 | 0.0% |
| Hispanic or Latino | 12,428 | 48.5% |
| Native / Alaskan | 46 | 0.2% |
| White / Caucasian | 12,759 | 49.8% |
| Two or more Races | 3,156 | 12.3% |
| Some other Race | 6,104 | 23.8% |
| Total | 25,632 | 100.0% |
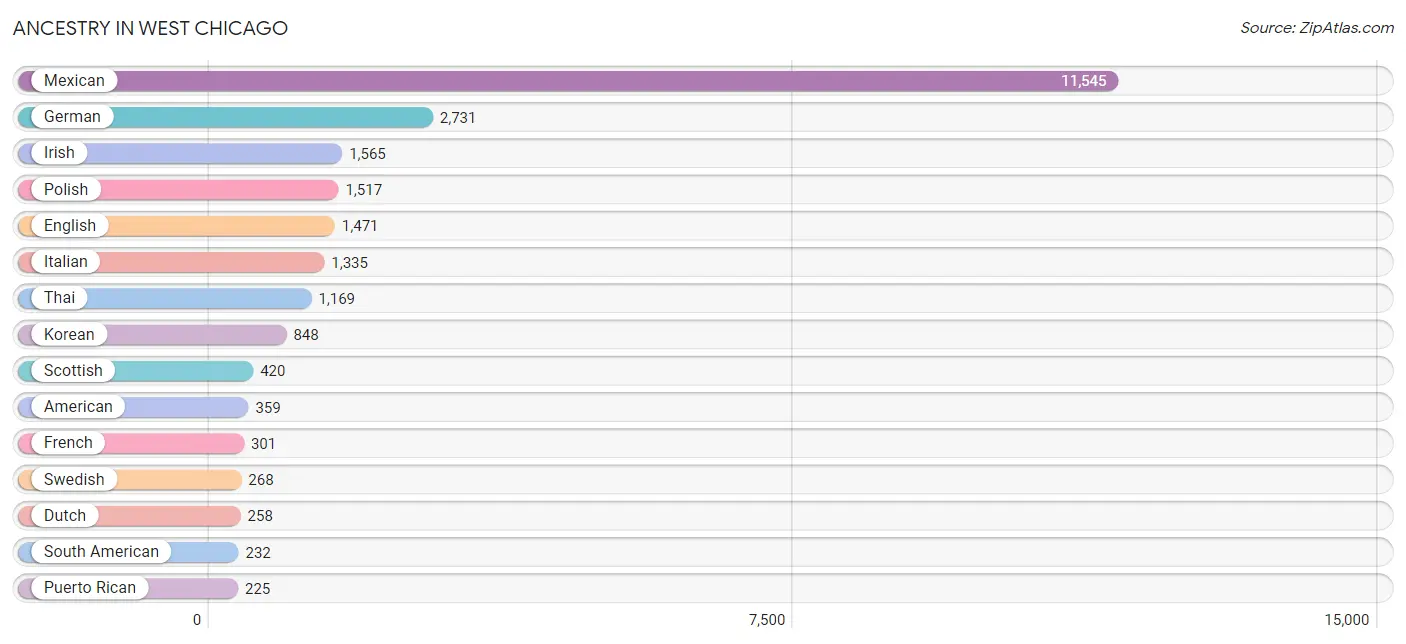
Ancestry in West Chicago
The most populous ancestries reported in West Chicago are Mexican (11,545 | 45.0%), German (2,731 | 10.6%), Irish (1,565 | 6.1%), Polish (1,517 | 5.9%), and English (1,471 | 5.7%), together accounting for 73.5% of all West Chicago residents.
| Ancestry | # Population | % Population |
| African | 21 | 0.1% |
| Albanian | 25 | 0.1% |
| American | 359 | 1.4% |
| Arab | 127 | 0.5% |
| Austrian | 17 | 0.1% |
| Belgian | 3 | 0.0% |
| Bolivian | 36 | 0.1% |
| British | 12 | 0.1% |
| Burmese | 175 | 0.7% |
| Central American | 182 | 0.7% |
| Central American Indian | 68 | 0.3% |
| Cherokee | 45 | 0.2% |
| Colombian | 127 | 0.5% |
| Croatian | 37 | 0.1% |
| Cuban | 57 | 0.2% |
| Czech | 202 | 0.8% |
| Danish | 24 | 0.1% |
| Dominican | 25 | 0.1% |
| Dutch | 258 | 1.0% |
| Eastern European | 45 | 0.2% |
| Ecuadorian | 50 | 0.2% |
| Egyptian | 34 | 0.1% |
| English | 1,471 | 5.7% |
| European | 158 | 0.6% |
| Finnish | 7 | 0.0% |
| French | 301 | 1.2% |
| French Canadian | 12 | 0.1% |
| German | 2,731 | 10.6% |
| Greek | 126 | 0.5% |
| Guatemalan | 171 | 0.7% |
| Hungarian | 70 | 0.3% |
| Icelander | 15 | 0.1% |
| Indian (Asian) | 154 | 0.6% |
| Indonesian | 18 | 0.1% |
| Iranian | 122 | 0.5% |
| Iraqi | 22 | 0.1% |
| Irish | 1,565 | 6.1% |
| Italian | 1,335 | 5.2% |
| Japanese | 4 | 0.0% |
| Korean | 848 | 3.3% |
| Lebanese | 16 | 0.1% |
| Lithuanian | 14 | 0.1% |
| Mexican | 11,545 | 45.0% |
| Mexican American Indian | 18 | 0.1% |
| New Zealander | 4 | 0.0% |
| Norwegian | 137 | 0.5% |
| Peruvian | 19 | 0.1% |
| Polish | 1,517 | 5.9% |
| Portuguese | 67 | 0.3% |
| Puerto Rican | 225 | 0.9% |
| Romanian | 71 | 0.3% |
| Russian | 54 | 0.2% |
| Salvadoran | 11 | 0.0% |
| Scotch-Irish | 108 | 0.4% |
| Scottish | 420 | 1.6% |
| Slavic | 4 | 0.0% |
| South African | 8 | 0.0% |
| South American | 232 | 0.9% |
| Sri Lankan | 85 | 0.3% |
| Subsaharan African | 29 | 0.1% |
| Swedish | 268 | 1.1% |
| Swiss | 6 | 0.0% |
| Thai | 1,169 | 4.6% |
| Ukrainian | 49 | 0.2% |
| Welsh | 74 | 0.3% |
| West Indian | 12 | 0.1% | View All 66 Rows |
Immigrants in West Chicago
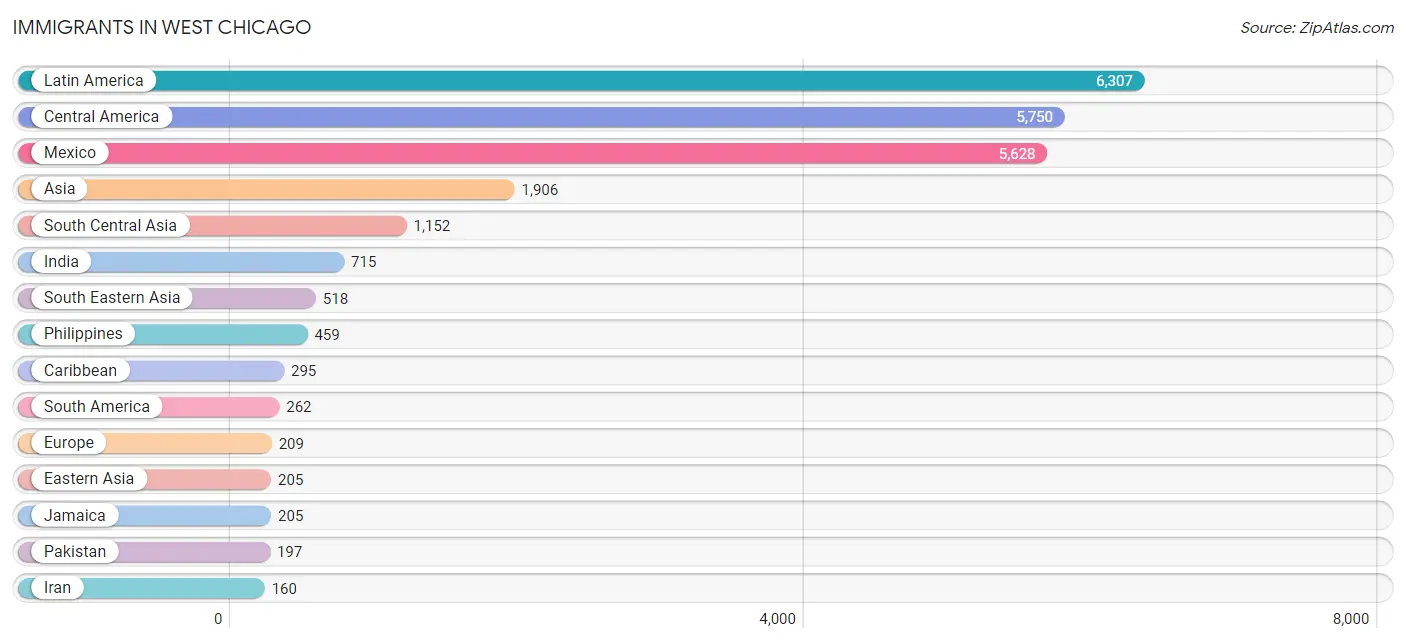
The most numerous immigrant groups reported in West Chicago came from Latin America (6,307 | 24.6%), Central America (5,750 | 22.4%), Mexico (5,628 | 22.0%), Asia (1,906 | 7.4%), and South Central Asia (1,152 | 4.5%), together accounting for 80.9% of all West Chicago residents.
| Immigration Origin | # Population | % Population |
| Africa | 41 | 0.2% |
| Asia | 1,906 | 7.4% |
| Bolivia | 1 | 0.0% |
| Cambodia | 4 | 0.0% |
| Canada | 21 | 0.1% |
| Caribbean | 295 | 1.1% |
| Central America | 5,750 | 22.4% |
| China | 121 | 0.5% |
| Colombia | 126 | 0.5% |
| Croatia | 5 | 0.0% |
| Cuba | 73 | 0.3% |
| Denmark | 21 | 0.1% |
| Dominican Republic | 17 | 0.1% |
| Eastern Africa | 10 | 0.0% |
| Eastern Asia | 205 | 0.8% |
| Eastern Europe | 134 | 0.5% |
| Ecuador | 69 | 0.3% |
| El Salvador | 19 | 0.1% |
| Europe | 209 | 0.8% |
| Germany | 19 | 0.1% |
| Guatemala | 103 | 0.4% |
| Hong Kong | 15 | 0.1% |
| India | 715 | 2.8% |
| Iran | 160 | 0.6% |
| Iraq | 31 | 0.1% |
| Italy | 35 | 0.1% |
| Jamaica | 205 | 0.8% |
| Korea | 84 | 0.3% |
| Latin America | 6,307 | 24.6% |
| Mexico | 5,628 | 22.0% |
| Nepal | 80 | 0.3% |
| Nigeria | 6 | 0.0% |
| Northern Europe | 21 | 0.1% |
| Oceania | 19 | 0.1% |
| Pakistan | 197 | 0.8% |
| Peru | 19 | 0.1% |
| Philippines | 459 | 1.8% |
| Poland | 129 | 0.5% |
| South Africa | 8 | 0.0% |
| South America | 262 | 1.0% |
| South Central Asia | 1,152 | 4.5% |
| South Eastern Asia | 518 | 2.0% |
| Southern Europe | 35 | 0.1% |
| Venezuela | 47 | 0.2% |
| Vietnam | 37 | 0.1% |
| Western Africa | 6 | 0.0% |
| Western Asia | 31 | 0.1% |
| Western Europe | 19 | 0.1% | View All 48 Rows |
Sex and Age in West Chicago
Sex and Age in West Chicago
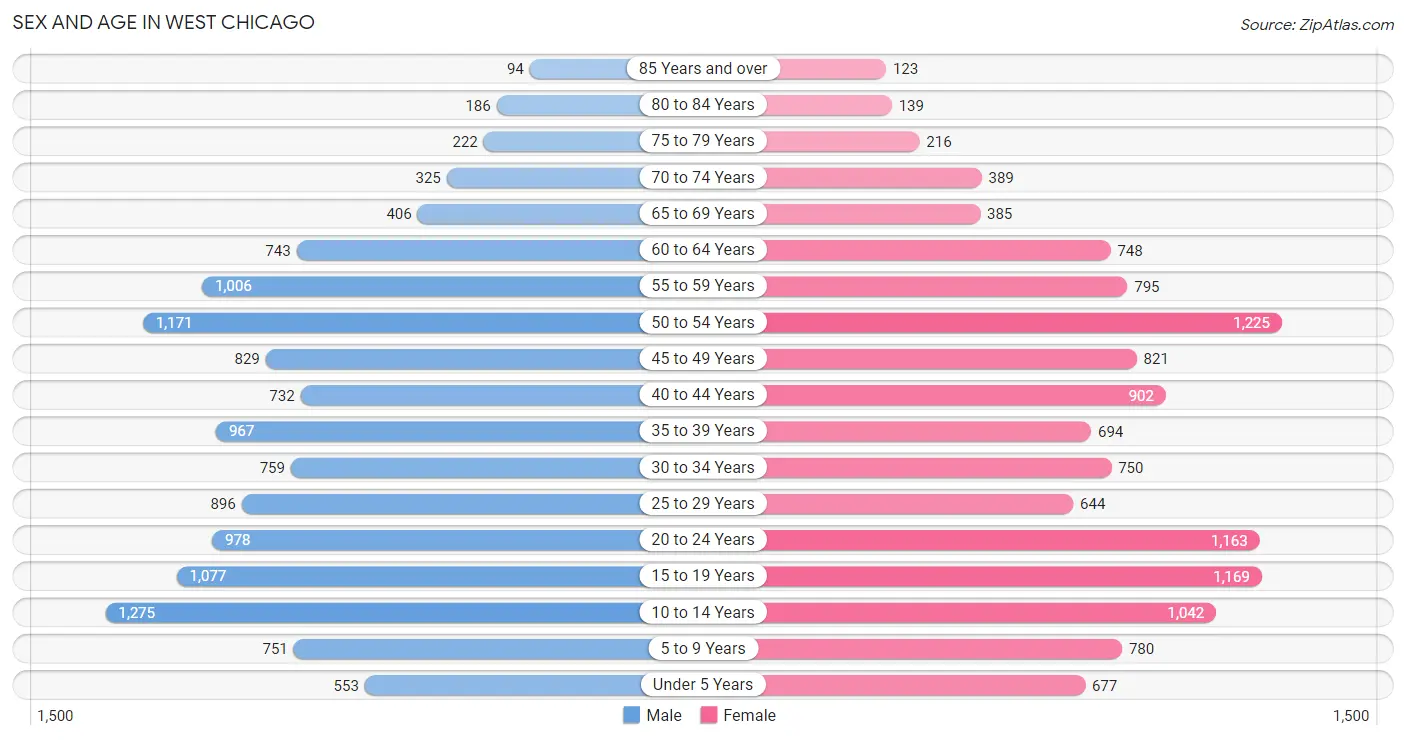
The most populous age groups in West Chicago are 10 to 14 Years (1,275 | 9.8%) for men and 50 to 54 Years (1,225 | 9.7%) for women.
| Age Bracket | Male | Female |
| Under 5 Years | 553 (4.3%) | 677 (5.3%) |
| 5 to 9 Years | 751 (5.8%) | 780 (6.2%) |
| 10 to 14 Years | 1,275 (9.8%) | 1,042 (8.2%) |
| 15 to 19 Years | 1,077 (8.3%) | 1,169 (9.2%) |
| 20 to 24 Years | 978 (7.5%) | 1,163 (9.2%) |
| 25 to 29 Years | 896 (6.9%) | 644 (5.1%) |
| 30 to 34 Years | 759 (5.9%) | 750 (5.9%) |
| 35 to 39 Years | 967 (7.5%) | 694 (5.5%) |
| 40 to 44 Years | 732 (5.6%) | 902 (7.1%) |
| 45 to 49 Years | 829 (6.4%) | 821 (6.5%) |
| 50 to 54 Years | 1,171 (9.0%) | 1,225 (9.7%) |
| 55 to 59 Years | 1,006 (7.8%) | 795 (6.3%) |
| 60 to 64 Years | 743 (5.7%) | 748 (5.9%) |
| 65 to 69 Years | 406 (3.1%) | 385 (3.0%) |
| 70 to 74 Years | 325 (2.5%) | 389 (3.1%) |
| 75 to 79 Years | 222 (1.7%) | 216 (1.7%) |
| 80 to 84 Years | 186 (1.4%) | 139 (1.1%) |
| 85 Years and over | 94 (0.7%) | 123 (1.0%) |
| Total | 12,970 (100.0%) | 12,662 (100.0%) |
Families and Households in West Chicago
Median Family Size in West Chicago
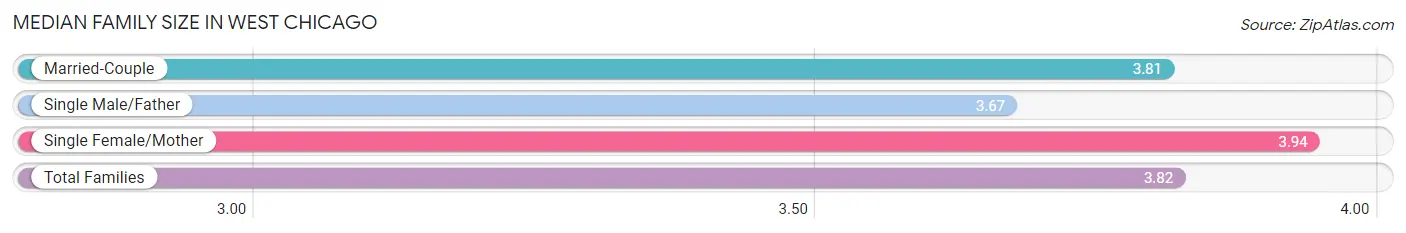
The median family size in West Chicago is 3.82 persons per family, with single female/mother families (918 | 15.8%) accounting for the largest median family size of 3.94 persons per family. On the other hand, single male/father families (492 | 8.5%) represent the smallest median family size with 3.67 persons per family.
| Family Type | # Families | Family Size |
| Married-Couple | 4,414 (75.8%) | 3.81 |
| Single Male/Father | 492 (8.5%) | 3.67 |
| Single Female/Mother | 918 (15.8%) | 3.94 |
| Total Families | 5,824 (100.0%) | 3.82 |
Median Household Size in West Chicago
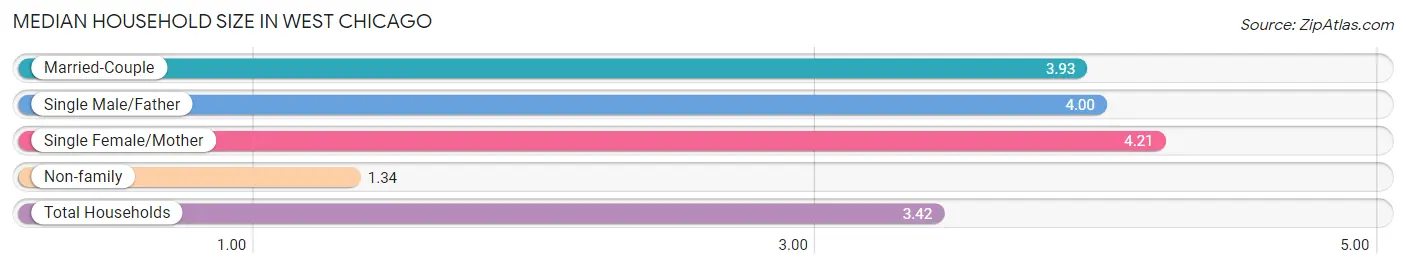
The median household size in West Chicago is 3.42 persons per household, with single female/mother households (918 | 12.4%) accounting for the largest median household size of 4.21 persons per household. non-family households (1,556 | 21.1%) represent the smallest median household size with 1.34 persons per household.
| Household Type | # Households | Household Size |
| Married-Couple | 4,414 (59.8%) | 3.93 |
| Single Male/Father | 492 (6.7%) | 4.00 |
| Single Female/Mother | 918 (12.4%) | 4.21 |
| Non-family | 1,556 (21.1%) | 1.34 |
| Total Households | 7,380 (100.0%) | 3.42 |
Household Size by Marriage Status in West Chicago
Out of a total of 7,380 households in West Chicago, 5,824 (78.9%) are family households, while 1,556 (21.1%) are nonfamily households. The most numerous type of family households are 2-person households, comprising 1,582, and the most common type of nonfamily households are 1-person households, comprising 1,262.
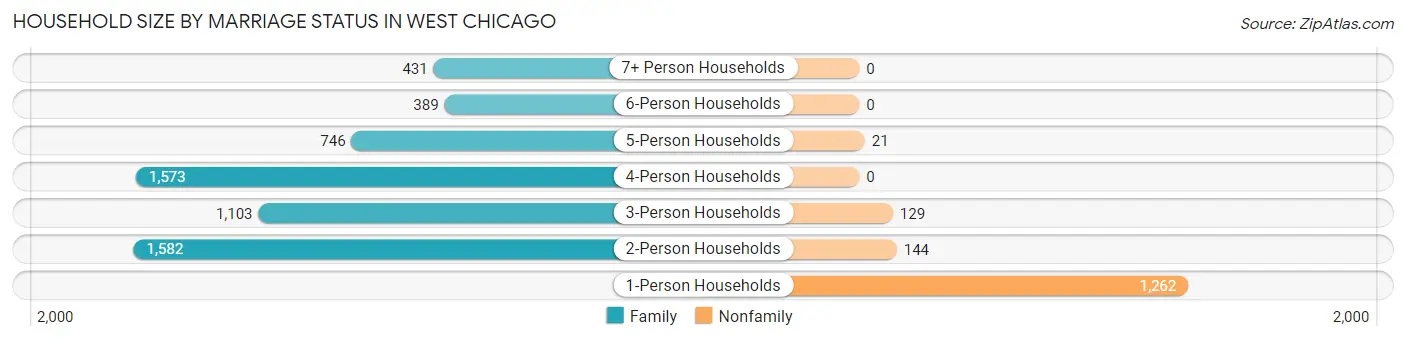
| Household Size | Family Households | Nonfamily Households |
| 1-Person Households | - | 1,262 (17.1%) |
| 2-Person Households | 1,582 (21.4%) | 144 (1.9%) |
| 3-Person Households | 1,103 (14.9%) | 129 (1.8%) |
| 4-Person Households | 1,573 (21.3%) | 0 (0.0%) |
| 5-Person Households | 746 (10.1%) | 21 (0.3%) |
| 6-Person Households | 389 (5.3%) | 0 (0.0%) |
| 7+ Person Households | 431 (5.8%) | 0 (0.0%) |
| Total | 5,824 (78.9%) | 1,556 (21.1%) |
Female Fertility in West Chicago
Fertility by Age in West Chicago
Average fertility rate in West Chicago is 51.0 births per 1,000 women. Women in the age bracket of 20 to 34 years have the highest fertility rate with 101.0 births per 1,000 women. Women in the age bracket of 20 to 34 years acount for 76.6% of all women with births.
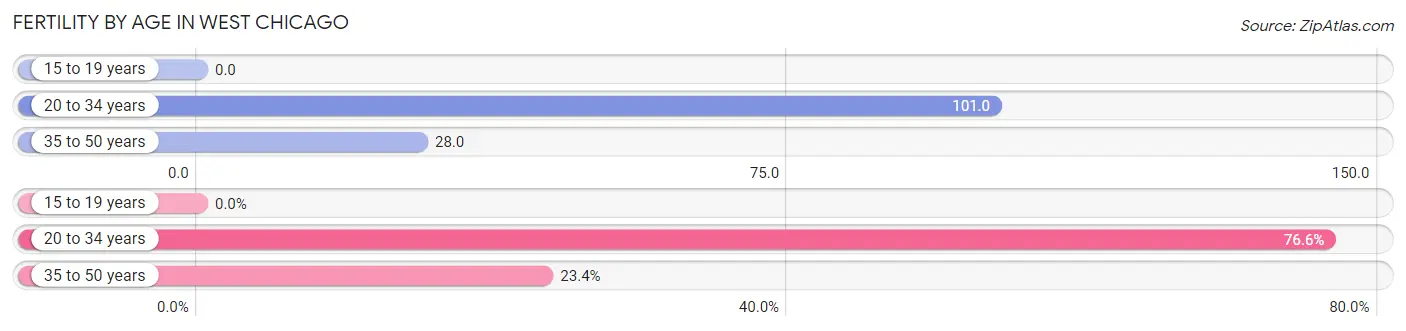
| Age Bracket | Women with Births | Births / 1,000 Women |
| 15 to 19 years | 0 (0.0%) | 0.0 |
| 20 to 34 years | 258 (76.6%) | 101.0 |
| 35 to 50 years | 79 (23.4%) | 28.0 |
| Total | 337 (100.0%) | 51.0 |
Fertility by Age by Marriage Status in West Chicago
50.1% of women with births (337) in West Chicago are married. The highest percentage of unmarried women with births falls into 20 to 34 years age bracket with 65.1% of them unmarried at the time of birth, while the lowest percentage of unmarried women with births belong to 35 to 50 years age bracket with 0.0% of them unmarried.
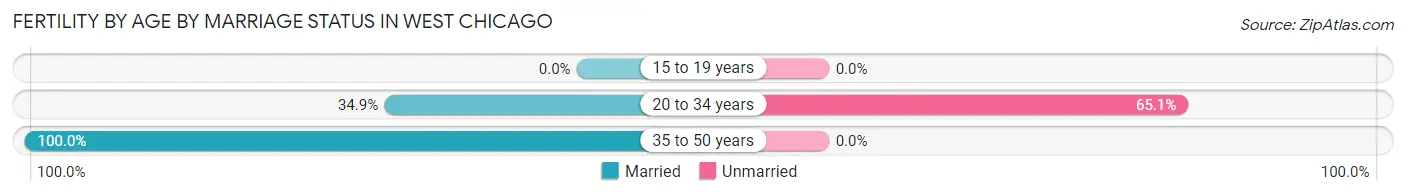
| Age Bracket | Married | Unmarried |
| 15 to 19 years | 0 (0.0%) | 0 (0.0%) |
| 20 to 34 years | 90 (34.9%) | 168 (65.1%) |
| 35 to 50 years | 79 (100.0%) | 0 (0.0%) |
| Total | 169 (50.1%) | 168 (49.8%) |
Fertility by Education in West Chicago
Average fertility rate in West Chicago is 51.0 births per 1,000 women. Women with the education attainment of graduate degree have the highest fertility rate of 109.0 births per 1,000 women, while women with the education attainment of bachelor's degree have the lowest fertility at 24.0 births per 1,000 women. Women with the education attainment of high school diploma represent 33.5% of all women with births.
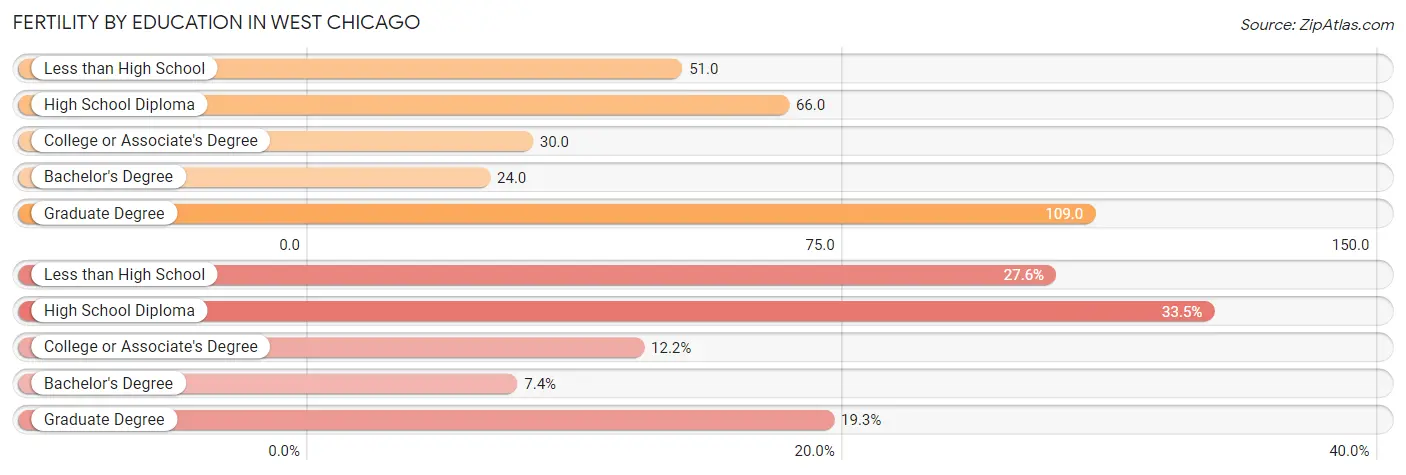
| Educational Attainment | Women with Births | Births / 1,000 Women |
| Less than High School | 93 (27.6%) | 51.0 |
| High School Diploma | 113 (33.5%) | 66.0 |
| College or Associate's Degree | 41 (12.2%) | 30.0 |
| Bachelor's Degree | 25 (7.4%) | 24.0 |
| Graduate Degree | 65 (19.3%) | 109.0 |
| Total | 337 (100.0%) | 51.0 |
Fertility by Education by Marriage Status in West Chicago
49.8% of women with births in West Chicago are unmarried. Women with the educational attainment of graduate degree are most likely to be married with 100.0% of them married at childbirth, while women with the educational attainment of less than high school are least likely to be married with 100.0% of them unmarried at childbirth.
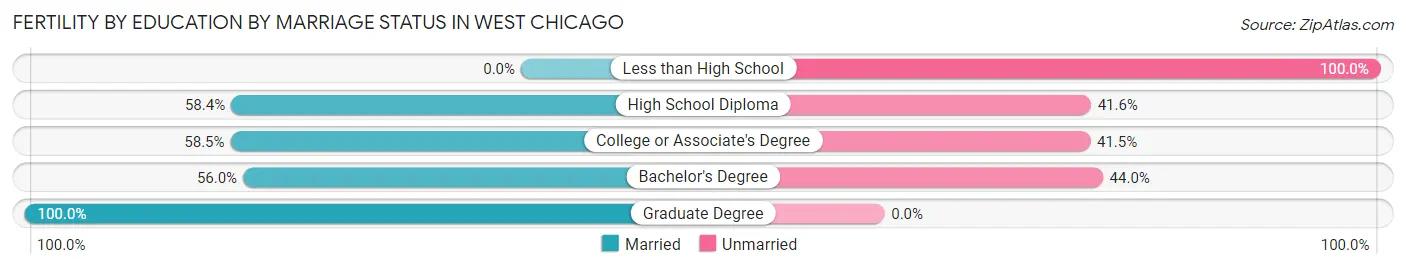
| Educational Attainment | Married | Unmarried |
| Less than High School | 0 (0.0%) | 93 (100.0%) |
| High School Diploma | 66 (58.4%) | 47 (41.6%) |
| College or Associate's Degree | 24 (58.5%) | 17 (41.5%) |
| Bachelor's Degree | 14 (56.0%) | 11 (44.0%) |
| Graduate Degree | 65 (100.0%) | 0 (0.0%) |
| Total | 169 (50.1%) | 168 (49.8%) |
Employment Characteristics in West Chicago
Employment by Class of Employer in West Chicago
Among the 12,806 employed individuals in West Chicago, private company employees (10,014 | 78.2%), not-for-profit organizations (922 | 7.2%), and local government employees (740 | 5.8%) make up the most common classes of employment.
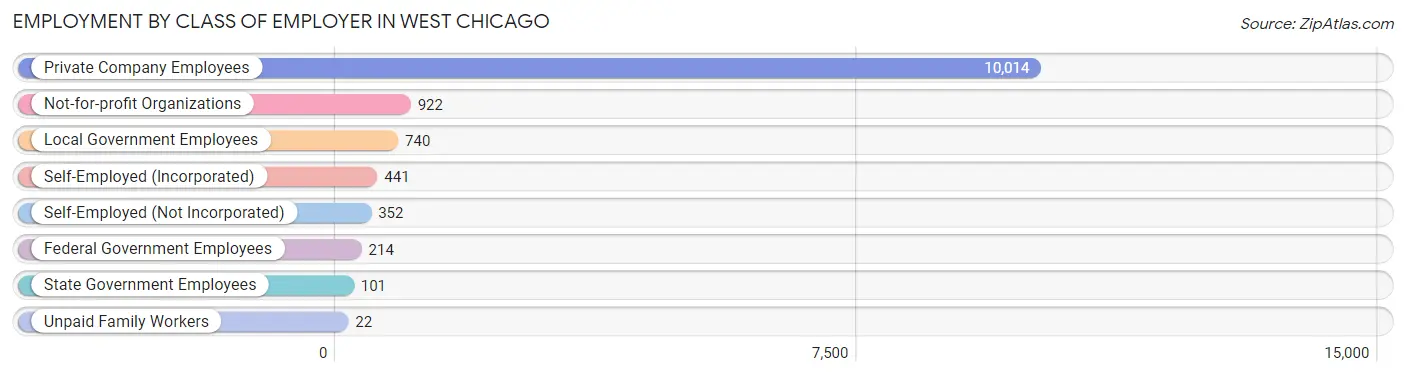
| Employer Class | # Employees | % Employees |
| Private Company Employees | 10,014 | 78.2% |
| Self-Employed (Incorporated) | 441 | 3.4% |
| Self-Employed (Not Incorporated) | 352 | 2.8% |
| Not-for-profit Organizations | 922 | 7.2% |
| Local Government Employees | 740 | 5.8% |
| State Government Employees | 101 | 0.8% |
| Federal Government Employees | 214 | 1.7% |
| Unpaid Family Workers | 22 | 0.2% |
| Total | 12,806 | 100.0% |
Employment Status by Age in West Chicago
According to the labor force statistics for West Chicago, out of the total population over 16 years of age (20,195), 72.5% or 14,641 individuals are in the labor force, with 10.4% or 1,523 of them unemployed. The age group with the highest labor force participation rate is 20 to 24 years, with 91.2% or 1,953 individuals in the labor force. Within the labor force, the 20 to 24 years age range has the highest percentage of unemployed individuals, with 29.8% or 582 of them being unemployed.
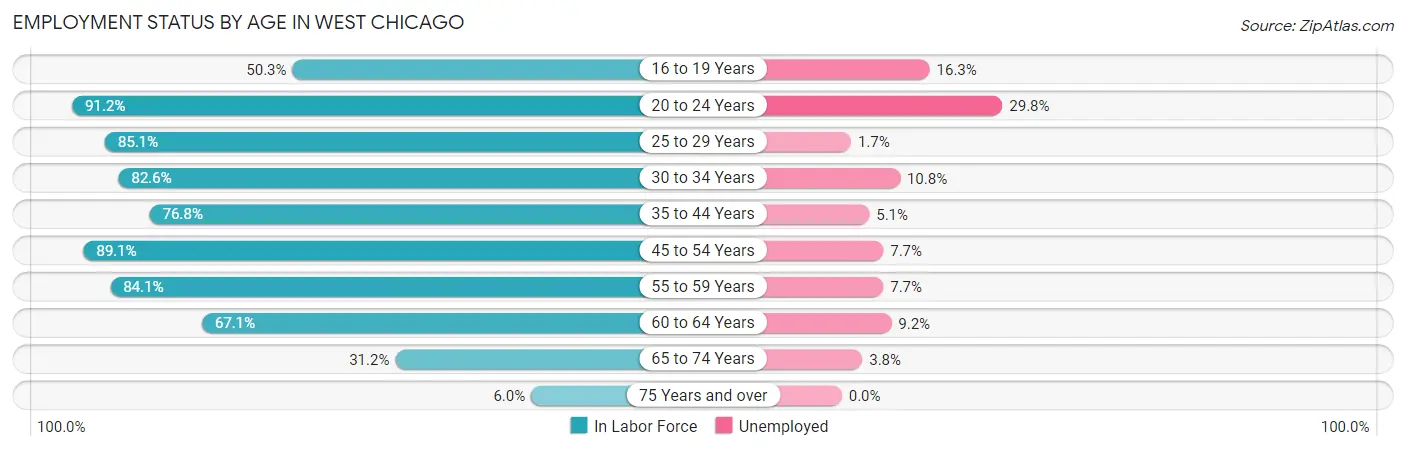
| Age Bracket | In Labor Force | Unemployed |
| 16 to 19 Years | 949 (50.3%) | 155 (16.3%) |
| 20 to 24 Years | 1,953 (91.2%) | 582 (29.8%) |
| 25 to 29 Years | 1,311 (85.1%) | 22 (1.7%) |
| 30 to 34 Years | 1,246 (82.6%) | 135 (10.8%) |
| 35 to 44 Years | 2,531 (76.8%) | 129 (5.1%) |
| 45 to 54 Years | 3,605 (89.1%) | 278 (7.7%) |
| 55 to 59 Years | 1,515 (84.1%) | 117 (7.7%) |
| 60 to 64 Years | 1,000 (67.1%) | 92 (9.2%) |
| 65 to 74 Years | 470 (31.2%) | 18 (3.8%) |
| 75 Years and over | 59 (6.0%) | 0 (0.0%) |
| Total | 14,641 (72.5%) | 1,523 (10.4%) |
Employment Status by Educational Attainment in West Chicago
According to labor force statistics for West Chicago, 81.9% of individuals (11,206) out of the total population between 25 and 64 years of age (13,682) are in the labor force, with 6.9% or 773 of them being unemployed. The group with the highest labor force participation rate are those with the educational attainment of bachelor's degree or higher, with 86.2% or 3,738 individuals in the labor force. Within the labor force, individuals with college / associate degree education have the highest percentage of unemployment, with 10.7% or 303 of them being unemployed.
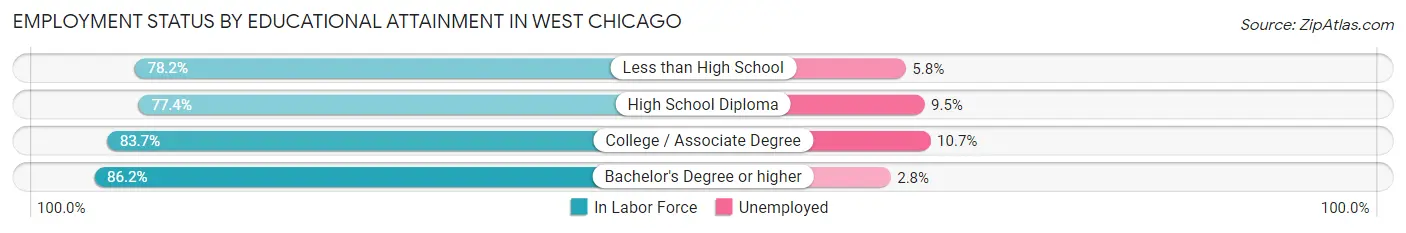
| Educational Attainment | In Labor Force | Unemployed |
| Less than High School | 2,059 (78.2%) | 153 (5.8%) |
| High School Diploma | 2,577 (77.4%) | 316 (9.5%) |
| College / Associate Degree | 2,832 (83.7%) | 362 (10.7%) |
| Bachelor's Degree or higher | 3,738 (86.2%) | 121 (2.8%) |
| Total | 11,206 (81.9%) | 944 (6.9%) |
Employment Occupations by Sex in West Chicago
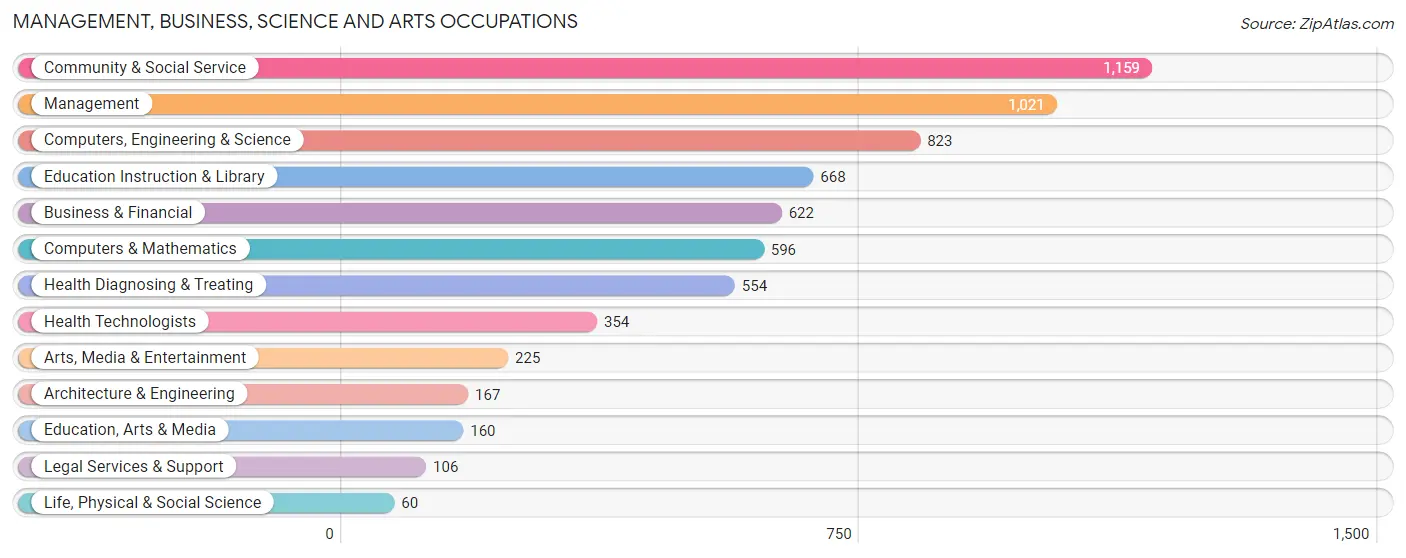
Management, Business, Science and Arts Occupations
The most common Management, Business, Science and Arts occupations in West Chicago are Community & Social Service (1,159 | 8.8%), Management (1,021 | 7.8%), Computers, Engineering & Science (823 | 6.3%), Education Instruction & Library (668 | 5.1%), and Business & Financial (622 | 4.8%).
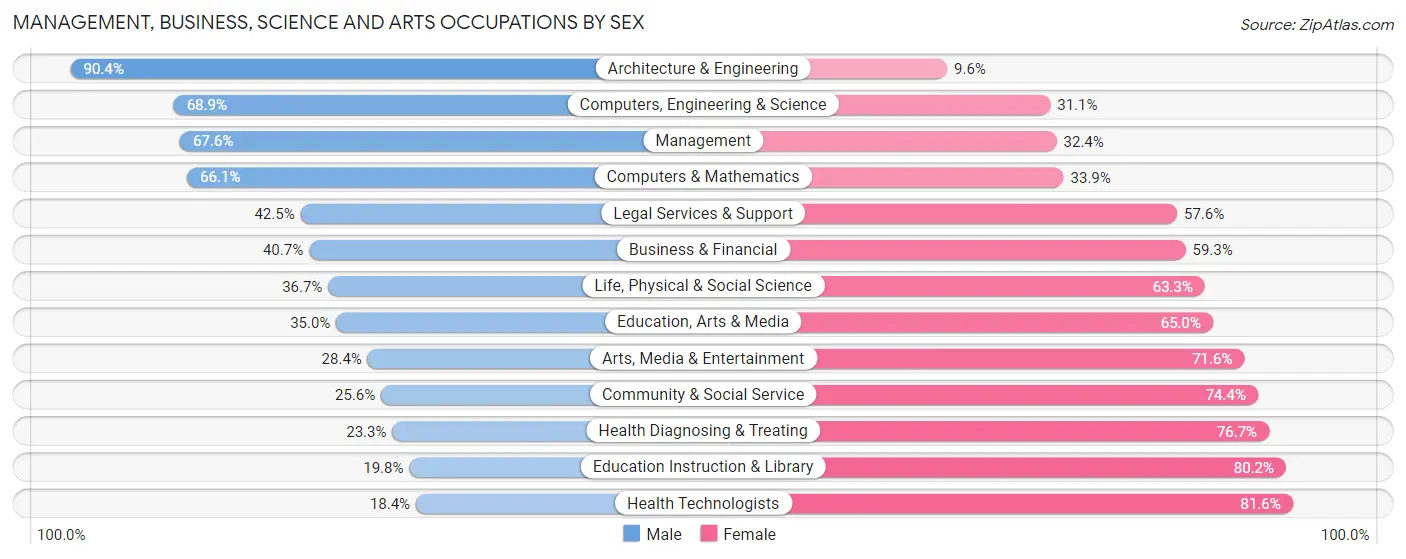
Management, Business, Science and Arts Occupations by Sex
Within the Management, Business, Science and Arts occupations in West Chicago, the most male-oriented occupations are Architecture & Engineering (90.4%), Computers, Engineering & Science (68.9%), and Management (67.6%), while the most female-oriented occupations are Health Technologists (81.6%), Education Instruction & Library (80.2%), and Health Diagnosing & Treating (76.7%).
| Occupation | Male | Female |
| Management | 690 (67.6%) | 331 (32.4%) |
| Business & Financial | 253 (40.7%) | 369 (59.3%) |
| Computers, Engineering & Science | 567 (68.9%) | 256 (31.1%) |
| Computers & Mathematics | 394 (66.1%) | 202 (33.9%) |
| Architecture & Engineering | 151 (90.4%) | 16 (9.6%) |
| Life, Physical & Social Science | 22 (36.7%) | 38 (63.3%) |
| Community & Social Service | 297 (25.6%) | 862 (74.4%) |
| Education, Arts & Media | 56 (35.0%) | 104 (65.0%) |
| Legal Services & Support | 45 (42.4%) | 61 (57.6%) |
| Education Instruction & Library | 132 (19.8%) | 536 (80.2%) |
| Arts, Media & Entertainment | 64 (28.4%) | 161 (71.6%) |
| Health Diagnosing & Treating | 129 (23.3%) | 425 (76.7%) |
| Health Technologists | 65 (18.4%) | 289 (81.6%) |
| Total (Category) | 1,936 (46.3%) | 2,243 (53.7%) |
| Total (Overall) | 7,113 (54.3%) | 5,993 (45.7%) |
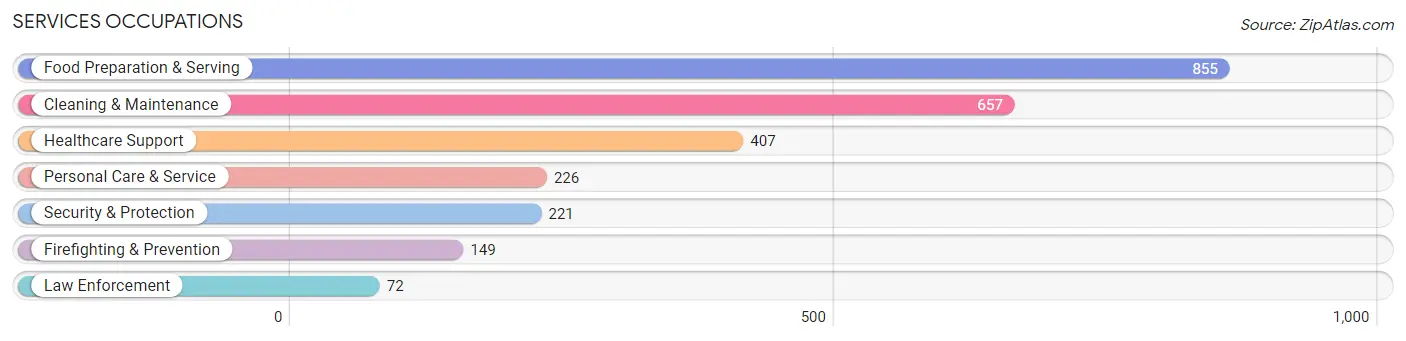
Services Occupations
The most common Services occupations in West Chicago are Food Preparation & Serving (855 | 6.5%), Cleaning & Maintenance (657 | 5.0%), Healthcare Support (407 | 3.1%), Personal Care & Service (226 | 1.7%), and Security & Protection (221 | 1.7%).
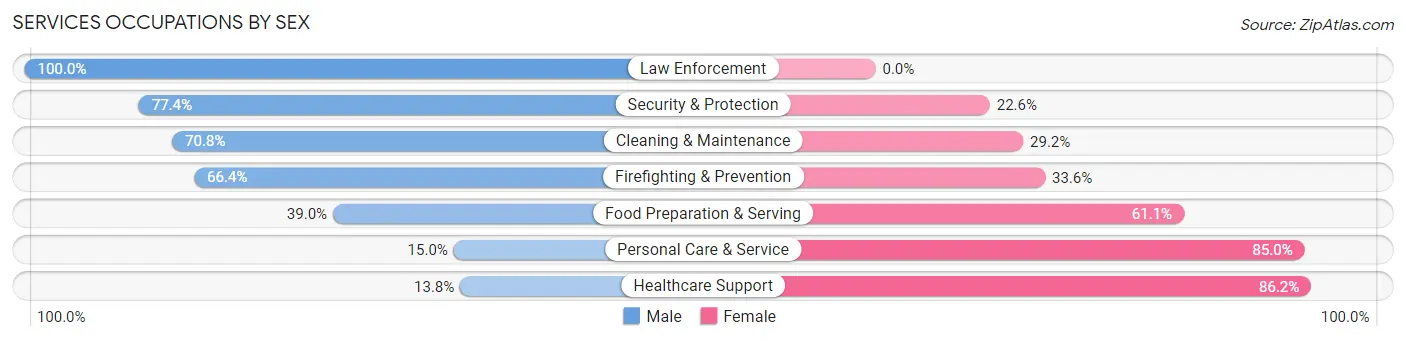
Services Occupations by Sex
Within the Services occupations in West Chicago, the most male-oriented occupations are Law Enforcement (100.0%), Security & Protection (77.4%), and Cleaning & Maintenance (70.8%), while the most female-oriented occupations are Healthcare Support (86.2%), Personal Care & Service (85.0%), and Food Preparation & Serving (61.1%).
| Occupation | Male | Female |
| Healthcare Support | 56 (13.8%) | 351 (86.2%) |
| Security & Protection | 171 (77.4%) | 50 (22.6%) |
| Firefighting & Prevention | 99 (66.4%) | 50 (33.6%) |
| Law Enforcement | 72 (100.0%) | 0 (0.0%) |
| Food Preparation & Serving | 333 (39.0%) | 522 (61.1%) |
| Cleaning & Maintenance | 465 (70.8%) | 192 (29.2%) |
| Personal Care & Service | 34 (15.0%) | 192 (85.0%) |
| Total (Category) | 1,059 (44.8%) | 1,307 (55.2%) |
| Total (Overall) | 7,113 (54.3%) | 5,993 (45.7%) |
Sales and Office Occupations
The most common Sales and Office occupations in West Chicago are Office & Administration (1,427 | 10.9%), and Sales & Related (1,337 | 10.2%).

Sales and Office Occupations by Sex

| Occupation | Male | Female |
| Sales & Related | 793 (59.3%) | 544 (40.7%) |
| Office & Administration | 480 (33.6%) | 947 (66.4%) |
| Total (Category) | 1,273 (46.1%) | 1,491 (53.9%) |
| Total (Overall) | 7,113 (54.3%) | 5,993 (45.7%) |
Natural Resources, Construction and Maintenance Occupations
The most common Natural Resources, Construction and Maintenance occupations in West Chicago are Construction & Extraction (618 | 4.7%), Installation, Maintenance & Repair (307 | 2.3%), and Farming, Fishing & Forestry (142 | 1.1%).
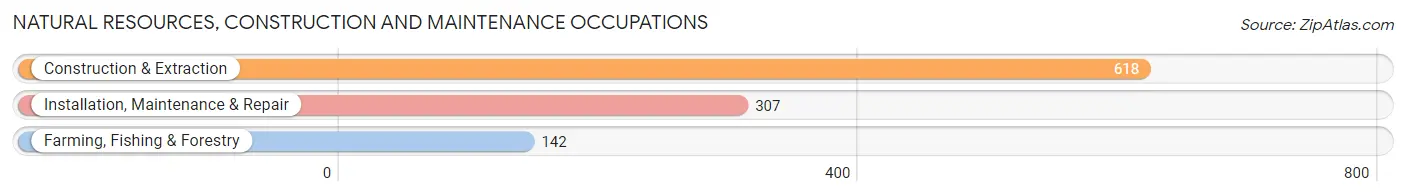
Natural Resources, Construction and Maintenance Occupations by Sex

| Occupation | Male | Female |
| Farming, Fishing & Forestry | 39 (27.5%) | 103 (72.5%) |
| Construction & Extraction | 614 (99.4%) | 4 (0.6%) |
| Installation, Maintenance & Repair | 278 (90.5%) | 29 (9.5%) |
| Total (Category) | 931 (87.3%) | 136 (12.8%) |
| Total (Overall) | 7,113 (54.3%) | 5,993 (45.7%) |
Production, Transportation and Moving Occupations
The most common Production, Transportation and Moving occupations in West Chicago are Production (1,299 | 9.9%), Material Moving (997 | 7.6%), and Transportation (434 | 3.3%).
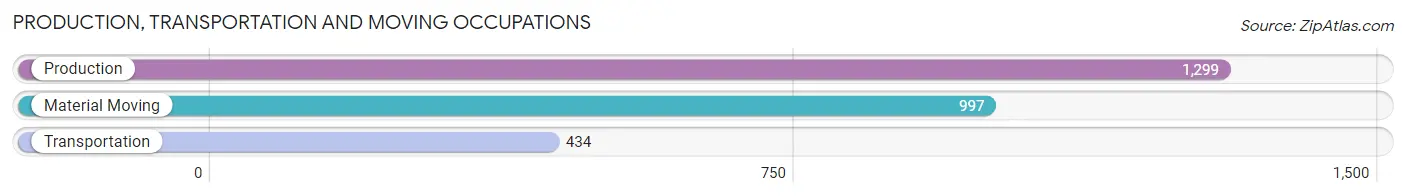
Production, Transportation and Moving Occupations by Sex
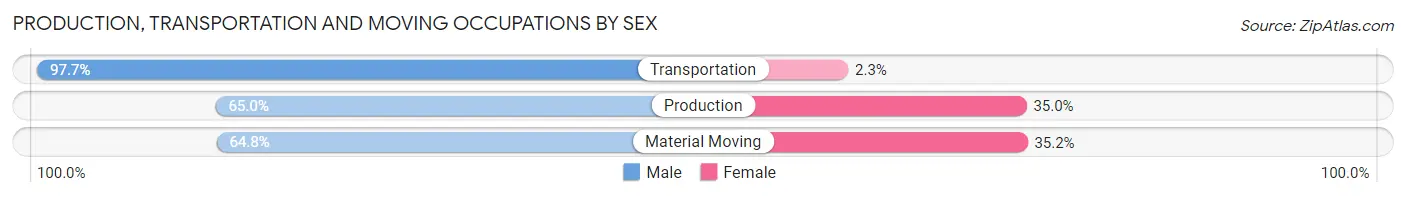
| Occupation | Male | Female |
| Production | 844 (65.0%) | 455 (35.0%) |
| Transportation | 424 (97.7%) | 10 (2.3%) |
| Material Moving | 646 (64.8%) | 351 (35.2%) |
| Total (Category) | 1,914 (70.1%) | 816 (29.9%) |
| Total (Overall) | 7,113 (54.3%) | 5,993 (45.7%) |
Employment Industries by Sex in West Chicago
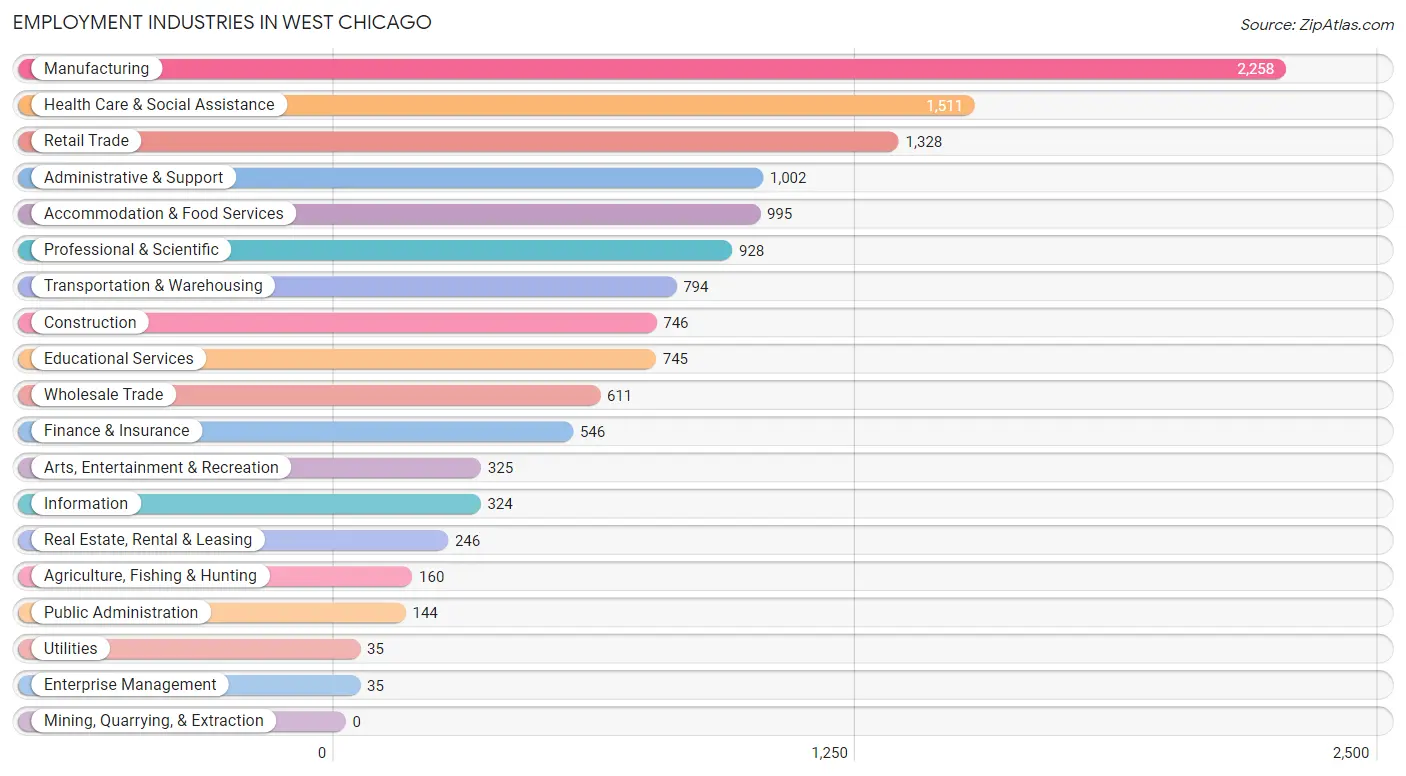
Employment Industries in West Chicago
The major employment industries in West Chicago include Manufacturing (2,258 | 17.2%), Health Care & Social Assistance (1,511 | 11.5%), Retail Trade (1,328 | 10.1%), Administrative & Support (1,002 | 7.6%), and Accommodation & Food Services (995 | 7.6%).
Employment Industries by Sex in West Chicago
The West Chicago industries that see more men than women are Construction (94.0%), Public Administration (80.6%), and Transportation & Warehousing (73.9%), whereas the industries that tend to have a higher number of women are Enterprise Management (100.0%), Health Care & Social Assistance (83.1%), and Educational Services (81.3%).
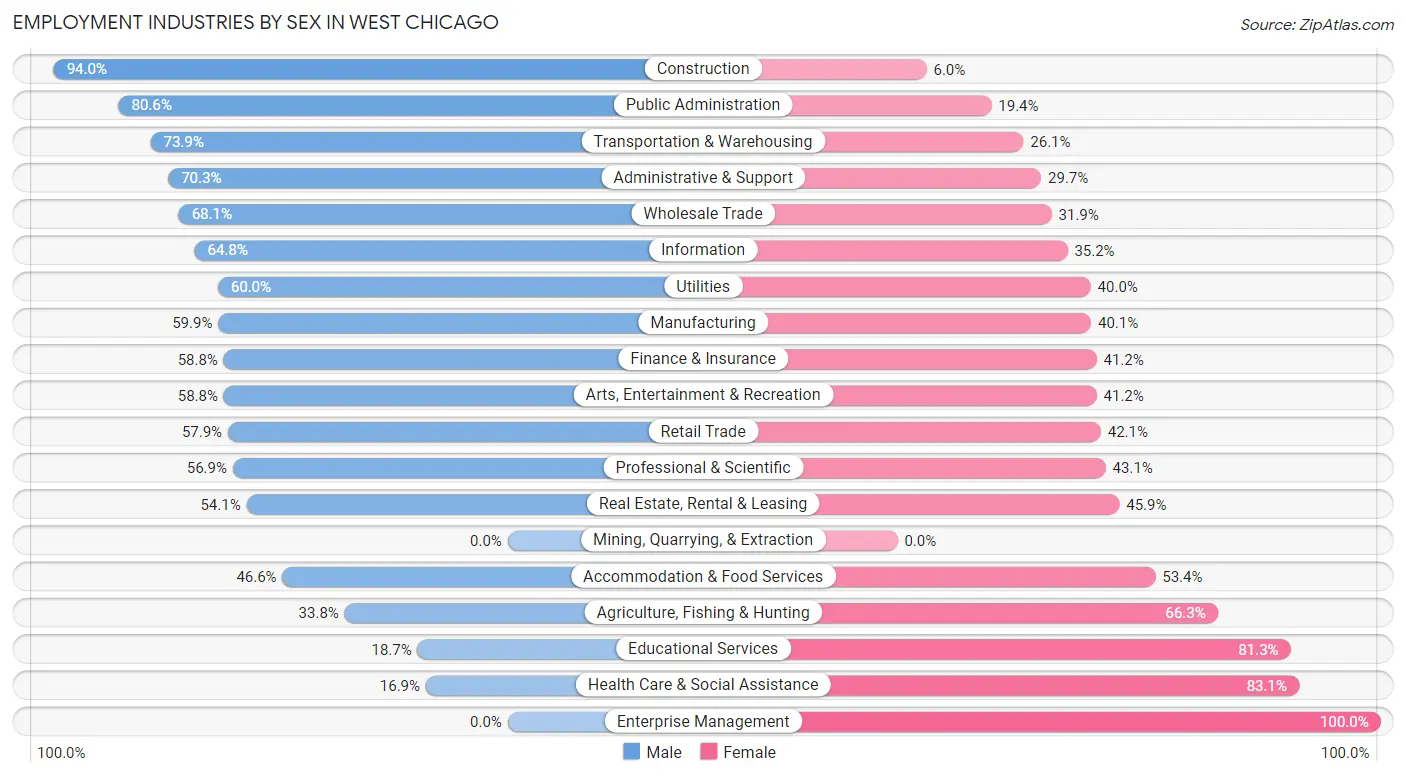
| Industry | Male | Female |
| Agriculture, Fishing & Hunting | 54 (33.8%) | 106 (66.2%) |
| Mining, Quarrying, & Extraction | 0 (0.0%) | 0 (0.0%) |
| Construction | 701 (94.0%) | 45 (6.0%) |
| Manufacturing | 1,353 (59.9%) | 905 (40.1%) |
| Wholesale Trade | 416 (68.1%) | 195 (31.9%) |
| Retail Trade | 769 (57.9%) | 559 (42.1%) |
| Transportation & Warehousing | 587 (73.9%) | 207 (26.1%) |
| Utilities | 21 (60.0%) | 14 (40.0%) |
| Information | 210 (64.8%) | 114 (35.2%) |
| Finance & Insurance | 321 (58.8%) | 225 (41.2%) |
| Real Estate, Rental & Leasing | 133 (54.1%) | 113 (45.9%) |
| Professional & Scientific | 528 (56.9%) | 400 (43.1%) |
| Enterprise Management | 0 (0.0%) | 35 (100.0%) |
| Administrative & Support | 704 (70.3%) | 298 (29.7%) |
| Educational Services | 139 (18.7%) | 606 (81.3%) |
| Health Care & Social Assistance | 256 (16.9%) | 1,255 (83.1%) |
| Arts, Entertainment & Recreation | 191 (58.8%) | 134 (41.2%) |
| Accommodation & Food Services | 464 (46.6%) | 531 (53.4%) |
| Public Administration | 116 (80.6%) | 28 (19.4%) |
| Total | 7,113 (54.3%) | 5,993 (45.7%) |
Education in West Chicago
School Enrollment in West Chicago
The most common levels of schooling among the 7,488 students in West Chicago are high school (2,235 | 29.8%), middle school (1,630 | 21.8%), and college / undergraduate (1,263 | 16.9%).
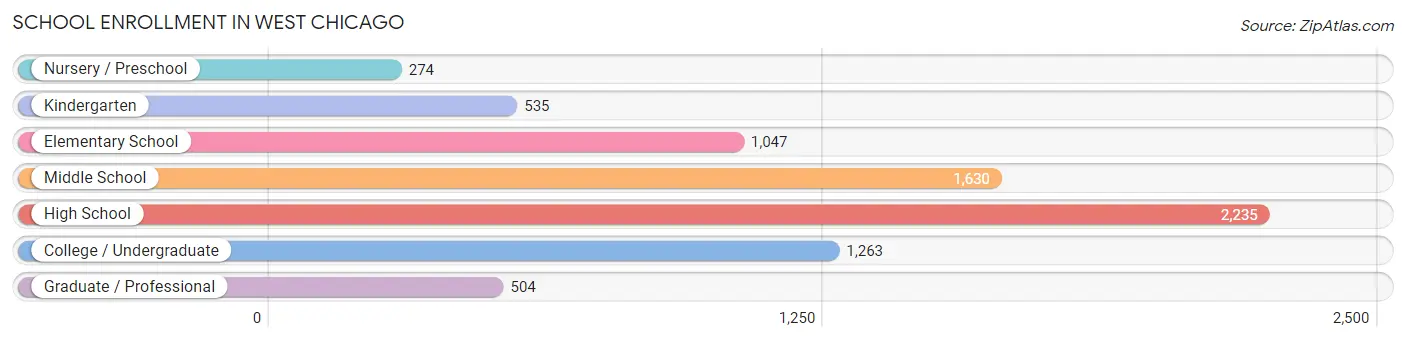
| School Level | # Students | % Students |
| Nursery / Preschool | 274 | 3.7% |
| Kindergarten | 535 | 7.1% |
| Elementary School | 1,047 | 14.0% |
| Middle School | 1,630 | 21.8% |
| High School | 2,235 | 29.8% |
| College / Undergraduate | 1,263 | 16.9% |
| Graduate / Professional | 504 | 6.7% |
| Total | 7,488 | 100.0% |
School Enrollment by Age by Funding Source in West Chicago
Out of a total of 7,488 students who are enrolled in schools in West Chicago, 1,258 (16.8%) attend a private institution, while the remaining 6,230 (83.2%) are enrolled in public schools. The age group of 35 years and over has the highest likelihood of being enrolled in private schools, with 198 (36.1% in the age bracket) enrolled. Conversely, the age group of 18 to 19 year olds has the lowest likelihood of being enrolled in a private school, with 339 (88.5% in the age bracket) attending a public institution.
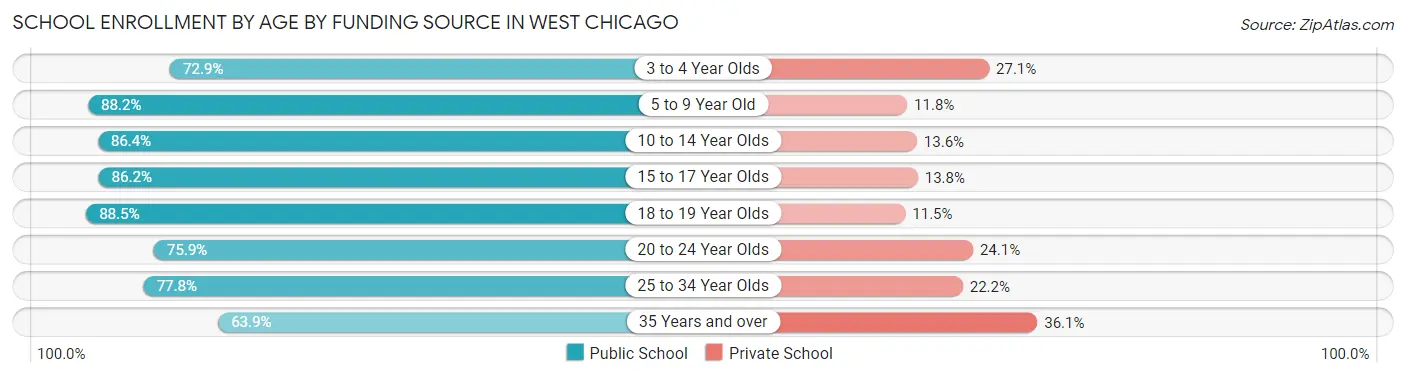
| Age Bracket | Public School | Private School |
| 3 to 4 Year Olds | 183 (72.9%) | 68 (27.1%) |
| 5 to 9 Year Old | 1,259 (88.2%) | 169 (11.8%) |
| 10 to 14 Year Olds | 1,931 (86.4%) | 305 (13.6%) |
| 15 to 17 Year Olds | 1,281 (86.2%) | 205 (13.8%) |
| 18 to 19 Year Olds | 339 (88.5%) | 44 (11.5%) |
| 20 to 24 Year Olds | 627 (75.9%) | 199 (24.1%) |
| 25 to 34 Year Olds | 256 (77.8%) | 73 (22.2%) |
| 35 Years and over | 351 (63.9%) | 198 (36.1%) |
| Total | 6,230 (83.2%) | 1,258 (16.8%) |
Educational Attainment by Field of Study in West Chicago
Business (1,330 | 24.9%), education (671 | 12.5%), engineering (526 | 9.8%), computers & mathematics (466 | 8.7%), and science & technology (388 | 7.2%) are the most common fields of study among 5,351 individuals in West Chicago who have obtained a bachelor's degree or higher.
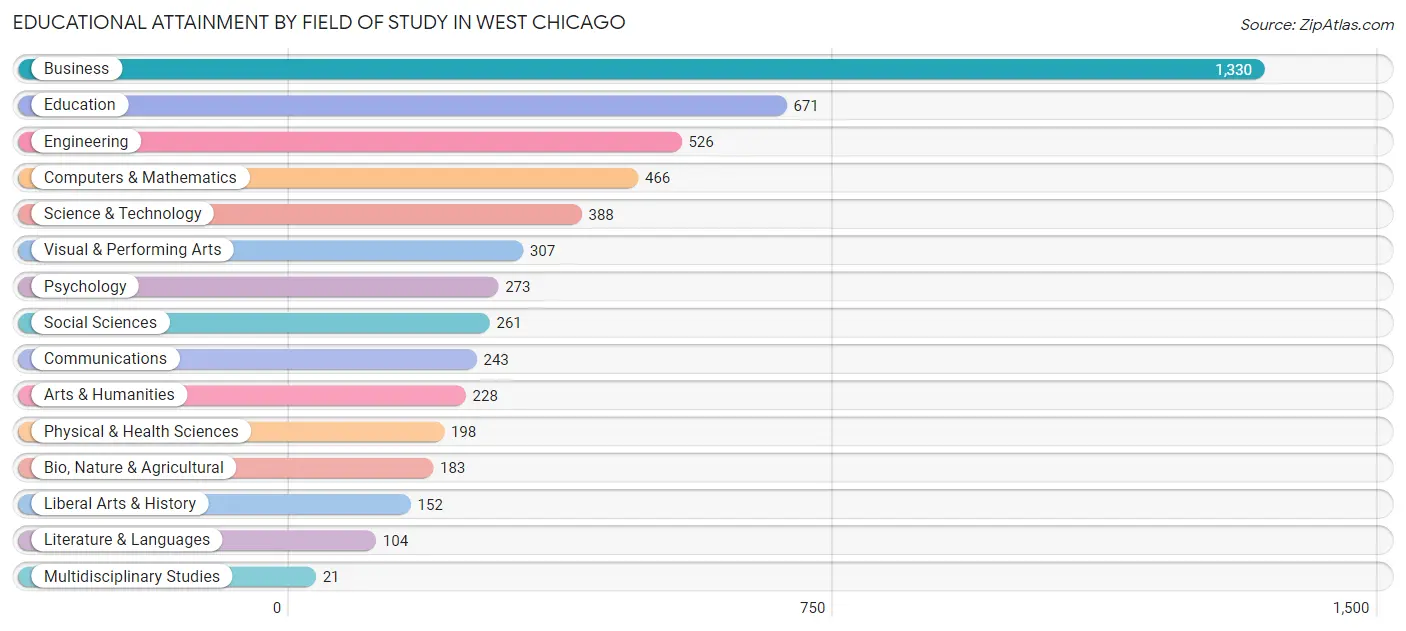
| Field of Study | # Graduates | % Graduates |
| Computers & Mathematics | 466 | 8.7% |
| Bio, Nature & Agricultural | 183 | 3.4% |
| Physical & Health Sciences | 198 | 3.7% |
| Psychology | 273 | 5.1% |
| Social Sciences | 261 | 4.9% |
| Engineering | 526 | 9.8% |
| Multidisciplinary Studies | 21 | 0.4% |
| Science & Technology | 388 | 7.2% |
| Business | 1,330 | 24.9% |
| Education | 671 | 12.5% |
| Literature & Languages | 104 | 1.9% |
| Liberal Arts & History | 152 | 2.8% |
| Visual & Performing Arts | 307 | 5.7% |
| Communications | 243 | 4.5% |
| Arts & Humanities | 228 | 4.3% |
| Total | 5,351 | 100.0% |
Transportation & Commute in West Chicago
Vehicle Availability by Sex in West Chicago
The most prevalent vehicle ownership categories in West Chicago are males with 2 vehicles (2,826, accounting for 40.2%) and females with 2 vehicles (2,105, making up 49.0%).
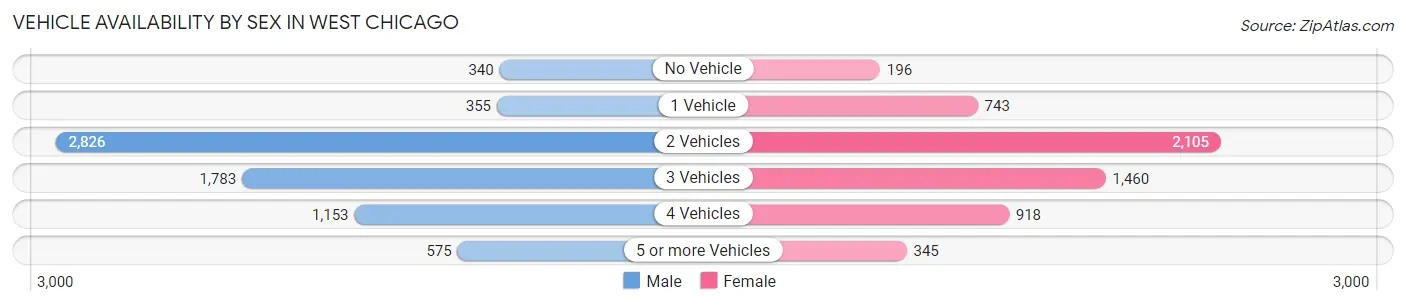
| Vehicles Available | Male | Female |
| No Vehicle | 340 (4.8%) | 196 (3.4%) |
| 1 Vehicle | 355 (5.1%) | 743 (12.9%) |
| 2 Vehicles | 2,826 (40.2%) | 2,105 (36.5%) |
| 3 Vehicles | 1,783 (25.4%) | 1,460 (25.3%) |
| 4 Vehicles | 1,153 (16.4%) | 918 (15.9%) |
| 5 or more Vehicles | 575 (8.2%) | 345 (6.0%) |
| Total | 7,032 (100.0%) | 5,767 (100.0%) |
Commute Time in West Chicago
The most frequently occuring commute durations in West Chicago are 15 to 19 minutes (2,126 commuters, 18.1%), 30 to 34 minutes (1,946 commuters, 16.6%), and 10 to 14 minutes (1,486 commuters, 12.7%).
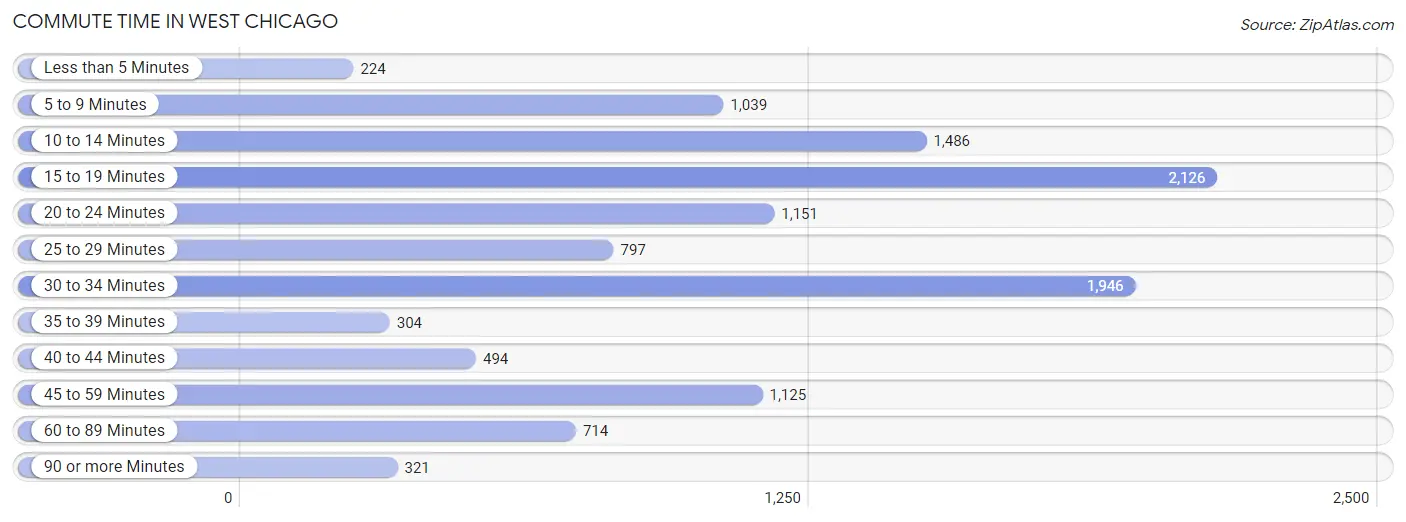
| Commute Time | # Commuters | % Commuters |
| Less than 5 Minutes | 224 | 1.9% |
| 5 to 9 Minutes | 1,039 | 8.9% |
| 10 to 14 Minutes | 1,486 | 12.7% |
| 15 to 19 Minutes | 2,126 | 18.1% |
| 20 to 24 Minutes | 1,151 | 9.8% |
| 25 to 29 Minutes | 797 | 6.8% |
| 30 to 34 Minutes | 1,946 | 16.6% |
| 35 to 39 Minutes | 304 | 2.6% |
| 40 to 44 Minutes | 494 | 4.2% |
| 45 to 59 Minutes | 1,125 | 9.6% |
| 60 to 89 Minutes | 714 | 6.1% |
| 90 or more Minutes | 321 | 2.7% |
Commute Time by Sex in West Chicago
The most common commute times in West Chicago are 15 to 19 minutes (1,235 commuters, 19.0%) for males and 15 to 19 minutes (891 commuters, 17.0%) for females.
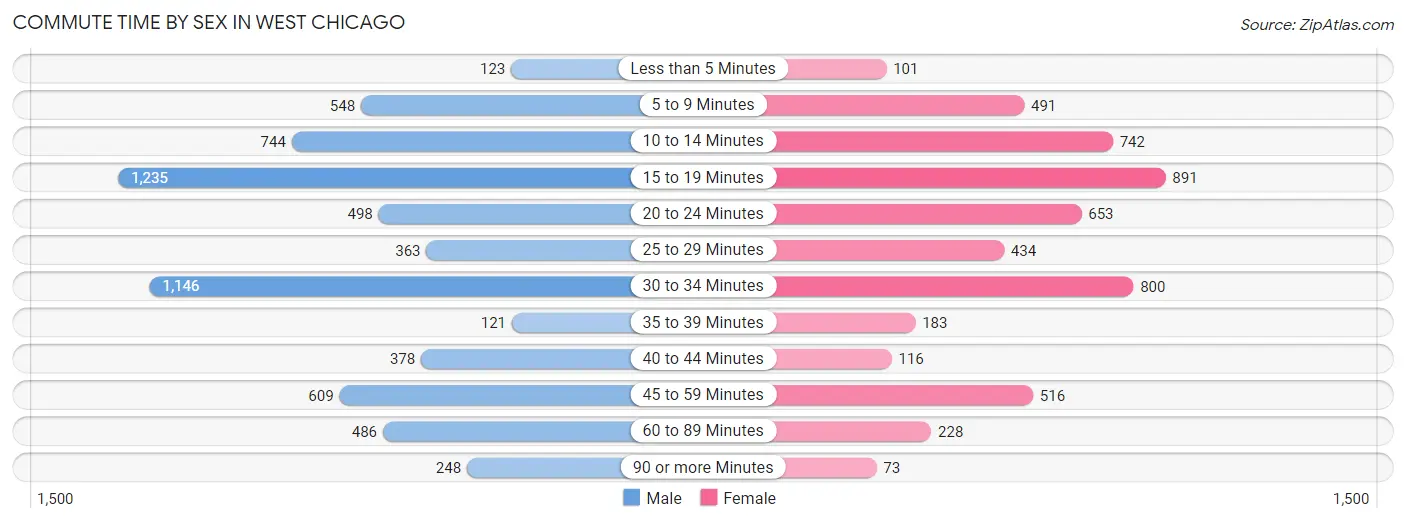
| Commute Time | Male | Female |
| Less than 5 Minutes | 123 (1.9%) | 101 (1.9%) |
| 5 to 9 Minutes | 548 (8.4%) | 491 (9.4%) |
| 10 to 14 Minutes | 744 (11.5%) | 742 (14.2%) |
| 15 to 19 Minutes | 1,235 (19.0%) | 891 (17.0%) |
| 20 to 24 Minutes | 498 (7.7%) | 653 (12.5%) |
| 25 to 29 Minutes | 363 (5.6%) | 434 (8.3%) |
| 30 to 34 Minutes | 1,146 (17.6%) | 800 (15.3%) |
| 35 to 39 Minutes | 121 (1.9%) | 183 (3.5%) |
| 40 to 44 Minutes | 378 (5.8%) | 116 (2.2%) |
| 45 to 59 Minutes | 609 (9.4%) | 516 (9.9%) |
| 60 to 89 Minutes | 486 (7.5%) | 228 (4.4%) |
| 90 or more Minutes | 248 (3.8%) | 73 (1.4%) |
Time of Departure to Work by Sex in West Chicago
The most frequent times of departure to work in West Chicago are 6:30 AM to 6:59 AM (720, 11.1%) for males and 7:00 AM to 7:29 AM (912, 17.4%) for females.
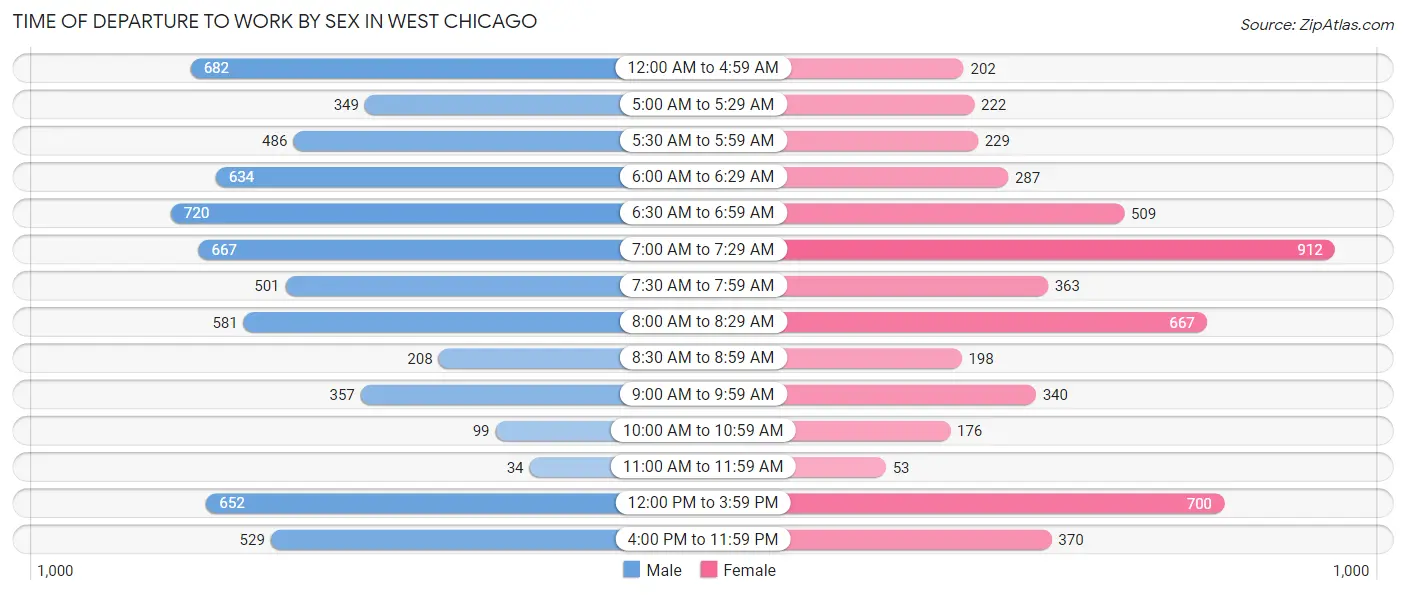
| Time of Departure | Male | Female |
| 12:00 AM to 4:59 AM | 682 (10.5%) | 202 (3.9%) |
| 5:00 AM to 5:29 AM | 349 (5.4%) | 222 (4.3%) |
| 5:30 AM to 5:59 AM | 486 (7.5%) | 229 (4.4%) |
| 6:00 AM to 6:29 AM | 634 (9.8%) | 287 (5.5%) |
| 6:30 AM to 6:59 AM | 720 (11.1%) | 509 (9.7%) |
| 7:00 AM to 7:29 AM | 667 (10.3%) | 912 (17.4%) |
| 7:30 AM to 7:59 AM | 501 (7.7%) | 363 (6.9%) |
| 8:00 AM to 8:29 AM | 581 (8.9%) | 667 (12.8%) |
| 8:30 AM to 8:59 AM | 208 (3.2%) | 198 (3.8%) |
| 9:00 AM to 9:59 AM | 357 (5.5%) | 340 (6.5%) |
| 10:00 AM to 10:59 AM | 99 (1.5%) | 176 (3.4%) |
| 11:00 AM to 11:59 AM | 34 (0.5%) | 53 (1.0%) |
| 12:00 PM to 3:59 PM | 652 (10.0%) | 700 (13.4%) |
| 4:00 PM to 11:59 PM | 529 (8.1%) | 370 (7.1%) |
| Total | 6,499 (100.0%) | 5,228 (100.0%) |
Housing Occupancy in West Chicago
Occupancy by Ownership in West Chicago
Of the total 7,380 dwellings in West Chicago, owner-occupied units account for 5,267 (71.4%), while renter-occupied units make up 2,113 (28.6%).
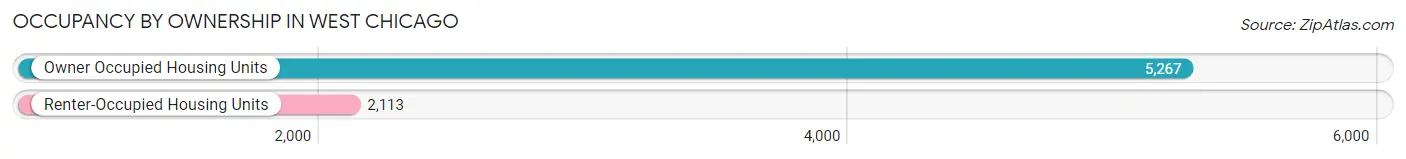
| Occupancy | # Housing Units | % Housing Units |
| Owner Occupied Housing Units | 5,267 | 71.4% |
| Renter-Occupied Housing Units | 2,113 | 28.6% |
| Total Occupied Housing Units | 7,380 | 100.0% |
Occupancy by Household Size in West Chicago
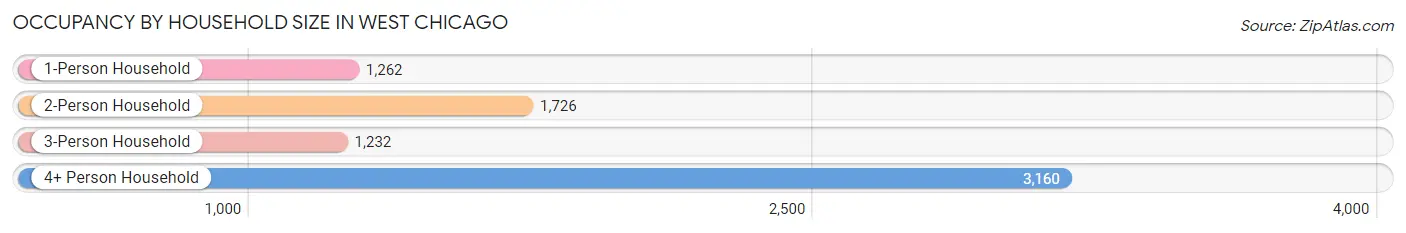
| Household Size | # Housing Units | % Housing Units |
| 1-Person Household | 1,262 | 17.1% |
| 2-Person Household | 1,726 | 23.4% |
| 3-Person Household | 1,232 | 16.7% |
| 4+ Person Household | 3,160 | 42.8% |
| Total Housing Units | 7,380 | 100.0% |
Occupancy by Ownership by Household Size in West Chicago
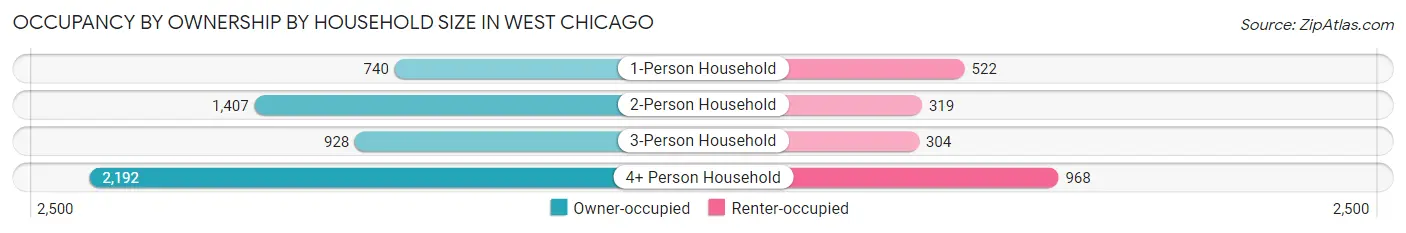
| Household Size | Owner-occupied | Renter-occupied |
| 1-Person Household | 740 (58.6%) | 522 (41.4%) |
| 2-Person Household | 1,407 (81.5%) | 319 (18.5%) |
| 3-Person Household | 928 (75.3%) | 304 (24.7%) |
| 4+ Person Household | 2,192 (69.4%) | 968 (30.6%) |
| Total Housing Units | 5,267 (71.4%) | 2,113 (28.6%) |
Occupancy by Educational Attainment in West Chicago
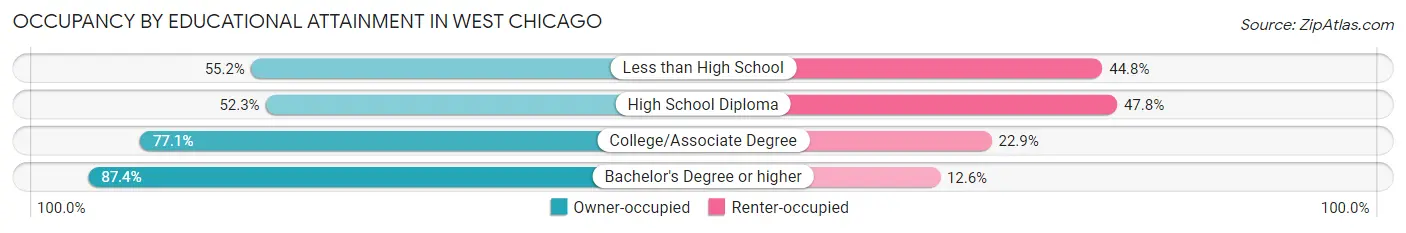
| Household Size | Owner-occupied | Renter-occupied |
| Less than High School | 704 (55.2%) | 572 (44.8%) |
| High School Diploma | 881 (52.2%) | 805 (47.7%) |
| College/Associate Degree | 1,338 (77.1%) | 397 (22.9%) |
| Bachelor's Degree or higher | 2,344 (87.4%) | 339 (12.6%) |
Occupancy by Age of Householder in West Chicago
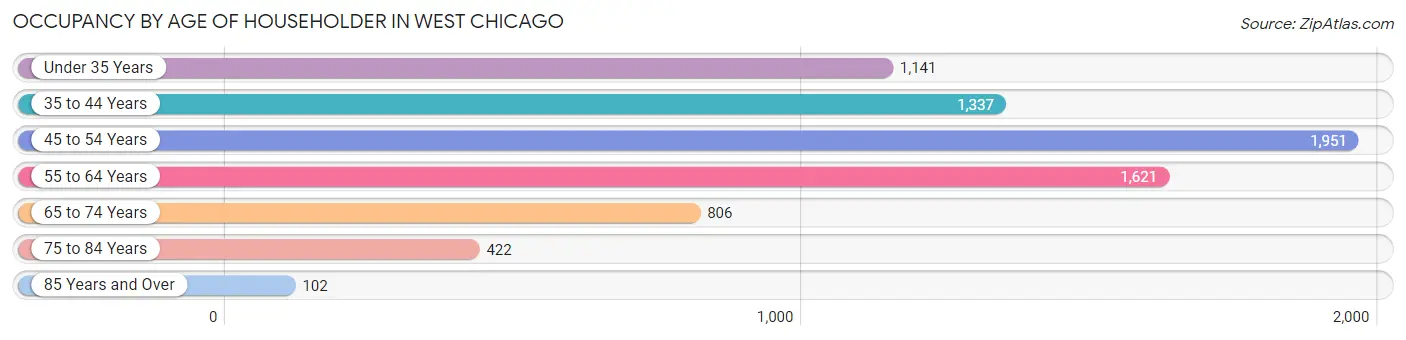
| Age Bracket | # Households | % Households |
| Under 35 Years | 1,141 | 15.5% |
| 35 to 44 Years | 1,337 | 18.1% |
| 45 to 54 Years | 1,951 | 26.4% |
| 55 to 64 Years | 1,621 | 22.0% |
| 65 to 74 Years | 806 | 10.9% |
| 75 to 84 Years | 422 | 5.7% |
| 85 Years and Over | 102 | 1.4% |
| Total | 7,380 | 100.0% |
Housing Finances in West Chicago
Median Income by Occupancy in West Chicago
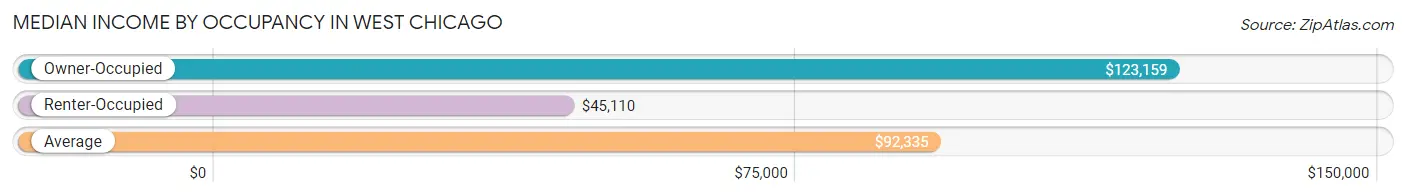
| Occupancy Type | # Households | Median Income |
| Owner-Occupied | 5,267 (71.4%) | $123,159 |
| Renter-Occupied | 2,113 (28.6%) | $45,110 |
| Average | 7,380 (100.0%) | $92,335 |
Occupancy by Householder Income Bracket in West Chicago
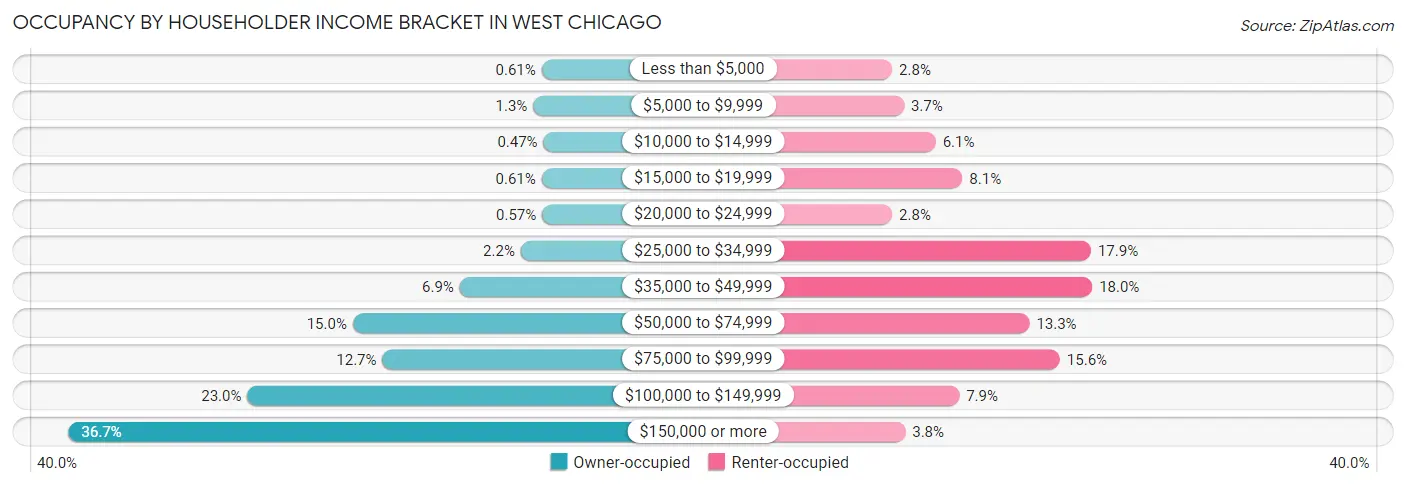
| Income Bracket | Owner-occupied | Renter-occupied |
| Less than $5,000 | 32 (0.6%) | 59 (2.8%) |
| $5,000 to $9,999 | 66 (1.3%) | 78 (3.7%) |
| $10,000 to $14,999 | 25 (0.5%) | 129 (6.1%) |
| $15,000 to $19,999 | 32 (0.6%) | 172 (8.1%) |
| $20,000 to $24,999 | 30 (0.6%) | 59 (2.8%) |
| $25,000 to $34,999 | 116 (2.2%) | 379 (17.9%) |
| $35,000 to $49,999 | 361 (6.9%) | 381 (18.0%) |
| $50,000 to $74,999 | 790 (15.0%) | 280 (13.3%) |
| $75,000 to $99,999 | 671 (12.7%) | 329 (15.6%) |
| $100,000 to $149,999 | 1,213 (23.0%) | 167 (7.9%) |
| $150,000 or more | 1,931 (36.7%) | 80 (3.8%) |
| Total | 5,267 (100.0%) | 2,113 (100.0%) |
Monthly Housing Cost Tiers in West Chicago
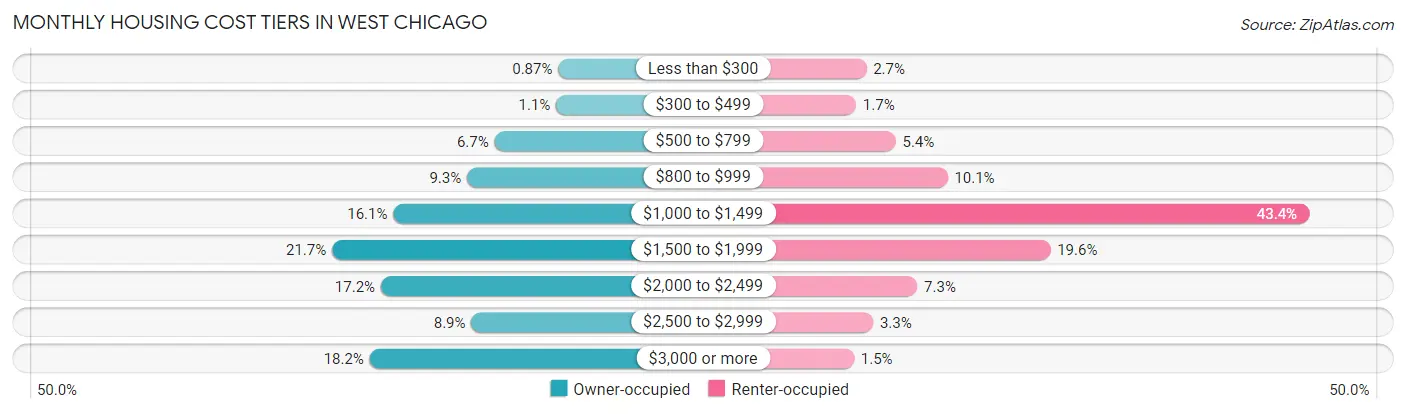
| Monthly Cost | Owner-occupied | Renter-occupied |
| Less than $300 | 46 (0.9%) | 56 (2.6%) |
| $300 to $499 | 56 (1.1%) | 36 (1.7%) |
| $500 to $799 | 355 (6.7%) | 113 (5.3%) |
| $800 to $999 | 488 (9.3%) | 214 (10.1%) |
| $1,000 to $1,499 | 846 (16.1%) | 917 (43.4%) |
| $1,500 to $1,999 | 1,143 (21.7%) | 414 (19.6%) |
| $2,000 to $2,499 | 906 (17.2%) | 155 (7.3%) |
| $2,500 to $2,999 | 467 (8.9%) | 69 (3.3%) |
| $3,000 or more | 960 (18.2%) | 32 (1.5%) |
| Total | 5,267 (100.0%) | 2,113 (100.0%) |
Physical Housing Characteristics in West Chicago
Housing Structures in West Chicago
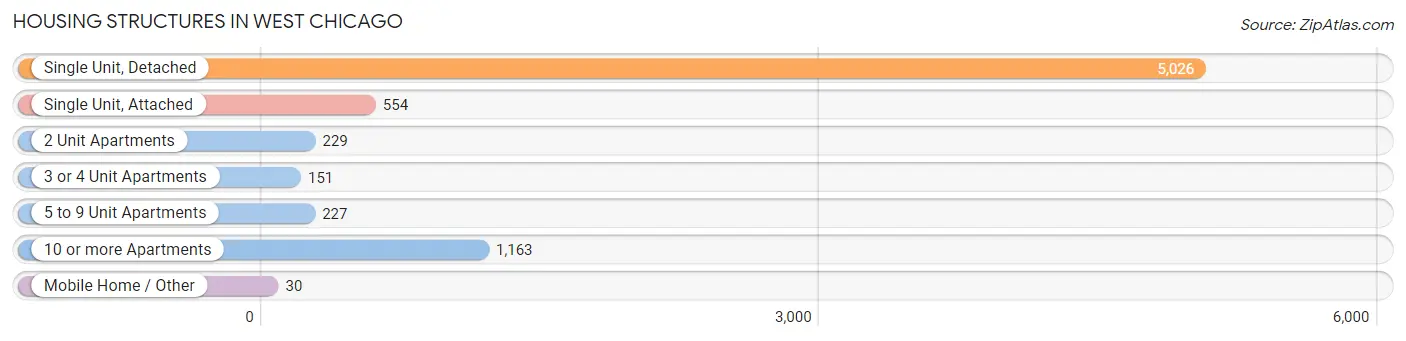
| Structure Type | # Housing Units | % Housing Units |
| Single Unit, Detached | 5,026 | 68.1% |
| Single Unit, Attached | 554 | 7.5% |
| 2 Unit Apartments | 229 | 3.1% |
| 3 or 4 Unit Apartments | 151 | 2.1% |
| 5 to 9 Unit Apartments | 227 | 3.1% |
| 10 or more Apartments | 1,163 | 15.8% |
| Mobile Home / Other | 30 | 0.4% |
| Total | 7,380 | 100.0% |
Housing Structures by Occupancy in West Chicago
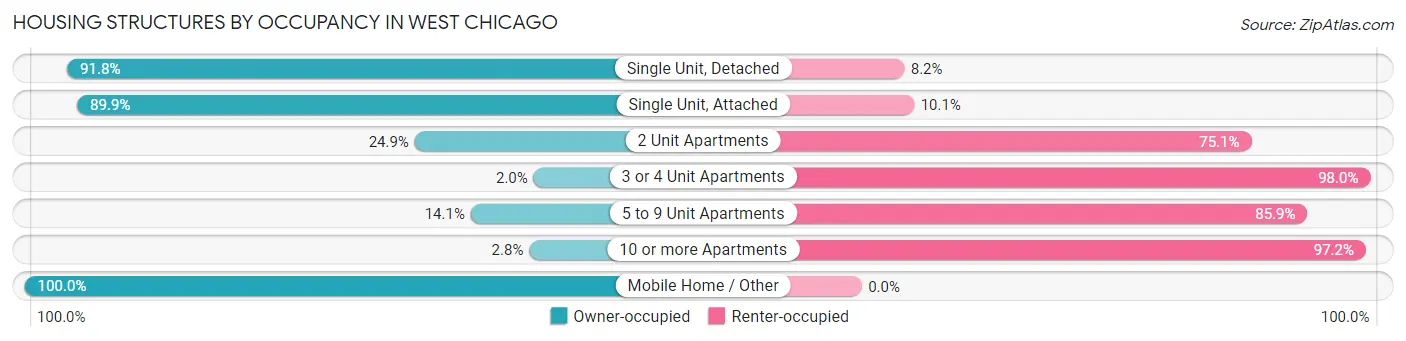
| Structure Type | Owner-occupied | Renter-occupied |
| Single Unit, Detached | 4,614 (91.8%) | 412 (8.2%) |
| Single Unit, Attached | 498 (89.9%) | 56 (10.1%) |
| 2 Unit Apartments | 57 (24.9%) | 172 (75.1%) |
| 3 or 4 Unit Apartments | 3 (2.0%) | 148 (98.0%) |
| 5 to 9 Unit Apartments | 32 (14.1%) | 195 (85.9%) |
| 10 or more Apartments | 33 (2.8%) | 1,130 (97.2%) |
| Mobile Home / Other | 30 (100.0%) | 0 (0.0%) |
| Total | 5,267 (71.4%) | 2,113 (28.6%) |
Housing Structures by Number of Rooms in West Chicago
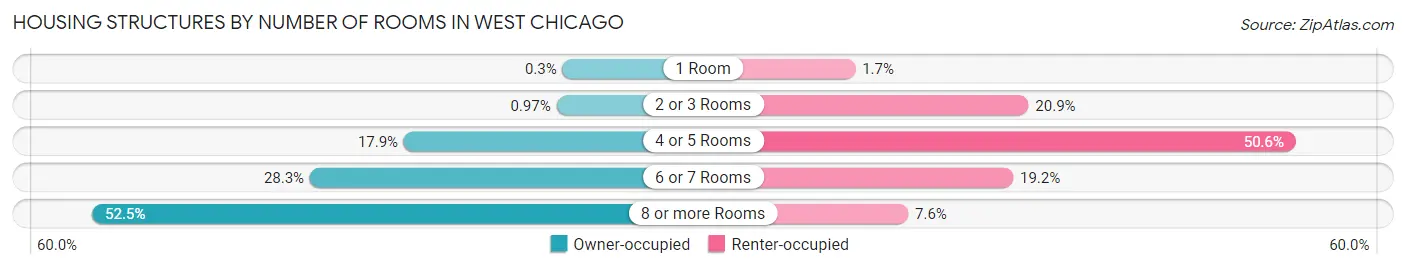
| Number of Rooms | Owner-occupied | Renter-occupied |
| 1 Room | 16 (0.3%) | 36 (1.7%) |
| 2 or 3 Rooms | 51 (1.0%) | 442 (20.9%) |
| 4 or 5 Rooms | 943 (17.9%) | 1,069 (50.6%) |
| 6 or 7 Rooms | 1,492 (28.3%) | 406 (19.2%) |
| 8 or more Rooms | 2,765 (52.5%) | 160 (7.6%) |
| Total | 5,267 (100.0%) | 2,113 (100.0%) |
Housing Structure by Heating Type in West Chicago
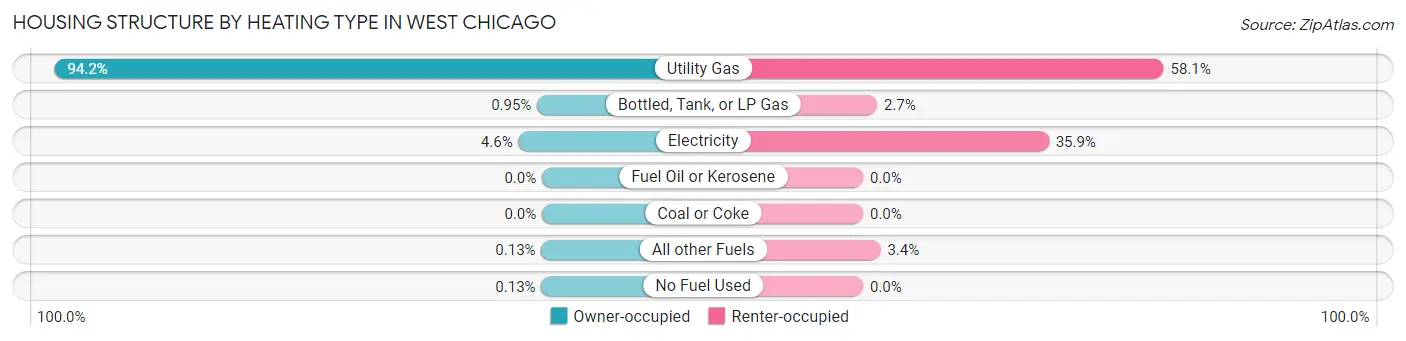
| Heating Type | Owner-occupied | Renter-occupied |
| Utility Gas | 4,963 (94.2%) | 1,227 (58.1%) |
| Bottled, Tank, or LP Gas | 50 (0.9%) | 57 (2.7%) |
| Electricity | 240 (4.6%) | 758 (35.9%) |
| Fuel Oil or Kerosene | 0 (0.0%) | 0 (0.0%) |
| Coal or Coke | 0 (0.0%) | 0 (0.0%) |
| All other Fuels | 7 (0.1%) | 71 (3.4%) |
| No Fuel Used | 7 (0.1%) | 0 (0.0%) |
| Total | 5,267 (100.0%) | 2,113 (100.0%) |
Household Vehicle Usage in West Chicago
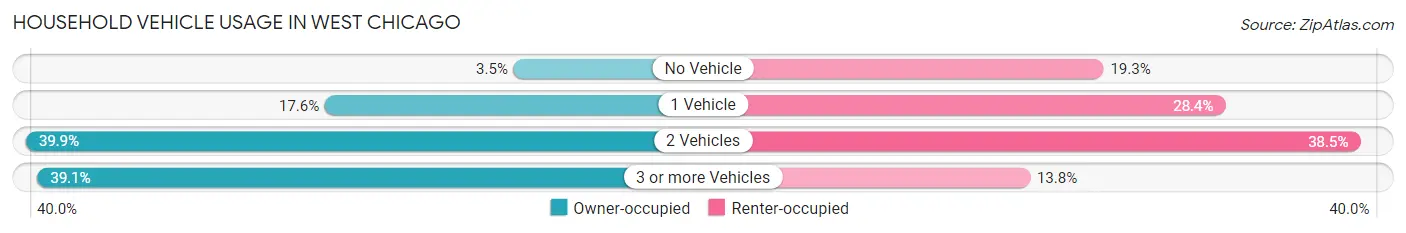
| Vehicles per Household | Owner-occupied | Renter-occupied |
| No Vehicle | 183 (3.5%) | 408 (19.3%) |
| 1 Vehicle | 925 (17.6%) | 600 (28.4%) |
| 2 Vehicles | 2,102 (39.9%) | 813 (38.5%) |
| 3 or more Vehicles | 2,057 (39.1%) | 292 (13.8%) |
| Total | 5,267 (100.0%) | 2,113 (100.0%) |
Real Estate & Mortgages in West Chicago
Real Estate and Mortgage Overview in West Chicago
| Characteristic | Without Mortgage | With Mortgage |
| Housing Units | 1,620 | 3,647 |
| Median Property Value | $250,400 | $312,000 |
| Median Household Income | $97,232 | $1,444 |
| Monthly Housing Costs | $984 | $960 |
| Real Estate Taxes | $7,170 | $48 |
Property Value by Mortgage Status in West Chicago
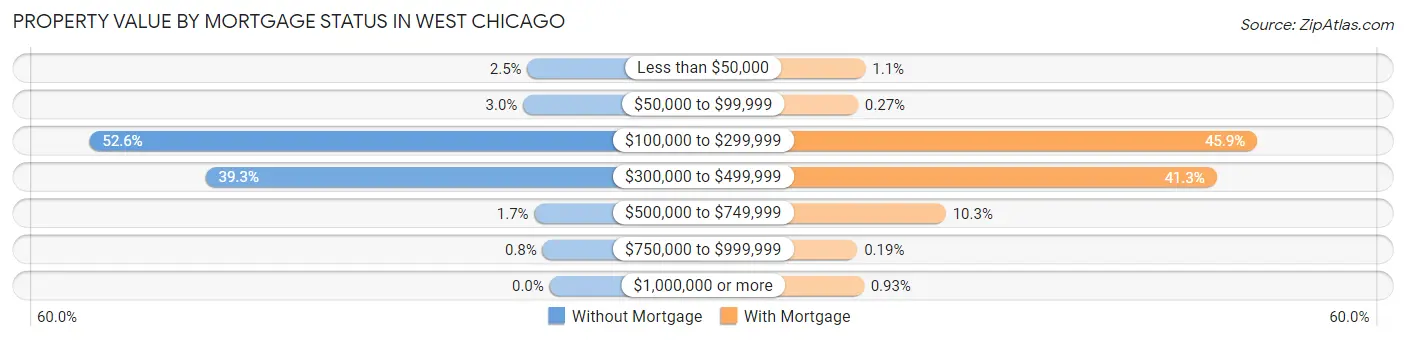
| Property Value | Without Mortgage | With Mortgage |
| Less than $50,000 | 41 (2.5%) | 41 (1.1%) |
| $50,000 to $99,999 | 49 (3.0%) | 10 (0.3%) |
| $100,000 to $299,999 | 852 (52.6%) | 1,674 (45.9%) |
| $300,000 to $499,999 | 637 (39.3%) | 1,505 (41.3%) |
| $500,000 to $749,999 | 28 (1.7%) | 376 (10.3%) |
| $750,000 to $999,999 | 13 (0.8%) | 7 (0.2%) |
| $1,000,000 or more | 0 (0.0%) | 34 (0.9%) |
| Total | 1,620 (100.0%) | 3,647 (100.0%) |
Household Income by Mortgage Status in West Chicago
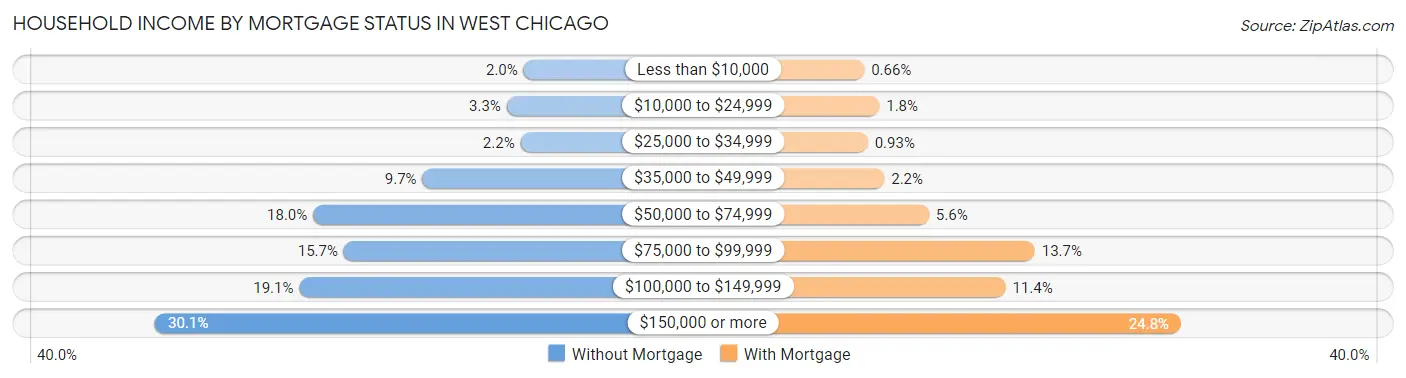
| Household Income | Without Mortgage | With Mortgage |
| Less than $10,000 | 32 (2.0%) | 24 (0.7%) |
| $10,000 to $24,999 | 53 (3.3%) | 66 (1.8%) |
| $25,000 to $34,999 | 36 (2.2%) | 34 (0.9%) |
| $35,000 to $49,999 | 157 (9.7%) | 80 (2.2%) |
| $50,000 to $74,999 | 292 (18.0%) | 204 (5.6%) |
| $75,000 to $99,999 | 254 (15.7%) | 498 (13.7%) |
| $100,000 to $149,999 | 309 (19.1%) | 417 (11.4%) |
| $150,000 or more | 487 (30.1%) | 904 (24.8%) |
| Total | 1,620 (100.0%) | 3,647 (100.0%) |
Property Value to Household Income Ratio in West Chicago
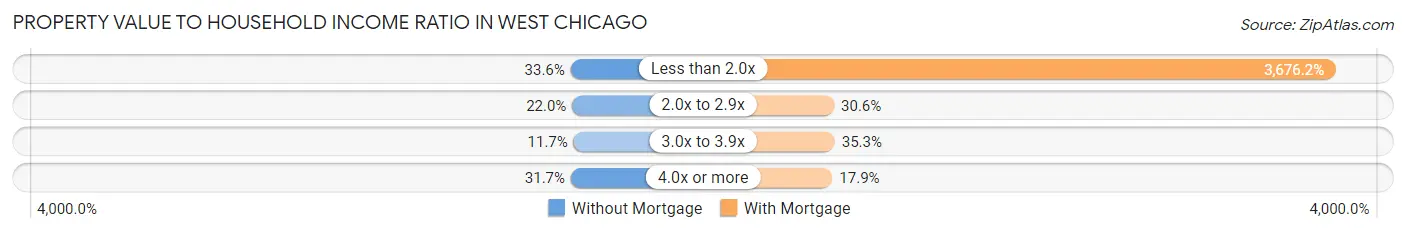
| Value-to-Income Ratio | Without Mortgage | With Mortgage |
| Less than 2.0x | 544 (33.6%) | 134,071 (3,676.2%) |
| 2.0x to 2.9x | 357 (22.0%) | 1,116 (30.6%) |
| 3.0x to 3.9x | 189 (11.7%) | 1,287 (35.3%) |
| 4.0x or more | 514 (31.7%) | 652 (17.9%) |
| Total | 1,620 (100.0%) | 3,647 (100.0%) |
Real Estate Taxes by Mortgage Status in West Chicago

| Property Taxes | Without Mortgage | With Mortgage |
| Less than $800 | 4 (0.3%) | 10 (0.3%) |
| $800 to $1,499 | 84 (5.2%) | 31 (0.9%) |
| $800 to $1,499 | 1,496 (92.3%) | 13 (0.4%) |
| Total | 1,620 (100.0%) | 3,647 (100.0%) |
Health & Disability in West Chicago
Health Insurance Coverage by Age in West Chicago
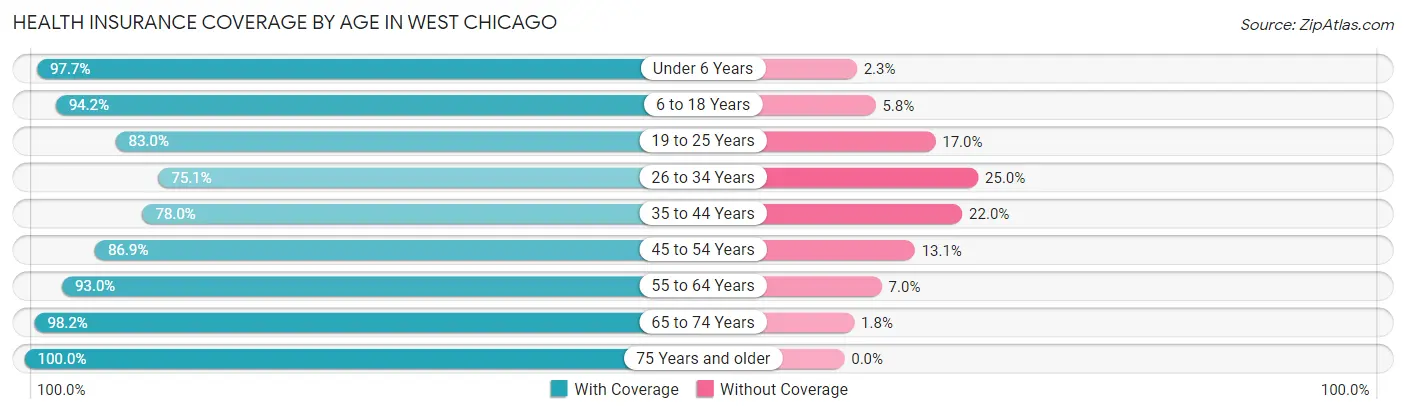
| Age Bracket | With Coverage | Without Coverage |
| Under 6 Years | 1,559 (97.7%) | 37 (2.3%) |
| 6 to 18 Years | 5,169 (94.2%) | 319 (5.8%) |
| 19 to 25 Years | 2,314 (83.0%) | 473 (17.0%) |
| 26 to 34 Years | 1,979 (75.0%) | 658 (24.9%) |
| 35 to 44 Years | 2,531 (78.0%) | 713 (22.0%) |
| 45 to 54 Years | 3,487 (86.9%) | 527 (13.1%) |
| 55 to 64 Years | 2,965 (93.0%) | 222 (7.0%) |
| 65 to 74 Years | 1,441 (98.2%) | 27 (1.8%) |
| 75 Years and older | 853 (100.0%) | 0 (0.0%) |
| Total | 22,298 (88.2%) | 2,976 (11.8%) |
Health Insurance Coverage by Citizenship Status in West Chicago

| Citizenship Status | With Coverage | Without Coverage |
| Native Born | 1,559 (97.7%) | 37 (2.3%) |
| Foreign Born, Citizen | 5,169 (94.2%) | 319 (5.8%) |
| Foreign Born, not a Citizen | 2,314 (83.0%) | 473 (17.0%) |
Health Insurance Coverage by Household Income in West Chicago
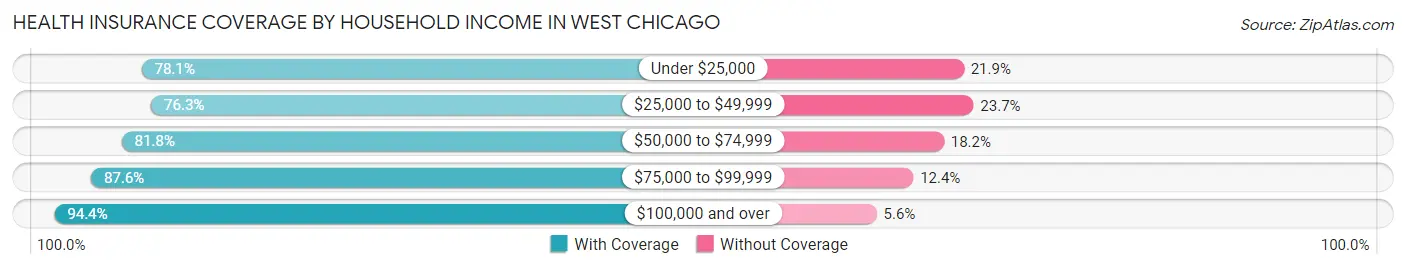
| Household Income | With Coverage | Without Coverage |
| Under $25,000 | 1,490 (78.1%) | 418 (21.9%) |
| $25,000 to $49,999 | 2,547 (76.3%) | 792 (23.7%) |
| $50,000 to $74,999 | 2,518 (81.8%) | 559 (18.2%) |
| $75,000 to $99,999 | 3,328 (87.6%) | 473 (12.4%) |
| $100,000 and over | 12,401 (94.4%) | 733 (5.6%) |
Public vs Private Health Insurance Coverage by Age in West Chicago
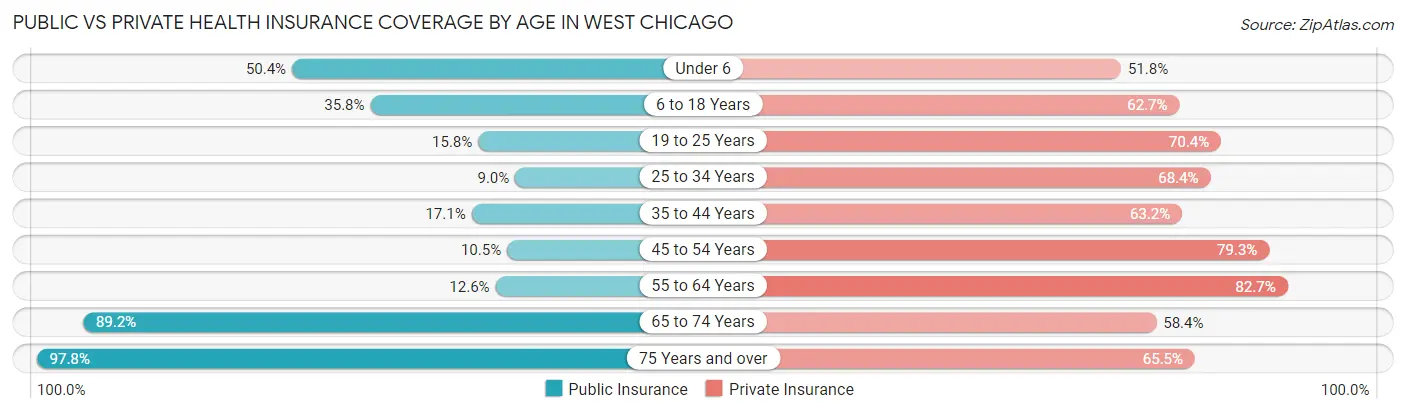
| Age Bracket | Public Insurance | Private Insurance |
| Under 6 | 804 (50.4%) | 827 (51.8%) |
| 6 to 18 Years | 1,966 (35.8%) | 3,438 (62.6%) |
| 19 to 25 Years | 441 (15.8%) | 1,962 (70.4%) |
| 25 to 34 Years | 236 (8.9%) | 1,804 (68.4%) |
| 35 to 44 Years | 553 (17.1%) | 2,049 (63.2%) |
| 45 to 54 Years | 420 (10.5%) | 3,184 (79.3%) |
| 55 to 64 Years | 402 (12.6%) | 2,637 (82.7%) |
| 65 to 74 Years | 1,309 (89.2%) | 857 (58.4%) |
| 75 Years and over | 834 (97.8%) | 559 (65.5%) |
| Total | 6,965 (27.6%) | 17,317 (68.5%) |
Disability Status by Sex by Age in West Chicago
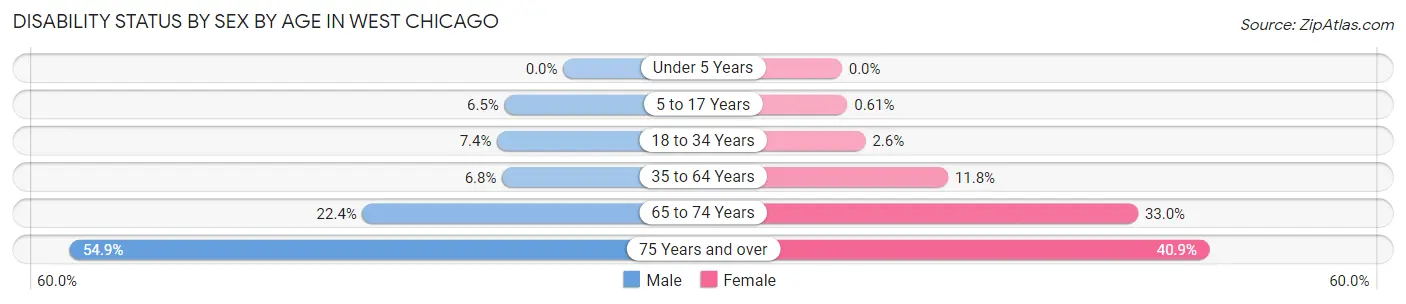
| Age Bracket | Male | Female |
| Under 5 Years | 0 (0.0%) | 0 (0.0%) |
| 5 to 17 Years | 180 (6.5%) | 16 (0.6%) |
| 18 to 34 Years | 219 (7.4%) | 77 (2.6%) |
| 35 to 64 Years | 363 (6.8%) | 604 (11.8%) |
| 65 to 74 Years | 158 (22.4%) | 251 (33.0%) |
| 75 Years and over | 267 (54.9%) | 150 (40.9%) |
Disability Class by Sex by Age in West Chicago
Disability Class: Hearing Difficulty
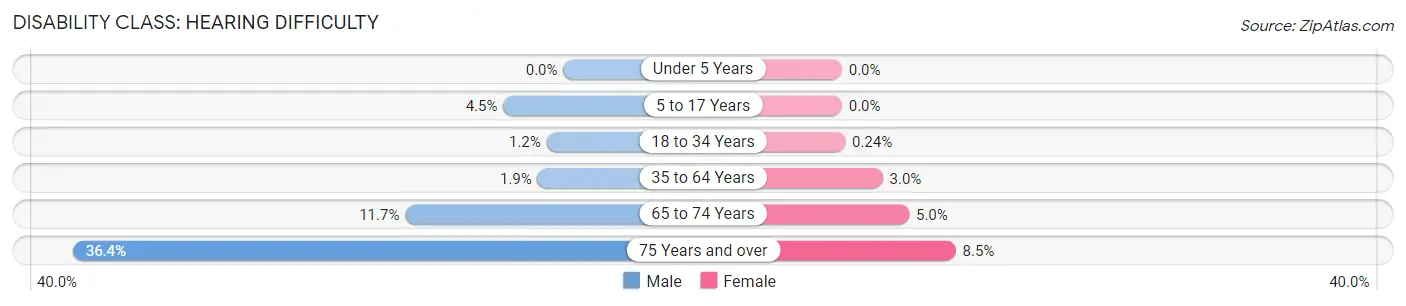
| Age Bracket | Male | Female |
| Under 5 Years | 0 (0.0%) | 0 (0.0%) |
| 5 to 17 Years | 123 (4.5%) | 0 (0.0%) |
| 18 to 34 Years | 37 (1.2%) | 7 (0.2%) |
| 35 to 64 Years | 102 (1.9%) | 155 (3.0%) |
| 65 to 74 Years | 83 (11.7%) | 38 (5.0%) |
| 75 Years and over | 177 (36.4%) | 31 (8.5%) |
Disability Class: Vision Difficulty
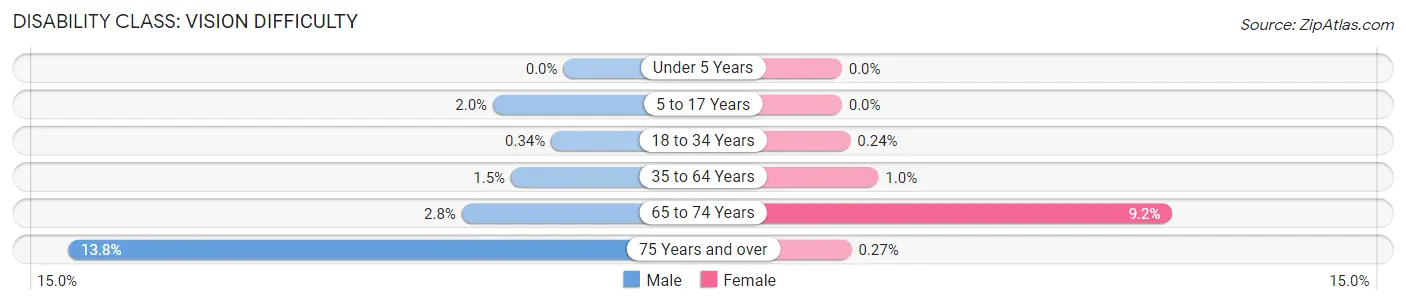
| Age Bracket | Male | Female |
| Under 5 Years | 0 (0.0%) | 0 (0.0%) |
| 5 to 17 Years | 54 (2.0%) | 0 (0.0%) |
| 18 to 34 Years | 10 (0.3%) | 7 (0.2%) |
| 35 to 64 Years | 78 (1.5%) | 52 (1.0%) |
| 65 to 74 Years | 20 (2.8%) | 70 (9.2%) |
| 75 Years and over | 67 (13.8%) | 1 (0.3%) |
Disability Class: Cognitive Difficulty
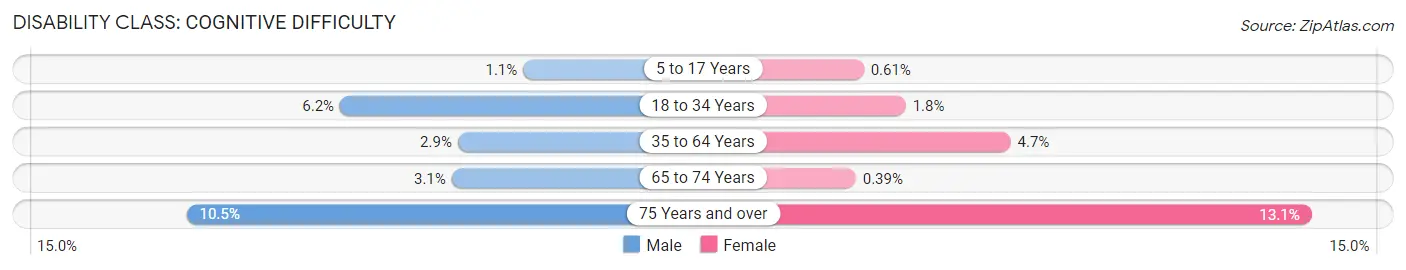
| Age Bracket | Male | Female |
| 5 to 17 Years | 31 (1.1%) | 16 (0.6%) |
| 18 to 34 Years | 185 (6.2%) | 52 (1.8%) |
| 35 to 64 Years | 157 (2.9%) | 240 (4.7%) |
| 65 to 74 Years | 22 (3.1%) | 3 (0.4%) |
| 75 Years and over | 51 (10.5%) | 48 (13.1%) |
Disability Class: Ambulatory Difficulty
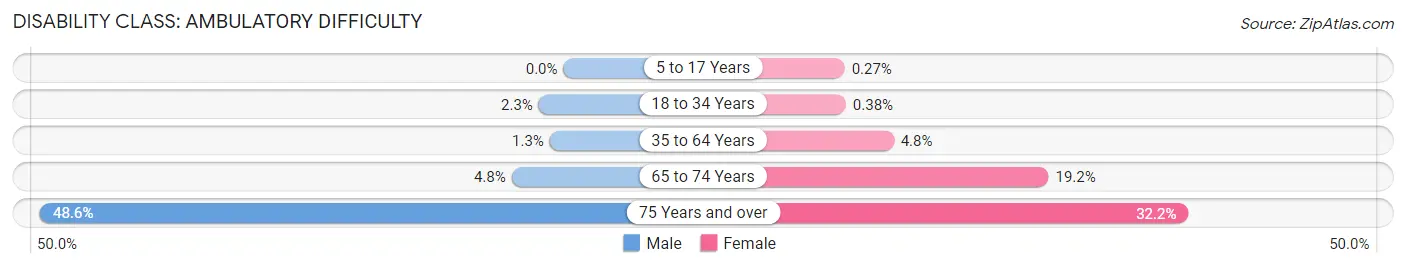
| Age Bracket | Male | Female |
| 5 to 17 Years | 0 (0.0%) | 7 (0.3%) |
| 18 to 34 Years | 68 (2.3%) | 11 (0.4%) |
| 35 to 64 Years | 68 (1.3%) | 246 (4.8%) |
| 65 to 74 Years | 34 (4.8%) | 146 (19.2%) |
| 75 Years and over | 236 (48.6%) | 118 (32.2%) |
Disability Class: Self-Care Difficulty
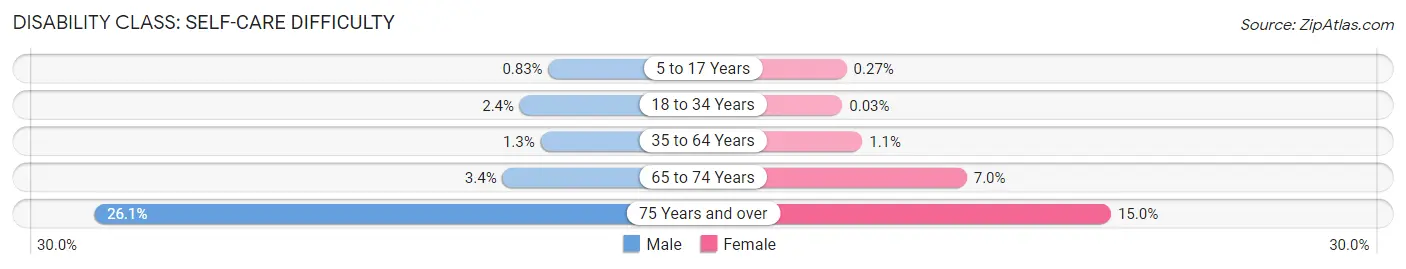
| Age Bracket | Male | Female |
| 5 to 17 Years | 23 (0.8%) | 7 (0.3%) |
| 18 to 34 Years | 72 (2.4%) | 1 (0.0%) |
| 35 to 64 Years | 68 (1.3%) | 58 (1.1%) |
| 65 to 74 Years | 24 (3.4%) | 53 (7.0%) |
| 75 Years and over | 127 (26.1%) | 55 (15.0%) |
Technology Access in West Chicago
Computing Device Access in West Chicago
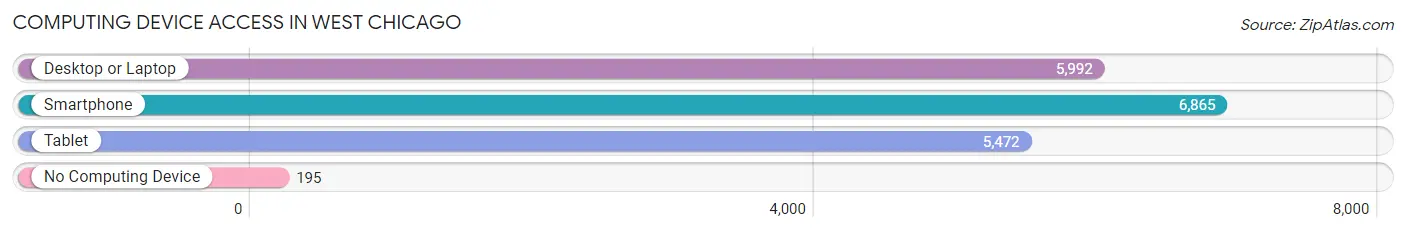
| Device Type | # Households | % Households |
| Desktop or Laptop | 5,992 | 81.2% |
| Smartphone | 6,865 | 93.0% |
| Tablet | 5,472 | 74.2% |
| No Computing Device | 195 | 2.6% |
| Total | 7,380 | 100.0% |
Internet Access in West Chicago
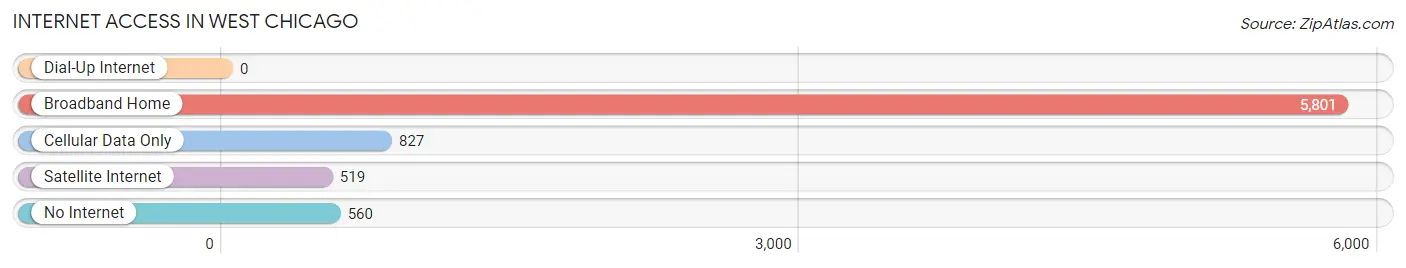
| Internet Type | # Households | % Households |
| Dial-Up Internet | 0 | 0.0% |
| Broadband Home | 5,801 | 78.6% |
| Cellular Data Only | 827 | 11.2% |
| Satellite Internet | 519 | 7.0% |
| No Internet | 560 | 7.6% |
| Total | 7,380 | 100.0% |
West Chicago Summary
History
West Chicago, Illinois is a city located in DuPage County, approximately 35 miles west of Chicago. The city was first settled in 1833 by a group of German immigrants, and was originally known as Turner. The city was renamed West Chicago in 1897, and was officially incorporated in 1902.
The city of West Chicago has a rich history of industry and manufacturing. In the late 19th century, the city was home to several factories, including the Western Wheeled Scraper Company, which manufactured road-building equipment. The city was also home to the West Chicago Street Railway Company, which provided transportation services to the city.
In the early 20th century, the city was home to several large manufacturing companies, including the West Chicago Steel Company, which produced steel products for the railroad industry. The city was also home to the West Chicago Brick Company, which produced bricks for the construction industry.
The city of West Chicago has also been home to several notable people, including former U.S. President Ronald Reagan, who was born in the city in 1911.
Geography
West Chicago is located in DuPage County, approximately 35 miles west of Chicago. The city is situated on the western edge of the Chicago metropolitan area, and is bordered by the cities of Winfield, Warrenville, and Wheaton.
The city of West Chicago covers an area of 8.3 square miles, and has a population of approximately 28,000 people. The city is located at an elevation of 690 feet above sea level.
The city of West Chicago is located in a region of rolling hills and prairies. The city is located on the Fox River, and is home to several parks and recreational areas, including the West Chicago Prairie Nature Preserve.
Economy
The economy of West Chicago is largely based on manufacturing and industry. The city is home to several large manufacturing companies, including the West Chicago Steel Company, which produces steel products for the railroad industry. The city is also home to several other manufacturing companies, including the West Chicago Brick Company, which produces bricks for the construction industry.
The city of West Chicago is also home to several large retail stores, including Walmart, Target, and Kohl’s. The city is also home to several restaurants, bars, and other businesses.
Demographics
As of the 2010 census, the population of West Chicago was 28,086. The racial makeup of the city was 79.3% White, 8.2% African American, 0.3% Native American, 5.2% Asian, and 6.9% from other races. Hispanic or Latino of any race were 22.2% of the population.
The median household income in West Chicago was $60,945, and the median family income was $71,945. The per capita income in West Chicago was $27,945. Approximately 8.2% of the population was below the poverty line.
Common Questions
What is Per Capita Income in West Chicago?
Per Capita income in West Chicago is $36,092.
What is the Median Family Income in West Chicago?
Median Family Income in West Chicago is $106,534.
What is the Median Household income in West Chicago?
Median Household Income in West Chicago is $92,335.
What is Income or Wage Gap in West Chicago?
Income or Wage Gap in West Chicago is 24.2%.
Women in West Chicago earn 75.8 cents for every dollar earned by a man.
What is Inequality or Gini Index in West Chicago?
Inequality or Gini Index in West Chicago is 0.43.
What is the Total Population of West Chicago?
Total Population of West Chicago is 25,632.
What is the Total Male Population of West Chicago?
Total Male Population of West Chicago is 12,970.
What is the Total Female Population of West Chicago?
Total Female Population of West Chicago is 12,662.
What is the Ratio of Males per 100 Females in West Chicago?
There are 102.43 Males per 100 Females in West Chicago.
What is the Ratio of Females per 100 Males in West Chicago?
There are 97.63 Females per 100 Males in West Chicago.
What is the Median Population Age in West Chicago?
Median Population Age in West Chicago is 35.8 Years.
What is the Average Family Size in West Chicago
Average Family Size in West Chicago is 3.8 People.
What is the Average Household Size in West Chicago
Average Household Size in West Chicago is 3.4 People.
How Large is the Labor Force in West Chicago?
There are 14,641 People in the Labor Forcein in West Chicago.
What is the Percentage of People in the Labor Force in West Chicago?
72.5% of People are in the Labor Force in West Chicago.
What is the Unemployment Rate in West Chicago?
Unemployment Rate in West Chicago is 10.4%.