Montgomery, IL Map & Demographics
Montgomery Map
Montgomery Overview
$34,600
PER CAPITA INCOME
$109,154
AVG FAMILY INCOME
$105,240
AVG HOUSEHOLD INCOME
28.7%
WAGE / INCOME GAP [ % ]
71.3¢/ $1
WAGE / INCOME GAP [ $ ]
0.32
INEQUALITY / GINI INDEX
20,644
TOTAL POPULATION
11,194
MALE POPULATION
9,450
FEMALE POPULATION
118.46
MALES / 100 FEMALES
84.42
FEMALES / 100 MALES
31.7
MEDIAN AGE
3.5
AVG FAMILY SIZE
3.1
AVG HOUSEHOLD SIZE
11,728
LABOR FORCE [ PEOPLE ]
75.7%
PERCENT IN LABOR FORCE
5.5%
UNEMPLOYMENT RATE
Montgomery Zip Codes
Income in Montgomery
Income Overview in Montgomery
Per Capita Income in Montgomery is $34,600, while median incomes of families and households are $109,154 and $105,240 respectively.
| Characteristic | Number | Measure |
| Per Capita Income | 20,644 | $34,600 |
| Median Family Income | 4,965 | $109,154 |
| Mean Family Income | 4,965 | $117,034 |
| Median Household Income | 6,619 | $105,240 |
| Mean Household Income | 6,619 | $109,098 |
| Income Deficit | 4,965 | $0 |
| Wage / Income Gap (%) | 20,644 | 28.68% |
| Wage / Income Gap ($) | 20,644 | 71.32¢ per $1 |
| Gini / Inequality Index | 20,644 | 0.32 |
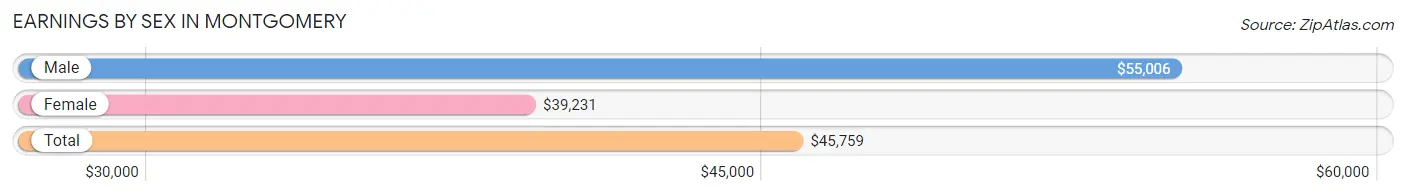
Earnings by Sex in Montgomery
Average Earnings in Montgomery are $45,759, $55,006 for men and $39,231 for women, a difference of 28.7%.
| Sex | Number | Average Earnings |
| Male | 6,527 (55.4%) | $55,006 |
| Female | 5,248 (44.6%) | $39,231 |
| Total | 11,775 (100.0%) | $45,759 |
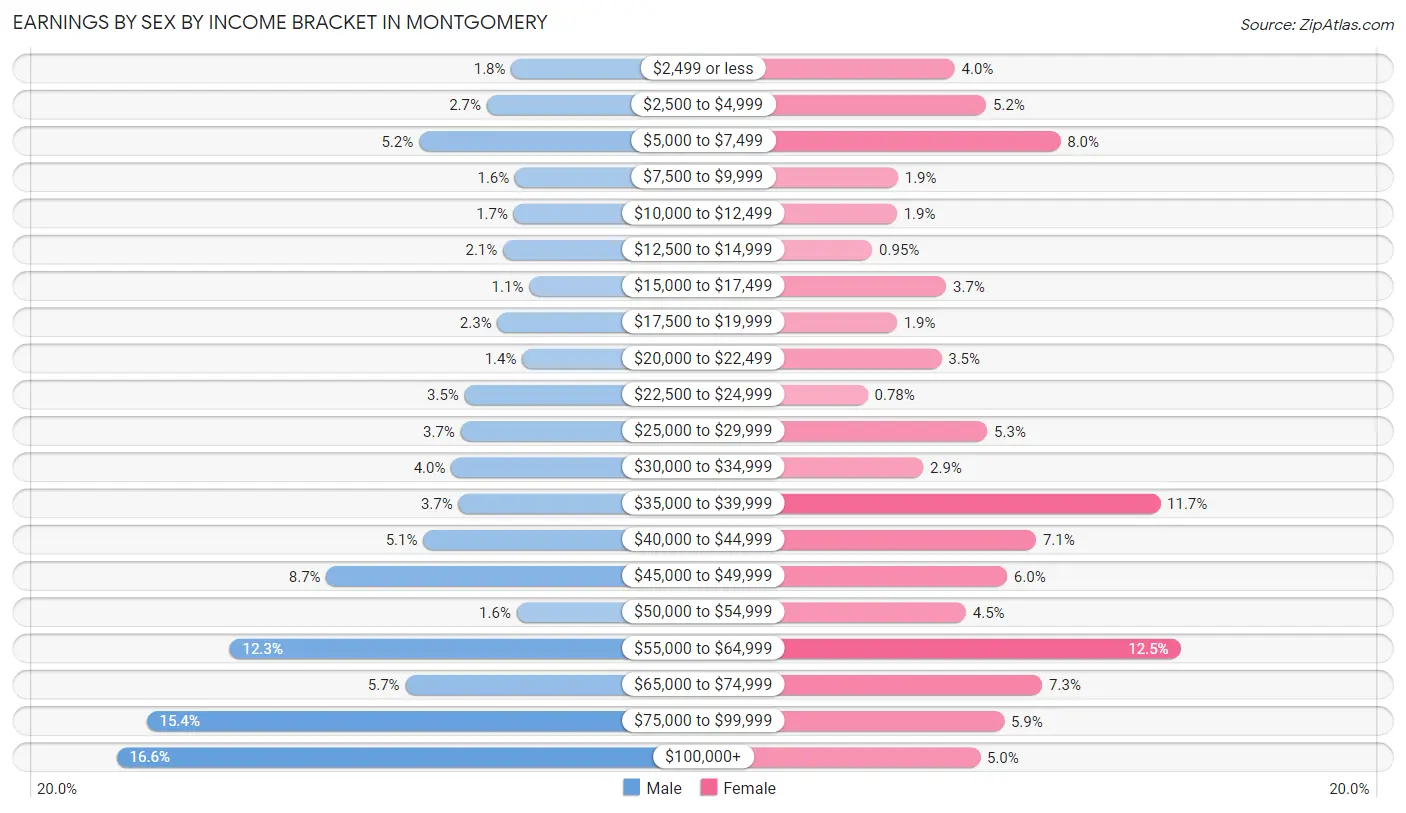
Earnings by Sex by Income Bracket in Montgomery
The most common earnings brackets in Montgomery are $100,000+ for men (1,080 | 16.6%) and $55,000 to $64,999 for women (656 | 12.5%).
| Income | Male | Female |
| $2,499 or less | 115 (1.8%) | 212 (4.0%) |
| $2,500 to $4,999 | 175 (2.7%) | 274 (5.2%) |
| $5,000 to $7,499 | 341 (5.2%) | 420 (8.0%) |
| $7,500 to $9,999 | 106 (1.6%) | 100 (1.9%) |
| $10,000 to $12,499 | 109 (1.7%) | 98 (1.9%) |
| $12,500 to $14,999 | 135 (2.1%) | 50 (0.9%) |
| $15,000 to $17,499 | 71 (1.1%) | 195 (3.7%) |
| $17,500 to $19,999 | 149 (2.3%) | 98 (1.9%) |
| $20,000 to $22,499 | 88 (1.3%) | 186 (3.5%) |
| $22,500 to $24,999 | 229 (3.5%) | 41 (0.8%) |
| $25,000 to $29,999 | 239 (3.7%) | 276 (5.3%) |
| $30,000 to $34,999 | 262 (4.0%) | 150 (2.9%) |
| $35,000 to $39,999 | 244 (3.7%) | 616 (11.7%) |
| $40,000 to $44,999 | 330 (5.1%) | 372 (7.1%) |
| $45,000 to $49,999 | 567 (8.7%) | 315 (6.0%) |
| $50,000 to $54,999 | 102 (1.6%) | 234 (4.5%) |
| $55,000 to $64,999 | 804 (12.3%) | 656 (12.5%) |
| $65,000 to $74,999 | 374 (5.7%) | 384 (7.3%) |
| $75,000 to $99,999 | 1,007 (15.4%) | 309 (5.9%) |
| $100,000+ | 1,080 (16.6%) | 262 (5.0%) |
| Total | 6,527 (100.0%) | 5,248 (100.0%) |
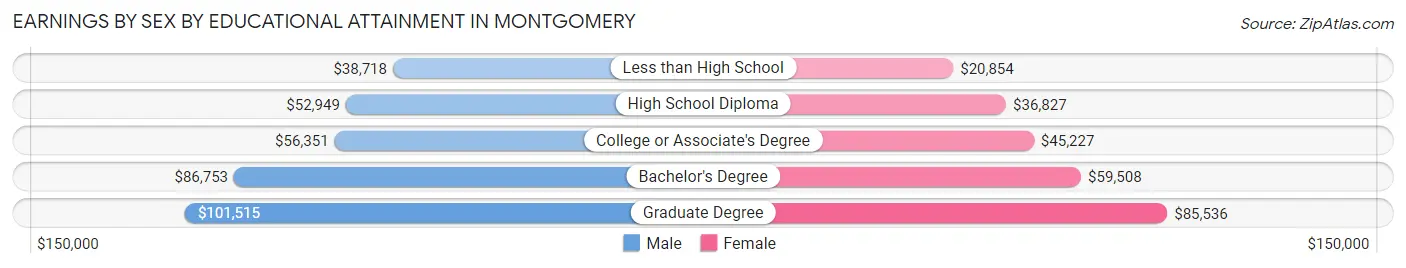
Earnings by Sex by Educational Attainment in Montgomery
Average earnings in Montgomery are $59,265 for men and $44,146 for women, a difference of 25.5%. Men with an educational attainment of graduate degree enjoy the highest average annual earnings of $101,515, while those with less than high school education earn the least with $38,718. Women with an educational attainment of graduate degree earn the most with the average annual earnings of $85,536, while those with less than high school education have the smallest earnings of $20,854.
| Educational Attainment | Male Income | Female Income |
| Less than High School | $38,718 | $20,854 |
| High School Diploma | $52,949 | $36,827 |
| College or Associate's Degree | $56,351 | $45,227 |
| Bachelor's Degree | $86,753 | $59,508 |
| Graduate Degree | $101,515 | $85,536 |
| Total | $59,265 | $44,146 |
Family Income in Montgomery
Family Income Brackets in Montgomery
According to the Montgomery family income data, there are 1,653 families falling into the $100,000 to $149,999 income range, which is the most common income bracket and makes up 33.3% of all families. Conversely, the $15,000 to $24,999 income bracket is the least frequent group with only 10 families (0.2%) belonging to this category.
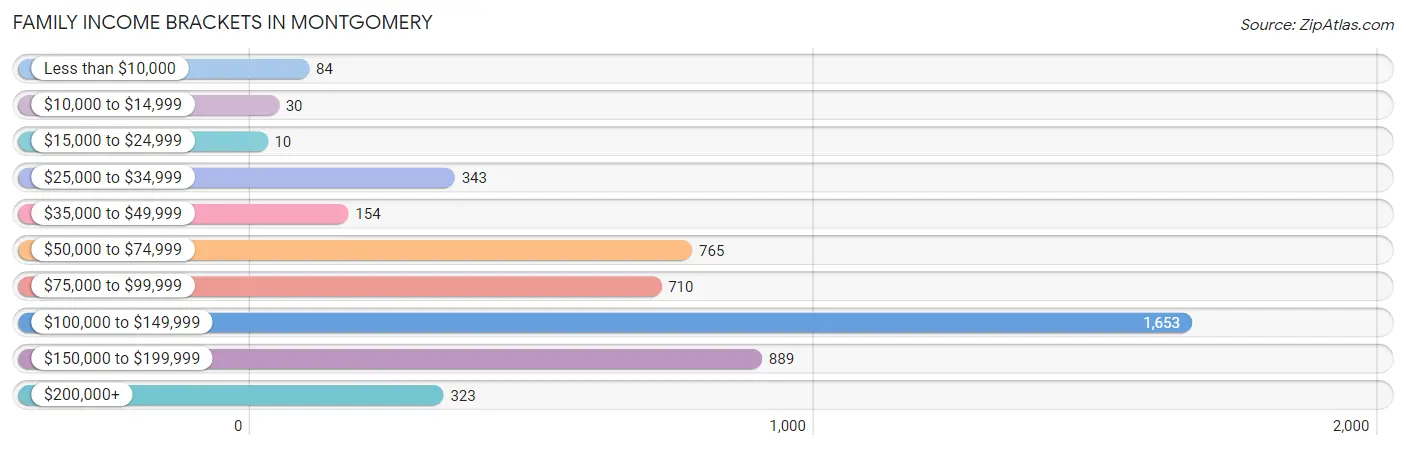
| Income Bracket | # Families | % Families |
| Less than $10,000 | 84 | 1.7% |
| $10,000 to $14,999 | 30 | 0.6% |
| $15,000 to $24,999 | 10 | 0.2% |
| $25,000 to $34,999 | 343 | 6.9% |
| $35,000 to $49,999 | 154 | 3.1% |
| $50,000 to $74,999 | 765 | 15.4% |
| $75,000 to $99,999 | 710 | 14.3% |
| $100,000 to $149,999 | 1,653 | 33.3% |
| $150,000 to $199,999 | 889 | 17.9% |
| $200,000+ | 323 | 6.5% |
Family Income by Famaliy Size in Montgomery
6-person families (151 | 3.0%) account for the highest median family income in Montgomery with $187,893 per family, while 2-person families (1,125 | 22.7%) have the highest median income of $44,297 per family member.
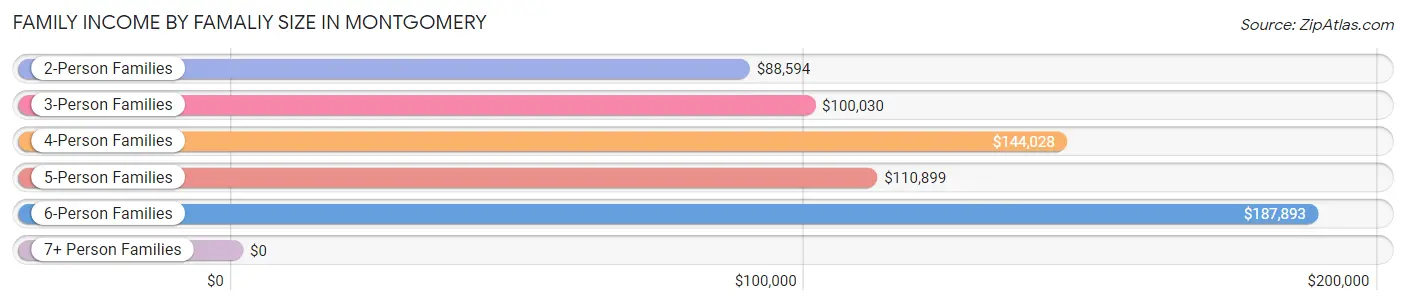
| Income Bracket | # Families | Median Income |
| 2-Person Families | 1,125 (22.7%) | $88,594 |
| 3-Person Families | 1,083 (21.8%) | $100,030 |
| 4-Person Families | 1,285 (25.9%) | $144,028 |
| 5-Person Families | 1,096 (22.1%) | $110,899 |
| 6-Person Families | 151 (3.0%) | $187,893 |
| 7+ Person Families | 225 (4.5%) | $0 |
| Total | 4,965 (100.0%) | $109,154 |
Family Income by Number of Earners in Montgomery
The median family income in Montgomery is $109,154, with families comprising 3+ earners (1,412) having the highest median family income of $129,071, while families with 1 earner (1,060) have the lowest median family income of $56,422, accounting for 28.4% and 21.3% of families, respectively.
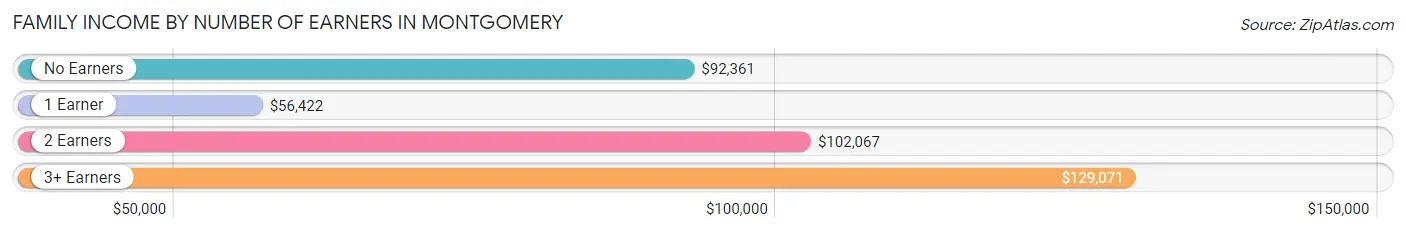
| Number of Earners | # Families | Median Income |
| No Earners | 307 (6.2%) | $92,361 |
| 1 Earner | 1,060 (21.3%) | $56,422 |
| 2 Earners | 2,186 (44.0%) | $102,067 |
| 3+ Earners | 1,412 (28.4%) | $129,071 |
| Total | 4,965 (100.0%) | $109,154 |
Household Income in Montgomery
Household Income Brackets in Montgomery
With 2,125 households falling in the category, the $100,000 to $149,999 income range is the most frequent in Montgomery, accounting for 32.1% of all households. In contrast, only 13 households (0.2%) fall into the $10,000 to $14,999 income bracket, making it the least populous group.
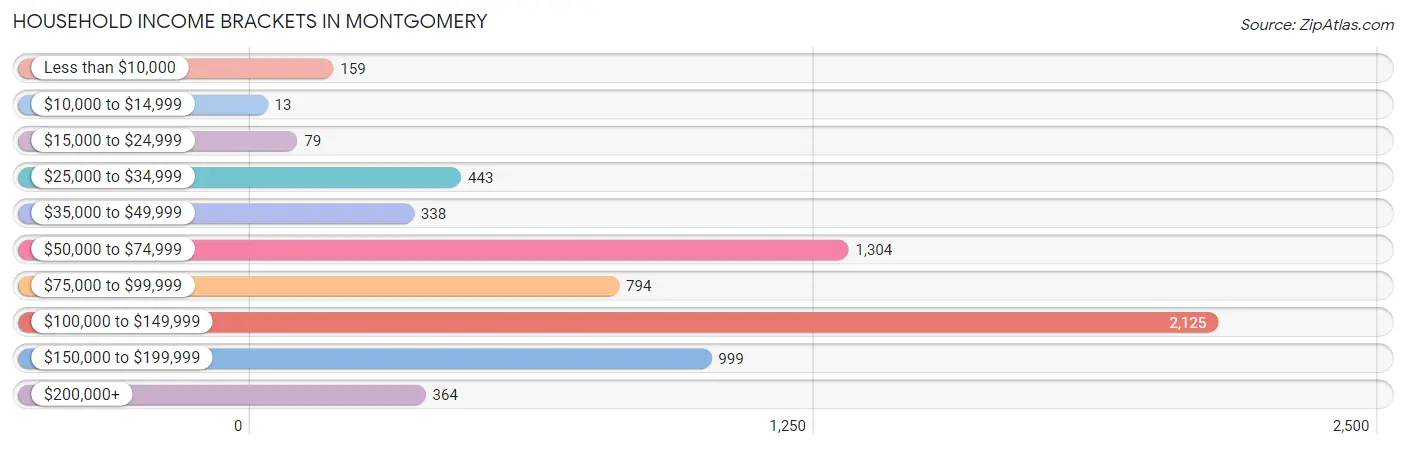
| Income Bracket | # Households | % Households |
| Less than $10,000 | 159 | 2.4% |
| $10,000 to $14,999 | 13 | 0.2% |
| $15,000 to $24,999 | 79 | 1.2% |
| $25,000 to $34,999 | 443 | 6.7% |
| $35,000 to $49,999 | 338 | 5.1% |
| $50,000 to $74,999 | 1,304 | 19.7% |
| $75,000 to $99,999 | 794 | 12.0% |
| $100,000 to $149,999 | 2,125 | 32.1% |
| $150,000 to $199,999 | 999 | 15.1% |
| $200,000+ | 364 | 5.5% |
Household Income by Householder Age in Montgomery
The median household income in Montgomery is $105,240, with the highest median household income of $112,260 found in the 45 to 64 years age bracket for the primary householder. A total of 2,491 households (37.6%) fall into this category. Meanwhile, the 15 to 24 years age bracket for the primary householder has the lowest median household income of $33,864, with 366 households (5.5%) in this group.
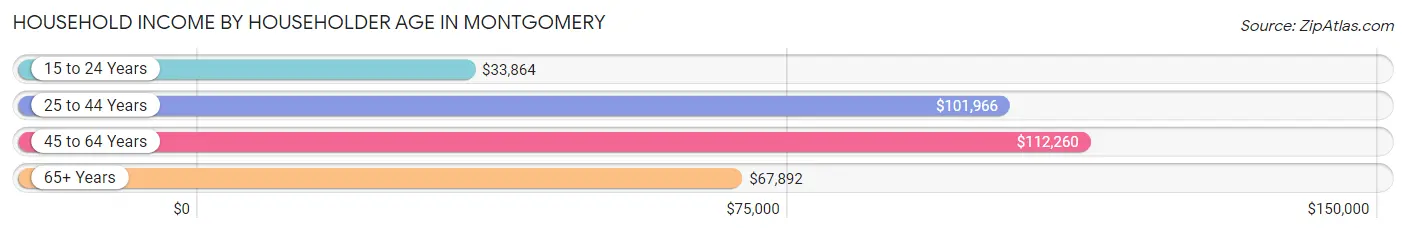
| Income Bracket | # Households | Median Income |
| 15 to 24 Years | 366 (5.5%) | $33,864 |
| 25 to 44 Years | 2,690 (40.6%) | $101,966 |
| 45 to 64 Years | 2,491 (37.6%) | $112,260 |
| 65+ Years | 1,072 (16.2%) | $67,892 |
| Total | 6,619 (100.0%) | $105,240 |
Poverty in Montgomery
Income Below Poverty by Sex and Age in Montgomery
With 7.3% poverty level for males and 11.9% for females among the residents of Montgomery, under 5 year old males and 5 year old females are the most vulnerable to poverty, with 148 males (19.2%) and 96 females (53.0%) in their respective age groups living below the poverty level.
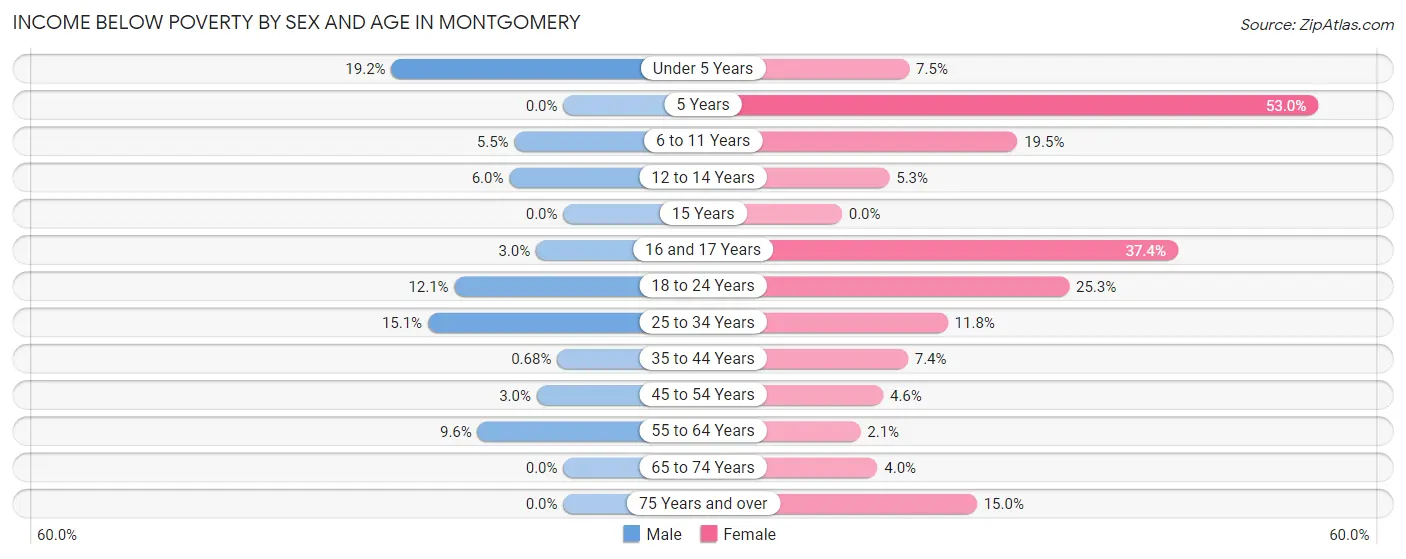
| Age Bracket | Male | Female |
| Under 5 Years | 148 (19.2%) | 33 (7.5%) |
| 5 Years | 0 (0.0%) | 96 (53.0%) |
| 6 to 11 Years | 70 (5.4%) | 144 (19.5%) |
| 12 to 14 Years | 34 (6.0%) | 19 (5.3%) |
| 15 Years | 0 (0.0%) | 0 (0.0%) |
| 16 and 17 Years | 24 (3.0%) | 101 (37.4%) |
| 18 to 24 Years | 163 (12.1%) | 308 (25.3%) |
| 25 to 34 Years | 216 (15.1%) | 118 (11.8%) |
| 35 to 44 Years | 12 (0.7%) | 133 (7.3%) |
| 45 to 54 Years | 37 (3.0%) | 58 (4.6%) |
| 55 to 64 Years | 95 (9.6%) | 13 (2.1%) |
| 65 to 74 Years | 0 (0.0%) | 26 (4.0%) |
| 75 Years and over | 0 (0.0%) | 69 (15.0%) |
| Total | 799 (7.3%) | 1,118 (11.9%) |
Income Above Poverty by Sex and Age in Montgomery
According to the poverty statistics in Montgomery, males aged 5 years and females aged 15 years are the age groups that are most secure financially, with 100.0% of males and 100.0% of females in these age groups living above the poverty line.
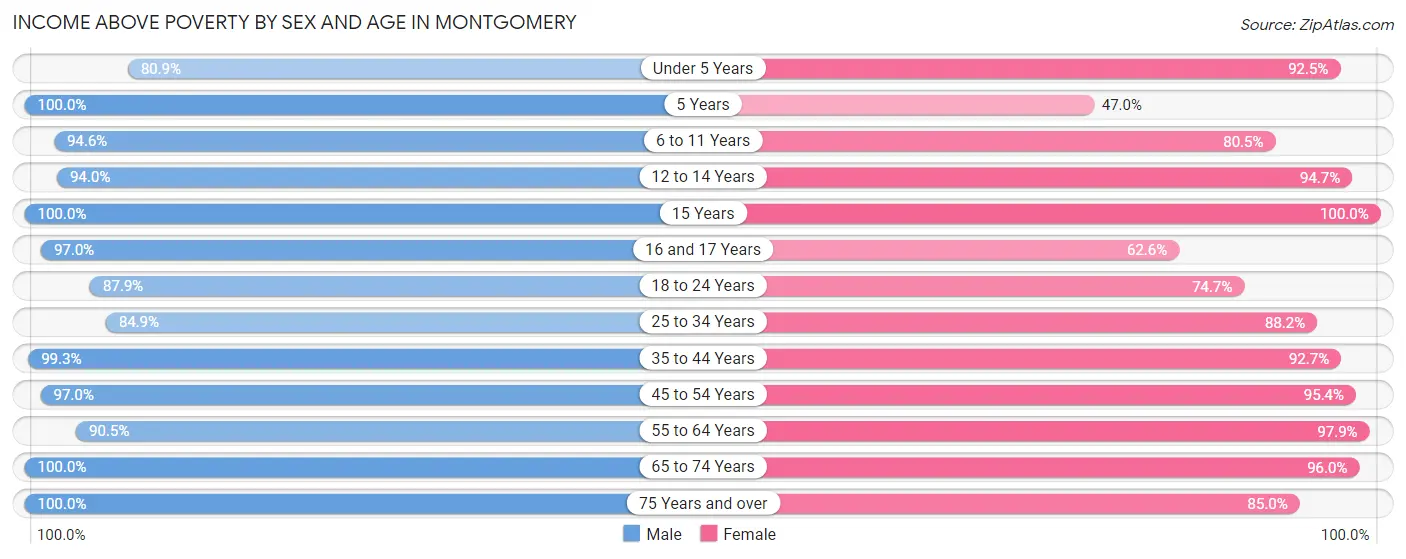
| Age Bracket | Male | Female |
| Under 5 Years | 625 (80.8%) | 407 (92.5%) |
| 5 Years | 46 (100.0%) | 85 (47.0%) |
| 6 to 11 Years | 1,214 (94.6%) | 593 (80.5%) |
| 12 to 14 Years | 531 (94.0%) | 340 (94.7%) |
| 15 Years | 35 (100.0%) | 359 (100.0%) |
| 16 and 17 Years | 765 (97.0%) | 169 (62.6%) |
| 18 to 24 Years | 1,181 (87.9%) | 909 (74.7%) |
| 25 to 34 Years | 1,216 (84.9%) | 883 (88.2%) |
| 35 to 44 Years | 1,762 (99.3%) | 1,677 (92.6%) |
| 45 to 54 Years | 1,214 (97.0%) | 1,205 (95.4%) |
| 55 to 64 Years | 900 (90.4%) | 614 (97.9%) |
| 65 to 74 Years | 333 (100.0%) | 630 (96.0%) |
| 75 Years and over | 272 (100.0%) | 390 (85.0%) |
| Total | 10,094 (92.7%) | 8,261 (88.1%) |
Income Below Poverty Among Married-Couple Families in Montgomery
The poverty statistics for married-couple families in Montgomery show that 3.3% or 130 of the total 4,000 families live below the poverty line. Families with no children have the highest poverty rate of 5.1%, comprising of 81 families. On the other hand, families with 5 or more children have the lowest poverty rate of 0.0%, which includes 0 families.
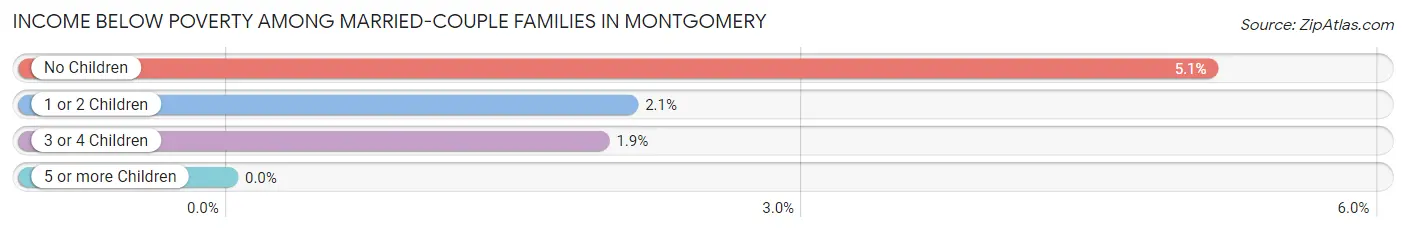
| Children | Above Poverty | Below Poverty |
| No Children | 1,501 (94.9%) | 81 (5.1%) |
| 1 or 2 Children | 1,730 (97.9%) | 37 (2.1%) |
| 3 or 4 Children | 605 (98.1%) | 12 (1.9%) |
| 5 or more Children | 34 (100.0%) | 0 (0.0%) |
| Total | 3,870 (96.8%) | 130 (3.3%) |
Income Below Poverty Among Single-Parent Households in Montgomery
According to the poverty data in Montgomery, 10.1% or 29 single-father households and 26.7% or 181 single-mother households are living below the poverty line. Among single-father households, those with 3 or 4 children have the highest poverty rate, with 29 households (100.0%) experiencing poverty. Likewise, among single-mother households, those with 3 or 4 children have the highest poverty rate, with 164 households (80.8%) falling below the poverty line.
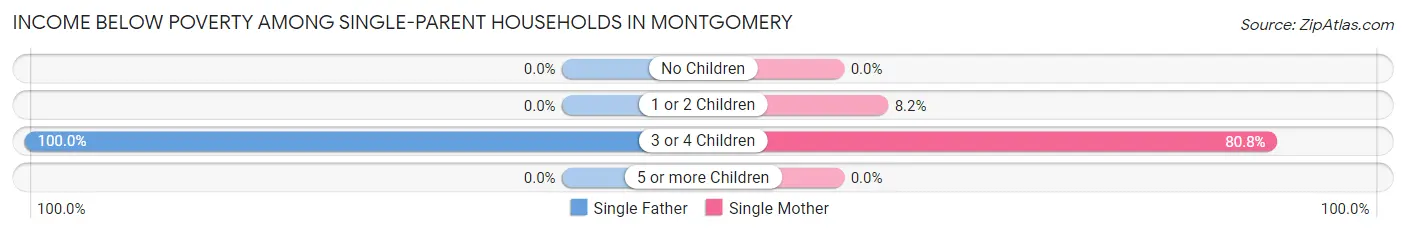
| Children | Single Father | Single Mother |
| No Children | 0 (0.0%) | 0 (0.0%) |
| 1 or 2 Children | 0 (0.0%) | 17 (8.2%) |
| 3 or 4 Children | 29 (100.0%) | 164 (80.8%) |
| 5 or more Children | 0 (0.0%) | 0 (0.0%) |
| Total | 29 (10.1%) | 181 (26.7%) |
Income Below Poverty Among Married-Couple vs Single-Parent Households in Montgomery
The poverty data for Montgomery shows that 130 of the married-couple family households (3.3%) and 210 of the single-parent households (21.8%) are living below the poverty level. Within the married-couple family households, those with no children have the highest poverty rate, with 81 households (5.1%) falling below the poverty line. Among the single-parent households, those with 3 or 4 children have the highest poverty rate, with 193 household (83.2%) living below poverty.
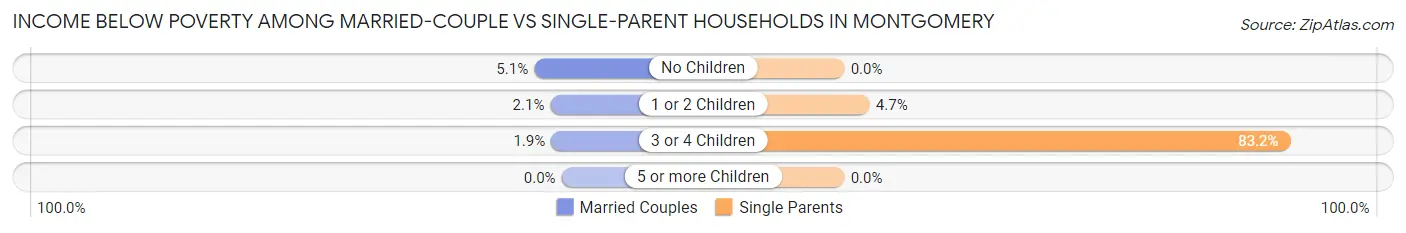
| Children | Married-Couple Families | Single-Parent Households |
| No Children | 81 (5.1%) | 0 (0.0%) |
| 1 or 2 Children | 37 (2.1%) | 17 (4.7%) |
| 3 or 4 Children | 12 (1.9%) | 193 (83.2%) |
| 5 or more Children | 0 (0.0%) | 0 (0.0%) |
| Total | 130 (3.3%) | 210 (21.8%) |
Race in Montgomery
The most populous races in Montgomery are White / Caucasian (14,265 | 69.1%), Hispanic or Latino (6,664 | 32.3%), and Some other Race (2,763 | 13.4%).
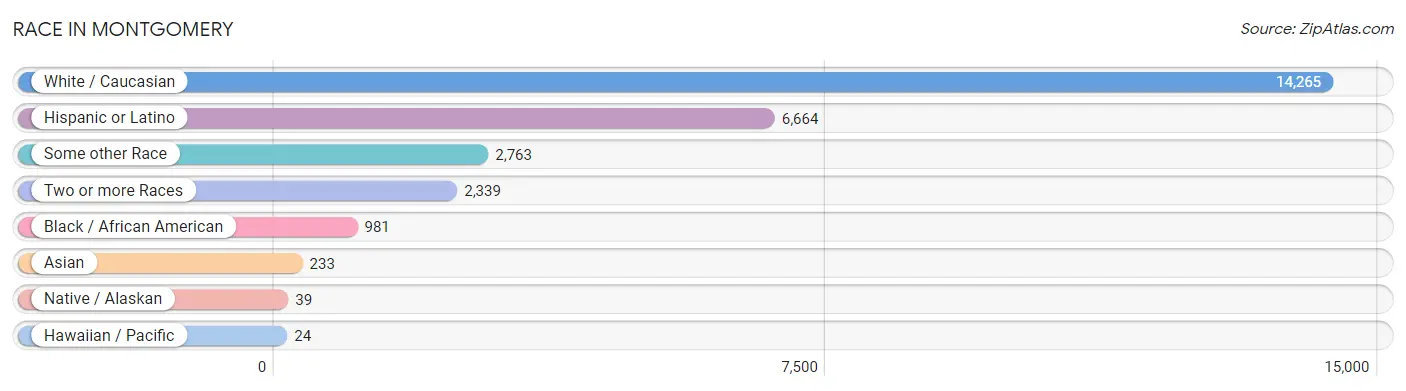
| Race | # Population | % Population |
| Asian | 233 | 1.1% |
| Black / African American | 981 | 4.8% |
| Hawaiian / Pacific | 24 | 0.1% |
| Hispanic or Latino | 6,664 | 32.3% |
| Native / Alaskan | 39 | 0.2% |
| White / Caucasian | 14,265 | 69.1% |
| Two or more Races | 2,339 | 11.3% |
| Some other Race | 2,763 | 13.4% |
| Total | 20,644 | 100.0% |
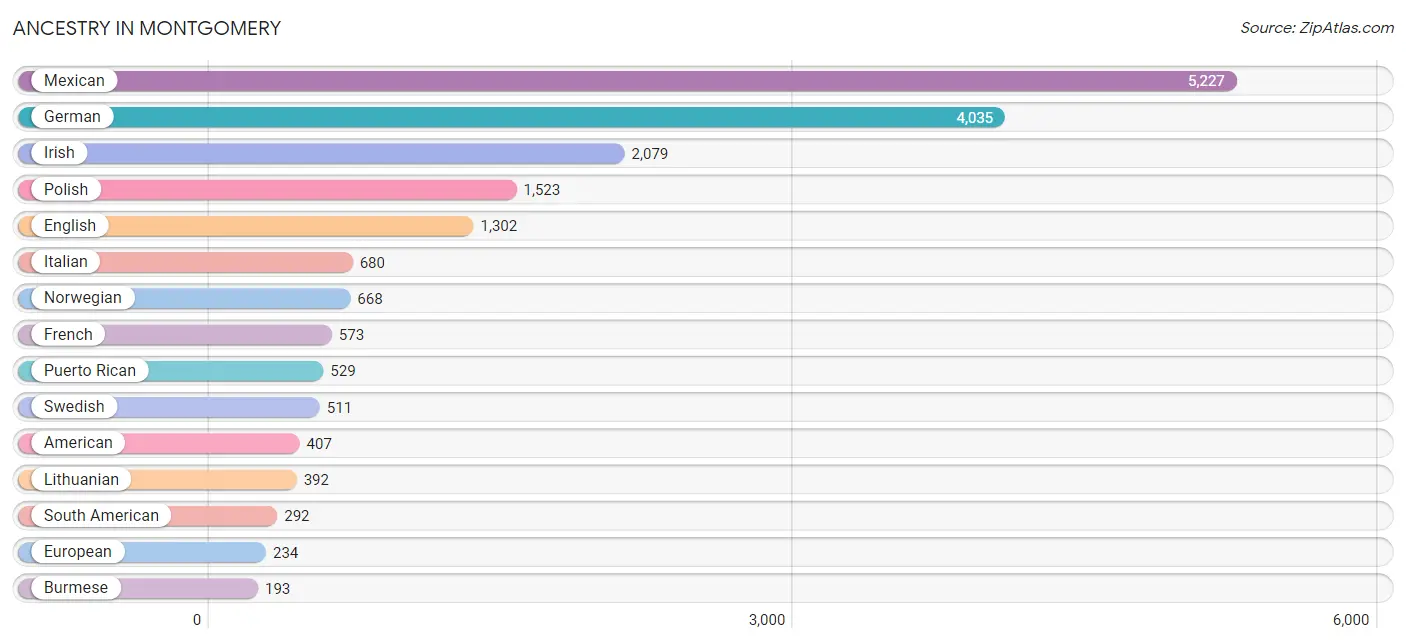
Ancestry in Montgomery
The most populous ancestries reported in Montgomery are Mexican (5,227 | 25.3%), German (4,035 | 19.6%), Irish (2,079 | 10.1%), Polish (1,523 | 7.4%), and English (1,302 | 6.3%), together accounting for 68.6% of all Montgomery residents.
| Ancestry | # Population | % Population |
| American | 407 | 2.0% |
| Apache | 20 | 0.1% |
| Arab | 54 | 0.3% |
| Argentinean | 134 | 0.6% |
| Austrian | 95 | 0.5% |
| Belgian | 35 | 0.2% |
| Blackfeet | 9 | 0.0% |
| Burmese | 193 | 0.9% |
| Central American | 91 | 0.4% |
| Central American Indian | 12 | 0.1% |
| Cherokee | 9 | 0.0% |
| Chilean | 26 | 0.1% |
| Croatian | 45 | 0.2% |
| Czech | 59 | 0.3% |
| Czechoslovakian | 18 | 0.1% |
| Dutch | 58 | 0.3% |
| Eastern European | 69 | 0.3% |
| English | 1,302 | 6.3% |
| European | 234 | 1.1% |
| French | 573 | 2.8% |
| French Canadian | 26 | 0.1% |
| German | 4,035 | 19.6% |
| Ghanaian | 20 | 0.1% |
| Greek | 20 | 0.1% |
| Guatemalan | 55 | 0.3% |
| Hungarian | 103 | 0.5% |
| Indian (Asian) | 76 | 0.4% |
| Irish | 2,079 | 10.1% |
| Italian | 680 | 3.3% |
| Korean | 92 | 0.4% |
| Lithuanian | 392 | 1.9% |
| Luxembourger | 154 | 0.7% |
| Mexican | 5,227 | 25.3% |
| Native Hawaiian | 24 | 0.1% |
| Nicaraguan | 8 | 0.0% |
| Nigerian | 40 | 0.2% |
| Norwegian | 668 | 3.2% |
| Peruvian | 132 | 0.6% |
| Polish | 1,523 | 7.4% |
| Puerto Rican | 529 | 2.6% |
| Romanian | 53 | 0.3% |
| Russian | 129 | 0.6% |
| Salvadoran | 28 | 0.1% |
| Scotch-Irish | 57 | 0.3% |
| Scottish | 183 | 0.9% |
| Sioux | 7 | 0.0% |
| Slovene | 35 | 0.2% |
| South American | 292 | 1.4% |
| Spaniard | 22 | 0.1% |
| Subsaharan African | 60 | 0.3% |
| Swedish | 511 | 2.5% |
| Swiss | 44 | 0.2% |
| Thai | 140 | 0.7% |
| Ukrainian | 67 | 0.3% |
| Welsh | 36 | 0.2% | View All 55 Rows |
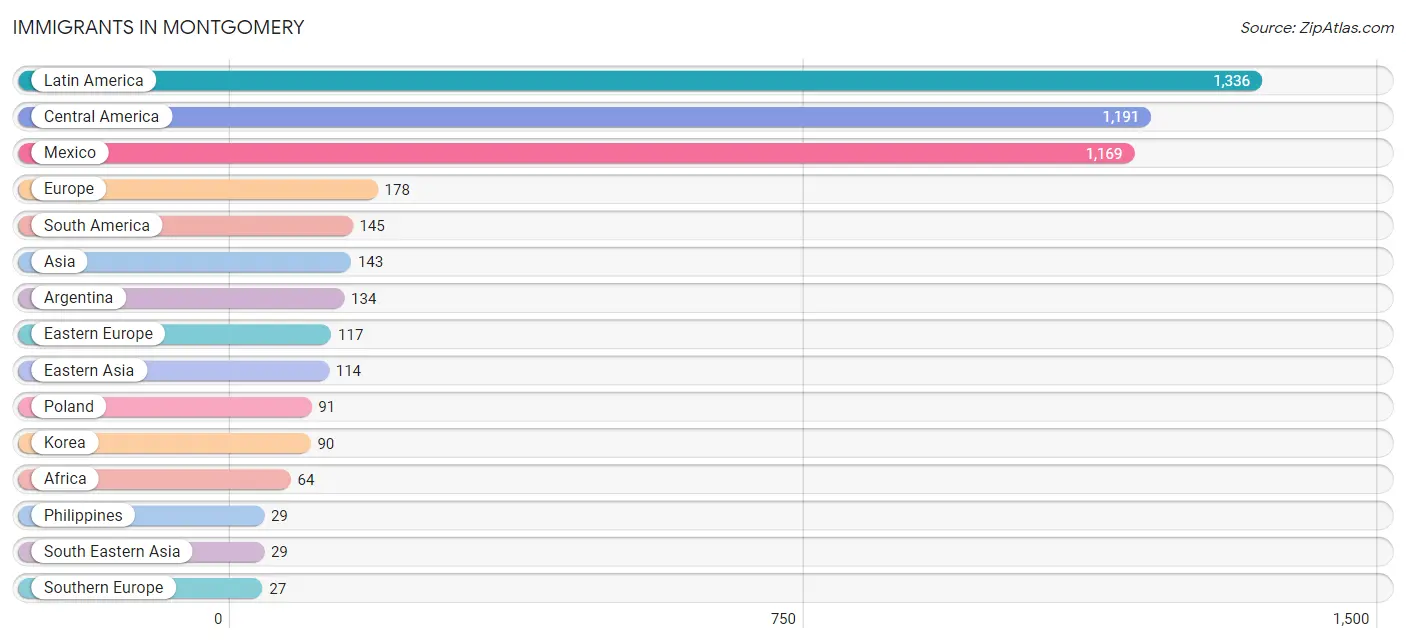
Immigrants in Montgomery
The most numerous immigrant groups reported in Montgomery came from Latin America (1,336 | 6.5%), Central America (1,191 | 5.8%), Mexico (1,169 | 5.7%), Europe (178 | 0.9%), and South America (145 | 0.7%), together accounting for 19.5% of all Montgomery residents.
| Immigration Origin | # Population | % Population |
| Africa | 64 | 0.3% |
| Argentina | 134 | 0.6% |
| Asia | 143 | 0.7% |
| Bosnia and Herzegovina | 19 | 0.1% |
| Cameroon | 17 | 0.1% |
| Central America | 1,191 | 5.8% |
| China | 24 | 0.1% |
| Eastern Asia | 114 | 0.5% |
| Eastern Europe | 117 | 0.6% |
| El Salvador | 10 | 0.1% |
| England | 5 | 0.0% |
| Europe | 178 | 0.9% |
| Germany | 9 | 0.0% |
| Greece | 5 | 0.0% |
| Guatemala | 12 | 0.1% |
| Hungary | 7 | 0.0% |
| Italy | 22 | 0.1% |
| Korea | 90 | 0.4% |
| Latin America | 1,336 | 6.5% |
| Mexico | 1,169 | 5.7% |
| Middle Africa | 17 | 0.1% |
| Morocco | 24 | 0.1% |
| Nigeria | 23 | 0.1% |
| Northern Africa | 24 | 0.1% |
| Northern Europe | 25 | 0.1% |
| Peru | 11 | 0.1% |
| Philippines | 29 | 0.1% |
| Poland | 91 | 0.4% |
| South America | 145 | 0.7% |
| South Eastern Asia | 29 | 0.1% |
| Southern Europe | 27 | 0.1% |
| Taiwan | 24 | 0.1% |
| Western Africa | 23 | 0.1% |
| Western Europe | 9 | 0.0% | View All 34 Rows |
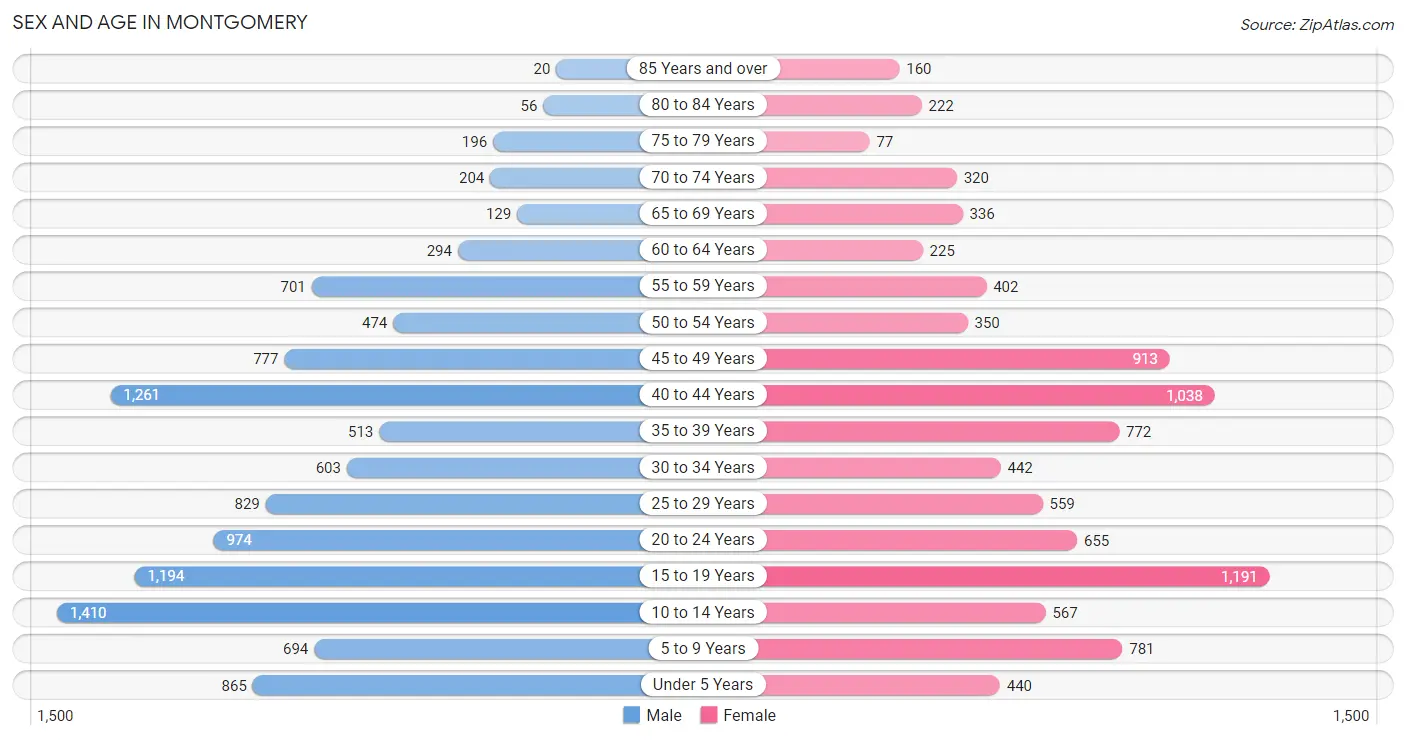
Sex and Age in Montgomery
Sex and Age in Montgomery
The most populous age groups in Montgomery are 10 to 14 Years (1,410 | 12.6%) for men and 15 to 19 Years (1,191 | 12.6%) for women.
| Age Bracket | Male | Female |
| Under 5 Years | 865 (7.7%) | 440 (4.7%) |
| 5 to 9 Years | 694 (6.2%) | 781 (8.3%) |
| 10 to 14 Years | 1,410 (12.6%) | 567 (6.0%) |
| 15 to 19 Years | 1,194 (10.7%) | 1,191 (12.6%) |
| 20 to 24 Years | 974 (8.7%) | 655 (6.9%) |
| 25 to 29 Years | 829 (7.4%) | 559 (5.9%) |
| 30 to 34 Years | 603 (5.4%) | 442 (4.7%) |
| 35 to 39 Years | 513 (4.6%) | 772 (8.2%) |
| 40 to 44 Years | 1,261 (11.3%) | 1,038 (11.0%) |
| 45 to 49 Years | 777 (6.9%) | 913 (9.7%) |
| 50 to 54 Years | 474 (4.2%) | 350 (3.7%) |
| 55 to 59 Years | 701 (6.3%) | 402 (4.3%) |
| 60 to 64 Years | 294 (2.6%) | 225 (2.4%) |
| 65 to 69 Years | 129 (1.1%) | 336 (3.6%) |
| 70 to 74 Years | 204 (1.8%) | 320 (3.4%) |
| 75 to 79 Years | 196 (1.8%) | 77 (0.8%) |
| 80 to 84 Years | 56 (0.5%) | 222 (2.4%) |
| 85 Years and over | 20 (0.2%) | 160 (1.7%) |
| Total | 11,194 (100.0%) | 9,450 (100.0%) |
Families and Households in Montgomery
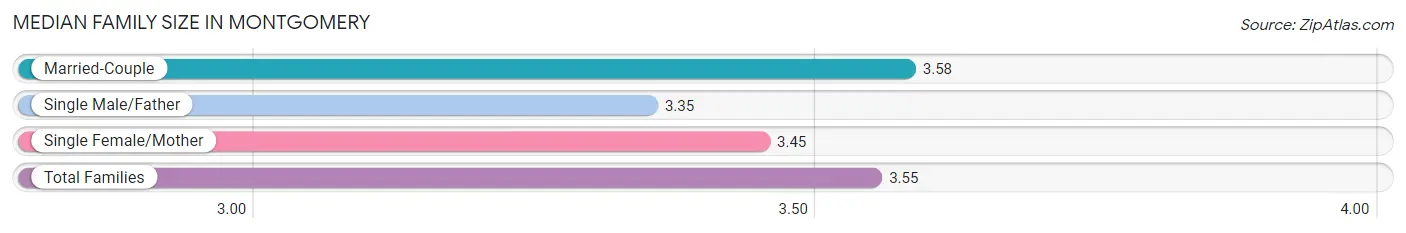
Median Family Size in Montgomery
The median family size in Montgomery is 3.55 persons per family, with married-couple families (4,000 | 80.6%) accounting for the largest median family size of 3.58 persons per family. On the other hand, single male/father families (288 | 5.8%) represent the smallest median family size with 3.35 persons per family.
| Family Type | # Families | Family Size |
| Married-Couple | 4,000 (80.6%) | 3.58 |
| Single Male/Father | 288 (5.8%) | 3.35 |
| Single Female/Mother | 677 (13.6%) | 3.45 |
| Total Families | 4,965 (100.0%) | 3.55 |
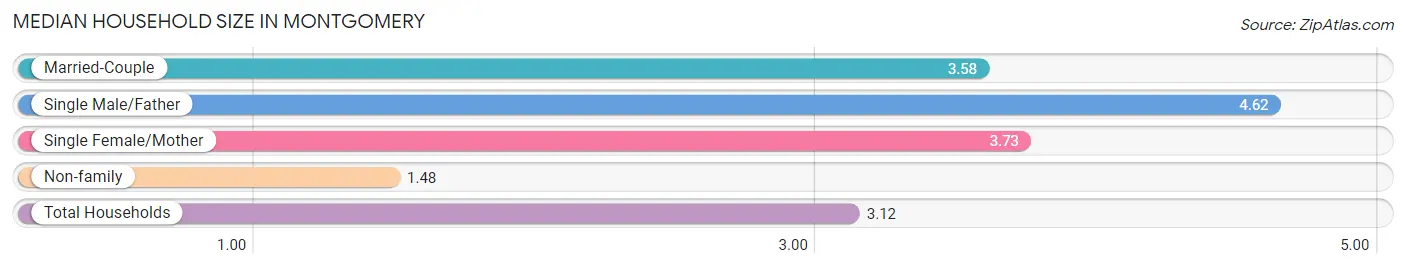
Median Household Size in Montgomery
The median household size in Montgomery is 3.12 persons per household, with single male/father households (288 | 4.3%) accounting for the largest median household size of 4.62 persons per household. non-family households (1,654 | 25.0%) represent the smallest median household size with 1.48 persons per household.
| Household Type | # Households | Household Size |
| Married-Couple | 4,000 (60.4%) | 3.58 |
| Single Male/Father | 288 (4.3%) | 4.62 |
| Single Female/Mother | 677 (10.2%) | 3.73 |
| Non-family | 1,654 (25.0%) | 1.48 |
| Total Households | 6,619 (100.0%) | 3.12 |
Household Size by Marriage Status in Montgomery
Out of a total of 6,619 households in Montgomery, 4,965 (75.0%) are family households, while 1,654 (25.0%) are nonfamily households. The most numerous type of family households are 4-person households, comprising 1,413, and the most common type of nonfamily households are 1-person households, comprising 1,229.
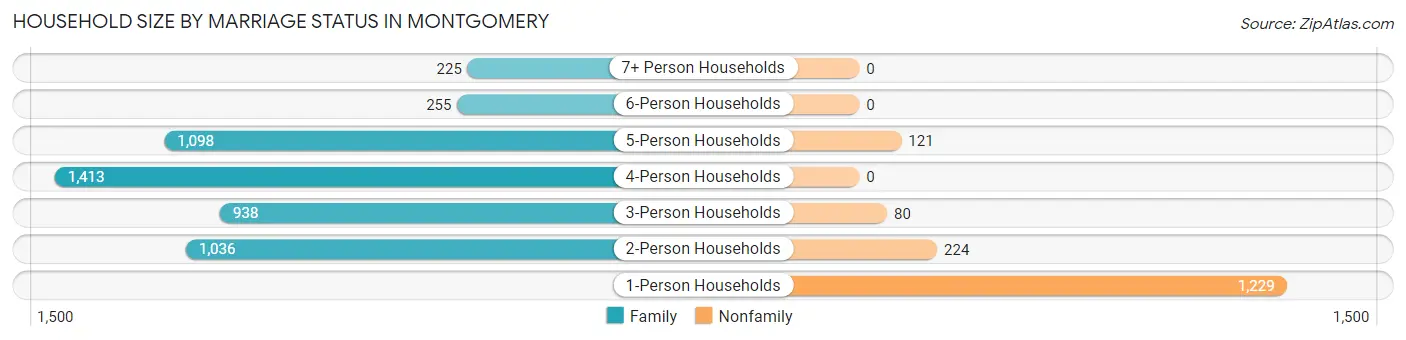
| Household Size | Family Households | Nonfamily Households |
| 1-Person Households | - | 1,229 (18.6%) |
| 2-Person Households | 1,036 (15.7%) | 224 (3.4%) |
| 3-Person Households | 938 (14.2%) | 80 (1.2%) |
| 4-Person Households | 1,413 (21.3%) | 0 (0.0%) |
| 5-Person Households | 1,098 (16.6%) | 121 (1.8%) |
| 6-Person Households | 255 (3.8%) | 0 (0.0%) |
| 7+ Person Households | 225 (3.4%) | 0 (0.0%) |
| Total | 4,965 (75.0%) | 1,654 (25.0%) |
Female Fertility in Montgomery
Fertility by Age in Montgomery
Average fertility rate in Montgomery is 31.0 births per 1,000 women. Women in the age bracket of 20 to 34 years have the highest fertility rate with 73.0 births per 1,000 women. Women in the age bracket of 20 to 34 years acount for 68.0% of all women with births.
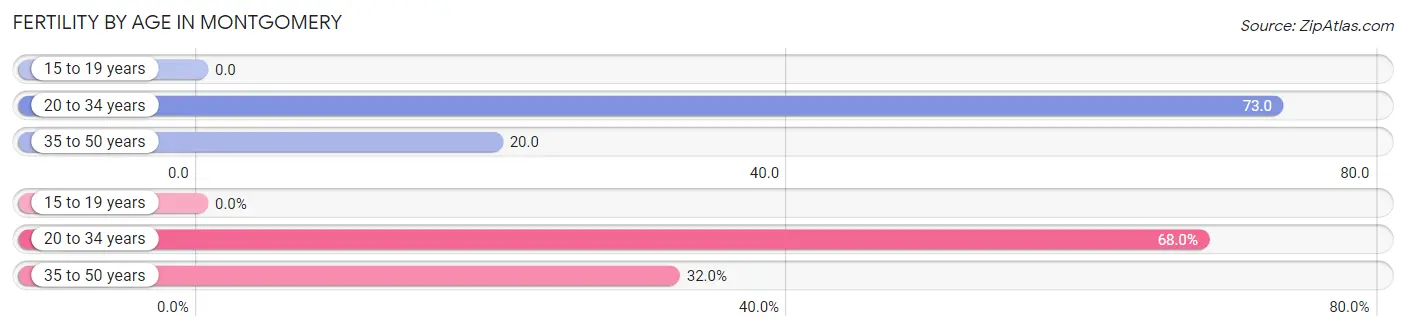
| Age Bracket | Women with Births | Births / 1,000 Women |
| 15 to 19 years | 0 (0.0%) | 0.0 |
| 20 to 34 years | 121 (68.0%) | 73.0 |
| 35 to 50 years | 57 (32.0%) | 20.0 |
| Total | 178 (100.0%) | 31.0 |
Fertility by Age by Marriage Status in Montgomery
74.2% of women with births (178) in Montgomery are married. The highest percentage of unmarried women with births falls into 35 to 50 years age bracket with 80.7% of them unmarried at the time of birth, while the lowest percentage of unmarried women with births belong to 20 to 34 years age bracket with 0.0% of them unmarried.
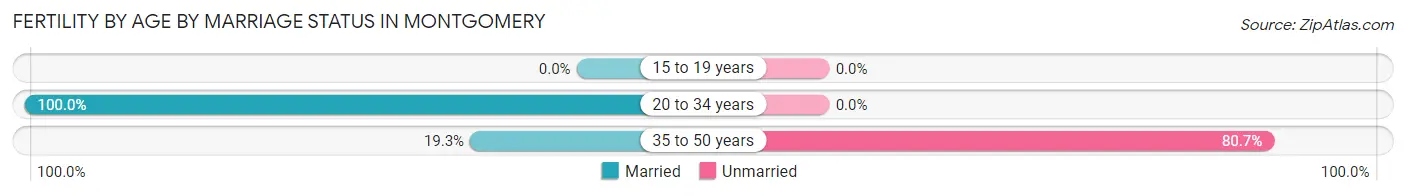
| Age Bracket | Married | Unmarried |
| 15 to 19 years | 0 (0.0%) | 0 (0.0%) |
| 20 to 34 years | 121 (100.0%) | 0 (0.0%) |
| 35 to 50 years | 11 (19.3%) | 46 (80.7%) |
| Total | 132 (74.2%) | 46 (25.8%) |
Fertility by Education in Montgomery
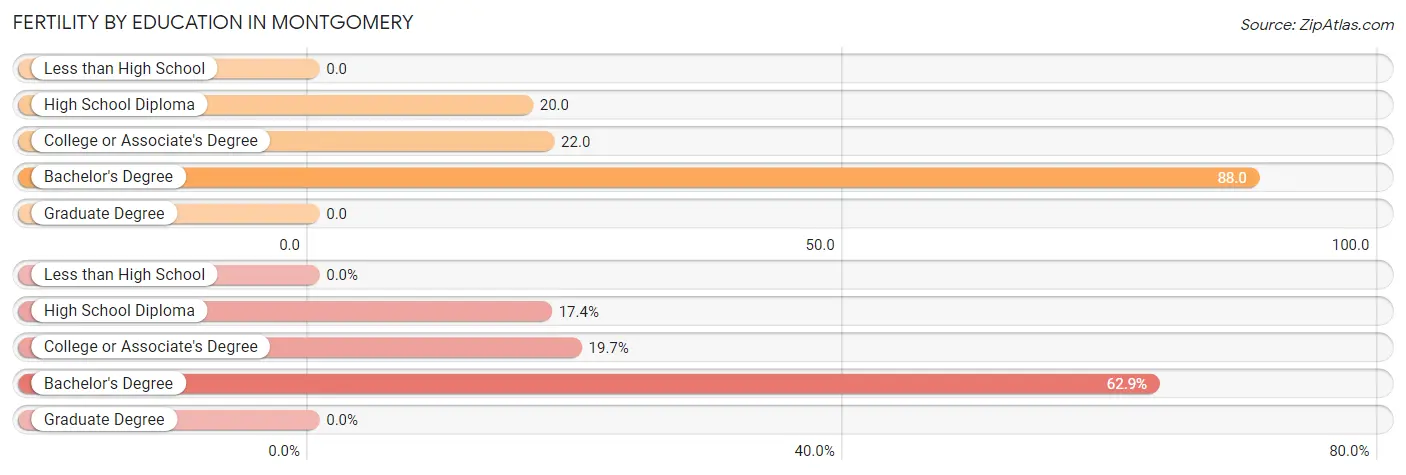
| Educational Attainment | Women with Births | Births / 1,000 Women |
| Less than High School | 0 (0.0%) | 0.0 |
| High School Diploma | 31 (17.4%) | 20.0 |
| College or Associate's Degree | 35 (19.7%) | 22.0 |
| Bachelor's Degree | 112 (62.9%) | 88.0 |
| Graduate Degree | 0 (0.0%) | 0.0 |
| Total | 178 (100.0%) | 31.0 |
Fertility by Education by Marriage Status in Montgomery
25.8% of women with births in Montgomery are unmarried. Women with the educational attainment of high school diploma are most likely to be married with 100.0% of them married at childbirth, while women with the educational attainment of bachelor's degree are least likely to be married with 41.1% of them unmarried at childbirth.
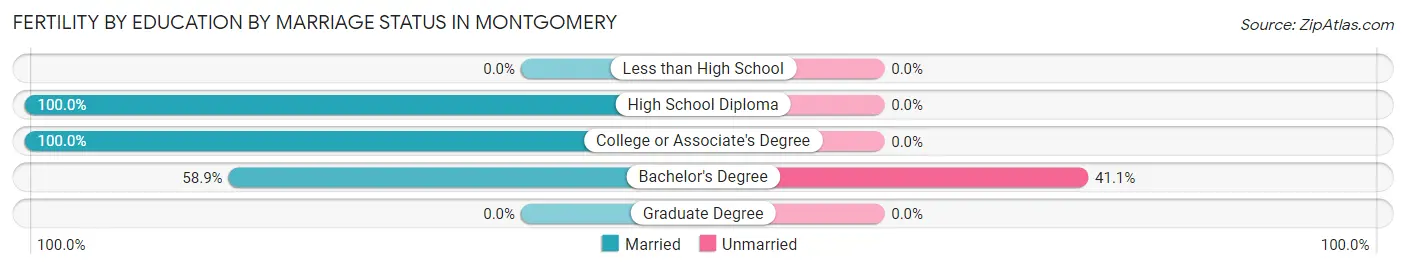
| Educational Attainment | Married | Unmarried |
| Less than High School | 0 (0.0%) | 0 (0.0%) |
| High School Diploma | 31 (100.0%) | 0 (0.0%) |
| College or Associate's Degree | 35 (100.0%) | 0 (0.0%) |
| Bachelor's Degree | 66 (58.9%) | 46 (41.1%) |
| Graduate Degree | 0 (0.0%) | 0 (0.0%) |
| Total | 132 (74.2%) | 46 (25.8%) |
Employment Characteristics in Montgomery
Employment by Class of Employer in Montgomery
Among the 11,057 employed individuals in Montgomery, private company employees (7,772 | 70.3%), local government employees (1,428 | 12.9%), and self-employed (not incorporated) (719 | 6.5%) make up the most common classes of employment.
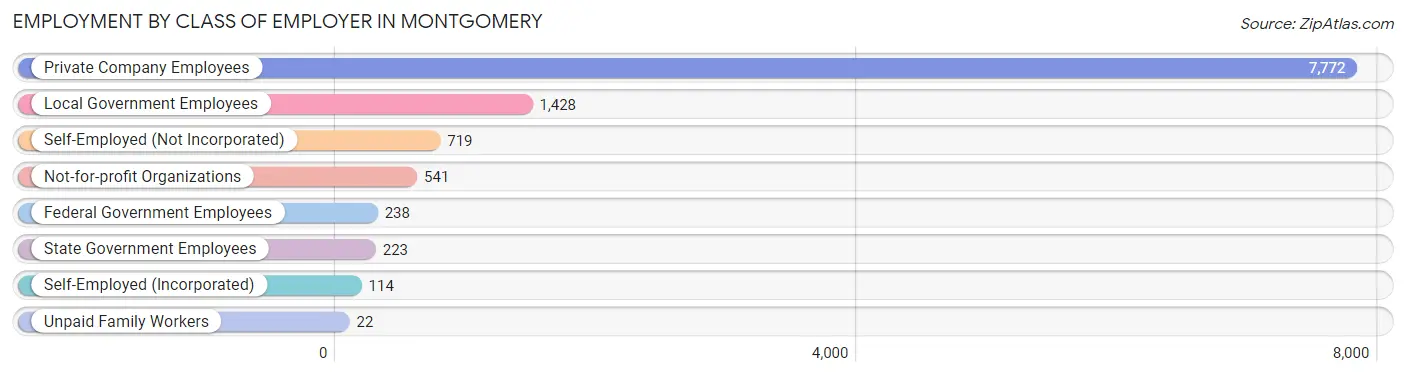
| Employer Class | # Employees | % Employees |
| Private Company Employees | 7,772 | 70.3% |
| Self-Employed (Incorporated) | 114 | 1.0% |
| Self-Employed (Not Incorporated) | 719 | 6.5% |
| Not-for-profit Organizations | 541 | 4.9% |
| Local Government Employees | 1,428 | 12.9% |
| State Government Employees | 223 | 2.0% |
| Federal Government Employees | 238 | 2.1% |
| Unpaid Family Workers | 22 | 0.2% |
| Total | 11,057 | 100.0% |
Employment Status by Age in Montgomery
According to the labor force statistics for Montgomery, out of the total population over 16 years of age (15,493), 75.7% or 11,728 individuals are in the labor force, with 5.5% or 645 of them unemployed. The age group with the highest labor force participation rate is 25 to 29 years, with 98.3% or 1,364 individuals in the labor force. Within the labor force, the 25 to 29 years age range has the highest percentage of unemployed individuals, with 22.0% or 300 of them being unemployed.
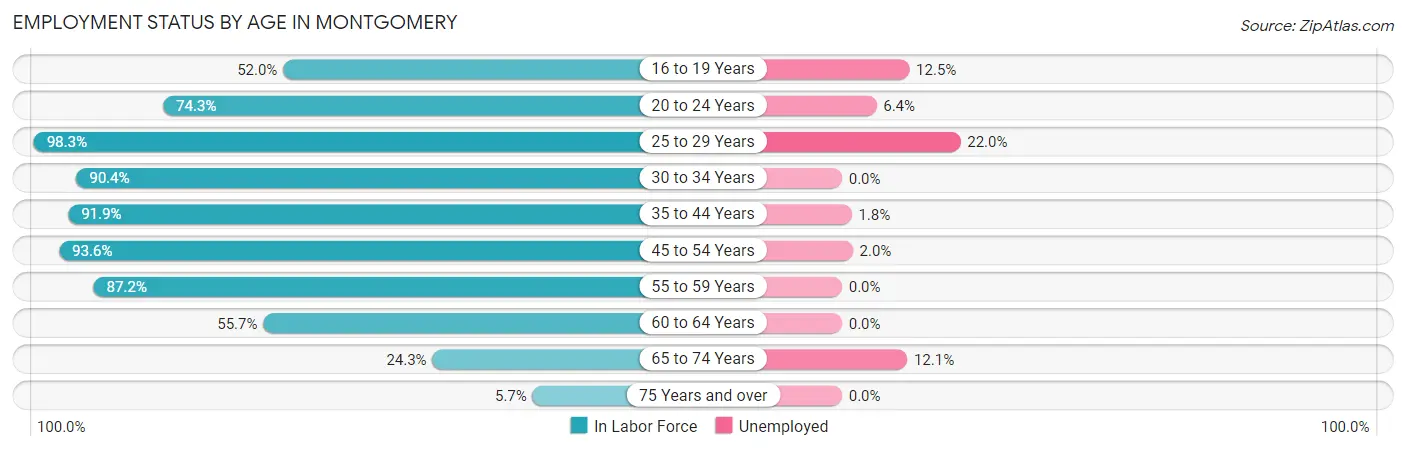
| Age Bracket | In Labor Force | Unemployed |
| 16 to 19 Years | 1,035 (52.0%) | 129 (12.5%) |
| 20 to 24 Years | 1,210 (74.3%) | 77 (6.4%) |
| 25 to 29 Years | 1,364 (98.3%) | 300 (22.0%) |
| 30 to 34 Years | 945 (90.4%) | 0 (0.0%) |
| 35 to 44 Years | 3,294 (91.9%) | 59 (1.8%) |
| 45 to 54 Years | 2,353 (93.6%) | 47 (2.0%) |
| 55 to 59 Years | 962 (87.2%) | 0 (0.0%) |
| 60 to 64 Years | 289 (55.7%) | 0 (0.0%) |
| 65 to 74 Years | 240 (24.3%) | 29 (12.1%) |
| 75 Years and over | 42 (5.7%) | 0 (0.0%) |
| Total | 11,728 (75.7%) | 645 (5.5%) |
Employment Status by Educational Attainment in Montgomery
According to labor force statistics for Montgomery, 90.7% of individuals (9,209) out of the total population between 25 and 64 years of age (10,153) are in the labor force, with 4.4% or 405 of them being unemployed. The group with the highest labor force participation rate are those with the educational attainment of bachelor's degree or higher, with 95.9% or 2,968 individuals in the labor force. Within the labor force, individuals with less than high school education have the highest percentage of unemployment, with 26.8% or 174 of them being unemployed.
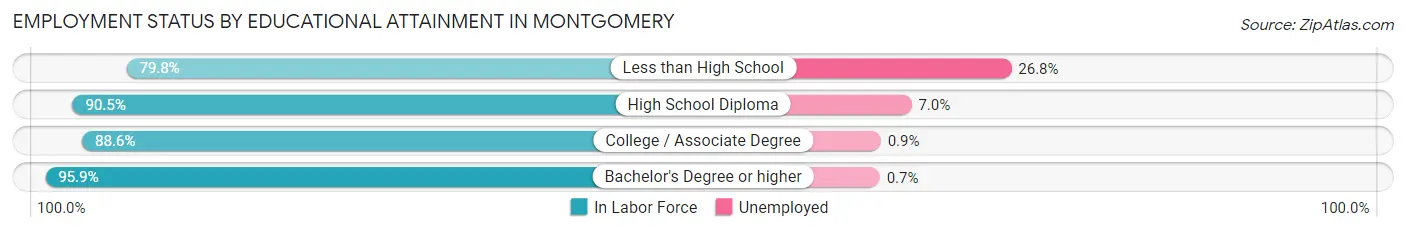
| Educational Attainment | In Labor Force | Unemployed |
| Less than High School | 650 (79.8%) | 218 (26.8%) |
| High School Diploma | 2,600 (90.5%) | 201 (7.0%) |
| College / Associate Degree | 2,986 (88.6%) | 30 (0.9%) |
| Bachelor's Degree or higher | 2,968 (95.9%) | 22 (0.7%) |
| Total | 9,209 (90.7%) | 447 (4.4%) |
Employment Occupations by Sex in Montgomery
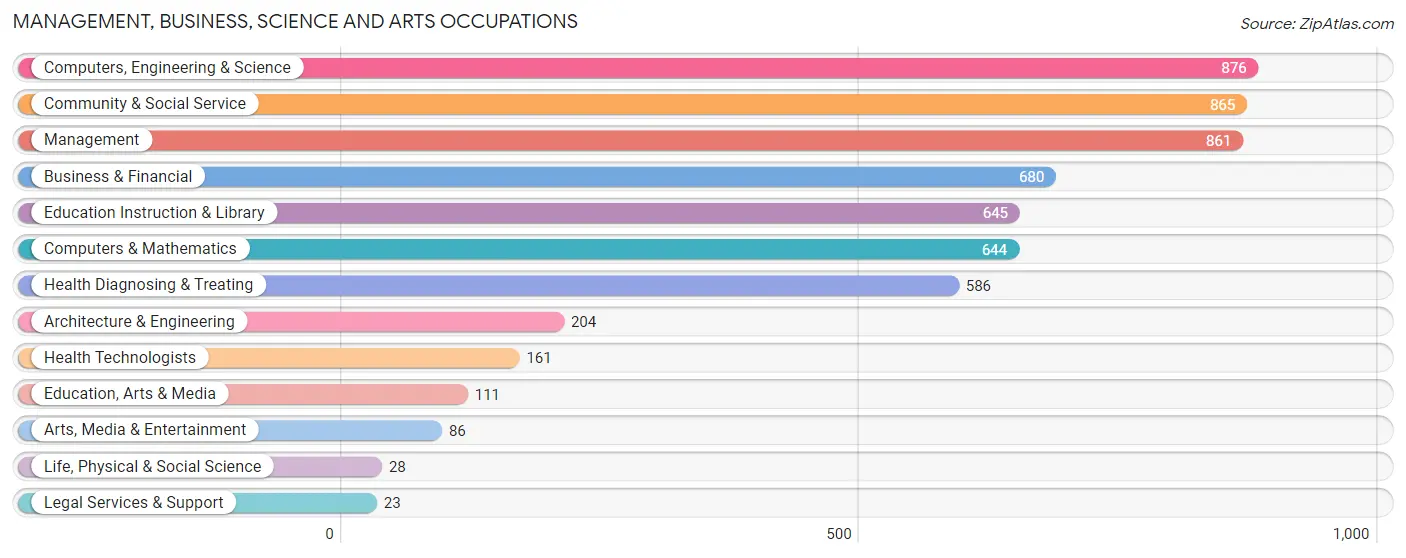
Management, Business, Science and Arts Occupations
The most common Management, Business, Science and Arts occupations in Montgomery are Computers, Engineering & Science (876 | 7.9%), Community & Social Service (865 | 7.8%), Management (861 | 7.8%), Business & Financial (680 | 6.1%), and Education Instruction & Library (645 | 5.8%).
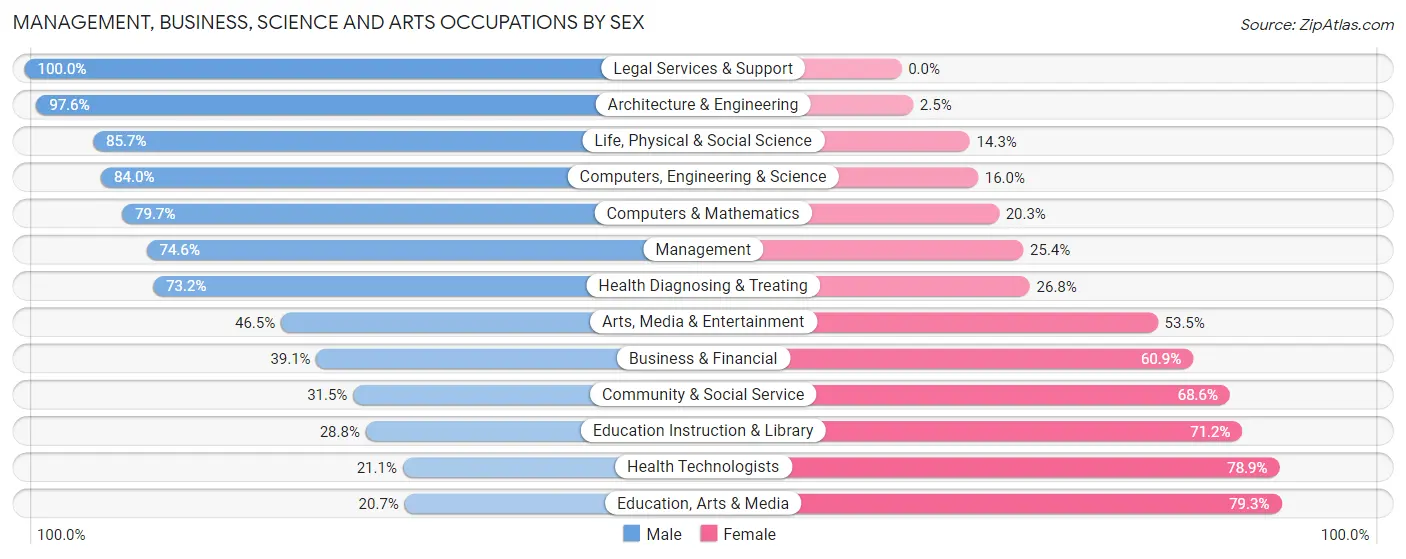
Management, Business, Science and Arts Occupations by Sex
Within the Management, Business, Science and Arts occupations in Montgomery, the most male-oriented occupations are Legal Services & Support (100.0%), Architecture & Engineering (97.6%), and Life, Physical & Social Science (85.7%), while the most female-oriented occupations are Education, Arts & Media (79.3%), Health Technologists (78.9%), and Education Instruction & Library (71.2%).
| Occupation | Male | Female |
| Management | 642 (74.6%) | 219 (25.4%) |
| Business & Financial | 266 (39.1%) | 414 (60.9%) |
| Computers, Engineering & Science | 736 (84.0%) | 140 (16.0%) |
| Computers & Mathematics | 513 (79.7%) | 131 (20.3%) |
| Architecture & Engineering | 199 (97.6%) | 5 (2.5%) |
| Life, Physical & Social Science | 24 (85.7%) | 4 (14.3%) |
| Community & Social Service | 272 (31.5%) | 593 (68.5%) |
| Education, Arts & Media | 23 (20.7%) | 88 (79.3%) |
| Legal Services & Support | 23 (100.0%) | 0 (0.0%) |
| Education Instruction & Library | 186 (28.8%) | 459 (71.2%) |
| Arts, Media & Entertainment | 40 (46.5%) | 46 (53.5%) |
| Health Diagnosing & Treating | 429 (73.2%) | 157 (26.8%) |
| Health Technologists | 34 (21.1%) | 127 (78.9%) |
| Total (Category) | 2,345 (60.6%) | 1,523 (39.4%) |
| Total (Overall) | 6,141 (55.4%) | 4,940 (44.6%) |
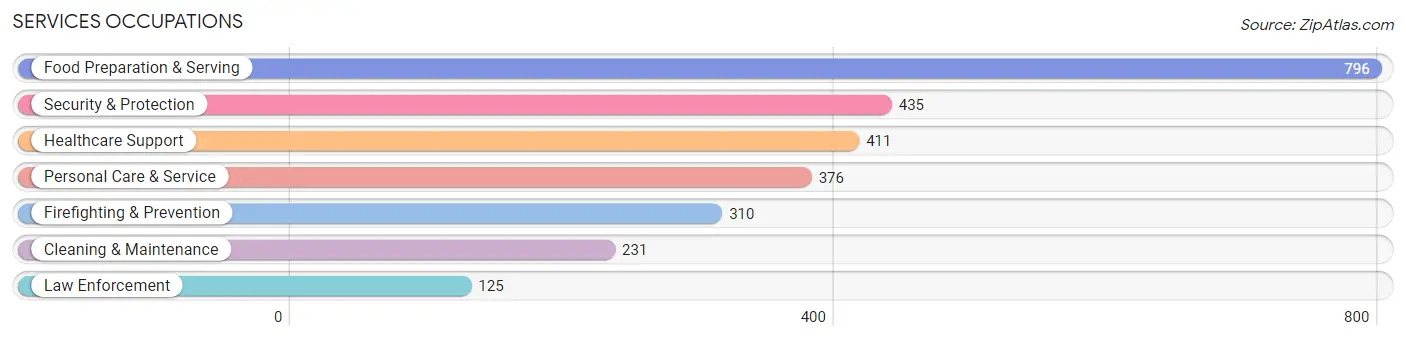
Services Occupations
The most common Services occupations in Montgomery are Food Preparation & Serving (796 | 7.2%), Security & Protection (435 | 3.9%), Healthcare Support (411 | 3.7%), Personal Care & Service (376 | 3.4%), and Firefighting & Prevention (310 | 2.8%).
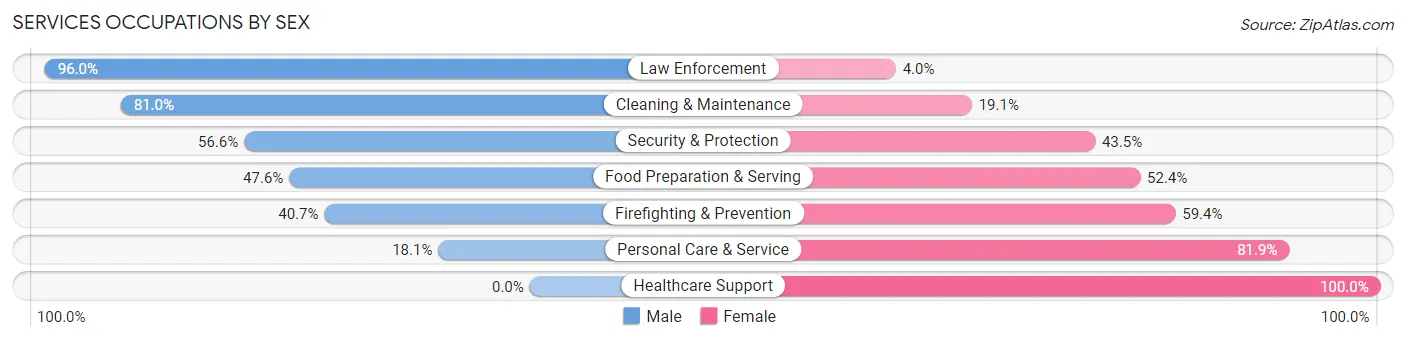
Services Occupations by Sex
Within the Services occupations in Montgomery, the most male-oriented occupations are Law Enforcement (96.0%), Cleaning & Maintenance (80.9%), and Security & Protection (56.6%), while the most female-oriented occupations are Healthcare Support (100.0%), Personal Care & Service (81.9%), and Firefighting & Prevention (59.4%).
| Occupation | Male | Female |
| Healthcare Support | 0 (0.0%) | 411 (100.0%) |
| Security & Protection | 246 (56.6%) | 189 (43.4%) |
| Firefighting & Prevention | 126 (40.6%) | 184 (59.4%) |
| Law Enforcement | 120 (96.0%) | 5 (4.0%) |
| Food Preparation & Serving | 379 (47.6%) | 417 (52.4%) |
| Cleaning & Maintenance | 187 (80.9%) | 44 (19.1%) |
| Personal Care & Service | 68 (18.1%) | 308 (81.9%) |
| Total (Category) | 880 (39.1%) | 1,369 (60.9%) |
| Total (Overall) | 6,141 (55.4%) | 4,940 (44.6%) |
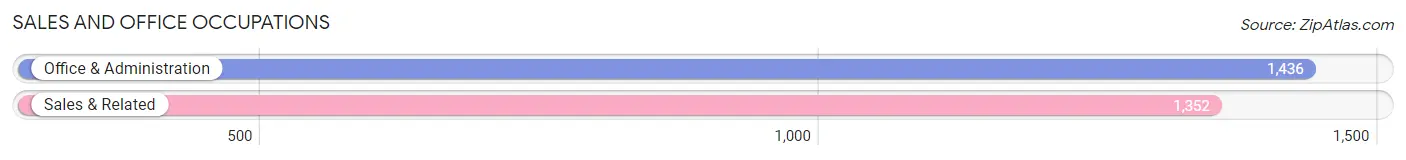
Sales and Office Occupations
The most common Sales and Office occupations in Montgomery are Office & Administration (1,436 | 13.0%), and Sales & Related (1,352 | 12.2%).
Sales and Office Occupations by Sex
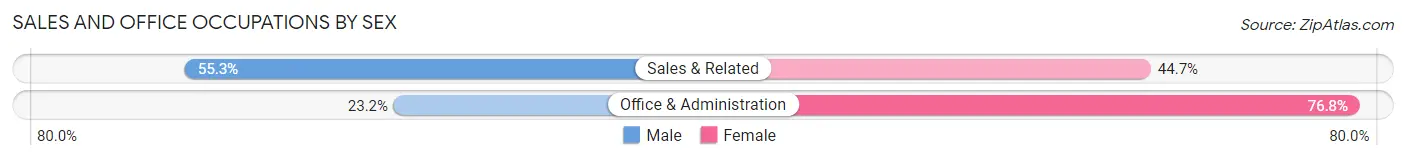
| Occupation | Male | Female |
| Sales & Related | 748 (55.3%) | 604 (44.7%) |
| Office & Administration | 333 (23.2%) | 1,103 (76.8%) |
| Total (Category) | 1,081 (38.8%) | 1,707 (61.2%) |
| Total (Overall) | 6,141 (55.4%) | 4,940 (44.6%) |
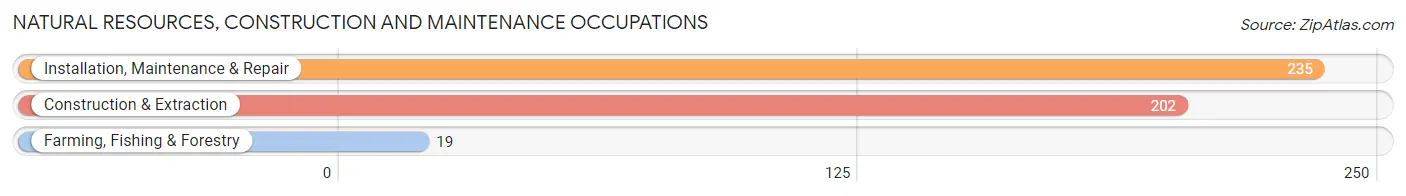
Natural Resources, Construction and Maintenance Occupations
The most common Natural Resources, Construction and Maintenance occupations in Montgomery are Installation, Maintenance & Repair (235 | 2.1%), Construction & Extraction (202 | 1.8%), and Farming, Fishing & Forestry (19 | 0.2%).
Natural Resources, Construction and Maintenance Occupations by Sex
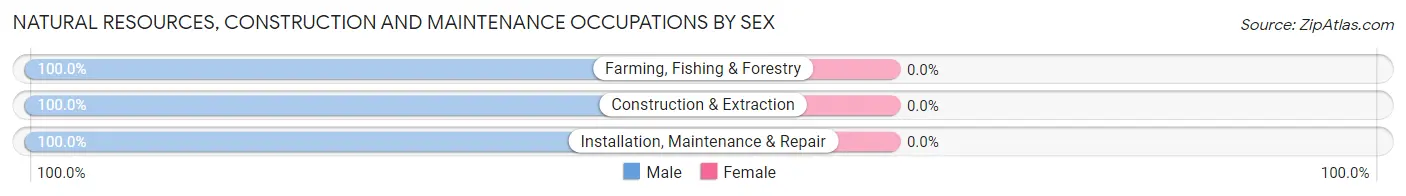
| Occupation | Male | Female |
| Farming, Fishing & Forestry | 19 (100.0%) | 0 (0.0%) |
| Construction & Extraction | 202 (100.0%) | 0 (0.0%) |
| Installation, Maintenance & Repair | 235 (100.0%) | 0 (0.0%) |
| Total (Category) | 456 (100.0%) | 0 (0.0%) |
| Total (Overall) | 6,141 (55.4%) | 4,940 (44.6%) |
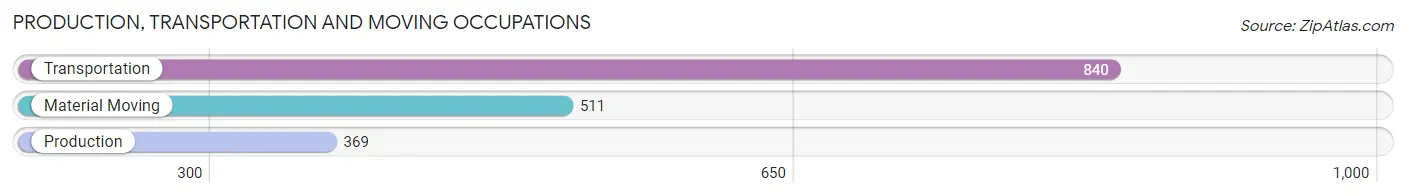
Production, Transportation and Moving Occupations
The most common Production, Transportation and Moving occupations in Montgomery are Transportation (840 | 7.6%), Material Moving (511 | 4.6%), and Production (369 | 3.3%).
Production, Transportation and Moving Occupations by Sex
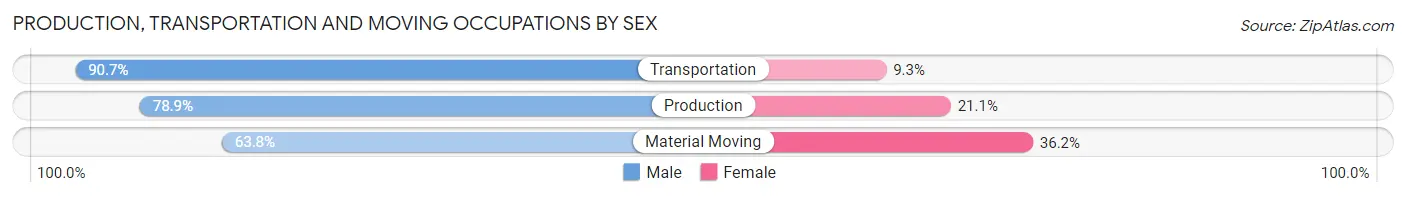
| Occupation | Male | Female |
| Production | 291 (78.9%) | 78 (21.1%) |
| Transportation | 762 (90.7%) | 78 (9.3%) |
| Material Moving | 326 (63.8%) | 185 (36.2%) |
| Total (Category) | 1,379 (80.2%) | 341 (19.8%) |
| Total (Overall) | 6,141 (55.4%) | 4,940 (44.6%) |
Employment Industries by Sex in Montgomery
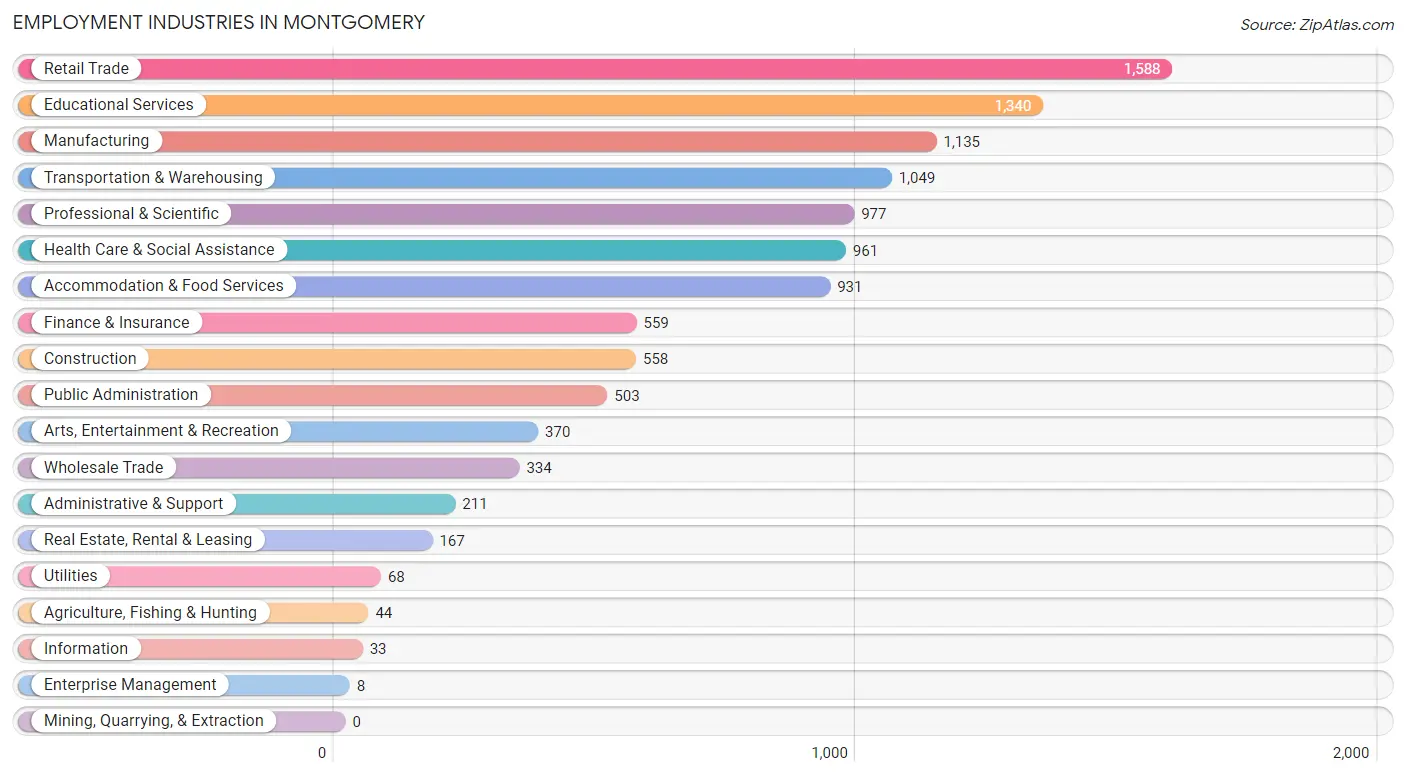
Employment Industries in Montgomery
The major employment industries in Montgomery include Retail Trade (1,588 | 14.3%), Educational Services (1,340 | 12.1%), Manufacturing (1,135 | 10.2%), Transportation & Warehousing (1,049 | 9.5%), and Professional & Scientific (977 | 8.8%).
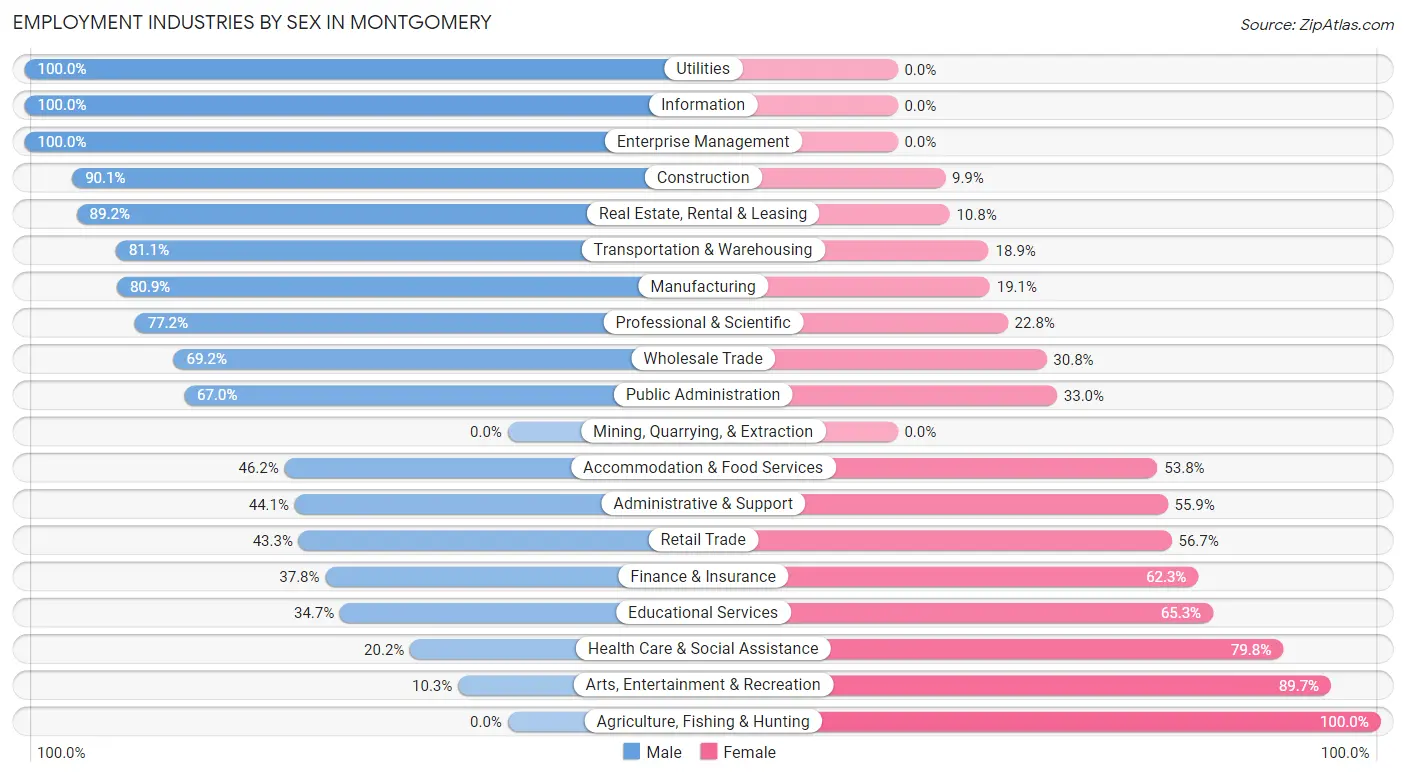
Employment Industries by Sex in Montgomery
The Montgomery industries that see more men than women are Utilities (100.0%), Information (100.0%), and Enterprise Management (100.0%), whereas the industries that tend to have a higher number of women are Agriculture, Fishing & Hunting (100.0%), Arts, Entertainment & Recreation (89.7%), and Health Care & Social Assistance (79.8%).
| Industry | Male | Female |
| Agriculture, Fishing & Hunting | 0 (0.0%) | 44 (100.0%) |
| Mining, Quarrying, & Extraction | 0 (0.0%) | 0 (0.0%) |
| Construction | 503 (90.1%) | 55 (9.9%) |
| Manufacturing | 918 (80.9%) | 217 (19.1%) |
| Wholesale Trade | 231 (69.2%) | 103 (30.8%) |
| Retail Trade | 687 (43.3%) | 901 (56.7%) |
| Transportation & Warehousing | 851 (81.1%) | 198 (18.9%) |
| Utilities | 68 (100.0%) | 0 (0.0%) |
| Information | 33 (100.0%) | 0 (0.0%) |
| Finance & Insurance | 211 (37.8%) | 348 (62.3%) |
| Real Estate, Rental & Leasing | 149 (89.2%) | 18 (10.8%) |
| Professional & Scientific | 754 (77.2%) | 223 (22.8%) |
| Enterprise Management | 8 (100.0%) | 0 (0.0%) |
| Administrative & Support | 93 (44.1%) | 118 (55.9%) |
| Educational Services | 465 (34.7%) | 875 (65.3%) |
| Health Care & Social Assistance | 194 (20.2%) | 767 (79.8%) |
| Arts, Entertainment & Recreation | 38 (10.3%) | 332 (89.7%) |
| Accommodation & Food Services | 430 (46.2%) | 501 (53.8%) |
| Public Administration | 337 (67.0%) | 166 (33.0%) |
| Total | 6,141 (55.4%) | 4,940 (44.6%) |
Education in Montgomery
School Enrollment in Montgomery
The most common levels of schooling among the 6,900 students in Montgomery are middle school (1,711 | 24.8%), high school (1,705 | 24.7%), and college / undergraduate (1,422 | 20.6%).
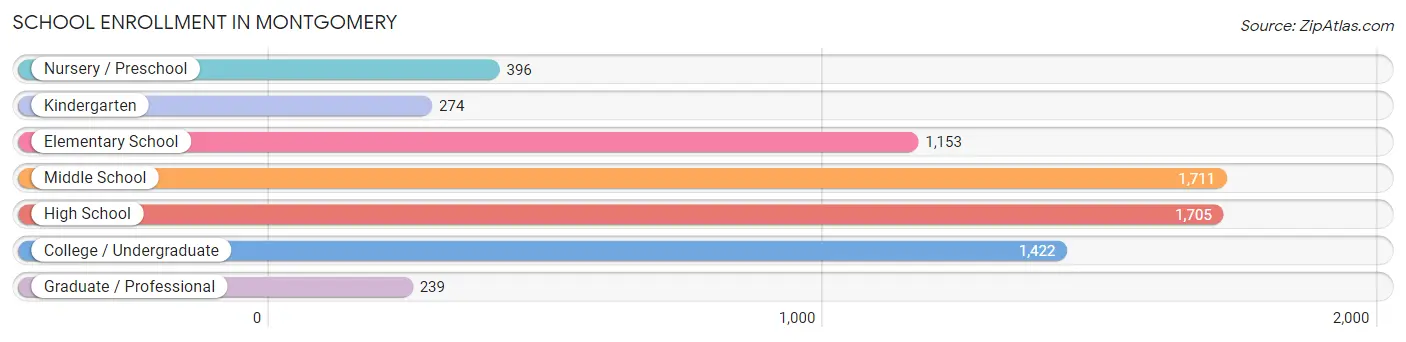
| School Level | # Students | % Students |
| Nursery / Preschool | 396 | 5.7% |
| Kindergarten | 274 | 4.0% |
| Elementary School | 1,153 | 16.7% |
| Middle School | 1,711 | 24.8% |
| High School | 1,705 | 24.7% |
| College / Undergraduate | 1,422 | 20.6% |
| Graduate / Professional | 239 | 3.5% |
| Total | 6,900 | 100.0% |
School Enrollment by Age by Funding Source in Montgomery
Out of a total of 6,900 students who are enrolled in schools in Montgomery, 1,352 (19.6%) attend a private institution, while the remaining 5,548 (80.4%) are enrolled in public schools. The age group of 25 to 34 year olds has the highest likelihood of being enrolled in private schools, with 230 (83.9% in the age bracket) enrolled. Conversely, the age group of 5 to 9 year old has the lowest likelihood of being enrolled in a private school, with 1,273 (95.5% in the age bracket) attending a public institution.
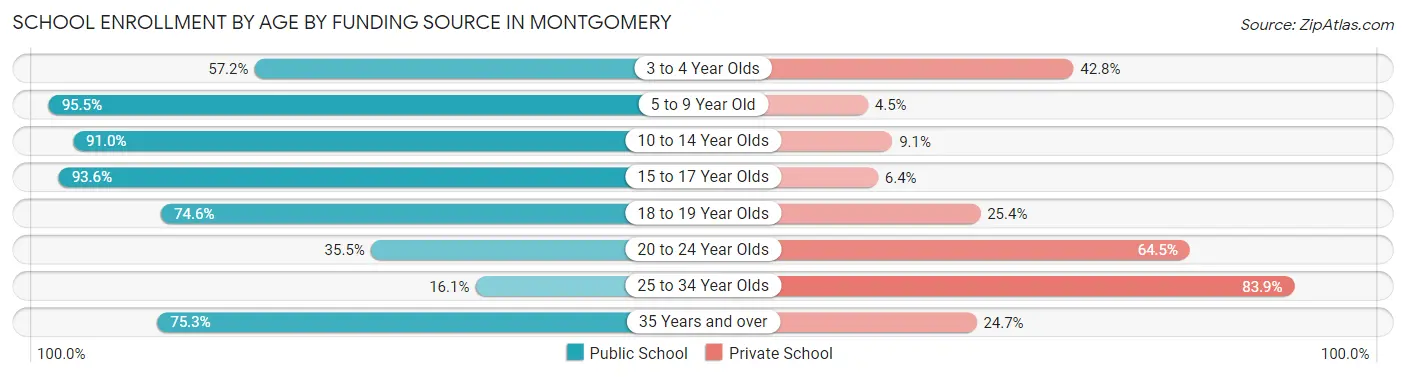
| Age Bracket | Public School | Private School |
| 3 to 4 Year Olds | 202 (57.2%) | 151 (42.8%) |
| 5 to 9 Year Old | 1,273 (95.5%) | 60 (4.5%) |
| 10 to 14 Year Olds | 1,798 (90.9%) | 179 (9.0%) |
| 15 to 17 Year Olds | 1,355 (93.6%) | 92 (6.4%) |
| 18 to 19 Year Olds | 507 (74.6%) | 173 (25.4%) |
| 20 to 24 Year Olds | 231 (35.5%) | 419 (64.5%) |
| 25 to 34 Year Olds | 44 (16.1%) | 230 (83.9%) |
| 35 Years and over | 140 (75.3%) | 46 (24.7%) |
| Total | 5,548 (80.4%) | 1,352 (19.6%) |
Educational Attainment by Field of Study in Montgomery
Business (956 | 25.9%), education (531 | 14.4%), social sciences (472 | 12.8%), arts & humanities (297 | 8.0%), and bio, nature & agricultural (251 | 6.8%) are the most common fields of study among 3,696 individuals in Montgomery who have obtained a bachelor's degree or higher.
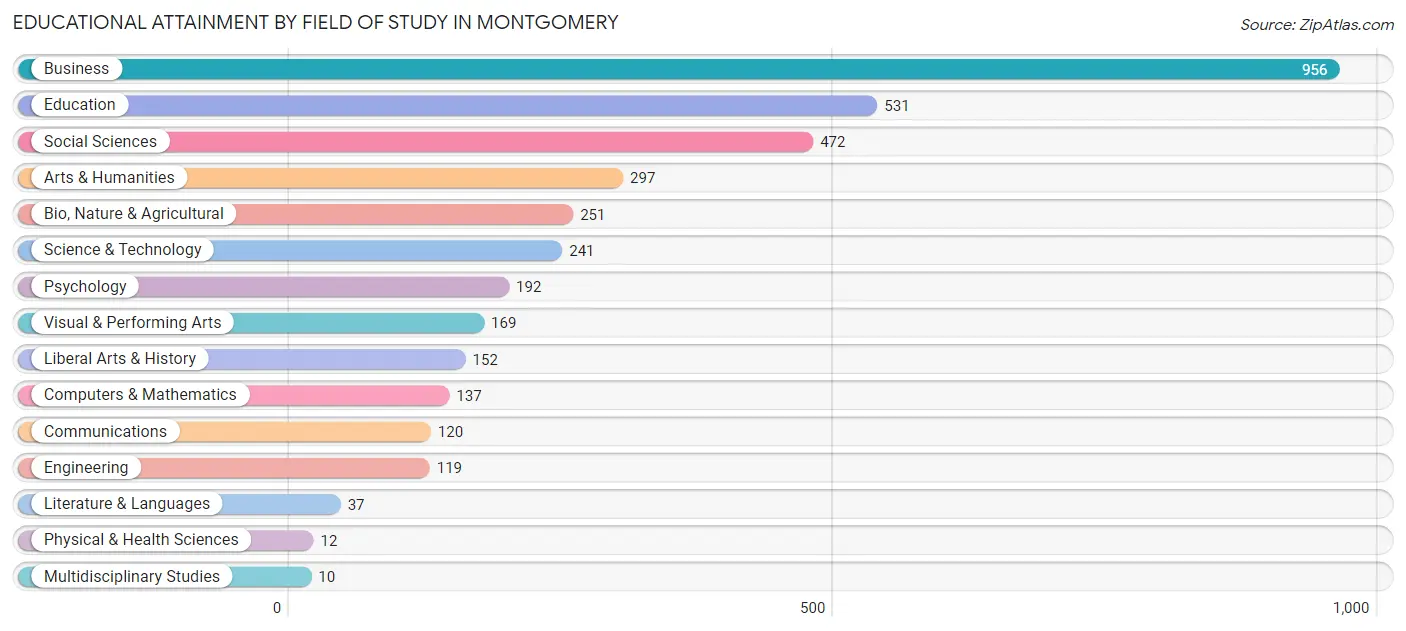
| Field of Study | # Graduates | % Graduates |
| Computers & Mathematics | 137 | 3.7% |
| Bio, Nature & Agricultural | 251 | 6.8% |
| Physical & Health Sciences | 12 | 0.3% |
| Psychology | 192 | 5.2% |
| Social Sciences | 472 | 12.8% |
| Engineering | 119 | 3.2% |
| Multidisciplinary Studies | 10 | 0.3% |
| Science & Technology | 241 | 6.5% |
| Business | 956 | 25.9% |
| Education | 531 | 14.4% |
| Literature & Languages | 37 | 1.0% |
| Liberal Arts & History | 152 | 4.1% |
| Visual & Performing Arts | 169 | 4.6% |
| Communications | 120 | 3.3% |
| Arts & Humanities | 297 | 8.0% |
| Total | 3,696 | 100.0% |
Transportation & Commute in Montgomery
Vehicle Availability by Sex in Montgomery
The most prevalent vehicle ownership categories in Montgomery are males with 2 vehicles (2,538, accounting for 41.2%) and females with 2 vehicles (2,025, making up 51.7%).
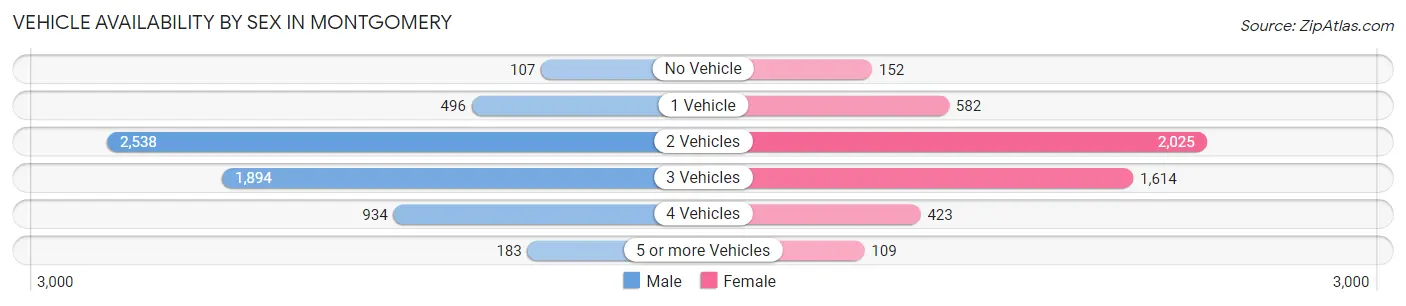
| Vehicles Available | Male | Female |
| No Vehicle | 107 (1.7%) | 152 (3.1%) |
| 1 Vehicle | 496 (8.1%) | 582 (11.9%) |
| 2 Vehicles | 2,538 (41.2%) | 2,025 (41.3%) |
| 3 Vehicles | 1,894 (30.8%) | 1,614 (32.9%) |
| 4 Vehicles | 934 (15.2%) | 423 (8.6%) |
| 5 or more Vehicles | 183 (3.0%) | 109 (2.2%) |
| Total | 6,152 (100.0%) | 4,905 (100.0%) |
Commute Time in Montgomery
The most frequently occuring commute durations in Montgomery are 45 to 59 minutes (1,399 commuters, 13.8%), 60 to 89 minutes (1,393 commuters, 13.7%), and 15 to 19 minutes (1,314 commuters, 13.0%).
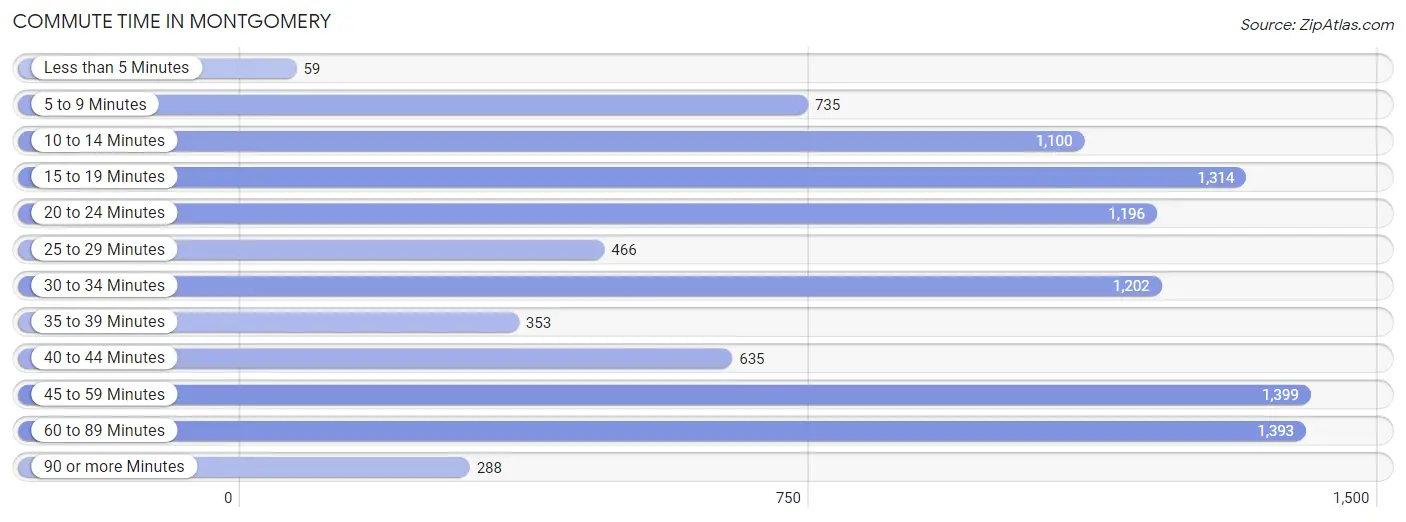
| Commute Time | # Commuters | % Commuters |
| Less than 5 Minutes | 59 | 0.6% |
| 5 to 9 Minutes | 735 | 7.2% |
| 10 to 14 Minutes | 1,100 | 10.8% |
| 15 to 19 Minutes | 1,314 | 13.0% |
| 20 to 24 Minutes | 1,196 | 11.8% |
| 25 to 29 Minutes | 466 | 4.6% |
| 30 to 34 Minutes | 1,202 | 11.8% |
| 35 to 39 Minutes | 353 | 3.5% |
| 40 to 44 Minutes | 635 | 6.3% |
| 45 to 59 Minutes | 1,399 | 13.8% |
| 60 to 89 Minutes | 1,393 | 13.7% |
| 90 or more Minutes | 288 | 2.8% |
Commute Time by Sex in Montgomery
The most common commute times in Montgomery are 60 to 89 minutes (1,106 commuters, 19.1%) for males and 20 to 24 minutes (717 commuters, 16.5%) for females.
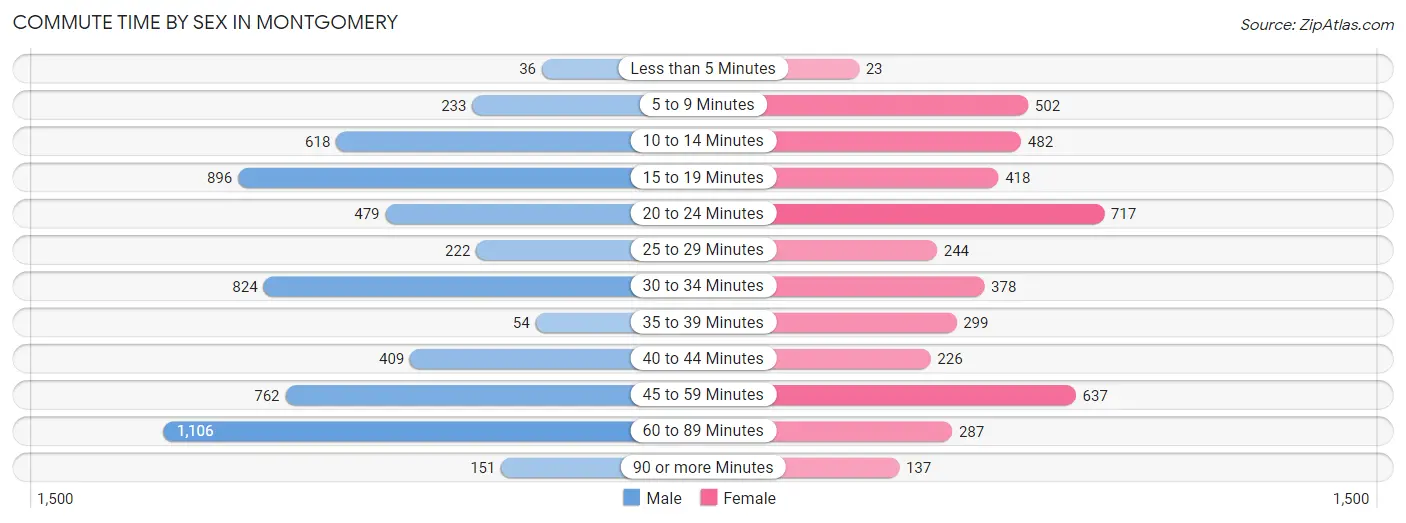
| Commute Time | Male | Female |
| Less than 5 Minutes | 36 (0.6%) | 23 (0.5%) |
| 5 to 9 Minutes | 233 (4.0%) | 502 (11.5%) |
| 10 to 14 Minutes | 618 (10.7%) | 482 (11.1%) |
| 15 to 19 Minutes | 896 (15.5%) | 418 (9.6%) |
| 20 to 24 Minutes | 479 (8.3%) | 717 (16.5%) |
| 25 to 29 Minutes | 222 (3.8%) | 244 (5.6%) |
| 30 to 34 Minutes | 824 (14.2%) | 378 (8.7%) |
| 35 to 39 Minutes | 54 (0.9%) | 299 (6.9%) |
| 40 to 44 Minutes | 409 (7.1%) | 226 (5.2%) |
| 45 to 59 Minutes | 762 (13.2%) | 637 (14.6%) |
| 60 to 89 Minutes | 1,106 (19.1%) | 287 (6.6%) |
| 90 or more Minutes | 151 (2.6%) | 137 (3.2%) |
Time of Departure to Work by Sex in Montgomery
The most frequent times of departure to work in Montgomery are 7:00 AM to 7:29 AM (1,053, 18.2%) for males and 7:00 AM to 7:29 AM (1,115, 25.6%) for females.
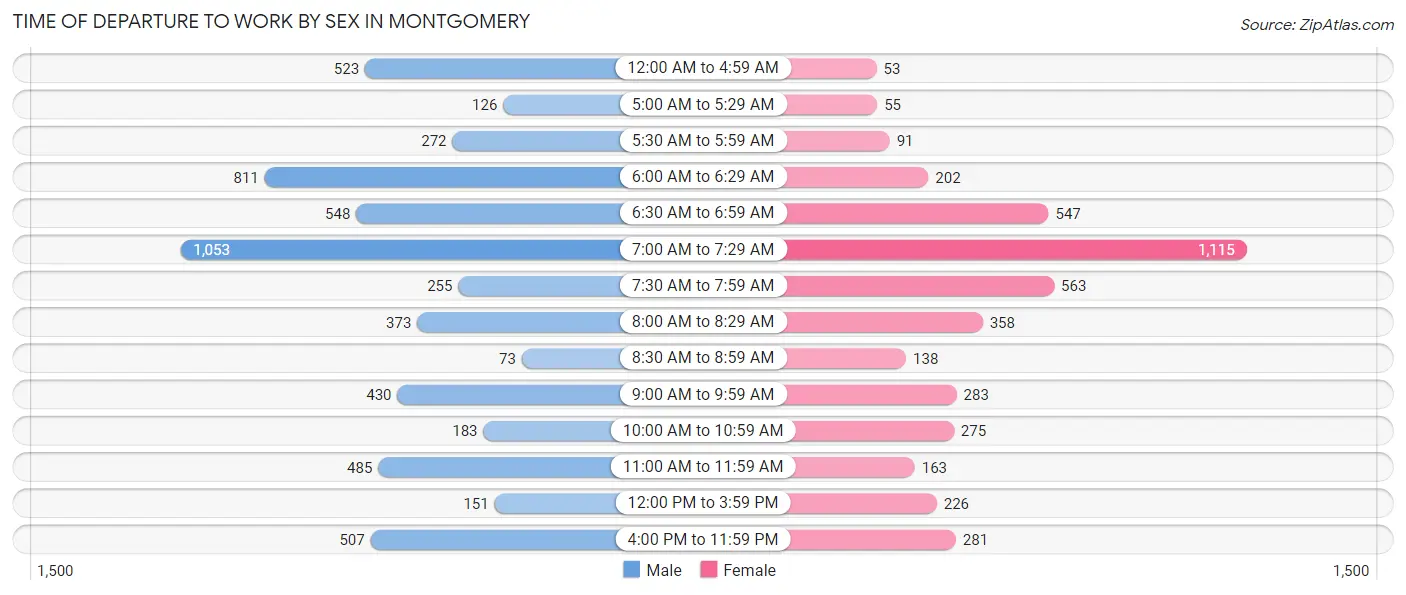
| Time of Departure | Male | Female |
| 12:00 AM to 4:59 AM | 523 (9.0%) | 53 (1.2%) |
| 5:00 AM to 5:29 AM | 126 (2.2%) | 55 (1.3%) |
| 5:30 AM to 5:59 AM | 272 (4.7%) | 91 (2.1%) |
| 6:00 AM to 6:29 AM | 811 (14.0%) | 202 (4.6%) |
| 6:30 AM to 6:59 AM | 548 (9.5%) | 547 (12.6%) |
| 7:00 AM to 7:29 AM | 1,053 (18.2%) | 1,115 (25.6%) |
| 7:30 AM to 7:59 AM | 255 (4.4%) | 563 (12.9%) |
| 8:00 AM to 8:29 AM | 373 (6.4%) | 358 (8.2%) |
| 8:30 AM to 8:59 AM | 73 (1.3%) | 138 (3.2%) |
| 9:00 AM to 9:59 AM | 430 (7.4%) | 283 (6.5%) |
| 10:00 AM to 10:59 AM | 183 (3.2%) | 275 (6.3%) |
| 11:00 AM to 11:59 AM | 485 (8.4%) | 163 (3.7%) |
| 12:00 PM to 3:59 PM | 151 (2.6%) | 226 (5.2%) |
| 4:00 PM to 11:59 PM | 507 (8.8%) | 281 (6.5%) |
| Total | 5,790 (100.0%) | 4,350 (100.0%) |
Housing Occupancy in Montgomery
Occupancy by Ownership in Montgomery
Of the total 6,619 dwellings in Montgomery, owner-occupied units account for 5,054 (76.4%), while renter-occupied units make up 1,565 (23.6%).
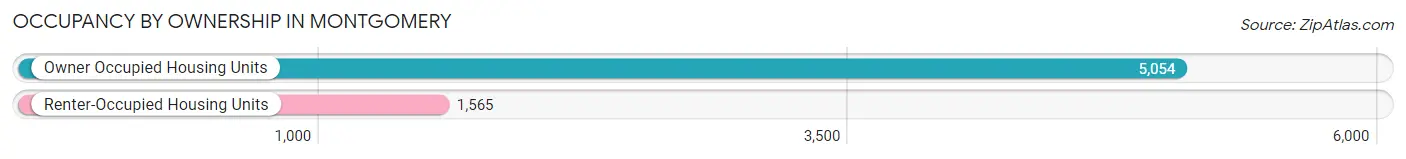
| Occupancy | # Housing Units | % Housing Units |
| Owner Occupied Housing Units | 5,054 | 76.4% |
| Renter-Occupied Housing Units | 1,565 | 23.6% |
| Total Occupied Housing Units | 6,619 | 100.0% |
Occupancy by Household Size in Montgomery
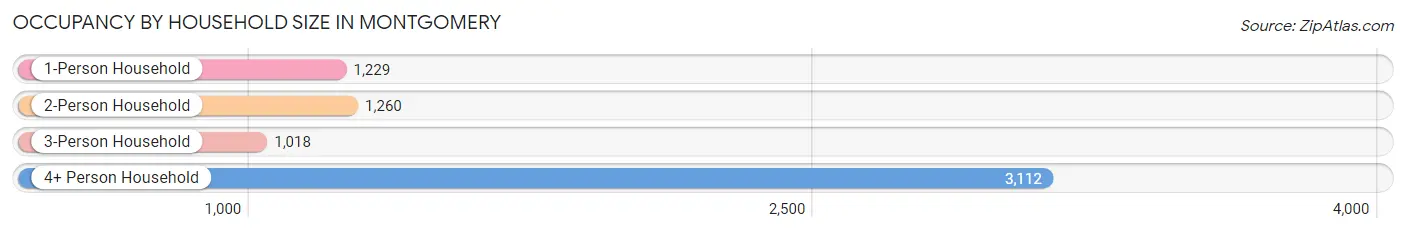
| Household Size | # Housing Units | % Housing Units |
| 1-Person Household | 1,229 | 18.6% |
| 2-Person Household | 1,260 | 19.0% |
| 3-Person Household | 1,018 | 15.4% |
| 4+ Person Household | 3,112 | 47.0% |
| Total Housing Units | 6,619 | 100.0% |
Occupancy by Ownership by Household Size in Montgomery
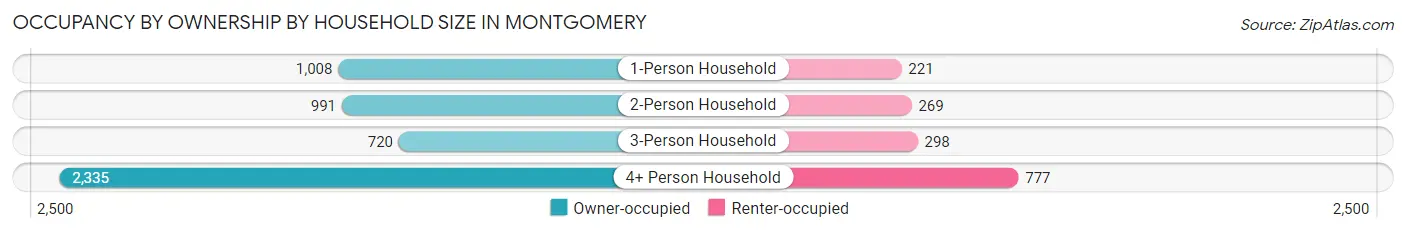
| Household Size | Owner-occupied | Renter-occupied |
| 1-Person Household | 1,008 (82.0%) | 221 (18.0%) |
| 2-Person Household | 991 (78.6%) | 269 (21.3%) |
| 3-Person Household | 720 (70.7%) | 298 (29.3%) |
| 4+ Person Household | 2,335 (75.0%) | 777 (25.0%) |
| Total Housing Units | 5,054 (76.4%) | 1,565 (23.6%) |
Occupancy by Educational Attainment in Montgomery
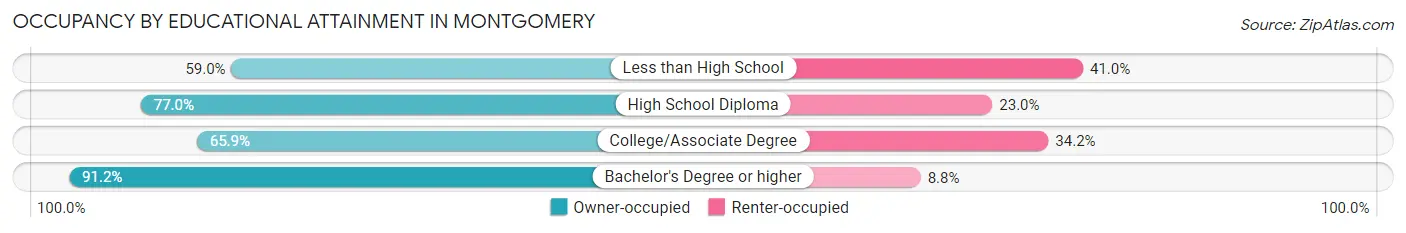
| Household Size | Owner-occupied | Renter-occupied |
| Less than High School | 269 (59.0%) | 187 (41.0%) |
| High School Diploma | 1,326 (77.0%) | 397 (23.0%) |
| College/Associate Degree | 1,531 (65.8%) | 794 (34.2%) |
| Bachelor's Degree or higher | 1,928 (91.2%) | 187 (8.8%) |
Occupancy by Age of Householder in Montgomery
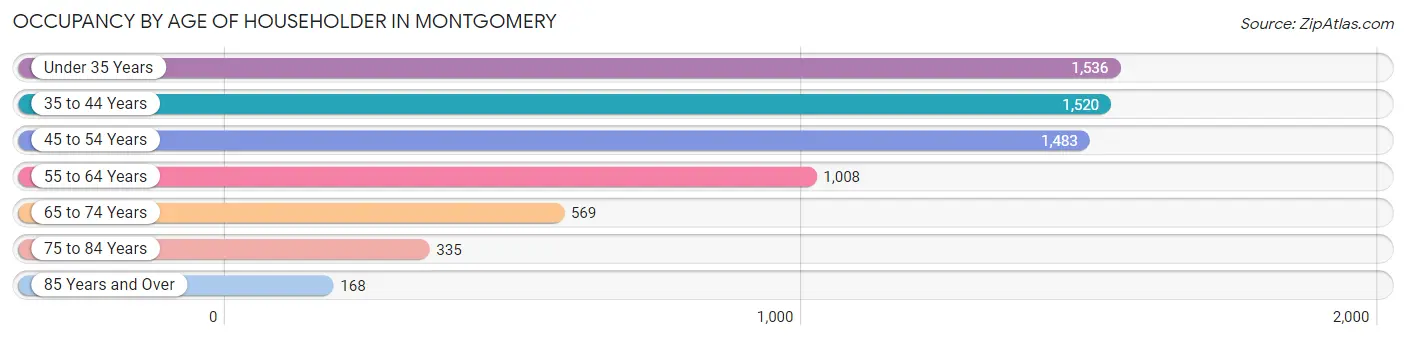
| Age Bracket | # Households | % Households |
| Under 35 Years | 1,536 | 23.2% |
| 35 to 44 Years | 1,520 | 23.0% |
| 45 to 54 Years | 1,483 | 22.4% |
| 55 to 64 Years | 1,008 | 15.2% |
| 65 to 74 Years | 569 | 8.6% |
| 75 to 84 Years | 335 | 5.1% |
| 85 Years and Over | 168 | 2.5% |
| Total | 6,619 | 100.0% |
Housing Finances in Montgomery
Median Income by Occupancy in Montgomery
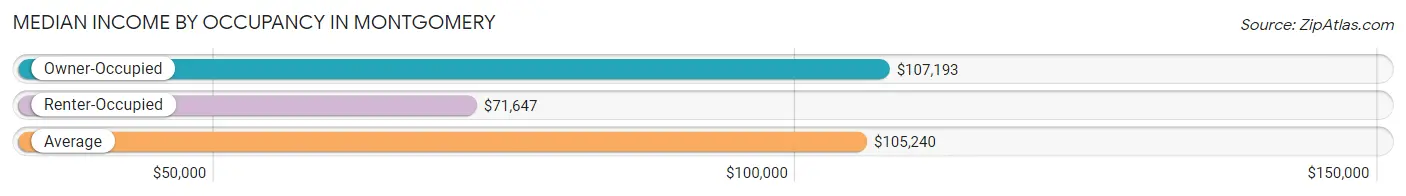
| Occupancy Type | # Households | Median Income |
| Owner-Occupied | 5,054 (76.4%) | $107,193 |
| Renter-Occupied | 1,565 (23.6%) | $71,647 |
| Average | 6,619 (100.0%) | $105,240 |
Occupancy by Householder Income Bracket in Montgomery
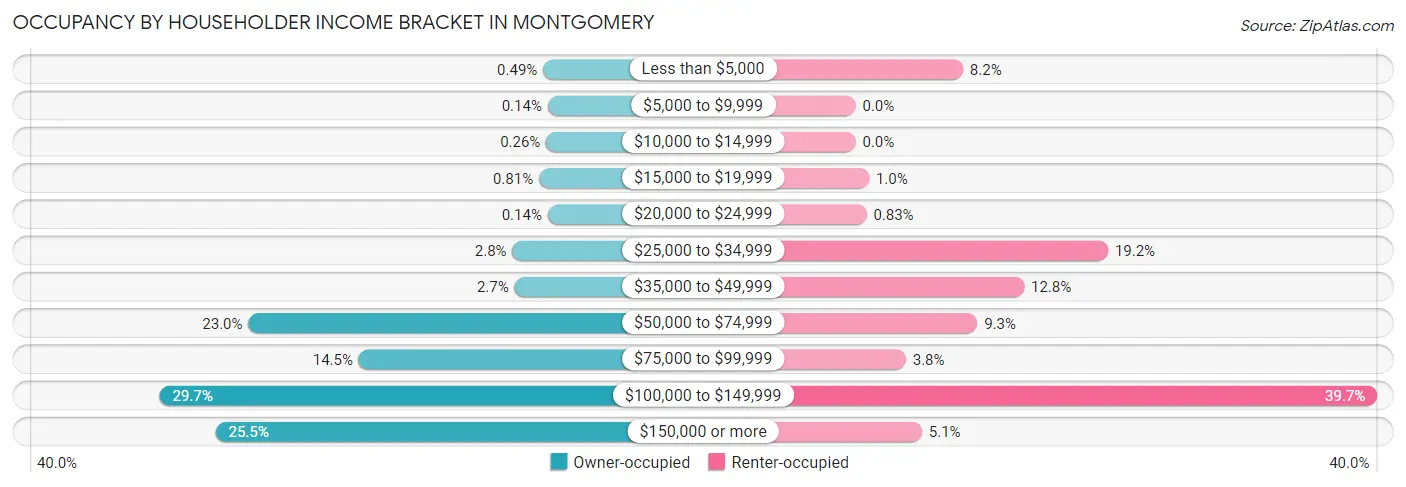
| Income Bracket | Owner-occupied | Renter-occupied |
| Less than $5,000 | 25 (0.5%) | 128 (8.2%) |
| $5,000 to $9,999 | 7 (0.1%) | 0 (0.0%) |
| $10,000 to $14,999 | 13 (0.3%) | 0 (0.0%) |
| $15,000 to $19,999 | 41 (0.8%) | 16 (1.0%) |
| $20,000 to $24,999 | 7 (0.1%) | 13 (0.8%) |
| $25,000 to $34,999 | 143 (2.8%) | 301 (19.2%) |
| $35,000 to $49,999 | 135 (2.7%) | 201 (12.8%) |
| $50,000 to $74,999 | 1,160 (23.0%) | 145 (9.3%) |
| $75,000 to $99,999 | 735 (14.5%) | 60 (3.8%) |
| $100,000 to $149,999 | 1,502 (29.7%) | 622 (39.7%) |
| $150,000 or more | 1,286 (25.5%) | 79 (5.1%) |
| Total | 5,054 (100.0%) | 1,565 (100.0%) |
Monthly Housing Cost Tiers in Montgomery
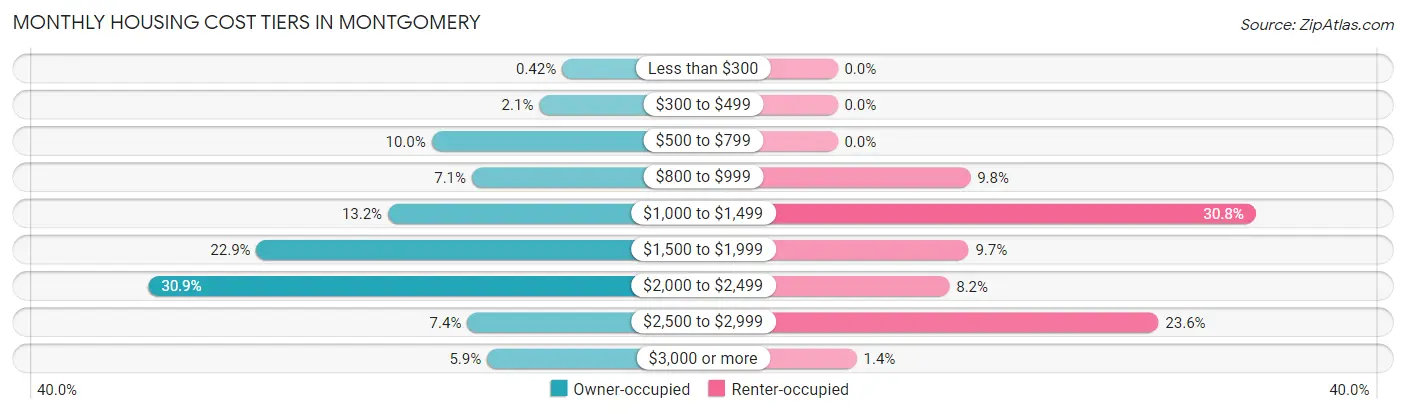
| Monthly Cost | Owner-occupied | Renter-occupied |
| Less than $300 | 21 (0.4%) | 0 (0.0%) |
| $300 to $499 | 106 (2.1%) | 0 (0.0%) |
| $500 to $799 | 507 (10.0%) | 0 (0.0%) |
| $800 to $999 | 357 (7.1%) | 153 (9.8%) |
| $1,000 to $1,499 | 669 (13.2%) | 482 (30.8%) |
| $1,500 to $1,999 | 1,159 (22.9%) | 151 (9.7%) |
| $2,000 to $2,499 | 1,561 (30.9%) | 129 (8.2%) |
| $2,500 to $2,999 | 374 (7.4%) | 370 (23.6%) |
| $3,000 or more | 300 (5.9%) | 22 (1.4%) |
| Total | 5,054 (100.0%) | 1,565 (100.0%) |
Physical Housing Characteristics in Montgomery
Housing Structures in Montgomery
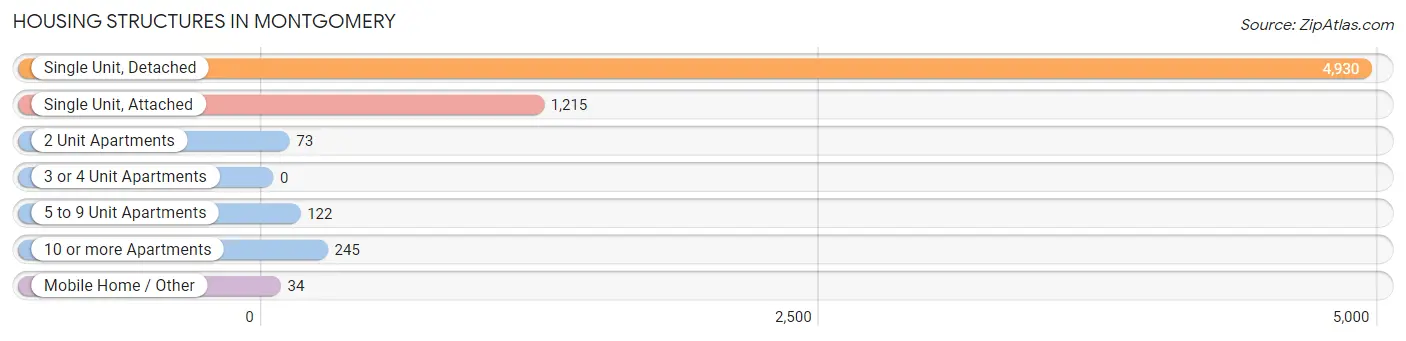
| Structure Type | # Housing Units | % Housing Units |
| Single Unit, Detached | 4,930 | 74.5% |
| Single Unit, Attached | 1,215 | 18.4% |
| 2 Unit Apartments | 73 | 1.1% |
| 3 or 4 Unit Apartments | 0 | 0.0% |
| 5 to 9 Unit Apartments | 122 | 1.8% |
| 10 or more Apartments | 245 | 3.7% |
| Mobile Home / Other | 34 | 0.5% |
| Total | 6,619 | 100.0% |
Housing Structures by Occupancy in Montgomery
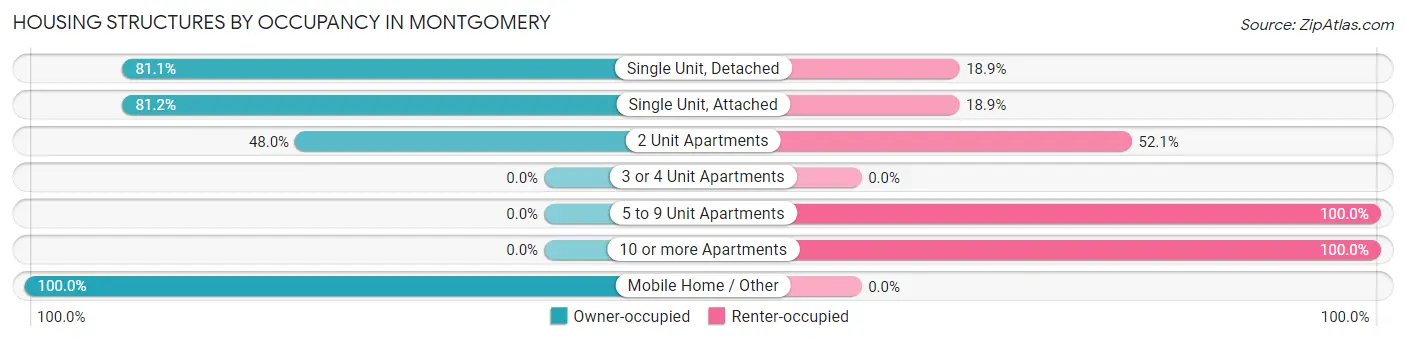
| Structure Type | Owner-occupied | Renter-occupied |
| Single Unit, Detached | 3,999 (81.1%) | 931 (18.9%) |
| Single Unit, Attached | 986 (81.1%) | 229 (18.9%) |
| 2 Unit Apartments | 35 (47.9%) | 38 (52.0%) |
| 3 or 4 Unit Apartments | 0 (0.0%) | 0 (0.0%) |
| 5 to 9 Unit Apartments | 0 (0.0%) | 122 (100.0%) |
| 10 or more Apartments | 0 (0.0%) | 245 (100.0%) |
| Mobile Home / Other | 34 (100.0%) | 0 (0.0%) |
| Total | 5,054 (76.4%) | 1,565 (23.6%) |
Housing Structures by Number of Rooms in Montgomery
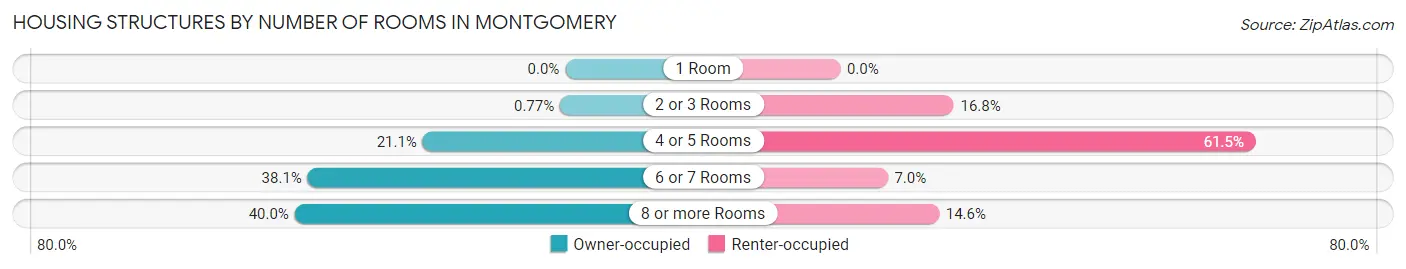
| Number of Rooms | Owner-occupied | Renter-occupied |
| 1 Room | 0 (0.0%) | 0 (0.0%) |
| 2 or 3 Rooms | 39 (0.8%) | 263 (16.8%) |
| 4 or 5 Rooms | 1,066 (21.1%) | 963 (61.5%) |
| 6 or 7 Rooms | 1,926 (38.1%) | 110 (7.0%) |
| 8 or more Rooms | 2,023 (40.0%) | 229 (14.6%) |
| Total | 5,054 (100.0%) | 1,565 (100.0%) |
Housing Structure by Heating Type in Montgomery
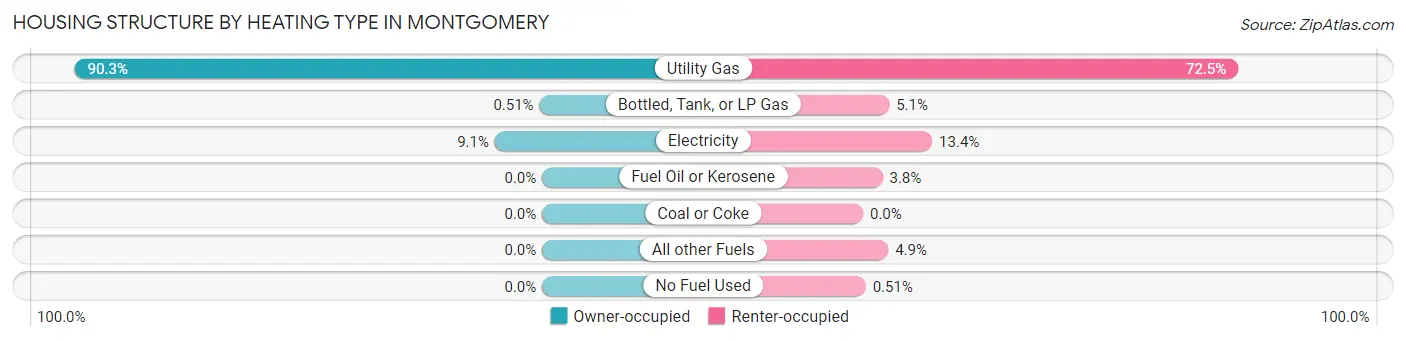
| Heating Type | Owner-occupied | Renter-occupied |
| Utility Gas | 4,566 (90.3%) | 1,134 (72.5%) |
| Bottled, Tank, or LP Gas | 26 (0.5%) | 79 (5.1%) |
| Electricity | 462 (9.1%) | 209 (13.4%) |
| Fuel Oil or Kerosene | 0 (0.0%) | 59 (3.8%) |
| Coal or Coke | 0 (0.0%) | 0 (0.0%) |
| All other Fuels | 0 (0.0%) | 76 (4.9%) |
| No Fuel Used | 0 (0.0%) | 8 (0.5%) |
| Total | 5,054 (100.0%) | 1,565 (100.0%) |
Household Vehicle Usage in Montgomery
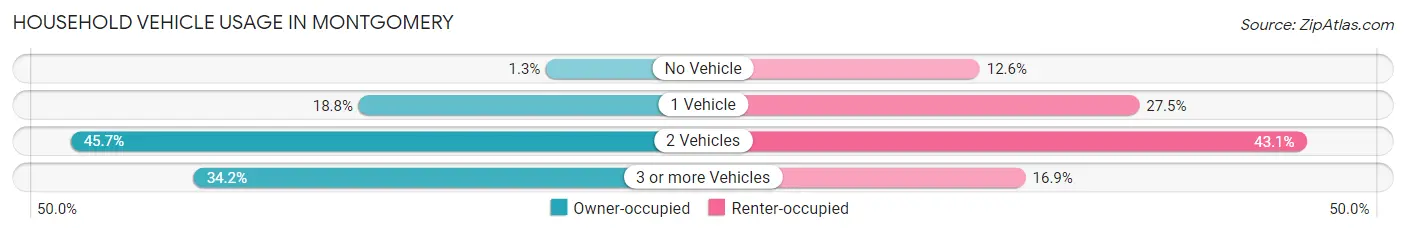
| Vehicles per Household | Owner-occupied | Renter-occupied |
| No Vehicle | 66 (1.3%) | 197 (12.6%) |
| 1 Vehicle | 950 (18.8%) | 430 (27.5%) |
| 2 Vehicles | 2,309 (45.7%) | 674 (43.1%) |
| 3 or more Vehicles | 1,729 (34.2%) | 264 (16.9%) |
| Total | 5,054 (100.0%) | 1,565 (100.0%) |
Real Estate & Mortgages in Montgomery
Real Estate and Mortgage Overview in Montgomery
| Characteristic | Without Mortgage | With Mortgage |
| Housing Units | 1,185 | 3,869 |
| Median Property Value | $254,800 | $267,900 |
| Median Household Income | $76,250 | $1,195 |
| Monthly Housing Costs | $790 | $300 |
| Real Estate Taxes | $5,678 | $16 |
Property Value by Mortgage Status in Montgomery
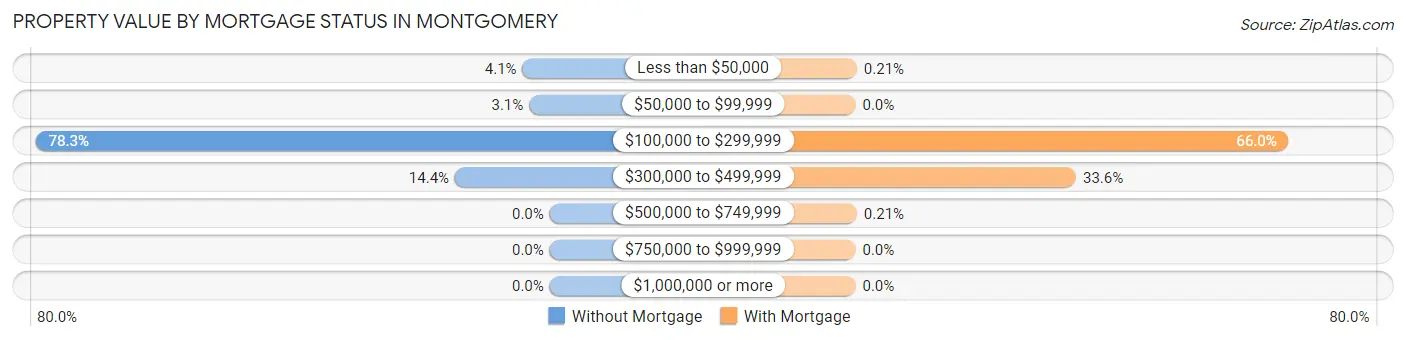
| Property Value | Without Mortgage | With Mortgage |
| Less than $50,000 | 49 (4.1%) | 8 (0.2%) |
| $50,000 to $99,999 | 37 (3.1%) | 0 (0.0%) |
| $100,000 to $299,999 | 928 (78.3%) | 2,553 (66.0%) |
| $300,000 to $499,999 | 171 (14.4%) | 1,300 (33.6%) |
| $500,000 to $749,999 | 0 (0.0%) | 8 (0.2%) |
| $750,000 to $999,999 | 0 (0.0%) | 0 (0.0%) |
| $1,000,000 or more | 0 (0.0%) | 0 (0.0%) |
| Total | 1,185 (100.0%) | 3,869 (100.0%) |
Household Income by Mortgage Status in Montgomery
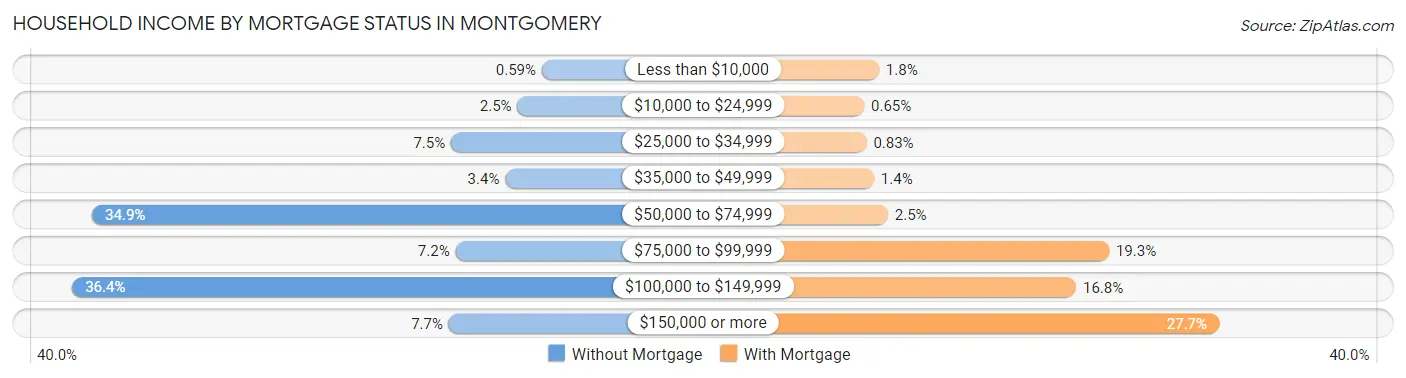
| Household Income | Without Mortgage | With Mortgage |
| Less than $10,000 | 7 (0.6%) | 69 (1.8%) |
| $10,000 to $24,999 | 29 (2.5%) | 25 (0.6%) |
| $25,000 to $34,999 | 89 (7.5%) | 32 (0.8%) |
| $35,000 to $49,999 | 40 (3.4%) | 54 (1.4%) |
| $50,000 to $74,999 | 413 (34.8%) | 95 (2.5%) |
| $75,000 to $99,999 | 85 (7.2%) | 747 (19.3%) |
| $100,000 to $149,999 | 431 (36.4%) | 650 (16.8%) |
| $150,000 or more | 91 (7.7%) | 1,071 (27.7%) |
| Total | 1,185 (100.0%) | 3,869 (100.0%) |
Property Value to Household Income Ratio in Montgomery
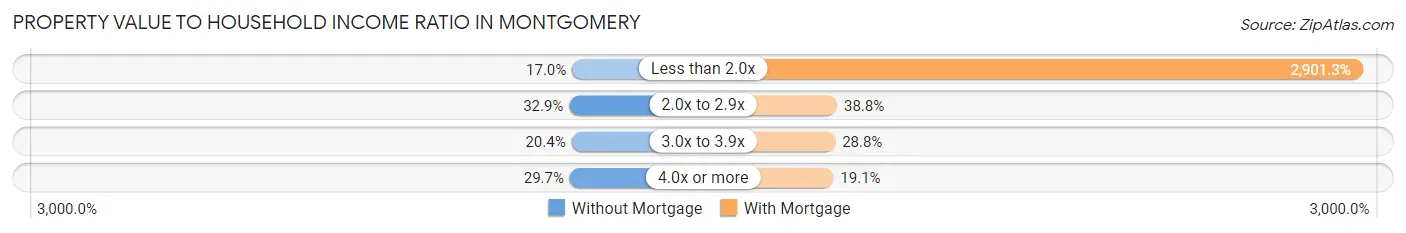
| Value-to-Income Ratio | Without Mortgage | With Mortgage |
| Less than 2.0x | 201 (17.0%) | 112,250 (2,901.3%) |
| 2.0x to 2.9x | 390 (32.9%) | 1,501 (38.8%) |
| 3.0x to 3.9x | 242 (20.4%) | 1,115 (28.8%) |
| 4.0x or more | 352 (29.7%) | 737 (19.1%) |
| Total | 1,185 (100.0%) | 3,869 (100.0%) |
Real Estate Taxes by Mortgage Status in Montgomery
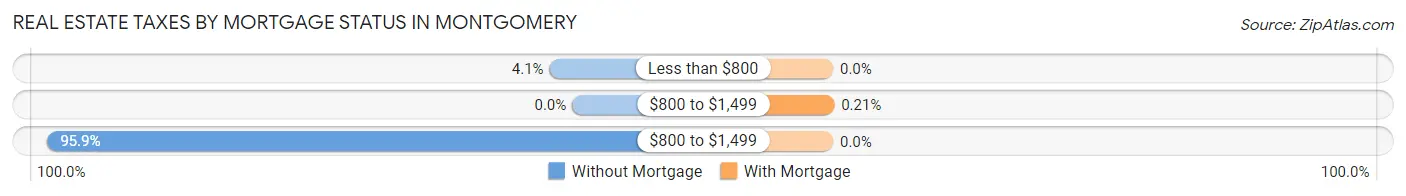
| Property Taxes | Without Mortgage | With Mortgage |
| Less than $800 | 49 (4.1%) | 0 (0.0%) |
| $800 to $1,499 | 0 (0.0%) | 8 (0.2%) |
| $800 to $1,499 | 1,136 (95.9%) | 0 (0.0%) |
| Total | 1,185 (100.0%) | 3,869 (100.0%) |
Health & Disability in Montgomery
Health Insurance Coverage by Age in Montgomery
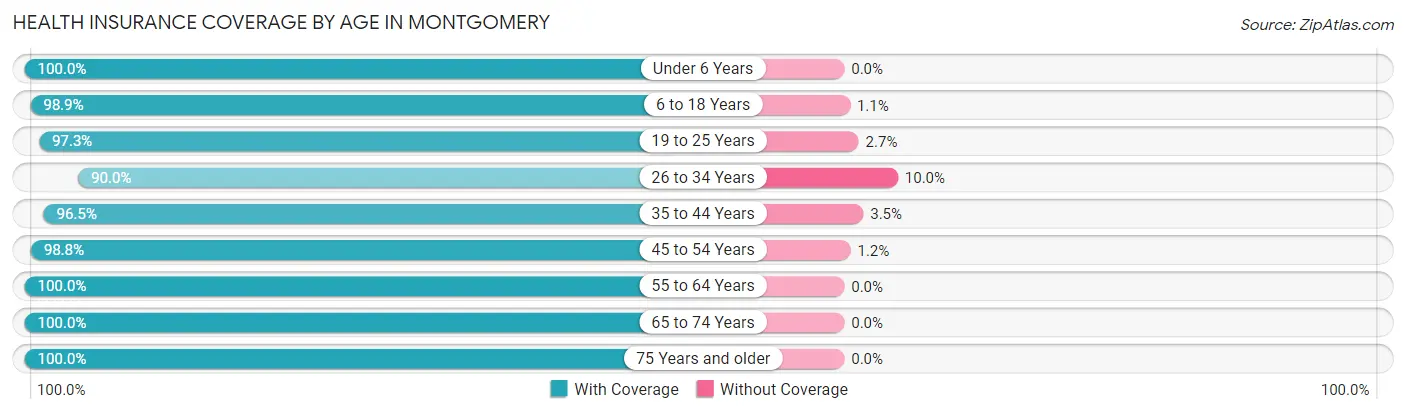
| Age Bracket | With Coverage | Without Coverage |
| Under 6 Years | 1,532 (100.0%) | 0 (0.0%) |
| 6 to 18 Years | 5,212 (98.9%) | 56 (1.1%) |
| 19 to 25 Years | 2,358 (97.3%) | 65 (2.7%) |
| 26 to 34 Years | 1,783 (90.0%) | 198 (10.0%) |
| 35 to 44 Years | 3,457 (96.5%) | 127 (3.5%) |
| 45 to 54 Years | 2,474 (98.8%) | 29 (1.2%) |
| 55 to 64 Years | 1,622 (100.0%) | 0 (0.0%) |
| 65 to 74 Years | 989 (100.0%) | 0 (0.0%) |
| 75 Years and older | 731 (100.0%) | 0 (0.0%) |
| Total | 20,158 (97.7%) | 475 (2.3%) |
Health Insurance Coverage by Citizenship Status in Montgomery
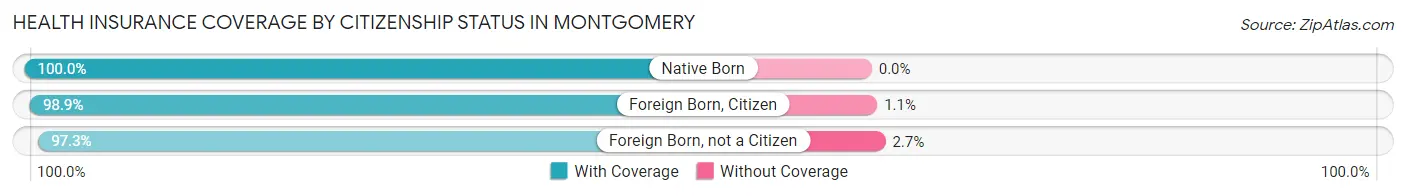
| Citizenship Status | With Coverage | Without Coverage |
| Native Born | 1,532 (100.0%) | 0 (0.0%) |
| Foreign Born, Citizen | 5,212 (98.9%) | 56 (1.1%) |
| Foreign Born, not a Citizen | 2,358 (97.3%) | 65 (2.7%) |
Health Insurance Coverage by Household Income in Montgomery
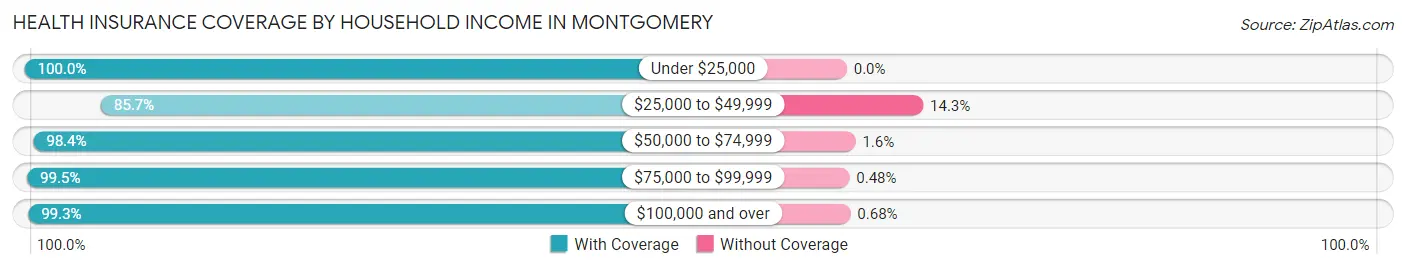
| Household Income | With Coverage | Without Coverage |
| Under $25,000 | 330 (100.0%) | 0 (0.0%) |
| $25,000 to $49,999 | 1,960 (85.7%) | 327 (14.3%) |
| $50,000 to $74,999 | 3,080 (98.4%) | 51 (1.6%) |
| $75,000 to $99,999 | 2,287 (99.5%) | 11 (0.5%) |
| $100,000 and over | 12,491 (99.3%) | 86 (0.7%) |
Public vs Private Health Insurance Coverage by Age in Montgomery
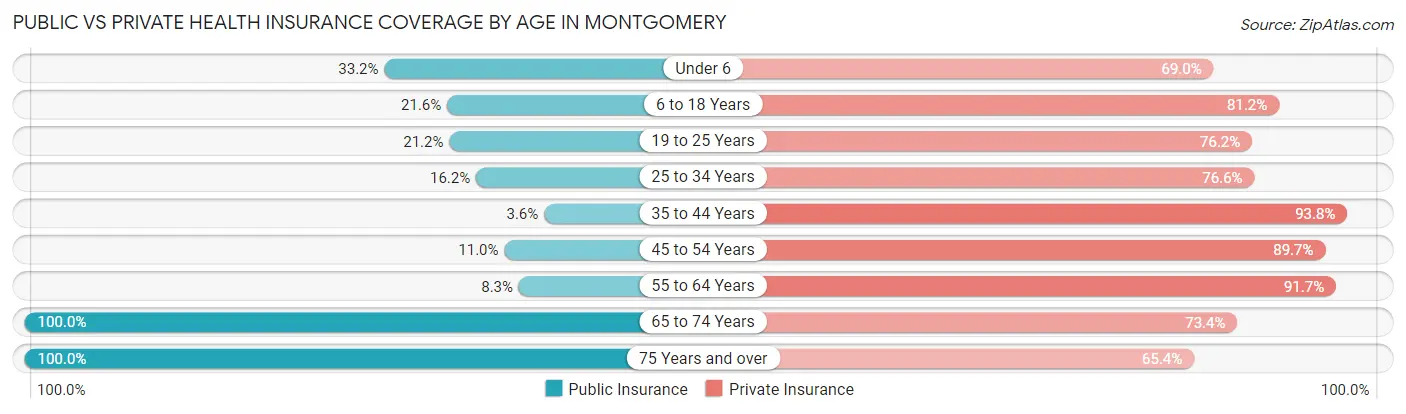
| Age Bracket | Public Insurance | Private Insurance |
| Under 6 | 509 (33.2%) | 1,057 (69.0%) |
| 6 to 18 Years | 1,137 (21.6%) | 4,276 (81.2%) |
| 19 to 25 Years | 513 (21.2%) | 1,845 (76.1%) |
| 25 to 34 Years | 321 (16.2%) | 1,517 (76.6%) |
| 35 to 44 Years | 128 (3.6%) | 3,362 (93.8%) |
| 45 to 54 Years | 274 (11.0%) | 2,246 (89.7%) |
| 55 to 64 Years | 134 (8.3%) | 1,488 (91.7%) |
| 65 to 74 Years | 989 (100.0%) | 726 (73.4%) |
| 75 Years and over | 731 (100.0%) | 478 (65.4%) |
| Total | 4,736 (23.0%) | 16,995 (82.4%) |
Disability Status by Sex by Age in Montgomery
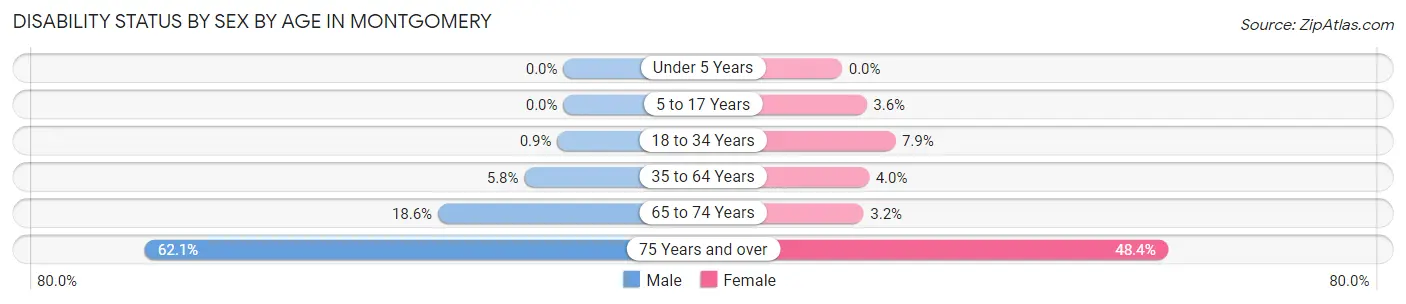
| Age Bracket | Male | Female |
| Under 5 Years | 0 (0.0%) | 0 (0.0%) |
| 5 to 17 Years | 0 (0.0%) | 72 (3.6%) |
| 18 to 34 Years | 25 (0.9%) | 175 (7.9%) |
| 35 to 64 Years | 232 (5.8%) | 148 (4.0%) |
| 65 to 74 Years | 62 (18.6%) | 21 (3.2%) |
| 75 Years and over | 169 (62.1%) | 222 (48.4%) |
Disability Class by Sex by Age in Montgomery
Disability Class: Hearing Difficulty
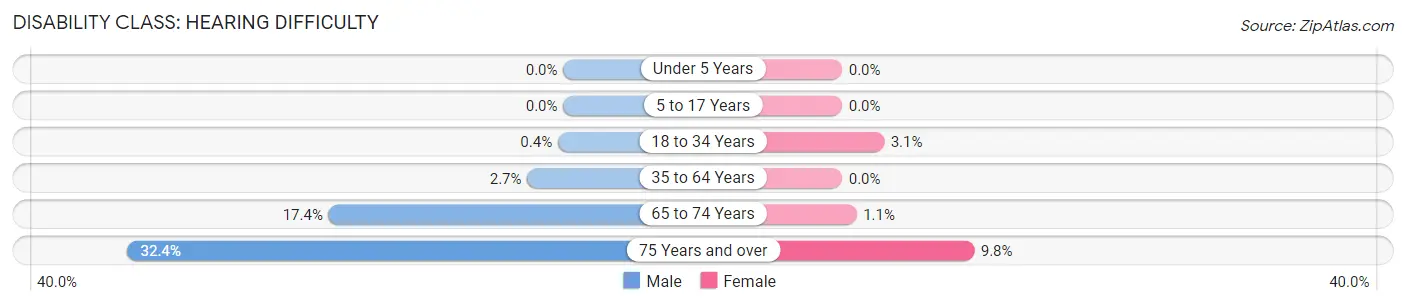
| Age Bracket | Male | Female |
| Under 5 Years | 0 (0.0%) | 0 (0.0%) |
| 5 to 17 Years | 0 (0.0%) | 0 (0.0%) |
| 18 to 34 Years | 11 (0.4%) | 69 (3.1%) |
| 35 to 64 Years | 107 (2.7%) | 0 (0.0%) |
| 65 to 74 Years | 58 (17.4%) | 7 (1.1%) |
| 75 Years and over | 88 (32.4%) | 45 (9.8%) |
Disability Class: Vision Difficulty
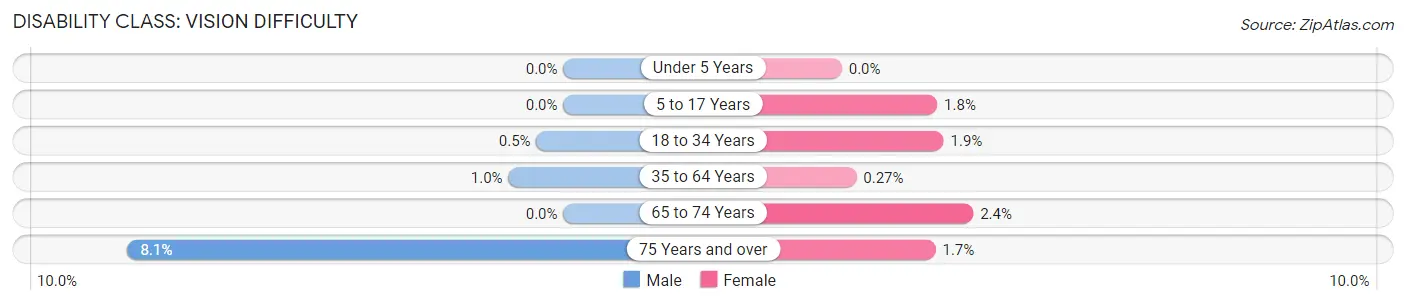
| Age Bracket | Male | Female |
| Under 5 Years | 0 (0.0%) | 0 (0.0%) |
| 5 to 17 Years | 0 (0.0%) | 35 (1.8%) |
| 18 to 34 Years | 14 (0.5%) | 42 (1.9%) |
| 35 to 64 Years | 41 (1.0%) | 10 (0.3%) |
| 65 to 74 Years | 0 (0.0%) | 16 (2.4%) |
| 75 Years and over | 22 (8.1%) | 8 (1.7%) |
Disability Class: Cognitive Difficulty
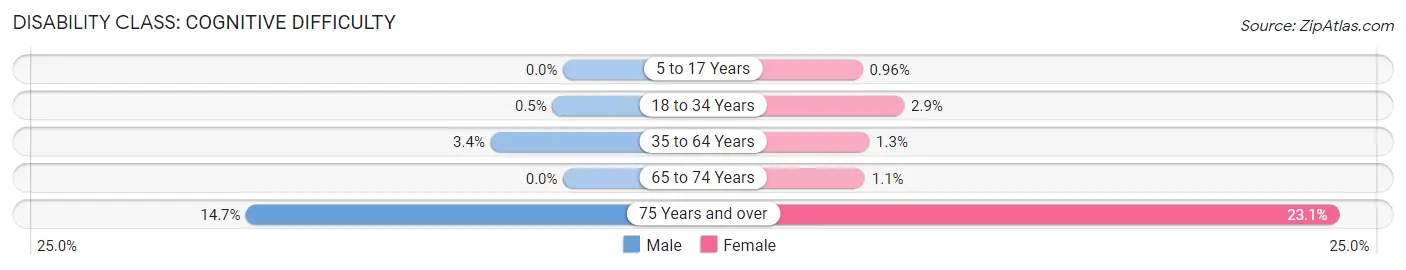
| Age Bracket | Male | Female |
| 5 to 17 Years | 0 (0.0%) | 19 (1.0%) |
| 18 to 34 Years | 14 (0.5%) | 64 (2.9%) |
| 35 to 64 Years | 135 (3.4%) | 47 (1.3%) |
| 65 to 74 Years | 0 (0.0%) | 7 (1.1%) |
| 75 Years and over | 40 (14.7%) | 106 (23.1%) |
Disability Class: Ambulatory Difficulty
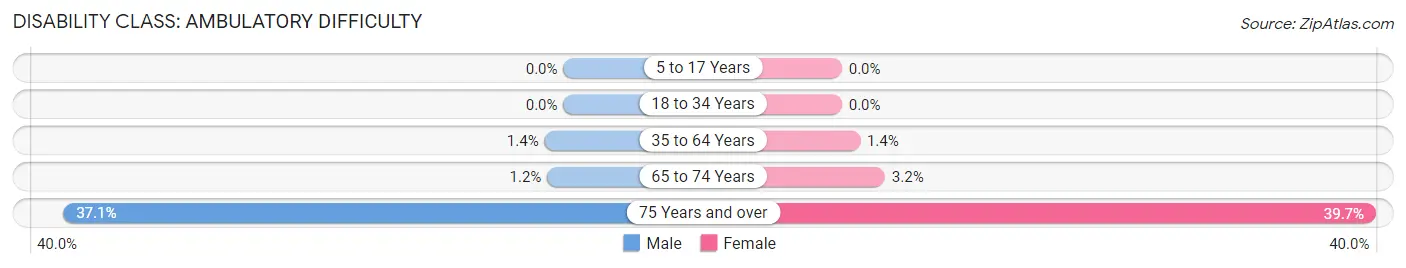
| Age Bracket | Male | Female |
| 5 to 17 Years | 0 (0.0%) | 0 (0.0%) |
| 18 to 34 Years | 0 (0.0%) | 0 (0.0%) |
| 35 to 64 Years | 56 (1.4%) | 50 (1.3%) |
| 65 to 74 Years | 4 (1.2%) | 21 (3.2%) |
| 75 Years and over | 101 (37.1%) | 182 (39.7%) |
Disability Class: Self-Care Difficulty
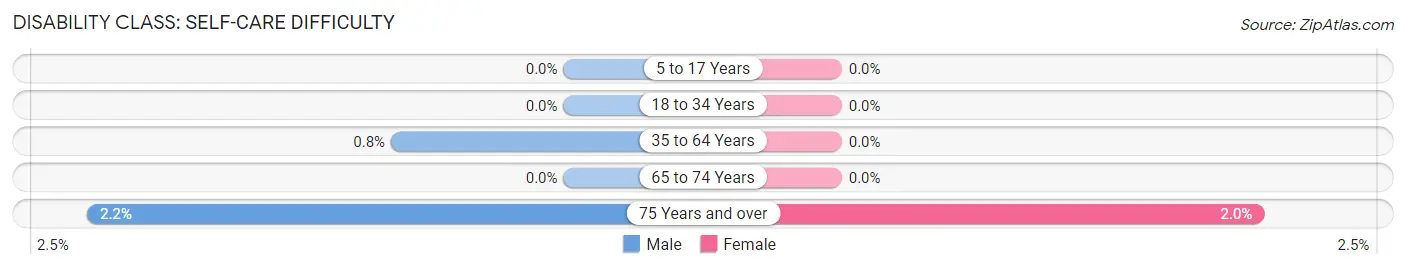
| Age Bracket | Male | Female |
| 5 to 17 Years | 0 (0.0%) | 0 (0.0%) |
| 18 to 34 Years | 0 (0.0%) | 0 (0.0%) |
| 35 to 64 Years | 32 (0.8%) | 0 (0.0%) |
| 65 to 74 Years | 0 (0.0%) | 0 (0.0%) |
| 75 Years and over | 6 (2.2%) | 9 (2.0%) |
Technology Access in Montgomery
Computing Device Access in Montgomery
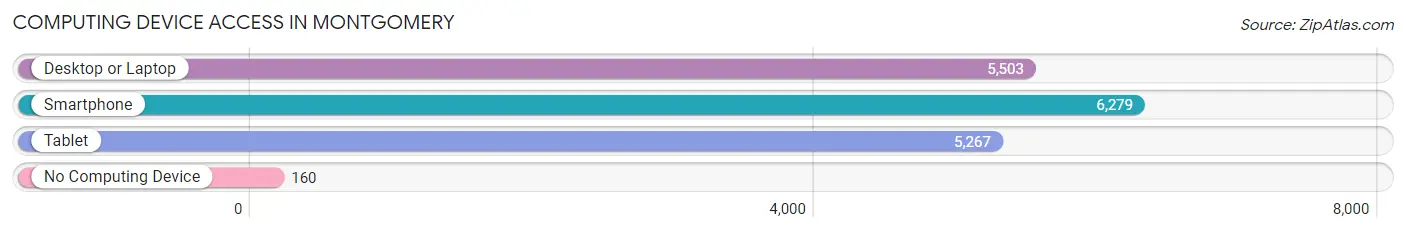
| Device Type | # Households | % Households |
| Desktop or Laptop | 5,503 | 83.1% |
| Smartphone | 6,279 | 94.9% |
| Tablet | 5,267 | 79.6% |
| No Computing Device | 160 | 2.4% |
| Total | 6,619 | 100.0% |
Internet Access in Montgomery
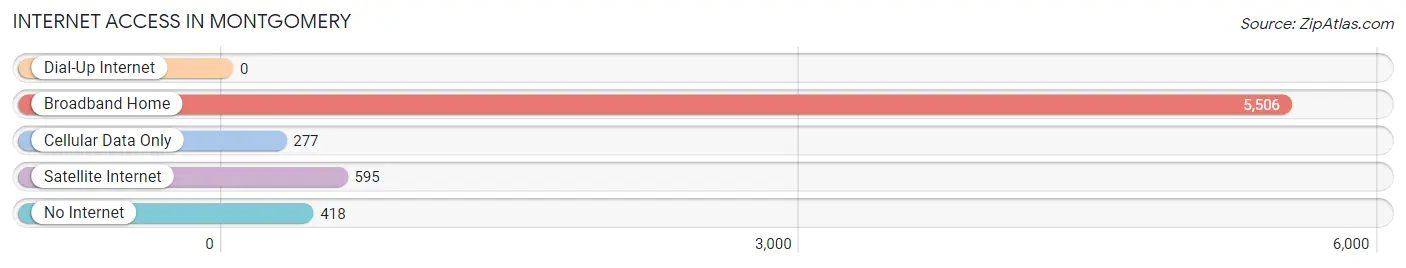
| Internet Type | # Households | % Households |
| Dial-Up Internet | 0 | 0.0% |
| Broadband Home | 5,506 | 83.2% |
| Cellular Data Only | 277 | 4.2% |
| Satellite Internet | 595 | 9.0% |
| No Internet | 418 | 6.3% |
| Total | 6,619 | 100.0% |
Montgomery Summary
Montgomery, Illinois is a village located in Kane and Kendall Counties in the U.S. state of Illinois. It is part of the Chicago metropolitan area and is located approximately 40 miles west of downtown Chicago. As of the 2010 census, the village had a population of 18,438.
History
The area that is now Montgomery was first settled in the 1830s by settlers from New York and New England. The village was originally known as “Hainesville” after one of the first settlers, John Haines. In 1837, the village was renamed “Montgomery” after Richard Montgomery, an American Revolutionary War hero.
The village was incorporated in 1858 and was home to a variety of industries, including a brickyard, a sawmill, a grist mill, and a distillery. The village also had a railroad station, which was a major factor in its growth.
In the late 19th century, Montgomery was a popular summer resort destination for Chicagoans. The village was home to several resorts, including the Montgomery Hotel, which was built in 1891 and was one of the largest hotels in the area.
Geography
Montgomery is located at 41°45'17" North, 88°20'45" West (41.754722, -88.345833). According to the 2010 census, the village has a total area of 8.9 square miles, all of which is land.
The village is located in the Fox River Valley, which is part of the Chicago metropolitan area. The Fox River runs through the village and is a popular recreational area for fishing, boating, and swimming.
Economy
Montgomery’s economy is largely based on manufacturing and retail. The village is home to several large manufacturing companies, including the Montgomery Manufacturing Company, which produces industrial equipment, and the Montgomery Plastics Company, which produces plastic products.
The village is also home to several retail stores, including a Walmart Supercenter, a Target, and a Kohl’s. The village also has several restaurants, including a McDonald’s, a Subway, and a Burger King.
Demographics
As of the 2010 census, the village had a population of 18,438. The racial makeup of the village was 87.3% White, 5.2% African American, 0.5% Native American, 2.2% Asian, 0.1% Pacific Islander, 2.3% from other races, and 2.4% from two or more races. Hispanic or Latino of any race were 8.2% of the population.
The median household income in the village was $68,945 and the median family income was $77,945. The per capita income for the village was $30,945. About 4.2% of families and 5.3% of the population were below the poverty line, including 6.3% of those under age 18 and 4.2% of those age 65 or over.
Common Questions
What is Per Capita Income in Montgomery?
Per Capita income in Montgomery is $34,600.
What is the Median Family Income in Montgomery?
Median Family Income in Montgomery is $109,154.
What is the Median Household income in Montgomery?
Median Household Income in Montgomery is $105,240.
What is Income or Wage Gap in Montgomery?
Income or Wage Gap in Montgomery is 28.7%.
Women in Montgomery earn 71.3 cents for every dollar earned by a man.
What is Inequality or Gini Index in Montgomery?
Inequality or Gini Index in Montgomery is 0.32.
What is the Total Population of Montgomery?
Total Population of Montgomery is 20,644.
What is the Total Male Population of Montgomery?
Total Male Population of Montgomery is 11,194.
What is the Total Female Population of Montgomery?
Total Female Population of Montgomery is 9,450.
What is the Ratio of Males per 100 Females in Montgomery?
There are 118.46 Males per 100 Females in Montgomery.
What is the Ratio of Females per 100 Males in Montgomery?
There are 84.42 Females per 100 Males in Montgomery.
What is the Median Population Age in Montgomery?
Median Population Age in Montgomery is 31.7 Years.
What is the Average Family Size in Montgomery
Average Family Size in Montgomery is 3.5 People.
What is the Average Household Size in Montgomery
Average Household Size in Montgomery is 3.1 People.
How Large is the Labor Force in Montgomery?
There are 11,728 People in the Labor Forcein in Montgomery.
What is the Percentage of People in the Labor Force in Montgomery?
75.7% of People are in the Labor Force in Montgomery.
What is the Unemployment Rate in Montgomery?
Unemployment Rate in Montgomery is 5.5%.