Joliet, IL Map & Demographics
Joliet Map
Joliet Overview
$34,169
PER CAPITA INCOME
$98,522
AVG FAMILY INCOME
$84,971
AVG HOUSEHOLD INCOME
37.9%
WAGE / INCOME GAP [ % ]
62.1¢/ $1
WAGE / INCOME GAP [ $ ]
$13,612
FAMILY INCOME DEFICIT
0.40
INEQUALITY / GINI INDEX
150,221
TOTAL POPULATION
75,215
MALE POPULATION
75,006
FEMALE POPULATION
100.28
MALES / 100 FEMALES
99.72
FEMALES / 100 MALES
34.3
MEDIAN AGE
3.5
AVG FAMILY SIZE
3.0
AVG HOUSEHOLD SIZE
79,954
LABOR FORCE [ PEOPLE ]
69.7%
PERCENT IN LABOR FORCE
6.2%
UNEMPLOYMENT RATE
Income in Joliet
Income Overview in Joliet
Per Capita Income in Joliet is $34,169, while median incomes of families and households are $98,522 and $84,971 respectively.
| Characteristic | Number | Measure |
| Per Capita Income | 150,221 | $34,169 |
| Median Family Income | 35,465 | $98,522 |
| Mean Family Income | 35,465 | $111,089 |
| Median Household Income | 49,815 | $84,971 |
| Mean Household Income | 49,815 | $99,841 |
| Income Deficit | 35,465 | $13,612 |
| Wage / Income Gap (%) | 150,221 | 37.85% |
| Wage / Income Gap ($) | 150,221 | 62.15¢ per $1 |
| Gini / Inequality Index | 150,221 | 0.40 |
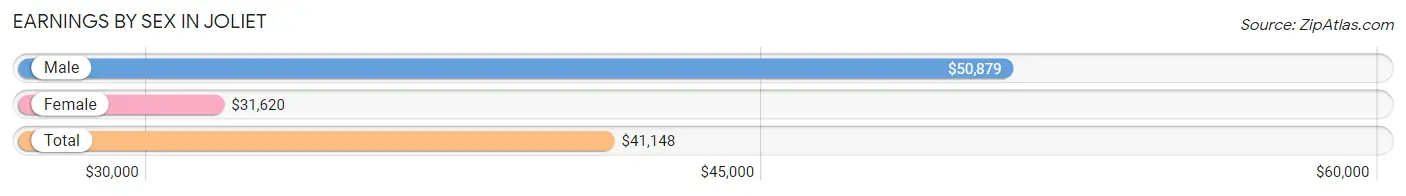
Earnings by Sex in Joliet
Average Earnings in Joliet are $41,148, $50,879 for men and $31,620 for women, a difference of 37.9%.
| Sex | Number | Average Earnings |
| Male | 44,107 (53.3%) | $50,879 |
| Female | 38,648 (46.7%) | $31,620 |
| Total | 82,755 (100.0%) | $41,148 |
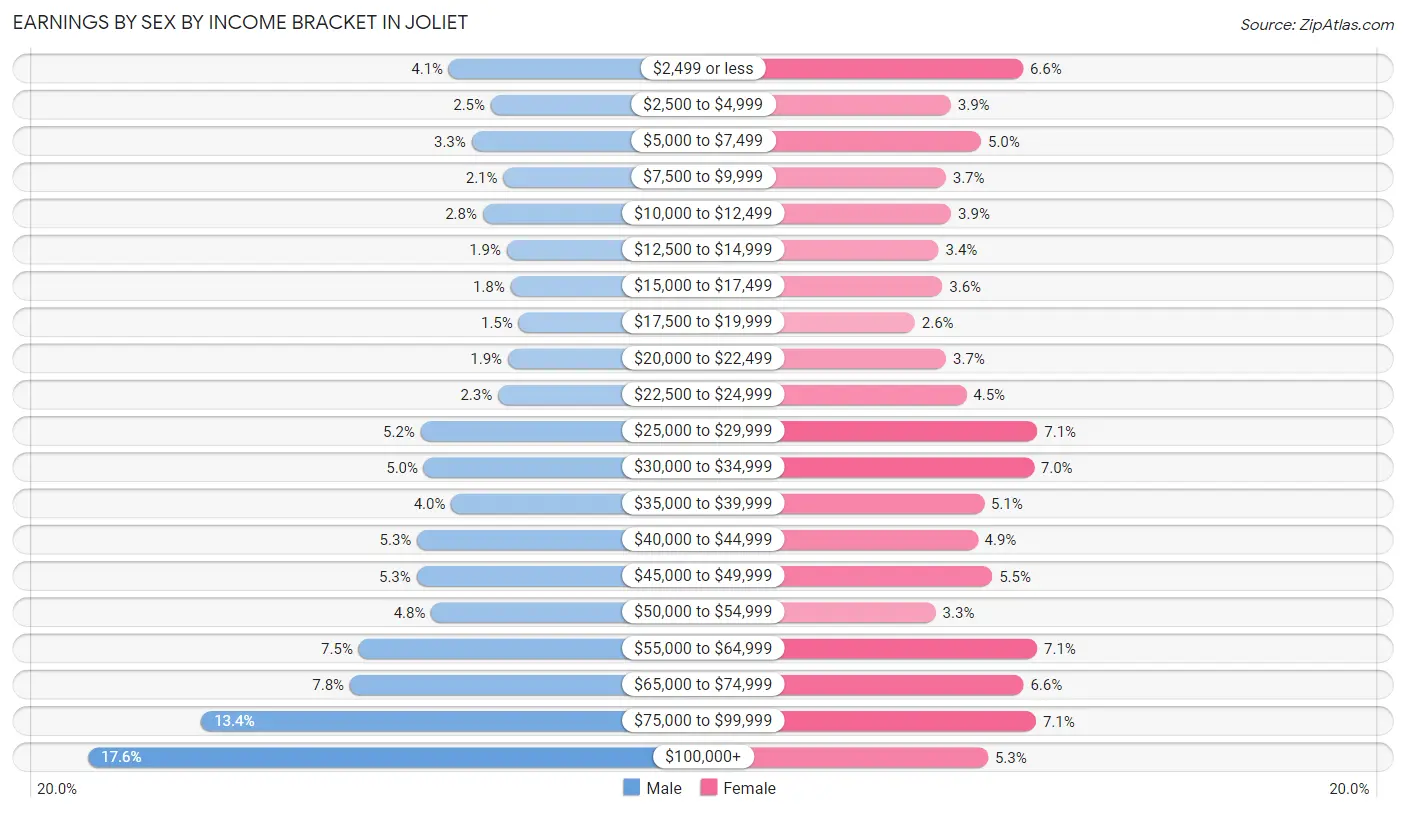
Earnings by Sex by Income Bracket in Joliet
The most common earnings brackets in Joliet are $100,000+ for men (7,773 | 17.6%) and $25,000 to $29,999 for women (2,760 | 7.1%).
| Income | Male | Female |
| $2,499 or less | 1,810 (4.1%) | 2,549 (6.6%) |
| $2,500 to $4,999 | 1,116 (2.5%) | 1,508 (3.9%) |
| $5,000 to $7,499 | 1,432 (3.3%) | 1,945 (5.0%) |
| $7,500 to $9,999 | 907 (2.1%) | 1,432 (3.7%) |
| $10,000 to $12,499 | 1,249 (2.8%) | 1,511 (3.9%) |
| $12,500 to $14,999 | 850 (1.9%) | 1,330 (3.4%) |
| $15,000 to $17,499 | 789 (1.8%) | 1,385 (3.6%) |
| $17,500 to $19,999 | 656 (1.5%) | 984 (2.5%) |
| $20,000 to $22,499 | 835 (1.9%) | 1,439 (3.7%) |
| $22,500 to $24,999 | 995 (2.3%) | 1,732 (4.5%) |
| $25,000 to $29,999 | 2,278 (5.2%) | 2,760 (7.1%) |
| $30,000 to $34,999 | 2,225 (5.0%) | 2,710 (7.0%) |
| $35,000 to $39,999 | 1,768 (4.0%) | 1,985 (5.1%) |
| $40,000 to $44,999 | 2,333 (5.3%) | 1,892 (4.9%) |
| $45,000 to $49,999 | 2,343 (5.3%) | 2,106 (5.4%) |
| $50,000 to $54,999 | 2,100 (4.8%) | 1,286 (3.3%) |
| $55,000 to $64,999 | 3,301 (7.5%) | 2,754 (7.1%) |
| $65,000 to $74,999 | 3,445 (7.8%) | 2,557 (6.6%) |
| $75,000 to $99,999 | 5,902 (13.4%) | 2,740 (7.1%) |
| $100,000+ | 7,773 (17.6%) | 2,043 (5.3%) |
| Total | 44,107 (100.0%) | 38,648 (100.0%) |
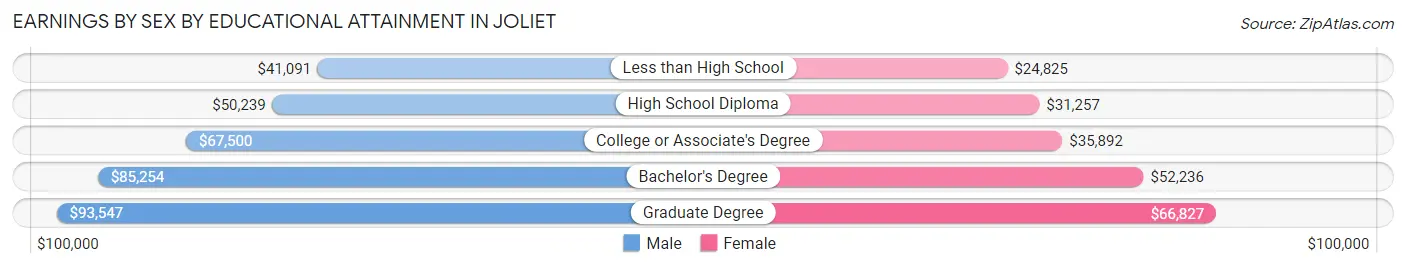
Earnings by Sex by Educational Attainment in Joliet
Average earnings in Joliet are $60,397 for men and $37,321 for women, a difference of 38.2%. Men with an educational attainment of graduate degree enjoy the highest average annual earnings of $93,547, while those with less than high school education earn the least with $41,091. Women with an educational attainment of graduate degree earn the most with the average annual earnings of $66,827, while those with less than high school education have the smallest earnings of $24,825.
| Educational Attainment | Male Income | Female Income |
| Less than High School | $41,091 | $24,825 |
| High School Diploma | $50,239 | $31,257 |
| College or Associate's Degree | $67,500 | $35,892 |
| Bachelor's Degree | $85,254 | $52,236 |
| Graduate Degree | $93,547 | $66,827 |
| Total | $60,397 | $37,321 |
Family Income in Joliet
Family Income Brackets in Joliet
According to the Joliet family income data, there are 9,008 families falling into the $100,000 to $149,999 income range, which is the most common income bracket and makes up 25.4% of all families. Conversely, the $10,000 to $14,999 income bracket is the least frequent group with only 497 families (1.4%) belonging to this category.
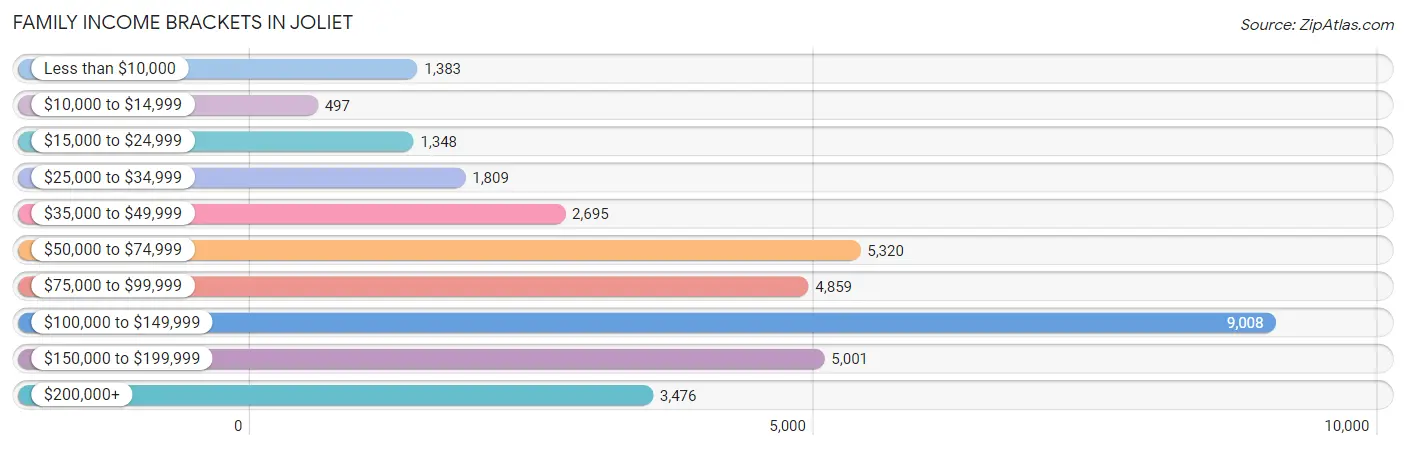
| Income Bracket | # Families | % Families |
| Less than $10,000 | 1,383 | 3.9% |
| $10,000 to $14,999 | 497 | 1.4% |
| $15,000 to $24,999 | 1,348 | 3.8% |
| $25,000 to $34,999 | 1,809 | 5.1% |
| $35,000 to $49,999 | 2,695 | 7.6% |
| $50,000 to $74,999 | 5,320 | 15.0% |
| $75,000 to $99,999 | 4,859 | 13.7% |
| $100,000 to $149,999 | 9,008 | 25.4% |
| $150,000 to $199,999 | 5,001 | 14.1% |
| $200,000+ | 3,476 | 9.8% |
Family Income by Famaliy Size in Joliet
7+ person families (1,001 | 2.8%) account for the highest median family income in Joliet with $117,961 per family, while 2-person families (11,668 | 32.9%) have the highest median income of $38,834 per family member.
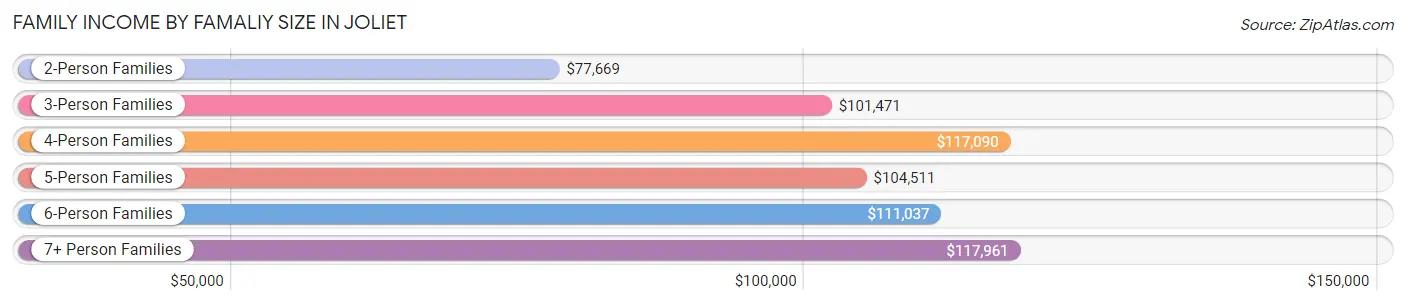
| Income Bracket | # Families | Median Income |
| 2-Person Families | 11,668 (32.9%) | $77,669 |
| 3-Person Families | 8,489 (23.9%) | $101,471 |
| 4-Person Families | 8,631 (24.3%) | $117,090 |
| 5-Person Families | 4,254 (12.0%) | $104,511 |
| 6-Person Families | 1,422 (4.0%) | $111,037 |
| 7+ Person Families | 1,001 (2.8%) | $117,961 |
| Total | 35,465 (100.0%) | $98,522 |
Family Income by Number of Earners in Joliet
The median family income in Joliet is $98,522, with families comprising 3+ earners (6,937) having the highest median family income of $139,428, while families with no earners (3,181) have the lowest median family income of $36,772, accounting for 19.6% and 9.0% of families, respectively.
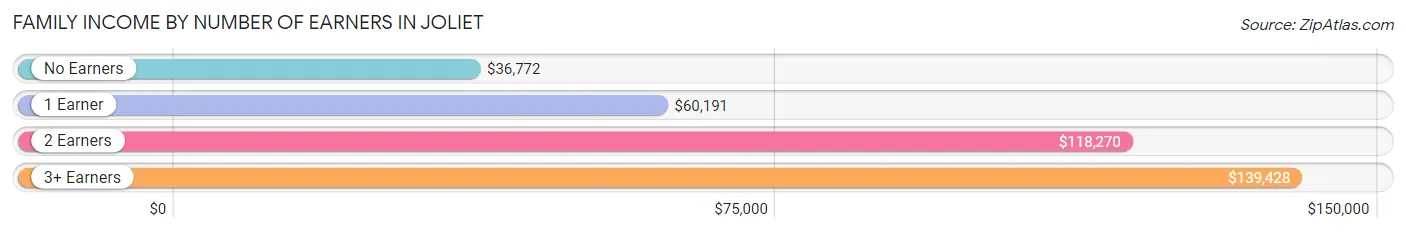
| Number of Earners | # Families | Median Income |
| No Earners | 3,181 (9.0%) | $36,772 |
| 1 Earner | 10,514 (29.6%) | $60,191 |
| 2 Earners | 14,833 (41.8%) | $118,270 |
| 3+ Earners | 6,937 (19.6%) | $139,428 |
| Total | 35,465 (100.0%) | $98,522 |
Household Income in Joliet
Household Income Brackets in Joliet
With 10,959 households falling in the category, the $100,000 to $149,999 income range is the most frequent in Joliet, accounting for 22.0% of all households. In contrast, only 1,395 households (2.8%) fall into the $10,000 to $14,999 income bracket, making it the least populous group.
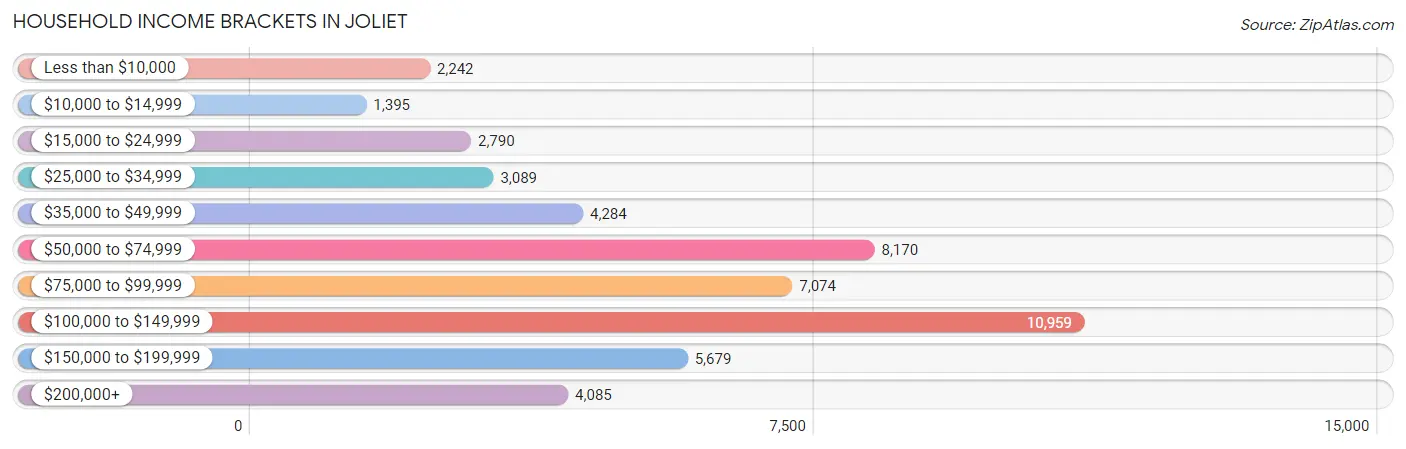
| Income Bracket | # Households | % Households |
| Less than $10,000 | 2,242 | 4.5% |
| $10,000 to $14,999 | 1,395 | 2.8% |
| $15,000 to $24,999 | 2,790 | 5.6% |
| $25,000 to $34,999 | 3,089 | 6.2% |
| $35,000 to $49,999 | 4,284 | 8.6% |
| $50,000 to $74,999 | 8,170 | 16.4% |
| $75,000 to $99,999 | 7,074 | 14.2% |
| $100,000 to $149,999 | 10,959 | 22.0% |
| $150,000 to $199,999 | 5,679 | 11.4% |
| $200,000+ | 4,085 | 8.2% |
Household Income by Householder Age in Joliet
The median household income in Joliet is $84,971, with the highest median household income of $98,946 found in the 45 to 64 years age bracket for the primary householder. A total of 20,466 households (41.1%) fall into this category. Meanwhile, the 65+ years age bracket for the primary householder has the lowest median household income of $56,504, with 9,196 households (18.5%) in this group.
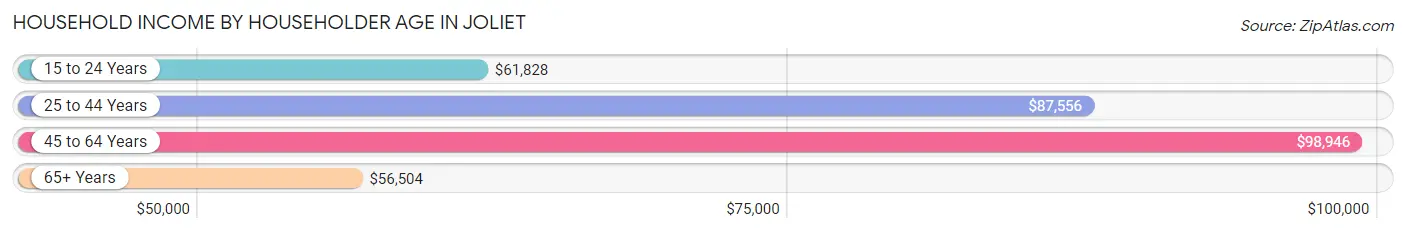
| Income Bracket | # Households | Median Income |
| 15 to 24 Years | 1,240 (2.5%) | $61,828 |
| 25 to 44 Years | 18,913 (38.0%) | $87,556 |
| 45 to 64 Years | 20,466 (41.1%) | $98,946 |
| 65+ Years | 9,196 (18.5%) | $56,504 |
| Total | 49,815 (100.0%) | $84,971 |
Poverty in Joliet
Income Below Poverty by Sex and Age in Joliet
With 9.4% poverty level for males and 12.2% for females among the residents of Joliet, 15 year old males and 5 year old females are the most vulnerable to poverty, with 410 males (26.1%) and 309 females (31.0%) in their respective age groups living below the poverty level.
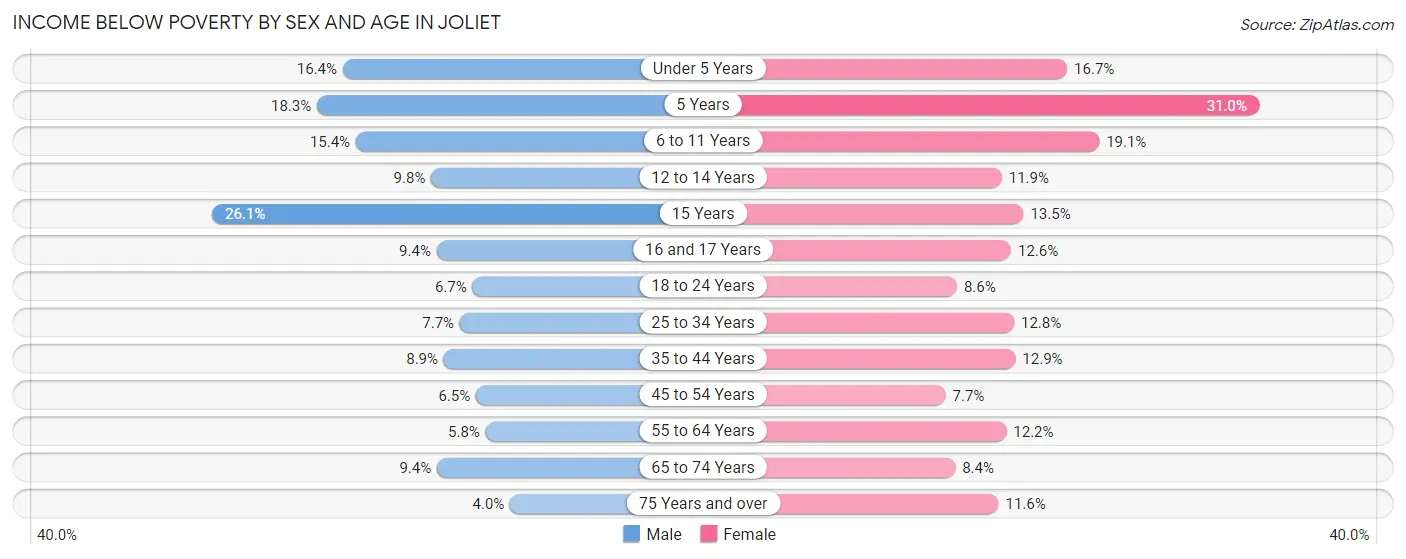
| Age Bracket | Male | Female |
| Under 5 Years | 771 (16.4%) | 709 (16.7%) |
| 5 Years | 177 (18.3%) | 309 (31.0%) |
| 6 to 11 Years | 1,104 (15.4%) | 1,250 (19.1%) |
| 12 to 14 Years | 361 (9.8%) | 460 (11.9%) |
| 15 Years | 410 (26.1%) | 160 (13.5%) |
| 16 and 17 Years | 207 (9.4%) | 266 (12.6%) |
| 18 to 24 Years | 536 (6.7%) | 678 (8.6%) |
| 25 to 34 Years | 733 (7.7%) | 1,280 (12.8%) |
| 35 to 44 Years | 957 (8.9%) | 1,361 (12.9%) |
| 45 to 54 Years | 734 (6.5%) | 835 (7.7%) |
| 55 to 64 Years | 434 (5.8%) | 866 (12.2%) |
| 65 to 74 Years | 406 (9.4%) | 425 (8.4%) |
| 75 Years and over | 75 (4.0%) | 379 (11.6%) |
| Total | 6,905 (9.4%) | 8,978 (12.2%) |
Income Above Poverty by Sex and Age in Joliet
According to the poverty statistics in Joliet, males aged 75 years and over and females aged 45 to 54 years are the age groups that are most secure financially, with 96.1% of males and 92.3% of females in these age groups living above the poverty line.
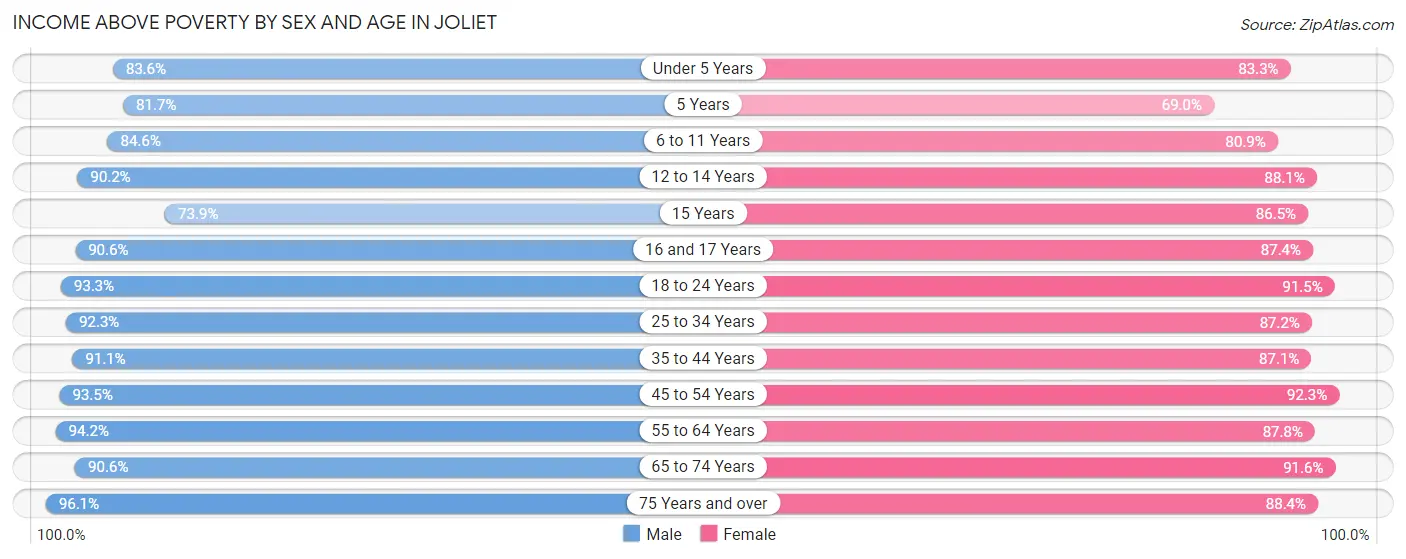
| Age Bracket | Male | Female |
| Under 5 Years | 3,940 (83.6%) | 3,529 (83.3%) |
| 5 Years | 791 (81.7%) | 689 (69.0%) |
| 6 to 11 Years | 6,066 (84.6%) | 5,291 (80.9%) |
| 12 to 14 Years | 3,320 (90.2%) | 3,412 (88.1%) |
| 15 Years | 1,162 (73.9%) | 1,026 (86.5%) |
| 16 and 17 Years | 1,996 (90.6%) | 1,850 (87.4%) |
| 18 to 24 Years | 7,421 (93.3%) | 7,254 (91.4%) |
| 25 to 34 Years | 8,810 (92.3%) | 8,728 (87.2%) |
| 35 to 44 Years | 9,837 (91.1%) | 9,195 (87.1%) |
| 45 to 54 Years | 10,597 (93.5%) | 9,993 (92.3%) |
| 55 to 64 Years | 7,084 (94.2%) | 6,222 (87.8%) |
| 65 to 74 Years | 3,922 (90.6%) | 4,625 (91.6%) |
| 75 Years and over | 1,826 (96.1%) | 2,876 (88.4%) |
| Total | 66,772 (90.6%) | 64,690 (87.8%) |
Income Below Poverty Among Married-Couple Families in Joliet
The poverty statistics for married-couple families in Joliet show that 4.0% or 982 of the total 24,756 families live below the poverty line. Families with 3 or 4 children have the highest poverty rate of 16.9%, comprising of 424 families. On the other hand, families with 1 or 2 children have the lowest poverty rate of 2.0%, which includes 218 families.
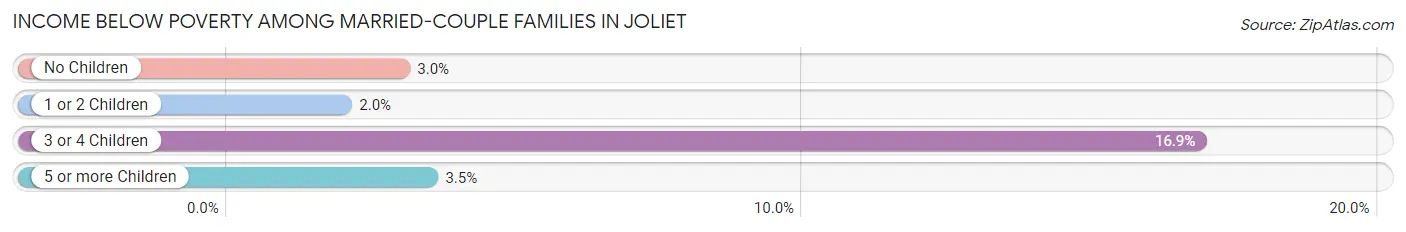
| Children | Above Poverty | Below Poverty |
| No Children | 10,719 (97.0%) | 332 (3.0%) |
| 1 or 2 Children | 10,745 (98.0%) | 218 (2.0%) |
| 3 or 4 Children | 2,089 (83.1%) | 424 (16.9%) |
| 5 or more Children | 221 (96.5%) | 8 (3.5%) |
| Total | 23,774 (96.0%) | 982 (4.0%) |
Income Below Poverty Among Single-Parent Households in Joliet
According to the poverty data in Joliet, 8.8% or 313 single-father households and 26.6% or 1,901 single-mother households are living below the poverty line. Among single-father households, those with 5 or more children have the highest poverty rate, with 15 households (28.8%) experiencing poverty. Likewise, among single-mother households, those with 5 or more children have the highest poverty rate, with 44 households (53.0%) falling below the poverty line.
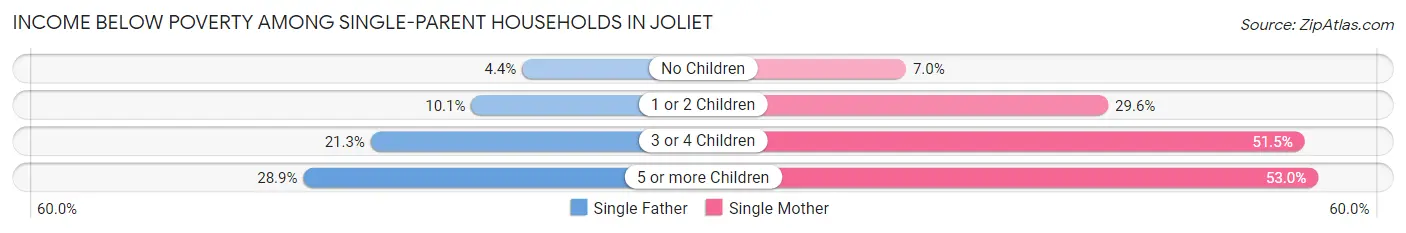
| Children | Single Father | Single Mother |
| No Children | 71 (4.4%) | 150 (7.0%) |
| 1 or 2 Children | 159 (10.1%) | 1,107 (29.6%) |
| 3 or 4 Children | 68 (21.3%) | 600 (51.5%) |
| 5 or more Children | 15 (28.8%) | 44 (53.0%) |
| Total | 313 (8.8%) | 1,901 (26.6%) |
Income Below Poverty Among Married-Couple vs Single-Parent Households in Joliet
The poverty data for Joliet shows that 982 of the married-couple family households (4.0%) and 2,214 of the single-parent households (20.7%) are living below the poverty level. Within the married-couple family households, those with 3 or 4 children have the highest poverty rate, with 424 households (16.9%) falling below the poverty line. Among the single-parent households, those with 3 or 4 children have the highest poverty rate, with 668 household (45.0%) living below poverty.
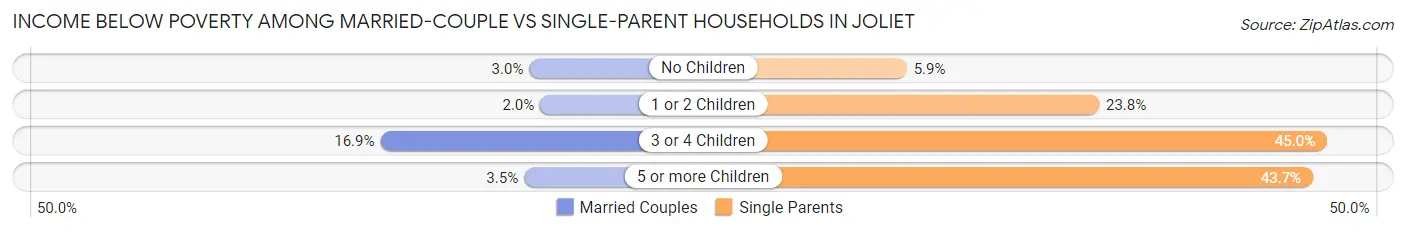
| Children | Married-Couple Families | Single-Parent Households |
| No Children | 332 (3.0%) | 221 (5.9%) |
| 1 or 2 Children | 218 (2.0%) | 1,266 (23.8%) |
| 3 or 4 Children | 424 (16.9%) | 668 (45.0%) |
| 5 or more Children | 8 (3.5%) | 59 (43.7%) |
| Total | 982 (4.0%) | 2,214 (20.7%) |
Race in Joliet
The most populous races in Joliet are White / Caucasian (85,598 | 57.0%), Hispanic or Latino (50,388 | 33.5%), and Black / African American (25,759 | 17.2%).
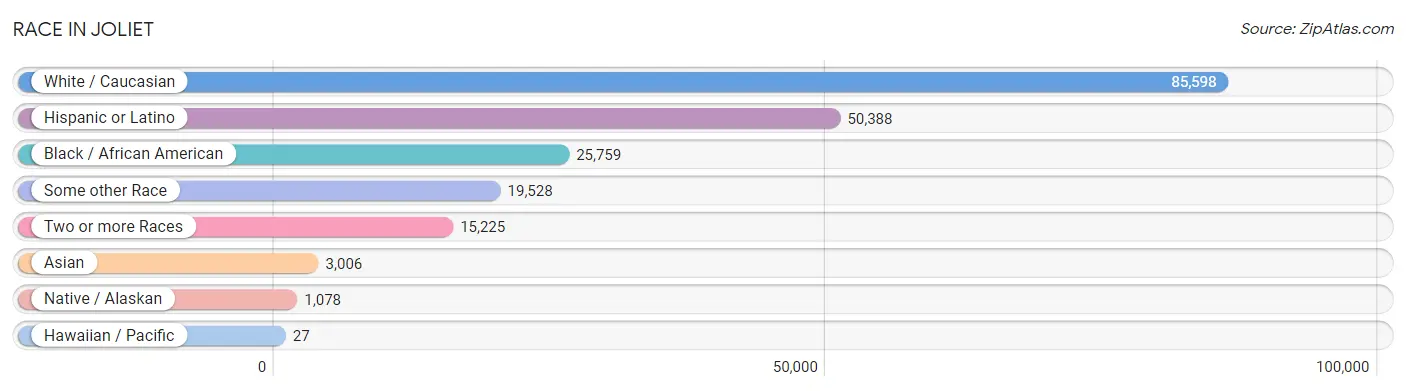
| Race | # Population | % Population |
| Asian | 3,006 | 2.0% |
| Black / African American | 25,759 | 17.2% |
| Hawaiian / Pacific | 27 | 0.0% |
| Hispanic or Latino | 50,388 | 33.5% |
| Native / Alaskan | 1,078 | 0.7% |
| White / Caucasian | 85,598 | 57.0% |
| Two or more Races | 15,225 | 10.1% |
| Some other Race | 19,528 | 13.0% |
| Total | 150,221 | 100.0% |
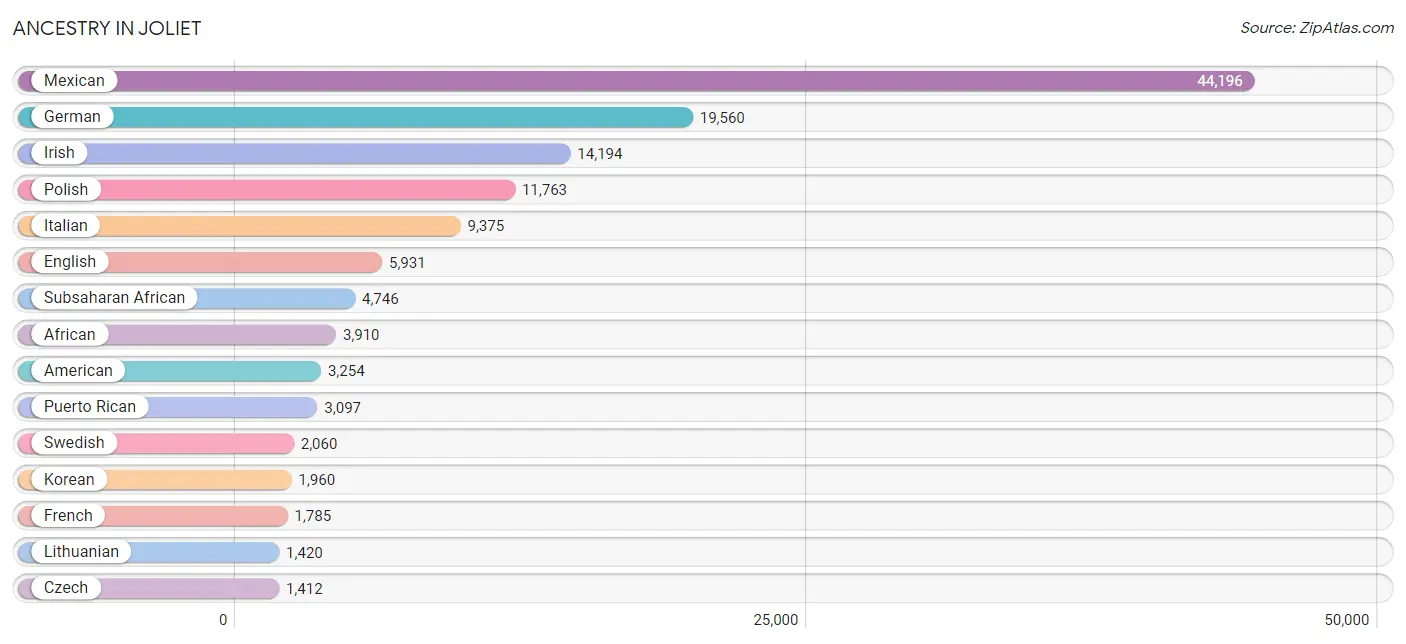
Ancestry in Joliet
The most populous ancestries reported in Joliet are Mexican (44,196 | 29.4%), German (19,560 | 13.0%), Irish (14,194 | 9.5%), Polish (11,763 | 7.8%), and Italian (9,375 | 6.2%), together accounting for 66.0% of all Joliet residents.
| Ancestry | # Population | % Population |
| African | 3,910 | 2.6% |
| Albanian | 2 | 0.0% |
| American | 3,254 | 2.2% |
| Apache | 32 | 0.0% |
| Arab | 224 | 0.2% |
| Argentinean | 1 | 0.0% |
| Armenian | 16 | 0.0% |
| Australian | 5 | 0.0% |
| Austrian | 315 | 0.2% |
| Bangladeshi | 49 | 0.0% |
| Belgian | 119 | 0.1% |
| Bhutanese | 354 | 0.2% |
| Blackfeet | 211 | 0.1% |
| Brazilian | 31 | 0.0% |
| British | 244 | 0.2% |
| British West Indian | 4 | 0.0% |
| Bulgarian | 10 | 0.0% |
| Burmese | 389 | 0.3% |
| Cambodian | 17 | 0.0% |
| Canadian | 169 | 0.1% |
| Central American | 838 | 0.6% |
| Central American Indian | 58 | 0.0% |
| Cherokee | 574 | 0.4% |
| Chilean | 28 | 0.0% |
| Chippewa | 27 | 0.0% |
| Choctaw | 20 | 0.0% |
| Colombian | 438 | 0.3% |
| Comanche | 42 | 0.0% |
| Costa Rican | 47 | 0.0% |
| Croatian | 1,208 | 0.8% |
| Cuban | 288 | 0.2% |
| Czech | 1,412 | 0.9% |
| Czechoslovakian | 255 | 0.2% |
| Danish | 397 | 0.3% |
| Dominican | 79 | 0.1% |
| Dutch | 1,053 | 0.7% |
| Eastern European | 317 | 0.2% |
| Ecuadorian | 102 | 0.1% |
| Egyptian | 23 | 0.0% |
| English | 5,931 | 4.0% |
| Ethiopian | 54 | 0.0% |
| European | 1,221 | 0.8% |
| Filipino | 82 | 0.1% |
| Finnish | 117 | 0.1% |
| French | 1,785 | 1.2% |
| French Canadian | 262 | 0.2% |
| German | 19,560 | 13.0% |
| Ghanaian | 196 | 0.1% |
| Greek | 763 | 0.5% |
| Guamanian / Chamorro | 62 | 0.0% |
| Guatemalan | 419 | 0.3% |
| Haitian | 122 | 0.1% |
| Honduran | 76 | 0.1% |
| Hungarian | 363 | 0.2% |
| Indian (Asian) | 446 | 0.3% |
| Inupiat | 2 | 0.0% |
| Irish | 14,194 | 9.5% |
| Iroquois | 37 | 0.0% |
| Israeli | 15 | 0.0% |
| Italian | 9,375 | 6.2% |
| Jamaican | 192 | 0.1% |
| Japanese | 93 | 0.1% |
| Kenyan | 10 | 0.0% |
| Korean | 1,960 | 1.3% |
| Latvian | 5 | 0.0% |
| Lebanese | 83 | 0.1% |
| Lithuanian | 1,420 | 0.9% |
| Luxembourger | 31 | 0.0% |
| Macedonian | 166 | 0.1% |
| Malaysian | 228 | 0.2% |
| Menominee | 22 | 0.0% |
| Mexican | 44,196 | 29.4% |
| Mexican American Indian | 761 | 0.5% |
| Mongolian | 47 | 0.0% |
| Moroccan | 8 | 0.0% |
| Native Hawaiian | 48 | 0.0% |
| Navajo | 38 | 0.0% |
| Nigerian | 354 | 0.2% |
| Northern European | 135 | 0.1% |
| Norwegian | 828 | 0.5% |
| Ottawa | 4 | 0.0% |
| Pakistani | 37 | 0.0% |
| Panamanian | 141 | 0.1% |
| Pennsylvania German | 4 | 0.0% |
| Peruvian | 36 | 0.0% |
| Polish | 11,763 | 7.8% |
| Portuguese | 77 | 0.1% |
| Potawatomi | 3 | 0.0% |
| Puerto Rican | 3,097 | 2.1% |
| Romanian | 263 | 0.2% |
| Russian | 336 | 0.2% |
| Salvadoran | 155 | 0.1% |
| Samoan | 36 | 0.0% |
| Scandinavian | 168 | 0.1% |
| Scotch-Irish | 535 | 0.4% |
| Scottish | 1,014 | 0.7% |
| Serbian | 233 | 0.2% |
| Sioux | 11 | 0.0% |
| Slavic | 171 | 0.1% |
| Slovak | 830 | 0.5% |
| Slovene | 1,064 | 0.7% |
| South African | 11 | 0.0% |
| South American | 886 | 0.6% |
| Spaniard | 337 | 0.2% |
| Spanish | 72 | 0.1% |
| Sri Lankan | 184 | 0.1% |
| Subsaharan African | 4,746 | 3.2% |
| Swedish | 2,060 | 1.4% |
| Swiss | 75 | 0.1% |
| Syrian | 85 | 0.1% |
| Thai | 588 | 0.4% |
| Tongan | 76 | 0.1% |
| Trinidadian and Tobagonian | 9 | 0.0% |
| Turkish | 60 | 0.0% |
| Ukrainian | 301 | 0.2% |
| Uruguayan | 15 | 0.0% |
| Venezuelan | 266 | 0.2% |
| Vietnamese | 28 | 0.0% |
| Welsh | 437 | 0.3% |
| West Indian | 17 | 0.0% |
| Yaqui | 1 | 0.0% |
| Yugoslavian | 174 | 0.1% | View All 122 Rows |
Immigrants in Joliet
The most numerous immigrant groups reported in Joliet came from Latin America (17,032 | 11.3%), Central America (15,967 | 10.6%), Mexico (15,709 | 10.5%), Europe (1,937 | 1.3%), and Asia (1,718 | 1.1%), together accounting for 34.9% of all Joliet residents.
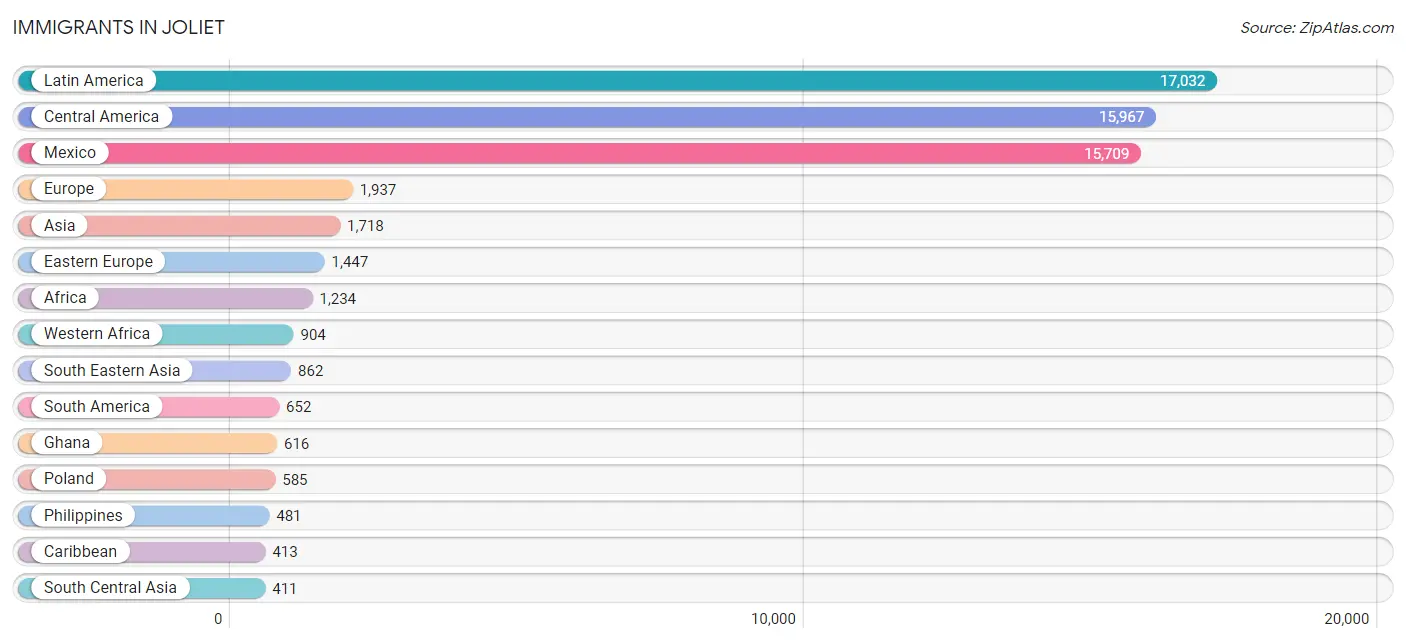
| Immigration Origin | # Population | % Population |
| Africa | 1,234 | 0.8% |
| Asia | 1,718 | 1.1% |
| Bangladesh | 17 | 0.0% |
| Barbados | 21 | 0.0% |
| Bosnia and Herzegovina | 52 | 0.0% |
| Bulgaria | 3 | 0.0% |
| Cambodia | 69 | 0.1% |
| Cameroon | 165 | 0.1% |
| Canada | 99 | 0.1% |
| Caribbean | 413 | 0.3% |
| Central America | 15,967 | 10.6% |
| Chile | 10 | 0.0% |
| China | 284 | 0.2% |
| Colombia | 267 | 0.2% |
| Congo | 17 | 0.0% |
| Cuba | 63 | 0.0% |
| Czechoslovakia | 22 | 0.0% |
| Dominica | 31 | 0.0% |
| Dominican Republic | 69 | 0.1% |
| Eastern Africa | 63 | 0.0% |
| Eastern Asia | 382 | 0.3% |
| Eastern Europe | 1,447 | 1.0% |
| Ecuador | 37 | 0.0% |
| Egypt | 23 | 0.0% |
| El Salvador | 13 | 0.0% |
| England | 51 | 0.0% |
| Eritrea | 40 | 0.0% |
| Ethiopia | 14 | 0.0% |
| Europe | 1,937 | 1.3% |
| France | 27 | 0.0% |
| Germany | 131 | 0.1% |
| Ghana | 616 | 0.4% |
| Greece | 43 | 0.0% |
| Guatemala | 182 | 0.1% |
| Haiti | 91 | 0.1% |
| Honduras | 43 | 0.0% |
| Hungary | 5 | 0.0% |
| India | 251 | 0.2% |
| Ireland | 22 | 0.0% |
| Israel | 15 | 0.0% |
| Italy | 90 | 0.1% |
| Jamaica | 123 | 0.1% |
| Japan | 24 | 0.0% |
| Korea | 65 | 0.0% |
| Laos | 188 | 0.1% |
| Latin America | 17,032 | 11.3% |
| Lebanon | 46 | 0.0% |
| Lithuania | 235 | 0.2% |
| Malaysia | 19 | 0.0% |
| Mexico | 15,709 | 10.5% |
| Middle Africa | 195 | 0.1% |
| Moldova | 125 | 0.1% |
| Morocco | 20 | 0.0% |
| Netherlands | 31 | 0.0% |
| Nigeria | 234 | 0.2% |
| North Macedonia | 159 | 0.1% |
| Northern Africa | 54 | 0.0% |
| Northern Europe | 156 | 0.1% |
| Pakistan | 143 | 0.1% |
| Panama | 20 | 0.0% |
| Peru | 77 | 0.1% |
| Philippines | 481 | 0.3% |
| Poland | 585 | 0.4% |
| Romania | 36 | 0.0% |
| Russia | 104 | 0.1% |
| Saudi Arabia | 2 | 0.0% |
| Scotland | 44 | 0.0% |
| Serbia | 7 | 0.0% |
| South Africa | 18 | 0.0% |
| South America | 652 | 0.4% |
| South Central Asia | 411 | 0.3% |
| South Eastern Asia | 862 | 0.6% |
| Southern Europe | 145 | 0.1% |
| Spain | 12 | 0.0% |
| Taiwan | 82 | 0.1% |
| Thailand | 37 | 0.0% |
| Trinidad and Tobago | 15 | 0.0% |
| Ukraine | 104 | 0.1% |
| Uruguay | 15 | 0.0% |
| Venezuela | 235 | 0.2% |
| Vietnam | 53 | 0.0% |
| Western Africa | 904 | 0.6% |
| Western Asia | 63 | 0.0% |
| Western Europe | 189 | 0.1% | View All 84 Rows |
Sex and Age in Joliet
Sex and Age in Joliet
The most populous age groups in Joliet are 10 to 14 Years (6,431 | 8.6%) for men and 10 to 14 Years (6,045 | 8.1%) for women.
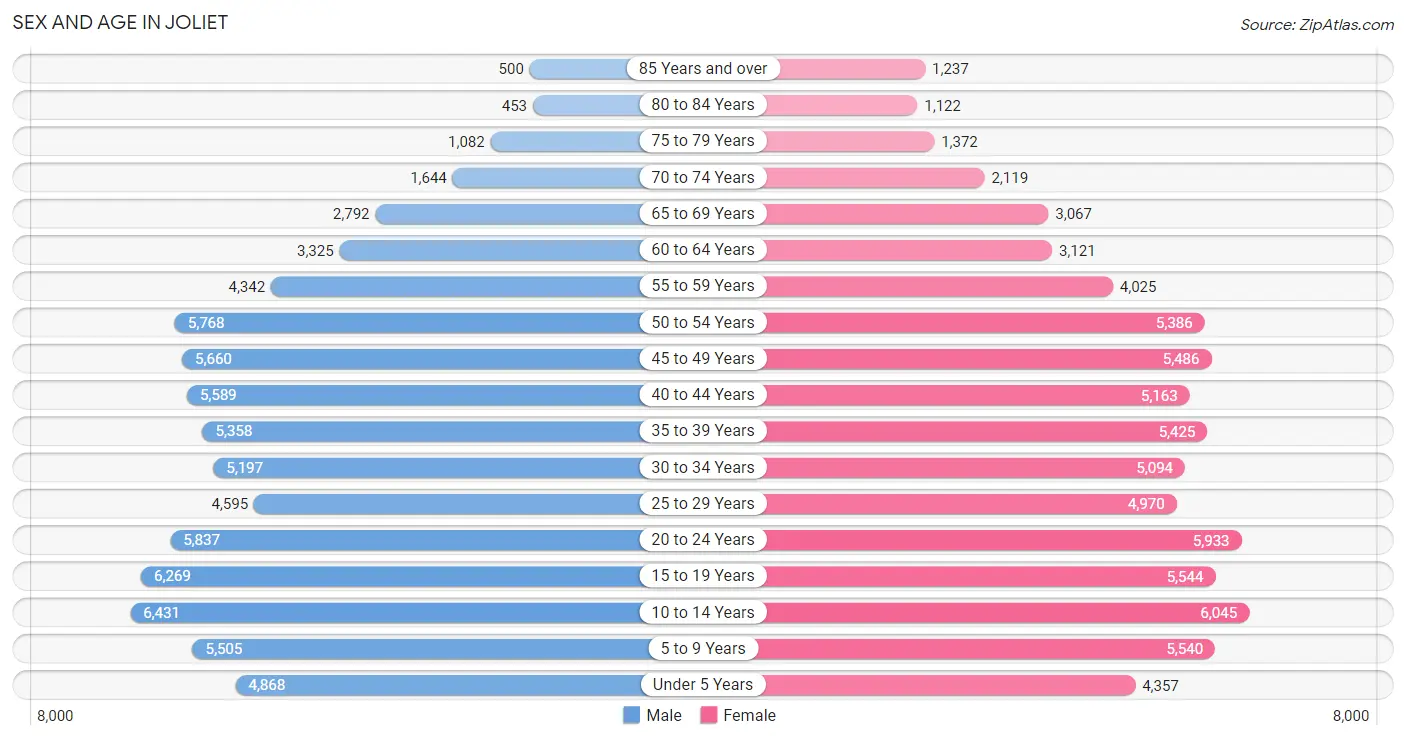
| Age Bracket | Male | Female |
| Under 5 Years | 4,868 (6.5%) | 4,357 (5.8%) |
| 5 to 9 Years | 5,505 (7.3%) | 5,540 (7.4%) |
| 10 to 14 Years | 6,431 (8.6%) | 6,045 (8.1%) |
| 15 to 19 Years | 6,269 (8.3%) | 5,544 (7.4%) |
| 20 to 24 Years | 5,837 (7.8%) | 5,933 (7.9%) |
| 25 to 29 Years | 4,595 (6.1%) | 4,970 (6.6%) |
| 30 to 34 Years | 5,197 (6.9%) | 5,094 (6.8%) |
| 35 to 39 Years | 5,358 (7.1%) | 5,425 (7.2%) |
| 40 to 44 Years | 5,589 (7.4%) | 5,163 (6.9%) |
| 45 to 49 Years | 5,660 (7.5%) | 5,486 (7.3%) |
| 50 to 54 Years | 5,768 (7.7%) | 5,386 (7.2%) |
| 55 to 59 Years | 4,342 (5.8%) | 4,025 (5.4%) |
| 60 to 64 Years | 3,325 (4.4%) | 3,121 (4.2%) |
| 65 to 69 Years | 2,792 (3.7%) | 3,067 (4.1%) |
| 70 to 74 Years | 1,644 (2.2%) | 2,119 (2.8%) |
| 75 to 79 Years | 1,082 (1.4%) | 1,372 (1.8%) |
| 80 to 84 Years | 453 (0.6%) | 1,122 (1.5%) |
| 85 Years and over | 500 (0.7%) | 1,237 (1.7%) |
| Total | 75,215 (100.0%) | 75,006 (100.0%) |
Families and Households in Joliet
Median Family Size in Joliet
The median family size in Joliet is 3.55 persons per family, with married-couple families (24,756 | 69.8%) accounting for the largest median family size of 3.69 persons per family. On the other hand, single male/father families (3,561 | 10.0%) represent the smallest median family size with 3.18 persons per family.
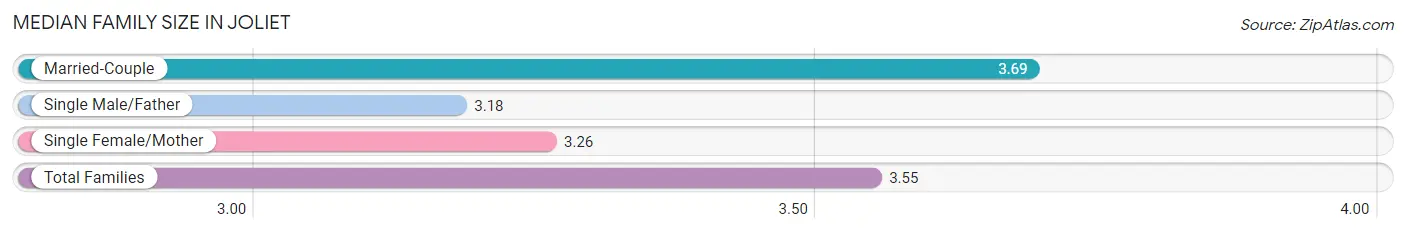
| Family Type | # Families | Family Size |
| Married-Couple | 24,756 (69.8%) | 3.69 |
| Single Male/Father | 3,561 (10.0%) | 3.18 |
| Single Female/Mother | 7,148 (20.2%) | 3.26 |
| Total Families | 35,465 (100.0%) | 3.55 |
Median Household Size in Joliet
The median household size in Joliet is 2.96 persons per household, with married-couple households (24,756 | 49.7%) accounting for the largest median household size of 3.72 persons per household. non-family households (14,350 | 28.8%) represent the smallest median household size with 1.21 persons per household.
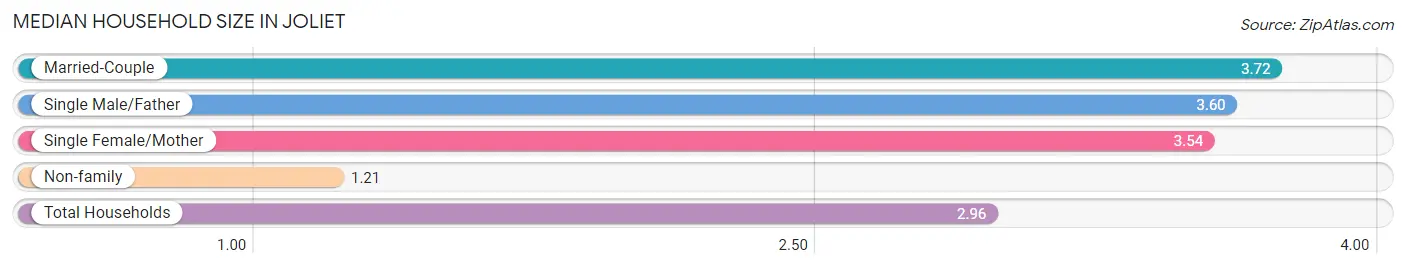
| Household Type | # Households | Household Size |
| Married-Couple | 24,756 (49.7%) | 3.72 |
| Single Male/Father | 3,561 (7.1%) | 3.60 |
| Single Female/Mother | 7,148 (14.3%) | 3.54 |
| Non-family | 14,350 (28.8%) | 1.21 |
| Total Households | 49,815 (100.0%) | 2.96 |
Household Size by Marriage Status in Joliet
Out of a total of 49,815 households in Joliet, 35,465 (71.2%) are family households, while 14,350 (28.8%) are nonfamily households. The most numerous type of family households are 2-person households, comprising 10,541, and the most common type of nonfamily households are 1-person households, comprising 11,852.
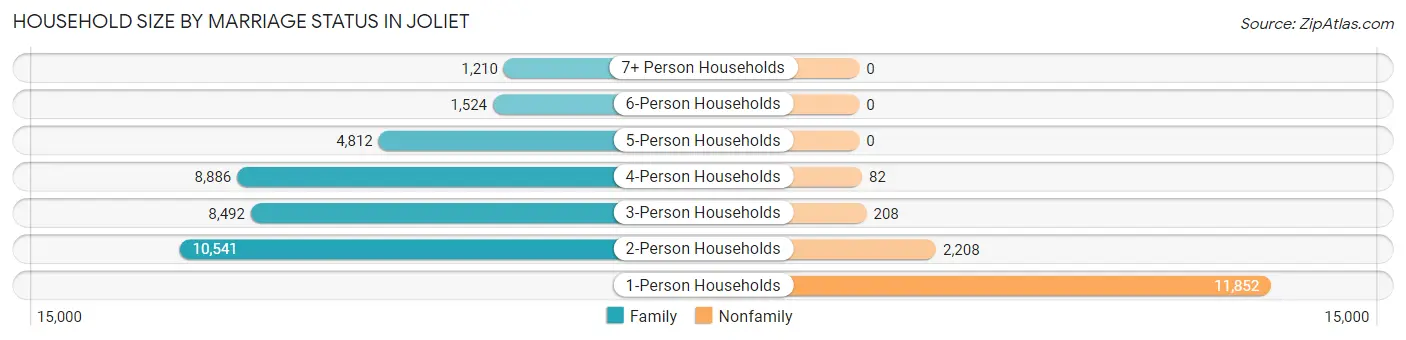
| Household Size | Family Households | Nonfamily Households |
| 1-Person Households | - | 11,852 (23.8%) |
| 2-Person Households | 10,541 (21.2%) | 2,208 (4.4%) |
| 3-Person Households | 8,492 (17.1%) | 208 (0.4%) |
| 4-Person Households | 8,886 (17.8%) | 82 (0.2%) |
| 5-Person Households | 4,812 (9.7%) | 0 (0.0%) |
| 6-Person Households | 1,524 (3.1%) | 0 (0.0%) |
| 7+ Person Households | 1,210 (2.4%) | 0 (0.0%) |
| Total | 35,465 (71.2%) | 14,350 (28.8%) |
Female Fertility in Joliet
Fertility by Age in Joliet
Average fertility rate in Joliet is 59.0 births per 1,000 women. Women in the age bracket of 20 to 34 years have the highest fertility rate with 99.0 births per 1,000 women. Women in the age bracket of 20 to 34 years acount for 69.2% of all women with births.
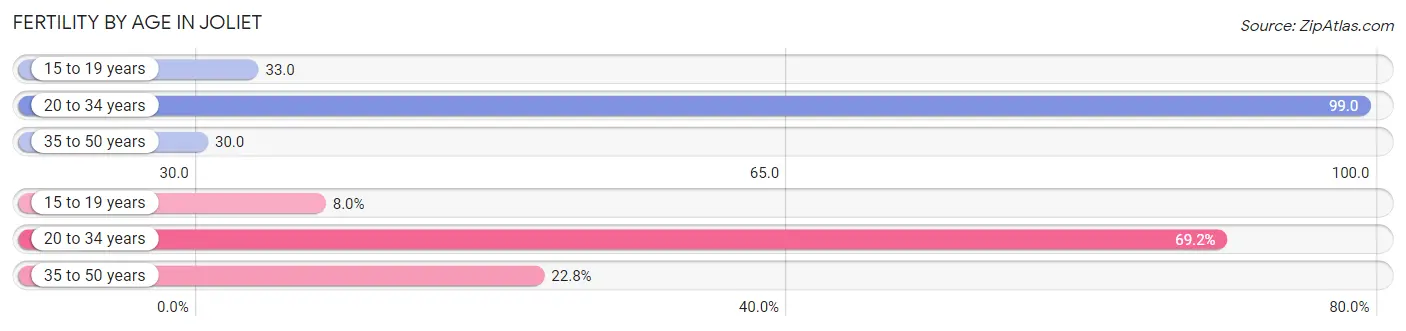
| Age Bracket | Women with Births | Births / 1,000 Women |
| 15 to 19 years | 183 (8.0%) | 33.0 |
| 20 to 34 years | 1,585 (69.2%) | 99.0 |
| 35 to 50 years | 523 (22.8%) | 30.0 |
| Total | 2,291 (100.0%) | 59.0 |
Fertility by Age by Marriage Status in Joliet
69.5% of women with births (2,291) in Joliet are married. The highest percentage of unmarried women with births falls into 15 to 19 years age bracket with 76.0% of them unmarried at the time of birth, while the lowest percentage of unmarried women with births belong to 35 to 50 years age bracket with 9.9% of them unmarried.
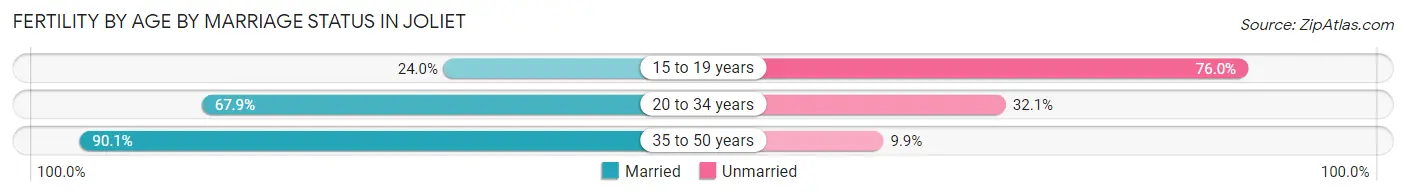
| Age Bracket | Married | Unmarried |
| 15 to 19 years | 44 (24.0%) | 139 (76.0%) |
| 20 to 34 years | 1,076 (67.9%) | 509 (32.1%) |
| 35 to 50 years | 471 (90.1%) | 52 (9.9%) |
| Total | 1,592 (69.5%) | 699 (30.5%) |
Fertility by Education in Joliet
Average fertility rate in Joliet is 59.0 births per 1,000 women. Women with the education attainment of graduate degree have the highest fertility rate of 131.0 births per 1,000 women, while women with the education attainment of less than high school have the lowest fertility at 40.0 births per 1,000 women. Women with the education attainment of college or associate's degree represent 30.0% of all women with births.
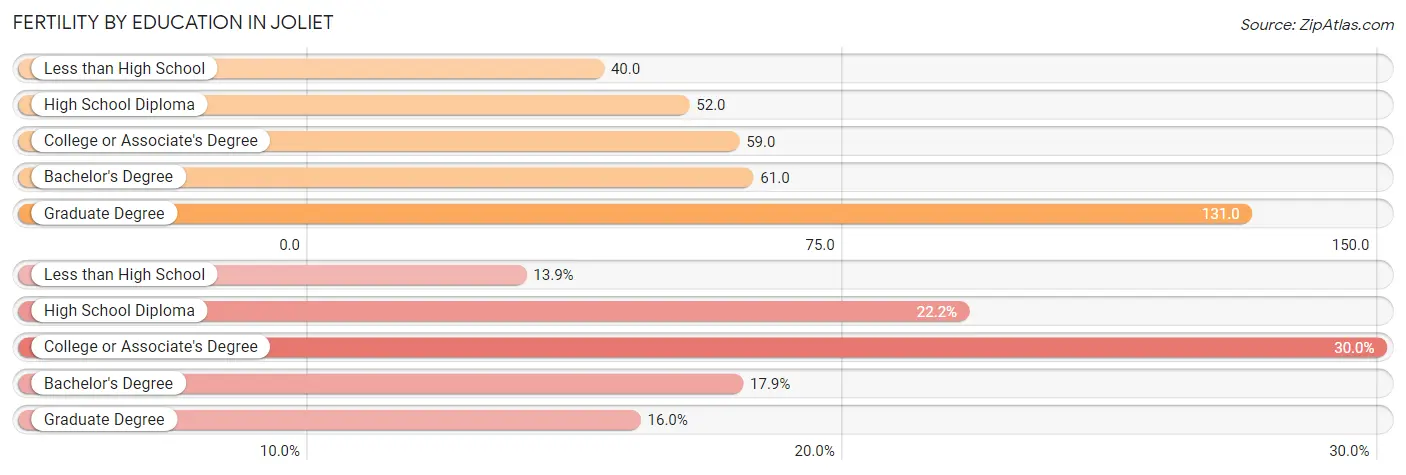
| Educational Attainment | Women with Births | Births / 1,000 Women |
| Less than High School | 318 (13.9%) | 40.0 |
| High School Diploma | 508 (22.2%) | 52.0 |
| College or Associate's Degree | 687 (30.0%) | 59.0 |
| Bachelor's Degree | 411 (17.9%) | 61.0 |
| Graduate Degree | 367 (16.0%) | 131.0 |
| Total | 2,291 (100.0%) | 59.0 |
Fertility by Education by Marriage Status in Joliet
30.5% of women with births in Joliet are unmarried. Women with the educational attainment of bachelor's degree are most likely to be married with 93.4% of them married at childbirth, while women with the educational attainment of less than high school are least likely to be married with 65.4% of them unmarried at childbirth.
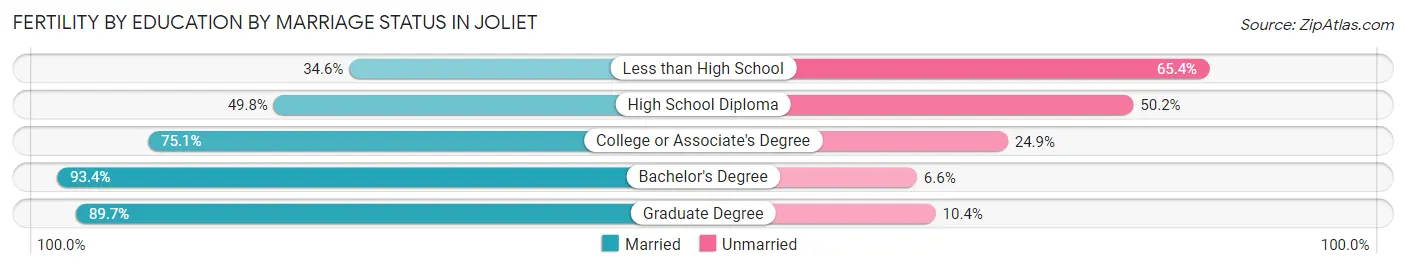
| Educational Attainment | Married | Unmarried |
| Less than High School | 110 (34.6%) | 208 (65.4%) |
| High School Diploma | 253 (49.8%) | 255 (50.2%) |
| College or Associate's Degree | 516 (75.1%) | 171 (24.9%) |
| Bachelor's Degree | 384 (93.4%) | 27 (6.6%) |
| Graduate Degree | 329 (89.6%) | 38 (10.3%) |
| Total | 1,592 (69.5%) | 699 (30.5%) |
Employment Characteristics in Joliet
Employment by Class of Employer in Joliet
Among the 72,984 employed individuals in Joliet, private company employees (53,747 | 73.6%), local government employees (6,022 | 8.3%), and not-for-profit organizations (4,803 | 6.6%) make up the most common classes of employment.
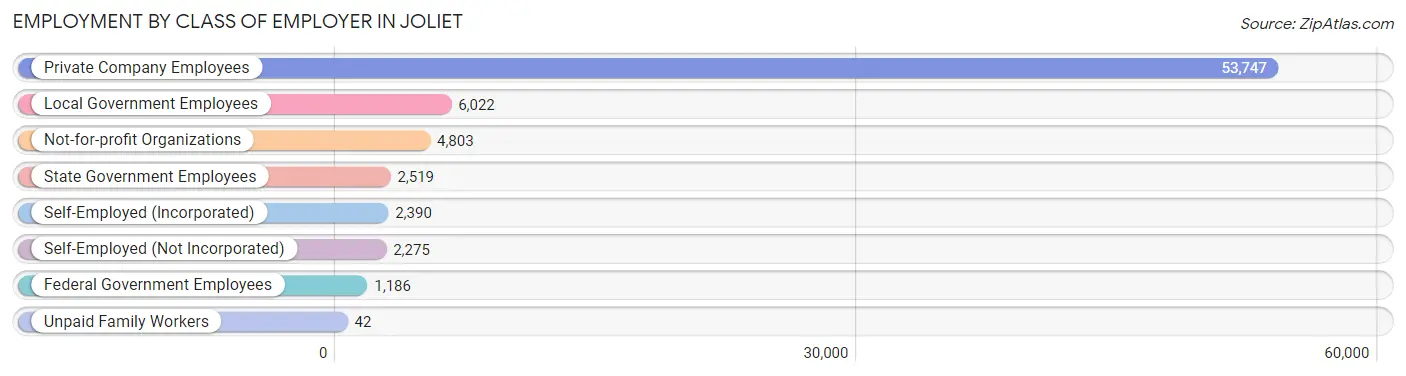
| Employer Class | # Employees | % Employees |
| Private Company Employees | 53,747 | 73.6% |
| Self-Employed (Incorporated) | 2,390 | 3.3% |
| Self-Employed (Not Incorporated) | 2,275 | 3.1% |
| Not-for-profit Organizations | 4,803 | 6.6% |
| Local Government Employees | 6,022 | 8.3% |
| State Government Employees | 2,519 | 3.5% |
| Federal Government Employees | 1,186 | 1.6% |
| Unpaid Family Workers | 42 | 0.1% |
| Total | 72,984 | 100.0% |
Employment Status by Age in Joliet
According to the labor force statistics for Joliet, out of the total population over 16 years of age (114,712), 69.7% or 79,954 individuals are in the labor force, with 6.2% or 4,957 of them unemployed. The age group with the highest labor force participation rate is 35 to 44 years, with 85.1% or 18,326 individuals in the labor force. Within the labor force, the 16 to 19 years age range has the highest percentage of unemployed individuals, with 14.7% or 641 of them being unemployed.
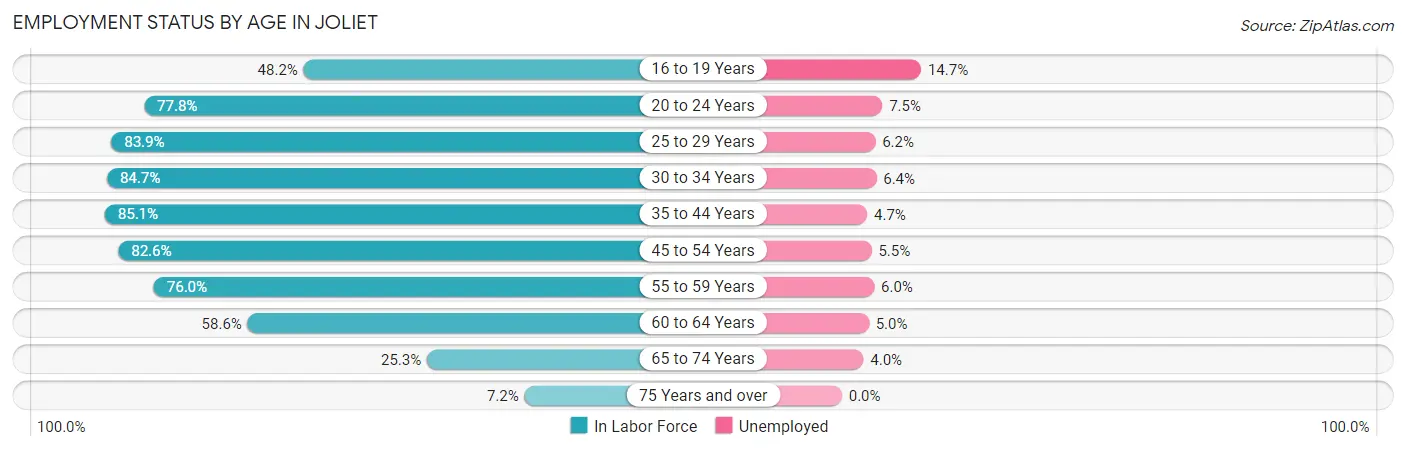
| Age Bracket | In Labor Force | Unemployed |
| 16 to 19 Years | 4,362 (48.2%) | 641 (14.7%) |
| 20 to 24 Years | 9,157 (77.8%) | 687 (7.5%) |
| 25 to 29 Years | 8,025 (83.9%) | 498 (6.2%) |
| 30 to 34 Years | 8,716 (84.7%) | 558 (6.4%) |
| 35 to 44 Years | 18,326 (85.1%) | 861 (4.7%) |
| 45 to 54 Years | 18,420 (82.6%) | 1,013 (5.5%) |
| 55 to 59 Years | 6,359 (76.0%) | 382 (6.0%) |
| 60 to 64 Years | 3,777 (58.6%) | 189 (5.0%) |
| 65 to 74 Years | 2,434 (25.3%) | 97 (4.0%) |
| 75 Years and over | 415 (7.2%) | 0 (0.0%) |
| Total | 79,954 (69.7%) | 4,957 (6.2%) |
Employment Status by Educational Attainment in Joliet
According to labor force statistics for Joliet, 81.0% of individuals (63,588) out of the total population between 25 and 64 years of age (78,504) are in the labor force, with 5.5% or 3,497 of them being unemployed. The group with the highest labor force participation rate are those with the educational attainment of bachelor's degree or higher, with 89.9% or 17,960 individuals in the labor force. Within the labor force, individuals with less than high school education have the highest percentage of unemployment, with 12.9% or 1,040 of them being unemployed.
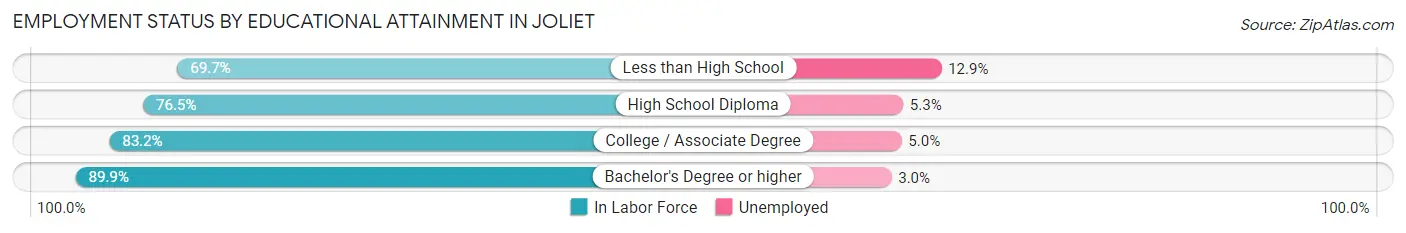
| Educational Attainment | In Labor Force | Unemployed |
| Less than High School | 8,061 (69.7%) | 1,492 (12.9%) |
| High School Diploma | 16,906 (76.5%) | 1,171 (5.3%) |
| College / Associate Degree | 20,684 (83.2%) | 1,243 (5.0%) |
| Bachelor's Degree or higher | 17,960 (89.9%) | 599 (3.0%) |
| Total | 63,588 (81.0%) | 4,318 (5.5%) |
Employment Occupations by Sex in Joliet
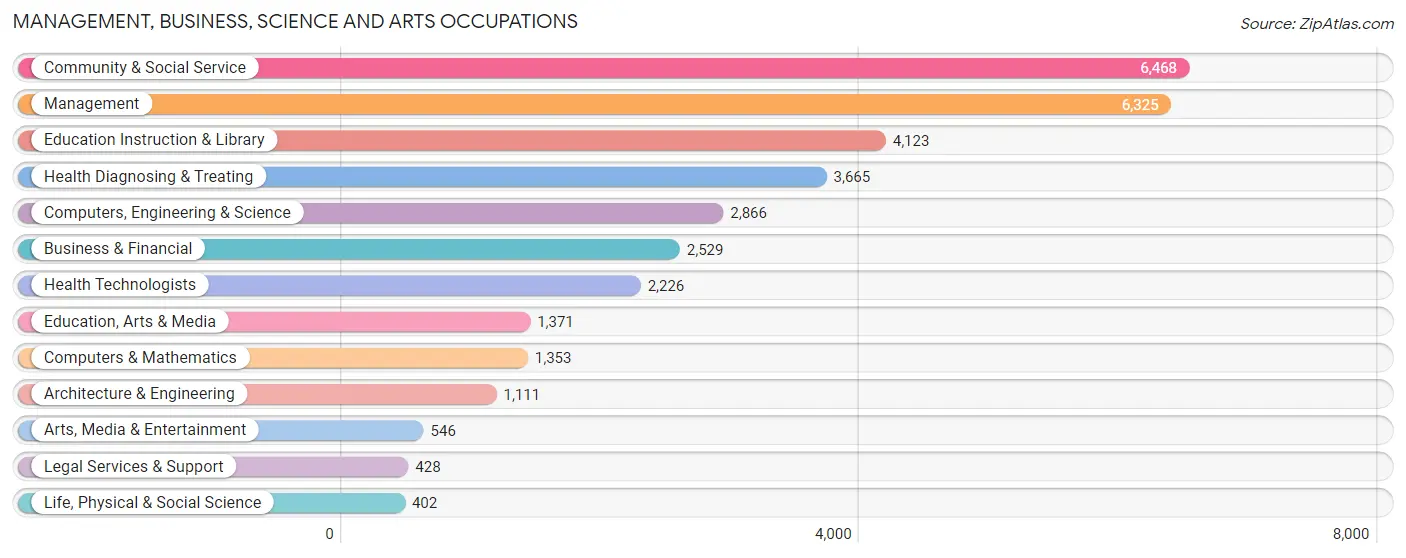
Management, Business, Science and Arts Occupations
The most common Management, Business, Science and Arts occupations in Joliet are Community & Social Service (6,468 | 8.6%), Management (6,325 | 8.4%), Education Instruction & Library (4,123 | 5.5%), Health Diagnosing & Treating (3,665 | 4.9%), and Computers, Engineering & Science (2,866 | 3.8%).
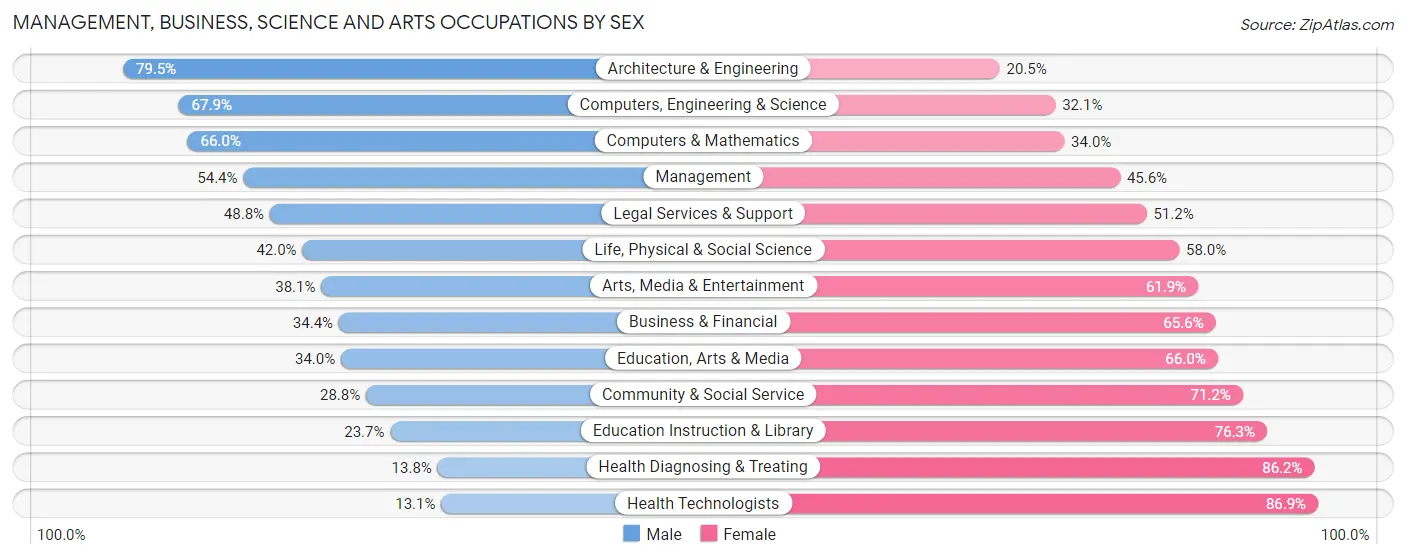
Management, Business, Science and Arts Occupations by Sex
Within the Management, Business, Science and Arts occupations in Joliet, the most male-oriented occupations are Architecture & Engineering (79.5%), Computers, Engineering & Science (67.9%), and Computers & Mathematics (66.0%), while the most female-oriented occupations are Health Technologists (86.9%), Health Diagnosing & Treating (86.2%), and Education Instruction & Library (76.3%).
| Occupation | Male | Female |
| Management | 3,438 (54.4%) | 2,887 (45.6%) |
| Business & Financial | 871 (34.4%) | 1,658 (65.6%) |
| Computers, Engineering & Science | 1,945 (67.9%) | 921 (32.1%) |
| Computers & Mathematics | 893 (66.0%) | 460 (34.0%) |
| Architecture & Engineering | 883 (79.5%) | 228 (20.5%) |
| Life, Physical & Social Science | 169 (42.0%) | 233 (58.0%) |
| Community & Social Service | 1,861 (28.8%) | 4,607 (71.2%) |
| Education, Arts & Media | 466 (34.0%) | 905 (66.0%) |
| Legal Services & Support | 209 (48.8%) | 219 (51.2%) |
| Education Instruction & Library | 978 (23.7%) | 3,145 (76.3%) |
| Arts, Media & Entertainment | 208 (38.1%) | 338 (61.9%) |
| Health Diagnosing & Treating | 507 (13.8%) | 3,158 (86.2%) |
| Health Technologists | 291 (13.1%) | 1,935 (86.9%) |
| Total (Category) | 8,622 (39.5%) | 13,231 (60.6%) |
| Total (Overall) | 40,492 (54.0%) | 34,505 (46.0%) |
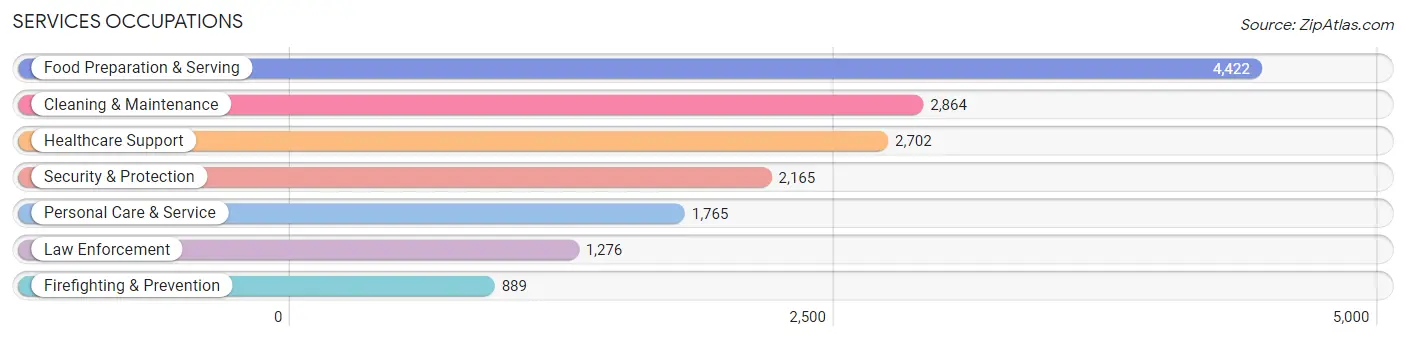
Services Occupations
The most common Services occupations in Joliet are Food Preparation & Serving (4,422 | 5.9%), Cleaning & Maintenance (2,864 | 3.8%), Healthcare Support (2,702 | 3.6%), Security & Protection (2,165 | 2.9%), and Personal Care & Service (1,765 | 2.4%).
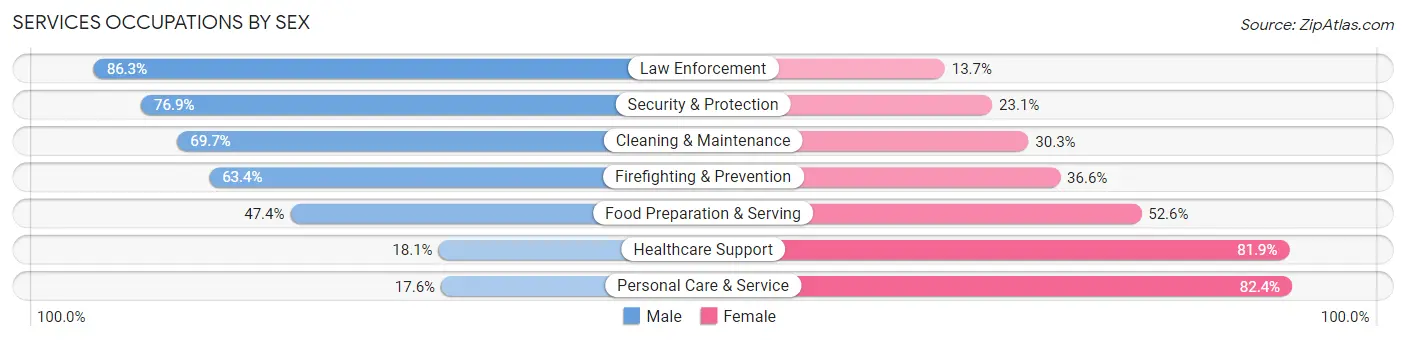
Services Occupations by Sex
Within the Services occupations in Joliet, the most male-oriented occupations are Law Enforcement (86.3%), Security & Protection (76.9%), and Cleaning & Maintenance (69.7%), while the most female-oriented occupations are Personal Care & Service (82.4%), Healthcare Support (81.9%), and Food Preparation & Serving (52.6%).
| Occupation | Male | Female |
| Healthcare Support | 488 (18.1%) | 2,214 (81.9%) |
| Security & Protection | 1,665 (76.9%) | 500 (23.1%) |
| Firefighting & Prevention | 564 (63.4%) | 325 (36.6%) |
| Law Enforcement | 1,101 (86.3%) | 175 (13.7%) |
| Food Preparation & Serving | 2,095 (47.4%) | 2,327 (52.6%) |
| Cleaning & Maintenance | 1,997 (69.7%) | 867 (30.3%) |
| Personal Care & Service | 310 (17.6%) | 1,455 (82.4%) |
| Total (Category) | 6,555 (47.1%) | 7,363 (52.9%) |
| Total (Overall) | 40,492 (54.0%) | 34,505 (46.0%) |
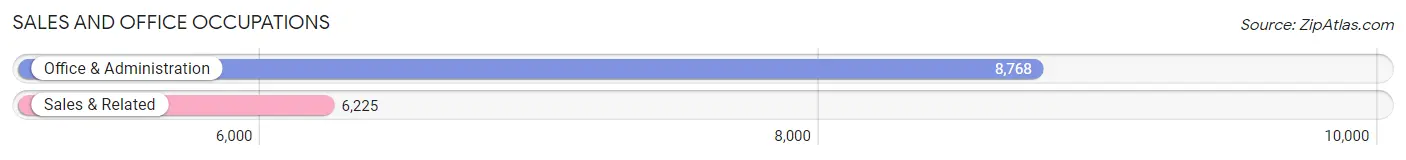
Sales and Office Occupations
The most common Sales and Office occupations in Joliet are Office & Administration (8,768 | 11.7%), and Sales & Related (6,225 | 8.3%).
Sales and Office Occupations by Sex
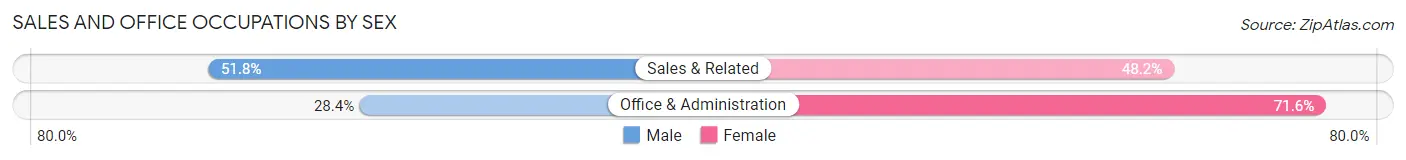
| Occupation | Male | Female |
| Sales & Related | 3,223 (51.8%) | 3,002 (48.2%) |
| Office & Administration | 2,490 (28.4%) | 6,278 (71.6%) |
| Total (Category) | 5,713 (38.1%) | 9,280 (61.9%) |
| Total (Overall) | 40,492 (54.0%) | 34,505 (46.0%) |
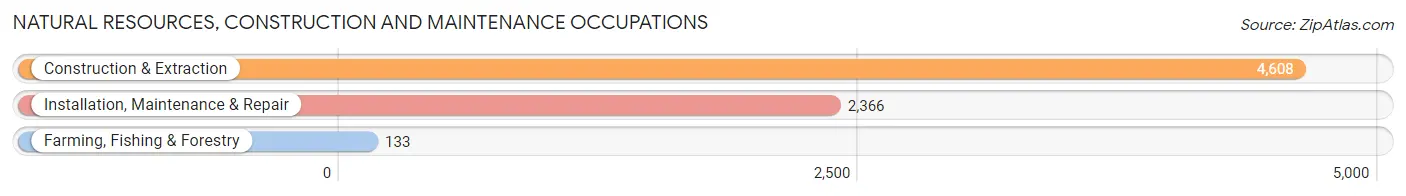
Natural Resources, Construction and Maintenance Occupations
The most common Natural Resources, Construction and Maintenance occupations in Joliet are Construction & Extraction (4,608 | 6.1%), Installation, Maintenance & Repair (2,366 | 3.2%), and Farming, Fishing & Forestry (133 | 0.2%).
Natural Resources, Construction and Maintenance Occupations by Sex
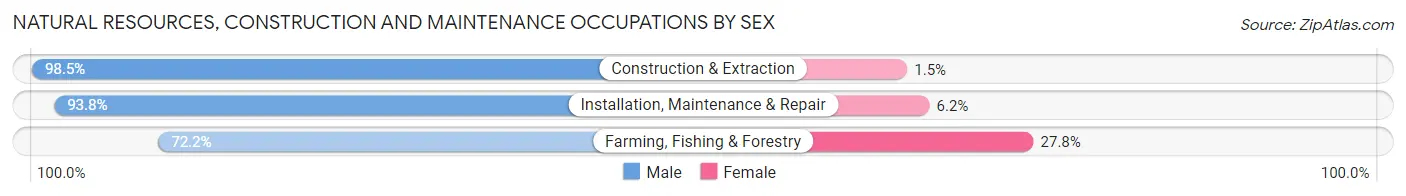
| Occupation | Male | Female |
| Farming, Fishing & Forestry | 96 (72.2%) | 37 (27.8%) |
| Construction & Extraction | 4,537 (98.5%) | 71 (1.5%) |
| Installation, Maintenance & Repair | 2,220 (93.8%) | 146 (6.2%) |
| Total (Category) | 6,853 (96.4%) | 254 (3.6%) |
| Total (Overall) | 40,492 (54.0%) | 34,505 (46.0%) |
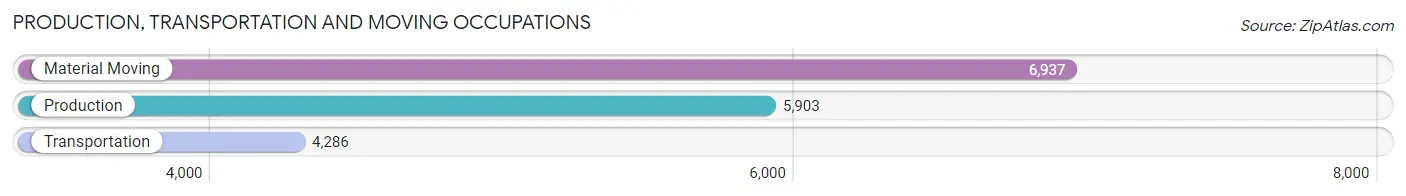
Production, Transportation and Moving Occupations
The most common Production, Transportation and Moving occupations in Joliet are Material Moving (6,937 | 9.2%), Production (5,903 | 7.9%), and Transportation (4,286 | 5.7%).
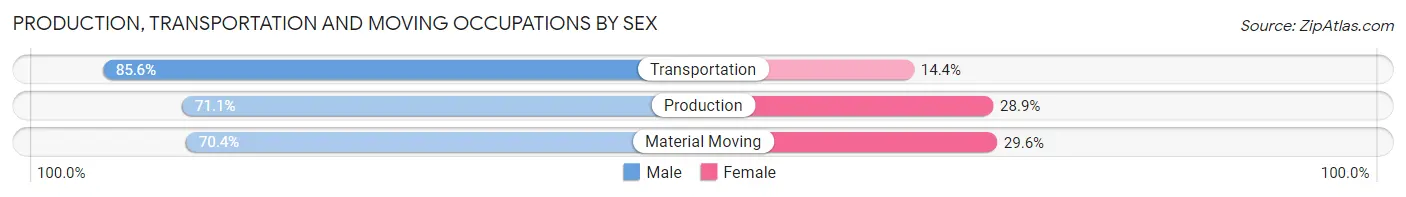
Production, Transportation and Moving Occupations by Sex
| Occupation | Male | Female |
| Production | 4,196 (71.1%) | 1,707 (28.9%) |
| Transportation | 3,670 (85.6%) | 616 (14.4%) |
| Material Moving | 4,883 (70.4%) | 2,054 (29.6%) |
| Total (Category) | 12,749 (74.4%) | 4,377 (25.6%) |
| Total (Overall) | 40,492 (54.0%) | 34,505 (46.0%) |
Employment Industries by Sex in Joliet
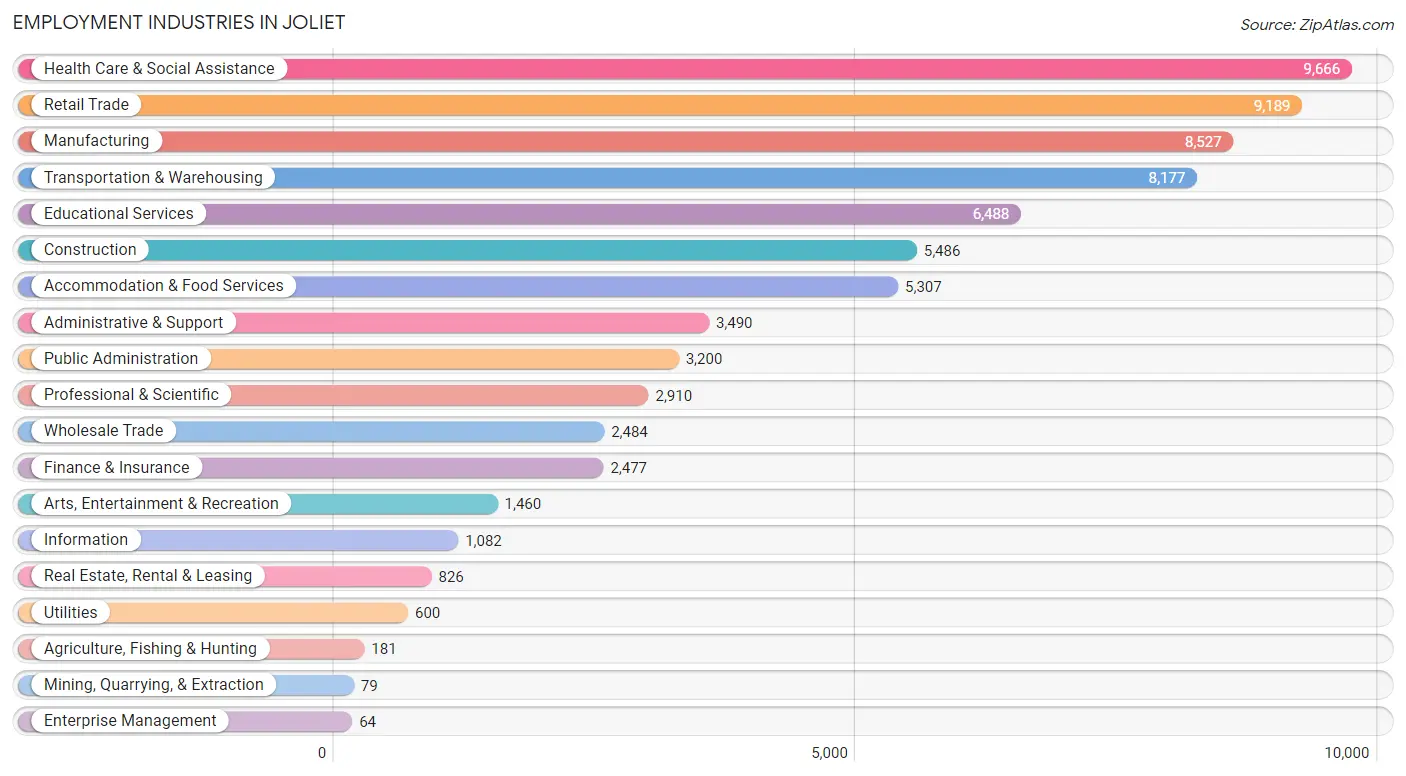
Employment Industries in Joliet
The major employment industries in Joliet include Health Care & Social Assistance (9,666 | 12.9%), Retail Trade (9,189 | 12.2%), Manufacturing (8,527 | 11.4%), Transportation & Warehousing (8,177 | 10.9%), and Educational Services (6,488 | 8.6%).
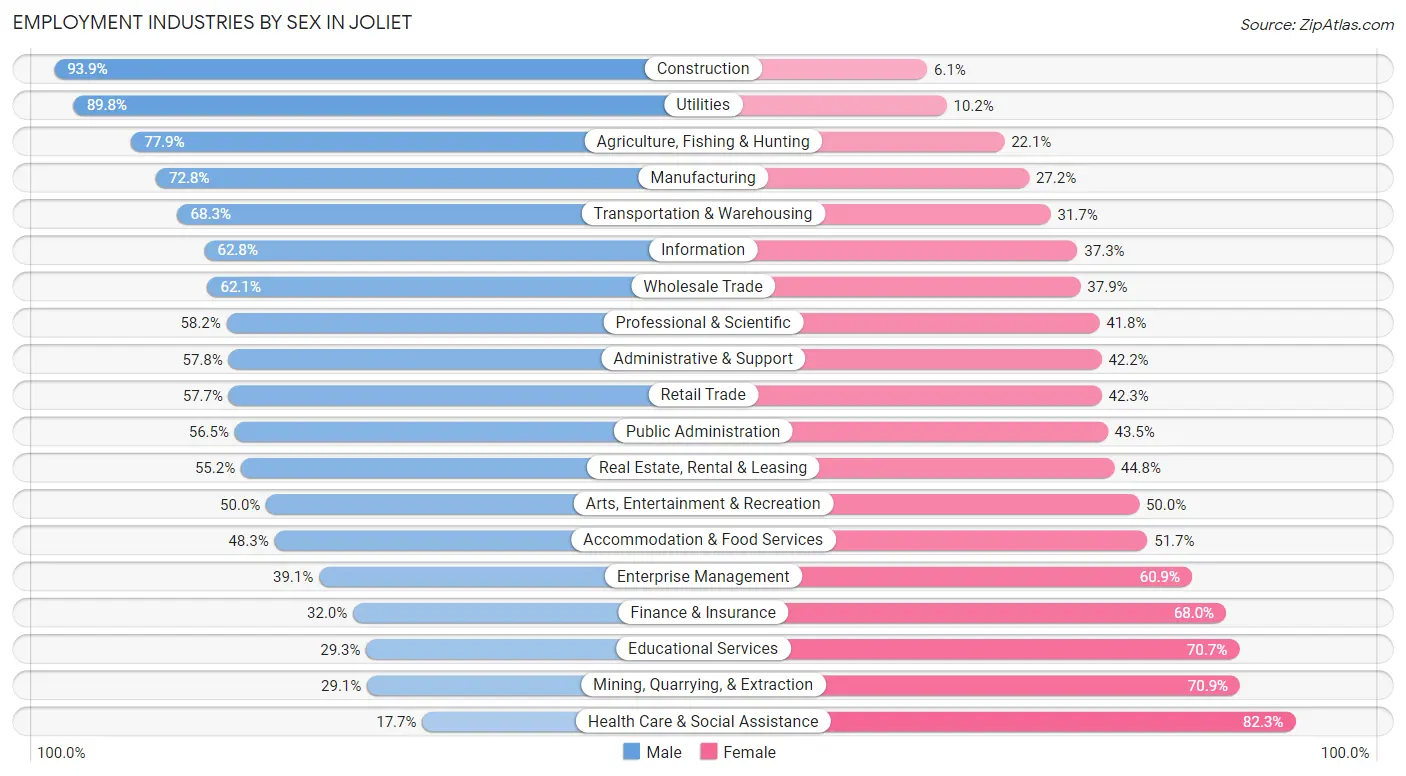
Employment Industries by Sex in Joliet
The Joliet industries that see more men than women are Construction (93.9%), Utilities (89.8%), and Agriculture, Fishing & Hunting (77.9%), whereas the industries that tend to have a higher number of women are Health Care & Social Assistance (82.3%), Mining, Quarrying, & Extraction (70.9%), and Educational Services (70.7%).
| Industry | Male | Female |
| Agriculture, Fishing & Hunting | 141 (77.9%) | 40 (22.1%) |
| Mining, Quarrying, & Extraction | 23 (29.1%) | 56 (70.9%) |
| Construction | 5,149 (93.9%) | 337 (6.1%) |
| Manufacturing | 6,205 (72.8%) | 2,322 (27.2%) |
| Wholesale Trade | 1,543 (62.1%) | 941 (37.9%) |
| Retail Trade | 5,305 (57.7%) | 3,884 (42.3%) |
| Transportation & Warehousing | 5,586 (68.3%) | 2,591 (31.7%) |
| Utilities | 539 (89.8%) | 61 (10.2%) |
| Information | 679 (62.7%) | 403 (37.2%) |
| Finance & Insurance | 793 (32.0%) | 1,684 (68.0%) |
| Real Estate, Rental & Leasing | 456 (55.2%) | 370 (44.8%) |
| Professional & Scientific | 1,694 (58.2%) | 1,216 (41.8%) |
| Enterprise Management | 25 (39.1%) | 39 (60.9%) |
| Administrative & Support | 2,016 (57.8%) | 1,474 (42.2%) |
| Educational Services | 1,899 (29.3%) | 4,589 (70.7%) |
| Health Care & Social Assistance | 1,709 (17.7%) | 7,957 (82.3%) |
| Arts, Entertainment & Recreation | 730 (50.0%) | 730 (50.0%) |
| Accommodation & Food Services | 2,562 (48.3%) | 2,745 (51.7%) |
| Public Administration | 1,808 (56.5%) | 1,392 (43.5%) |
| Total | 40,492 (54.0%) | 34,505 (46.0%) |
Education in Joliet
School Enrollment in Joliet
The most common levels of schooling among the 41,368 students in Joliet are high school (9,771 | 23.6%), middle school (9,662 | 23.4%), and elementary school (8,823 | 21.3%).
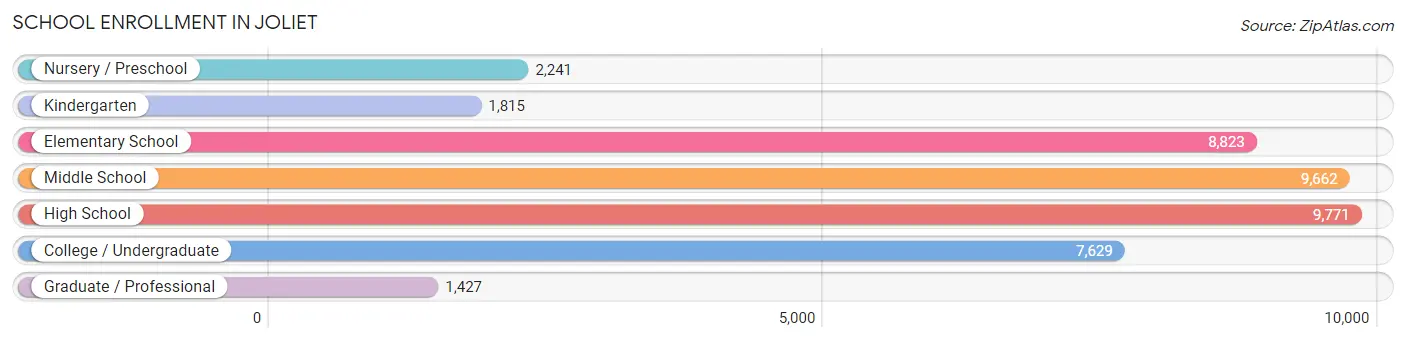
| School Level | # Students | % Students |
| Nursery / Preschool | 2,241 | 5.4% |
| Kindergarten | 1,815 | 4.4% |
| Elementary School | 8,823 | 21.3% |
| Middle School | 9,662 | 23.4% |
| High School | 9,771 | 23.6% |
| College / Undergraduate | 7,629 | 18.4% |
| Graduate / Professional | 1,427 | 3.5% |
| Total | 41,368 | 100.0% |
School Enrollment by Age by Funding Source in Joliet
Out of a total of 41,368 students who are enrolled in schools in Joliet, 6,412 (15.5%) attend a private institution, while the remaining 34,956 (84.5%) are enrolled in public schools. The age group of 35 years and over has the highest likelihood of being enrolled in private schools, with 843 (40.4% in the age bracket) enrolled. Conversely, the age group of 15 to 17 year olds has the lowest likelihood of being enrolled in a private school, with 6,376 (93.6% in the age bracket) attending a public institution.
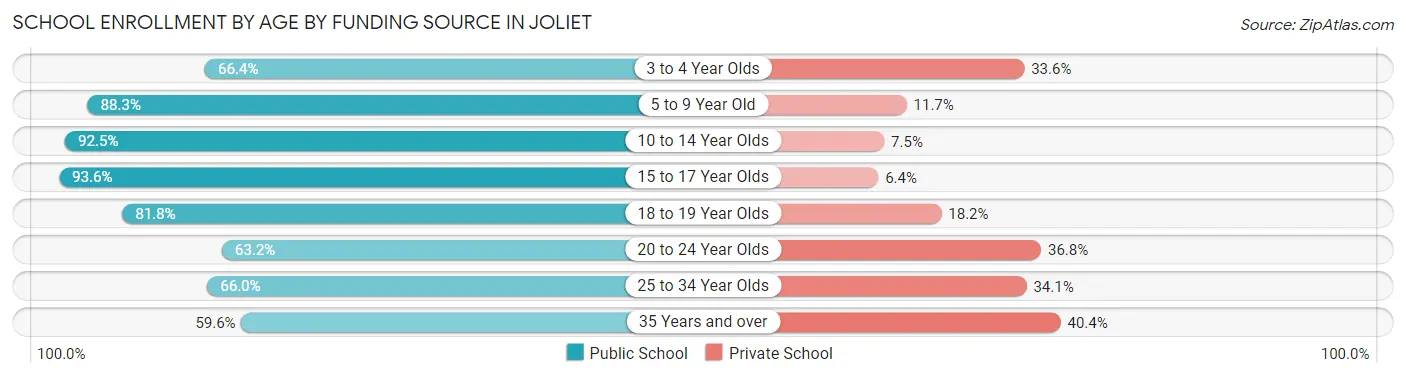
| Age Bracket | Public School | Private School |
| 3 to 4 Year Olds | 979 (66.4%) | 496 (33.6%) |
| 5 to 9 Year Old | 9,266 (88.3%) | 1,230 (11.7%) |
| 10 to 14 Year Olds | 11,243 (92.5%) | 917 (7.5%) |
| 15 to 17 Year Olds | 6,376 (93.6%) | 439 (6.4%) |
| 18 to 19 Year Olds | 2,373 (81.8%) | 528 (18.2%) |
| 20 to 24 Year Olds | 2,352 (63.2%) | 1,367 (36.8%) |
| 25 to 34 Year Olds | 1,131 (65.9%) | 584 (34.1%) |
| 35 Years and over | 1,244 (59.6%) | 843 (40.4%) |
| Total | 34,956 (84.5%) | 6,412 (15.5%) |
Educational Attainment by Field of Study in Joliet
Business (5,078 | 20.4%), education (3,875 | 15.6%), science & technology (2,757 | 11.1%), arts & humanities (2,330 | 9.4%), and engineering (1,532 | 6.1%) are the most common fields of study among 24,905 individuals in Joliet who have obtained a bachelor's degree or higher.
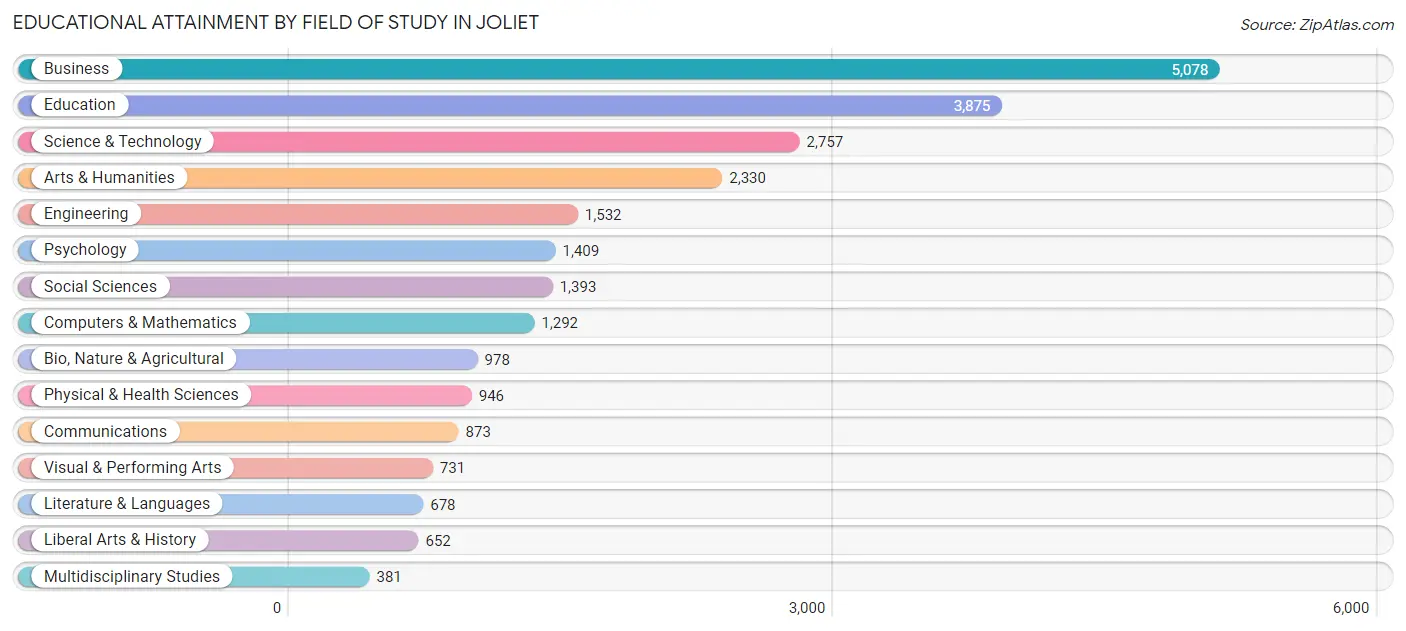
| Field of Study | # Graduates | % Graduates |
| Computers & Mathematics | 1,292 | 5.2% |
| Bio, Nature & Agricultural | 978 | 3.9% |
| Physical & Health Sciences | 946 | 3.8% |
| Psychology | 1,409 | 5.7% |
| Social Sciences | 1,393 | 5.6% |
| Engineering | 1,532 | 6.1% |
| Multidisciplinary Studies | 381 | 1.5% |
| Science & Technology | 2,757 | 11.1% |
| Business | 5,078 | 20.4% |
| Education | 3,875 | 15.6% |
| Literature & Languages | 678 | 2.7% |
| Liberal Arts & History | 652 | 2.6% |
| Visual & Performing Arts | 731 | 2.9% |
| Communications | 873 | 3.5% |
| Arts & Humanities | 2,330 | 9.4% |
| Total | 24,905 | 100.0% |
Transportation & Commute in Joliet
Vehicle Availability by Sex in Joliet
The most prevalent vehicle ownership categories in Joliet are males with 2 vehicles (16,897, accounting for 42.7%) and females with 2 vehicles (13,635, making up 51.0%).
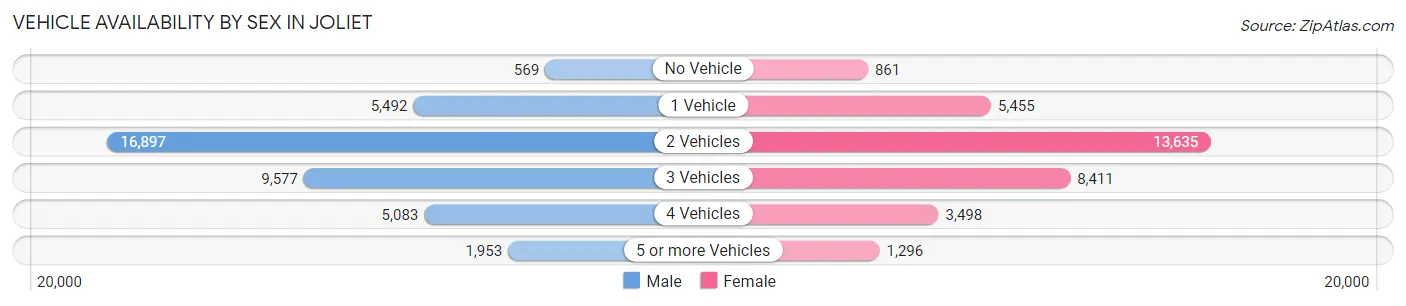
| Vehicles Available | Male | Female |
| No Vehicle | 569 (1.4%) | 861 (2.6%) |
| 1 Vehicle | 5,492 (13.9%) | 5,455 (16.5%) |
| 2 Vehicles | 16,897 (42.7%) | 13,635 (41.1%) |
| 3 Vehicles | 9,577 (24.2%) | 8,411 (25.4%) |
| 4 Vehicles | 5,083 (12.9%) | 3,498 (10.5%) |
| 5 or more Vehicles | 1,953 (4.9%) | 1,296 (3.9%) |
| Total | 39,571 (100.0%) | 33,156 (100.0%) |
Commute Time in Joliet
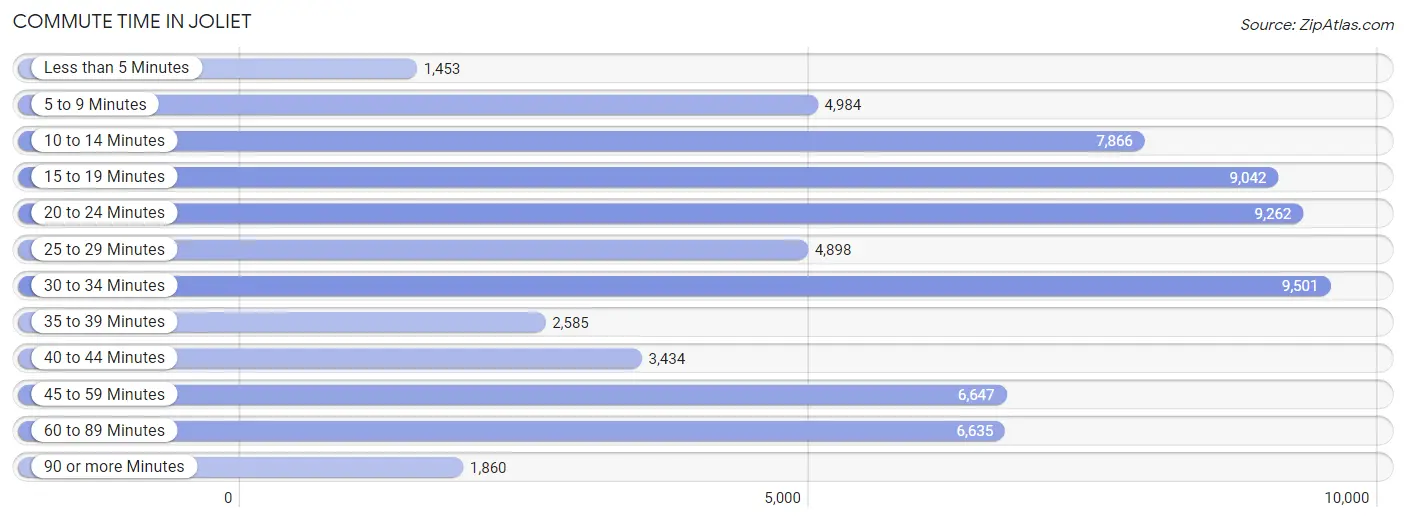
The most frequently occuring commute durations in Joliet are 30 to 34 minutes (9,501 commuters, 13.9%), 20 to 24 minutes (9,262 commuters, 13.6%), and 15 to 19 minutes (9,042 commuters, 13.3%).
| Commute Time | # Commuters | % Commuters |
| Less than 5 Minutes | 1,453 | 2.1% |
| 5 to 9 Minutes | 4,984 | 7.3% |
| 10 to 14 Minutes | 7,866 | 11.5% |
| 15 to 19 Minutes | 9,042 | 13.3% |
| 20 to 24 Minutes | 9,262 | 13.6% |
| 25 to 29 Minutes | 4,898 | 7.2% |
| 30 to 34 Minutes | 9,501 | 13.9% |
| 35 to 39 Minutes | 2,585 | 3.8% |
| 40 to 44 Minutes | 3,434 | 5.0% |
| 45 to 59 Minutes | 6,647 | 9.8% |
| 60 to 89 Minutes | 6,635 | 9.7% |
| 90 or more Minutes | 1,860 | 2.7% |
Commute Time by Sex in Joliet
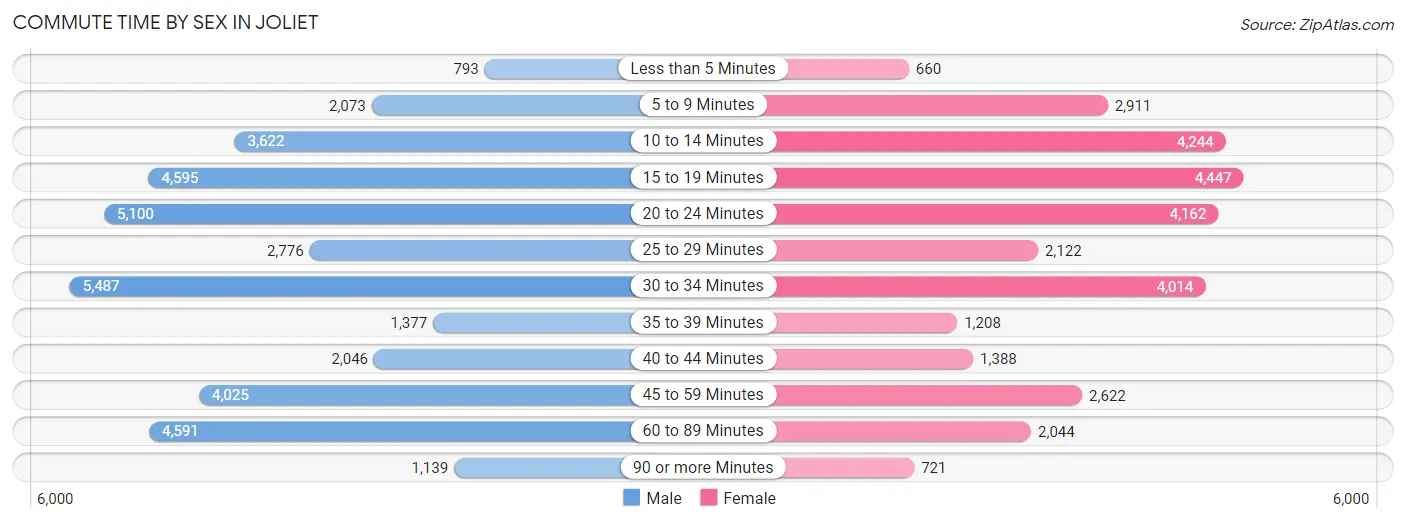
The most common commute times in Joliet are 30 to 34 minutes (5,487 commuters, 14.6%) for males and 15 to 19 minutes (4,447 commuters, 14.6%) for females.
| Commute Time | Male | Female |
| Less than 5 Minutes | 793 (2.1%) | 660 (2.2%) |
| 5 to 9 Minutes | 2,073 (5.5%) | 2,911 (9.5%) |
| 10 to 14 Minutes | 3,622 (9.6%) | 4,244 (13.9%) |
| 15 to 19 Minutes | 4,595 (12.2%) | 4,447 (14.6%) |
| 20 to 24 Minutes | 5,100 (13.6%) | 4,162 (13.6%) |
| 25 to 29 Minutes | 2,776 (7.4%) | 2,122 (7.0%) |
| 30 to 34 Minutes | 5,487 (14.6%) | 4,014 (13.1%) |
| 35 to 39 Minutes | 1,377 (3.7%) | 1,208 (4.0%) |
| 40 to 44 Minutes | 2,046 (5.4%) | 1,388 (4.5%) |
| 45 to 59 Minutes | 4,025 (10.7%) | 2,622 (8.6%) |
| 60 to 89 Minutes | 4,591 (12.2%) | 2,044 (6.7%) |
| 90 or more Minutes | 1,139 (3.0%) | 721 (2.4%) |
Time of Departure to Work by Sex in Joliet
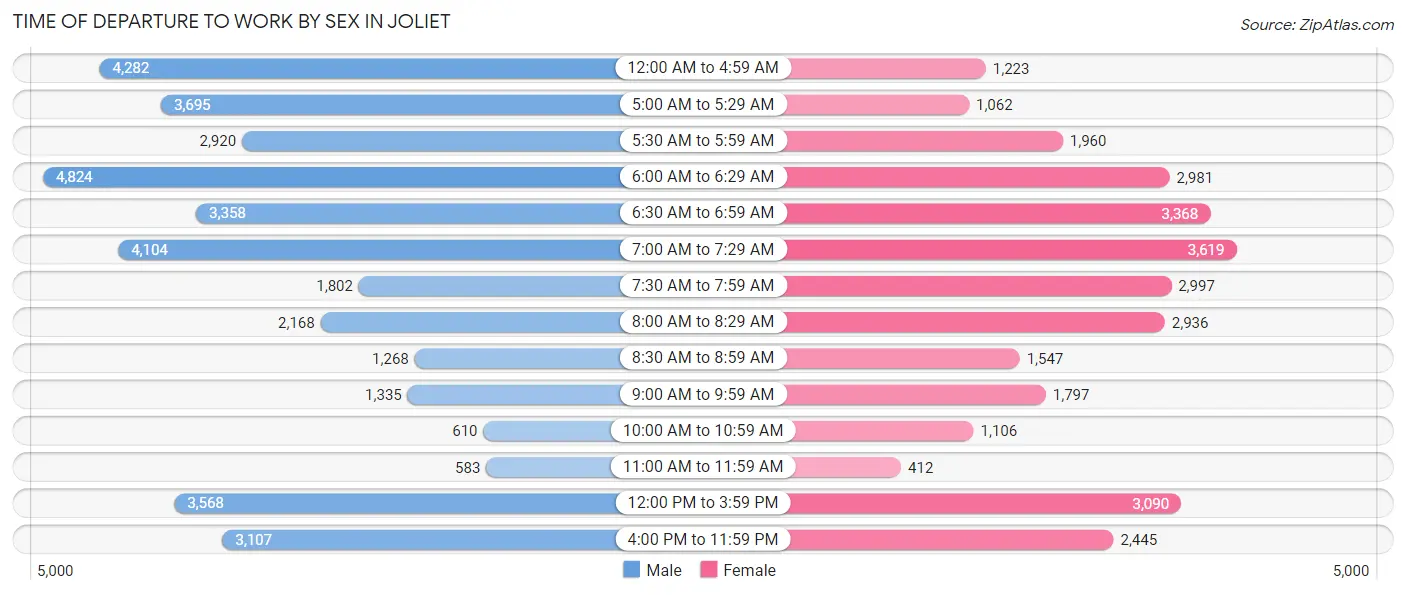
The most frequent times of departure to work in Joliet are 6:00 AM to 6:29 AM (4,824, 12.8%) for males and 7:00 AM to 7:29 AM (3,619, 11.8%) for females.
| Time of Departure | Male | Female |
| 12:00 AM to 4:59 AM | 4,282 (11.4%) | 1,223 (4.0%) |
| 5:00 AM to 5:29 AM | 3,695 (9.8%) | 1,062 (3.5%) |
| 5:30 AM to 5:59 AM | 2,920 (7.8%) | 1,960 (6.4%) |
| 6:00 AM to 6:29 AM | 4,824 (12.8%) | 2,981 (9.8%) |
| 6:30 AM to 6:59 AM | 3,358 (8.9%) | 3,368 (11.0%) |
| 7:00 AM to 7:29 AM | 4,104 (10.9%) | 3,619 (11.8%) |
| 7:30 AM to 7:59 AM | 1,802 (4.8%) | 2,997 (9.8%) |
| 8:00 AM to 8:29 AM | 2,168 (5.8%) | 2,936 (9.6%) |
| 8:30 AM to 8:59 AM | 1,268 (3.4%) | 1,547 (5.1%) |
| 9:00 AM to 9:59 AM | 1,335 (3.5%) | 1,797 (5.9%) |
| 10:00 AM to 10:59 AM | 610 (1.6%) | 1,106 (3.6%) |
| 11:00 AM to 11:59 AM | 583 (1.5%) | 412 (1.3%) |
| 12:00 PM to 3:59 PM | 3,568 (9.5%) | 3,090 (10.1%) |
| 4:00 PM to 11:59 PM | 3,107 (8.3%) | 2,445 (8.0%) |
| Total | 37,624 (100.0%) | 30,543 (100.0%) |
Housing Occupancy in Joliet
Occupancy by Ownership in Joliet
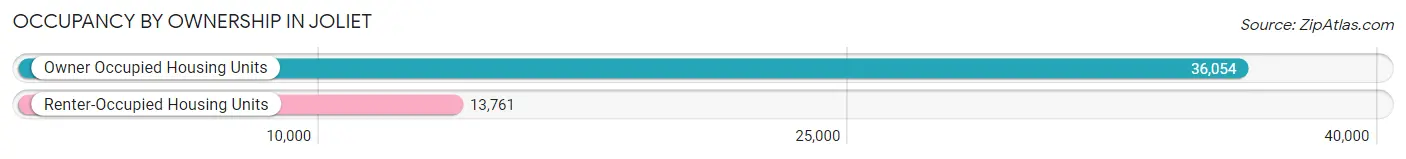
Of the total 49,815 dwellings in Joliet, owner-occupied units account for 36,054 (72.4%), while renter-occupied units make up 13,761 (27.6%).
| Occupancy | # Housing Units | % Housing Units |
| Owner Occupied Housing Units | 36,054 | 72.4% |
| Renter-Occupied Housing Units | 13,761 | 27.6% |
| Total Occupied Housing Units | 49,815 | 100.0% |
Occupancy by Household Size in Joliet
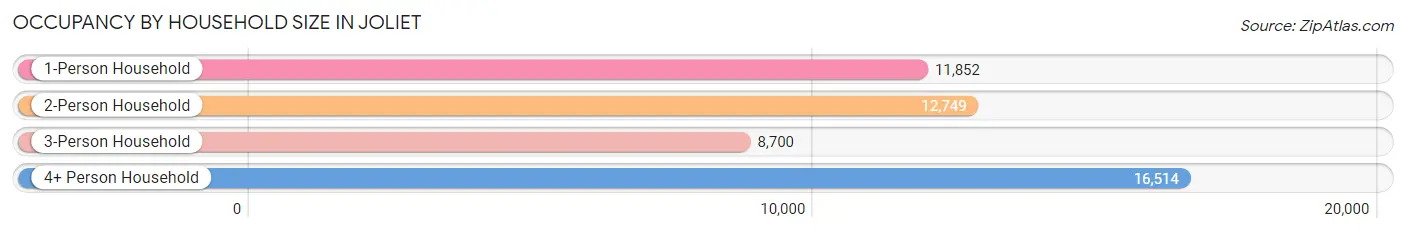
| Household Size | # Housing Units | % Housing Units |
| 1-Person Household | 11,852 | 23.8% |
| 2-Person Household | 12,749 | 25.6% |
| 3-Person Household | 8,700 | 17.5% |
| 4+ Person Household | 16,514 | 33.2% |
| Total Housing Units | 49,815 | 100.0% |
Occupancy by Ownership by Household Size in Joliet
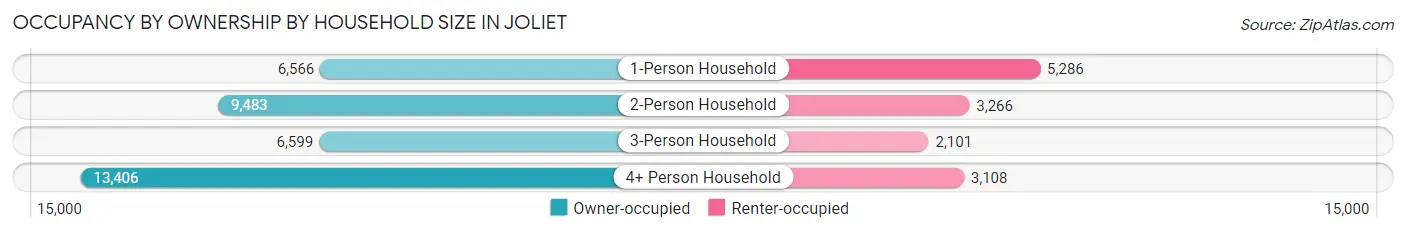
| Household Size | Owner-occupied | Renter-occupied |
| 1-Person Household | 6,566 (55.4%) | 5,286 (44.6%) |
| 2-Person Household | 9,483 (74.4%) | 3,266 (25.6%) |
| 3-Person Household | 6,599 (75.8%) | 2,101 (24.1%) |
| 4+ Person Household | 13,406 (81.2%) | 3,108 (18.8%) |
| Total Housing Units | 36,054 (72.4%) | 13,761 (27.6%) |
Occupancy by Educational Attainment in Joliet
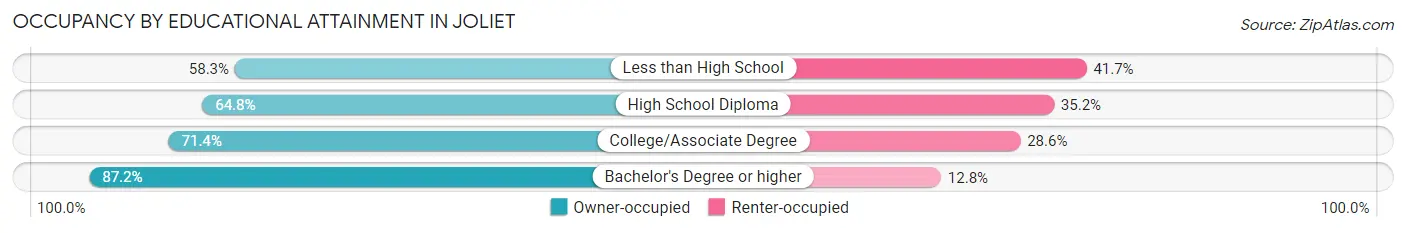
| Household Size | Owner-occupied | Renter-occupied |
| Less than High School | 3,925 (58.3%) | 2,806 (41.7%) |
| High School Diploma | 7,901 (64.8%) | 4,299 (35.2%) |
| College/Associate Degree | 12,223 (71.4%) | 4,887 (28.6%) |
| Bachelor's Degree or higher | 12,005 (87.2%) | 1,769 (12.8%) |
Occupancy by Age of Householder in Joliet
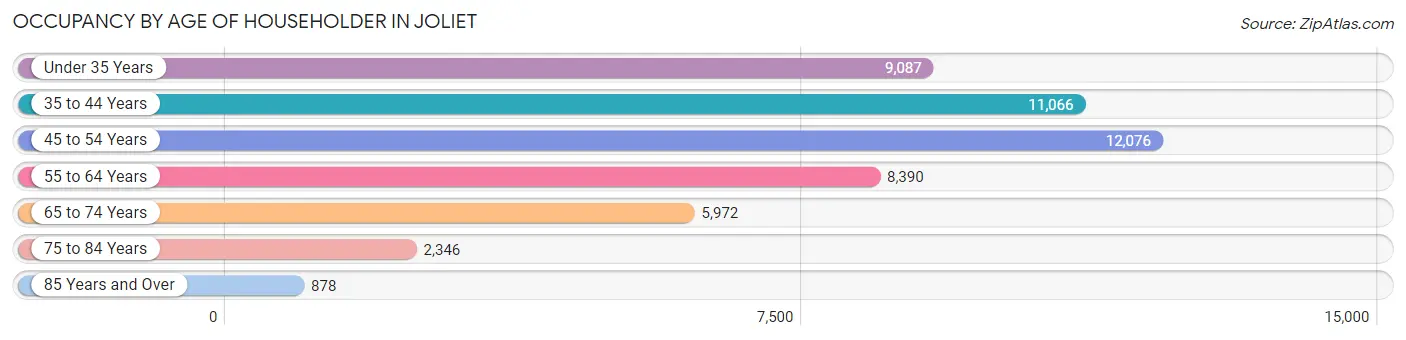
| Age Bracket | # Households | % Households |
| Under 35 Years | 9,087 | 18.2% |
| 35 to 44 Years | 11,066 | 22.2% |
| 45 to 54 Years | 12,076 | 24.2% |
| 55 to 64 Years | 8,390 | 16.8% |
| 65 to 74 Years | 5,972 | 12.0% |
| 75 to 84 Years | 2,346 | 4.7% |
| 85 Years and Over | 878 | 1.8% |
| Total | 49,815 | 100.0% |
Housing Finances in Joliet
Median Income by Occupancy in Joliet
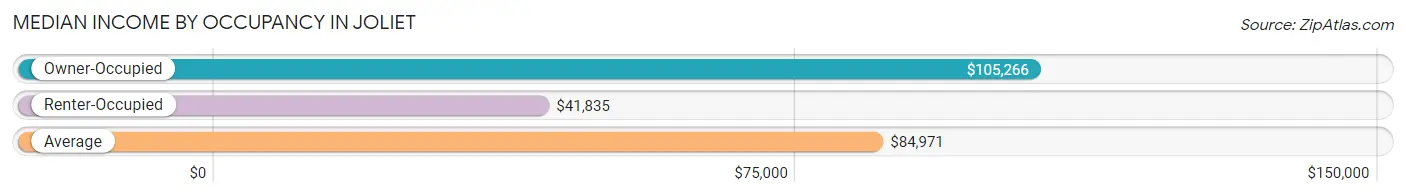
| Occupancy Type | # Households | Median Income |
| Owner-Occupied | 36,054 (72.4%) | $105,266 |
| Renter-Occupied | 13,761 (27.6%) | $41,835 |
| Average | 49,815 (100.0%) | $84,971 |
Occupancy by Householder Income Bracket in Joliet
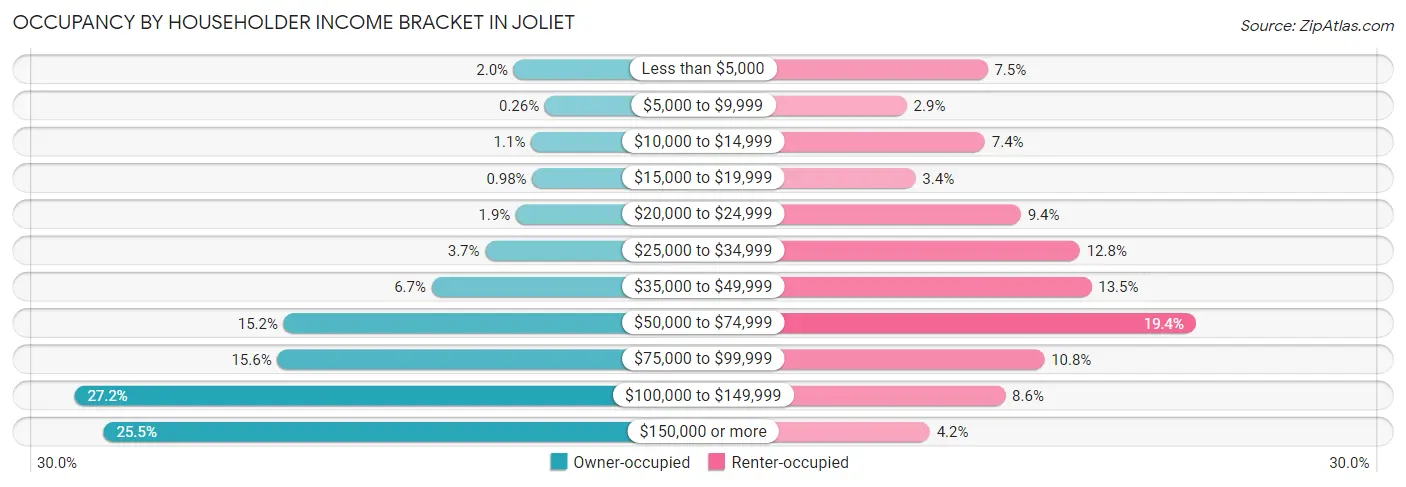
| Income Bracket | Owner-occupied | Renter-occupied |
| Less than $5,000 | 735 (2.0%) | 1,037 (7.5%) |
| $5,000 to $9,999 | 92 (0.3%) | 402 (2.9%) |
| $10,000 to $14,999 | 378 (1.1%) | 1,017 (7.4%) |
| $15,000 to $19,999 | 353 (1.0%) | 470 (3.4%) |
| $20,000 to $24,999 | 688 (1.9%) | 1,299 (9.4%) |
| $25,000 to $34,999 | 1,324 (3.7%) | 1,763 (12.8%) |
| $35,000 to $49,999 | 2,426 (6.7%) | 1,854 (13.5%) |
| $50,000 to $74,999 | 5,475 (15.2%) | 2,675 (19.4%) |
| $75,000 to $99,999 | 5,607 (15.5%) | 1,484 (10.8%) |
| $100,000 to $149,999 | 9,787 (27.2%) | 1,177 (8.6%) |
| $150,000 or more | 9,189 (25.5%) | 583 (4.2%) |
| Total | 36,054 (100.0%) | 13,761 (100.0%) |
Monthly Housing Cost Tiers in Joliet
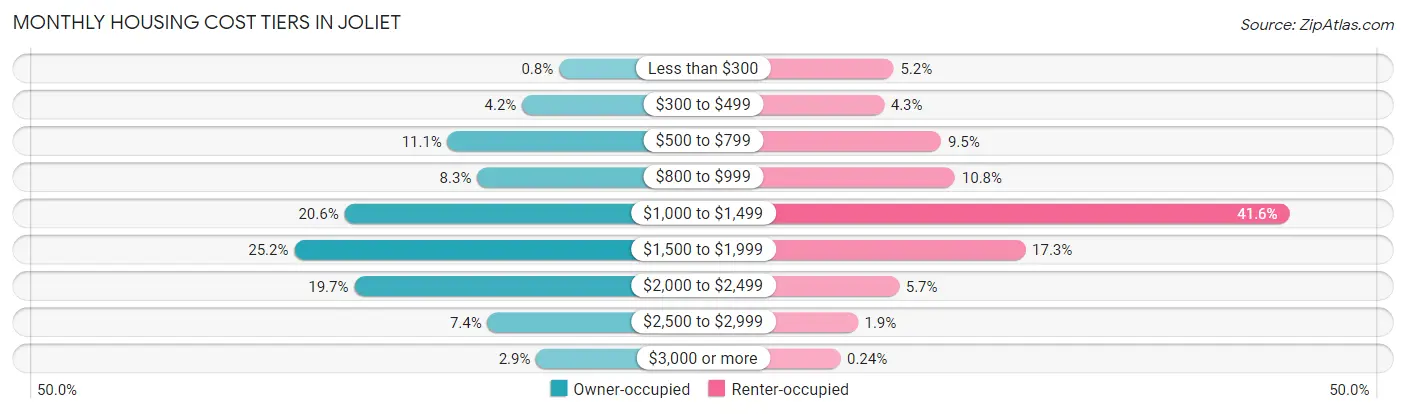
| Monthly Cost | Owner-occupied | Renter-occupied |
| Less than $300 | 289 (0.8%) | 710 (5.2%) |
| $300 to $499 | 1,509 (4.2%) | 587 (4.3%) |
| $500 to $799 | 3,985 (11.1%) | 1,312 (9.5%) |
| $800 to $999 | 3,004 (8.3%) | 1,488 (10.8%) |
| $1,000 to $1,499 | 7,409 (20.5%) | 5,724 (41.6%) |
| $1,500 to $1,999 | 9,073 (25.2%) | 2,378 (17.3%) |
| $2,000 to $2,499 | 7,084 (19.7%) | 777 (5.7%) |
| $2,500 to $2,999 | 2,660 (7.4%) | 254 (1.8%) |
| $3,000 or more | 1,041 (2.9%) | 33 (0.2%) |
| Total | 36,054 (100.0%) | 13,761 (100.0%) |
Physical Housing Characteristics in Joliet
Housing Structures in Joliet
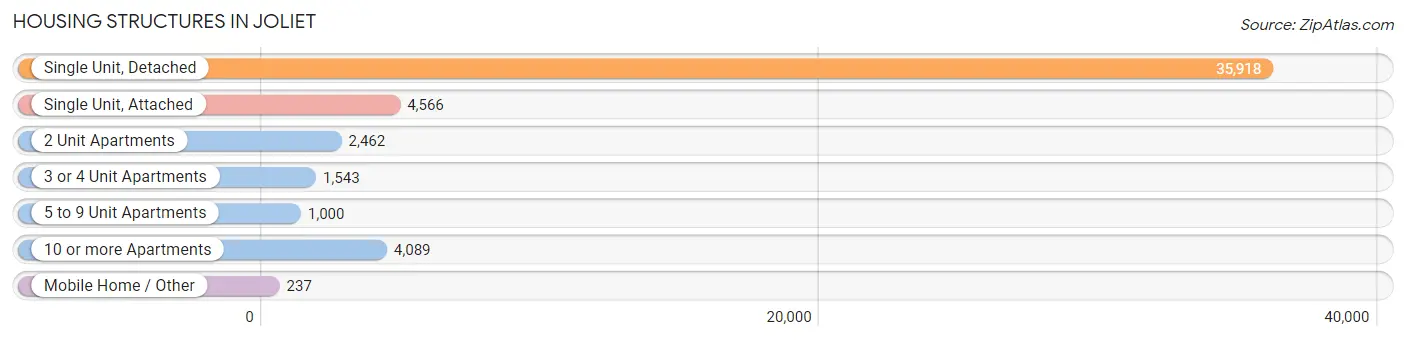
| Structure Type | # Housing Units | % Housing Units |
| Single Unit, Detached | 35,918 | 72.1% |
| Single Unit, Attached | 4,566 | 9.2% |
| 2 Unit Apartments | 2,462 | 4.9% |
| 3 or 4 Unit Apartments | 1,543 | 3.1% |
| 5 to 9 Unit Apartments | 1,000 | 2.0% |
| 10 or more Apartments | 4,089 | 8.2% |
| Mobile Home / Other | 237 | 0.5% |
| Total | 49,815 | 100.0% |
Housing Structures by Occupancy in Joliet
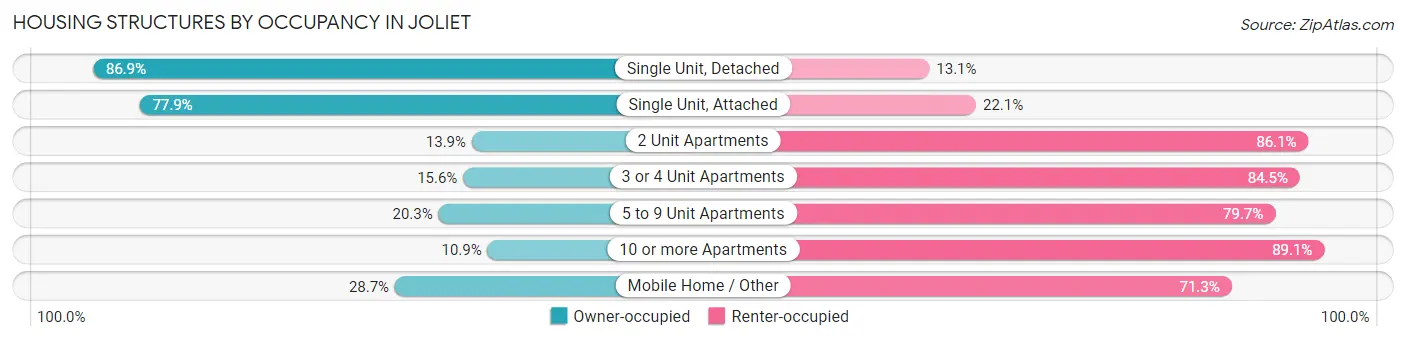
| Structure Type | Owner-occupied | Renter-occupied |
| Single Unit, Detached | 31,201 (86.9%) | 4,717 (13.1%) |
| Single Unit, Attached | 3,556 (77.9%) | 1,010 (22.1%) |
| 2 Unit Apartments | 342 (13.9%) | 2,120 (86.1%) |
| 3 or 4 Unit Apartments | 240 (15.5%) | 1,303 (84.5%) |
| 5 to 9 Unit Apartments | 203 (20.3%) | 797 (79.7%) |
| 10 or more Apartments | 444 (10.9%) | 3,645 (89.1%) |
| Mobile Home / Other | 68 (28.7%) | 169 (71.3%) |
| Total | 36,054 (72.4%) | 13,761 (27.6%) |
Housing Structures by Number of Rooms in Joliet
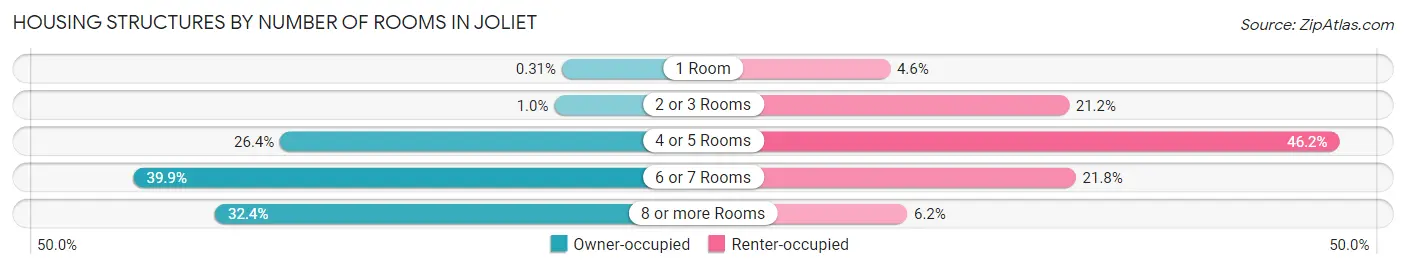
| Number of Rooms | Owner-occupied | Renter-occupied |
| 1 Room | 112 (0.3%) | 637 (4.6%) |
| 2 or 3 Rooms | 364 (1.0%) | 2,913 (21.2%) |
| 4 or 5 Rooms | 9,509 (26.4%) | 6,356 (46.2%) |
| 6 or 7 Rooms | 14,393 (39.9%) | 3,000 (21.8%) |
| 8 or more Rooms | 11,676 (32.4%) | 855 (6.2%) |
| Total | 36,054 (100.0%) | 13,761 (100.0%) |
Housing Structure by Heating Type in Joliet
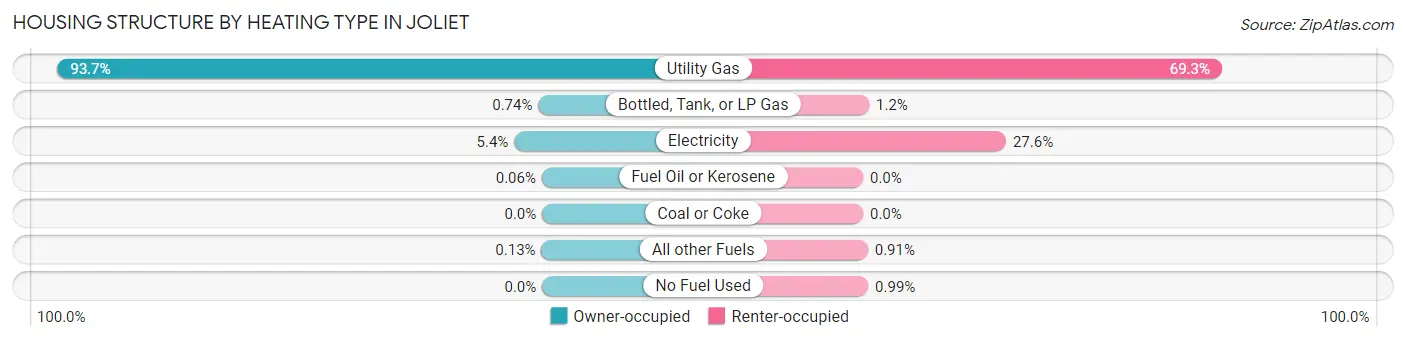
| Heating Type | Owner-occupied | Renter-occupied |
| Utility Gas | 33,771 (93.7%) | 9,538 (69.3%) |
| Bottled, Tank, or LP Gas | 268 (0.7%) | 161 (1.2%) |
| Electricity | 1,947 (5.4%) | 3,801 (27.6%) |
| Fuel Oil or Kerosene | 21 (0.1%) | 0 (0.0%) |
| Coal or Coke | 0 (0.0%) | 0 (0.0%) |
| All other Fuels | 47 (0.1%) | 125 (0.9%) |
| No Fuel Used | 0 (0.0%) | 136 (1.0%) |
| Total | 36,054 (100.0%) | 13,761 (100.0%) |
Household Vehicle Usage in Joliet
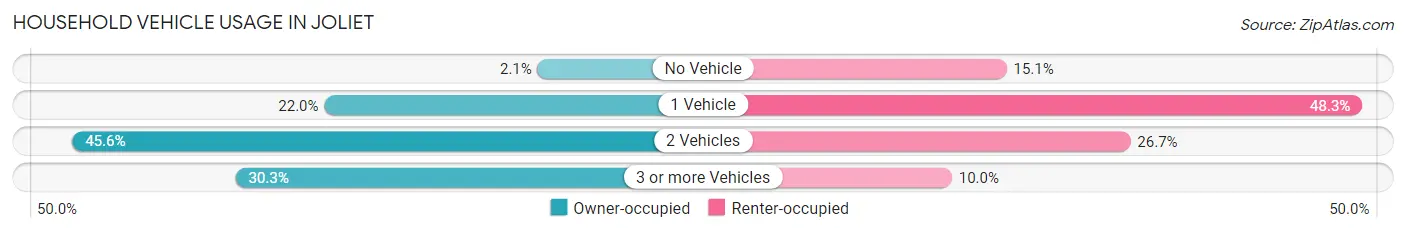
| Vehicles per Household | Owner-occupied | Renter-occupied |
| No Vehicle | 762 (2.1%) | 2,077 (15.1%) |
| 1 Vehicle | 7,940 (22.0%) | 6,644 (48.3%) |
| 2 Vehicles | 16,424 (45.6%) | 3,667 (26.7%) |
| 3 or more Vehicles | 10,928 (30.3%) | 1,373 (10.0%) |
| Total | 36,054 (100.0%) | 13,761 (100.0%) |
Real Estate & Mortgages in Joliet
Real Estate and Mortgage Overview in Joliet
| Characteristic | Without Mortgage | With Mortgage |
| Housing Units | 9,217 | 26,837 |
| Median Property Value | $209,700 | $241,000 |
| Median Household Income | $78,235 | $7,374 |
| Monthly Housing Costs | $749 | $1,025 |
| Real Estate Taxes | $4,702 | $387 |
Property Value by Mortgage Status in Joliet
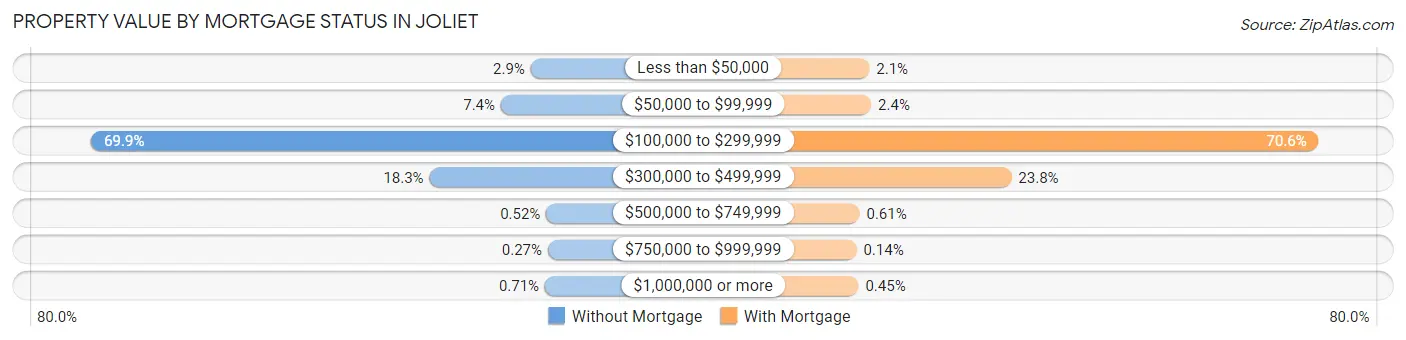
| Property Value | Without Mortgage | With Mortgage |
| Less than $50,000 | 265 (2.9%) | 567 (2.1%) |
| $50,000 to $99,999 | 685 (7.4%) | 639 (2.4%) |
| $100,000 to $299,999 | 6,441 (69.9%) | 18,935 (70.6%) |
| $300,000 to $499,999 | 1,688 (18.3%) | 6,373 (23.7%) |
| $500,000 to $749,999 | 48 (0.5%) | 164 (0.6%) |
| $750,000 to $999,999 | 25 (0.3%) | 37 (0.1%) |
| $1,000,000 or more | 65 (0.7%) | 122 (0.4%) |
| Total | 9,217 (100.0%) | 26,837 (100.0%) |
Household Income by Mortgage Status in Joliet
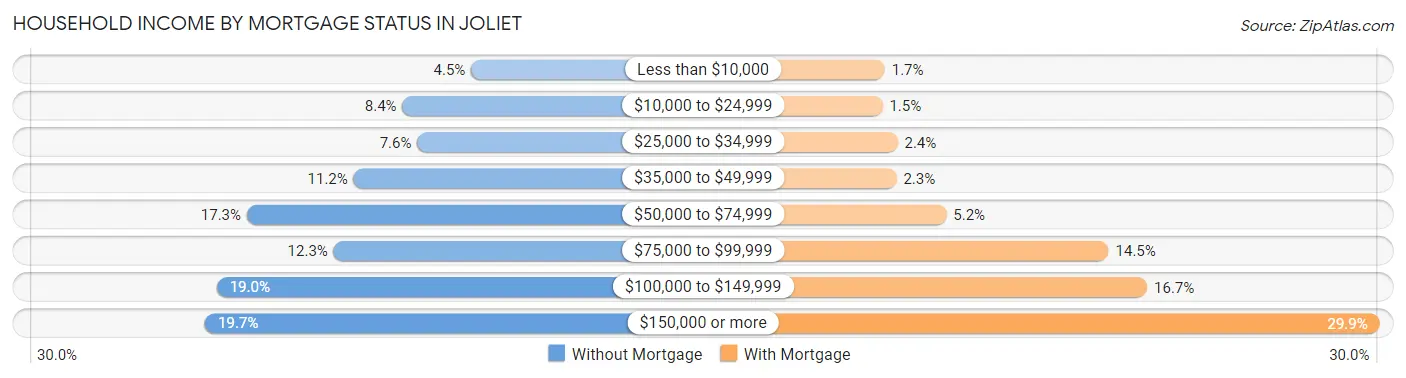
| Household Income | Without Mortgage | With Mortgage |
| Less than $10,000 | 413 (4.5%) | 447 (1.7%) |
| $10,000 to $24,999 | 775 (8.4%) | 414 (1.5%) |
| $25,000 to $34,999 | 697 (7.6%) | 644 (2.4%) |
| $35,000 to $49,999 | 1,032 (11.2%) | 627 (2.3%) |
| $50,000 to $74,999 | 1,595 (17.3%) | 1,394 (5.2%) |
| $75,000 to $99,999 | 1,137 (12.3%) | 3,880 (14.5%) |
| $100,000 to $149,999 | 1,753 (19.0%) | 4,470 (16.7%) |
| $150,000 or more | 1,815 (19.7%) | 8,034 (29.9%) |
| Total | 9,217 (100.0%) | 26,837 (100.0%) |
Property Value to Household Income Ratio in Joliet
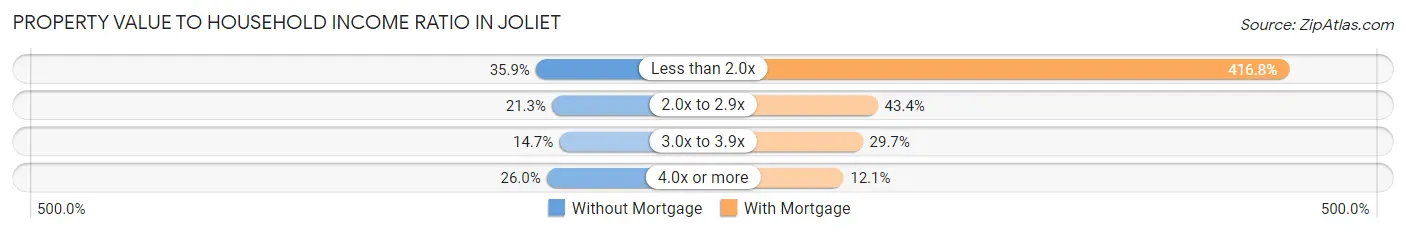
| Value-to-Income Ratio | Without Mortgage | With Mortgage |
| Less than 2.0x | 3,309 (35.9%) | 111,865 (416.8%) |
| 2.0x to 2.9x | 1,959 (21.2%) | 11,636 (43.4%) |
| 3.0x to 3.9x | 1,350 (14.6%) | 7,966 (29.7%) |
| 4.0x or more | 2,400 (26.0%) | 3,254 (12.1%) |
| Total | 9,217 (100.0%) | 26,837 (100.0%) |
Real Estate Taxes by Mortgage Status in Joliet
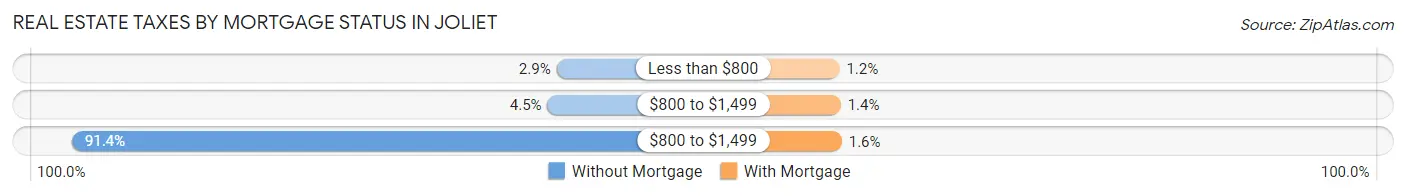
| Property Taxes | Without Mortgage | With Mortgage |
| Less than $800 | 263 (2.9%) | 316 (1.2%) |
| $800 to $1,499 | 415 (4.5%) | 375 (1.4%) |
| $800 to $1,499 | 8,421 (91.4%) | 429 (1.6%) |
| Total | 9,217 (100.0%) | 26,837 (100.0%) |
Health & Disability in Joliet
Health Insurance Coverage by Age in Joliet
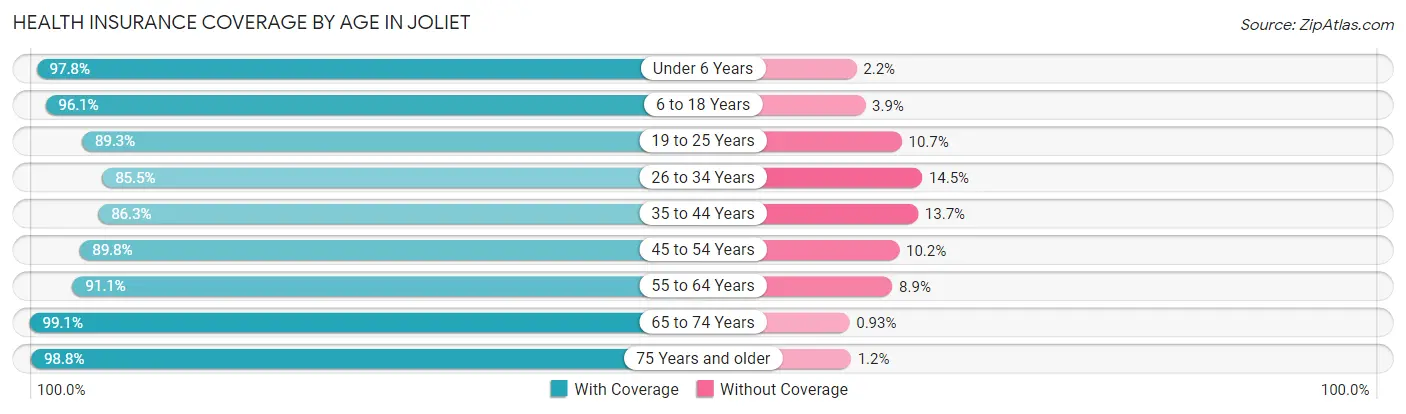
| Age Bracket | With Coverage | Without Coverage |
| Under 6 Years | 10,955 (97.8%) | 251 (2.2%) |
| 6 to 18 Years | 29,970 (96.1%) | 1,210 (3.9%) |
| 19 to 25 Years | 13,752 (89.3%) | 1,645 (10.7%) |
| 26 to 34 Years | 15,243 (85.5%) | 2,581 (14.5%) |
| 35 to 44 Years | 18,416 (86.3%) | 2,931 (13.7%) |
| 45 to 54 Years | 19,897 (89.8%) | 2,262 (10.2%) |
| 55 to 64 Years | 13,303 (91.1%) | 1,303 (8.9%) |
| 65 to 74 Years | 9,291 (99.1%) | 87 (0.9%) |
| 75 Years and older | 5,094 (98.8%) | 62 (1.2%) |
| Total | 135,921 (91.7%) | 12,332 (8.3%) |
Health Insurance Coverage by Citizenship Status in Joliet
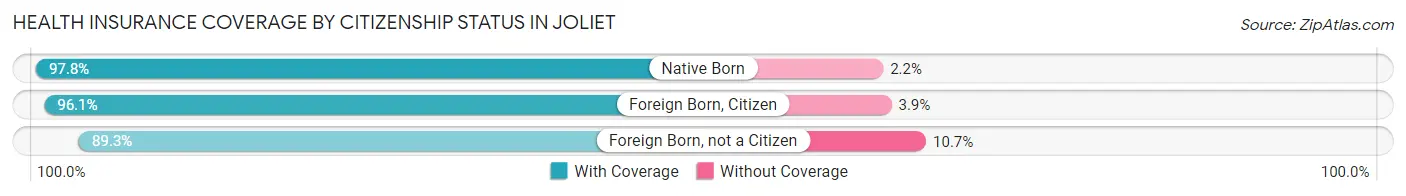
| Citizenship Status | With Coverage | Without Coverage |
| Native Born | 10,955 (97.8%) | 251 (2.2%) |
| Foreign Born, Citizen | 29,970 (96.1%) | 1,210 (3.9%) |
| Foreign Born, not a Citizen | 13,752 (89.3%) | 1,645 (10.7%) |
Health Insurance Coverage by Household Income in Joliet
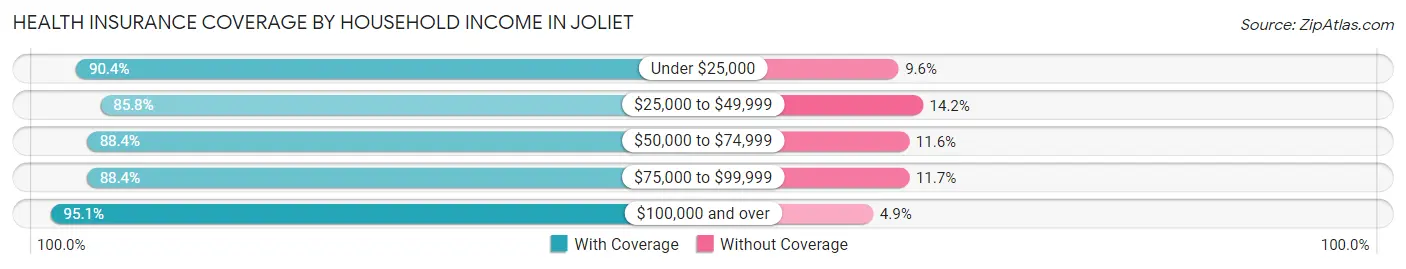
| Household Income | With Coverage | Without Coverage |
| Under $25,000 | 11,483 (90.4%) | 1,225 (9.6%) |
| $25,000 to $49,999 | 14,729 (85.8%) | 2,437 (14.2%) |
| $50,000 to $74,999 | 18,923 (88.4%) | 2,492 (11.6%) |
| $75,000 to $99,999 | 18,922 (88.3%) | 2,496 (11.7%) |
| $100,000 and over | 71,110 (95.1%) | 3,657 (4.9%) |
Public vs Private Health Insurance Coverage by Age in Joliet
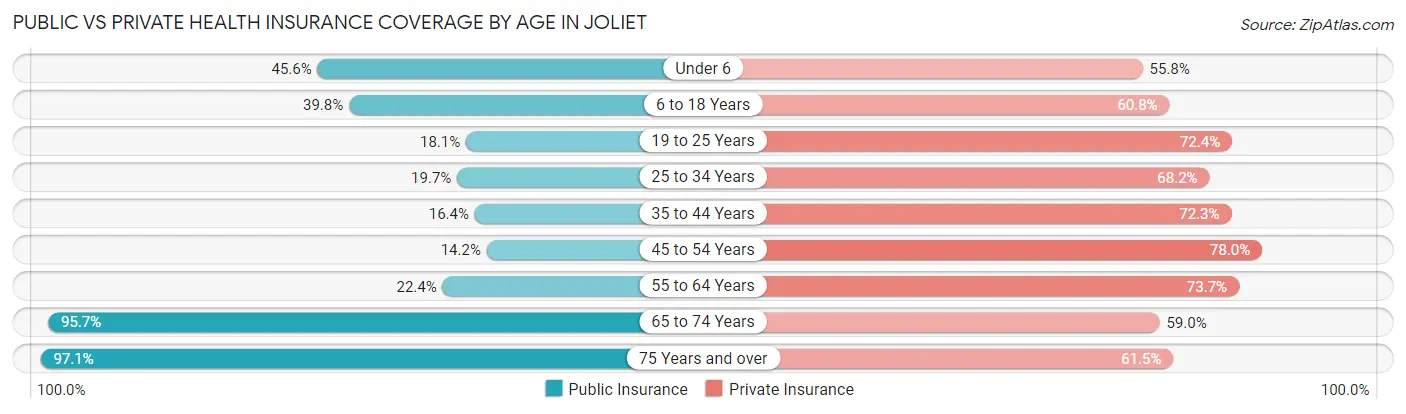
| Age Bracket | Public Insurance | Private Insurance |
| Under 6 | 5,112 (45.6%) | 6,257 (55.8%) |
| 6 to 18 Years | 12,400 (39.8%) | 18,959 (60.8%) |
| 19 to 25 Years | 2,780 (18.1%) | 11,151 (72.4%) |
| 25 to 34 Years | 3,514 (19.7%) | 12,161 (68.2%) |
| 35 to 44 Years | 3,509 (16.4%) | 15,434 (72.3%) |
| 45 to 54 Years | 3,152 (14.2%) | 17,283 (78.0%) |
| 55 to 64 Years | 3,274 (22.4%) | 10,765 (73.7%) |
| 65 to 74 Years | 8,971 (95.7%) | 5,530 (59.0%) |
| 75 Years and over | 5,004 (97.1%) | 3,172 (61.5%) |
| Total | 47,716 (32.2%) | 100,712 (67.9%) |
Disability Status by Sex by Age in Joliet
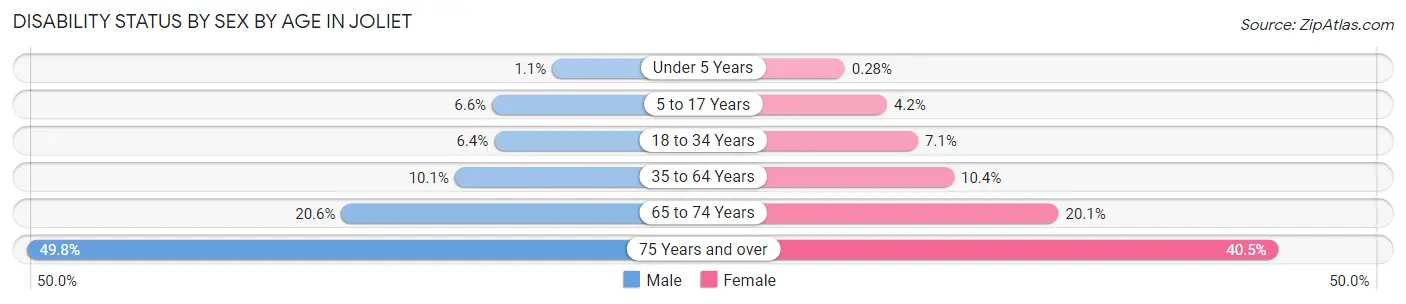
| Age Bracket | Male | Female |
| Under 5 Years | 51 (1.1%) | 12 (0.3%) |
| 5 to 17 Years | 1,041 (6.6%) | 623 (4.2%) |
| 18 to 34 Years | 1,135 (6.4%) | 1,285 (7.1%) |
| 35 to 64 Years | 2,988 (10.1%) | 2,966 (10.4%) |
| 65 to 74 Years | 892 (20.6%) | 1,016 (20.1%) |
| 75 Years and over | 947 (49.8%) | 1,319 (40.5%) |
Disability Class by Sex by Age in Joliet
Disability Class: Hearing Difficulty
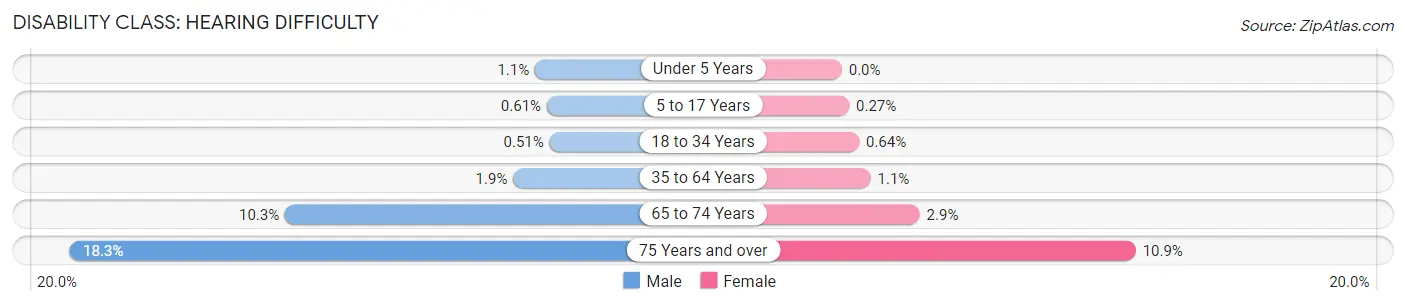
| Age Bracket | Male | Female |
| Under 5 Years | 51 (1.1%) | 0 (0.0%) |
| 5 to 17 Years | 95 (0.6%) | 40 (0.3%) |
| 18 to 34 Years | 90 (0.5%) | 117 (0.6%) |
| 35 to 64 Years | 552 (1.9%) | 306 (1.1%) |
| 65 to 74 Years | 447 (10.3%) | 146 (2.9%) |
| 75 Years and over | 348 (18.3%) | 355 (10.9%) |
Disability Class: Vision Difficulty
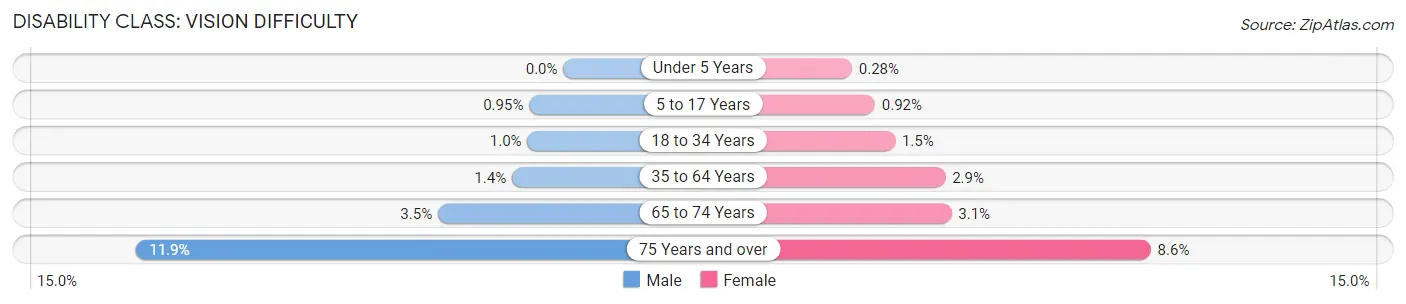
| Age Bracket | Male | Female |
| Under 5 Years | 0 (0.0%) | 12 (0.3%) |
| 5 to 17 Years | 149 (0.9%) | 137 (0.9%) |
| 18 to 34 Years | 176 (1.0%) | 268 (1.5%) |
| 35 to 64 Years | 425 (1.4%) | 819 (2.9%) |
| 65 to 74 Years | 151 (3.5%) | 154 (3.0%) |
| 75 Years and over | 226 (11.9%) | 280 (8.6%) |
Disability Class: Cognitive Difficulty
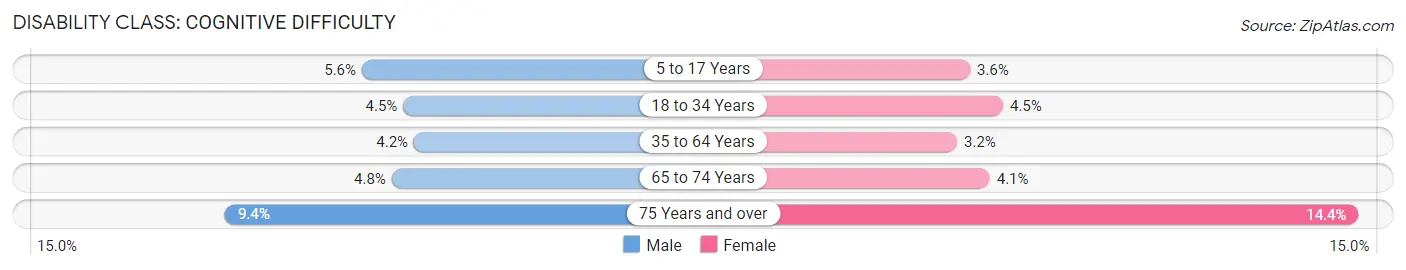
| Age Bracket | Male | Female |
| 5 to 17 Years | 880 (5.6%) | 532 (3.6%) |
| 18 to 34 Years | 788 (4.5%) | 816 (4.5%) |
| 35 to 64 Years | 1,232 (4.2%) | 915 (3.2%) |
| 65 to 74 Years | 207 (4.8%) | 208 (4.1%) |
| 75 Years and over | 179 (9.4%) | 468 (14.4%) |
Disability Class: Ambulatory Difficulty
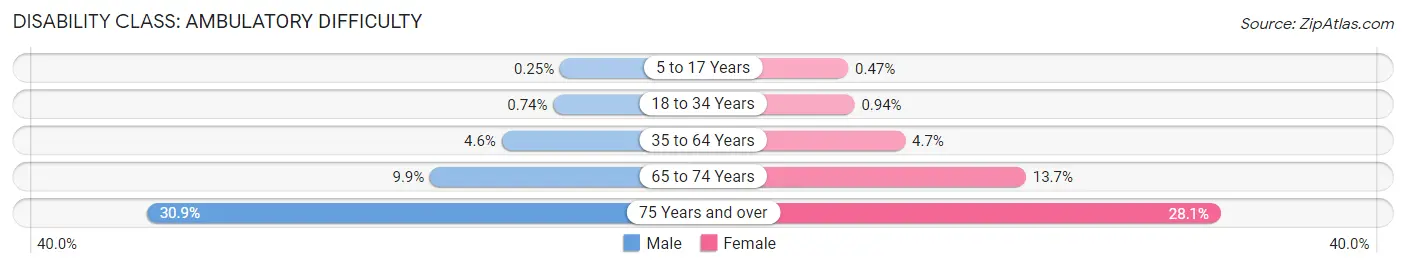
| Age Bracket | Male | Female |
| 5 to 17 Years | 40 (0.3%) | 70 (0.5%) |
| 18 to 34 Years | 130 (0.7%) | 170 (0.9%) |
| 35 to 64 Years | 1,357 (4.6%) | 1,337 (4.7%) |
| 65 to 74 Years | 428 (9.9%) | 690 (13.7%) |
| 75 Years and over | 588 (30.9%) | 916 (28.1%) |
Disability Class: Self-Care Difficulty
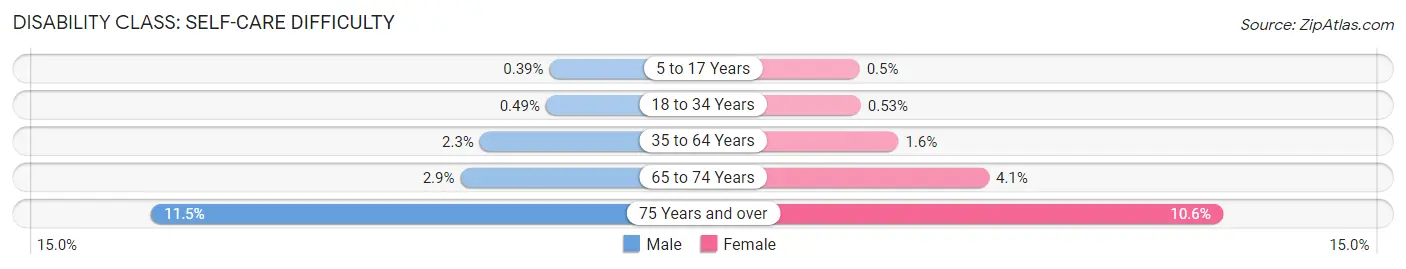
| Age Bracket | Male | Female |
| 5 to 17 Years | 62 (0.4%) | 75 (0.5%) |
| 18 to 34 Years | 87 (0.5%) | 96 (0.5%) |
| 35 to 64 Years | 692 (2.3%) | 451 (1.6%) |
| 65 to 74 Years | 124 (2.9%) | 207 (4.1%) |
| 75 Years and over | 218 (11.5%) | 345 (10.6%) |
Technology Access in Joliet
Computing Device Access in Joliet
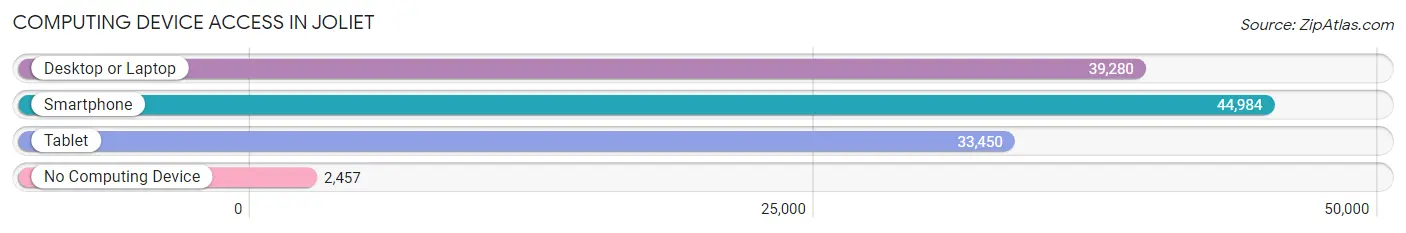
| Device Type | # Households | % Households |
| Desktop or Laptop | 39,280 | 78.8% |
| Smartphone | 44,984 | 90.3% |
| Tablet | 33,450 | 67.1% |
| No Computing Device | 2,457 | 4.9% |
| Total | 49,815 | 100.0% |
Internet Access in Joliet
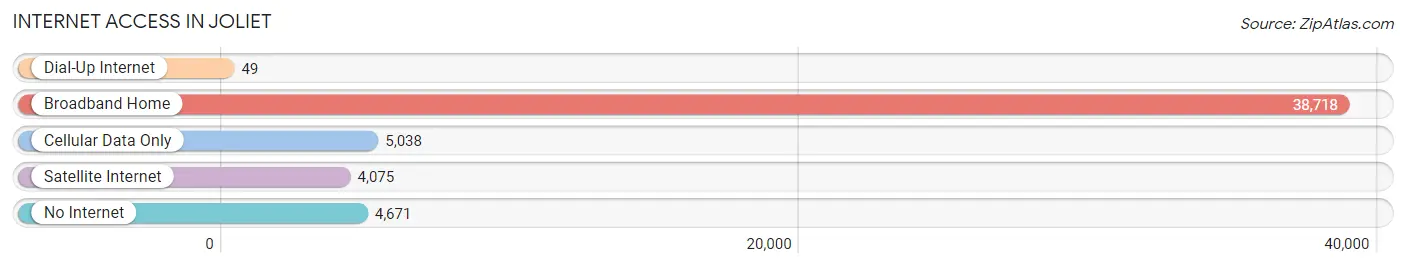
| Internet Type | # Households | % Households |
| Dial-Up Internet | 49 | 0.1% |
| Broadband Home | 38,718 | 77.7% |
| Cellular Data Only | 5,038 | 10.1% |
| Satellite Internet | 4,075 | 8.2% |
| No Internet | 4,671 | 9.4% |
| Total | 49,815 | 100.0% |
Joliet Summary
Joliet is a city located in Will County, Illinois, United States. It is the county seat of Will County and is located along the Des Plaines River. As of the 2010 census, the city had a total population of 147,433, making it the fourth-largest city in Illinois. Joliet is a major industrial city and is home to several large companies, including Caterpillar, Inc., and the University of St. Francis.
History
The area that is now Joliet was first settled in the early 1800s by French-Canadian fur traders. The first permanent settlement was established in 1833 by James B. Campbell, who named the area after his friend, French explorer Louis Joliet. The city was incorporated in 1852 and quickly grew to become an important transportation hub. The Illinois and Michigan Canal, which connected the Great Lakes to the Mississippi River, was completed in 1848 and ran through the city. The canal was a major factor in the city's growth and development, as it allowed for the transportation of goods and people.
In the late 19th century, Joliet became an important industrial center, with several steel mills and other factories located in the city. The city was also home to several large railroads, including the Chicago and Alton Railroad and the Rock Island Railroad. The city's economy was further bolstered by the completion of the Joliet Arsenal in 1940, which was used to manufacture ammunition and other military supplies during World War II.
Geography
Joliet is located in northeastern Illinois, approximately 40 miles southwest of Chicago. The city is situated along the Des Plaines River and is bordered by the cities of Bolingbrook, Romeoville, and Shorewood. The city has a total area of 37.2 square miles, of which 36.7 square miles is land and 0.5 square miles is water.
Economy
Joliet is a major industrial city and is home to several large companies, including Caterpillar, Inc., and the University of St. Francis. The city is also home to several large medical centers, including Silver Cross Hospital and Presence Saint Joseph Medical Center. The city's economy is further bolstered by the presence of several large retail outlets, including the Louis Joliet Mall and the Joliet Town Center.
Demographics
As of the 2010 census, the city had a total population of 147,433, making it the fourth-largest city in Illinois. The population was spread out, with 33.3% under the age of 18, 10.7% from 18 to 24, 30.2% from 25 to 44, 19.2% from 45 to 64, and 6.7% who were 65 years of age or older. The median age was 31.4 years. The gender makeup of the city was 48.7% male and 51.3% female.
The median income for a household in the city was $50,945, and the median income for a family was $60,945. The per capita income for the city was $23,845. About 11.3% of families and 14.2% of the population were below the poverty line, including 19.2% of those under age 18 and 8.2% of those age 65 or over.
Common Questions
What is Per Capita Income in Joliet?
Per Capita income in Joliet is $34,169.
What is the Median Family Income in Joliet?
Median Family Income in Joliet is $98,522.
What is the Median Household income in Joliet?
Median Household Income in Joliet is $84,971.
What is Income or Wage Gap in Joliet?
Income or Wage Gap in Joliet is 37.9%.
Women in Joliet earn 62.1 cents for every dollar earned by a man.
What is Family Income Deficit in Joliet?
Family Income Deficit in Joliet is $13,612.
Families that are below poverty line in Joliet earn $13,612 less on average than the poverty threshold level.
What is Inequality or Gini Index in Joliet?
Inequality or Gini Index in Joliet is 0.40.
What is the Total Population of Joliet?
Total Population of Joliet is 150,221.
What is the Total Male Population of Joliet?
Total Male Population of Joliet is 75,215.
What is the Total Female Population of Joliet?
Total Female Population of Joliet is 75,006.
What is the Ratio of Males per 100 Females in Joliet?
There are 100.28 Males per 100 Females in Joliet.
What is the Ratio of Females per 100 Males in Joliet?
There are 99.72 Females per 100 Males in Joliet.
What is the Median Population Age in Joliet?
Median Population Age in Joliet is 34.3 Years.
What is the Average Family Size in Joliet
Average Family Size in Joliet is 3.5 People.
What is the Average Household Size in Joliet
Average Household Size in Joliet is 3.0 People.
How Large is the Labor Force in Joliet?
There are 79,954 People in the Labor Forcein in Joliet.
What is the Percentage of People in the Labor Force in Joliet?
69.7% of People are in the Labor Force in Joliet.
What is the Unemployment Rate in Joliet?
Unemployment Rate in Joliet is 6.2%.