Hanover Park, IL Map & Demographics
Hanover Park Map
Hanover Park Overview
$29,940
PER CAPITA INCOME
$91,788
AVG FAMILY INCOME
$88,460
AVG HOUSEHOLD INCOME
26.3%
WAGE / INCOME GAP [ % ]
73.7¢/ $1
WAGE / INCOME GAP [ $ ]
$13,574
FAMILY INCOME DEFICIT
0.37
INEQUALITY / GINI INDEX
37,222
TOTAL POPULATION
18,101
MALE POPULATION
19,121
FEMALE POPULATION
94.67
MALES / 100 FEMALES
105.64
FEMALES / 100 MALES
34.7
MEDIAN AGE
3.7
AVG FAMILY SIZE
3.4
AVG HOUSEHOLD SIZE
19,266
LABOR FORCE [ PEOPLE ]
67.9%
PERCENT IN LABOR FORCE
5.3%
UNEMPLOYMENT RATE
Hanover Park Zip Codes
Income in Hanover Park
Income Overview in Hanover Park
Per Capita Income in Hanover Park is $29,940, while median incomes of families and households are $91,788 and $88,460 respectively.
| Characteristic | Number | Measure |
| Per Capita Income | 37,222 | $29,940 |
| Median Family Income | 9,110 | $91,788 |
| Mean Family Income | 9,110 | $103,893 |
| Median Household Income | 11,113 | $88,460 |
| Mean Household Income | 11,113 | $97,856 |
| Income Deficit | 9,110 | $13,574 |
| Wage / Income Gap (%) | 37,222 | 26.28% |
| Wage / Income Gap ($) | 37,222 | 73.72¢ per $1 |
| Gini / Inequality Index | 37,222 | 0.37 |
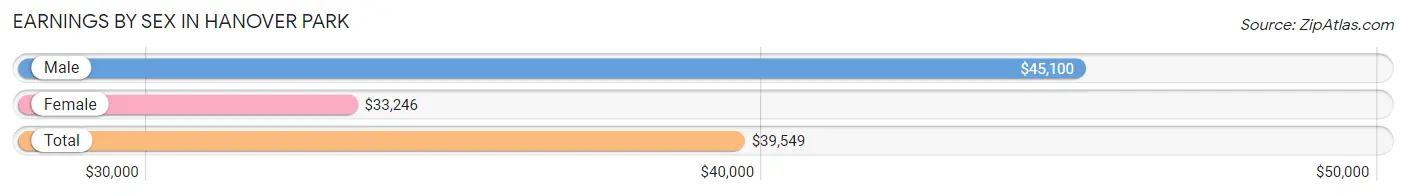
Earnings by Sex in Hanover Park
Average Earnings in Hanover Park are $39,549, $45,100 for men and $33,246 for women, a difference of 26.3%.
| Sex | Number | Average Earnings |
| Male | 10,788 (54.1%) | $45,100 |
| Female | 9,144 (45.9%) | $33,246 |
| Total | 19,932 (100.0%) | $39,549 |
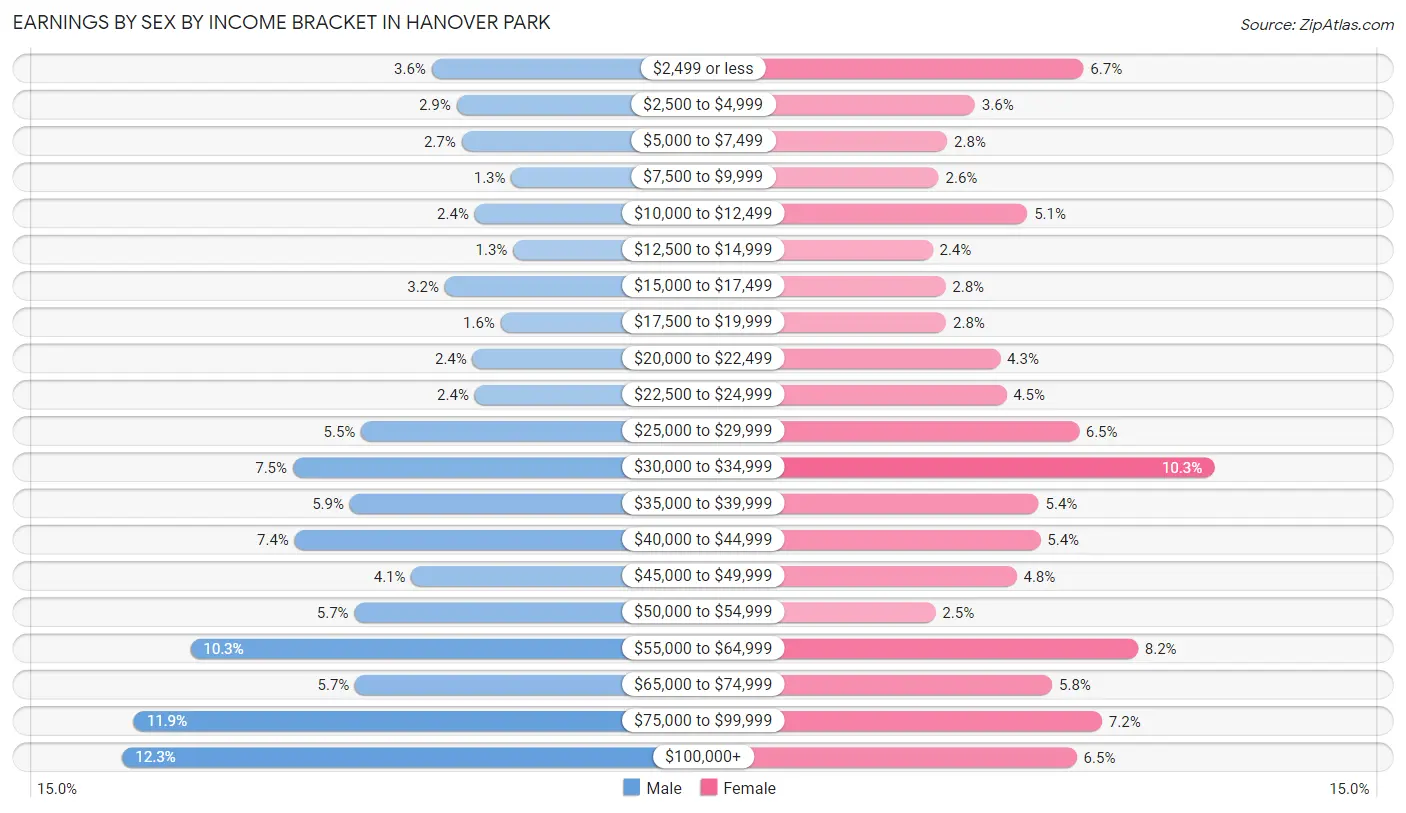
Earnings by Sex by Income Bracket in Hanover Park
The most common earnings brackets in Hanover Park are $100,000+ for men (1,322 | 12.2%) and $30,000 to $34,999 for women (944 | 10.3%).
| Income | Male | Female |
| $2,499 or less | 384 (3.6%) | 608 (6.7%) |
| $2,500 to $4,999 | 309 (2.9%) | 329 (3.6%) |
| $5,000 to $7,499 | 293 (2.7%) | 258 (2.8%) |
| $7,500 to $9,999 | 142 (1.3%) | 236 (2.6%) |
| $10,000 to $12,499 | 253 (2.4%) | 464 (5.1%) |
| $12,500 to $14,999 | 137 (1.3%) | 220 (2.4%) |
| $15,000 to $17,499 | 344 (3.2%) | 253 (2.8%) |
| $17,500 to $19,999 | 175 (1.6%) | 255 (2.8%) |
| $20,000 to $22,499 | 260 (2.4%) | 394 (4.3%) |
| $22,500 to $24,999 | 253 (2.4%) | 410 (4.5%) |
| $25,000 to $29,999 | 598 (5.5%) | 596 (6.5%) |
| $30,000 to $34,999 | 805 (7.5%) | 944 (10.3%) |
| $35,000 to $39,999 | 632 (5.9%) | 493 (5.4%) |
| $40,000 to $44,999 | 799 (7.4%) | 497 (5.4%) |
| $45,000 to $49,999 | 446 (4.1%) | 436 (4.8%) |
| $50,000 to $54,999 | 618 (5.7%) | 228 (2.5%) |
| $55,000 to $64,999 | 1,115 (10.3%) | 748 (8.2%) |
| $65,000 to $74,999 | 616 (5.7%) | 528 (5.8%) |
| $75,000 to $99,999 | 1,287 (11.9%) | 656 (7.2%) |
| $100,000+ | 1,322 (12.2%) | 591 (6.5%) |
| Total | 10,788 (100.0%) | 9,144 (100.0%) |
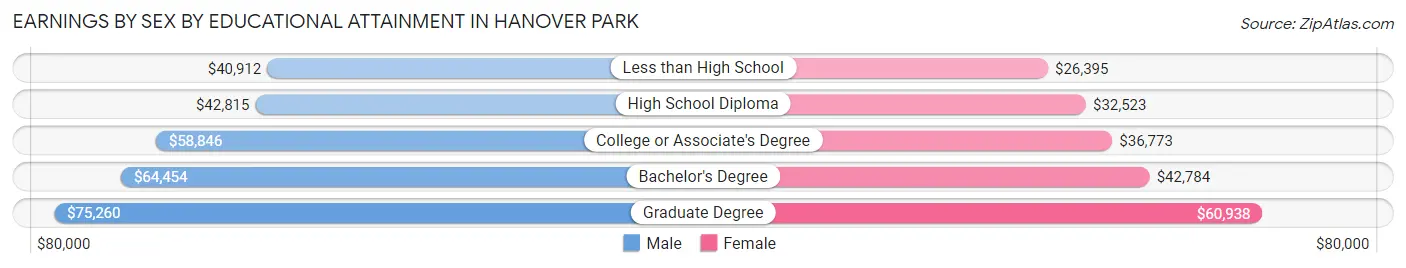
Earnings by Sex by Educational Attainment in Hanover Park
Average earnings in Hanover Park are $51,331 for men and $36,114 for women, a difference of 29.6%. Men with an educational attainment of graduate degree enjoy the highest average annual earnings of $75,260, while those with less than high school education earn the least with $40,912. Women with an educational attainment of graduate degree earn the most with the average annual earnings of $60,938, while those with less than high school education have the smallest earnings of $26,395.
| Educational Attainment | Male Income | Female Income |
| Less than High School | $40,912 | $26,395 |
| High School Diploma | $42,815 | $32,523 |
| College or Associate's Degree | $58,846 | $36,773 |
| Bachelor's Degree | $64,454 | $42,784 |
| Graduate Degree | $75,260 | $60,938 |
| Total | $51,331 | $36,114 |
Family Income in Hanover Park
Family Income Brackets in Hanover Park
According to the Hanover Park family income data, there are 2,278 families falling into the $100,000 to $149,999 income range, which is the most common income bracket and makes up 25.0% of all families. Conversely, the $10,000 to $14,999 income bracket is the least frequent group with only 219 families (2.4%) belonging to this category.
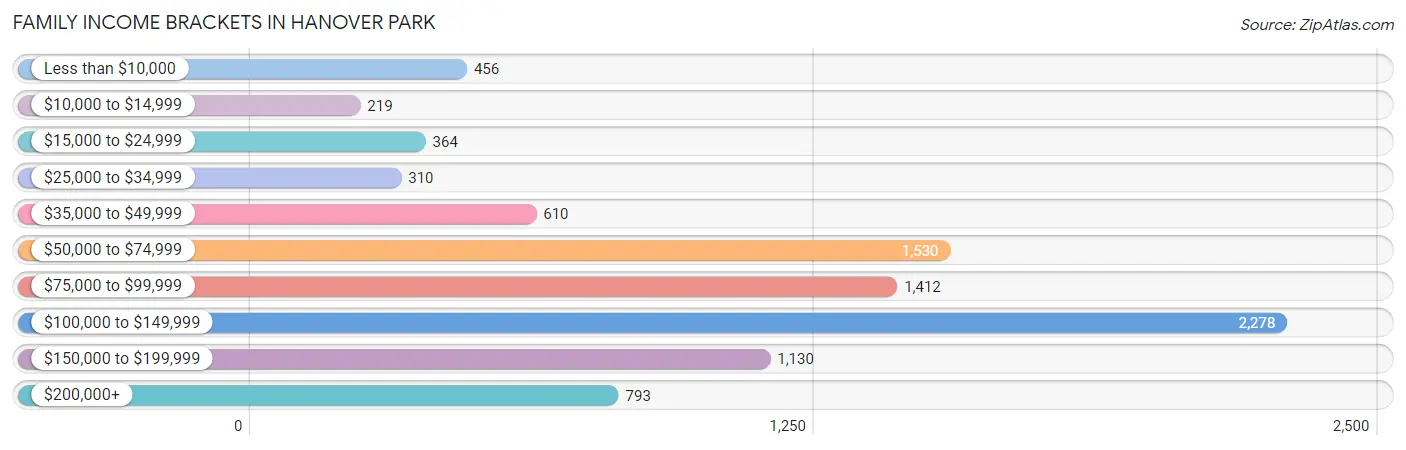
| Income Bracket | # Families | % Families |
| Less than $10,000 | 456 | 5.0% |
| $10,000 to $14,999 | 219 | 2.4% |
| $15,000 to $24,999 | 364 | 4.0% |
| $25,000 to $34,999 | 310 | 3.4% |
| $35,000 to $49,999 | 610 | 6.7% |
| $50,000 to $74,999 | 1,530 | 16.8% |
| $75,000 to $99,999 | 1,412 | 15.5% |
| $100,000 to $149,999 | 2,278 | 25.0% |
| $150,000 to $199,999 | 1,130 | 12.4% |
| $200,000+ | 793 | 8.7% |
Family Income by Famaliy Size in Hanover Park
5-person families (1,061 | 11.7%) account for the highest median family income in Hanover Park with $119,120 per family, while 2-person families (3,182 | 34.9%) have the highest median income of $37,533 per family member.
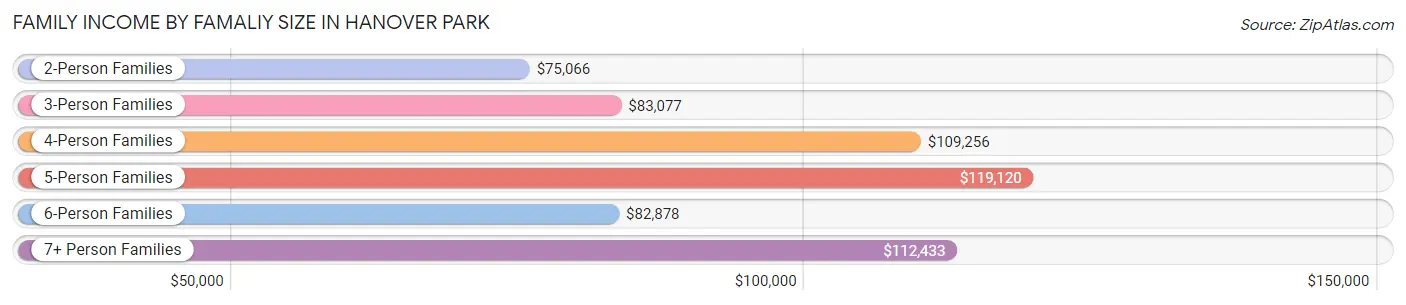
| Income Bracket | # Families | Median Income |
| 2-Person Families | 3,182 (34.9%) | $75,066 |
| 3-Person Families | 1,950 (21.4%) | $83,077 |
| 4-Person Families | 1,803 (19.8%) | $109,256 |
| 5-Person Families | 1,061 (11.7%) | $119,120 |
| 6-Person Families | 531 (5.8%) | $82,878 |
| 7+ Person Families | 583 (6.4%) | $112,433 |
| Total | 9,110 (100.0%) | $91,788 |
Family Income by Number of Earners in Hanover Park
The median family income in Hanover Park is $91,788, with families comprising 3+ earners (2,103) having the highest median family income of $125,585, while families with no earners (953) have the lowest median family income of $23,144, accounting for 23.1% and 10.5% of families, respectively.
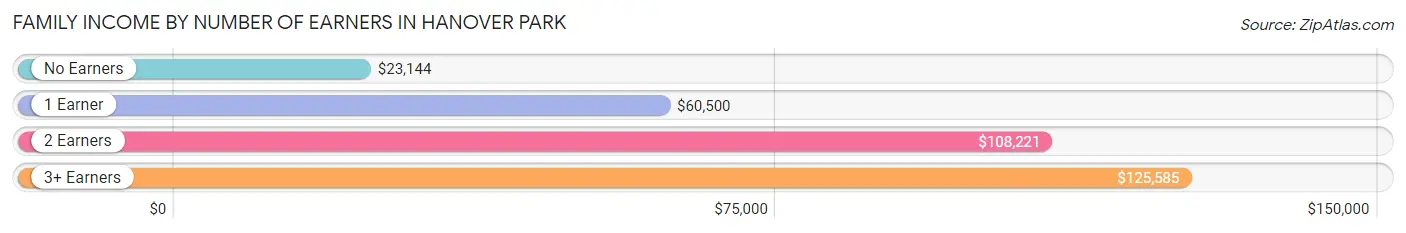
| Number of Earners | # Families | Median Income |
| No Earners | 953 (10.5%) | $23,144 |
| 1 Earner | 2,326 (25.5%) | $60,500 |
| 2 Earners | 3,728 (40.9%) | $108,221 |
| 3+ Earners | 2,103 (23.1%) | $125,585 |
| Total | 9,110 (100.0%) | $91,788 |
Household Income in Hanover Park
Household Income Brackets in Hanover Park
With 2,689 households falling in the category, the $100,000 to $149,999 income range is the most frequent in Hanover Park, accounting for 24.2% of all households. In contrast, only 267 households (2.4%) fall into the $10,000 to $14,999 income bracket, making it the least populous group.
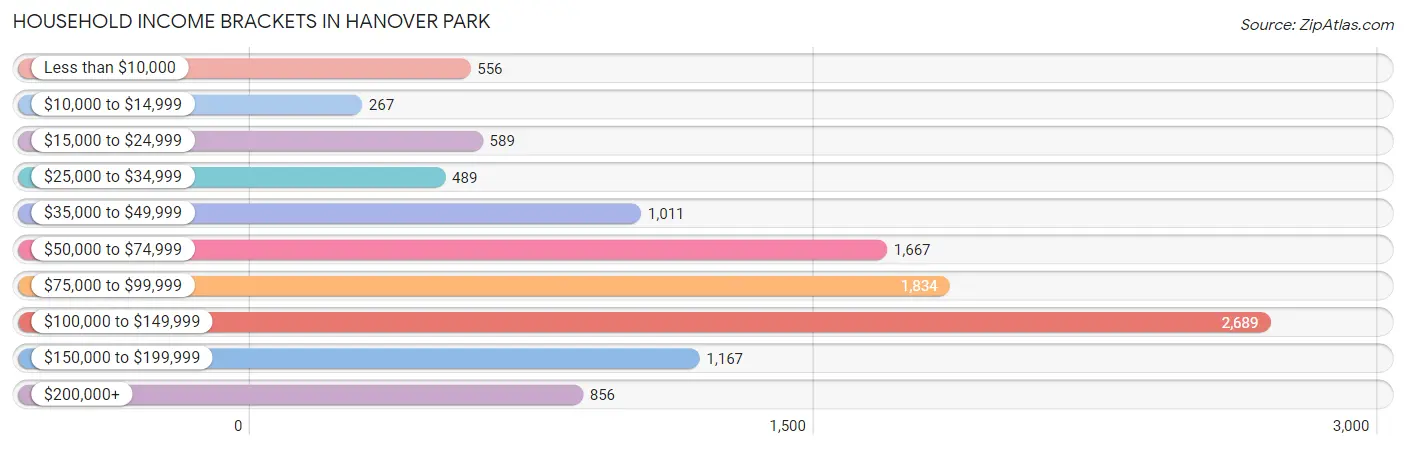
| Income Bracket | # Households | % Households |
| Less than $10,000 | 556 | 5.0% |
| $10,000 to $14,999 | 267 | 2.4% |
| $15,000 to $24,999 | 589 | 5.3% |
| $25,000 to $34,999 | 489 | 4.4% |
| $35,000 to $49,999 | 1,011 | 9.1% |
| $50,000 to $74,999 | 1,667 | 15.0% |
| $75,000 to $99,999 | 1,834 | 16.5% |
| $100,000 to $149,999 | 2,689 | 24.2% |
| $150,000 to $199,999 | 1,167 | 10.5% |
| $200,000+ | 856 | 7.7% |
Household Income by Householder Age in Hanover Park
The median household income in Hanover Park is $88,460, with the highest median household income of $95,972 found in the 25 to 44 years age bracket for the primary householder. A total of 3,837 households (34.5%) fall into this category. Meanwhile, the 15 to 24 years age bracket for the primary householder has the lowest median household income of $54,659, with 352 households (3.2%) in this group.
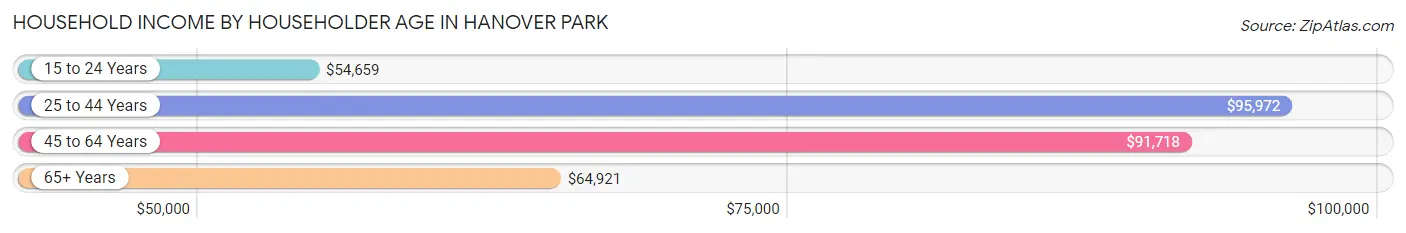
| Income Bracket | # Households | Median Income |
| 15 to 24 Years | 352 (3.2%) | $54,659 |
| 25 to 44 Years | 3,837 (34.5%) | $95,972 |
| 45 to 64 Years | 4,773 (42.9%) | $91,718 |
| 65+ Years | 2,151 (19.4%) | $64,921 |
| Total | 11,113 (100.0%) | $88,460 |
Poverty in Hanover Park
Income Below Poverty by Sex and Age in Hanover Park
With 13.8% poverty level for males and 15.5% for females among the residents of Hanover Park, 6 to 11 year old males and 12 to 14 year old females are the most vulnerable to poverty, with 605 males (34.0%) and 263 females (27.7%) in their respective age groups living below the poverty level.
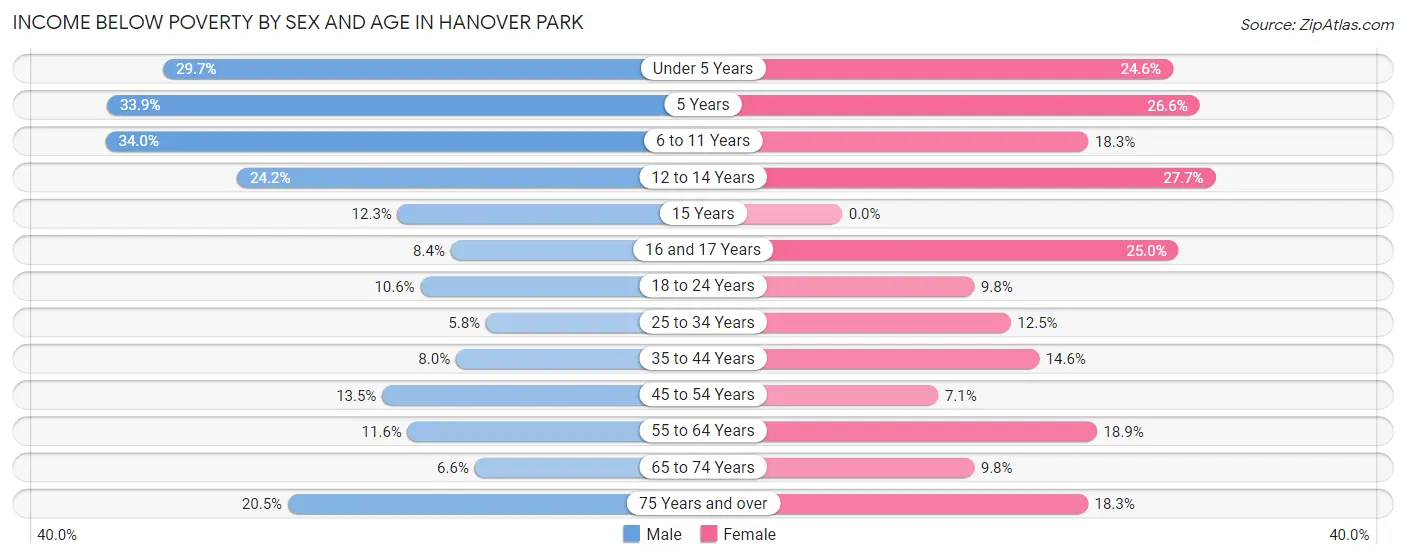
| Age Bracket | Male | Female |
| Under 5 Years | 246 (29.7%) | 327 (24.6%) |
| 5 Years | 41 (33.9%) | 51 (26.6%) |
| 6 to 11 Years | 605 (34.0%) | 356 (18.3%) |
| 12 to 14 Years | 179 (24.2%) | 263 (27.7%) |
| 15 Years | 46 (12.3%) | 0 (0.0%) |
| 16 and 17 Years | 54 (8.4%) | 182 (25.0%) |
| 18 to 24 Years | 179 (10.6%) | 145 (9.8%) |
| 25 to 34 Years | 161 (5.8%) | 320 (12.5%) |
| 35 to 44 Years | 205 (8.0%) | 380 (14.6%) |
| 45 to 54 Years | 303 (13.5%) | 154 (7.1%) |
| 55 to 64 Years | 256 (11.6%) | 453 (18.9%) |
| 65 to 74 Years | 92 (6.6%) | 145 (9.8%) |
| 75 Years and over | 110 (20.4%) | 159 (18.2%) |
| Total | 2,477 (13.8%) | 2,935 (15.5%) |
Income Above Poverty by Sex and Age in Hanover Park
According to the poverty statistics in Hanover Park, males aged 25 to 34 years and females aged 15 years are the age groups that are most secure financially, with 94.3% of males and 100.0% of females in these age groups living above the poverty line.
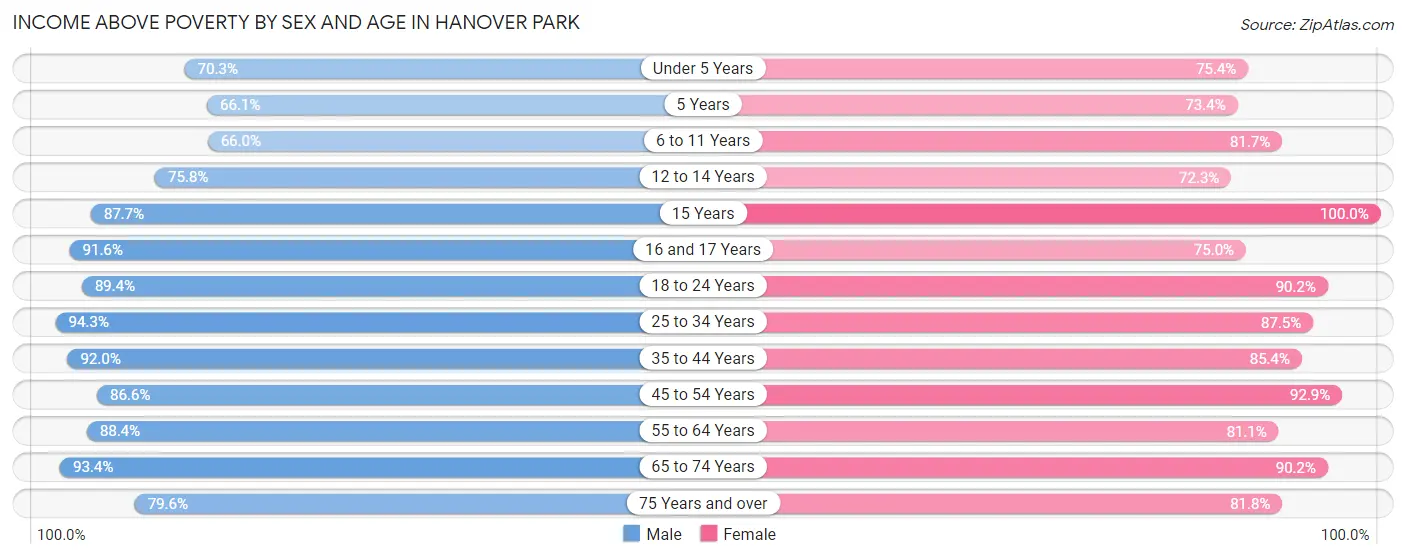
| Age Bracket | Male | Female |
| Under 5 Years | 582 (70.3%) | 1,004 (75.4%) |
| 5 Years | 80 (66.1%) | 141 (73.4%) |
| 6 to 11 Years | 1,175 (66.0%) | 1,591 (81.7%) |
| 12 to 14 Years | 560 (75.8%) | 685 (72.3%) |
| 15 Years | 328 (87.7%) | 260 (100.0%) |
| 16 and 17 Years | 592 (91.6%) | 546 (75.0%) |
| 18 to 24 Years | 1,508 (89.4%) | 1,333 (90.2%) |
| 25 to 34 Years | 2,638 (94.3%) | 2,236 (87.5%) |
| 35 to 44 Years | 2,368 (92.0%) | 2,220 (85.4%) |
| 45 to 54 Years | 1,950 (86.6%) | 2,002 (92.9%) |
| 55 to 64 Years | 1,959 (88.4%) | 1,943 (81.1%) |
| 65 to 74 Years | 1,306 (93.4%) | 1,335 (90.2%) |
| 75 Years and over | 428 (79.5%) | 712 (81.8%) |
| Total | 15,474 (86.2%) | 16,008 (84.5%) |
Income Below Poverty Among Married-Couple Families in Hanover Park
The poverty statistics for married-couple families in Hanover Park show that 7.7% or 489 of the total 6,307 families live below the poverty line. Families with 3 or 4 children have the highest poverty rate of 25.3%, comprising of 226 families. On the other hand, families with 5 or more children have the lowest poverty rate of 0.0%, which includes 0 families.
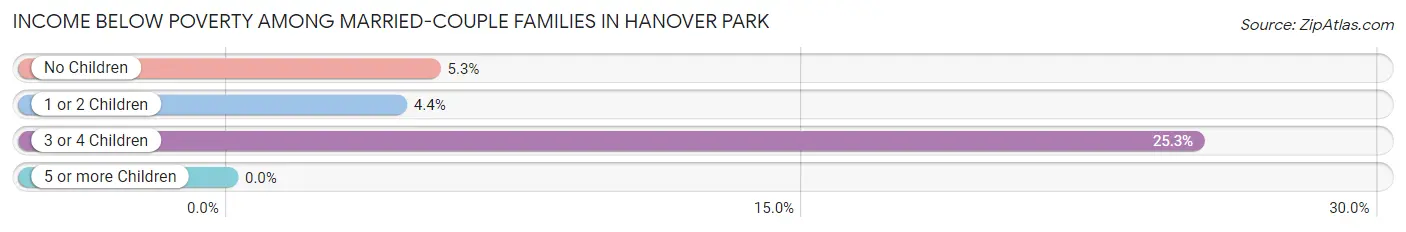
| Children | Above Poverty | Below Poverty |
| No Children | 2,939 (94.7%) | 164 (5.3%) |
| 1 or 2 Children | 2,148 (95.6%) | 99 (4.4%) |
| 3 or 4 Children | 669 (74.8%) | 226 (25.3%) |
| 5 or more Children | 62 (100.0%) | 0 (0.0%) |
| Total | 5,818 (92.2%) | 489 (7.7%) |
Income Below Poverty Among Single-Parent Households in Hanover Park
According to the poverty data in Hanover Park, 20.4% or 183 single-father households and 25.5% or 486 single-mother households are living below the poverty line. Among single-father households, those with 1 or 2 children have the highest poverty rate, with 134 households (53.0%) experiencing poverty. Likewise, among single-mother households, those with 5 or more children have the highest poverty rate, with 38 households (100.0%) falling below the poverty line.
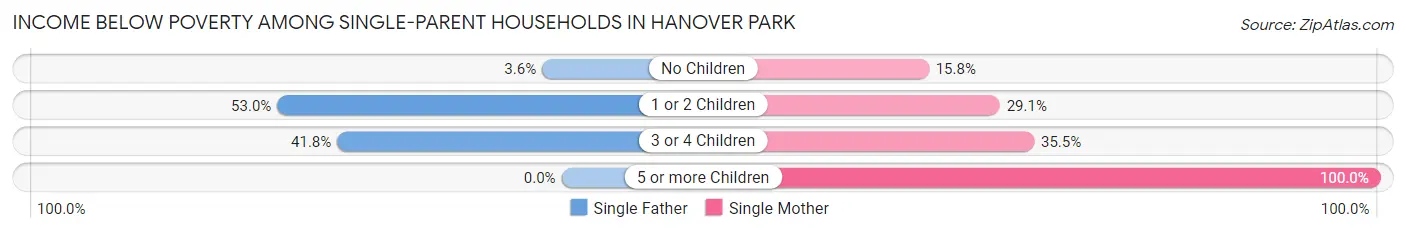
| Children | Single Father | Single Mother |
| No Children | 21 (3.6%) | 137 (15.8%) |
| 1 or 2 Children | 134 (53.0%) | 200 (29.1%) |
| 3 or 4 Children | 28 (41.8%) | 111 (35.5%) |
| 5 or more Children | 0 (0.0%) | 38 (100.0%) |
| Total | 183 (20.4%) | 486 (25.5%) |
Income Below Poverty Among Married-Couple vs Single-Parent Households in Hanover Park
The poverty data for Hanover Park shows that 489 of the married-couple family households (7.7%) and 669 of the single-parent households (23.9%) are living below the poverty level. Within the married-couple family households, those with 3 or 4 children have the highest poverty rate, with 226 households (25.3%) falling below the poverty line. Among the single-parent households, those with 5 or more children have the highest poverty rate, with 38 household (100.0%) living below poverty.
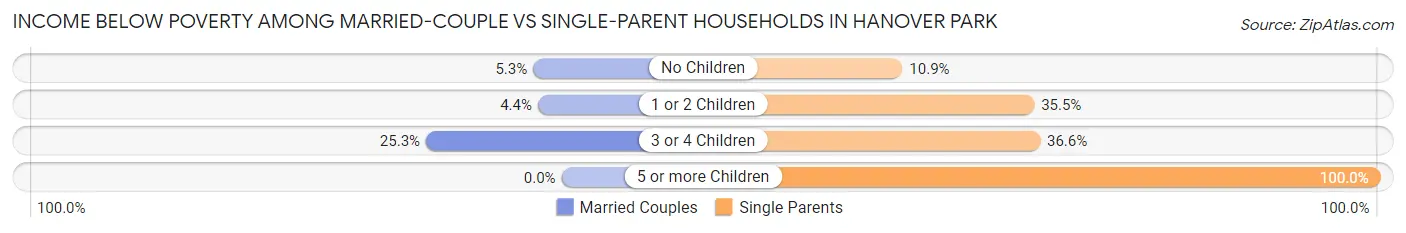
| Children | Married-Couple Families | Single-Parent Households |
| No Children | 164 (5.3%) | 158 (10.9%) |
| 1 or 2 Children | 99 (4.4%) | 334 (35.5%) |
| 3 or 4 Children | 226 (25.3%) | 139 (36.6%) |
| 5 or more Children | 0 (0.0%) | 38 (100.0%) |
| Total | 489 (7.7%) | 669 (23.9%) |
Race in Hanover Park
The most populous races in Hanover Park are White / Caucasian (15,838 | 42.5%), Hispanic or Latino (14,338 | 38.5%), and Asian (7,257 | 19.5%).
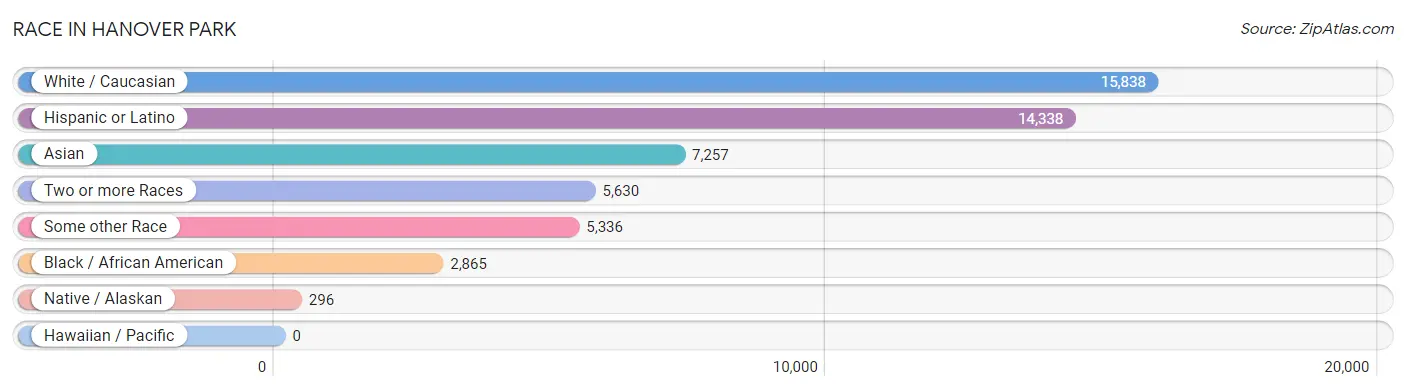
| Race | # Population | % Population |
| Asian | 7,257 | 19.5% |
| Black / African American | 2,865 | 7.7% |
| Hawaiian / Pacific | 0 | 0.0% |
| Hispanic or Latino | 14,338 | 38.5% |
| Native / Alaskan | 296 | 0.8% |
| White / Caucasian | 15,838 | 42.5% |
| Two or more Races | 5,630 | 15.1% |
| Some other Race | 5,336 | 14.3% |
| Total | 37,222 | 100.0% |
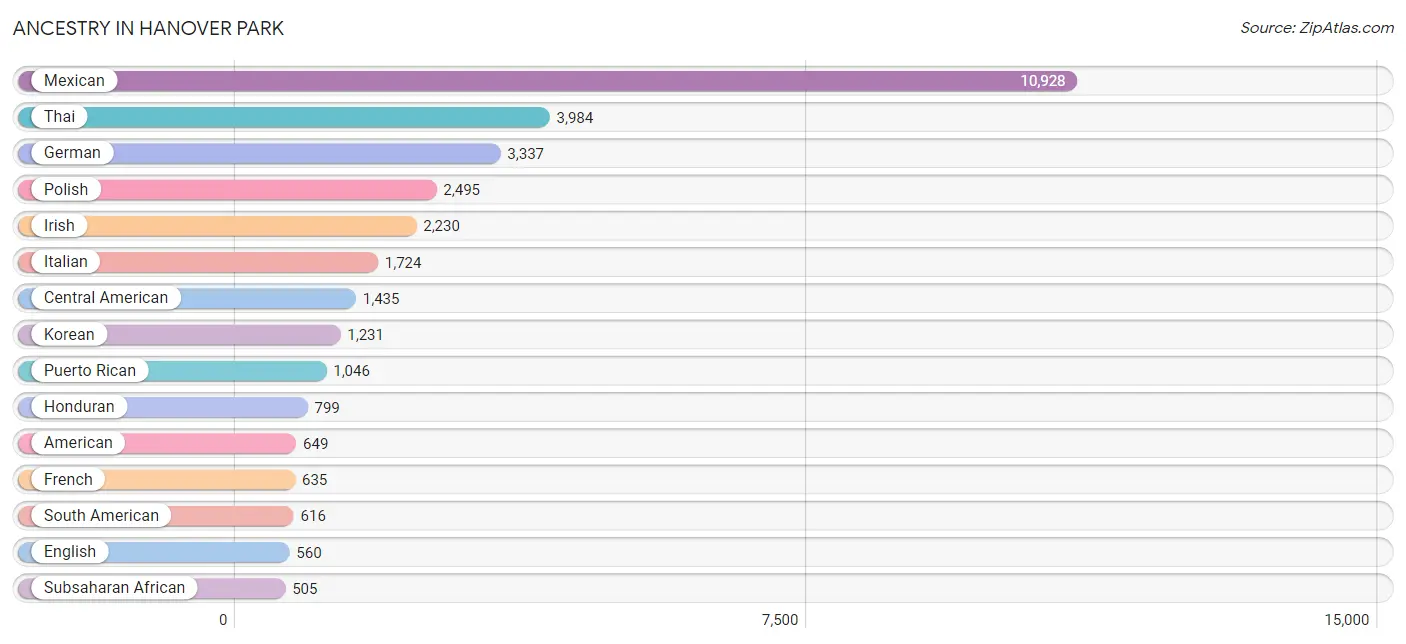
Ancestry in Hanover Park
The most populous ancestries reported in Hanover Park are Mexican (10,928 | 29.4%), Thai (3,984 | 10.7%), German (3,337 | 9.0%), Polish (2,495 | 6.7%), and Irish (2,230 | 6.0%), together accounting for 61.7% of all Hanover Park residents.
| Ancestry | # Population | % Population |
| African | 63 | 0.2% |
| Albanian | 48 | 0.1% |
| American | 649 | 1.7% |
| Apache | 7 | 0.0% |
| Arab | 424 | 1.1% |
| Austrian | 41 | 0.1% |
| Bangladeshi | 14 | 0.0% |
| Basque | 12 | 0.0% |
| Belgian | 33 | 0.1% |
| Bhutanese | 42 | 0.1% |
| Blackfeet | 18 | 0.1% |
| British | 24 | 0.1% |
| Bulgarian | 61 | 0.2% |
| Burmese | 228 | 0.6% |
| Canadian | 31 | 0.1% |
| Central American | 1,435 | 3.9% |
| Central American Indian | 59 | 0.2% |
| Cherokee | 28 | 0.1% |
| Chippewa | 3 | 0.0% |
| Colombian | 134 | 0.4% |
| Costa Rican | 137 | 0.4% |
| Croatian | 43 | 0.1% |
| Cuban | 123 | 0.3% |
| Czech | 146 | 0.4% |
| Czechoslovakian | 70 | 0.2% |
| Danish | 20 | 0.1% |
| Dominican | 54 | 0.2% |
| Dutch | 196 | 0.5% |
| Eastern European | 31 | 0.1% |
| Ecuadorian | 166 | 0.4% |
| Egyptian | 292 | 0.8% |
| English | 560 | 1.5% |
| Ethiopian | 70 | 0.2% |
| European | 272 | 0.7% |
| Filipino | 52 | 0.1% |
| Finnish | 37 | 0.1% |
| French | 635 | 1.7% |
| French Canadian | 13 | 0.0% |
| German | 3,337 | 9.0% |
| Ghanaian | 65 | 0.2% |
| Greek | 147 | 0.4% |
| Guatemalan | 229 | 0.6% |
| Honduran | 799 | 2.1% |
| Hungarian | 110 | 0.3% |
| Indian (Asian) | 178 | 0.5% |
| Indonesian | 20 | 0.1% |
| Iraqi | 60 | 0.2% |
| Irish | 2,230 | 6.0% |
| Italian | 1,724 | 4.6% |
| Japanese | 213 | 0.6% |
| Korean | 1,231 | 3.3% |
| Latvian | 5 | 0.0% |
| Lithuanian | 48 | 0.1% |
| Malaysian | 187 | 0.5% |
| Mexican | 10,928 | 29.4% |
| Mexican American Indian | 231 | 0.6% |
| Navajo | 6 | 0.0% |
| Nigerian | 29 | 0.1% |
| Norwegian | 213 | 0.6% |
| Pakistani | 6 | 0.0% |
| Palestinian | 27 | 0.1% |
| Panamanian | 53 | 0.1% |
| Pennsylvania German | 9 | 0.0% |
| Peruvian | 51 | 0.1% |
| Polish | 2,495 | 6.7% |
| Portuguese | 39 | 0.1% |
| Puerto Rican | 1,046 | 2.8% |
| Romanian | 32 | 0.1% |
| Russian | 67 | 0.2% |
| Salvadoran | 167 | 0.4% |
| Scandinavian | 110 | 0.3% |
| Scotch-Irish | 34 | 0.1% |
| Scottish | 159 | 0.4% |
| Serbian | 37 | 0.1% |
| Slavic | 4 | 0.0% |
| Slovak | 26 | 0.1% |
| Slovene | 28 | 0.1% |
| Somali | 278 | 0.7% |
| South American | 616 | 1.7% |
| Soviet Union | 6 | 0.0% |
| Spaniard | 37 | 0.1% |
| Spanish | 37 | 0.1% |
| Sri Lankan | 297 | 0.8% |
| Subsaharan African | 505 | 1.4% |
| Swedish | 339 | 0.9% |
| Swiss | 43 | 0.1% |
| Thai | 3,984 | 10.7% |
| Trinidadian and Tobagonian | 35 | 0.1% |
| Ukrainian | 118 | 0.3% |
| Venezuelan | 265 | 0.7% |
| Welsh | 2 | 0.0% |
| Yugoslavian | 26 | 0.1% | View All 92 Rows |
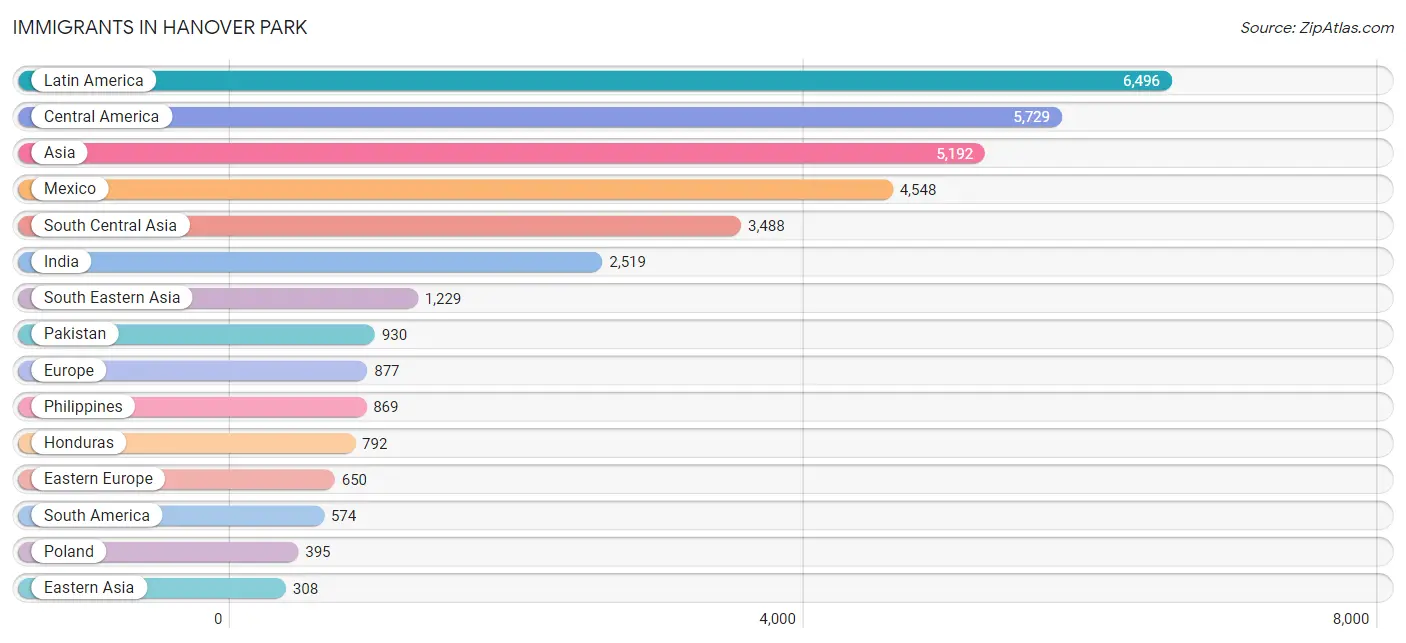
Immigrants in Hanover Park
The most numerous immigrant groups reported in Hanover Park came from Latin America (6,496 | 17.4%), Central America (5,729 | 15.4%), Asia (5,192 | 14.0%), Mexico (4,548 | 12.2%), and South Central Asia (3,488 | 9.4%), together accounting for 68.4% of all Hanover Park residents.
| Immigration Origin | # Population | % Population |
| Africa | 300 | 0.8% |
| Albania | 42 | 0.1% |
| Asia | 5,192 | 14.0% |
| Bosnia and Herzegovina | 27 | 0.1% |
| Brazil | 39 | 0.1% |
| Bulgaria | 29 | 0.1% |
| Cambodia | 121 | 0.3% |
| Canada | 153 | 0.4% |
| Caribbean | 193 | 0.5% |
| Central America | 5,729 | 15.4% |
| China | 115 | 0.3% |
| Colombia | 100 | 0.3% |
| Costa Rica | 24 | 0.1% |
| Croatia | 10 | 0.0% |
| Cuba | 147 | 0.4% |
| Dominican Republic | 35 | 0.1% |
| Eastern Africa | 87 | 0.2% |
| Eastern Asia | 308 | 0.8% |
| Eastern Europe | 650 | 1.8% |
| Ecuador | 89 | 0.2% |
| Egypt | 119 | 0.3% |
| El Salvador | 179 | 0.5% |
| England | 50 | 0.1% |
| Ethiopia | 40 | 0.1% |
| Europe | 877 | 2.4% |
| France | 9 | 0.0% |
| Germany | 33 | 0.1% |
| Ghana | 51 | 0.1% |
| Greece | 21 | 0.1% |
| Guatemala | 145 | 0.4% |
| Guyana | 11 | 0.0% |
| Honduras | 792 | 2.1% |
| India | 2,519 | 6.8% |
| Iraq | 45 | 0.1% |
| Ireland | 5 | 0.0% |
| Israel | 9 | 0.0% |
| Italy | 11 | 0.0% |
| Japan | 18 | 0.1% |
| Jordan | 10 | 0.0% |
| Kenya | 9 | 0.0% |
| Korea | 175 | 0.5% |
| Laos | 111 | 0.3% |
| Latin America | 6,496 | 17.4% |
| Latvia | 14 | 0.0% |
| Lithuania | 18 | 0.1% |
| Mexico | 4,548 | 12.2% |
| Northern Africa | 138 | 0.4% |
| Northern Europe | 126 | 0.3% |
| Pakistan | 930 | 2.5% |
| Panama | 41 | 0.1% |
| Peru | 53 | 0.1% |
| Philippines | 869 | 2.3% |
| Poland | 395 | 1.1% |
| Romania | 14 | 0.0% |
| Saudi Arabia | 16 | 0.0% |
| Serbia | 19 | 0.1% |
| Somalia | 38 | 0.1% |
| South America | 574 | 1.5% |
| South Central Asia | 3,488 | 9.4% |
| South Eastern Asia | 1,229 | 3.3% |
| Southern Europe | 32 | 0.1% |
| Taiwan | 3 | 0.0% |
| Thailand | 6 | 0.0% |
| Trinidad and Tobago | 11 | 0.0% |
| Ukraine | 69 | 0.2% |
| Venezuela | 282 | 0.8% |
| Vietnam | 109 | 0.3% |
| Western Africa | 51 | 0.1% |
| Western Asia | 115 | 0.3% |
| Western Europe | 42 | 0.1% | View All 70 Rows |
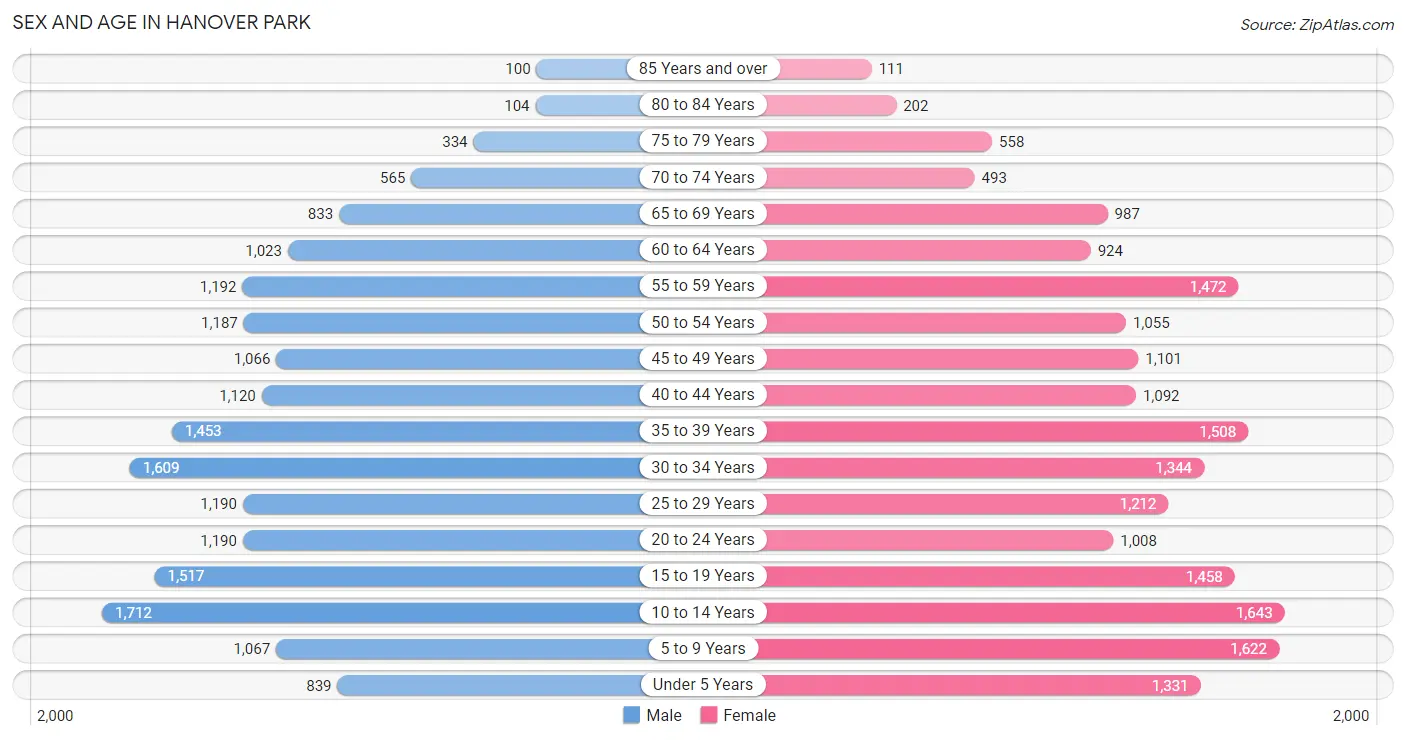
Sex and Age in Hanover Park
Sex and Age in Hanover Park
The most populous age groups in Hanover Park are 10 to 14 Years (1,712 | 9.5%) for men and 10 to 14 Years (1,643 | 8.6%) for women.
| Age Bracket | Male | Female |
| Under 5 Years | 839 (4.6%) | 1,331 (7.0%) |
| 5 to 9 Years | 1,067 (5.9%) | 1,622 (8.5%) |
| 10 to 14 Years | 1,712 (9.5%) | 1,643 (8.6%) |
| 15 to 19 Years | 1,517 (8.4%) | 1,458 (7.6%) |
| 20 to 24 Years | 1,190 (6.6%) | 1,008 (5.3%) |
| 25 to 29 Years | 1,190 (6.6%) | 1,212 (6.3%) |
| 30 to 34 Years | 1,609 (8.9%) | 1,344 (7.0%) |
| 35 to 39 Years | 1,453 (8.0%) | 1,508 (7.9%) |
| 40 to 44 Years | 1,120 (6.2%) | 1,092 (5.7%) |
| 45 to 49 Years | 1,066 (5.9%) | 1,101 (5.8%) |
| 50 to 54 Years | 1,187 (6.6%) | 1,055 (5.5%) |
| 55 to 59 Years | 1,192 (6.6%) | 1,472 (7.7%) |
| 60 to 64 Years | 1,023 (5.7%) | 924 (4.8%) |
| 65 to 69 Years | 833 (4.6%) | 987 (5.2%) |
| 70 to 74 Years | 565 (3.1%) | 493 (2.6%) |
| 75 to 79 Years | 334 (1.8%) | 558 (2.9%) |
| 80 to 84 Years | 104 (0.6%) | 202 (1.1%) |
| 85 Years and over | 100 (0.5%) | 111 (0.6%) |
| Total | 18,101 (100.0%) | 19,121 (100.0%) |
Families and Households in Hanover Park
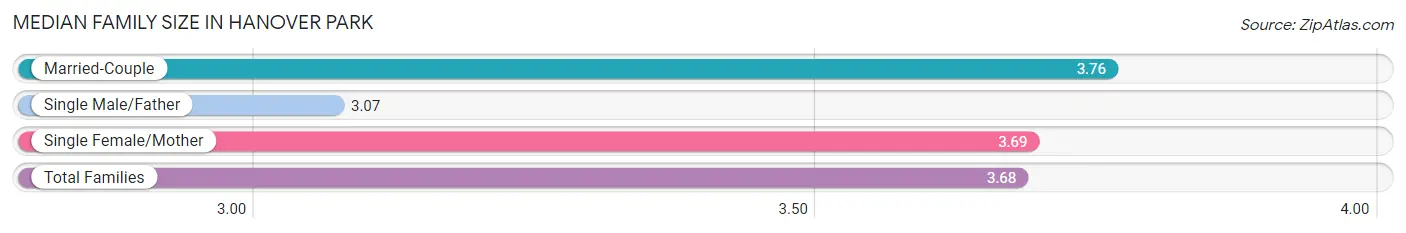
Median Family Size in Hanover Park
The median family size in Hanover Park is 3.68 persons per family, with married-couple families (6,307 | 69.2%) accounting for the largest median family size of 3.76 persons per family. On the other hand, single male/father families (899 | 9.9%) represent the smallest median family size with 3.07 persons per family.
| Family Type | # Families | Family Size |
| Married-Couple | 6,307 (69.2%) | 3.76 |
| Single Male/Father | 899 (9.9%) | 3.07 |
| Single Female/Mother | 1,904 (20.9%) | 3.69 |
| Total Families | 9,110 (100.0%) | 3.68 |
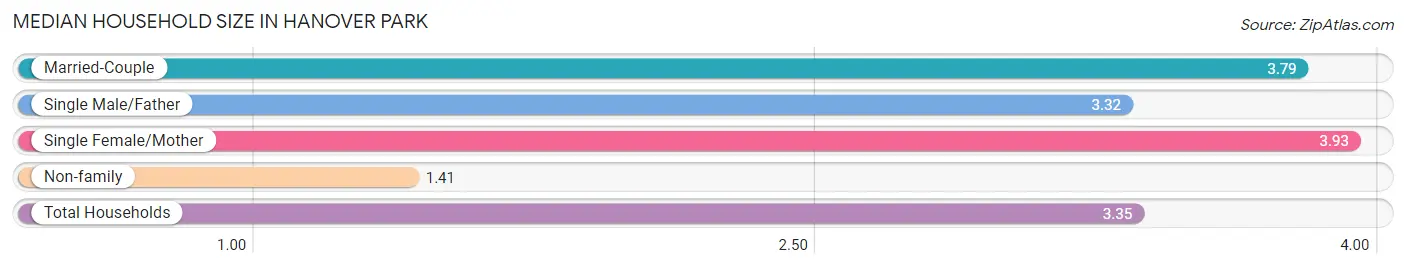
Median Household Size in Hanover Park
The median household size in Hanover Park is 3.35 persons per household, with single female/mother households (1,904 | 17.1%) accounting for the largest median household size of 3.93 persons per household. non-family households (2,003 | 18.0%) represent the smallest median household size with 1.41 persons per household.
| Household Type | # Households | Household Size |
| Married-Couple | 6,307 (56.8%) | 3.79 |
| Single Male/Father | 899 (8.1%) | 3.32 |
| Single Female/Mother | 1,904 (17.1%) | 3.93 |
| Non-family | 2,003 (18.0%) | 1.41 |
| Total Households | 11,113 (100.0%) | 3.35 |
Household Size by Marriage Status in Hanover Park
Out of a total of 11,113 households in Hanover Park, 9,110 (82.0%) are family households, while 2,003 (18.0%) are nonfamily households. The most numerous type of family households are 2-person households, comprising 2,955, and the most common type of nonfamily households are 1-person households, comprising 1,523.
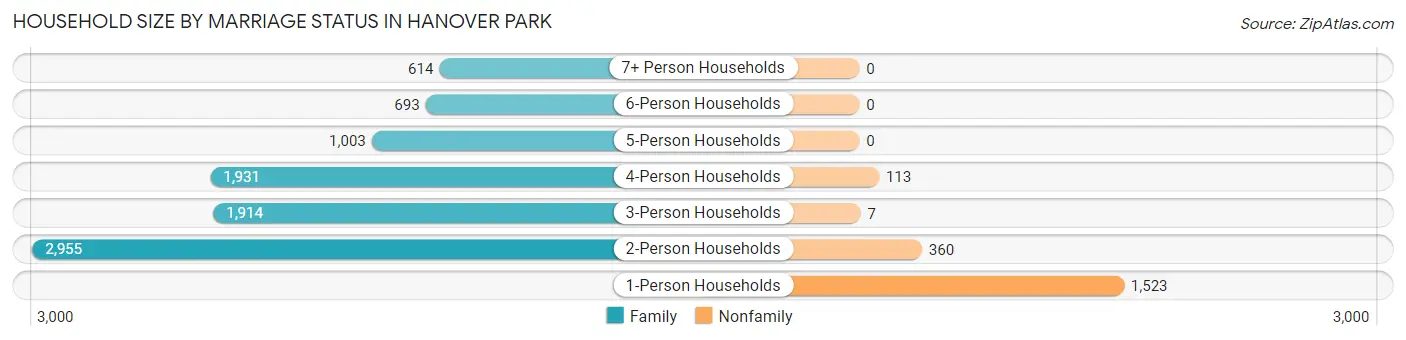
| Household Size | Family Households | Nonfamily Households |
| 1-Person Households | - | 1,523 (13.7%) |
| 2-Person Households | 2,955 (26.6%) | 360 (3.2%) |
| 3-Person Households | 1,914 (17.2%) | 7 (0.1%) |
| 4-Person Households | 1,931 (17.4%) | 113 (1.0%) |
| 5-Person Households | 1,003 (9.0%) | 0 (0.0%) |
| 6-Person Households | 693 (6.2%) | 0 (0.0%) |
| 7+ Person Households | 614 (5.5%) | 0 (0.0%) |
| Total | 9,110 (82.0%) | 2,003 (18.0%) |
Female Fertility in Hanover Park
Fertility by Age in Hanover Park
Average fertility rate in Hanover Park is 68.0 births per 1,000 women. Women in the age bracket of 20 to 34 years have the highest fertility rate with 82.0 births per 1,000 women. Women in the age bracket of 20 to 34 years acount for 47.6% of all women with births.
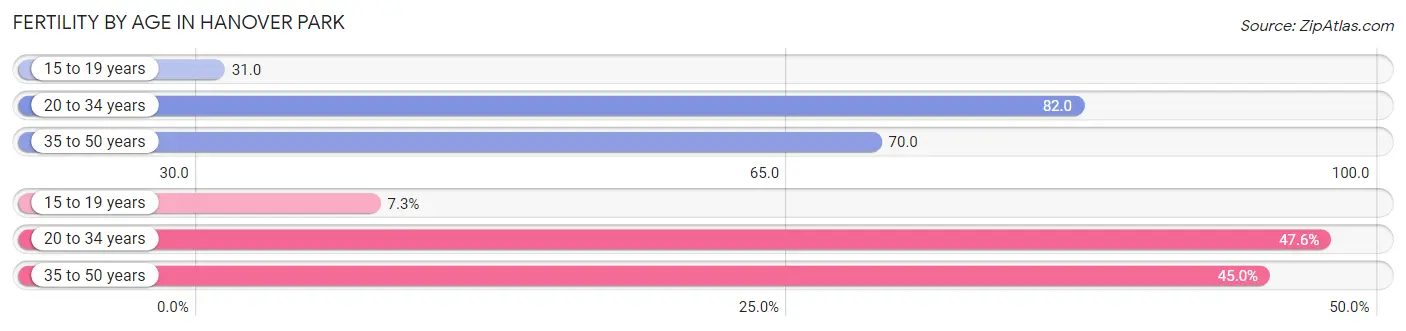
| Age Bracket | Women with Births | Births / 1,000 Women |
| 15 to 19 years | 45 (7.3%) | 31.0 |
| 20 to 34 years | 293 (47.6%) | 82.0 |
| 35 to 50 years | 277 (45.0%) | 70.0 |
| Total | 615 (100.0%) | 68.0 |
Fertility by Age by Marriage Status in Hanover Park
74.1% of women with births (615) in Hanover Park are married. The highest percentage of unmarried women with births falls into 15 to 19 years age bracket with 100.0% of them unmarried at the time of birth, while the lowest percentage of unmarried women with births belong to 35 to 50 years age bracket with 16.2% of them unmarried.
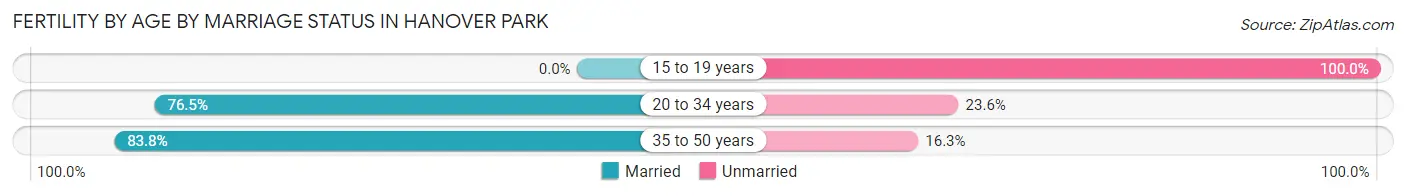
| Age Bracket | Married | Unmarried |
| 15 to 19 years | 0 (0.0%) | 45 (100.0%) |
| 20 to 34 years | 224 (76.4%) | 69 (23.5%) |
| 35 to 50 years | 232 (83.8%) | 45 (16.3%) |
| Total | 456 (74.2%) | 159 (25.9%) |
Fertility by Education in Hanover Park
Average fertility rate in Hanover Park is 68.0 births per 1,000 women. Women with the education attainment of graduate degree have the highest fertility rate of 121.0 births per 1,000 women, while women with the education attainment of less than high school have the lowest fertility at 40.0 births per 1,000 women. Women with the education attainment of high school diploma represent 28.3% of all women with births.
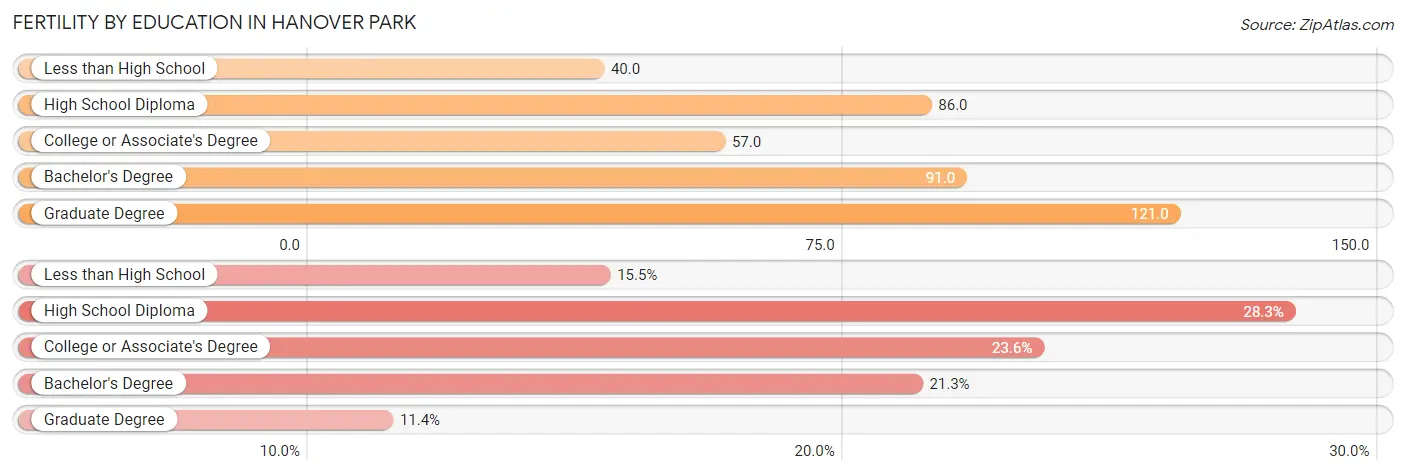
| Educational Attainment | Women with Births | Births / 1,000 Women |
| Less than High School | 95 (15.4%) | 40.0 |
| High School Diploma | 174 (28.3%) | 86.0 |
| College or Associate's Degree | 145 (23.6%) | 57.0 |
| Bachelor's Degree | 131 (21.3%) | 91.0 |
| Graduate Degree | 70 (11.4%) | 121.0 |
| Total | 615 (100.0%) | 68.0 |
Fertility by Education by Marriage Status in Hanover Park
25.9% of women with births in Hanover Park are unmarried. Women with the educational attainment of graduate degree are most likely to be married with 100.0% of them married at childbirth, while women with the educational attainment of college or associate's degree are least likely to be married with 55.2% of them unmarried at childbirth.
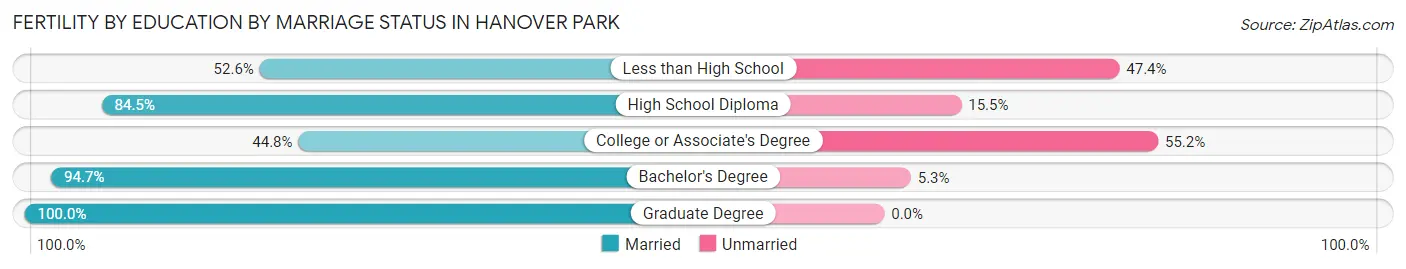
| Educational Attainment | Married | Unmarried |
| Less than High School | 50 (52.6%) | 45 (47.4%) |
| High School Diploma | 147 (84.5%) | 27 (15.5%) |
| College or Associate's Degree | 65 (44.8%) | 80 (55.2%) |
| Bachelor's Degree | 124 (94.7%) | 7 (5.3%) |
| Graduate Degree | 70 (100.0%) | 0 (0.0%) |
| Total | 456 (74.2%) | 159 (25.9%) |
Employment Characteristics in Hanover Park
Employment by Class of Employer in Hanover Park
Among the 17,905 employed individuals in Hanover Park, private company employees (14,197 | 79.3%), not-for-profit organizations (1,180 | 6.6%), and local government employees (710 | 4.0%) make up the most common classes of employment.
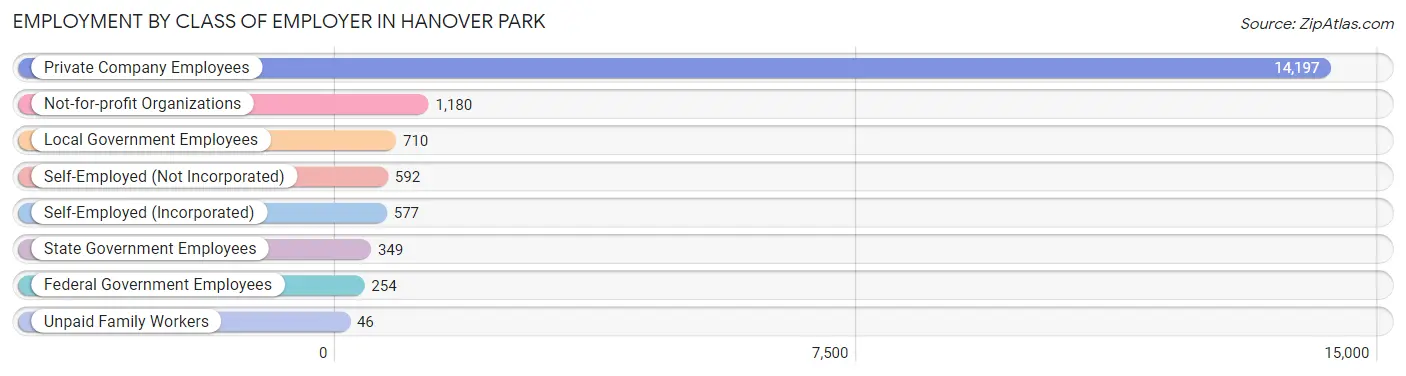
| Employer Class | # Employees | % Employees |
| Private Company Employees | 14,197 | 79.3% |
| Self-Employed (Incorporated) | 577 | 3.2% |
| Self-Employed (Not Incorporated) | 592 | 3.3% |
| Not-for-profit Organizations | 1,180 | 6.6% |
| Local Government Employees | 710 | 4.0% |
| State Government Employees | 349 | 1.9% |
| Federal Government Employees | 254 | 1.4% |
| Unpaid Family Workers | 46 | 0.3% |
| Total | 17,905 | 100.0% |
Employment Status by Age in Hanover Park
According to the labor force statistics for Hanover Park, out of the total population over 16 years of age (28,374), 67.9% or 19,266 individuals are in the labor force, with 5.3% or 1,021 of them unemployed. The age group with the highest labor force participation rate is 25 to 29 years, with 86.8% or 2,085 individuals in the labor force. Within the labor force, the 16 to 19 years age range has the highest percentage of unemployed individuals, with 14.1% or 153 of them being unemployed.
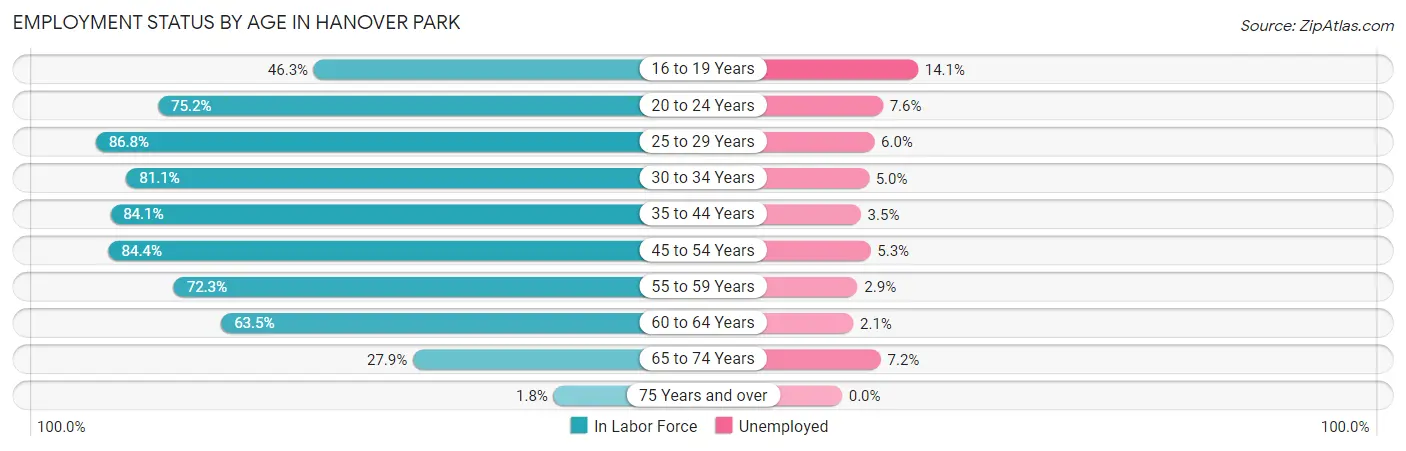
| Age Bracket | In Labor Force | Unemployed |
| 16 to 19 Years | 1,084 (46.3%) | 153 (14.1%) |
| 20 to 24 Years | 1,653 (75.2%) | 126 (7.6%) |
| 25 to 29 Years | 2,085 (86.8%) | 125 (6.0%) |
| 30 to 34 Years | 2,395 (81.1%) | 120 (5.0%) |
| 35 to 44 Years | 4,350 (84.1%) | 152 (3.5%) |
| 45 to 54 Years | 3,721 (84.4%) | 197 (5.3%) |
| 55 to 59 Years | 1,926 (72.3%) | 56 (2.9%) |
| 60 to 64 Years | 1,236 (63.5%) | 26 (2.1%) |
| 65 to 74 Years | 803 (27.9%) | 58 (7.2%) |
| 75 Years and over | 25 (1.8%) | 0 (0.0%) |
| Total | 19,266 (67.9%) | 1,021 (5.3%) |
Employment Status by Educational Attainment in Hanover Park
According to labor force statistics for Hanover Park, 80.4% of individuals (15,717) out of the total population between 25 and 64 years of age (19,548) are in the labor force, with 4.3% or 676 of them being unemployed. The group with the highest labor force participation rate are those with the educational attainment of bachelor's degree or higher, with 88.5% or 4,727 individuals in the labor force. Within the labor force, individuals with college / associate degree education have the highest percentage of unemployment, with 6.0% or 269 of them being unemployed.
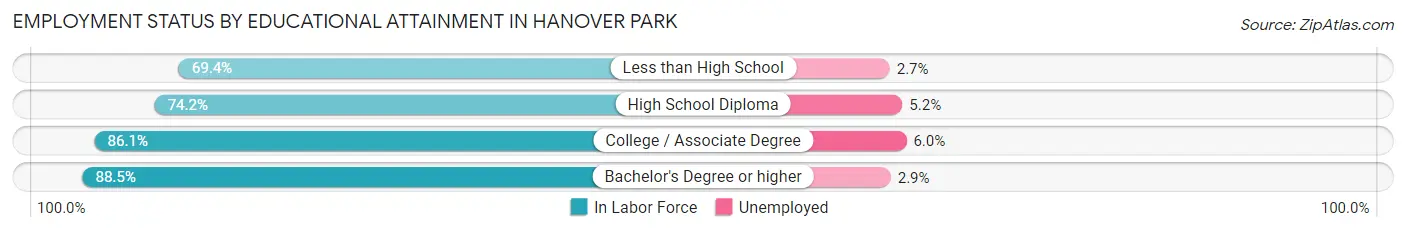
| Educational Attainment | In Labor Force | Unemployed |
| Less than High School | 2,483 (69.4%) | 97 (2.7%) |
| High School Diploma | 4,019 (74.2%) | 282 (5.2%) |
| College / Associate Degree | 4,488 (86.1%) | 313 (6.0%) |
| Bachelor's Degree or higher | 4,727 (88.5%) | 155 (2.9%) |
| Total | 15,717 (80.4%) | 841 (4.3%) |
Employment Occupations by Sex in Hanover Park
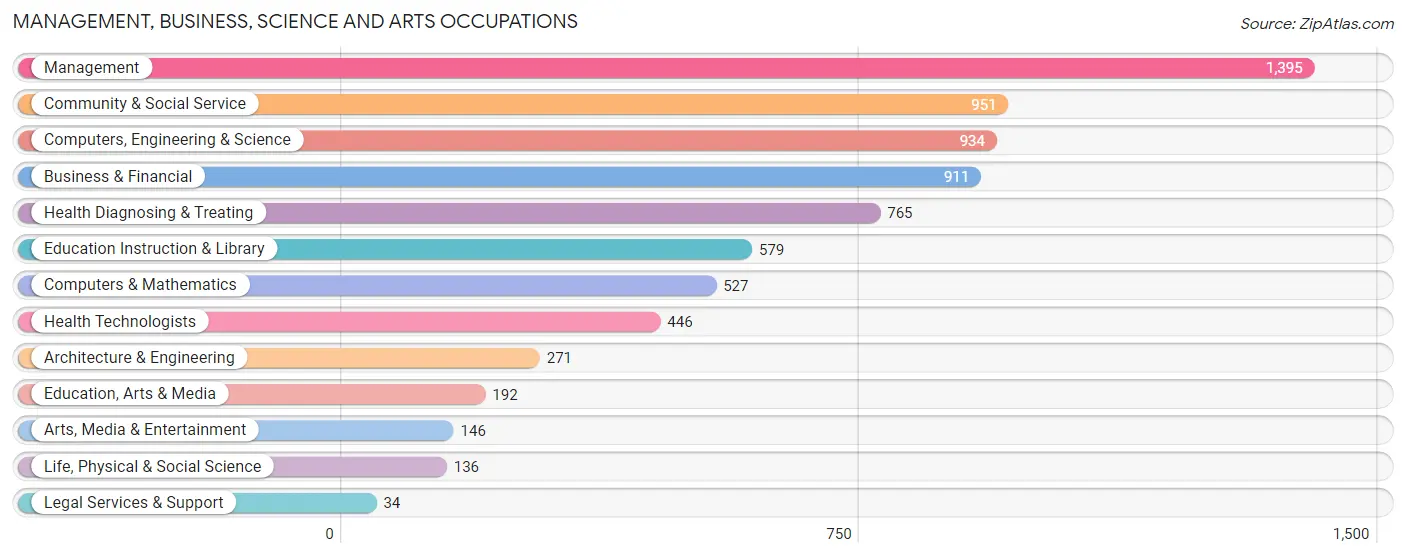
Management, Business, Science and Arts Occupations
The most common Management, Business, Science and Arts occupations in Hanover Park are Management (1,395 | 7.6%), Community & Social Service (951 | 5.2%), Computers, Engineering & Science (934 | 5.1%), Business & Financial (911 | 5.0%), and Health Diagnosing & Treating (765 | 4.2%).
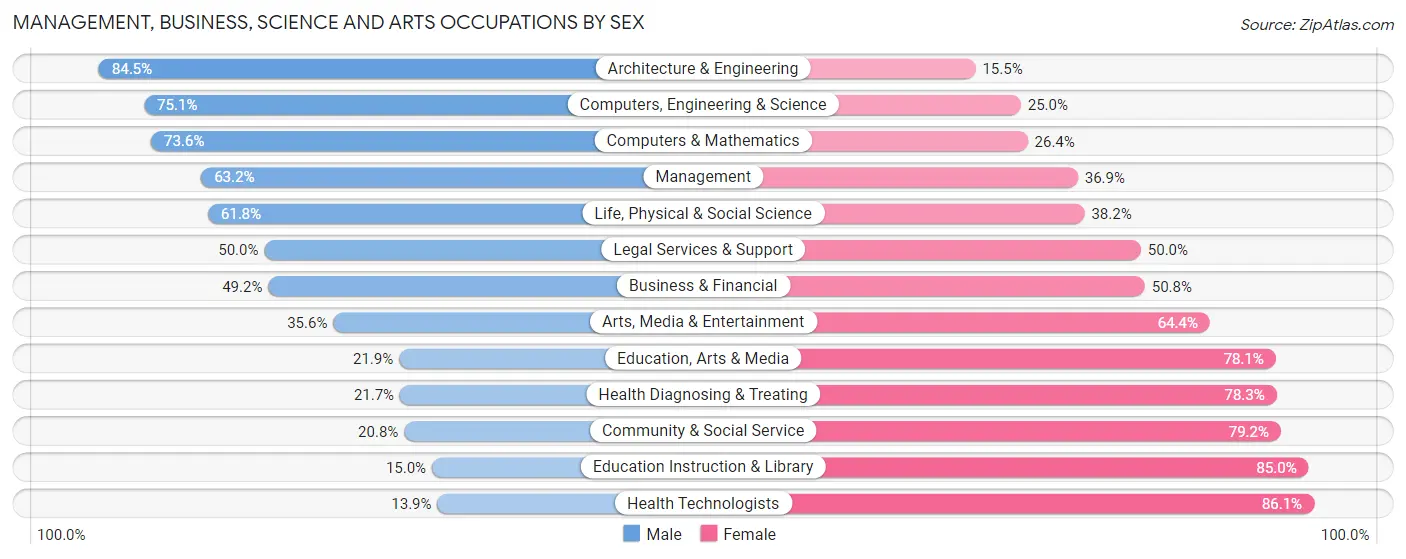
Management, Business, Science and Arts Occupations by Sex
Within the Management, Business, Science and Arts occupations in Hanover Park, the most male-oriented occupations are Architecture & Engineering (84.5%), Computers, Engineering & Science (75.0%), and Computers & Mathematics (73.6%), while the most female-oriented occupations are Health Technologists (86.1%), Education Instruction & Library (85.0%), and Community & Social Service (79.2%).
| Occupation | Male | Female |
| Management | 881 (63.1%) | 514 (36.8%) |
| Business & Financial | 448 (49.2%) | 463 (50.8%) |
| Computers, Engineering & Science | 701 (75.0%) | 233 (24.9%) |
| Computers & Mathematics | 388 (73.6%) | 139 (26.4%) |
| Architecture & Engineering | 229 (84.5%) | 42 (15.5%) |
| Life, Physical & Social Science | 84 (61.8%) | 52 (38.2%) |
| Community & Social Service | 198 (20.8%) | 753 (79.2%) |
| Education, Arts & Media | 42 (21.9%) | 150 (78.1%) |
| Legal Services & Support | 17 (50.0%) | 17 (50.0%) |
| Education Instruction & Library | 87 (15.0%) | 492 (85.0%) |
| Arts, Media & Entertainment | 52 (35.6%) | 94 (64.4%) |
| Health Diagnosing & Treating | 166 (21.7%) | 599 (78.3%) |
| Health Technologists | 62 (13.9%) | 384 (86.1%) |
| Total (Category) | 2,394 (48.3%) | 2,562 (51.7%) |
| Total (Overall) | 9,981 (54.7%) | 8,258 (45.3%) |
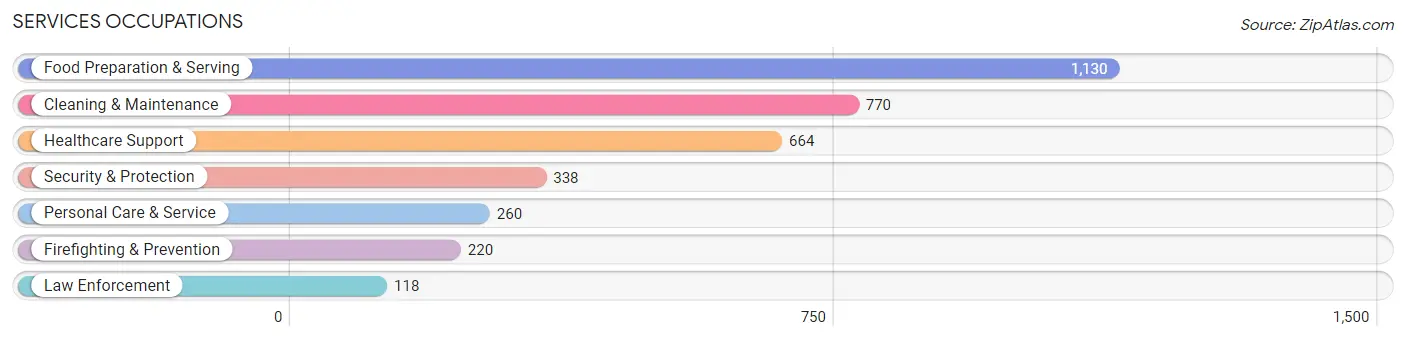
Services Occupations
The most common Services occupations in Hanover Park are Food Preparation & Serving (1,130 | 6.2%), Cleaning & Maintenance (770 | 4.2%), Healthcare Support (664 | 3.6%), Security & Protection (338 | 1.8%), and Personal Care & Service (260 | 1.4%).
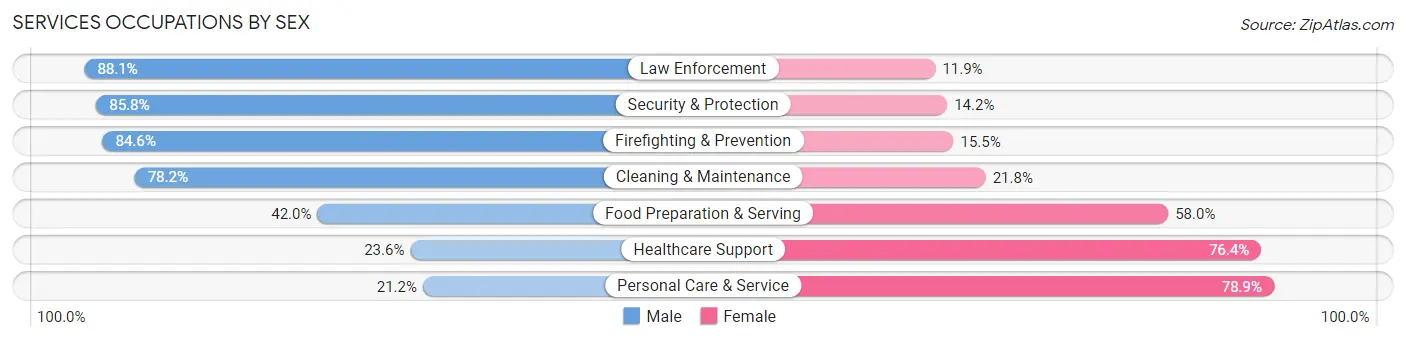
Services Occupations by Sex
Within the Services occupations in Hanover Park, the most male-oriented occupations are Law Enforcement (88.1%), Security & Protection (85.8%), and Firefighting & Prevention (84.6%), while the most female-oriented occupations are Personal Care & Service (78.8%), Healthcare Support (76.4%), and Food Preparation & Serving (58.0%).
| Occupation | Male | Female |
| Healthcare Support | 157 (23.6%) | 507 (76.4%) |
| Security & Protection | 290 (85.8%) | 48 (14.2%) |
| Firefighting & Prevention | 186 (84.6%) | 34 (15.4%) |
| Law Enforcement | 104 (88.1%) | 14 (11.9%) |
| Food Preparation & Serving | 475 (42.0%) | 655 (58.0%) |
| Cleaning & Maintenance | 602 (78.2%) | 168 (21.8%) |
| Personal Care & Service | 55 (21.1%) | 205 (78.8%) |
| Total (Category) | 1,579 (49.9%) | 1,583 (50.1%) |
| Total (Overall) | 9,981 (54.7%) | 8,258 (45.3%) |
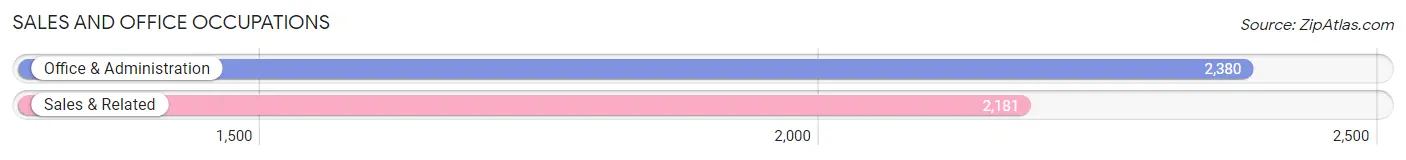
Sales and Office Occupations
The most common Sales and Office occupations in Hanover Park are Office & Administration (2,380 | 13.1%), and Sales & Related (2,181 | 12.0%).
Sales and Office Occupations by Sex
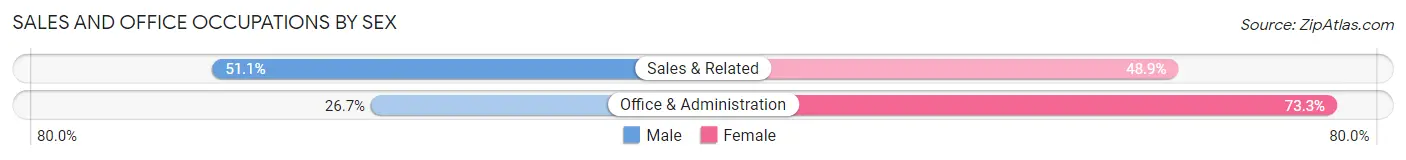
| Occupation | Male | Female |
| Sales & Related | 1,115 (51.1%) | 1,066 (48.9%) |
| Office & Administration | 636 (26.7%) | 1,744 (73.3%) |
| Total (Category) | 1,751 (38.4%) | 2,810 (61.6%) |
| Total (Overall) | 9,981 (54.7%) | 8,258 (45.3%) |
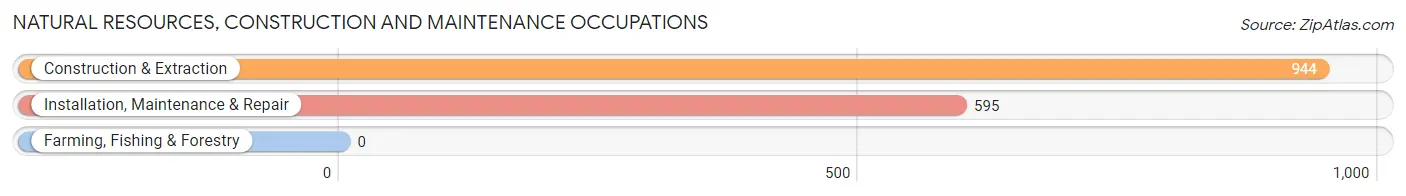
Natural Resources, Construction and Maintenance Occupations
The most common Natural Resources, Construction and Maintenance occupations in Hanover Park are Construction & Extraction (944 | 5.2%), and Installation, Maintenance & Repair (595 | 3.3%).
Natural Resources, Construction and Maintenance Occupations by Sex
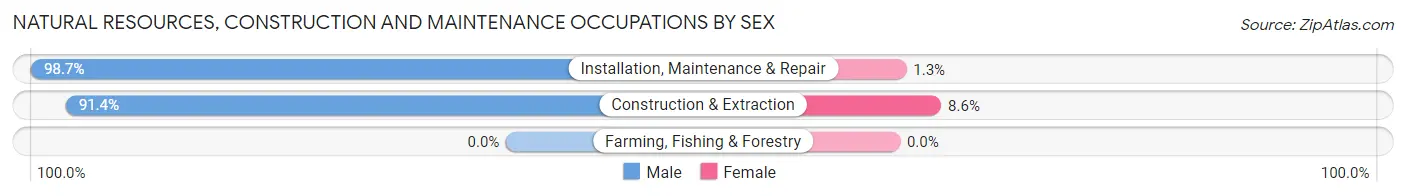
| Occupation | Male | Female |
| Farming, Fishing & Forestry | 0 (0.0%) | 0 (0.0%) |
| Construction & Extraction | 863 (91.4%) | 81 (8.6%) |
| Installation, Maintenance & Repair | 587 (98.7%) | 8 (1.3%) |
| Total (Category) | 1,450 (94.2%) | 89 (5.8%) |
| Total (Overall) | 9,981 (54.7%) | 8,258 (45.3%) |
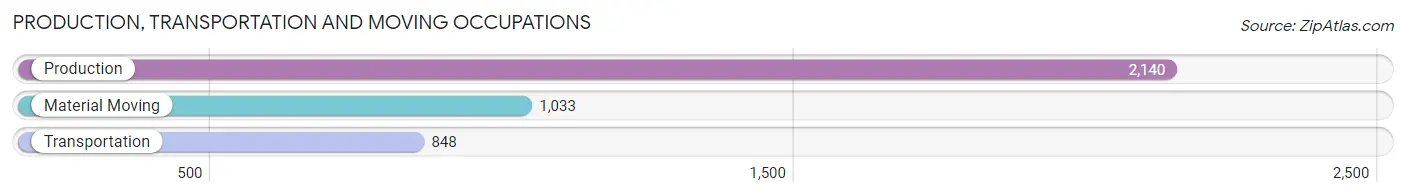
Production, Transportation and Moving Occupations
The most common Production, Transportation and Moving occupations in Hanover Park are Production (2,140 | 11.7%), Material Moving (1,033 | 5.7%), and Transportation (848 | 4.6%).
Production, Transportation and Moving Occupations by Sex
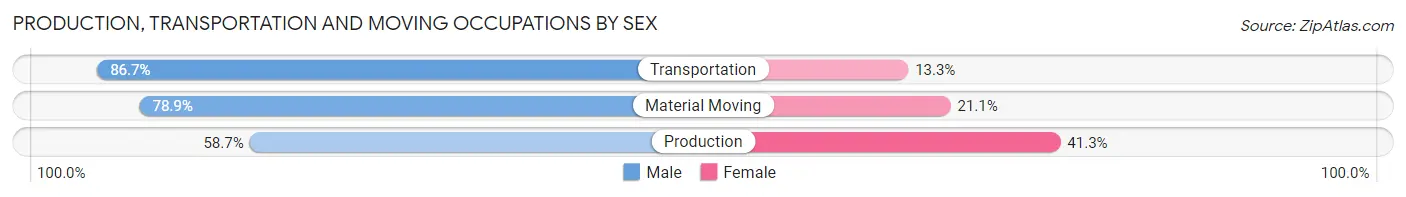
| Occupation | Male | Female |
| Production | 1,257 (58.7%) | 883 (41.3%) |
| Transportation | 735 (86.7%) | 113 (13.3%) |
| Material Moving | 815 (78.9%) | 218 (21.1%) |
| Total (Category) | 2,807 (69.8%) | 1,214 (30.2%) |
| Total (Overall) | 9,981 (54.7%) | 8,258 (45.3%) |
Employment Industries by Sex in Hanover Park
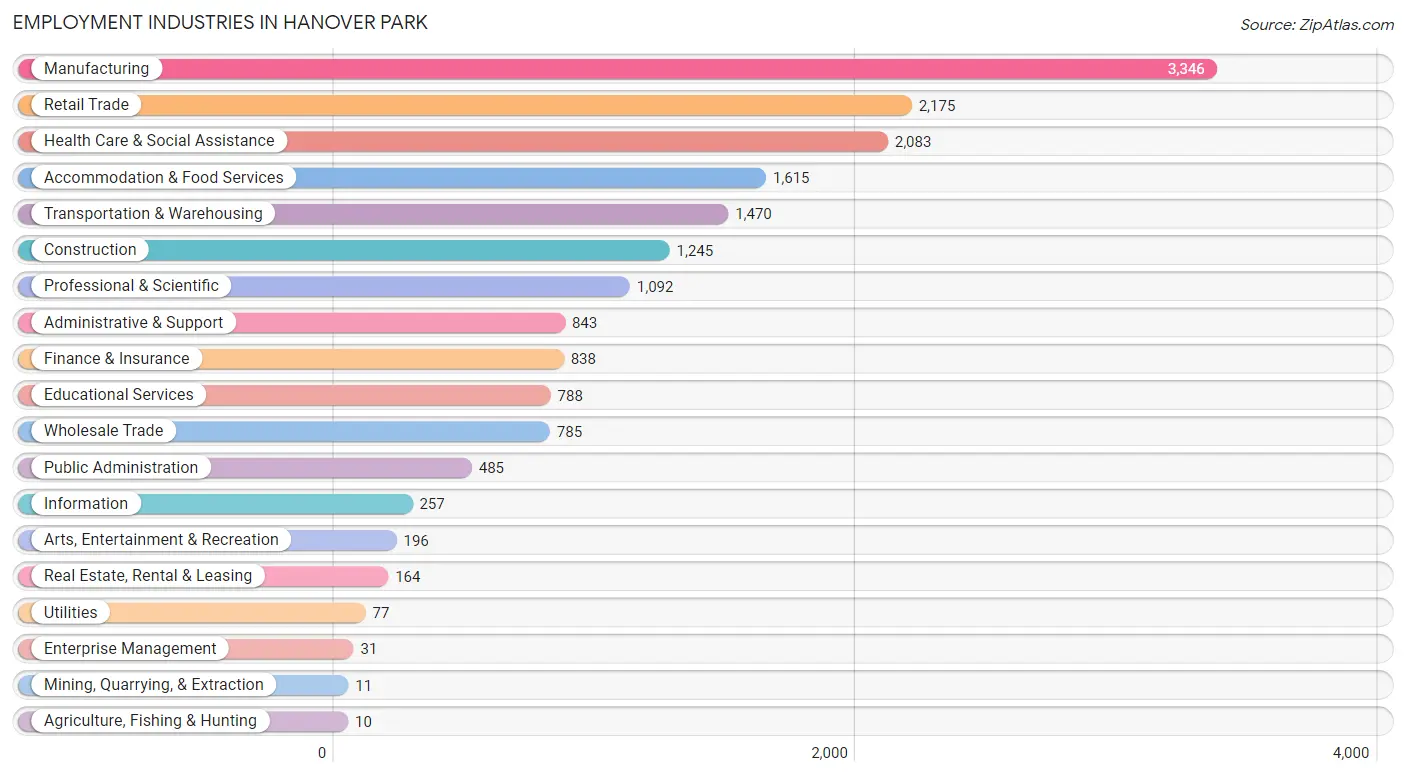
Employment Industries in Hanover Park
The major employment industries in Hanover Park include Manufacturing (3,346 | 18.3%), Retail Trade (2,175 | 11.9%), Health Care & Social Assistance (2,083 | 11.4%), Accommodation & Food Services (1,615 | 8.8%), and Transportation & Warehousing (1,470 | 8.1%).
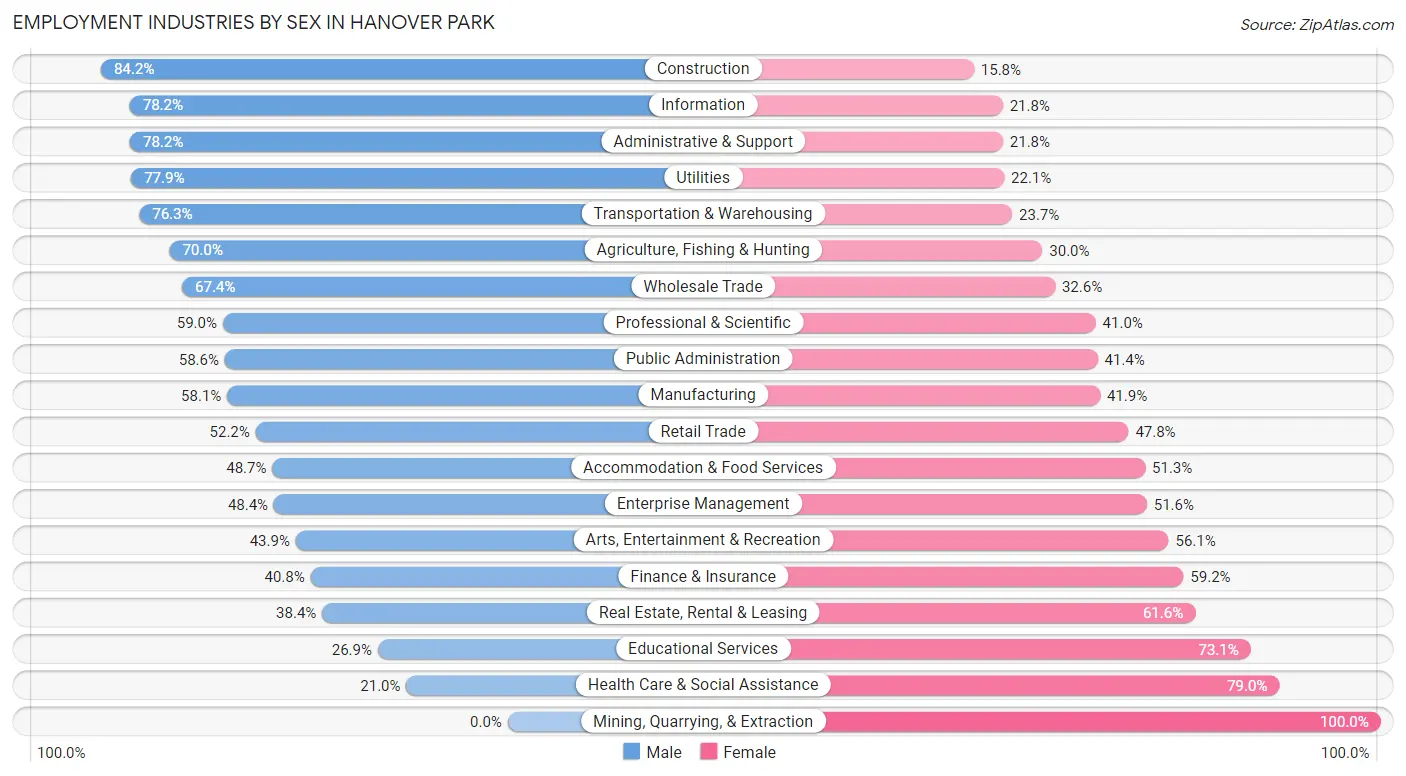
Employment Industries by Sex in Hanover Park
The Hanover Park industries that see more men than women are Construction (84.2%), Information (78.2%), and Administrative & Support (78.2%), whereas the industries that tend to have a higher number of women are Mining, Quarrying, & Extraction (100.0%), Health Care & Social Assistance (79.0%), and Educational Services (73.1%).
| Industry | Male | Female |
| Agriculture, Fishing & Hunting | 7 (70.0%) | 3 (30.0%) |
| Mining, Quarrying, & Extraction | 0 (0.0%) | 11 (100.0%) |
| Construction | 1,048 (84.2%) | 197 (15.8%) |
| Manufacturing | 1,943 (58.1%) | 1,403 (41.9%) |
| Wholesale Trade | 529 (67.4%) | 256 (32.6%) |
| Retail Trade | 1,135 (52.2%) | 1,040 (47.8%) |
| Transportation & Warehousing | 1,121 (76.3%) | 349 (23.7%) |
| Utilities | 60 (77.9%) | 17 (22.1%) |
| Information | 201 (78.2%) | 56 (21.8%) |
| Finance & Insurance | 342 (40.8%) | 496 (59.2%) |
| Real Estate, Rental & Leasing | 63 (38.4%) | 101 (61.6%) |
| Professional & Scientific | 644 (59.0%) | 448 (41.0%) |
| Enterprise Management | 15 (48.4%) | 16 (51.6%) |
| Administrative & Support | 659 (78.2%) | 184 (21.8%) |
| Educational Services | 212 (26.9%) | 576 (73.1%) |
| Health Care & Social Assistance | 437 (21.0%) | 1,646 (79.0%) |
| Arts, Entertainment & Recreation | 86 (43.9%) | 110 (56.1%) |
| Accommodation & Food Services | 787 (48.7%) | 828 (51.3%) |
| Public Administration | 284 (58.6%) | 201 (41.4%) |
| Total | 9,981 (54.7%) | 8,258 (45.3%) |
Education in Hanover Park
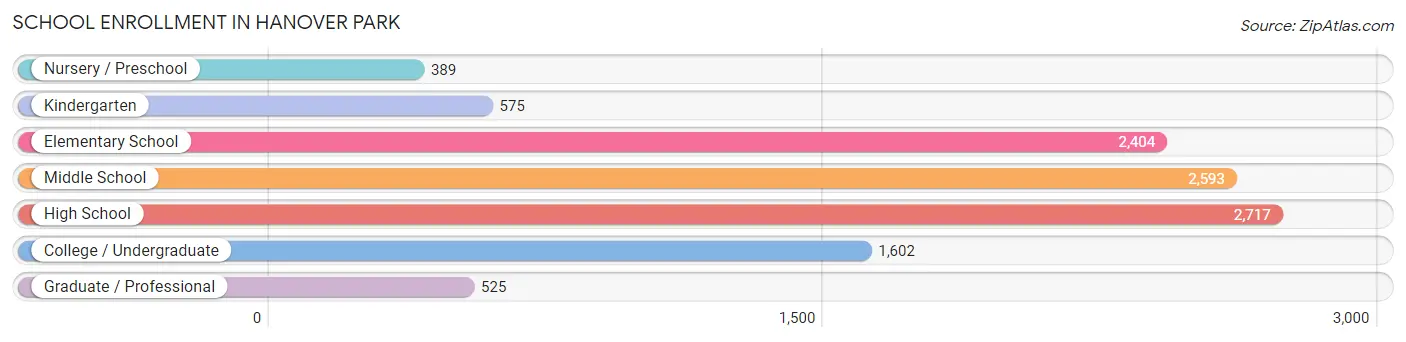
School Enrollment in Hanover Park
The most common levels of schooling among the 10,805 students in Hanover Park are high school (2,717 | 25.2%), middle school (2,593 | 24.0%), and elementary school (2,404 | 22.3%).
| School Level | # Students | % Students |
| Nursery / Preschool | 389 | 3.6% |
| Kindergarten | 575 | 5.3% |
| Elementary School | 2,404 | 22.3% |
| Middle School | 2,593 | 24.0% |
| High School | 2,717 | 25.2% |
| College / Undergraduate | 1,602 | 14.8% |
| Graduate / Professional | 525 | 4.9% |
| Total | 10,805 | 100.0% |
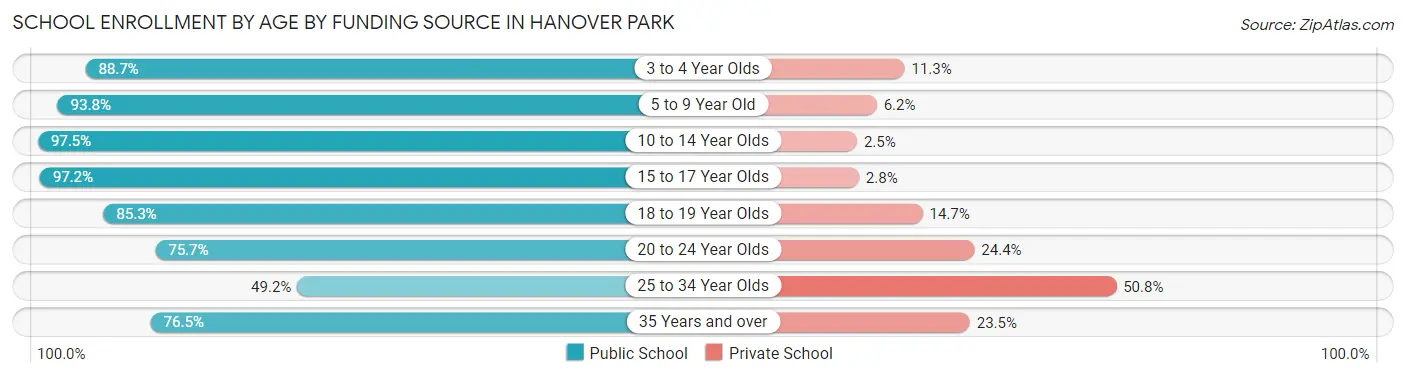
School Enrollment by Age by Funding Source in Hanover Park
Out of a total of 10,805 students who are enrolled in schools in Hanover Park, 1,048 (9.7%) attend a private institution, while the remaining 9,757 (90.3%) are enrolled in public schools. The age group of 25 to 34 year olds has the highest likelihood of being enrolled in private schools, with 295 (50.8% in the age bracket) enrolled. Conversely, the age group of 10 to 14 year olds has the lowest likelihood of being enrolled in a private school, with 3,231 (97.5% in the age bracket) attending a public institution.
| Age Bracket | Public School | Private School |
| 3 to 4 Year Olds | 258 (88.7%) | 33 (11.3%) |
| 5 to 9 Year Old | 2,409 (93.8%) | 158 (6.2%) |
| 10 to 14 Year Olds | 3,231 (97.5%) | 82 (2.5%) |
| 15 to 17 Year Olds | 1,951 (97.2%) | 57 (2.8%) |
| 18 to 19 Year Olds | 610 (85.3%) | 105 (14.7%) |
| 20 to 24 Year Olds | 668 (75.6%) | 215 (24.3%) |
| 25 to 34 Year Olds | 286 (49.2%) | 295 (50.8%) |
| 35 Years and over | 342 (76.5%) | 105 (23.5%) |
| Total | 9,757 (90.3%) | 1,048 (9.7%) |
Educational Attainment by Field of Study in Hanover Park
Business (1,824 | 26.2%), engineering (803 | 11.6%), science & technology (765 | 11.0%), computers & mathematics (597 | 8.6%), and education (550 | 7.9%) are the most common fields of study among 6,950 individuals in Hanover Park who have obtained a bachelor's degree or higher.
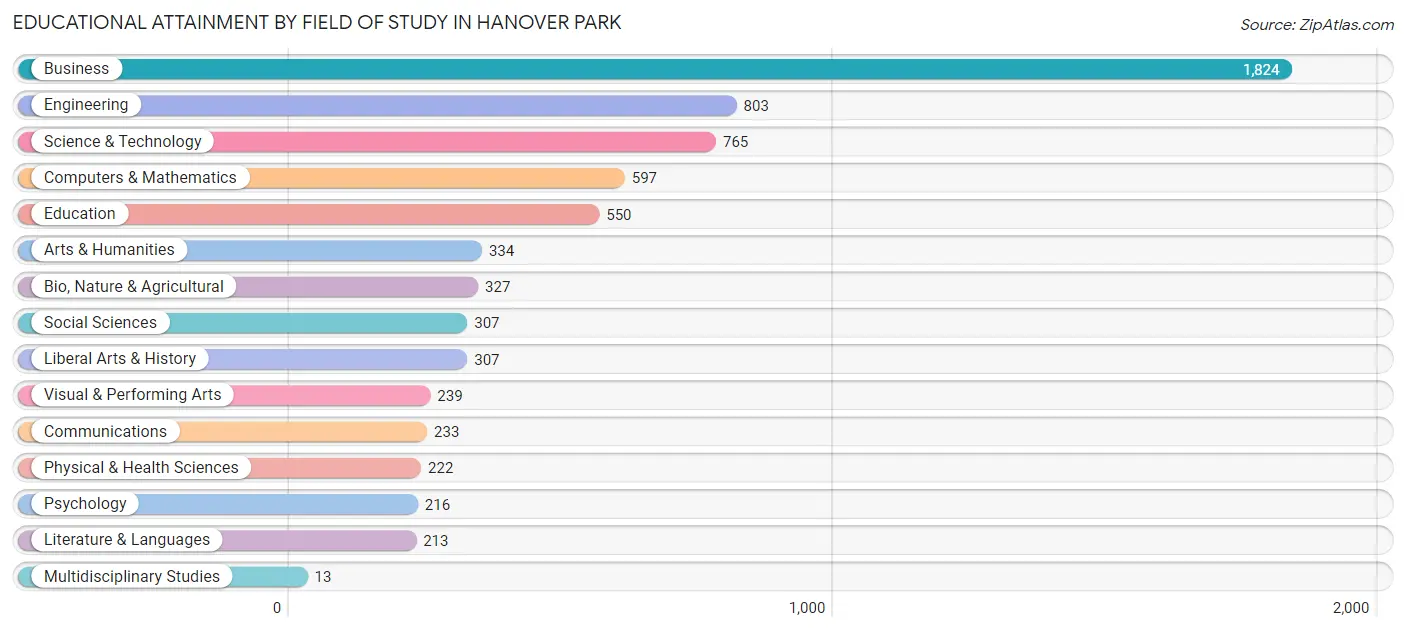
| Field of Study | # Graduates | % Graduates |
| Computers & Mathematics | 597 | 8.6% |
| Bio, Nature & Agricultural | 327 | 4.7% |
| Physical & Health Sciences | 222 | 3.2% |
| Psychology | 216 | 3.1% |
| Social Sciences | 307 | 4.4% |
| Engineering | 803 | 11.6% |
| Multidisciplinary Studies | 13 | 0.2% |
| Science & Technology | 765 | 11.0% |
| Business | 1,824 | 26.2% |
| Education | 550 | 7.9% |
| Literature & Languages | 213 | 3.1% |
| Liberal Arts & History | 307 | 4.4% |
| Visual & Performing Arts | 239 | 3.4% |
| Communications | 233 | 3.4% |
| Arts & Humanities | 334 | 4.8% |
| Total | 6,950 | 100.0% |
Transportation & Commute in Hanover Park
Vehicle Availability by Sex in Hanover Park
The most prevalent vehicle ownership categories in Hanover Park are males with 2 vehicles (3,940, accounting for 40.0%) and females with 2 vehicles (3,245, making up 48.9%).
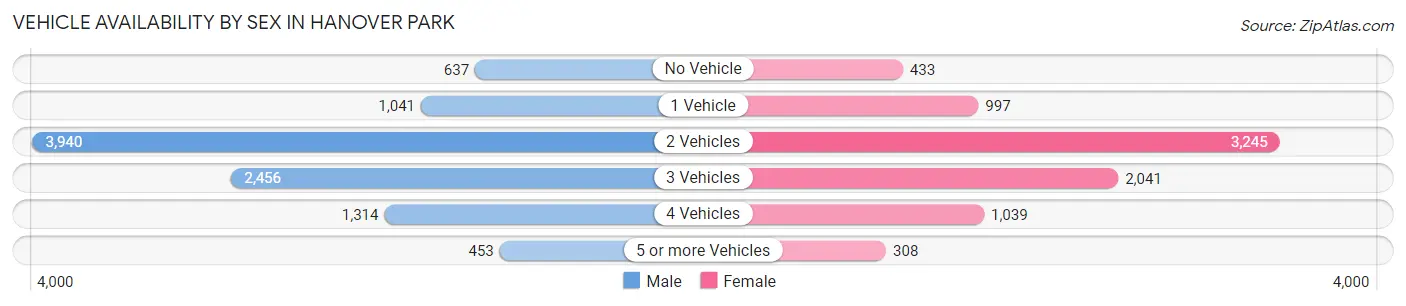
| Vehicles Available | Male | Female |
| No Vehicle | 637 (6.5%) | 433 (5.4%) |
| 1 Vehicle | 1,041 (10.6%) | 997 (12.4%) |
| 2 Vehicles | 3,940 (40.0%) | 3,245 (40.3%) |
| 3 Vehicles | 2,456 (25.0%) | 2,041 (25.3%) |
| 4 Vehicles | 1,314 (13.4%) | 1,039 (12.9%) |
| 5 or more Vehicles | 453 (4.6%) | 308 (3.8%) |
| Total | 9,841 (100.0%) | 8,063 (100.0%) |
Commute Time in Hanover Park
The most frequently occuring commute durations in Hanover Park are 30 to 34 minutes (3,114 commuters, 19.2%), 15 to 19 minutes (2,330 commuters, 14.3%), and 20 to 24 minutes (1,998 commuters, 12.3%).
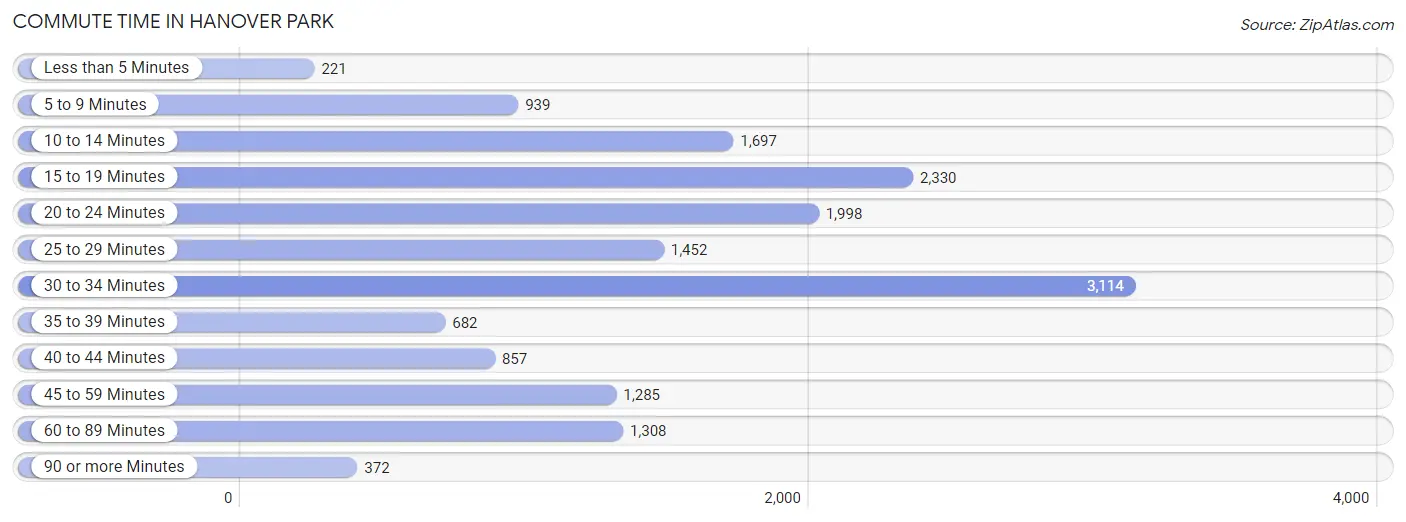
| Commute Time | # Commuters | % Commuters |
| Less than 5 Minutes | 221 | 1.4% |
| 5 to 9 Minutes | 939 | 5.8% |
| 10 to 14 Minutes | 1,697 | 10.4% |
| 15 to 19 Minutes | 2,330 | 14.3% |
| 20 to 24 Minutes | 1,998 | 12.3% |
| 25 to 29 Minutes | 1,452 | 8.9% |
| 30 to 34 Minutes | 3,114 | 19.2% |
| 35 to 39 Minutes | 682 | 4.2% |
| 40 to 44 Minutes | 857 | 5.3% |
| 45 to 59 Minutes | 1,285 | 7.9% |
| 60 to 89 Minutes | 1,308 | 8.1% |
| 90 or more Minutes | 372 | 2.3% |
Commute Time by Sex in Hanover Park
The most common commute times in Hanover Park are 30 to 34 minutes (1,644 commuters, 18.3%) for males and 30 to 34 minutes (1,470 commuters, 20.3%) for females.
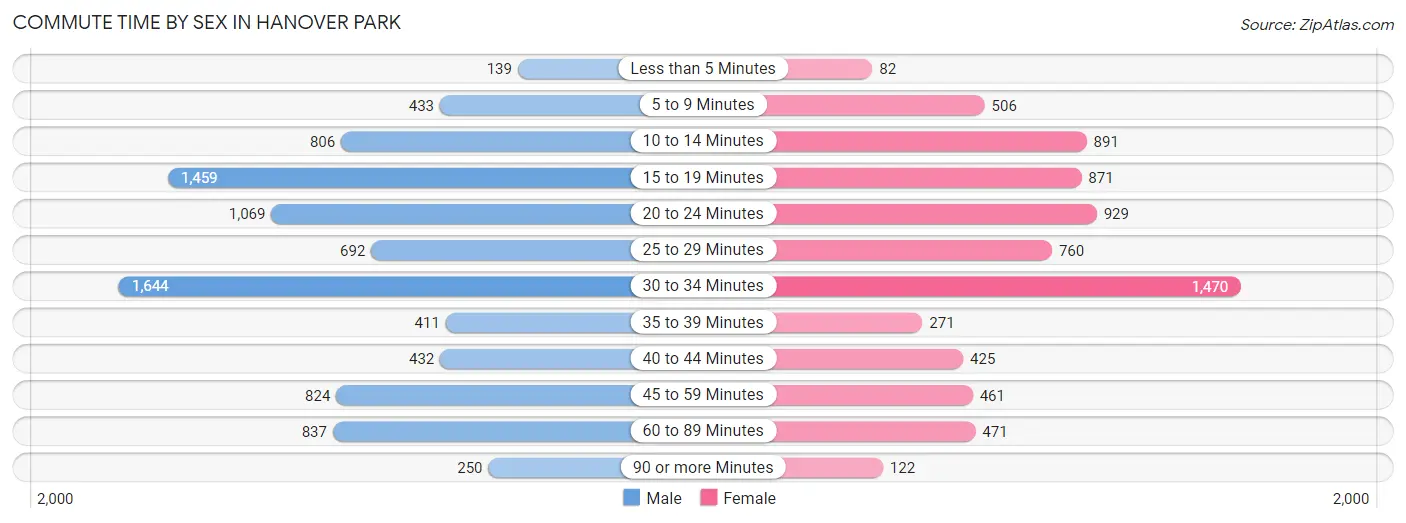
| Commute Time | Male | Female |
| Less than 5 Minutes | 139 (1.5%) | 82 (1.1%) |
| 5 to 9 Minutes | 433 (4.8%) | 506 (7.0%) |
| 10 to 14 Minutes | 806 (9.0%) | 891 (12.3%) |
| 15 to 19 Minutes | 1,459 (16.2%) | 871 (12.0%) |
| 20 to 24 Minutes | 1,069 (11.9%) | 929 (12.8%) |
| 25 to 29 Minutes | 692 (7.7%) | 760 (10.5%) |
| 30 to 34 Minutes | 1,644 (18.3%) | 1,470 (20.3%) |
| 35 to 39 Minutes | 411 (4.6%) | 271 (3.7%) |
| 40 to 44 Minutes | 432 (4.8%) | 425 (5.9%) |
| 45 to 59 Minutes | 824 (9.2%) | 461 (6.4%) |
| 60 to 89 Minutes | 837 (9.3%) | 471 (6.5%) |
| 90 or more Minutes | 250 (2.8%) | 122 (1.7%) |
Time of Departure to Work by Sex in Hanover Park
The most frequent times of departure to work in Hanover Park are 7:00 AM to 7:29 AM (1,443, 16.0%) for males and 6:30 AM to 6:59 AM (988, 13.6%) for females.
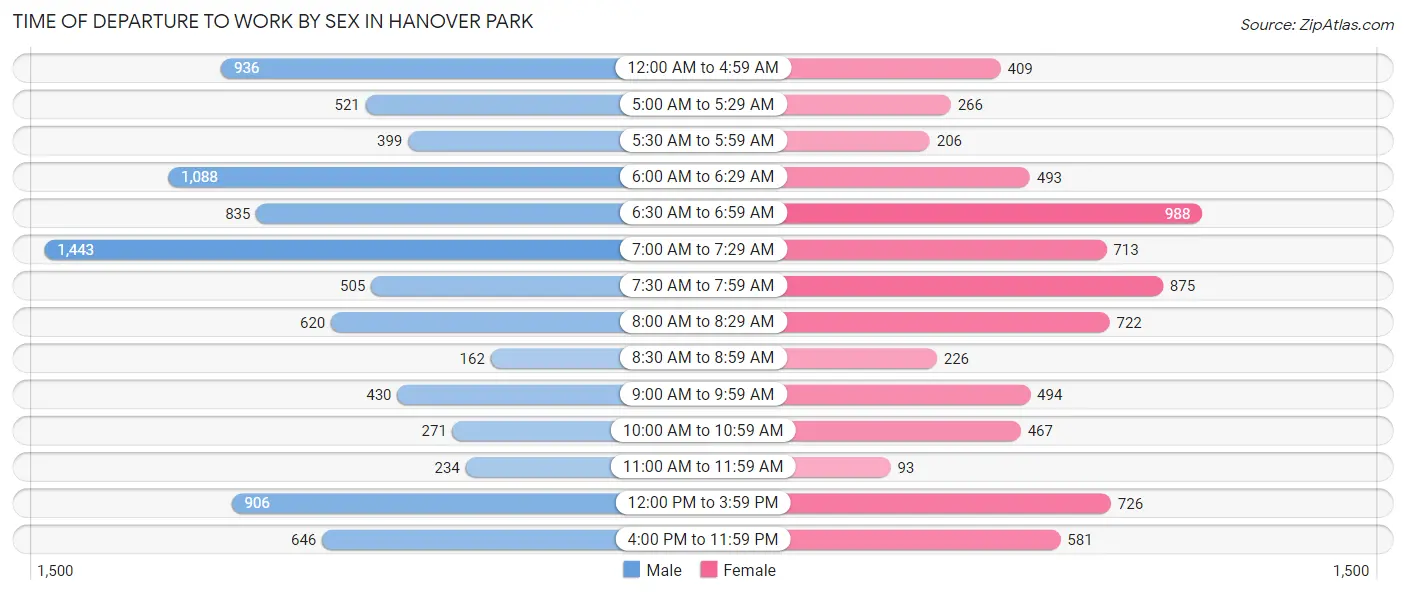
| Time of Departure | Male | Female |
| 12:00 AM to 4:59 AM | 936 (10.4%) | 409 (5.6%) |
| 5:00 AM to 5:29 AM | 521 (5.8%) | 266 (3.7%) |
| 5:30 AM to 5:59 AM | 399 (4.4%) | 206 (2.8%) |
| 6:00 AM to 6:29 AM | 1,088 (12.1%) | 493 (6.8%) |
| 6:30 AM to 6:59 AM | 835 (9.3%) | 988 (13.6%) |
| 7:00 AM to 7:29 AM | 1,443 (16.0%) | 713 (9.8%) |
| 7:30 AM to 7:59 AM | 505 (5.6%) | 875 (12.0%) |
| 8:00 AM to 8:29 AM | 620 (6.9%) | 722 (10.0%) |
| 8:30 AM to 8:59 AM | 162 (1.8%) | 226 (3.1%) |
| 9:00 AM to 9:59 AM | 430 (4.8%) | 494 (6.8%) |
| 10:00 AM to 10:59 AM | 271 (3.0%) | 467 (6.4%) |
| 11:00 AM to 11:59 AM | 234 (2.6%) | 93 (1.3%) |
| 12:00 PM to 3:59 PM | 906 (10.1%) | 726 (10.0%) |
| 4:00 PM to 11:59 PM | 646 (7.2%) | 581 (8.0%) |
| Total | 8,996 (100.0%) | 7,259 (100.0%) |
Housing Occupancy in Hanover Park
Occupancy by Ownership in Hanover Park
Of the total 11,113 dwellings in Hanover Park, owner-occupied units account for 8,361 (75.2%), while renter-occupied units make up 2,752 (24.8%).
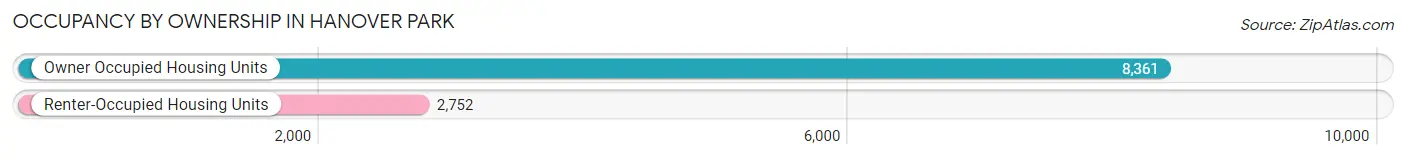
| Occupancy | # Housing Units | % Housing Units |
| Owner Occupied Housing Units | 8,361 | 75.2% |
| Renter-Occupied Housing Units | 2,752 | 24.8% |
| Total Occupied Housing Units | 11,113 | 100.0% |
Occupancy by Household Size in Hanover Park
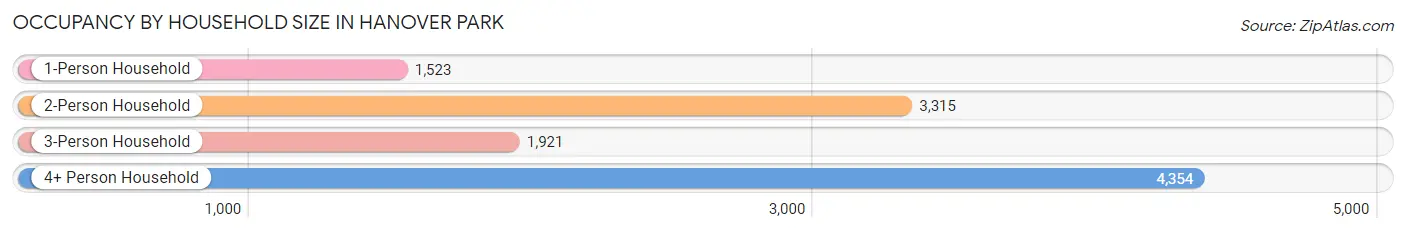
| Household Size | # Housing Units | % Housing Units |
| 1-Person Household | 1,523 | 13.7% |
| 2-Person Household | 3,315 | 29.8% |
| 3-Person Household | 1,921 | 17.3% |
| 4+ Person Household | 4,354 | 39.2% |
| Total Housing Units | 11,113 | 100.0% |
Occupancy by Ownership by Household Size in Hanover Park
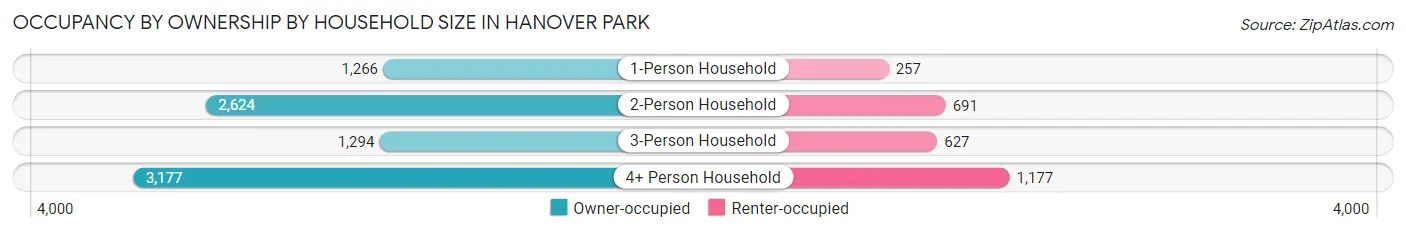
| Household Size | Owner-occupied | Renter-occupied |
| 1-Person Household | 1,266 (83.1%) | 257 (16.9%) |
| 2-Person Household | 2,624 (79.2%) | 691 (20.8%) |
| 3-Person Household | 1,294 (67.4%) | 627 (32.6%) |
| 4+ Person Household | 3,177 (73.0%) | 1,177 (27.0%) |
| Total Housing Units | 8,361 (75.2%) | 2,752 (24.8%) |
Occupancy by Educational Attainment in Hanover Park
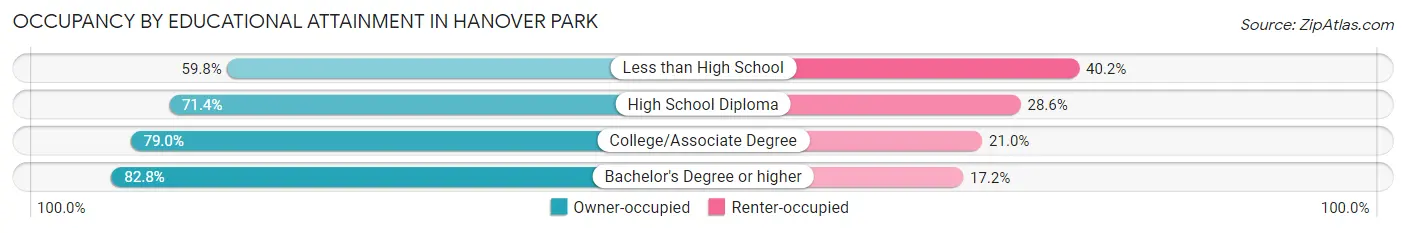
| Household Size | Owner-occupied | Renter-occupied |
| Less than High School | 983 (59.8%) | 662 (40.2%) |
| High School Diploma | 2,121 (71.4%) | 851 (28.6%) |
| College/Associate Degree | 2,512 (79.0%) | 668 (21.0%) |
| Bachelor's Degree or higher | 2,745 (82.8%) | 571 (17.2%) |
Occupancy by Age of Householder in Hanover Park
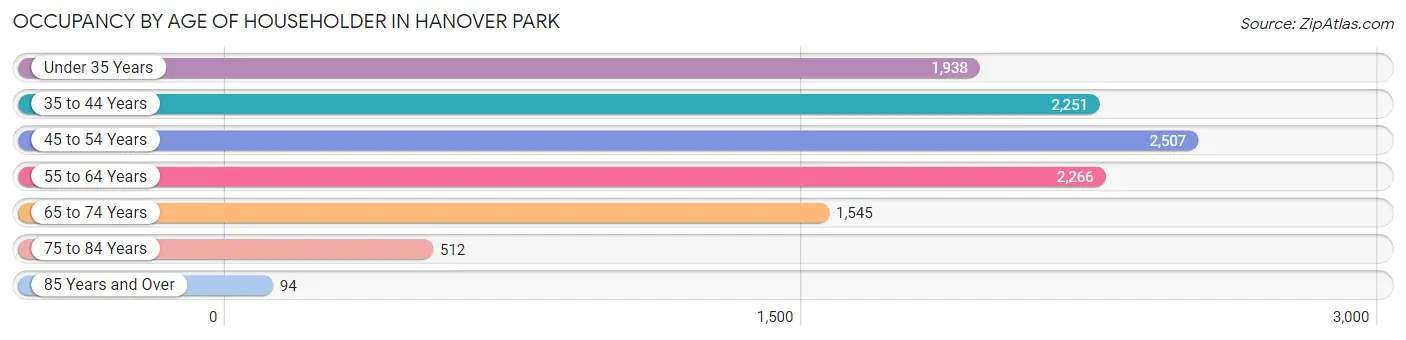
| Age Bracket | # Households | % Households |
| Under 35 Years | 1,938 | 17.4% |
| 35 to 44 Years | 2,251 | 20.3% |
| 45 to 54 Years | 2,507 | 22.6% |
| 55 to 64 Years | 2,266 | 20.4% |
| 65 to 74 Years | 1,545 | 13.9% |
| 75 to 84 Years | 512 | 4.6% |
| 85 Years and Over | 94 | 0.9% |
| Total | 11,113 | 100.0% |
Housing Finances in Hanover Park
Median Income by Occupancy in Hanover Park
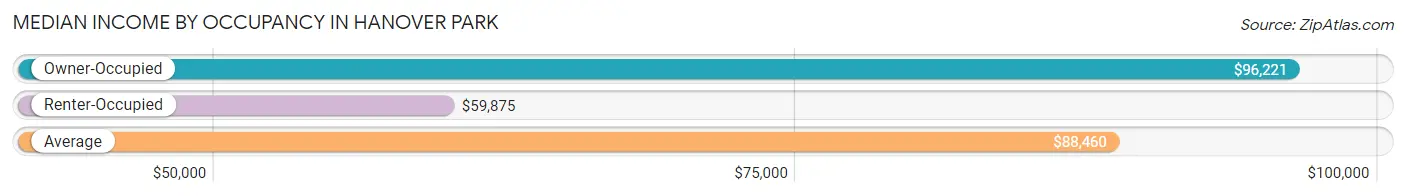
| Occupancy Type | # Households | Median Income |
| Owner-Occupied | 8,361 (75.2%) | $96,221 |
| Renter-Occupied | 2,752 (24.8%) | $59,875 |
| Average | 11,113 (100.0%) | $88,460 |
Occupancy by Householder Income Bracket in Hanover Park
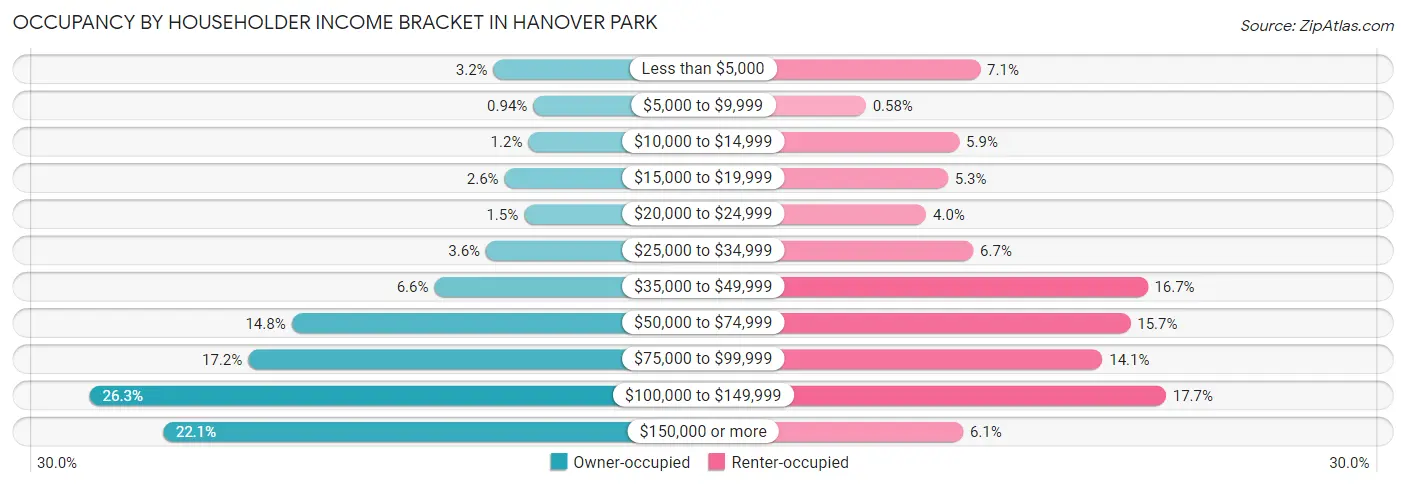
| Income Bracket | Owner-occupied | Renter-occupied |
| Less than $5,000 | 268 (3.2%) | 196 (7.1%) |
| $5,000 to $9,999 | 79 (0.9%) | 16 (0.6%) |
| $10,000 to $14,999 | 102 (1.2%) | 163 (5.9%) |
| $15,000 to $19,999 | 216 (2.6%) | 145 (5.3%) |
| $20,000 to $24,999 | 122 (1.5%) | 111 (4.0%) |
| $25,000 to $34,999 | 304 (3.6%) | 185 (6.7%) |
| $35,000 to $49,999 | 551 (6.6%) | 459 (16.7%) |
| $50,000 to $74,999 | 1,233 (14.7%) | 432 (15.7%) |
| $75,000 to $99,999 | 1,441 (17.2%) | 388 (14.1%) |
| $100,000 to $149,999 | 2,197 (26.3%) | 488 (17.7%) |
| $150,000 or more | 1,848 (22.1%) | 169 (6.1%) |
| Total | 8,361 (100.0%) | 2,752 (100.0%) |
Monthly Housing Cost Tiers in Hanover Park
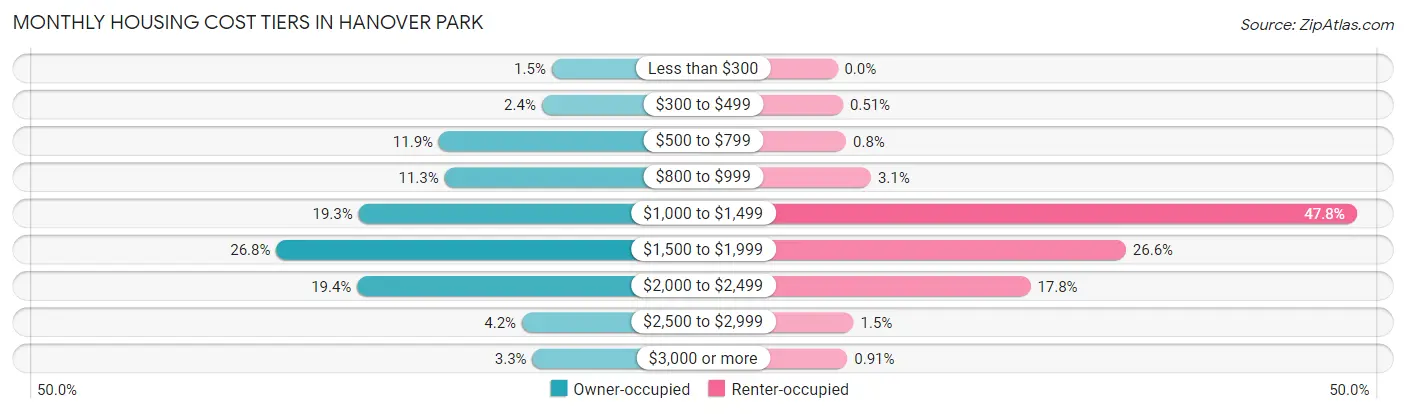
| Monthly Cost | Owner-occupied | Renter-occupied |
| Less than $300 | 123 (1.5%) | 0 (0.0%) |
| $300 to $499 | 200 (2.4%) | 14 (0.5%) |
| $500 to $799 | 992 (11.9%) | 22 (0.8%) |
| $800 to $999 | 948 (11.3%) | 85 (3.1%) |
| $1,000 to $1,499 | 1,610 (19.3%) | 1,315 (47.8%) |
| $1,500 to $1,999 | 2,243 (26.8%) | 731 (26.6%) |
| $2,000 to $2,499 | 1,620 (19.4%) | 489 (17.8%) |
| $2,500 to $2,999 | 353 (4.2%) | 41 (1.5%) |
| $3,000 or more | 272 (3.3%) | 25 (0.9%) |
| Total | 8,361 (100.0%) | 2,752 (100.0%) |
Physical Housing Characteristics in Hanover Park
Housing Structures in Hanover Park
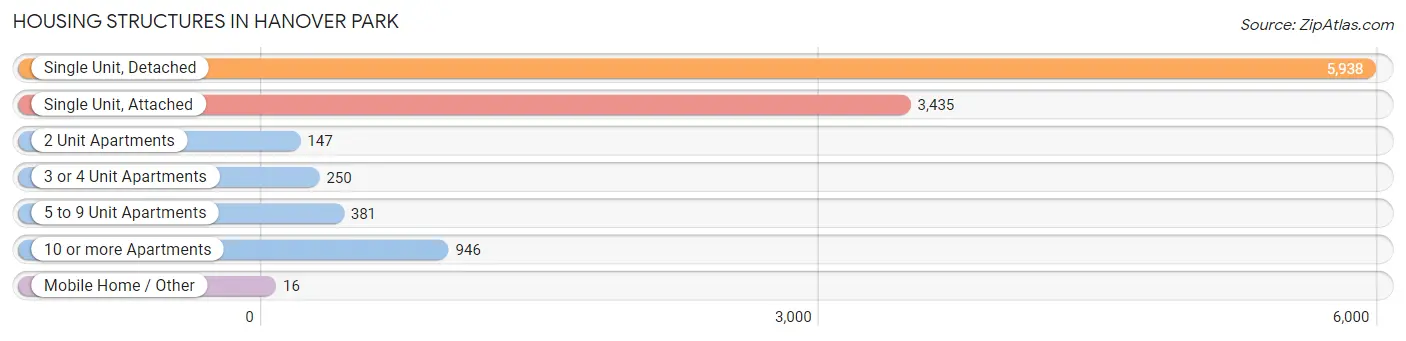
| Structure Type | # Housing Units | % Housing Units |
| Single Unit, Detached | 5,938 | 53.4% |
| Single Unit, Attached | 3,435 | 30.9% |
| 2 Unit Apartments | 147 | 1.3% |
| 3 or 4 Unit Apartments | 250 | 2.2% |
| 5 to 9 Unit Apartments | 381 | 3.4% |
| 10 or more Apartments | 946 | 8.5% |
| Mobile Home / Other | 16 | 0.1% |
| Total | 11,113 | 100.0% |
Housing Structures by Occupancy in Hanover Park
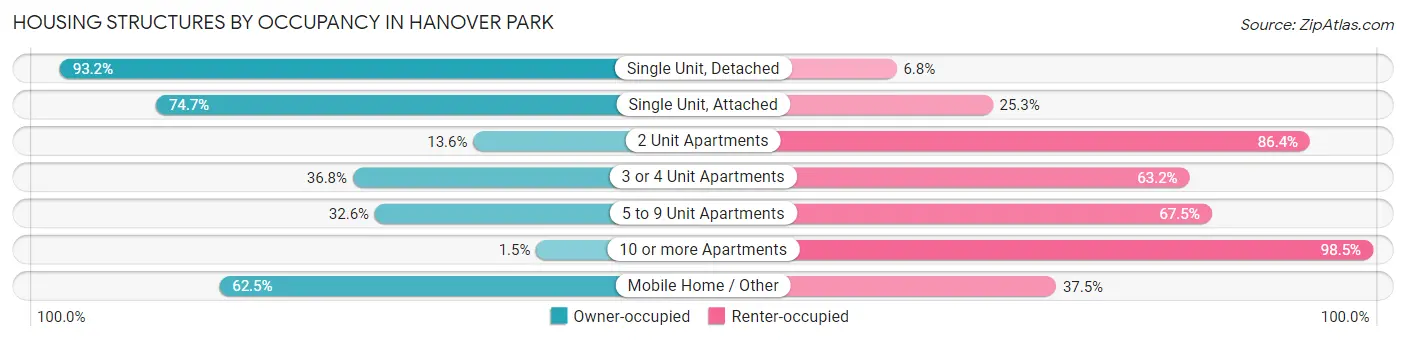
| Structure Type | Owner-occupied | Renter-occupied |
| Single Unit, Detached | 5,535 (93.2%) | 403 (6.8%) |
| Single Unit, Attached | 2,566 (74.7%) | 869 (25.3%) |
| 2 Unit Apartments | 20 (13.6%) | 127 (86.4%) |
| 3 or 4 Unit Apartments | 92 (36.8%) | 158 (63.2%) |
| 5 to 9 Unit Apartments | 124 (32.6%) | 257 (67.4%) |
| 10 or more Apartments | 14 (1.5%) | 932 (98.5%) |
| Mobile Home / Other | 10 (62.5%) | 6 (37.5%) |
| Total | 8,361 (75.2%) | 2,752 (24.8%) |
Housing Structures by Number of Rooms in Hanover Park
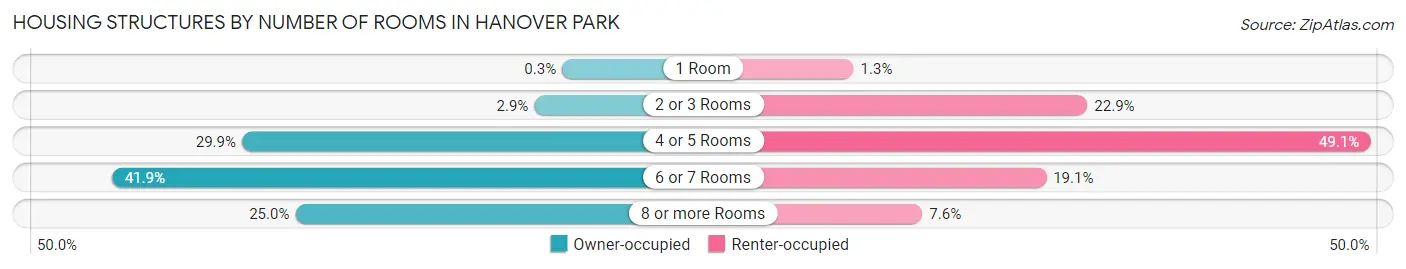
| Number of Rooms | Owner-occupied | Renter-occupied |
| 1 Room | 25 (0.3%) | 35 (1.3%) |
| 2 or 3 Rooms | 240 (2.9%) | 630 (22.9%) |
| 4 or 5 Rooms | 2,501 (29.9%) | 1,352 (49.1%) |
| 6 or 7 Rooms | 3,507 (41.9%) | 525 (19.1%) |
| 8 or more Rooms | 2,088 (25.0%) | 210 (7.6%) |
| Total | 8,361 (100.0%) | 2,752 (100.0%) |
Housing Structure by Heating Type in Hanover Park
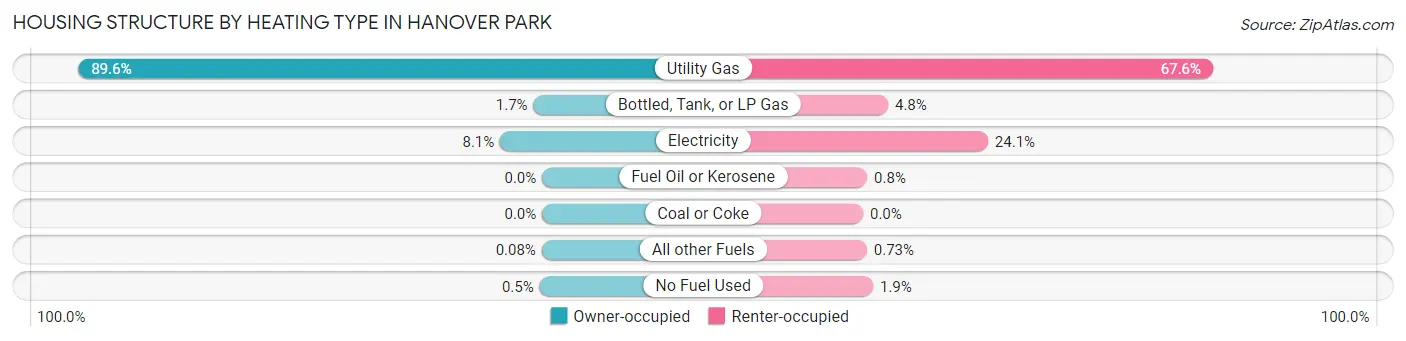
| Heating Type | Owner-occupied | Renter-occupied |
| Utility Gas | 7,494 (89.6%) | 1,860 (67.6%) |
| Bottled, Tank, or LP Gas | 140 (1.7%) | 133 (4.8%) |
| Electricity | 678 (8.1%) | 664 (24.1%) |
| Fuel Oil or Kerosene | 0 (0.0%) | 22 (0.8%) |
| Coal or Coke | 0 (0.0%) | 0 (0.0%) |
| All other Fuels | 7 (0.1%) | 20 (0.7%) |
| No Fuel Used | 42 (0.5%) | 53 (1.9%) |
| Total | 8,361 (100.0%) | 2,752 (100.0%) |
Household Vehicle Usage in Hanover Park
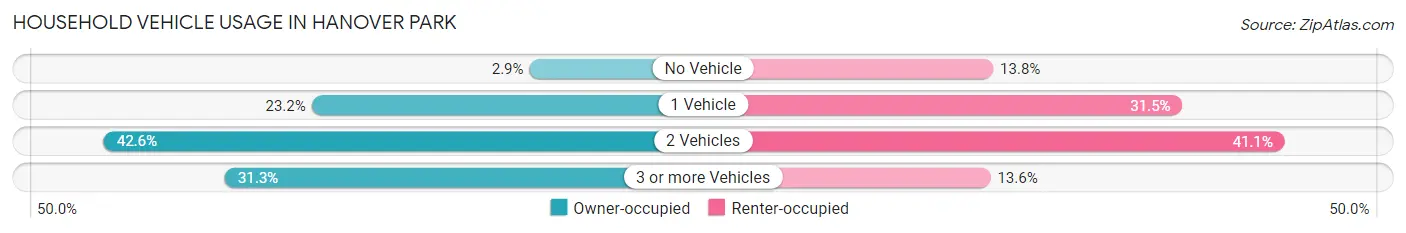
| Vehicles per Household | Owner-occupied | Renter-occupied |
| No Vehicle | 241 (2.9%) | 381 (13.8%) |
| 1 Vehicle | 1,941 (23.2%) | 867 (31.5%) |
| 2 Vehicles | 3,562 (42.6%) | 1,130 (41.1%) |
| 3 or more Vehicles | 2,617 (31.3%) | 374 (13.6%) |
| Total | 8,361 (100.0%) | 2,752 (100.0%) |
Real Estate & Mortgages in Hanover Park
Real Estate and Mortgage Overview in Hanover Park
| Characteristic | Without Mortgage | With Mortgage |
| Housing Units | 2,369 | 5,992 |
| Median Property Value | $260,900 | $241,300 |
| Median Household Income | $78,512 | $1,491 |
| Monthly Housing Costs | $820 | $260 |
| Real Estate Taxes | $5,979 | $222 |
Property Value by Mortgage Status in Hanover Park
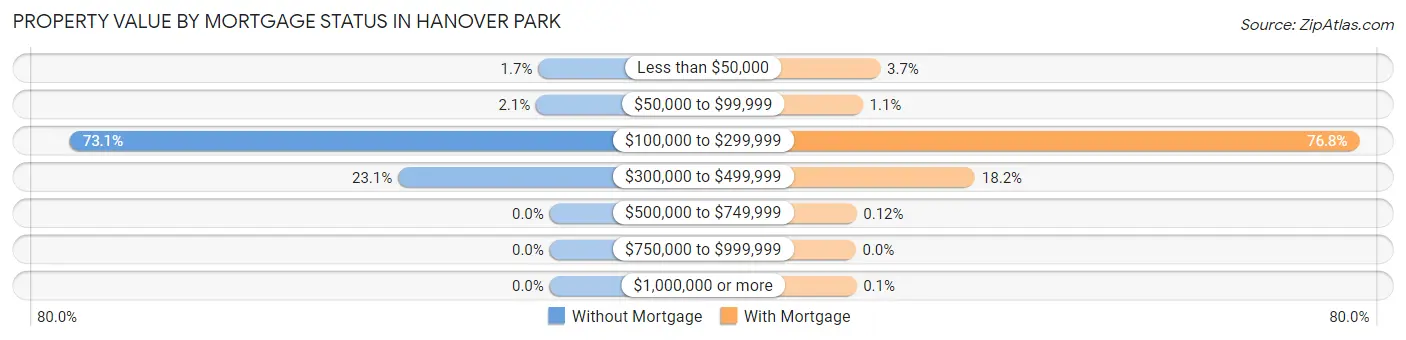
| Property Value | Without Mortgage | With Mortgage |
| Less than $50,000 | 41 (1.7%) | 224 (3.7%) |
| $50,000 to $99,999 | 49 (2.1%) | 65 (1.1%) |
| $100,000 to $299,999 | 1,732 (73.1%) | 4,600 (76.8%) |
| $300,000 to $499,999 | 547 (23.1%) | 1,090 (18.2%) |
| $500,000 to $749,999 | 0 (0.0%) | 7 (0.1%) |
| $750,000 to $999,999 | 0 (0.0%) | 0 (0.0%) |
| $1,000,000 or more | 0 (0.0%) | 6 (0.1%) |
| Total | 2,369 (100.0%) | 5,992 (100.0%) |
Household Income by Mortgage Status in Hanover Park
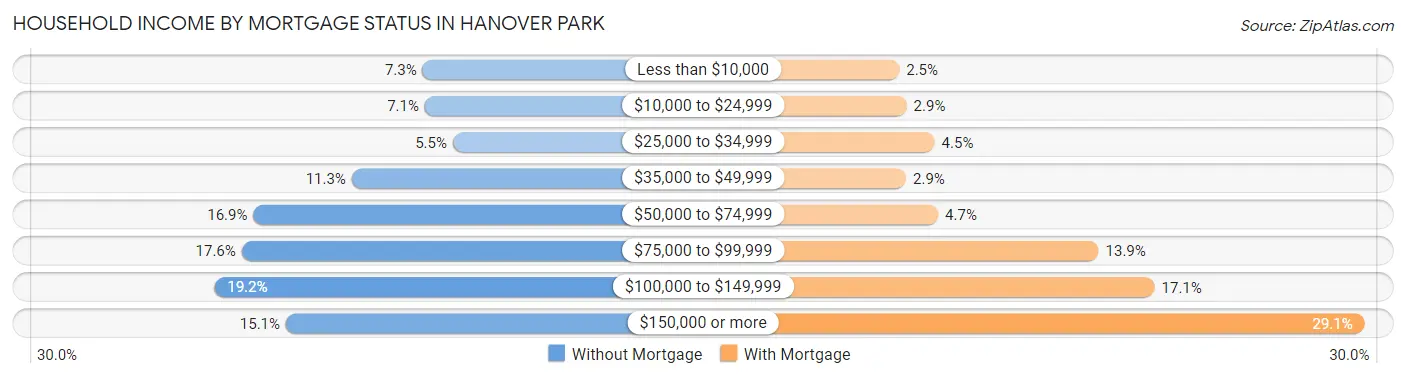
| Household Income | Without Mortgage | With Mortgage |
| Less than $10,000 | 172 (7.3%) | 150 (2.5%) |
| $10,000 to $24,999 | 169 (7.1%) | 175 (2.9%) |
| $25,000 to $34,999 | 131 (5.5%) | 271 (4.5%) |
| $35,000 to $49,999 | 268 (11.3%) | 173 (2.9%) |
| $50,000 to $74,999 | 401 (16.9%) | 283 (4.7%) |
| $75,000 to $99,999 | 417 (17.6%) | 832 (13.9%) |
| $100,000 to $149,999 | 454 (19.2%) | 1,024 (17.1%) |
| $150,000 or more | 357 (15.1%) | 1,743 (29.1%) |
| Total | 2,369 (100.0%) | 5,992 (100.0%) |
Property Value to Household Income Ratio in Hanover Park
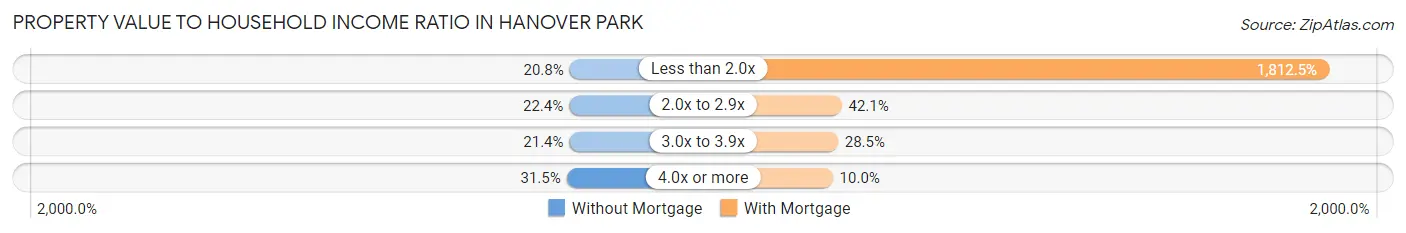
| Value-to-Income Ratio | Without Mortgage | With Mortgage |
| Less than 2.0x | 492 (20.8%) | 108,602 (1,812.5%) |
| 2.0x to 2.9x | 530 (22.4%) | 2,524 (42.1%) |
| 3.0x to 3.9x | 507 (21.4%) | 1,706 (28.5%) |
| 4.0x or more | 747 (31.5%) | 597 (10.0%) |
| Total | 2,369 (100.0%) | 5,992 (100.0%) |
Real Estate Taxes by Mortgage Status in Hanover Park
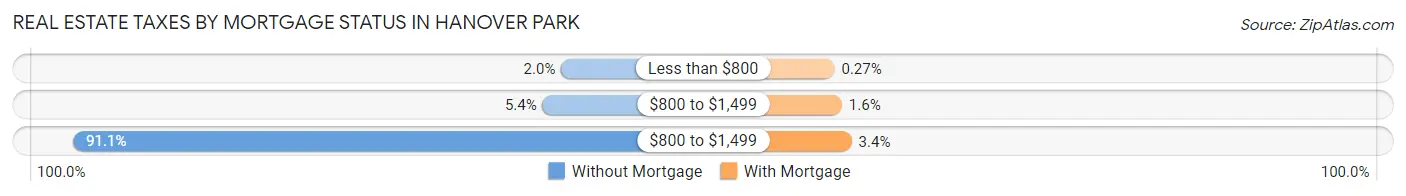
| Property Taxes | Without Mortgage | With Mortgage |
| Less than $800 | 47 (2.0%) | 16 (0.3%) |
| $800 to $1,499 | 128 (5.4%) | 97 (1.6%) |
| $800 to $1,499 | 2,159 (91.1%) | 204 (3.4%) |
| Total | 2,369 (100.0%) | 5,992 (100.0%) |
Health & Disability in Hanover Park
Health Insurance Coverage by Age in Hanover Park
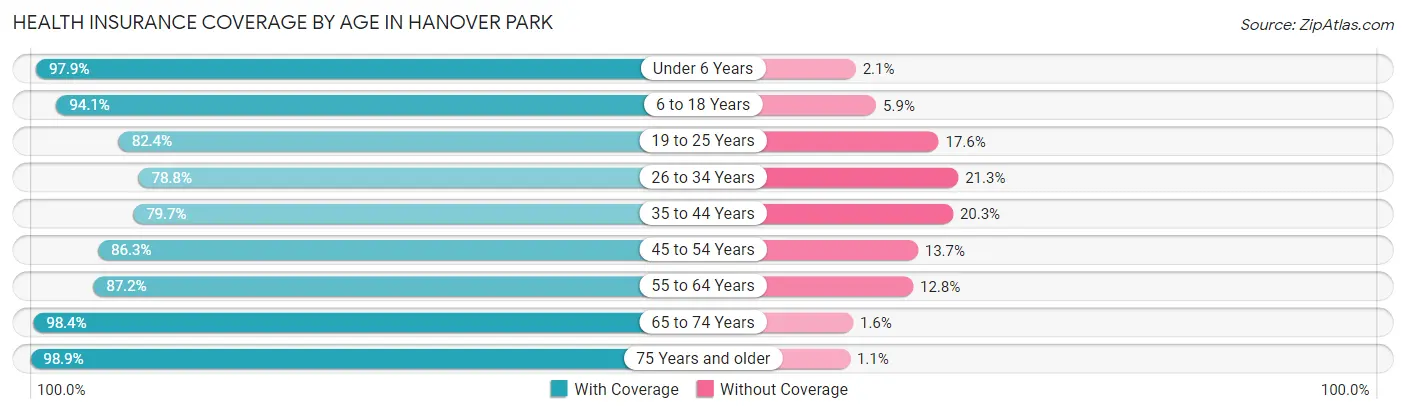
| Age Bracket | With Coverage | Without Coverage |
| Under 6 Years | 2,430 (97.9%) | 53 (2.1%) |
| 6 to 18 Years | 7,817 (94.1%) | 494 (5.9%) |
| 19 to 25 Years | 2,499 (82.4%) | 533 (17.6%) |
| 26 to 34 Years | 3,850 (78.7%) | 1,039 (21.2%) |
| 35 to 44 Years | 4,125 (79.7%) | 1,048 (20.3%) |
| 45 to 54 Years | 3,805 (86.3%) | 604 (13.7%) |
| 55 to 64 Years | 4,020 (87.2%) | 591 (12.8%) |
| 65 to 74 Years | 2,831 (98.4%) | 47 (1.6%) |
| 75 Years and older | 1,394 (98.9%) | 15 (1.1%) |
| Total | 32,771 (88.1%) | 4,424 (11.9%) |
Health Insurance Coverage by Citizenship Status in Hanover Park
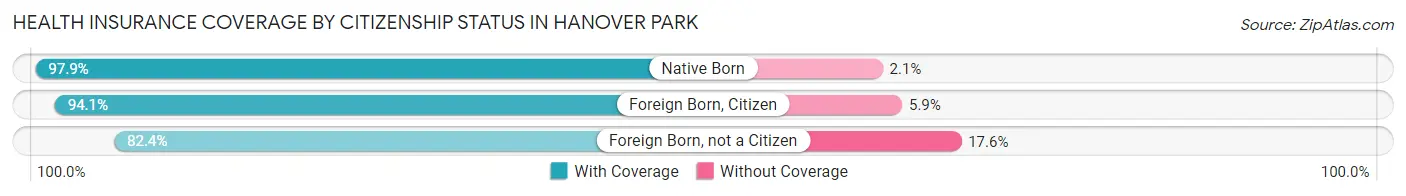
| Citizenship Status | With Coverage | Without Coverage |
| Native Born | 2,430 (97.9%) | 53 (2.1%) |
| Foreign Born, Citizen | 7,817 (94.1%) | 494 (5.9%) |
| Foreign Born, not a Citizen | 2,499 (82.4%) | 533 (17.6%) |
Health Insurance Coverage by Household Income in Hanover Park
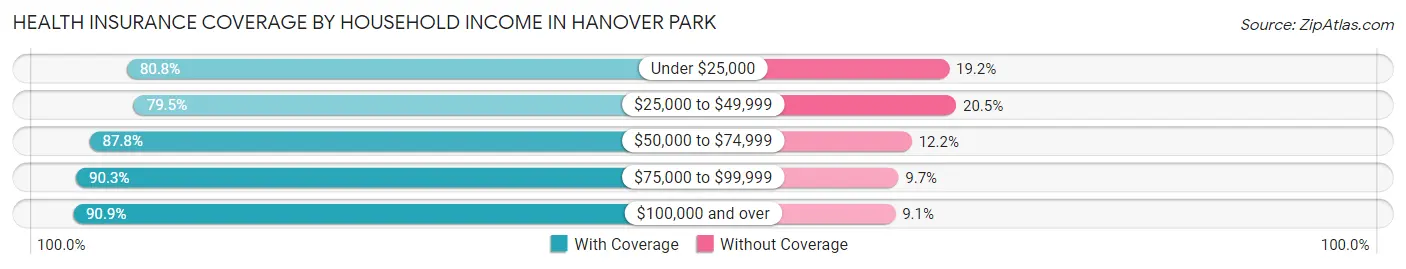
| Household Income | With Coverage | Without Coverage |
| Under $25,000 | 3,119 (80.8%) | 739 (19.2%) |
| $25,000 to $49,999 | 3,317 (79.5%) | 854 (20.5%) |
| $50,000 to $74,999 | 4,200 (87.8%) | 582 (12.2%) |
| $75,000 to $99,999 | 5,590 (90.3%) | 598 (9.7%) |
| $100,000 and over | 16,534 (90.9%) | 1,649 (9.1%) |
Public vs Private Health Insurance Coverage by Age in Hanover Park
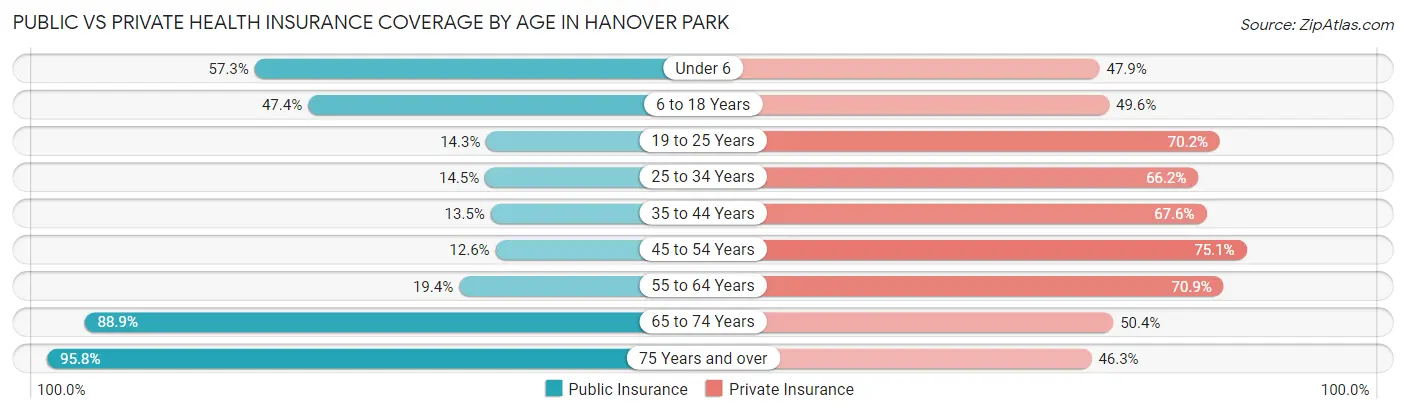
| Age Bracket | Public Insurance | Private Insurance |
| Under 6 | 1,423 (57.3%) | 1,188 (47.8%) |
| 6 to 18 Years | 3,939 (47.4%) | 4,123 (49.6%) |
| 19 to 25 Years | 434 (14.3%) | 2,128 (70.2%) |
| 25 to 34 Years | 711 (14.5%) | 3,234 (66.1%) |
| 35 to 44 Years | 698 (13.5%) | 3,499 (67.6%) |
| 45 to 54 Years | 556 (12.6%) | 3,311 (75.1%) |
| 55 to 64 Years | 893 (19.4%) | 3,268 (70.9%) |
| 65 to 74 Years | 2,558 (88.9%) | 1,450 (50.4%) |
| 75 Years and over | 1,350 (95.8%) | 653 (46.3%) |
| Total | 12,562 (33.8%) | 22,854 (61.4%) |
Disability Status by Sex by Age in Hanover Park
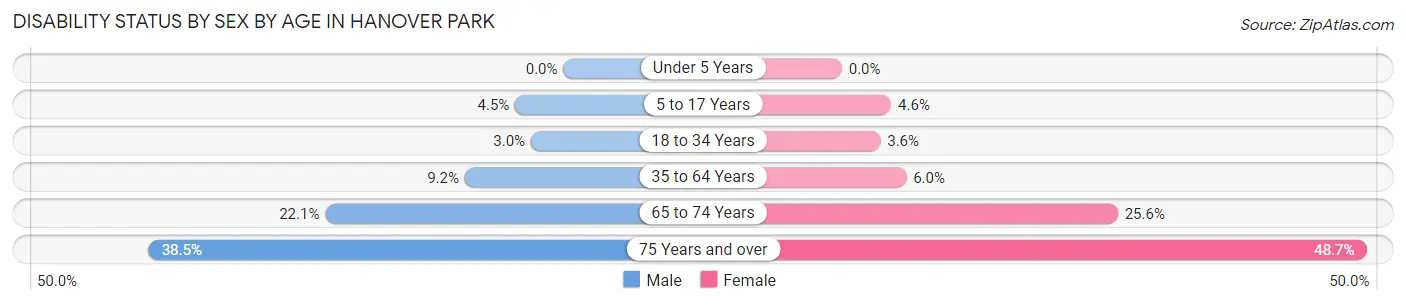
| Age Bracket | Male | Female |
| Under 5 Years | 0 (0.0%) | 0 (0.0%) |
| 5 to 17 Years | 170 (4.5%) | 195 (4.6%) |
| 18 to 34 Years | 134 (3.0%) | 144 (3.6%) |
| 35 to 64 Years | 644 (9.1%) | 428 (6.0%) |
| 65 to 74 Years | 309 (22.1%) | 379 (25.6%) |
| 75 Years and over | 207 (38.5%) | 424 (48.7%) |
Disability Class by Sex by Age in Hanover Park
Disability Class: Hearing Difficulty
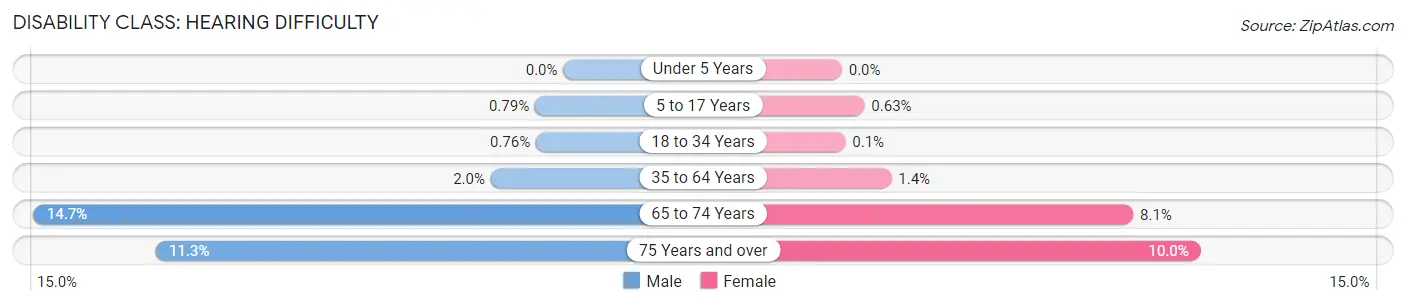
| Age Bracket | Male | Female |
| Under 5 Years | 0 (0.0%) | 0 (0.0%) |
| 5 to 17 Years | 30 (0.8%) | 27 (0.6%) |
| 18 to 34 Years | 34 (0.8%) | 4 (0.1%) |
| 35 to 64 Years | 142 (2.0%) | 99 (1.4%) |
| 65 to 74 Years | 206 (14.7%) | 120 (8.1%) |
| 75 Years and over | 61 (11.3%) | 87 (10.0%) |
Disability Class: Vision Difficulty
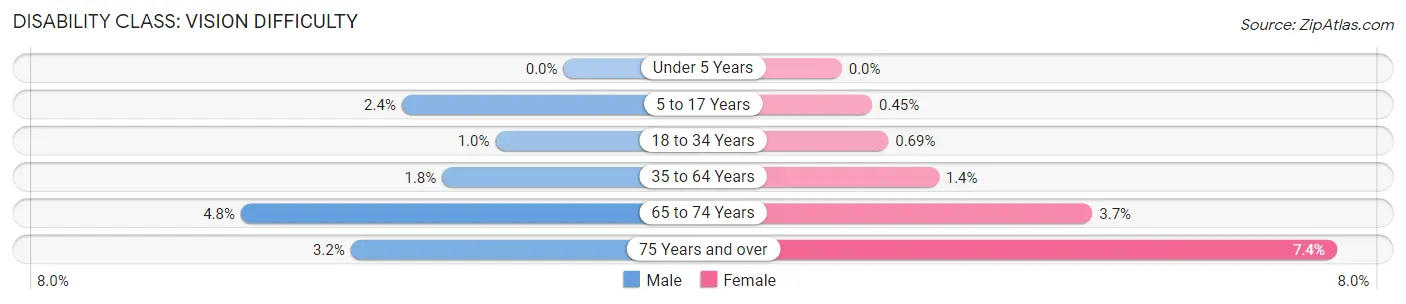
| Age Bracket | Male | Female |
| Under 5 Years | 0 (0.0%) | 0 (0.0%) |
| 5 to 17 Years | 91 (2.4%) | 19 (0.4%) |
| 18 to 34 Years | 45 (1.0%) | 28 (0.7%) |
| 35 to 64 Years | 127 (1.8%) | 103 (1.4%) |
| 65 to 74 Years | 67 (4.8%) | 55 (3.7%) |
| 75 Years and over | 17 (3.2%) | 64 (7.3%) |
Disability Class: Cognitive Difficulty
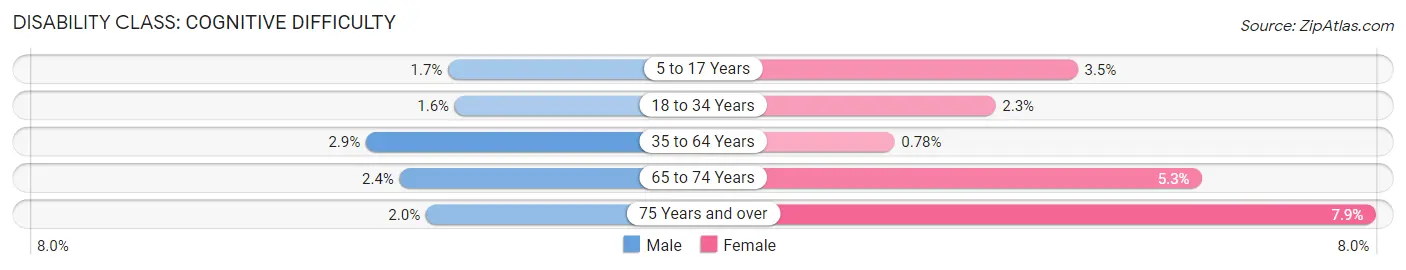
| Age Bracket | Male | Female |
| 5 to 17 Years | 65 (1.7%) | 149 (3.5%) |
| 18 to 34 Years | 72 (1.6%) | 92 (2.3%) |
| 35 to 64 Years | 206 (2.9%) | 56 (0.8%) |
| 65 to 74 Years | 34 (2.4%) | 79 (5.3%) |
| 75 Years and over | 11 (2.0%) | 69 (7.9%) |
Disability Class: Ambulatory Difficulty
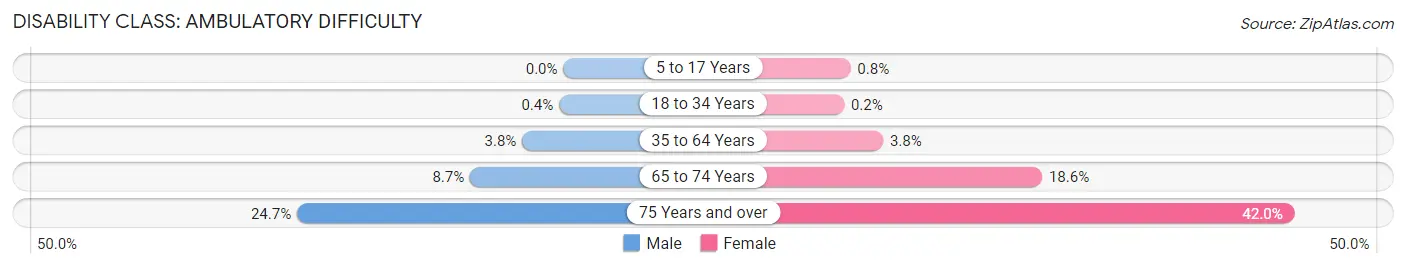
| Age Bracket | Male | Female |
| 5 to 17 Years | 0 (0.0%) | 34 (0.8%) |
| 18 to 34 Years | 18 (0.4%) | 8 (0.2%) |
| 35 to 64 Years | 269 (3.8%) | 273 (3.8%) |
| 65 to 74 Years | 121 (8.7%) | 275 (18.6%) |
| 75 Years and over | 133 (24.7%) | 366 (42.0%) |
Disability Class: Self-Care Difficulty
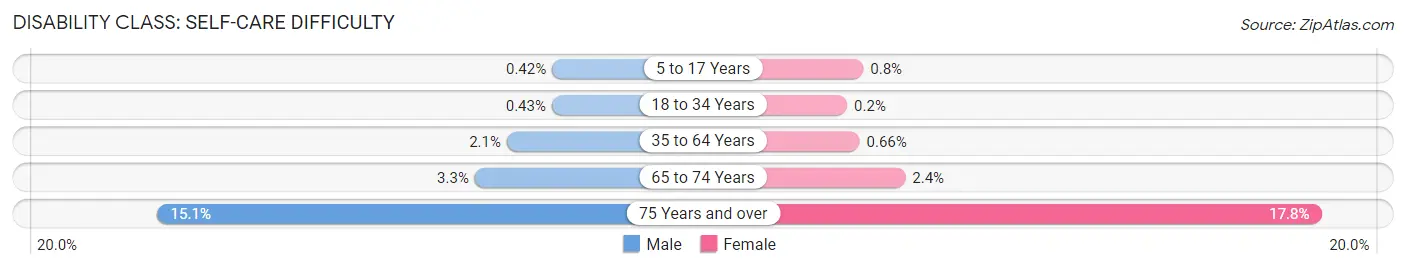
| Age Bracket | Male | Female |
| 5 to 17 Years | 16 (0.4%) | 34 (0.8%) |
| 18 to 34 Years | 19 (0.4%) | 8 (0.2%) |
| 35 to 64 Years | 148 (2.1%) | 47 (0.7%) |
| 65 to 74 Years | 46 (3.3%) | 35 (2.4%) |
| 75 Years and over | 81 (15.1%) | 155 (17.8%) |
Technology Access in Hanover Park
Computing Device Access in Hanover Park
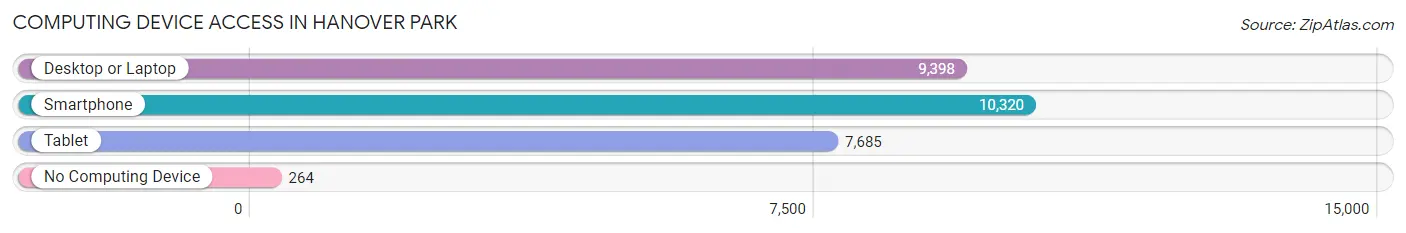
| Device Type | # Households | % Households |
| Desktop or Laptop | 9,398 | 84.6% |
| Smartphone | 10,320 | 92.9% |
| Tablet | 7,685 | 69.2% |
| No Computing Device | 264 | 2.4% |
| Total | 11,113 | 100.0% |
Internet Access in Hanover Park
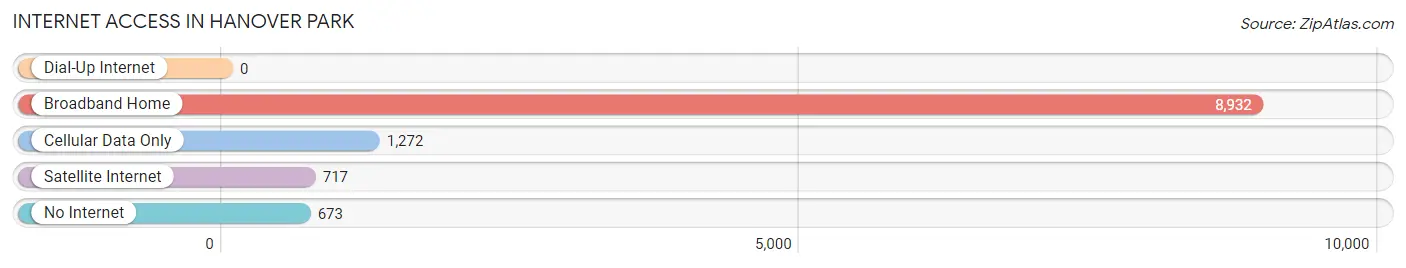
| Internet Type | # Households | % Households |
| Dial-Up Internet | 0 | 0.0% |
| Broadband Home | 8,932 | 80.4% |
| Cellular Data Only | 1,272 | 11.5% |
| Satellite Internet | 717 | 6.5% |
| No Internet | 673 | 6.1% |
| Total | 11,113 | 100.0% |
Hanover Park Summary
Hanover Park, Illinois is a village located in Cook and DuPage counties in the state of Illinois. It is a part of the Chicago metropolitan area and is located approximately 25 miles northwest of downtown Chicago. The village has a population of 37,973 as of the 2010 census, making it the second largest village in Illinois.
History
The area that is now Hanover Park was first settled in the early 1800s by German immigrants. The village was originally known as “Hickory Grove” and was incorporated in 1958. The village was named after the Hanover Township, which was named after the Kingdom of Hanover in Germany.
Geography
Hanover Park is located at 41°58'17" North, 88°7'45" West (41.9714, -88.1292). According to the United States Census Bureau, the village has a total area of 8.3 square miles, of which 8.2 square miles is land and 0.1 square miles is water.
Economy
Hanover Park is home to a variety of businesses, including manufacturing, retail, and service industries. The village is home to several large employers, including the Hanover Park Metra Station, the Hanover Park Post Office, and the Hanover Park Fire Department. The village also has a number of small businesses, including restaurants, shops, and professional services.
Demographics
As of the 2010 census, Hanover Park had a population of 37,973. The racial makeup of the village was 57.2% White, 15.2% African American, 0.4% Native American, 15.7% Asian, 0.1% Pacific Islander, 8.2% from other races, and 3.2% from two or more races. Hispanic or Latino of any race were 22.3% of the population.
The median income for a household in the village was $60,945, and the median income for a family was $68,945. The per capita income for the village was $25,945. About 6.2% of families and 8.2% of the population were below the poverty line, including 11.2% of those under age 18 and 5.2% of those age 65 or over.
Hanover Park is served by several school districts, including the Community Consolidated School District 54, the Elgin Area School District U-46, and the Schaumburg Township Elementary District 54. The village is also home to several private schools, including St. Peter Lutheran School and St. Isidore Catholic School.
Common Questions
What is Per Capita Income in Hanover Park?
Per Capita income in Hanover Park is $29,940.
What is the Median Family Income in Hanover Park?
Median Family Income in Hanover Park is $91,788.
What is the Median Household income in Hanover Park?
Median Household Income in Hanover Park is $88,460.
What is Income or Wage Gap in Hanover Park?
Income or Wage Gap in Hanover Park is 26.3%.
Women in Hanover Park earn 73.7 cents for every dollar earned by a man.
What is Family Income Deficit in Hanover Park?
Family Income Deficit in Hanover Park is $13,574.
Families that are below poverty line in Hanover Park earn $13,574 less on average than the poverty threshold level.
What is Inequality or Gini Index in Hanover Park?
Inequality or Gini Index in Hanover Park is 0.37.
What is the Total Population of Hanover Park?
Total Population of Hanover Park is 37,222.
What is the Total Male Population of Hanover Park?
Total Male Population of Hanover Park is 18,101.
What is the Total Female Population of Hanover Park?
Total Female Population of Hanover Park is 19,121.
What is the Ratio of Males per 100 Females in Hanover Park?
There are 94.67 Males per 100 Females in Hanover Park.
What is the Ratio of Females per 100 Males in Hanover Park?
There are 105.64 Females per 100 Males in Hanover Park.
What is the Median Population Age in Hanover Park?
Median Population Age in Hanover Park is 34.7 Years.
What is the Average Family Size in Hanover Park
Average Family Size in Hanover Park is 3.7 People.
What is the Average Household Size in Hanover Park
Average Household Size in Hanover Park is 3.4 People.
How Large is the Labor Force in Hanover Park?
There are 19,266 People in the Labor Forcein in Hanover Park.
What is the Percentage of People in the Labor Force in Hanover Park?
67.9% of People are in the Labor Force in Hanover Park.
What is the Unemployment Rate in Hanover Park?
Unemployment Rate in Hanover Park is 5.3%.