Bridgeview, IL Map & Demographics
Bridgeview Map
Bridgeview Overview
$27,322
PER CAPITA INCOME
$70,494
AVG FAMILY INCOME
$61,426
AVG HOUSEHOLD INCOME
4.8%
WAGE / INCOME GAP [ % ]
95.2¢/ $1
WAGE / INCOME GAP [ $ ]
$8,453
FAMILY INCOME DEFICIT
0.41
INEQUALITY / GINI INDEX
16,939
TOTAL POPULATION
7,967
MALE POPULATION
8,972
FEMALE POPULATION
88.80
MALES / 100 FEMALES
112.61
FEMALES / 100 MALES
39.2
MEDIAN AGE
3.3
AVG FAMILY SIZE
2.7
AVG HOUSEHOLD SIZE
8,198
LABOR FORCE [ PEOPLE ]
59.7%
PERCENT IN LABOR FORCE
8.5%
UNEMPLOYMENT RATE
Bridgeview Zip Codes
Income in Bridgeview
Income Overview in Bridgeview
Per Capita Income in Bridgeview is $27,322, while median incomes of families and households are $70,494 and $61,426 respectively.
| Characteristic | Number | Measure |
| Per Capita Income | 16,939 | $27,322 |
| Median Family Income | 4,022 | $70,494 |
| Mean Family Income | 4,022 | $85,805 |
| Median Household Income | 6,118 | $61,426 |
| Mean Household Income | 6,118 | $73,165 |
| Income Deficit | 4,022 | $8,453 |
| Wage / Income Gap (%) | 16,939 | 4.78% |
| Wage / Income Gap ($) | 16,939 | 95.22¢ per $1 |
| Gini / Inequality Index | 16,939 | 0.41 |
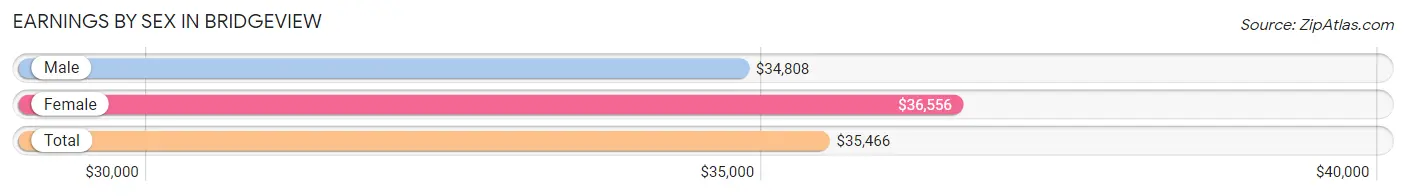
Earnings by Sex in Bridgeview
Average Earnings in Bridgeview are $35,466, $34,808 for men and $36,556 for women, a difference of 4.8%.
| Sex | Number | Average Earnings |
| Male | 4,575 (54.2%) | $34,808 |
| Female | 3,872 (45.8%) | $36,556 |
| Total | 8,447 (100.0%) | $35,466 |
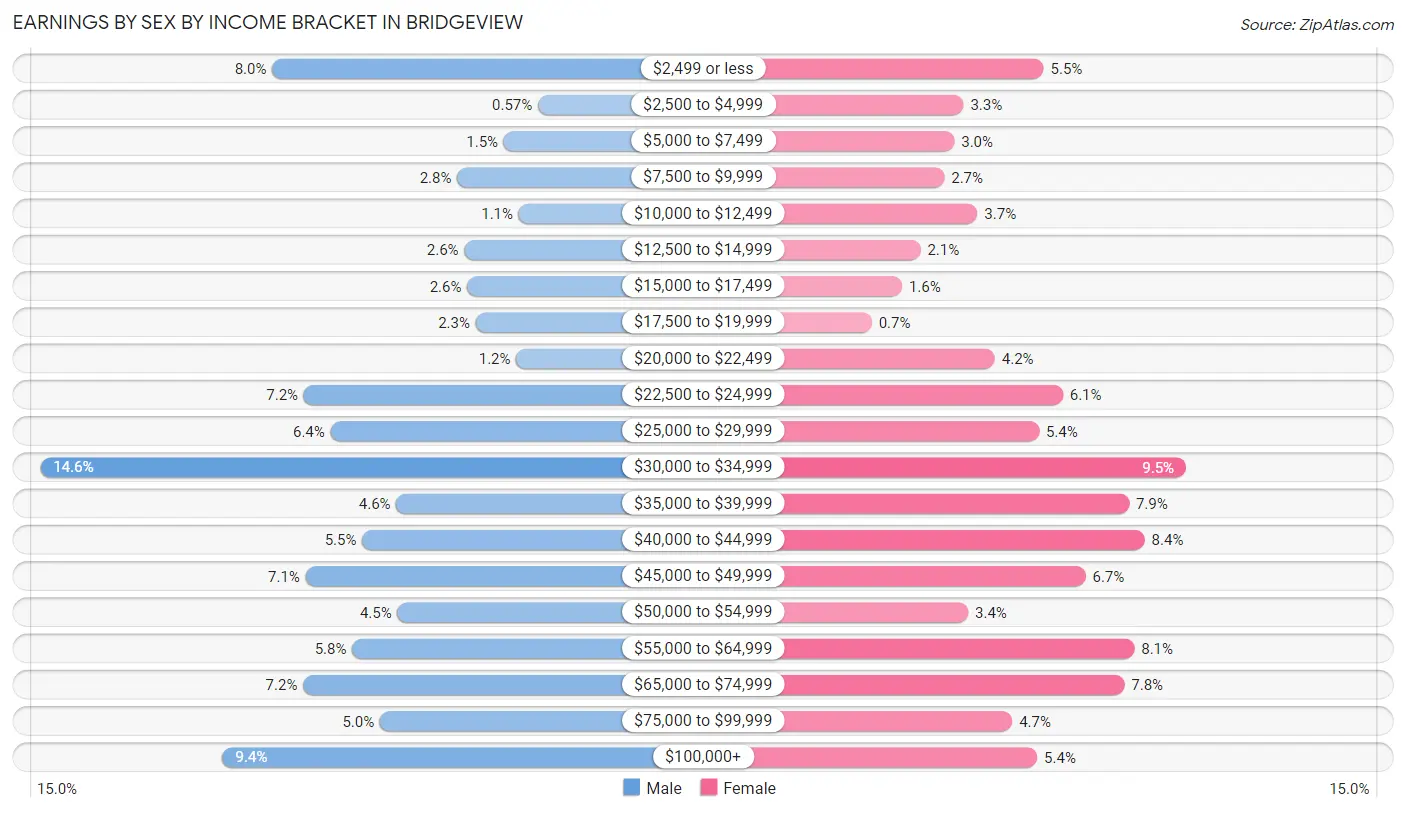
Earnings by Sex by Income Bracket in Bridgeview
The most common earnings brackets in Bridgeview are $30,000 to $34,999 for men (666 | 14.6%) and $30,000 to $34,999 for women (369 | 9.5%).
| Income | Male | Female |
| $2,499 or less | 368 (8.0%) | 214 (5.5%) |
| $2,500 to $4,999 | 26 (0.6%) | 127 (3.3%) |
| $5,000 to $7,499 | 70 (1.5%) | 117 (3.0%) |
| $7,500 to $9,999 | 130 (2.8%) | 106 (2.7%) |
| $10,000 to $12,499 | 51 (1.1%) | 142 (3.7%) |
| $12,500 to $14,999 | 121 (2.6%) | 80 (2.1%) |
| $15,000 to $17,499 | 117 (2.6%) | 60 (1.5%) |
| $17,500 to $19,999 | 106 (2.3%) | 27 (0.7%) |
| $20,000 to $22,499 | 54 (1.2%) | 161 (4.2%) |
| $22,500 to $24,999 | 327 (7.1%) | 235 (6.1%) |
| $25,000 to $29,999 | 293 (6.4%) | 209 (5.4%) |
| $30,000 to $34,999 | 666 (14.6%) | 369 (9.5%) |
| $35,000 to $39,999 | 208 (4.5%) | 307 (7.9%) |
| $40,000 to $44,999 | 252 (5.5%) | 324 (8.4%) |
| $45,000 to $49,999 | 325 (7.1%) | 260 (6.7%) |
| $50,000 to $54,999 | 207 (4.5%) | 132 (3.4%) |
| $55,000 to $64,999 | 265 (5.8%) | 313 (8.1%) |
| $65,000 to $74,999 | 328 (7.2%) | 302 (7.8%) |
| $75,000 to $99,999 | 229 (5.0%) | 180 (4.6%) |
| $100,000+ | 432 (9.4%) | 207 (5.3%) |
| Total | 4,575 (100.0%) | 3,872 (100.0%) |
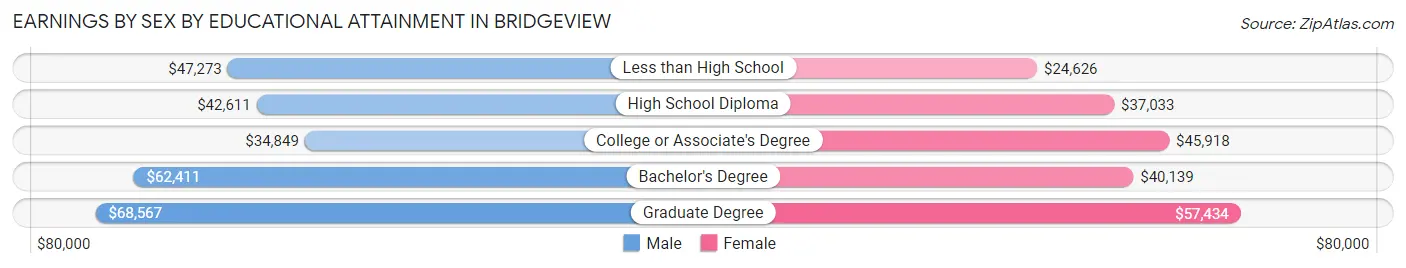
Earnings by Sex by Educational Attainment in Bridgeview
Average earnings in Bridgeview are $44,805 for men and $40,065 for women, a difference of 10.6%. Men with an educational attainment of graduate degree enjoy the highest average annual earnings of $68,567, while those with college or associate's degree education earn the least with $34,849. Women with an educational attainment of graduate degree earn the most with the average annual earnings of $57,434, while those with less than high school education have the smallest earnings of $24,626.
| Educational Attainment | Male Income | Female Income |
| Less than High School | $47,273 | $24,626 |
| High School Diploma | $42,611 | $37,033 |
| College or Associate's Degree | $34,849 | $45,918 |
| Bachelor's Degree | $62,411 | $40,139 |
| Graduate Degree | $68,567 | $57,434 |
| Total | $44,805 | $40,065 |
Family Income in Bridgeview
Family Income Brackets in Bridgeview
According to the Bridgeview family income data, there are 965 families falling into the $50,000 to $74,999 income range, which is the most common income bracket and makes up 24.0% of all families. Conversely, the $10,000 to $14,999 income bracket is the least frequent group with only 60 families (1.5%) belonging to this category.
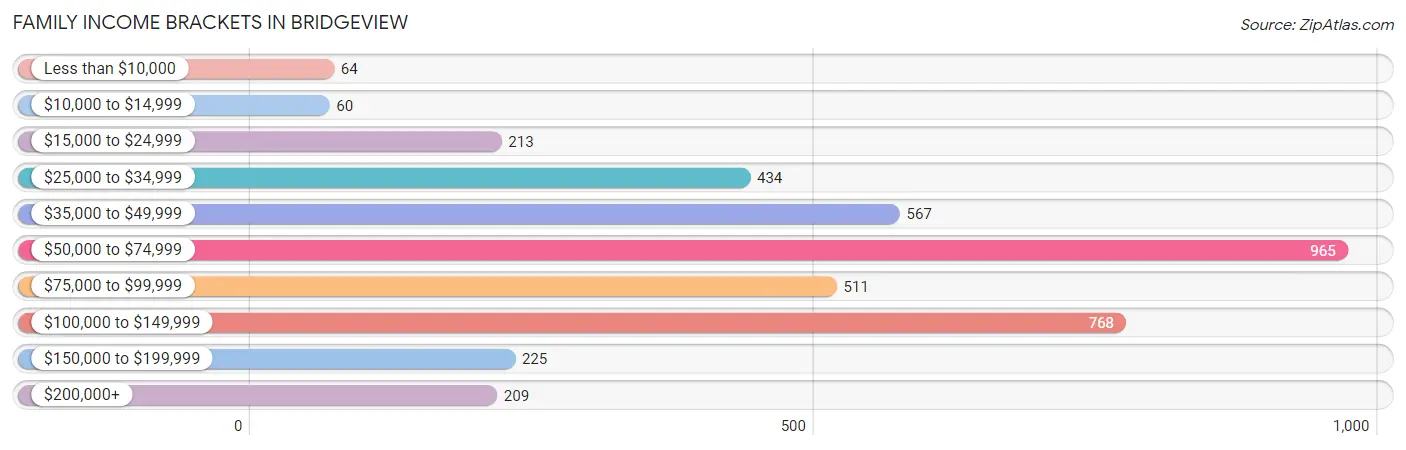
| Income Bracket | # Families | % Families |
| Less than $10,000 | 64 | 1.6% |
| $10,000 to $14,999 | 60 | 1.5% |
| $15,000 to $24,999 | 213 | 5.3% |
| $25,000 to $34,999 | 434 | 10.8% |
| $35,000 to $49,999 | 567 | 14.1% |
| $50,000 to $74,999 | 965 | 24.0% |
| $75,000 to $99,999 | 511 | 12.7% |
| $100,000 to $149,999 | 768 | 19.1% |
| $150,000 to $199,999 | 225 | 5.6% |
| $200,000+ | 209 | 5.2% |
Family Income by Famaliy Size in Bridgeview
7+ person families (89 | 2.2%) account for the highest median family income in Bridgeview with $154,861 per family, while 3-person families (917 | 22.8%) have the highest median income of $31,768 per family member.
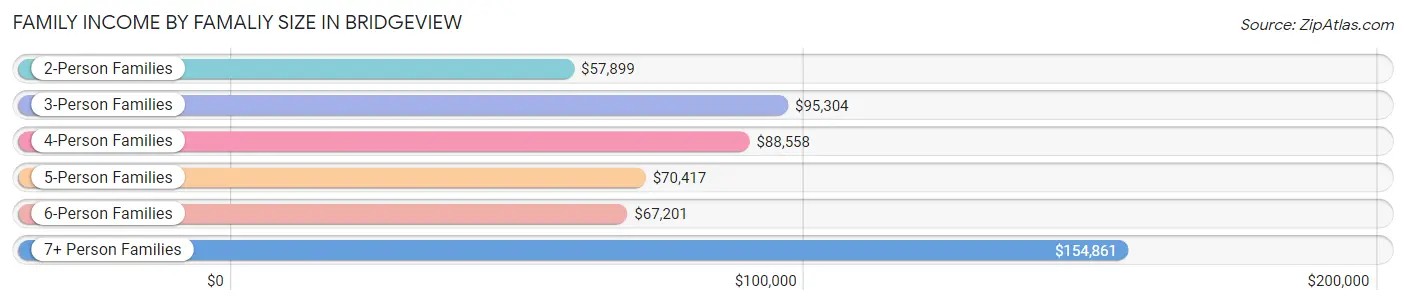
| Income Bracket | # Families | Median Income |
| 2-Person Families | 1,847 (45.9%) | $57,899 |
| 3-Person Families | 917 (22.8%) | $95,304 |
| 4-Person Families | 453 (11.3%) | $88,558 |
| 5-Person Families | 581 (14.4%) | $70,417 |
| 6-Person Families | 135 (3.4%) | $67,201 |
| 7+ Person Families | 89 (2.2%) | $154,861 |
| Total | 4,022 (100.0%) | $70,494 |
Family Income by Number of Earners in Bridgeview
The median family income in Bridgeview is $70,494, with families comprising 3+ earners (492) having the highest median family income of $124,375, while families with no earners (567) have the lowest median family income of $45,049, accounting for 12.2% and 14.1% of families, respectively.
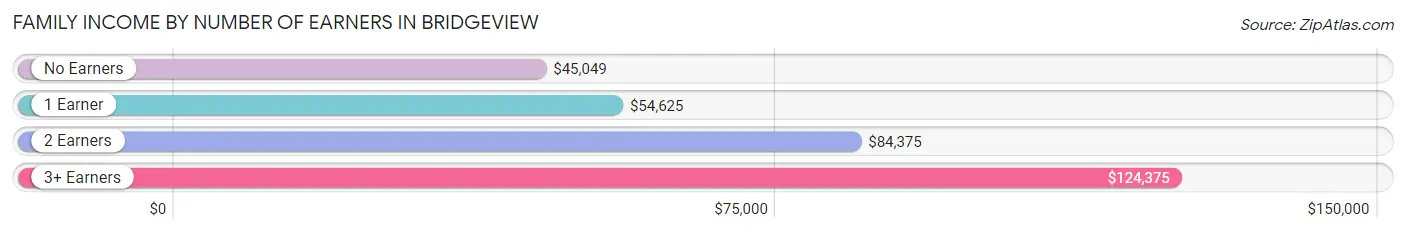
| Number of Earners | # Families | Median Income |
| No Earners | 567 (14.1%) | $45,049 |
| 1 Earner | 1,318 (32.8%) | $54,625 |
| 2 Earners | 1,645 (40.9%) | $84,375 |
| 3+ Earners | 492 (12.2%) | $124,375 |
| Total | 4,022 (100.0%) | $70,494 |
Household Income in Bridgeview
Household Income Brackets in Bridgeview
With 1,273 households falling in the category, the $50,000 to $74,999 income range is the most frequent in Bridgeview, accounting for 20.8% of all households. In contrast, only 208 households (3.4%) fall into the $200,000+ income bracket, making it the least populous group.
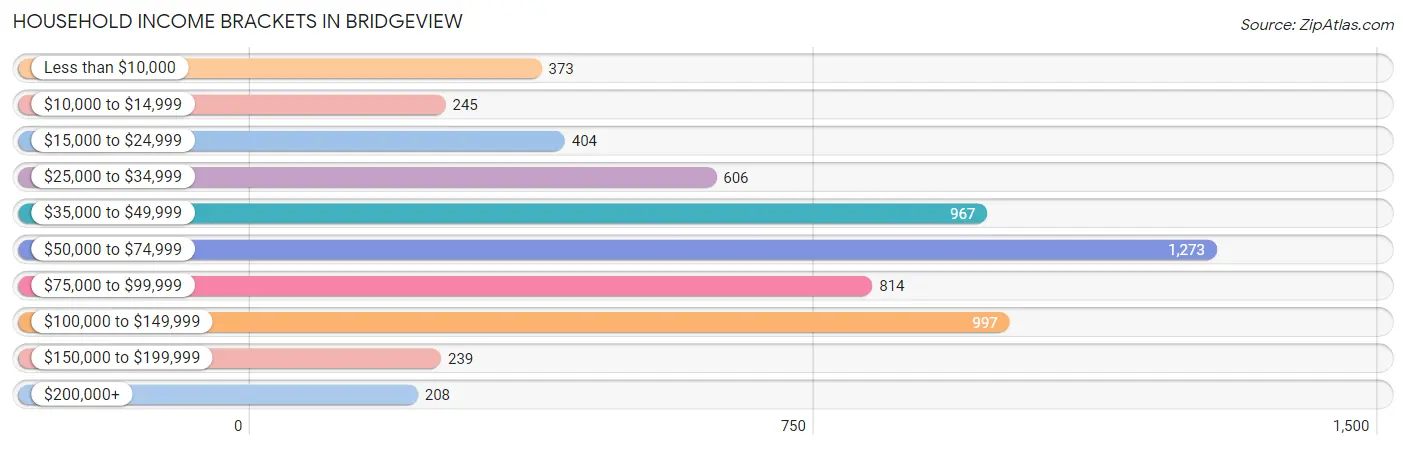
| Income Bracket | # Households | % Households |
| Less than $10,000 | 373 | 6.1% |
| $10,000 to $14,999 | 245 | 4.0% |
| $15,000 to $24,999 | 404 | 6.6% |
| $25,000 to $34,999 | 606 | 9.9% |
| $35,000 to $49,999 | 967 | 15.8% |
| $50,000 to $74,999 | 1,273 | 20.8% |
| $75,000 to $99,999 | 814 | 13.3% |
| $100,000 to $149,999 | 997 | 16.3% |
| $150,000 to $199,999 | 239 | 3.9% |
| $200,000+ | 208 | 3.4% |
Household Income by Householder Age in Bridgeview
The median household income in Bridgeview is $61,426, with the highest median household income of $66,365 found in the 45 to 64 years age bracket for the primary householder. A total of 2,457 households (40.2%) fall into this category. Meanwhile, the 15 to 24 years age bracket for the primary householder has the lowest median household income of $0, with 7 households (0.1%) in this group.
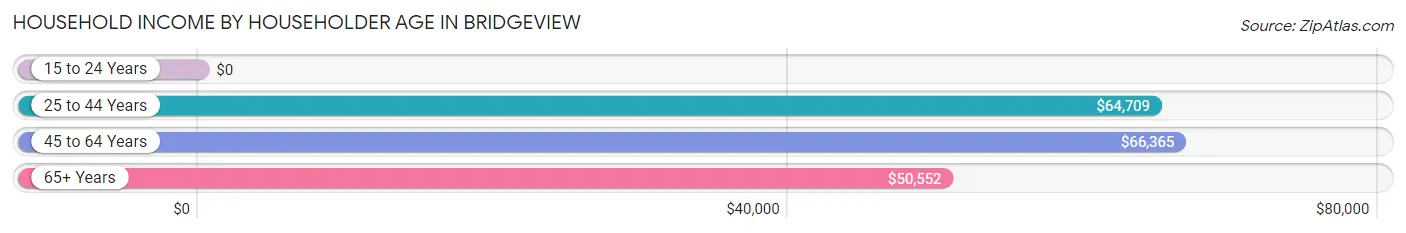
| Income Bracket | # Households | Median Income |
| 15 to 24 Years | 7 (0.1%) | $0 |
| 25 to 44 Years | 2,027 (33.1%) | $64,709 |
| 45 to 64 Years | 2,457 (40.2%) | $66,365 |
| 65+ Years | 1,627 (26.6%) | $50,552 |
| Total | 6,118 (100.0%) | $61,426 |
Poverty in Bridgeview
Income Below Poverty by Sex and Age in Bridgeview
With 16.3% poverty level for males and 14.9% for females among the residents of Bridgeview, 15 year old males and 25 to 34 year old females are the most vulnerable to poverty, with 112 males (70.9%) and 347 females (28.5%) in their respective age groups living below the poverty level.
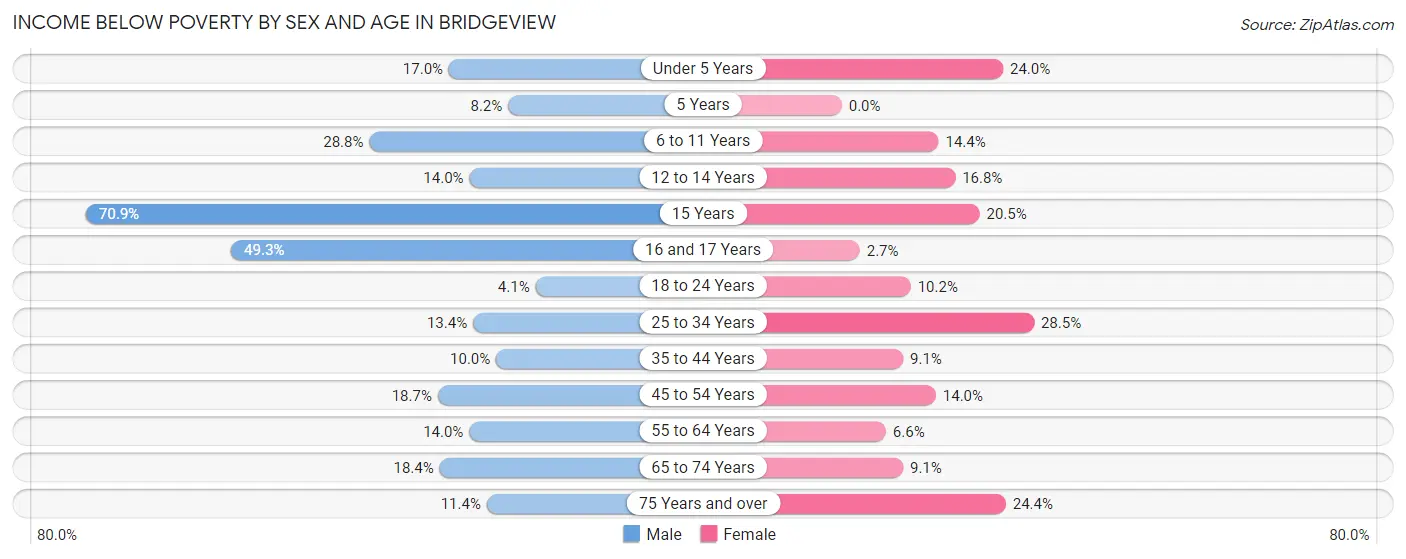
| Age Bracket | Male | Female |
| Under 5 Years | 71 (17.0%) | 125 (23.9%) |
| 5 Years | 5 (8.2%) | 0 (0.0%) |
| 6 to 11 Years | 151 (28.8%) | 101 (14.4%) |
| 12 to 14 Years | 42 (14.0%) | 16 (16.8%) |
| 15 Years | 112 (70.9%) | 45 (20.4%) |
| 16 and 17 Years | 108 (49.3%) | 5 (2.7%) |
| 18 to 24 Years | 41 (4.1%) | 74 (10.2%) |
| 25 to 34 Years | 153 (13.4%) | 347 (28.5%) |
| 35 to 44 Years | 95 (10.0%) | 92 (9.1%) |
| 45 to 54 Years | 180 (18.6%) | 153 (14.0%) |
| 55 to 64 Years | 130 (14.0%) | 81 (6.6%) |
| 65 to 74 Years | 135 (18.4%) | 77 (9.1%) |
| 75 Years and over | 37 (11.4%) | 150 (24.3%) |
| Total | 1,260 (16.3%) | 1,266 (14.9%) |
Income Above Poverty by Sex and Age in Bridgeview
According to the poverty statistics in Bridgeview, males aged 18 to 24 years and females aged 16 and 17 years are the age groups that are most secure financially, with 95.9% of males and 97.3% of females in these age groups living above the poverty line.
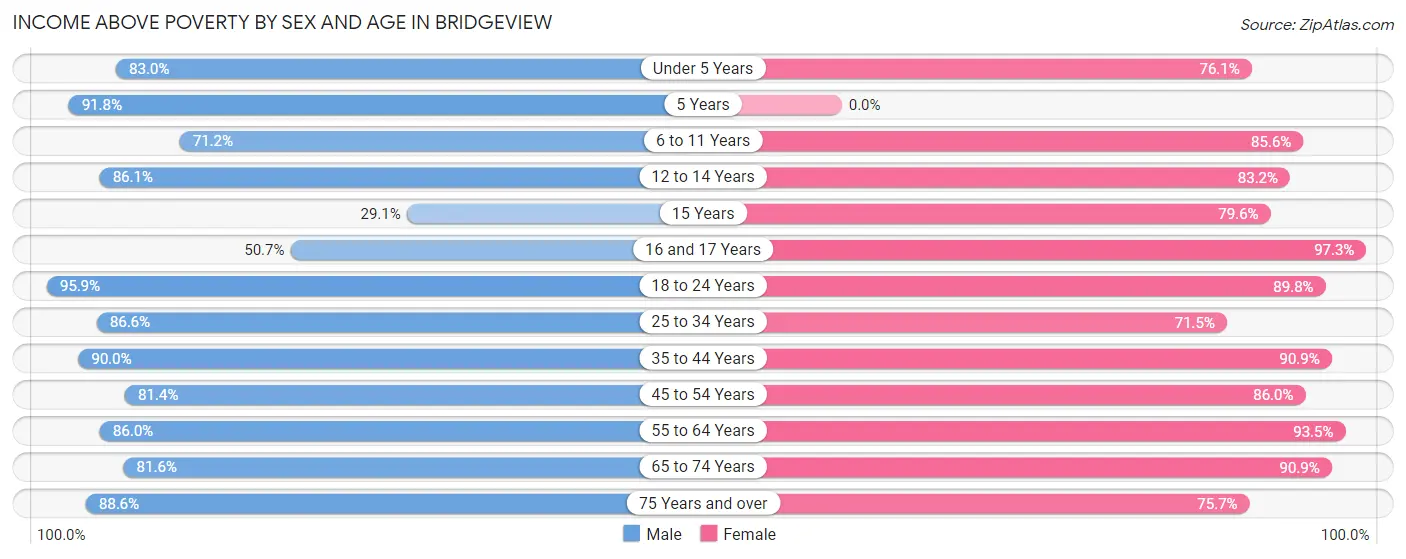
| Age Bracket | Male | Female |
| Under 5 Years | 347 (83.0%) | 397 (76.0%) |
| 5 Years | 56 (91.8%) | 0 (0.0%) |
| 6 to 11 Years | 373 (71.2%) | 602 (85.6%) |
| 12 to 14 Years | 259 (86.1%) | 79 (83.2%) |
| 15 Years | 46 (29.1%) | 175 (79.5%) |
| 16 and 17 Years | 111 (50.7%) | 182 (97.3%) |
| 18 to 24 Years | 950 (95.9%) | 649 (89.8%) |
| 25 to 34 Years | 987 (86.6%) | 869 (71.5%) |
| 35 to 44 Years | 857 (90.0%) | 919 (90.9%) |
| 45 to 54 Years | 785 (81.4%) | 942 (86.0%) |
| 55 to 64 Years | 800 (86.0%) | 1,155 (93.4%) |
| 65 to 74 Years | 599 (81.6%) | 770 (90.9%) |
| 75 Years and over | 288 (88.6%) | 466 (75.6%) |
| Total | 6,458 (83.7%) | 7,205 (85.1%) |
Income Below Poverty Among Married-Couple Families in Bridgeview
The poverty statistics for married-couple families in Bridgeview show that 8.1% or 203 of the total 2,494 families live below the poverty line. Families with 1 or 2 children have the highest poverty rate of 20.8%, comprising of 127 families. On the other hand, families with 5 or more children have the lowest poverty rate of 0.0%, which includes 0 families.
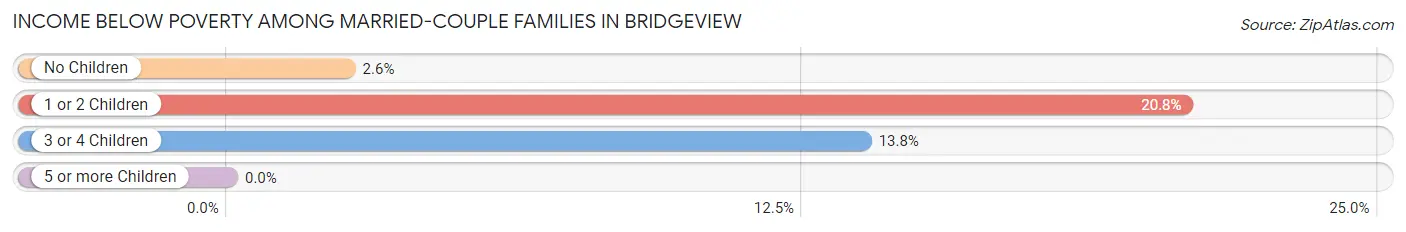
| Children | Above Poverty | Below Poverty |
| No Children | 1,523 (97.4%) | 40 (2.6%) |
| 1 or 2 Children | 484 (79.2%) | 127 (20.8%) |
| 3 or 4 Children | 225 (86.2%) | 36 (13.8%) |
| 5 or more Children | 59 (100.0%) | 0 (0.0%) |
| Total | 2,291 (91.9%) | 203 (8.1%) |
Income Below Poverty Among Single-Parent Households in Bridgeview
According to the poverty data in Bridgeview, 25.6% or 101 single-father households and 11.0% or 125 single-mother households are living below the poverty line. Among single-father households, those with no children have the highest poverty rate, with 72 households (28.8%) experiencing poverty. Likewise, among single-mother households, those with 3 or 4 children have the highest poverty rate, with 71 households (57.7%) falling below the poverty line.
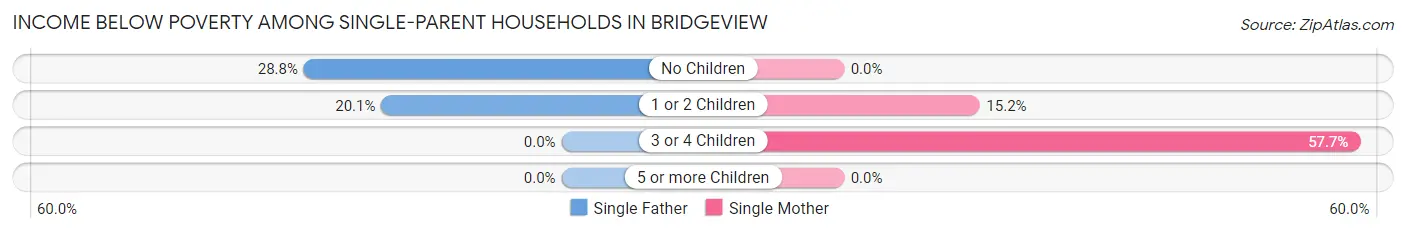
| Children | Single Father | Single Mother |
| No Children | 72 (28.8%) | 0 (0.0%) |
| 1 or 2 Children | 29 (20.1%) | 54 (15.2%) |
| 3 or 4 Children | 0 (0.0%) | 71 (57.7%) |
| 5 or more Children | 0 (0.0%) | 0 (0.0%) |
| Total | 101 (25.6%) | 125 (11.0%) |
Income Below Poverty Among Married-Couple vs Single-Parent Households in Bridgeview
The poverty data for Bridgeview shows that 203 of the married-couple family households (8.1%) and 226 of the single-parent households (14.8%) are living below the poverty level. Within the married-couple family households, those with 1 or 2 children have the highest poverty rate, with 127 households (20.8%) falling below the poverty line. Among the single-parent households, those with 3 or 4 children have the highest poverty rate, with 71 household (57.7%) living below poverty.
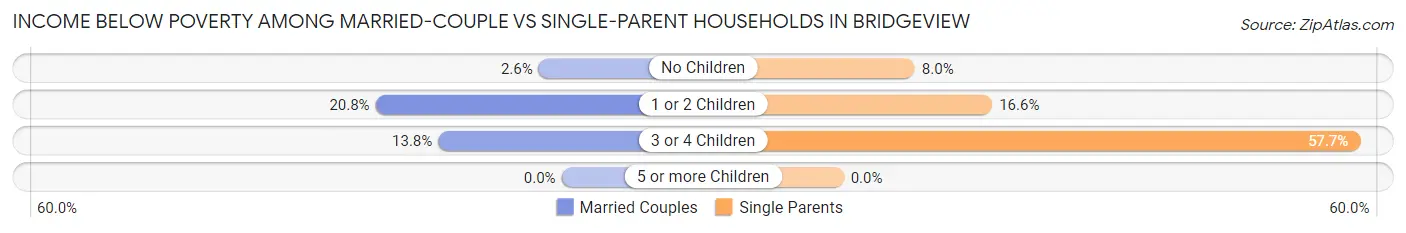
| Children | Married-Couple Families | Single-Parent Households |
| No Children | 40 (2.6%) | 72 (8.0%) |
| 1 or 2 Children | 127 (20.8%) | 83 (16.6%) |
| 3 or 4 Children | 36 (13.8%) | 71 (57.7%) |
| 5 or more Children | 0 (0.0%) | 0 (0.0%) |
| Total | 203 (8.1%) | 226 (14.8%) |
Race in Bridgeview
The most populous races in Bridgeview are White / Caucasian (12,315 | 72.7%), Hispanic or Latino (5,422 | 32.0%), and Two or more Races (1,750 | 10.3%).
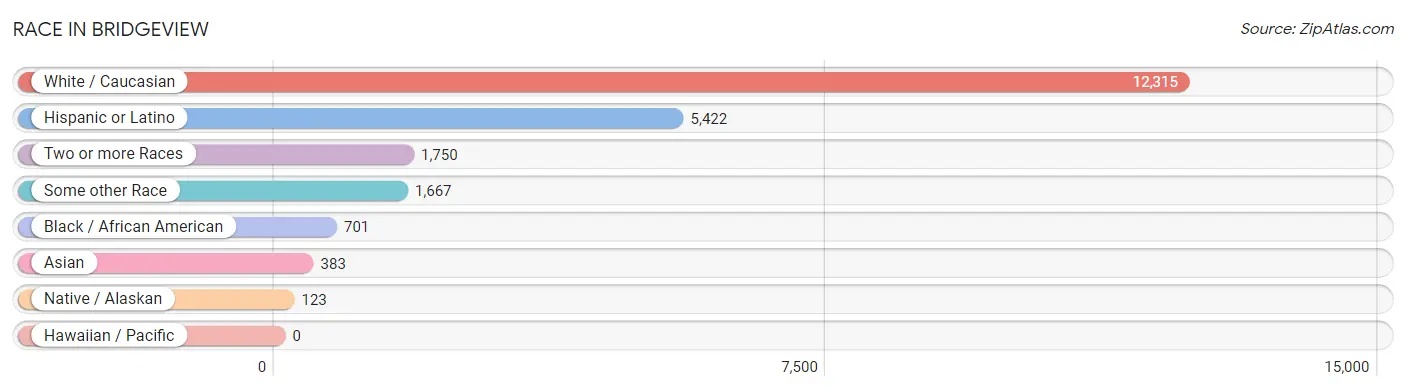
| Race | # Population | % Population |
| Asian | 383 | 2.3% |
| Black / African American | 701 | 4.1% |
| Hawaiian / Pacific | 0 | 0.0% |
| Hispanic or Latino | 5,422 | 32.0% |
| Native / Alaskan | 123 | 0.7% |
| White / Caucasian | 12,315 | 72.7% |
| Two or more Races | 1,750 | 10.3% |
| Some other Race | 1,667 | 9.8% |
| Total | 16,939 | 100.0% |
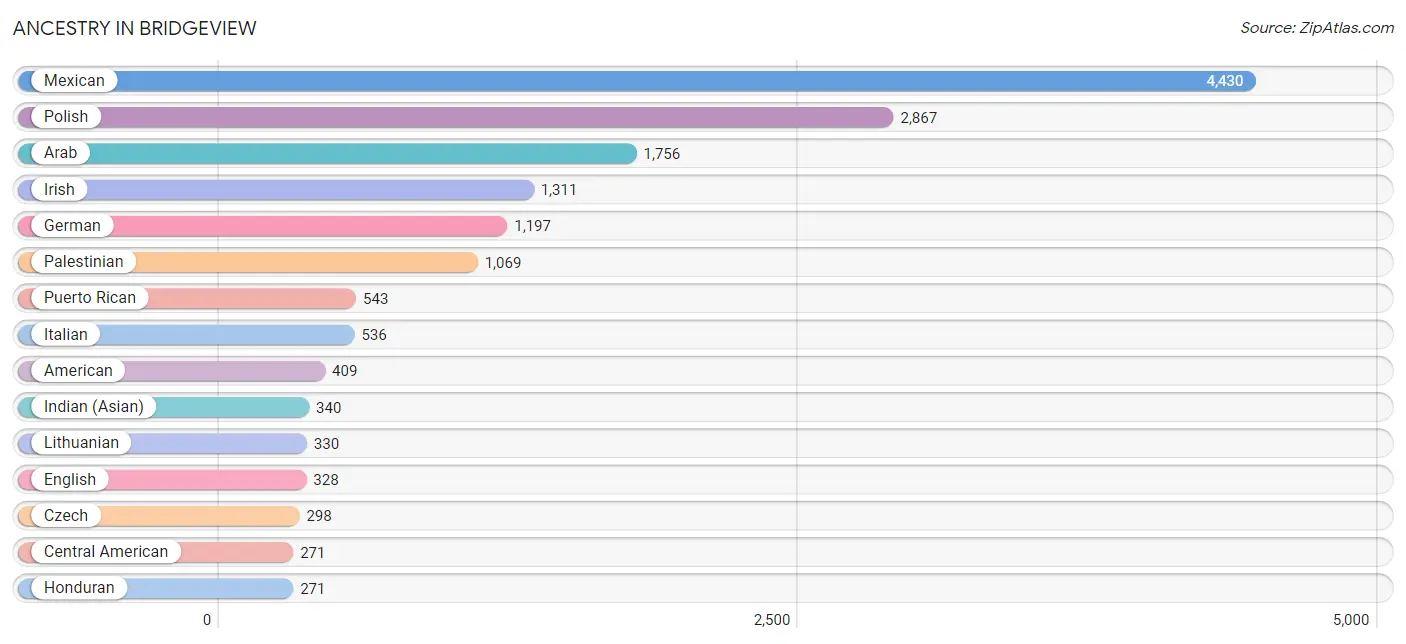
Ancestry in Bridgeview
The most populous ancestries reported in Bridgeview are Mexican (4,430 | 26.2%), Polish (2,867 | 16.9%), Arab (1,756 | 10.4%), Irish (1,311 | 7.7%), and German (1,197 | 7.1%), together accounting for 68.3% of all Bridgeview residents.
| Ancestry | # Population | % Population |
| African | 69 | 0.4% |
| Albanian | 35 | 0.2% |
| American | 409 | 2.4% |
| Arab | 1,756 | 10.4% |
| Armenian | 29 | 0.2% |
| Austrian | 10 | 0.1% |
| Bhutanese | 43 | 0.3% |
| British | 23 | 0.1% |
| Central American | 271 | 1.6% |
| Cherokee | 10 | 0.1% |
| Chippewa | 18 | 0.1% |
| Croatian | 31 | 0.2% |
| Czech | 298 | 1.8% |
| Danish | 56 | 0.3% |
| Dutch | 69 | 0.4% |
| Ecuadorian | 63 | 0.4% |
| Egyptian | 178 | 1.1% |
| English | 328 | 1.9% |
| European | 52 | 0.3% |
| French | 49 | 0.3% |
| German | 1,197 | 7.1% |
| German Russian | 9 | 0.1% |
| Greek | 164 | 1.0% |
| Haitian | 11 | 0.1% |
| Honduran | 271 | 1.6% |
| Hungarian | 20 | 0.1% |
| Indian (Asian) | 340 | 2.0% |
| Irish | 1,311 | 7.7% |
| Italian | 536 | 3.2% |
| Jordanian | 22 | 0.1% |
| Korean | 169 | 1.0% |
| Lebanese | 22 | 0.1% |
| Lithuanian | 330 | 1.9% |
| Mexican | 4,430 | 26.2% |
| Mexican American Indian | 62 | 0.4% |
| Norwegian | 22 | 0.1% |
| Palestinian | 1,069 | 6.3% |
| Peruvian | 60 | 0.4% |
| Polish | 2,867 | 16.9% |
| Portuguese | 15 | 0.1% |
| Puerto Rican | 543 | 3.2% |
| Russian | 34 | 0.2% |
| Scotch-Irish | 9 | 0.1% |
| Scottish | 14 | 0.1% |
| Serbian | 18 | 0.1% |
| Slovak | 153 | 0.9% |
| South American | 132 | 0.8% |
| Spaniard | 24 | 0.1% |
| Spanish | 16 | 0.1% |
| Sri Lankan | 18 | 0.1% |
| Subsaharan African | 69 | 0.4% |
| Swedish | 51 | 0.3% |
| Thai | 62 | 0.4% |
| Turkish | 21 | 0.1% |
| Venezuelan | 9 | 0.1% | View All 55 Rows |
Immigrants in Bridgeview
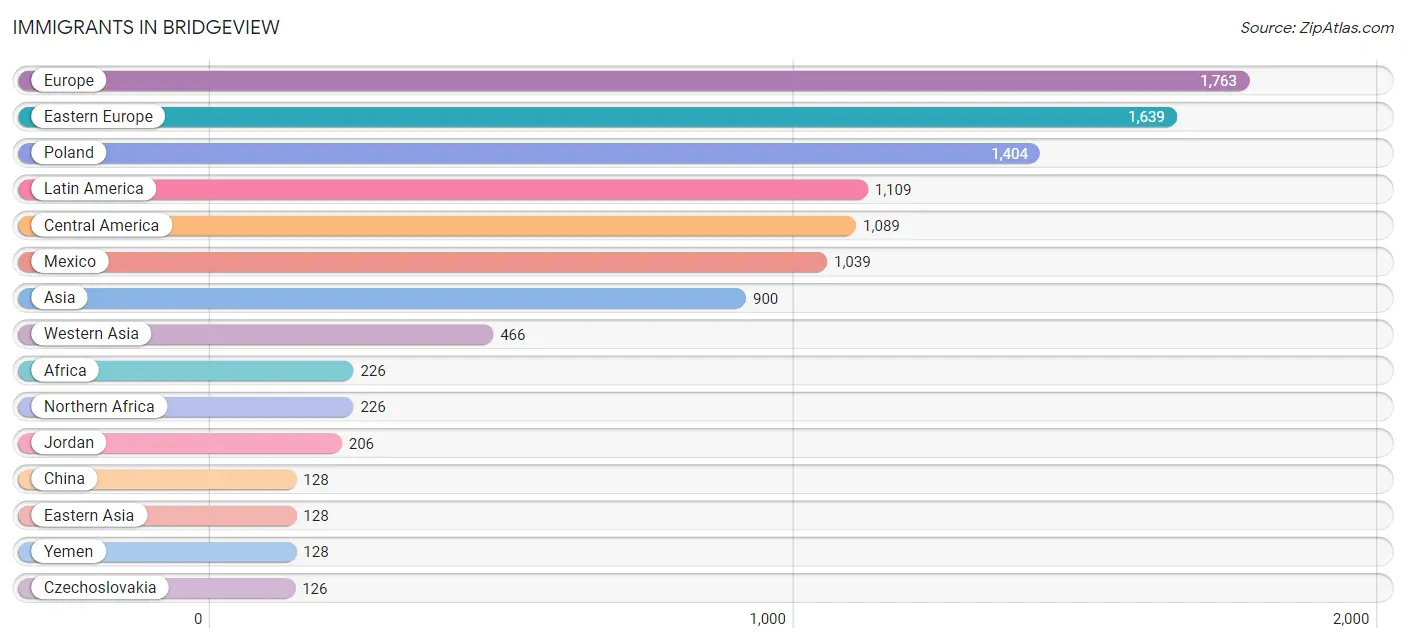
The most numerous immigrant groups reported in Bridgeview came from Europe (1,763 | 10.4%), Eastern Europe (1,639 | 9.7%), Poland (1,404 | 8.3%), Latin America (1,109 | 6.6%), and Central America (1,089 | 6.4%), together accounting for 41.4% of all Bridgeview residents.
| Immigration Origin | # Population | % Population |
| Africa | 226 | 1.3% |
| Asia | 900 | 5.3% |
| Bangladesh | 41 | 0.2% |
| Bosnia and Herzegovina | 18 | 0.1% |
| Canada | 10 | 0.1% |
| Caribbean | 11 | 0.1% |
| Central America | 1,089 | 6.4% |
| China | 128 | 0.8% |
| Croatia | 8 | 0.1% |
| Czechoslovakia | 126 | 0.7% |
| Eastern Asia | 128 | 0.8% |
| Eastern Europe | 1,639 | 9.7% |
| Egypt | 117 | 0.7% |
| Europe | 1,763 | 10.4% |
| France | 27 | 0.2% |
| Greece | 77 | 0.4% |
| Haiti | 11 | 0.1% |
| Honduras | 50 | 0.3% |
| Hong Kong | 7 | 0.0% |
| Israel | 48 | 0.3% |
| Jordan | 206 | 1.2% |
| Kuwait | 42 | 0.3% |
| Latin America | 1,109 | 6.6% |
| Lebanon | 11 | 0.1% |
| Malaysia | 20 | 0.1% |
| Mexico | 1,039 | 6.1% |
| Northern Africa | 226 | 1.3% |
| Pakistan | 6 | 0.0% |
| Philippines | 55 | 0.3% |
| Poland | 1,404 | 8.3% |
| Russia | 17 | 0.1% |
| Saudi Arabia | 8 | 0.1% |
| South America | 9 | 0.1% |
| South Central Asia | 47 | 0.3% |
| South Eastern Asia | 93 | 0.5% |
| Southern Europe | 77 | 0.4% |
| Syria | 23 | 0.1% |
| Venezuela | 9 | 0.1% |
| Vietnam | 18 | 0.1% |
| Western Asia | 466 | 2.8% |
| Western Europe | 47 | 0.3% |
| Yemen | 128 | 0.8% | View All 42 Rows |
Sex and Age in Bridgeview
Sex and Age in Bridgeview
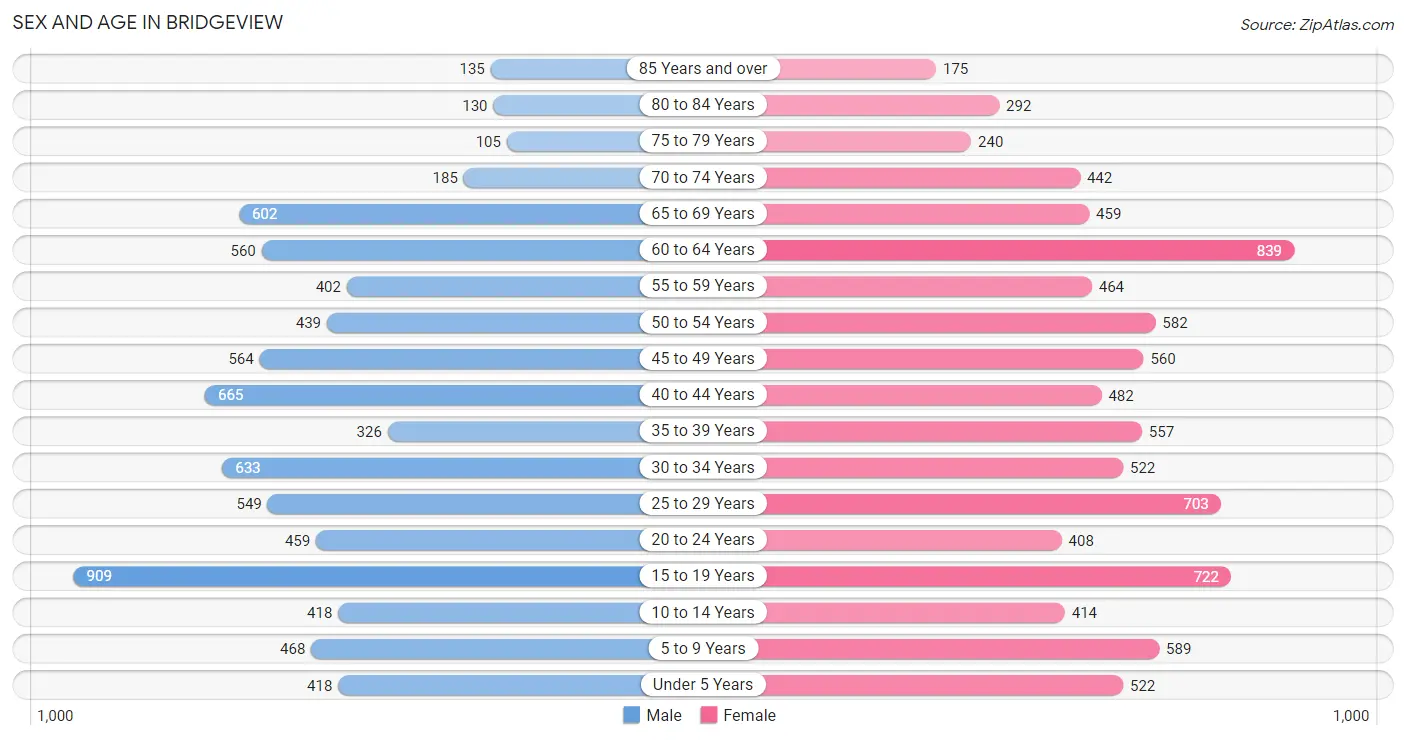
The most populous age groups in Bridgeview are 15 to 19 Years (909 | 11.4%) for men and 60 to 64 Years (839 | 9.3%) for women.
| Age Bracket | Male | Female |
| Under 5 Years | 418 (5.2%) | 522 (5.8%) |
| 5 to 9 Years | 468 (5.9%) | 589 (6.6%) |
| 10 to 14 Years | 418 (5.2%) | 414 (4.6%) |
| 15 to 19 Years | 909 (11.4%) | 722 (8.1%) |
| 20 to 24 Years | 459 (5.8%) | 408 (4.5%) |
| 25 to 29 Years | 549 (6.9%) | 703 (7.8%) |
| 30 to 34 Years | 633 (8.0%) | 522 (5.8%) |
| 35 to 39 Years | 326 (4.1%) | 557 (6.2%) |
| 40 to 44 Years | 665 (8.4%) | 482 (5.4%) |
| 45 to 49 Years | 564 (7.1%) | 560 (6.2%) |
| 50 to 54 Years | 439 (5.5%) | 582 (6.5%) |
| 55 to 59 Years | 402 (5.1%) | 464 (5.2%) |
| 60 to 64 Years | 560 (7.0%) | 839 (9.3%) |
| 65 to 69 Years | 602 (7.6%) | 459 (5.1%) |
| 70 to 74 Years | 185 (2.3%) | 442 (4.9%) |
| 75 to 79 Years | 105 (1.3%) | 240 (2.7%) |
| 80 to 84 Years | 130 (1.6%) | 292 (3.3%) |
| 85 Years and over | 135 (1.7%) | 175 (1.9%) |
| Total | 7,967 (100.0%) | 8,972 (100.0%) |
Families and Households in Bridgeview
Median Family Size in Bridgeview
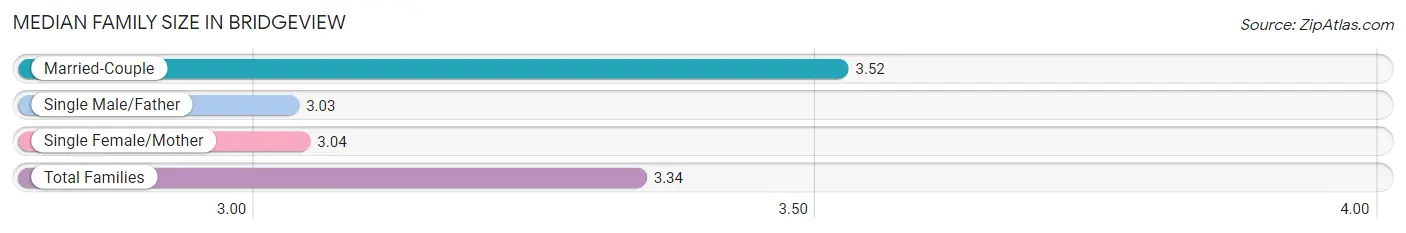
The median family size in Bridgeview is 3.34 persons per family, with married-couple families (2,494 | 62.0%) accounting for the largest median family size of 3.52 persons per family. On the other hand, single male/father families (394 | 9.8%) represent the smallest median family size with 3.03 persons per family.
| Family Type | # Families | Family Size |
| Married-Couple | 2,494 (62.0%) | 3.52 |
| Single Male/Father | 394 (9.8%) | 3.03 |
| Single Female/Mother | 1,134 (28.2%) | 3.04 |
| Total Families | 4,022 (100.0%) | 3.34 |
Median Household Size in Bridgeview
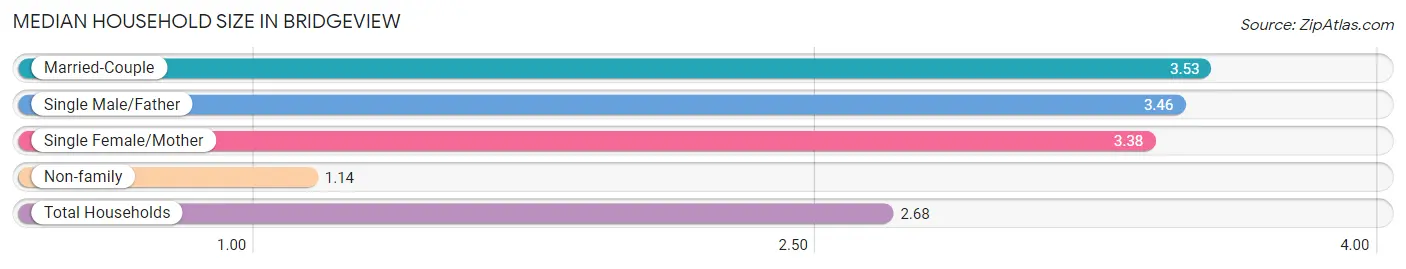
The median household size in Bridgeview is 2.68 persons per household, with married-couple households (2,494 | 40.8%) accounting for the largest median household size of 3.53 persons per household. non-family households (2,096 | 34.3%) represent the smallest median household size with 1.14 persons per household.
| Household Type | # Households | Household Size |
| Married-Couple | 2,494 (40.8%) | 3.53 |
| Single Male/Father | 394 (6.4%) | 3.46 |
| Single Female/Mother | 1,134 (18.5%) | 3.38 |
| Non-family | 2,096 (34.3%) | 1.14 |
| Total Households | 6,118 (100.0%) | 2.68 |
Household Size by Marriage Status in Bridgeview
Out of a total of 6,118 households in Bridgeview, 4,022 (65.7%) are family households, while 2,096 (34.3%) are nonfamily households. The most numerous type of family households are 2-person households, comprising 1,617, and the most common type of nonfamily households are 1-person households, comprising 1,837.
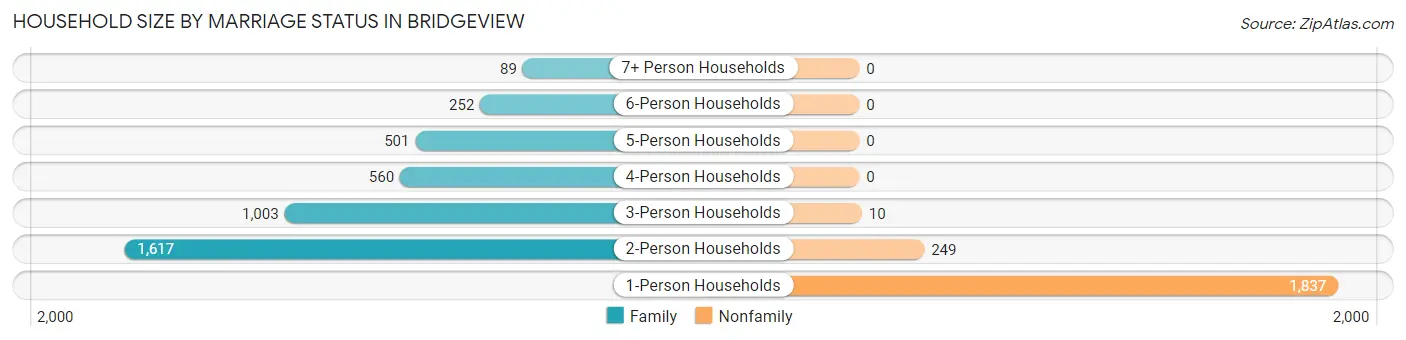
| Household Size | Family Households | Nonfamily Households |
| 1-Person Households | - | 1,837 (30.0%) |
| 2-Person Households | 1,617 (26.4%) | 249 (4.1%) |
| 3-Person Households | 1,003 (16.4%) | 10 (0.2%) |
| 4-Person Households | 560 (9.1%) | 0 (0.0%) |
| 5-Person Households | 501 (8.2%) | 0 (0.0%) |
| 6-Person Households | 252 (4.1%) | 0 (0.0%) |
| 7+ Person Households | 89 (1.5%) | 0 (0.0%) |
| Total | 4,022 (65.7%) | 2,096 (34.3%) |
Female Fertility in Bridgeview
Fertility by Age in Bridgeview
Average fertility rate in Bridgeview is 42.0 births per 1,000 women. Women in the age bracket of 20 to 34 years have the highest fertility rate with 62.0 births per 1,000 women. Women in the age bracket of 20 to 34 years acount for 59.1% of all women with births.
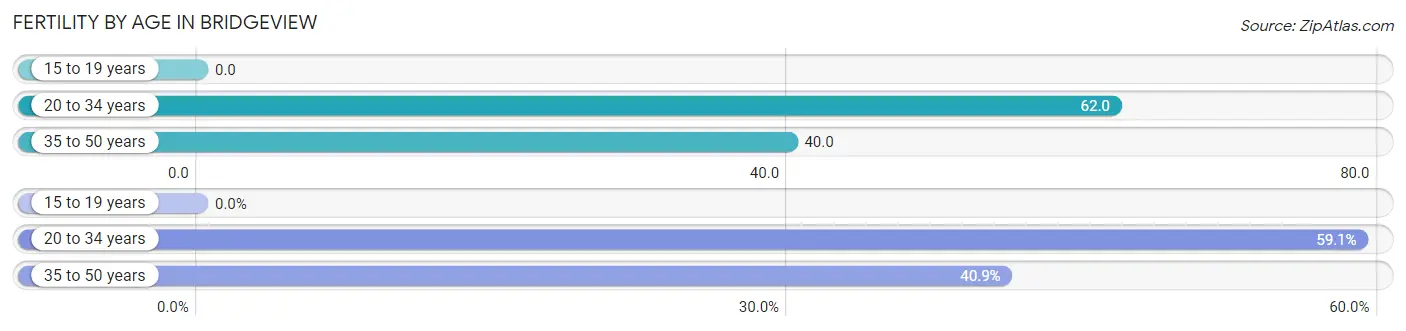
| Age Bracket | Women with Births | Births / 1,000 Women |
| 15 to 19 years | 0 (0.0%) | 0.0 |
| 20 to 34 years | 101 (59.1%) | 62.0 |
| 35 to 50 years | 70 (40.9%) | 40.0 |
| Total | 171 (100.0%) | 42.0 |
Fertility by Age by Marriage Status in Bridgeview
74.3% of women with births (171) in Bridgeview are married. The highest percentage of unmarried women with births falls into 20 to 34 years age bracket with 43.6% of them unmarried at the time of birth, while the lowest percentage of unmarried women with births belong to 35 to 50 years age bracket with 0.0% of them unmarried.
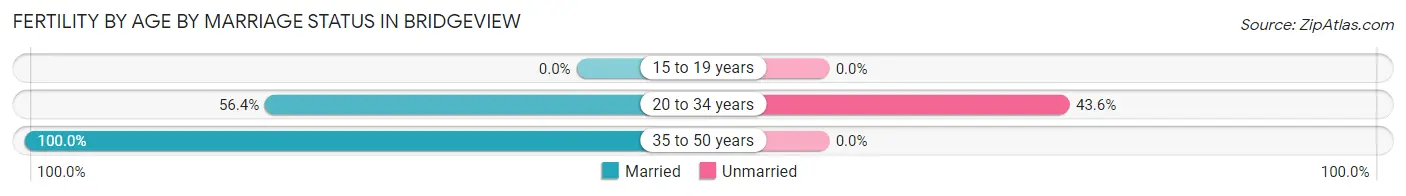
| Age Bracket | Married | Unmarried |
| 15 to 19 years | 0 (0.0%) | 0 (0.0%) |
| 20 to 34 years | 57 (56.4%) | 44 (43.6%) |
| 35 to 50 years | 70 (100.0%) | 0 (0.0%) |
| Total | 127 (74.3%) | 44 (25.7%) |
Fertility by Education in Bridgeview
Average fertility rate in Bridgeview is 42.0 births per 1,000 women. Women with the education attainment of college or associate's degree have the highest fertility rate of 75.0 births per 1,000 women, while women with the education attainment of high school diploma have the lowest fertility at 11.0 births per 1,000 women. Women with the education attainment of college or associate's degree represent 62.6% of all women with births.
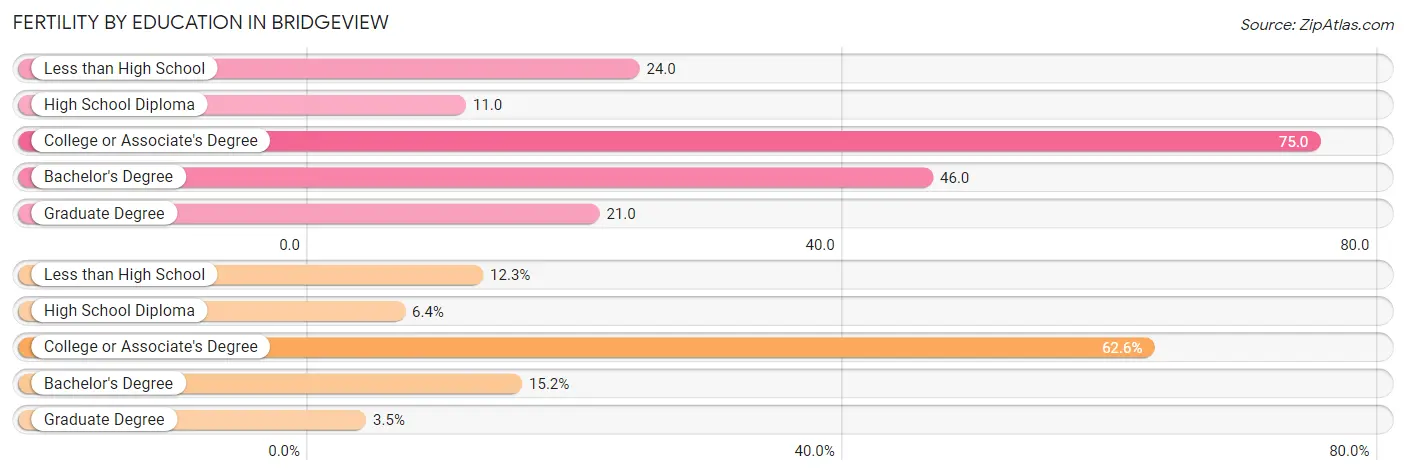
| Educational Attainment | Women with Births | Births / 1,000 Women |
| Less than High School | 21 (12.3%) | 24.0 |
| High School Diploma | 11 (6.4%) | 11.0 |
| College or Associate's Degree | 107 (62.6%) | 75.0 |
| Bachelor's Degree | 26 (15.2%) | 46.0 |
| Graduate Degree | 6 (3.5%) | 21.0 |
| Total | 171 (100.0%) | 42.0 |
Fertility by Education by Marriage Status in Bridgeview
25.7% of women with births in Bridgeview are unmarried. Women with the educational attainment of less than high school are most likely to be married with 100.0% of them married at childbirth, while women with the educational attainment of high school diploma are least likely to be married with 100.0% of them unmarried at childbirth.
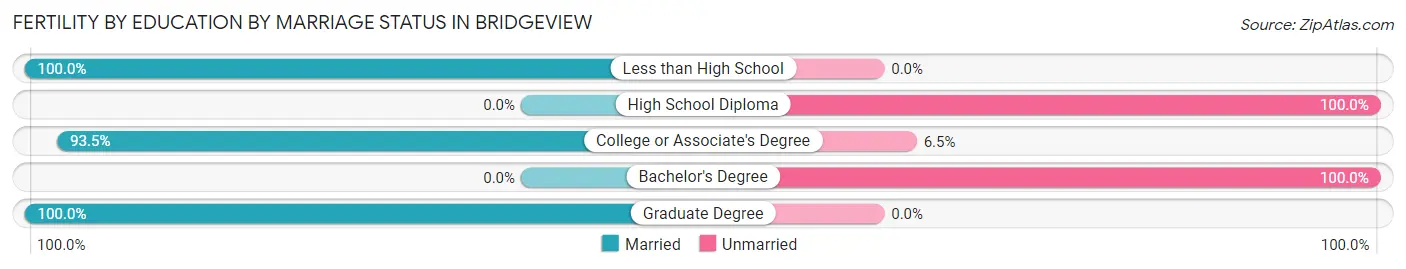
| Educational Attainment | Married | Unmarried |
| Less than High School | 21 (100.0%) | 0 (0.0%) |
| High School Diploma | 0 (0.0%) | 11 (100.0%) |
| College or Associate's Degree | 100 (93.5%) | 7 (6.5%) |
| Bachelor's Degree | 0 (0.0%) | 26 (100.0%) |
| Graduate Degree | 6 (100.0%) | 0 (0.0%) |
| Total | 127 (74.3%) | 44 (25.7%) |
Employment Characteristics in Bridgeview
Employment by Class of Employer in Bridgeview
Among the 7,377 employed individuals in Bridgeview, private company employees (5,237 | 71.0%), not-for-profit organizations (555 | 7.5%), and self-employed (incorporated) (537 | 7.3%) make up the most common classes of employment.
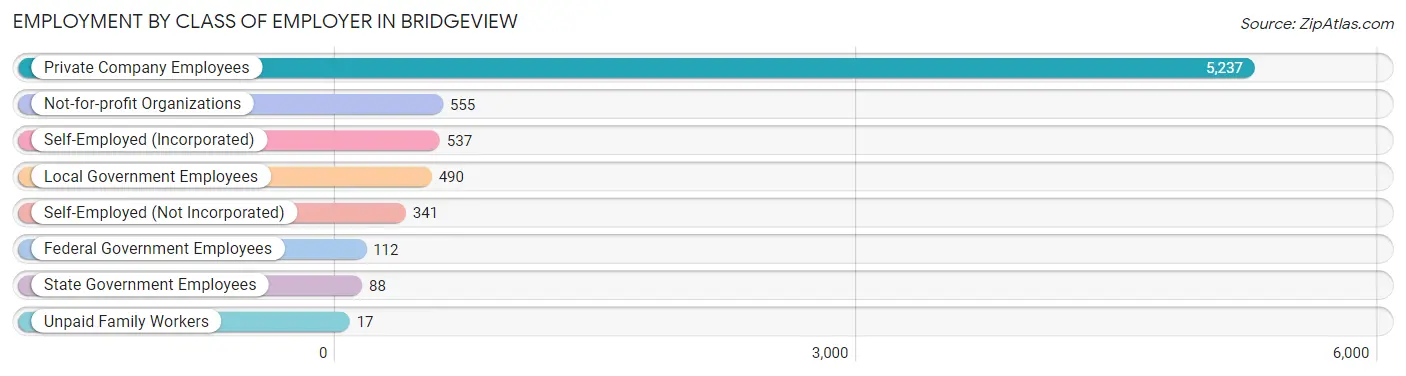
| Employer Class | # Employees | % Employees |
| Private Company Employees | 5,237 | 71.0% |
| Self-Employed (Incorporated) | 537 | 7.3% |
| Self-Employed (Not Incorporated) | 341 | 4.6% |
| Not-for-profit Organizations | 555 | 7.5% |
| Local Government Employees | 490 | 6.6% |
| State Government Employees | 88 | 1.2% |
| Federal Government Employees | 112 | 1.5% |
| Unpaid Family Workers | 17 | 0.2% |
| Total | 7,377 | 100.0% |
Employment Status by Age in Bridgeview
According to the labor force statistics for Bridgeview, out of the total population over 16 years of age (13,732), 59.7% or 8,198 individuals are in the labor force, with 8.5% or 697 of them unemployed. The age group with the highest labor force participation rate is 20 to 24 years, with 85.8% or 744 individuals in the labor force. Within the labor force, the 20 to 24 years age range has the highest percentage of unemployed individuals, with 21.1% or 157 of them being unemployed.
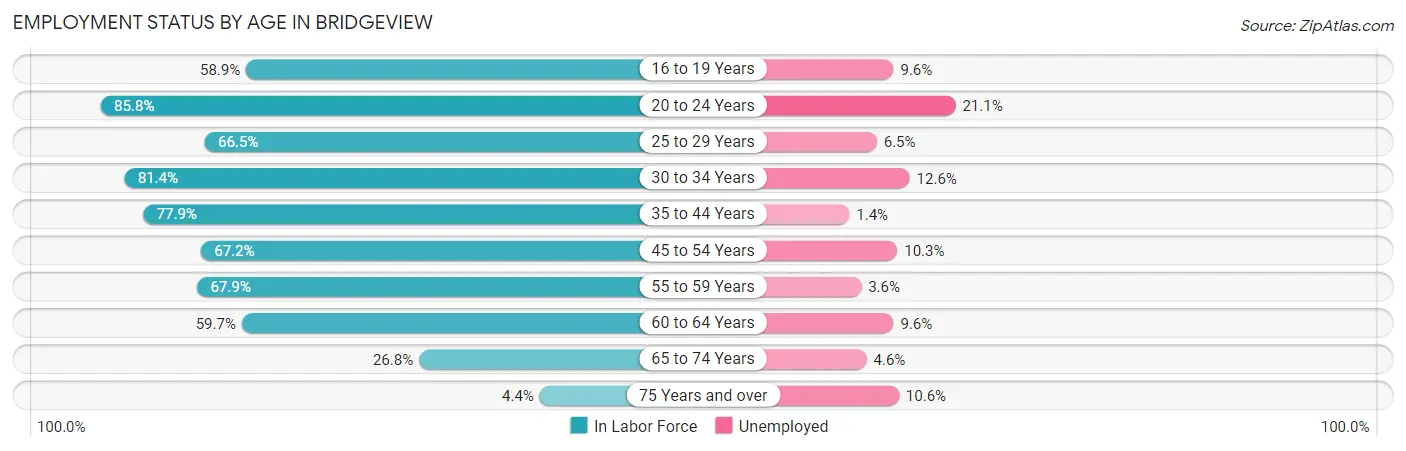
| Age Bracket | In Labor Force | Unemployed |
| 16 to 19 Years | 738 (58.9%) | 71 (9.6%) |
| 20 to 24 Years | 744 (85.8%) | 157 (21.1%) |
| 25 to 29 Years | 833 (66.5%) | 54 (6.5%) |
| 30 to 34 Years | 940 (81.4%) | 118 (12.6%) |
| 35 to 44 Years | 1,581 (77.9%) | 22 (1.4%) |
| 45 to 54 Years | 1,441 (67.2%) | 148 (10.3%) |
| 55 to 59 Years | 588 (67.9%) | 21 (3.6%) |
| 60 to 64 Years | 835 (59.7%) | 80 (9.6%) |
| 65 to 74 Years | 452 (26.8%) | 21 (4.6%) |
| 75 Years and over | 47 (4.4%) | 5 (10.6%) |
| Total | 8,198 (59.7%) | 697 (8.5%) |
Employment Status by Educational Attainment in Bridgeview
According to labor force statistics for Bridgeview, 70.3% of individuals (6,219) out of the total population between 25 and 64 years of age (8,847) are in the labor force, with 7.1% or 442 of them being unemployed. The group with the highest labor force participation rate are those with the educational attainment of bachelor's degree or higher, with 76.6% or 1,246 individuals in the labor force. Within the labor force, individuals with less than high school education have the highest percentage of unemployment, with 24.5% or 205 of them being unemployed.
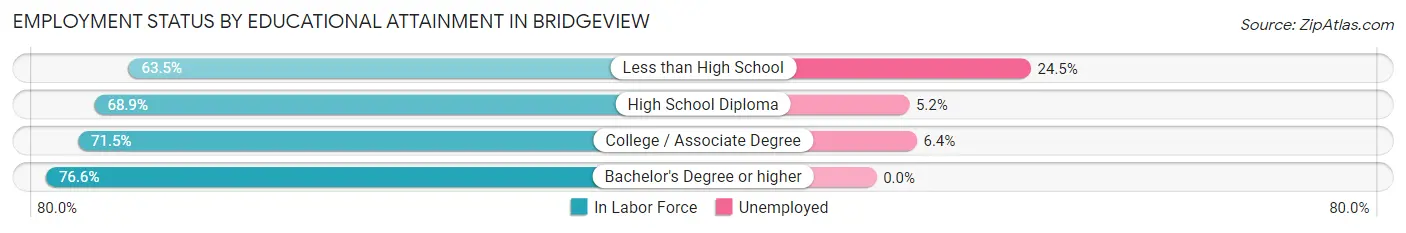
| Educational Attainment | In Labor Force | Unemployed |
| Less than High School | 837 (63.5%) | 323 (24.5%) |
| High School Diploma | 2,252 (68.9%) | 170 (5.2%) |
| College / Associate Degree | 1,883 (71.5%) | 169 (6.4%) |
| Bachelor's Degree or higher | 1,246 (76.6%) | 0 (0.0%) |
| Total | 6,219 (70.3%) | 628 (7.1%) |
Employment Occupations by Sex in Bridgeview
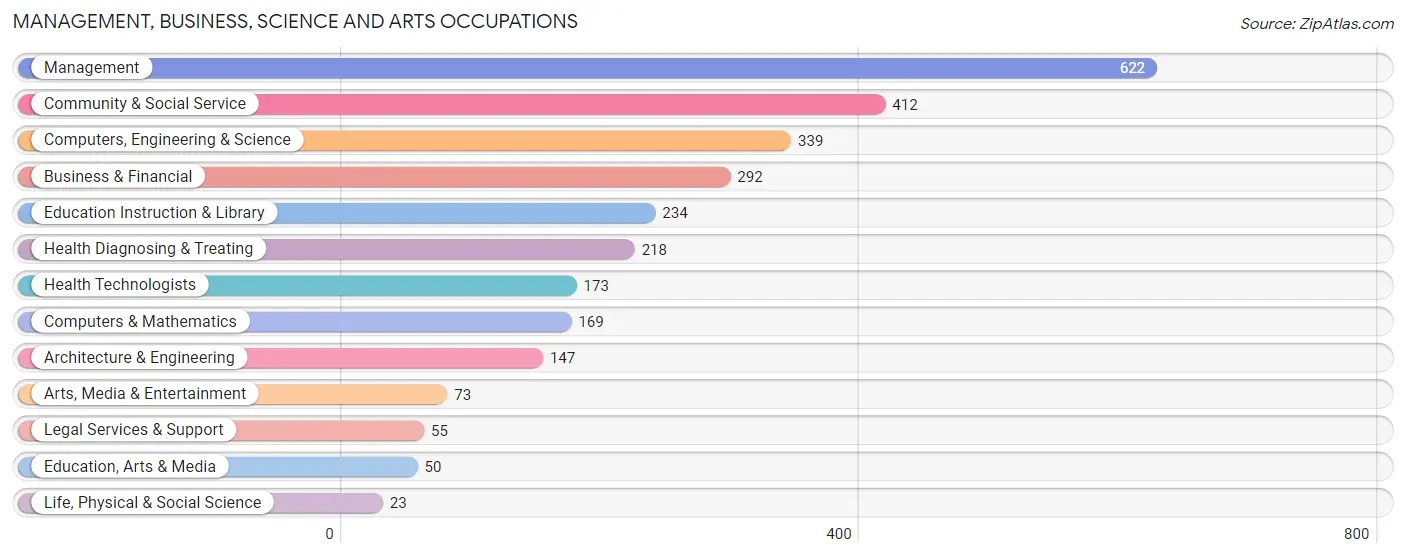
Management, Business, Science and Arts Occupations
The most common Management, Business, Science and Arts occupations in Bridgeview are Management (622 | 8.3%), Community & Social Service (412 | 5.5%), Computers, Engineering & Science (339 | 4.5%), Business & Financial (292 | 3.9%), and Education Instruction & Library (234 | 3.1%).
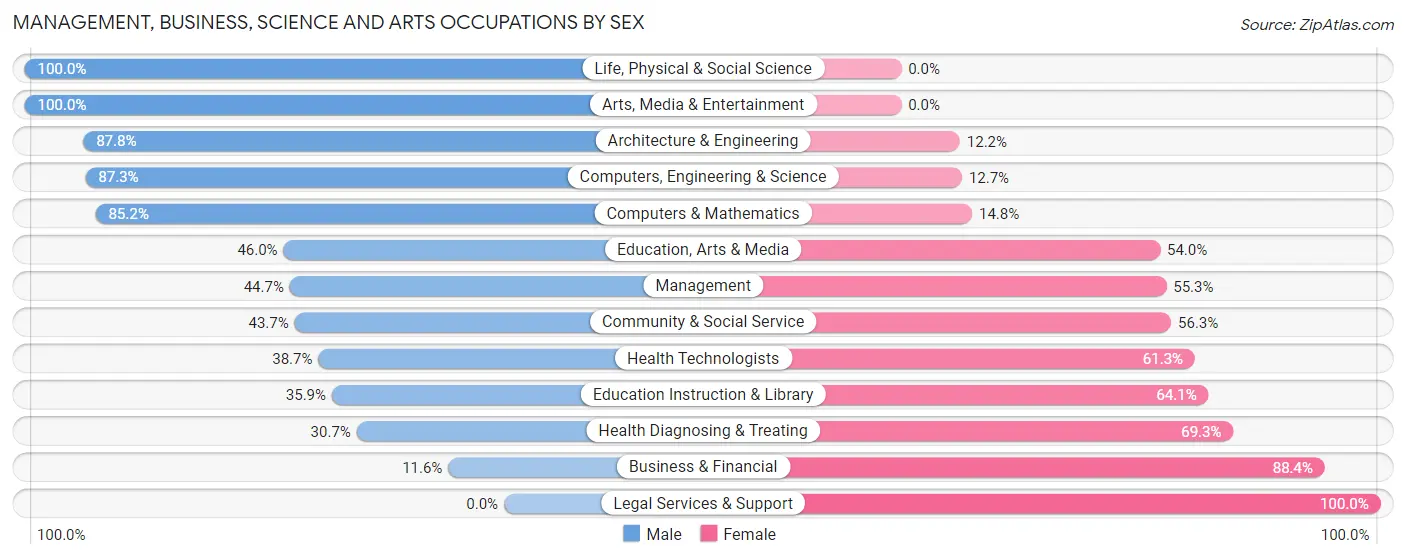
Management, Business, Science and Arts Occupations by Sex
Within the Management, Business, Science and Arts occupations in Bridgeview, the most male-oriented occupations are Life, Physical & Social Science (100.0%), Arts, Media & Entertainment (100.0%), and Architecture & Engineering (87.8%), while the most female-oriented occupations are Legal Services & Support (100.0%), Business & Financial (88.4%), and Health Diagnosing & Treating (69.3%).
| Occupation | Male | Female |
| Management | 278 (44.7%) | 344 (55.3%) |
| Business & Financial | 34 (11.6%) | 258 (88.4%) |
| Computers, Engineering & Science | 296 (87.3%) | 43 (12.7%) |
| Computers & Mathematics | 144 (85.2%) | 25 (14.8%) |
| Architecture & Engineering | 129 (87.8%) | 18 (12.2%) |
| Life, Physical & Social Science | 23 (100.0%) | 0 (0.0%) |
| Community & Social Service | 180 (43.7%) | 232 (56.3%) |
| Education, Arts & Media | 23 (46.0%) | 27 (54.0%) |
| Legal Services & Support | 0 (0.0%) | 55 (100.0%) |
| Education Instruction & Library | 84 (35.9%) | 150 (64.1%) |
| Arts, Media & Entertainment | 73 (100.0%) | 0 (0.0%) |
| Health Diagnosing & Treating | 67 (30.7%) | 151 (69.3%) |
| Health Technologists | 67 (38.7%) | 106 (61.3%) |
| Total (Category) | 855 (45.4%) | 1,028 (54.6%) |
| Total (Overall) | 4,020 (53.6%) | 3,483 (46.4%) |
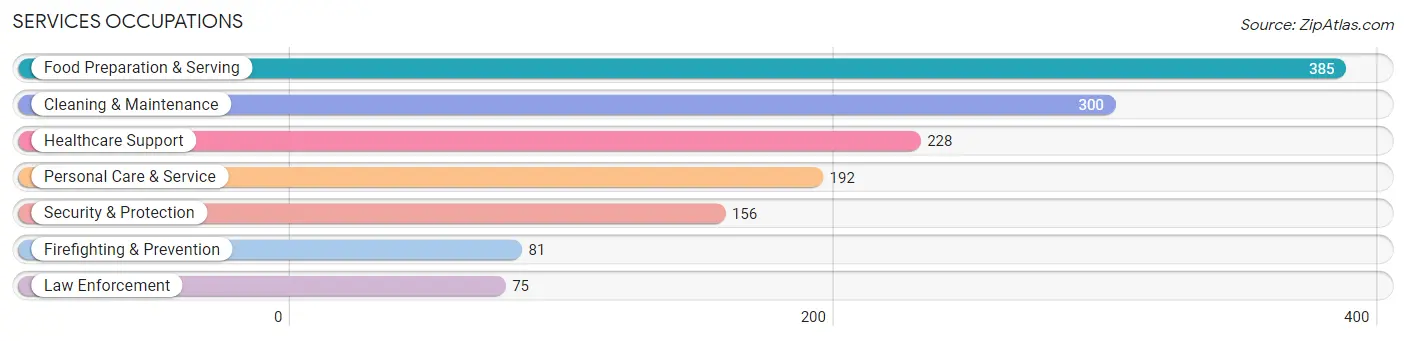
Services Occupations
The most common Services occupations in Bridgeview are Food Preparation & Serving (385 | 5.1%), Cleaning & Maintenance (300 | 4.0%), Healthcare Support (228 | 3.0%), Personal Care & Service (192 | 2.6%), and Security & Protection (156 | 2.1%).
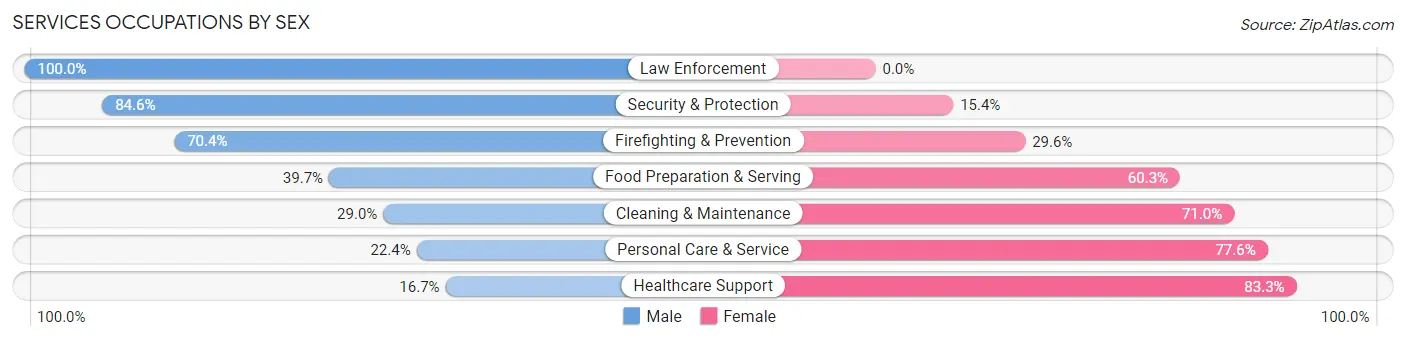
Services Occupations by Sex
Within the Services occupations in Bridgeview, the most male-oriented occupations are Law Enforcement (100.0%), Security & Protection (84.6%), and Firefighting & Prevention (70.4%), while the most female-oriented occupations are Healthcare Support (83.3%), Personal Care & Service (77.6%), and Cleaning & Maintenance (71.0%).
| Occupation | Male | Female |
| Healthcare Support | 38 (16.7%) | 190 (83.3%) |
| Security & Protection | 132 (84.6%) | 24 (15.4%) |
| Firefighting & Prevention | 57 (70.4%) | 24 (29.6%) |
| Law Enforcement | 75 (100.0%) | 0 (0.0%) |
| Food Preparation & Serving | 153 (39.7%) | 232 (60.3%) |
| Cleaning & Maintenance | 87 (29.0%) | 213 (71.0%) |
| Personal Care & Service | 43 (22.4%) | 149 (77.6%) |
| Total (Category) | 453 (35.9%) | 808 (64.1%) |
| Total (Overall) | 4,020 (53.6%) | 3,483 (46.4%) |
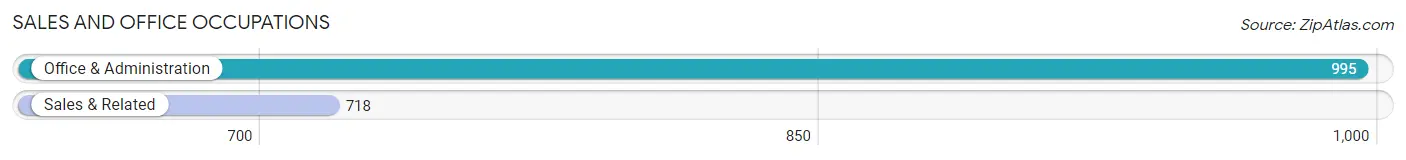
Sales and Office Occupations
The most common Sales and Office occupations in Bridgeview are Office & Administration (995 | 13.3%), and Sales & Related (718 | 9.6%).
Sales and Office Occupations by Sex
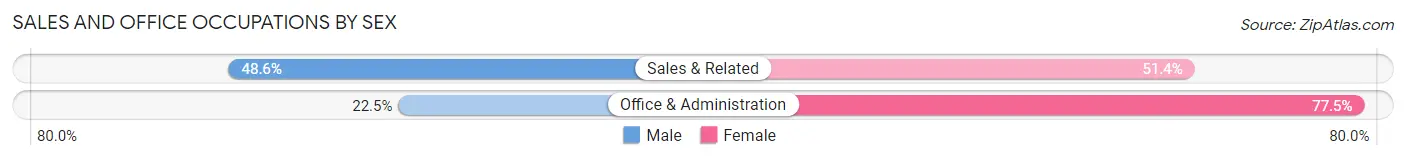
| Occupation | Male | Female |
| Sales & Related | 349 (48.6%) | 369 (51.4%) |
| Office & Administration | 224 (22.5%) | 771 (77.5%) |
| Total (Category) | 573 (33.5%) | 1,140 (66.5%) |
| Total (Overall) | 4,020 (53.6%) | 3,483 (46.4%) |
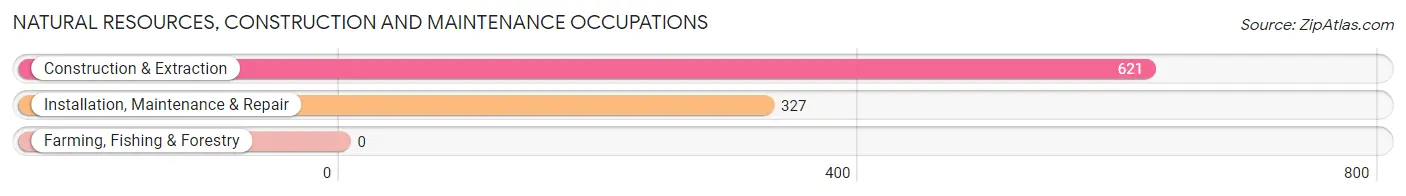
Natural Resources, Construction and Maintenance Occupations
The most common Natural Resources, Construction and Maintenance occupations in Bridgeview are Construction & Extraction (621 | 8.3%), and Installation, Maintenance & Repair (327 | 4.4%).
Natural Resources, Construction and Maintenance Occupations by Sex
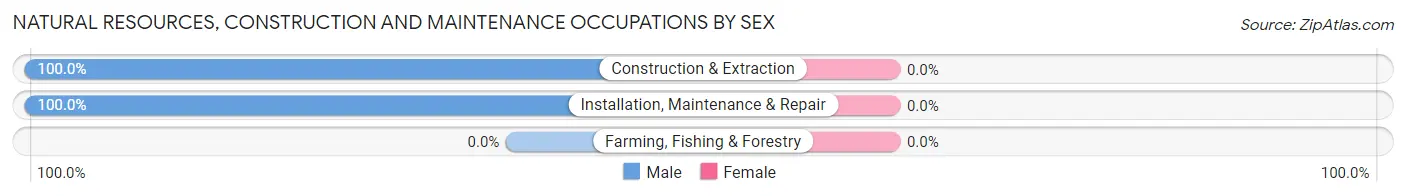
| Occupation | Male | Female |
| Farming, Fishing & Forestry | 0 (0.0%) | 0 (0.0%) |
| Construction & Extraction | 621 (100.0%) | 0 (0.0%) |
| Installation, Maintenance & Repair | 327 (100.0%) | 0 (0.0%) |
| Total (Category) | 948 (100.0%) | 0 (0.0%) |
| Total (Overall) | 4,020 (53.6%) | 3,483 (46.4%) |
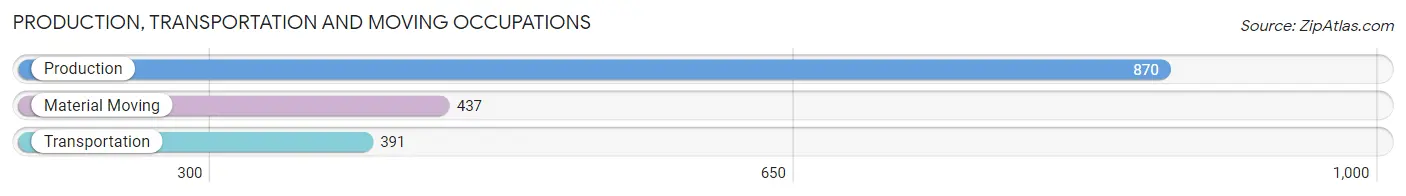
Production, Transportation and Moving Occupations
The most common Production, Transportation and Moving occupations in Bridgeview are Production (870 | 11.6%), Material Moving (437 | 5.8%), and Transportation (391 | 5.2%).
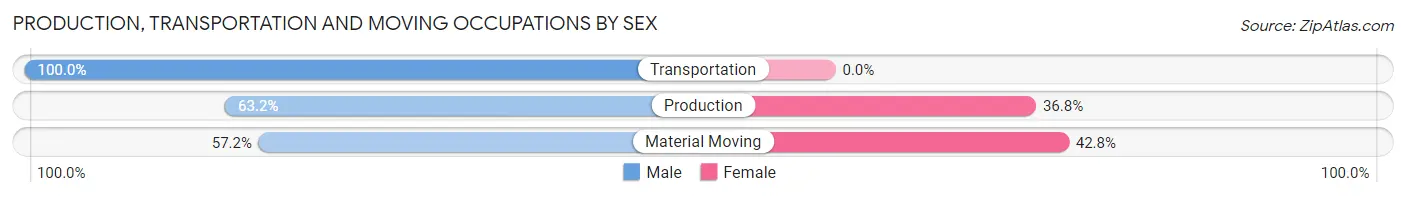
Production, Transportation and Moving Occupations by Sex
| Occupation | Male | Female |
| Production | 550 (63.2%) | 320 (36.8%) |
| Transportation | 391 (100.0%) | 0 (0.0%) |
| Material Moving | 250 (57.2%) | 187 (42.8%) |
| Total (Category) | 1,191 (70.1%) | 507 (29.9%) |
| Total (Overall) | 4,020 (53.6%) | 3,483 (46.4%) |
Employment Industries by Sex in Bridgeview
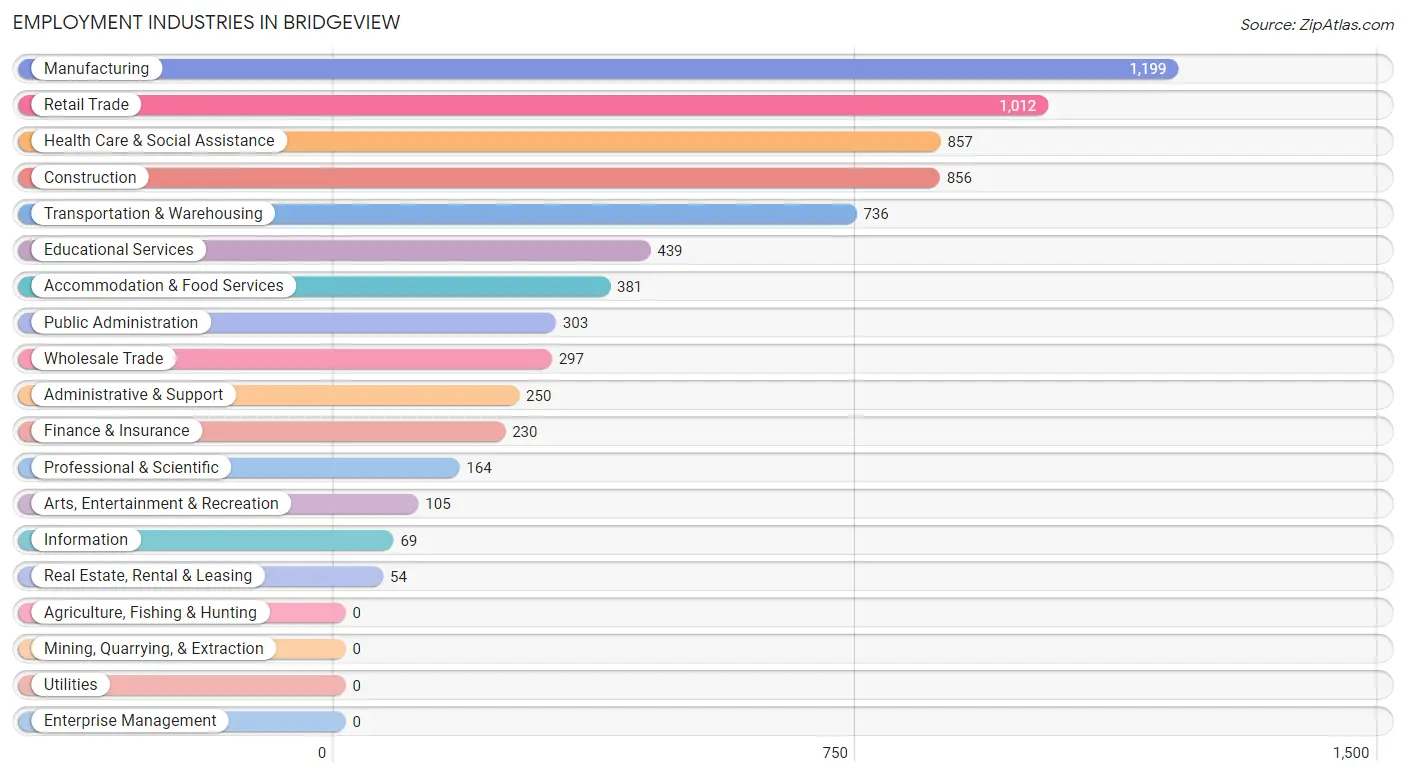
Employment Industries in Bridgeview
The major employment industries in Bridgeview include Manufacturing (1,199 | 16.0%), Retail Trade (1,012 | 13.5%), Health Care & Social Assistance (857 | 11.4%), Construction (856 | 11.4%), and Transportation & Warehousing (736 | 9.8%).
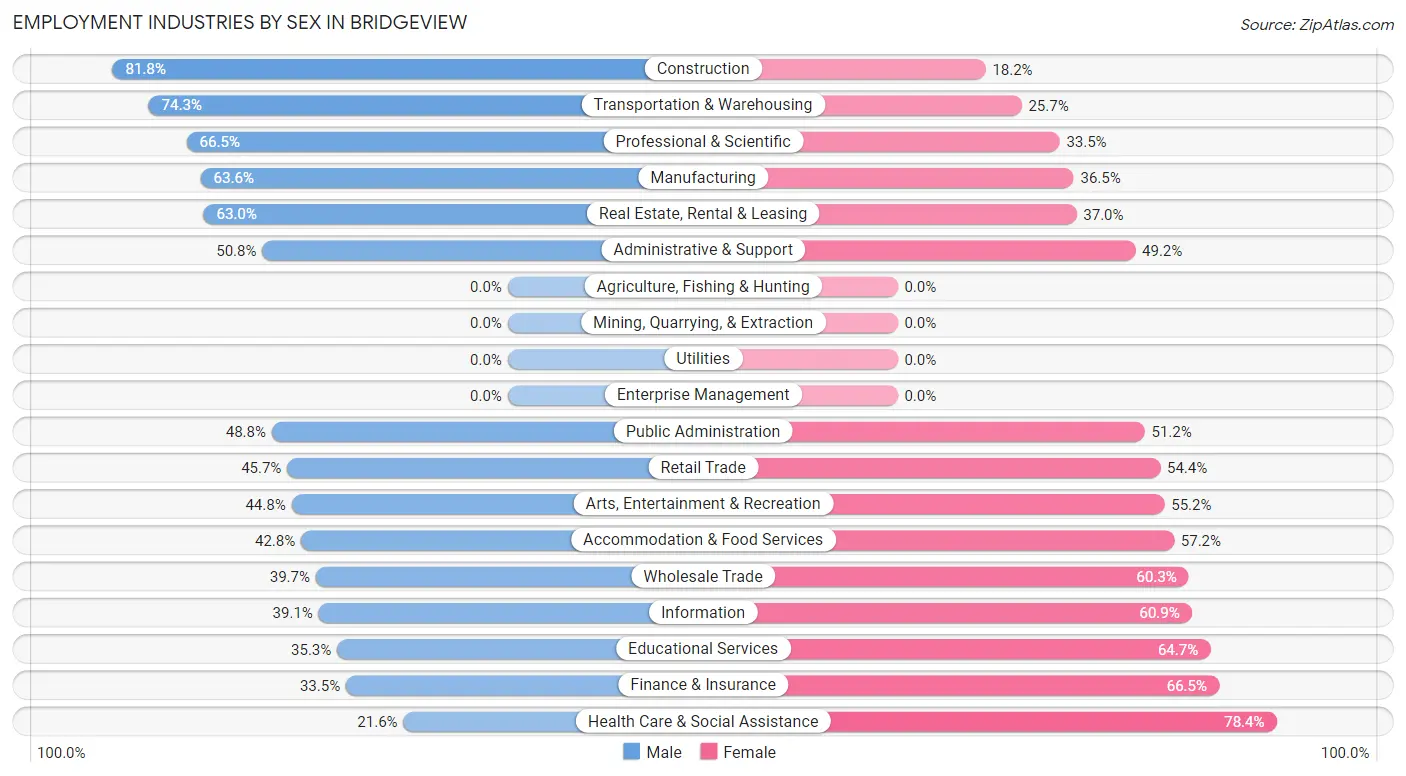
Employment Industries by Sex in Bridgeview
The Bridgeview industries that see more men than women are Construction (81.8%), Transportation & Warehousing (74.3%), and Professional & Scientific (66.5%), whereas the industries that tend to have a higher number of women are Health Care & Social Assistance (78.4%), Finance & Insurance (66.5%), and Educational Services (64.7%).
| Industry | Male | Female |
| Agriculture, Fishing & Hunting | 0 (0.0%) | 0 (0.0%) |
| Mining, Quarrying, & Extraction | 0 (0.0%) | 0 (0.0%) |
| Construction | 700 (81.8%) | 156 (18.2%) |
| Manufacturing | 762 (63.5%) | 437 (36.4%) |
| Wholesale Trade | 118 (39.7%) | 179 (60.3%) |
| Retail Trade | 462 (45.7%) | 550 (54.3%) |
| Transportation & Warehousing | 547 (74.3%) | 189 (25.7%) |
| Utilities | 0 (0.0%) | 0 (0.0%) |
| Information | 27 (39.1%) | 42 (60.9%) |
| Finance & Insurance | 77 (33.5%) | 153 (66.5%) |
| Real Estate, Rental & Leasing | 34 (63.0%) | 20 (37.0%) |
| Professional & Scientific | 109 (66.5%) | 55 (33.5%) |
| Enterprise Management | 0 (0.0%) | 0 (0.0%) |
| Administrative & Support | 127 (50.8%) | 123 (49.2%) |
| Educational Services | 155 (35.3%) | 284 (64.7%) |
| Health Care & Social Assistance | 185 (21.6%) | 672 (78.4%) |
| Arts, Entertainment & Recreation | 47 (44.8%) | 58 (55.2%) |
| Accommodation & Food Services | 163 (42.8%) | 218 (57.2%) |
| Public Administration | 148 (48.8%) | 155 (51.2%) |
| Total | 4,020 (53.6%) | 3,483 (46.4%) |
Education in Bridgeview
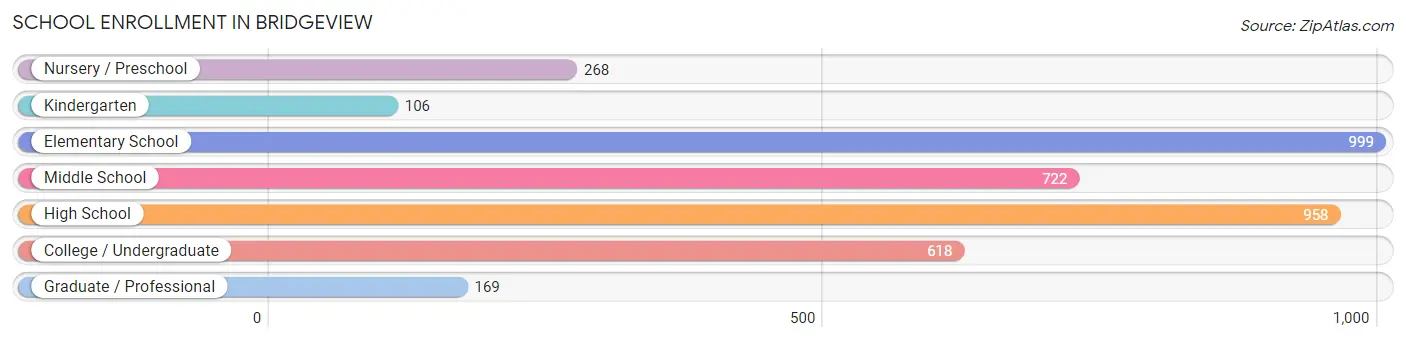
School Enrollment in Bridgeview
The most common levels of schooling among the 3,840 students in Bridgeview are elementary school (999 | 26.0%), high school (958 | 24.9%), and middle school (722 | 18.8%).
| School Level | # Students | % Students |
| Nursery / Preschool | 268 | 7.0% |
| Kindergarten | 106 | 2.8% |
| Elementary School | 999 | 26.0% |
| Middle School | 722 | 18.8% |
| High School | 958 | 24.9% |
| College / Undergraduate | 618 | 16.1% |
| Graduate / Professional | 169 | 4.4% |
| Total | 3,840 | 100.0% |
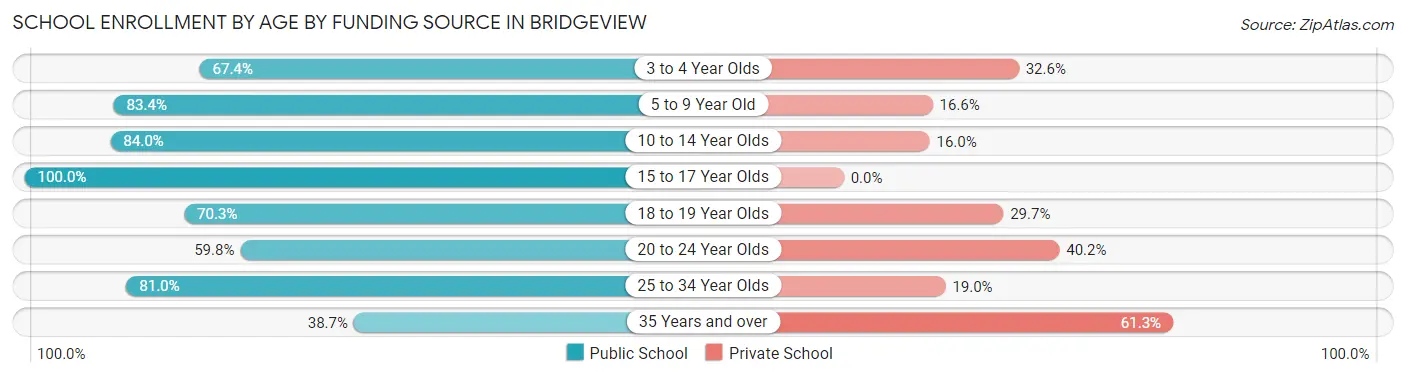
School Enrollment by Age by Funding Source in Bridgeview
Out of a total of 3,840 students who are enrolled in schools in Bridgeview, 707 (18.4%) attend a private institution, while the remaining 3,133 (81.6%) are enrolled in public schools. The age group of 35 years and over has the highest likelihood of being enrolled in private schools, with 65 (61.3% in the age bracket) enrolled. Conversely, the age group of 15 to 17 year olds has the lowest likelihood of being enrolled in a private school, with 738 (100.0% in the age bracket) attending a public institution.
| Age Bracket | Public School | Private School |
| 3 to 4 Year Olds | 186 (67.4%) | 90 (32.6%) |
| 5 to 9 Year Old | 882 (83.4%) | 175 (16.6%) |
| 10 to 14 Year Olds | 699 (84.0%) | 133 (16.0%) |
| 15 to 17 Year Olds | 738 (100.0%) | 0 (0.0%) |
| 18 to 19 Year Olds | 227 (70.3%) | 96 (29.7%) |
| 20 to 24 Year Olds | 143 (59.8%) | 96 (40.2%) |
| 25 to 34 Year Olds | 218 (81.0%) | 51 (19.0%) |
| 35 Years and over | 41 (38.7%) | 65 (61.3%) |
| Total | 3,133 (81.6%) | 707 (18.4%) |
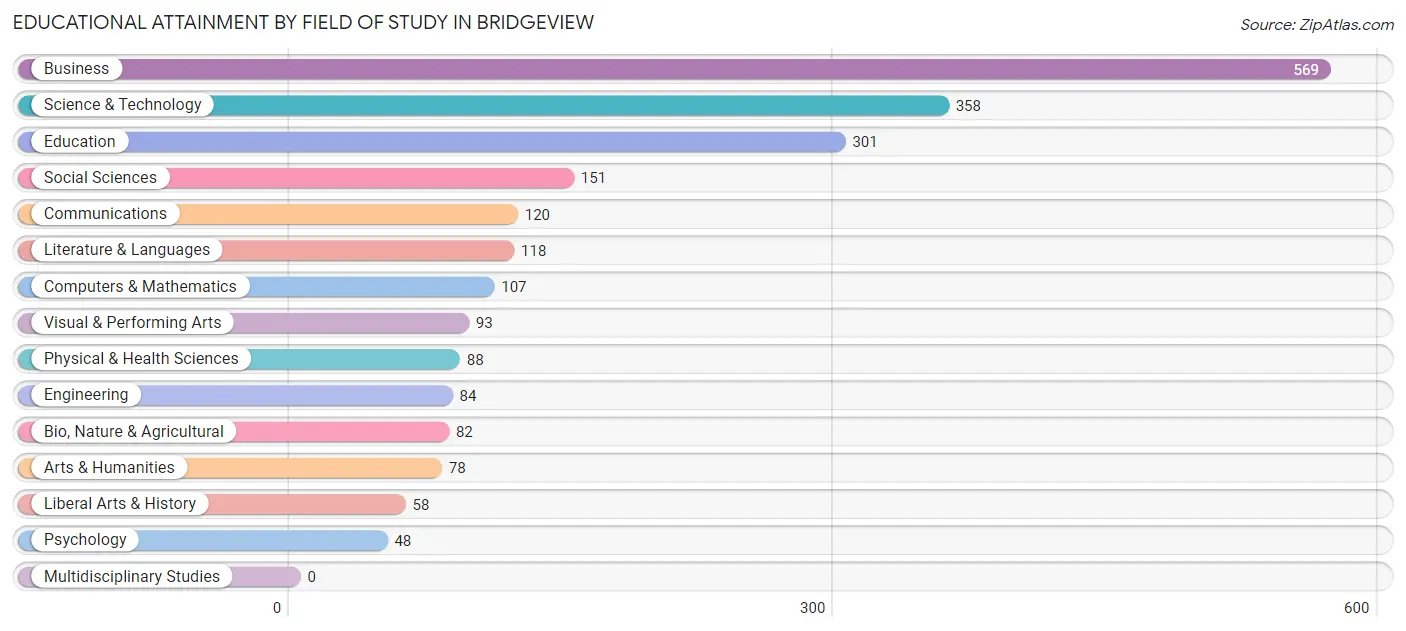
Educational Attainment by Field of Study in Bridgeview
Business (569 | 25.2%), science & technology (358 | 15.9%), education (301 | 13.4%), social sciences (151 | 6.7%), and communications (120 | 5.3%) are the most common fields of study among 2,255 individuals in Bridgeview who have obtained a bachelor's degree or higher.
| Field of Study | # Graduates | % Graduates |
| Computers & Mathematics | 107 | 4.8% |
| Bio, Nature & Agricultural | 82 | 3.6% |
| Physical & Health Sciences | 88 | 3.9% |
| Psychology | 48 | 2.1% |
| Social Sciences | 151 | 6.7% |
| Engineering | 84 | 3.7% |
| Multidisciplinary Studies | 0 | 0.0% |
| Science & Technology | 358 | 15.9% |
| Business | 569 | 25.2% |
| Education | 301 | 13.4% |
| Literature & Languages | 118 | 5.2% |
| Liberal Arts & History | 58 | 2.6% |
| Visual & Performing Arts | 93 | 4.1% |
| Communications | 120 | 5.3% |
| Arts & Humanities | 78 | 3.5% |
| Total | 2,255 | 100.0% |
Transportation & Commute in Bridgeview
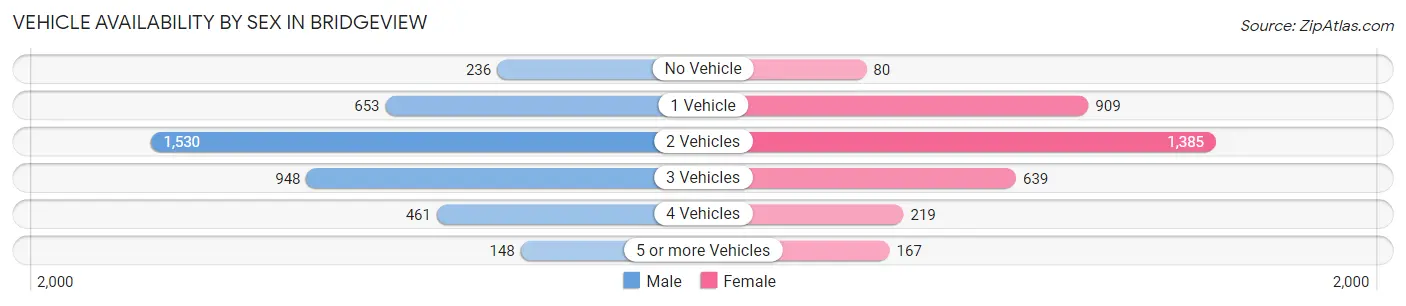
Vehicle Availability by Sex in Bridgeview
The most prevalent vehicle ownership categories in Bridgeview are males with 2 vehicles (1,530, accounting for 38.5%) and females with 2 vehicles (1,385, making up 45.0%).
| Vehicles Available | Male | Female |
| No Vehicle | 236 (5.9%) | 80 (2.4%) |
| 1 Vehicle | 653 (16.4%) | 909 (26.7%) |
| 2 Vehicles | 1,530 (38.5%) | 1,385 (40.7%) |
| 3 Vehicles | 948 (23.8%) | 639 (18.8%) |
| 4 Vehicles | 461 (11.6%) | 219 (6.4%) |
| 5 or more Vehicles | 148 (3.7%) | 167 (4.9%) |
| Total | 3,976 (100.0%) | 3,399 (100.0%) |
Commute Time in Bridgeview
The most frequently occuring commute durations in Bridgeview are 45 to 59 minutes (1,293 commuters, 18.9%), 30 to 34 minutes (1,133 commuters, 16.6%), and 15 to 19 minutes (975 commuters, 14.3%).
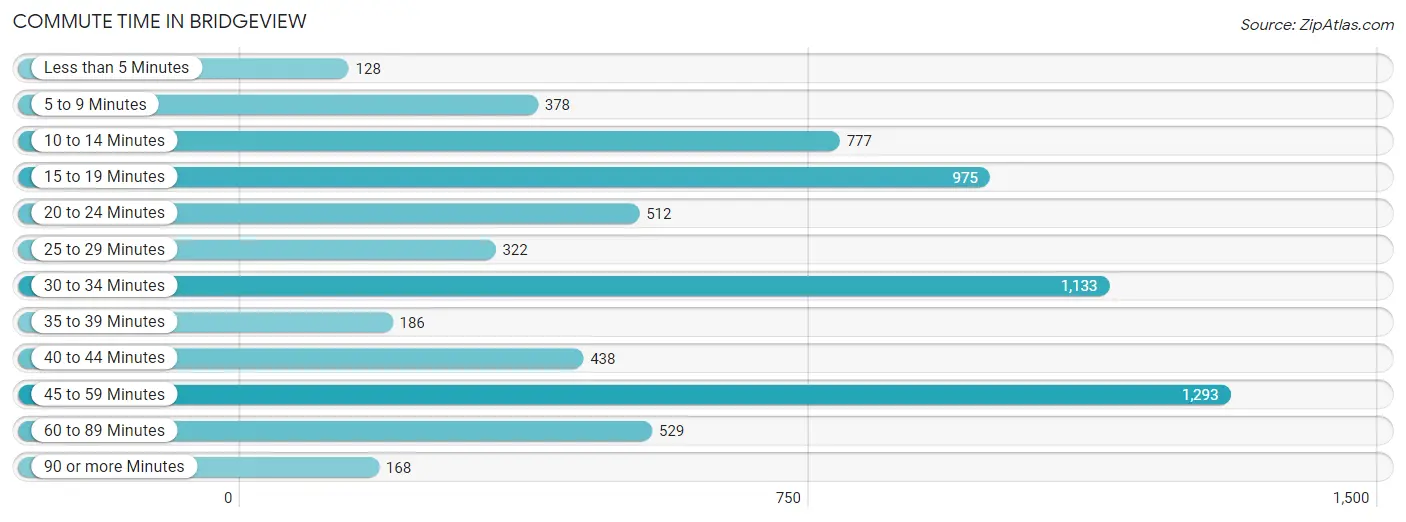
| Commute Time | # Commuters | % Commuters |
| Less than 5 Minutes | 128 | 1.9% |
| 5 to 9 Minutes | 378 | 5.5% |
| 10 to 14 Minutes | 777 | 11.4% |
| 15 to 19 Minutes | 975 | 14.3% |
| 20 to 24 Minutes | 512 | 7.5% |
| 25 to 29 Minutes | 322 | 4.7% |
| 30 to 34 Minutes | 1,133 | 16.6% |
| 35 to 39 Minutes | 186 | 2.7% |
| 40 to 44 Minutes | 438 | 6.4% |
| 45 to 59 Minutes | 1,293 | 18.9% |
| 60 to 89 Minutes | 529 | 7.7% |
| 90 or more Minutes | 168 | 2.5% |
Commute Time by Sex in Bridgeview
The most common commute times in Bridgeview are 45 to 59 minutes (900 commuters, 24.1%) for males and 15 to 19 minutes (550 commuters, 17.7%) for females.
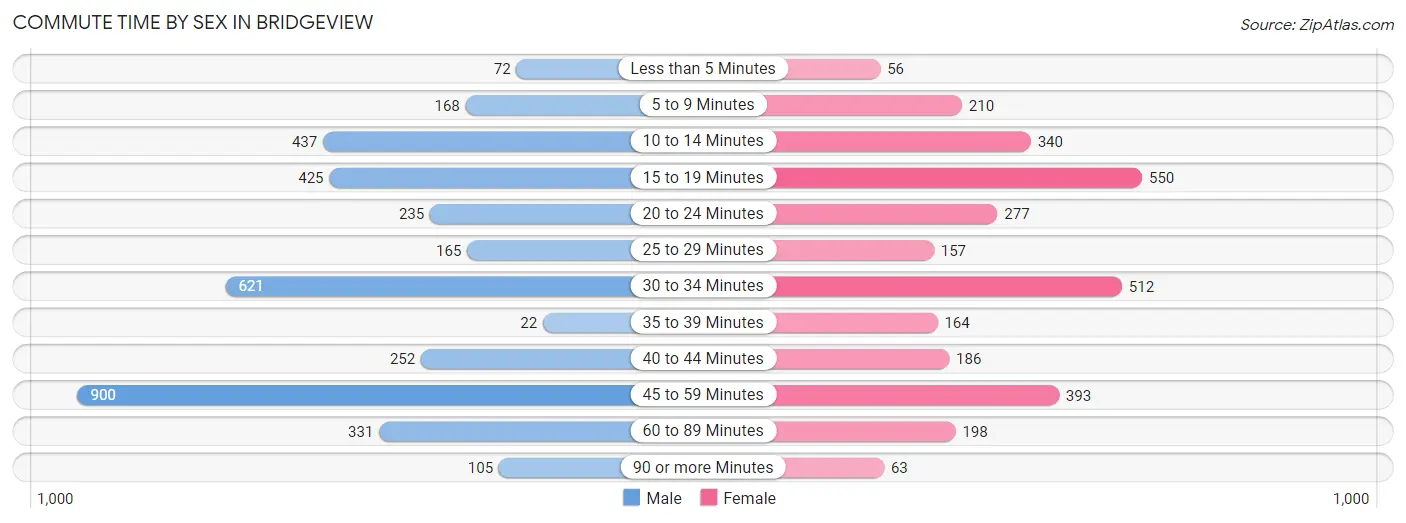
| Commute Time | Male | Female |
| Less than 5 Minutes | 72 (1.9%) | 56 (1.8%) |
| 5 to 9 Minutes | 168 (4.5%) | 210 (6.8%) |
| 10 to 14 Minutes | 437 (11.7%) | 340 (11.0%) |
| 15 to 19 Minutes | 425 (11.4%) | 550 (17.7%) |
| 20 to 24 Minutes | 235 (6.3%) | 277 (8.9%) |
| 25 to 29 Minutes | 165 (4.4%) | 157 (5.1%) |
| 30 to 34 Minutes | 621 (16.6%) | 512 (16.5%) |
| 35 to 39 Minutes | 22 (0.6%) | 164 (5.3%) |
| 40 to 44 Minutes | 252 (6.8%) | 186 (6.0%) |
| 45 to 59 Minutes | 900 (24.1%) | 393 (12.7%) |
| 60 to 89 Minutes | 331 (8.9%) | 198 (6.4%) |
| 90 or more Minutes | 105 (2.8%) | 63 (2.0%) |
Time of Departure to Work by Sex in Bridgeview
The most frequent times of departure to work in Bridgeview are 5:00 AM to 5:29 AM (753, 20.2%) for males and 8:00 AM to 8:29 AM (481, 15.5%) for females.
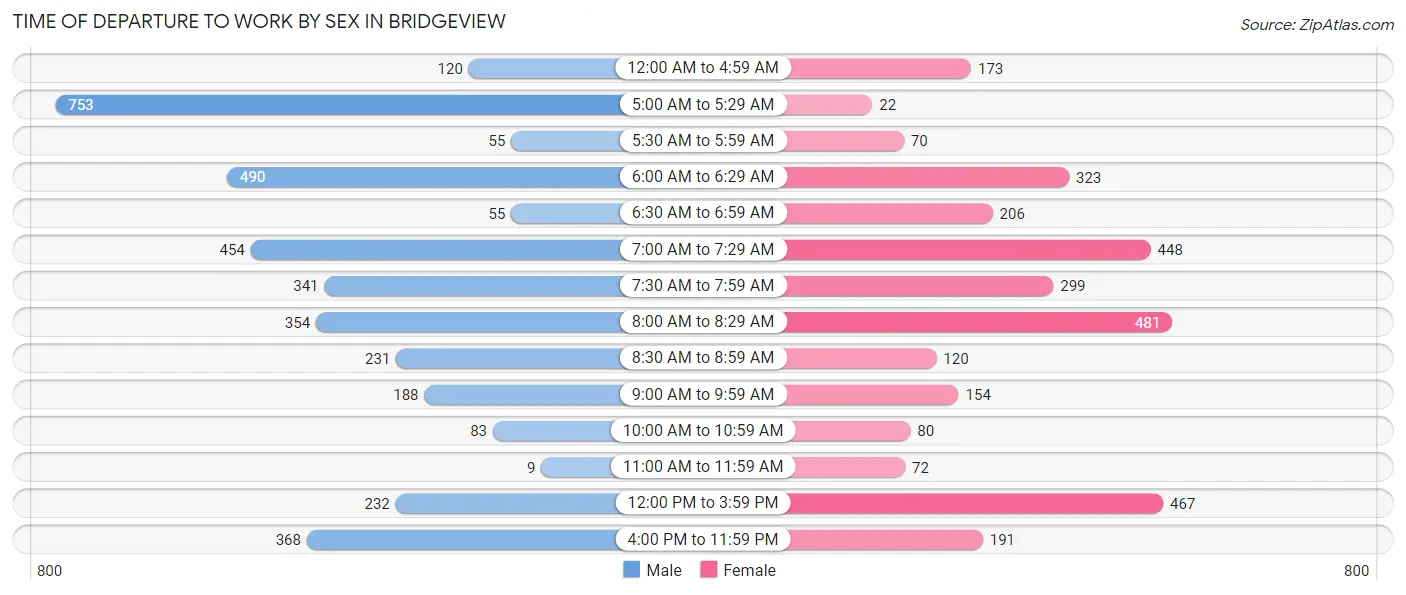
| Time of Departure | Male | Female |
| 12:00 AM to 4:59 AM | 120 (3.2%) | 173 (5.6%) |
| 5:00 AM to 5:29 AM | 753 (20.2%) | 22 (0.7%) |
| 5:30 AM to 5:59 AM | 55 (1.5%) | 70 (2.2%) |
| 6:00 AM to 6:29 AM | 490 (13.1%) | 323 (10.4%) |
| 6:30 AM to 6:59 AM | 55 (1.5%) | 206 (6.6%) |
| 7:00 AM to 7:29 AM | 454 (12.2%) | 448 (14.4%) |
| 7:30 AM to 7:59 AM | 341 (9.1%) | 299 (9.6%) |
| 8:00 AM to 8:29 AM | 354 (9.5%) | 481 (15.5%) |
| 8:30 AM to 8:59 AM | 231 (6.2%) | 120 (3.9%) |
| 9:00 AM to 9:59 AM | 188 (5.0%) | 154 (5.0%) |
| 10:00 AM to 10:59 AM | 83 (2.2%) | 80 (2.6%) |
| 11:00 AM to 11:59 AM | 9 (0.2%) | 72 (2.3%) |
| 12:00 PM to 3:59 PM | 232 (6.2%) | 467 (15.0%) |
| 4:00 PM to 11:59 PM | 368 (9.9%) | 191 (6.1%) |
| Total | 3,733 (100.0%) | 3,106 (100.0%) |
Housing Occupancy in Bridgeview
Occupancy by Ownership in Bridgeview
Of the total 6,118 dwellings in Bridgeview, owner-occupied units account for 4,076 (66.6%), while renter-occupied units make up 2,042 (33.4%).
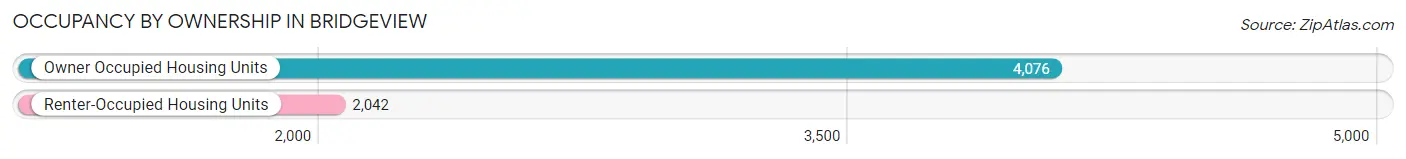
| Occupancy | # Housing Units | % Housing Units |
| Owner Occupied Housing Units | 4,076 | 66.6% |
| Renter-Occupied Housing Units | 2,042 | 33.4% |
| Total Occupied Housing Units | 6,118 | 100.0% |
Occupancy by Household Size in Bridgeview
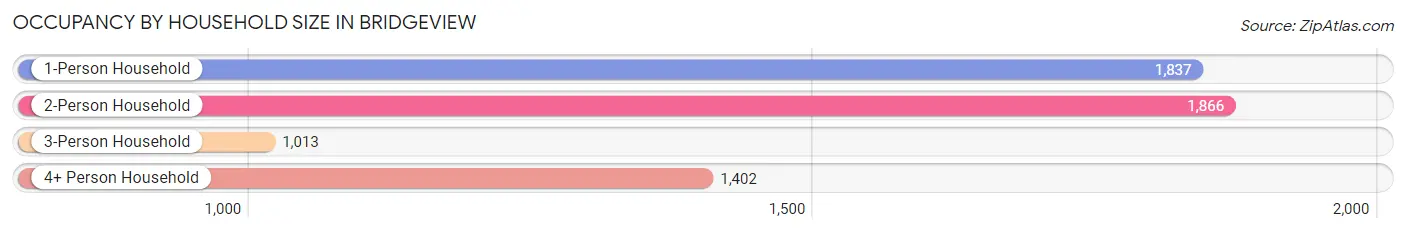
| Household Size | # Housing Units | % Housing Units |
| 1-Person Household | 1,837 | 30.0% |
| 2-Person Household | 1,866 | 30.5% |
| 3-Person Household | 1,013 | 16.6% |
| 4+ Person Household | 1,402 | 22.9% |
| Total Housing Units | 6,118 | 100.0% |
Occupancy by Ownership by Household Size in Bridgeview
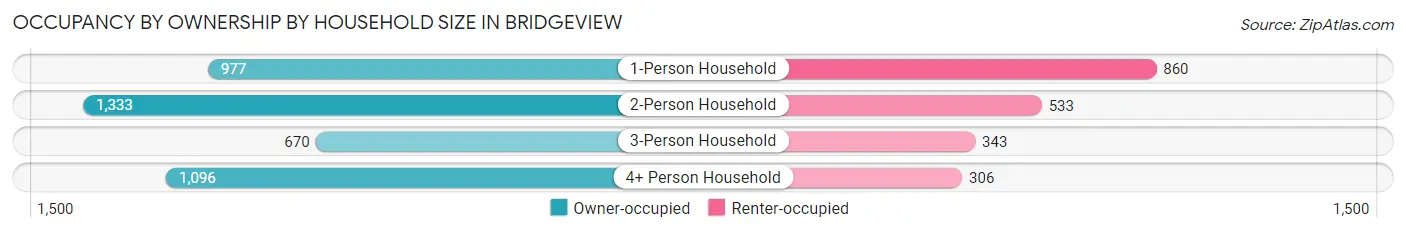
| Household Size | Owner-occupied | Renter-occupied |
| 1-Person Household | 977 (53.2%) | 860 (46.8%) |
| 2-Person Household | 1,333 (71.4%) | 533 (28.6%) |
| 3-Person Household | 670 (66.1%) | 343 (33.9%) |
| 4+ Person Household | 1,096 (78.2%) | 306 (21.8%) |
| Total Housing Units | 4,076 (66.6%) | 2,042 (33.4%) |
Occupancy by Educational Attainment in Bridgeview
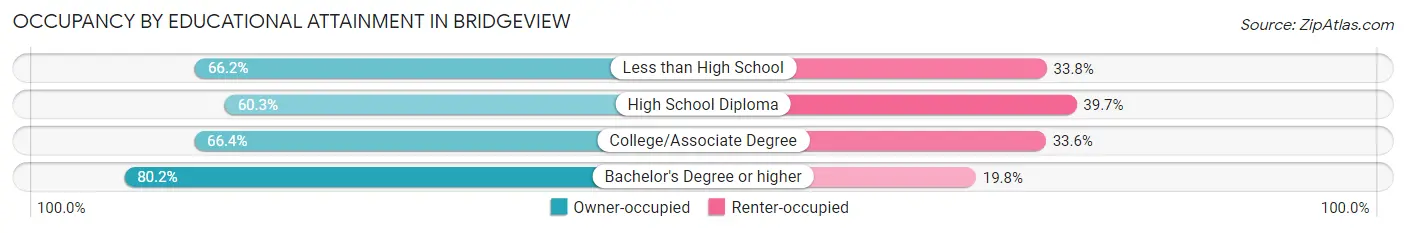
| Household Size | Owner-occupied | Renter-occupied |
| Less than High School | 576 (66.2%) | 294 (33.8%) |
| High School Diploma | 1,357 (60.3%) | 893 (39.7%) |
| College/Associate Degree | 1,258 (66.4%) | 637 (33.6%) |
| Bachelor's Degree or higher | 885 (80.2%) | 218 (19.8%) |
Occupancy by Age of Householder in Bridgeview
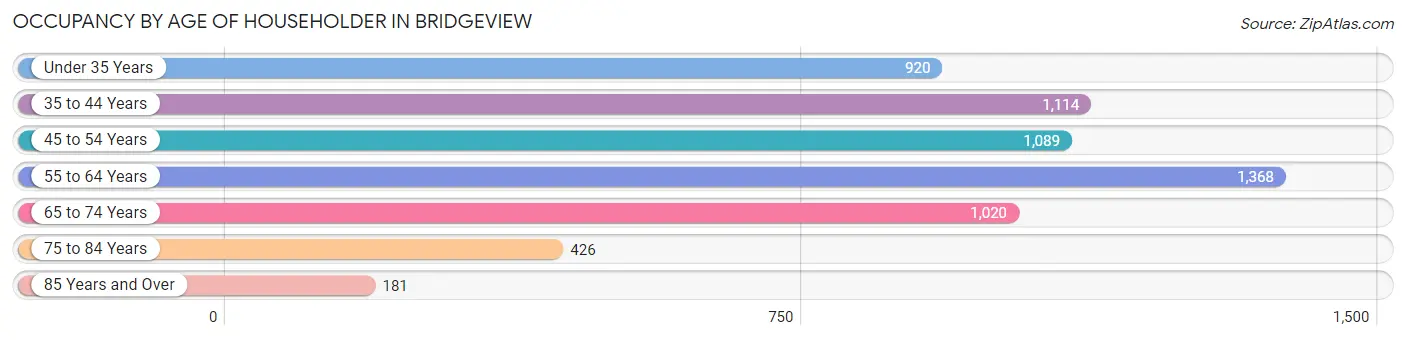
| Age Bracket | # Households | % Households |
| Under 35 Years | 920 | 15.0% |
| 35 to 44 Years | 1,114 | 18.2% |
| 45 to 54 Years | 1,089 | 17.8% |
| 55 to 64 Years | 1,368 | 22.4% |
| 65 to 74 Years | 1,020 | 16.7% |
| 75 to 84 Years | 426 | 7.0% |
| 85 Years and Over | 181 | 3.0% |
| Total | 6,118 | 100.0% |
Housing Finances in Bridgeview
Median Income by Occupancy in Bridgeview
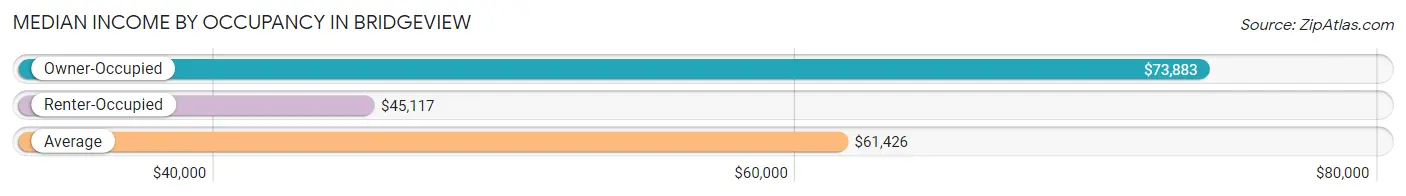
| Occupancy Type | # Households | Median Income |
| Owner-Occupied | 4,076 (66.6%) | $73,883 |
| Renter-Occupied | 2,042 (33.4%) | $45,117 |
| Average | 6,118 (100.0%) | $61,426 |
Occupancy by Householder Income Bracket in Bridgeview
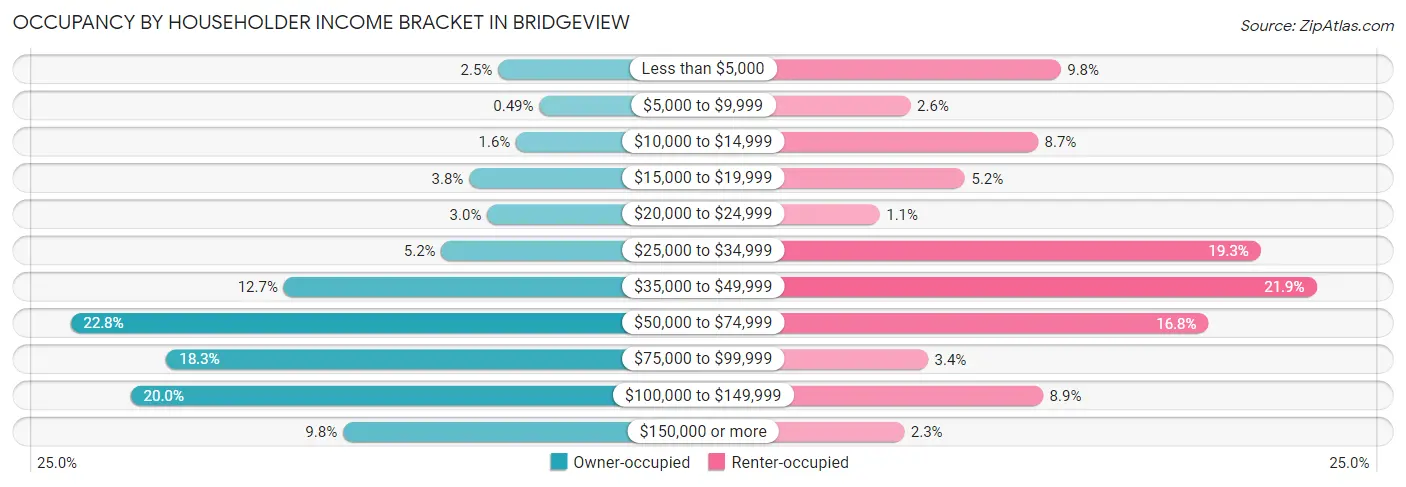
| Income Bracket | Owner-occupied | Renter-occupied |
| Less than $5,000 | 100 (2.5%) | 199 (9.8%) |
| $5,000 to $9,999 | 20 (0.5%) | 53 (2.6%) |
| $10,000 to $14,999 | 65 (1.6%) | 177 (8.7%) |
| $15,000 to $19,999 | 156 (3.8%) | 106 (5.2%) |
| $20,000 to $24,999 | 121 (3.0%) | 23 (1.1%) |
| $25,000 to $34,999 | 210 (5.1%) | 394 (19.3%) |
| $35,000 to $49,999 | 516 (12.7%) | 448 (21.9%) |
| $50,000 to $74,999 | 930 (22.8%) | 343 (16.8%) |
| $75,000 to $99,999 | 744 (18.2%) | 70 (3.4%) |
| $100,000 to $149,999 | 813 (20.0%) | 182 (8.9%) |
| $150,000 or more | 401 (9.8%) | 47 (2.3%) |
| Total | 4,076 (100.0%) | 2,042 (100.0%) |
Monthly Housing Cost Tiers in Bridgeview
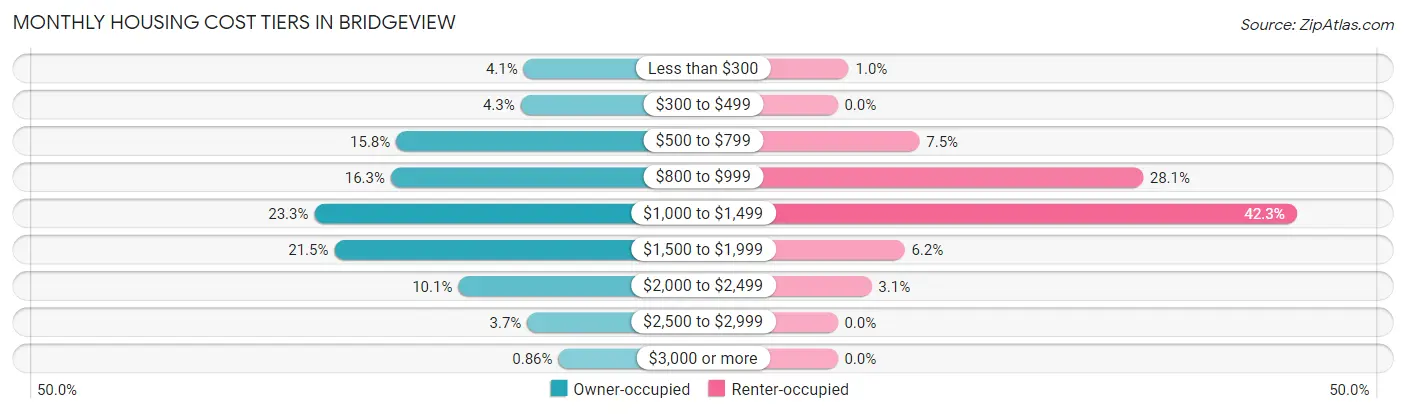
| Monthly Cost | Owner-occupied | Renter-occupied |
| Less than $300 | 166 (4.1%) | 21 (1.0%) |
| $300 to $499 | 177 (4.3%) | 0 (0.0%) |
| $500 to $799 | 644 (15.8%) | 154 (7.5%) |
| $800 to $999 | 664 (16.3%) | 574 (28.1%) |
| $1,000 to $1,499 | 951 (23.3%) | 863 (42.3%) |
| $1,500 to $1,999 | 876 (21.5%) | 126 (6.2%) |
| $2,000 to $2,499 | 411 (10.1%) | 64 (3.1%) |
| $2,500 to $2,999 | 152 (3.7%) | 0 (0.0%) |
| $3,000 or more | 35 (0.9%) | 0 (0.0%) |
| Total | 4,076 (100.0%) | 2,042 (100.0%) |
Physical Housing Characteristics in Bridgeview
Housing Structures in Bridgeview
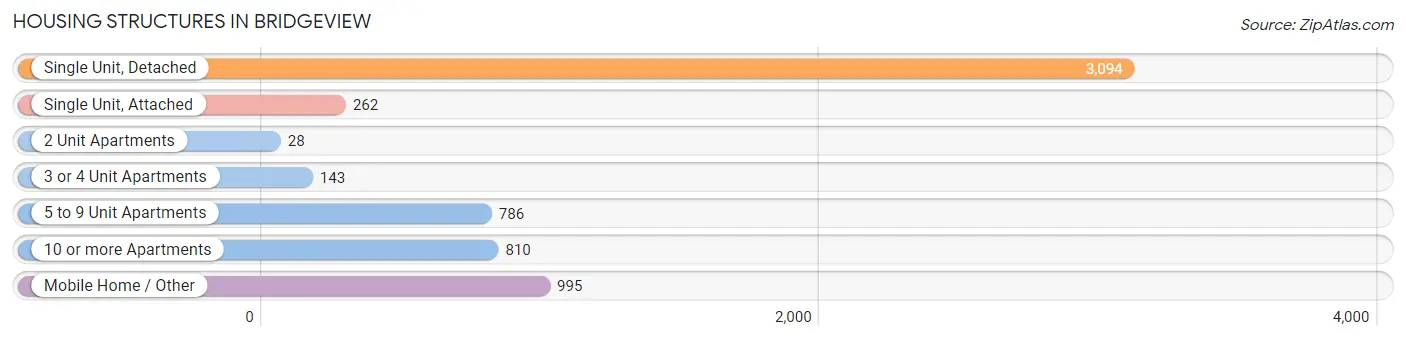
| Structure Type | # Housing Units | % Housing Units |
| Single Unit, Detached | 3,094 | 50.6% |
| Single Unit, Attached | 262 | 4.3% |
| 2 Unit Apartments | 28 | 0.5% |
| 3 or 4 Unit Apartments | 143 | 2.3% |
| 5 to 9 Unit Apartments | 786 | 12.9% |
| 10 or more Apartments | 810 | 13.2% |
| Mobile Home / Other | 995 | 16.3% |
| Total | 6,118 | 100.0% |
Housing Structures by Occupancy in Bridgeview
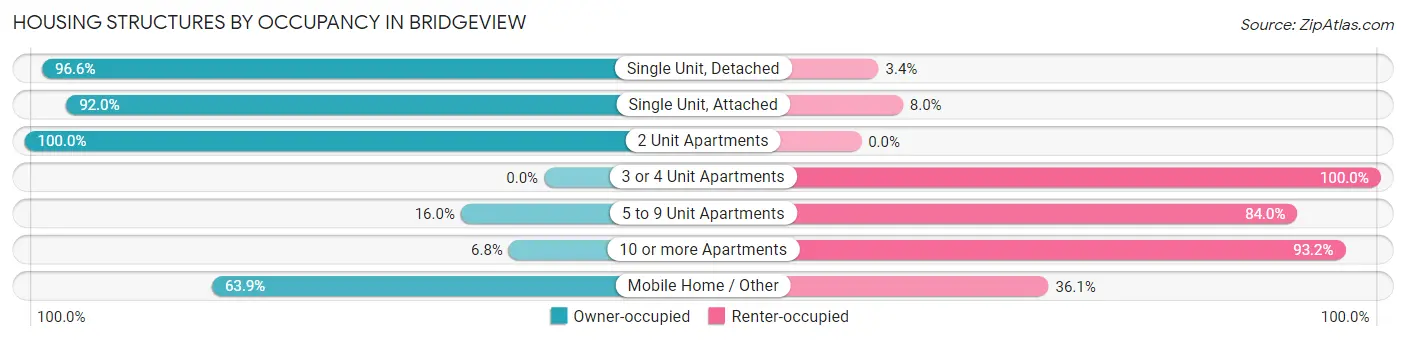
| Structure Type | Owner-occupied | Renter-occupied |
| Single Unit, Detached | 2,990 (96.6%) | 104 (3.4%) |
| Single Unit, Attached | 241 (92.0%) | 21 (8.0%) |
| 2 Unit Apartments | 28 (100.0%) | 0 (0.0%) |
| 3 or 4 Unit Apartments | 0 (0.0%) | 143 (100.0%) |
| 5 to 9 Unit Apartments | 126 (16.0%) | 660 (84.0%) |
| 10 or more Apartments | 55 (6.8%) | 755 (93.2%) |
| Mobile Home / Other | 636 (63.9%) | 359 (36.1%) |
| Total | 4,076 (66.6%) | 2,042 (33.4%) |
Housing Structures by Number of Rooms in Bridgeview
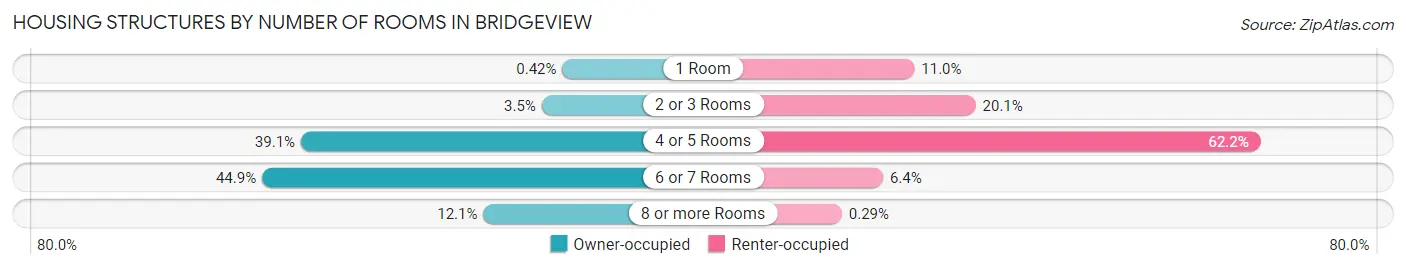
| Number of Rooms | Owner-occupied | Renter-occupied |
| 1 Room | 17 (0.4%) | 225 (11.0%) |
| 2 or 3 Rooms | 142 (3.5%) | 410 (20.1%) |
| 4 or 5 Rooms | 1,594 (39.1%) | 1,271 (62.2%) |
| 6 or 7 Rooms | 1,829 (44.9%) | 130 (6.4%) |
| 8 or more Rooms | 494 (12.1%) | 6 (0.3%) |
| Total | 4,076 (100.0%) | 2,042 (100.0%) |
Housing Structure by Heating Type in Bridgeview
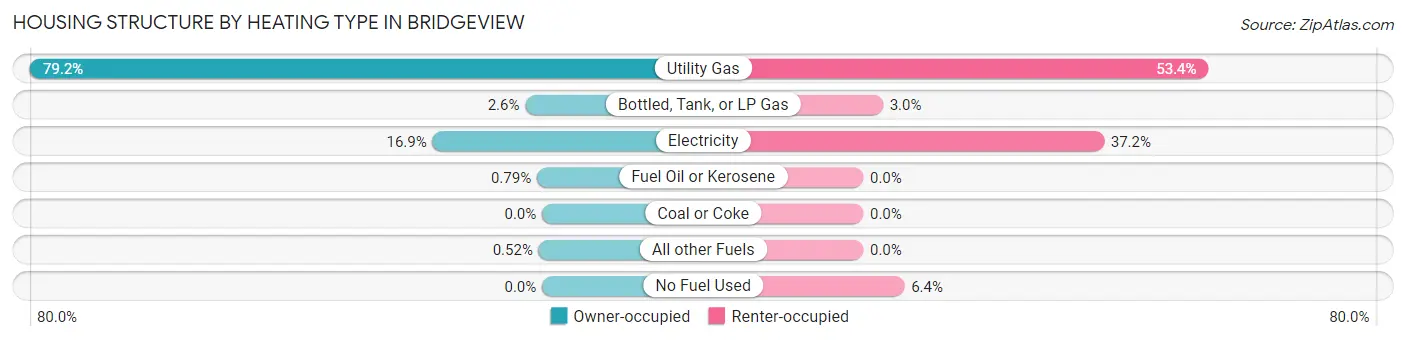
| Heating Type | Owner-occupied | Renter-occupied |
| Utility Gas | 3,227 (79.2%) | 1,090 (53.4%) |
| Bottled, Tank, or LP Gas | 106 (2.6%) | 62 (3.0%) |
| Electricity | 690 (16.9%) | 760 (37.2%) |
| Fuel Oil or Kerosene | 32 (0.8%) | 0 (0.0%) |
| Coal or Coke | 0 (0.0%) | 0 (0.0%) |
| All other Fuels | 21 (0.5%) | 0 (0.0%) |
| No Fuel Used | 0 (0.0%) | 130 (6.4%) |
| Total | 4,076 (100.0%) | 2,042 (100.0%) |
Household Vehicle Usage in Bridgeview
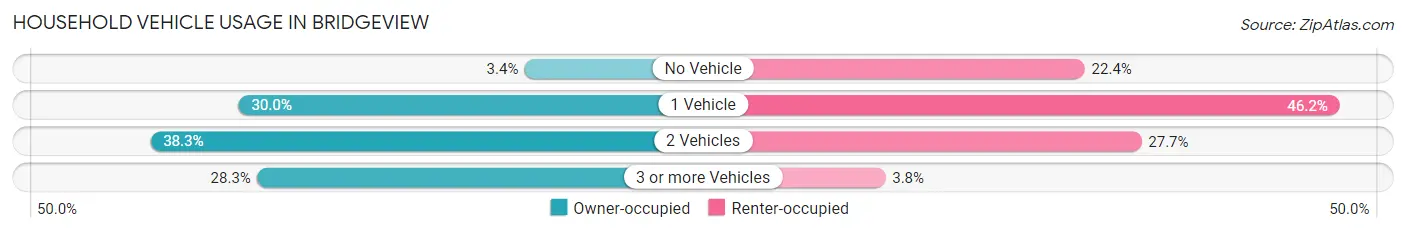
| Vehicles per Household | Owner-occupied | Renter-occupied |
| No Vehicle | 137 (3.4%) | 457 (22.4%) |
| 1 Vehicle | 1,224 (30.0%) | 943 (46.2%) |
| 2 Vehicles | 1,560 (38.3%) | 565 (27.7%) |
| 3 or more Vehicles | 1,155 (28.3%) | 77 (3.8%) |
| Total | 4,076 (100.0%) | 2,042 (100.0%) |
Real Estate & Mortgages in Bridgeview
Real Estate and Mortgage Overview in Bridgeview
| Characteristic | Without Mortgage | With Mortgage |
| Housing Units | 1,989 | 2,087 |
| Median Property Value | $219,300 | $227,100 |
| Median Household Income | $64,254 | $218 |
| Monthly Housing Costs | $830 | $35 |
| Real Estate Taxes | $5,206 | $172 |
Property Value by Mortgage Status in Bridgeview
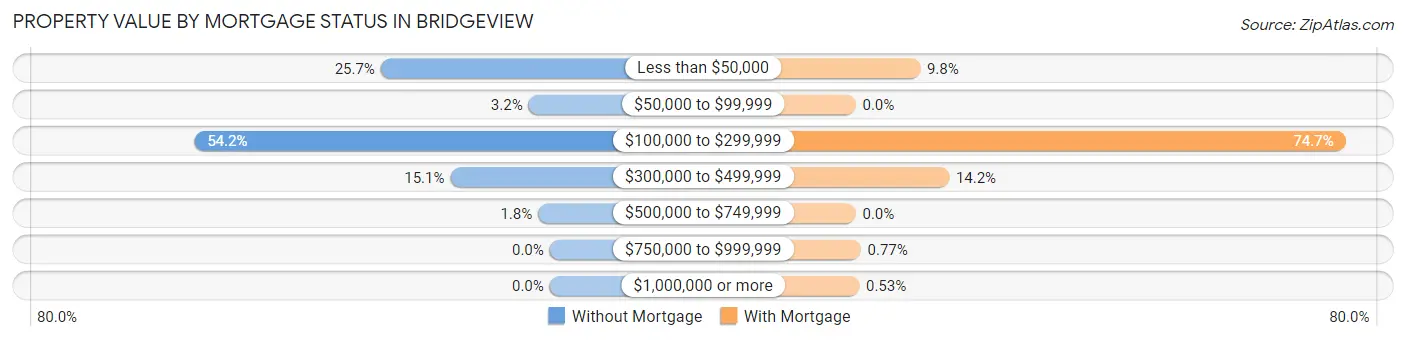
| Property Value | Without Mortgage | With Mortgage |
| Less than $50,000 | 512 (25.7%) | 205 (9.8%) |
| $50,000 to $99,999 | 64 (3.2%) | 0 (0.0%) |
| $100,000 to $299,999 | 1,077 (54.1%) | 1,558 (74.7%) |
| $300,000 to $499,999 | 301 (15.1%) | 297 (14.2%) |
| $500,000 to $749,999 | 35 (1.8%) | 0 (0.0%) |
| $750,000 to $999,999 | 0 (0.0%) | 16 (0.8%) |
| $1,000,000 or more | 0 (0.0%) | 11 (0.5%) |
| Total | 1,989 (100.0%) | 2,087 (100.0%) |
Household Income by Mortgage Status in Bridgeview
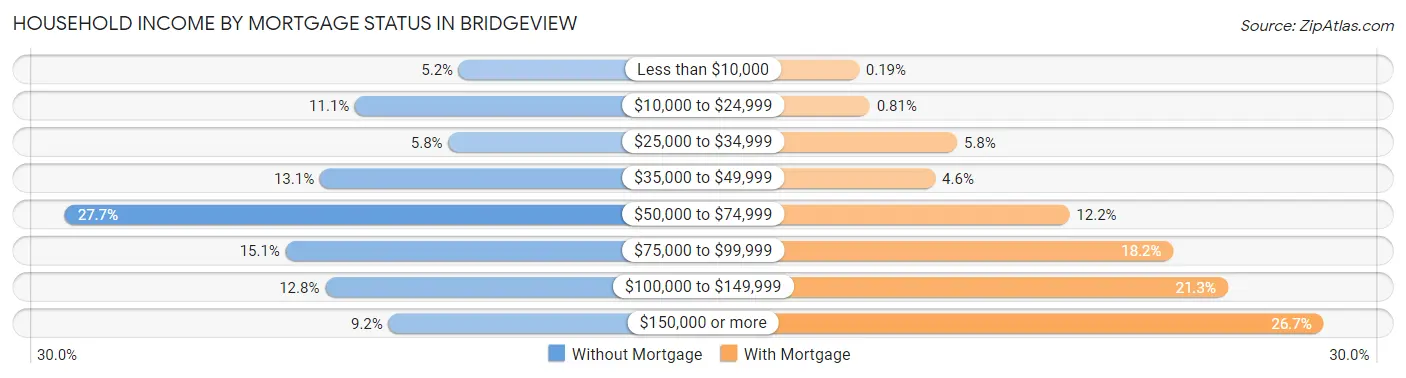
| Household Income | Without Mortgage | With Mortgage |
| Less than $10,000 | 103 (5.2%) | 4 (0.2%) |
| $10,000 to $24,999 | 221 (11.1%) | 17 (0.8%) |
| $25,000 to $34,999 | 115 (5.8%) | 121 (5.8%) |
| $35,000 to $49,999 | 261 (13.1%) | 95 (4.5%) |
| $50,000 to $74,999 | 551 (27.7%) | 255 (12.2%) |
| $75,000 to $99,999 | 300 (15.1%) | 379 (18.2%) |
| $100,000 to $149,999 | 255 (12.8%) | 444 (21.3%) |
| $150,000 or more | 183 (9.2%) | 558 (26.7%) |
| Total | 1,989 (100.0%) | 2,087 (100.0%) |
Property Value to Household Income Ratio in Bridgeview
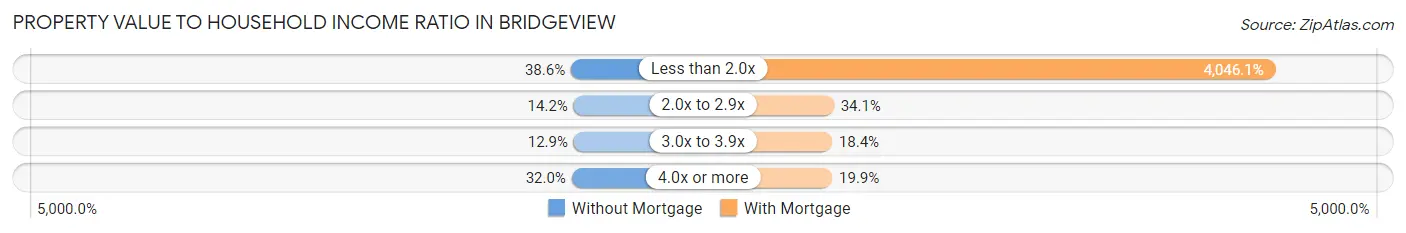
| Value-to-Income Ratio | Without Mortgage | With Mortgage |
| Less than 2.0x | 768 (38.6%) | 84,441 (4,046.1%) |
| 2.0x to 2.9x | 283 (14.2%) | 712 (34.1%) |
| 3.0x to 3.9x | 257 (12.9%) | 384 (18.4%) |
| 4.0x or more | 637 (32.0%) | 416 (19.9%) |
| Total | 1,989 (100.0%) | 2,087 (100.0%) |
Real Estate Taxes by Mortgage Status in Bridgeview
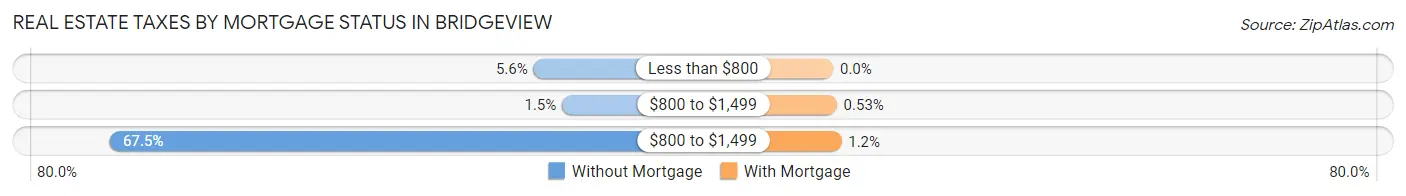
| Property Taxes | Without Mortgage | With Mortgage |
| Less than $800 | 112 (5.6%) | 0 (0.0%) |
| $800 to $1,499 | 29 (1.5%) | 11 (0.5%) |
| $800 to $1,499 | 1,343 (67.5%) | 25 (1.2%) |
| Total | 1,989 (100.0%) | 2,087 (100.0%) |
Health & Disability in Bridgeview
Health Insurance Coverage by Age in Bridgeview
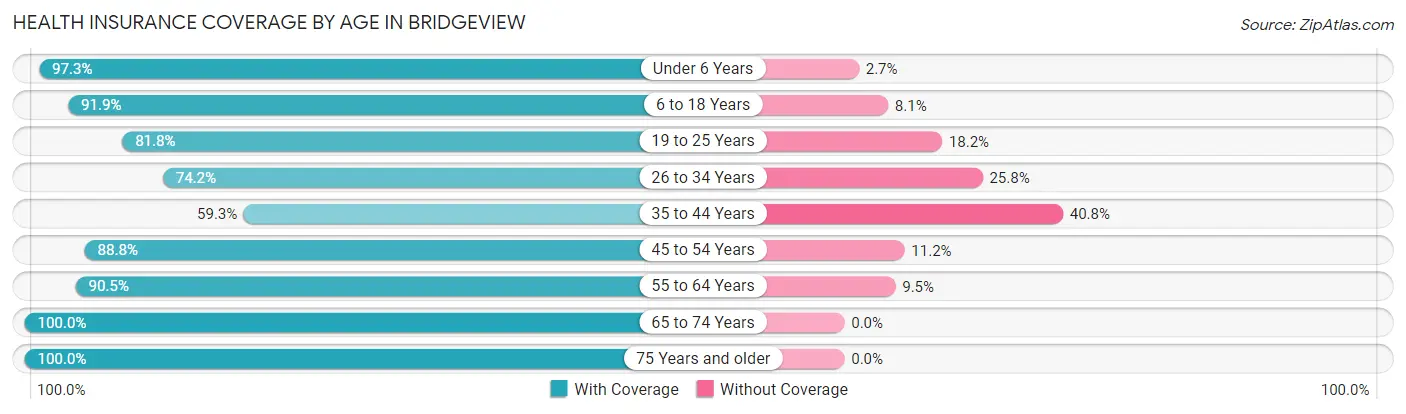
| Age Bracket | With Coverage | Without Coverage |
| Under 6 Years | 974 (97.3%) | 27 (2.7%) |
| 6 to 18 Years | 2,938 (91.9%) | 260 (8.1%) |
| 19 to 25 Years | 1,069 (81.8%) | 238 (18.2%) |
| 26 to 34 Years | 1,616 (74.2%) | 561 (25.8%) |
| 35 to 44 Years | 1,163 (59.3%) | 800 (40.7%) |
| 45 to 54 Years | 1,829 (88.8%) | 231 (11.2%) |
| 55 to 64 Years | 1,960 (90.5%) | 206 (9.5%) |
| 65 to 74 Years | 1,581 (100.0%) | 0 (0.0%) |
| 75 Years and older | 941 (100.0%) | 0 (0.0%) |
| Total | 14,071 (85.8%) | 2,323 (14.2%) |
Health Insurance Coverage by Citizenship Status in Bridgeview
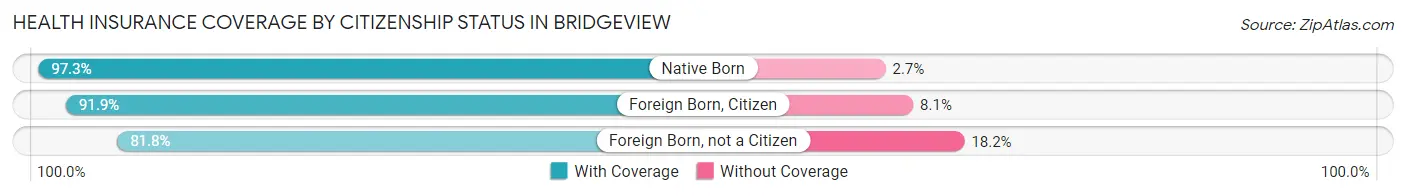
| Citizenship Status | With Coverage | Without Coverage |
| Native Born | 974 (97.3%) | 27 (2.7%) |
| Foreign Born, Citizen | 2,938 (91.9%) | 260 (8.1%) |
| Foreign Born, not a Citizen | 1,069 (81.8%) | 238 (18.2%) |
Health Insurance Coverage by Household Income in Bridgeview
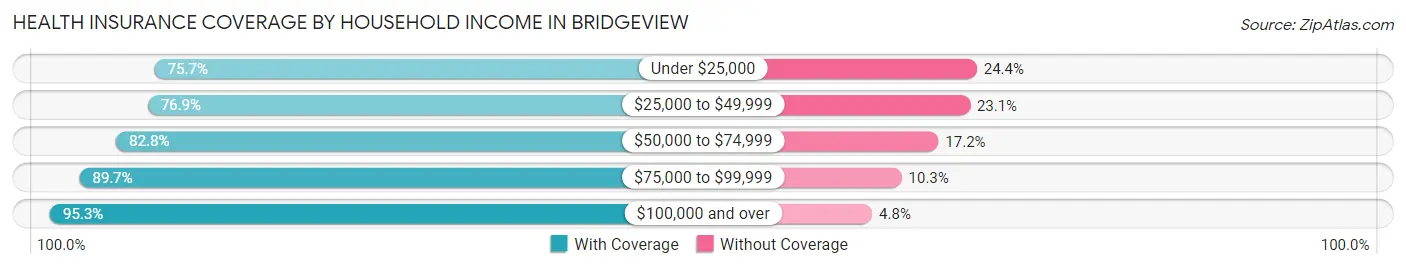
| Household Income | With Coverage | Without Coverage |
| Under $25,000 | 1,187 (75.6%) | 382 (24.3%) |
| $25,000 to $49,999 | 2,647 (76.9%) | 794 (23.1%) |
| $50,000 to $74,999 | 3,205 (82.8%) | 664 (17.2%) |
| $75,000 to $99,999 | 2,027 (89.7%) | 232 (10.3%) |
| $100,000 and over | 4,995 (95.3%) | 249 (4.8%) |
Public vs Private Health Insurance Coverage by Age in Bridgeview
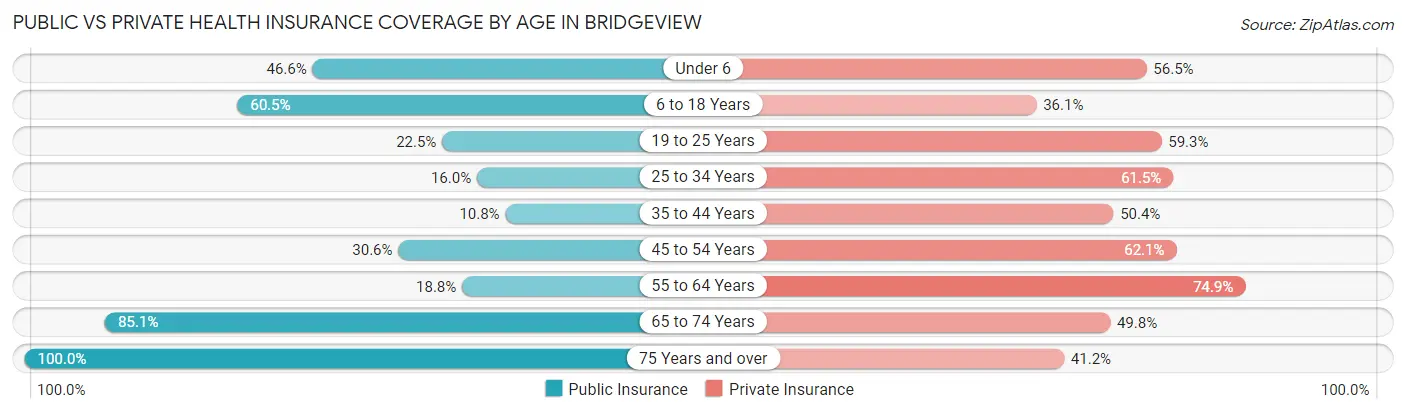
| Age Bracket | Public Insurance | Private Insurance |
| Under 6 | 466 (46.6%) | 566 (56.5%) |
| 6 to 18 Years | 1,935 (60.5%) | 1,154 (36.1%) |
| 19 to 25 Years | 294 (22.5%) | 775 (59.3%) |
| 25 to 34 Years | 349 (16.0%) | 1,339 (61.5%) |
| 35 to 44 Years | 211 (10.7%) | 989 (50.4%) |
| 45 to 54 Years | 631 (30.6%) | 1,279 (62.1%) |
| 55 to 64 Years | 407 (18.8%) | 1,622 (74.9%) |
| 65 to 74 Years | 1,345 (85.1%) | 787 (49.8%) |
| 75 Years and over | 941 (100.0%) | 388 (41.2%) |
| Total | 6,579 (40.1%) | 8,899 (54.3%) |
Disability Status by Sex by Age in Bridgeview
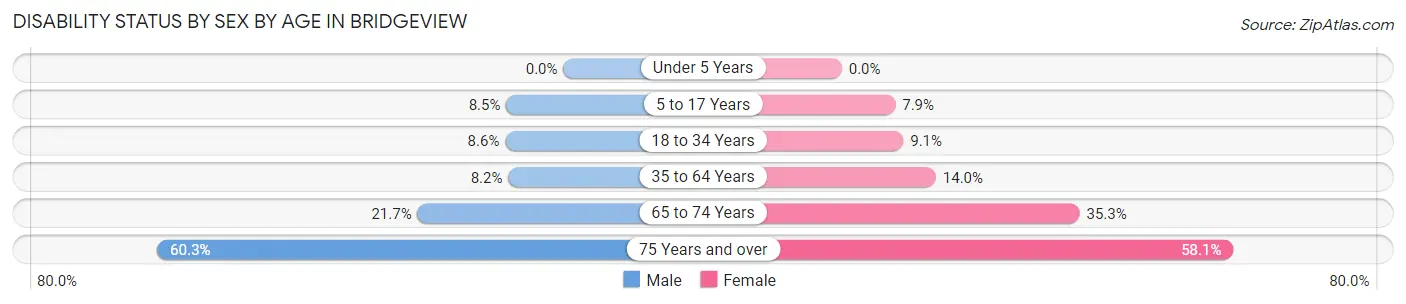
| Age Bracket | Male | Female |
| Under 5 Years | 0 (0.0%) | 0 (0.0%) |
| 5 to 17 Years | 107 (8.5%) | 112 (7.9%) |
| 18 to 34 Years | 184 (8.6%) | 177 (9.1%) |
| 35 to 64 Years | 233 (8.2%) | 467 (14.0%) |
| 65 to 74 Years | 159 (21.7%) | 299 (35.3%) |
| 75 Years and over | 196 (60.3%) | 358 (58.1%) |
Disability Class by Sex by Age in Bridgeview
Disability Class: Hearing Difficulty
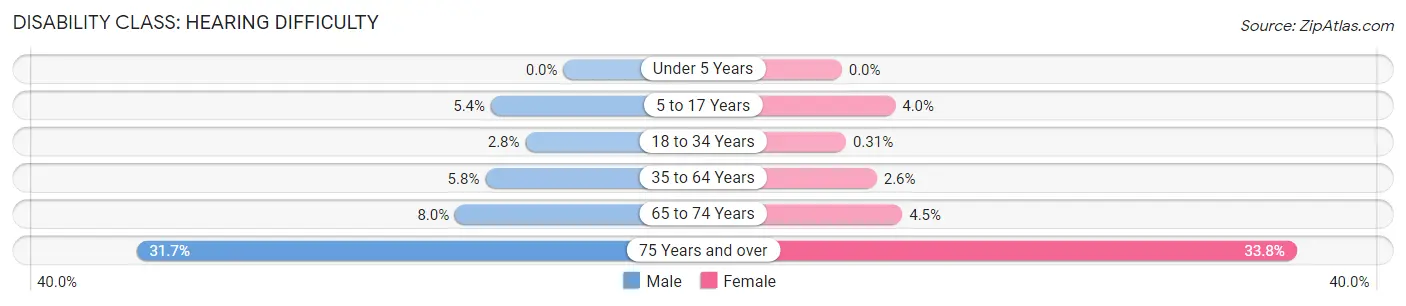
| Age Bracket | Male | Female |
| Under 5 Years | 0 (0.0%) | 0 (0.0%) |
| 5 to 17 Years | 68 (5.4%) | 56 (4.0%) |
| 18 to 34 Years | 60 (2.8%) | 6 (0.3%) |
| 35 to 64 Years | 165 (5.8%) | 87 (2.6%) |
| 65 to 74 Years | 59 (8.0%) | 38 (4.5%) |
| 75 Years and over | 103 (31.7%) | 208 (33.8%) |
Disability Class: Vision Difficulty
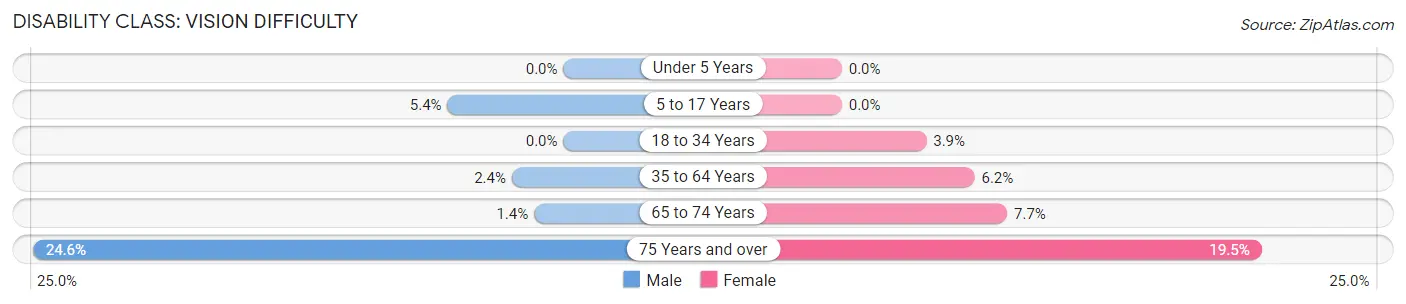
| Age Bracket | Male | Female |
| Under 5 Years | 0 (0.0%) | 0 (0.0%) |
| 5 to 17 Years | 68 (5.4%) | 0 (0.0%) |
| 18 to 34 Years | 0 (0.0%) | 76 (3.9%) |
| 35 to 64 Years | 68 (2.4%) | 206 (6.2%) |
| 65 to 74 Years | 10 (1.4%) | 65 (7.7%) |
| 75 Years and over | 80 (24.6%) | 120 (19.5%) |
Disability Class: Cognitive Difficulty
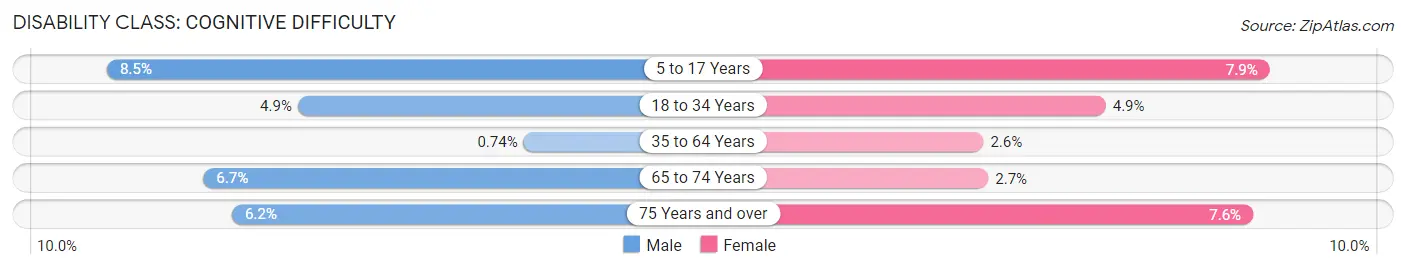
| Age Bracket | Male | Female |
| 5 to 17 Years | 107 (8.5%) | 112 (7.9%) |
| 18 to 34 Years | 105 (4.9%) | 95 (4.9%) |
| 35 to 64 Years | 21 (0.7%) | 88 (2.6%) |
| 65 to 74 Years | 49 (6.7%) | 23 (2.7%) |
| 75 Years and over | 20 (6.1%) | 47 (7.6%) |
Disability Class: Ambulatory Difficulty
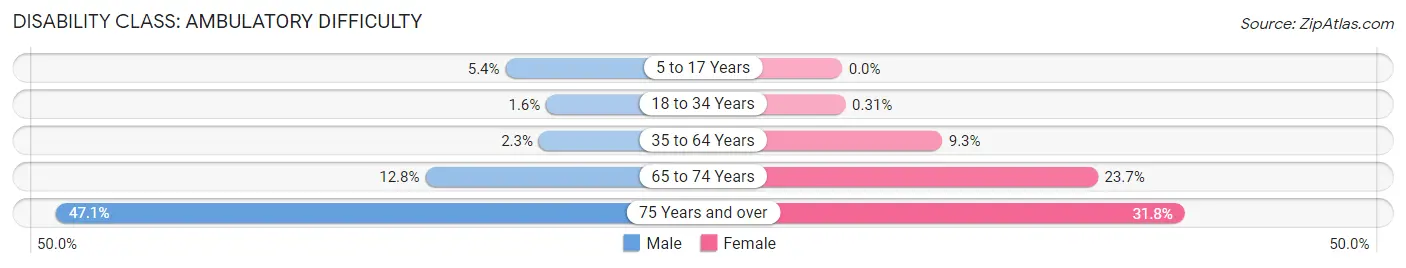
| Age Bracket | Male | Female |
| 5 to 17 Years | 68 (5.4%) | 0 (0.0%) |
| 18 to 34 Years | 34 (1.6%) | 6 (0.3%) |
| 35 to 64 Years | 65 (2.3%) | 310 (9.3%) |
| 65 to 74 Years | 94 (12.8%) | 201 (23.7%) |
| 75 Years and over | 153 (47.1%) | 196 (31.8%) |
Disability Class: Self-Care Difficulty
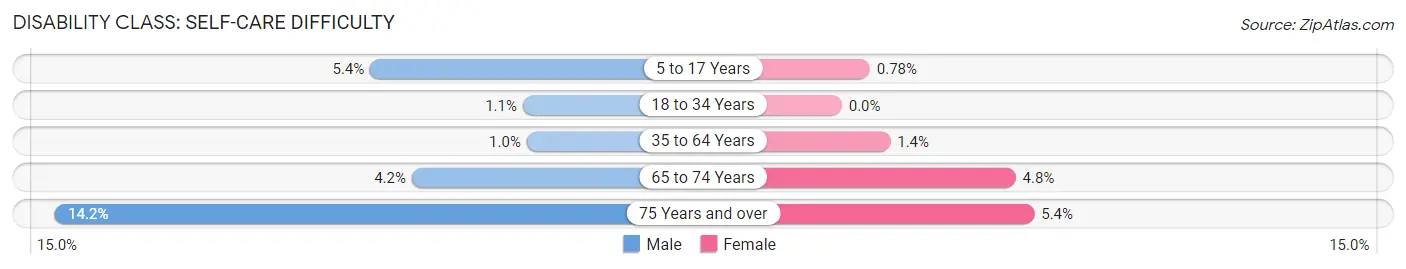
| Age Bracket | Male | Female |
| 5 to 17 Years | 68 (5.4%) | 11 (0.8%) |
| 18 to 34 Years | 24 (1.1%) | 0 (0.0%) |
| 35 to 64 Years | 29 (1.0%) | 45 (1.3%) |
| 65 to 74 Years | 31 (4.2%) | 41 (4.8%) |
| 75 Years and over | 46 (14.1%) | 33 (5.4%) |
Technology Access in Bridgeview
Computing Device Access in Bridgeview
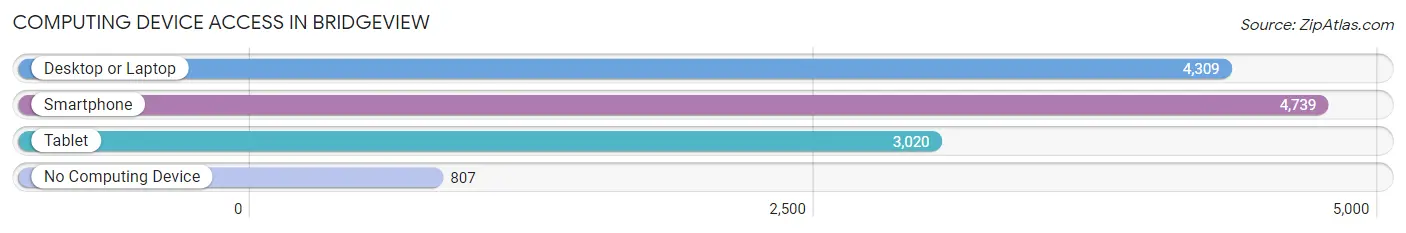
| Device Type | # Households | % Households |
| Desktop or Laptop | 4,309 | 70.4% |
| Smartphone | 4,739 | 77.5% |
| Tablet | 3,020 | 49.4% |
| No Computing Device | 807 | 13.2% |
| Total | 6,118 | 100.0% |
Internet Access in Bridgeview
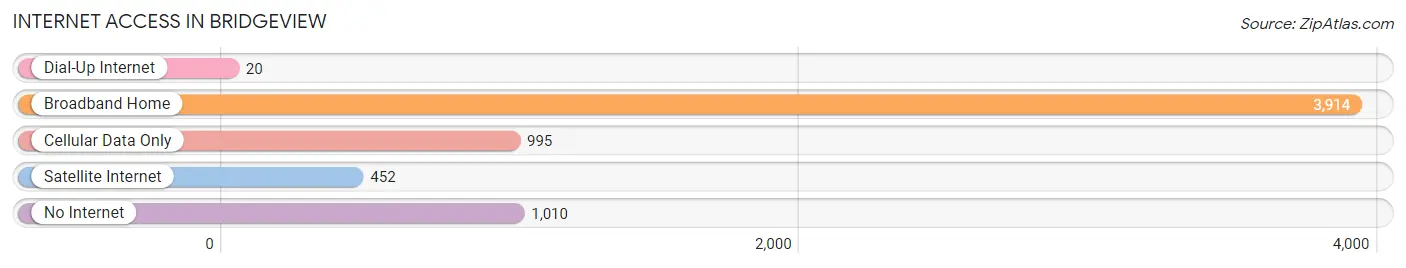
| Internet Type | # Households | % Households |
| Dial-Up Internet | 20 | 0.3% |
| Broadband Home | 3,914 | 64.0% |
| Cellular Data Only | 995 | 16.3% |
| Satellite Internet | 452 | 7.4% |
| No Internet | 1,010 | 16.5% |
| Total | 6,118 | 100.0% |
Bridgeview Summary
Bridgeview is a village located in Cook County, Illinois, United States. It is a suburb of Chicago, located approximately 13 miles southwest of the Loop. As of the 2010 census, the village had a population of 16,446.
History
The area that is now Bridgeview was first settled in the 1830s by German and Irish immigrants. The first settler was a man named John Hughes, who built a log cabin near the intersection of 73rd Street and Harlem Avenue. The area was known as Hughes' Crossing until the early 1900s, when it was renamed Bridgeview. The name was chosen because of the view of the bridge over the Des Plaines River.
The village was incorporated in 1940, and the first mayor was John J. O'Connell. The village grew rapidly in the 1950s and 1960s, and by the 1970s it had become a thriving community.
Geography
Bridgeview is located at 41°43'17" North, 87°48'17" West (41.7214, -87.8047). According to the 2010 census, the village has a total area of 4.2 square miles, all land.
The village is bordered by the Des Plaines River to the east, and is located near the intersection of Interstate 294 and Interstate 55.
Economy
The economy of Bridgeview is largely based on retail and services. The village is home to several large shopping centers, including the Bridgeview Plaza Shopping Center, the Bridgeview Town Center, and the Bridgeview Commons Shopping Center.
The village is also home to several industrial parks, including the Bridgeview Industrial Park and the Bridgeview Business Park. These parks are home to a variety of businesses, including manufacturing, distribution, and technology companies.
Demographics
As of the 2010 census, there were 16,446 people, 5,945 households, and 4,541 families residing in the village. The population density was 3,919.3 people per square mile. The racial makeup of the village was 79.2% White, 5.3% African American, 0.3% Native American, 4.2% Asian, 0.1% Pacific Islander, 8.2% from other races, and 2.9% from two or more races. Hispanic or Latino of any race were 18.3% of the population.
The median income for a household in the village was $50,945, and the median income for a family was $60,945. The per capita income for the village was $22,945. About 5.3% of families and 7.2% of the population were below the poverty line, including 9.2% of those under age 18 and 5.3% of those age 65 or over.
Common Questions
What is Per Capita Income in Bridgeview?
Per Capita income in Bridgeview is $27,322.
What is the Median Family Income in Bridgeview?
Median Family Income in Bridgeview is $70,494.
What is the Median Household income in Bridgeview?
Median Household Income in Bridgeview is $61,426.
What is Income or Wage Gap in Bridgeview?
Income or Wage Gap in Bridgeview is 4.8%.
Women in Bridgeview earn 95.2 cents for every dollar earned by a man.
What is Family Income Deficit in Bridgeview?
Family Income Deficit in Bridgeview is $8,453.
Families that are below poverty line in Bridgeview earn $8,453 less on average than the poverty threshold level.
What is Inequality or Gini Index in Bridgeview?
Inequality or Gini Index in Bridgeview is 0.41.
What is the Total Population of Bridgeview?
Total Population of Bridgeview is 16,939.
What is the Total Male Population of Bridgeview?
Total Male Population of Bridgeview is 7,967.
What is the Total Female Population of Bridgeview?
Total Female Population of Bridgeview is 8,972.
What is the Ratio of Males per 100 Females in Bridgeview?
There are 88.80 Males per 100 Females in Bridgeview.
What is the Ratio of Females per 100 Males in Bridgeview?
There are 112.61 Females per 100 Males in Bridgeview.
What is the Median Population Age in Bridgeview?
Median Population Age in Bridgeview is 39.2 Years.
What is the Average Family Size in Bridgeview
Average Family Size in Bridgeview is 3.3 People.
What is the Average Household Size in Bridgeview
Average Household Size in Bridgeview is 2.7 People.
How Large is the Labor Force in Bridgeview?
There are 8,198 People in the Labor Forcein in Bridgeview.
What is the Percentage of People in the Labor Force in Bridgeview?
59.7% of People are in the Labor Force in Bridgeview.
What is the Unemployment Rate in Bridgeview?
Unemployment Rate in Bridgeview is 8.5%.