Alsip, IL Map & Demographics
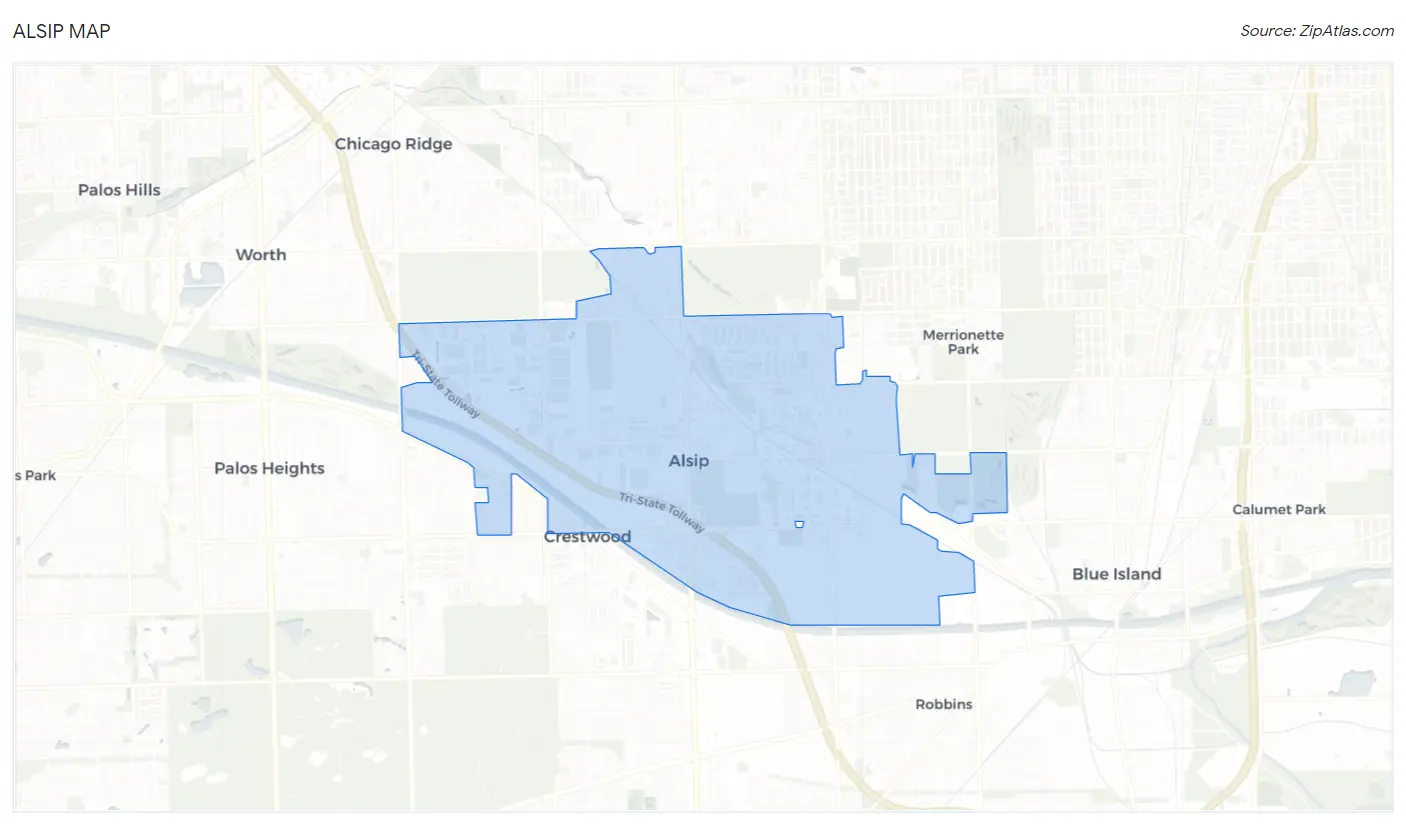
Alsip Map
Alsip Overview
$33,200
PER CAPITA INCOME
$93,261
AVG FAMILY INCOME
$63,131
AVG HOUSEHOLD INCOME
20.9%
WAGE / INCOME GAP [ % ]
79.1¢/ $1
WAGE / INCOME GAP [ $ ]
0.42
INEQUALITY / GINI INDEX
18,866
TOTAL POPULATION
9,276
MALE POPULATION
9,590
FEMALE POPULATION
96.73
MALES / 100 FEMALES
103.39
FEMALES / 100 MALES
39.5
MEDIAN AGE
3.3
AVG FAMILY SIZE
2.5
AVG HOUSEHOLD SIZE
9,829
LABOR FORCE [ PEOPLE ]
65.5%
PERCENT IN LABOR FORCE
6.7%
UNEMPLOYMENT RATE
Alsip Zip Codes
Income in Alsip
Income Overview in Alsip
Per Capita Income in Alsip is $33,200, while median incomes of families and households are $93,261 and $63,131 respectively.
| Characteristic | Number | Measure |
| Per Capita Income | 18,866 | $33,200 |
| Median Family Income | 4,526 | $93,261 |
| Mean Family Income | 4,526 | $100,073 |
| Median Household Income | 7,683 | $63,131 |
| Mean Household Income | 7,683 | $80,564 |
| Income Deficit | 4,526 | $0 |
| Wage / Income Gap (%) | 18,866 | 20.87% |
| Wage / Income Gap ($) | 18,866 | 79.13¢ per $1 |
| Gini / Inequality Index | 18,866 | 0.42 |
Earnings by Sex in Alsip
Average Earnings in Alsip are $44,350, $50,628 for men and $40,062 for women, a difference of 20.9%.
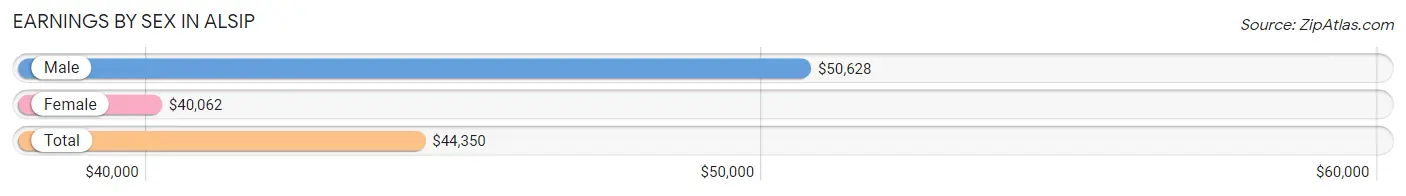
| Sex | Number | Average Earnings |
| Male | 5,174 (52.4%) | $50,628 |
| Female | 4,704 (47.6%) | $40,062 |
| Total | 9,878 (100.0%) | $44,350 |
Earnings by Sex by Income Bracket in Alsip
The most common earnings brackets in Alsip are $100,000+ for men (821 | 15.9%) and $55,000 to $64,999 for women (478 | 10.2%).
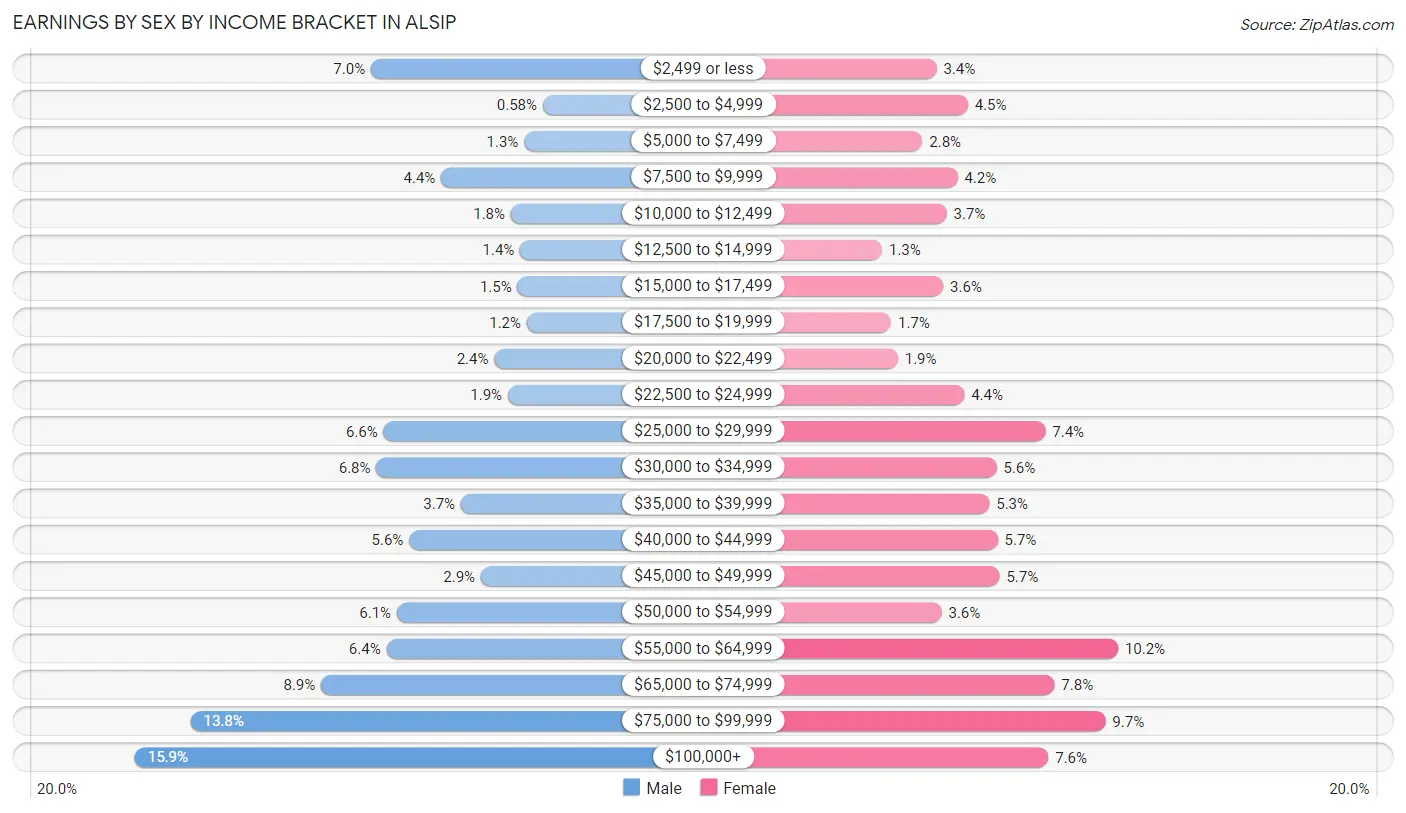
| Income | Male | Female |
| $2,499 or less | 363 (7.0%) | 158 (3.4%) |
| $2,500 to $4,999 | 30 (0.6%) | 213 (4.5%) |
| $5,000 to $7,499 | 66 (1.3%) | 133 (2.8%) |
| $7,500 to $9,999 | 227 (4.4%) | 195 (4.2%) |
| $10,000 to $12,499 | 92 (1.8%) | 176 (3.7%) |
| $12,500 to $14,999 | 74 (1.4%) | 62 (1.3%) |
| $15,000 to $17,499 | 79 (1.5%) | 170 (3.6%) |
| $17,500 to $19,999 | 61 (1.2%) | 78 (1.7%) |
| $20,000 to $22,499 | 124 (2.4%) | 90 (1.9%) |
| $22,500 to $24,999 | 98 (1.9%) | 207 (4.4%) |
| $25,000 to $29,999 | 339 (6.6%) | 350 (7.4%) |
| $30,000 to $34,999 | 353 (6.8%) | 264 (5.6%) |
| $35,000 to $39,999 | 189 (3.6%) | 251 (5.3%) |
| $40,000 to $44,999 | 289 (5.6%) | 266 (5.7%) |
| $45,000 to $49,999 | 150 (2.9%) | 269 (5.7%) |
| $50,000 to $54,999 | 313 (6.0%) | 167 (3.5%) |
| $55,000 to $64,999 | 333 (6.4%) | 478 (10.2%) |
| $65,000 to $74,999 | 460 (8.9%) | 366 (7.8%) |
| $75,000 to $99,999 | 713 (13.8%) | 456 (9.7%) |
| $100,000+ | 821 (15.9%) | 355 (7.5%) |
| Total | 5,174 (100.0%) | 4,704 (100.0%) |
Earnings by Sex by Educational Attainment in Alsip
Average earnings in Alsip are $54,865 for men and $48,005 for women, a difference of 12.5%. Men with an educational attainment of bachelor's degree enjoy the highest average annual earnings of $59,936, while those with less than high school education earn the least with $39,016. Women with an educational attainment of graduate degree earn the most with the average annual earnings of $66,720, while those with high school diploma education have the smallest earnings of $29,010.
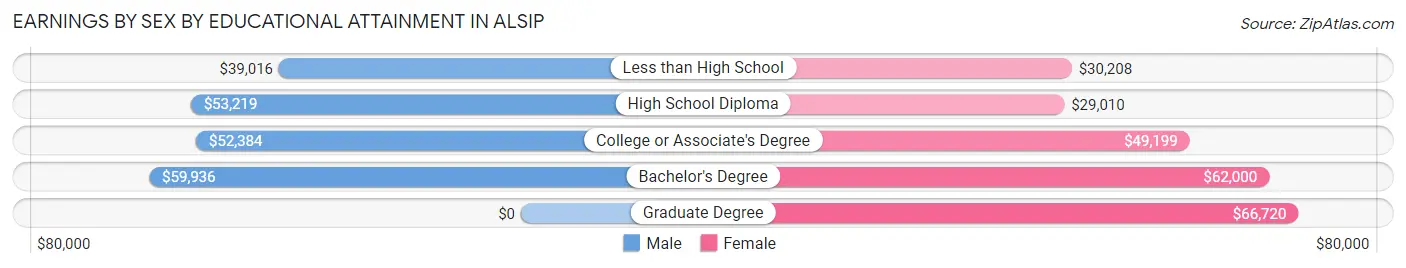
| Educational Attainment | Male Income | Female Income |
| Less than High School | $39,016 | $30,208 |
| High School Diploma | $53,219 | $29,010 |
| College or Associate's Degree | $52,384 | $49,199 |
| Bachelor's Degree | $59,936 | $62,000 |
| Graduate Degree | - | - |
| Total | $54,865 | $48,005 |
Family Income in Alsip
Family Income Brackets in Alsip
According to the Alsip family income data, there are 1,290 families falling into the $100,000 to $149,999 income range, which is the most common income bracket and makes up 28.5% of all families. Conversely, the $15,000 to $24,999 income bracket is the least frequent group with only 72 families (1.6%) belonging to this category.
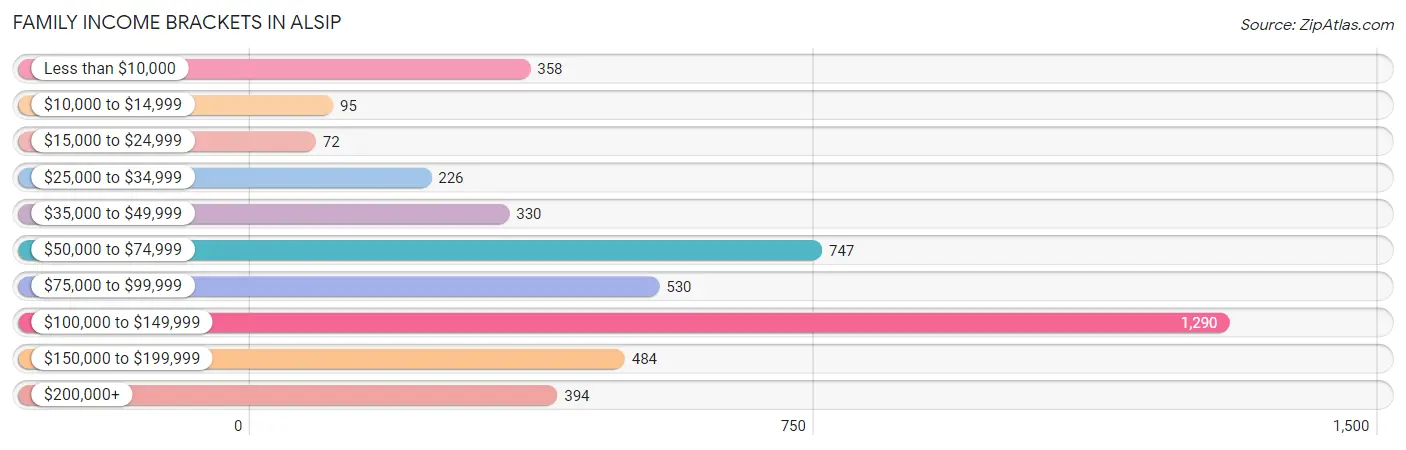
| Income Bracket | # Families | % Families |
| Less than $10,000 | 358 | 7.9% |
| $10,000 to $14,999 | 95 | 2.1% |
| $15,000 to $24,999 | 72 | 1.6% |
| $25,000 to $34,999 | 226 | 5.0% |
| $35,000 to $49,999 | 330 | 7.3% |
| $50,000 to $74,999 | 747 | 16.5% |
| $75,000 to $99,999 | 530 | 11.7% |
| $100,000 to $149,999 | 1,290 | 28.5% |
| $150,000 to $199,999 | 484 | 10.7% |
| $200,000+ | 394 | 8.7% |
Family Income by Famaliy Size in Alsip
5-person families (511 | 11.3%) account for the highest median family income in Alsip with $118,732 per family, while 2-person families (1,664 | 36.8%) have the highest median income of $30,658 per family member.
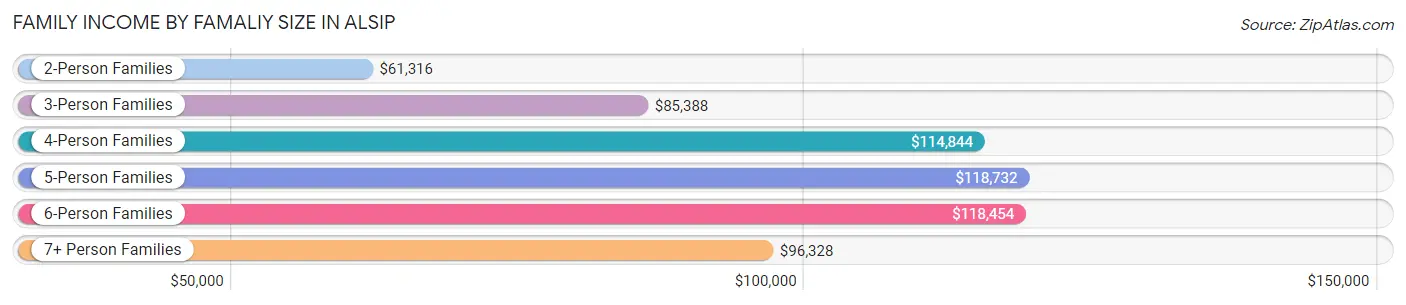
| Income Bracket | # Families | Median Income |
| 2-Person Families | 1,664 (36.8%) | $61,316 |
| 3-Person Families | 1,359 (30.0%) | $85,388 |
| 4-Person Families | 800 (17.7%) | $114,844 |
| 5-Person Families | 511 (11.3%) | $118,732 |
| 6-Person Families | 115 (2.5%) | $118,454 |
| 7+ Person Families | 77 (1.7%) | $96,328 |
| Total | 4,526 (100.0%) | $93,261 |
Family Income by Number of Earners in Alsip
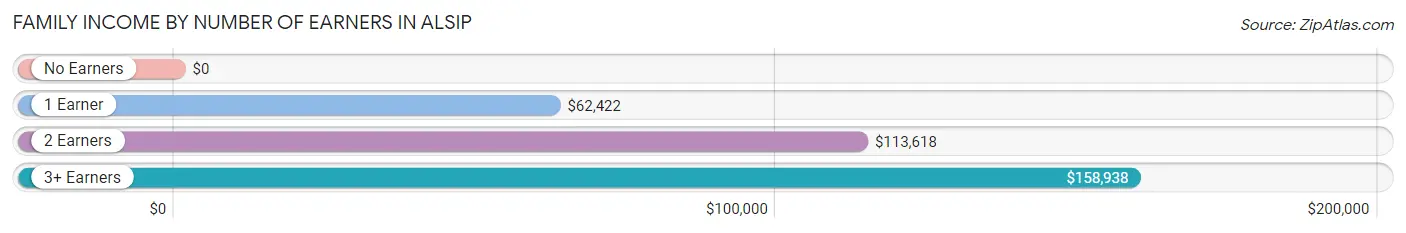
| Number of Earners | # Families | Median Income |
| No Earners | 779 (17.2%) | $0 |
| 1 Earner | 1,159 (25.6%) | $62,422 |
| 2 Earners | 1,946 (43.0%) | $113,618 |
| 3+ Earners | 642 (14.2%) | $158,938 |
| Total | 4,526 (100.0%) | $93,261 |
Household Income in Alsip
Household Income Brackets in Alsip
With 1,483 households falling in the category, the $100,000 to $149,999 income range is the most frequent in Alsip, accounting for 19.3% of all households. In contrast, only 146 households (1.9%) fall into the $10,000 to $14,999 income bracket, making it the least populous group.
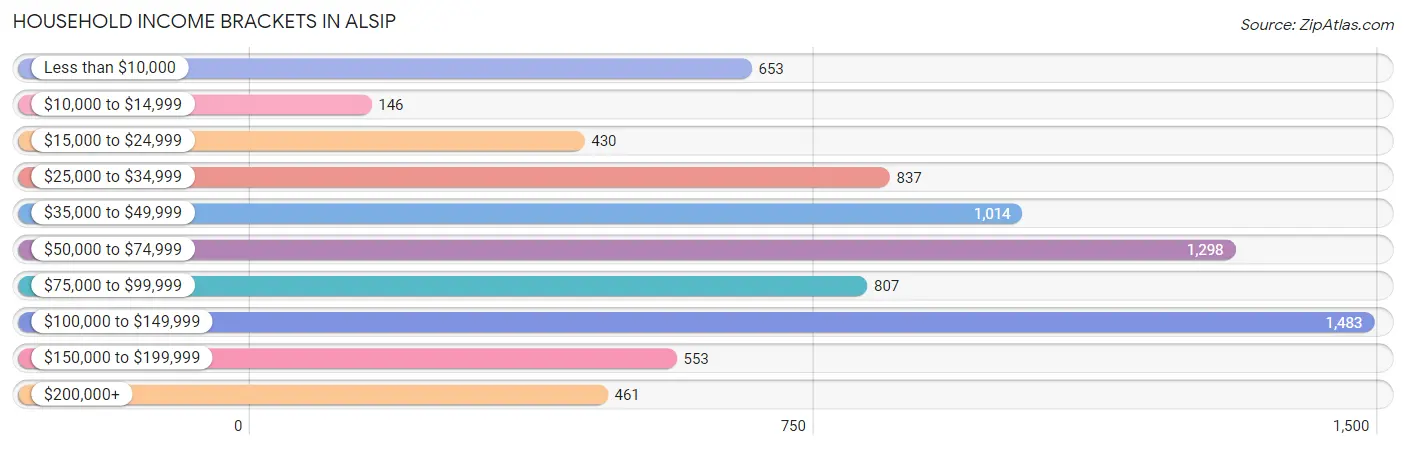
| Income Bracket | # Households | % Households |
| Less than $10,000 | 653 | 8.5% |
| $10,000 to $14,999 | 146 | 1.9% |
| $15,000 to $24,999 | 430 | 5.6% |
| $25,000 to $34,999 | 837 | 10.9% |
| $35,000 to $49,999 | 1,014 | 13.2% |
| $50,000 to $74,999 | 1,298 | 16.9% |
| $75,000 to $99,999 | 807 | 10.5% |
| $100,000 to $149,999 | 1,483 | 19.3% |
| $150,000 to $199,999 | 553 | 7.2% |
| $200,000+ | 461 | 6.0% |
Household Income by Householder Age in Alsip
The median household income in Alsip is $63,131, with the highest median household income of $95,172 found in the 45 to 64 years age bracket for the primary householder. A total of 2,747 households (35.7%) fall into this category. Meanwhile, the 65+ years age bracket for the primary householder has the lowest median household income of $39,502, with 2,378 households (30.9%) in this group.
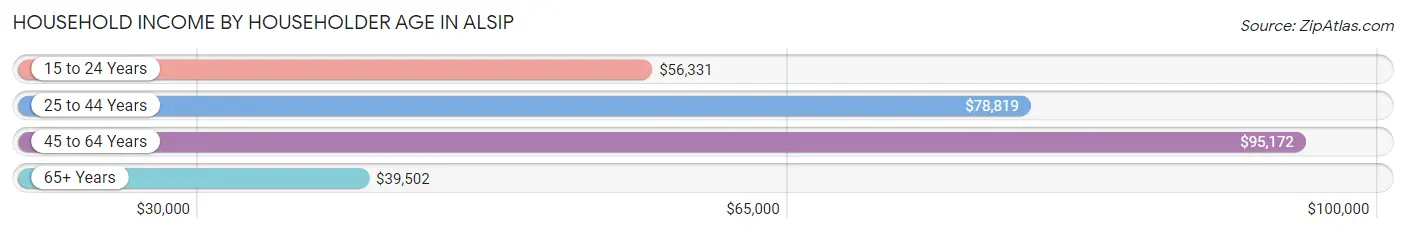
| Income Bracket | # Households | Median Income |
| 15 to 24 Years | 79 (1.0%) | $56,331 |
| 25 to 44 Years | 2,479 (32.3%) | $78,819 |
| 45 to 64 Years | 2,747 (35.7%) | $95,172 |
| 65+ Years | 2,378 (30.9%) | $39,502 |
| Total | 7,683 (100.0%) | $63,131 |
Poverty in Alsip
Income Below Poverty by Sex and Age in Alsip
With 9.8% poverty level for males and 11.3% for females among the residents of Alsip, 15 year old males and 6 to 11 year old females are the most vulnerable to poverty, with 92 males (82.9%) and 151 females (19.0%) in their respective age groups living below the poverty level.
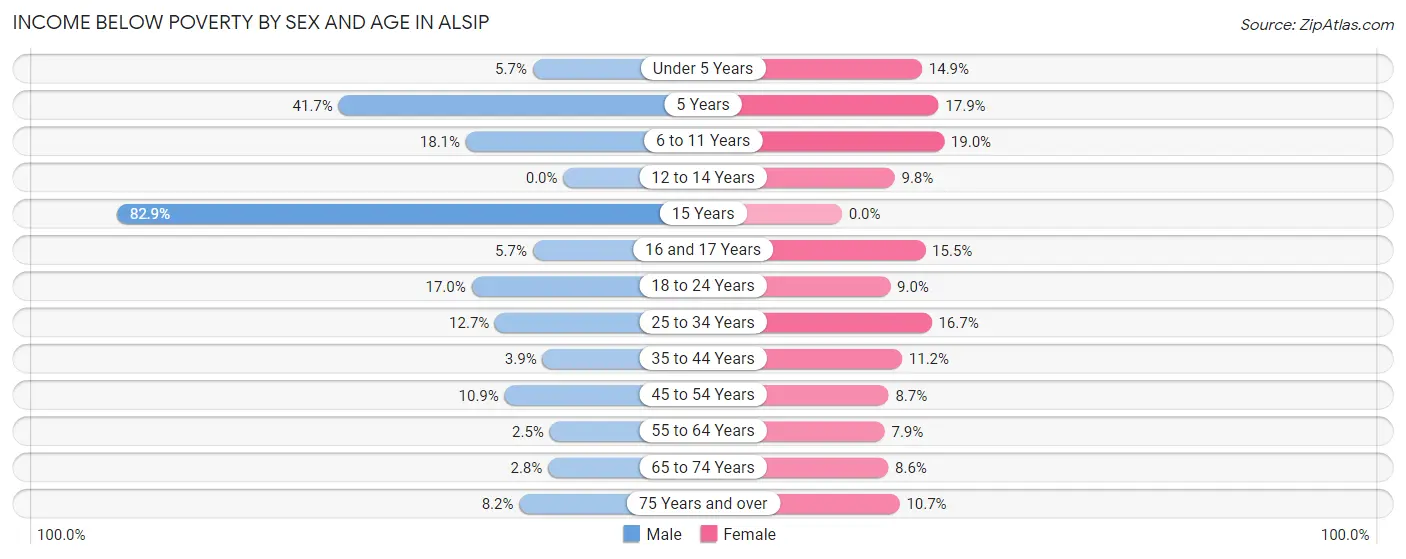
| Age Bracket | Male | Female |
| Under 5 Years | 31 (5.7%) | 67 (14.9%) |
| 5 Years | 83 (41.7%) | 26 (17.9%) |
| 6 to 11 Years | 133 (18.1%) | 151 (19.0%) |
| 12 to 14 Years | 0 (0.0%) | 19 (9.8%) |
| 15 Years | 92 (82.9%) | 0 (0.0%) |
| 16 and 17 Years | 18 (5.7%) | 41 (15.5%) |
| 18 to 24 Years | 146 (17.0%) | 64 (9.0%) |
| 25 to 34 Years | 128 (12.7%) | 150 (16.7%) |
| 35 to 44 Years | 57 (3.9%) | 152 (11.2%) |
| 45 to 54 Years | 121 (10.9%) | 118 (8.7%) |
| 55 to 64 Years | 27 (2.5%) | 94 (7.9%) |
| 65 to 74 Years | 19 (2.8%) | 98 (8.6%) |
| 75 Years and over | 52 (8.2%) | 99 (10.7%) |
| Total | 907 (9.8%) | 1,079 (11.3%) |
Income Above Poverty by Sex and Age in Alsip
According to the poverty statistics in Alsip, males aged 12 to 14 years and females aged 15 years are the age groups that are most secure financially, with 100.0% of males and 100.0% of females in these age groups living above the poverty line.
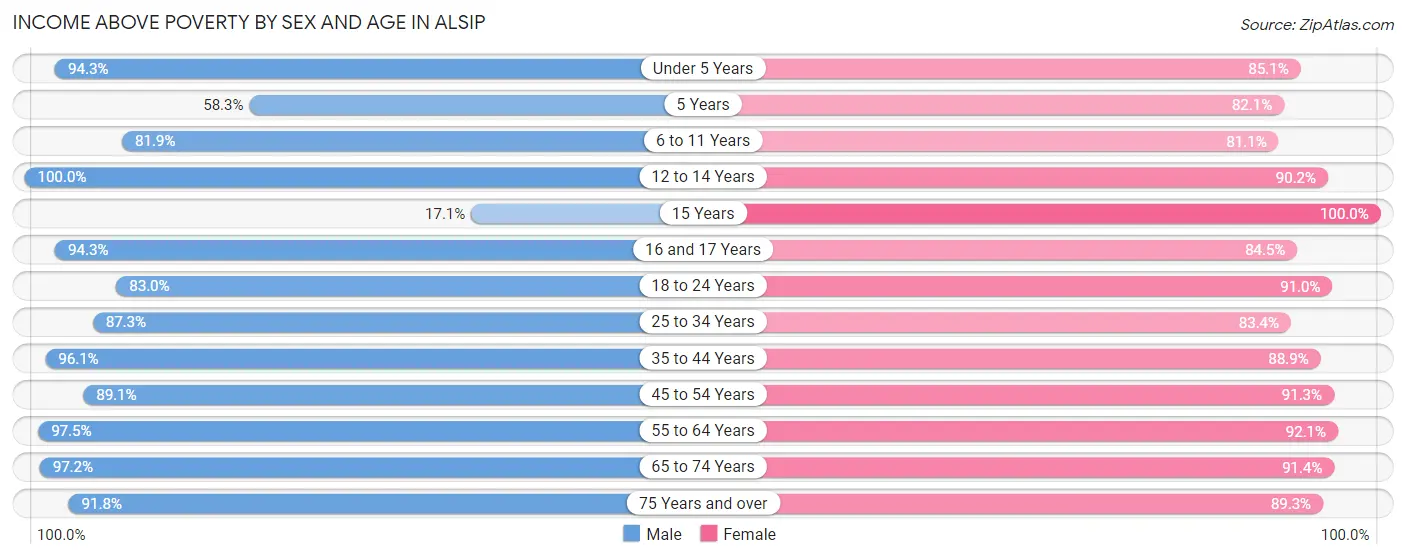
| Age Bracket | Male | Female |
| Under 5 Years | 515 (94.3%) | 384 (85.1%) |
| 5 Years | 116 (58.3%) | 119 (82.1%) |
| 6 to 11 Years | 602 (81.9%) | 646 (81.0%) |
| 12 to 14 Years | 501 (100.0%) | 175 (90.2%) |
| 15 Years | 19 (17.1%) | 116 (100.0%) |
| 16 and 17 Years | 299 (94.3%) | 224 (84.5%) |
| 18 to 24 Years | 711 (83.0%) | 650 (91.0%) |
| 25 to 34 Years | 883 (87.3%) | 751 (83.4%) |
| 35 to 44 Years | 1,416 (96.1%) | 1,211 (88.8%) |
| 45 to 54 Years | 989 (89.1%) | 1,243 (91.3%) |
| 55 to 64 Years | 1,035 (97.5%) | 1,091 (92.1%) |
| 65 to 74 Years | 653 (97.2%) | 1,042 (91.4%) |
| 75 Years and over | 584 (91.8%) | 826 (89.3%) |
| Total | 8,323 (90.2%) | 8,478 (88.7%) |
Income Below Poverty Among Married-Couple Families in Alsip
The poverty statistics for married-couple families in Alsip show that 3.2% or 98 of the total 3,042 families live below the poverty line. Families with 3 or 4 children have the highest poverty rate of 4.0%, comprising of 12 families. On the other hand, families with 1 or 2 children have the lowest poverty rate of 2.8%, which includes 28 families.
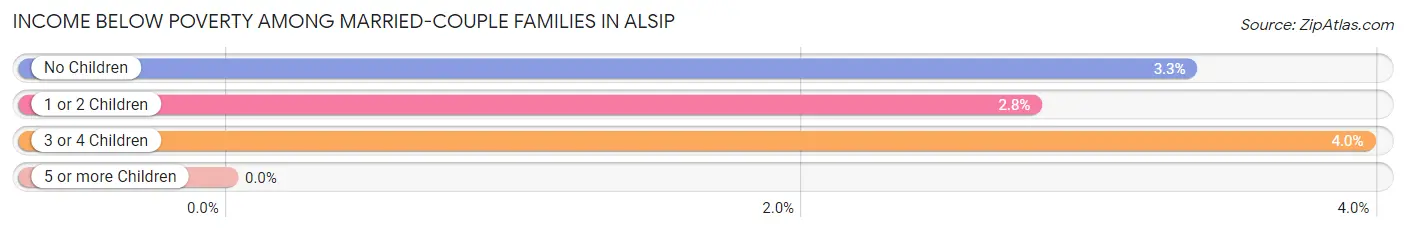
| Children | Above Poverty | Below Poverty |
| No Children | 1,680 (96.7%) | 58 (3.3%) |
| 1 or 2 Children | 973 (97.2%) | 28 (2.8%) |
| 3 or 4 Children | 291 (96.0%) | 12 (4.0%) |
| 5 or more Children | 0 (0.0%) | 0 (0.0%) |
| Total | 2,944 (96.8%) | 98 (3.2%) |
Income Below Poverty Among Single-Parent Households in Alsip
According to the poverty data in Alsip, 17.6% or 48 single-father households and 29.2% or 354 single-mother households are living below the poverty line. Among single-father households, those with 1 or 2 children have the highest poverty rate, with 48 households (32.4%) experiencing poverty. Likewise, among single-mother households, those with 5 or more children have the highest poverty rate, with 18 households (100.0%) falling below the poverty line.
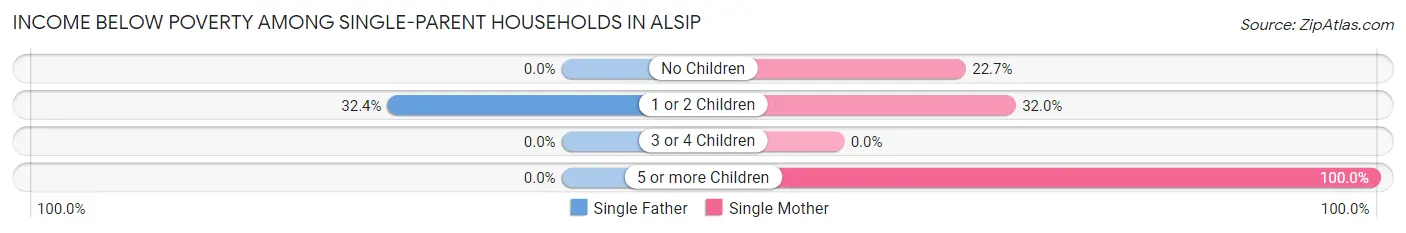
| Children | Single Father | Single Mother |
| No Children | 0 (0.0%) | 89 (22.7%) |
| 1 or 2 Children | 48 (32.4%) | 247 (32.0%) |
| 3 or 4 Children | 0 (0.0%) | 0 (0.0%) |
| 5 or more Children | 0 (0.0%) | 18 (100.0%) |
| Total | 48 (17.6%) | 354 (29.2%) |
Income Below Poverty Among Married-Couple vs Single-Parent Households in Alsip
The poverty data for Alsip shows that 98 of the married-couple family households (3.2%) and 402 of the single-parent households (27.1%) are living below the poverty level. Within the married-couple family households, those with 3 or 4 children have the highest poverty rate, with 12 households (4.0%) falling below the poverty line. Among the single-parent households, those with 5 or more children have the highest poverty rate, with 18 household (100.0%) living below poverty.
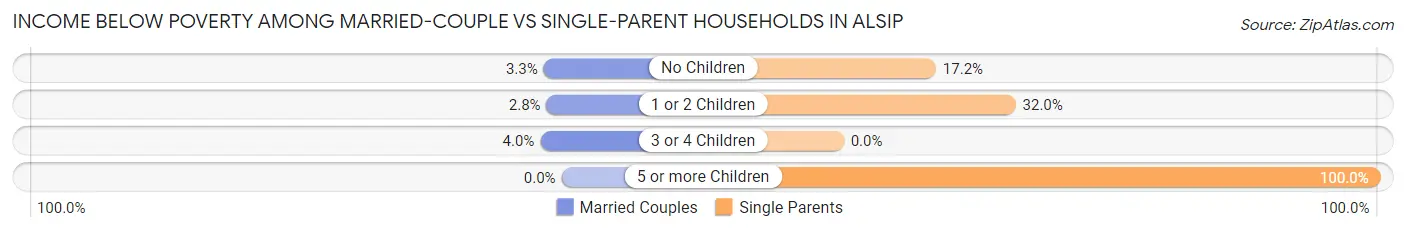
| Children | Married-Couple Families | Single-Parent Households |
| No Children | 58 (3.3%) | 89 (17.2%) |
| 1 or 2 Children | 28 (2.8%) | 295 (32.0%) |
| 3 or 4 Children | 12 (4.0%) | 0 (0.0%) |
| 5 or more Children | 0 (0.0%) | 18 (100.0%) |
| Total | 98 (3.2%) | 402 (27.1%) |
Race in Alsip
The most populous races in Alsip are White / Caucasian (11,028 | 58.5%), Hispanic or Latino (4,875 | 25.8%), and Black / African American (4,366 | 23.1%).
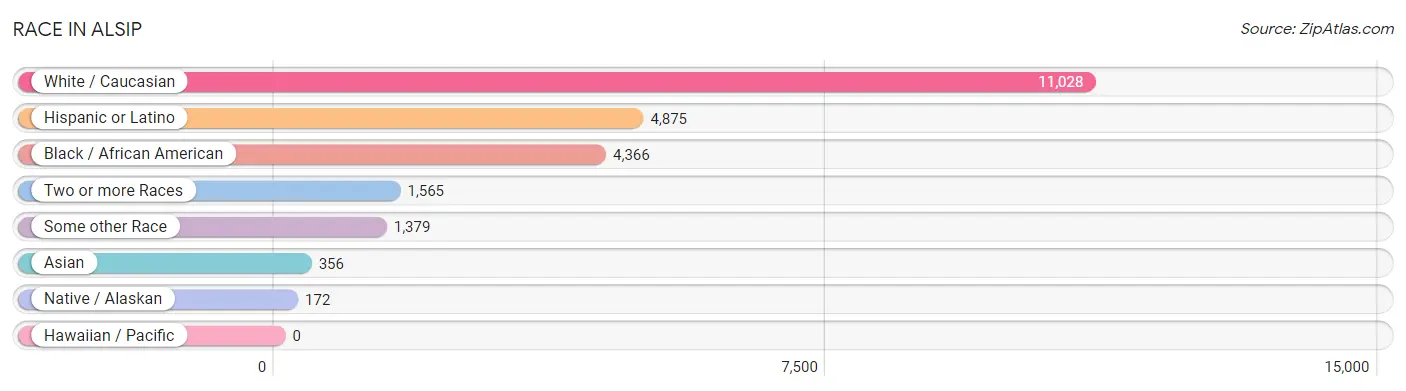
| Race | # Population | % Population |
| Asian | 356 | 1.9% |
| Black / African American | 4,366 | 23.1% |
| Hawaiian / Pacific | 0 | 0.0% |
| Hispanic or Latino | 4,875 | 25.8% |
| Native / Alaskan | 172 | 0.9% |
| White / Caucasian | 11,028 | 58.5% |
| Two or more Races | 1,565 | 8.3% |
| Some other Race | 1,379 | 7.3% |
| Total | 18,866 | 100.0% |
Ancestry in Alsip
The most populous ancestries reported in Alsip are Mexican (4,290 | 22.7%), Irish (2,664 | 14.1%), German (1,983 | 10.5%), Polish (1,907 | 10.1%), and Italian (1,147 | 6.1%), together accounting for 63.6% of all Alsip residents.
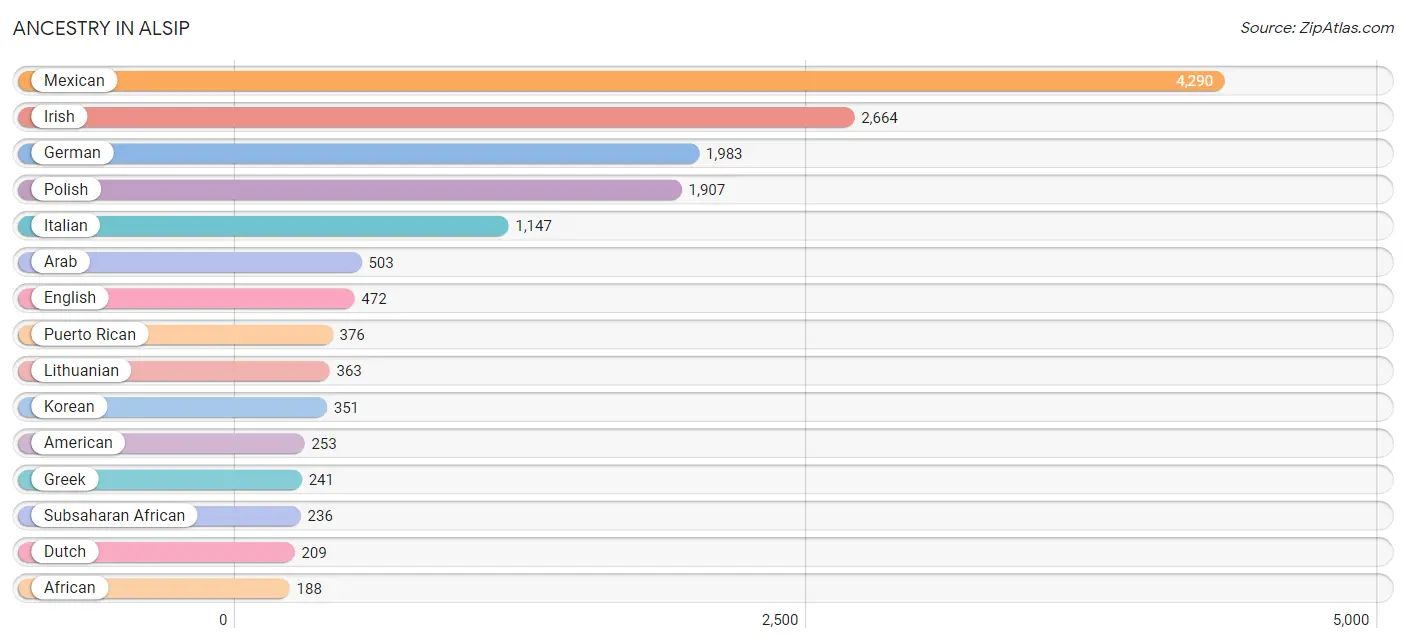
| Ancestry | # Population | % Population |
| African | 188 | 1.0% |
| American | 253 | 1.3% |
| Arab | 503 | 2.7% |
| Austrian | 39 | 0.2% |
| Belgian | 28 | 0.2% |
| British | 41 | 0.2% |
| Central American | 50 | 0.3% |
| Cherokee | 113 | 0.6% |
| Chilean | 11 | 0.1% |
| Croatian | 17 | 0.1% |
| Cuban | 56 | 0.3% |
| Czech | 134 | 0.7% |
| Danish | 34 | 0.2% |
| Dutch | 209 | 1.1% |
| Eastern European | 73 | 0.4% |
| Egyptian | 19 | 0.1% |
| English | 472 | 2.5% |
| European | 65 | 0.3% |
| Finnish | 24 | 0.1% |
| French | 166 | 0.9% |
| French Canadian | 37 | 0.2% |
| German | 1,983 | 10.5% |
| Greek | 241 | 1.3% |
| Guatemalan | 29 | 0.2% |
| Honduran | 12 | 0.1% |
| Irish | 2,664 | 14.1% |
| Israeli | 74 | 0.4% |
| Italian | 1,147 | 6.1% |
| Korean | 351 | 1.9% |
| Lithuanian | 363 | 1.9% |
| Mexican | 4,290 | 22.7% |
| Mexican American Indian | 137 | 0.7% |
| Moroccan | 123 | 0.6% |
| Nigerian | 48 | 0.3% |
| Norwegian | 36 | 0.2% |
| Palestinian | 167 | 0.9% |
| Panamanian | 9 | 0.1% |
| Polish | 1,907 | 10.1% |
| Puerto Rican | 376 | 2.0% |
| Romanian | 8 | 0.0% |
| Russian | 9 | 0.1% |
| Scotch-Irish | 68 | 0.4% |
| Scottish | 72 | 0.4% |
| Serbian | 66 | 0.4% |
| Sioux | 60 | 0.3% |
| Slovak | 49 | 0.3% |
| South American | 11 | 0.1% |
| Sri Lankan | 59 | 0.3% |
| Subsaharan African | 236 | 1.3% |
| Swedish | 168 | 0.9% |
| Thai | 17 | 0.1% |
| Turkish | 9 | 0.1% |
| Ukrainian | 97 | 0.5% | View All 53 Rows |
Immigrants in Alsip
The most numerous immigrant groups reported in Alsip came from Latin America (804 | 4.3%), Central America (793 | 4.2%), Mexico (737 | 3.9%), Asia (456 | 2.4%), and Europe (382 | 2.0%), together accounting for 16.8% of all Alsip residents.
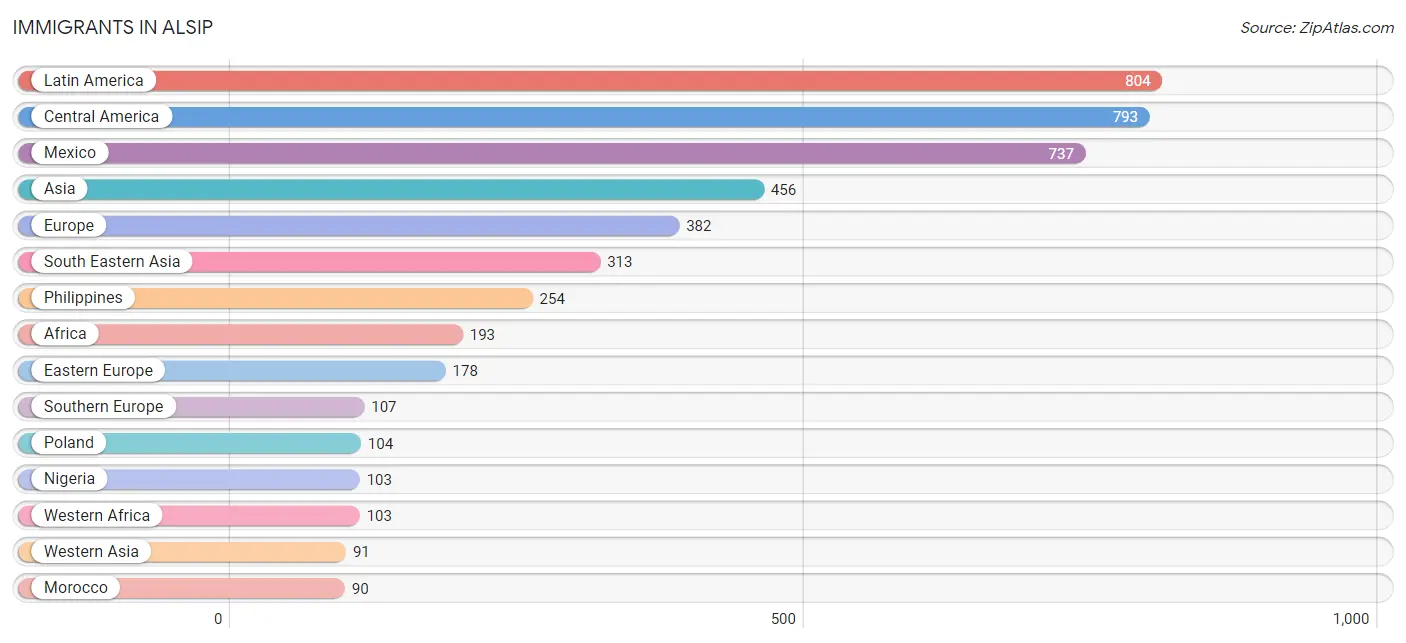
| Immigration Origin | # Population | % Population |
| Africa | 193 | 1.0% |
| Asia | 456 | 2.4% |
| Austria | 18 | 0.1% |
| Belgium | 8 | 0.0% |
| Canada | 8 | 0.0% |
| Central America | 793 | 4.2% |
| Chile | 11 | 0.1% |
| Eastern Europe | 178 | 0.9% |
| England | 26 | 0.1% |
| Europe | 382 | 2.0% |
| Greece | 57 | 0.3% |
| Guatemala | 29 | 0.2% |
| Honduras | 18 | 0.1% |
| India | 17 | 0.1% |
| Ireland | 34 | 0.2% |
| Israel | 39 | 0.2% |
| Italy | 50 | 0.3% |
| Jordan | 18 | 0.1% |
| Kuwait | 15 | 0.1% |
| Latin America | 804 | 4.3% |
| Mexico | 737 | 3.9% |
| Morocco | 90 | 0.5% |
| Nigeria | 103 | 0.5% |
| Northern Africa | 90 | 0.5% |
| Northern Europe | 71 | 0.4% |
| Panama | 9 | 0.1% |
| Philippines | 254 | 1.3% |
| Poland | 104 | 0.5% |
| Romania | 8 | 0.0% |
| Saudi Arabia | 19 | 0.1% |
| Serbia | 66 | 0.4% |
| South America | 11 | 0.1% |
| South Central Asia | 17 | 0.1% |
| South Eastern Asia | 313 | 1.7% |
| Southern Europe | 107 | 0.6% |
| Vietnam | 59 | 0.3% |
| Western Africa | 103 | 0.5% |
| Western Asia | 91 | 0.5% |
| Western Europe | 26 | 0.1% | View All 39 Rows |
Sex and Age in Alsip
Sex and Age in Alsip
The most populous age groups in Alsip are 35 to 39 Years (883 | 9.5%) for men and 45 to 49 Years (848 | 8.8%) for women.
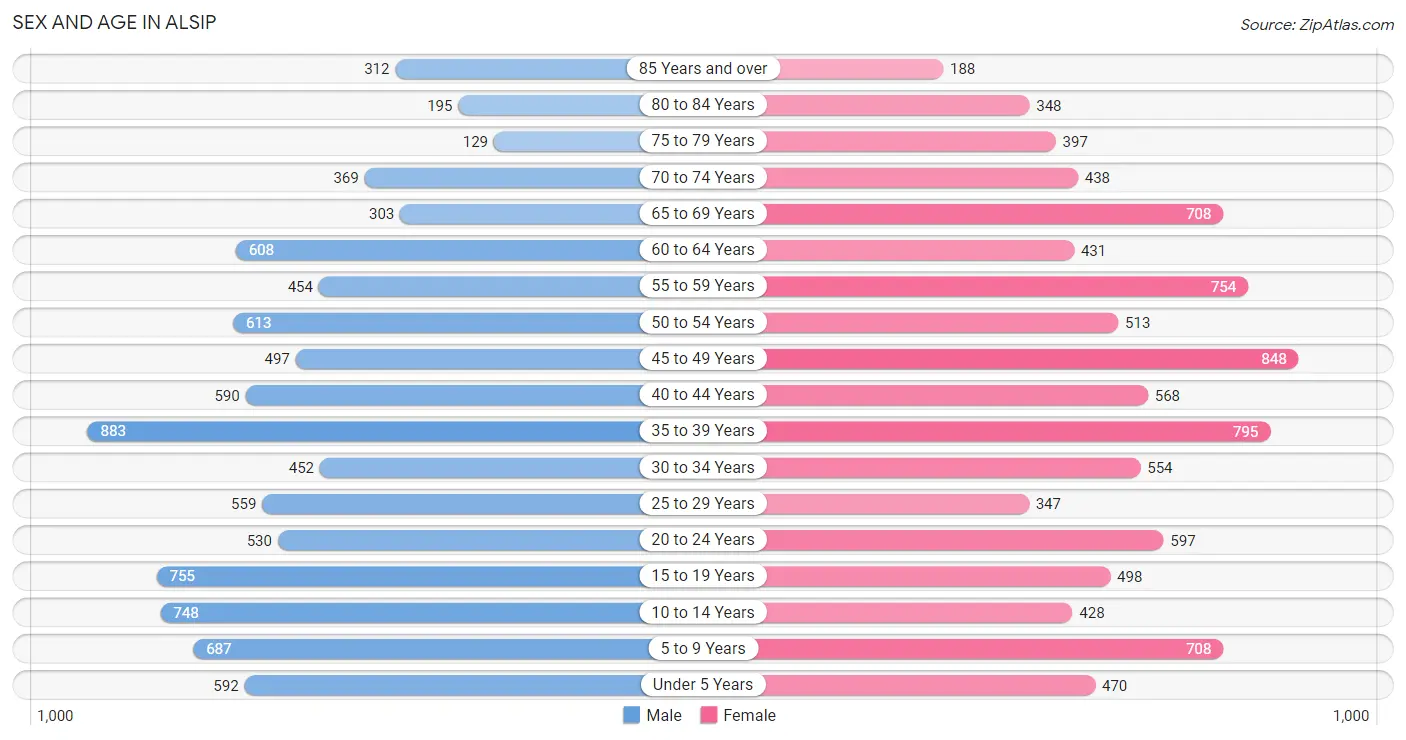
| Age Bracket | Male | Female |
| Under 5 Years | 592 (6.4%) | 470 (4.9%) |
| 5 to 9 Years | 687 (7.4%) | 708 (7.4%) |
| 10 to 14 Years | 748 (8.1%) | 428 (4.5%) |
| 15 to 19 Years | 755 (8.1%) | 498 (5.2%) |
| 20 to 24 Years | 530 (5.7%) | 597 (6.2%) |
| 25 to 29 Years | 559 (6.0%) | 347 (3.6%) |
| 30 to 34 Years | 452 (4.9%) | 554 (5.8%) |
| 35 to 39 Years | 883 (9.5%) | 795 (8.3%) |
| 40 to 44 Years | 590 (6.4%) | 568 (5.9%) |
| 45 to 49 Years | 497 (5.4%) | 848 (8.8%) |
| 50 to 54 Years | 613 (6.6%) | 513 (5.3%) |
| 55 to 59 Years | 454 (4.9%) | 754 (7.9%) |
| 60 to 64 Years | 608 (6.6%) | 431 (4.5%) |
| 65 to 69 Years | 303 (3.3%) | 708 (7.4%) |
| 70 to 74 Years | 369 (4.0%) | 438 (4.6%) |
| 75 to 79 Years | 129 (1.4%) | 397 (4.1%) |
| 80 to 84 Years | 195 (2.1%) | 348 (3.6%) |
| 85 Years and over | 312 (3.4%) | 188 (2.0%) |
| Total | 9,276 (100.0%) | 9,590 (100.0%) |
Families and Households in Alsip
Median Family Size in Alsip
The median family size in Alsip is 3.31 persons per family, with married-couple families (3,042 | 67.2%) accounting for the largest median family size of 3.46 persons per family. On the other hand, single female/mother families (1,211 | 26.8%) represent the smallest median family size with 2.99 persons per family.
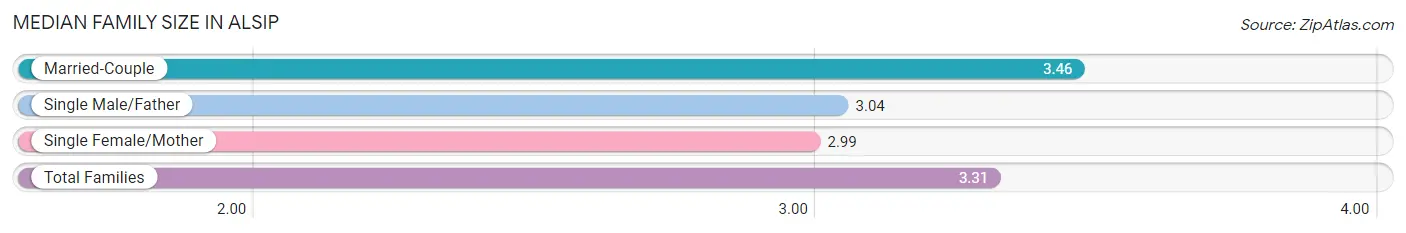
| Family Type | # Families | Family Size |
| Married-Couple | 3,042 (67.2%) | 3.46 |
| Single Male/Father | 273 (6.0%) | 3.04 |
| Single Female/Mother | 1,211 (26.8%) | 2.99 |
| Total Families | 4,526 (100.0%) | 3.31 |
Median Household Size in Alsip
The median household size in Alsip is 2.45 persons per household, with married-couple households (3,042 | 39.6%) accounting for the largest median household size of 3.49 persons per household. non-family households (3,157 | 41.1%) represent the smallest median household size with 1.12 persons per household.
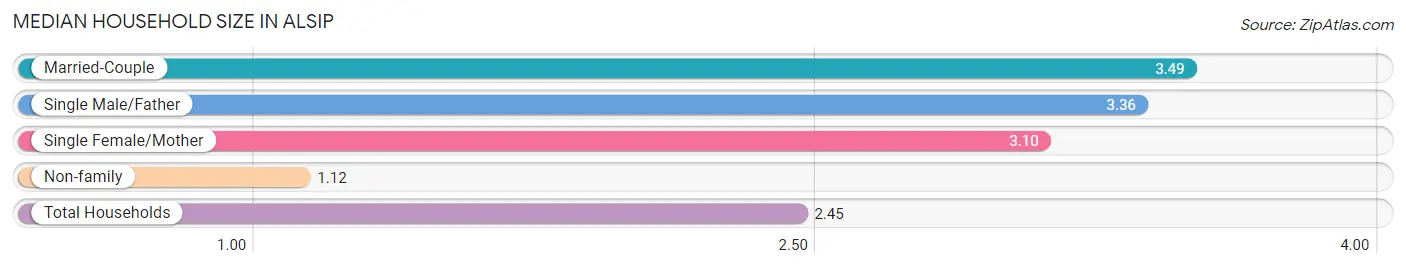
| Household Type | # Households | Household Size |
| Married-Couple | 3,042 (39.6%) | 3.49 |
| Single Male/Father | 273 (3.5%) | 3.36 |
| Single Female/Mother | 1,211 (15.8%) | 3.10 |
| Non-family | 3,157 (41.1%) | 1.12 |
| Total Households | 7,683 (100.0%) | 2.45 |
Household Size by Marriage Status in Alsip
Out of a total of 7,683 households in Alsip, 4,526 (58.9%) are family households, while 3,157 (41.1%) are nonfamily households. The most numerous type of family households are 2-person households, comprising 1,597, and the most common type of nonfamily households are 1-person households, comprising 2,827.
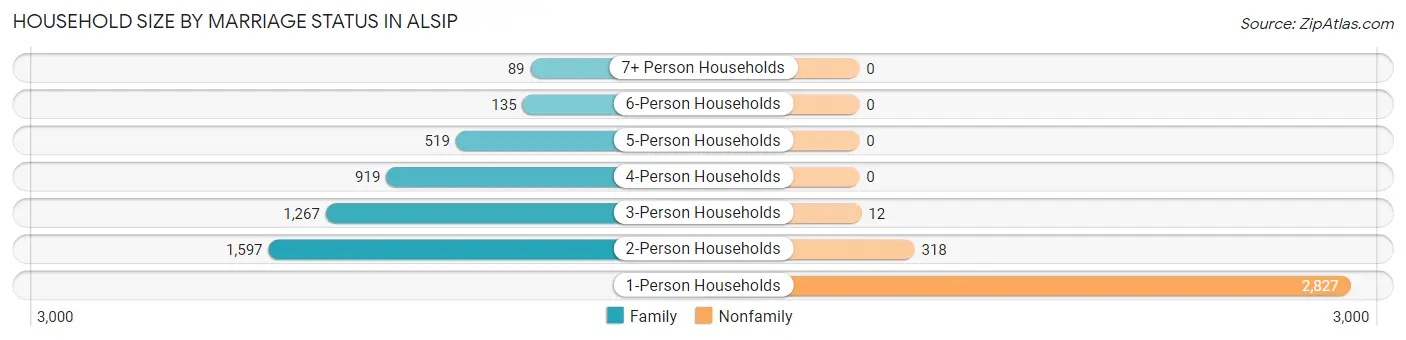
| Household Size | Family Households | Nonfamily Households |
| 1-Person Households | - | 2,827 (36.8%) |
| 2-Person Households | 1,597 (20.8%) | 318 (4.1%) |
| 3-Person Households | 1,267 (16.5%) | 12 (0.2%) |
| 4-Person Households | 919 (12.0%) | 0 (0.0%) |
| 5-Person Households | 519 (6.8%) | 0 (0.0%) |
| 6-Person Households | 135 (1.8%) | 0 (0.0%) |
| 7+ Person Households | 89 (1.2%) | 0 (0.0%) |
| Total | 4,526 (58.9%) | 3,157 (41.1%) |
Female Fertility in Alsip
Fertility by Age in Alsip
Average fertility rate in Alsip is 57.0 births per 1,000 women. Women in the age bracket of 35 to 50 years have the highest fertility rate with 89.0 births per 1,000 women. Women in the age bracket of 35 to 50 years acount for 83.8% of all women with births.
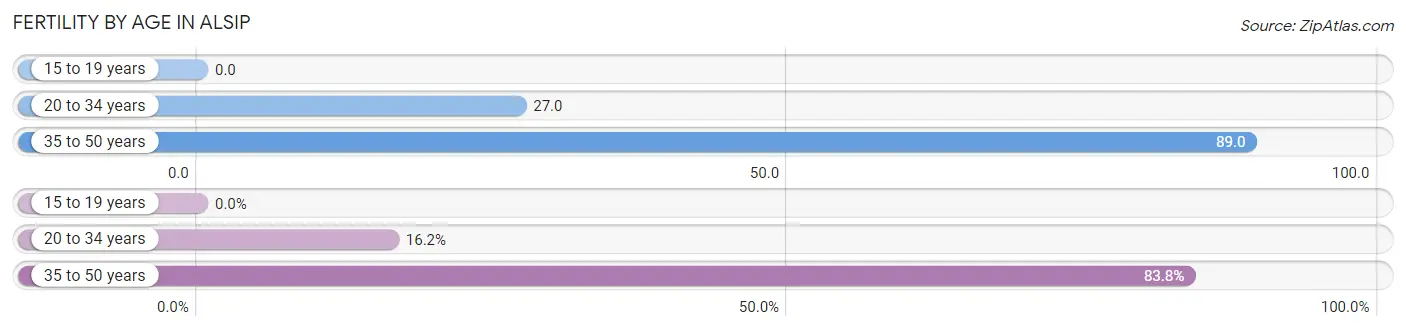
| Age Bracket | Women with Births | Births / 1,000 Women |
| 15 to 19 years | 0 (0.0%) | 0.0 |
| 20 to 34 years | 40 (16.2%) | 27.0 |
| 35 to 50 years | 207 (83.8%) | 89.0 |
| Total | 247 (100.0%) | 57.0 |
Fertility by Age by Marriage Status in Alsip
49.4% of women with births (247) in Alsip are married. The highest percentage of unmarried women with births falls into 35 to 50 years age bracket with 60.4% of them unmarried at the time of birth, while the lowest percentage of unmarried women with births belong to 20 to 34 years age bracket with 0.0% of them unmarried.
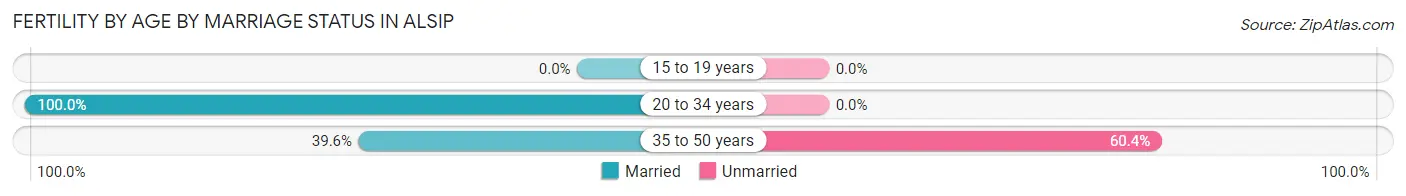
| Age Bracket | Married | Unmarried |
| 15 to 19 years | 0 (0.0%) | 0 (0.0%) |
| 20 to 34 years | 40 (100.0%) | 0 (0.0%) |
| 35 to 50 years | 82 (39.6%) | 125 (60.4%) |
| Total | 122 (49.4%) | 125 (50.6%) |
Fertility by Education in Alsip
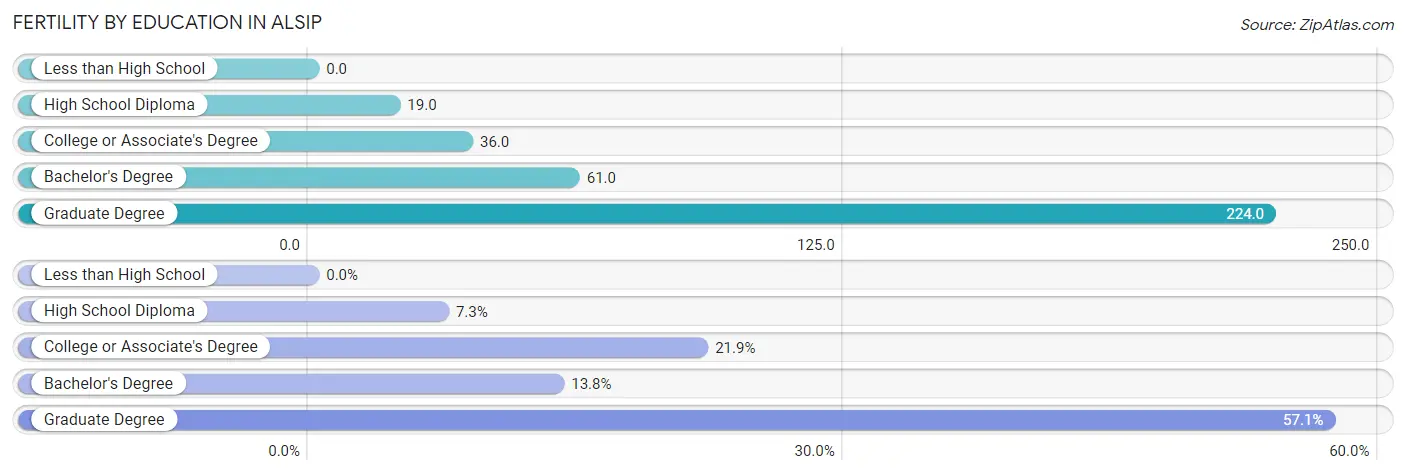
| Educational Attainment | Women with Births | Births / 1,000 Women |
| Less than High School | 0 (0.0%) | 0.0 |
| High School Diploma | 18 (7.3%) | 19.0 |
| College or Associate's Degree | 54 (21.9%) | 36.0 |
| Bachelor's Degree | 34 (13.8%) | 61.0 |
| Graduate Degree | 141 (57.1%) | 224.0 |
| Total | 247 (100.0%) | 57.0 |
Fertility by Education by Marriage Status in Alsip
50.6% of women with births in Alsip are unmarried. Women with the educational attainment of high school diploma are most likely to be married with 100.0% of them married at childbirth, while women with the educational attainment of graduate degree are least likely to be married with 80.8% of them unmarried at childbirth.
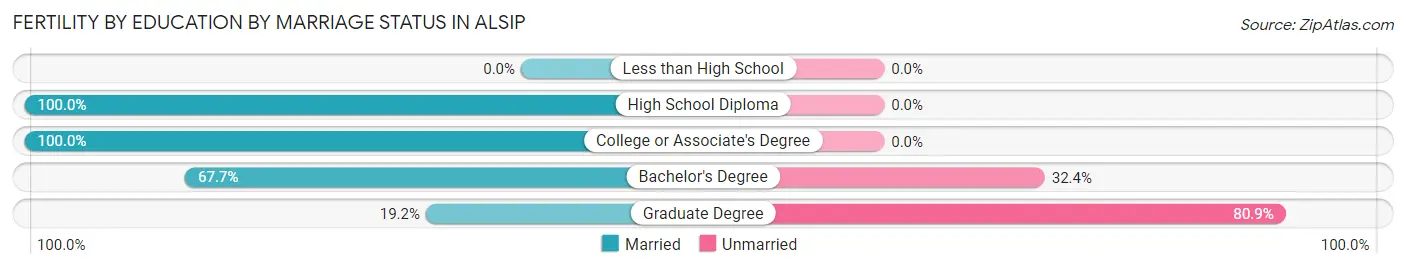
| Educational Attainment | Married | Unmarried |
| Less than High School | 0 (0.0%) | 0 (0.0%) |
| High School Diploma | 18 (100.0%) | 0 (0.0%) |
| College or Associate's Degree | 54 (100.0%) | 0 (0.0%) |
| Bachelor's Degree | 23 (67.6%) | 11 (32.4%) |
| Graduate Degree | 27 (19.2%) | 114 (80.8%) |
| Total | 122 (49.4%) | 125 (50.6%) |
Employment Characteristics in Alsip
Employment by Class of Employer in Alsip
Among the 9,007 employed individuals in Alsip, private company employees (6,961 | 77.3%), local government employees (775 | 8.6%), and not-for-profit organizations (560 | 6.2%) make up the most common classes of employment.
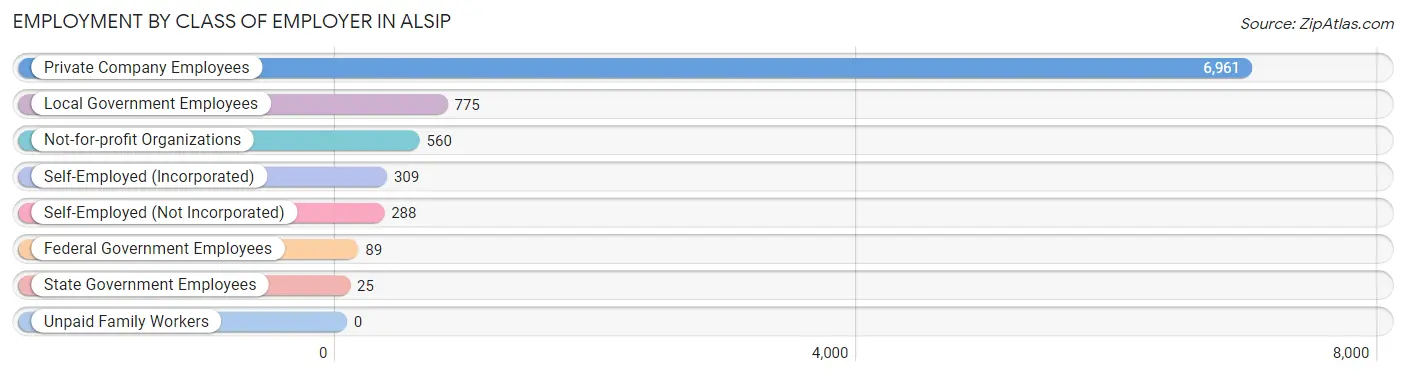
| Employer Class | # Employees | % Employees |
| Private Company Employees | 6,961 | 77.3% |
| Self-Employed (Incorporated) | 309 | 3.4% |
| Self-Employed (Not Incorporated) | 288 | 3.2% |
| Not-for-profit Organizations | 560 | 6.2% |
| Local Government Employees | 775 | 8.6% |
| State Government Employees | 25 | 0.3% |
| Federal Government Employees | 89 | 1.0% |
| Unpaid Family Workers | 0 | 0.0% |
| Total | 9,007 | 100.0% |
Employment Status by Age in Alsip
According to the labor force statistics for Alsip, out of the total population over 16 years of age (15,006), 65.5% or 9,829 individuals are in the labor force, with 6.7% or 659 of them unemployed. The age group with the highest labor force participation rate is 25 to 29 years, with 95.3% or 863 individuals in the labor force. Within the labor force, the 25 to 29 years age range has the highest percentage of unemployed individuals, with 24.6% or 212 of them being unemployed.
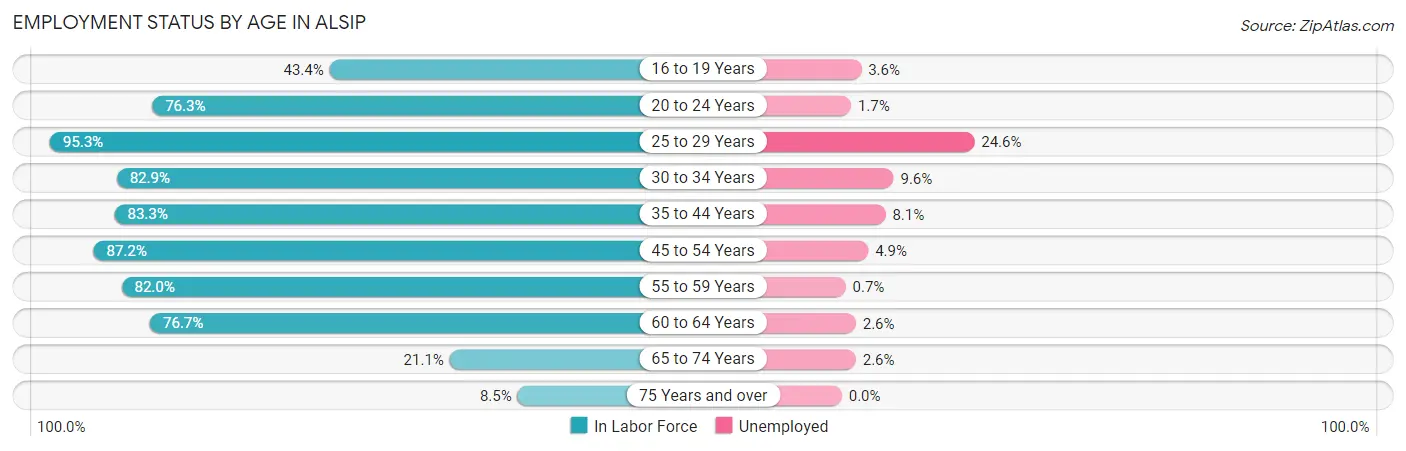
| Age Bracket | In Labor Force | Unemployed |
| 16 to 19 Years | 445 (43.4%) | 16 (3.6%) |
| 20 to 24 Years | 860 (76.3%) | 15 (1.7%) |
| 25 to 29 Years | 863 (95.3%) | 212 (24.6%) |
| 30 to 34 Years | 834 (82.9%) | 80 (9.6%) |
| 35 to 44 Years | 2,362 (83.3%) | 191 (8.1%) |
| 45 to 54 Years | 2,155 (87.2%) | 106 (4.9%) |
| 55 to 59 Years | 991 (82.0%) | 7 (0.7%) |
| 60 to 64 Years | 797 (76.7%) | 21 (2.6%) |
| 65 to 74 Years | 384 (21.1%) | 10 (2.6%) |
| 75 Years and over | 133 (8.5%) | 0 (0.0%) |
| Total | 9,829 (65.5%) | 659 (6.7%) |
Employment Status by Educational Attainment in Alsip
According to labor force statistics for Alsip, 84.5% of individuals (7,999) out of the total population between 25 and 64 years of age (9,466) are in the labor force, with 7.7% or 616 of them being unemployed. The group with the highest labor force participation rate are those with the educational attainment of bachelor's degree or higher, with 92.0% or 2,252 individuals in the labor force. Within the labor force, individuals with less than high school education have the highest percentage of unemployment, with 20.2% or 146 of them being unemployed.
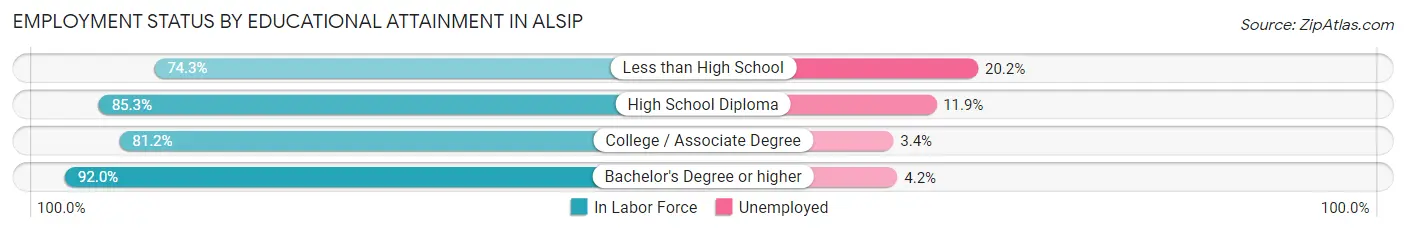
| Educational Attainment | In Labor Force | Unemployed |
| Less than High School | 721 (74.3%) | 196 (20.2%) |
| High School Diploma | 2,424 (85.3%) | 338 (11.9%) |
| College / Associate Degree | 2,603 (81.2%) | 109 (3.4%) |
| Bachelor's Degree or higher | 2,252 (92.0%) | 103 (4.2%) |
| Total | 7,999 (84.5%) | 729 (7.7%) |
Employment Occupations by Sex in Alsip
Management, Business, Science and Arts Occupations
The most common Management, Business, Science and Arts occupations in Alsip are Management (892 | 9.7%), Community & Social Service (840 | 9.2%), Health Diagnosing & Treating (721 | 7.9%), Business & Financial (404 | 4.4%), and Education Instruction & Library (404 | 4.4%).
Management, Business, Science and Arts Occupations by Sex
Within the Management, Business, Science and Arts occupations in Alsip, the most male-oriented occupations are Architecture & Engineering (100.0%), Life, Physical & Social Science (100.0%), and Computers, Engineering & Science (88.4%), while the most female-oriented occupations are Legal Services & Support (100.0%), Education Instruction & Library (82.7%), and Education, Arts & Media (81.1%).
| Occupation | Male | Female |
| Management | 427 (47.9%) | 465 (52.1%) |
| Business & Financial | 119 (29.5%) | 285 (70.5%) |
| Computers, Engineering & Science | 260 (88.4%) | 34 (11.6%) |
| Computers & Mathematics | 88 (72.1%) | 34 (27.9%) |
| Architecture & Engineering | 130 (100.0%) | 0 (0.0%) |
| Life, Physical & Social Science | 42 (100.0%) | 0 (0.0%) |
| Community & Social Service | 217 (25.8%) | 623 (74.2%) |
| Education, Arts & Media | 45 (18.9%) | 193 (81.1%) |
| Legal Services & Support | 0 (0.0%) | 29 (100.0%) |
| Education Instruction & Library | 70 (17.3%) | 334 (82.7%) |
| Arts, Media & Entertainment | 102 (60.4%) | 67 (39.6%) |
| Health Diagnosing & Treating | 168 (23.3%) | 553 (76.7%) |
| Health Technologists | 64 (19.5%) | 265 (80.5%) |
| Total (Category) | 1,191 (37.8%) | 1,960 (62.2%) |
| Total (Overall) | 4,723 (51.5%) | 4,441 (48.5%) |
Services Occupations
The most common Services occupations in Alsip are Personal Care & Service (346 | 3.8%), Cleaning & Maintenance (332 | 3.6%), Healthcare Support (288 | 3.1%), Food Preparation & Serving (210 | 2.3%), and Security & Protection (199 | 2.2%).
Services Occupations by Sex
Within the Services occupations in Alsip, the most male-oriented occupations are Firefighting & Prevention (90.7%), Security & Protection (81.9%), and Law Enforcement (73.5%), while the most female-oriented occupations are Healthcare Support (65.3%), Personal Care & Service (61.3%), and Food Preparation & Serving (53.8%).
| Occupation | Male | Female |
| Healthcare Support | 100 (34.7%) | 188 (65.3%) |
| Security & Protection | 163 (81.9%) | 36 (18.1%) |
| Firefighting & Prevention | 88 (90.7%) | 9 (9.3%) |
| Law Enforcement | 75 (73.5%) | 27 (26.5%) |
| Food Preparation & Serving | 97 (46.2%) | 113 (53.8%) |
| Cleaning & Maintenance | 237 (71.4%) | 95 (28.6%) |
| Personal Care & Service | 134 (38.7%) | 212 (61.3%) |
| Total (Category) | 731 (53.2%) | 644 (46.8%) |
| Total (Overall) | 4,723 (51.5%) | 4,441 (48.5%) |
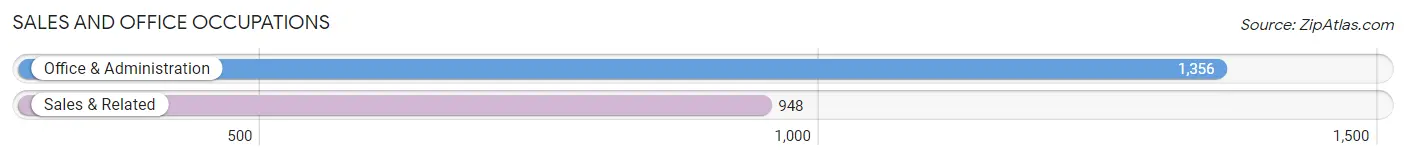
Sales and Office Occupations
The most common Sales and Office occupations in Alsip are Office & Administration (1,356 | 14.8%), and Sales & Related (948 | 10.3%).
Sales and Office Occupations by Sex
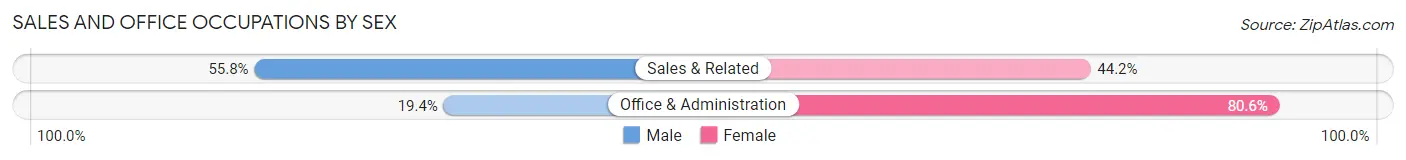
| Occupation | Male | Female |
| Sales & Related | 529 (55.8%) | 419 (44.2%) |
| Office & Administration | 263 (19.4%) | 1,093 (80.6%) |
| Total (Category) | 792 (34.4%) | 1,512 (65.6%) |
| Total (Overall) | 4,723 (51.5%) | 4,441 (48.5%) |
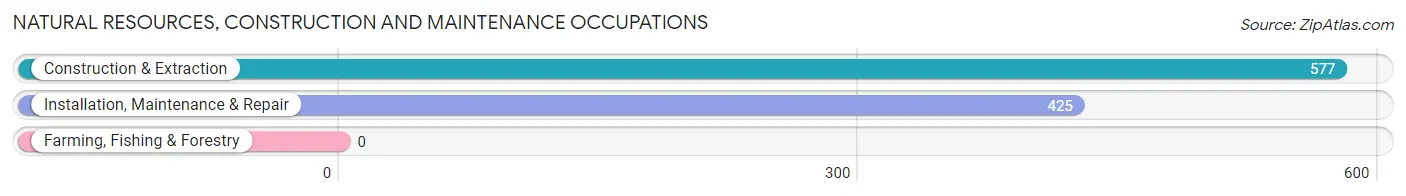
Natural Resources, Construction and Maintenance Occupations
The most common Natural Resources, Construction and Maintenance occupations in Alsip are Construction & Extraction (577 | 6.3%), and Installation, Maintenance & Repair (425 | 4.6%).
Natural Resources, Construction and Maintenance Occupations by Sex
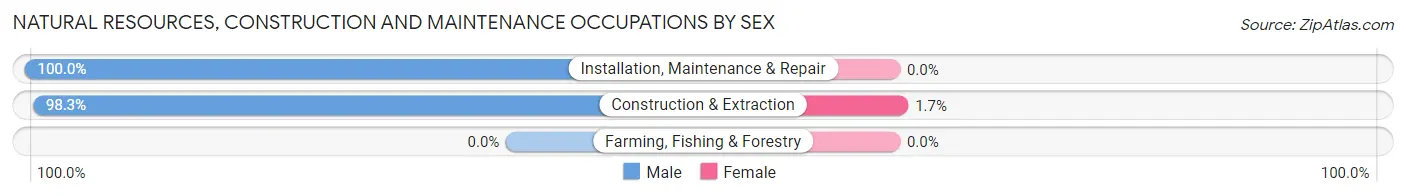
| Occupation | Male | Female |
| Farming, Fishing & Forestry | 0 (0.0%) | 0 (0.0%) |
| Construction & Extraction | 567 (98.3%) | 10 (1.7%) |
| Installation, Maintenance & Repair | 425 (100.0%) | 0 (0.0%) |
| Total (Category) | 992 (99.0%) | 10 (1.0%) |
| Total (Overall) | 4,723 (51.5%) | 4,441 (48.5%) |
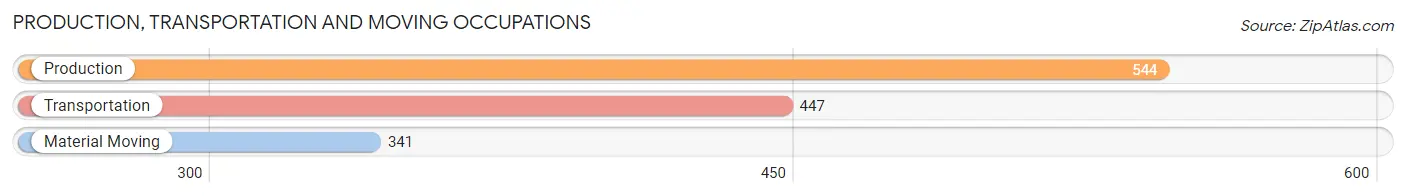
Production, Transportation and Moving Occupations
The most common Production, Transportation and Moving occupations in Alsip are Production (544 | 5.9%), Transportation (447 | 4.9%), and Material Moving (341 | 3.7%).
Production, Transportation and Moving Occupations by Sex
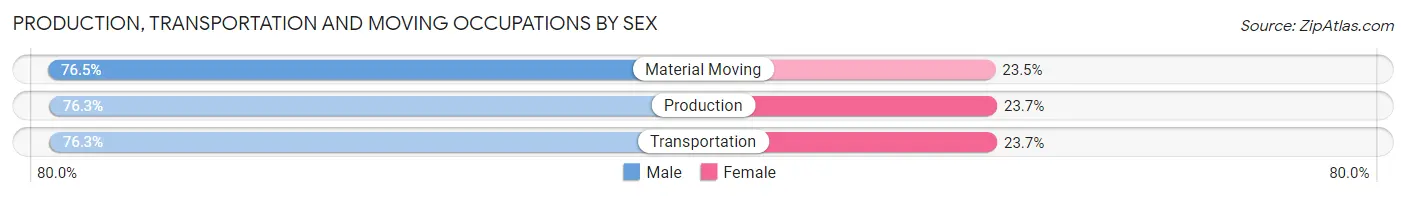
| Occupation | Male | Female |
| Production | 415 (76.3%) | 129 (23.7%) |
| Transportation | 341 (76.3%) | 106 (23.7%) |
| Material Moving | 261 (76.5%) | 80 (23.5%) |
| Total (Category) | 1,017 (76.3%) | 315 (23.6%) |
| Total (Overall) | 4,723 (51.5%) | 4,441 (48.5%) |
Employment Industries by Sex in Alsip
Employment Industries in Alsip
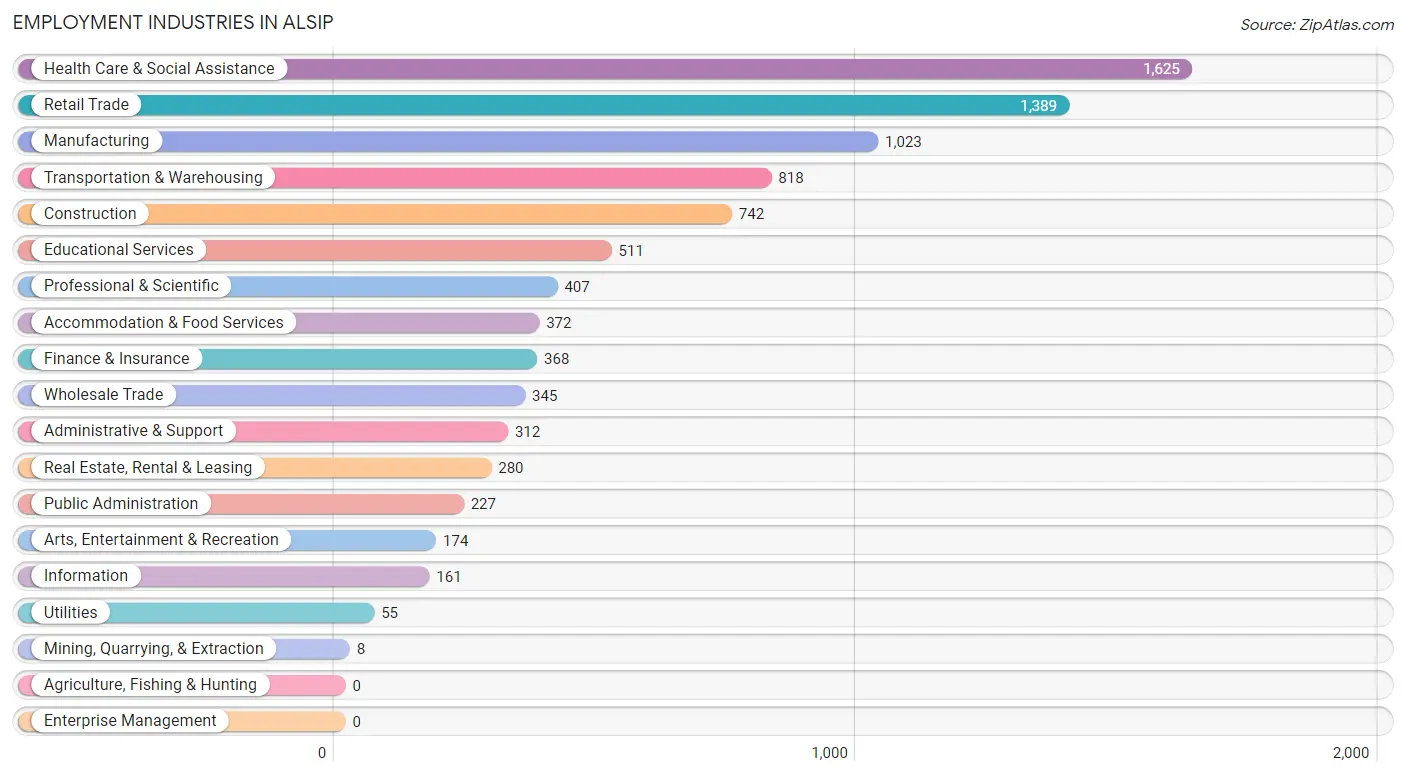
The major employment industries in Alsip include Health Care & Social Assistance (1,625 | 17.7%), Retail Trade (1,389 | 15.2%), Manufacturing (1,023 | 11.2%), Transportation & Warehousing (818 | 8.9%), and Construction (742 | 8.1%).
Employment Industries by Sex in Alsip
The Alsip industries that see more men than women are Construction (97.6%), Information (85.1%), and Administrative & Support (76.6%), whereas the industries that tend to have a higher number of women are Mining, Quarrying, & Extraction (100.0%), Finance & Insurance (77.4%), and Health Care & Social Assistance (75.2%).
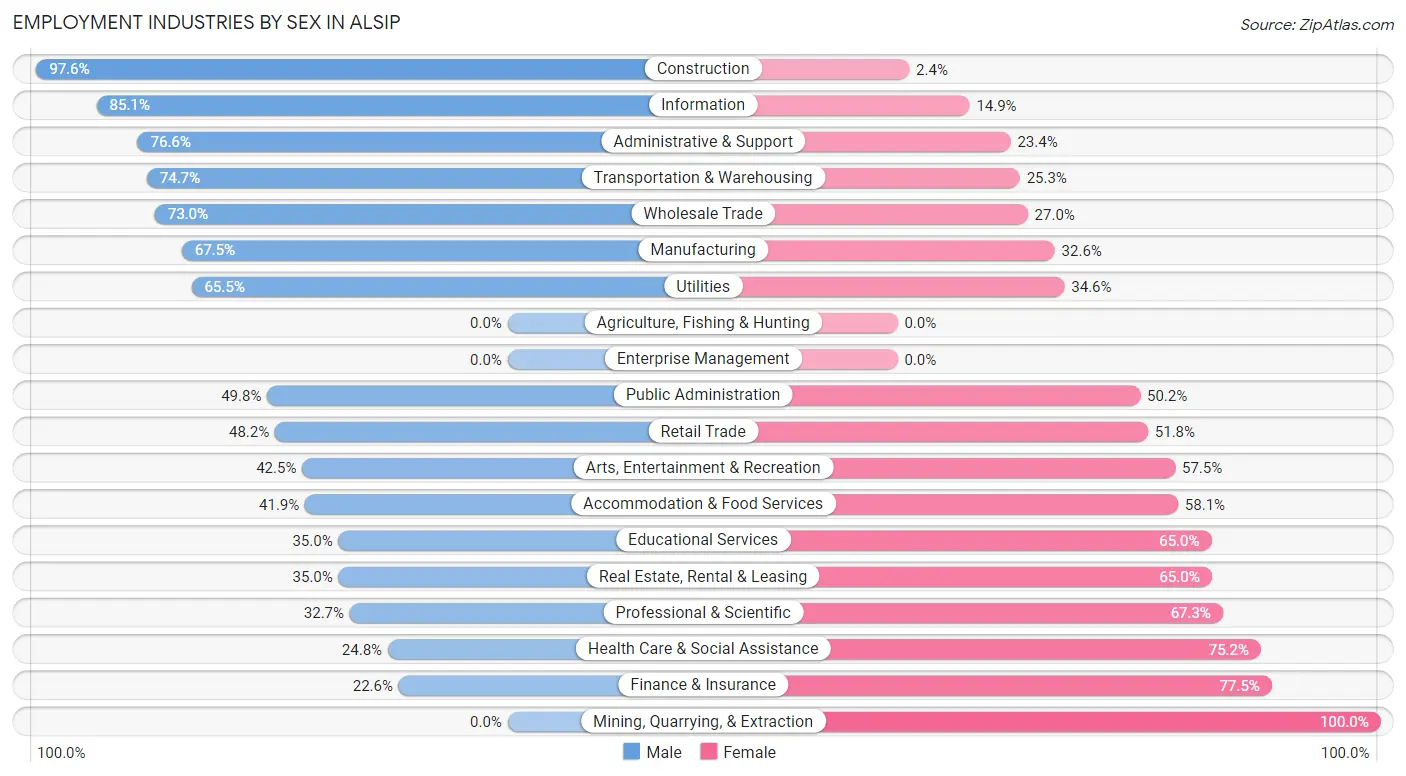
| Industry | Male | Female |
| Agriculture, Fishing & Hunting | 0 (0.0%) | 0 (0.0%) |
| Mining, Quarrying, & Extraction | 0 (0.0%) | 8 (100.0%) |
| Construction | 724 (97.6%) | 18 (2.4%) |
| Manufacturing | 690 (67.4%) | 333 (32.6%) |
| Wholesale Trade | 252 (73.0%) | 93 (27.0%) |
| Retail Trade | 669 (48.2%) | 720 (51.8%) |
| Transportation & Warehousing | 611 (74.7%) | 207 (25.3%) |
| Utilities | 36 (65.4%) | 19 (34.5%) |
| Information | 137 (85.1%) | 24 (14.9%) |
| Finance & Insurance | 83 (22.6%) | 285 (77.4%) |
| Real Estate, Rental & Leasing | 98 (35.0%) | 182 (65.0%) |
| Professional & Scientific | 133 (32.7%) | 274 (67.3%) |
| Enterprise Management | 0 (0.0%) | 0 (0.0%) |
| Administrative & Support | 239 (76.6%) | 73 (23.4%) |
| Educational Services | 179 (35.0%) | 332 (65.0%) |
| Health Care & Social Assistance | 403 (24.8%) | 1,222 (75.2%) |
| Arts, Entertainment & Recreation | 74 (42.5%) | 100 (57.5%) |
| Accommodation & Food Services | 156 (41.9%) | 216 (58.1%) |
| Public Administration | 113 (49.8%) | 114 (50.2%) |
| Total | 4,723 (51.5%) | 4,441 (48.5%) |
Education in Alsip
School Enrollment in Alsip
The most common levels of schooling among the 4,931 students in Alsip are high school (1,274 | 25.8%), elementary school (1,028 | 20.8%), and college / undergraduate (921 | 18.7%).
| School Level | # Students | % Students |
| Nursery / Preschool | 356 | 7.2% |
| Kindergarten | 228 | 4.6% |
| Elementary School | 1,028 | 20.8% |
| Middle School | 906 | 18.4% |
| High School | 1,274 | 25.8% |
| College / Undergraduate | 921 | 18.7% |
| Graduate / Professional | 218 | 4.4% |
| Total | 4,931 | 100.0% |
School Enrollment by Age by Funding Source in Alsip
Out of a total of 4,931 students who are enrolled in schools in Alsip, 542 (11.0%) attend a private institution, while the remaining 4,389 (89.0%) are enrolled in public schools. The age group of 35 years and over has the highest likelihood of being enrolled in private schools, with 73 (32.6% in the age bracket) enrolled. Conversely, the age group of 15 to 17 year olds has the lowest likelihood of being enrolled in a private school, with 803 (100.0% in the age bracket) attending a public institution.
| Age Bracket | Public School | Private School |
| 3 to 4 Year Olds | 184 (88.0%) | 25 (12.0%) |
| 5 to 9 Year Old | 1,088 (85.5%) | 184 (14.5%) |
| 10 to 14 Year Olds | 1,116 (96.5%) | 41 (3.5%) |
| 15 to 17 Year Olds | 803 (100.0%) | 0 (0.0%) |
| 18 to 19 Year Olds | 409 (98.3%) | 7 (1.7%) |
| 20 to 24 Year Olds | 424 (73.7%) | 151 (26.3%) |
| 25 to 34 Year Olds | 213 (77.4%) | 62 (22.6%) |
| 35 Years and over | 151 (67.4%) | 73 (32.6%) |
| Total | 4,389 (89.0%) | 542 (11.0%) |
Educational Attainment by Field of Study in Alsip
Business (656 | 22.4%), science & technology (533 | 18.2%), education (318 | 10.9%), social sciences (236 | 8.1%), and psychology (225 | 7.7%) are the most common fields of study among 2,925 individuals in Alsip who have obtained a bachelor's degree or higher.
| Field of Study | # Graduates | % Graduates |
| Computers & Mathematics | 40 | 1.4% |
| Bio, Nature & Agricultural | 142 | 4.9% |
| Physical & Health Sciences | 14 | 0.5% |
| Psychology | 225 | 7.7% |
| Social Sciences | 236 | 8.1% |
| Engineering | 160 | 5.5% |
| Multidisciplinary Studies | 0 | 0.0% |
| Science & Technology | 533 | 18.2% |
| Business | 656 | 22.4% |
| Education | 318 | 10.9% |
| Literature & Languages | 85 | 2.9% |
| Liberal Arts & History | 81 | 2.8% |
| Visual & Performing Arts | 26 | 0.9% |
| Communications | 191 | 6.5% |
| Arts & Humanities | 218 | 7.4% |
| Total | 2,925 | 100.0% |
Transportation & Commute in Alsip
Vehicle Availability by Sex in Alsip
The most prevalent vehicle ownership categories in Alsip are males with 2 vehicles (1,955, accounting for 42.4%) and females with 2 vehicles (1,721, making up 44.5%).
| Vehicles Available | Male | Female |
| No Vehicle | 95 (2.1%) | 83 (1.9%) |
| 1 Vehicle | 853 (18.5%) | 1,345 (30.6%) |
| 2 Vehicles | 1,955 (42.4%) | 1,721 (39.1%) |
| 3 Vehicles | 937 (20.3%) | 659 (15.0%) |
| 4 Vehicles | 733 (15.9%) | 576 (13.1%) |
| 5 or more Vehicles | 34 (0.7%) | 14 (0.3%) |
| Total | 4,607 (100.0%) | 4,398 (100.0%) |
Commute Time in Alsip
The most frequently occuring commute durations in Alsip are 30 to 34 minutes (1,599 commuters, 18.7%), 45 to 59 minutes (1,173 commuters, 13.7%), and 20 to 24 minutes (992 commuters, 11.6%).
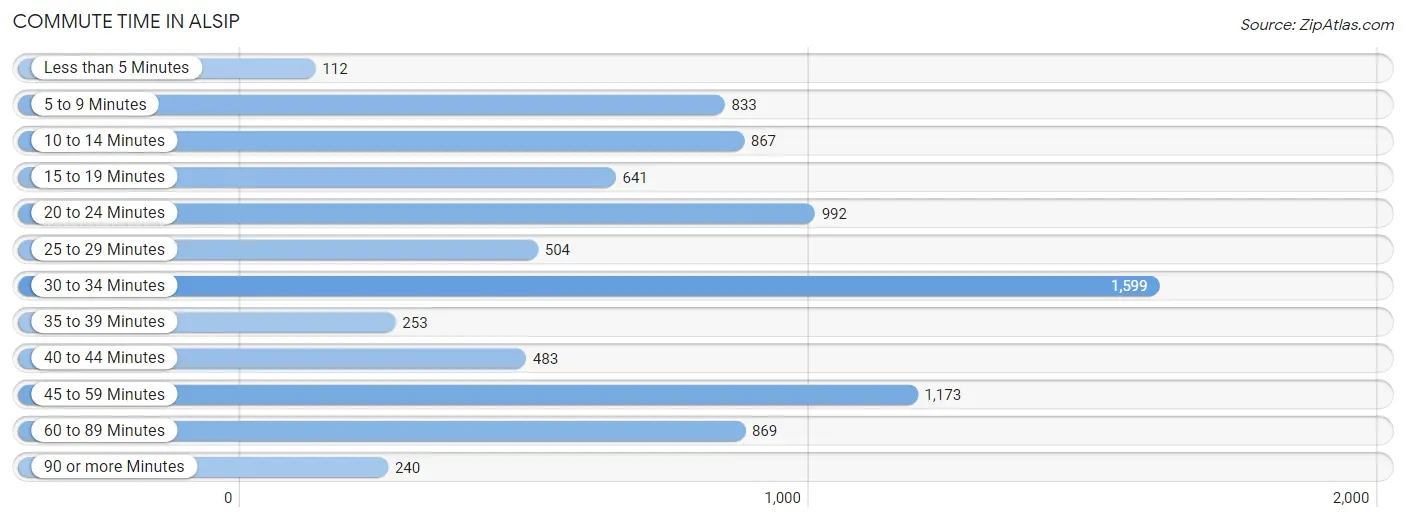
| Commute Time | # Commuters | % Commuters |
| Less than 5 Minutes | 112 | 1.3% |
| 5 to 9 Minutes | 833 | 9.7% |
| 10 to 14 Minutes | 867 | 10.1% |
| 15 to 19 Minutes | 641 | 7.5% |
| 20 to 24 Minutes | 992 | 11.6% |
| 25 to 29 Minutes | 504 | 5.9% |
| 30 to 34 Minutes | 1,599 | 18.7% |
| 35 to 39 Minutes | 253 | 2.9% |
| 40 to 44 Minutes | 483 | 5.6% |
| 45 to 59 Minutes | 1,173 | 13.7% |
| 60 to 89 Minutes | 869 | 10.1% |
| 90 or more Minutes | 240 | 2.8% |
Commute Time by Sex in Alsip
The most common commute times in Alsip are 45 to 59 minutes (839 commuters, 19.2%) for males and 30 to 34 minutes (766 commuters, 18.3%) for females.
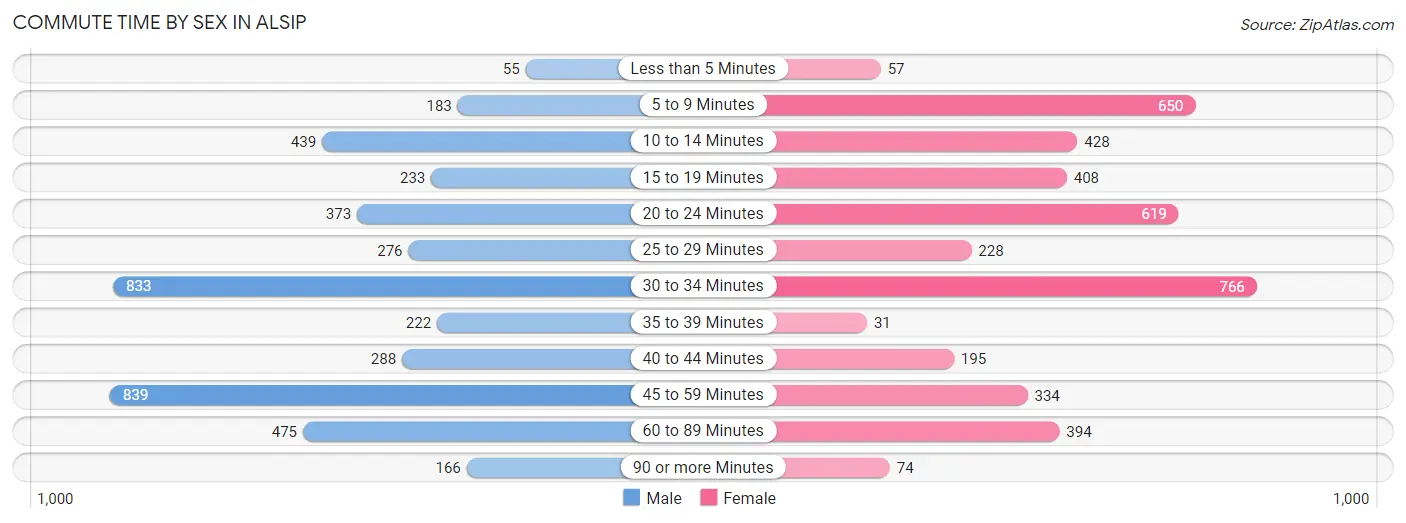
| Commute Time | Male | Female |
| Less than 5 Minutes | 55 (1.3%) | 57 (1.4%) |
| 5 to 9 Minutes | 183 (4.2%) | 650 (15.5%) |
| 10 to 14 Minutes | 439 (10.0%) | 428 (10.2%) |
| 15 to 19 Minutes | 233 (5.3%) | 408 (9.8%) |
| 20 to 24 Minutes | 373 (8.5%) | 619 (14.8%) |
| 25 to 29 Minutes | 276 (6.3%) | 228 (5.4%) |
| 30 to 34 Minutes | 833 (19.0%) | 766 (18.3%) |
| 35 to 39 Minutes | 222 (5.1%) | 31 (0.7%) |
| 40 to 44 Minutes | 288 (6.6%) | 195 (4.7%) |
| 45 to 59 Minutes | 839 (19.2%) | 334 (8.0%) |
| 60 to 89 Minutes | 475 (10.8%) | 394 (9.4%) |
| 90 or more Minutes | 166 (3.8%) | 74 (1.8%) |
Time of Departure to Work by Sex in Alsip
The most frequent times of departure to work in Alsip are 6:00 AM to 6:29 AM (610, 13.9%) for males and 8:00 AM to 8:29 AM (777, 18.6%) for females.
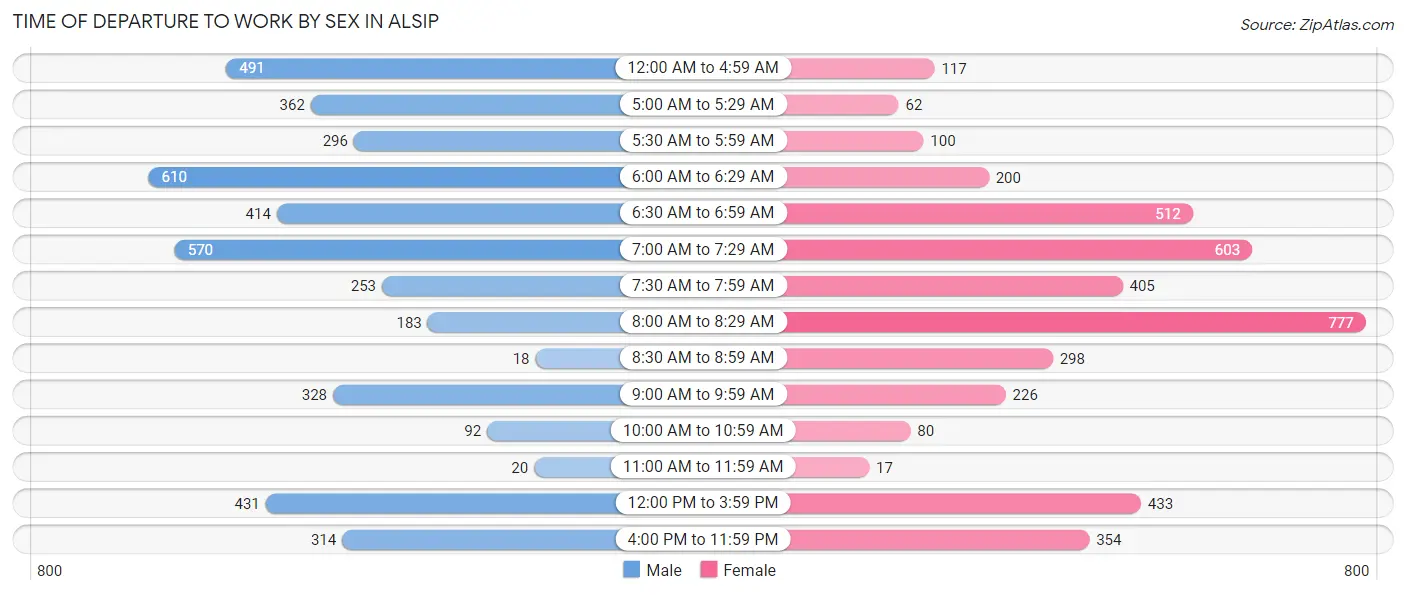
| Time of Departure | Male | Female |
| 12:00 AM to 4:59 AM | 491 (11.2%) | 117 (2.8%) |
| 5:00 AM to 5:29 AM | 362 (8.3%) | 62 (1.5%) |
| 5:30 AM to 5:59 AM | 296 (6.8%) | 100 (2.4%) |
| 6:00 AM to 6:29 AM | 610 (13.9%) | 200 (4.8%) |
| 6:30 AM to 6:59 AM | 414 (9.5%) | 512 (12.2%) |
| 7:00 AM to 7:29 AM | 570 (13.0%) | 603 (14.4%) |
| 7:30 AM to 7:59 AM | 253 (5.8%) | 405 (9.7%) |
| 8:00 AM to 8:29 AM | 183 (4.2%) | 777 (18.6%) |
| 8:30 AM to 8:59 AM | 18 (0.4%) | 298 (7.1%) |
| 9:00 AM to 9:59 AM | 328 (7.5%) | 226 (5.4%) |
| 10:00 AM to 10:59 AM | 92 (2.1%) | 80 (1.9%) |
| 11:00 AM to 11:59 AM | 20 (0.5%) | 17 (0.4%) |
| 12:00 PM to 3:59 PM | 431 (9.8%) | 433 (10.3%) |
| 4:00 PM to 11:59 PM | 314 (7.2%) | 354 (8.5%) |
| Total | 4,382 (100.0%) | 4,184 (100.0%) |
Housing Occupancy in Alsip
Occupancy by Ownership in Alsip
Of the total 7,683 dwellings in Alsip, owner-occupied units account for 4,864 (63.3%), while renter-occupied units make up 2,819 (36.7%).
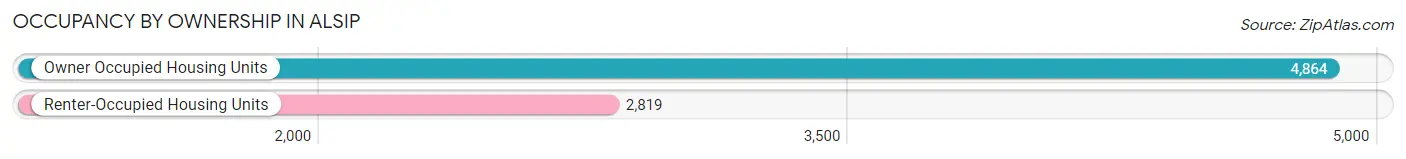
| Occupancy | # Housing Units | % Housing Units |
| Owner Occupied Housing Units | 4,864 | 63.3% |
| Renter-Occupied Housing Units | 2,819 | 36.7% |
| Total Occupied Housing Units | 7,683 | 100.0% |
Occupancy by Household Size in Alsip
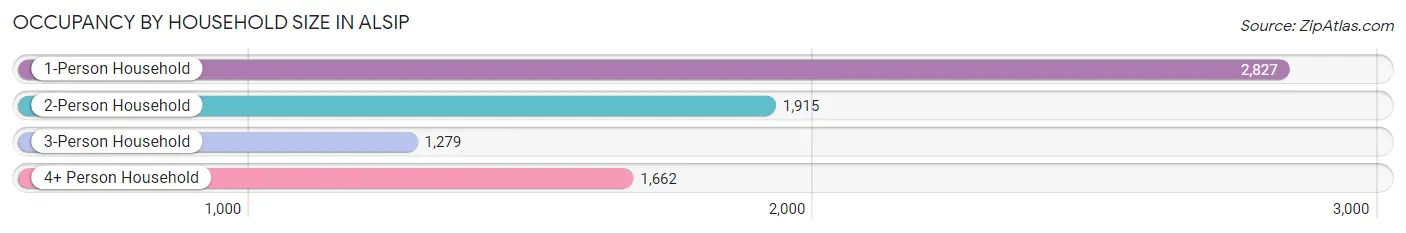
| Household Size | # Housing Units | % Housing Units |
| 1-Person Household | 2,827 | 36.8% |
| 2-Person Household | 1,915 | 24.9% |
| 3-Person Household | 1,279 | 16.7% |
| 4+ Person Household | 1,662 | 21.6% |
| Total Housing Units | 7,683 | 100.0% |
Occupancy by Ownership by Household Size in Alsip
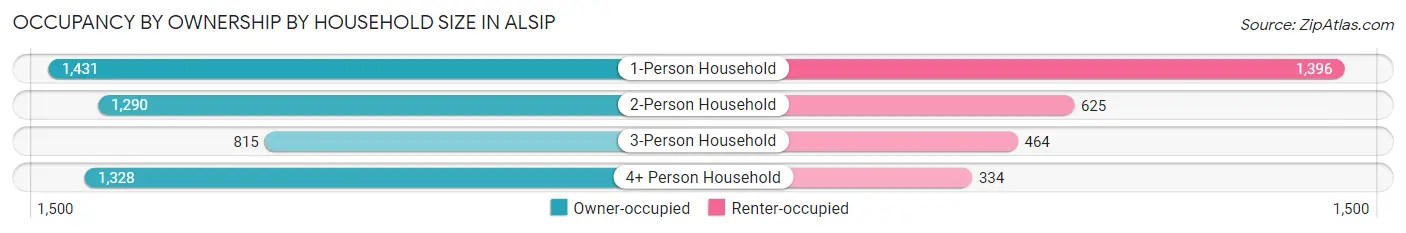
| Household Size | Owner-occupied | Renter-occupied |
| 1-Person Household | 1,431 (50.6%) | 1,396 (49.4%) |
| 2-Person Household | 1,290 (67.4%) | 625 (32.6%) |
| 3-Person Household | 815 (63.7%) | 464 (36.3%) |
| 4+ Person Household | 1,328 (79.9%) | 334 (20.1%) |
| Total Housing Units | 4,864 (63.3%) | 2,819 (36.7%) |
Occupancy by Educational Attainment in Alsip
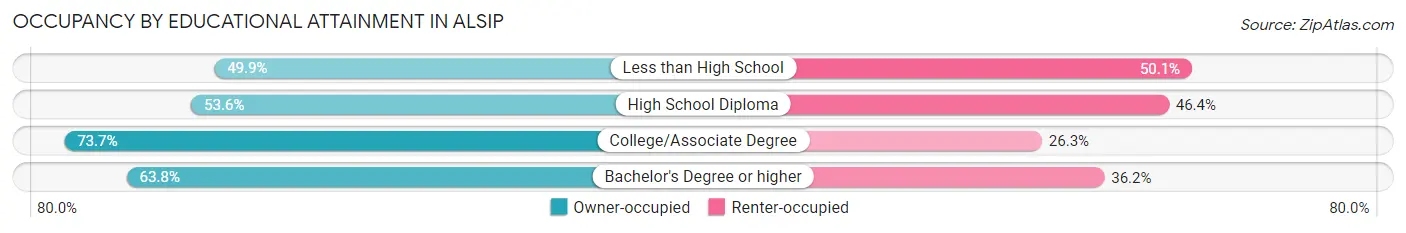
| Household Size | Owner-occupied | Renter-occupied |
| Less than High School | 319 (49.9%) | 320 (50.1%) |
| High School Diploma | 1,231 (53.6%) | 1,066 (46.4%) |
| College/Associate Degree | 2,120 (73.7%) | 756 (26.3%) |
| Bachelor's Degree or higher | 1,194 (63.8%) | 677 (36.2%) |
Occupancy by Age of Householder in Alsip
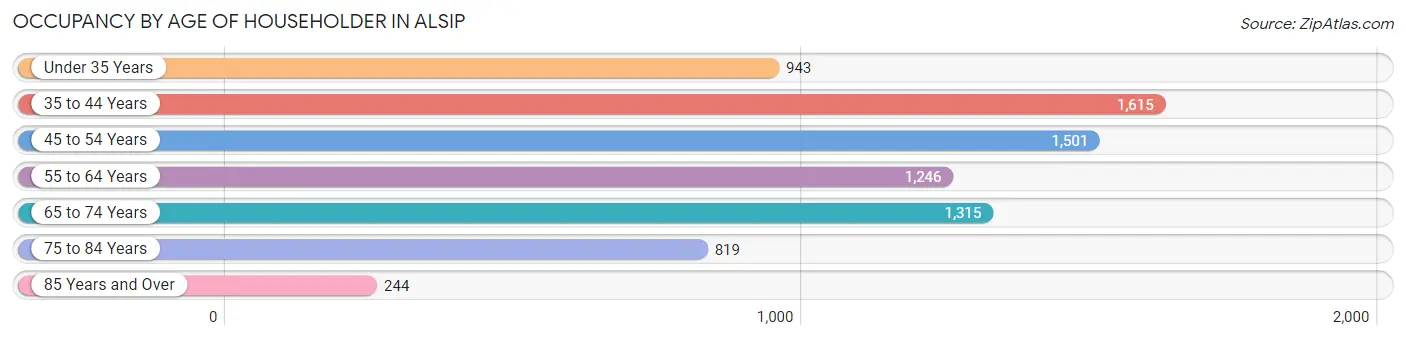
| Age Bracket | # Households | % Households |
| Under 35 Years | 943 | 12.3% |
| 35 to 44 Years | 1,615 | 21.0% |
| 45 to 54 Years | 1,501 | 19.5% |
| 55 to 64 Years | 1,246 | 16.2% |
| 65 to 74 Years | 1,315 | 17.1% |
| 75 to 84 Years | 819 | 10.7% |
| 85 Years and Over | 244 | 3.2% |
| Total | 7,683 | 100.0% |
Housing Finances in Alsip
Median Income by Occupancy in Alsip
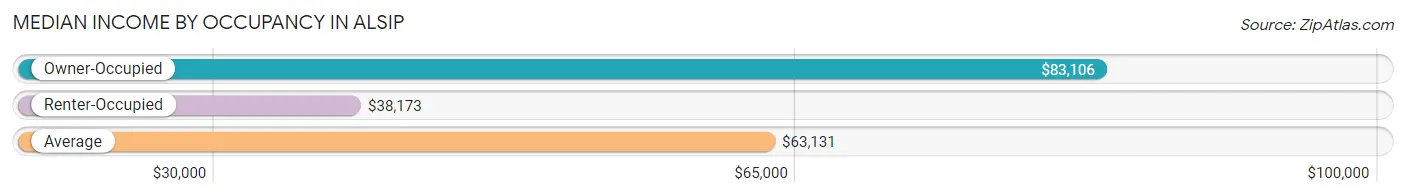
| Occupancy Type | # Households | Median Income |
| Owner-Occupied | 4,864 (63.3%) | $83,106 |
| Renter-Occupied | 2,819 (36.7%) | $38,173 |
| Average | 7,683 (100.0%) | $63,131 |
Occupancy by Householder Income Bracket in Alsip
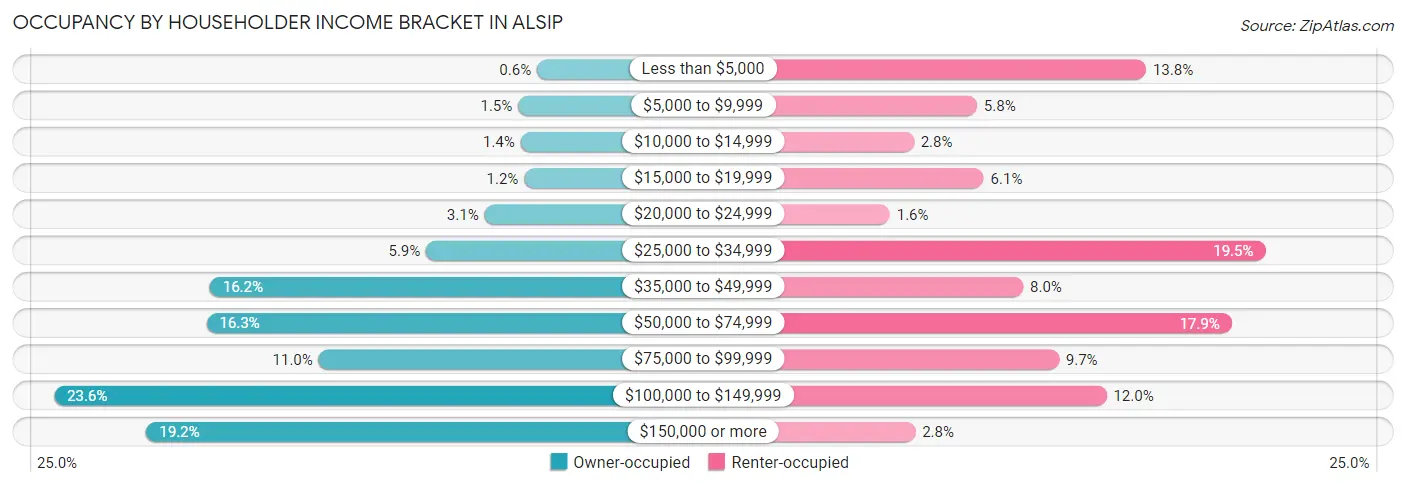
| Income Bracket | Owner-occupied | Renter-occupied |
| Less than $5,000 | 29 (0.6%) | 390 (13.8%) |
| $5,000 to $9,999 | 73 (1.5%) | 163 (5.8%) |
| $10,000 to $14,999 | 67 (1.4%) | 78 (2.8%) |
| $15,000 to $19,999 | 59 (1.2%) | 172 (6.1%) |
| $20,000 to $24,999 | 151 (3.1%) | 46 (1.6%) |
| $25,000 to $34,999 | 286 (5.9%) | 550 (19.5%) |
| $35,000 to $49,999 | 787 (16.2%) | 225 (8.0%) |
| $50,000 to $74,999 | 795 (16.3%) | 505 (17.9%) |
| $75,000 to $99,999 | 535 (11.0%) | 273 (9.7%) |
| $100,000 to $149,999 | 1,148 (23.6%) | 337 (11.9%) |
| $150,000 or more | 934 (19.2%) | 80 (2.8%) |
| Total | 4,864 (100.0%) | 2,819 (100.0%) |
Monthly Housing Cost Tiers in Alsip
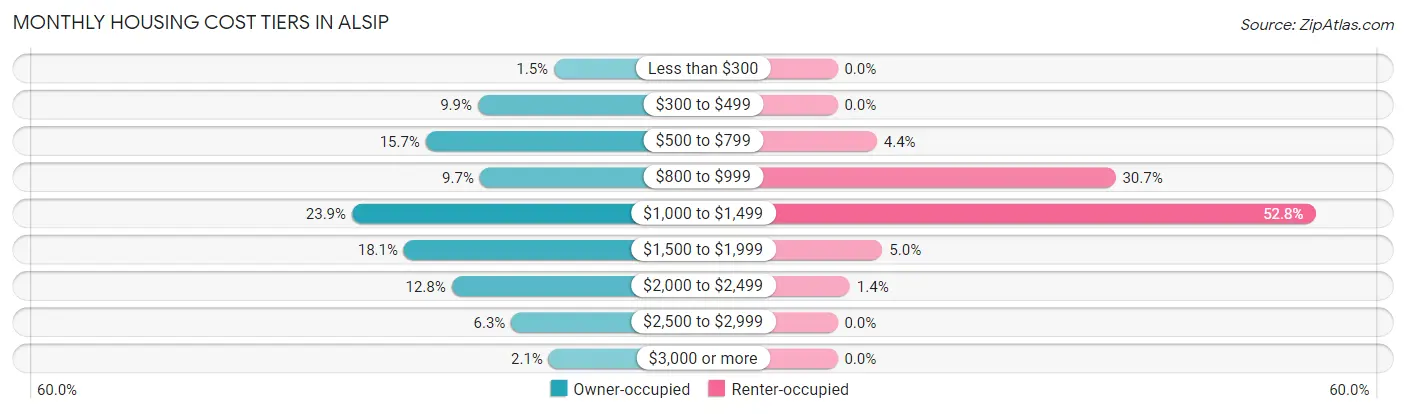
| Monthly Cost | Owner-occupied | Renter-occupied |
| Less than $300 | 74 (1.5%) | 0 (0.0%) |
| $300 to $499 | 483 (9.9%) | 0 (0.0%) |
| $500 to $799 | 763 (15.7%) | 123 (4.4%) |
| $800 to $999 | 473 (9.7%) | 866 (30.7%) |
| $1,000 to $1,499 | 1,160 (23.8%) | 1,488 (52.8%) |
| $1,500 to $1,999 | 881 (18.1%) | 140 (5.0%) |
| $2,000 to $2,499 | 624 (12.8%) | 39 (1.4%) |
| $2,500 to $2,999 | 304 (6.2%) | 0 (0.0%) |
| $3,000 or more | 102 (2.1%) | 0 (0.0%) |
| Total | 4,864 (100.0%) | 2,819 (100.0%) |
Physical Housing Characteristics in Alsip
Housing Structures in Alsip
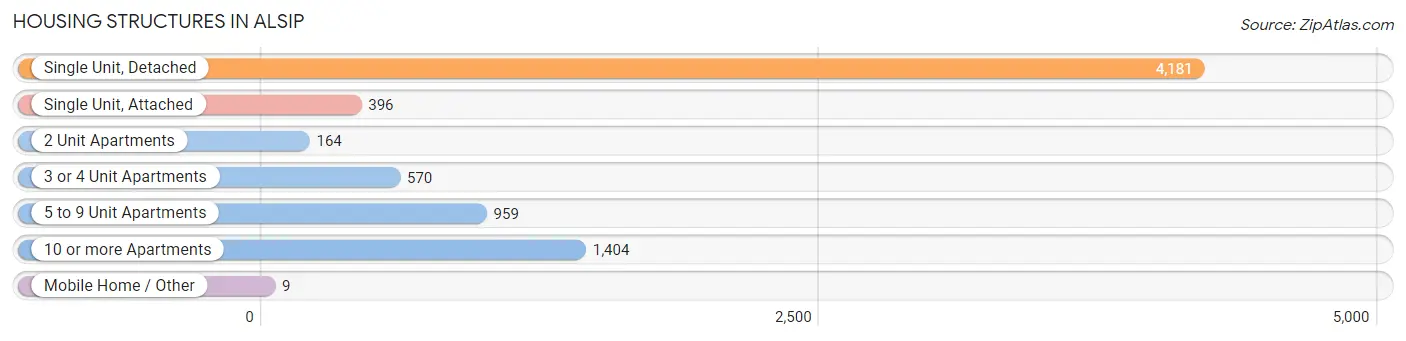
| Structure Type | # Housing Units | % Housing Units |
| Single Unit, Detached | 4,181 | 54.4% |
| Single Unit, Attached | 396 | 5.1% |
| 2 Unit Apartments | 164 | 2.1% |
| 3 or 4 Unit Apartments | 570 | 7.4% |
| 5 to 9 Unit Apartments | 959 | 12.5% |
| 10 or more Apartments | 1,404 | 18.3% |
| Mobile Home / Other | 9 | 0.1% |
| Total | 7,683 | 100.0% |
Housing Structures by Occupancy in Alsip
| Structure Type | Owner-occupied | Renter-occupied |
| Single Unit, Detached | 3,830 (91.6%) | 351 (8.4%) |
| Single Unit, Attached | 368 (92.9%) | 28 (7.1%) |
| 2 Unit Apartments | 44 (26.8%) | 120 (73.2%) |
| 3 or 4 Unit Apartments | 123 (21.6%) | 447 (78.4%) |
| 5 to 9 Unit Apartments | 355 (37.0%) | 604 (63.0%) |
| 10 or more Apartments | 135 (9.6%) | 1,269 (90.4%) |
| Mobile Home / Other | 9 (100.0%) | 0 (0.0%) |
| Total | 4,864 (63.3%) | 2,819 (36.7%) |
Housing Structures by Number of Rooms in Alsip
| Number of Rooms | Owner-occupied | Renter-occupied |
| 1 Room | 0 (0.0%) | 45 (1.6%) |
| 2 or 3 Rooms | 160 (3.3%) | 498 (17.7%) |
| 4 or 5 Rooms | 1,215 (25.0%) | 1,848 (65.6%) |
| 6 or 7 Rooms | 2,511 (51.6%) | 261 (9.3%) |
| 8 or more Rooms | 978 (20.1%) | 167 (5.9%) |
| Total | 4,864 (100.0%) | 2,819 (100.0%) |
Housing Structure by Heating Type in Alsip
| Heating Type | Owner-occupied | Renter-occupied |
| Utility Gas | 4,586 (94.3%) | 1,515 (53.7%) |
| Bottled, Tank, or LP Gas | 29 (0.6%) | 42 (1.5%) |
| Electricity | 249 (5.1%) | 1,060 (37.6%) |
| Fuel Oil or Kerosene | 0 (0.0%) | 0 (0.0%) |
| Coal or Coke | 0 (0.0%) | 0 (0.0%) |
| All other Fuels | 0 (0.0%) | 109 (3.9%) |
| No Fuel Used | 0 (0.0%) | 93 (3.3%) |
| Total | 4,864 (100.0%) | 2,819 (100.0%) |
Household Vehicle Usage in Alsip
| Vehicles per Household | Owner-occupied | Renter-occupied |
| No Vehicle | 78 (1.6%) | 379 (13.4%) |
| 1 Vehicle | 1,520 (31.2%) | 1,865 (66.2%) |
| 2 Vehicles | 2,035 (41.8%) | 491 (17.4%) |
| 3 or more Vehicles | 1,231 (25.3%) | 84 (3.0%) |
| Total | 4,864 (100.0%) | 2,819 (100.0%) |
Real Estate & Mortgages in Alsip
Real Estate and Mortgage Overview in Alsip
| Characteristic | Without Mortgage | With Mortgage |
| Housing Units | 1,727 | 3,137 |
| Median Property Value | $193,200 | $200,600 |
| Median Household Income | $56,078 | $684 |
| Monthly Housing Costs | $718 | $102 |
| Real Estate Taxes | $4,514 | $111 |
Property Value by Mortgage Status in Alsip
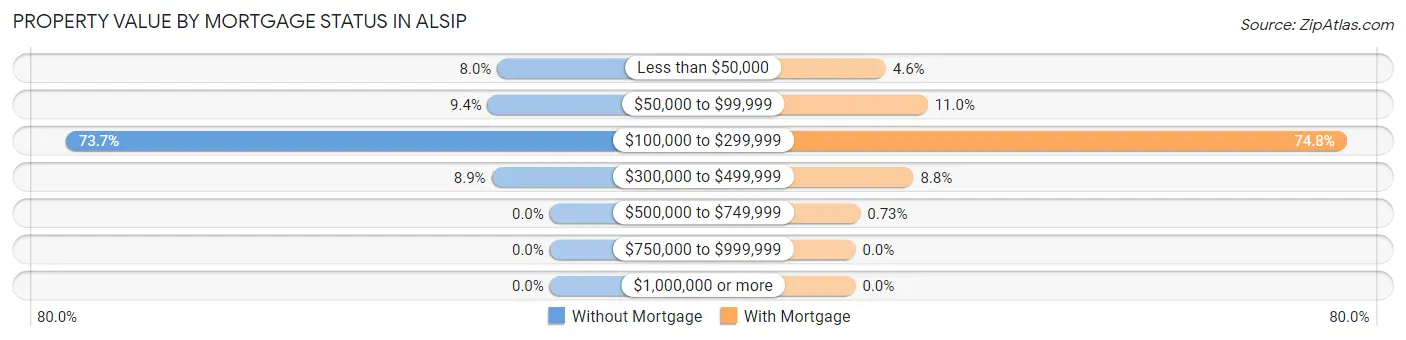
| Property Value | Without Mortgage | With Mortgage |
| Less than $50,000 | 138 (8.0%) | 145 (4.6%) |
| $50,000 to $99,999 | 163 (9.4%) | 345 (11.0%) |
| $100,000 to $299,999 | 1,273 (73.7%) | 2,347 (74.8%) |
| $300,000 to $499,999 | 153 (8.9%) | 277 (8.8%) |
| $500,000 to $749,999 | 0 (0.0%) | 23 (0.7%) |
| $750,000 to $999,999 | 0 (0.0%) | 0 (0.0%) |
| $1,000,000 or more | 0 (0.0%) | 0 (0.0%) |
| Total | 1,727 (100.0%) | 3,137 (100.0%) |
Household Income by Mortgage Status in Alsip
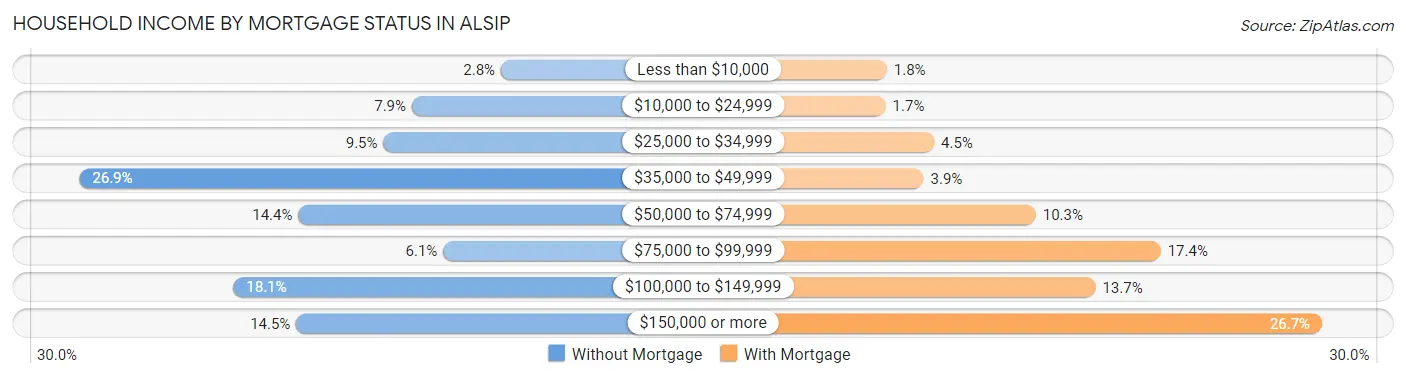
| Household Income | Without Mortgage | With Mortgage |
| Less than $10,000 | 48 (2.8%) | 56 (1.8%) |
| $10,000 to $24,999 | 136 (7.9%) | 54 (1.7%) |
| $25,000 to $34,999 | 164 (9.5%) | 141 (4.5%) |
| $35,000 to $49,999 | 464 (26.9%) | 122 (3.9%) |
| $50,000 to $74,999 | 248 (14.4%) | 323 (10.3%) |
| $75,000 to $99,999 | 105 (6.1%) | 547 (17.4%) |
| $100,000 to $149,999 | 312 (18.1%) | 430 (13.7%) |
| $150,000 or more | 250 (14.5%) | 836 (26.7%) |
| Total | 1,727 (100.0%) | 3,137 (100.0%) |
Property Value to Household Income Ratio in Alsip
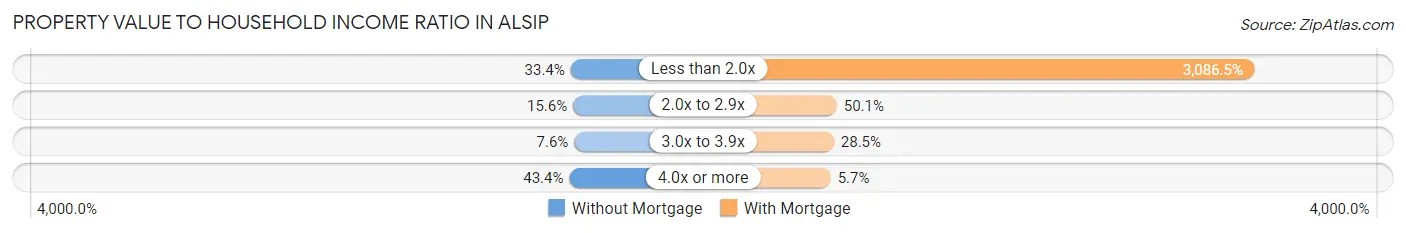
| Value-to-Income Ratio | Without Mortgage | With Mortgage |
| Less than 2.0x | 577 (33.4%) | 96,823 (3,086.5%) |
| 2.0x to 2.9x | 270 (15.6%) | 1,571 (50.1%) |
| 3.0x to 3.9x | 131 (7.6%) | 895 (28.5%) |
| 4.0x or more | 749 (43.4%) | 179 (5.7%) |
| Total | 1,727 (100.0%) | 3,137 (100.0%) |
Real Estate Taxes by Mortgage Status in Alsip
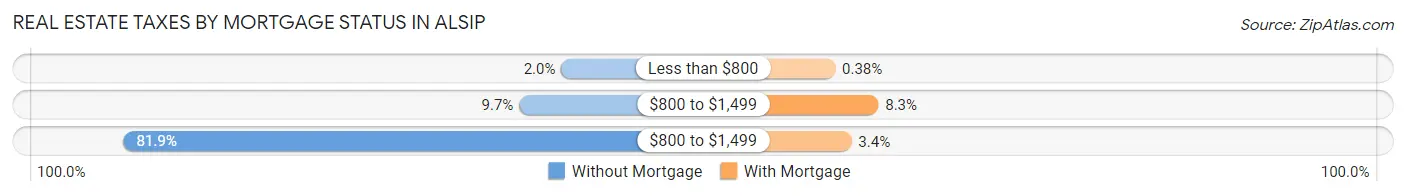
| Property Taxes | Without Mortgage | With Mortgage |
| Less than $800 | 34 (2.0%) | 12 (0.4%) |
| $800 to $1,499 | 167 (9.7%) | 259 (8.3%) |
| $800 to $1,499 | 1,415 (81.9%) | 105 (3.4%) |
| Total | 1,727 (100.0%) | 3,137 (100.0%) |
Health & Disability in Alsip
Health Insurance Coverage by Age in Alsip
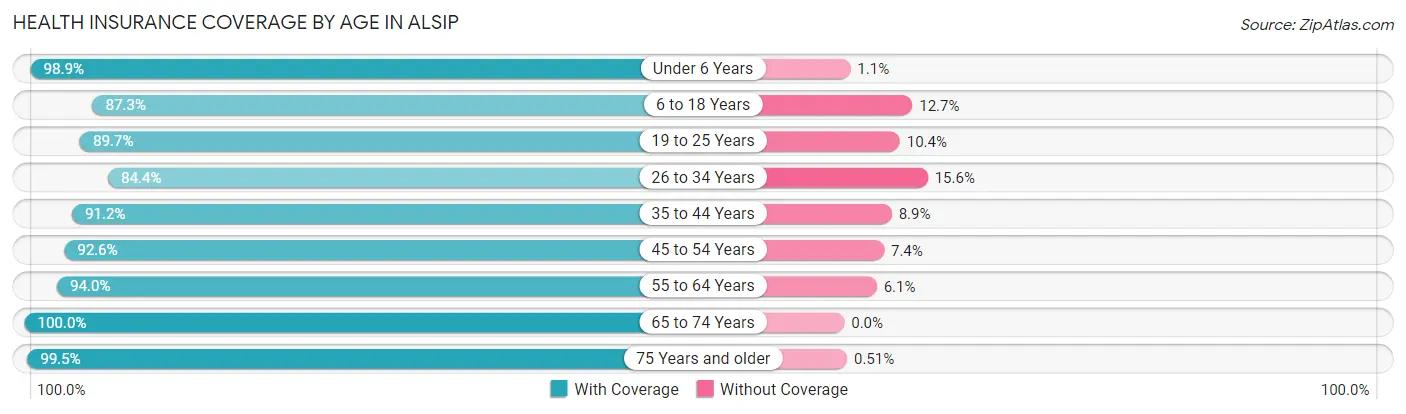
| Age Bracket | With Coverage | Without Coverage |
| Under 6 Years | 1,390 (98.9%) | 16 (1.1%) |
| 6 to 18 Years | 2,906 (87.3%) | 422 (12.7%) |
| 19 to 25 Years | 1,334 (89.6%) | 154 (10.3%) |
| 26 to 34 Years | 1,438 (84.4%) | 265 (15.6%) |
| 35 to 44 Years | 2,585 (91.1%) | 251 (8.8%) |
| 45 to 54 Years | 2,288 (92.6%) | 183 (7.4%) |
| 55 to 64 Years | 2,111 (94.0%) | 136 (6.0%) |
| 65 to 74 Years | 1,812 (100.0%) | 0 (0.0%) |
| 75 Years and older | 1,553 (99.5%) | 8 (0.5%) |
| Total | 17,417 (92.4%) | 1,435 (7.6%) |
Health Insurance Coverage by Citizenship Status in Alsip
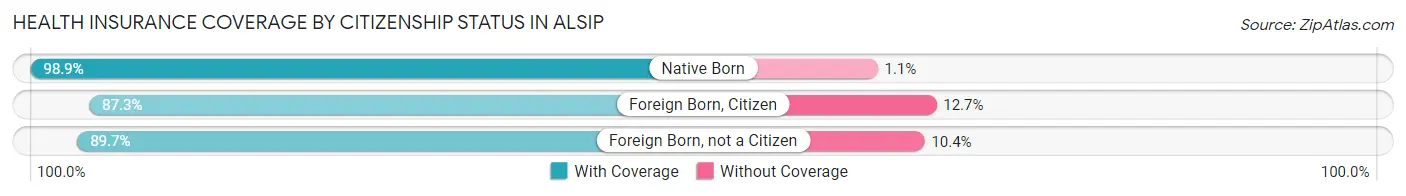
| Citizenship Status | With Coverage | Without Coverage |
| Native Born | 1,390 (98.9%) | 16 (1.1%) |
| Foreign Born, Citizen | 2,906 (87.3%) | 422 (12.7%) |
| Foreign Born, not a Citizen | 1,334 (89.6%) | 154 (10.3%) |
Health Insurance Coverage by Household Income in Alsip
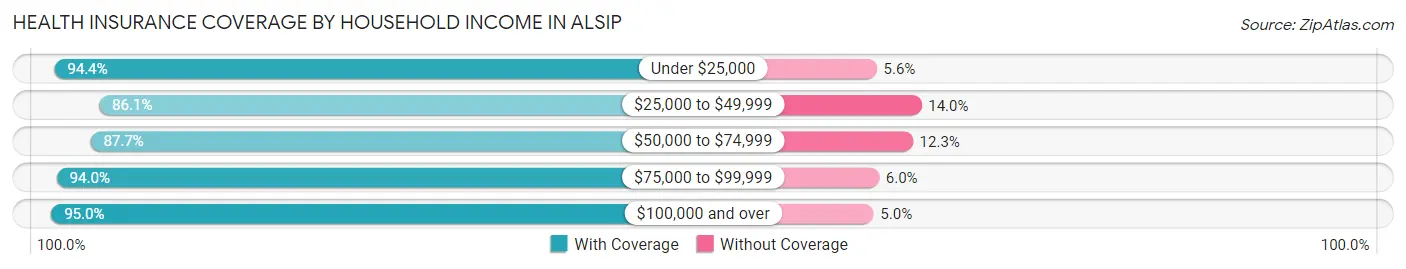
| Household Income | With Coverage | Without Coverage |
| Under $25,000 | 2,030 (94.4%) | 120 (5.6%) |
| $25,000 to $49,999 | 2,382 (86.1%) | 386 (14.0%) |
| $50,000 to $74,999 | 2,522 (87.7%) | 355 (12.3%) |
| $75,000 to $99,999 | 2,175 (94.0%) | 139 (6.0%) |
| $100,000 and over | 8,287 (95.0%) | 435 (5.0%) |
Public vs Private Health Insurance Coverage by Age in Alsip
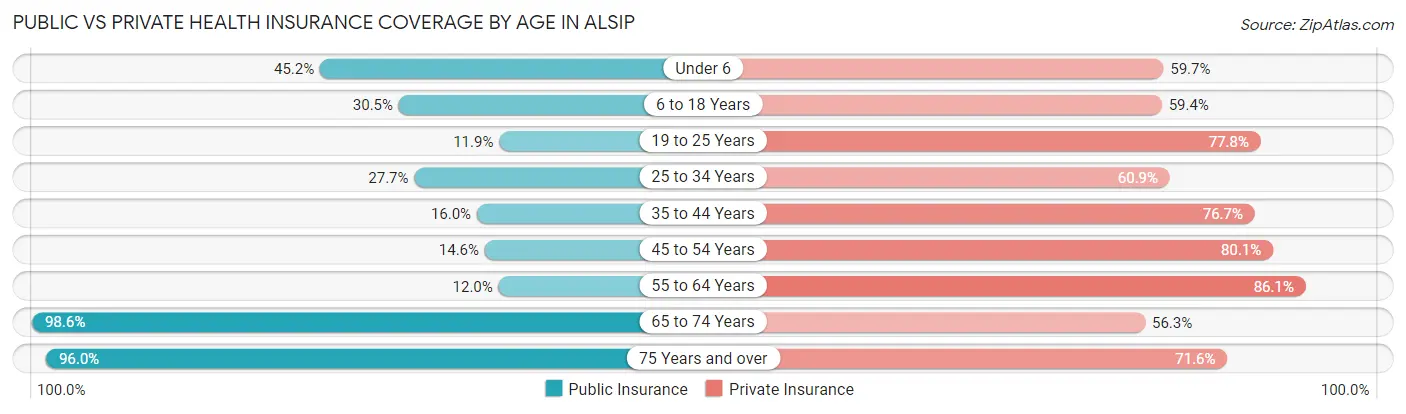
| Age Bracket | Public Insurance | Private Insurance |
| Under 6 | 635 (45.2%) | 839 (59.7%) |
| 6 to 18 Years | 1,016 (30.5%) | 1,976 (59.4%) |
| 19 to 25 Years | 177 (11.9%) | 1,157 (77.8%) |
| 25 to 34 Years | 471 (27.7%) | 1,037 (60.9%) |
| 35 to 44 Years | 455 (16.0%) | 2,174 (76.7%) |
| 45 to 54 Years | 360 (14.6%) | 1,978 (80.0%) |
| 55 to 64 Years | 270 (12.0%) | 1,935 (86.1%) |
| 65 to 74 Years | 1,787 (98.6%) | 1,020 (56.3%) |
| 75 Years and over | 1,499 (96.0%) | 1,117 (71.6%) |
| Total | 6,670 (35.4%) | 13,233 (70.2%) |
Disability Status by Sex by Age in Alsip
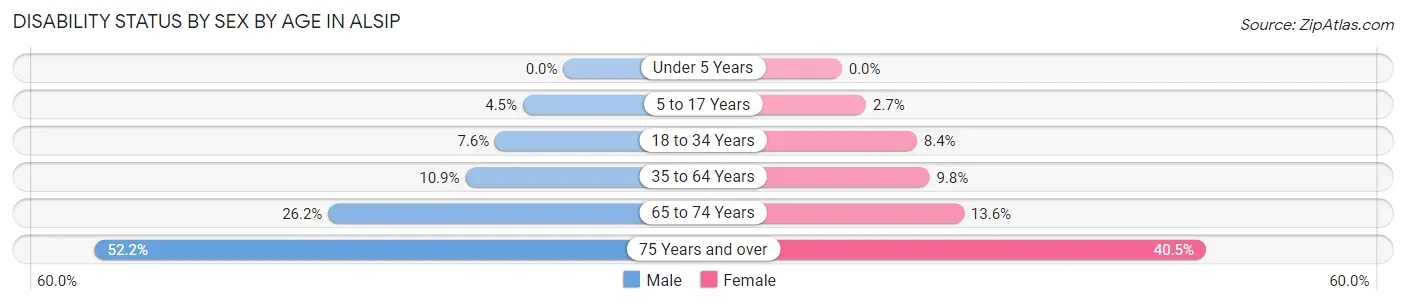
| Age Bracket | Male | Female |
| Under 5 Years | 0 (0.0%) | 0 (0.0%) |
| 5 to 17 Years | 84 (4.5%) | 41 (2.7%) |
| 18 to 34 Years | 142 (7.6%) | 135 (8.4%) |
| 35 to 64 Years | 398 (10.9%) | 382 (9.8%) |
| 65 to 74 Years | 176 (26.2%) | 155 (13.6%) |
| 75 Years and over | 332 (52.2%) | 375 (40.5%) |
Disability Class by Sex by Age in Alsip
Disability Class: Hearing Difficulty
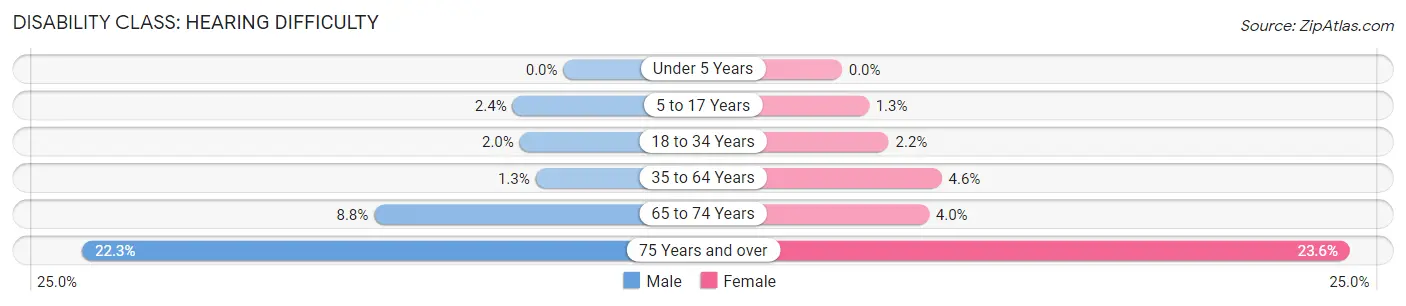
| Age Bracket | Male | Female |
| Under 5 Years | 0 (0.0%) | 0 (0.0%) |
| 5 to 17 Years | 44 (2.4%) | 19 (1.3%) |
| 18 to 34 Years | 38 (2.0%) | 35 (2.2%) |
| 35 to 64 Years | 47 (1.3%) | 181 (4.6%) |
| 65 to 74 Years | 59 (8.8%) | 46 (4.0%) |
| 75 Years and over | 142 (22.3%) | 218 (23.6%) |
Disability Class: Vision Difficulty
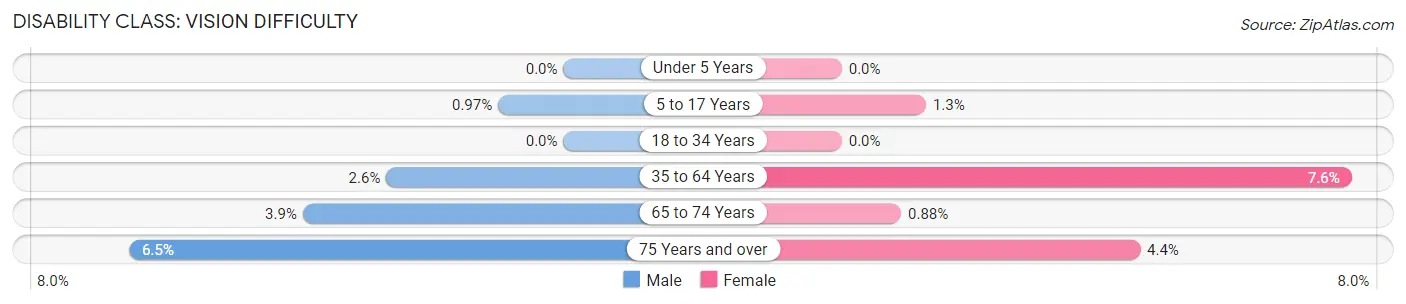
| Age Bracket | Male | Female |
| Under 5 Years | 0 (0.0%) | 0 (0.0%) |
| 5 to 17 Years | 18 (1.0%) | 19 (1.3%) |
| 18 to 34 Years | 0 (0.0%) | 0 (0.0%) |
| 35 to 64 Years | 96 (2.6%) | 296 (7.6%) |
| 65 to 74 Years | 26 (3.9%) | 10 (0.9%) |
| 75 Years and over | 41 (6.5%) | 41 (4.4%) |
Disability Class: Cognitive Difficulty
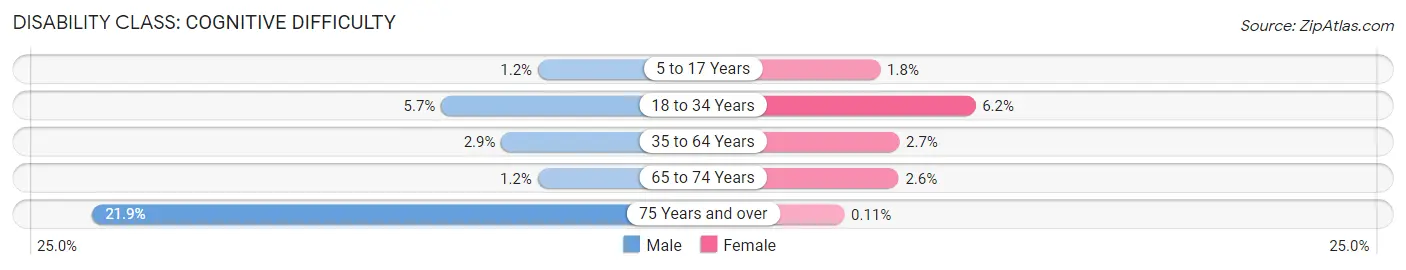
| Age Bracket | Male | Female |
| 5 to 17 Years | 22 (1.2%) | 27 (1.8%) |
| 18 to 34 Years | 106 (5.7%) | 100 (6.2%) |
| 35 to 64 Years | 105 (2.9%) | 104 (2.7%) |
| 65 to 74 Years | 8 (1.2%) | 30 (2.6%) |
| 75 Years and over | 139 (21.9%) | 1 (0.1%) |
Disability Class: Ambulatory Difficulty
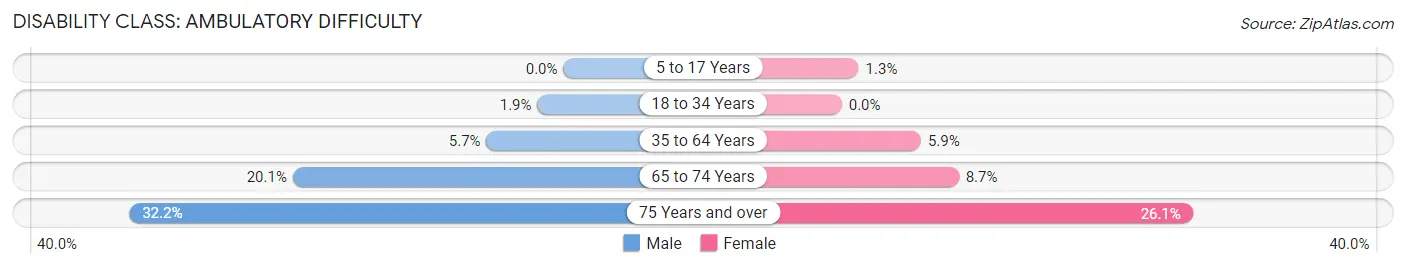
| Age Bracket | Male | Female |
| 5 to 17 Years | 0 (0.0%) | 19 (1.3%) |
| 18 to 34 Years | 36 (1.9%) | 0 (0.0%) |
| 35 to 64 Years | 208 (5.7%) | 230 (5.9%) |
| 65 to 74 Years | 135 (20.1%) | 99 (8.7%) |
| 75 Years and over | 205 (32.2%) | 241 (26.1%) |
Disability Class: Self-Care Difficulty
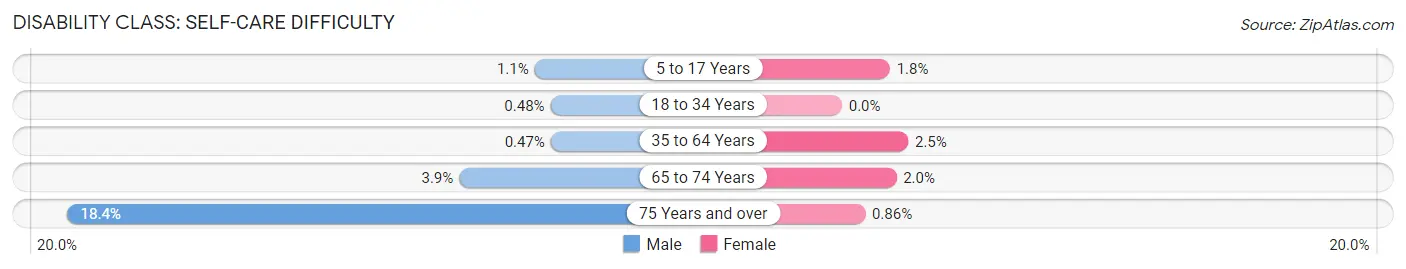
| Age Bracket | Male | Female |
| 5 to 17 Years | 20 (1.1%) | 27 (1.8%) |
| 18 to 34 Years | 9 (0.5%) | 0 (0.0%) |
| 35 to 64 Years | 17 (0.5%) | 96 (2.5%) |
| 65 to 74 Years | 26 (3.9%) | 23 (2.0%) |
| 75 Years and over | 117 (18.4%) | 8 (0.9%) |
Technology Access in Alsip
Computing Device Access in Alsip
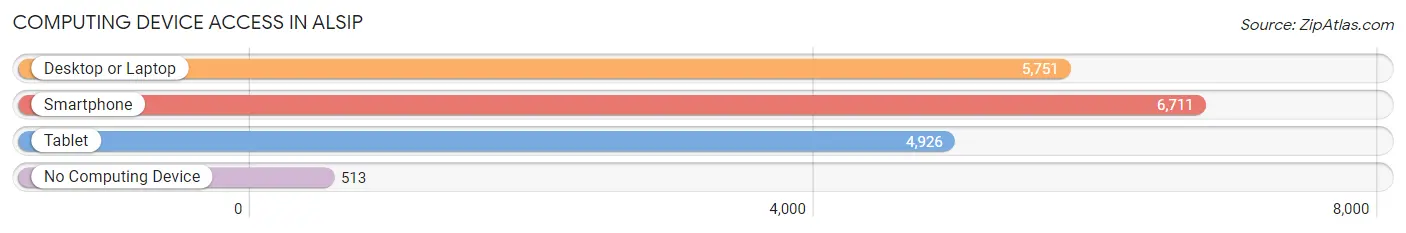
| Device Type | # Households | % Households |
| Desktop or Laptop | 5,751 | 74.9% |
| Smartphone | 6,711 | 87.4% |
| Tablet | 4,926 | 64.1% |
| No Computing Device | 513 | 6.7% |
| Total | 7,683 | 100.0% |
Internet Access in Alsip
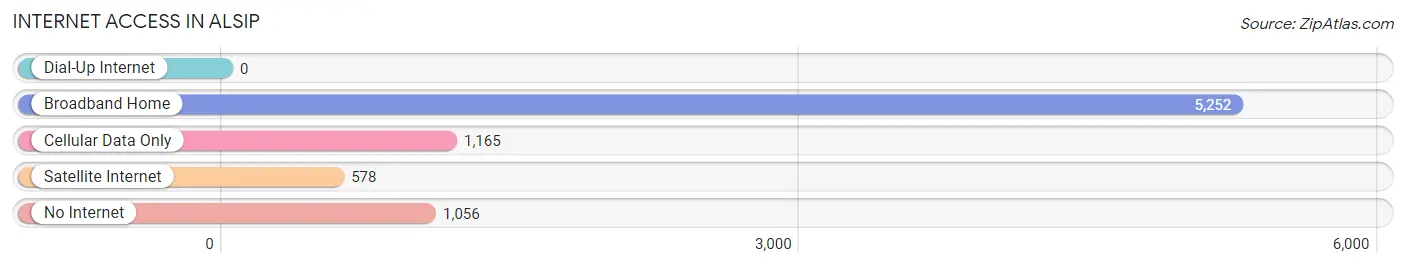
| Internet Type | # Households | % Households |
| Dial-Up Internet | 0 | 0.0% |
| Broadband Home | 5,252 | 68.4% |
| Cellular Data Only | 1,165 | 15.2% |
| Satellite Internet | 578 | 7.5% |
| No Internet | 1,056 | 13.7% |
| Total | 7,683 | 100.0% |
Alsip Summary
Alsip is a village located in Cook County, Illinois, United States. It is a suburb of Chicago, located approximately 13 miles southwest of the city's downtown. As of the 2010 census, the village had a population of 19,277.
History
The area that is now Alsip was first settled in the 1830s by German and Dutch immigrants. The village was originally known as "Vickery's Grove" after the first settler, William Vickery. In 1883, the village was renamed Alsip after Frank Alsip, a local businessman who owned a brickyard and a coal mine.
In the early 1900s, Alsip was a rural farming community. The village was incorporated in 1927 and experienced rapid growth in the 1950s and 1960s. During this time, many new businesses and industries were established in the area, including a steel mill, a chemical plant, and a paper mill.
Geography
Alsip is located in northeastern Illinois, approximately 13 miles southwest of downtown Chicago. It is bordered by the villages of Oak Lawn to the north, Merrionette Park to the east, and Crestwood to the south. The village is situated on the Calumet Sag Channel, a tributary of the Calumet River.
The village has a total area of 5.2 square miles, all of which is land. The terrain is generally flat, with some low hills in the northern part of the village.
Economy
Alsip is a primarily residential community, with a small commercial district located along Cicero Avenue. The village is home to several large industrial and manufacturing companies, including a steel mill, a chemical plant, and a paper mill.
The village is also home to several retail stores, including a Walmart Supercenter, a Target, and a Home Depot. Alsip is also home to a number of restaurants, including several fast food chains and a few local establishments.
Demographics
As of the 2010 census, there were 19,277 people, 7,717 households, and 5,072 families residing in the village. The population density was 3,717.3 people per square mile. The racial makeup of the village was 79.2% White, 11.3% African American, 0.3% Native American, 1.7% Asian, 0.1% Pacific Islander, 5.2% from other races, and 2.4% from two or more races. Hispanic or Latino of any race were 11.7% of the population.
The median income for a household in the village was $50,945, and the median income for a family was $60,945. The per capita income for the village was $24,945. About 6.2% of families and 8.2% of the population were below the poverty line, including 11.2% of those under age 18 and 5.2% of those age 65 or over.
Common Questions
What is Per Capita Income in Alsip?
Per Capita income in Alsip is $33,200.
What is the Median Family Income in Alsip?
Median Family Income in Alsip is $93,261.
What is the Median Household income in Alsip?
Median Household Income in Alsip is $63,131.
What is Income or Wage Gap in Alsip?
Income or Wage Gap in Alsip is 20.9%.
Women in Alsip earn 79.1 cents for every dollar earned by a man.
What is Inequality or Gini Index in Alsip?
Inequality or Gini Index in Alsip is 0.42.
What is the Total Population of Alsip?
Total Population of Alsip is 18,866.
What is the Total Male Population of Alsip?
Total Male Population of Alsip is 9,276.
What is the Total Female Population of Alsip?
Total Female Population of Alsip is 9,590.
What is the Ratio of Males per 100 Females in Alsip?
There are 96.73 Males per 100 Females in Alsip.
What is the Ratio of Females per 100 Males in Alsip?
There are 103.39 Females per 100 Males in Alsip.
What is the Median Population Age in Alsip?
Median Population Age in Alsip is 39.5 Years.
What is the Average Family Size in Alsip
Average Family Size in Alsip is 3.3 People.
What is the Average Household Size in Alsip
Average Household Size in Alsip is 2.5 People.
How Large is the Labor Force in Alsip?
There are 9,829 People in the Labor Forcein in Alsip.
What is the Percentage of People in the Labor Force in Alsip?
65.5% of People are in the Labor Force in Alsip.
What is the Unemployment Rate in Alsip?
Unemployment Rate in Alsip is 6.7%.