Zip Codes with the Highest Percentage of Hispanic or Latino Population in Springfield, IL
RELATED REPORTS & OPTIONS
Hispanic or Latino
Springfield
Compare Zip Codes
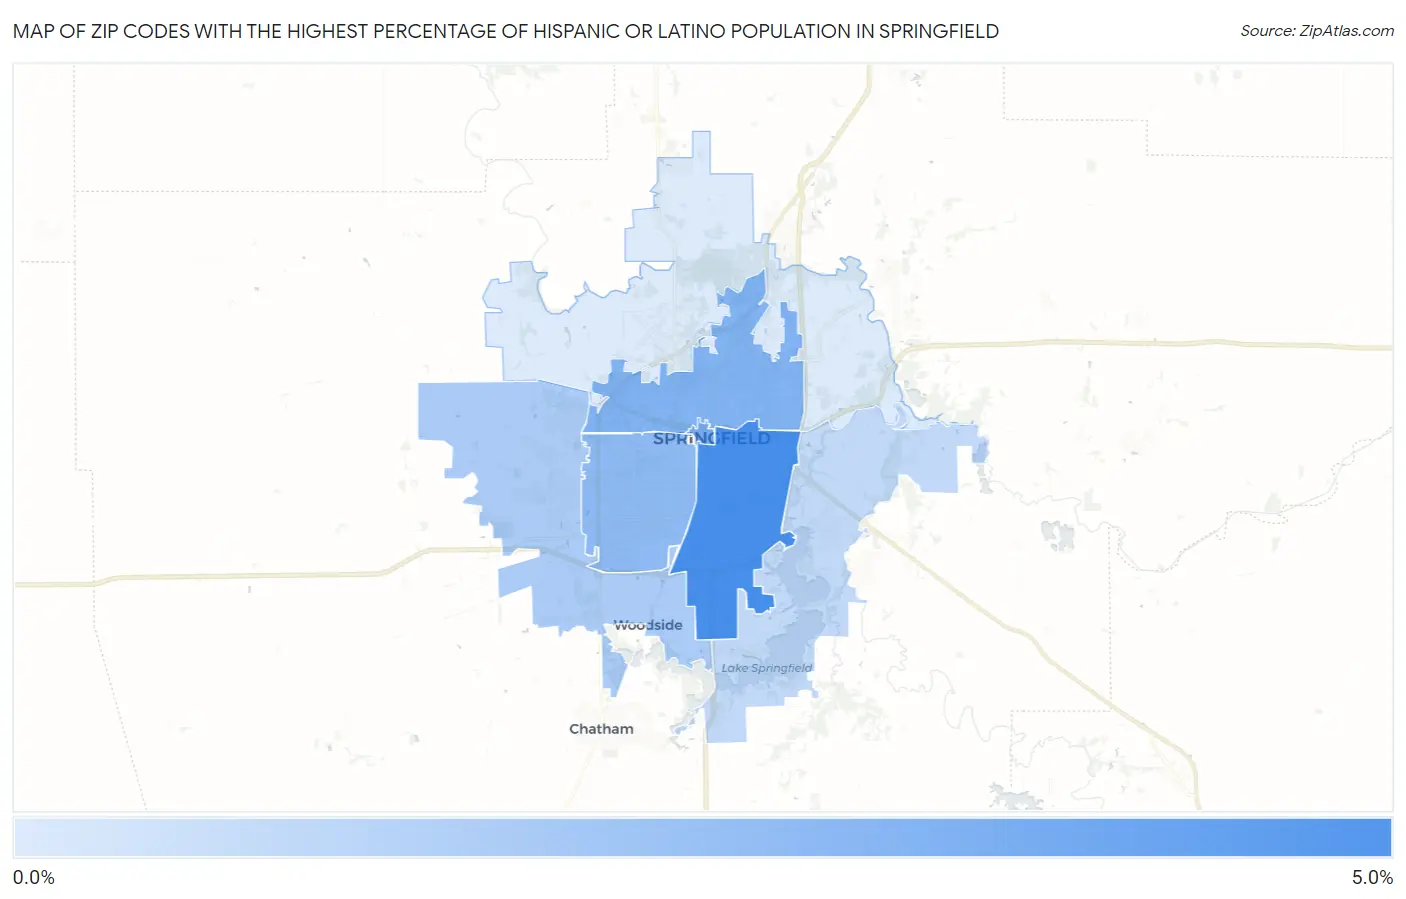
Map of Zip Codes with the Highest Percentage of Hispanic or Latino Population in Springfield
0.38%
4.9%
Zip Codes with the Highest Percentage of Hispanic or Latino Population in Springfield, IL
| Zip Code | Hispanic or Latino | vs State | vs National | |
| 1. | 62703 | 4.9% | 17.8%(-12.9)#512 | 18.7%(-13.7)#14,397 |
| 2. | 62701 | 3.5% | 17.8%(-14.3)#614 | 18.7%(-15.1)#17,099 |
| 3. | 62702 | 3.1% | 17.8%(-14.7)#657 | 18.7%(-15.5)#17,984 |
| 4. | 62704 | 2.7% | 17.8%(-15.1)#719 | 18.7%(-15.9)#19,136 |
| 5. | 62711 | 1.9% | 17.8%(-16.0)#821 | 18.7%(-16.8)#21,390 |
| 6. | 62712 | 1.2% | 17.8%(-16.7)#937 | 18.7%(-17.5)#23,527 |
| 7. | 62707 | 0.38% | 17.8%(-17.5)#1,081 | 18.7%(-18.3)#26,163 |
1
Common Questions
What are the Top 5 Zip Codes with the Highest Percentage of Hispanic or Latino Population in Springfield, IL?
Top 5 Zip Codes with the Highest Percentage of Hispanic or Latino Population in Springfield, IL are:
What zip code has the Highest Percentage of Hispanic or Latino Population in Springfield, IL?
62703 has the Highest Percentage of Hispanic or Latino Population in Springfield, IL with 4.9%.
What is the Percentage of Hispanic or Latino Population in Springfield, IL?
Percentage of Hispanic or Latino Population in Springfield is 3.1%.
What is the Percentage of Hispanic or Latino Population in Illinois?
Percentage of Hispanic or Latino Population in Illinois is 17.8%.
What is the Percentage of Hispanic or Latino Population in the United States?
Percentage of Hispanic or Latino Population in the United States is 18.7%.