Maywood, IL Map & Demographics
Maywood Map
Maywood Overview
$26,418
PER CAPITA INCOME
$76,357
AVG FAMILY INCOME
$64,767
AVG HOUSEHOLD INCOME
4.5%
WAGE / INCOME GAP [ % ]
95.5¢/ $1
WAGE / INCOME GAP [ $ ]
$13,754
FAMILY INCOME DEFICIT
0.43
INEQUALITY / GINI INDEX
23,385
TOTAL POPULATION
11,460
MALE POPULATION
11,925
FEMALE POPULATION
96.10
MALES / 100 FEMALES
104.06
FEMALES / 100 MALES
37.0
MEDIAN AGE
3.9
AVG FAMILY SIZE
3.0
AVG HOUSEHOLD SIZE
10,706
LABOR FORCE [ PEOPLE ]
57.9%
PERCENT IN LABOR FORCE
9.0%
UNEMPLOYMENT RATE
Maywood Zip Codes
Income in Maywood
Income Overview in Maywood
Per Capita Income in Maywood is $26,418, while median incomes of families and households are $76,357 and $64,767 respectively.
| Characteristic | Number | Measure |
| Per Capita Income | 23,385 | $26,418 |
| Median Family Income | 5,054 | $76,357 |
| Mean Family Income | 5,054 | $89,610 |
| Median Household Income | 7,672 | $64,767 |
| Mean Household Income | 7,672 | $77,130 |
| Income Deficit | 5,054 | $13,754 |
| Wage / Income Gap (%) | 23,385 | 4.46% |
| Wage / Income Gap ($) | 23,385 | 95.54¢ per $1 |
| Gini / Inequality Index | 23,385 | 0.43 |
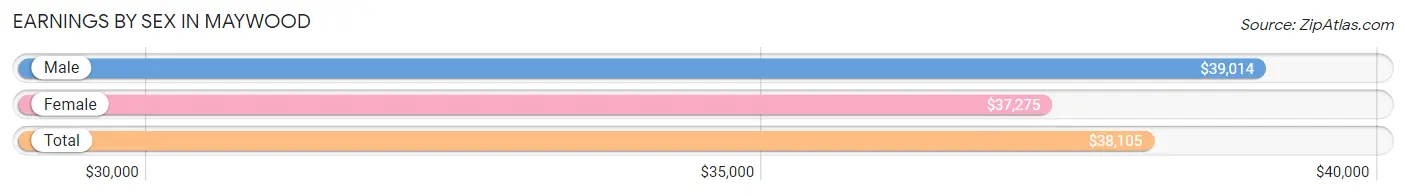
Earnings by Sex in Maywood
Average Earnings in Maywood are $38,105, $39,014 for men and $37,275 for women, a difference of 4.5%.
| Sex | Number | Average Earnings |
| Male | 5,375 (49.6%) | $39,014 |
| Female | 5,465 (50.4%) | $37,275 |
| Total | 10,840 (100.0%) | $38,105 |
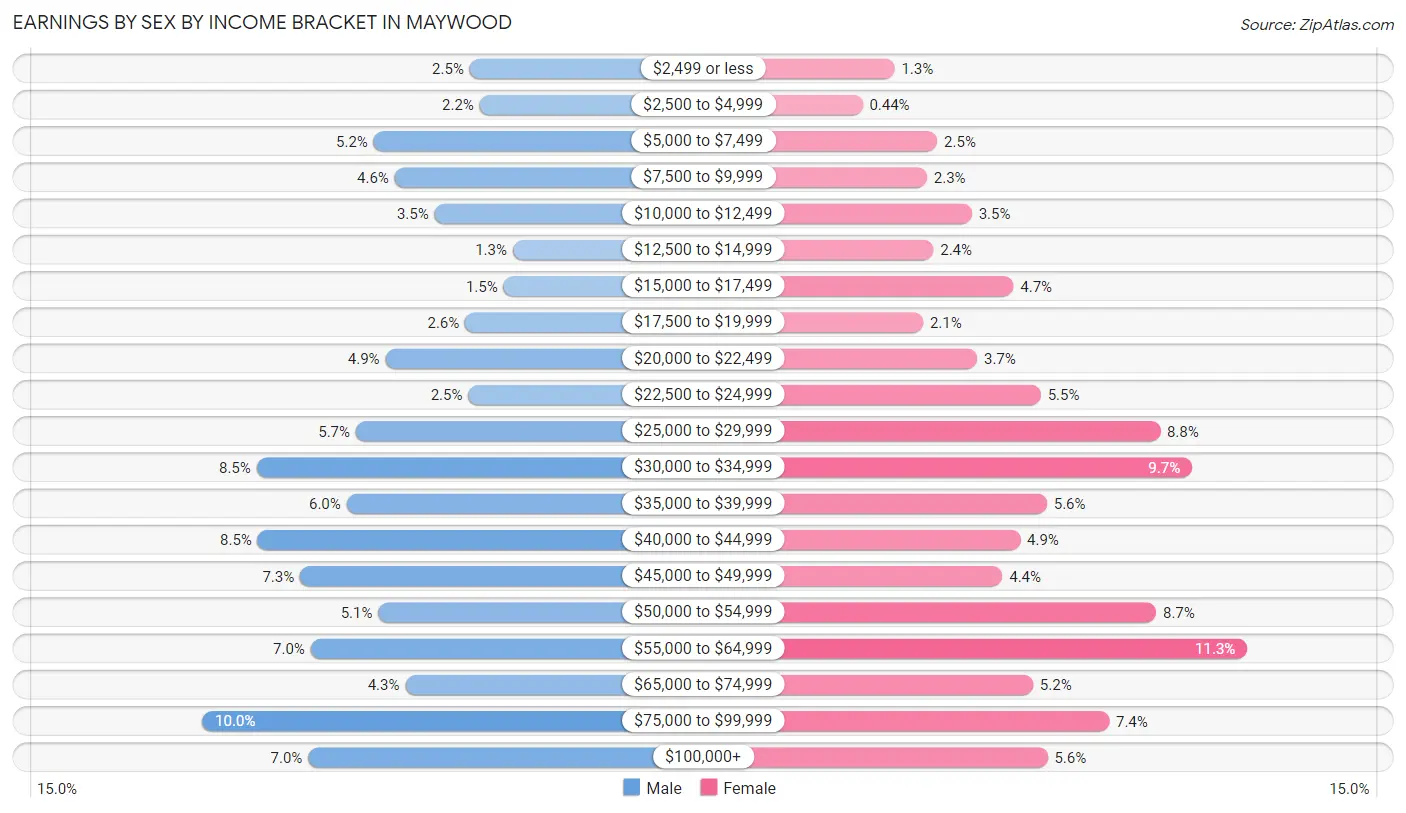
Earnings by Sex by Income Bracket in Maywood
The most common earnings brackets in Maywood are $75,000 to $99,999 for men (538 | 10.0%) and $55,000 to $64,999 for women (615 | 11.3%).
| Income | Male | Female |
| $2,499 or less | 134 (2.5%) | 73 (1.3%) |
| $2,500 to $4,999 | 119 (2.2%) | 24 (0.4%) |
| $5,000 to $7,499 | 279 (5.2%) | 139 (2.5%) |
| $7,500 to $9,999 | 247 (4.6%) | 123 (2.2%) |
| $10,000 to $12,499 | 187 (3.5%) | 192 (3.5%) |
| $12,500 to $14,999 | 69 (1.3%) | 133 (2.4%) |
| $15,000 to $17,499 | 83 (1.5%) | 256 (4.7%) |
| $17,500 to $19,999 | 141 (2.6%) | 117 (2.1%) |
| $20,000 to $22,499 | 261 (4.9%) | 200 (3.7%) |
| $22,500 to $24,999 | 136 (2.5%) | 298 (5.4%) |
| $25,000 to $29,999 | 306 (5.7%) | 481 (8.8%) |
| $30,000 to $34,999 | 456 (8.5%) | 530 (9.7%) |
| $35,000 to $39,999 | 320 (5.9%) | 307 (5.6%) |
| $40,000 to $44,999 | 454 (8.5%) | 266 (4.9%) |
| $45,000 to $49,999 | 390 (7.3%) | 239 (4.4%) |
| $50,000 to $54,999 | 272 (5.1%) | 475 (8.7%) |
| $55,000 to $64,999 | 374 (7.0%) | 615 (11.3%) |
| $65,000 to $74,999 | 231 (4.3%) | 286 (5.2%) |
| $75,000 to $99,999 | 538 (10.0%) | 403 (7.4%) |
| $100,000+ | 378 (7.0%) | 308 (5.6%) |
| Total | 5,375 (100.0%) | 5,465 (100.0%) |
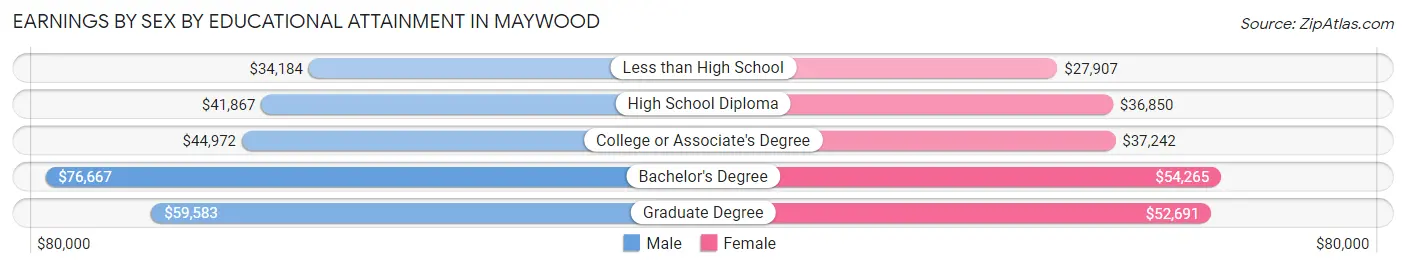
Earnings by Sex by Educational Attainment in Maywood
Average earnings in Maywood are $42,835 for men and $41,518 for women, a difference of 3.1%. Men with an educational attainment of bachelor's degree enjoy the highest average annual earnings of $76,667, while those with less than high school education earn the least with $34,184. Women with an educational attainment of bachelor's degree earn the most with the average annual earnings of $54,265, while those with less than high school education have the smallest earnings of $27,907.
| Educational Attainment | Male Income | Female Income |
| Less than High School | $34,184 | $27,907 |
| High School Diploma | $41,867 | $36,850 |
| College or Associate's Degree | $44,972 | $37,242 |
| Bachelor's Degree | $76,667 | $54,265 |
| Graduate Degree | $59,583 | $52,691 |
| Total | $42,835 | $41,518 |
Family Income in Maywood
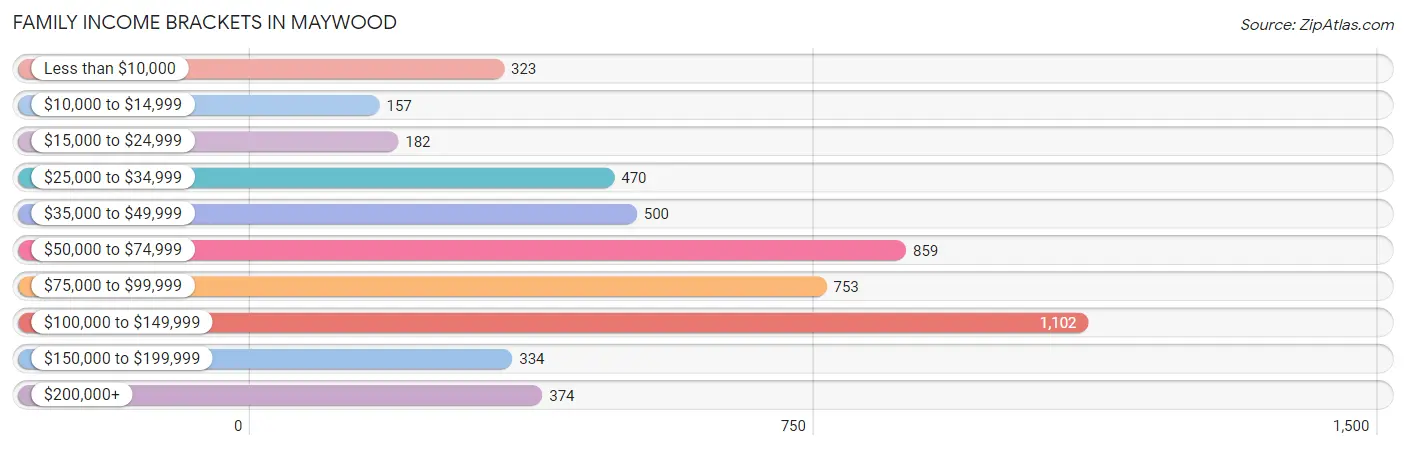
Family Income Brackets in Maywood
According to the Maywood family income data, there are 1,102 families falling into the $100,000 to $149,999 income range, which is the most common income bracket and makes up 21.8% of all families. Conversely, the $10,000 to $14,999 income bracket is the least frequent group with only 157 families (3.1%) belonging to this category.
| Income Bracket | # Families | % Families |
| Less than $10,000 | 323 | 6.4% |
| $10,000 to $14,999 | 157 | 3.1% |
| $15,000 to $24,999 | 182 | 3.6% |
| $25,000 to $34,999 | 470 | 9.3% |
| $35,000 to $49,999 | 500 | 9.9% |
| $50,000 to $74,999 | 859 | 17.0% |
| $75,000 to $99,999 | 753 | 14.9% |
| $100,000 to $149,999 | 1,102 | 21.8% |
| $150,000 to $199,999 | 334 | 6.6% |
| $200,000+ | 374 | 7.4% |
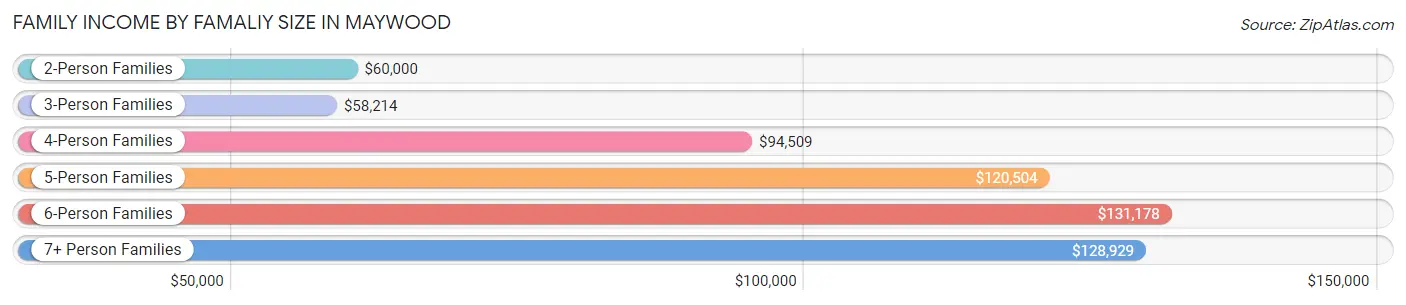
Family Income by Famaliy Size in Maywood
6-person families (219 | 4.3%) account for the highest median family income in Maywood with $131,178 per family, while 2-person families (1,616 | 32.0%) have the highest median income of $30,000 per family member.
| Income Bracket | # Families | Median Income |
| 2-Person Families | 1,616 (32.0%) | $60,000 |
| 3-Person Families | 1,142 (22.6%) | $58,214 |
| 4-Person Families | 1,266 (25.1%) | $94,509 |
| 5-Person Families | 599 (11.8%) | $120,504 |
| 6-Person Families | 219 (4.3%) | $131,178 |
| 7+ Person Families | 212 (4.2%) | $128,929 |
| Total | 5,054 (100.0%) | $76,357 |
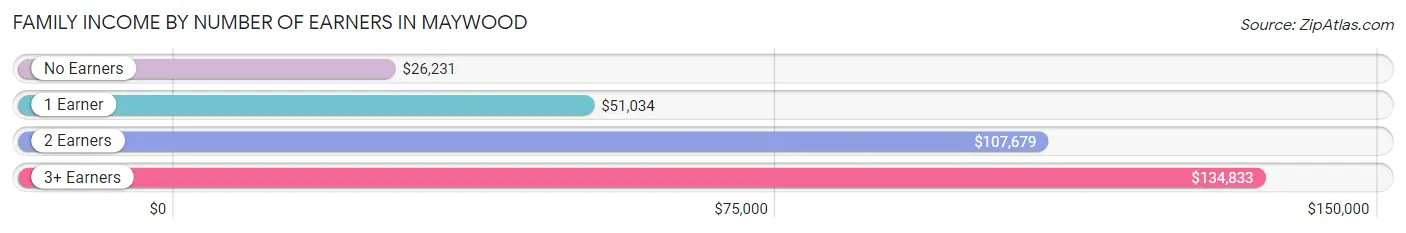
Family Income by Number of Earners in Maywood
The median family income in Maywood is $76,357, with families comprising 3+ earners (940) having the highest median family income of $134,833, while families with no earners (730) have the lowest median family income of $26,231, accounting for 18.6% and 14.4% of families, respectively.
| Number of Earners | # Families | Median Income |
| No Earners | 730 (14.4%) | $26,231 |
| 1 Earner | 1,938 (38.4%) | $51,034 |
| 2 Earners | 1,446 (28.6%) | $107,679 |
| 3+ Earners | 940 (18.6%) | $134,833 |
| Total | 5,054 (100.0%) | $76,357 |
Household Income in Maywood
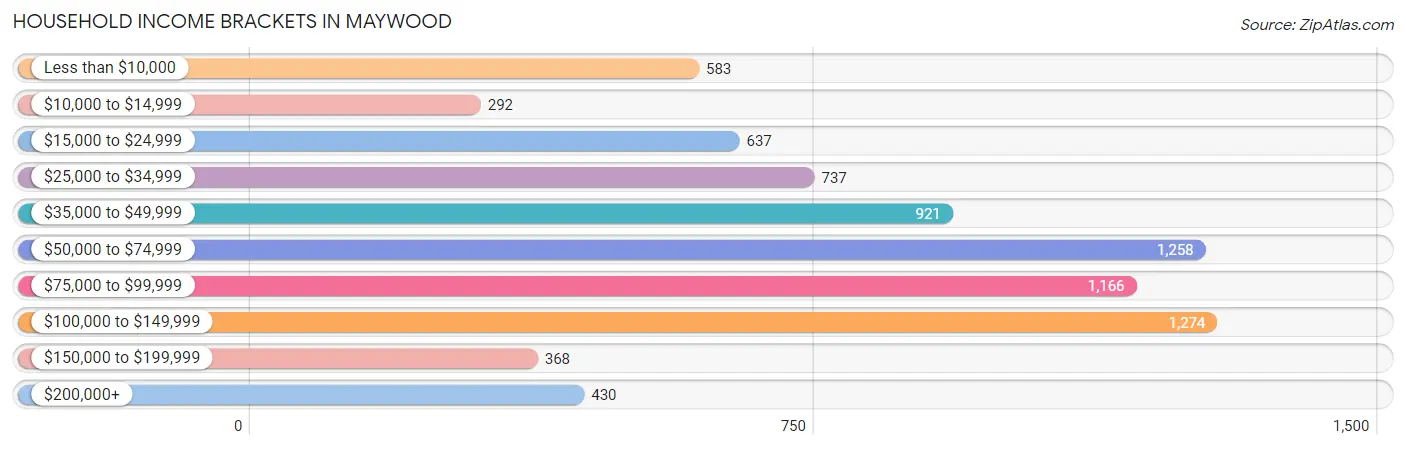
Household Income Brackets in Maywood
With 1,274 households falling in the category, the $100,000 to $149,999 income range is the most frequent in Maywood, accounting for 16.6% of all households. In contrast, only 292 households (3.8%) fall into the $10,000 to $14,999 income bracket, making it the least populous group.
| Income Bracket | # Households | % Households |
| Less than $10,000 | 583 | 7.6% |
| $10,000 to $14,999 | 292 | 3.8% |
| $15,000 to $24,999 | 637 | 8.3% |
| $25,000 to $34,999 | 737 | 9.6% |
| $35,000 to $49,999 | 921 | 12.0% |
| $50,000 to $74,999 | 1,258 | 16.4% |
| $75,000 to $99,999 | 1,166 | 15.2% |
| $100,000 to $149,999 | 1,274 | 16.6% |
| $150,000 to $199,999 | 368 | 4.8% |
| $200,000+ | 430 | 5.6% |
Household Income by Householder Age in Maywood
The median household income in Maywood is $64,767, with the highest median household income of $70,394 found in the 45 to 64 years age bracket for the primary householder. A total of 3,055 households (39.8%) fall into this category. Meanwhile, the 15 to 24 years age bracket for the primary householder has the lowest median household income of $0, with 182 households (2.4%) in this group.
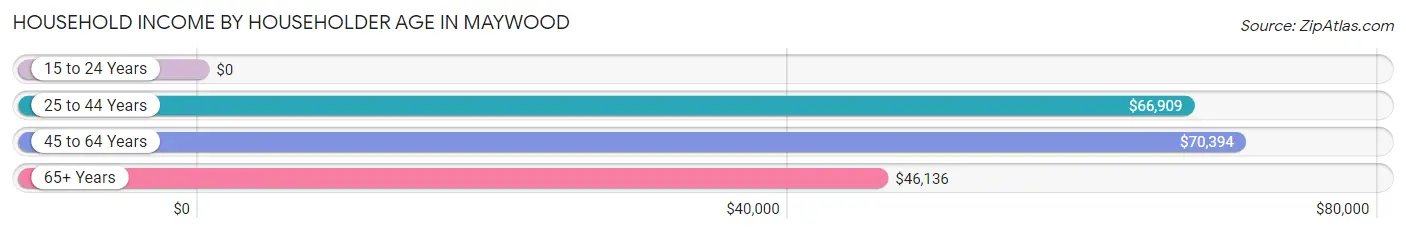
| Income Bracket | # Households | Median Income |
| 15 to 24 Years | 182 (2.4%) | $0 |
| 25 to 44 Years | 2,424 (31.6%) | $66,909 |
| 45 to 64 Years | 3,055 (39.8%) | $70,394 |
| 65+ Years | 2,011 (26.2%) | $46,136 |
| Total | 7,672 (100.0%) | $64,767 |
Poverty in Maywood
Income Below Poverty by Sex and Age in Maywood
With 15.8% poverty level for males and 14.7% for females among the residents of Maywood, 6 to 11 year old males and 15 year old females are the most vulnerable to poverty, with 343 males (33.0%) and 56 females (37.8%) in their respective age groups living below the poverty level.
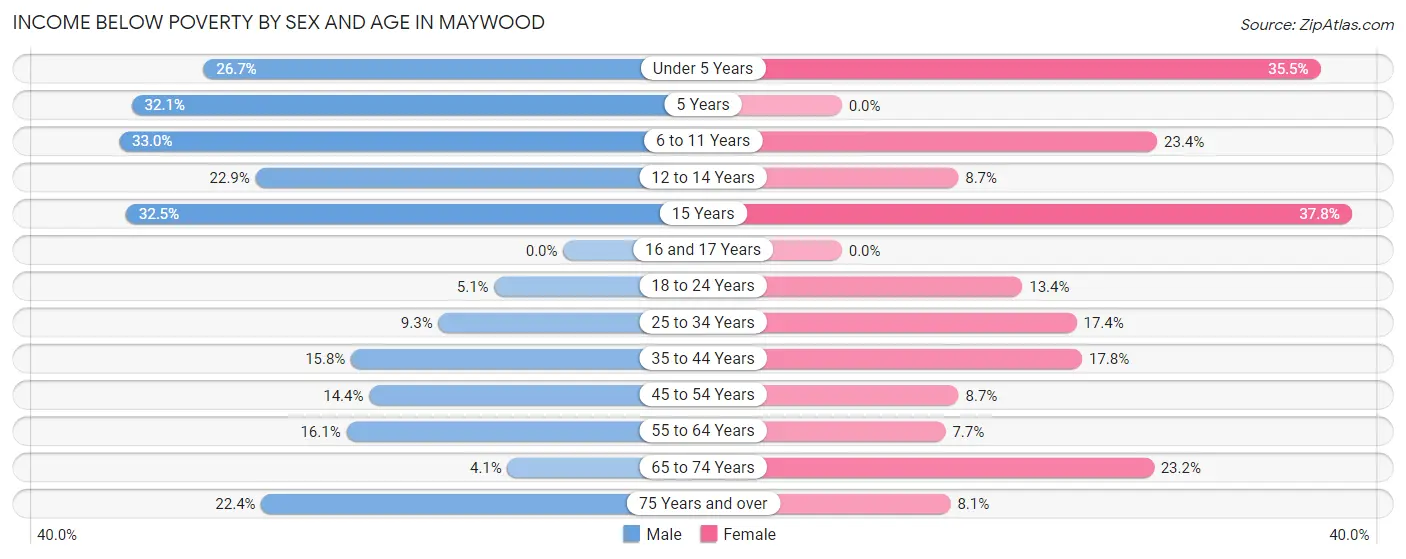
| Age Bracket | Male | Female |
| Under 5 Years | 225 (26.7%) | 151 (35.5%) |
| 5 Years | 25 (32.1%) | 0 (0.0%) |
| 6 to 11 Years | 343 (33.0%) | 250 (23.4%) |
| 12 to 14 Years | 133 (22.9%) | 30 (8.6%) |
| 15 Years | 38 (32.5%) | 56 (37.8%) |
| 16 and 17 Years | 0 (0.0%) | 0 (0.0%) |
| 18 to 24 Years | 61 (5.1%) | 188 (13.4%) |
| 25 to 34 Years | 148 (9.3%) | 302 (17.4%) |
| 35 to 44 Years | 251 (15.8%) | 206 (17.8%) |
| 45 to 54 Years | 222 (14.4%) | 163 (8.7%) |
| 55 to 64 Years | 207 (16.1%) | 128 (7.7%) |
| 65 to 74 Years | 30 (4.1%) | 195 (23.2%) |
| 75 Years and over | 113 (22.4%) | 75 (8.1%) |
| Total | 1,796 (15.8%) | 1,744 (14.7%) |
Income Above Poverty by Sex and Age in Maywood
According to the poverty statistics in Maywood, males aged 16 and 17 years and females aged 5 years are the age groups that are most secure financially, with 100.0% of males and 100.0% of females in these age groups living above the poverty line.
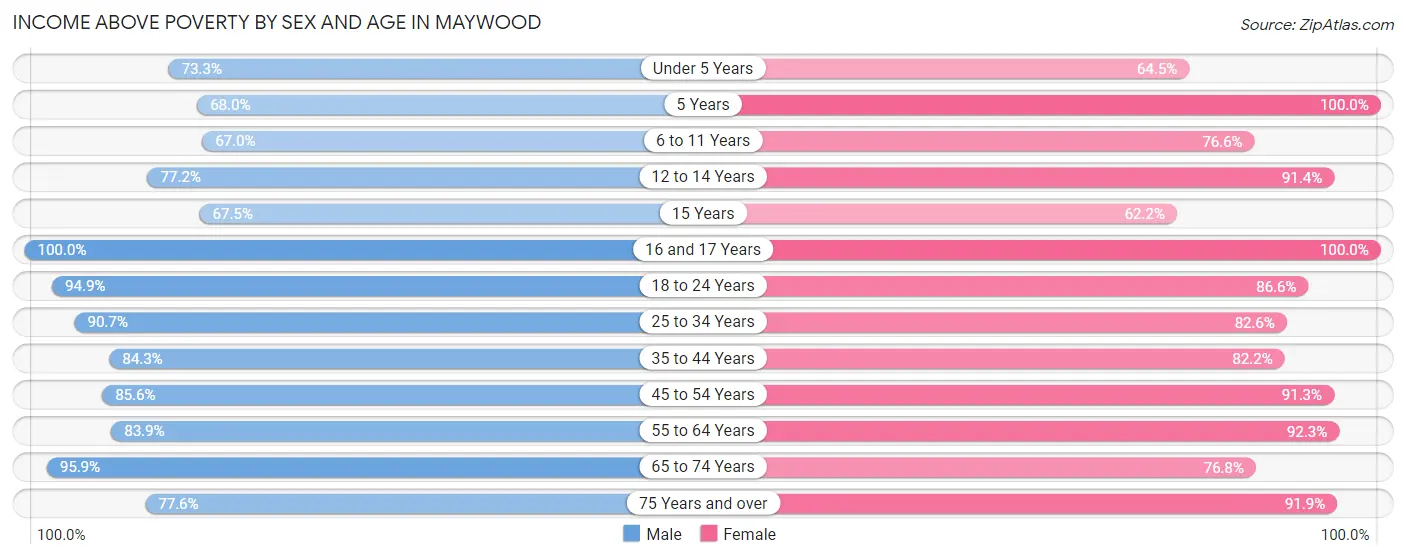
| Age Bracket | Male | Female |
| Under 5 Years | 617 (73.3%) | 274 (64.5%) |
| 5 Years | 53 (67.9%) | 81 (100.0%) |
| 6 to 11 Years | 697 (67.0%) | 818 (76.6%) |
| 12 to 14 Years | 449 (77.1%) | 317 (91.3%) |
| 15 Years | 79 (67.5%) | 92 (62.2%) |
| 16 and 17 Years | 270 (100.0%) | 178 (100.0%) |
| 18 to 24 Years | 1,131 (94.9%) | 1,215 (86.6%) |
| 25 to 34 Years | 1,448 (90.7%) | 1,431 (82.6%) |
| 35 to 44 Years | 1,343 (84.3%) | 949 (82.2%) |
| 45 to 54 Years | 1,319 (85.6%) | 1,717 (91.3%) |
| 55 to 64 Years | 1,079 (83.9%) | 1,535 (92.3%) |
| 65 to 74 Years | 695 (95.9%) | 647 (76.8%) |
| 75 Years and over | 391 (77.6%) | 854 (91.9%) |
| Total | 9,571 (84.2%) | 10,108 (85.3%) |
Income Below Poverty Among Married-Couple Families in Maywood
The poverty statistics for married-couple families in Maywood show that 7.5% or 207 of the total 2,773 families live below the poverty line. Families with 3 or 4 children have the highest poverty rate of 28.7%, comprising of 79 families. On the other hand, families with 1 or 2 children have the lowest poverty rate of 2.7%, which includes 24 families.
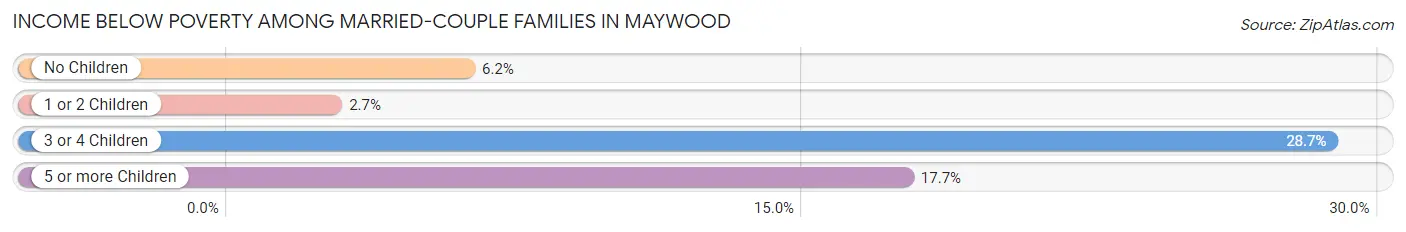
| Children | Above Poverty | Below Poverty |
| No Children | 1,484 (93.8%) | 98 (6.2%) |
| 1 or 2 Children | 858 (97.3%) | 24 (2.7%) |
| 3 or 4 Children | 196 (71.3%) | 79 (28.7%) |
| 5 or more Children | 28 (82.4%) | 6 (17.6%) |
| Total | 2,566 (92.5%) | 207 (7.5%) |
Income Below Poverty Among Single-Parent Households in Maywood
According to the poverty data in Maywood, 11.3% or 56 single-father households and 23.2% or 414 single-mother households are living below the poverty line. Among single-father households, those with 1 or 2 children have the highest poverty rate, with 46 households (19.5%) experiencing poverty. Likewise, among single-mother households, those with 5 or more children have the highest poverty rate, with 27 households (44.3%) falling below the poverty line.
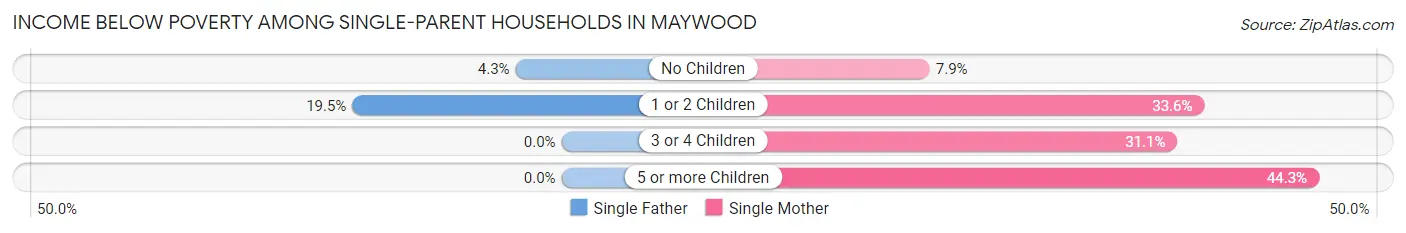
| Children | Single Father | Single Mother |
| No Children | 10 (4.3%) | 58 (7.9%) |
| 1 or 2 Children | 46 (19.5%) | 274 (33.6%) |
| 3 or 4 Children | 0 (0.0%) | 55 (31.1%) |
| 5 or more Children | 0 (0.0%) | 27 (44.3%) |
| Total | 56 (11.3%) | 414 (23.2%) |
Income Below Poverty Among Married-Couple vs Single-Parent Households in Maywood
The poverty data for Maywood shows that 207 of the married-couple family households (7.5%) and 470 of the single-parent households (20.6%) are living below the poverty level. Within the married-couple family households, those with 3 or 4 children have the highest poverty rate, with 79 households (28.7%) falling below the poverty line. Among the single-parent households, those with 5 or more children have the highest poverty rate, with 27 household (44.3%) living below poverty.
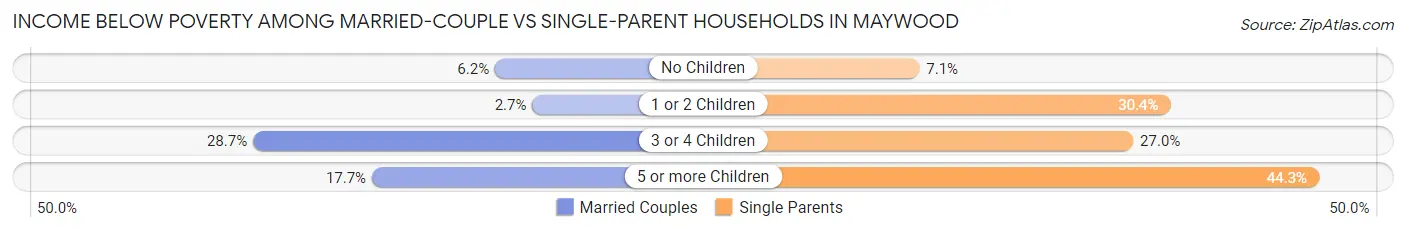
| Children | Married-Couple Families | Single-Parent Households |
| No Children | 98 (6.2%) | 68 (7.0%) |
| 1 or 2 Children | 24 (2.7%) | 320 (30.4%) |
| 3 or 4 Children | 79 (28.7%) | 55 (27.0%) |
| 5 or more Children | 6 (17.6%) | 27 (44.3%) |
| Total | 207 (7.5%) | 470 (20.6%) |
Race in Maywood
The most populous races in Maywood are Black / African American (14,167 | 60.6%), Hispanic or Latino (7,130 | 30.5%), and Some other Race (3,849 | 16.5%).
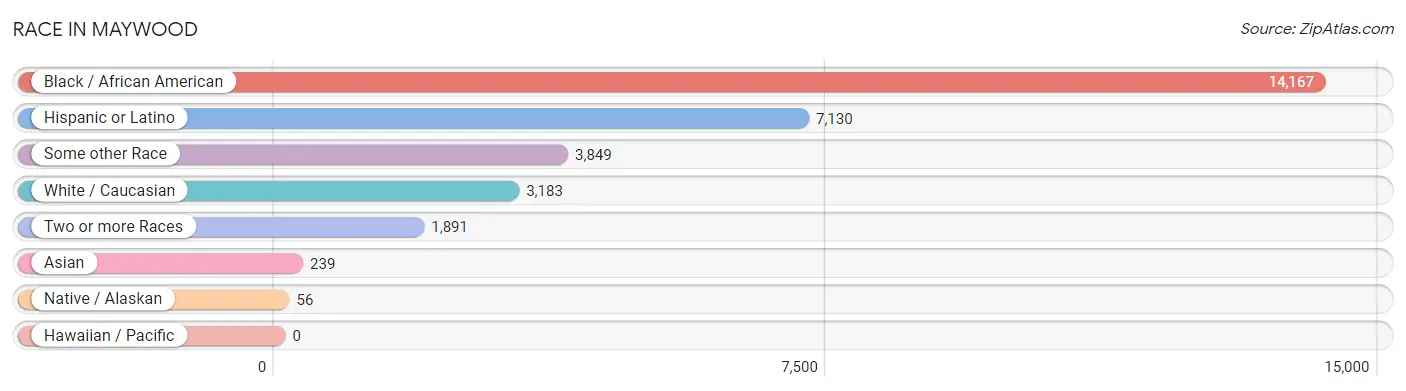
| Race | # Population | % Population |
| Asian | 239 | 1.0% |
| Black / African American | 14,167 | 60.6% |
| Hawaiian / Pacific | 0 | 0.0% |
| Hispanic or Latino | 7,130 | 30.5% |
| Native / Alaskan | 56 | 0.2% |
| White / Caucasian | 3,183 | 13.6% |
| Two or more Races | 1,891 | 8.1% |
| Some other Race | 3,849 | 16.5% |
| Total | 23,385 | 100.0% |
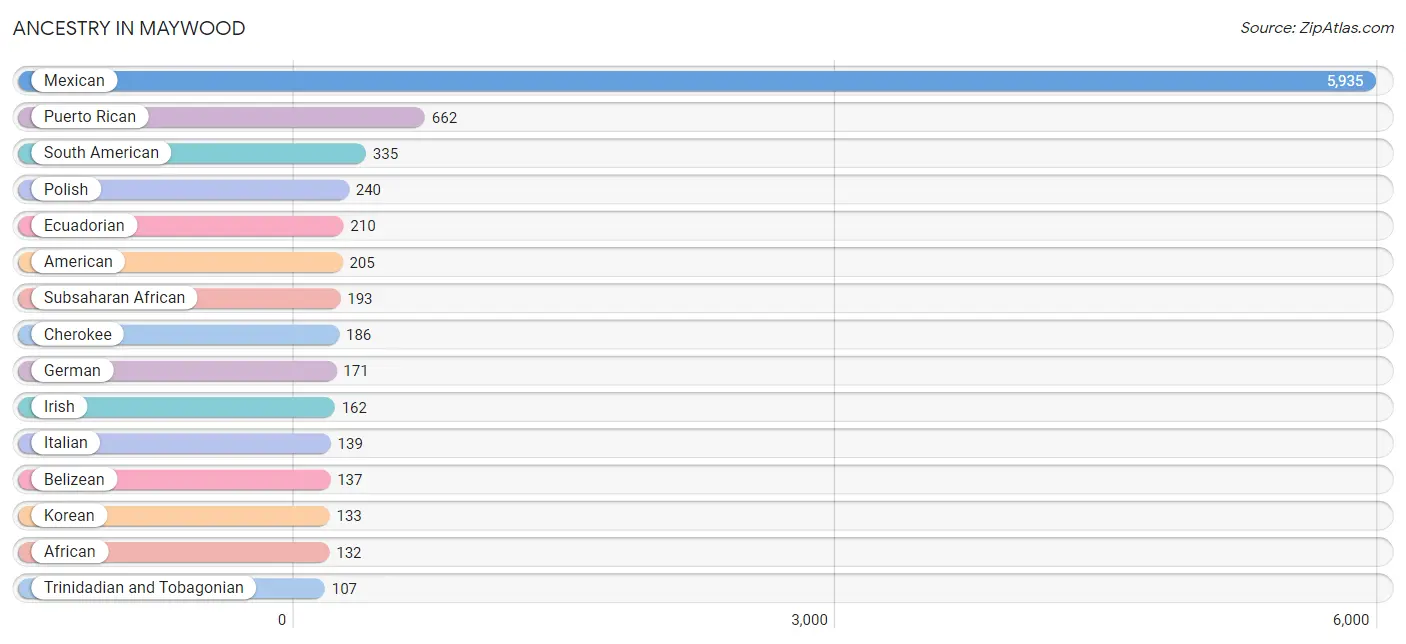
Ancestry in Maywood
The most populous ancestries reported in Maywood are Mexican (5,935 | 25.4%), Puerto Rican (662 | 2.8%), South American (335 | 1.4%), Polish (240 | 1.0%), and Ecuadorian (210 | 0.9%), together accounting for 31.6% of all Maywood residents.
| Ancestry | # Population | % Population |
| African | 132 | 0.6% |
| American | 205 | 0.9% |
| Belgian | 8 | 0.0% |
| Belizean | 137 | 0.6% |
| Bhutanese | 4 | 0.0% |
| Burmese | 28 | 0.1% |
| Central American | 105 | 0.4% |
| Central American Indian | 28 | 0.1% |
| Cherokee | 186 | 0.8% |
| Chilean | 51 | 0.2% |
| Colombian | 74 | 0.3% |
| Croatian | 2 | 0.0% |
| Cuban | 15 | 0.1% |
| Czech | 29 | 0.1% |
| Dutch | 27 | 0.1% |
| Eastern European | 10 | 0.0% |
| Ecuadorian | 210 | 0.9% |
| English | 106 | 0.4% |
| European | 31 | 0.1% |
| French | 31 | 0.1% |
| French Canadian | 23 | 0.1% |
| German | 171 | 0.7% |
| Ghanaian | 71 | 0.3% |
| Guatemalan | 42 | 0.2% |
| Hungarian | 32 | 0.1% |
| Indian (Asian) | 11 | 0.1% |
| Irish | 162 | 0.7% |
| Italian | 139 | 0.6% |
| Jamaican | 59 | 0.3% |
| Korean | 133 | 0.6% |
| Lithuanian | 1 | 0.0% |
| Mexican | 5,935 | 25.4% |
| Mexican American Indian | 41 | 0.2% |
| Native Hawaiian | 11 | 0.1% |
| Northern European | 88 | 0.4% |
| Norwegian | 8 | 0.0% |
| Pakistani | 35 | 0.2% |
| Panamanian | 12 | 0.1% |
| Polish | 240 | 1.0% |
| Puerto Rican | 662 | 2.8% |
| Russian | 16 | 0.1% |
| Salvadoran | 51 | 0.2% |
| Scandinavian | 10 | 0.0% |
| Scottish | 19 | 0.1% |
| South American | 335 | 1.4% |
| Spaniard | 11 | 0.1% |
| Sri Lankan | 27 | 0.1% |
| Subsaharan African | 193 | 0.8% |
| Swedish | 50 | 0.2% |
| Thai | 88 | 0.4% |
| Trinidadian and Tobagonian | 107 | 0.5% |
| Ukrainian | 7 | 0.0% | View All 52 Rows |
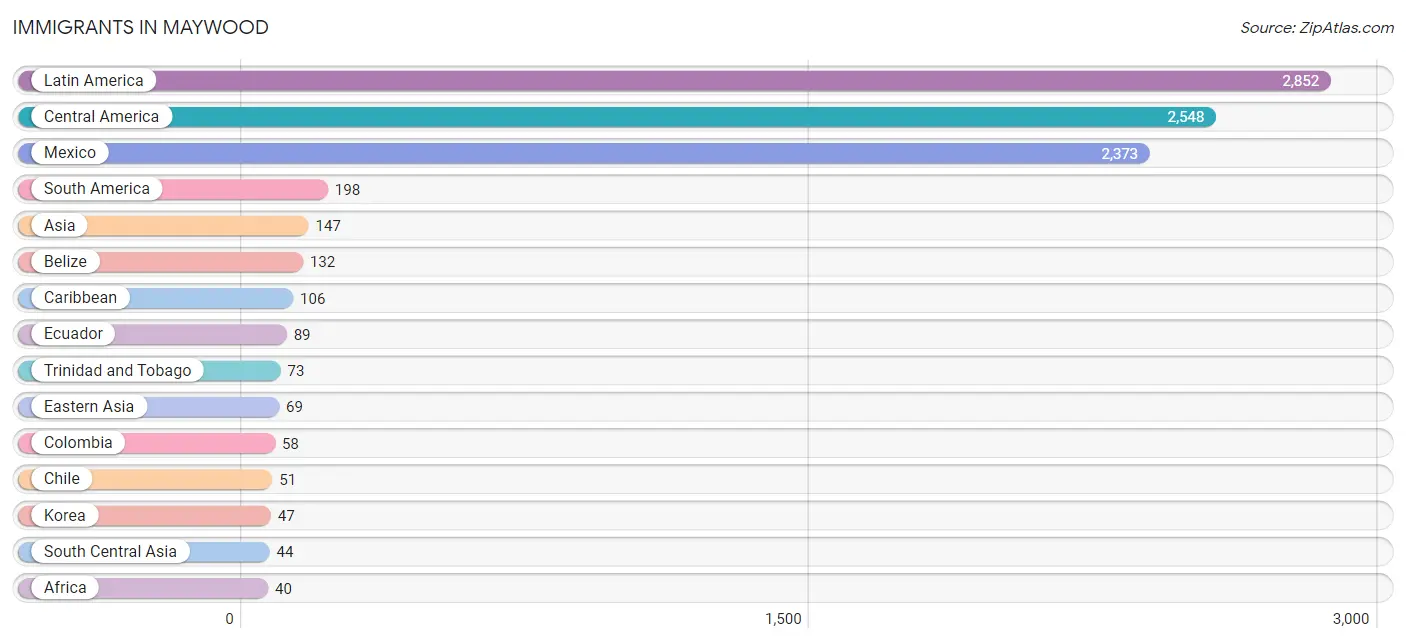
Immigrants in Maywood
The most numerous immigrant groups reported in Maywood came from Latin America (2,852 | 12.2%), Central America (2,548 | 10.9%), Mexico (2,373 | 10.2%), South America (198 | 0.9%), and Asia (147 | 0.6%), together accounting for 34.7% of all Maywood residents.
| Immigration Origin | # Population | % Population |
| Africa | 40 | 0.2% |
| Asia | 147 | 0.6% |
| Australia | 8 | 0.0% |
| Belize | 132 | 0.6% |
| Canada | 11 | 0.1% |
| Caribbean | 106 | 0.4% |
| Central America | 2,548 | 10.9% |
| Chile | 51 | 0.2% |
| China | 18 | 0.1% |
| Colombia | 58 | 0.3% |
| Croatia | 2 | 0.0% |
| Eastern Asia | 69 | 0.3% |
| Eastern Europe | 32 | 0.1% |
| Ecuador | 89 | 0.4% |
| Europe | 32 | 0.1% |
| Ghana | 29 | 0.1% |
| Guatemala | 10 | 0.0% |
| India | 26 | 0.1% |
| Jamaica | 33 | 0.1% |
| Japan | 4 | 0.0% |
| Korea | 47 | 0.2% |
| Latin America | 2,852 | 12.2% |
| Mexico | 2,373 | 10.2% |
| Nigeria | 11 | 0.1% |
| Oceania | 8 | 0.0% |
| Pakistan | 18 | 0.1% |
| Panama | 33 | 0.1% |
| Philippines | 34 | 0.2% |
| Poland | 9 | 0.0% |
| Russia | 14 | 0.1% |
| South America | 198 | 0.9% |
| South Central Asia | 44 | 0.2% |
| South Eastern Asia | 34 | 0.2% |
| Trinidad and Tobago | 73 | 0.3% |
| Ukraine | 7 | 0.0% |
| Western Africa | 40 | 0.2% | View All 36 Rows |
Sex and Age in Maywood
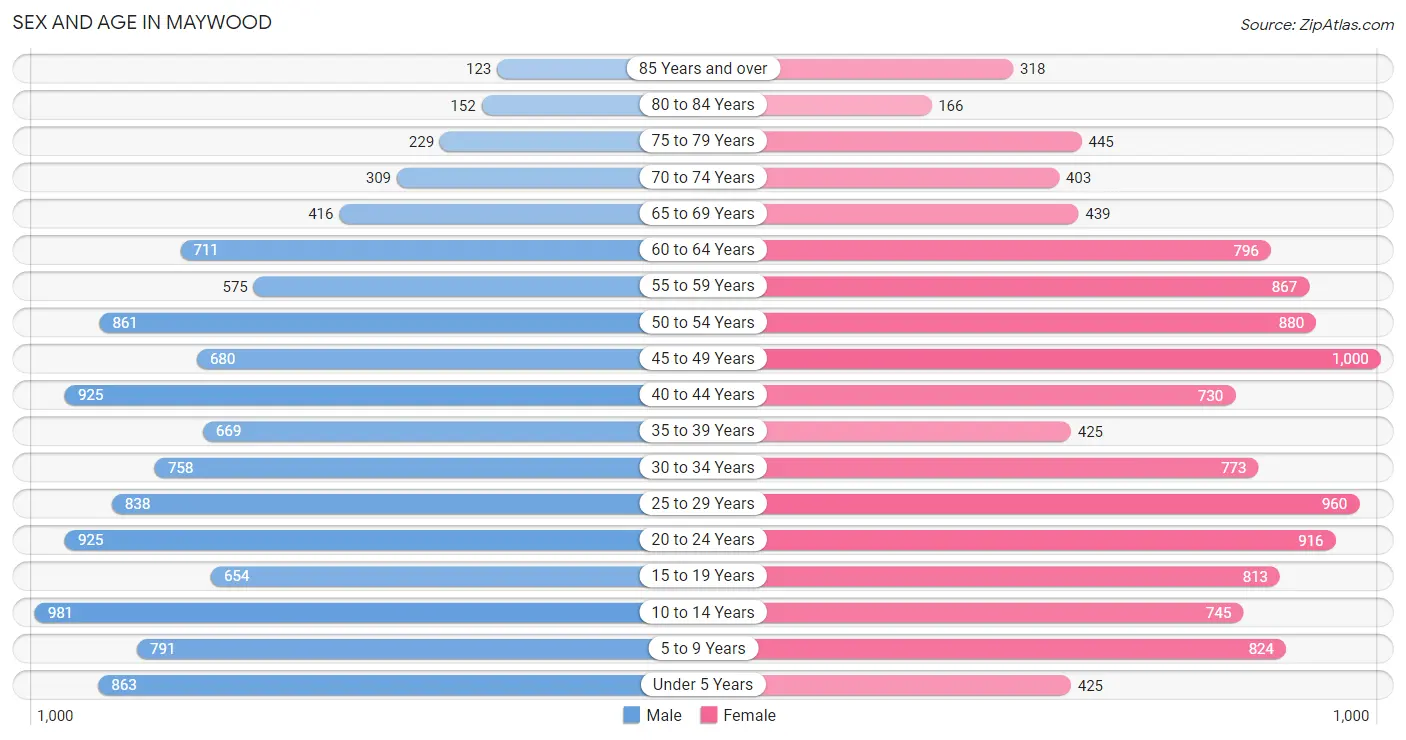
Sex and Age in Maywood
The most populous age groups in Maywood are 10 to 14 Years (981 | 8.6%) for men and 45 to 49 Years (1,000 | 8.4%) for women.
| Age Bracket | Male | Female |
| Under 5 Years | 863 (7.5%) | 425 (3.6%) |
| 5 to 9 Years | 791 (6.9%) | 824 (6.9%) |
| 10 to 14 Years | 981 (8.6%) | 745 (6.2%) |
| 15 to 19 Years | 654 (5.7%) | 813 (6.8%) |
| 20 to 24 Years | 925 (8.1%) | 916 (7.7%) |
| 25 to 29 Years | 838 (7.3%) | 960 (8.1%) |
| 30 to 34 Years | 758 (6.6%) | 773 (6.5%) |
| 35 to 39 Years | 669 (5.8%) | 425 (3.6%) |
| 40 to 44 Years | 925 (8.1%) | 730 (6.1%) |
| 45 to 49 Years | 680 (5.9%) | 1,000 (8.4%) |
| 50 to 54 Years | 861 (7.5%) | 880 (7.4%) |
| 55 to 59 Years | 575 (5.0%) | 867 (7.3%) |
| 60 to 64 Years | 711 (6.2%) | 796 (6.7%) |
| 65 to 69 Years | 416 (3.6%) | 439 (3.7%) |
| 70 to 74 Years | 309 (2.7%) | 403 (3.4%) |
| 75 to 79 Years | 229 (2.0%) | 445 (3.7%) |
| 80 to 84 Years | 152 (1.3%) | 166 (1.4%) |
| 85 Years and over | 123 (1.1%) | 318 (2.7%) |
| Total | 11,460 (100.0%) | 11,925 (100.0%) |
Families and Households in Maywood
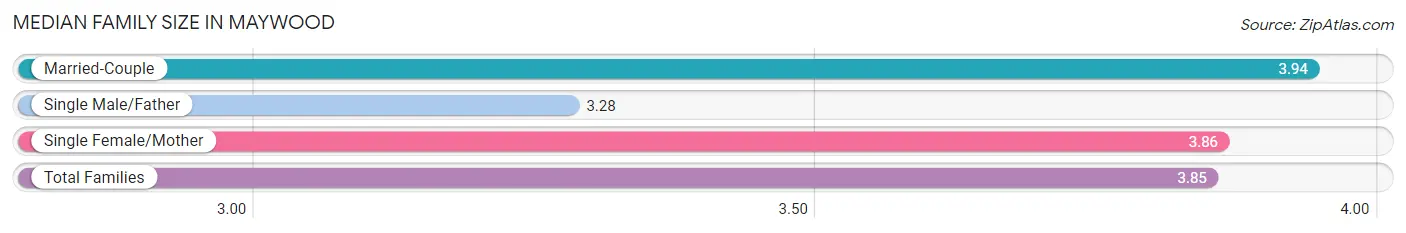
Median Family Size in Maywood
The median family size in Maywood is 3.85 persons per family, with married-couple families (2,773 | 54.9%) accounting for the largest median family size of 3.94 persons per family. On the other hand, single male/father families (496 | 9.8%) represent the smallest median family size with 3.28 persons per family.
| Family Type | # Families | Family Size |
| Married-Couple | 2,773 (54.9%) | 3.94 |
| Single Male/Father | 496 (9.8%) | 3.28 |
| Single Female/Mother | 1,785 (35.3%) | 3.86 |
| Total Families | 5,054 (100.0%) | 3.85 |
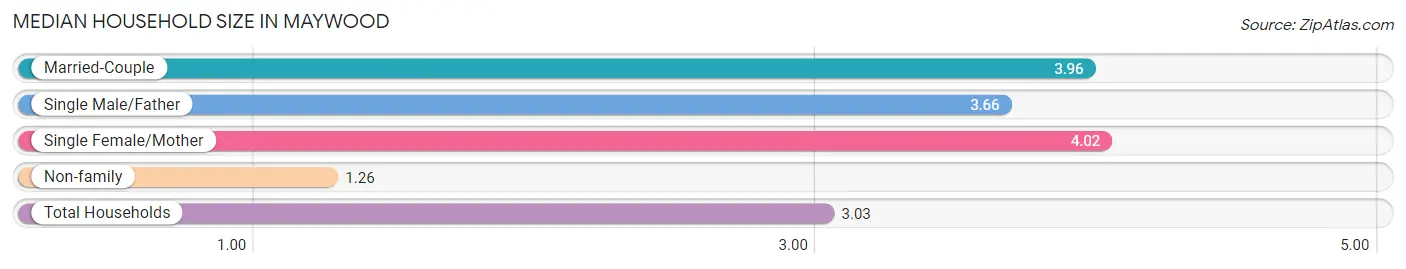
Median Household Size in Maywood
The median household size in Maywood is 3.03 persons per household, with single female/mother households (1,785 | 23.3%) accounting for the largest median household size of 4.02 persons per household. non-family households (2,618 | 34.1%) represent the smallest median household size with 1.26 persons per household.
| Household Type | # Households | Household Size |
| Married-Couple | 2,773 (36.1%) | 3.96 |
| Single Male/Father | 496 (6.5%) | 3.66 |
| Single Female/Mother | 1,785 (23.3%) | 4.02 |
| Non-family | 2,618 (34.1%) | 1.26 |
| Total Households | 7,672 (100.0%) | 3.03 |
Household Size by Marriage Status in Maywood
Out of a total of 7,672 households in Maywood, 5,054 (65.9%) are family households, while 2,618 (34.1%) are nonfamily households. The most numerous type of family households are 2-person households, comprising 1,510, and the most common type of nonfamily households are 1-person households, comprising 2,181.
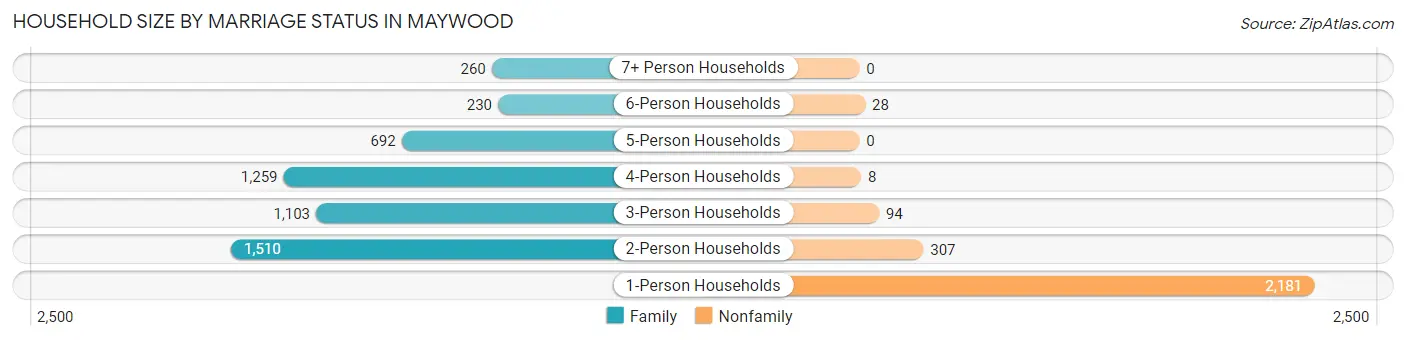
| Household Size | Family Households | Nonfamily Households |
| 1-Person Households | - | 2,181 (28.4%) |
| 2-Person Households | 1,510 (19.7%) | 307 (4.0%) |
| 3-Person Households | 1,103 (14.4%) | 94 (1.2%) |
| 4-Person Households | 1,259 (16.4%) | 8 (0.1%) |
| 5-Person Households | 692 (9.0%) | 0 (0.0%) |
| 6-Person Households | 230 (3.0%) | 28 (0.4%) |
| 7+ Person Households | 260 (3.4%) | 0 (0.0%) |
| Total | 5,054 (65.9%) | 2,618 (34.1%) |
Female Fertility in Maywood
Fertility by Age in Maywood
Average fertility rate in Maywood is 55.0 births per 1,000 women. Women in the age bracket of 20 to 34 years have the highest fertility rate with 95.0 births per 1,000 women. Women in the age bracket of 20 to 34 years acount for 77.9% of all women with births.
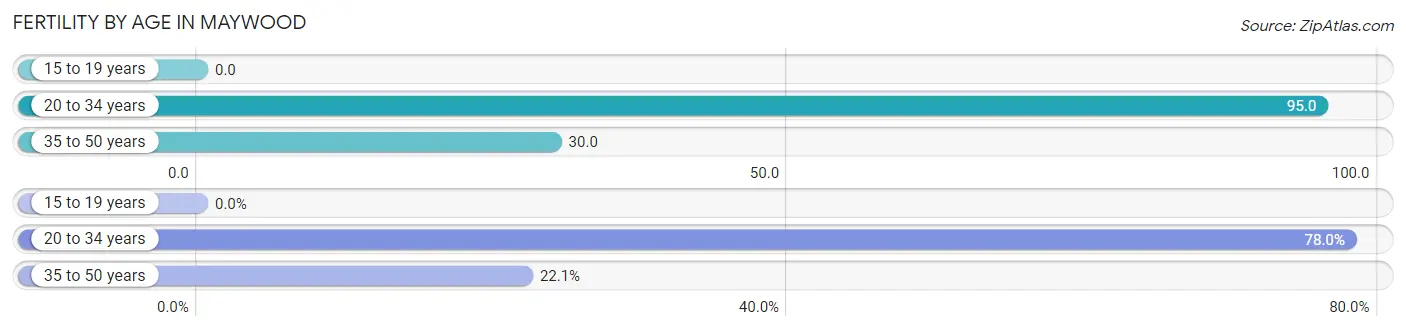
| Age Bracket | Women with Births | Births / 1,000 Women |
| 15 to 19 years | 0 (0.0%) | 0.0 |
| 20 to 34 years | 251 (77.9%) | 95.0 |
| 35 to 50 years | 71 (22.1%) | 30.0 |
| Total | 322 (100.0%) | 55.0 |
Fertility by Age by Marriage Status in Maywood
55.6% of women with births (322) in Maywood are married. The highest percentage of unmarried women with births falls into 20 to 34 years age bracket with 57.0% of them unmarried at the time of birth, while the lowest percentage of unmarried women with births belong to 35 to 50 years age bracket with 0.0% of them unmarried.
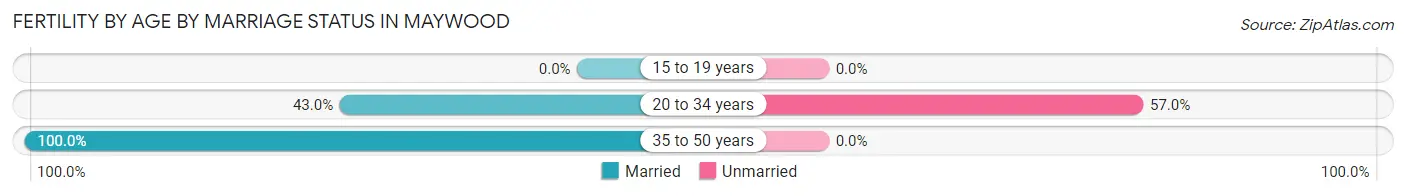
| Age Bracket | Married | Unmarried |
| 15 to 19 years | 0 (0.0%) | 0 (0.0%) |
| 20 to 34 years | 108 (43.0%) | 143 (57.0%) |
| 35 to 50 years | 71 (100.0%) | 0 (0.0%) |
| Total | 179 (55.6%) | 143 (44.4%) |
Fertility by Education in Maywood
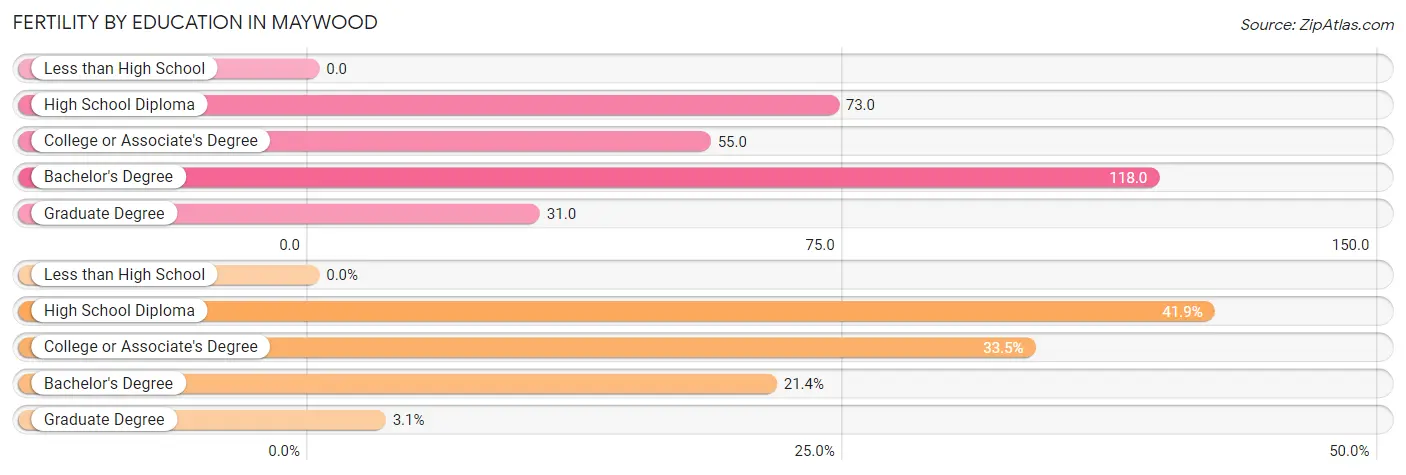
| Educational Attainment | Women with Births | Births / 1,000 Women |
| Less than High School | 0 (0.0%) | 0.0 |
| High School Diploma | 135 (41.9%) | 73.0 |
| College or Associate's Degree | 108 (33.5%) | 55.0 |
| Bachelor's Degree | 69 (21.4%) | 118.0 |
| Graduate Degree | 10 (3.1%) | 31.0 |
| Total | 322 (100.0%) | 55.0 |
Fertility by Education by Marriage Status in Maywood
44.4% of women with births in Maywood are unmarried. Women with the educational attainment of graduate degree are most likely to be married with 100.0% of them married at childbirth, while women with the educational attainment of bachelor's degree are least likely to be married with 56.5% of them unmarried at childbirth.
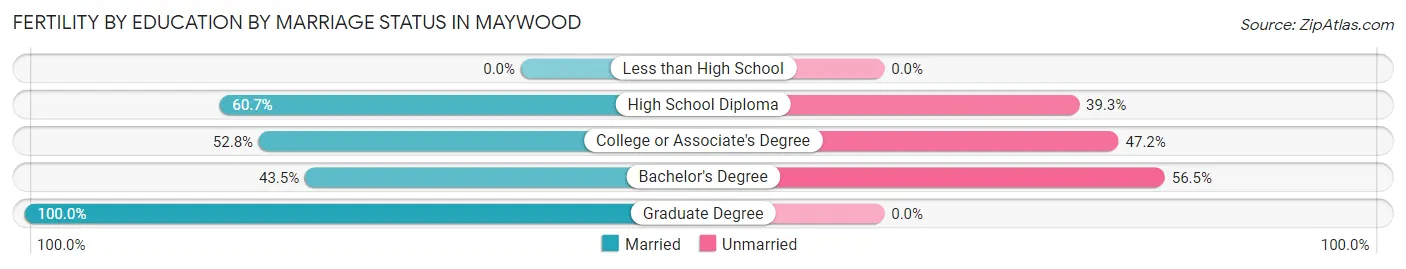
| Educational Attainment | Married | Unmarried |
| Less than High School | 0 (0.0%) | 0 (0.0%) |
| High School Diploma | 82 (60.7%) | 53 (39.3%) |
| College or Associate's Degree | 57 (52.8%) | 51 (47.2%) |
| Bachelor's Degree | 30 (43.5%) | 39 (56.5%) |
| Graduate Degree | 10 (100.0%) | 0 (0.0%) |
| Total | 179 (55.6%) | 143 (44.4%) |
Employment Characteristics in Maywood
Employment by Class of Employer in Maywood
Among the 9,504 employed individuals in Maywood, private company employees (6,822 | 71.8%), not-for-profit organizations (860 | 9.0%), and federal government employees (592 | 6.2%) make up the most common classes of employment.
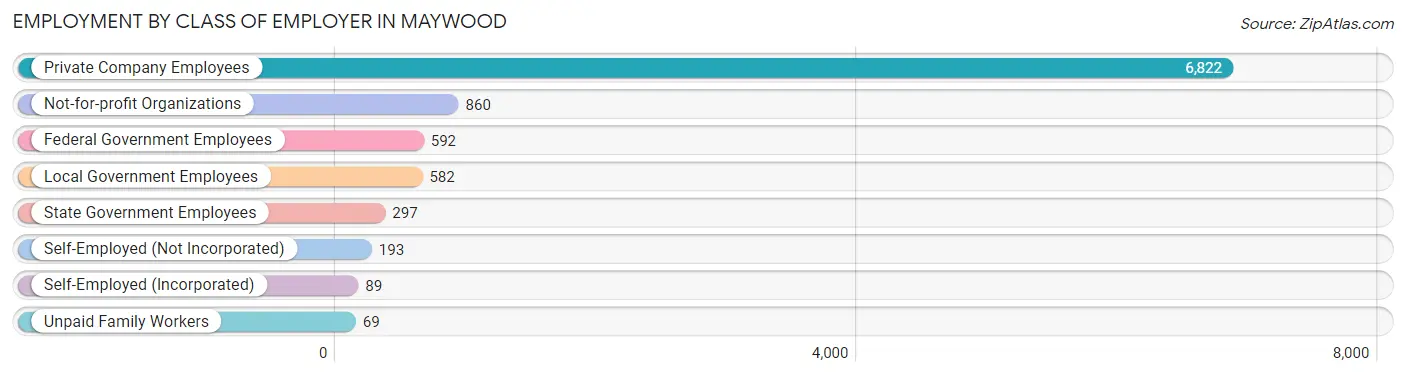
| Employer Class | # Employees | % Employees |
| Private Company Employees | 6,822 | 71.8% |
| Self-Employed (Incorporated) | 89 | 0.9% |
| Self-Employed (Not Incorporated) | 193 | 2.0% |
| Not-for-profit Organizations | 860 | 9.0% |
| Local Government Employees | 582 | 6.1% |
| State Government Employees | 297 | 3.1% |
| Federal Government Employees | 592 | 6.2% |
| Unpaid Family Workers | 69 | 0.7% |
| Total | 9,504 | 100.0% |
Employment Status by Age in Maywood
According to the labor force statistics for Maywood, out of the total population over 16 years of age (18,491), 57.9% or 10,706 individuals are in the labor force, with 9.0% or 964 of them unemployed. The age group with the highest labor force participation rate is 35 to 44 years, with 80.8% or 2,221 individuals in the labor force. Within the labor force, the 16 to 19 years age range has the highest percentage of unemployed individuals, with 19.9% or 59 of them being unemployed.
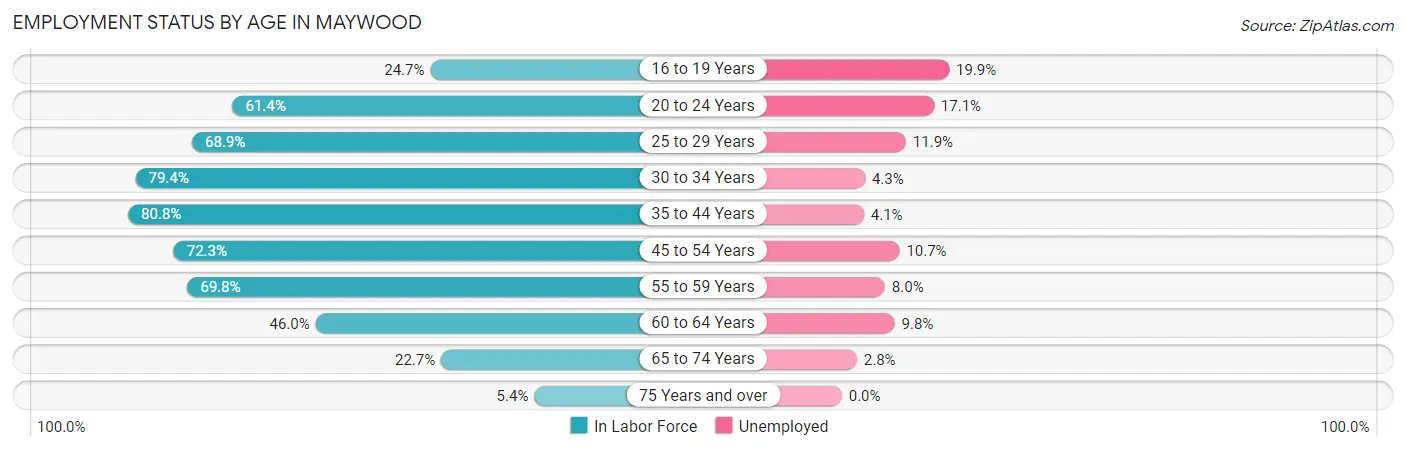
| Age Bracket | In Labor Force | Unemployed |
| 16 to 19 Years | 297 (24.7%) | 59 (19.9%) |
| 20 to 24 Years | 1,130 (61.4%) | 193 (17.1%) |
| 25 to 29 Years | 1,239 (68.9%) | 147 (11.9%) |
| 30 to 34 Years | 1,216 (79.4%) | 52 (4.3%) |
| 35 to 44 Years | 2,221 (80.8%) | 91 (4.1%) |
| 45 to 54 Years | 2,473 (72.3%) | 265 (10.7%) |
| 55 to 59 Years | 1,007 (69.8%) | 81 (8.0%) |
| 60 to 64 Years | 693 (46.0%) | 68 (9.8%) |
| 65 to 74 Years | 356 (22.7%) | 10 (2.8%) |
| 75 Years and over | 77 (5.4%) | 0 (0.0%) |
| Total | 10,706 (57.9%) | 964 (9.0%) |
Employment Status by Educational Attainment in Maywood
According to labor force statistics for Maywood, 71.1% of individuals (8,851) out of the total population between 25 and 64 years of age (12,448) are in the labor force, with 7.9% or 699 of them being unemployed. The group with the highest labor force participation rate are those with the educational attainment of bachelor's degree or higher, with 82.4% or 1,635 individuals in the labor force. Within the labor force, individuals with high school diploma education have the highest percentage of unemployment, with 10.0% or 292 of them being unemployed.
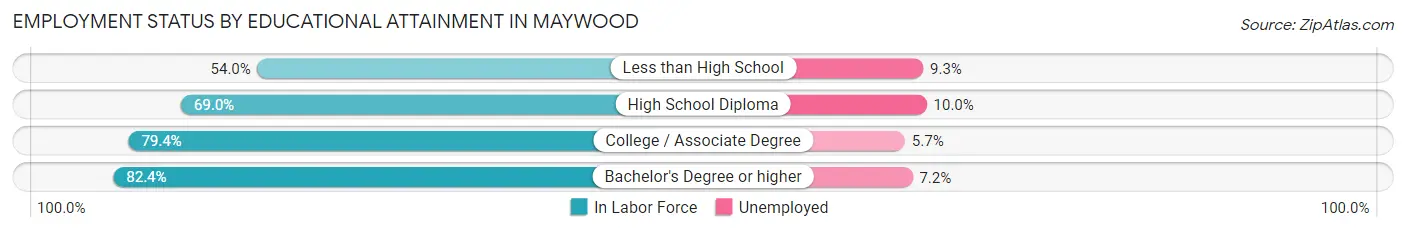
| Educational Attainment | In Labor Force | Unemployed |
| Less than High School | 1,383 (54.0%) | 238 (9.3%) |
| High School Diploma | 2,924 (69.0%) | 424 (10.0%) |
| College / Associate Degree | 2,910 (79.4%) | 209 (5.7%) |
| Bachelor's Degree or higher | 1,635 (82.4%) | 143 (7.2%) |
| Total | 8,851 (71.1%) | 983 (7.9%) |
Employment Occupations by Sex in Maywood
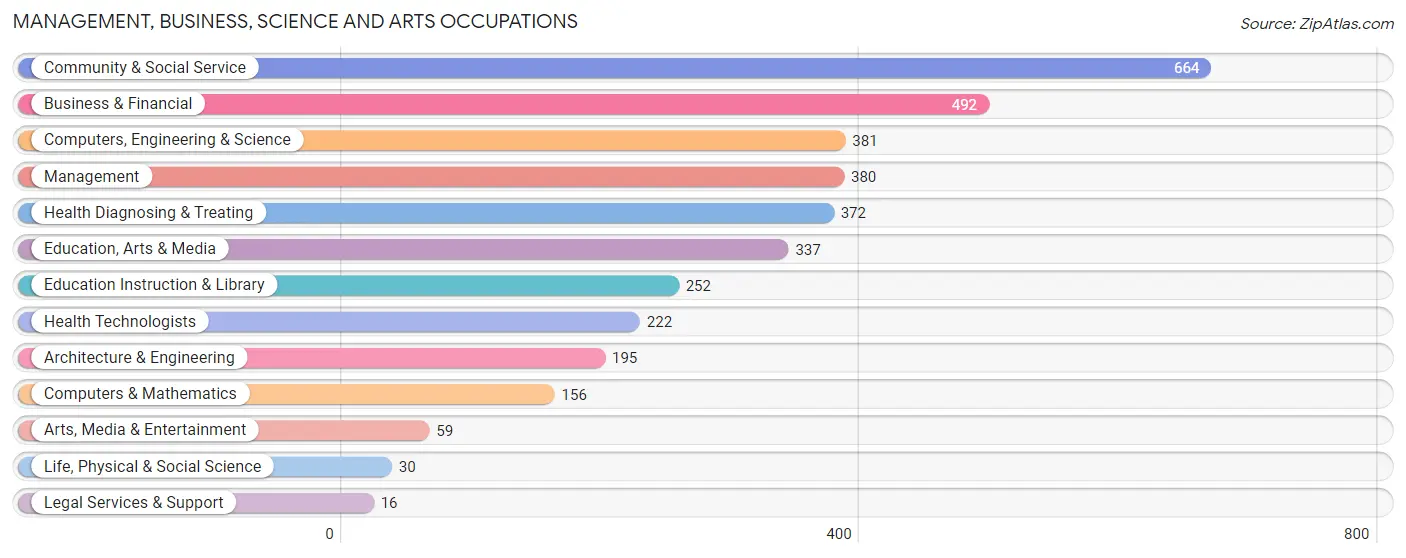
Management, Business, Science and Arts Occupations
The most common Management, Business, Science and Arts occupations in Maywood are Community & Social Service (664 | 6.8%), Business & Financial (492 | 5.1%), Computers, Engineering & Science (381 | 3.9%), Management (380 | 3.9%), and Health Diagnosing & Treating (372 | 3.8%).
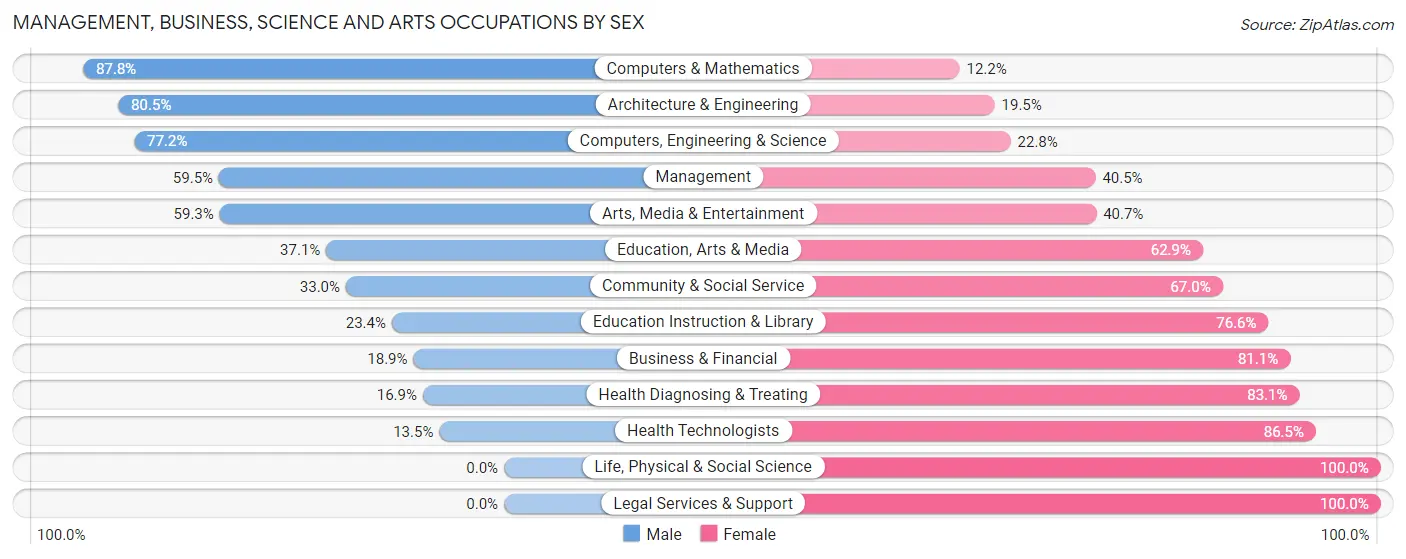
Management, Business, Science and Arts Occupations by Sex
Within the Management, Business, Science and Arts occupations in Maywood, the most male-oriented occupations are Computers & Mathematics (87.8%), Architecture & Engineering (80.5%), and Computers, Engineering & Science (77.2%), while the most female-oriented occupations are Life, Physical & Social Science (100.0%), Legal Services & Support (100.0%), and Health Technologists (86.5%).
| Occupation | Male | Female |
| Management | 226 (59.5%) | 154 (40.5%) |
| Business & Financial | 93 (18.9%) | 399 (81.1%) |
| Computers, Engineering & Science | 294 (77.2%) | 87 (22.8%) |
| Computers & Mathematics | 137 (87.8%) | 19 (12.2%) |
| Architecture & Engineering | 157 (80.5%) | 38 (19.5%) |
| Life, Physical & Social Science | 0 (0.0%) | 30 (100.0%) |
| Community & Social Service | 219 (33.0%) | 445 (67.0%) |
| Education, Arts & Media | 125 (37.1%) | 212 (62.9%) |
| Legal Services & Support | 0 (0.0%) | 16 (100.0%) |
| Education Instruction & Library | 59 (23.4%) | 193 (76.6%) |
| Arts, Media & Entertainment | 35 (59.3%) | 24 (40.7%) |
| Health Diagnosing & Treating | 63 (16.9%) | 309 (83.1%) |
| Health Technologists | 30 (13.5%) | 192 (86.5%) |
| Total (Category) | 895 (39.1%) | 1,394 (60.9%) |
| Total (Overall) | 4,835 (49.7%) | 4,890 (50.3%) |
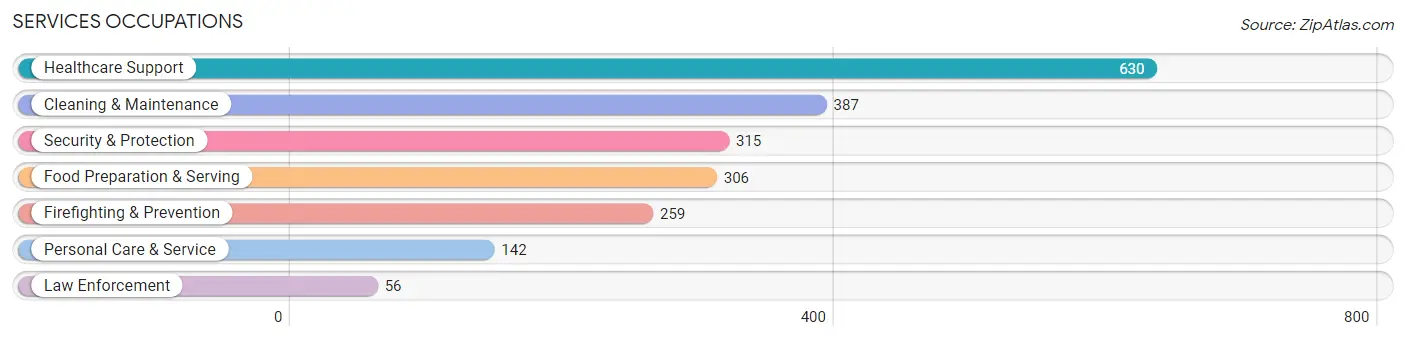
Services Occupations
The most common Services occupations in Maywood are Healthcare Support (630 | 6.5%), Cleaning & Maintenance (387 | 4.0%), Security & Protection (315 | 3.2%), Food Preparation & Serving (306 | 3.2%), and Firefighting & Prevention (259 | 2.7%).
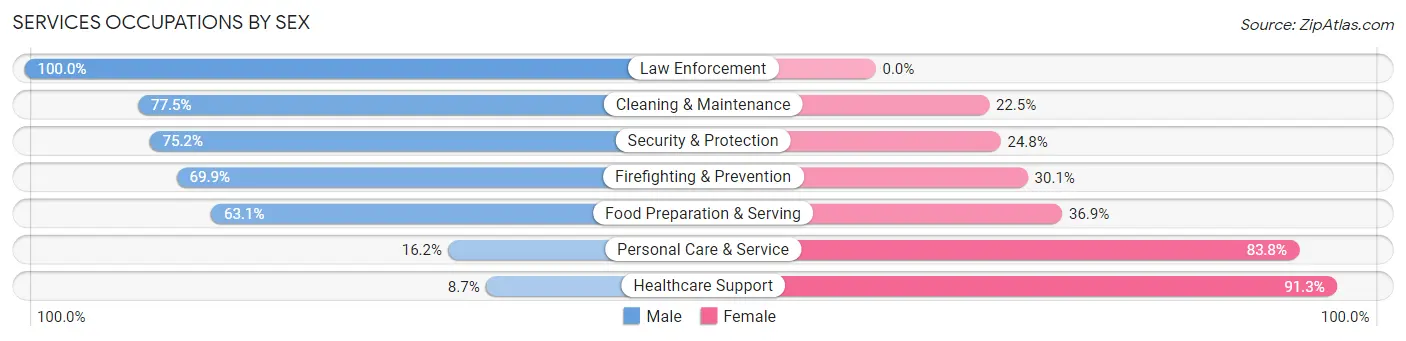
Services Occupations by Sex
Within the Services occupations in Maywood, the most male-oriented occupations are Law Enforcement (100.0%), Cleaning & Maintenance (77.5%), and Security & Protection (75.2%), while the most female-oriented occupations are Healthcare Support (91.3%), Personal Care & Service (83.8%), and Food Preparation & Serving (36.9%).
| Occupation | Male | Female |
| Healthcare Support | 55 (8.7%) | 575 (91.3%) |
| Security & Protection | 237 (75.2%) | 78 (24.8%) |
| Firefighting & Prevention | 181 (69.9%) | 78 (30.1%) |
| Law Enforcement | 56 (100.0%) | 0 (0.0%) |
| Food Preparation & Serving | 193 (63.1%) | 113 (36.9%) |
| Cleaning & Maintenance | 300 (77.5%) | 87 (22.5%) |
| Personal Care & Service | 23 (16.2%) | 119 (83.8%) |
| Total (Category) | 808 (45.4%) | 972 (54.6%) |
| Total (Overall) | 4,835 (49.7%) | 4,890 (50.3%) |
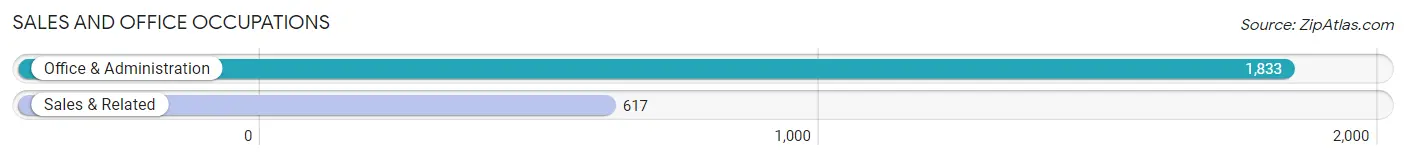
Sales and Office Occupations
The most common Sales and Office occupations in Maywood are Office & Administration (1,833 | 18.9%), and Sales & Related (617 | 6.3%).
Sales and Office Occupations by Sex
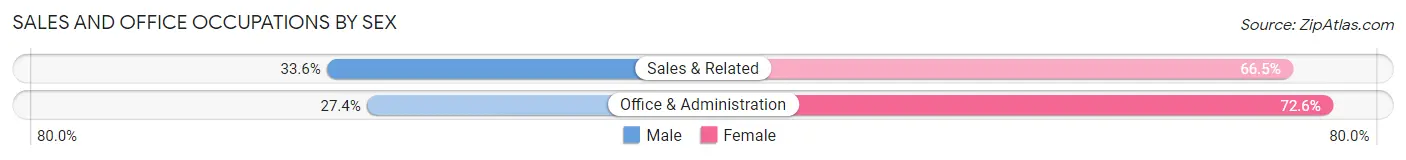
| Occupation | Male | Female |
| Sales & Related | 207 (33.6%) | 410 (66.4%) |
| Office & Administration | 502 (27.4%) | 1,331 (72.6%) |
| Total (Category) | 709 (28.9%) | 1,741 (71.1%) |
| Total (Overall) | 4,835 (49.7%) | 4,890 (50.3%) |
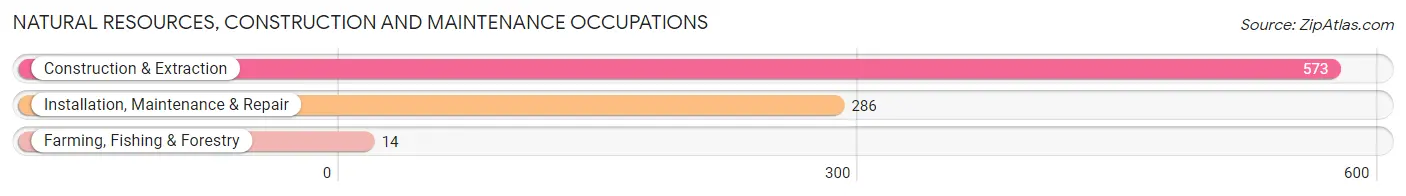
Natural Resources, Construction and Maintenance Occupations
The most common Natural Resources, Construction and Maintenance occupations in Maywood are Construction & Extraction (573 | 5.9%), Installation, Maintenance & Repair (286 | 2.9%), and Farming, Fishing & Forestry (14 | 0.1%).
Natural Resources, Construction and Maintenance Occupations by Sex
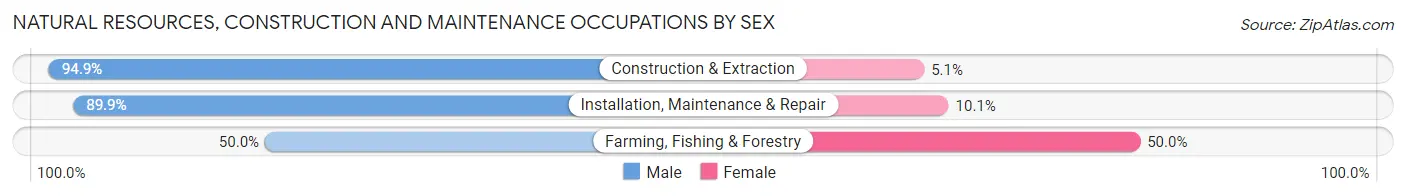
| Occupation | Male | Female |
| Farming, Fishing & Forestry | 7 (50.0%) | 7 (50.0%) |
| Construction & Extraction | 544 (94.9%) | 29 (5.1%) |
| Installation, Maintenance & Repair | 257 (89.9%) | 29 (10.1%) |
| Total (Category) | 808 (92.5%) | 65 (7.4%) |
| Total (Overall) | 4,835 (49.7%) | 4,890 (50.3%) |
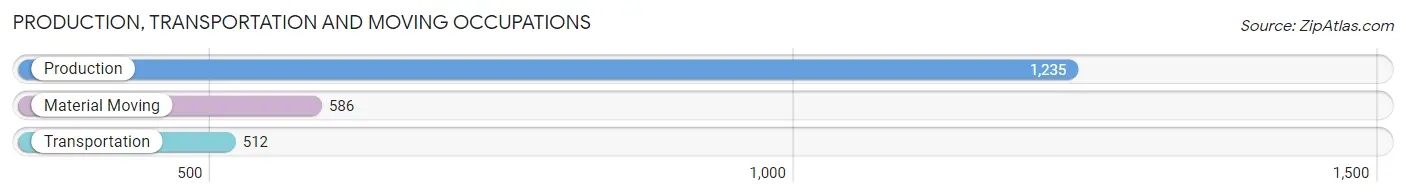
Production, Transportation and Moving Occupations
The most common Production, Transportation and Moving occupations in Maywood are Production (1,235 | 12.7%), Material Moving (586 | 6.0%), and Transportation (512 | 5.3%).
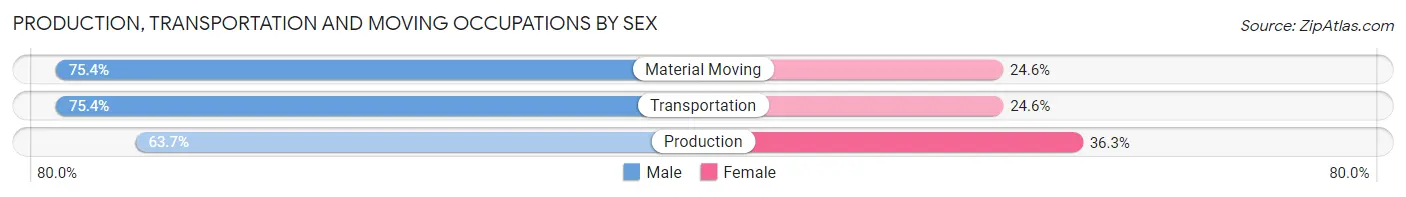
Production, Transportation and Moving Occupations by Sex
| Occupation | Male | Female |
| Production | 787 (63.7%) | 448 (36.3%) |
| Transportation | 386 (75.4%) | 126 (24.6%) |
| Material Moving | 442 (75.4%) | 144 (24.6%) |
| Total (Category) | 1,615 (69.2%) | 718 (30.8%) |
| Total (Overall) | 4,835 (49.7%) | 4,890 (50.3%) |
Employment Industries by Sex in Maywood
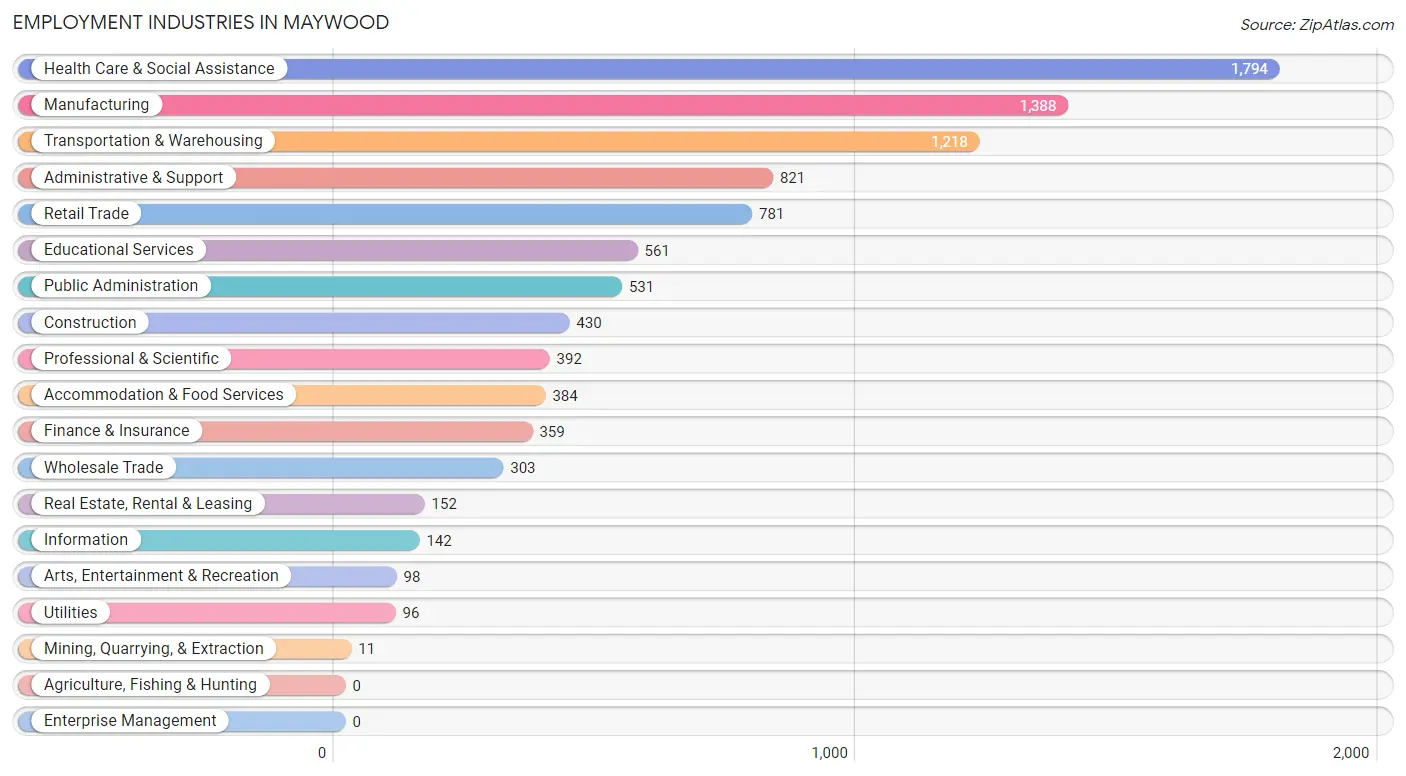
Employment Industries in Maywood
The major employment industries in Maywood include Health Care & Social Assistance (1,794 | 18.4%), Manufacturing (1,388 | 14.3%), Transportation & Warehousing (1,218 | 12.5%), Administrative & Support (821 | 8.4%), and Retail Trade (781 | 8.0%).
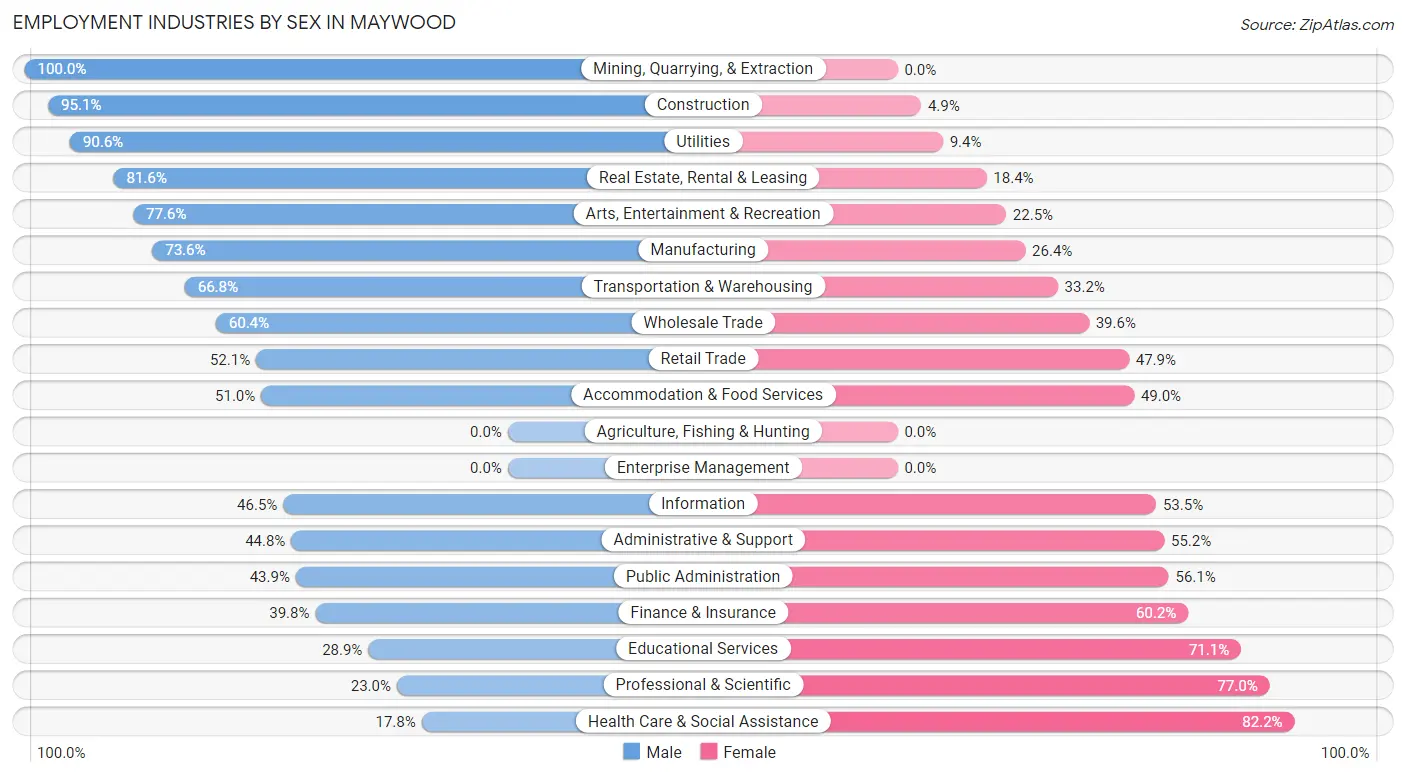
Employment Industries by Sex in Maywood
The Maywood industries that see more men than women are Mining, Quarrying, & Extraction (100.0%), Construction (95.1%), and Utilities (90.6%), whereas the industries that tend to have a higher number of women are Health Care & Social Assistance (82.2%), Professional & Scientific (77.0%), and Educational Services (71.1%).
| Industry | Male | Female |
| Agriculture, Fishing & Hunting | 0 (0.0%) | 0 (0.0%) |
| Mining, Quarrying, & Extraction | 11 (100.0%) | 0 (0.0%) |
| Construction | 409 (95.1%) | 21 (4.9%) |
| Manufacturing | 1,021 (73.6%) | 367 (26.4%) |
| Wholesale Trade | 183 (60.4%) | 120 (39.6%) |
| Retail Trade | 407 (52.1%) | 374 (47.9%) |
| Transportation & Warehousing | 814 (66.8%) | 404 (33.2%) |
| Utilities | 87 (90.6%) | 9 (9.4%) |
| Information | 66 (46.5%) | 76 (53.5%) |
| Finance & Insurance | 143 (39.8%) | 216 (60.2%) |
| Real Estate, Rental & Leasing | 124 (81.6%) | 28 (18.4%) |
| Professional & Scientific | 90 (23.0%) | 302 (77.0%) |
| Enterprise Management | 0 (0.0%) | 0 (0.0%) |
| Administrative & Support | 368 (44.8%) | 453 (55.2%) |
| Educational Services | 162 (28.9%) | 399 (71.1%) |
| Health Care & Social Assistance | 320 (17.8%) | 1,474 (82.2%) |
| Arts, Entertainment & Recreation | 76 (77.5%) | 22 (22.5%) |
| Accommodation & Food Services | 196 (51.0%) | 188 (49.0%) |
| Public Administration | 233 (43.9%) | 298 (56.1%) |
| Total | 4,835 (49.7%) | 4,890 (50.3%) |
Education in Maywood
School Enrollment in Maywood
The most common levels of schooling among the 5,974 students in Maywood are college / undergraduate (1,486 | 24.9%), middle school (1,464 | 24.5%), and elementary school (1,359 | 22.8%).
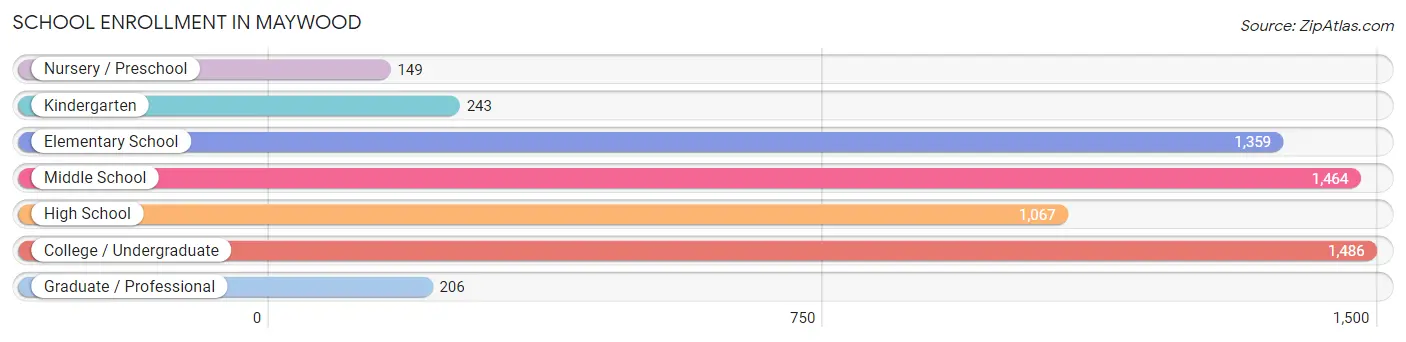
| School Level | # Students | % Students |
| Nursery / Preschool | 149 | 2.5% |
| Kindergarten | 243 | 4.1% |
| Elementary School | 1,359 | 22.8% |
| Middle School | 1,464 | 24.5% |
| High School | 1,067 | 17.9% |
| College / Undergraduate | 1,486 | 24.9% |
| Graduate / Professional | 206 | 3.5% |
| Total | 5,974 | 100.0% |
School Enrollment by Age by Funding Source in Maywood
Out of a total of 5,974 students who are enrolled in schools in Maywood, 860 (14.4%) attend a private institution, while the remaining 5,114 (85.6%) are enrolled in public schools. The age group of 35 years and over has the highest likelihood of being enrolled in private schools, with 199 (62.6% in the age bracket) enrolled. Conversely, the age group of 15 to 17 year olds has the lowest likelihood of being enrolled in a private school, with 647 (94.5% in the age bracket) attending a public institution.
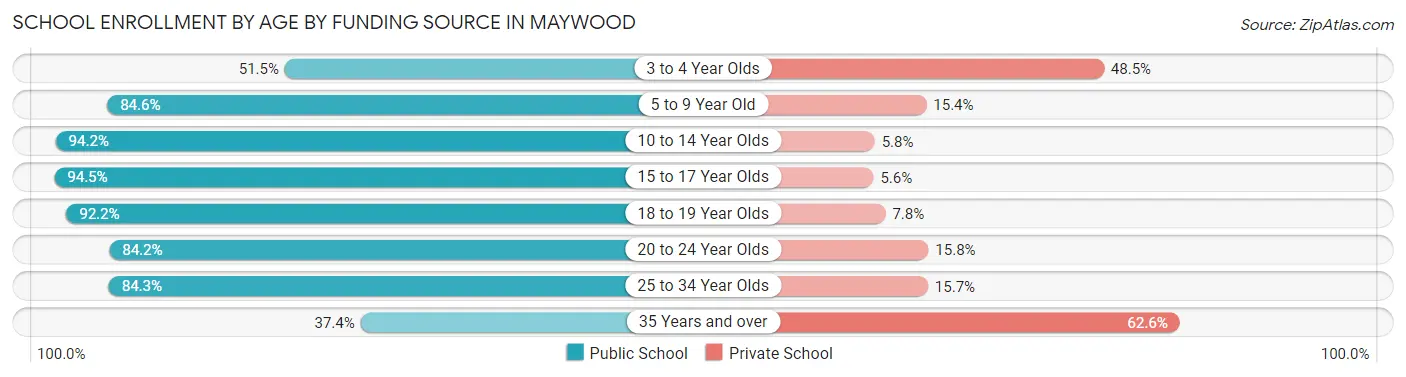
| Age Bracket | Public School | Private School |
| 3 to 4 Year Olds | 84 (51.5%) | 79 (48.5%) |
| 5 to 9 Year Old | 1,285 (84.6%) | 234 (15.4%) |
| 10 to 14 Year Olds | 1,579 (94.2%) | 97 (5.8%) |
| 15 to 17 Year Olds | 647 (94.5%) | 38 (5.6%) |
| 18 to 19 Year Olds | 498 (92.2%) | 42 (7.8%) |
| 20 to 24 Year Olds | 587 (84.2%) | 110 (15.8%) |
| 25 to 34 Year Olds | 317 (84.3%) | 59 (15.7%) |
| 35 Years and over | 119 (37.4%) | 199 (62.6%) |
| Total | 5,114 (85.6%) | 860 (14.4%) |
Educational Attainment by Field of Study in Maywood
Business (573 | 21.8%), education (339 | 12.9%), science & technology (308 | 11.7%), psychology (214 | 8.1%), and arts & humanities (192 | 7.3%) are the most common fields of study among 2,633 individuals in Maywood who have obtained a bachelor's degree or higher.
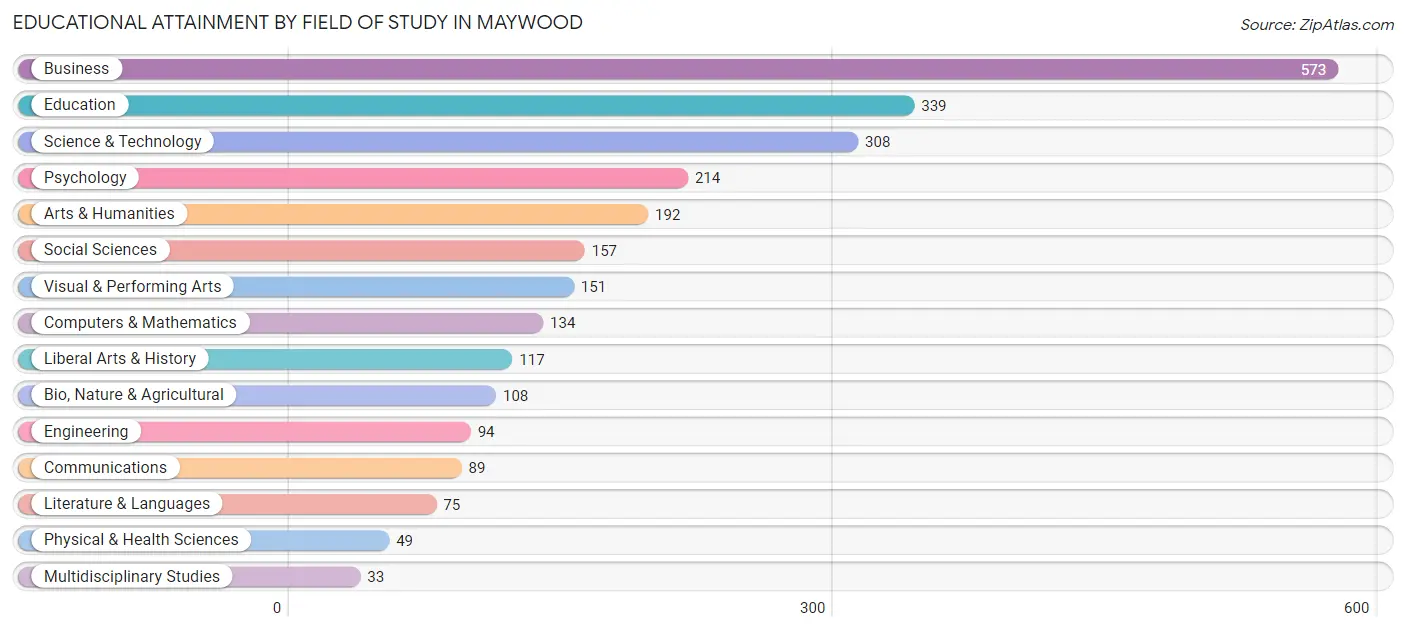
| Field of Study | # Graduates | % Graduates |
| Computers & Mathematics | 134 | 5.1% |
| Bio, Nature & Agricultural | 108 | 4.1% |
| Physical & Health Sciences | 49 | 1.9% |
| Psychology | 214 | 8.1% |
| Social Sciences | 157 | 6.0% |
| Engineering | 94 | 3.6% |
| Multidisciplinary Studies | 33 | 1.3% |
| Science & Technology | 308 | 11.7% |
| Business | 573 | 21.8% |
| Education | 339 | 12.9% |
| Literature & Languages | 75 | 2.9% |
| Liberal Arts & History | 117 | 4.4% |
| Visual & Performing Arts | 151 | 5.7% |
| Communications | 89 | 3.4% |
| Arts & Humanities | 192 | 7.3% |
| Total | 2,633 | 100.0% |
Transportation & Commute in Maywood
Vehicle Availability by Sex in Maywood
The most prevalent vehicle ownership categories in Maywood are males with 2 vehicles (1,842, accounting for 38.7%) and females with 2 vehicles (1,877, making up 38.9%).
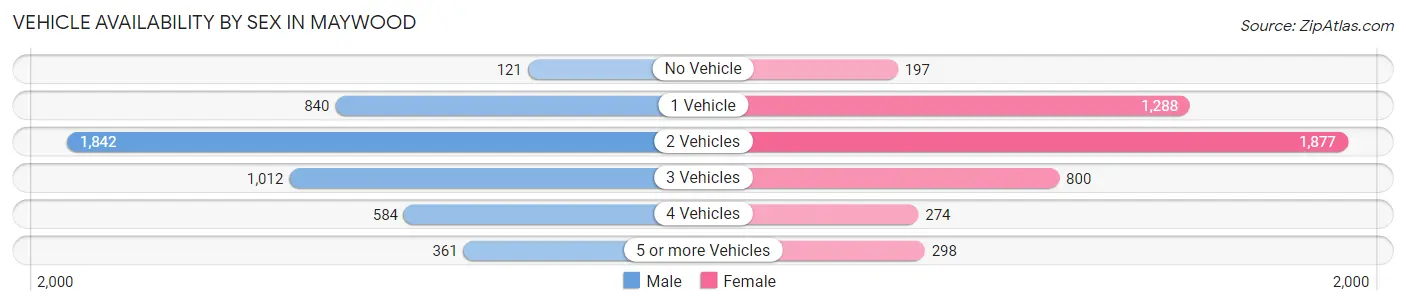
| Vehicles Available | Male | Female |
| No Vehicle | 121 (2.5%) | 197 (4.2%) |
| 1 Vehicle | 840 (17.6%) | 1,288 (27.2%) |
| 2 Vehicles | 1,842 (38.7%) | 1,877 (39.7%) |
| 3 Vehicles | 1,012 (21.3%) | 800 (16.9%) |
| 4 Vehicles | 584 (12.3%) | 274 (5.8%) |
| 5 or more Vehicles | 361 (7.6%) | 298 (6.3%) |
| Total | 4,760 (100.0%) | 4,734 (100.0%) |
Commute Time in Maywood
The most frequently occuring commute durations in Maywood are 30 to 34 minutes (1,822 commuters, 21.0%), 20 to 24 minutes (1,142 commuters, 13.2%), and 45 to 59 minutes (967 commuters, 11.1%).
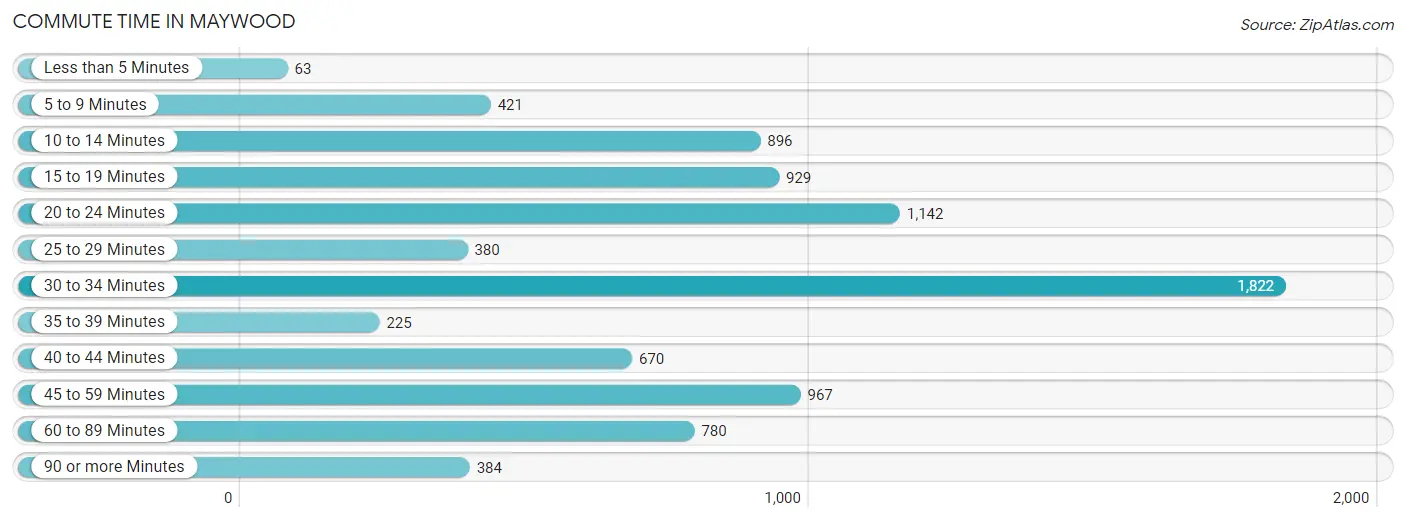
| Commute Time | # Commuters | % Commuters |
| Less than 5 Minutes | 63 | 0.7% |
| 5 to 9 Minutes | 421 | 4.9% |
| 10 to 14 Minutes | 896 | 10.3% |
| 15 to 19 Minutes | 929 | 10.7% |
| 20 to 24 Minutes | 1,142 | 13.2% |
| 25 to 29 Minutes | 380 | 4.4% |
| 30 to 34 Minutes | 1,822 | 21.0% |
| 35 to 39 Minutes | 225 | 2.6% |
| 40 to 44 Minutes | 670 | 7.7% |
| 45 to 59 Minutes | 967 | 11.1% |
| 60 to 89 Minutes | 780 | 9.0% |
| 90 or more Minutes | 384 | 4.4% |
Commute Time by Sex in Maywood
The most common commute times in Maywood are 30 to 34 minutes (974 commuters, 22.5%) for males and 30 to 34 minutes (848 commuters, 19.5%) for females.
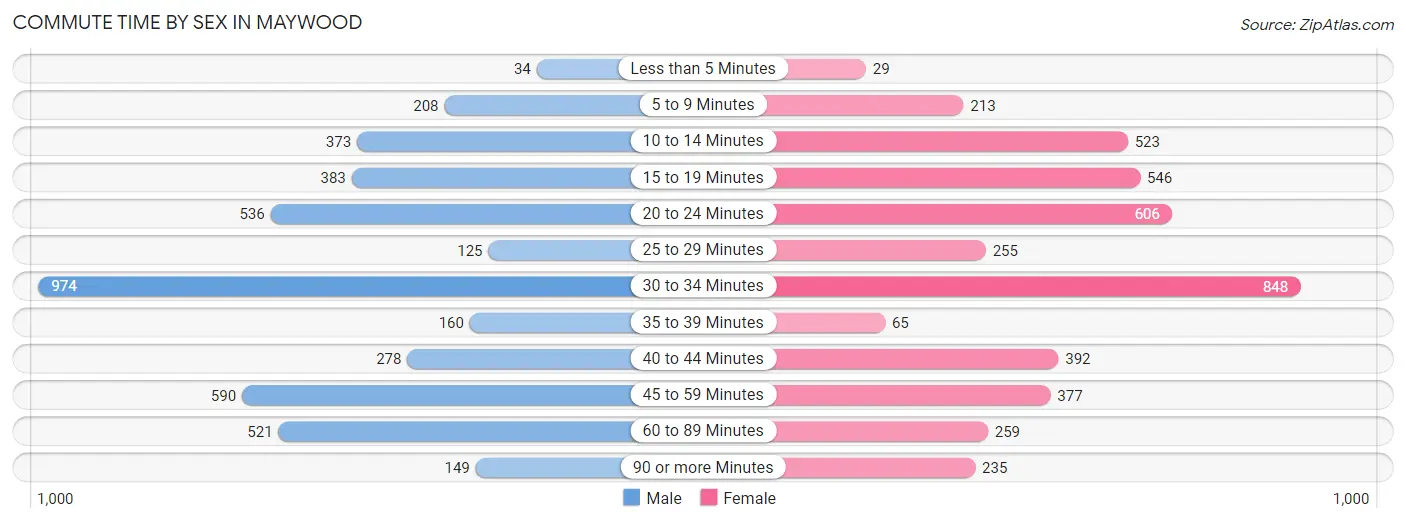
| Commute Time | Male | Female |
| Less than 5 Minutes | 34 (0.8%) | 29 (0.7%) |
| 5 to 9 Minutes | 208 (4.8%) | 213 (4.9%) |
| 10 to 14 Minutes | 373 (8.6%) | 523 (12.0%) |
| 15 to 19 Minutes | 383 (8.8%) | 546 (12.6%) |
| 20 to 24 Minutes | 536 (12.4%) | 606 (13.9%) |
| 25 to 29 Minutes | 125 (2.9%) | 255 (5.9%) |
| 30 to 34 Minutes | 974 (22.5%) | 848 (19.5%) |
| 35 to 39 Minutes | 160 (3.7%) | 65 (1.5%) |
| 40 to 44 Minutes | 278 (6.4%) | 392 (9.0%) |
| 45 to 59 Minutes | 590 (13.6%) | 377 (8.7%) |
| 60 to 89 Minutes | 521 (12.0%) | 259 (6.0%) |
| 90 or more Minutes | 149 (3.4%) | 235 (5.4%) |
Time of Departure to Work by Sex in Maywood
The most frequent times of departure to work in Maywood are 7:00 AM to 7:29 AM (555, 12.8%) for males and 7:00 AM to 7:29 AM (873, 20.1%) for females.
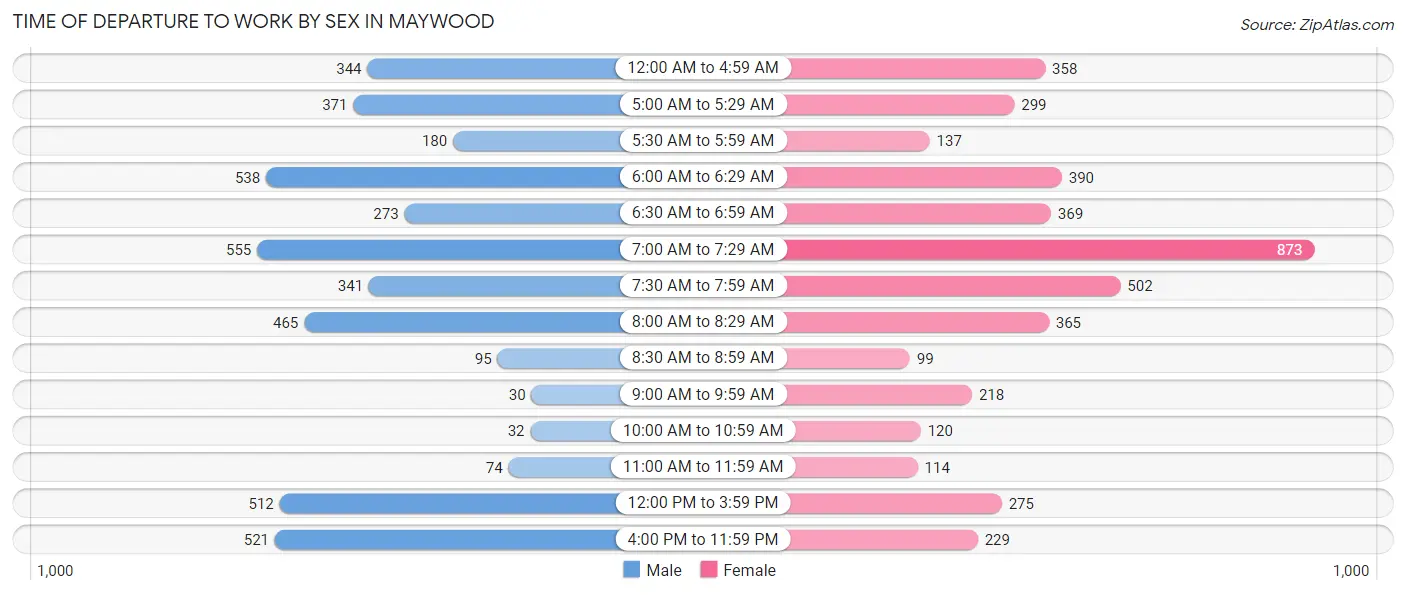
| Time of Departure | Male | Female |
| 12:00 AM to 4:59 AM | 344 (7.9%) | 358 (8.2%) |
| 5:00 AM to 5:29 AM | 371 (8.6%) | 299 (6.9%) |
| 5:30 AM to 5:59 AM | 180 (4.2%) | 137 (3.2%) |
| 6:00 AM to 6:29 AM | 538 (12.4%) | 390 (9.0%) |
| 6:30 AM to 6:59 AM | 273 (6.3%) | 369 (8.5%) |
| 7:00 AM to 7:29 AM | 555 (12.8%) | 873 (20.1%) |
| 7:30 AM to 7:59 AM | 341 (7.9%) | 502 (11.6%) |
| 8:00 AM to 8:29 AM | 465 (10.7%) | 365 (8.4%) |
| 8:30 AM to 8:59 AM | 95 (2.2%) | 99 (2.3%) |
| 9:00 AM to 9:59 AM | 30 (0.7%) | 218 (5.0%) |
| 10:00 AM to 10:59 AM | 32 (0.7%) | 120 (2.8%) |
| 11:00 AM to 11:59 AM | 74 (1.7%) | 114 (2.6%) |
| 12:00 PM to 3:59 PM | 512 (11.8%) | 275 (6.3%) |
| 4:00 PM to 11:59 PM | 521 (12.0%) | 229 (5.3%) |
| Total | 4,331 (100.0%) | 4,348 (100.0%) |
Housing Occupancy in Maywood
Occupancy by Ownership in Maywood
Of the total 7,672 dwellings in Maywood, owner-occupied units account for 4,779 (62.3%), while renter-occupied units make up 2,893 (37.7%).
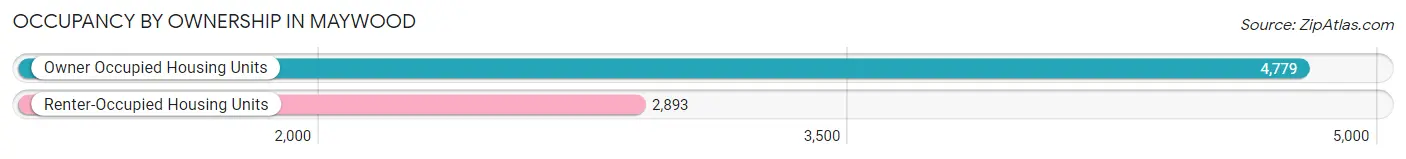
| Occupancy | # Housing Units | % Housing Units |
| Owner Occupied Housing Units | 4,779 | 62.3% |
| Renter-Occupied Housing Units | 2,893 | 37.7% |
| Total Occupied Housing Units | 7,672 | 100.0% |
Occupancy by Household Size in Maywood
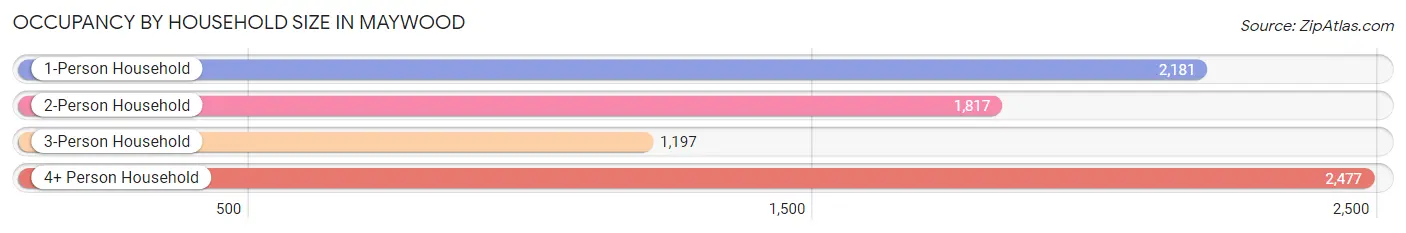
| Household Size | # Housing Units | % Housing Units |
| 1-Person Household | 2,181 | 28.4% |
| 2-Person Household | 1,817 | 23.7% |
| 3-Person Household | 1,197 | 15.6% |
| 4+ Person Household | 2,477 | 32.3% |
| Total Housing Units | 7,672 | 100.0% |
Occupancy by Ownership by Household Size in Maywood
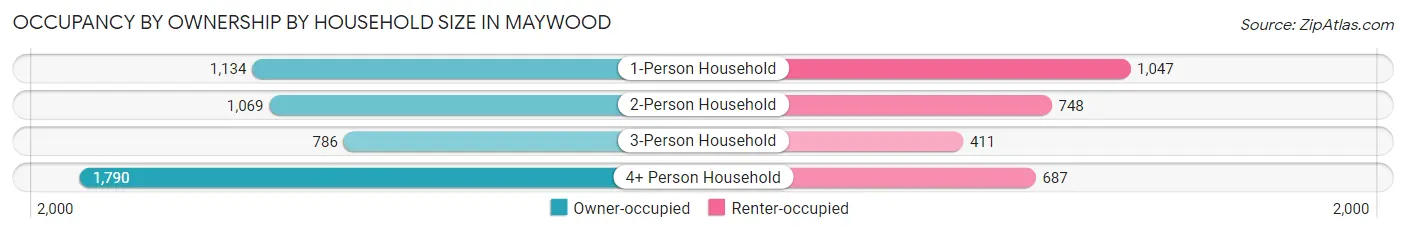
| Household Size | Owner-occupied | Renter-occupied |
| 1-Person Household | 1,134 (52.0%) | 1,047 (48.0%) |
| 2-Person Household | 1,069 (58.8%) | 748 (41.2%) |
| 3-Person Household | 786 (65.7%) | 411 (34.3%) |
| 4+ Person Household | 1,790 (72.3%) | 687 (27.7%) |
| Total Housing Units | 4,779 (62.3%) | 2,893 (37.7%) |
Occupancy by Educational Attainment in Maywood
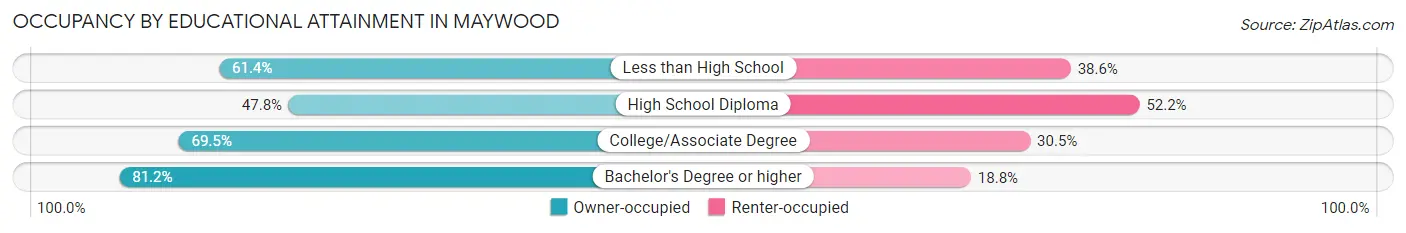
| Household Size | Owner-occupied | Renter-occupied |
| Less than High School | 962 (61.4%) | 604 (38.6%) |
| High School Diploma | 1,238 (47.8%) | 1,352 (52.2%) |
| College/Associate Degree | 1,636 (69.5%) | 719 (30.5%) |
| Bachelor's Degree or higher | 943 (81.2%) | 218 (18.8%) |
Occupancy by Age of Householder in Maywood
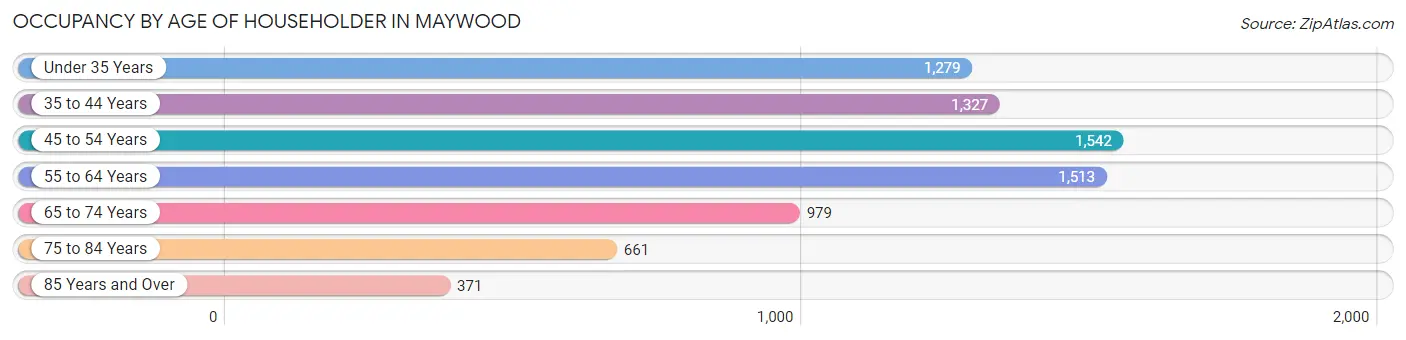
| Age Bracket | # Households | % Households |
| Under 35 Years | 1,279 | 16.7% |
| 35 to 44 Years | 1,327 | 17.3% |
| 45 to 54 Years | 1,542 | 20.1% |
| 55 to 64 Years | 1,513 | 19.7% |
| 65 to 74 Years | 979 | 12.8% |
| 75 to 84 Years | 661 | 8.6% |
| 85 Years and Over | 371 | 4.8% |
| Total | 7,672 | 100.0% |
Housing Finances in Maywood
Median Income by Occupancy in Maywood
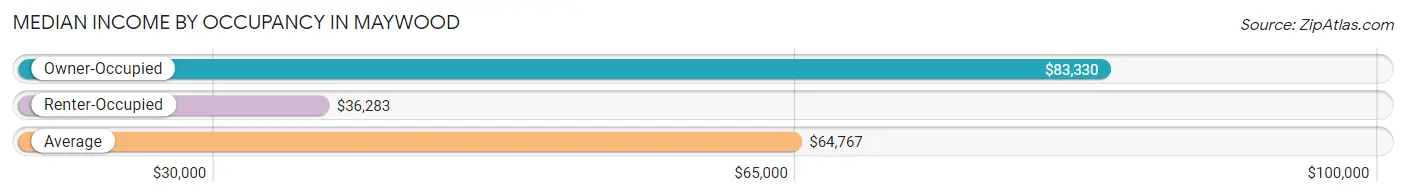
| Occupancy Type | # Households | Median Income |
| Owner-Occupied | 4,779 (62.3%) | $83,330 |
| Renter-Occupied | 2,893 (37.7%) | $36,283 |
| Average | 7,672 (100.0%) | $64,767 |
Occupancy by Householder Income Bracket in Maywood
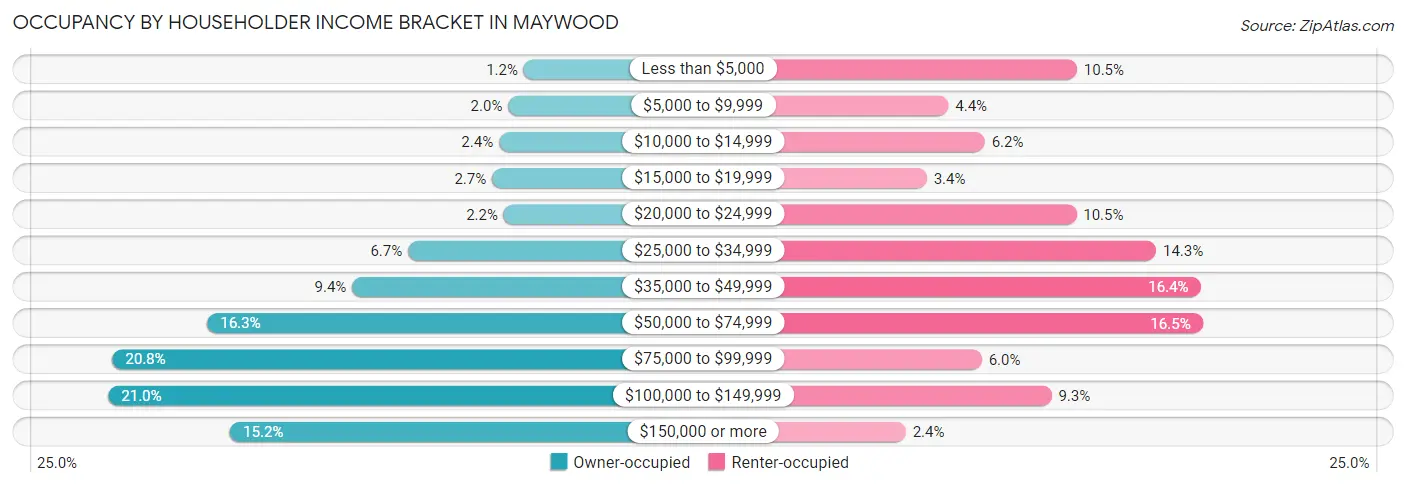
| Income Bracket | Owner-occupied | Renter-occupied |
| Less than $5,000 | 59 (1.2%) | 305 (10.5%) |
| $5,000 to $9,999 | 94 (2.0%) | 128 (4.4%) |
| $10,000 to $14,999 | 115 (2.4%) | 178 (6.1%) |
| $15,000 to $19,999 | 131 (2.7%) | 98 (3.4%) |
| $20,000 to $24,999 | 104 (2.2%) | 304 (10.5%) |
| $25,000 to $34,999 | 322 (6.7%) | 414 (14.3%) |
| $35,000 to $49,999 | 449 (9.4%) | 475 (16.4%) |
| $50,000 to $74,999 | 779 (16.3%) | 478 (16.5%) |
| $75,000 to $99,999 | 995 (20.8%) | 174 (6.0%) |
| $100,000 to $149,999 | 1,004 (21.0%) | 270 (9.3%) |
| $150,000 or more | 727 (15.2%) | 69 (2.4%) |
| Total | 4,779 (100.0%) | 2,893 (100.0%) |
Monthly Housing Cost Tiers in Maywood
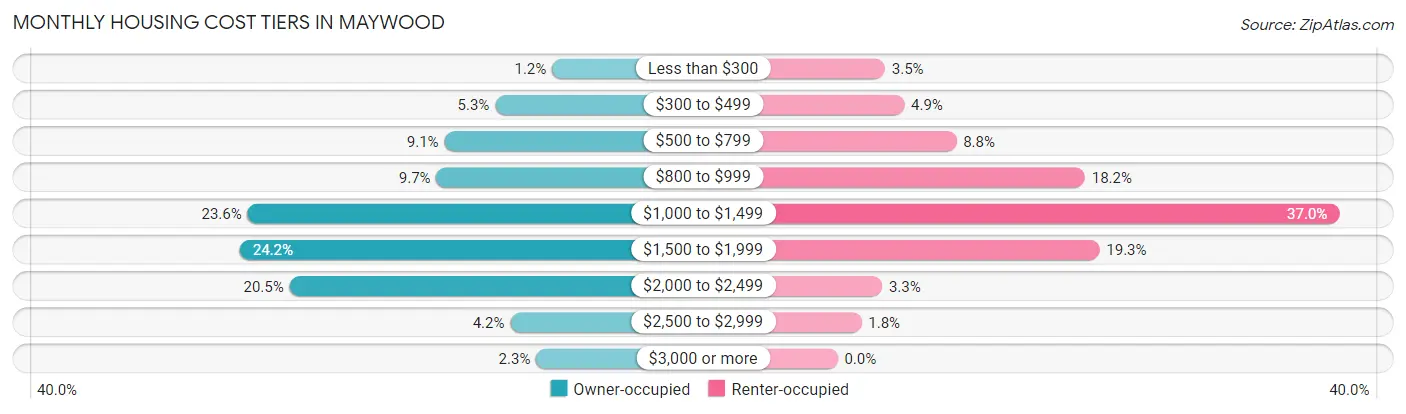
| Monthly Cost | Owner-occupied | Renter-occupied |
| Less than $300 | 55 (1.1%) | 101 (3.5%) |
| $300 to $499 | 255 (5.3%) | 142 (4.9%) |
| $500 to $799 | 434 (9.1%) | 253 (8.7%) |
| $800 to $999 | 462 (9.7%) | 527 (18.2%) |
| $1,000 to $1,499 | 1,127 (23.6%) | 1,069 (36.9%) |
| $1,500 to $1,999 | 1,154 (24.1%) | 558 (19.3%) |
| $2,000 to $2,499 | 979 (20.5%) | 95 (3.3%) |
| $2,500 to $2,999 | 202 (4.2%) | 51 (1.8%) |
| $3,000 or more | 111 (2.3%) | 0 (0.0%) |
| Total | 4,779 (100.0%) | 2,893 (100.0%) |
Physical Housing Characteristics in Maywood
Housing Structures in Maywood
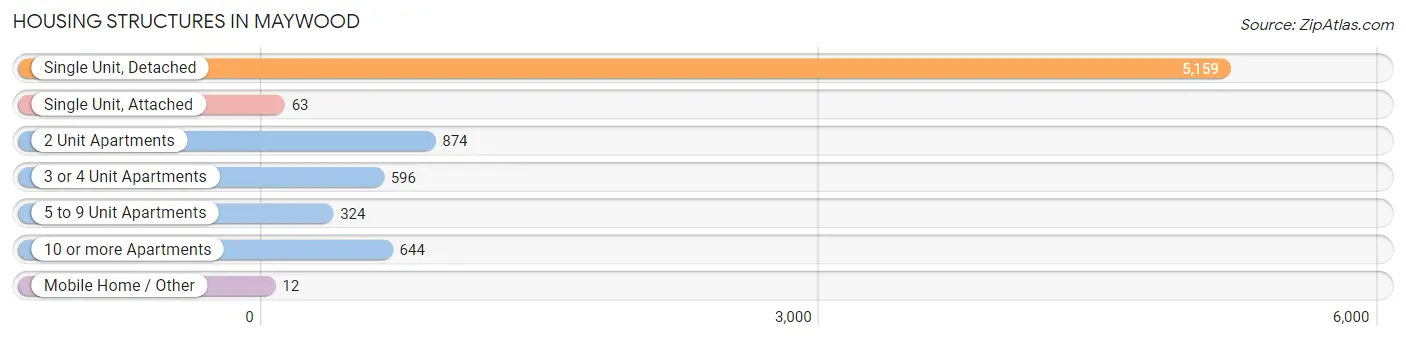
| Structure Type | # Housing Units | % Housing Units |
| Single Unit, Detached | 5,159 | 67.2% |
| Single Unit, Attached | 63 | 0.8% |
| 2 Unit Apartments | 874 | 11.4% |
| 3 or 4 Unit Apartments | 596 | 7.8% |
| 5 to 9 Unit Apartments | 324 | 4.2% |
| 10 or more Apartments | 644 | 8.4% |
| Mobile Home / Other | 12 | 0.2% |
| Total | 7,672 | 100.0% |
Housing Structures by Occupancy in Maywood
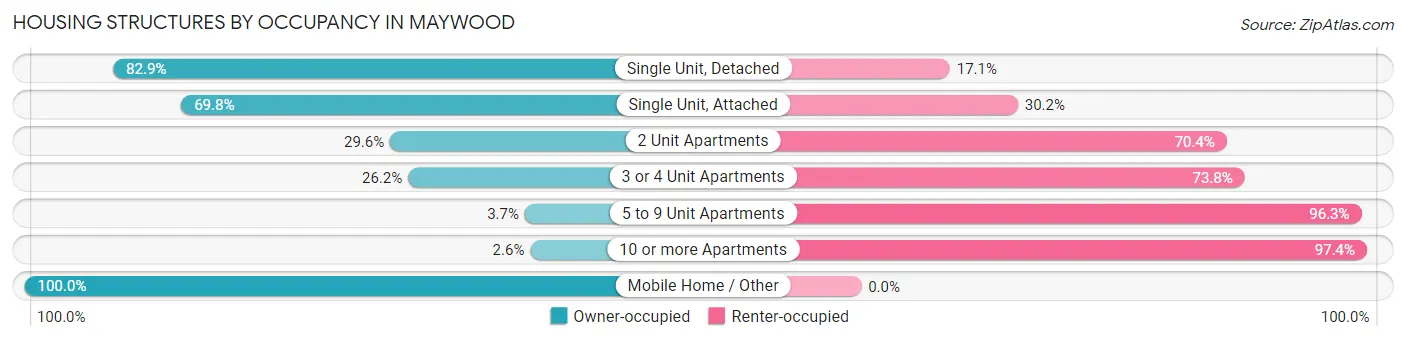
| Structure Type | Owner-occupied | Renter-occupied |
| Single Unit, Detached | 4,279 (82.9%) | 880 (17.1%) |
| Single Unit, Attached | 44 (69.8%) | 19 (30.2%) |
| 2 Unit Apartments | 259 (29.6%) | 615 (70.4%) |
| 3 or 4 Unit Apartments | 156 (26.2%) | 440 (73.8%) |
| 5 to 9 Unit Apartments | 12 (3.7%) | 312 (96.3%) |
| 10 or more Apartments | 17 (2.6%) | 627 (97.4%) |
| Mobile Home / Other | 12 (100.0%) | 0 (0.0%) |
| Total | 4,779 (62.3%) | 2,893 (37.7%) |
Housing Structures by Number of Rooms in Maywood
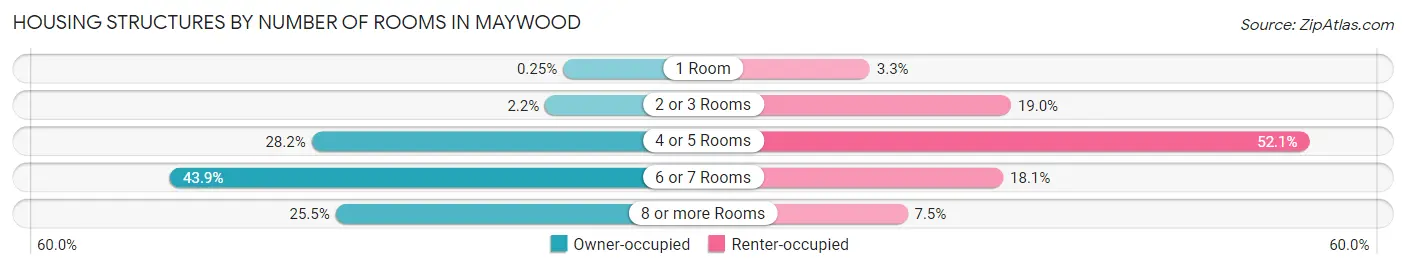
| Number of Rooms | Owner-occupied | Renter-occupied |
| 1 Room | 12 (0.3%) | 96 (3.3%) |
| 2 or 3 Rooms | 107 (2.2%) | 549 (19.0%) |
| 4 or 5 Rooms | 1,346 (28.2%) | 1,507 (52.1%) |
| 6 or 7 Rooms | 2,096 (43.9%) | 524 (18.1%) |
| 8 or more Rooms | 1,218 (25.5%) | 217 (7.5%) |
| Total | 4,779 (100.0%) | 2,893 (100.0%) |
Housing Structure by Heating Type in Maywood
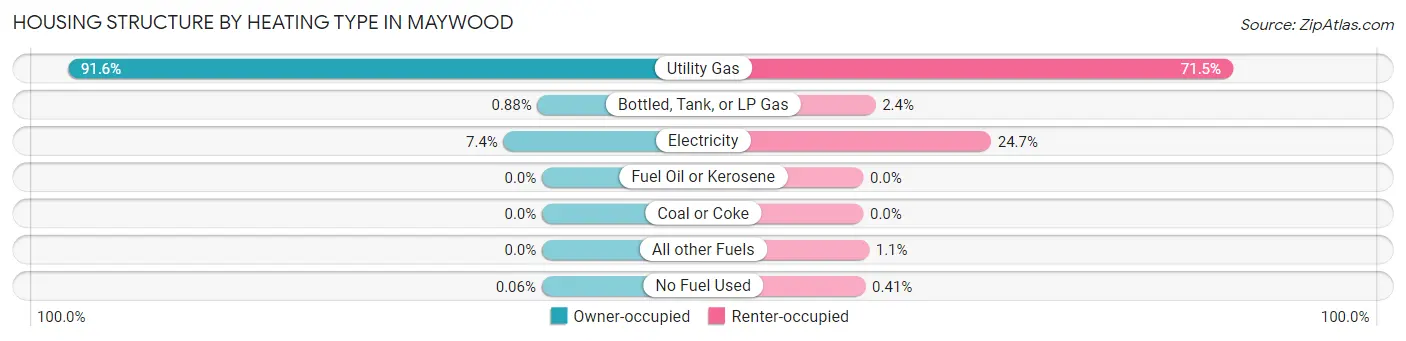
| Heating Type | Owner-occupied | Renter-occupied |
| Utility Gas | 4,379 (91.6%) | 2,067 (71.5%) |
| Bottled, Tank, or LP Gas | 42 (0.9%) | 68 (2.4%) |
| Electricity | 355 (7.4%) | 714 (24.7%) |
| Fuel Oil or Kerosene | 0 (0.0%) | 0 (0.0%) |
| Coal or Coke | 0 (0.0%) | 0 (0.0%) |
| All other Fuels | 0 (0.0%) | 32 (1.1%) |
| No Fuel Used | 3 (0.1%) | 12 (0.4%) |
| Total | 4,779 (100.0%) | 2,893 (100.0%) |
Household Vehicle Usage in Maywood
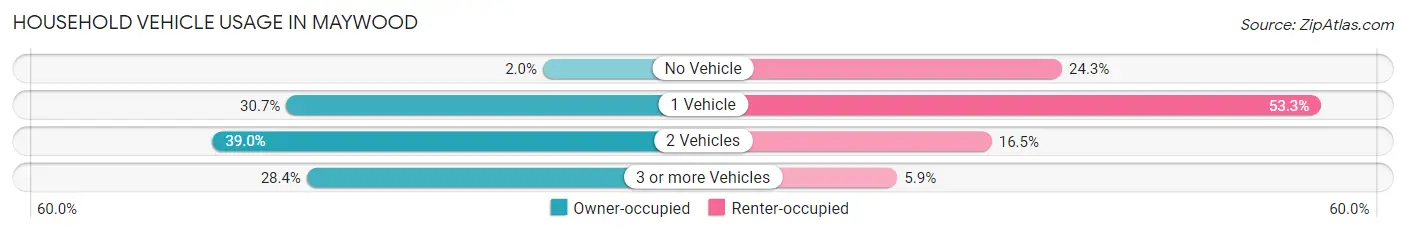
| Vehicles per Household | Owner-occupied | Renter-occupied |
| No Vehicle | 93 (1.9%) | 704 (24.3%) |
| 1 Vehicle | 1,467 (30.7%) | 1,543 (53.3%) |
| 2 Vehicles | 1,862 (39.0%) | 476 (16.5%) |
| 3 or more Vehicles | 1,357 (28.4%) | 170 (5.9%) |
| Total | 4,779 (100.0%) | 2,893 (100.0%) |
Real Estate & Mortgages in Maywood
Real Estate and Mortgage Overview in Maywood
| Characteristic | Without Mortgage | With Mortgage |
| Housing Units | 1,582 | 3,197 |
| Median Property Value | $200,500 | $193,500 |
| Median Household Income | $76,579 | $599 |
| Monthly Housing Costs | $877 | $111 |
| Real Estate Taxes | $5,812 | $28 |
Property Value by Mortgage Status in Maywood
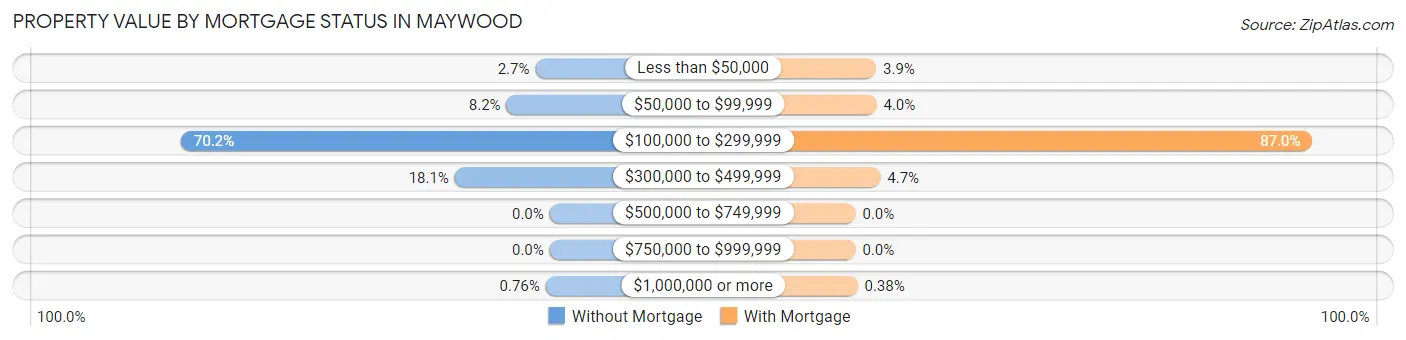
| Property Value | Without Mortgage | With Mortgage |
| Less than $50,000 | 43 (2.7%) | 125 (3.9%) |
| $50,000 to $99,999 | 130 (8.2%) | 128 (4.0%) |
| $100,000 to $299,999 | 1,111 (70.2%) | 2,781 (87.0%) |
| $300,000 to $499,999 | 286 (18.1%) | 151 (4.7%) |
| $500,000 to $749,999 | 0 (0.0%) | 0 (0.0%) |
| $750,000 to $999,999 | 0 (0.0%) | 0 (0.0%) |
| $1,000,000 or more | 12 (0.8%) | 12 (0.4%) |
| Total | 1,582 (100.0%) | 3,197 (100.0%) |
Household Income by Mortgage Status in Maywood
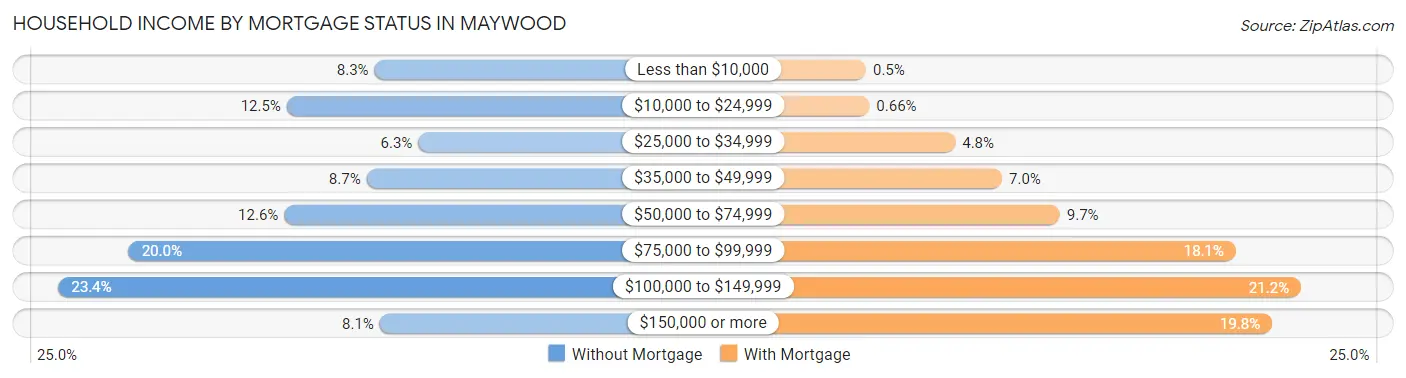
| Household Income | Without Mortgage | With Mortgage |
| Less than $10,000 | 132 (8.3%) | 16 (0.5%) |
| $10,000 to $24,999 | 198 (12.5%) | 21 (0.7%) |
| $25,000 to $34,999 | 99 (6.3%) | 152 (4.8%) |
| $35,000 to $49,999 | 138 (8.7%) | 223 (7.0%) |
| $50,000 to $74,999 | 200 (12.6%) | 311 (9.7%) |
| $75,000 to $99,999 | 317 (20.0%) | 579 (18.1%) |
| $100,000 to $149,999 | 370 (23.4%) | 678 (21.2%) |
| $150,000 or more | 128 (8.1%) | 634 (19.8%) |
| Total | 1,582 (100.0%) | 3,197 (100.0%) |
Property Value to Household Income Ratio in Maywood
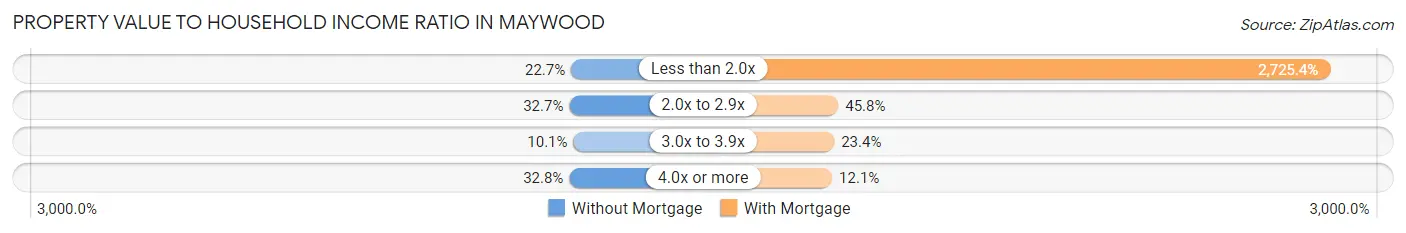
| Value-to-Income Ratio | Without Mortgage | With Mortgage |
| Less than 2.0x | 359 (22.7%) | 87,132 (2,725.4%) |
| 2.0x to 2.9x | 517 (32.7%) | 1,464 (45.8%) |
| 3.0x to 3.9x | 160 (10.1%) | 749 (23.4%) |
| 4.0x or more | 519 (32.8%) | 388 (12.1%) |
| Total | 1,582 (100.0%) | 3,197 (100.0%) |
Real Estate Taxes by Mortgage Status in Maywood
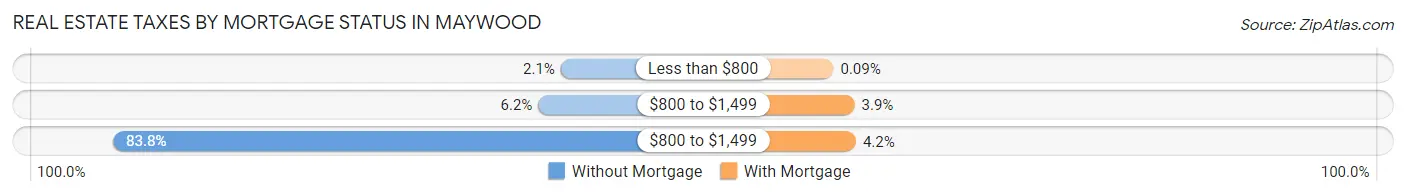
| Property Taxes | Without Mortgage | With Mortgage |
| Less than $800 | 33 (2.1%) | 3 (0.1%) |
| $800 to $1,499 | 98 (6.2%) | 126 (3.9%) |
| $800 to $1,499 | 1,326 (83.8%) | 134 (4.2%) |
| Total | 1,582 (100.0%) | 3,197 (100.0%) |
Health & Disability in Maywood
Health Insurance Coverage by Age in Maywood
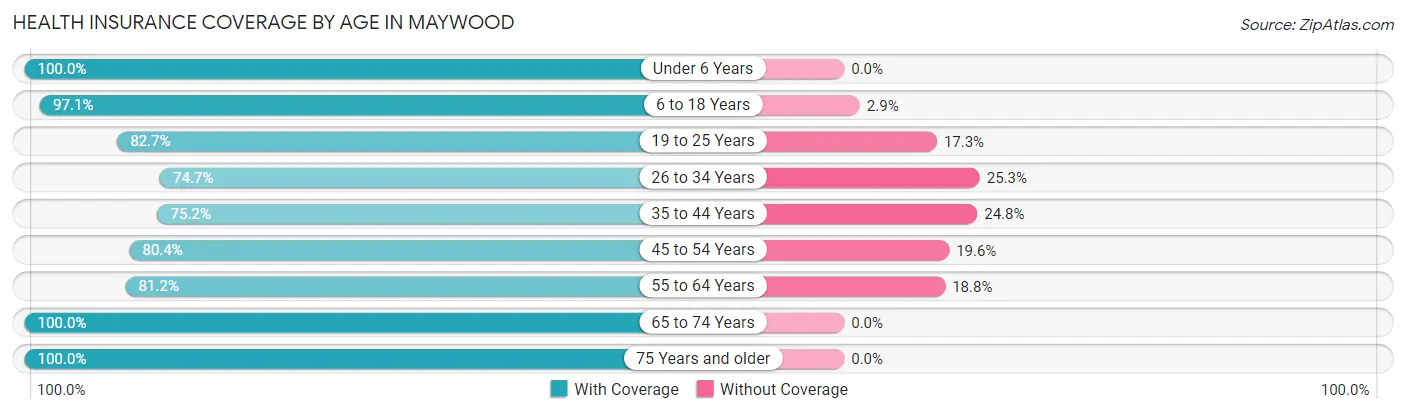
| Age Bracket | With Coverage | Without Coverage |
| Under 6 Years | 1,447 (100.0%) | 0 (0.0%) |
| 6 to 18 Years | 4,137 (97.1%) | 124 (2.9%) |
| 19 to 25 Years | 2,096 (82.7%) | 438 (17.3%) |
| 26 to 34 Years | 2,243 (74.7%) | 759 (25.3%) |
| 35 to 44 Years | 2,067 (75.2%) | 682 (24.8%) |
| 45 to 54 Years | 2,752 (80.4%) | 669 (19.6%) |
| 55 to 64 Years | 2,394 (81.2%) | 555 (18.8%) |
| 65 to 74 Years | 1,567 (100.0%) | 0 (0.0%) |
| 75 Years and older | 1,433 (100.0%) | 0 (0.0%) |
| Total | 20,136 (86.2%) | 3,227 (13.8%) |
Health Insurance Coverage by Citizenship Status in Maywood
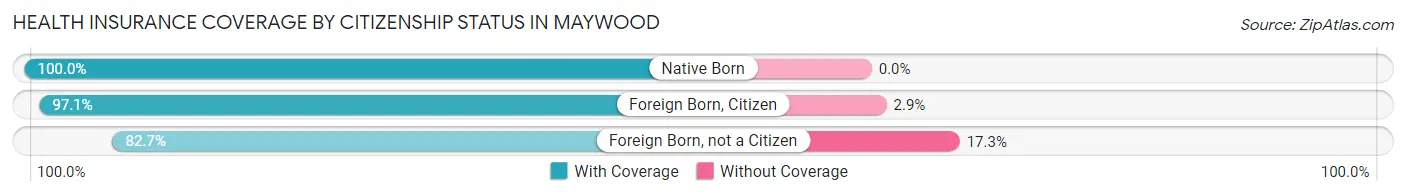
| Citizenship Status | With Coverage | Without Coverage |
| Native Born | 1,447 (100.0%) | 0 (0.0%) |
| Foreign Born, Citizen | 4,137 (97.1%) | 124 (2.9%) |
| Foreign Born, not a Citizen | 2,096 (82.7%) | 438 (17.3%) |
Health Insurance Coverage by Household Income in Maywood
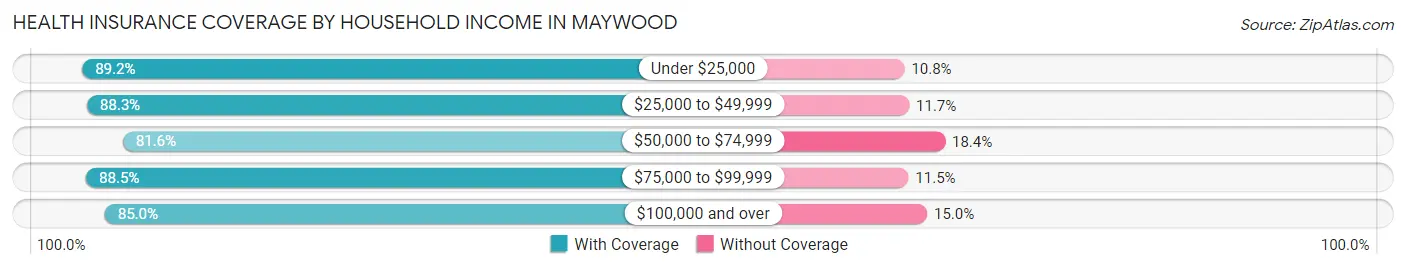
| Household Income | With Coverage | Without Coverage |
| Under $25,000 | 2,683 (89.2%) | 325 (10.8%) |
| $25,000 to $49,999 | 3,804 (88.3%) | 503 (11.7%) |
| $50,000 to $74,999 | 2,940 (81.6%) | 663 (18.4%) |
| $75,000 to $99,999 | 2,989 (88.5%) | 390 (11.5%) |
| $100,000 and over | 7,600 (85.0%) | 1,344 (15.0%) |
Public vs Private Health Insurance Coverage by Age in Maywood
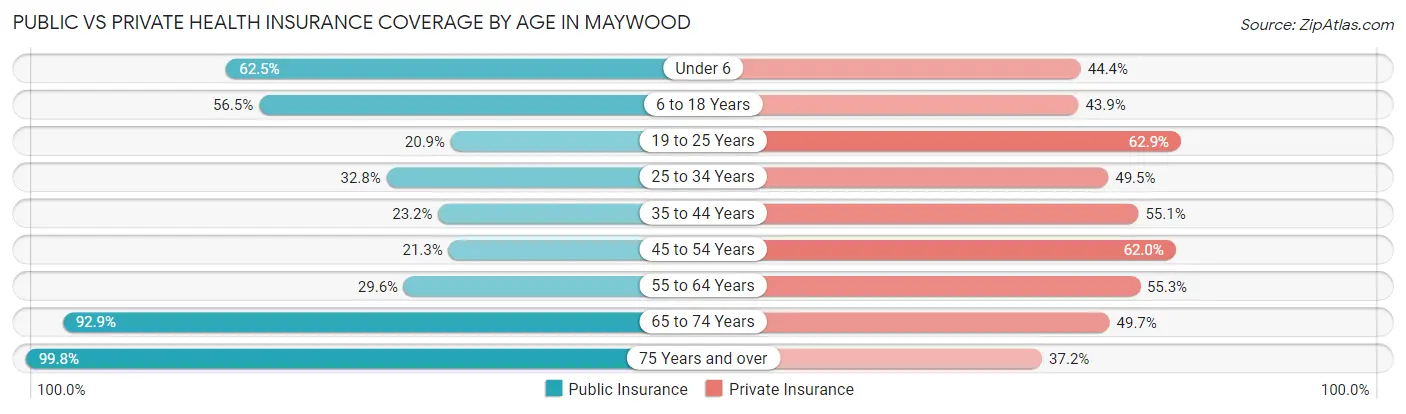
| Age Bracket | Public Insurance | Private Insurance |
| Under 6 | 905 (62.5%) | 642 (44.4%) |
| 6 to 18 Years | 2,407 (56.5%) | 1,872 (43.9%) |
| 19 to 25 Years | 529 (20.9%) | 1,595 (62.9%) |
| 25 to 34 Years | 985 (32.8%) | 1,485 (49.5%) |
| 35 to 44 Years | 638 (23.2%) | 1,514 (55.1%) |
| 45 to 54 Years | 729 (21.3%) | 2,120 (62.0%) |
| 55 to 64 Years | 873 (29.6%) | 1,632 (55.3%) |
| 65 to 74 Years | 1,456 (92.9%) | 779 (49.7%) |
| 75 Years and over | 1,430 (99.8%) | 533 (37.2%) |
| Total | 9,952 (42.6%) | 12,172 (52.1%) |
Disability Status by Sex by Age in Maywood
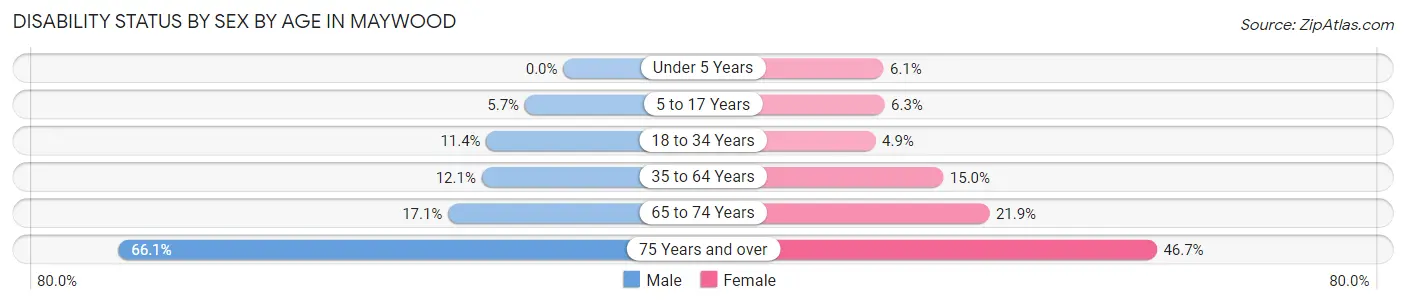
| Age Bracket | Male | Female |
| Under 5 Years | 0 (0.0%) | 26 (6.1%) |
| 5 to 17 Years | 123 (5.7%) | 119 (6.3%) |
| 18 to 34 Years | 316 (11.4%) | 155 (4.9%) |
| 35 to 64 Years | 536 (12.1%) | 705 (15.0%) |
| 65 to 74 Years | 124 (17.1%) | 184 (21.8%) |
| 75 Years and over | 333 (66.1%) | 434 (46.7%) |
Disability Class by Sex by Age in Maywood
Disability Class: Hearing Difficulty
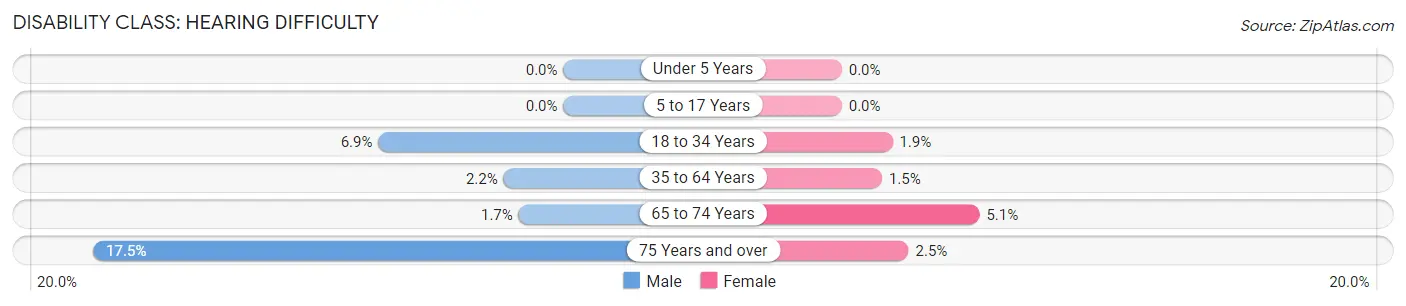
| Age Bracket | Male | Female |
| Under 5 Years | 0 (0.0%) | 0 (0.0%) |
| 5 to 17 Years | 0 (0.0%) | 0 (0.0%) |
| 18 to 34 Years | 190 (6.9%) | 59 (1.9%) |
| 35 to 64 Years | 98 (2.2%) | 70 (1.5%) |
| 65 to 74 Years | 12 (1.7%) | 43 (5.1%) |
| 75 Years and over | 88 (17.5%) | 23 (2.5%) |
Disability Class: Vision Difficulty
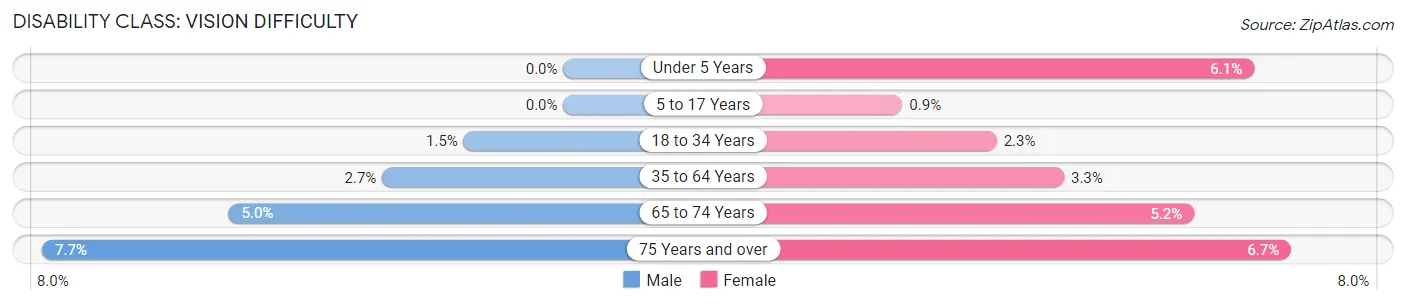
| Age Bracket | Male | Female |
| Under 5 Years | 0 (0.0%) | 26 (6.1%) |
| 5 to 17 Years | 0 (0.0%) | 17 (0.9%) |
| 18 to 34 Years | 41 (1.5%) | 72 (2.3%) |
| 35 to 64 Years | 119 (2.7%) | 155 (3.3%) |
| 65 to 74 Years | 36 (5.0%) | 44 (5.2%) |
| 75 Years and over | 39 (7.7%) | 62 (6.7%) |
Disability Class: Cognitive Difficulty
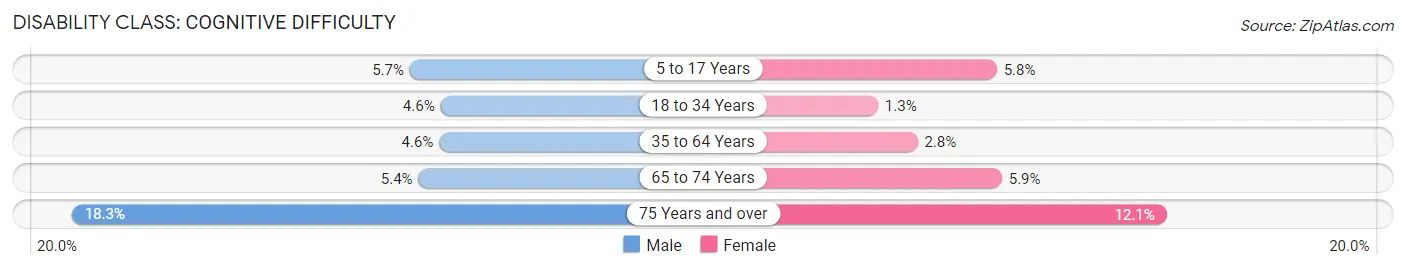
| Age Bracket | Male | Female |
| 5 to 17 Years | 123 (5.7%) | 109 (5.8%) |
| 18 to 34 Years | 126 (4.6%) | 42 (1.3%) |
| 35 to 64 Years | 204 (4.6%) | 132 (2.8%) |
| 65 to 74 Years | 39 (5.4%) | 50 (5.9%) |
| 75 Years and over | 92 (18.2%) | 112 (12.1%) |
Disability Class: Ambulatory Difficulty
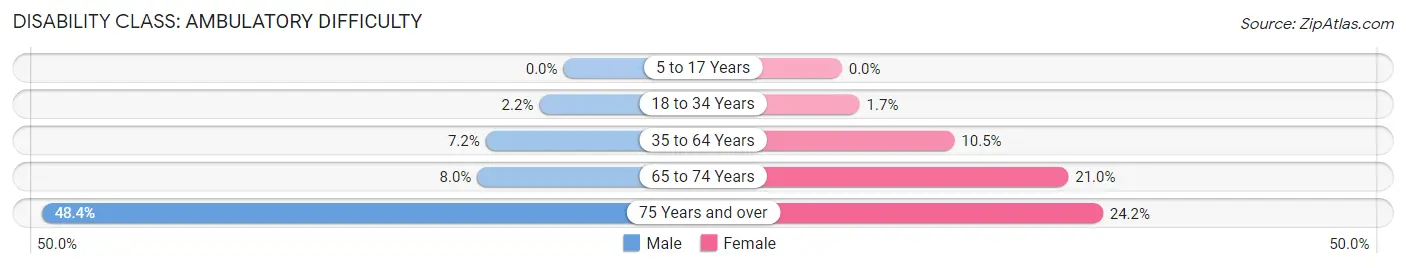
| Age Bracket | Male | Female |
| 5 to 17 Years | 0 (0.0%) | 0 (0.0%) |
| 18 to 34 Years | 62 (2.2%) | 52 (1.7%) |
| 35 to 64 Years | 319 (7.2%) | 491 (10.4%) |
| 65 to 74 Years | 58 (8.0%) | 177 (21.0%) |
| 75 Years and over | 244 (48.4%) | 225 (24.2%) |
Disability Class: Self-Care Difficulty
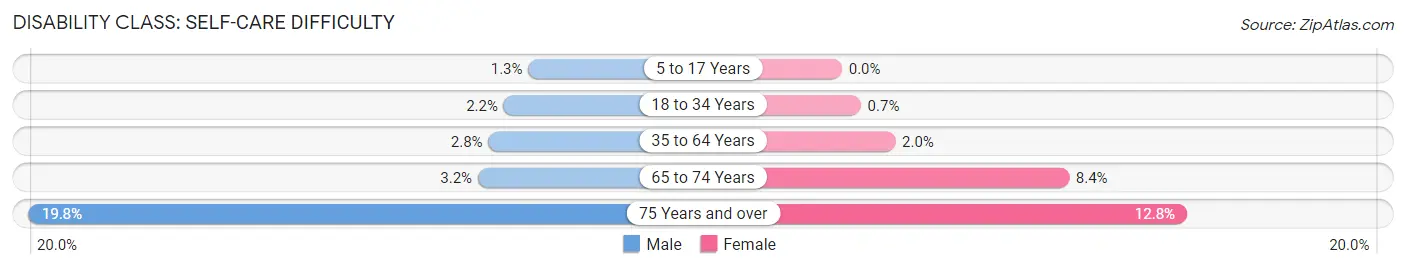
| Age Bracket | Male | Female |
| 5 to 17 Years | 28 (1.3%) | 0 (0.0%) |
| 18 to 34 Years | 61 (2.2%) | 22 (0.7%) |
| 35 to 64 Years | 123 (2.8%) | 93 (2.0%) |
| 65 to 74 Years | 23 (3.2%) | 71 (8.4%) |
| 75 Years and over | 100 (19.8%) | 119 (12.8%) |
Technology Access in Maywood
Computing Device Access in Maywood
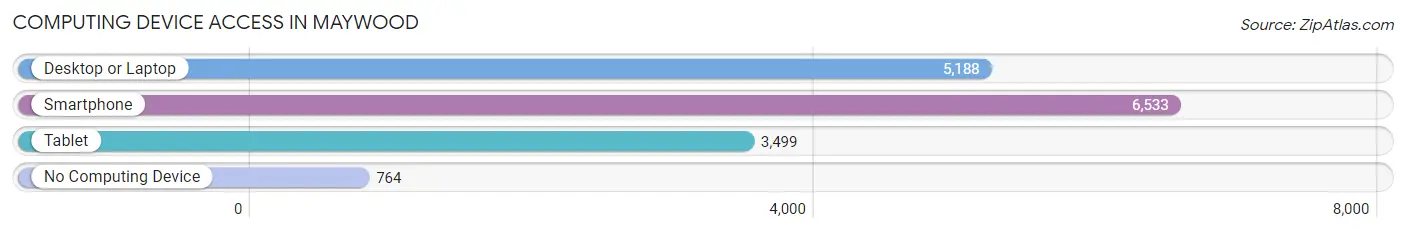
| Device Type | # Households | % Households |
| Desktop or Laptop | 5,188 | 67.6% |
| Smartphone | 6,533 | 85.2% |
| Tablet | 3,499 | 45.6% |
| No Computing Device | 764 | 10.0% |
| Total | 7,672 | 100.0% |
Internet Access in Maywood
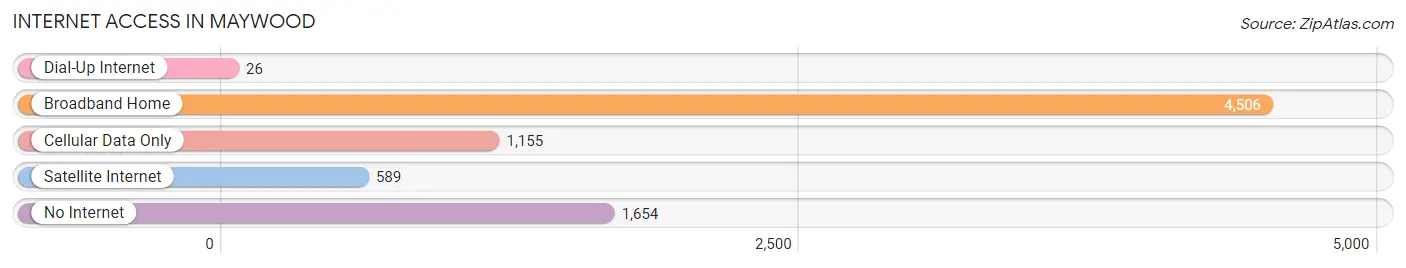
| Internet Type | # Households | % Households |
| Dial-Up Internet | 26 | 0.3% |
| Broadband Home | 4,506 | 58.7% |
| Cellular Data Only | 1,155 | 15.0% |
| Satellite Internet | 589 | 7.7% |
| No Internet | 1,654 | 21.6% |
| Total | 7,672 | 100.0% |
Maywood Summary
Maywood, Illinois is a village located in Cook County, Illinois, United States. It is a suburb of Chicago, located approximately 10 miles west of the city's downtown. As of the 2010 census, the village had a population of 24,090.
History
Maywood was first settled in 1835 by a group of settlers from New England. The village was originally known as "May's Woods" after the family who owned the land. The village was incorporated in 1869 and was named after the May family.
In the late 19th century, Maywood was a popular destination for wealthy Chicagoans who wanted to escape the city and enjoy the rural atmosphere. The village was known for its large estates and beautiful homes.
In the early 20th century, Maywood began to experience rapid growth as the city of Chicago expanded. The village was annexed by the city of Chicago in 1924, but it was later reincorporated as a village in 1925.
Geography
Maywood is located at 41°52'17" North, 87°48'17" West (41.871445, -87.804607). The village has a total area of 2.7 square miles, all of which is land.
The village is bordered by the city of Chicago to the east, the village of Melrose Park to the south, the village of Broadview to the west, and the village of Forest Park to the north.
Economy
Maywood is home to a variety of businesses and industries. The village is home to several manufacturing companies, including Maywood Industries, a manufacturer of plastic products, and Maywood Manufacturing, a manufacturer of metal products.
The village is also home to several retail stores, including a Walmart Supercenter, a Target, and a Home Depot.
Demographics
As of the 2010 census, the village had a population of 24,090. The racial makeup of the village was 57.2% African American, 33.3% White, 4.2% Hispanic or Latino, 2.2% Asian, and 0.3% Native American.
The median household income in Maywood was $37,945 in 2010. The per capita income was $17,845. About 22.3% of the population was below the poverty line.
Maywood is served by the Proviso Township High School District 209. The village is also home to several private schools, including St. Eulalia Catholic School and Maywood Christian Academy.
Common Questions
What is Per Capita Income in Maywood?
Per Capita income in Maywood is $26,418.
What is the Median Family Income in Maywood?
Median Family Income in Maywood is $76,357.
What is the Median Household income in Maywood?
Median Household Income in Maywood is $64,767.
What is Income or Wage Gap in Maywood?
Income or Wage Gap in Maywood is 4.5%.
Women in Maywood earn 95.5 cents for every dollar earned by a man.
What is Family Income Deficit in Maywood?
Family Income Deficit in Maywood is $13,754.
Families that are below poverty line in Maywood earn $13,754 less on average than the poverty threshold level.
What is Inequality or Gini Index in Maywood?
Inequality or Gini Index in Maywood is 0.43.
What is the Total Population of Maywood?
Total Population of Maywood is 23,385.
What is the Total Male Population of Maywood?
Total Male Population of Maywood is 11,460.
What is the Total Female Population of Maywood?
Total Female Population of Maywood is 11,925.
What is the Ratio of Males per 100 Females in Maywood?
There are 96.10 Males per 100 Females in Maywood.
What is the Ratio of Females per 100 Males in Maywood?
There are 104.06 Females per 100 Males in Maywood.
What is the Median Population Age in Maywood?
Median Population Age in Maywood is 37.0 Years.
What is the Average Family Size in Maywood
Average Family Size in Maywood is 3.9 People.
What is the Average Household Size in Maywood
Average Household Size in Maywood is 3.0 People.
How Large is the Labor Force in Maywood?
There are 10,706 People in the Labor Forcein in Maywood.
What is the Percentage of People in the Labor Force in Maywood?
57.9% of People are in the Labor Force in Maywood.
What is the Unemployment Rate in Maywood?
Unemployment Rate in Maywood is 9.0%.