Chicago, IL Map & Demographics
Chicago Map
Chicago Overview
$45,840
PER CAPITA INCOME
$87,343
AVG FAMILY INCOME
$71,673
AVG HOUSEHOLD INCOME
18.0%
WAGE / INCOME GAP [ % ]
82.0¢/ $1
WAGE / INCOME GAP [ $ ]
$11,501
FAMILY INCOME DEFICIT
0.53
INEQUALITY / GINI INDEX
2,721,914
TOTAL POPULATION
1,327,699
MALE POPULATION
1,394,215
FEMALE POPULATION
95.23
MALES / 100 FEMALES
105.01
FEMALES / 100 MALES
35.3
MEDIAN AGE
3.3
AVG FAMILY SIZE
2.4
AVG HOUSEHOLD SIZE
1,505,646
LABOR FORCE [ PEOPLE ]
67.3%
PERCENT IN LABOR FORCE
8.2%
UNEMPLOYMENT RATE
Chicago Zip Codes
Income in Chicago
Income Overview in Chicago
Per Capita Income in Chicago is $45,840, while median incomes of families and households are $87,343 and $71,673 respectively.
| Characteristic | Number | Measure |
| Per Capita Income | 2,721,914 | $45,840 |
| Median Family Income | 577,924 | $87,343 |
| Mean Family Income | 577,924 | $131,706 |
| Median Household Income | 1,129,908 | $71,673 |
| Mean Household Income | 1,129,908 | $108,346 |
| Income Deficit | 577,924 | $11,501 |
| Wage / Income Gap (%) | 2,721,914 | 18.02% |
| Wage / Income Gap ($) | 2,721,914 | 81.98¢ per $1 |
| Gini / Inequality Index | 2,721,914 | 0.53 |
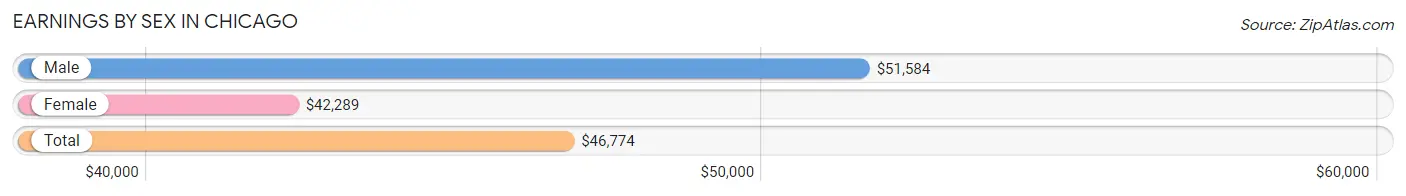
Earnings by Sex in Chicago
Average Earnings in Chicago are $46,774, $51,584 for men and $42,289 for women, a difference of 18.0%.
| Sex | Number | Average Earnings |
| Male | 773,811 (51.3%) | $51,584 |
| Female | 733,832 (48.7%) | $42,289 |
| Total | 1,507,643 (100.0%) | $46,774 |
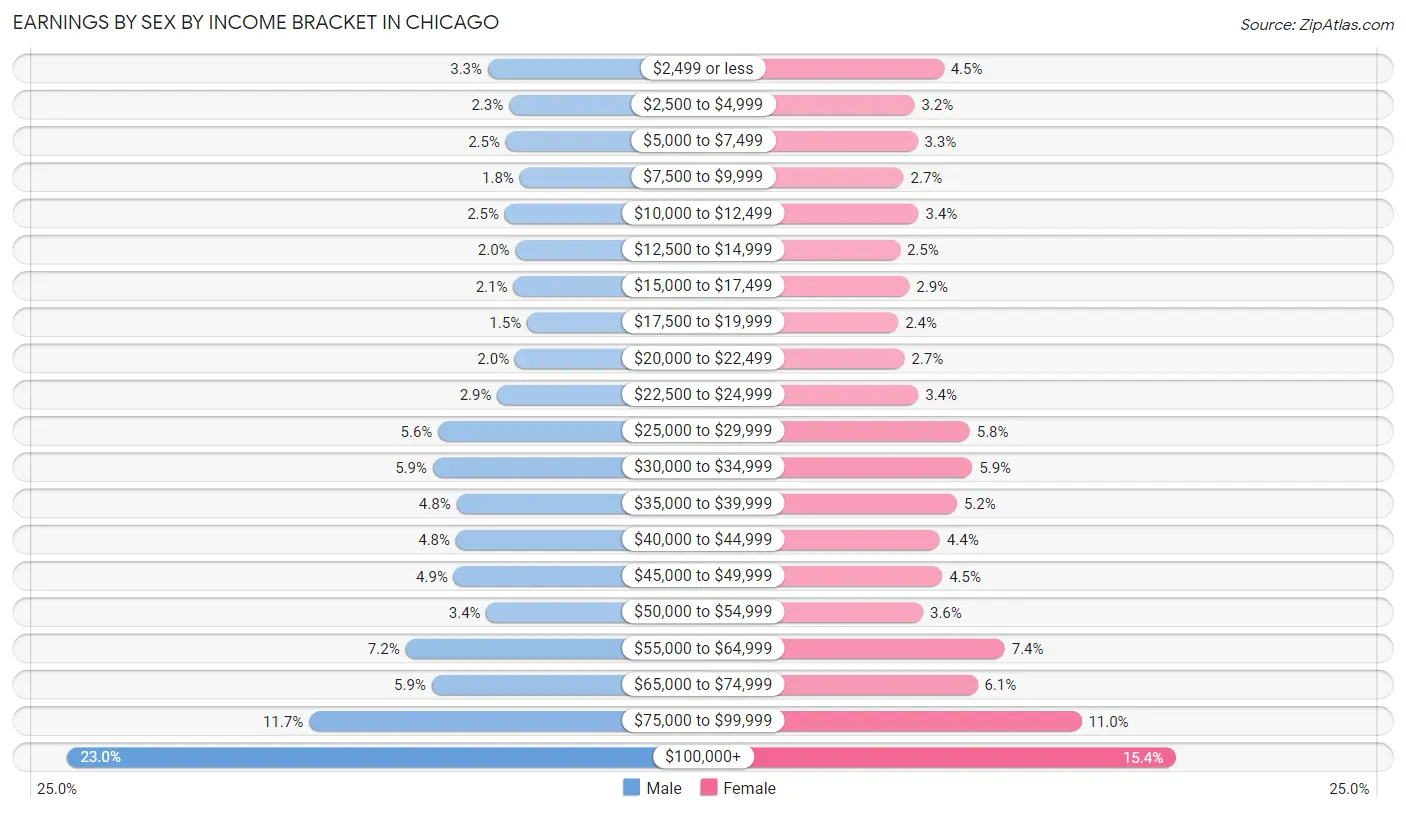
Earnings by Sex by Income Bracket in Chicago
The most common earnings brackets in Chicago are $100,000+ for men (177,909 | 23.0%) and $100,000+ for women (112,777 | 15.4%).
| Income | Male | Female |
| $2,499 or less | 25,558 (3.3%) | 33,326 (4.5%) |
| $2,500 to $4,999 | 17,905 (2.3%) | 23,248 (3.2%) |
| $5,000 to $7,499 | 19,004 (2.5%) | 24,282 (3.3%) |
| $7,500 to $9,999 | 13,988 (1.8%) | 19,496 (2.7%) |
| $10,000 to $12,499 | 19,387 (2.5%) | 24,634 (3.4%) |
| $12,500 to $14,999 | 15,549 (2.0%) | 18,307 (2.5%) |
| $15,000 to $17,499 | 16,362 (2.1%) | 21,505 (2.9%) |
| $17,500 to $19,999 | 11,363 (1.5%) | 17,721 (2.4%) |
| $20,000 to $22,499 | 15,723 (2.0%) | 19,779 (2.7%) |
| $22,500 to $24,999 | 22,161 (2.9%) | 24,608 (3.4%) |
| $25,000 to $29,999 | 43,554 (5.6%) | 42,296 (5.8%) |
| $30,000 to $34,999 | 45,535 (5.9%) | 43,164 (5.9%) |
| $35,000 to $39,999 | 36,935 (4.8%) | 37,864 (5.2%) |
| $40,000 to $44,999 | 37,126 (4.8%) | 31,964 (4.4%) |
| $45,000 to $49,999 | 37,940 (4.9%) | 32,824 (4.5%) |
| $50,000 to $54,999 | 26,100 (3.4%) | 26,209 (3.6%) |
| $55,000 to $64,999 | 55,432 (7.2%) | 54,278 (7.4%) |
| $65,000 to $74,999 | 45,872 (5.9%) | 44,911 (6.1%) |
| $75,000 to $99,999 | 90,408 (11.7%) | 80,639 (11.0%) |
| $100,000+ | 177,909 (23.0%) | 112,777 (15.4%) |
| Total | 773,811 (100.0%) | 733,832 (100.0%) |
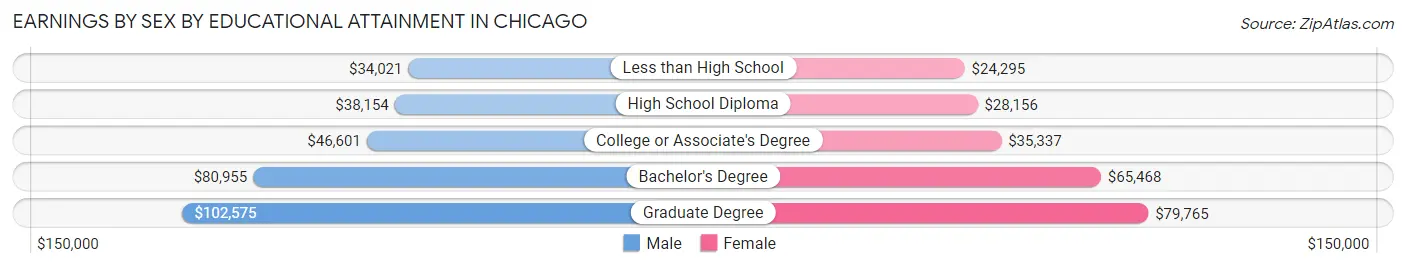
Earnings by Sex by Educational Attainment in Chicago
Average earnings in Chicago are $57,531 for men and $48,167 for women, a difference of 16.3%. Men with an educational attainment of graduate degree enjoy the highest average annual earnings of $102,575, while those with less than high school education earn the least with $34,021. Women with an educational attainment of graduate degree earn the most with the average annual earnings of $79,765, while those with less than high school education have the smallest earnings of $24,295.
| Educational Attainment | Male Income | Female Income |
| Less than High School | $34,021 | $24,295 |
| High School Diploma | $38,154 | $28,156 |
| College or Associate's Degree | $46,601 | $35,337 |
| Bachelor's Degree | $80,955 | $65,468 |
| Graduate Degree | $102,575 | $79,765 |
| Total | $57,531 | $48,167 |
Family Income in Chicago
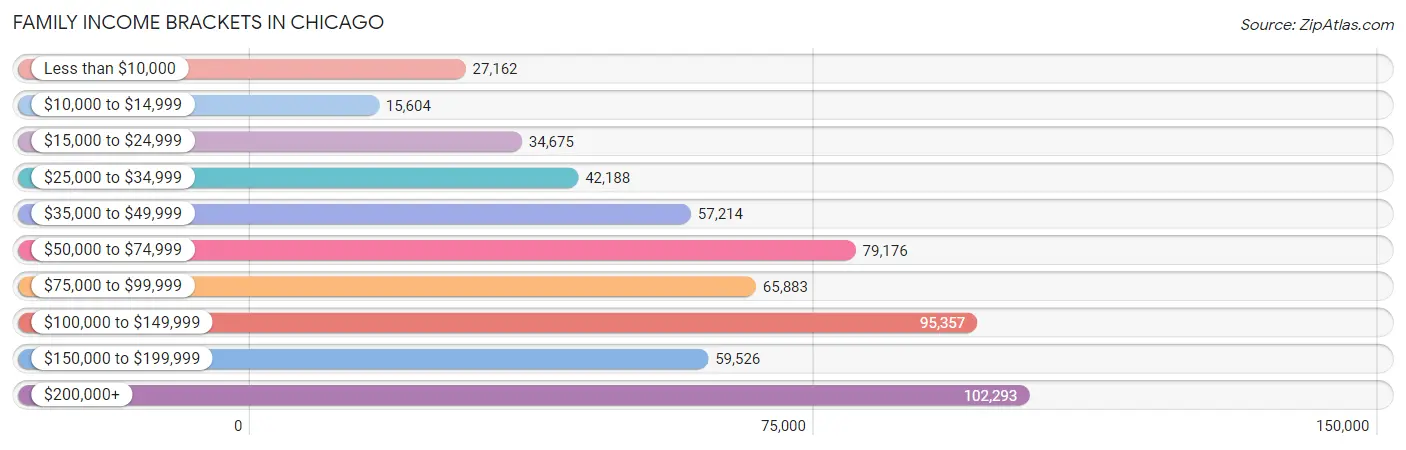
Family Income Brackets in Chicago
According to the Chicago family income data, there are 102,293 families falling into the $200,000+ income range, which is the most common income bracket and makes up 17.7% of all families. Conversely, the $10,000 to $14,999 income bracket is the least frequent group with only 15,604 families (2.7%) belonging to this category.
| Income Bracket | # Families | % Families |
| Less than $10,000 | 27,162 | 4.7% |
| $10,000 to $14,999 | 15,604 | 2.7% |
| $15,000 to $24,999 | 34,675 | 6.0% |
| $25,000 to $34,999 | 42,188 | 7.3% |
| $35,000 to $49,999 | 57,214 | 9.9% |
| $50,000 to $74,999 | 79,176 | 13.7% |
| $75,000 to $99,999 | 65,883 | 11.4% |
| $100,000 to $149,999 | 95,357 | 16.5% |
| $150,000 to $199,999 | 59,526 | 10.3% |
| $200,000+ | 102,293 | 17.7% |
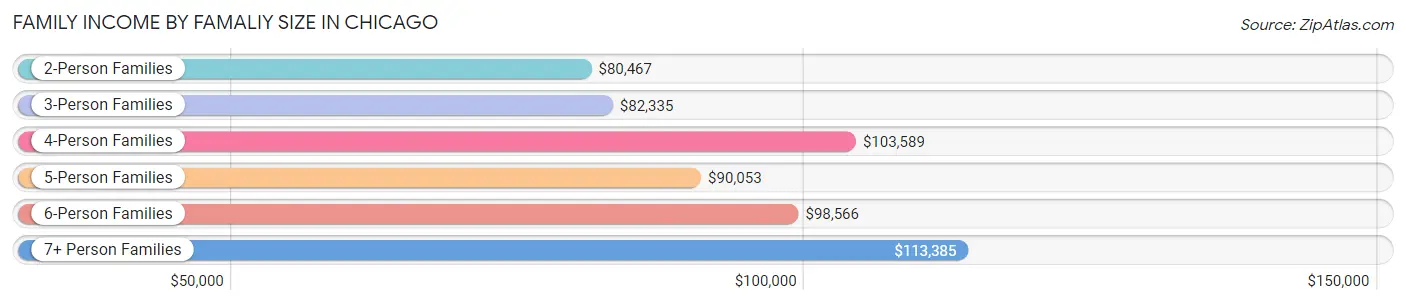
Family Income by Famaliy Size in Chicago
7+ person families (13,214 | 2.3%) account for the highest median family income in Chicago with $113,385 per family, while 2-person families (254,623 | 44.1%) have the highest median income of $40,234 per family member.
| Income Bracket | # Families | Median Income |
| 2-Person Families | 254,623 (44.1%) | $80,467 |
| 3-Person Families | 136,503 (23.6%) | $82,335 |
| 4-Person Families | 103,265 (17.9%) | $103,589 |
| 5-Person Families | 49,734 (8.6%) | $90,053 |
| 6-Person Families | 20,585 (3.6%) | $98,566 |
| 7+ Person Families | 13,214 (2.3%) | $113,385 |
| Total | 577,924 (100.0%) | $87,343 |
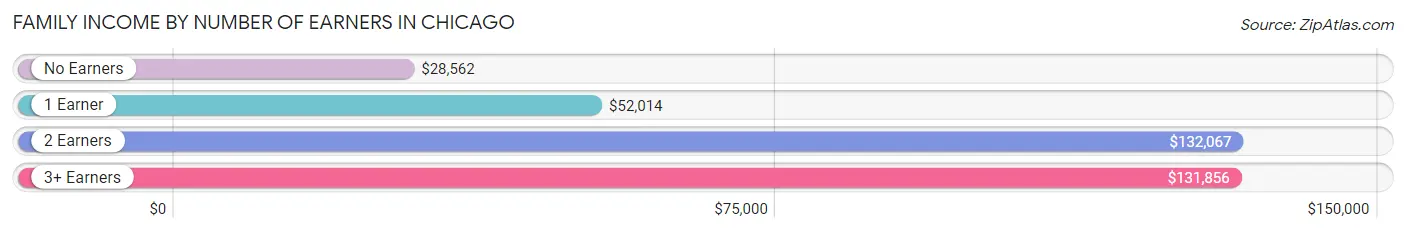
Family Income by Number of Earners in Chicago
The median family income in Chicago is $87,343, with families comprising 2 earners (245,288) having the highest median family income of $132,067, while families with no earners (72,378) have the lowest median family income of $28,562, accounting for 42.4% and 12.5% of families, respectively.
| Number of Earners | # Families | Median Income |
| No Earners | 72,378 (12.5%) | $28,562 |
| 1 Earner | 194,091 (33.6%) | $52,014 |
| 2 Earners | 245,288 (42.4%) | $132,067 |
| 3+ Earners | 66,167 (11.5%) | $131,856 |
| Total | 577,924 (100.0%) | $87,343 |
Household Income in Chicago
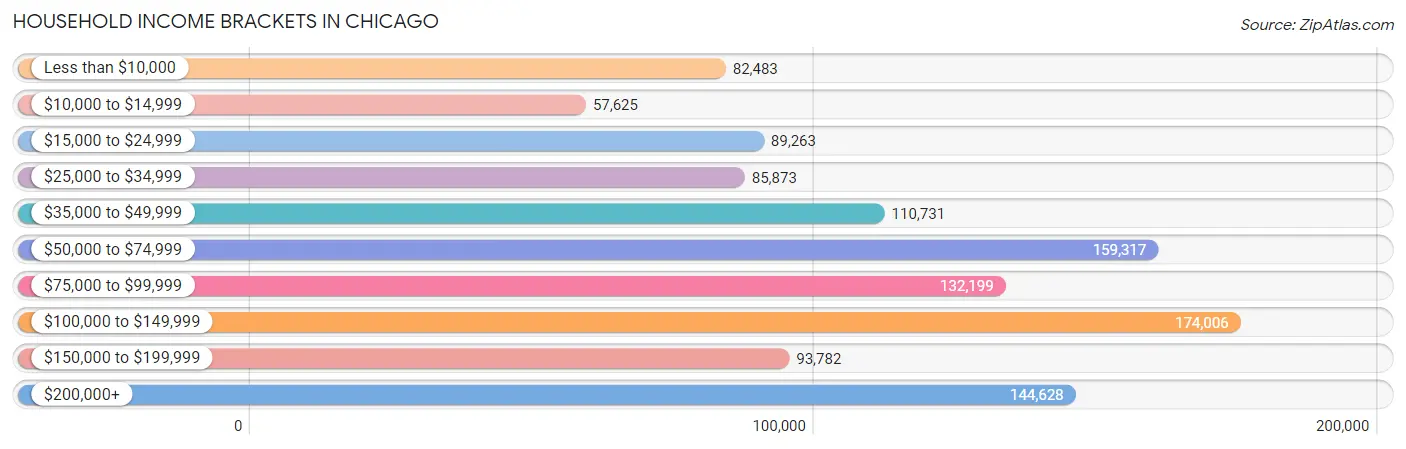
Household Income Brackets in Chicago
With 174,006 households falling in the category, the $100,000 to $149,999 income range is the most frequent in Chicago, accounting for 15.4% of all households. In contrast, only 57,625 households (5.1%) fall into the $10,000 to $14,999 income bracket, making it the least populous group.
| Income Bracket | # Households | % Households |
| Less than $10,000 | 82,483 | 7.3% |
| $10,000 to $14,999 | 57,625 | 5.1% |
| $15,000 to $24,999 | 89,263 | 7.9% |
| $25,000 to $34,999 | 85,873 | 7.6% |
| $35,000 to $49,999 | 110,731 | 9.8% |
| $50,000 to $74,999 | 159,317 | 14.1% |
| $75,000 to $99,999 | 132,199 | 11.7% |
| $100,000 to $149,999 | 174,006 | 15.4% |
| $150,000 to $199,999 | 93,782 | 8.3% |
| $200,000+ | 144,628 | 12.8% |
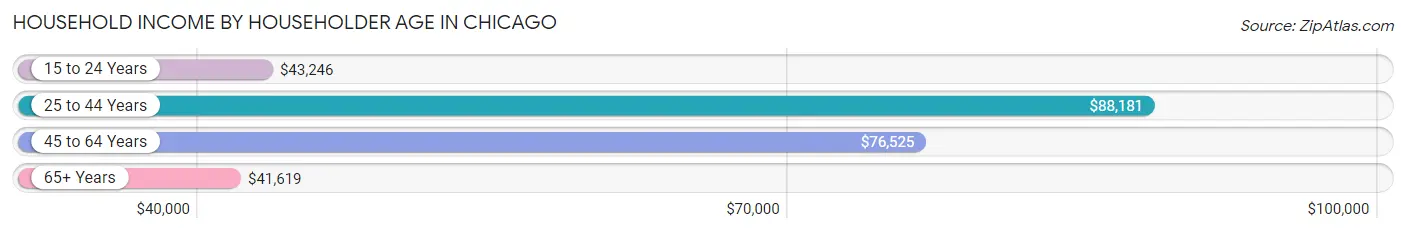
Household Income by Householder Age in Chicago
The median household income in Chicago is $71,673, with the highest median household income of $88,181 found in the 25 to 44 years age bracket for the primary householder. A total of 475,445 households (42.1%) fall into this category. Meanwhile, the 65+ years age bracket for the primary householder has the lowest median household income of $41,619, with 239,794 households (21.2%) in this group.
| Income Bracket | # Households | Median Income |
| 15 to 24 Years | 50,693 (4.5%) | $43,246 |
| 25 to 44 Years | 475,445 (42.1%) | $88,181 |
| 45 to 64 Years | 363,976 (32.2%) | $76,525 |
| 65+ Years | 239,794 (21.2%) | $41,619 |
| Total | 1,129,908 (100.0%) | $71,673 |
Poverty in Chicago
Income Below Poverty by Sex and Age in Chicago
With 15.2% poverty level for males and 18.5% for females among the residents of Chicago, 5 year old males and 15 year old females are the most vulnerable to poverty, with 3,854 males (26.0%) and 4,547 females (29.3%) in their respective age groups living below the poverty level.
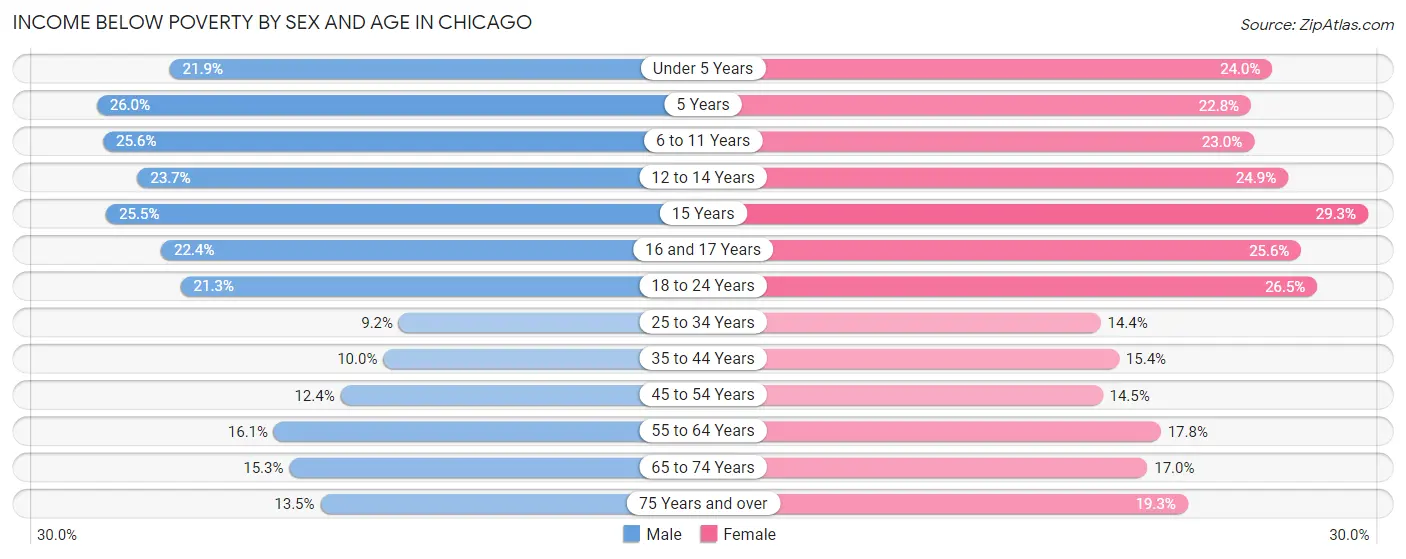
| Age Bracket | Male | Female |
| Under 5 Years | 16,983 (21.9%) | 18,304 (24.0%) |
| 5 Years | 3,854 (26.0%) | 2,912 (22.8%) |
| 6 to 11 Years | 22,468 (25.6%) | 19,990 (23.0%) |
| 12 to 14 Years | 10,862 (23.7%) | 11,388 (24.8%) |
| 15 Years | 3,766 (25.5%) | 4,547 (29.3%) |
| 16 and 17 Years | 6,506 (22.4%) | 7,464 (25.6%) |
| 18 to 24 Years | 25,006 (21.3%) | 33,997 (26.5%) |
| 25 to 34 Years | 24,187 (9.2%) | 38,430 (14.4%) |
| 35 to 44 Years | 19,515 (10.0%) | 29,784 (15.4%) |
| 45 to 54 Years | 19,892 (12.4%) | 23,137 (14.5%) |
| 55 to 64 Years | 23,432 (16.1%) | 27,282 (17.8%) |
| 65 to 74 Years | 14,219 (15.3%) | 19,605 (17.0%) |
| 75 Years and over | 7,329 (13.5%) | 17,374 (19.3%) |
| Total | 198,019 (15.2%) | 254,214 (18.5%) |
Income Above Poverty by Sex and Age in Chicago
According to the poverty statistics in Chicago, males aged 25 to 34 years and females aged 25 to 34 years are the age groups that are most secure financially, with 90.8% of males and 85.6% of females in these age groups living above the poverty line.
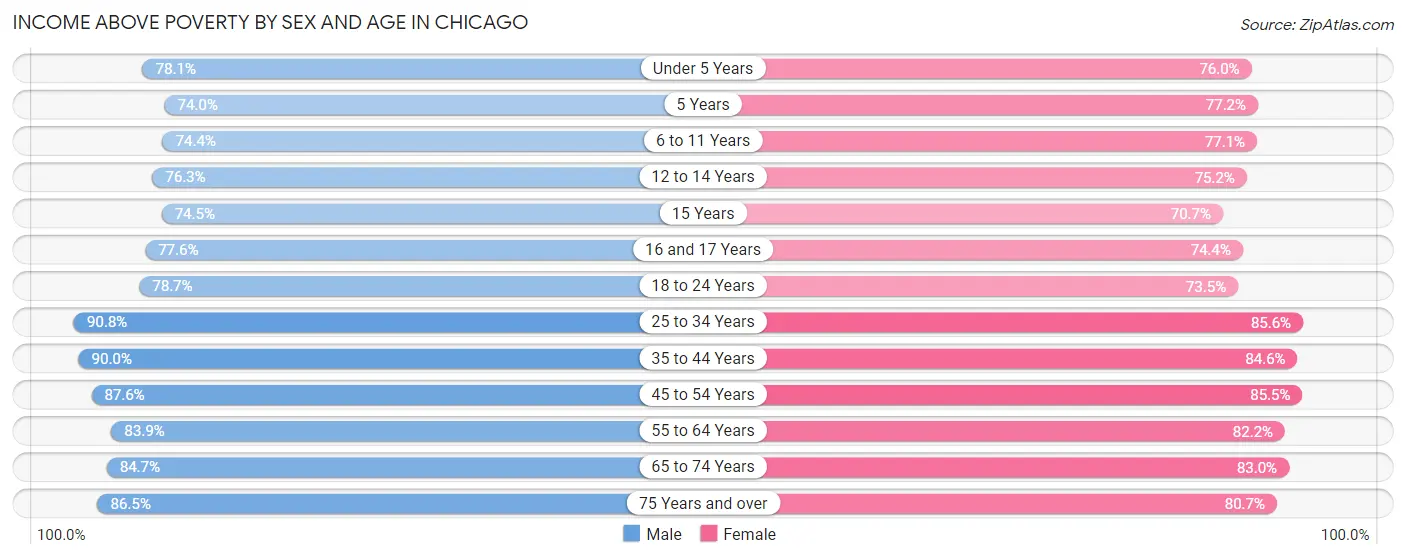
| Age Bracket | Male | Female |
| Under 5 Years | 60,477 (78.1%) | 58,072 (76.0%) |
| 5 Years | 10,981 (74.0%) | 9,869 (77.2%) |
| 6 to 11 Years | 65,201 (74.4%) | 67,109 (77.0%) |
| 12 to 14 Years | 34,934 (76.3%) | 34,440 (75.1%) |
| 15 Years | 11,027 (74.5%) | 10,975 (70.7%) |
| 16 and 17 Years | 22,533 (77.6%) | 21,710 (74.4%) |
| 18 to 24 Years | 92,348 (78.7%) | 94,422 (73.5%) |
| 25 to 34 Years | 239,756 (90.8%) | 228,189 (85.6%) |
| 35 to 44 Years | 175,052 (90.0%) | 163,293 (84.6%) |
| 45 to 54 Years | 140,380 (87.6%) | 136,198 (85.5%) |
| 55 to 64 Years | 121,926 (83.9%) | 126,318 (82.2%) |
| 65 to 74 Years | 78,985 (84.7%) | 95,617 (83.0%) |
| 75 Years and over | 46,858 (86.5%) | 72,846 (80.7%) |
| Total | 1,100,458 (84.8%) | 1,119,058 (81.5%) |
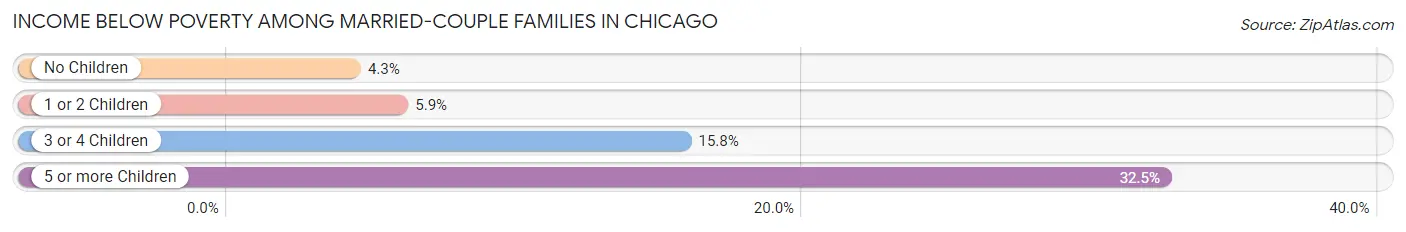
Income Below Poverty Among Married-Couple Families in Chicago
The poverty statistics for married-couple families in Chicago show that 5.9% or 20,909 of the total 357,408 families live below the poverty line. Families with 5 or more children have the highest poverty rate of 32.5%, comprising of 621 families. On the other hand, families with no children have the lowest poverty rate of 4.3%, which includes 8,669 families.
| Children | Above Poverty | Below Poverty |
| No Children | 194,102 (95.7%) | 8,669 (4.3%) |
| 1 or 2 Children | 119,241 (94.1%) | 7,519 (5.9%) |
| 3 or 4 Children | 21,867 (84.2%) | 4,100 (15.8%) |
| 5 or more Children | 1,289 (67.5%) | 621 (32.5%) |
| Total | 336,499 (94.2%) | 20,909 (5.9%) |
Income Below Poverty Among Single-Parent Households in Chicago
According to the poverty data in Chicago, 15.0% or 8,488 single-father households and 28.0% or 45,796 single-mother households are living below the poverty line. Among single-father households, those with 5 or more children have the highest poverty rate, with 216 households (52.5%) experiencing poverty. Likewise, among single-mother households, those with 5 or more children have the highest poverty rate, with 1,542 households (69.1%) falling below the poverty line.
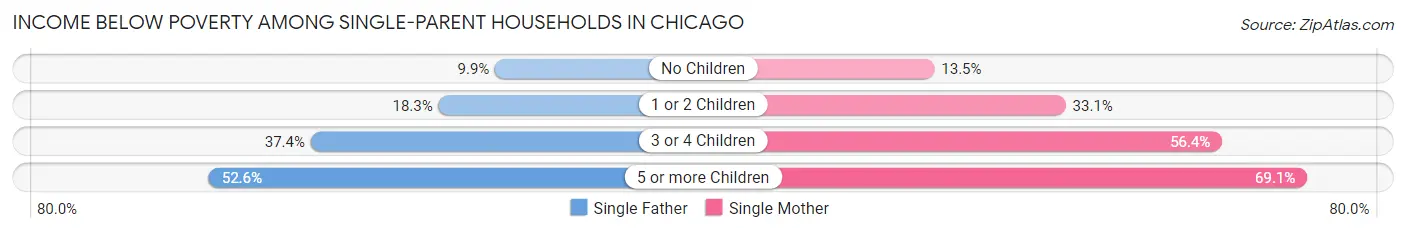
| Children | Single Father | Single Mother |
| No Children | 3,203 (9.9%) | 9,014 (13.5%) |
| 1 or 2 Children | 3,715 (18.3%) | 25,888 (33.1%) |
| 3 or 4 Children | 1,354 (37.4%) | 9,352 (56.4%) |
| 5 or more Children | 216 (52.5%) | 1,542 (69.1%) |
| Total | 8,488 (15.0%) | 45,796 (28.0%) |
Income Below Poverty Among Married-Couple vs Single-Parent Households in Chicago
The poverty data for Chicago shows that 20,909 of the married-couple family households (5.9%) and 54,284 of the single-parent households (24.6%) are living below the poverty level. Within the married-couple family households, those with 5 or more children have the highest poverty rate, with 621 households (32.5%) falling below the poverty line. Among the single-parent households, those with 5 or more children have the highest poverty rate, with 1,758 household (66.5%) living below poverty.
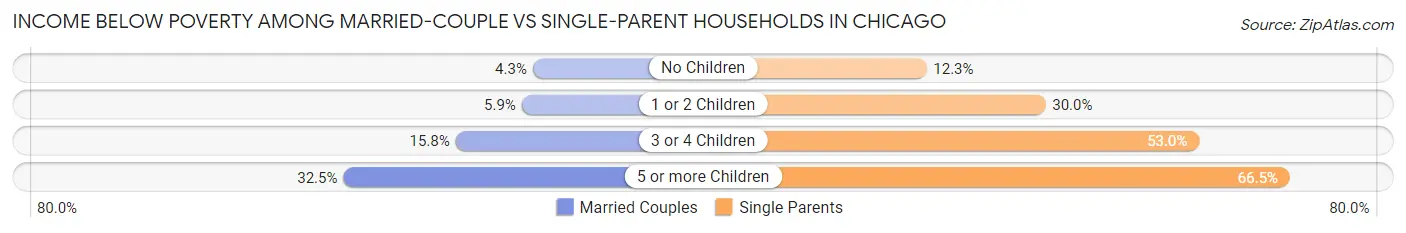
| Children | Married-Couple Families | Single-Parent Households |
| No Children | 8,669 (4.3%) | 12,217 (12.3%) |
| 1 or 2 Children | 7,519 (5.9%) | 29,603 (30.0%) |
| 3 or 4 Children | 4,100 (15.8%) | 10,706 (53.0%) |
| 5 or more Children | 621 (32.5%) | 1,758 (66.5%) |
| Total | 20,909 (5.9%) | 54,284 (24.6%) |
Race in Chicago
The most populous races in Chicago are White / Caucasian (1,154,279 | 42.4%), Hispanic or Latino (788,106 | 28.9%), and Black / African American (784,078 | 28.8%).
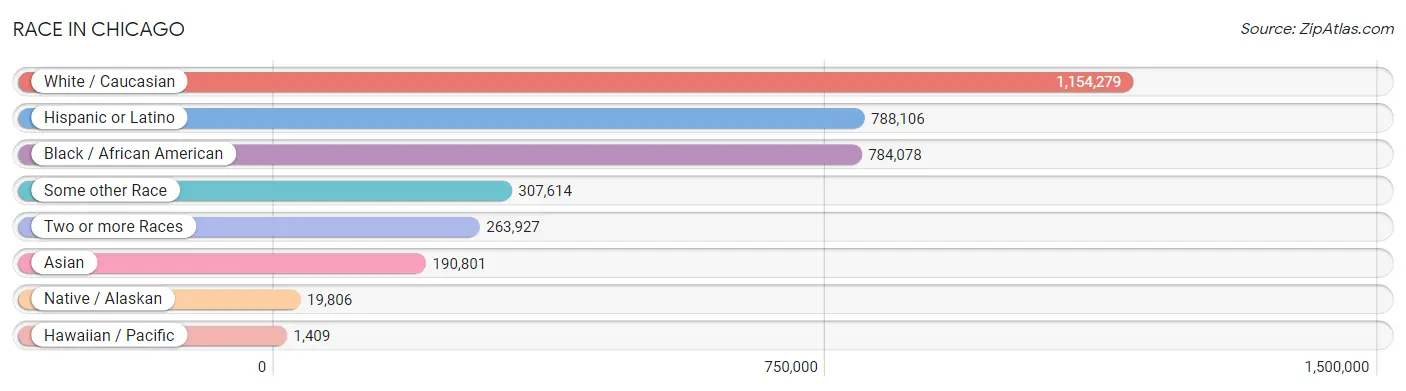
| Race | # Population | % Population |
| Asian | 190,801 | 7.0% |
| Black / African American | 784,078 | 28.8% |
| Hawaiian / Pacific | 1,409 | 0.1% |
| Hispanic or Latino | 788,106 | 28.9% |
| Native / Alaskan | 19,806 | 0.7% |
| White / Caucasian | 1,154,279 | 42.4% |
| Two or more Races | 263,927 | 9.7% |
| Some other Race | 307,614 | 11.3% |
| Total | 2,721,914 | 100.0% |
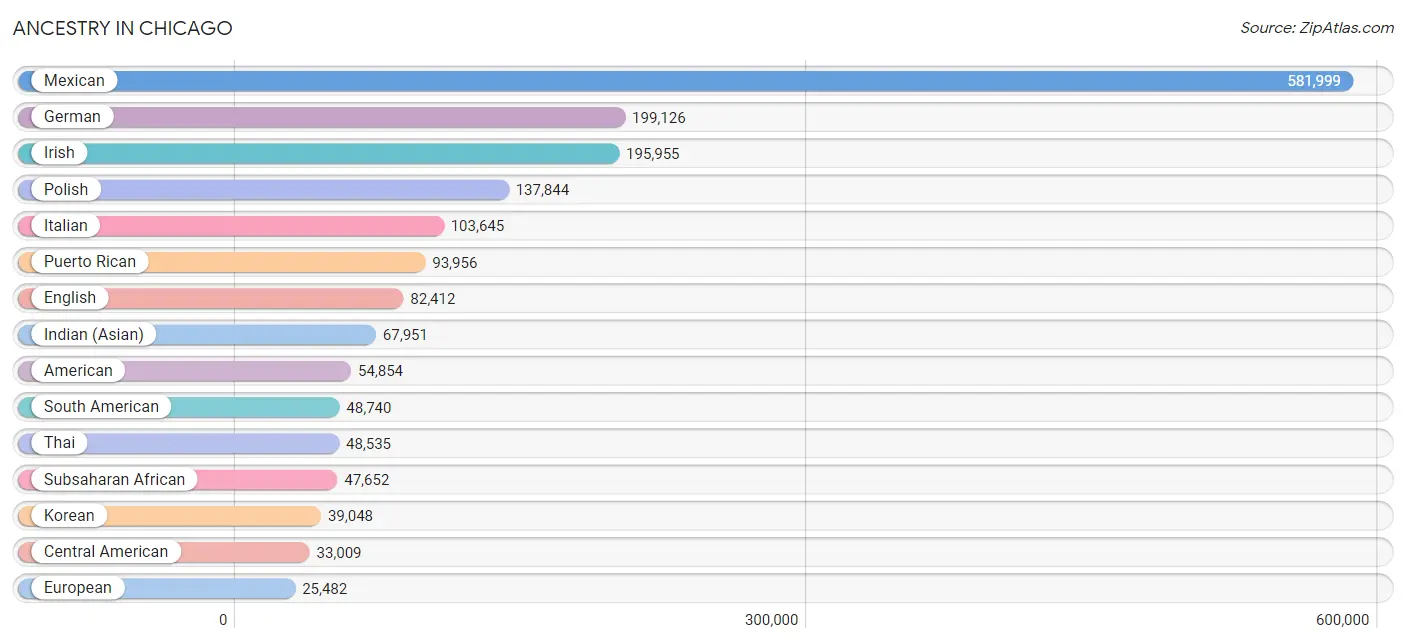
Ancestry in Chicago
The most populous ancestries reported in Chicago are Mexican (581,999 | 21.4%), German (199,126 | 7.3%), Irish (195,955 | 7.2%), Polish (137,844 | 5.1%), and Italian (103,645 | 3.8%), together accounting for 44.8% of all Chicago residents.
| Ancestry | # Population | % Population |
| Afghan | 895 | 0.0% |
| African | 20,769 | 0.8% |
| Alaska Native | 41 | 0.0% |
| Albanian | 2,363 | 0.1% |
| Aleut | 24 | 0.0% |
| Alsatian | 6 | 0.0% |
| American | 54,854 | 2.0% |
| Apache | 883 | 0.0% |
| Arab | 22,869 | 0.8% |
| Argentinean | 2,162 | 0.1% |
| Armenian | 2,244 | 0.1% |
| Assyrian / Chaldean / Syriac | 3,009 | 0.1% |
| Australian | 1,255 | 0.1% |
| Austrian | 6,744 | 0.3% |
| Bahamian | 254 | 0.0% |
| Bangladeshi | 279 | 0.0% |
| Barbadian | 352 | 0.0% |
| Basque | 313 | 0.0% |
| Belgian | 2,546 | 0.1% |
| Belizean | 3,051 | 0.1% |
| Bermudan | 98 | 0.0% |
| Bhutanese | 9,659 | 0.4% |
| Blackfeet | 689 | 0.0% |
| Bolivian | 811 | 0.0% |
| Brazilian | 3,206 | 0.1% |
| British | 8,918 | 0.3% |
| British West Indian | 135 | 0.0% |
| Bulgarian | 2,837 | 0.1% |
| Burmese | 16,224 | 0.6% |
| Cajun | 120 | 0.0% |
| Cambodian | 1,087 | 0.0% |
| Canadian | 2,832 | 0.1% |
| Cape Verdean | 72 | 0.0% |
| Carpatho Rusyn | 41 | 0.0% |
| Celtic | 183 | 0.0% |
| Central American | 33,009 | 1.2% |
| Central American Indian | 4,704 | 0.2% |
| Cherokee | 3,676 | 0.1% |
| Cheyenne | 16 | 0.0% |
| Chickasaw | 122 | 0.0% |
| Chilean | 1,548 | 0.1% |
| Chinese | 8 | 0.0% |
| Chippewa | 699 | 0.0% |
| Choctaw | 750 | 0.0% |
| Colombian | 11,383 | 0.4% |
| Comanche | 47 | 0.0% |
| Costa Rican | 909 | 0.0% |
| Cree | 132 | 0.0% |
| Creek | 96 | 0.0% |
| Croatian | 7,724 | 0.3% |
| Crow | 8 | 0.0% |
| Cuban | 9,163 | 0.3% |
| Cypriot | 120 | 0.0% |
| Czech | 10,542 | 0.4% |
| Czechoslovakian | 1,424 | 0.1% |
| Danish | 5,081 | 0.2% |
| Delaware | 39 | 0.0% |
| Dominican | 3,814 | 0.1% |
| Dutch | 13,275 | 0.5% |
| Dutch West Indian | 12 | 0.0% |
| Eastern European | 10,875 | 0.4% |
| Ecuadorian | 21,358 | 0.8% |
| Egyptian | 1,705 | 0.1% |
| English | 82,412 | 3.0% |
| Estonian | 262 | 0.0% |
| Ethiopian | 4,225 | 0.2% |
| European | 25,482 | 0.9% |
| Filipino | 2,312 | 0.1% |
| Finnish | 2,666 | 0.1% |
| French | 25,003 | 0.9% |
| French American Indian | 82 | 0.0% |
| French Canadian | 4,453 | 0.2% |
| German | 199,126 | 7.3% |
| German Russian | 57 | 0.0% |
| Ghanaian | 2,635 | 0.1% |
| Greek | 16,404 | 0.6% |
| Guamanian / Chamorro | 339 | 0.0% |
| Guatemalan | 18,579 | 0.7% |
| Guyanese | 590 | 0.0% |
| Haitian | 4,746 | 0.2% |
| Hmong | 67 | 0.0% |
| Honduran | 5,825 | 0.2% |
| Hopi | 31 | 0.0% |
| Houma | 9 | 0.0% |
| Hungarian | 8,341 | 0.3% |
| Icelander | 170 | 0.0% |
| Indian (Asian) | 67,951 | 2.5% |
| Indonesian | 1,868 | 0.1% |
| Inupiat | 167 | 0.0% |
| Iranian | 3,400 | 0.1% |
| Iraqi | 2,145 | 0.1% |
| Irish | 195,955 | 7.2% |
| Iroquois | 365 | 0.0% |
| Israeli | 1,411 | 0.1% |
| Italian | 103,645 | 3.8% |
| Jamaican | 4,470 | 0.2% |
| Japanese | 1,948 | 0.1% |
| Jordanian | 2,243 | 0.1% |
| Kenyan | 509 | 0.0% |
| Kiowa | 92 | 0.0% |
| Korean | 39,048 | 1.4% |
| Laotian | 552 | 0.0% |
| Latvian | 1,238 | 0.1% |
| Lebanese | 3,729 | 0.1% |
| Liberian | 436 | 0.0% |
| Lithuanian | 9,926 | 0.4% |
| Lumbee | 35 | 0.0% |
| Luxembourger | 676 | 0.0% |
| Macedonian | 2,428 | 0.1% |
| Malaysian | 741 | 0.0% |
| Maltese | 112 | 0.0% |
| Menominee | 167 | 0.0% |
| Mexican | 581,999 | 21.4% |
| Mexican American Indian | 14,918 | 0.5% |
| Mongolian | 668 | 0.0% |
| Moroccan | 1,677 | 0.1% |
| Native Hawaiian | 1,975 | 0.1% |
| Navajo | 509 | 0.0% |
| New Zealander | 70 | 0.0% |
| Nicaraguan | 953 | 0.0% |
| Nigerian | 13,009 | 0.5% |
| Northern European | 2,280 | 0.1% |
| Norwegian | 17,524 | 0.6% |
| Okinawan | 166 | 0.0% |
| Osage | 11 | 0.0% |
| Ottawa | 27 | 0.0% |
| Paiute | 42 | 0.0% |
| Pakistani | 4,835 | 0.2% |
| Palestinian | 2,554 | 0.1% |
| Panamanian | 630 | 0.0% |
| Paraguayan | 223 | 0.0% |
| Pennsylvania German | 31 | 0.0% |
| Peruvian | 5,536 | 0.2% |
| Pima | 27 | 0.0% |
| Polish | 137,844 | 5.1% |
| Portuguese | 2,810 | 0.1% |
| Potawatomi | 380 | 0.0% |
| Pueblo | 96 | 0.0% |
| Puerto Rican | 93,956 | 3.5% |
| Puget Sound Salish | 54 | 0.0% |
| Romanian | 8,954 | 0.3% |
| Russian | 24,864 | 0.9% |
| Salvadoran | 5,950 | 0.2% |
| Samoan | 335 | 0.0% |
| Scandinavian | 3,570 | 0.1% |
| Scotch-Irish | 6,507 | 0.2% |
| Scottish | 18,980 | 0.7% |
| Seminole | 50 | 0.0% |
| Senegalese | 235 | 0.0% |
| Serbian | 6,865 | 0.3% |
| Shoshone | 55 | 0.0% |
| Sierra Leonean | 59 | 0.0% |
| Sioux | 463 | 0.0% |
| Slavic | 588 | 0.0% |
| Slovak | 4,679 | 0.2% |
| Slovene | 1,760 | 0.1% |
| Somali | 650 | 0.0% |
| South African | 448 | 0.0% |
| South American | 48,740 | 1.8% |
| South American Indian | 914 | 0.0% |
| Soviet Union | 42 | 0.0% |
| Spaniard | 5,151 | 0.2% |
| Spanish | 2,601 | 0.1% |
| Spanish American | 101 | 0.0% |
| Spanish American Indian | 21 | 0.0% |
| Sri Lankan | 12,280 | 0.4% |
| Subsaharan African | 47,652 | 1.8% |
| Sudanese | 592 | 0.0% |
| Swedish | 24,166 | 0.9% |
| Swiss | 3,830 | 0.1% |
| Syrian | 1,447 | 0.1% |
| Taiwanese | 182 | 0.0% |
| Thai | 48,535 | 1.8% |
| Tohono O'Odham | 11 | 0.0% |
| Tongan | 114 | 0.0% |
| Trinidadian and Tobagonian | 605 | 0.0% |
| Turkish | 2,464 | 0.1% |
| U.S. Virgin Islander | 101 | 0.0% |
| Ugandan | 205 | 0.0% |
| Ukrainian | 14,623 | 0.5% |
| Uruguayan | 326 | 0.0% |
| Venezuelan | 5,210 | 0.2% |
| Vietnamese | 903 | 0.0% |
| Welsh | 6,791 | 0.3% |
| West Indian | 1,909 | 0.1% |
| Yaqui | 191 | 0.0% |
| Yugoslavian | 5,977 | 0.2% |
| Yuman | 6 | 0.0% |
| Zimbabwean | 128 | 0.0% | View All 189 Rows |
Immigrants in Chicago
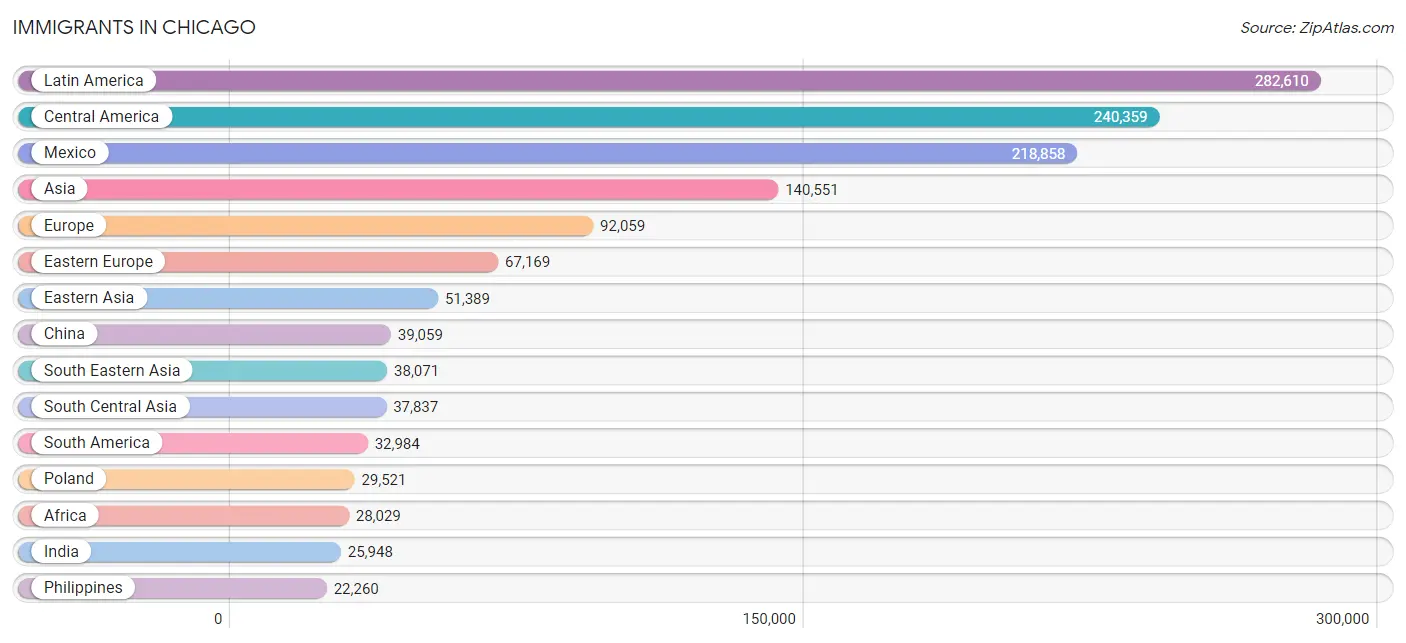
The most numerous immigrant groups reported in Chicago came from Latin America (282,610 | 10.4%), Central America (240,359 | 8.8%), Mexico (218,858 | 8.0%), Asia (140,551 | 5.2%), and Europe (92,059 | 3.4%), together accounting for 35.8% of all Chicago residents.
| Immigration Origin | # Population | % Population |
| Afghanistan | 626 | 0.0% |
| Africa | 28,029 | 1.0% |
| Albania | 1,020 | 0.0% |
| Argentina | 1,316 | 0.1% |
| Armenia | 308 | 0.0% |
| Asia | 140,551 | 5.2% |
| Australia | 1,152 | 0.0% |
| Austria | 772 | 0.0% |
| Bahamas | 134 | 0.0% |
| Bangladesh | 625 | 0.0% |
| Barbados | 103 | 0.0% |
| Belarus | 1,309 | 0.1% |
| Belgium | 223 | 0.0% |
| Belize | 1,735 | 0.1% |
| Bolivia | 456 | 0.0% |
| Bosnia and Herzegovina | 4,437 | 0.2% |
| Brazil | 3,960 | 0.2% |
| Bulgaria | 2,602 | 0.1% |
| Cabo Verde | 12 | 0.0% |
| Cambodia | 993 | 0.0% |
| Cameroon | 511 | 0.0% |
| Canada | 6,114 | 0.2% |
| Caribbean | 9,267 | 0.3% |
| Central America | 240,359 | 8.8% |
| Chile | 898 | 0.0% |
| China | 39,059 | 1.4% |
| Colombia | 5,945 | 0.2% |
| Congo | 231 | 0.0% |
| Costa Rica | 602 | 0.0% |
| Croatia | 1,330 | 0.1% |
| Cuba | 2,419 | 0.1% |
| Czechoslovakia | 487 | 0.0% |
| Denmark | 267 | 0.0% |
| Dominica | 26 | 0.0% |
| Dominican Republic | 1,673 | 0.1% |
| Eastern Africa | 6,264 | 0.2% |
| Eastern Asia | 51,389 | 1.9% |
| Eastern Europe | 67,169 | 2.5% |
| Ecuador | 11,340 | 0.4% |
| Egypt | 914 | 0.0% |
| El Salvador | 3,690 | 0.1% |
| England | 2,180 | 0.1% |
| Eritrea | 564 | 0.0% |
| Ethiopia | 2,848 | 0.1% |
| Europe | 92,059 | 3.4% |
| Fiji | 91 | 0.0% |
| France | 3,007 | 0.1% |
| Germany | 3,848 | 0.1% |
| Ghana | 3,030 | 0.1% |
| Greece | 2,361 | 0.1% |
| Guatemala | 10,661 | 0.4% |
| Guyana | 508 | 0.0% |
| Haiti | 2,276 | 0.1% |
| Honduras | 3,798 | 0.1% |
| Hong Kong | 2,713 | 0.1% |
| Hungary | 376 | 0.0% |
| India | 25,948 | 0.9% |
| Indonesia | 448 | 0.0% |
| Iran | 1,677 | 0.1% |
| Iraq | 2,906 | 0.1% |
| Ireland | 2,535 | 0.1% |
| Israel | 1,417 | 0.1% |
| Italy | 3,065 | 0.1% |
| Jamaica | 2,257 | 0.1% |
| Japan | 2,283 | 0.1% |
| Jordan | 1,977 | 0.1% |
| Kazakhstan | 262 | 0.0% |
| Kenya | 517 | 0.0% |
| Korea | 8,850 | 0.3% |
| Kuwait | 292 | 0.0% |
| Laos | 226 | 0.0% |
| Latin America | 282,610 | 10.4% |
| Latvia | 352 | 0.0% |
| Lebanon | 600 | 0.0% |
| Liberia | 244 | 0.0% |
| Lithuania | 745 | 0.0% |
| Malaysia | 1,674 | 0.1% |
| Mexico | 218,858 | 8.0% |
| Middle Africa | 1,348 | 0.1% |
| Moldova | 829 | 0.0% |
| Morocco | 1,381 | 0.1% |
| Nepal | 974 | 0.0% |
| Netherlands | 390 | 0.0% |
| Nicaragua | 578 | 0.0% |
| Nigeria | 9,001 | 0.3% |
| North Macedonia | 1,062 | 0.0% |
| Northern Africa | 3,928 | 0.1% |
| Northern Europe | 9,058 | 0.3% |
| Norway | 104 | 0.0% |
| Oceania | 1,517 | 0.1% |
| Pakistan | 5,433 | 0.2% |
| Panama | 344 | 0.0% |
| Peru | 3,621 | 0.1% |
| Philippines | 22,260 | 0.8% |
| Poland | 29,521 | 1.1% |
| Portugal | 149 | 0.0% |
| Romania | 5,216 | 0.2% |
| Russia | 4,277 | 0.2% |
| Saudi Arabia | 835 | 0.0% |
| Scotland | 191 | 0.0% |
| Senegal | 182 | 0.0% |
| Serbia | 3,094 | 0.1% |
| Sierra Leone | 179 | 0.0% |
| Singapore | 410 | 0.0% |
| Somalia | 548 | 0.0% |
| South Africa | 767 | 0.0% |
| South America | 32,984 | 1.2% |
| South Central Asia | 37,837 | 1.4% |
| South Eastern Asia | 38,071 | 1.4% |
| Southern Europe | 6,805 | 0.3% |
| Spain | 1,230 | 0.1% |
| Sri Lanka | 574 | 0.0% |
| St. Vincent and the Grenadines | 11 | 0.0% |
| Sudan | 124 | 0.0% |
| Sweden | 362 | 0.0% |
| Switzerland | 409 | 0.0% |
| Syria | 1,270 | 0.1% |
| Taiwan | 1,846 | 0.1% |
| Thailand | 2,925 | 0.1% |
| Trinidad and Tobago | 299 | 0.0% |
| Turkey | 1,794 | 0.1% |
| Uganda | 166 | 0.0% |
| Ukraine | 7,333 | 0.3% |
| Uruguay | 194 | 0.0% |
| Uzbekistan | 264 | 0.0% |
| Venezuela | 4,509 | 0.2% |
| Vietnam | 8,325 | 0.3% |
| West Indies | 47 | 0.0% |
| Western Africa | 14,678 | 0.5% |
| Western Asia | 12,346 | 0.4% |
| Western Europe | 8,649 | 0.3% |
| Yemen | 473 | 0.0% |
| Zaire | 510 | 0.0% |
| Zimbabwe | 132 | 0.0% | View All 134 Rows |
Sex and Age in Chicago
Sex and Age in Chicago
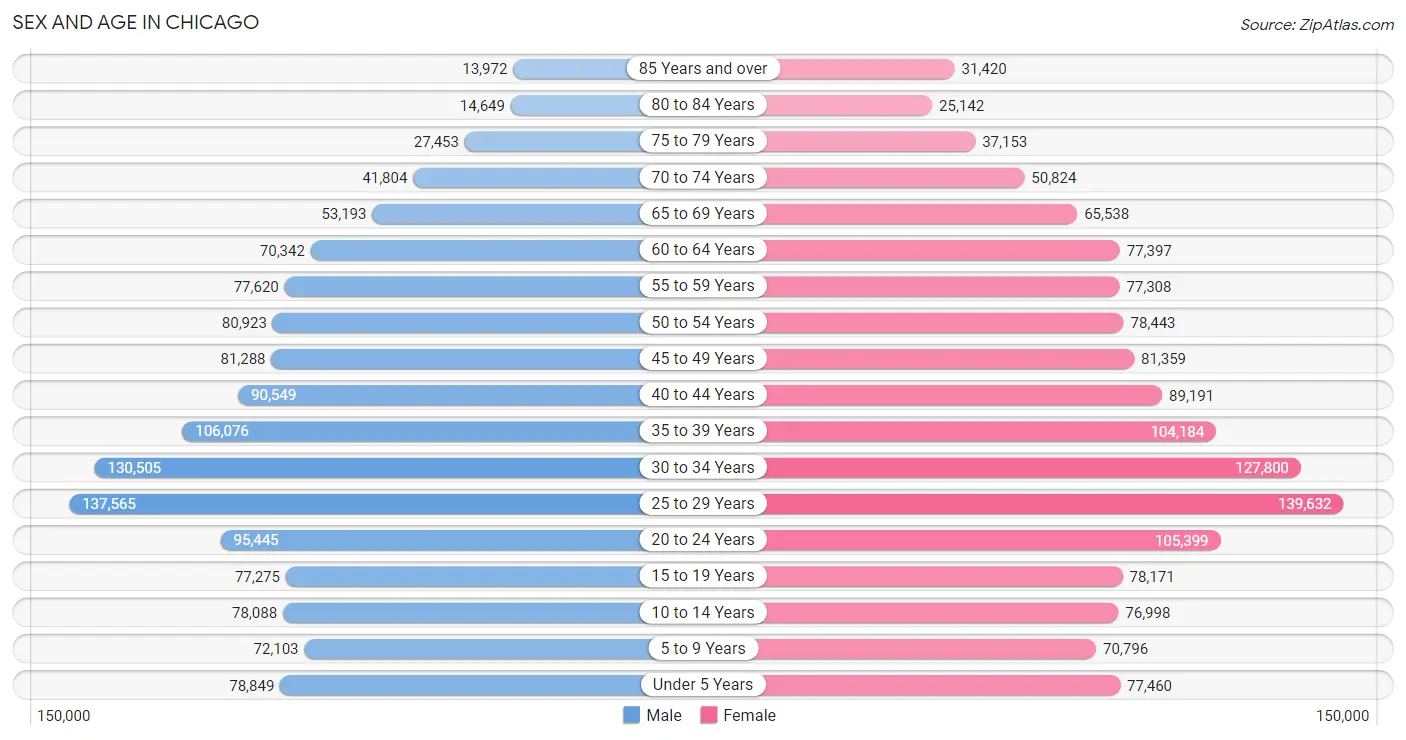
The most populous age groups in Chicago are 25 to 29 Years (137,565 | 10.4%) for men and 25 to 29 Years (139,632 | 10.0%) for women.
| Age Bracket | Male | Female |
| Under 5 Years | 78,849 (5.9%) | 77,460 (5.6%) |
| 5 to 9 Years | 72,103 (5.4%) | 70,796 (5.1%) |
| 10 to 14 Years | 78,088 (5.9%) | 76,998 (5.5%) |
| 15 to 19 Years | 77,275 (5.8%) | 78,171 (5.6%) |
| 20 to 24 Years | 95,445 (7.2%) | 105,399 (7.6%) |
| 25 to 29 Years | 137,565 (10.4%) | 139,632 (10.0%) |
| 30 to 34 Years | 130,505 (9.8%) | 127,800 (9.2%) |
| 35 to 39 Years | 106,076 (8.0%) | 104,184 (7.5%) |
| 40 to 44 Years | 90,549 (6.8%) | 89,191 (6.4%) |
| 45 to 49 Years | 81,288 (6.1%) | 81,359 (5.8%) |
| 50 to 54 Years | 80,923 (6.1%) | 78,443 (5.6%) |
| 55 to 59 Years | 77,620 (5.9%) | 77,308 (5.5%) |
| 60 to 64 Years | 70,342 (5.3%) | 77,397 (5.6%) |
| 65 to 69 Years | 53,193 (4.0%) | 65,538 (4.7%) |
| 70 to 74 Years | 41,804 (3.2%) | 50,824 (3.6%) |
| 75 to 79 Years | 27,453 (2.1%) | 37,153 (2.7%) |
| 80 to 84 Years | 14,649 (1.1%) | 25,142 (1.8%) |
| 85 Years and over | 13,972 (1.1%) | 31,420 (2.2%) |
| Total | 1,327,699 (100.0%) | 1,394,215 (100.0%) |
Families and Households in Chicago
Median Family Size in Chicago
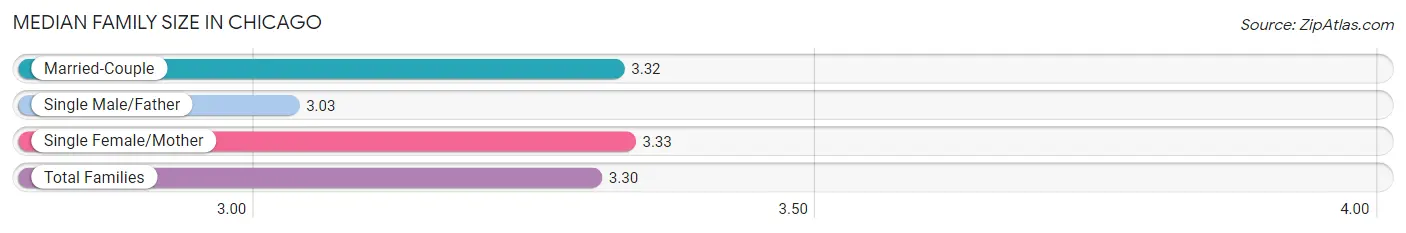
The median family size in Chicago is 3.30 persons per family, with single female/mother families (163,786 | 28.3%) accounting for the largest median family size of 3.33 persons per family. On the other hand, single male/father families (56,730 | 9.8%) represent the smallest median family size with 3.03 persons per family.
| Family Type | # Families | Family Size |
| Married-Couple | 357,408 (61.8%) | 3.32 |
| Single Male/Father | 56,730 (9.8%) | 3.03 |
| Single Female/Mother | 163,786 (28.3%) | 3.33 |
| Total Families | 577,924 (100.0%) | 3.30 |
Median Household Size in Chicago
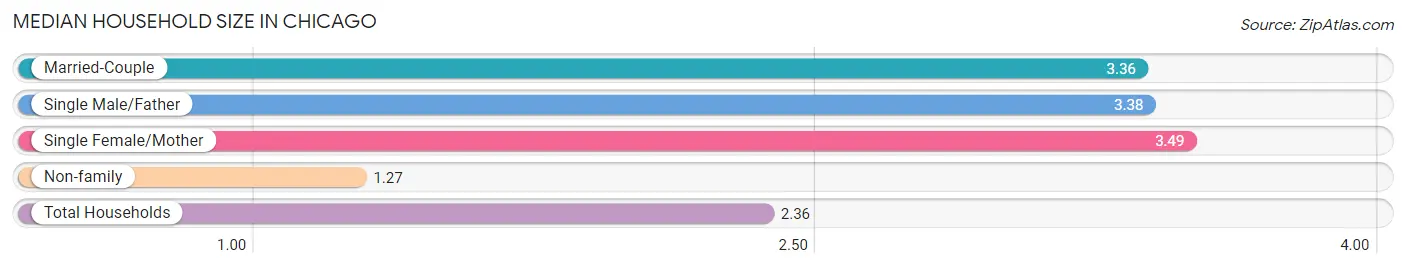
The median household size in Chicago is 2.36 persons per household, with single female/mother households (163,786 | 14.5%) accounting for the largest median household size of 3.49 persons per household. non-family households (551,984 | 48.8%) represent the smallest median household size with 1.27 persons per household.
| Household Type | # Households | Household Size |
| Married-Couple | 357,408 (31.6%) | 3.36 |
| Single Male/Father | 56,730 (5.0%) | 3.38 |
| Single Female/Mother | 163,786 (14.5%) | 3.49 |
| Non-family | 551,984 (48.8%) | 1.27 |
| Total Households | 1,129,908 (100.0%) | 2.36 |
Household Size by Marriage Status in Chicago
Out of a total of 1,129,908 households in Chicago, 577,924 (51.1%) are family households, while 551,984 (48.8%) are nonfamily households. The most numerous type of family households are 2-person households, comprising 236,889, and the most common type of nonfamily households are 1-person households, comprising 436,681.
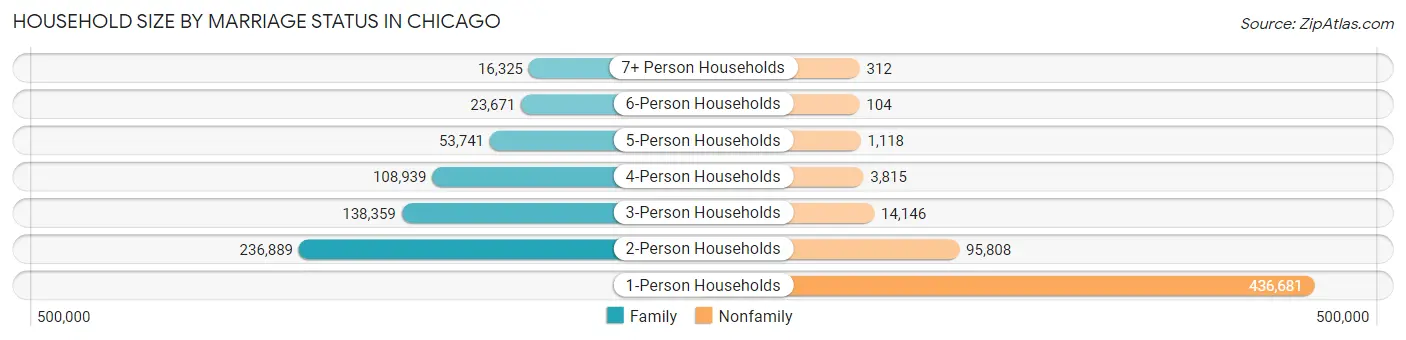
| Household Size | Family Households | Nonfamily Households |
| 1-Person Households | - | 436,681 (38.7%) |
| 2-Person Households | 236,889 (21.0%) | 95,808 (8.5%) |
| 3-Person Households | 138,359 (12.2%) | 14,146 (1.3%) |
| 4-Person Households | 108,939 (9.6%) | 3,815 (0.3%) |
| 5-Person Households | 53,741 (4.8%) | 1,118 (0.1%) |
| 6-Person Households | 23,671 (2.1%) | 104 (0.0%) |
| 7+ Person Households | 16,325 (1.4%) | 312 (0.0%) |
| Total | 577,924 (51.1%) | 551,984 (48.8%) |
Female Fertility in Chicago
Fertility by Age in Chicago
Average fertility rate in Chicago is 45.0 births per 1,000 women. Women in the age bracket of 20 to 34 years have the highest fertility rate with 59.0 births per 1,000 women. Women in the age bracket of 20 to 34 years acount for 64.9% of all women with births.
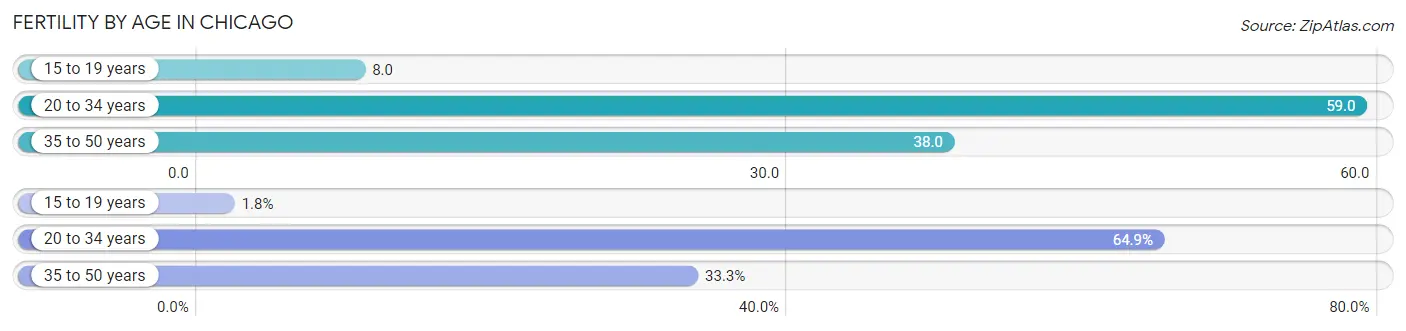
| Age Bracket | Women with Births | Births / 1,000 Women |
| 15 to 19 years | 612 (1.8%) | 8.0 |
| 20 to 34 years | 21,977 (64.9%) | 59.0 |
| 35 to 50 years | 11,256 (33.3%) | 38.0 |
| Total | 33,845 (100.0%) | 45.0 |
Fertility by Age by Marriage Status in Chicago
63.6% of women with births (33,845) in Chicago are married. The highest percentage of unmarried women with births falls into 15 to 19 years age bracket with 98.9% of them unmarried at the time of birth, while the lowest percentage of unmarried women with births belong to 35 to 50 years age bracket with 21.1% of them unmarried.
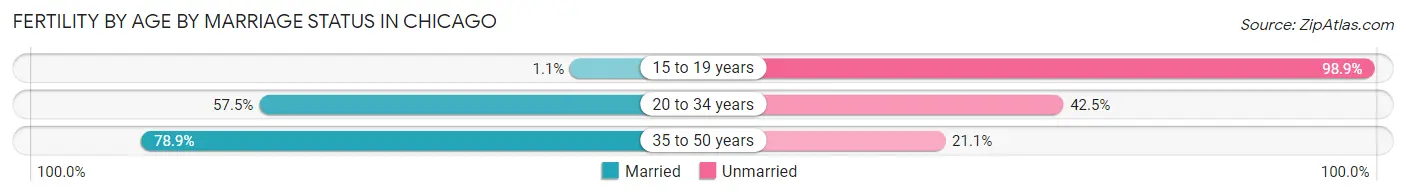
| Age Bracket | Married | Unmarried |
| 15 to 19 years | 7 (1.1%) | 605 (98.9%) |
| 20 to 34 years | 12,637 (57.5%) | 9,340 (42.5%) |
| 35 to 50 years | 8,881 (78.9%) | 2,375 (21.1%) |
| Total | 21,525 (63.6%) | 12,320 (36.4%) |
Fertility by Education in Chicago
Average fertility rate in Chicago is 45.0 births per 1,000 women. Women with the education attainment of graduate degree have the highest fertility rate of 57.0 births per 1,000 women, while women with the education attainment of less than high school have the lowest fertility at 37.0 births per 1,000 women. Women with the education attainment of college or associate's degree represent 24.8% of all women with births.
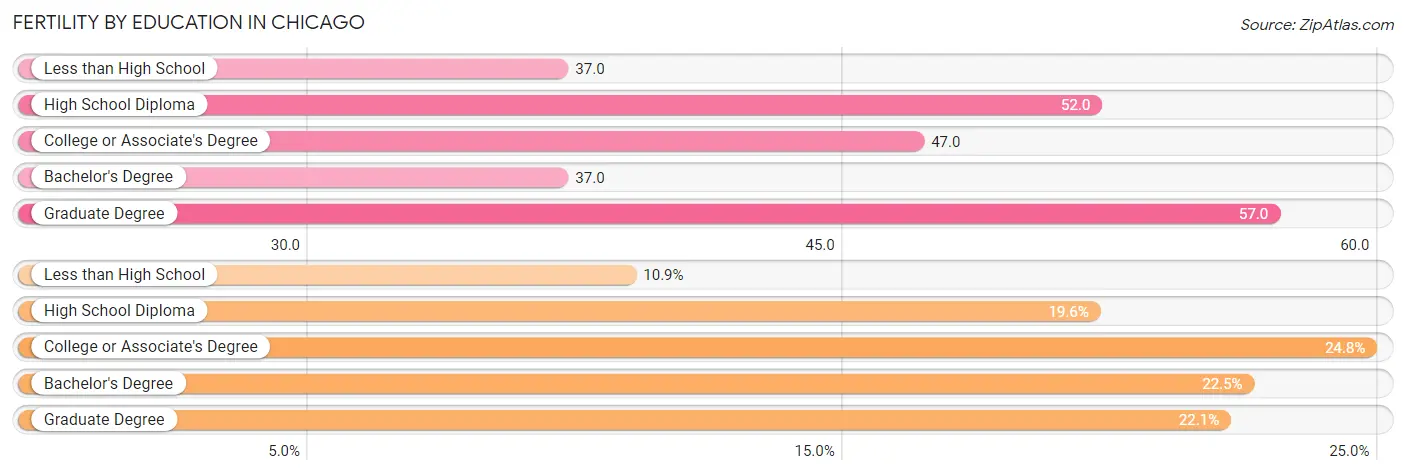
| Educational Attainment | Women with Births | Births / 1,000 Women |
| Less than High School | 3,704 (10.9%) | 37.0 |
| High School Diploma | 6,646 (19.6%) | 52.0 |
| College or Associate's Degree | 8,401 (24.8%) | 47.0 |
| Bachelor's Degree | 7,621 (22.5%) | 37.0 |
| Graduate Degree | 7,473 (22.1%) | 57.0 |
| Total | 33,845 (100.0%) | 45.0 |
Fertility by Education by Marriage Status in Chicago
36.4% of women with births in Chicago are unmarried. Women with the educational attainment of graduate degree are most likely to be married with 93.2% of them married at childbirth, while women with the educational attainment of less than high school are least likely to be married with 63.9% of them unmarried at childbirth.
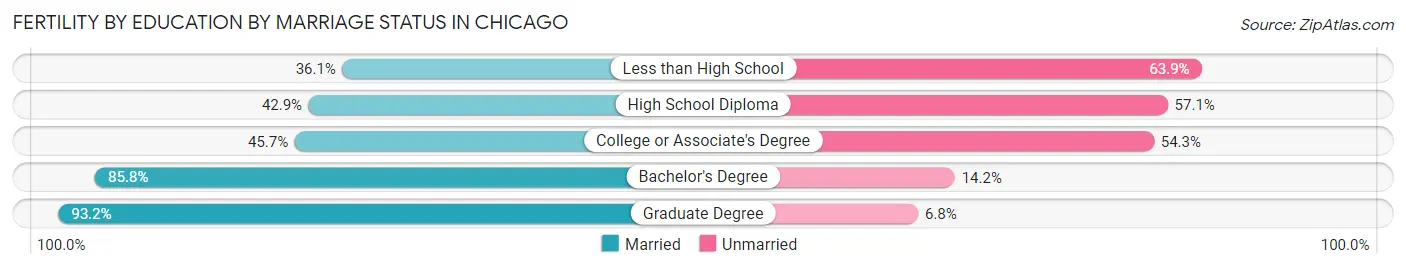
| Educational Attainment | Married | Unmarried |
| Less than High School | 1,337 (36.1%) | 2,367 (63.9%) |
| High School Diploma | 2,851 (42.9%) | 3,795 (57.1%) |
| College or Associate's Degree | 3,839 (45.7%) | 4,562 (54.3%) |
| Bachelor's Degree | 6,539 (85.8%) | 1,082 (14.2%) |
| Graduate Degree | 6,965 (93.2%) | 508 (6.8%) |
| Total | 21,525 (63.6%) | 12,320 (36.4%) |
Employment Characteristics in Chicago
Employment by Class of Employer in Chicago
Among the 1,352,496 employed individuals in Chicago, private company employees (916,769 | 67.8%), not-for-profit organizations (157,012 | 11.6%), and local government employees (102,820 | 7.6%) make up the most common classes of employment.
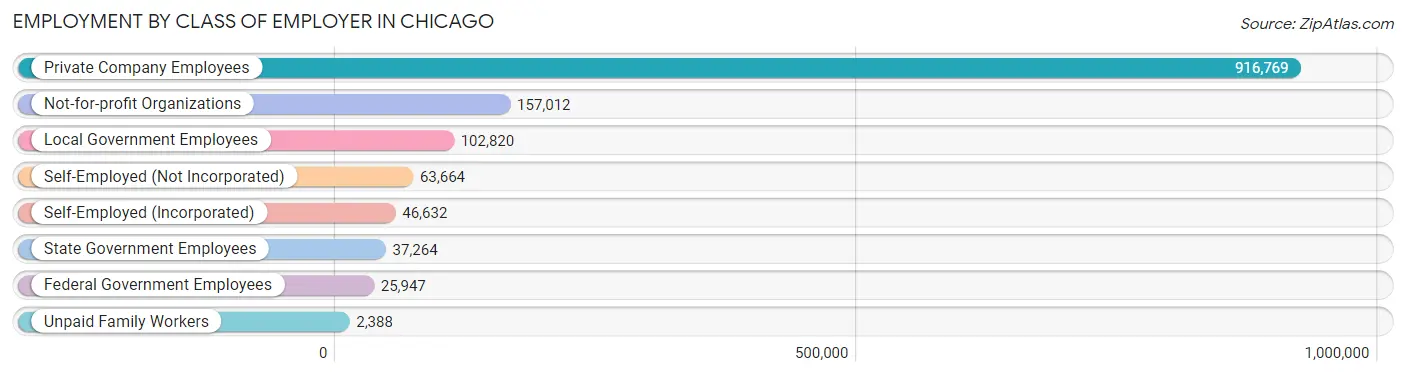
| Employer Class | # Employees | % Employees |
| Private Company Employees | 916,769 | 67.8% |
| Self-Employed (Incorporated) | 46,632 | 3.5% |
| Self-Employed (Not Incorporated) | 63,664 | 4.7% |
| Not-for-profit Organizations | 157,012 | 11.6% |
| Local Government Employees | 102,820 | 7.6% |
| State Government Employees | 37,264 | 2.8% |
| Federal Government Employees | 25,947 | 1.9% |
| Unpaid Family Workers | 2,388 | 0.2% |
| Total | 1,352,496 | 100.0% |
Employment Status by Age in Chicago
According to the labor force statistics for Chicago, out of the total population over 16 years of age (2,237,215), 67.3% or 1,505,646 individuals are in the labor force, with 8.2% or 123,463 of them unemployed. The age group with the highest labor force participation rate is 30 to 34 years, with 88.0% or 227,308 individuals in the labor force. Within the labor force, the 16 to 19 years age range has the highest percentage of unemployed individuals, with 29.4% or 10,183 of them being unemployed.
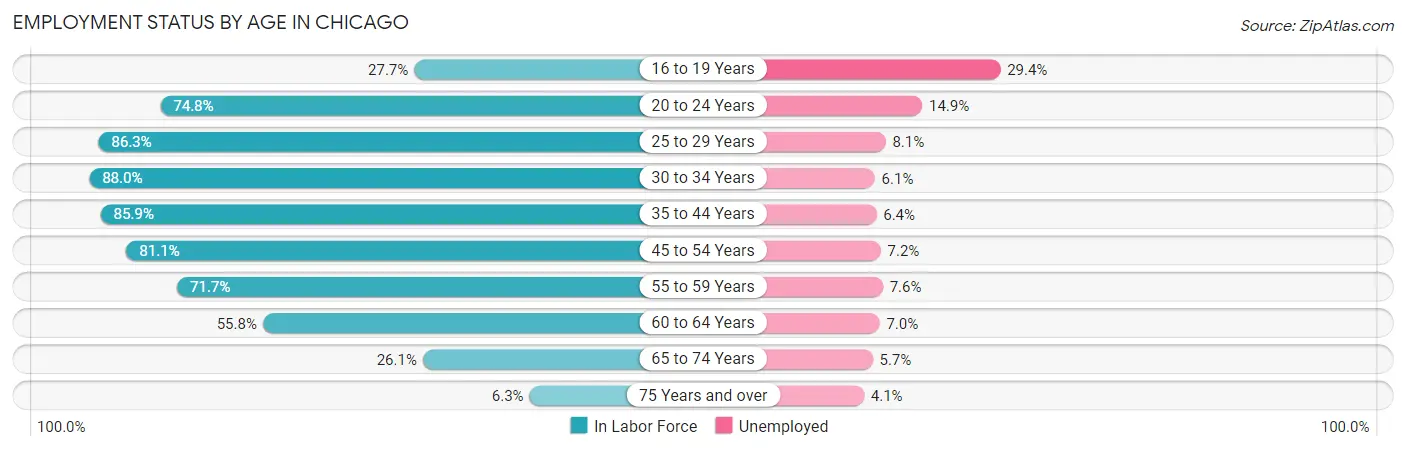
| Age Bracket | In Labor Force | Unemployed |
| 16 to 19 Years | 34,636 (27.7%) | 10,183 (29.4%) |
| 20 to 24 Years | 150,231 (74.8%) | 22,384 (14.9%) |
| 25 to 29 Years | 239,221 (86.3%) | 19,377 (8.1%) |
| 30 to 34 Years | 227,308 (88.0%) | 13,866 (6.1%) |
| 35 to 44 Years | 335,010 (85.9%) | 21,441 (6.4%) |
| 45 to 54 Years | 261,153 (81.1%) | 18,803 (7.2%) |
| 55 to 59 Years | 111,083 (71.7%) | 8,442 (7.6%) |
| 60 to 64 Years | 82,438 (55.8%) | 5,771 (7.0%) |
| 65 to 74 Years | 55,165 (26.1%) | 3,144 (5.7%) |
| 75 Years and over | 9,437 (6.3%) | 387 (4.1%) |
| Total | 1,505,646 (67.3%) | 123,463 (8.2%) |
Employment Status by Educational Attainment in Chicago
According to labor force statistics for Chicago, 81.0% of individuals (1,255,647) out of the total population between 25 and 64 years of age (1,550,182) are in the labor force, with 7.0% or 87,895 of them being unemployed. The group with the highest labor force participation rate are those with the educational attainment of bachelor's degree or higher, with 90.7% or 645,575 individuals in the labor force. Within the labor force, individuals with high school diploma education have the highest percentage of unemployment, with 12.2% or 27,261 of them being unemployed.
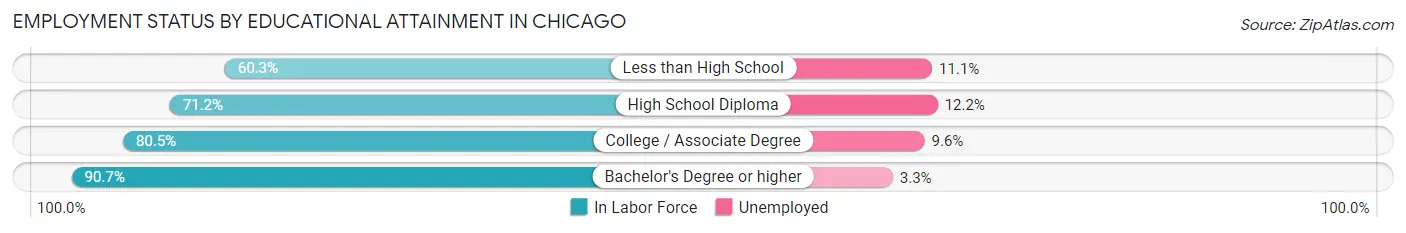
| Educational Attainment | In Labor Force | Unemployed |
| Less than High School | 105,190 (60.3%) | 19,363 (11.1%) |
| High School Diploma | 223,447 (71.2%) | 38,287 (12.2%) |
| College / Associate Degree | 281,861 (80.5%) | 33,613 (9.6%) |
| Bachelor's Degree or higher | 645,575 (90.7%) | 23,488 (3.3%) |
| Total | 1,255,647 (81.0%) | 108,513 (7.0%) |
Employment Occupations by Sex in Chicago
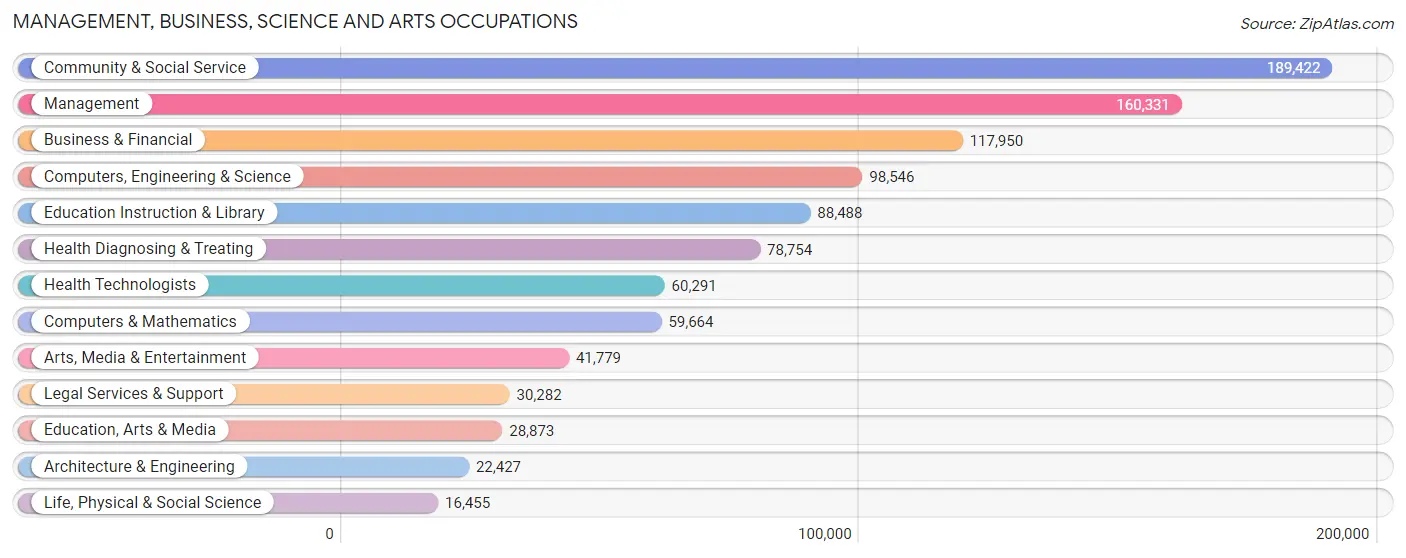
Management, Business, Science and Arts Occupations
The most common Management, Business, Science and Arts occupations in Chicago are Community & Social Service (189,422 | 13.7%), Management (160,331 | 11.6%), Business & Financial (117,950 | 8.5%), Computers, Engineering & Science (98,546 | 7.1%), and Education Instruction & Library (88,488 | 6.4%).
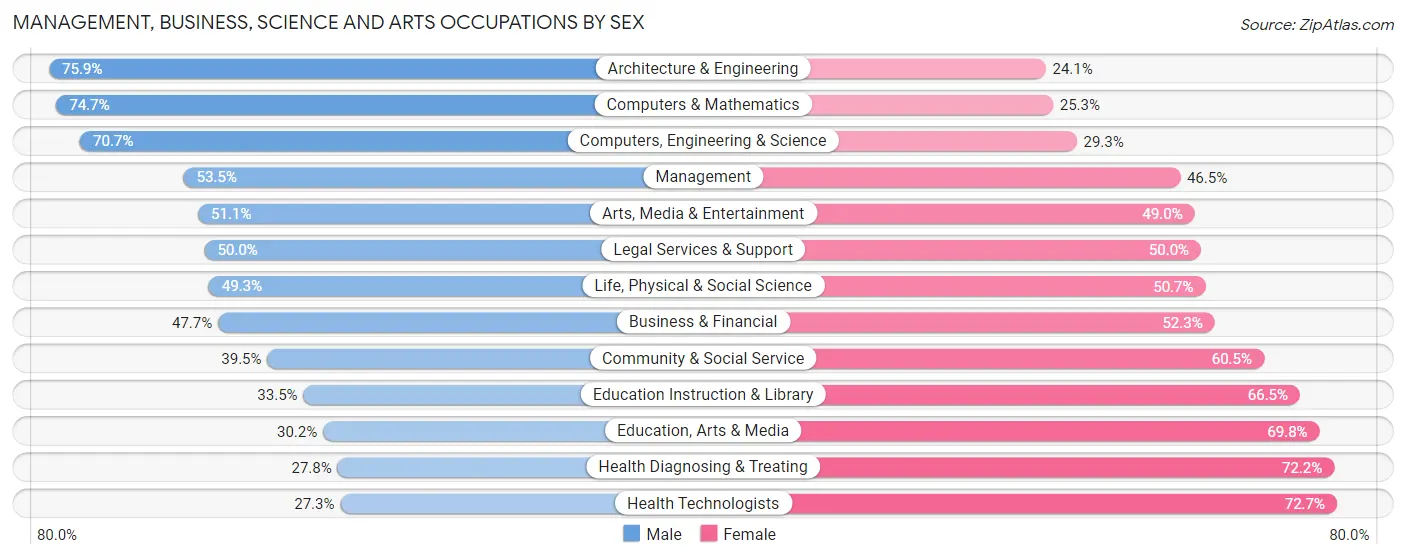
Management, Business, Science and Arts Occupations by Sex
Within the Management, Business, Science and Arts occupations in Chicago, the most male-oriented occupations are Architecture & Engineering (75.9%), Computers & Mathematics (74.7%), and Computers, Engineering & Science (70.7%), while the most female-oriented occupations are Health Technologists (72.7%), Health Diagnosing & Treating (72.2%), and Education, Arts & Media (69.8%).
| Occupation | Male | Female |
| Management | 85,722 (53.5%) | 74,609 (46.5%) |
| Business & Financial | 56,287 (47.7%) | 61,663 (52.3%) |
| Computers, Engineering & Science | 69,697 (70.7%) | 28,849 (29.3%) |
| Computers & Mathematics | 44,571 (74.7%) | 15,093 (25.3%) |
| Architecture & Engineering | 17,021 (75.9%) | 5,406 (24.1%) |
| Life, Physical & Social Science | 8,105 (49.3%) | 8,350 (50.7%) |
| Community & Social Service | 74,799 (39.5%) | 114,623 (60.5%) |
| Education, Arts & Media | 8,720 (30.2%) | 20,153 (69.8%) |
| Legal Services & Support | 15,135 (50.0%) | 15,147 (50.0%) |
| Education Instruction & Library | 29,614 (33.5%) | 58,874 (66.5%) |
| Arts, Media & Entertainment | 21,330 (51.0%) | 20,449 (48.9%) |
| Health Diagnosing & Treating | 21,871 (27.8%) | 56,883 (72.2%) |
| Health Technologists | 16,468 (27.3%) | 43,823 (72.7%) |
| Total (Category) | 308,376 (47.8%) | 336,627 (52.2%) |
| Total (Overall) | 711,392 (51.5%) | 669,726 (48.5%) |
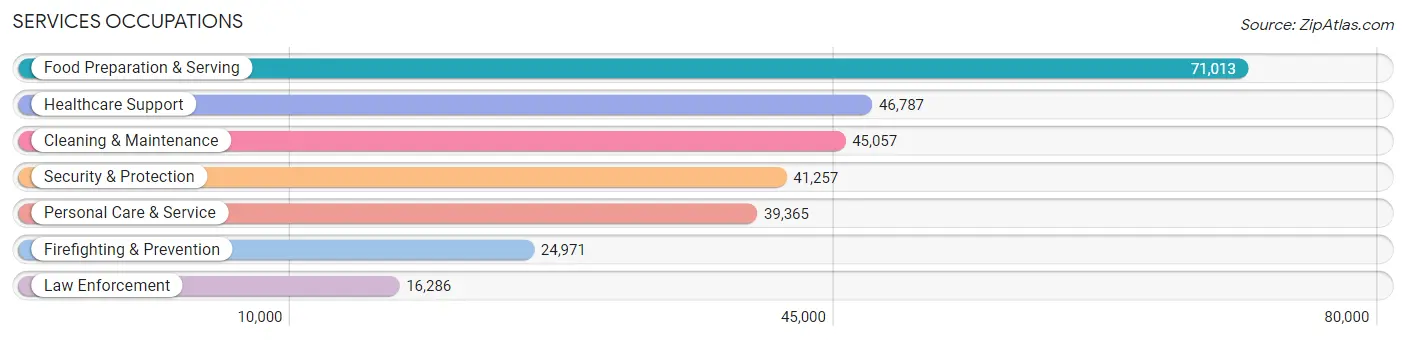
Services Occupations
The most common Services occupations in Chicago are Food Preparation & Serving (71,013 | 5.1%), Healthcare Support (46,787 | 3.4%), Cleaning & Maintenance (45,057 | 3.3%), Security & Protection (41,257 | 3.0%), and Personal Care & Service (39,365 | 2.9%).
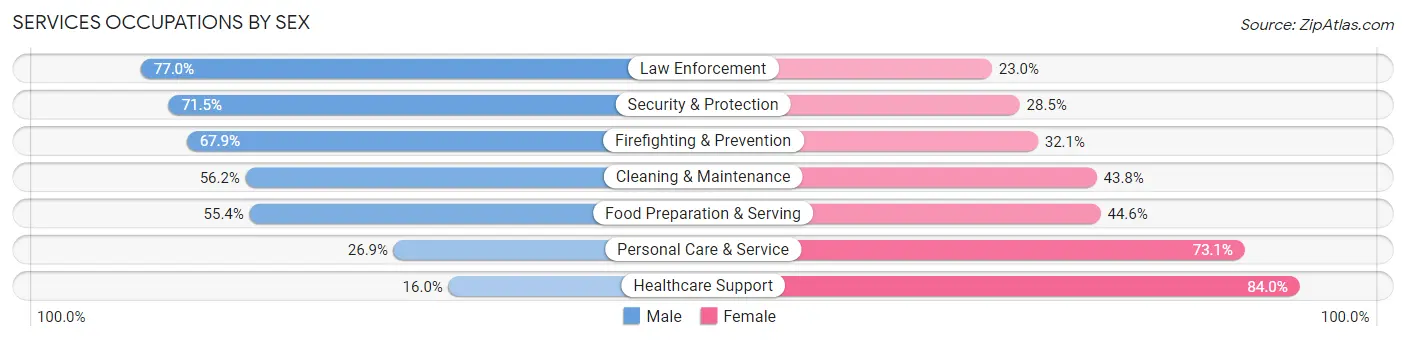
Services Occupations by Sex
Within the Services occupations in Chicago, the most male-oriented occupations are Law Enforcement (77.0%), Security & Protection (71.5%), and Firefighting & Prevention (67.9%), while the most female-oriented occupations are Healthcare Support (84.0%), Personal Care & Service (73.1%), and Food Preparation & Serving (44.6%).
| Occupation | Male | Female |
| Healthcare Support | 7,501 (16.0%) | 39,286 (84.0%) |
| Security & Protection | 29,483 (71.5%) | 11,774 (28.5%) |
| Firefighting & Prevention | 16,947 (67.9%) | 8,024 (32.1%) |
| Law Enforcement | 12,536 (77.0%) | 3,750 (23.0%) |
| Food Preparation & Serving | 39,368 (55.4%) | 31,645 (44.6%) |
| Cleaning & Maintenance | 25,329 (56.2%) | 19,728 (43.8%) |
| Personal Care & Service | 10,583 (26.9%) | 28,782 (73.1%) |
| Total (Category) | 112,264 (46.1%) | 131,215 (53.9%) |
| Total (Overall) | 711,392 (51.5%) | 669,726 (48.5%) |
Sales and Office Occupations
The most common Sales and Office occupations in Chicago are Office & Administration (136,550 | 9.9%), and Sales & Related (122,402 | 8.9%).

Sales and Office Occupations by Sex

| Occupation | Male | Female |
| Sales & Related | 59,311 (48.5%) | 63,091 (51.5%) |
| Office & Administration | 43,671 (32.0%) | 92,879 (68.0%) |
| Total (Category) | 102,982 (39.8%) | 155,970 (60.2%) |
| Total (Overall) | 711,392 (51.5%) | 669,726 (48.5%) |
Natural Resources, Construction and Maintenance Occupations
The most common Natural Resources, Construction and Maintenance occupations in Chicago are Construction & Extraction (41,434 | 3.0%), Installation, Maintenance & Repair (23,346 | 1.7%), and Farming, Fishing & Forestry (1,429 | 0.1%).

Natural Resources, Construction and Maintenance Occupations by Sex

| Occupation | Male | Female |
| Farming, Fishing & Forestry | 980 (68.6%) | 449 (31.4%) |
| Construction & Extraction | 40,010 (96.6%) | 1,424 (3.4%) |
| Installation, Maintenance & Repair | 22,419 (96.0%) | 927 (4.0%) |
| Total (Category) | 63,409 (95.8%) | 2,800 (4.2%) |
| Total (Overall) | 711,392 (51.5%) | 669,726 (48.5%) |
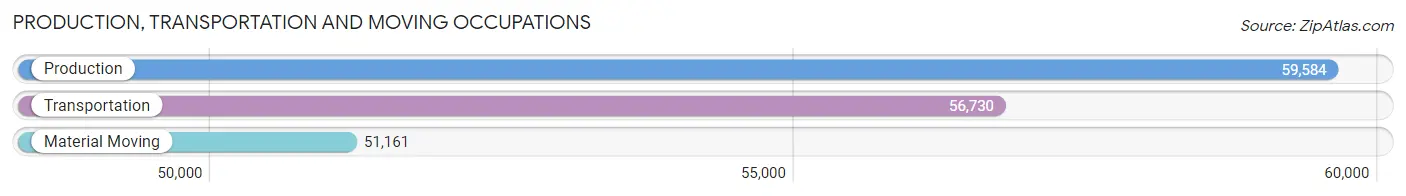
Production, Transportation and Moving Occupations
The most common Production, Transportation and Moving occupations in Chicago are Production (59,584 | 4.3%), Transportation (56,730 | 4.1%), and Material Moving (51,161 | 3.7%).
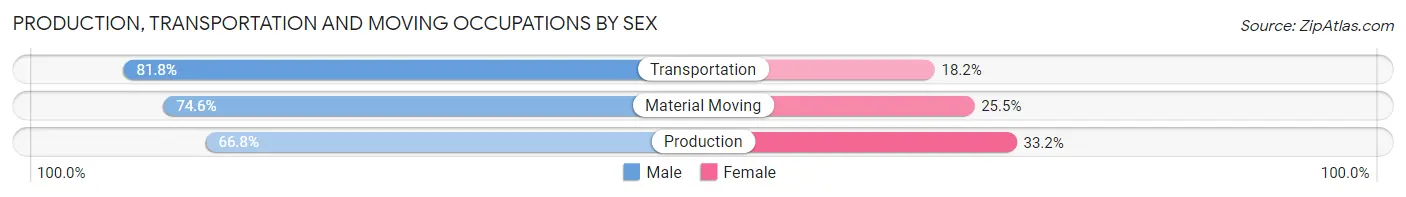
Production, Transportation and Moving Occupations by Sex
| Occupation | Male | Female |
| Production | 39,795 (66.8%) | 19,789 (33.2%) |
| Transportation | 46,428 (81.8%) | 10,302 (18.2%) |
| Material Moving | 38,138 (74.6%) | 13,023 (25.5%) |
| Total (Category) | 124,361 (74.3%) | 43,114 (25.7%) |
| Total (Overall) | 711,392 (51.5%) | 669,726 (48.5%) |
Employment Industries by Sex in Chicago
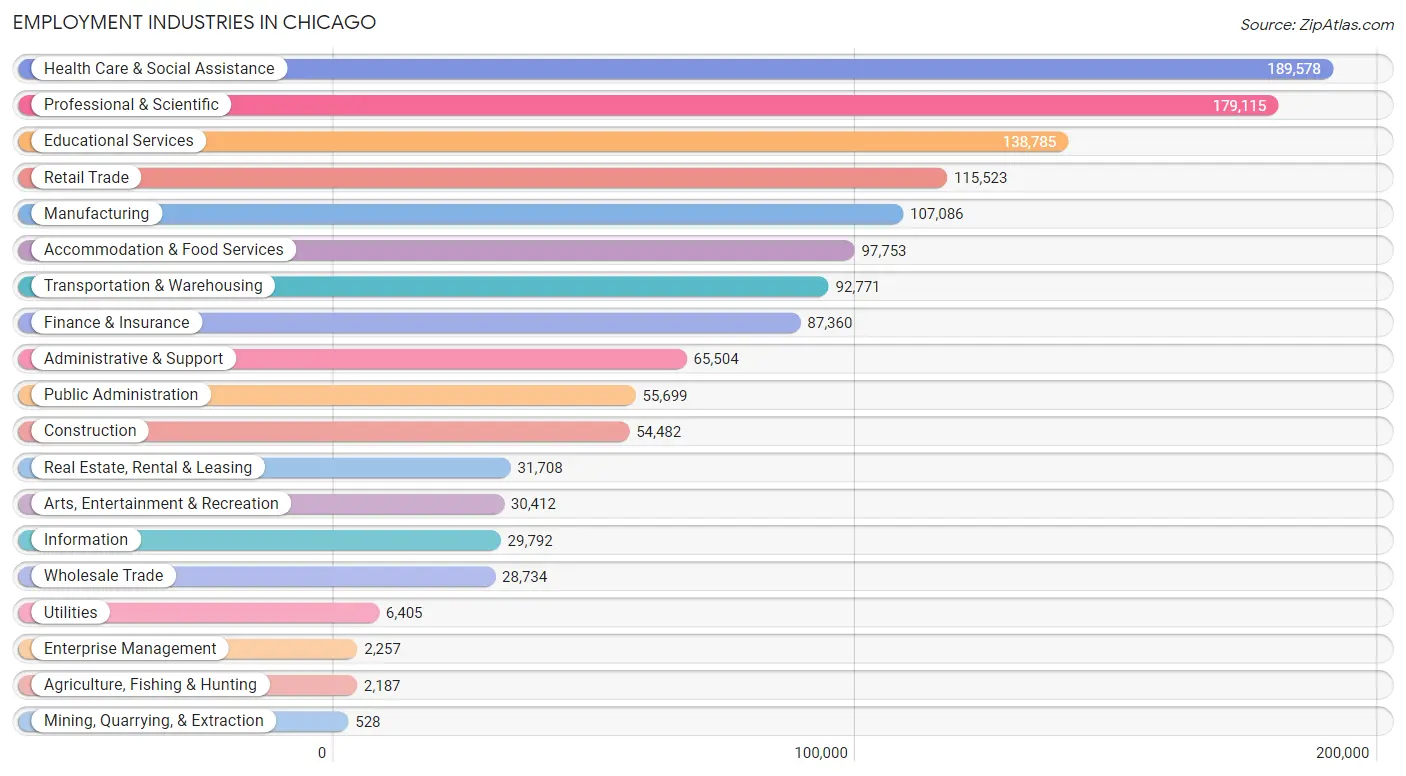
Employment Industries in Chicago
The major employment industries in Chicago include Health Care & Social Assistance (189,578 | 13.7%), Professional & Scientific (179,115 | 13.0%), Educational Services (138,785 | 10.1%), Retail Trade (115,523 | 8.4%), and Manufacturing (107,086 | 7.7%).
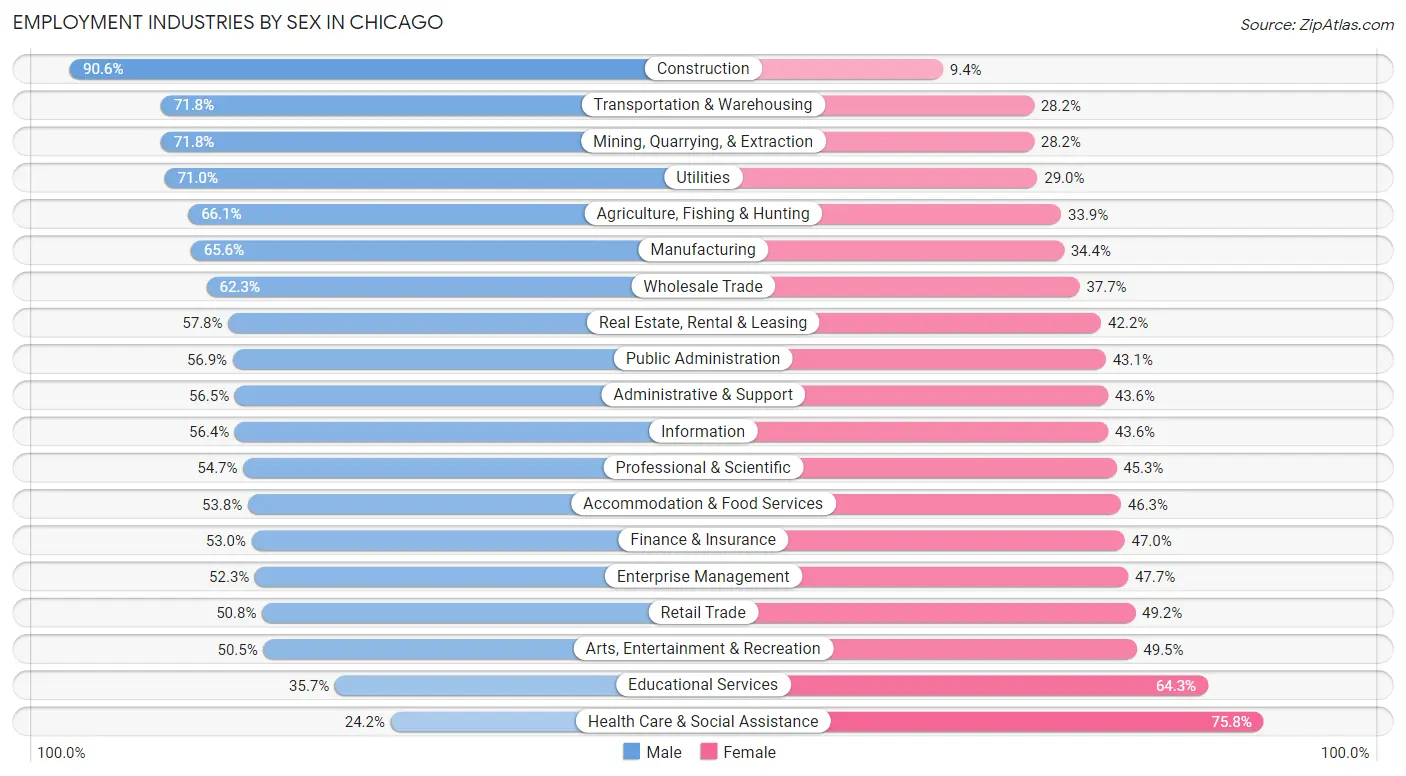
Employment Industries by Sex in Chicago
The Chicago industries that see more men than women are Construction (90.6%), Transportation & Warehousing (71.8%), and Mining, Quarrying, & Extraction (71.8%), whereas the industries that tend to have a higher number of women are Health Care & Social Assistance (75.8%), Educational Services (64.3%), and Arts, Entertainment & Recreation (49.5%).
| Industry | Male | Female |
| Agriculture, Fishing & Hunting | 1,446 (66.1%) | 741 (33.9%) |
| Mining, Quarrying, & Extraction | 379 (71.8%) | 149 (28.2%) |
| Construction | 49,357 (90.6%) | 5,125 (9.4%) |
| Manufacturing | 70,229 (65.6%) | 36,857 (34.4%) |
| Wholesale Trade | 17,908 (62.3%) | 10,826 (37.7%) |
| Retail Trade | 58,699 (50.8%) | 56,824 (49.2%) |
| Transportation & Warehousing | 66,602 (71.8%) | 26,169 (28.2%) |
| Utilities | 4,550 (71.0%) | 1,855 (29.0%) |
| Information | 16,813 (56.4%) | 12,979 (43.6%) |
| Finance & Insurance | 46,287 (53.0%) | 41,073 (47.0%) |
| Real Estate, Rental & Leasing | 18,338 (57.8%) | 13,370 (42.2%) |
| Professional & Scientific | 98,005 (54.7%) | 81,110 (45.3%) |
| Enterprise Management | 1,180 (52.3%) | 1,077 (47.7%) |
| Administrative & Support | 36,979 (56.5%) | 28,525 (43.5%) |
| Educational Services | 49,588 (35.7%) | 89,197 (64.3%) |
| Health Care & Social Assistance | 45,881 (24.2%) | 143,697 (75.8%) |
| Arts, Entertainment & Recreation | 15,371 (50.5%) | 15,041 (49.5%) |
| Accommodation & Food Services | 52,547 (53.7%) | 45,206 (46.3%) |
| Public Administration | 31,680 (56.9%) | 24,019 (43.1%) |
| Total | 711,392 (51.5%) | 669,726 (48.5%) |
Education in Chicago
School Enrollment in Chicago
The most common levels of schooling among the 632,447 students in Chicago are college / undergraduate (137,308 | 21.7%), high school (123,962 | 19.6%), and middle school (121,986 | 19.3%).
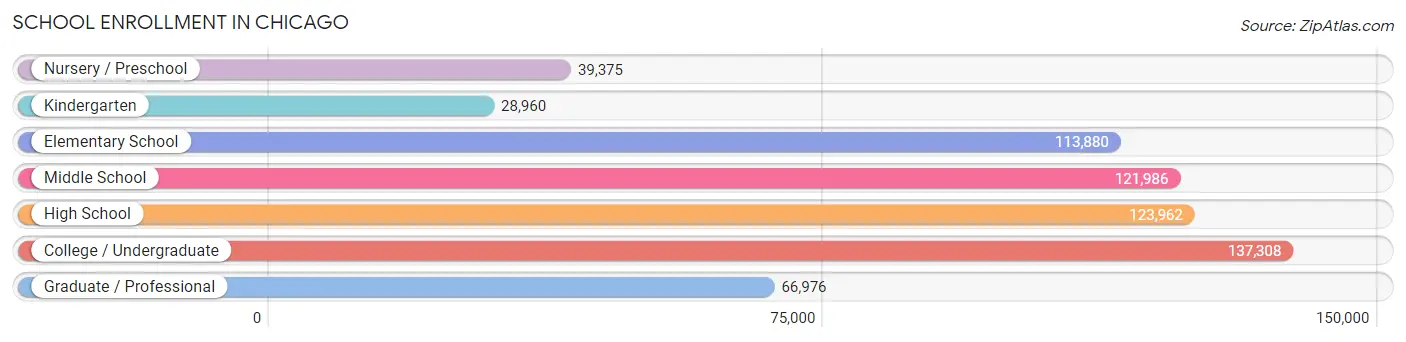
| School Level | # Students | % Students |
| Nursery / Preschool | 39,375 | 6.2% |
| Kindergarten | 28,960 | 4.6% |
| Elementary School | 113,880 | 18.0% |
| Middle School | 121,986 | 19.3% |
| High School | 123,962 | 19.6% |
| College / Undergraduate | 137,308 | 21.7% |
| Graduate / Professional | 66,976 | 10.6% |
| Total | 632,447 | 100.0% |
School Enrollment by Age by Funding Source in Chicago
Out of a total of 632,447 students who are enrolled in schools in Chicago, 180,880 (28.6%) attend a private institution, while the remaining 451,567 (71.4%) are enrolled in public schools. The age group of 25 to 34 year olds has the highest likelihood of being enrolled in private schools, with 32,037 (51.8% in the age bracket) enrolled. Conversely, the age group of 15 to 17 year olds has the lowest likelihood of being enrolled in a private school, with 72,558 (84.5% in the age bracket) attending a public institution.
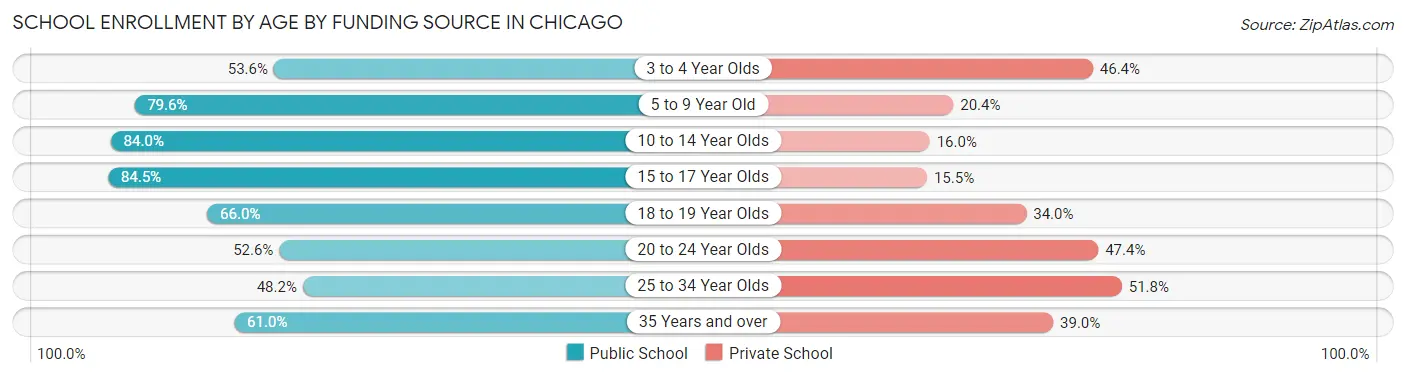
| Age Bracket | Public School | Private School |
| 3 to 4 Year Olds | 17,346 (53.6%) | 15,027 (46.4%) |
| 5 to 9 Year Old | 107,724 (79.6%) | 27,639 (20.4%) |
| 10 to 14 Year Olds | 127,184 (84.0%) | 24,275 (16.0%) |
| 15 to 17 Year Olds | 72,558 (84.5%) | 13,332 (15.5%) |
| 18 to 19 Year Olds | 33,974 (66.0%) | 17,508 (34.0%) |
| 20 to 24 Year Olds | 40,729 (52.6%) | 36,728 (47.4%) |
| 25 to 34 Year Olds | 29,795 (48.2%) | 32,037 (51.8%) |
| 35 Years and over | 22,316 (61.0%) | 14,275 (39.0%) |
| Total | 451,567 (71.4%) | 180,880 (28.6%) |
Educational Attainment by Field of Study in Chicago
Business (173,750 | 19.5%), social sciences (93,736 | 10.5%), science & technology (70,047 | 7.9%), education (61,545 | 6.9%), and communications (61,233 | 6.9%) are the most common fields of study among 891,974 individuals in Chicago who have obtained a bachelor's degree or higher.
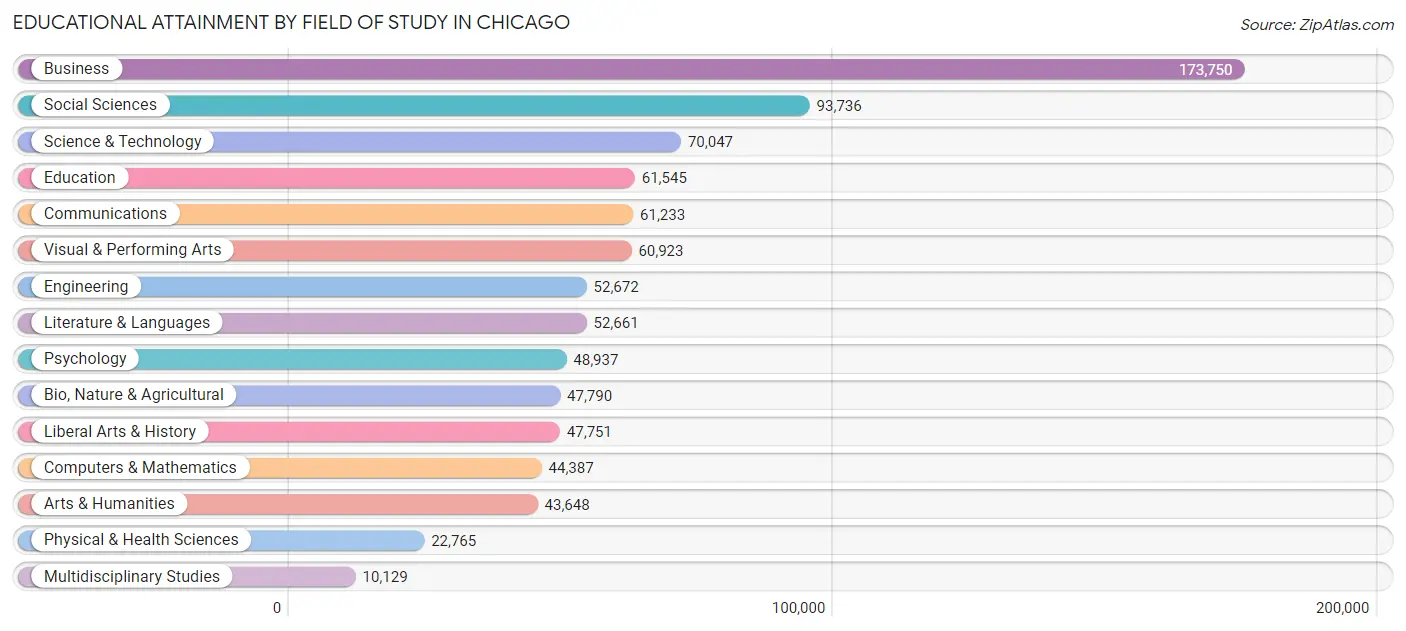
| Field of Study | # Graduates | % Graduates |
| Computers & Mathematics | 44,387 | 5.0% |
| Bio, Nature & Agricultural | 47,790 | 5.4% |
| Physical & Health Sciences | 22,765 | 2.5% |
| Psychology | 48,937 | 5.5% |
| Social Sciences | 93,736 | 10.5% |
| Engineering | 52,672 | 5.9% |
| Multidisciplinary Studies | 10,129 | 1.1% |
| Science & Technology | 70,047 | 7.9% |
| Business | 173,750 | 19.5% |
| Education | 61,545 | 6.9% |
| Literature & Languages | 52,661 | 5.9% |
| Liberal Arts & History | 47,751 | 5.3% |
| Visual & Performing Arts | 60,923 | 6.8% |
| Communications | 61,233 | 6.9% |
| Arts & Humanities | 43,648 | 4.9% |
| Total | 891,974 | 100.0% |
Transportation & Commute in Chicago
Vehicle Availability by Sex in Chicago
The most prevalent vehicle ownership categories in Chicago are males with 1 vehicle (269,388, accounting for 38.7%) and females with 1 vehicle (269,757, making up 41.4%).
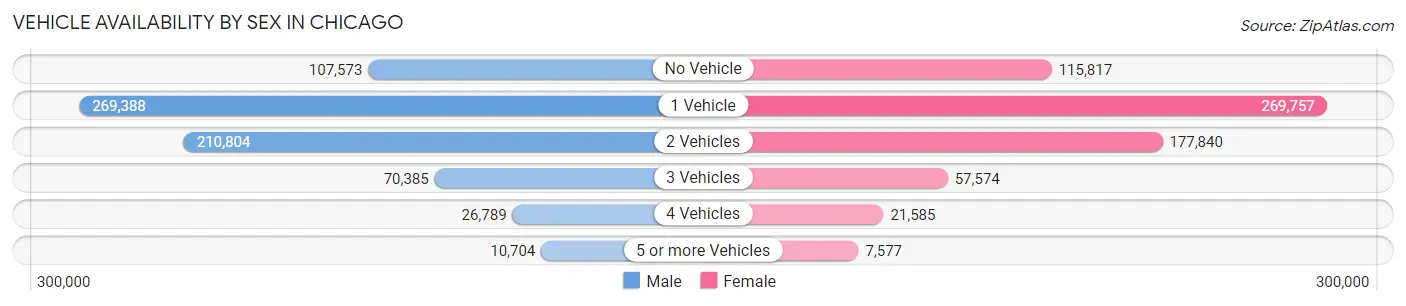
| Vehicles Available | Male | Female |
| No Vehicle | 107,573 (15.5%) | 115,817 (17.8%) |
| 1 Vehicle | 269,388 (38.7%) | 269,757 (41.5%) |
| 2 Vehicles | 210,804 (30.3%) | 177,840 (27.4%) |
| 3 Vehicles | 70,385 (10.1%) | 57,574 (8.9%) |
| 4 Vehicles | 26,789 (3.8%) | 21,585 (3.3%) |
| 5 or more Vehicles | 10,704 (1.5%) | 7,577 (1.2%) |
| Total | 695,643 (100.0%) | 650,150 (100.0%) |
Commute Time in Chicago
The most frequently occuring commute durations in Chicago are 30 to 34 minutes (221,921 commuters, 19.4%), 45 to 59 minutes (169,473 commuters, 14.8%), and 20 to 24 minutes (141,088 commuters, 12.4%).
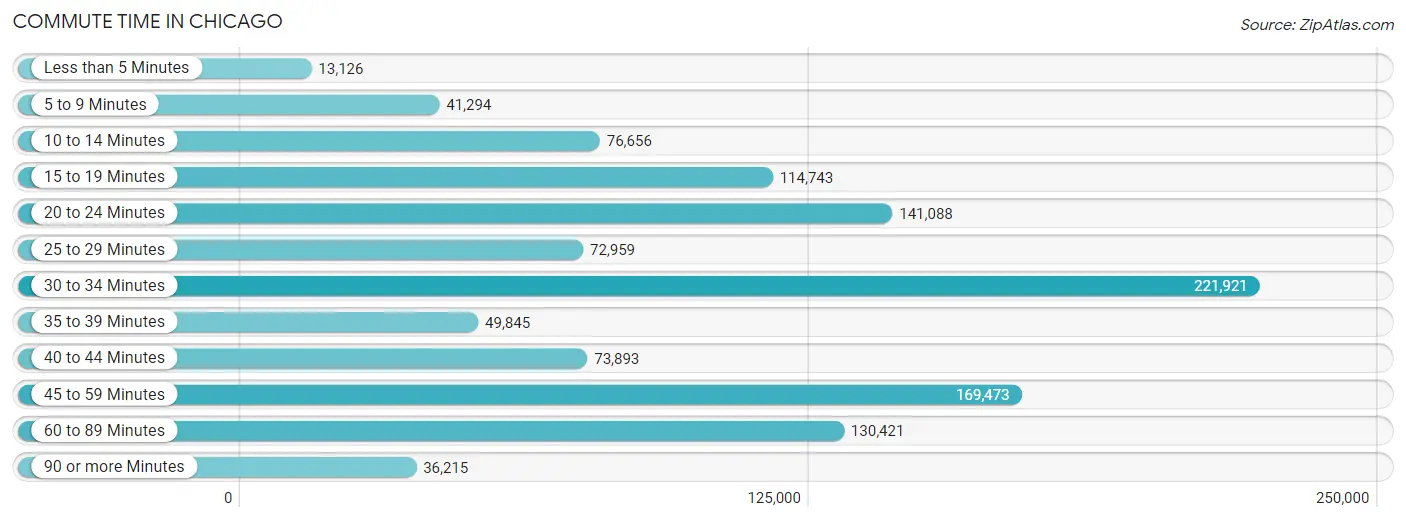
| Commute Time | # Commuters | % Commuters |
| Less than 5 Minutes | 13,126 | 1.1% |
| 5 to 9 Minutes | 41,294 | 3.6% |
| 10 to 14 Minutes | 76,656 | 6.7% |
| 15 to 19 Minutes | 114,743 | 10.1% |
| 20 to 24 Minutes | 141,088 | 12.4% |
| 25 to 29 Minutes | 72,959 | 6.4% |
| 30 to 34 Minutes | 221,921 | 19.4% |
| 35 to 39 Minutes | 49,845 | 4.4% |
| 40 to 44 Minutes | 73,893 | 6.5% |
| 45 to 59 Minutes | 169,473 | 14.8% |
| 60 to 89 Minutes | 130,421 | 11.4% |
| 90 or more Minutes | 36,215 | 3.2% |
Commute Time by Sex in Chicago
The most common commute times in Chicago are 30 to 34 minutes (119,258 commuters, 20.0%) for males and 30 to 34 minutes (102,663 commuters, 18.8%) for females.
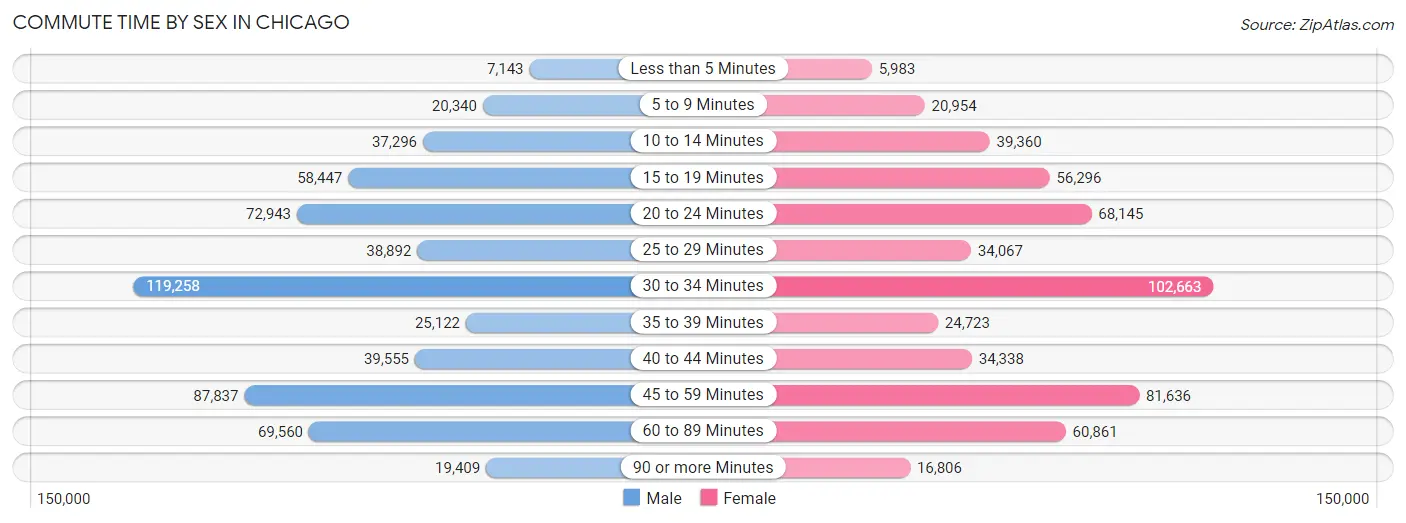
| Commute Time | Male | Female |
| Less than 5 Minutes | 7,143 (1.2%) | 5,983 (1.1%) |
| 5 to 9 Minutes | 20,340 (3.4%) | 20,954 (3.8%) |
| 10 to 14 Minutes | 37,296 (6.3%) | 39,360 (7.2%) |
| 15 to 19 Minutes | 58,447 (9.8%) | 56,296 (10.3%) |
| 20 to 24 Minutes | 72,943 (12.2%) | 68,145 (12.5%) |
| 25 to 29 Minutes | 38,892 (6.5%) | 34,067 (6.2%) |
| 30 to 34 Minutes | 119,258 (20.0%) | 102,663 (18.8%) |
| 35 to 39 Minutes | 25,122 (4.2%) | 24,723 (4.5%) |
| 40 to 44 Minutes | 39,555 (6.6%) | 34,338 (6.3%) |
| 45 to 59 Minutes | 87,837 (14.7%) | 81,636 (15.0%) |
| 60 to 89 Minutes | 69,560 (11.7%) | 60,861 (11.2%) |
| 90 or more Minutes | 19,409 (3.3%) | 16,806 (3.1%) |
Time of Departure to Work by Sex in Chicago
The most frequent times of departure to work in Chicago are 7:00 AM to 7:29 AM (82,369, 13.8%) for males and 7:00 AM to 7:29 AM (85,074, 15.6%) for females.
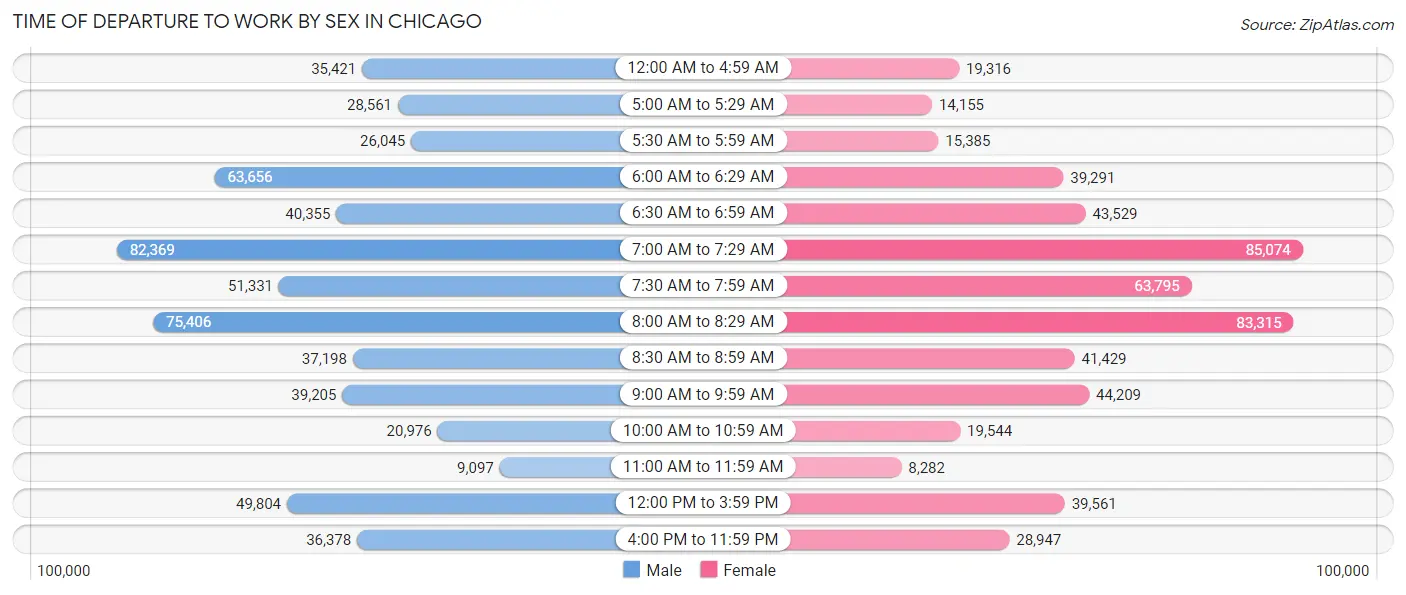
| Time of Departure | Male | Female |
| 12:00 AM to 4:59 AM | 35,421 (5.9%) | 19,316 (3.5%) |
| 5:00 AM to 5:29 AM | 28,561 (4.8%) | 14,155 (2.6%) |
| 5:30 AM to 5:59 AM | 26,045 (4.4%) | 15,385 (2.8%) |
| 6:00 AM to 6:29 AM | 63,656 (10.7%) | 39,291 (7.2%) |
| 6:30 AM to 6:59 AM | 40,355 (6.8%) | 43,529 (8.0%) |
| 7:00 AM to 7:29 AM | 82,369 (13.8%) | 85,074 (15.6%) |
| 7:30 AM to 7:59 AM | 51,331 (8.6%) | 63,795 (11.7%) |
| 8:00 AM to 8:29 AM | 75,406 (12.7%) | 83,315 (15.3%) |
| 8:30 AM to 8:59 AM | 37,198 (6.2%) | 41,429 (7.6%) |
| 9:00 AM to 9:59 AM | 39,205 (6.6%) | 44,209 (8.1%) |
| 10:00 AM to 10:59 AM | 20,976 (3.5%) | 19,544 (3.6%) |
| 11:00 AM to 11:59 AM | 9,097 (1.5%) | 8,282 (1.5%) |
| 12:00 PM to 3:59 PM | 49,804 (8.4%) | 39,561 (7.2%) |
| 4:00 PM to 11:59 PM | 36,378 (6.1%) | 28,947 (5.3%) |
| Total | 595,802 (100.0%) | 545,832 (100.0%) |
Housing Occupancy in Chicago
Occupancy by Ownership in Chicago
Of the total 1,129,908 dwellings in Chicago, owner-occupied units account for 515,235 (45.6%), while renter-occupied units make up 614,673 (54.4%).
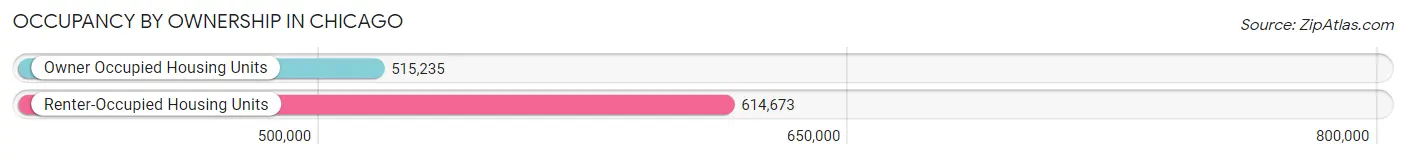
| Occupancy | # Housing Units | % Housing Units |
| Owner Occupied Housing Units | 515,235 | 45.6% |
| Renter-Occupied Housing Units | 614,673 | 54.4% |
| Total Occupied Housing Units | 1,129,908 | 100.0% |
Occupancy by Household Size in Chicago
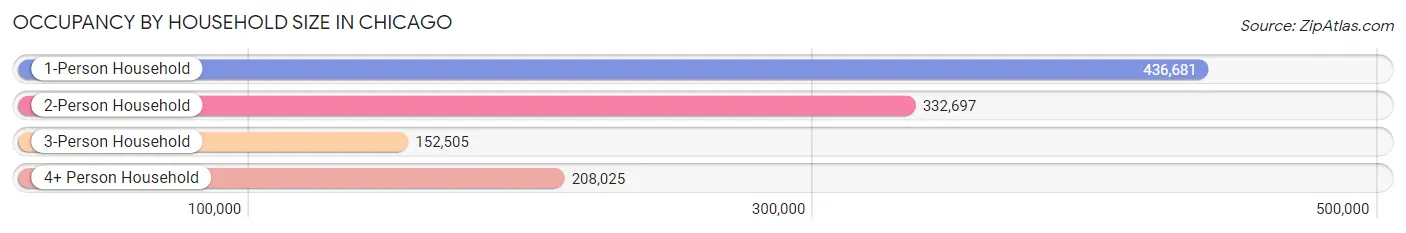
| Household Size | # Housing Units | % Housing Units |
| 1-Person Household | 436,681 | 38.7% |
| 2-Person Household | 332,697 | 29.4% |
| 3-Person Household | 152,505 | 13.5% |
| 4+ Person Household | 208,025 | 18.4% |
| Total Housing Units | 1,129,908 | 100.0% |
Occupancy by Ownership by Household Size in Chicago
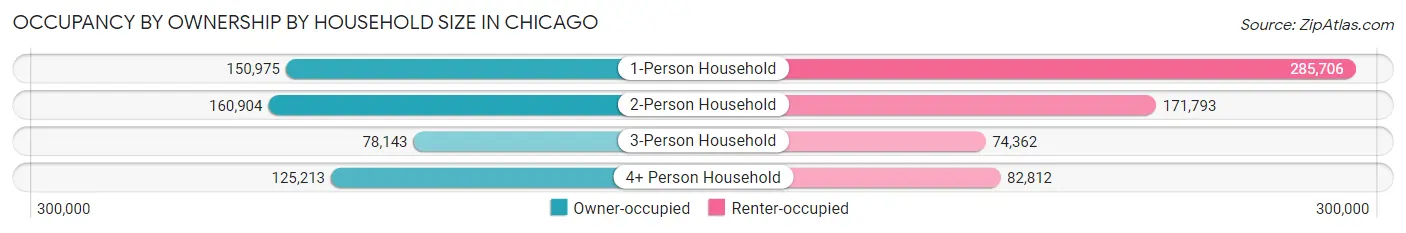
| Household Size | Owner-occupied | Renter-occupied |
| 1-Person Household | 150,975 (34.6%) | 285,706 (65.4%) |
| 2-Person Household | 160,904 (48.4%) | 171,793 (51.6%) |
| 3-Person Household | 78,143 (51.2%) | 74,362 (48.8%) |
| 4+ Person Household | 125,213 (60.2%) | 82,812 (39.8%) |
| Total Housing Units | 515,235 (45.6%) | 614,673 (54.4%) |
Occupancy by Educational Attainment in Chicago
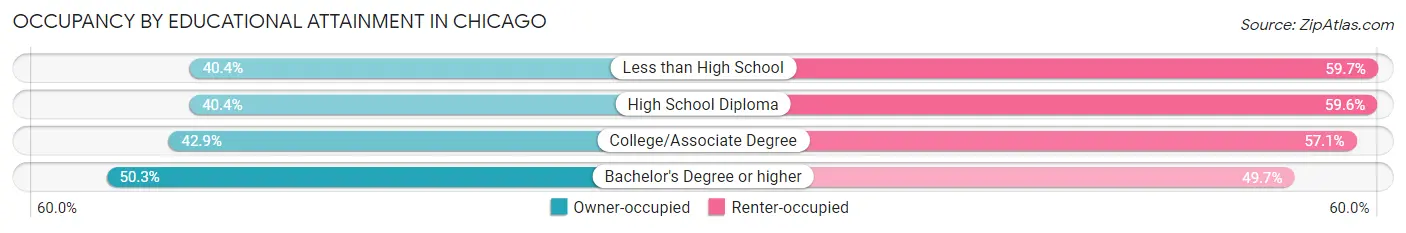
| Household Size | Owner-occupied | Renter-occupied |
| Less than High School | 49,953 (40.4%) | 73,858 (59.7%) |
| High School Diploma | 85,034 (40.4%) | 125,379 (59.6%) |
| College/Associate Degree | 114,184 (42.9%) | 152,171 (57.1%) |
| Bachelor's Degree or higher | 266,064 (50.3%) | 263,265 (49.7%) |
Occupancy by Age of Householder in Chicago
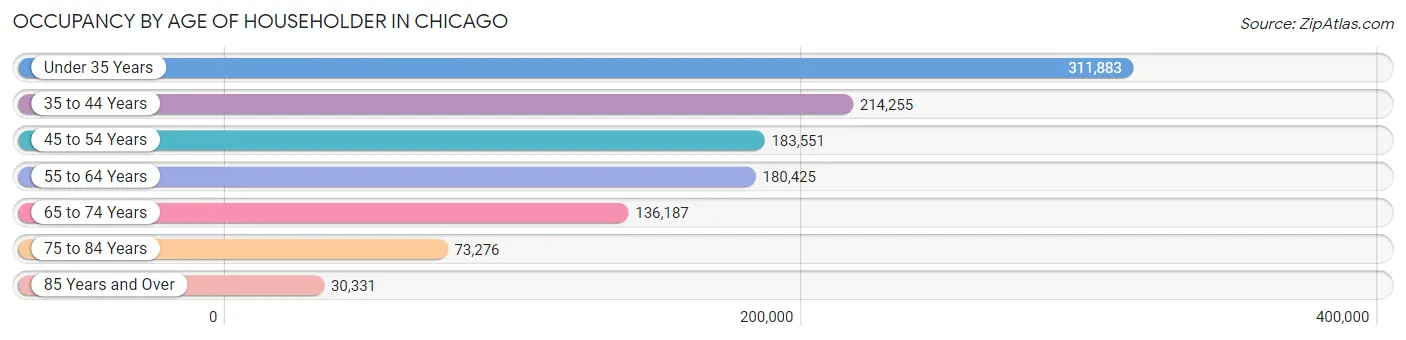
| Age Bracket | # Households | % Households |
| Under 35 Years | 311,883 | 27.6% |
| 35 to 44 Years | 214,255 | 19.0% |
| 45 to 54 Years | 183,551 | 16.2% |
| 55 to 64 Years | 180,425 | 16.0% |
| 65 to 74 Years | 136,187 | 12.0% |
| 75 to 84 Years | 73,276 | 6.5% |
| 85 Years and Over | 30,331 | 2.7% |
| Total | 1,129,908 | 100.0% |
Housing Finances in Chicago
Median Income by Occupancy in Chicago
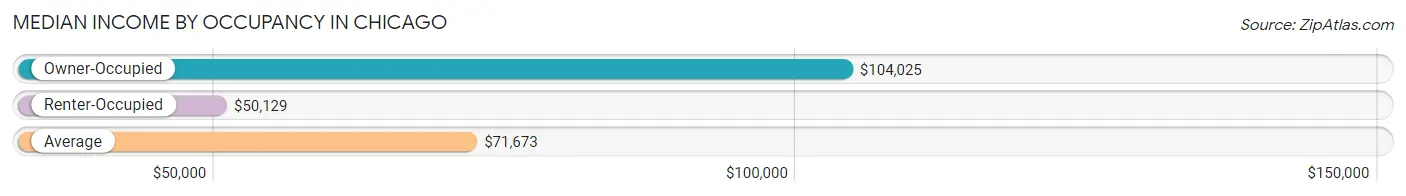
| Occupancy Type | # Households | Median Income |
| Owner-Occupied | 515,235 (45.6%) | $104,025 |
| Renter-Occupied | 614,673 (54.4%) | $50,129 |
| Average | 1,129,908 (100.0%) | $71,673 |
Occupancy by Householder Income Bracket in Chicago
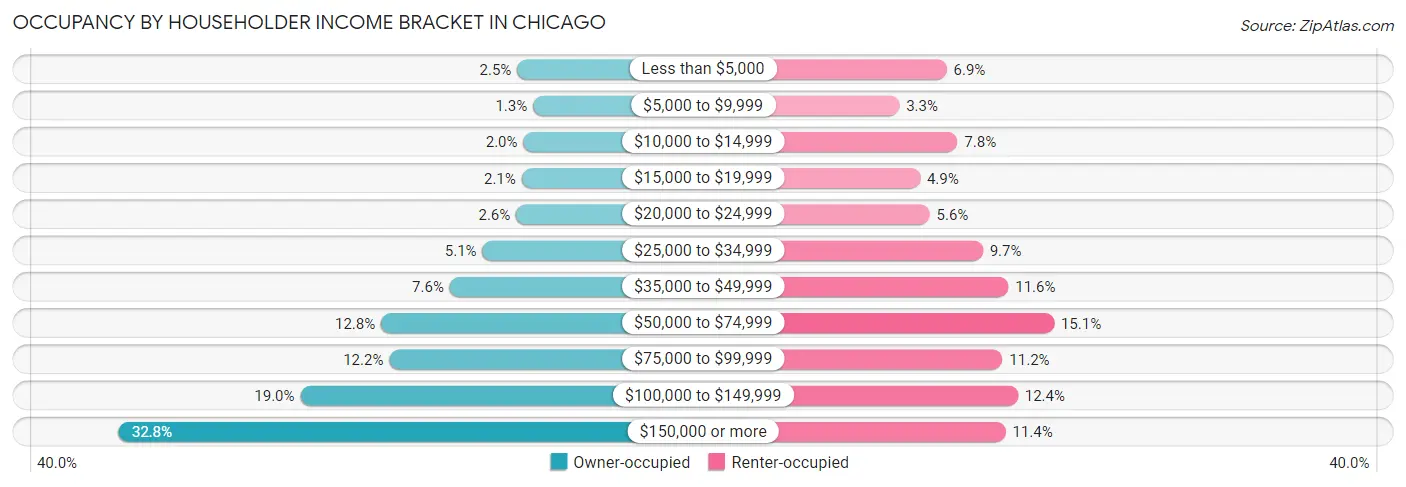
| Income Bracket | Owner-occupied | Renter-occupied |
| Less than $5,000 | 12,752 (2.5%) | 42,685 (6.9%) |
| $5,000 to $9,999 | 6,467 (1.3%) | 20,461 (3.3%) |
| $10,000 to $14,999 | 10,279 (2.0%) | 47,696 (7.8%) |
| $15,000 to $19,999 | 10,955 (2.1%) | 30,170 (4.9%) |
| $20,000 to $24,999 | 13,119 (2.5%) | 34,649 (5.6%) |
| $25,000 to $34,999 | 26,377 (5.1%) | 59,550 (9.7%) |
| $35,000 to $49,999 | 39,199 (7.6%) | 71,578 (11.6%) |
| $50,000 to $74,999 | 66,147 (12.8%) | 92,914 (15.1%) |
| $75,000 to $99,999 | 62,959 (12.2%) | 68,758 (11.2%) |
| $100,000 to $149,999 | 97,865 (19.0%) | 75,979 (12.4%) |
| $150,000 or more | 169,116 (32.8%) | 70,233 (11.4%) |
| Total | 515,235 (100.0%) | 614,673 (100.0%) |
Monthly Housing Cost Tiers in Chicago
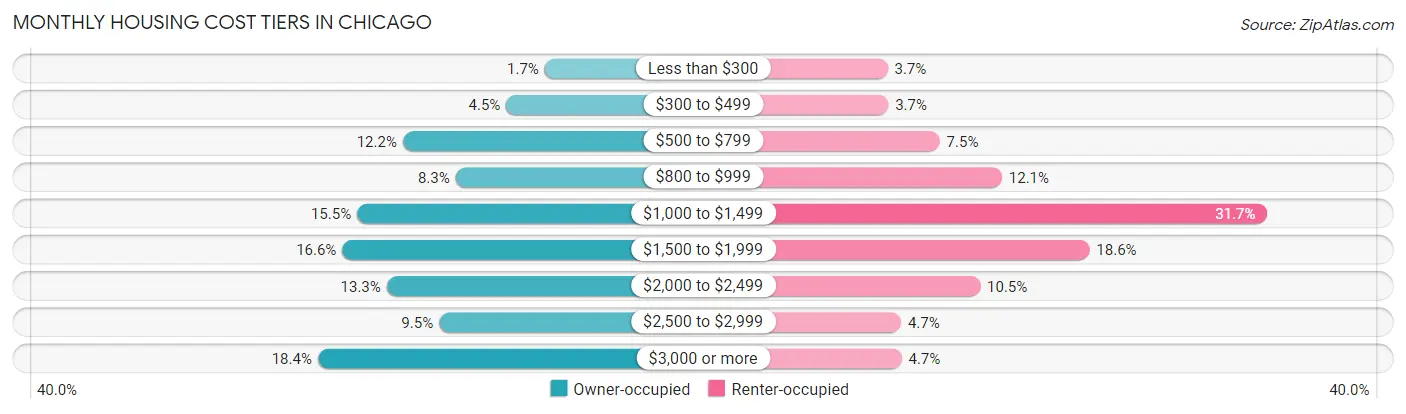
| Monthly Cost | Owner-occupied | Renter-occupied |
| Less than $300 | 8,743 (1.7%) | 22,706 (3.7%) |
| $300 to $499 | 23,347 (4.5%) | 23,016 (3.7%) |
| $500 to $799 | 62,617 (12.1%) | 46,310 (7.5%) |
| $800 to $999 | 42,573 (8.3%) | 74,467 (12.1%) |
| $1,000 to $1,499 | 79,952 (15.5%) | 194,593 (31.7%) |
| $1,500 to $1,999 | 85,564 (16.6%) | 114,094 (18.6%) |
| $2,000 to $2,499 | 68,737 (13.3%) | 64,596 (10.5%) |
| $2,500 to $2,999 | 48,830 (9.5%) | 28,783 (4.7%) |
| $3,000 or more | 94,872 (18.4%) | 29,028 (4.7%) |
| Total | 515,235 (100.0%) | 614,673 (100.0%) |
Physical Housing Characteristics in Chicago
Housing Structures in Chicago
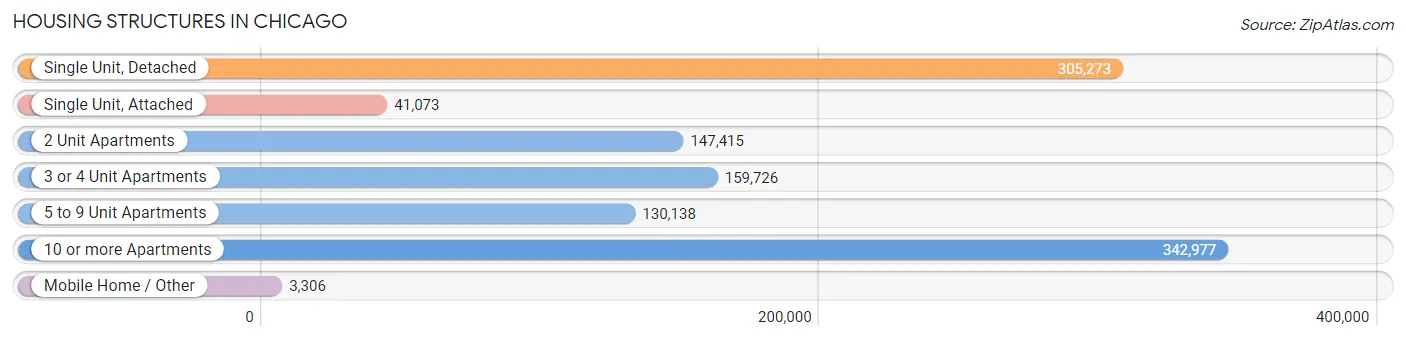
| Structure Type | # Housing Units | % Housing Units |
| Single Unit, Detached | 305,273 | 27.0% |
| Single Unit, Attached | 41,073 | 3.6% |
| 2 Unit Apartments | 147,415 | 13.1% |
| 3 or 4 Unit Apartments | 159,726 | 14.1% |
| 5 to 9 Unit Apartments | 130,138 | 11.5% |
| 10 or more Apartments | 342,977 | 30.3% |
| Mobile Home / Other | 3,306 | 0.3% |
| Total | 1,129,908 | 100.0% |
Housing Structures by Occupancy in Chicago
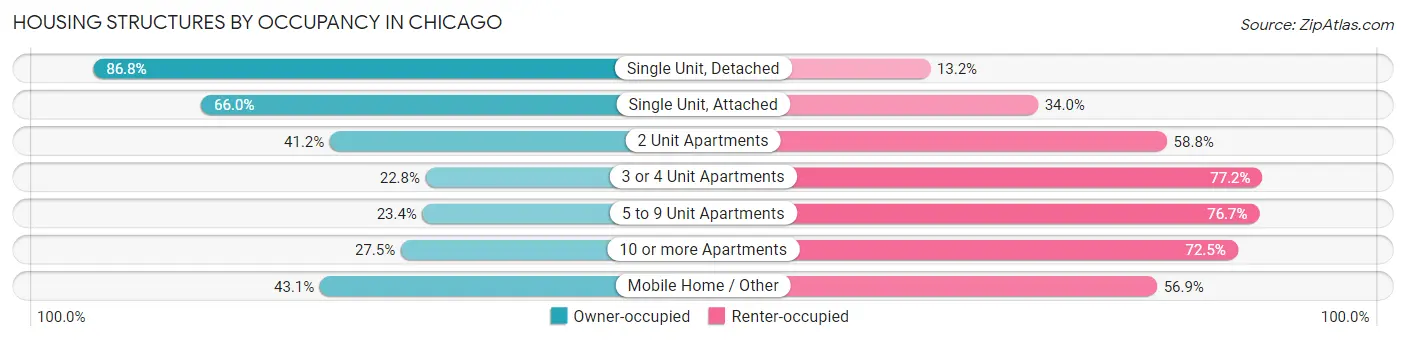
| Structure Type | Owner-occupied | Renter-occupied |
| Single Unit, Detached | 264,842 (86.8%) | 40,431 (13.2%) |
| Single Unit, Attached | 27,114 (66.0%) | 13,959 (34.0%) |
| 2 Unit Apartments | 60,709 (41.2%) | 86,706 (58.8%) |
| 3 or 4 Unit Apartments | 36,359 (22.8%) | 123,367 (77.2%) |
| 5 to 9 Unit Apartments | 30,390 (23.4%) | 99,748 (76.6%) |
| 10 or more Apartments | 94,396 (27.5%) | 248,581 (72.5%) |
| Mobile Home / Other | 1,425 (43.1%) | 1,881 (56.9%) |
| Total | 515,235 (45.6%) | 614,673 (54.4%) |
Housing Structures by Number of Rooms in Chicago
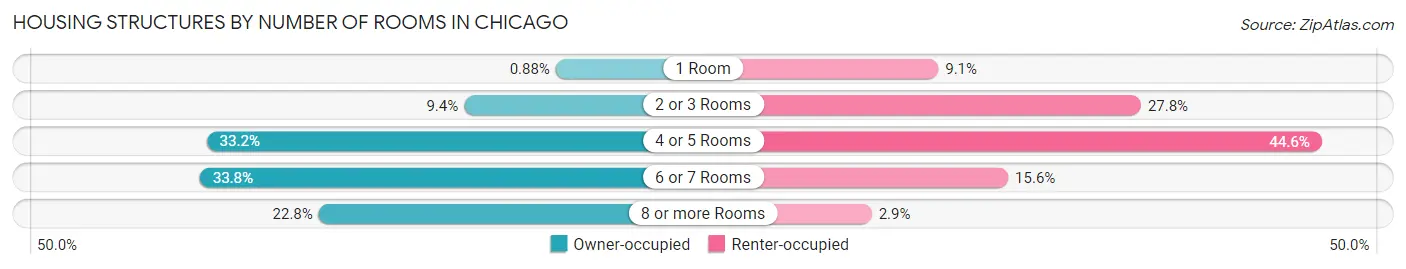
| Number of Rooms | Owner-occupied | Renter-occupied |
| 1 Room | 4,538 (0.9%) | 55,943 (9.1%) |
| 2 or 3 Rooms | 48,220 (9.4%) | 171,123 (27.8%) |
| 4 or 5 Rooms | 170,858 (33.2%) | 273,852 (44.6%) |
| 6 or 7 Rooms | 174,100 (33.8%) | 95,666 (15.6%) |
| 8 or more Rooms | 117,519 (22.8%) | 18,089 (2.9%) |
| Total | 515,235 (100.0%) | 614,673 (100.0%) |
Housing Structure by Heating Type in Chicago
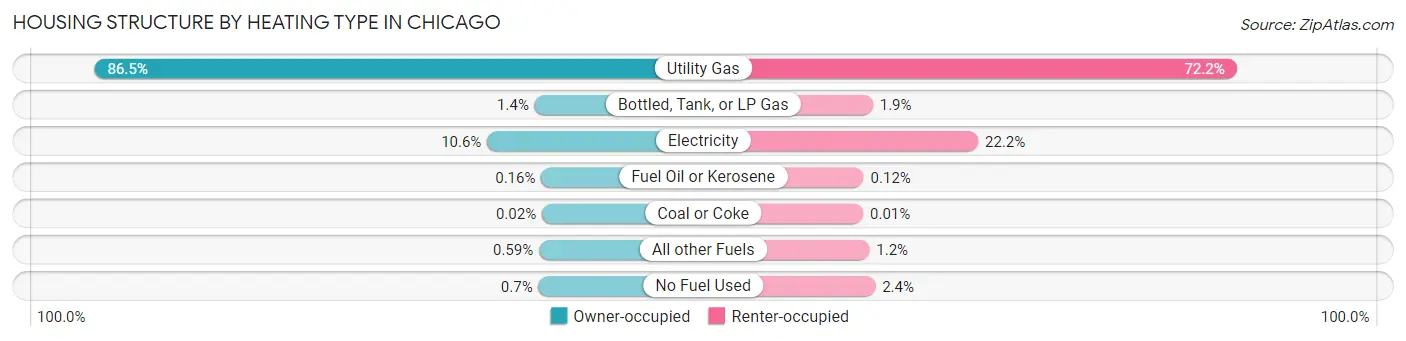
| Heating Type | Owner-occupied | Renter-occupied |
| Utility Gas | 445,615 (86.5%) | 443,655 (72.2%) |
| Bottled, Tank, or LP Gas | 7,337 (1.4%) | 11,575 (1.9%) |
| Electricity | 54,686 (10.6%) | 136,705 (22.2%) |
| Fuel Oil or Kerosene | 822 (0.2%) | 709 (0.1%) |
| Coal or Coke | 113 (0.0%) | 92 (0.0%) |
| All other Fuels | 3,039 (0.6%) | 7,498 (1.2%) |
| No Fuel Used | 3,623 (0.7%) | 14,439 (2.4%) |
| Total | 515,235 (100.0%) | 614,673 (100.0%) |
Household Vehicle Usage in Chicago
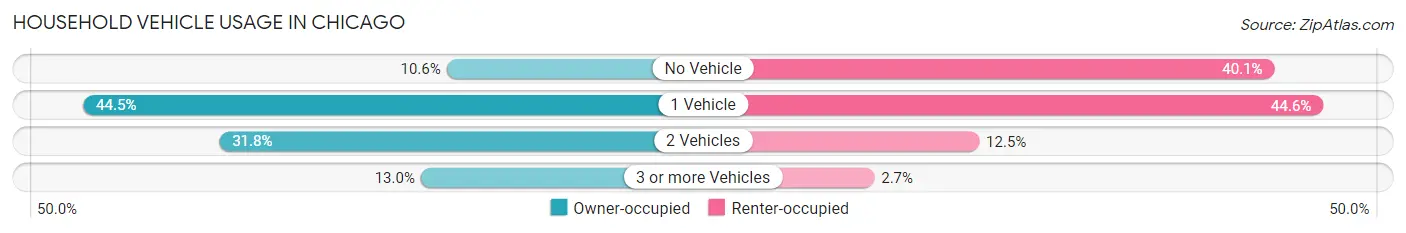
| Vehicles per Household | Owner-occupied | Renter-occupied |
| No Vehicle | 54,690 (10.6%) | 246,432 (40.1%) |
| 1 Vehicle | 229,451 (44.5%) | 274,414 (44.6%) |
| 2 Vehicles | 164,014 (31.8%) | 77,011 (12.5%) |
| 3 or more Vehicles | 67,080 (13.0%) | 16,816 (2.7%) |
| Total | 515,235 (100.0%) | 614,673 (100.0%) |
Real Estate & Mortgages in Chicago
Real Estate and Mortgage Overview in Chicago
| Characteristic | Without Mortgage | With Mortgage |
| Housing Units | 179,582 | 335,653 |
| Median Property Value | $266,400 | $331,600 |
| Median Household Income | $73,769 | $130,582 |
| Monthly Housing Costs | $807 | $89,823 |
| Real Estate Taxes | $4,011 | $7,433 |
Property Value by Mortgage Status in Chicago
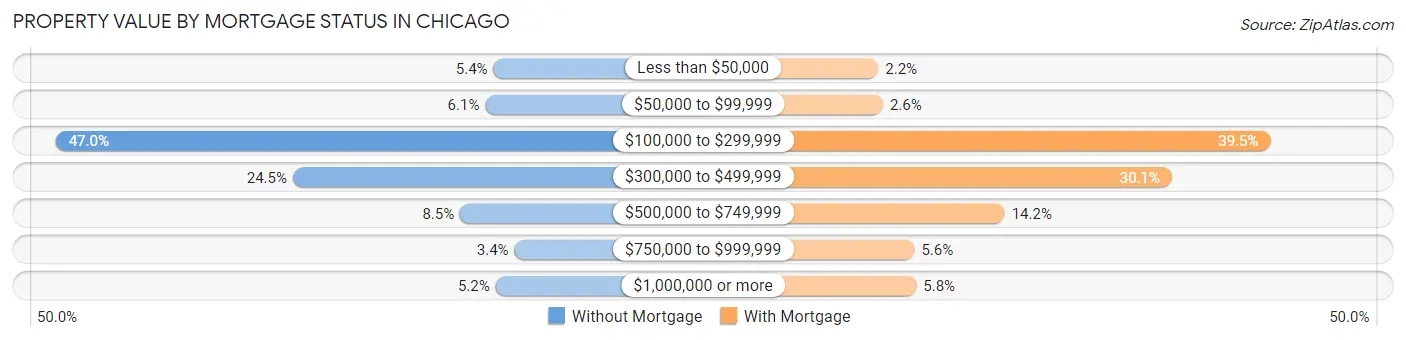
| Property Value | Without Mortgage | With Mortgage |
| Less than $50,000 | 9,603 (5.3%) | 7,269 (2.2%) |
| $50,000 to $99,999 | 11,009 (6.1%) | 8,751 (2.6%) |
| $100,000 to $299,999 | 84,459 (47.0%) | 132,593 (39.5%) |
| $300,000 to $499,999 | 43,930 (24.5%) | 101,101 (30.1%) |
| $500,000 to $749,999 | 15,315 (8.5%) | 47,696 (14.2%) |
| $750,000 to $999,999 | 6,011 (3.4%) | 18,823 (5.6%) |
| $1,000,000 or more | 9,255 (5.1%) | 19,420 (5.8%) |
| Total | 179,582 (100.0%) | 335,653 (100.0%) |
Household Income by Mortgage Status in Chicago
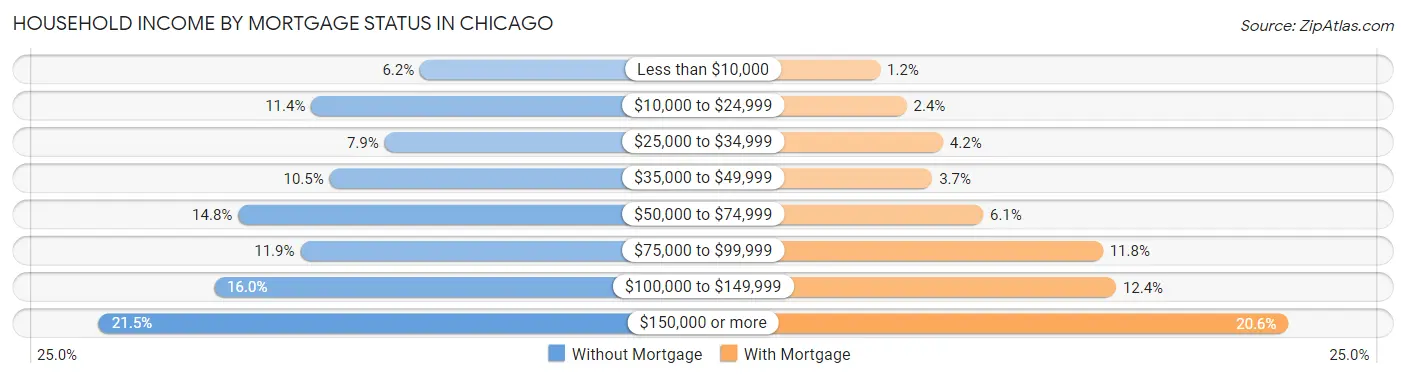
| Household Income | Without Mortgage | With Mortgage |
| Less than $10,000 | 11,075 (6.2%) | 3,940 (1.2%) |
| $10,000 to $24,999 | 20,387 (11.4%) | 8,144 (2.4%) |
| $25,000 to $34,999 | 14,112 (7.9%) | 13,966 (4.2%) |
| $35,000 to $49,999 | 18,819 (10.5%) | 12,265 (3.6%) |
| $50,000 to $74,999 | 26,633 (14.8%) | 20,380 (6.1%) |
| $75,000 to $99,999 | 21,325 (11.9%) | 39,514 (11.8%) |
| $100,000 to $149,999 | 28,697 (16.0%) | 41,634 (12.4%) |
| $150,000 or more | 38,534 (21.5%) | 69,168 (20.6%) |
| Total | 179,582 (100.0%) | 335,653 (100.0%) |
Property Value to Household Income Ratio in Chicago
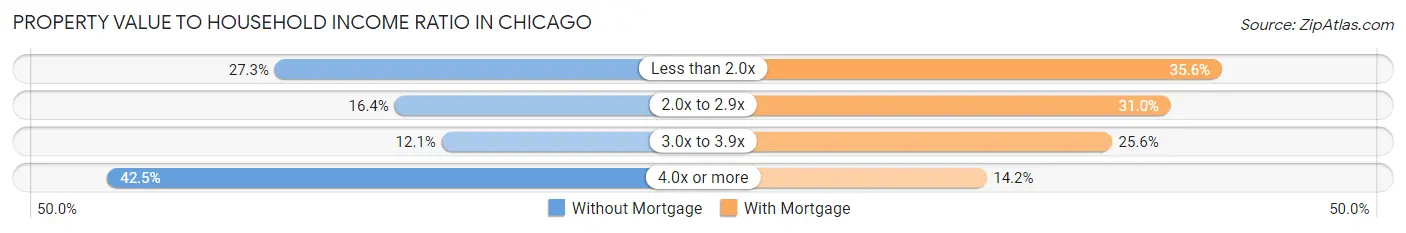
| Value-to-Income Ratio | Without Mortgage | With Mortgage |
| Less than 2.0x | 48,989 (27.3%) | 119,454 (35.6%) |
| 2.0x to 2.9x | 29,459 (16.4%) | 103,918 (31.0%) |
| 3.0x to 3.9x | 21,789 (12.1%) | 85,810 (25.6%) |
| 4.0x or more | 76,307 (42.5%) | 47,676 (14.2%) |
| Total | 179,582 (100.0%) | 335,653 (100.0%) |
Real Estate Taxes by Mortgage Status in Chicago
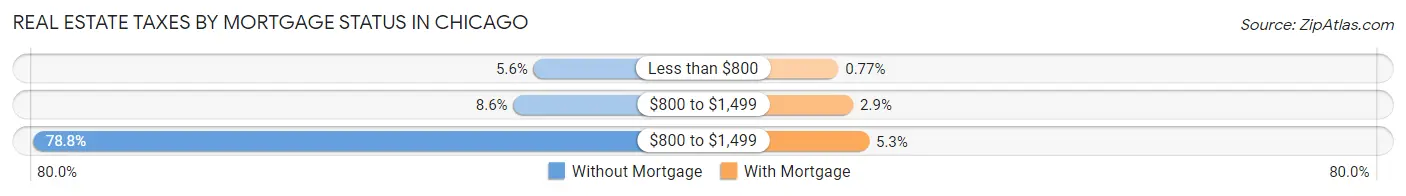
| Property Taxes | Without Mortgage | With Mortgage |
| Less than $800 | 10,083 (5.6%) | 2,587 (0.8%) |
| $800 to $1,499 | 15,397 (8.6%) | 9,859 (2.9%) |
| $800 to $1,499 | 141,502 (78.8%) | 17,654 (5.3%) |
| Total | 179,582 (100.0%) | 335,653 (100.0%) |
Health & Disability in Chicago
Health Insurance Coverage by Age in Chicago
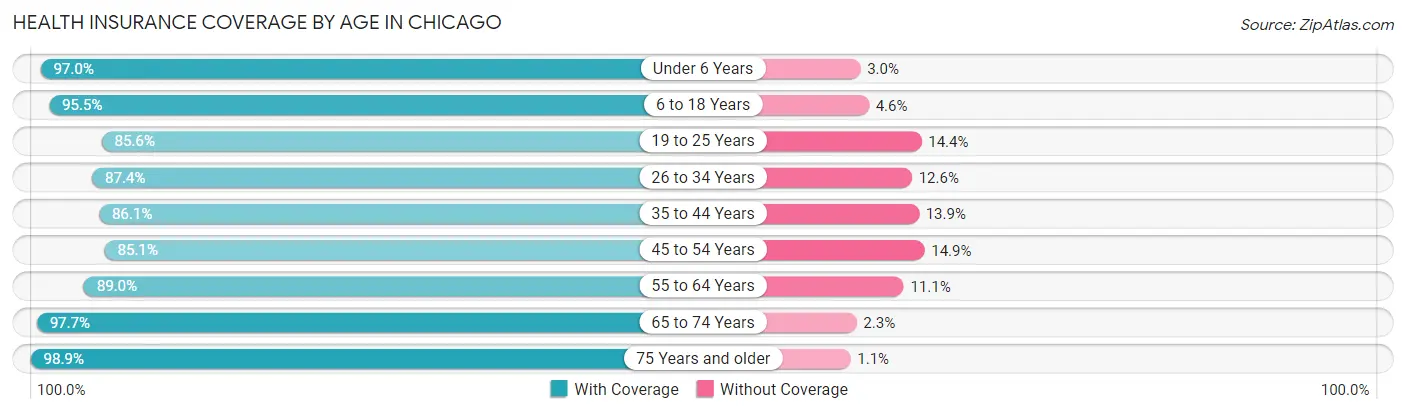
| Age Bracket | With Coverage | Without Coverage |
| Under 6 Years | 178,886 (97.0%) | 5,481 (3.0%) |
| 6 to 18 Years | 373,164 (95.5%) | 17,800 (4.5%) |
| 19 to 25 Years | 245,494 (85.6%) | 41,149 (14.4%) |
| 26 to 34 Years | 416,687 (87.4%) | 59,983 (12.6%) |
| 35 to 44 Years | 333,821 (86.1%) | 53,815 (13.9%) |
| 45 to 54 Years | 271,906 (85.1%) | 47,682 (14.9%) |
| 55 to 64 Years | 265,865 (88.9%) | 33,035 (11.1%) |
| 65 to 74 Years | 203,717 (97.7%) | 4,709 (2.3%) |
| 75 Years and older | 142,777 (98.9%) | 1,630 (1.1%) |
| Total | 2,432,317 (90.2%) | 265,284 (9.8%) |
Health Insurance Coverage by Citizenship Status in Chicago

| Citizenship Status | With Coverage | Without Coverage |
| Native Born | 178,886 (97.0%) | 5,481 (3.0%) |
| Foreign Born, Citizen | 373,164 (95.5%) | 17,800 (4.5%) |
| Foreign Born, not a Citizen | 245,494 (85.6%) | 41,149 (14.4%) |
Health Insurance Coverage by Household Income in Chicago
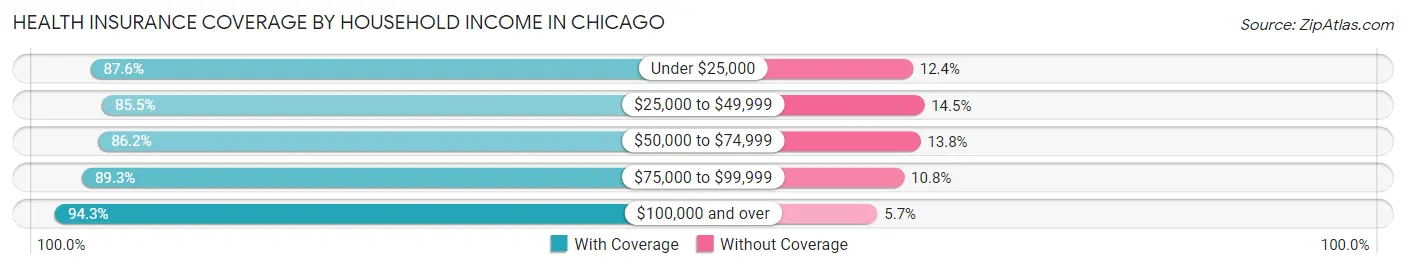
| Household Income | With Coverage | Without Coverage |
| Under $25,000 | 349,332 (87.6%) | 49,249 (12.4%) |
| $25,000 to $49,999 | 367,288 (85.5%) | 62,314 (14.5%) |
| $50,000 to $74,999 | 314,546 (86.2%) | 50,376 (13.8%) |
| $75,000 to $99,999 | 285,490 (89.2%) | 34,387 (10.7%) |
| $100,000 and over | 1,089,017 (94.3%) | 66,229 (5.7%) |
Public vs Private Health Insurance Coverage by Age in Chicago
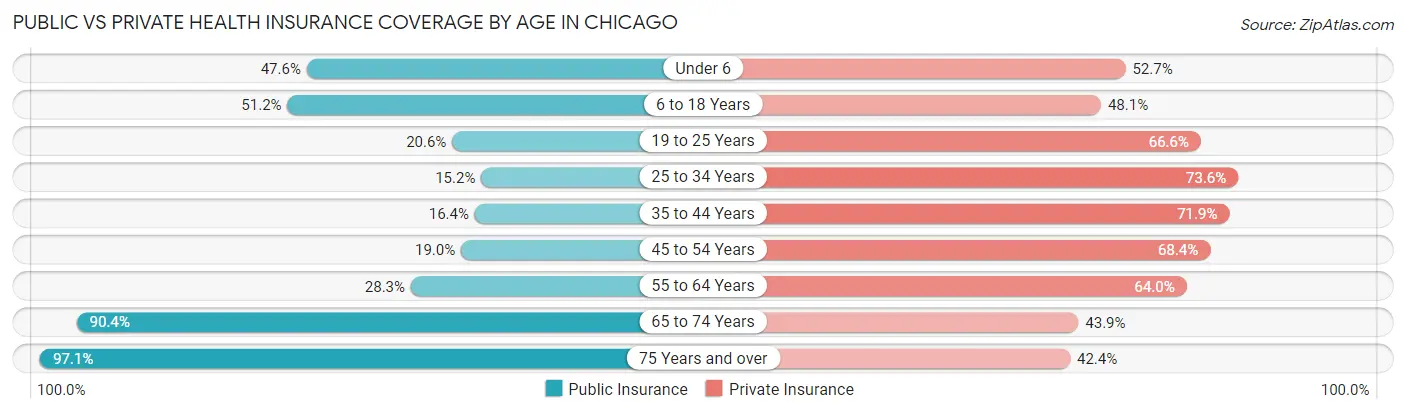
| Age Bracket | Public Insurance | Private Insurance |
| Under 6 | 87,818 (47.6%) | 97,080 (52.7%) |
| 6 to 18 Years | 200,242 (51.2%) | 188,112 (48.1%) |
| 19 to 25 Years | 59,126 (20.6%) | 190,977 (66.6%) |
| 25 to 34 Years | 72,652 (15.2%) | 350,567 (73.6%) |
| 35 to 44 Years | 63,702 (16.4%) | 278,731 (71.9%) |
| 45 to 54 Years | 60,693 (19.0%) | 218,475 (68.4%) |
| 55 to 64 Years | 84,599 (28.3%) | 191,223 (64.0%) |
| 65 to 74 Years | 188,324 (90.4%) | 91,510 (43.9%) |
| 75 Years and over | 140,276 (97.1%) | 61,182 (42.4%) |
| Total | 957,432 (35.5%) | 1,667,857 (61.8%) |
Disability Status by Sex by Age in Chicago

| Age Bracket | Male | Female |
| Under 5 Years | 673 (0.9%) | 554 (0.7%) |
| 5 to 17 Years | 11,312 (5.8%) | 6,289 (3.3%) |
| 18 to 34 Years | 22,271 (5.7%) | 21,760 (5.4%) |
| 35 to 64 Years | 56,181 (11.2%) | 63,679 (12.6%) |
| 65 to 74 Years | 24,683 (26.5%) | 31,227 (27.1%) |
| 75 Years and over | 21,861 (40.3%) | 46,100 (51.1%) |
Disability Class by Sex by Age in Chicago
Disability Class: Hearing Difficulty
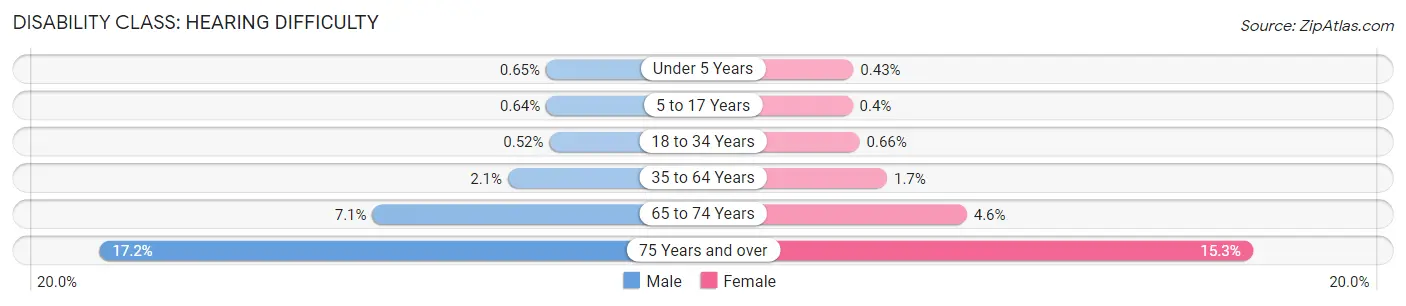
| Age Bracket | Male | Female |
| Under 5 Years | 513 (0.6%) | 332 (0.4%) |
| 5 to 17 Years | 1,234 (0.6%) | 762 (0.4%) |
| 18 to 34 Years | 2,028 (0.5%) | 2,691 (0.7%) |
| 35 to 64 Years | 10,302 (2.1%) | 8,505 (1.7%) |
| 65 to 74 Years | 6,609 (7.1%) | 5,342 (4.6%) |
| 75 Years and over | 9,332 (17.2%) | 13,762 (15.2%) |
Disability Class: Vision Difficulty
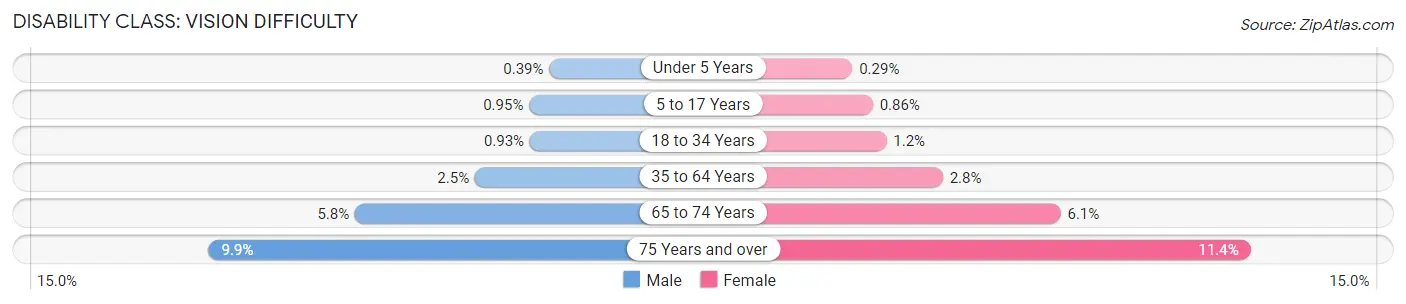
| Age Bracket | Male | Female |
| Under 5 Years | 307 (0.4%) | 222 (0.3%) |
| 5 to 17 Years | 1,844 (0.9%) | 1,648 (0.9%) |
| 18 to 34 Years | 3,631 (0.9%) | 5,017 (1.2%) |
| 35 to 64 Years | 12,302 (2.5%) | 14,219 (2.8%) |
| 65 to 74 Years | 5,405 (5.8%) | 7,012 (6.1%) |
| 75 Years and over | 5,351 (9.9%) | 10,264 (11.4%) |
Disability Class: Cognitive Difficulty
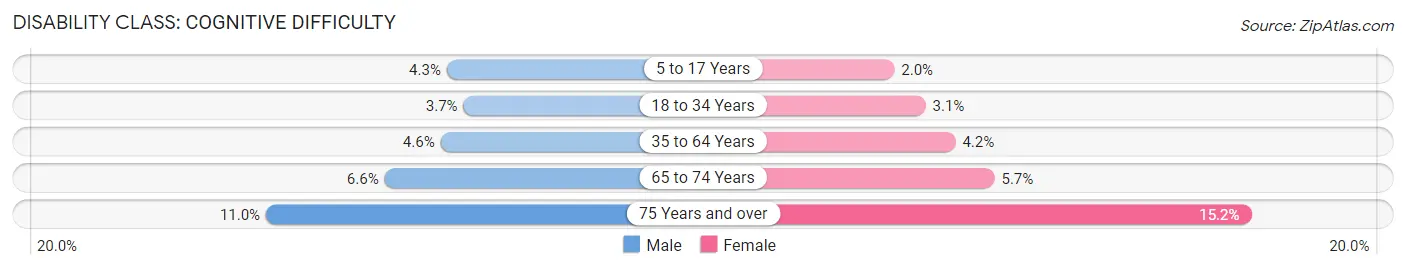
| Age Bracket | Male | Female |
| 5 to 17 Years | 8,414 (4.3%) | 3,756 (1.9%) |
| 18 to 34 Years | 14,469 (3.7%) | 12,589 (3.1%) |
| 35 to 64 Years | 22,790 (4.6%) | 21,365 (4.2%) |
| 65 to 74 Years | 6,188 (6.6%) | 6,534 (5.7%) |
| 75 Years and over | 5,984 (11.0%) | 13,710 (15.2%) |
Disability Class: Ambulatory Difficulty
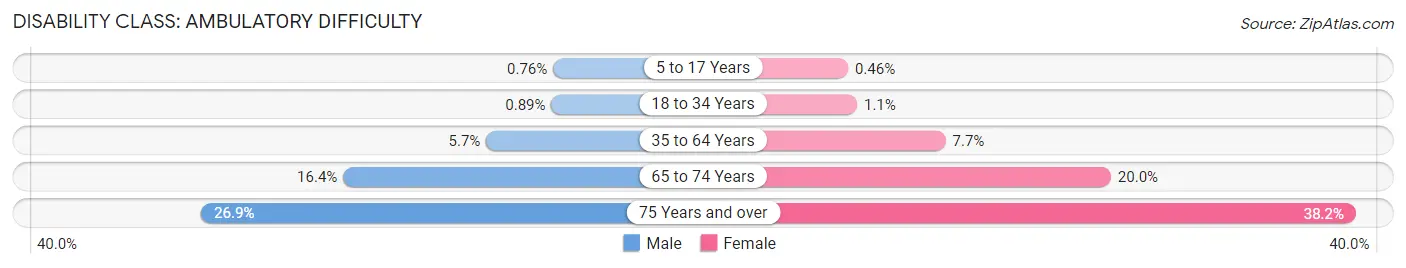
| Age Bracket | Male | Female |
| 5 to 17 Years | 1,466 (0.8%) | 881 (0.5%) |
| 18 to 34 Years | 3,479 (0.9%) | 4,566 (1.1%) |
| 35 to 64 Years | 28,662 (5.7%) | 39,002 (7.7%) |
| 65 to 74 Years | 15,235 (16.4%) | 23,020 (20.0%) |
| 75 Years and over | 14,571 (26.9%) | 34,424 (38.2%) |
Disability Class: Self-Care Difficulty
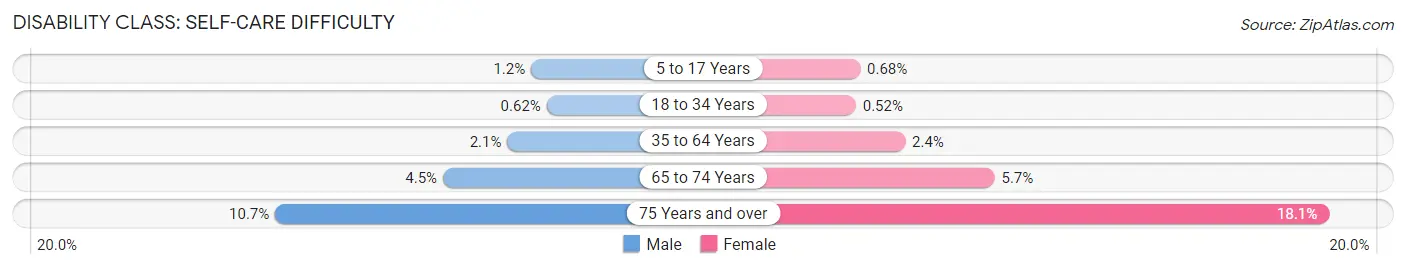
| Age Bracket | Male | Female |
| 5 to 17 Years | 2,332 (1.2%) | 1,303 (0.7%) |
| 18 to 34 Years | 2,438 (0.6%) | 2,097 (0.5%) |
| 35 to 64 Years | 10,379 (2.1%) | 11,886 (2.4%) |
| 65 to 74 Years | 4,164 (4.5%) | 6,537 (5.7%) |
| 75 Years and over | 5,800 (10.7%) | 16,323 (18.1%) |
Technology Access in Chicago
Computing Device Access in Chicago
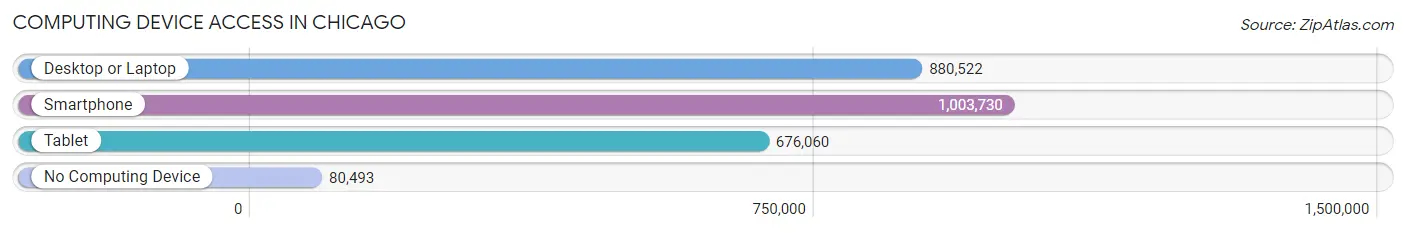
| Device Type | # Households | % Households |
| Desktop or Laptop | 880,522 | 77.9% |
| Smartphone | 1,003,730 | 88.8% |
| Tablet | 676,060 | 59.8% |
| No Computing Device | 80,493 | 7.1% |
| Total | 1,129,908 | 100.0% |
Internet Access in Chicago
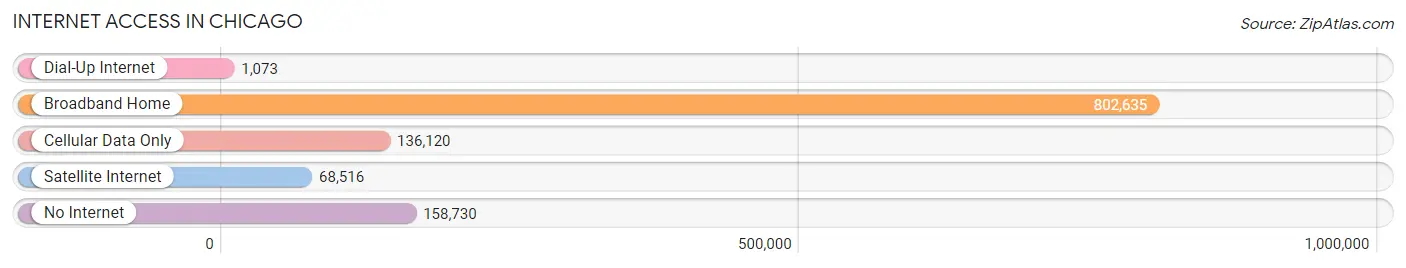
| Internet Type | # Households | % Households |
| Dial-Up Internet | 1,073 | 0.1% |
| Broadband Home | 802,635 | 71.0% |
| Cellular Data Only | 136,120 | 12.0% |
| Satellite Internet | 68,516 | 6.1% |
| No Internet | 158,730 | 14.1% |
| Total | 1,129,908 | 100.0% |
Chicago Summary
Chicago, IL is the third-largest city in the United States and the largest city in the state of Illinois. It is located on the southwestern shore of Lake Michigan in the northeastern corner of the state. The city is known for its vibrant culture, diverse population, and iconic skyline.
History
The area that is now Chicago was first settled by Native Americans in the late 17th century. The first non-native settlers arrived in the early 1800s, and the city was officially incorporated in 1837. In the mid-1800s, Chicago experienced a period of rapid growth and development, becoming a major transportation hub and the center of the nation’s meatpacking industry. The city was also the site of the 1893 World’s Columbian Exposition, which showcased the city’s progress and helped to further its reputation as a major industrial center.
In the early 20th century, Chicago was a major center of the labor movement, and the city was the site of the famous Haymarket Riot of 1886. The city also experienced a period of racial tension in the 1950s and 1960s, culminating in the 1968 Democratic National Convention. In the late 20th century, Chicago experienced a period of economic decline, but the city has since rebounded and is now a major center of finance, technology, and culture.
Geography
Chicago is located on the southwestern shore of Lake Michigan in the northeastern corner of the state of Illinois. The city is situated on a flat plain, with the Chicago River running through the center of the city. The city is divided into 77 distinct neighborhoods, each with its own unique character and culture. The city is also home to several parks, including Lincoln Park, Grant Park, and Millennium Park.
Economy
Chicago is a major center of finance, technology, and culture. The city is home to the Chicago Board of Trade, the Chicago Mercantile Exchange, and the Chicago Stock Exchange. The city is also a major center of manufacturing, with major companies such as Boeing, Motorola, and Kraft Foods having their headquarters in the city. The city is also home to several major universities, including the University of Chicago, Northwestern University, and the Illinois Institute of Technology.
Demographics
As of the 2010 census, the population of Chicago was 2,695,598. The city is home to a diverse population, with the largest ethnic groups being African American (32.9%), White (31.7%), Hispanic or Latino (28.9%), and Asian (5.5%). The city is also home to a large immigrant population, with the largest groups being from Mexico (14.5%), India (4.3%), and Poland (3.2%). The median household income in the city is $47,408, and the median home value is $224,800.
Common Questions
What is Per Capita Income in Chicago?
Per Capita income in Chicago is $45,840.
What is the Median Family Income in Chicago?
Median Family Income in Chicago is $87,343.
What is the Median Household income in Chicago?
Median Household Income in Chicago is $71,673.
What is Income or Wage Gap in Chicago?
Income or Wage Gap in Chicago is 18.0%.
Women in Chicago earn 82.0 cents for every dollar earned by a man.
What is Family Income Deficit in Chicago?
Family Income Deficit in Chicago is $11,501.
Families that are below poverty line in Chicago earn $11,501 less on average than the poverty threshold level.
What is Inequality or Gini Index in Chicago?
Inequality or Gini Index in Chicago is 0.53.
What is the Total Population of Chicago?
Total Population of Chicago is 2,721,914.
What is the Total Male Population of Chicago?
Total Male Population of Chicago is 1,327,699.
What is the Total Female Population of Chicago?
Total Female Population of Chicago is 1,394,215.
What is the Ratio of Males per 100 Females in Chicago?
There are 95.23 Males per 100 Females in Chicago.
What is the Ratio of Females per 100 Males in Chicago?
There are 105.01 Females per 100 Males in Chicago.
What is the Median Population Age in Chicago?
Median Population Age in Chicago is 35.3 Years.
What is the Average Family Size in Chicago
Average Family Size in Chicago is 3.3 People.
What is the Average Household Size in Chicago
Average Household Size in Chicago is 2.4 People.
How Large is the Labor Force in Chicago?
There are 1,505,646 People in the Labor Forcein in Chicago.
What is the Percentage of People in the Labor Force in Chicago?
67.3% of People are in the Labor Force in Chicago.
What is the Unemployment Rate in Chicago?
Unemployment Rate in Chicago is 8.2%.