Elgin, IL Map & Demographics
Elgin Map
Elgin Overview
$35,037
PER CAPITA INCOME
$95,415
AVG FAMILY INCOME
$85,998
AVG HOUSEHOLD INCOME
28.7%
WAGE / INCOME GAP [ % ]
71.3¢/ $1
WAGE / INCOME GAP [ $ ]
$9,471
FAMILY INCOME DEFICIT
0.39
INEQUALITY / GINI INDEX
114,190
TOTAL POPULATION
58,181
MALE POPULATION
56,009
FEMALE POPULATION
103.88
MALES / 100 FEMALES
96.27
FEMALES / 100 MALES
35.5
MEDIAN AGE
3.5
AVG FAMILY SIZE
2.9
AVG HOUSEHOLD SIZE
60,861
LABOR FORCE [ PEOPLE ]
69.1%
PERCENT IN LABOR FORCE
6.0%
UNEMPLOYMENT RATE
Income in Elgin
Income Overview in Elgin
Per Capita Income in Elgin is $35,037, while median incomes of families and households are $95,415 and $85,998 respectively.
| Characteristic | Number | Measure |
| Per Capita Income | 114,190 | $35,037 |
| Median Family Income | 27,754 | $95,415 |
| Mean Family Income | 27,754 | $111,868 |
| Median Household Income | 38,530 | $85,998 |
| Mean Household Income | 38,530 | $102,158 |
| Income Deficit | 27,754 | $9,471 |
| Wage / Income Gap (%) | 114,190 | 28.73% |
| Wage / Income Gap ($) | 114,190 | 71.27¢ per $1 |
| Gini / Inequality Index | 114,190 | 0.39 |
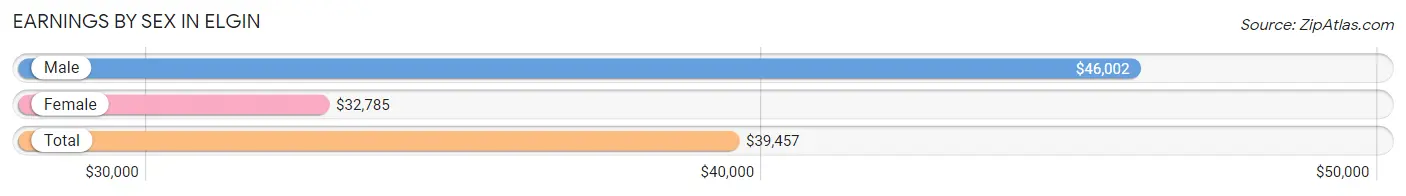
Earnings by Sex in Elgin
Average Earnings in Elgin are $39,457, $46,002 for men and $32,785 for women, a difference of 28.7%.
| Sex | Number | Average Earnings |
| Male | 35,373 (55.8%) | $46,002 |
| Female | 27,983 (44.2%) | $32,785 |
| Total | 63,356 (100.0%) | $39,457 |
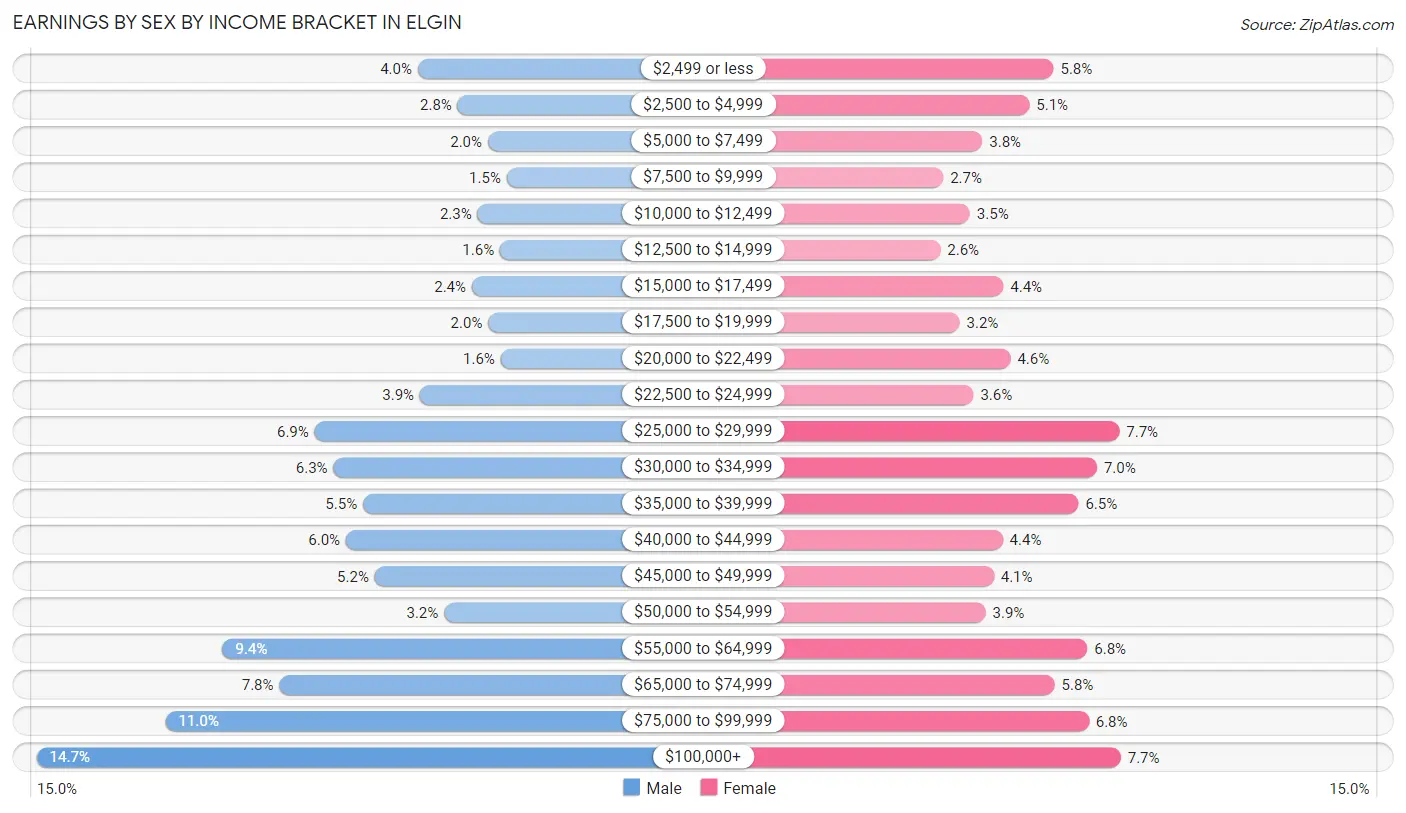
Earnings by Sex by Income Bracket in Elgin
The most common earnings brackets in Elgin are $100,000+ for men (5,185 | 14.7%) and $100,000+ for women (2,154 | 7.7%).
| Income | Male | Female |
| $2,499 or less | 1,399 (4.0%) | 1,625 (5.8%) |
| $2,500 to $4,999 | 1,001 (2.8%) | 1,435 (5.1%) |
| $5,000 to $7,499 | 700 (2.0%) | 1,066 (3.8%) |
| $7,500 to $9,999 | 512 (1.5%) | 759 (2.7%) |
| $10,000 to $12,499 | 802 (2.3%) | 968 (3.5%) |
| $12,500 to $14,999 | 579 (1.6%) | 736 (2.6%) |
| $15,000 to $17,499 | 860 (2.4%) | 1,231 (4.4%) |
| $17,500 to $19,999 | 697 (2.0%) | 886 (3.2%) |
| $20,000 to $22,499 | 574 (1.6%) | 1,287 (4.6%) |
| $22,500 to $24,999 | 1,376 (3.9%) | 997 (3.6%) |
| $25,000 to $29,999 | 2,423 (6.9%) | 2,143 (7.7%) |
| $30,000 to $34,999 | 2,234 (6.3%) | 1,968 (7.0%) |
| $35,000 to $39,999 | 1,942 (5.5%) | 1,823 (6.5%) |
| $40,000 to $44,999 | 2,111 (6.0%) | 1,227 (4.4%) |
| $45,000 to $49,999 | 1,827 (5.2%) | 1,157 (4.1%) |
| $50,000 to $54,999 | 1,134 (3.2%) | 1,091 (3.9%) |
| $55,000 to $64,999 | 3,340 (9.4%) | 1,893 (6.8%) |
| $65,000 to $74,999 | 2,773 (7.8%) | 1,635 (5.8%) |
| $75,000 to $99,999 | 3,904 (11.0%) | 1,902 (6.8%) |
| $100,000+ | 5,185 (14.7%) | 2,154 (7.7%) |
| Total | 35,373 (100.0%) | 27,983 (100.0%) |
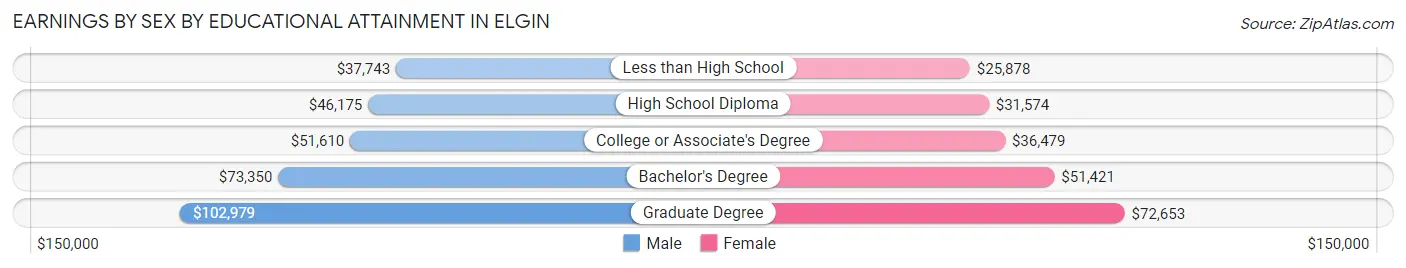
Earnings by Sex by Educational Attainment in Elgin
Average earnings in Elgin are $52,570 for men and $37,853 for women, a difference of 28.0%. Men with an educational attainment of graduate degree enjoy the highest average annual earnings of $102,979, while those with less than high school education earn the least with $37,743. Women with an educational attainment of graduate degree earn the most with the average annual earnings of $72,653, while those with less than high school education have the smallest earnings of $25,878.
| Educational Attainment | Male Income | Female Income |
| Less than High School | $37,743 | $25,878 |
| High School Diploma | $46,175 | $31,574 |
| College or Associate's Degree | $51,610 | $36,479 |
| Bachelor's Degree | $73,350 | $51,421 |
| Graduate Degree | $102,979 | $72,653 |
| Total | $52,570 | $37,853 |
Family Income in Elgin
Family Income Brackets in Elgin
According to the Elgin family income data, there are 6,911 families falling into the $100,000 to $149,999 income range, which is the most common income bracket and makes up 24.9% of all families. Conversely, the $10,000 to $14,999 income bracket is the least frequent group with only 444 families (1.6%) belonging to this category.
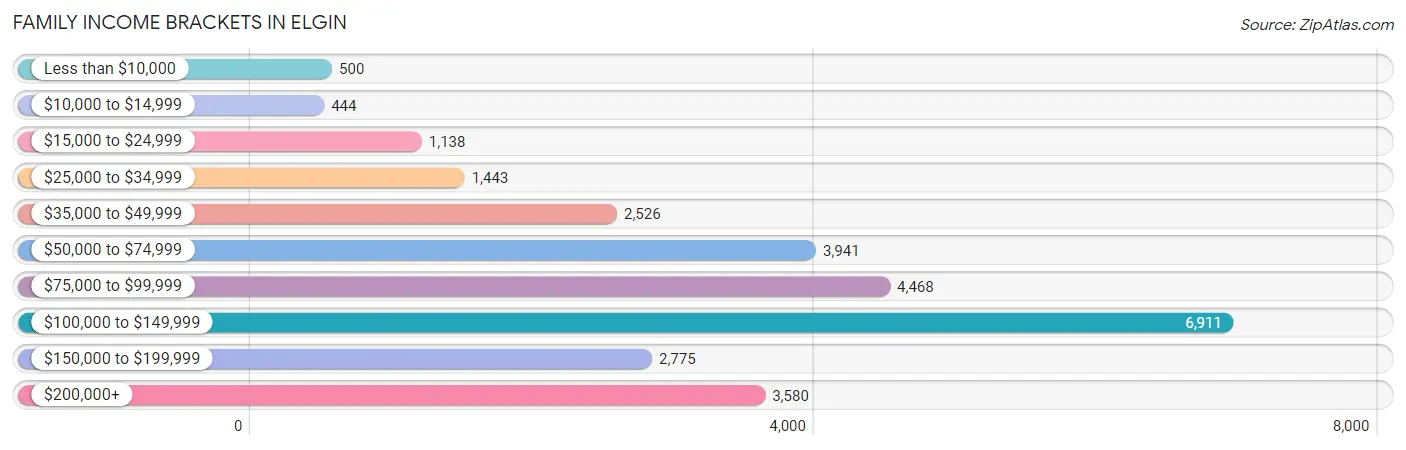
| Income Bracket | # Families | % Families |
| Less than $10,000 | 500 | 1.8% |
| $10,000 to $14,999 | 444 | 1.6% |
| $15,000 to $24,999 | 1,138 | 4.1% |
| $25,000 to $34,999 | 1,443 | 5.2% |
| $35,000 to $49,999 | 2,526 | 9.1% |
| $50,000 to $74,999 | 3,941 | 14.2% |
| $75,000 to $99,999 | 4,468 | 16.1% |
| $100,000 to $149,999 | 6,911 | 24.9% |
| $150,000 to $199,999 | 2,775 | 10.0% |
| $200,000+ | 3,580 | 12.9% |
Family Income by Famaliy Size in Elgin
7+ person families (1,124 | 4.1%) account for the highest median family income in Elgin with $122,106 per family, while 2-person families (10,378 | 37.4%) have the highest median income of $41,852 per family member.
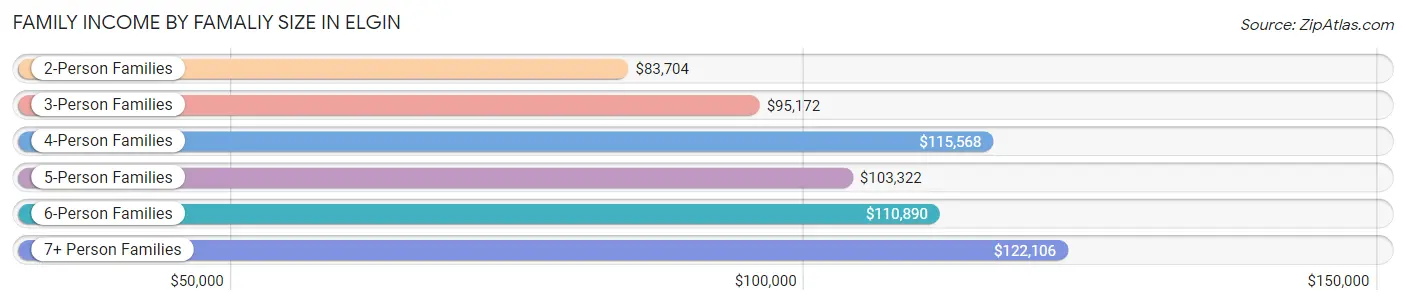
| Income Bracket | # Families | Median Income |
| 2-Person Families | 10,378 (37.4%) | $83,704 |
| 3-Person Families | 5,781 (20.8%) | $95,172 |
| 4-Person Families | 5,588 (20.1%) | $115,568 |
| 5-Person Families | 3,563 (12.8%) | $103,322 |
| 6-Person Families | 1,320 (4.8%) | $110,890 |
| 7+ Person Families | 1,124 (4.1%) | $122,106 |
| Total | 27,754 (100.0%) | $95,415 |
Family Income by Number of Earners in Elgin
The median family income in Elgin is $95,415, with families comprising 3+ earners (5,564) having the highest median family income of $130,826, while families with no earners (2,396) have the lowest median family income of $41,174, accounting for 20.1% and 8.6% of families, respectively.
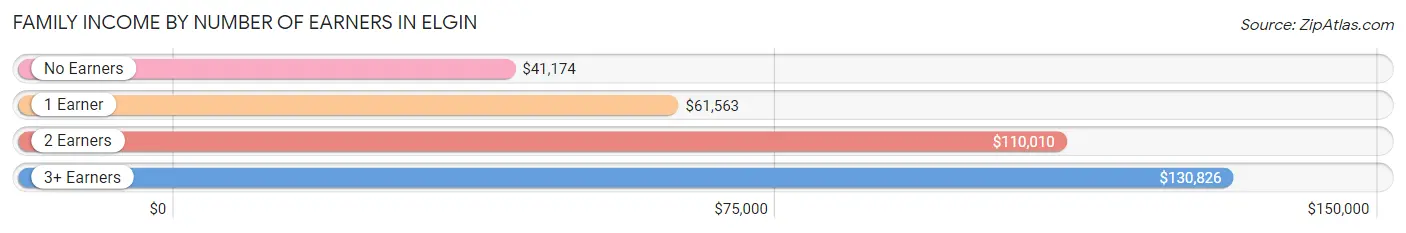
| Number of Earners | # Families | Median Income |
| No Earners | 2,396 (8.6%) | $41,174 |
| 1 Earner | 7,855 (28.3%) | $61,563 |
| 2 Earners | 11,939 (43.0%) | $110,010 |
| 3+ Earners | 5,564 (20.1%) | $130,826 |
| Total | 27,754 (100.0%) | $95,415 |
Household Income in Elgin
Household Income Brackets in Elgin
With 9,016 households falling in the category, the $100,000 to $149,999 income range is the most frequent in Elgin, accounting for 23.4% of all households. In contrast, only 1,002 households (2.6%) fall into the less than $10,000 income bracket, making it the least populous group.
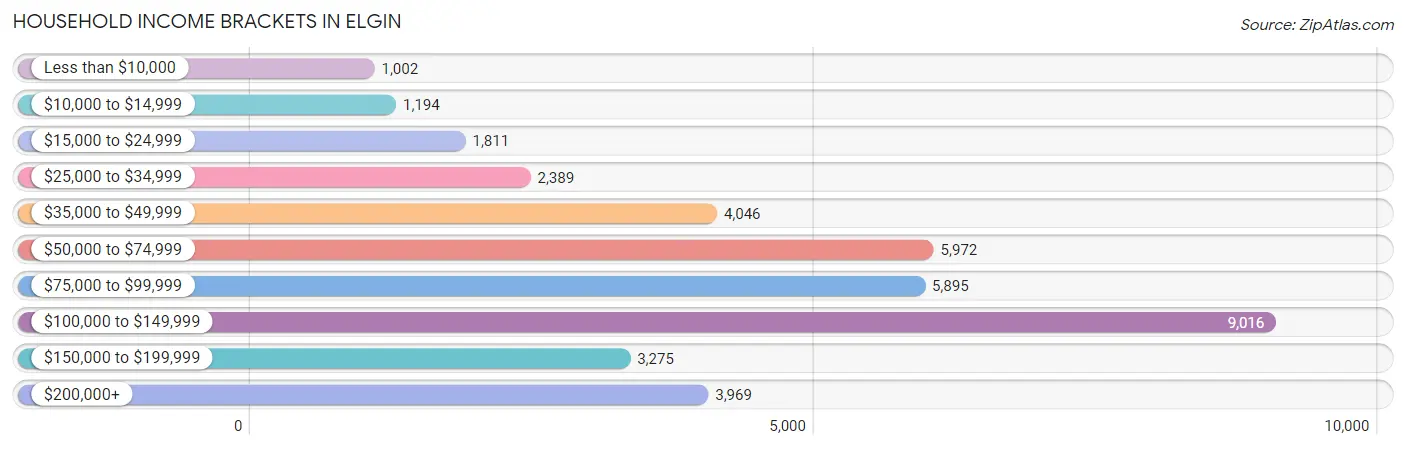
| Income Bracket | # Households | % Households |
| Less than $10,000 | 1,002 | 2.6% |
| $10,000 to $14,999 | 1,194 | 3.1% |
| $15,000 to $24,999 | 1,811 | 4.7% |
| $25,000 to $34,999 | 2,389 | 6.2% |
| $35,000 to $49,999 | 4,046 | 10.5% |
| $50,000 to $74,999 | 5,972 | 15.5% |
| $75,000 to $99,999 | 5,895 | 15.3% |
| $100,000 to $149,999 | 9,016 | 23.4% |
| $150,000 to $199,999 | 3,275 | 8.5% |
| $200,000+ | 3,969 | 10.3% |
Household Income by Householder Age in Elgin
The median household income in Elgin is $85,998, with the highest median household income of $99,382 found in the 45 to 64 years age bracket for the primary householder. A total of 15,553 households (40.4%) fall into this category. Meanwhile, the 65+ years age bracket for the primary householder has the lowest median household income of $62,825, with 8,706 households (22.6%) in this group.
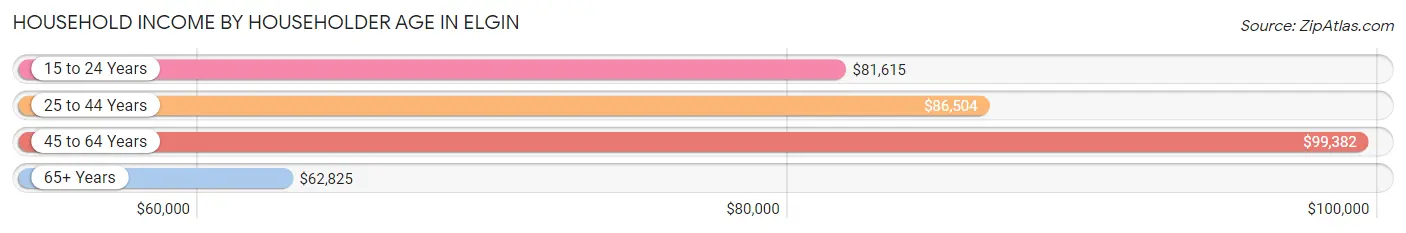
| Income Bracket | # Households | Median Income |
| 15 to 24 Years | 1,113 (2.9%) | $81,615 |
| 25 to 44 Years | 13,158 (34.2%) | $86,504 |
| 45 to 64 Years | 15,553 (40.4%) | $99,382 |
| 65+ Years | 8,706 (22.6%) | $62,825 |
| Total | 38,530 (100.0%) | $85,998 |
Poverty in Elgin
Income Below Poverty by Sex and Age in Elgin
With 8.6% poverty level for males and 11.4% for females among the residents of Elgin, under 5 year old males and 5 year old females are the most vulnerable to poverty, with 984 males (23.2%) and 132 females (21.3%) in their respective age groups living below the poverty level.
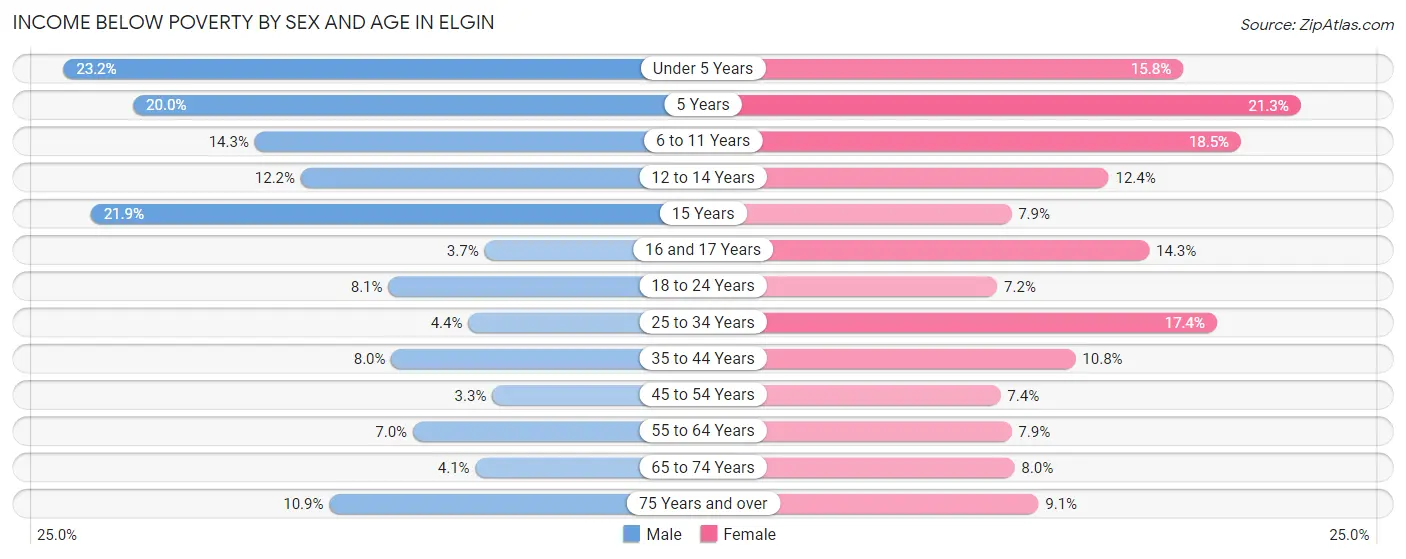
| Age Bracket | Male | Female |
| Under 5 Years | 984 (23.2%) | 622 (15.8%) |
| 5 Years | 179 (20.0%) | 132 (21.3%) |
| 6 to 11 Years | 675 (14.3%) | 853 (18.5%) |
| 12 to 14 Years | 315 (12.2%) | 295 (12.4%) |
| 15 Years | 175 (21.9%) | 81 (7.9%) |
| 16 and 17 Years | 67 (3.7%) | 286 (14.3%) |
| 18 to 24 Years | 427 (8.1%) | 395 (7.2%) |
| 25 to 34 Years | 374 (4.4%) | 1,187 (17.4%) |
| 35 to 44 Years | 615 (8.0%) | 725 (10.8%) |
| 45 to 54 Years | 242 (3.3%) | 534 (7.4%) |
| 55 to 64 Years | 479 (7.0%) | 556 (7.9%) |
| 65 to 74 Years | 174 (4.1%) | 358 (8.0%) |
| 75 Years and over | 222 (10.9%) | 262 (9.1%) |
| Total | 4,928 (8.6%) | 6,286 (11.4%) |
Income Above Poverty by Sex and Age in Elgin
According to the poverty statistics in Elgin, males aged 45 to 54 years and females aged 18 to 24 years are the age groups that are most secure financially, with 96.7% of males and 92.8% of females in these age groups living above the poverty line.
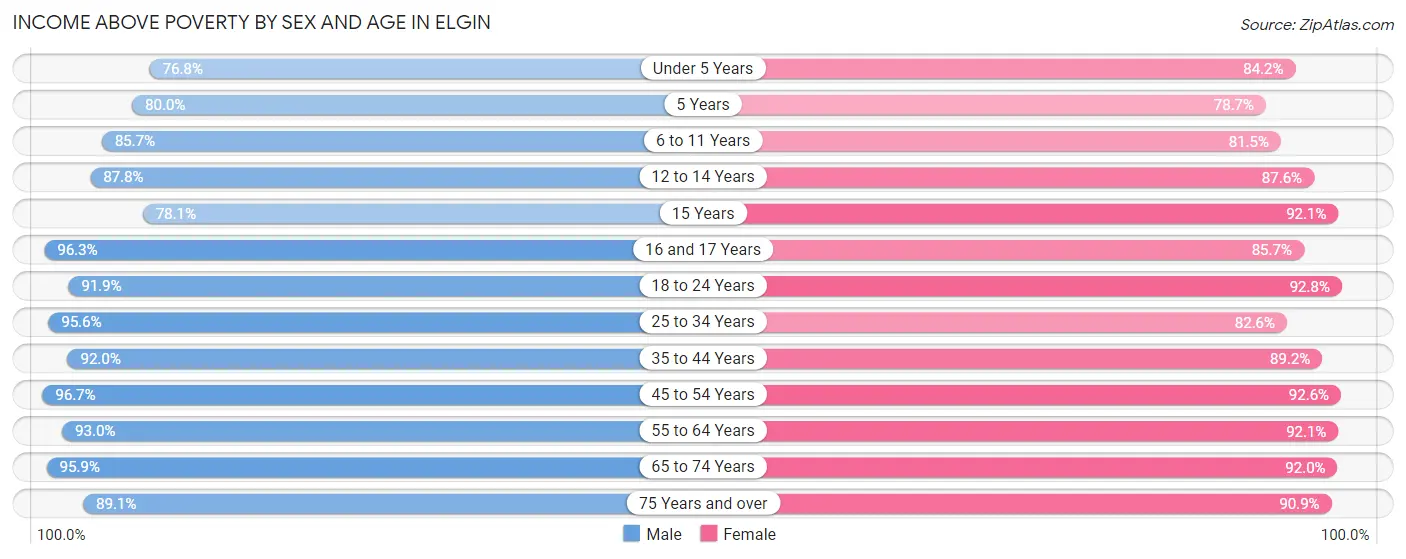
| Age Bracket | Male | Female |
| Under 5 Years | 3,258 (76.8%) | 3,308 (84.2%) |
| 5 Years | 718 (80.0%) | 488 (78.7%) |
| 6 to 11 Years | 4,038 (85.7%) | 3,752 (81.5%) |
| 12 to 14 Years | 2,271 (87.8%) | 2,088 (87.6%) |
| 15 Years | 623 (78.1%) | 950 (92.1%) |
| 16 and 17 Years | 1,765 (96.3%) | 1,720 (85.7%) |
| 18 to 24 Years | 4,831 (91.9%) | 5,083 (92.8%) |
| 25 to 34 Years | 8,106 (95.6%) | 5,633 (82.6%) |
| 35 to 44 Years | 7,087 (92.0%) | 5,966 (89.2%) |
| 45 to 54 Years | 7,088 (96.7%) | 6,720 (92.6%) |
| 55 to 64 Years | 6,380 (93.0%) | 6,511 (92.1%) |
| 65 to 74 Years | 4,091 (95.9%) | 4,110 (92.0%) |
| 75 Years and over | 1,822 (89.1%) | 2,612 (90.9%) |
| Total | 52,078 (91.4%) | 48,941 (88.6%) |
Income Below Poverty Among Married-Couple Families in Elgin
The poverty statistics for married-couple families in Elgin show that 4.7% or 918 of the total 19,631 families live below the poverty line. Families with 3 or 4 children have the highest poverty rate of 19.2%, comprising of 419 families. On the other hand, families with no children have the lowest poverty rate of 2.4%, which includes 244 families.
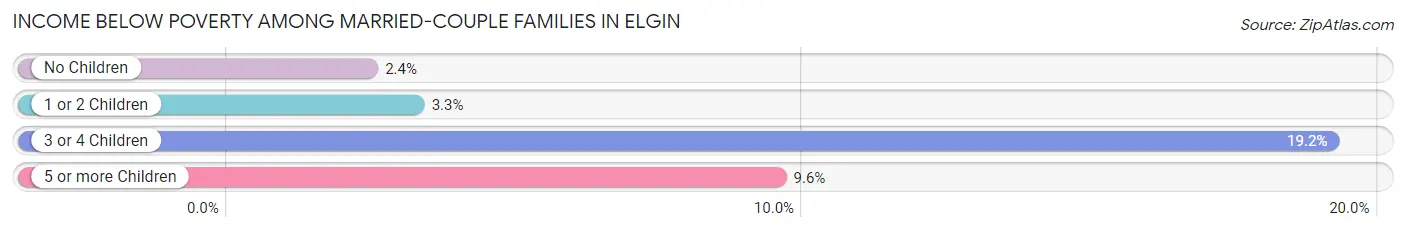
| Children | Above Poverty | Below Poverty |
| No Children | 9,743 (97.6%) | 244 (2.4%) |
| 1 or 2 Children | 7,023 (96.8%) | 236 (3.3%) |
| 3 or 4 Children | 1,767 (80.8%) | 419 (19.2%) |
| 5 or more Children | 180 (90.4%) | 19 (9.6%) |
| Total | 18,713 (95.3%) | 918 (4.7%) |
Income Below Poverty Among Single-Parent Households in Elgin
According to the poverty data in Elgin, 7.6% or 197 single-father households and 22.6% or 1,249 single-mother households are living below the poverty line. Among single-father households, those with 1 or 2 children have the highest poverty rate, with 133 households (15.9%) experiencing poverty. Likewise, among single-mother households, those with 5 or more children have the highest poverty rate, with 88 households (82.2%) falling below the poverty line.
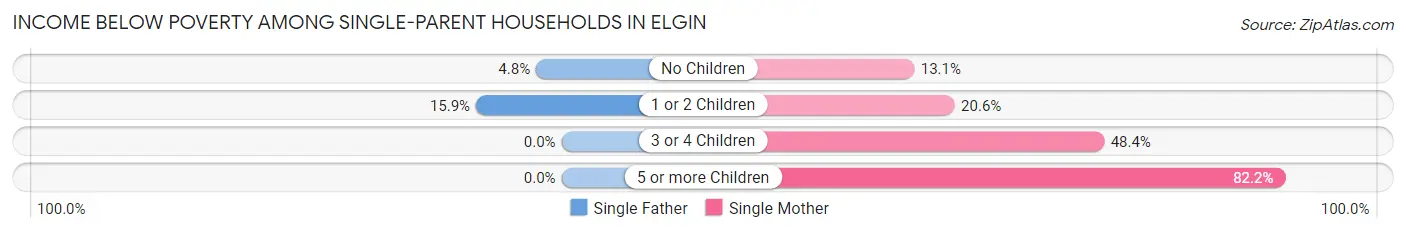
| Children | Single Father | Single Mother |
| No Children | 64 (4.8%) | 257 (13.1%) |
| 1 or 2 Children | 133 (15.9%) | 565 (20.6%) |
| 3 or 4 Children | 0 (0.0%) | 339 (48.4%) |
| 5 or more Children | 0 (0.0%) | 88 (82.2%) |
| Total | 197 (7.6%) | 1,249 (22.6%) |
Income Below Poverty Among Married-Couple vs Single-Parent Households in Elgin
The poverty data for Elgin shows that 918 of the married-couple family households (4.7%) and 1,446 of the single-parent households (17.8%) are living below the poverty level. Within the married-couple family households, those with 3 or 4 children have the highest poverty rate, with 419 households (19.2%) falling below the poverty line. Among the single-parent households, those with 5 or more children have the highest poverty rate, with 88 household (48.9%) living below poverty.
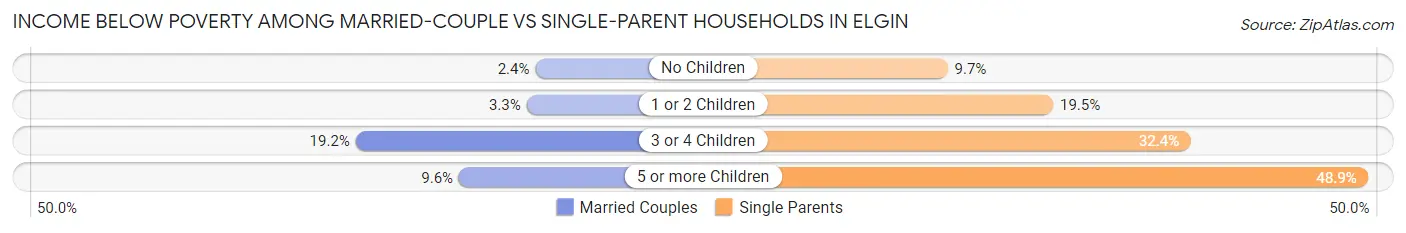
| Children | Married-Couple Families | Single-Parent Households |
| No Children | 244 (2.4%) | 321 (9.7%) |
| 1 or 2 Children | 236 (3.3%) | 698 (19.5%) |
| 3 or 4 Children | 419 (19.2%) | 339 (32.4%) |
| 5 or more Children | 19 (9.6%) | 88 (48.9%) |
| Total | 918 (4.7%) | 1,446 (17.8%) |
Race in Elgin
The most populous races in Elgin are White / Caucasian (57,733 | 50.6%), Hispanic or Latino (54,061 | 47.3%), and Some other Race (25,317 | 22.2%).
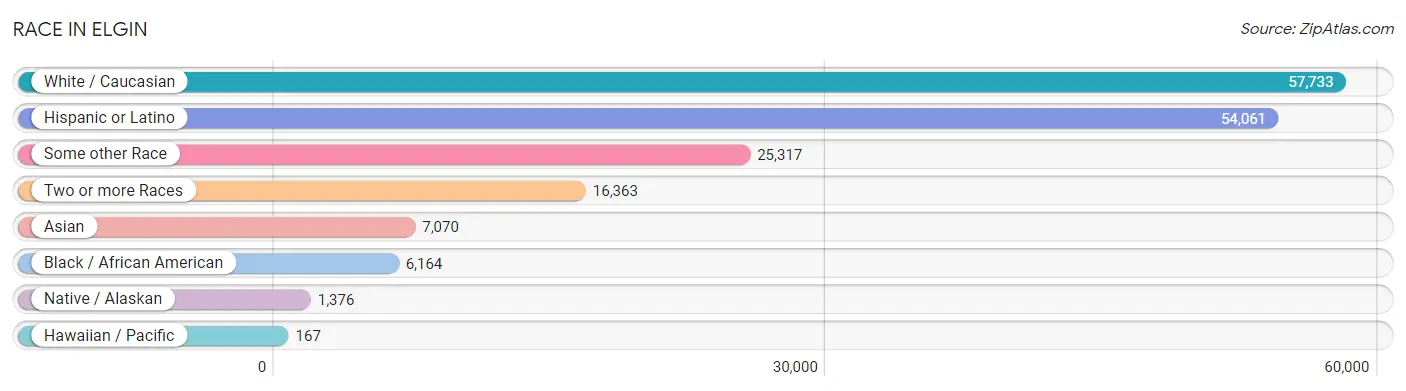
| Race | # Population | % Population |
| Asian | 7,070 | 6.2% |
| Black / African American | 6,164 | 5.4% |
| Hawaiian / Pacific | 167 | 0.2% |
| Hispanic or Latino | 54,061 | 47.3% |
| Native / Alaskan | 1,376 | 1.2% |
| White / Caucasian | 57,733 | 50.6% |
| Two or more Races | 16,363 | 14.3% |
| Some other Race | 25,317 | 22.2% |
| Total | 114,190 | 100.0% |
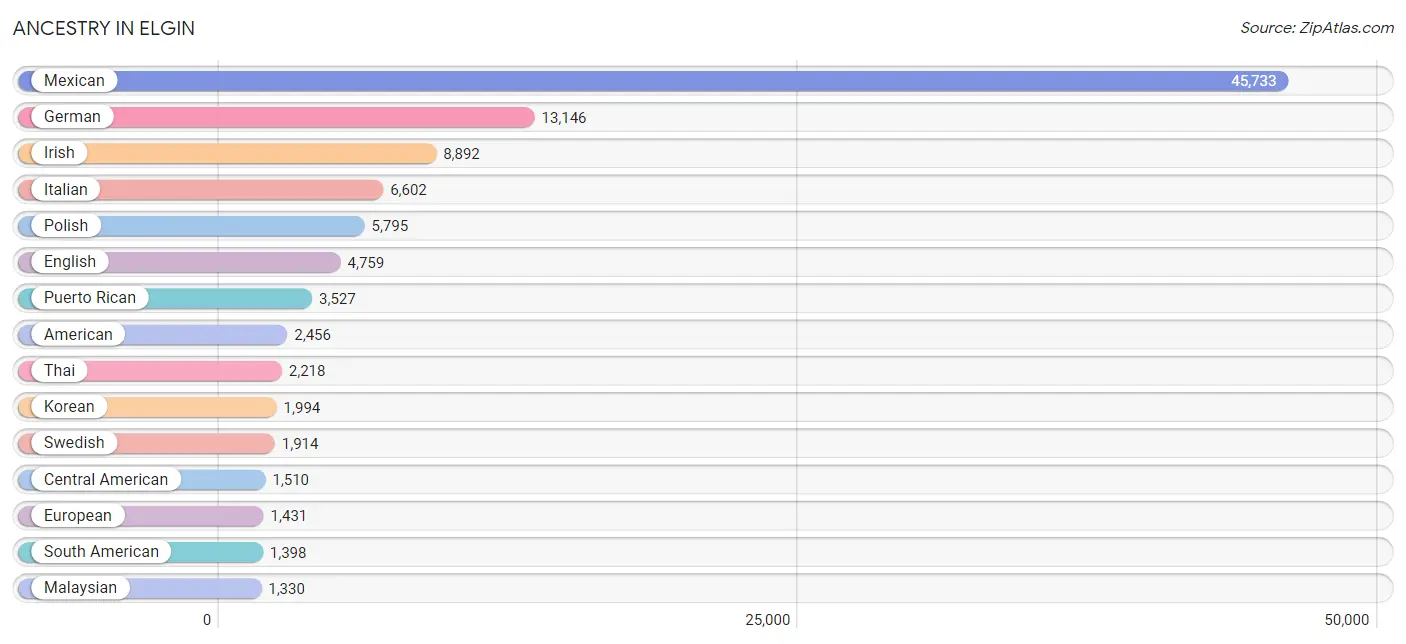
Ancestry in Elgin
The most populous ancestries reported in Elgin are Mexican (45,733 | 40.1%), German (13,146 | 11.5%), Irish (8,892 | 7.8%), Italian (6,602 | 5.8%), and Polish (5,795 | 5.1%), together accounting for 70.2% of all Elgin residents.
| Ancestry | # Population | % Population |
| African | 99 | 0.1% |
| Albanian | 197 | 0.2% |
| American | 2,456 | 2.1% |
| Apache | 5 | 0.0% |
| Arab | 370 | 0.3% |
| Argentinean | 4 | 0.0% |
| Assyrian / Chaldean / Syriac | 158 | 0.1% |
| Australian | 54 | 0.1% |
| Austrian | 64 | 0.1% |
| Bahamian | 9 | 0.0% |
| Barbadian | 29 | 0.0% |
| Belgian | 33 | 0.0% |
| Belizean | 11 | 0.0% |
| Bhutanese | 153 | 0.1% |
| Blackfeet | 28 | 0.0% |
| Brazilian | 44 | 0.0% |
| British | 216 | 0.2% |
| Bulgarian | 157 | 0.1% |
| Burmese | 298 | 0.3% |
| Canadian | 155 | 0.1% |
| Central American | 1,510 | 1.3% |
| Central American Indian | 281 | 0.3% |
| Cherokee | 67 | 0.1% |
| Chilean | 76 | 0.1% |
| Colombian | 609 | 0.5% |
| Costa Rican | 151 | 0.1% |
| Croatian | 157 | 0.1% |
| Crow | 12 | 0.0% |
| Cuban | 200 | 0.2% |
| Czech | 443 | 0.4% |
| Czechoslovakian | 86 | 0.1% |
| Danish | 305 | 0.3% |
| Delaware | 9 | 0.0% |
| Dominican | 1 | 0.0% |
| Dutch | 614 | 0.5% |
| Eastern European | 220 | 0.2% |
| Ecuadorian | 213 | 0.2% |
| Egyptian | 91 | 0.1% |
| English | 4,759 | 4.2% |
| European | 1,431 | 1.3% |
| Finnish | 119 | 0.1% |
| French | 1,106 | 1.0% |
| French Canadian | 156 | 0.1% |
| German | 13,146 | 11.5% |
| Ghanaian | 77 | 0.1% |
| Greek | 394 | 0.4% |
| Guatemalan | 445 | 0.4% |
| Guyanese | 21 | 0.0% |
| Haitian | 82 | 0.1% |
| Honduran | 56 | 0.1% |
| Hungarian | 444 | 0.4% |
| Indian (Asian) | 758 | 0.7% |
| Inupiat | 98 | 0.1% |
| Iranian | 29 | 0.0% |
| Irish | 8,892 | 7.8% |
| Iroquois | 17 | 0.0% |
| Italian | 6,602 | 5.8% |
| Jamaican | 42 | 0.0% |
| Japanese | 67 | 0.1% |
| Kenyan | 44 | 0.0% |
| Korean | 1,994 | 1.8% |
| Laotian | 91 | 0.1% |
| Lebanese | 28 | 0.0% |
| Lithuanian | 356 | 0.3% |
| Luxembourger | 10 | 0.0% |
| Macedonian | 122 | 0.1% |
| Malaysian | 1,330 | 1.2% |
| Mexican | 45,733 | 40.1% |
| Mexican American Indian | 874 | 0.8% |
| Mongolian | 21 | 0.0% |
| Native Hawaiian | 131 | 0.1% |
| Navajo | 6 | 0.0% |
| Nigerian | 23 | 0.0% |
| Northern European | 36 | 0.0% |
| Norwegian | 1,318 | 1.1% |
| Osage | 3 | 0.0% |
| Ottawa | 27 | 0.0% |
| Pakistani | 85 | 0.1% |
| Panamanian | 171 | 0.2% |
| Peruvian | 31 | 0.0% |
| Polish | 5,795 | 5.1% |
| Portuguese | 15 | 0.0% |
| Puerto Rican | 3,527 | 3.1% |
| Romanian | 158 | 0.1% |
| Russian | 1,138 | 1.0% |
| Salvadoran | 687 | 0.6% |
| Samoan | 23 | 0.0% |
| Scandinavian | 145 | 0.1% |
| Scotch-Irish | 446 | 0.4% |
| Scottish | 937 | 0.8% |
| Serbian | 365 | 0.3% |
| Slavic | 42 | 0.0% |
| Slovak | 106 | 0.1% |
| Slovene | 88 | 0.1% |
| Somali | 10 | 0.0% |
| South American | 1,398 | 1.2% |
| South American Indian | 70 | 0.1% |
| Spaniard | 130 | 0.1% |
| Spanish | 286 | 0.3% |
| Sri Lankan | 227 | 0.2% |
| Subsaharan African | 448 | 0.4% |
| Swedish | 1,914 | 1.7% |
| Swiss | 229 | 0.2% |
| Syrian | 21 | 0.0% |
| Thai | 2,218 | 1.9% |
| Trinidadian and Tobagonian | 13 | 0.0% |
| Turkish | 96 | 0.1% |
| U.S. Virgin Islander | 10 | 0.0% |
| Ukrainian | 402 | 0.4% |
| Venezuelan | 465 | 0.4% |
| Welsh | 285 | 0.3% |
| West Indian | 22 | 0.0% |
| Yugoslavian | 33 | 0.0% | View All 113 Rows |
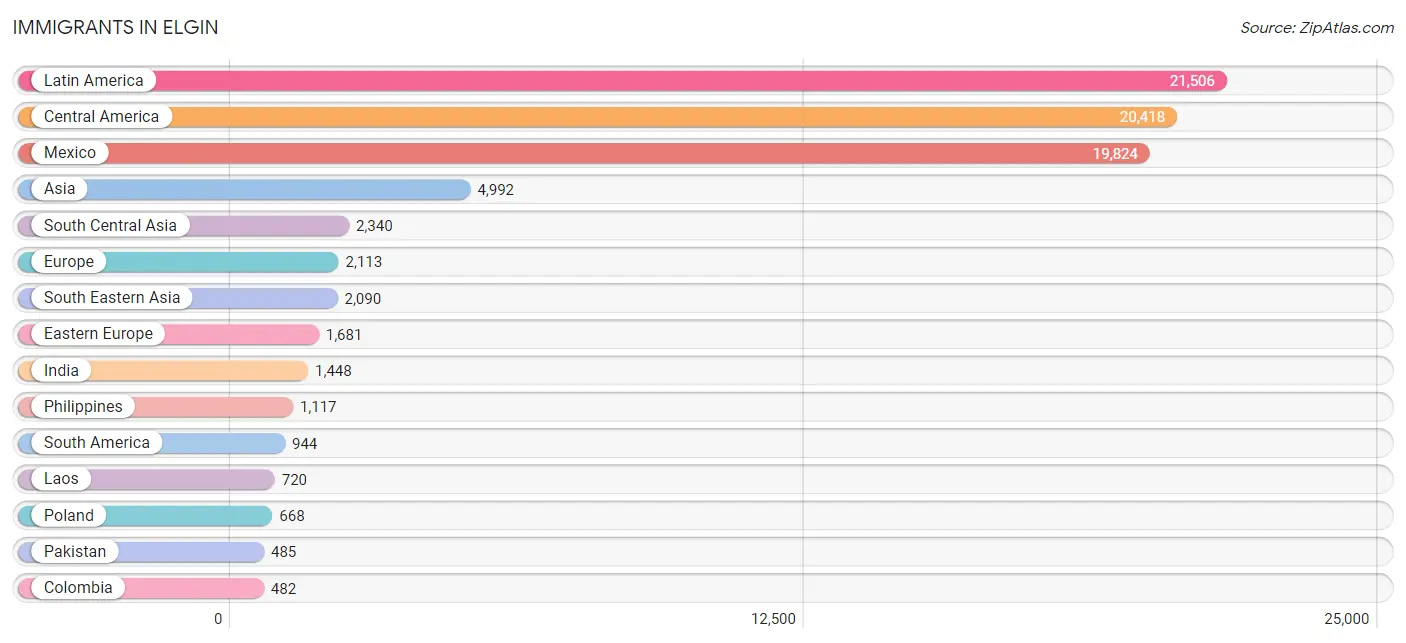
Immigrants in Elgin
The most numerous immigrant groups reported in Elgin came from Latin America (21,506 | 18.8%), Central America (20,418 | 17.9%), Mexico (19,824 | 17.4%), Asia (4,992 | 4.4%), and South Central Asia (2,340 | 2.1%), together accounting for 60.5% of all Elgin residents.
| Immigration Origin | # Population | % Population |
| Africa | 359 | 0.3% |
| Argentina | 21 | 0.0% |
| Asia | 4,992 | 4.4% |
| Australia | 46 | 0.0% |
| Bahamas | 31 | 0.0% |
| Barbados | 10 | 0.0% |
| Belize | 7 | 0.0% |
| Bosnia and Herzegovina | 88 | 0.1% |
| Brazil | 28 | 0.0% |
| Bulgaria | 70 | 0.1% |
| Cameroon | 73 | 0.1% |
| Canada | 211 | 0.2% |
| Caribbean | 144 | 0.1% |
| Central America | 20,418 | 17.9% |
| Chile | 20 | 0.0% |
| China | 98 | 0.1% |
| Colombia | 482 | 0.4% |
| Costa Rica | 151 | 0.1% |
| Croatia | 47 | 0.0% |
| Cuba | 7 | 0.0% |
| Eastern Africa | 64 | 0.1% |
| Eastern Asia | 304 | 0.3% |
| Eastern Europe | 1,681 | 1.5% |
| Ecuador | 66 | 0.1% |
| El Salvador | 230 | 0.2% |
| England | 47 | 0.0% |
| Ethiopia | 3 | 0.0% |
| Europe | 2,113 | 1.8% |
| France | 17 | 0.0% |
| Germany | 133 | 0.1% |
| Ghana | 85 | 0.1% |
| Greece | 65 | 0.1% |
| Guatemala | 167 | 0.2% |
| Haiti | 13 | 0.0% |
| Honduras | 39 | 0.0% |
| Hong Kong | 16 | 0.0% |
| India | 1,448 | 1.3% |
| Indonesia | 25 | 0.0% |
| Iran | 26 | 0.0% |
| Ireland | 1 | 0.0% |
| Italy | 67 | 0.1% |
| Jamaica | 42 | 0.0% |
| Japan | 32 | 0.0% |
| Kenya | 20 | 0.0% |
| Korea | 174 | 0.2% |
| Laos | 720 | 0.6% |
| Latin America | 21,506 | 18.8% |
| Lithuania | 13 | 0.0% |
| Malaysia | 14 | 0.0% |
| Mexico | 19,824 | 17.4% |
| Middle Africa | 73 | 0.1% |
| Moldova | 60 | 0.1% |
| Netherlands | 7 | 0.0% |
| North Macedonia | 128 | 0.1% |
| Northern Africa | 55 | 0.1% |
| Northern Europe | 84 | 0.1% |
| Oceania | 46 | 0.0% |
| Pakistan | 485 | 0.4% |
| Peru | 31 | 0.0% |
| Philippines | 1,117 | 1.0% |
| Poland | 668 | 0.6% |
| Romania | 102 | 0.1% |
| Russia | 339 | 0.3% |
| Scotland | 14 | 0.0% |
| Serbia | 45 | 0.0% |
| Somalia | 10 | 0.0% |
| South America | 944 | 0.8% |
| South Central Asia | 2,340 | 2.1% |
| South Eastern Asia | 2,090 | 1.8% |
| Southern Europe | 139 | 0.1% |
| Spain | 7 | 0.0% |
| Sweden | 12 | 0.0% |
| Syria | 128 | 0.1% |
| Taiwan | 7 | 0.0% |
| Thailand | 66 | 0.1% |
| Trinidad and Tobago | 11 | 0.0% |
| Turkey | 29 | 0.0% |
| Ukraine | 111 | 0.1% |
| Uzbekistan | 381 | 0.3% |
| Venezuela | 296 | 0.3% |
| Vietnam | 118 | 0.1% |
| West Indies | 30 | 0.0% |
| Western Africa | 158 | 0.1% |
| Western Asia | 190 | 0.2% |
| Western Europe | 157 | 0.1% | View All 85 Rows |
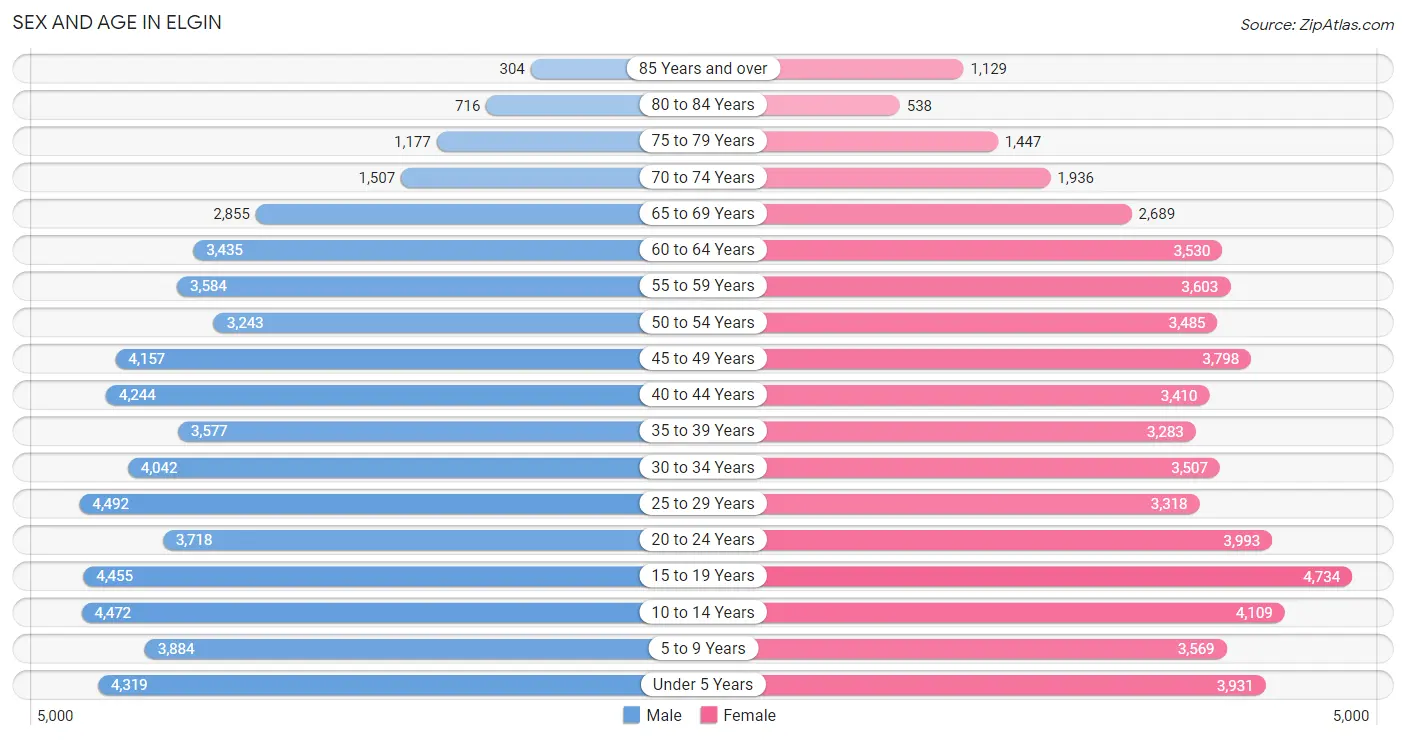
Sex and Age in Elgin
Sex and Age in Elgin
The most populous age groups in Elgin are 25 to 29 Years (4,492 | 7.7%) for men and 15 to 19 Years (4,734 | 8.5%) for women.
| Age Bracket | Male | Female |
| Under 5 Years | 4,319 (7.4%) | 3,931 (7.0%) |
| 5 to 9 Years | 3,884 (6.7%) | 3,569 (6.4%) |
| 10 to 14 Years | 4,472 (7.7%) | 4,109 (7.3%) |
| 15 to 19 Years | 4,455 (7.7%) | 4,734 (8.5%) |
| 20 to 24 Years | 3,718 (6.4%) | 3,993 (7.1%) |
| 25 to 29 Years | 4,492 (7.7%) | 3,318 (5.9%) |
| 30 to 34 Years | 4,042 (7.0%) | 3,507 (6.3%) |
| 35 to 39 Years | 3,577 (6.1%) | 3,283 (5.9%) |
| 40 to 44 Years | 4,244 (7.3%) | 3,410 (6.1%) |
| 45 to 49 Years | 4,157 (7.1%) | 3,798 (6.8%) |
| 50 to 54 Years | 3,243 (5.6%) | 3,485 (6.2%) |
| 55 to 59 Years | 3,584 (6.2%) | 3,603 (6.4%) |
| 60 to 64 Years | 3,435 (5.9%) | 3,530 (6.3%) |
| 65 to 69 Years | 2,855 (4.9%) | 2,689 (4.8%) |
| 70 to 74 Years | 1,507 (2.6%) | 1,936 (3.5%) |
| 75 to 79 Years | 1,177 (2.0%) | 1,447 (2.6%) |
| 80 to 84 Years | 716 (1.2%) | 538 (1.0%) |
| 85 Years and over | 304 (0.5%) | 1,129 (2.0%) |
| Total | 58,181 (100.0%) | 56,009 (100.0%) |
Families and Households in Elgin
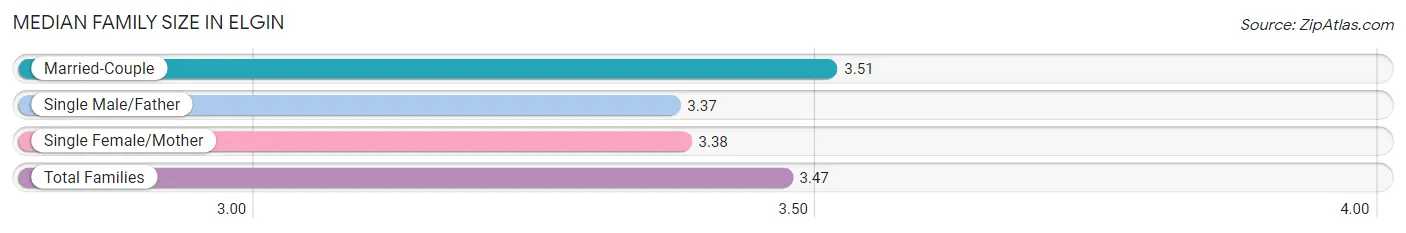
Median Family Size in Elgin
The median family size in Elgin is 3.47 persons per family, with married-couple families (19,631 | 70.7%) accounting for the largest median family size of 3.51 persons per family. On the other hand, single male/father families (2,603 | 9.4%) represent the smallest median family size with 3.37 persons per family.
| Family Type | # Families | Family Size |
| Married-Couple | 19,631 (70.7%) | 3.51 |
| Single Male/Father | 2,603 (9.4%) | 3.37 |
| Single Female/Mother | 5,520 (19.9%) | 3.38 |
| Total Families | 27,754 (100.0%) | 3.47 |
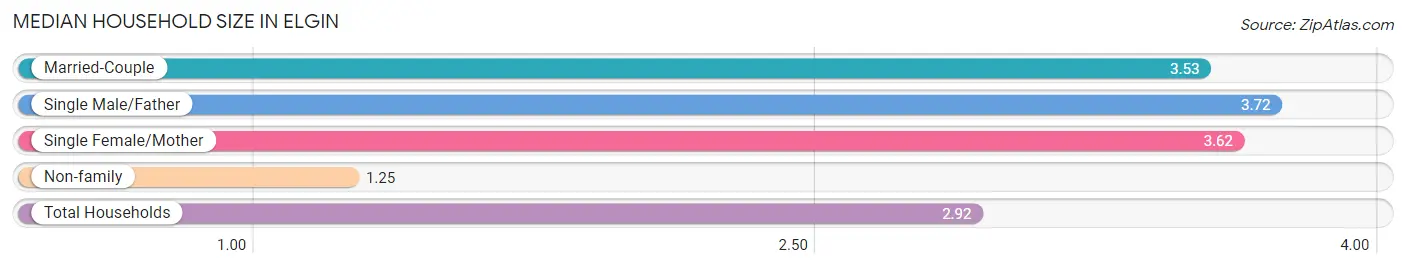
Median Household Size in Elgin
The median household size in Elgin is 2.92 persons per household, with single male/father households (2,603 | 6.8%) accounting for the largest median household size of 3.72 persons per household. non-family households (10,776 | 28.0%) represent the smallest median household size with 1.25 persons per household.
| Household Type | # Households | Household Size |
| Married-Couple | 19,631 (50.9%) | 3.53 |
| Single Male/Father | 2,603 (6.8%) | 3.72 |
| Single Female/Mother | 5,520 (14.3%) | 3.62 |
| Non-family | 10,776 (28.0%) | 1.25 |
| Total Households | 38,530 (100.0%) | 2.92 |
Household Size by Marriage Status in Elgin
Out of a total of 38,530 households in Elgin, 27,754 (72.0%) are family households, while 10,776 (28.0%) are nonfamily households. The most numerous type of family households are 2-person households, comprising 9,557, and the most common type of nonfamily households are 1-person households, comprising 8,933.
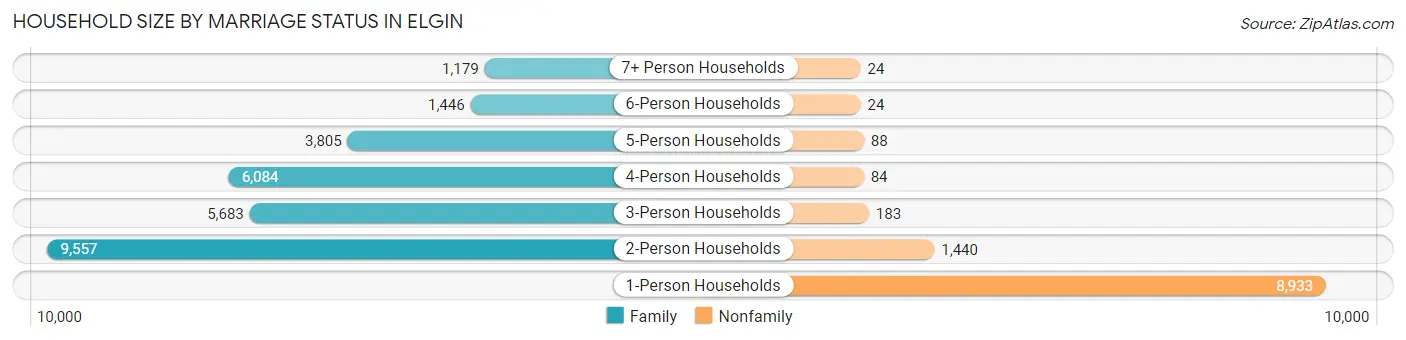
| Household Size | Family Households | Nonfamily Households |
| 1-Person Households | - | 8,933 (23.2%) |
| 2-Person Households | 9,557 (24.8%) | 1,440 (3.7%) |
| 3-Person Households | 5,683 (14.7%) | 183 (0.5%) |
| 4-Person Households | 6,084 (15.8%) | 84 (0.2%) |
| 5-Person Households | 3,805 (9.9%) | 88 (0.2%) |
| 6-Person Households | 1,446 (3.7%) | 24 (0.1%) |
| 7+ Person Households | 1,179 (3.1%) | 24 (0.1%) |
| Total | 27,754 (72.0%) | 10,776 (28.0%) |
Female Fertility in Elgin
Fertility by Age in Elgin
Average fertility rate in Elgin is 55.0 births per 1,000 women. Women in the age bracket of 20 to 34 years have the highest fertility rate with 109.0 births per 1,000 women. Women in the age bracket of 20 to 34 years acount for 80.3% of all women with births.
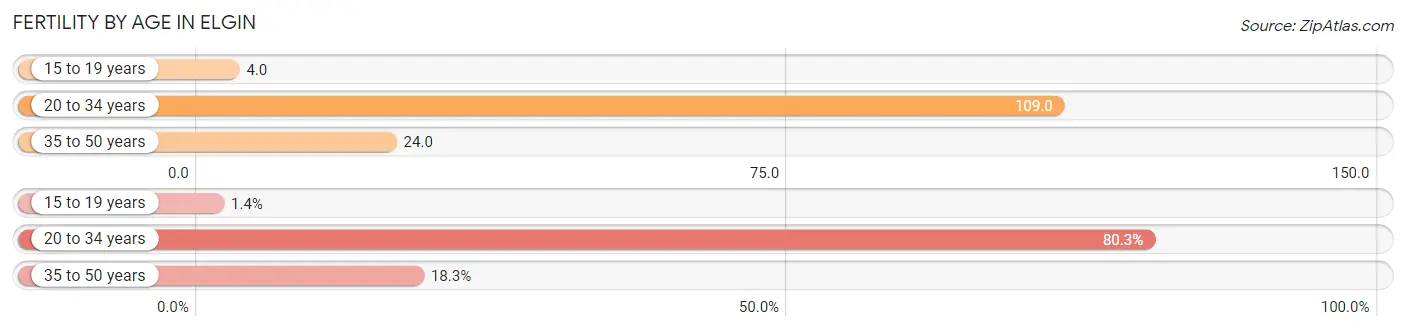
| Age Bracket | Women with Births | Births / 1,000 Women |
| 15 to 19 years | 20 (1.4%) | 4.0 |
| 20 to 34 years | 1,184 (80.3%) | 109.0 |
| 35 to 50 years | 270 (18.3%) | 24.0 |
| Total | 1,474 (100.0%) | 55.0 |
Fertility by Age by Marriage Status in Elgin
72.5% of women with births (1,474) in Elgin are married. The highest percentage of unmarried women with births falls into 15 to 19 years age bracket with 100.0% of them unmarried at the time of birth, while the lowest percentage of unmarried women with births belong to 35 to 50 years age bracket with 9.6% of them unmarried.
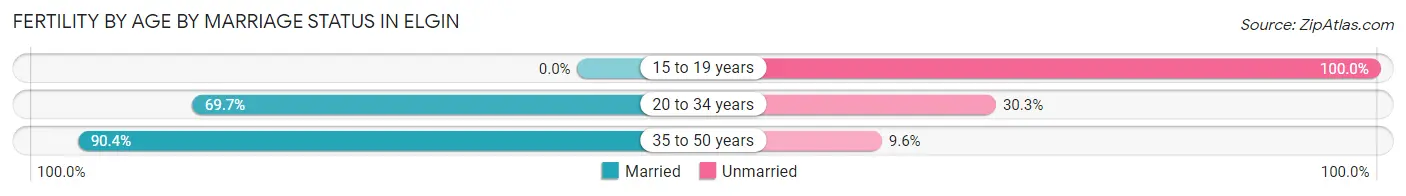
| Age Bracket | Married | Unmarried |
| 15 to 19 years | 0 (0.0%) | 20 (100.0%) |
| 20 to 34 years | 825 (69.7%) | 359 (30.3%) |
| 35 to 50 years | 244 (90.4%) | 26 (9.6%) |
| Total | 1,069 (72.5%) | 405 (27.5%) |
Fertility by Education in Elgin
Average fertility rate in Elgin is 55.0 births per 1,000 women. Women with the education attainment of graduate degree have the highest fertility rate of 105.0 births per 1,000 women, while women with the education attainment of less than high school have the lowest fertility at 35.0 births per 1,000 women. Women with the education attainment of college or associate's degree represent 33.8% of all women with births.
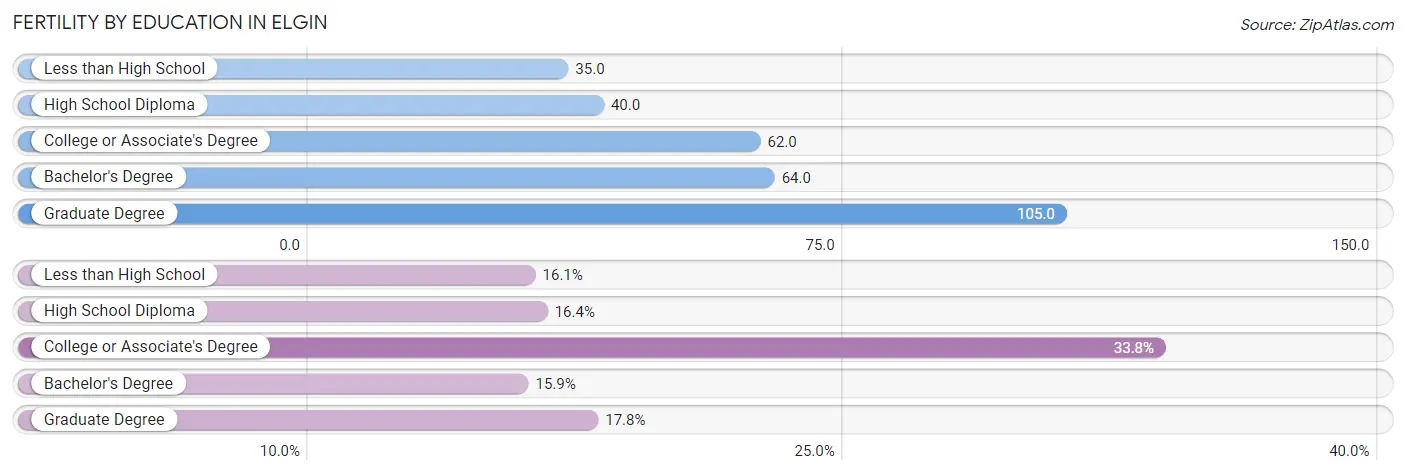
| Educational Attainment | Women with Births | Births / 1,000 Women |
| Less than High School | 237 (16.1%) | 35.0 |
| High School Diploma | 242 (16.4%) | 40.0 |
| College or Associate's Degree | 498 (33.8%) | 62.0 |
| Bachelor's Degree | 234 (15.9%) | 64.0 |
| Graduate Degree | 263 (17.8%) | 105.0 |
| Total | 1,474 (100.0%) | 55.0 |
Fertility by Education by Marriage Status in Elgin
27.5% of women with births in Elgin are unmarried. Women with the educational attainment of graduate degree are most likely to be married with 100.0% of them married at childbirth, while women with the educational attainment of high school diploma are least likely to be married with 48.3% of them unmarried at childbirth.
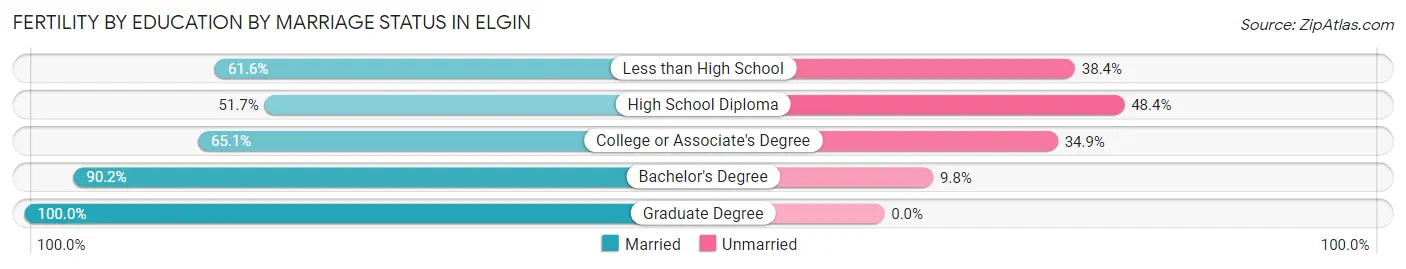
| Educational Attainment | Married | Unmarried |
| Less than High School | 146 (61.6%) | 91 (38.4%) |
| High School Diploma | 125 (51.6%) | 117 (48.3%) |
| College or Associate's Degree | 324 (65.1%) | 174 (34.9%) |
| Bachelor's Degree | 211 (90.2%) | 23 (9.8%) |
| Graduate Degree | 263 (100.0%) | 0 (0.0%) |
| Total | 1,069 (72.5%) | 405 (27.5%) |
Employment Characteristics in Elgin
Employment by Class of Employer in Elgin
Among the 56,062 employed individuals in Elgin, private company employees (44,540 | 79.4%), local government employees (3,365 | 6.0%), and not-for-profit organizations (3,263 | 5.8%) make up the most common classes of employment.
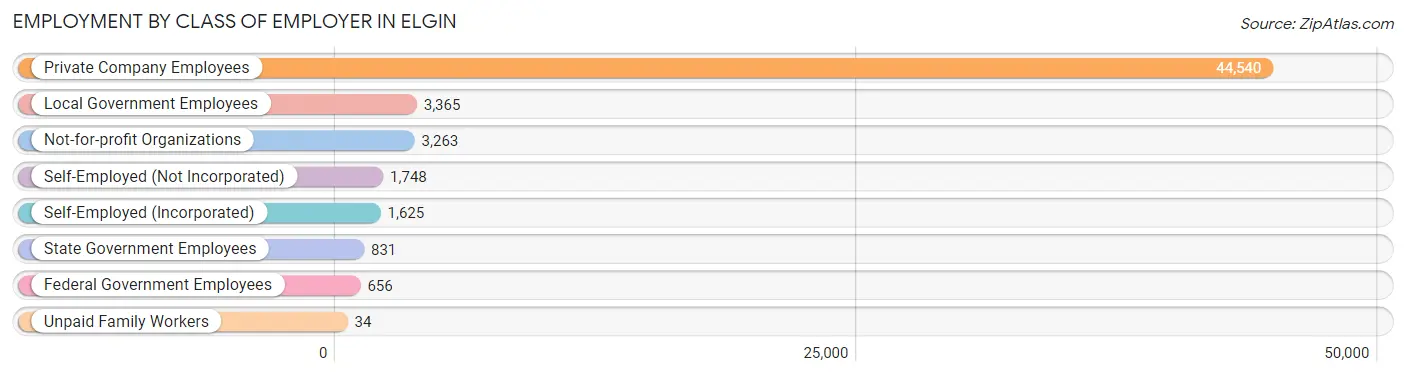
| Employer Class | # Employees | % Employees |
| Private Company Employees | 44,540 | 79.4% |
| Self-Employed (Incorporated) | 1,625 | 2.9% |
| Self-Employed (Not Incorporated) | 1,748 | 3.1% |
| Not-for-profit Organizations | 3,263 | 5.8% |
| Local Government Employees | 3,365 | 6.0% |
| State Government Employees | 831 | 1.5% |
| Federal Government Employees | 656 | 1.2% |
| Unpaid Family Workers | 34 | 0.1% |
| Total | 56,062 | 100.0% |
Employment Status by Age in Elgin
According to the labor force statistics for Elgin, out of the total population over 16 years of age (88,076), 69.1% or 60,861 individuals are in the labor force, with 6.0% or 3,652 of them unemployed. The age group with the highest labor force participation rate is 25 to 29 years, with 87.0% or 6,795 individuals in the labor force. Within the labor force, the 16 to 19 years age range has the highest percentage of unemployed individuals, with 9.6% or 334 of them being unemployed.
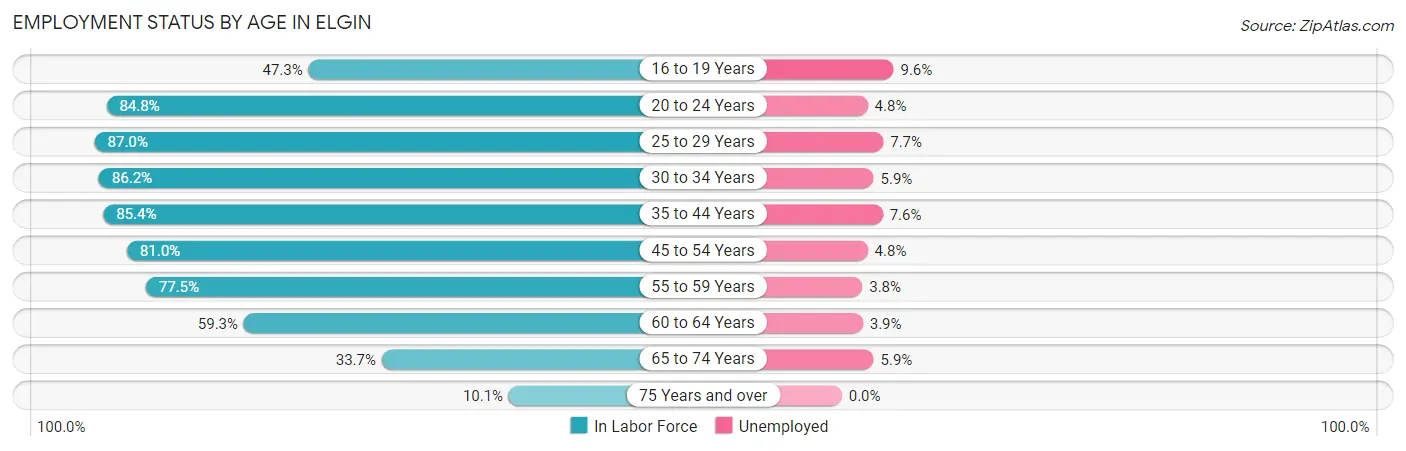
| Age Bracket | In Labor Force | Unemployed |
| 16 to 19 Years | 3,481 (47.3%) | 334 (9.6%) |
| 20 to 24 Years | 6,539 (84.8%) | 314 (4.8%) |
| 25 to 29 Years | 6,795 (87.0%) | 523 (7.7%) |
| 30 to 34 Years | 6,507 (86.2%) | 384 (5.9%) |
| 35 to 44 Years | 12,395 (85.4%) | 942 (7.6%) |
| 45 to 54 Years | 11,893 (81.0%) | 571 (4.8%) |
| 55 to 59 Years | 5,570 (77.5%) | 212 (3.8%) |
| 60 to 64 Years | 4,130 (59.3%) | 161 (3.9%) |
| 65 to 74 Years | 3,029 (33.7%) | 179 (5.9%) |
| 75 Years and over | 536 (10.1%) | 0 (0.0%) |
| Total | 60,861 (69.1%) | 3,652 (6.0%) |
Employment Status by Educational Attainment in Elgin
According to labor force statistics for Elgin, 80.6% of individuals (47,319) out of the total population between 25 and 64 years of age (58,708) are in the labor force, with 5.9% or 2,792 of them being unemployed. The group with the highest labor force participation rate are those with the educational attainment of bachelor's degree or higher, with 86.8% or 13,593 individuals in the labor force. Within the labor force, individuals with less than high school education have the highest percentage of unemployment, with 7.6% or 663 of them being unemployed.
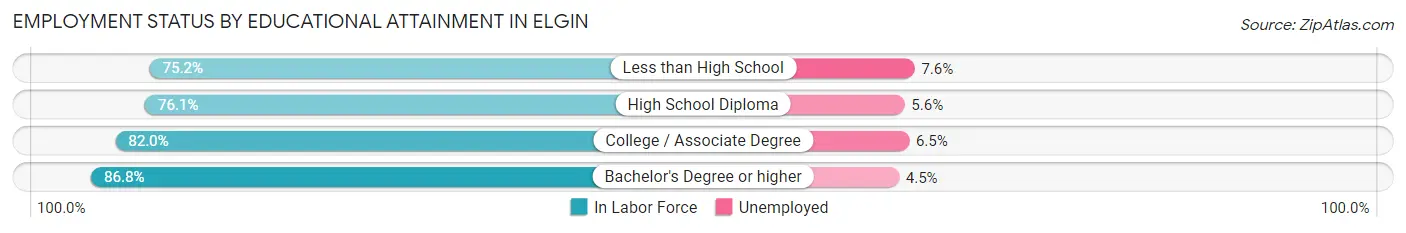
| Educational Attainment | In Labor Force | Unemployed |
| Less than High School | 8,723 (75.2%) | 882 (7.6%) |
| High School Diploma | 10,254 (76.1%) | 755 (5.6%) |
| College / Associate Degree | 14,739 (82.0%) | 1,168 (6.5%) |
| Bachelor's Degree or higher | 13,593 (86.8%) | 705 (4.5%) |
| Total | 47,319 (80.6%) | 3,464 (5.9%) |
Employment Occupations by Sex in Elgin
Management, Business, Science and Arts Occupations
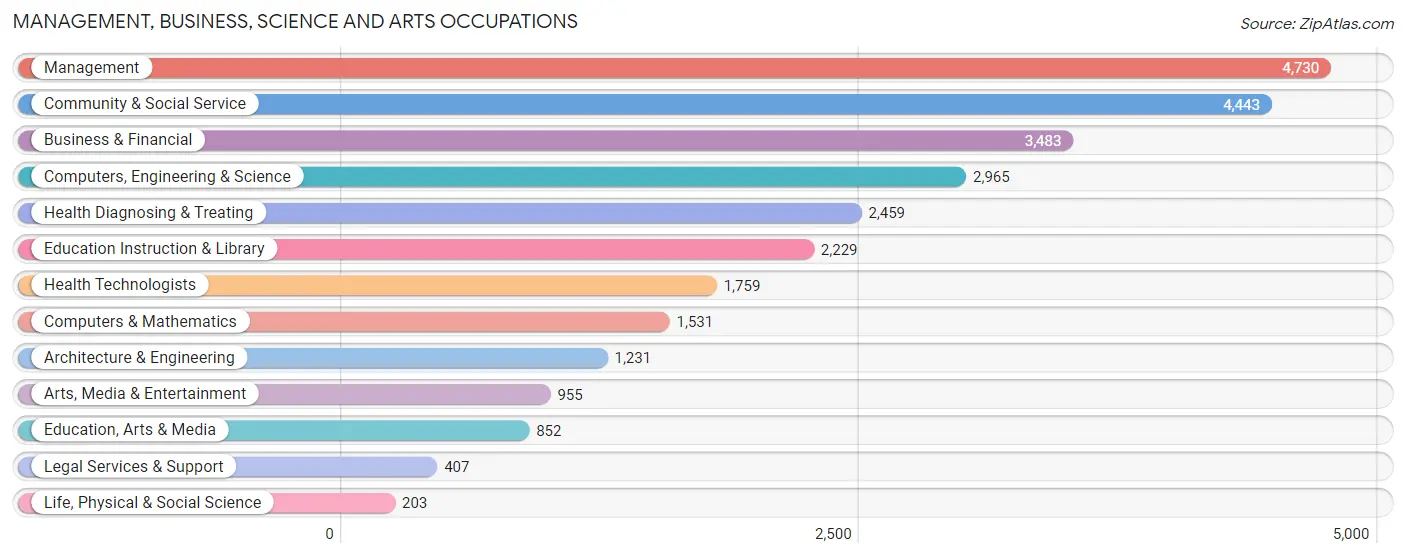
The most common Management, Business, Science and Arts occupations in Elgin are Management (4,730 | 8.3%), Community & Social Service (4,443 | 7.8%), Business & Financial (3,483 | 6.1%), Computers, Engineering & Science (2,965 | 5.2%), and Health Diagnosing & Treating (2,459 | 4.3%).
Management, Business, Science and Arts Occupations by Sex
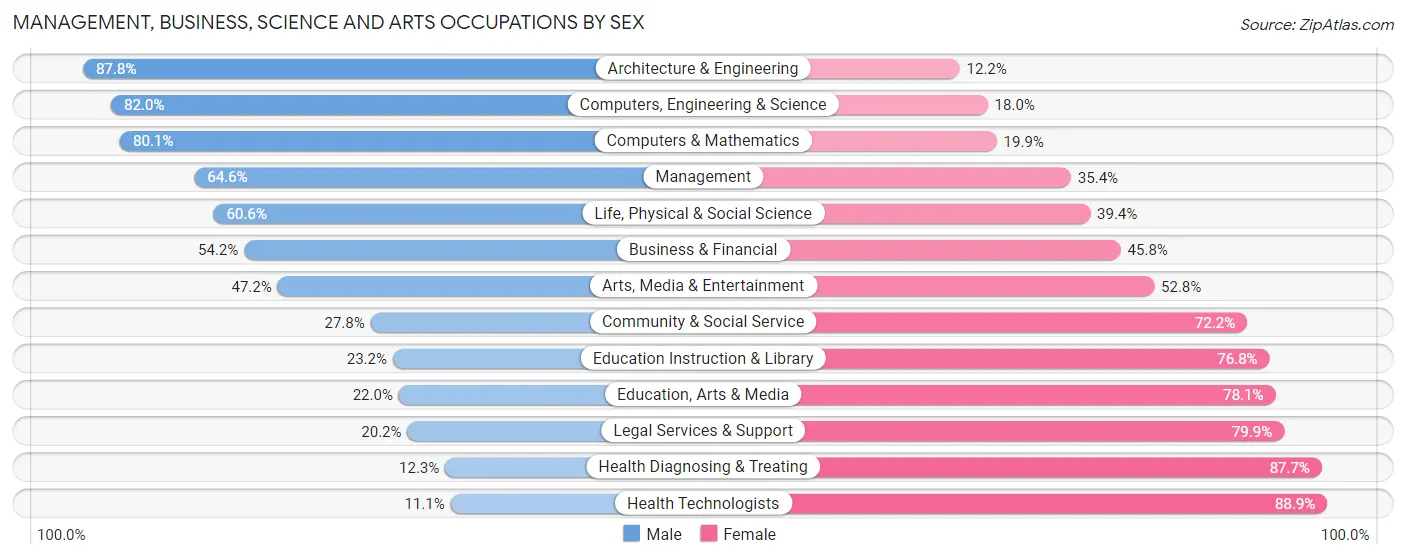
Within the Management, Business, Science and Arts occupations in Elgin, the most male-oriented occupations are Architecture & Engineering (87.8%), Computers, Engineering & Science (82.0%), and Computers & Mathematics (80.1%), while the most female-oriented occupations are Health Technologists (88.9%), Health Diagnosing & Treating (87.7%), and Legal Services & Support (79.8%).
| Occupation | Male | Female |
| Management | 3,055 (64.6%) | 1,675 (35.4%) |
| Business & Financial | 1,888 (54.2%) | 1,595 (45.8%) |
| Computers, Engineering & Science | 2,430 (82.0%) | 535 (18.0%) |
| Computers & Mathematics | 1,226 (80.1%) | 305 (19.9%) |
| Architecture & Engineering | 1,081 (87.8%) | 150 (12.2%) |
| Life, Physical & Social Science | 123 (60.6%) | 80 (39.4%) |
| Community & Social Service | 1,237 (27.8%) | 3,206 (72.2%) |
| Education, Arts & Media | 187 (22.0%) | 665 (78.0%) |
| Legal Services & Support | 82 (20.2%) | 325 (79.8%) |
| Education Instruction & Library | 517 (23.2%) | 1,712 (76.8%) |
| Arts, Media & Entertainment | 451 (47.2%) | 504 (52.8%) |
| Health Diagnosing & Treating | 302 (12.3%) | 2,157 (87.7%) |
| Health Technologists | 196 (11.1%) | 1,563 (88.9%) |
| Total (Category) | 8,912 (49.3%) | 9,168 (50.7%) |
| Total (Overall) | 32,182 (56.2%) | 25,035 (43.8%) |
Services Occupations
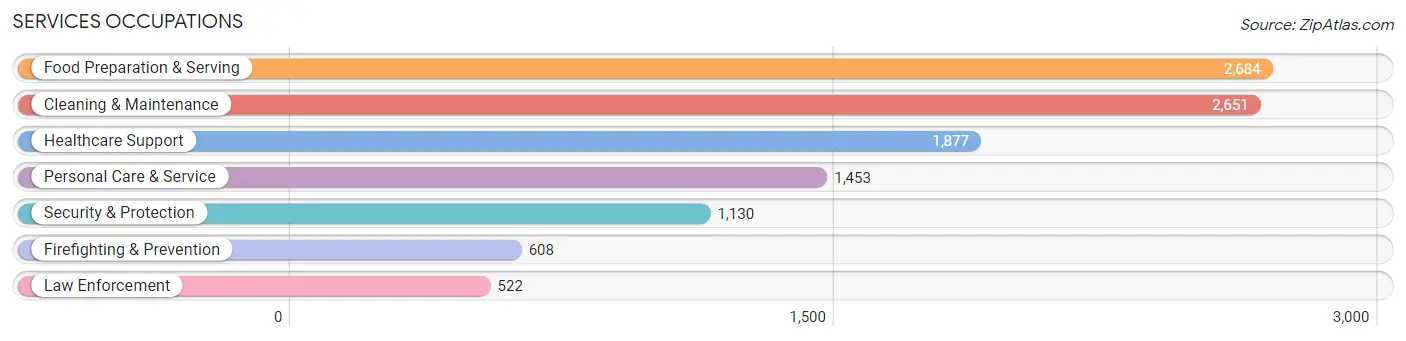
The most common Services occupations in Elgin are Food Preparation & Serving (2,684 | 4.7%), Cleaning & Maintenance (2,651 | 4.6%), Healthcare Support (1,877 | 3.3%), Personal Care & Service (1,453 | 2.5%), and Security & Protection (1,130 | 2.0%).
Services Occupations by Sex
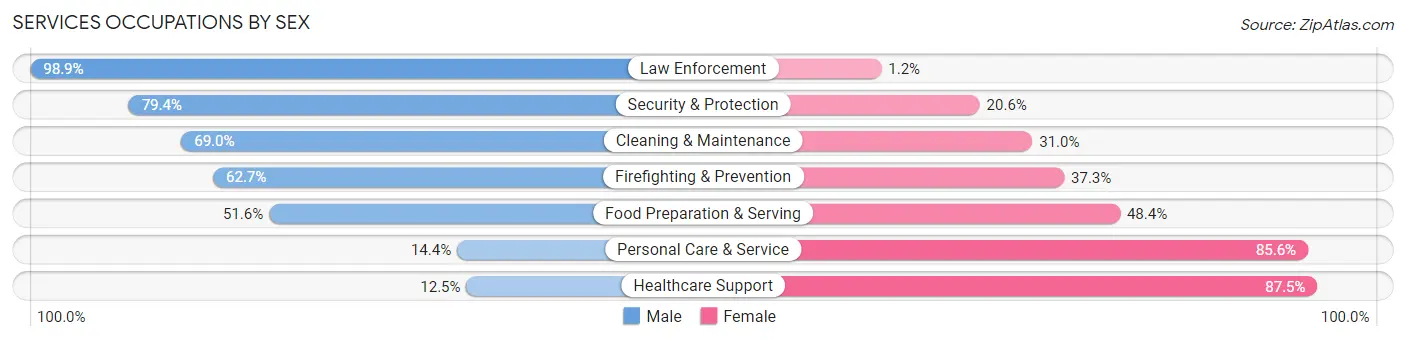
Within the Services occupations in Elgin, the most male-oriented occupations are Law Enforcement (98.9%), Security & Protection (79.4%), and Cleaning & Maintenance (69.0%), while the most female-oriented occupations are Healthcare Support (87.5%), Personal Care & Service (85.6%), and Food Preparation & Serving (48.4%).
| Occupation | Male | Female |
| Healthcare Support | 235 (12.5%) | 1,642 (87.5%) |
| Security & Protection | 897 (79.4%) | 233 (20.6%) |
| Firefighting & Prevention | 381 (62.7%) | 227 (37.3%) |
| Law Enforcement | 516 (98.9%) | 6 (1.1%) |
| Food Preparation & Serving | 1,385 (51.6%) | 1,299 (48.4%) |
| Cleaning & Maintenance | 1,828 (69.0%) | 823 (31.0%) |
| Personal Care & Service | 209 (14.4%) | 1,244 (85.6%) |
| Total (Category) | 4,554 (46.5%) | 5,241 (53.5%) |
| Total (Overall) | 32,182 (56.2%) | 25,035 (43.8%) |
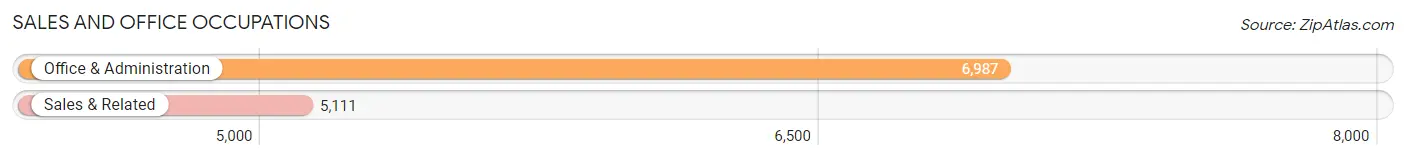
Sales and Office Occupations
The most common Sales and Office occupations in Elgin are Office & Administration (6,987 | 12.2%), and Sales & Related (5,111 | 8.9%).
Sales and Office Occupations by Sex
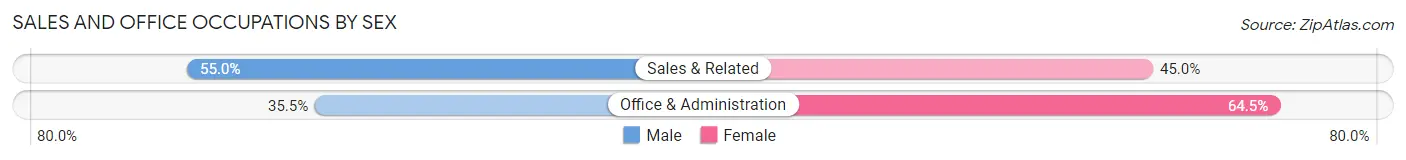
| Occupation | Male | Female |
| Sales & Related | 2,811 (55.0%) | 2,300 (45.0%) |
| Office & Administration | 2,478 (35.5%) | 4,509 (64.5%) |
| Total (Category) | 5,289 (43.7%) | 6,809 (56.3%) |
| Total (Overall) | 32,182 (56.2%) | 25,035 (43.8%) |
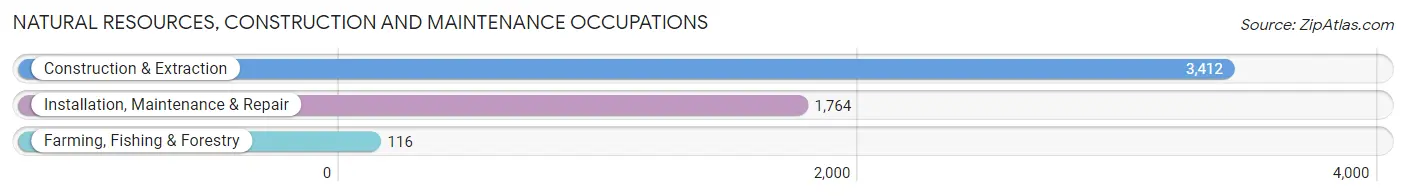
Natural Resources, Construction and Maintenance Occupations
The most common Natural Resources, Construction and Maintenance occupations in Elgin are Construction & Extraction (3,412 | 6.0%), Installation, Maintenance & Repair (1,764 | 3.1%), and Farming, Fishing & Forestry (116 | 0.2%).
Natural Resources, Construction and Maintenance Occupations by Sex
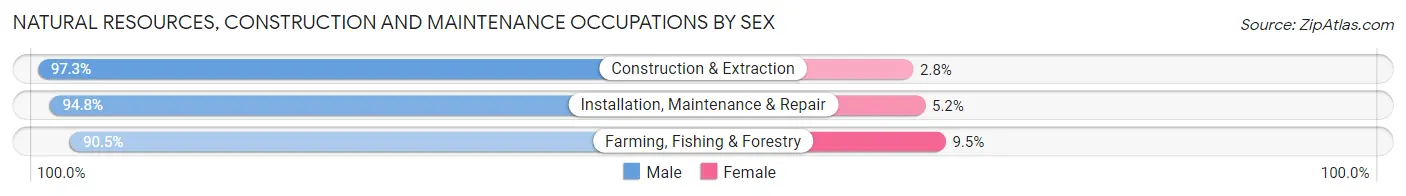
| Occupation | Male | Female |
| Farming, Fishing & Forestry | 105 (90.5%) | 11 (9.5%) |
| Construction & Extraction | 3,318 (97.3%) | 94 (2.8%) |
| Installation, Maintenance & Repair | 1,672 (94.8%) | 92 (5.2%) |
| Total (Category) | 5,095 (96.3%) | 197 (3.7%) |
| Total (Overall) | 32,182 (56.2%) | 25,035 (43.8%) |
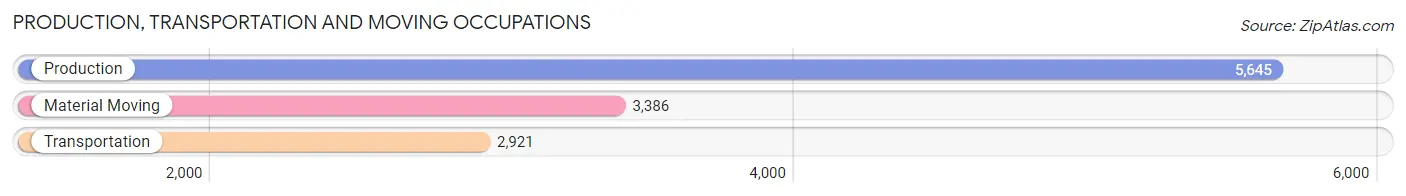
Production, Transportation and Moving Occupations
The most common Production, Transportation and Moving occupations in Elgin are Production (5,645 | 9.9%), Material Moving (3,386 | 5.9%), and Transportation (2,921 | 5.1%).
Production, Transportation and Moving Occupations by Sex
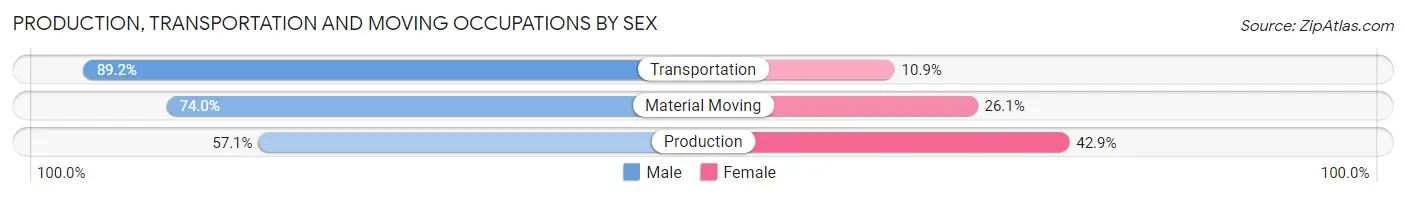
| Occupation | Male | Female |
| Production | 3,224 (57.1%) | 2,421 (42.9%) |
| Transportation | 2,604 (89.1%) | 317 (10.8%) |
| Material Moving | 2,504 (74.0%) | 882 (26.1%) |
| Total (Category) | 8,332 (69.7%) | 3,620 (30.3%) |
| Total (Overall) | 32,182 (56.2%) | 25,035 (43.8%) |
Employment Industries by Sex in Elgin
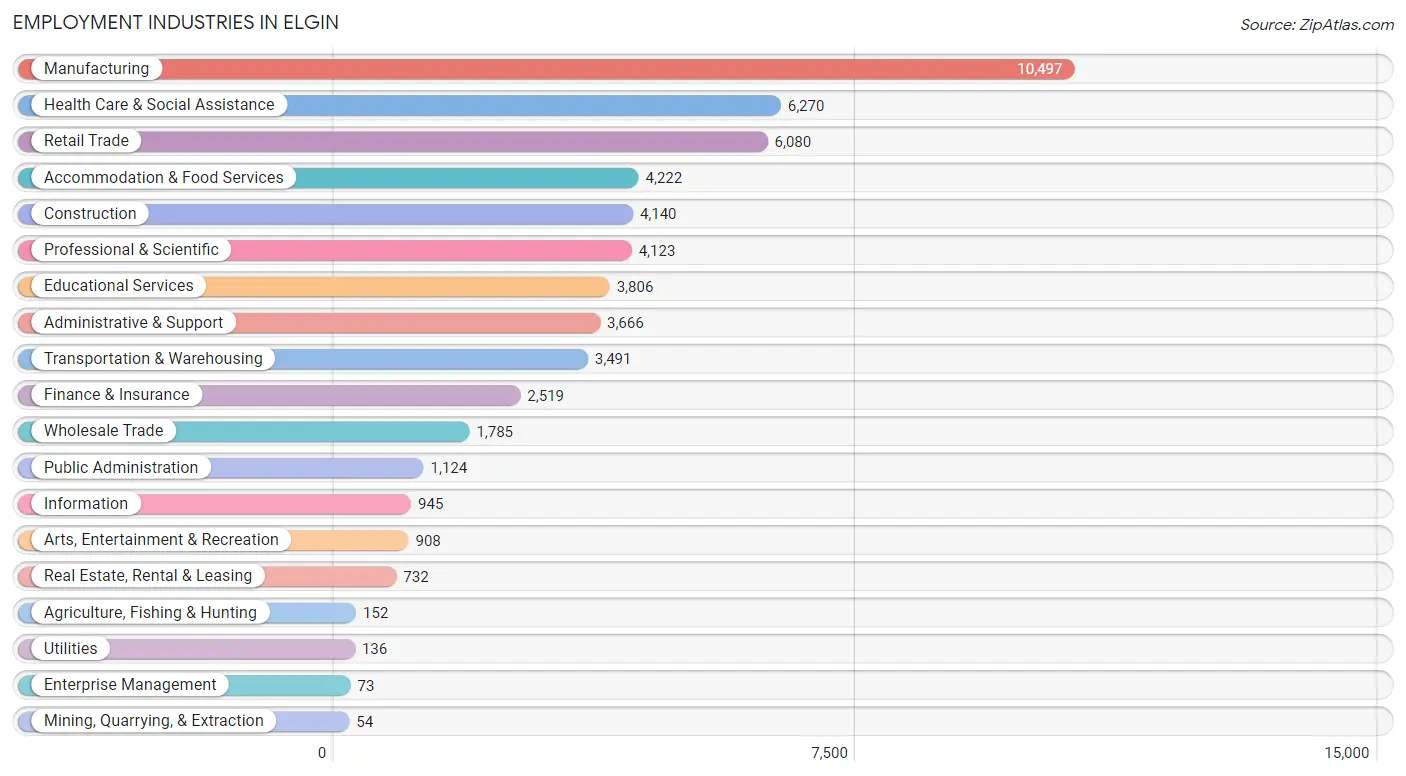
Employment Industries in Elgin
The major employment industries in Elgin include Manufacturing (10,497 | 18.3%), Health Care & Social Assistance (6,270 | 11.0%), Retail Trade (6,080 | 10.6%), Accommodation & Food Services (4,222 | 7.4%), and Construction (4,140 | 7.2%).
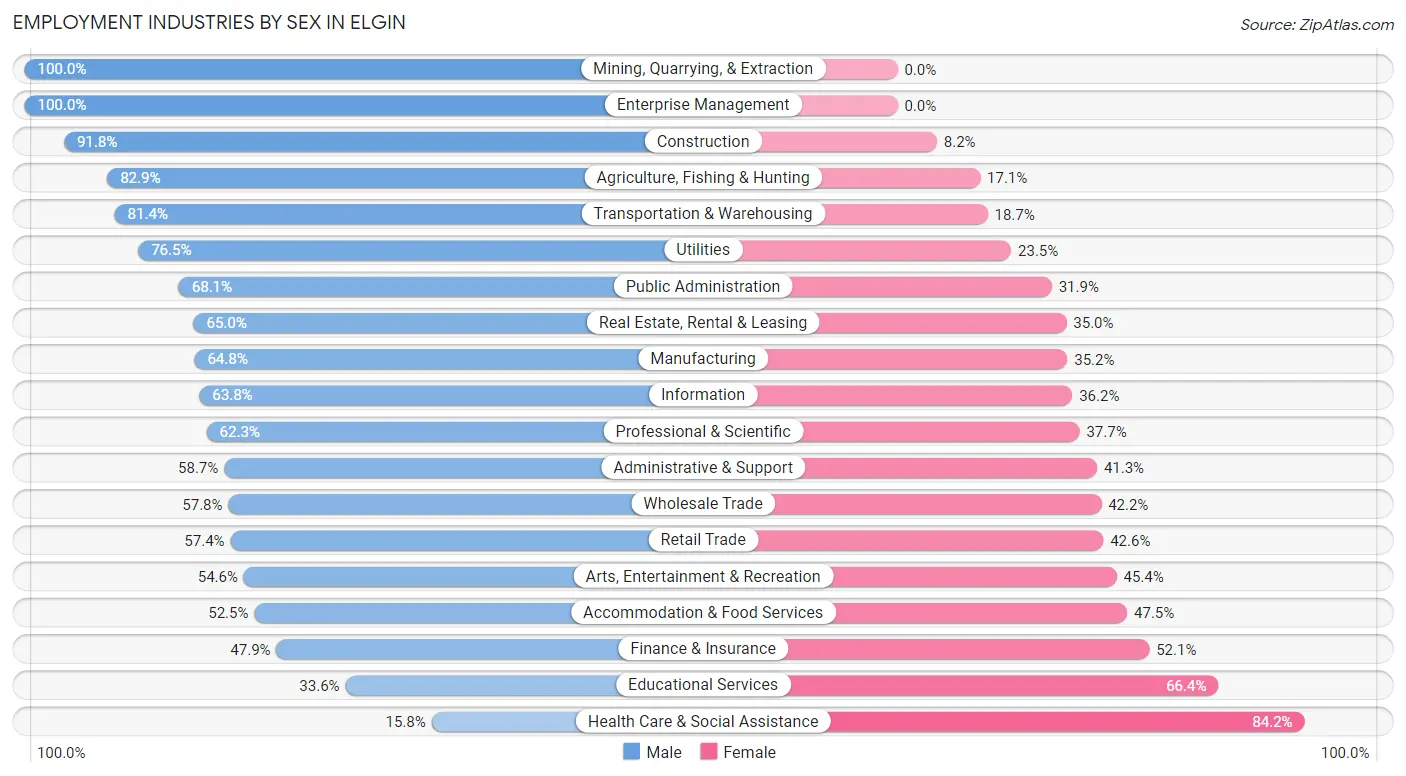
Employment Industries by Sex in Elgin
The Elgin industries that see more men than women are Mining, Quarrying, & Extraction (100.0%), Enterprise Management (100.0%), and Construction (91.8%), whereas the industries that tend to have a higher number of women are Health Care & Social Assistance (84.2%), Educational Services (66.4%), and Finance & Insurance (52.1%).
| Industry | Male | Female |
| Agriculture, Fishing & Hunting | 126 (82.9%) | 26 (17.1%) |
| Mining, Quarrying, & Extraction | 54 (100.0%) | 0 (0.0%) |
| Construction | 3,802 (91.8%) | 338 (8.2%) |
| Manufacturing | 6,805 (64.8%) | 3,692 (35.2%) |
| Wholesale Trade | 1,032 (57.8%) | 753 (42.2%) |
| Retail Trade | 3,490 (57.4%) | 2,590 (42.6%) |
| Transportation & Warehousing | 2,840 (81.4%) | 651 (18.6%) |
| Utilities | 104 (76.5%) | 32 (23.5%) |
| Information | 603 (63.8%) | 342 (36.2%) |
| Finance & Insurance | 1,206 (47.9%) | 1,313 (52.1%) |
| Real Estate, Rental & Leasing | 476 (65.0%) | 256 (35.0%) |
| Professional & Scientific | 2,569 (62.3%) | 1,554 (37.7%) |
| Enterprise Management | 73 (100.0%) | 0 (0.0%) |
| Administrative & Support | 2,152 (58.7%) | 1,514 (41.3%) |
| Educational Services | 1,279 (33.6%) | 2,527 (66.4%) |
| Health Care & Social Assistance | 988 (15.8%) | 5,282 (84.2%) |
| Arts, Entertainment & Recreation | 496 (54.6%) | 412 (45.4%) |
| Accommodation & Food Services | 2,215 (52.5%) | 2,007 (47.5%) |
| Public Administration | 765 (68.1%) | 359 (31.9%) |
| Total | 32,182 (56.2%) | 25,035 (43.8%) |
Education in Elgin
School Enrollment in Elgin
The most common levels of schooling among the 30,097 students in Elgin are high school (7,564 | 25.1%), middle school (6,826 | 22.7%), and elementary school (5,618 | 18.7%).
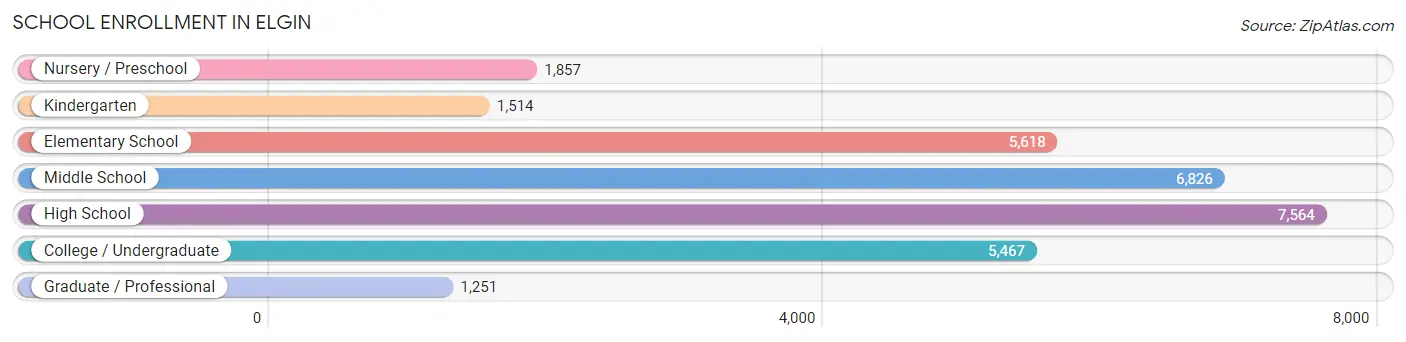
| School Level | # Students | % Students |
| Nursery / Preschool | 1,857 | 6.2% |
| Kindergarten | 1,514 | 5.0% |
| Elementary School | 5,618 | 18.7% |
| Middle School | 6,826 | 22.7% |
| High School | 7,564 | 25.1% |
| College / Undergraduate | 5,467 | 18.2% |
| Graduate / Professional | 1,251 | 4.2% |
| Total | 30,097 | 100.0% |
School Enrollment by Age by Funding Source in Elgin
Out of a total of 30,097 students who are enrolled in schools in Elgin, 3,672 (12.2%) attend a private institution, while the remaining 26,425 (87.8%) are enrolled in public schools. The age group of 35 years and over has the highest likelihood of being enrolled in private schools, with 441 (42.5% in the age bracket) enrolled. Conversely, the age group of 15 to 17 year olds has the lowest likelihood of being enrolled in a private school, with 5,242 (97.0% in the age bracket) attending a public institution.
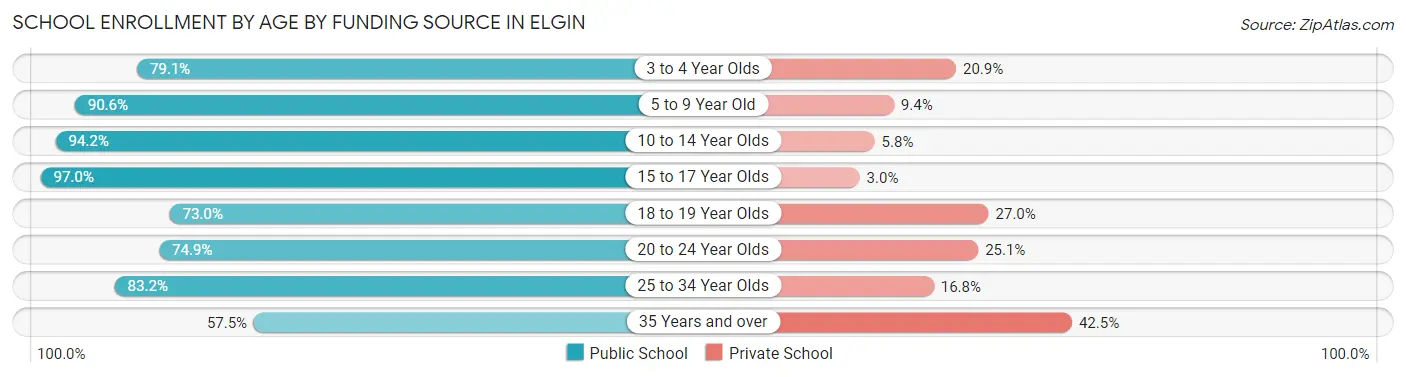
| Age Bracket | Public School | Private School |
| 3 to 4 Year Olds | 1,171 (79.1%) | 310 (20.9%) |
| 5 to 9 Year Old | 6,196 (90.6%) | 640 (9.4%) |
| 10 to 14 Year Olds | 7,877 (94.2%) | 482 (5.8%) |
| 15 to 17 Year Olds | 5,242 (97.0%) | 161 (3.0%) |
| 18 to 19 Year Olds | 1,609 (73.0%) | 595 (27.0%) |
| 20 to 24 Year Olds | 2,294 (74.9%) | 767 (25.1%) |
| 25 to 34 Year Olds | 1,428 (83.2%) | 288 (16.8%) |
| 35 Years and over | 596 (57.5%) | 441 (42.5%) |
| Total | 26,425 (87.8%) | 3,672 (12.2%) |
Educational Attainment by Field of Study in Elgin
Business (4,126 | 19.9%), education (2,634 | 12.7%), science & technology (1,956 | 9.5%), engineering (1,679 | 8.1%), and liberal arts & history (1,350 | 6.5%) are the most common fields of study among 20,708 individuals in Elgin who have obtained a bachelor's degree or higher.
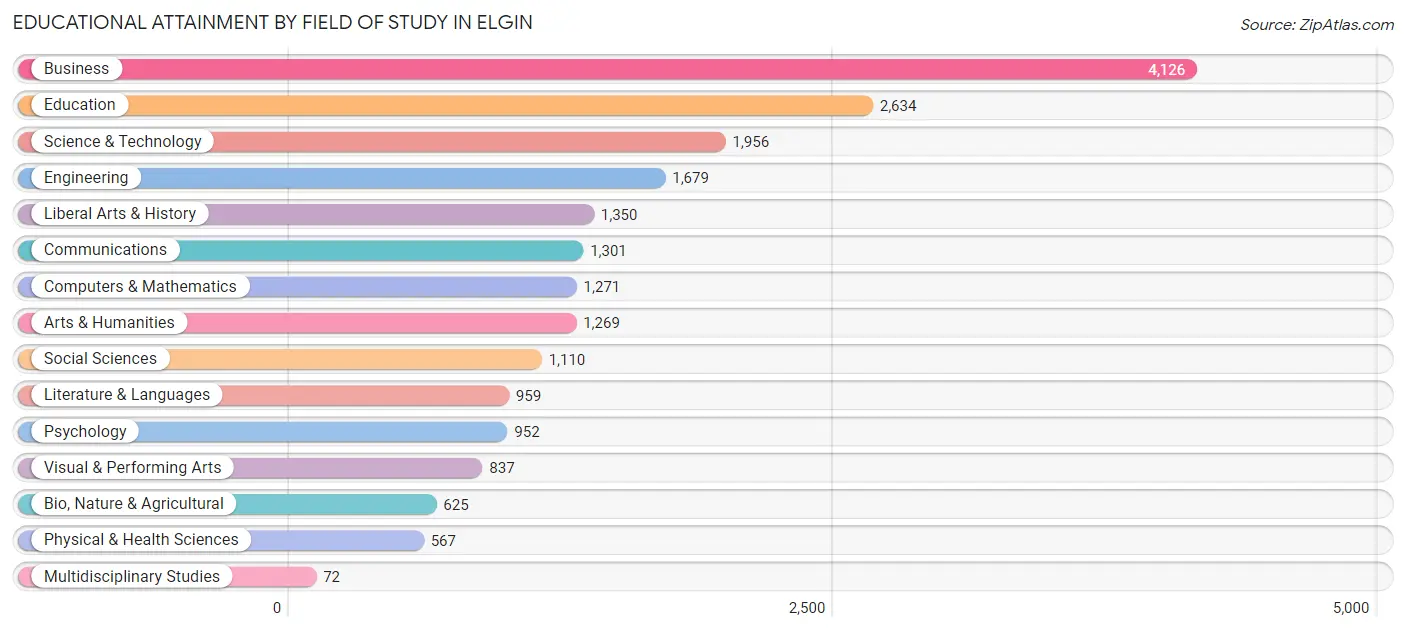
| Field of Study | # Graduates | % Graduates |
| Computers & Mathematics | 1,271 | 6.1% |
| Bio, Nature & Agricultural | 625 | 3.0% |
| Physical & Health Sciences | 567 | 2.7% |
| Psychology | 952 | 4.6% |
| Social Sciences | 1,110 | 5.4% |
| Engineering | 1,679 | 8.1% |
| Multidisciplinary Studies | 72 | 0.4% |
| Science & Technology | 1,956 | 9.5% |
| Business | 4,126 | 19.9% |
| Education | 2,634 | 12.7% |
| Literature & Languages | 959 | 4.6% |
| Liberal Arts & History | 1,350 | 6.5% |
| Visual & Performing Arts | 837 | 4.0% |
| Communications | 1,301 | 6.3% |
| Arts & Humanities | 1,269 | 6.1% |
| Total | 20,708 | 100.0% |
Transportation & Commute in Elgin
Vehicle Availability by Sex in Elgin
The most prevalent vehicle ownership categories in Elgin are males with 2 vehicles (12,236, accounting for 39.0%) and females with 2 vehicles (9,386, making up 50.1%).
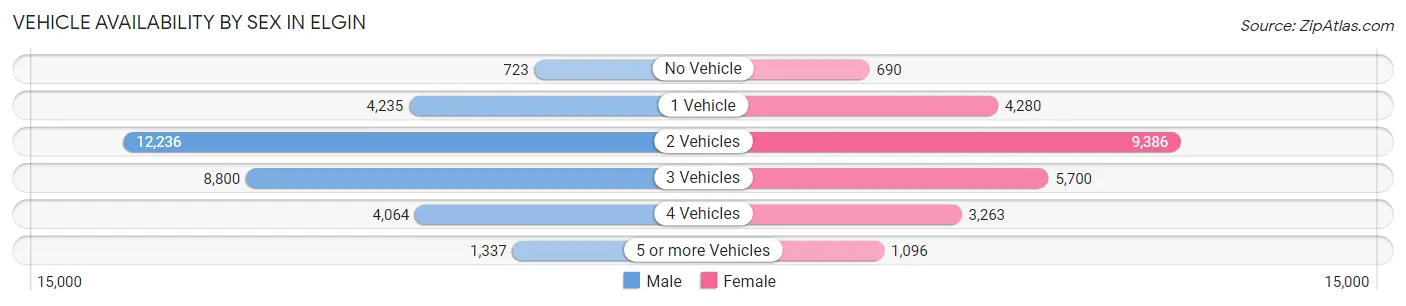
| Vehicles Available | Male | Female |
| No Vehicle | 723 (2.3%) | 690 (2.8%) |
| 1 Vehicle | 4,235 (13.5%) | 4,280 (17.5%) |
| 2 Vehicles | 12,236 (39.0%) | 9,386 (38.4%) |
| 3 Vehicles | 8,800 (28.0%) | 5,700 (23.4%) |
| 4 Vehicles | 4,064 (12.9%) | 3,263 (13.4%) |
| 5 or more Vehicles | 1,337 (4.3%) | 1,096 (4.5%) |
| Total | 31,395 (100.0%) | 24,415 (100.0%) |
Commute Time in Elgin
The most frequently occuring commute durations in Elgin are 30 to 34 minutes (7,831 commuters, 15.6%), 10 to 14 minutes (6,930 commuters, 13.8%), and 15 to 19 minutes (6,870 commuters, 13.7%).
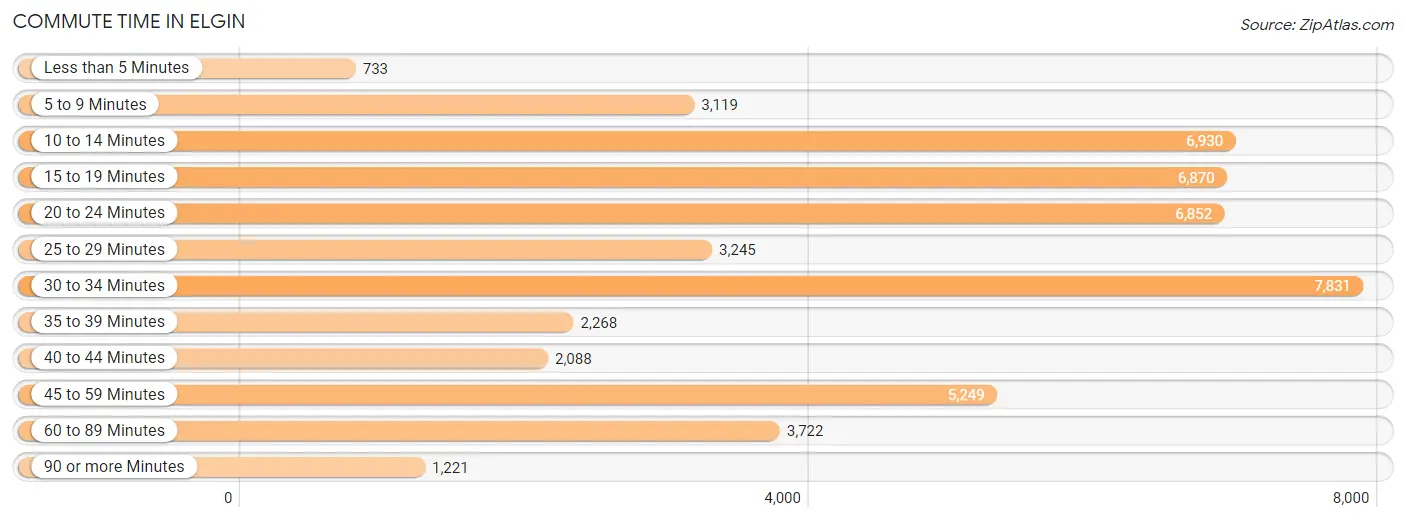
| Commute Time | # Commuters | % Commuters |
| Less than 5 Minutes | 733 | 1.5% |
| 5 to 9 Minutes | 3,119 | 6.2% |
| 10 to 14 Minutes | 6,930 | 13.8% |
| 15 to 19 Minutes | 6,870 | 13.7% |
| 20 to 24 Minutes | 6,852 | 13.7% |
| 25 to 29 Minutes | 3,245 | 6.5% |
| 30 to 34 Minutes | 7,831 | 15.6% |
| 35 to 39 Minutes | 2,268 | 4.5% |
| 40 to 44 Minutes | 2,088 | 4.2% |
| 45 to 59 Minutes | 5,249 | 10.5% |
| 60 to 89 Minutes | 3,722 | 7.4% |
| 90 or more Minutes | 1,221 | 2.4% |
Commute Time by Sex in Elgin
The most common commute times in Elgin are 30 to 34 minutes (4,796 commuters, 17.0%) for males and 10 to 14 minutes (3,688 commuters, 16.9%) for females.
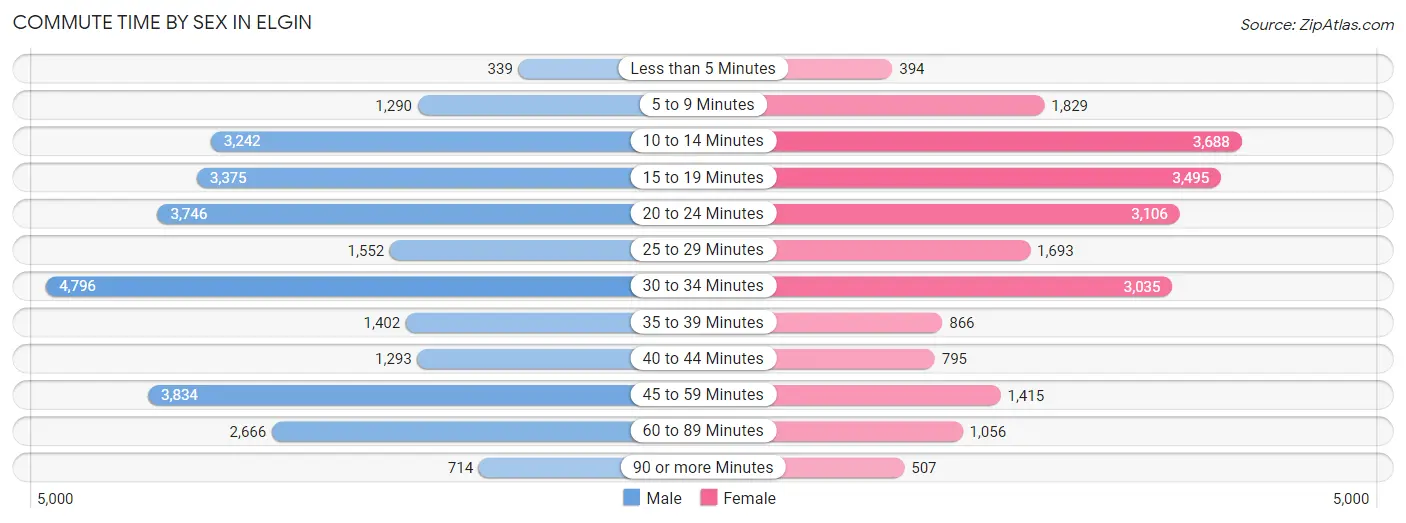
| Commute Time | Male | Female |
| Less than 5 Minutes | 339 (1.2%) | 394 (1.8%) |
| 5 to 9 Minutes | 1,290 (4.6%) | 1,829 (8.4%) |
| 10 to 14 Minutes | 3,242 (11.5%) | 3,688 (16.9%) |
| 15 to 19 Minutes | 3,375 (11.9%) | 3,495 (16.0%) |
| 20 to 24 Minutes | 3,746 (13.3%) | 3,106 (14.2%) |
| 25 to 29 Minutes | 1,552 (5.5%) | 1,693 (7.7%) |
| 30 to 34 Minutes | 4,796 (17.0%) | 3,035 (13.9%) |
| 35 to 39 Minutes | 1,402 (5.0%) | 866 (4.0%) |
| 40 to 44 Minutes | 1,293 (4.6%) | 795 (3.6%) |
| 45 to 59 Minutes | 3,834 (13.6%) | 1,415 (6.5%) |
| 60 to 89 Minutes | 2,666 (9.4%) | 1,056 (4.8%) |
| 90 or more Minutes | 714 (2.5%) | 507 (2.3%) |
Time of Departure to Work by Sex in Elgin
The most frequent times of departure to work in Elgin are 7:00 AM to 7:29 AM (4,874, 17.2%) for males and 7:00 AM to 7:29 AM (3,594, 16.4%) for females.
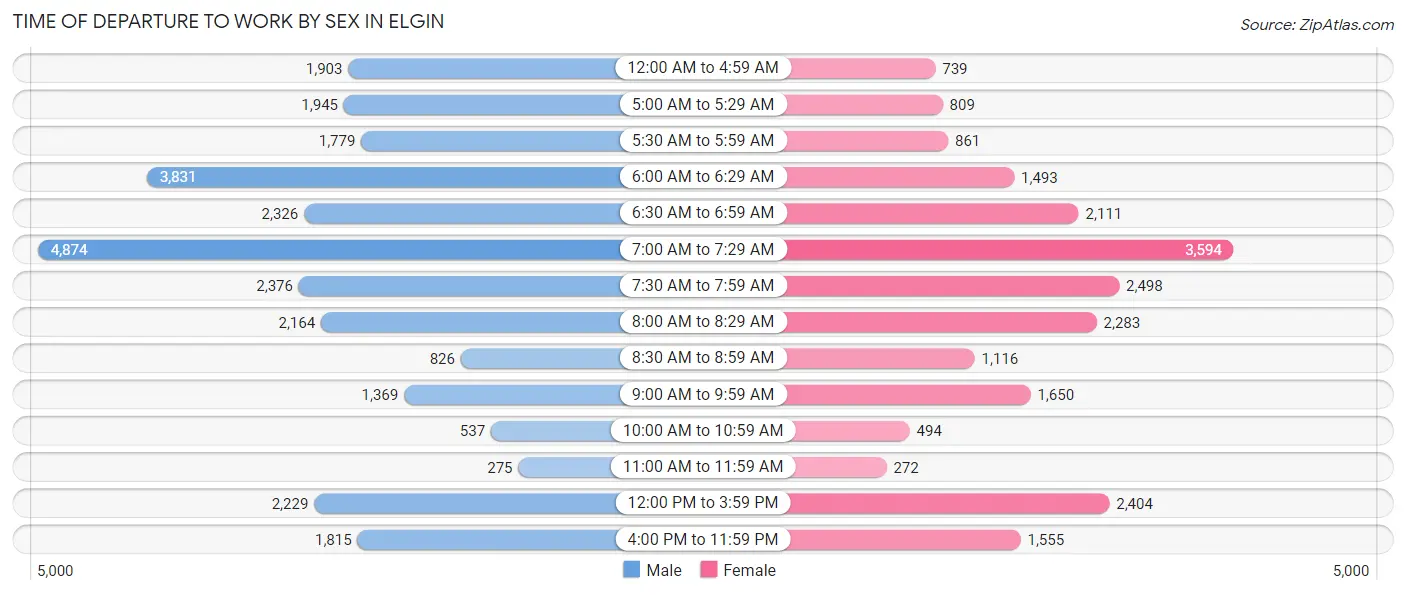
| Time of Departure | Male | Female |
| 12:00 AM to 4:59 AM | 1,903 (6.7%) | 739 (3.4%) |
| 5:00 AM to 5:29 AM | 1,945 (6.9%) | 809 (3.7%) |
| 5:30 AM to 5:59 AM | 1,779 (6.3%) | 861 (3.9%) |
| 6:00 AM to 6:29 AM | 3,831 (13.6%) | 1,493 (6.8%) |
| 6:30 AM to 6:59 AM | 2,326 (8.2%) | 2,111 (9.7%) |
| 7:00 AM to 7:29 AM | 4,874 (17.2%) | 3,594 (16.4%) |
| 7:30 AM to 7:59 AM | 2,376 (8.4%) | 2,498 (11.4%) |
| 8:00 AM to 8:29 AM | 2,164 (7.7%) | 2,283 (10.4%) |
| 8:30 AM to 8:59 AM | 826 (2.9%) | 1,116 (5.1%) |
| 9:00 AM to 9:59 AM | 1,369 (4.9%) | 1,650 (7.5%) |
| 10:00 AM to 10:59 AM | 537 (1.9%) | 494 (2.3%) |
| 11:00 AM to 11:59 AM | 275 (1.0%) | 272 (1.2%) |
| 12:00 PM to 3:59 PM | 2,229 (7.9%) | 2,404 (11.0%) |
| 4:00 PM to 11:59 PM | 1,815 (6.4%) | 1,555 (7.1%) |
| Total | 28,249 (100.0%) | 21,879 (100.0%) |
Housing Occupancy in Elgin
Occupancy by Ownership in Elgin
Of the total 38,530 dwellings in Elgin, owner-occupied units account for 27,425 (71.2%), while renter-occupied units make up 11,105 (28.8%).
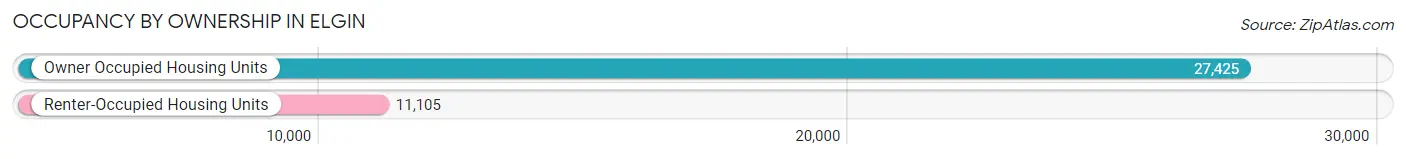
| Occupancy | # Housing Units | % Housing Units |
| Owner Occupied Housing Units | 27,425 | 71.2% |
| Renter-Occupied Housing Units | 11,105 | 28.8% |
| Total Occupied Housing Units | 38,530 | 100.0% |
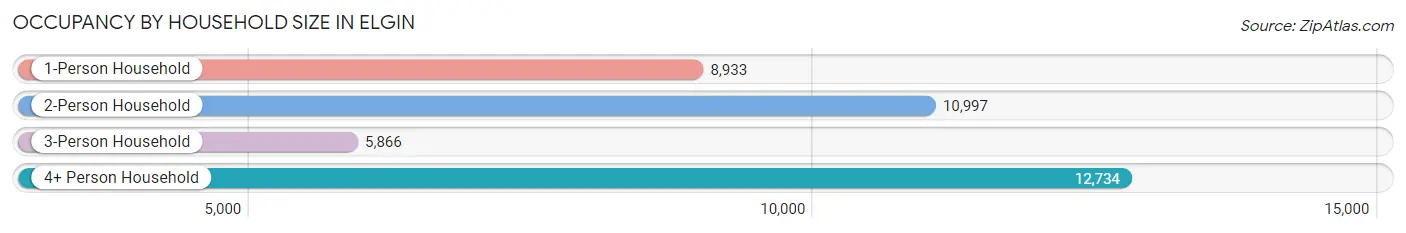
Occupancy by Household Size in Elgin
| Household Size | # Housing Units | % Housing Units |
| 1-Person Household | 8,933 | 23.2% |
| 2-Person Household | 10,997 | 28.5% |
| 3-Person Household | 5,866 | 15.2% |
| 4+ Person Household | 12,734 | 33.1% |
| Total Housing Units | 38,530 | 100.0% |
Occupancy by Ownership by Household Size in Elgin
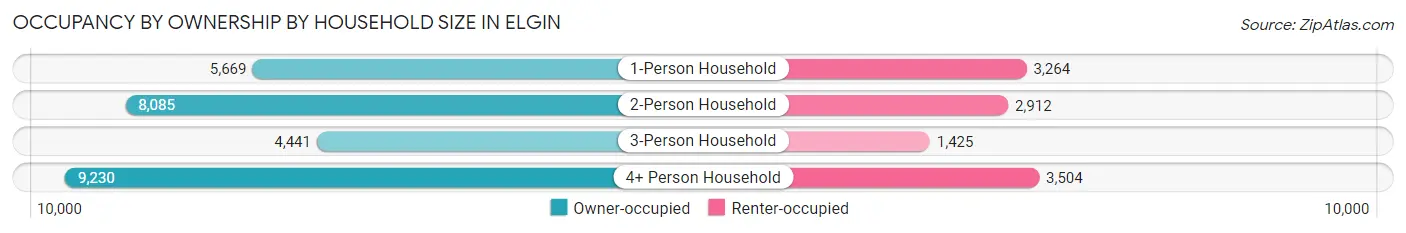
| Household Size | Owner-occupied | Renter-occupied |
| 1-Person Household | 5,669 (63.5%) | 3,264 (36.5%) |
| 2-Person Household | 8,085 (73.5%) | 2,912 (26.5%) |
| 3-Person Household | 4,441 (75.7%) | 1,425 (24.3%) |
| 4+ Person Household | 9,230 (72.5%) | 3,504 (27.5%) |
| Total Housing Units | 27,425 (71.2%) | 11,105 (28.8%) |
Occupancy by Educational Attainment in Elgin
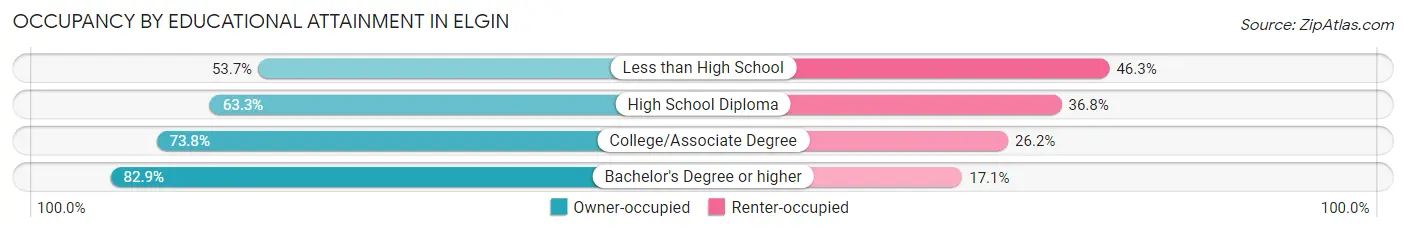
| Household Size | Owner-occupied | Renter-occupied |
| Less than High School | 3,101 (53.7%) | 2,669 (46.3%) |
| High School Diploma | 5,283 (63.2%) | 3,070 (36.7%) |
| College/Associate Degree | 9,735 (73.8%) | 3,451 (26.2%) |
| Bachelor's Degree or higher | 9,306 (82.9%) | 1,915 (17.1%) |
Occupancy by Age of Householder in Elgin
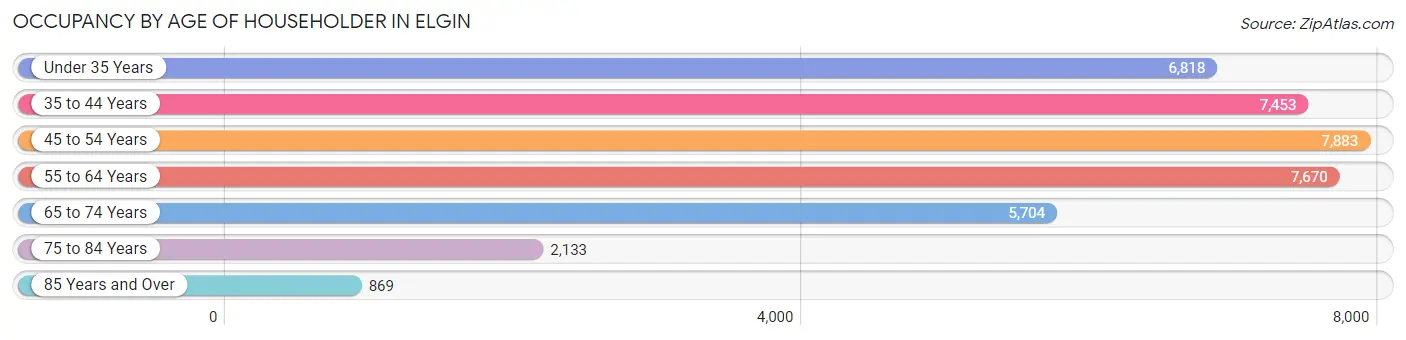
| Age Bracket | # Households | % Households |
| Under 35 Years | 6,818 | 17.7% |
| 35 to 44 Years | 7,453 | 19.3% |
| 45 to 54 Years | 7,883 | 20.5% |
| 55 to 64 Years | 7,670 | 19.9% |
| 65 to 74 Years | 5,704 | 14.8% |
| 75 to 84 Years | 2,133 | 5.5% |
| 85 Years and Over | 869 | 2.3% |
| Total | 38,530 | 100.0% |
Housing Finances in Elgin
Median Income by Occupancy in Elgin
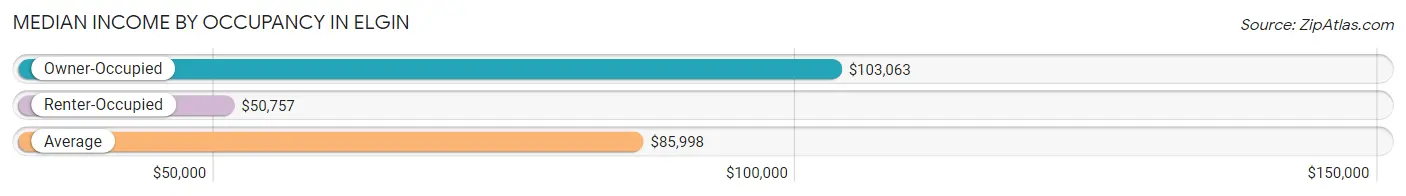
| Occupancy Type | # Households | Median Income |
| Owner-Occupied | 27,425 (71.2%) | $103,063 |
| Renter-Occupied | 11,105 (28.8%) | $50,757 |
| Average | 38,530 (100.0%) | $85,998 |
Occupancy by Householder Income Bracket in Elgin
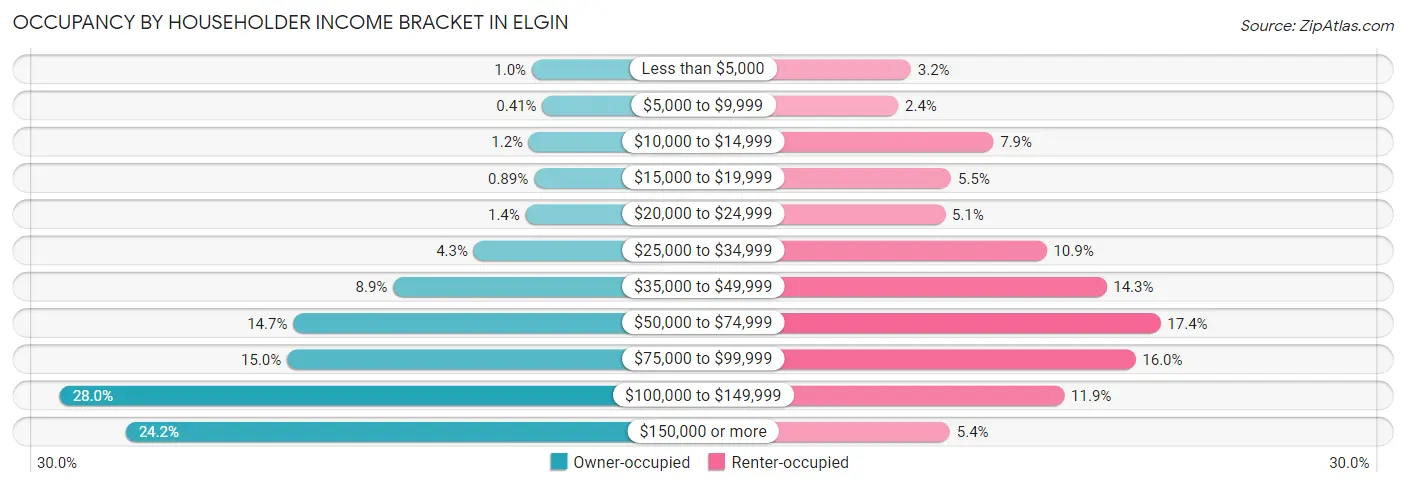
| Income Bracket | Owner-occupied | Renter-occupied |
| Less than $5,000 | 276 (1.0%) | 351 (3.2%) |
| $5,000 to $9,999 | 112 (0.4%) | 270 (2.4%) |
| $10,000 to $14,999 | 324 (1.2%) | 874 (7.9%) |
| $15,000 to $19,999 | 245 (0.9%) | 606 (5.5%) |
| $20,000 to $24,999 | 375 (1.4%) | 567 (5.1%) |
| $25,000 to $34,999 | 1,188 (4.3%) | 1,212 (10.9%) |
| $35,000 to $49,999 | 2,453 (8.9%) | 1,591 (14.3%) |
| $50,000 to $74,999 | 4,018 (14.6%) | 1,935 (17.4%) |
| $75,000 to $99,999 | 4,115 (15.0%) | 1,776 (16.0%) |
| $100,000 to $149,999 | 7,677 (28.0%) | 1,324 (11.9%) |
| $150,000 or more | 6,642 (24.2%) | 599 (5.4%) |
| Total | 27,425 (100.0%) | 11,105 (100.0%) |
Monthly Housing Cost Tiers in Elgin
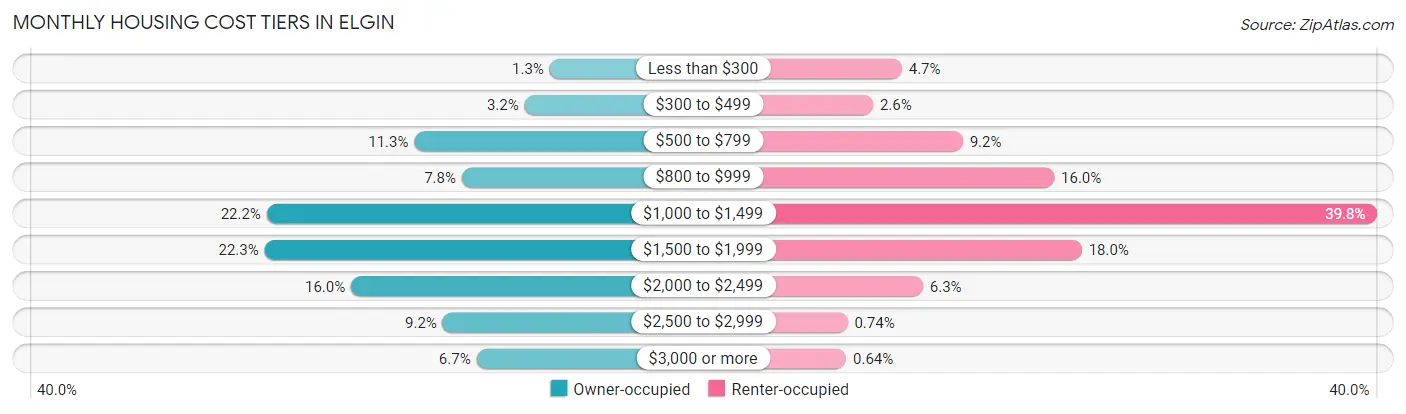
| Monthly Cost | Owner-occupied | Renter-occupied |
| Less than $300 | 364 (1.3%) | 526 (4.7%) |
| $300 to $499 | 871 (3.2%) | 291 (2.6%) |
| $500 to $799 | 3,100 (11.3%) | 1,025 (9.2%) |
| $800 to $999 | 2,140 (7.8%) | 1,772 (16.0%) |
| $1,000 to $1,499 | 6,079 (22.2%) | 4,415 (39.8%) |
| $1,500 to $1,999 | 6,124 (22.3%) | 1,998 (18.0%) |
| $2,000 to $2,499 | 4,378 (16.0%) | 698 (6.3%) |
| $2,500 to $2,999 | 2,527 (9.2%) | 82 (0.7%) |
| $3,000 or more | 1,842 (6.7%) | 71 (0.6%) |
| Total | 27,425 (100.0%) | 11,105 (100.0%) |
Physical Housing Characteristics in Elgin
Housing Structures in Elgin
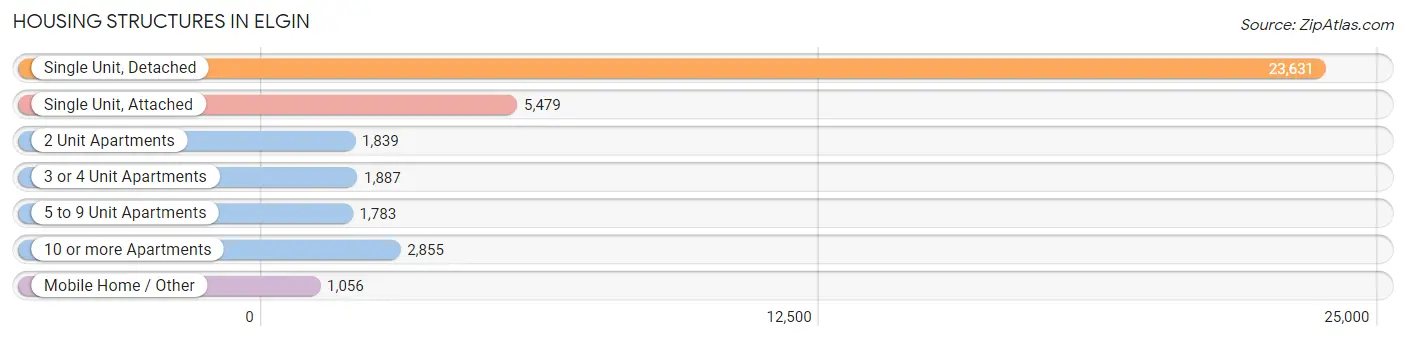
| Structure Type | # Housing Units | % Housing Units |
| Single Unit, Detached | 23,631 | 61.3% |
| Single Unit, Attached | 5,479 | 14.2% |
| 2 Unit Apartments | 1,839 | 4.8% |
| 3 or 4 Unit Apartments | 1,887 | 4.9% |
| 5 to 9 Unit Apartments | 1,783 | 4.6% |
| 10 or more Apartments | 2,855 | 7.4% |
| Mobile Home / Other | 1,056 | 2.7% |
| Total | 38,530 | 100.0% |
Housing Structures by Occupancy in Elgin
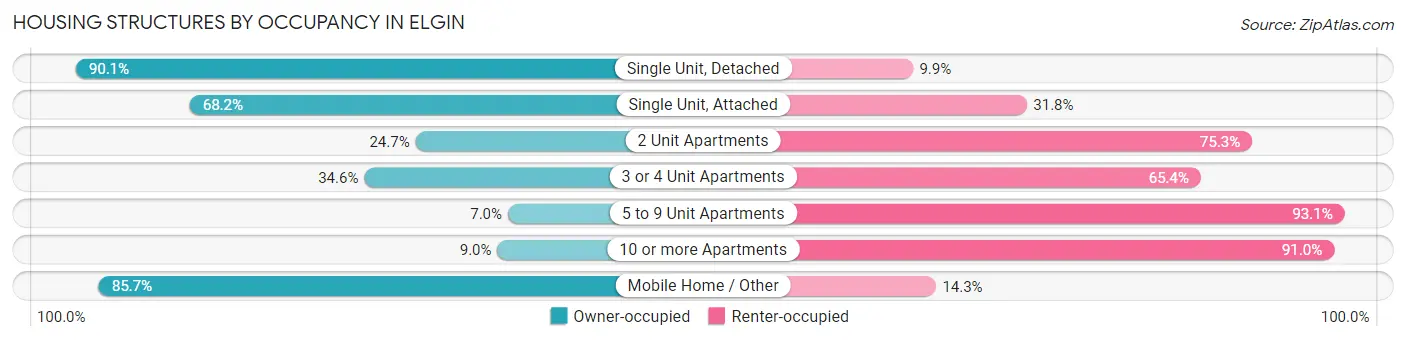
| Structure Type | Owner-occupied | Renter-occupied |
| Single Unit, Detached | 21,296 (90.1%) | 2,335 (9.9%) |
| Single Unit, Attached | 3,736 (68.2%) | 1,743 (31.8%) |
| 2 Unit Apartments | 455 (24.7%) | 1,384 (75.3%) |
| 3 or 4 Unit Apartments | 653 (34.6%) | 1,234 (65.4%) |
| 5 to 9 Unit Apartments | 124 (7.0%) | 1,659 (93.0%) |
| 10 or more Apartments | 256 (9.0%) | 2,599 (91.0%) |
| Mobile Home / Other | 905 (85.7%) | 151 (14.3%) |
| Total | 27,425 (71.2%) | 11,105 (28.8%) |
Housing Structures by Number of Rooms in Elgin
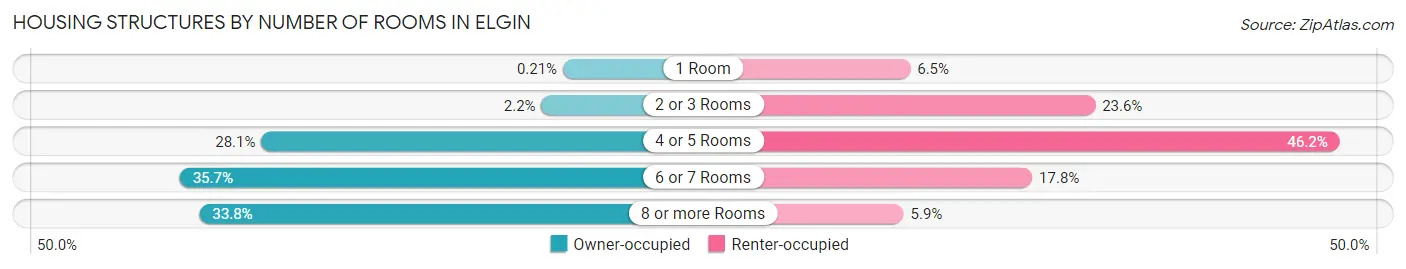
| Number of Rooms | Owner-occupied | Renter-occupied |
| 1 Room | 57 (0.2%) | 723 (6.5%) |
| 2 or 3 Rooms | 604 (2.2%) | 2,622 (23.6%) |
| 4 or 5 Rooms | 7,708 (28.1%) | 5,132 (46.2%) |
| 6 or 7 Rooms | 9,778 (35.6%) | 1,974 (17.8%) |
| 8 or more Rooms | 9,278 (33.8%) | 654 (5.9%) |
| Total | 27,425 (100.0%) | 11,105 (100.0%) |
Housing Structure by Heating Type in Elgin
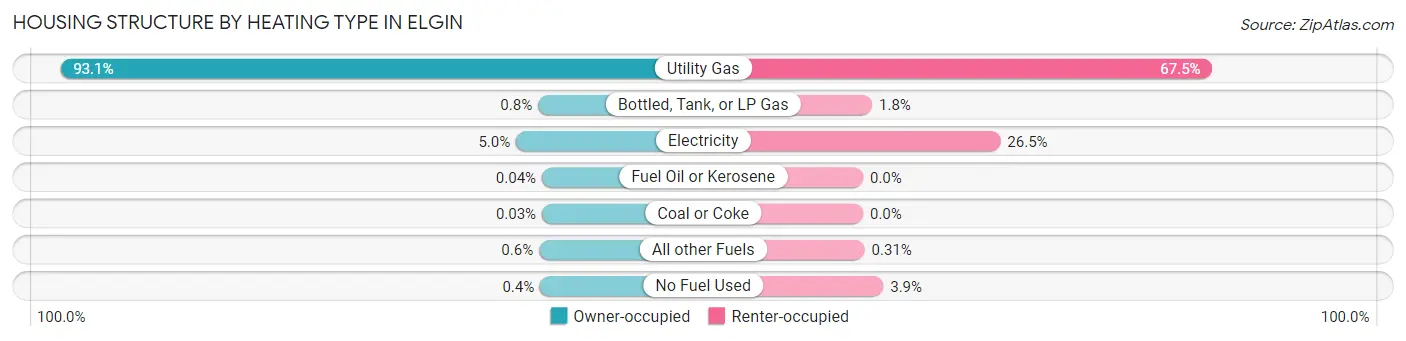
| Heating Type | Owner-occupied | Renter-occupied |
| Utility Gas | 25,536 (93.1%) | 7,496 (67.5%) |
| Bottled, Tank, or LP Gas | 219 (0.8%) | 194 (1.8%) |
| Electricity | 1,379 (5.0%) | 2,947 (26.5%) |
| Fuel Oil or Kerosene | 10 (0.0%) | 0 (0.0%) |
| Coal or Coke | 7 (0.0%) | 0 (0.0%) |
| All other Fuels | 165 (0.6%) | 34 (0.3%) |
| No Fuel Used | 109 (0.4%) | 434 (3.9%) |
| Total | 27,425 (100.0%) | 11,105 (100.0%) |
Household Vehicle Usage in Elgin
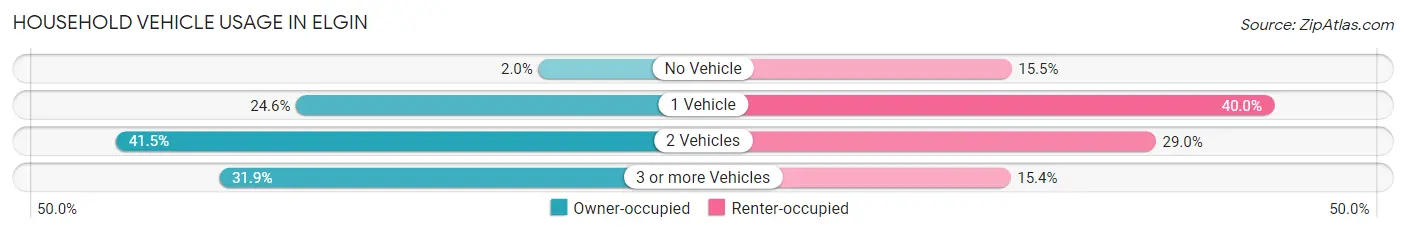
| Vehicles per Household | Owner-occupied | Renter-occupied |
| No Vehicle | 554 (2.0%) | 1,725 (15.5%) |
| 1 Vehicle | 6,757 (24.6%) | 4,445 (40.0%) |
| 2 Vehicles | 11,380 (41.5%) | 3,220 (29.0%) |
| 3 or more Vehicles | 8,734 (31.9%) | 1,715 (15.4%) |
| Total | 27,425 (100.0%) | 11,105 (100.0%) |
Real Estate & Mortgages in Elgin
Real Estate and Mortgage Overview in Elgin
| Characteristic | Without Mortgage | With Mortgage |
| Housing Units | 8,388 | 19,037 |
| Median Property Value | $222,800 | $248,400 |
| Median Household Income | $79,919 | $5,072 |
| Monthly Housing Costs | $809 | $1,807 |
| Real Estate Taxes | $5,253 | $225 |
Property Value by Mortgage Status in Elgin
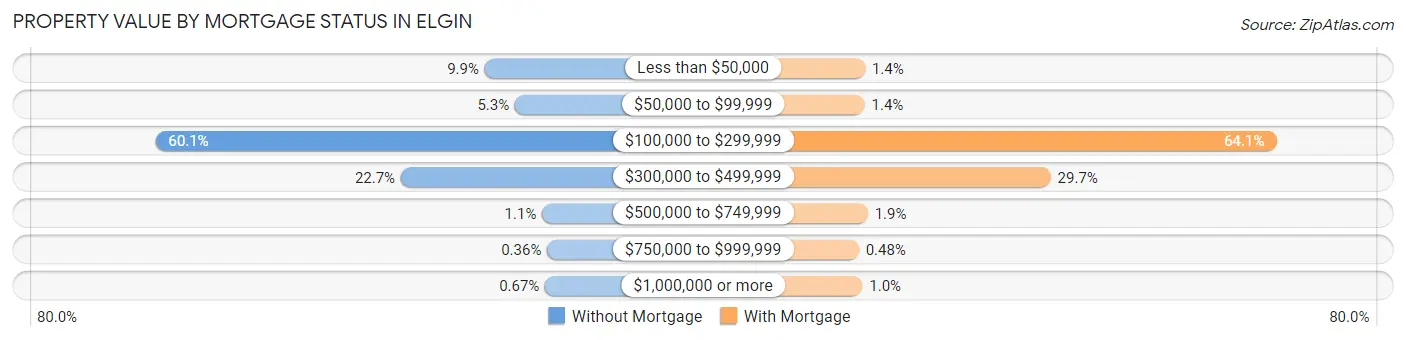
| Property Value | Without Mortgage | With Mortgage |
| Less than $50,000 | 828 (9.9%) | 272 (1.4%) |
| $50,000 to $99,999 | 442 (5.3%) | 262 (1.4%) |
| $100,000 to $299,999 | 5,038 (60.1%) | 12,202 (64.1%) |
| $300,000 to $499,999 | 1,900 (22.7%) | 5,659 (29.7%) |
| $500,000 to $749,999 | 94 (1.1%) | 352 (1.8%) |
| $750,000 to $999,999 | 30 (0.4%) | 92 (0.5%) |
| $1,000,000 or more | 56 (0.7%) | 198 (1.0%) |
| Total | 8,388 (100.0%) | 19,037 (100.0%) |
Household Income by Mortgage Status in Elgin
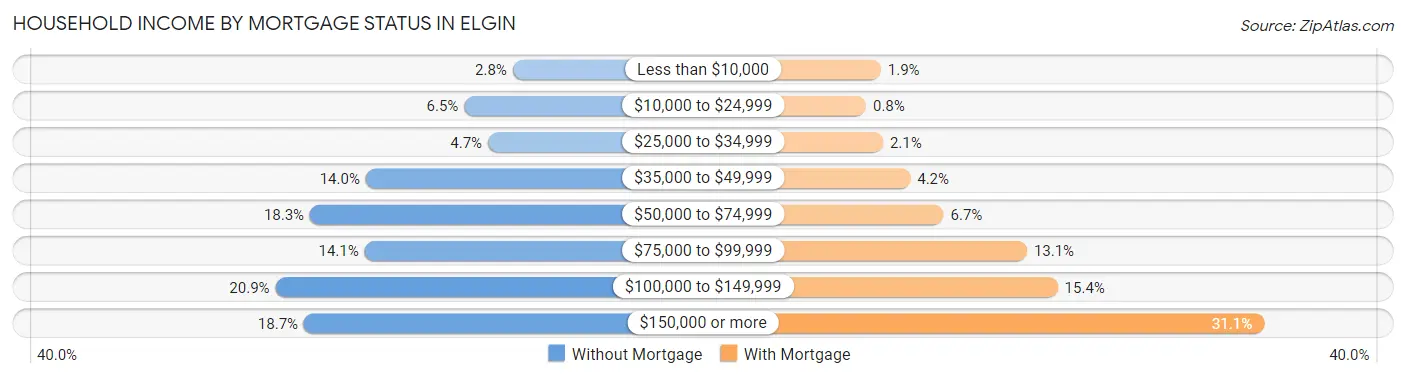
| Household Income | Without Mortgage | With Mortgage |
| Less than $10,000 | 236 (2.8%) | 367 (1.9%) |
| $10,000 to $24,999 | 546 (6.5%) | 152 (0.8%) |
| $25,000 to $34,999 | 394 (4.7%) | 398 (2.1%) |
| $35,000 to $49,999 | 1,175 (14.0%) | 794 (4.2%) |
| $50,000 to $74,999 | 1,532 (18.3%) | 1,278 (6.7%) |
| $75,000 to $99,999 | 1,183 (14.1%) | 2,486 (13.1%) |
| $100,000 to $149,999 | 1,752 (20.9%) | 2,932 (15.4%) |
| $150,000 or more | 1,570 (18.7%) | 5,925 (31.1%) |
| Total | 8,388 (100.0%) | 19,037 (100.0%) |
Property Value to Household Income Ratio in Elgin
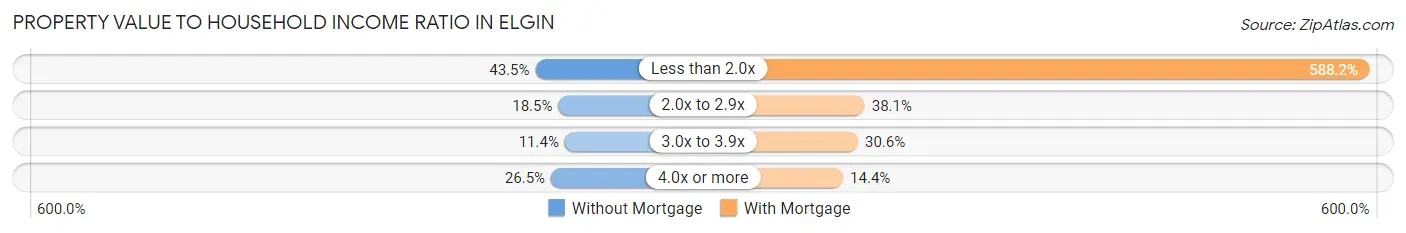
| Value-to-Income Ratio | Without Mortgage | With Mortgage |
| Less than 2.0x | 3,651 (43.5%) | 111,983 (588.2%) |
| 2.0x to 2.9x | 1,551 (18.5%) | 7,244 (38.1%) |
| 3.0x to 3.9x | 957 (11.4%) | 5,831 (30.6%) |
| 4.0x or more | 2,223 (26.5%) | 2,744 (14.4%) |
| Total | 8,388 (100.0%) | 19,037 (100.0%) |
Real Estate Taxes by Mortgage Status in Elgin
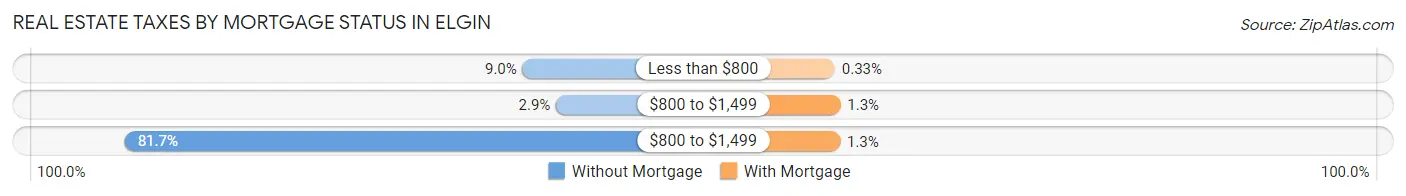
| Property Taxes | Without Mortgage | With Mortgage |
| Less than $800 | 758 (9.0%) | 62 (0.3%) |
| $800 to $1,499 | 244 (2.9%) | 253 (1.3%) |
| $800 to $1,499 | 6,854 (81.7%) | 244 (1.3%) |
| Total | 8,388 (100.0%) | 19,037 (100.0%) |
Health & Disability in Elgin
Health Insurance Coverage by Age in Elgin
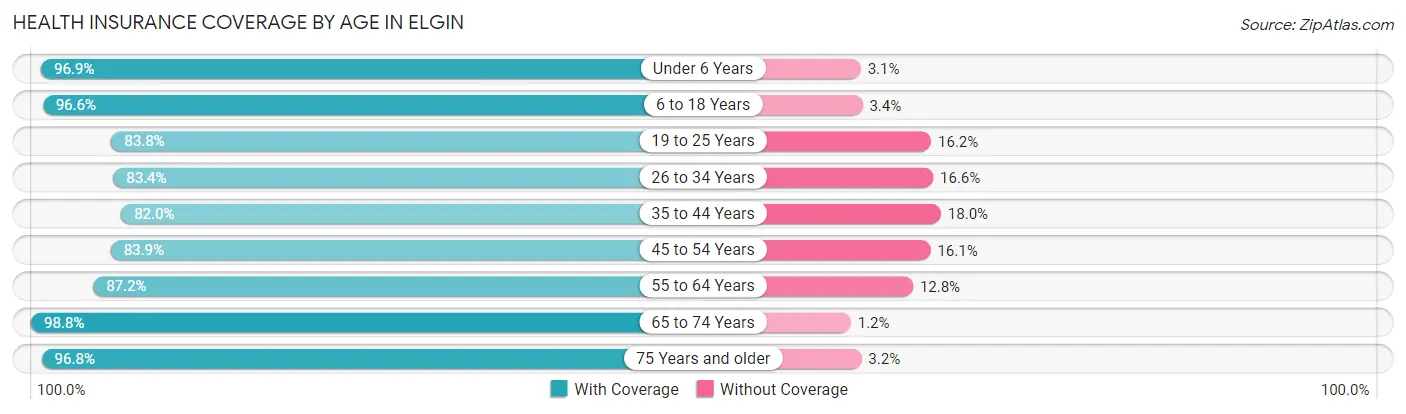
| Age Bracket | With Coverage | Without Coverage |
| Under 6 Years | 9,501 (96.9%) | 301 (3.1%) |
| 6 to 18 Years | 21,073 (96.6%) | 737 (3.4%) |
| 19 to 25 Years | 9,050 (83.8%) | 1,748 (16.2%) |
| 26 to 34 Years | 11,680 (83.4%) | 2,318 (16.6%) |
| 35 to 44 Years | 11,800 (82.0%) | 2,593 (18.0%) |
| 45 to 54 Years | 12,241 (83.9%) | 2,343 (16.1%) |
| 55 to 64 Years | 12,143 (87.2%) | 1,783 (12.8%) |
| 65 to 74 Years | 8,627 (98.8%) | 106 (1.2%) |
| 75 Years and older | 4,761 (96.8%) | 157 (3.2%) |
| Total | 100,876 (89.3%) | 12,086 (10.7%) |
Health Insurance Coverage by Citizenship Status in Elgin
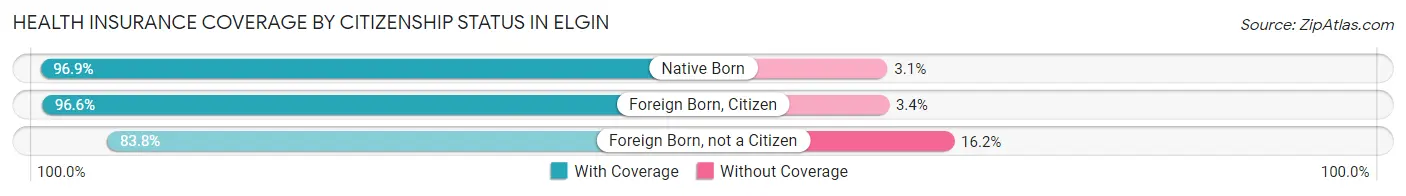
| Citizenship Status | With Coverage | Without Coverage |
| Native Born | 9,501 (96.9%) | 301 (3.1%) |
| Foreign Born, Citizen | 21,073 (96.6%) | 737 (3.4%) |
| Foreign Born, not a Citizen | 9,050 (83.8%) | 1,748 (16.2%) |
Health Insurance Coverage by Household Income in Elgin
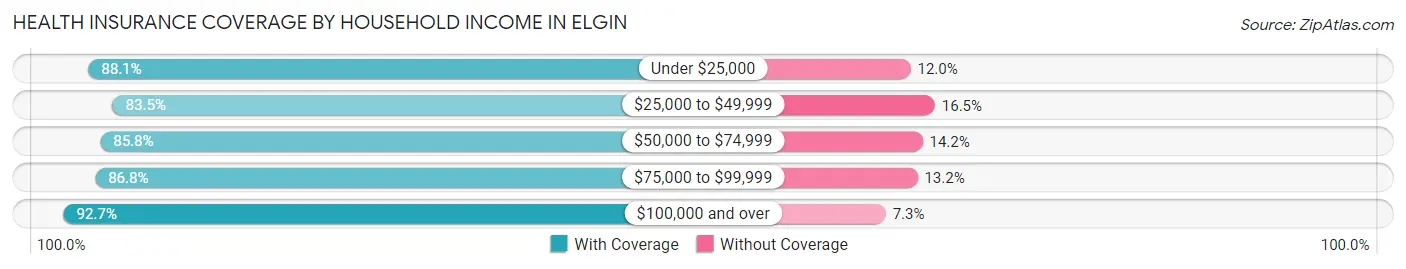
| Household Income | With Coverage | Without Coverage |
| Under $25,000 | 7,028 (88.0%) | 954 (11.9%) |
| $25,000 to $49,999 | 12,395 (83.5%) | 2,450 (16.5%) |
| $50,000 to $74,999 | 14,177 (85.8%) | 2,345 (14.2%) |
| $75,000 to $99,999 | 14,300 (86.8%) | 2,182 (13.2%) |
| $100,000 and over | 52,420 (92.7%) | 4,121 (7.3%) |
Public vs Private Health Insurance Coverage by Age in Elgin
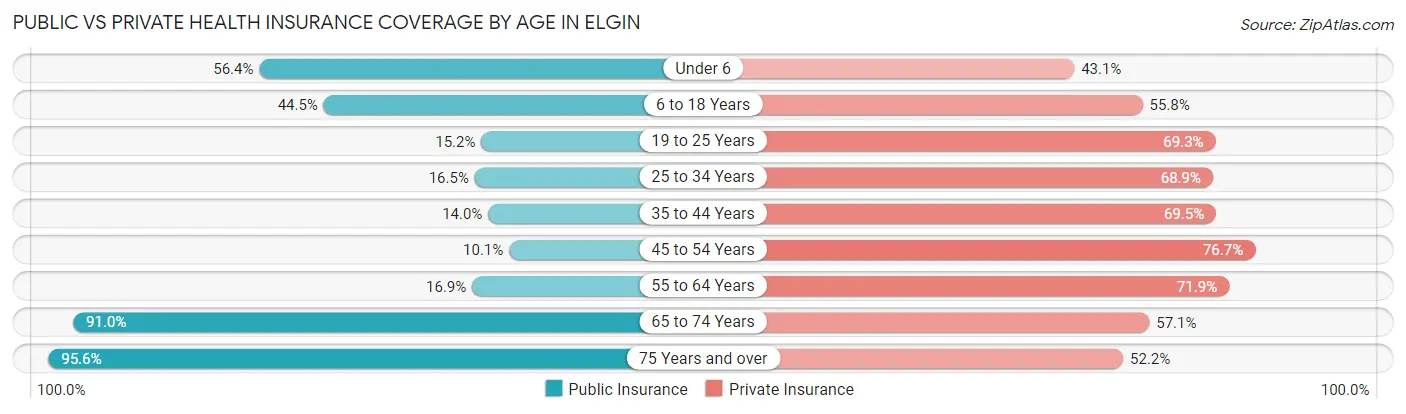
| Age Bracket | Public Insurance | Private Insurance |
| Under 6 | 5,532 (56.4%) | 4,229 (43.1%) |
| 6 to 18 Years | 9,700 (44.5%) | 12,179 (55.8%) |
| 19 to 25 Years | 1,644 (15.2%) | 7,487 (69.3%) |
| 25 to 34 Years | 2,303 (16.5%) | 9,639 (68.9%) |
| 35 to 44 Years | 2,008 (14.0%) | 9,997 (69.5%) |
| 45 to 54 Years | 1,468 (10.1%) | 11,185 (76.7%) |
| 55 to 64 Years | 2,359 (16.9%) | 10,007 (71.9%) |
| 65 to 74 Years | 7,946 (91.0%) | 4,984 (57.1%) |
| 75 Years and over | 4,701 (95.6%) | 2,568 (52.2%) |
| Total | 37,661 (33.3%) | 72,275 (64.0%) |
Disability Status by Sex by Age in Elgin
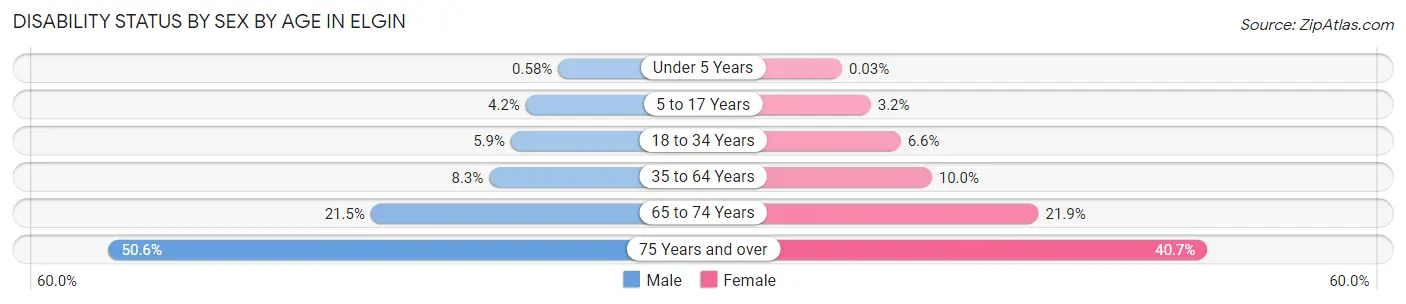
| Age Bracket | Male | Female |
| Under 5 Years | 25 (0.6%) | 1 (0.0%) |
| 5 to 17 Years | 461 (4.2%) | 346 (3.2%) |
| 18 to 34 Years | 817 (5.9%) | 821 (6.6%) |
| 35 to 64 Years | 1,811 (8.3%) | 2,105 (10.0%) |
| 65 to 74 Years | 915 (21.4%) | 979 (21.9%) |
| 75 Years and over | 1,035 (50.6%) | 1,170 (40.7%) |
Disability Class by Sex by Age in Elgin
Disability Class: Hearing Difficulty
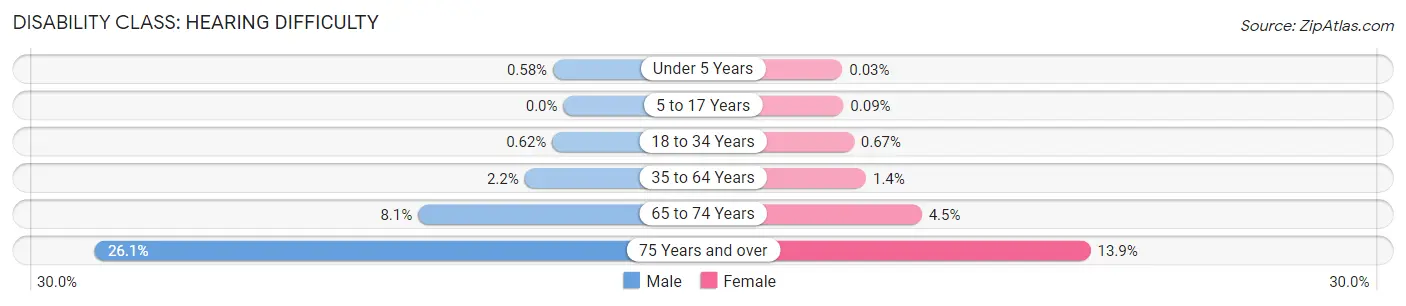
| Age Bracket | Male | Female |
| Under 5 Years | 25 (0.6%) | 1 (0.0%) |
| 5 to 17 Years | 0 (0.0%) | 10 (0.1%) |
| 18 to 34 Years | 87 (0.6%) | 84 (0.7%) |
| 35 to 64 Years | 473 (2.2%) | 283 (1.3%) |
| 65 to 74 Years | 345 (8.1%) | 199 (4.4%) |
| 75 Years and over | 533 (26.1%) | 398 (13.9%) |
Disability Class: Vision Difficulty
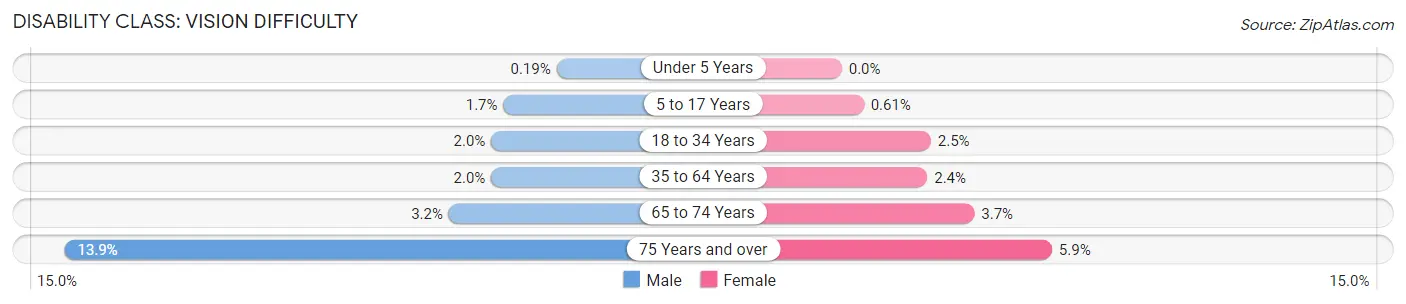
| Age Bracket | Male | Female |
| Under 5 Years | 8 (0.2%) | 0 (0.0%) |
| 5 to 17 Years | 183 (1.7%) | 65 (0.6%) |
| 18 to 34 Years | 280 (2.0%) | 310 (2.5%) |
| 35 to 64 Years | 440 (2.0%) | 500 (2.4%) |
| 65 to 74 Years | 136 (3.2%) | 165 (3.7%) |
| 75 Years and over | 284 (13.9%) | 168 (5.9%) |
Disability Class: Cognitive Difficulty
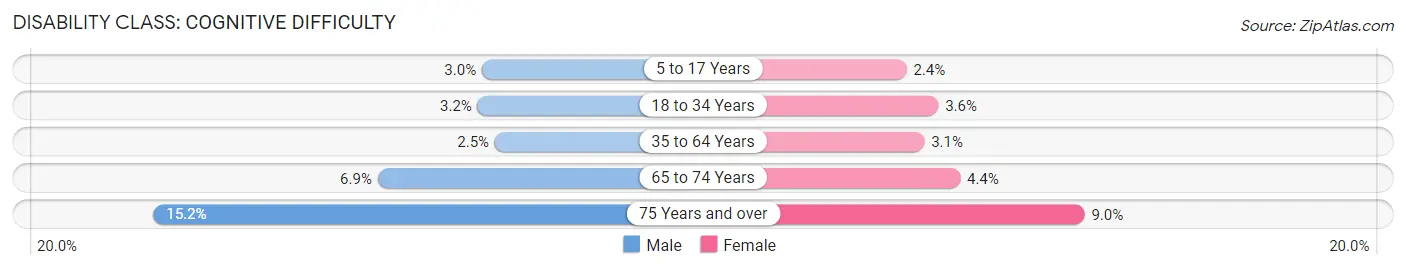
| Age Bracket | Male | Female |
| 5 to 17 Years | 332 (3.0%) | 257 (2.4%) |
| 18 to 34 Years | 444 (3.2%) | 448 (3.6%) |
| 35 to 64 Years | 555 (2.5%) | 644 (3.1%) |
| 65 to 74 Years | 294 (6.9%) | 196 (4.4%) |
| 75 Years and over | 311 (15.2%) | 259 (9.0%) |
Disability Class: Ambulatory Difficulty
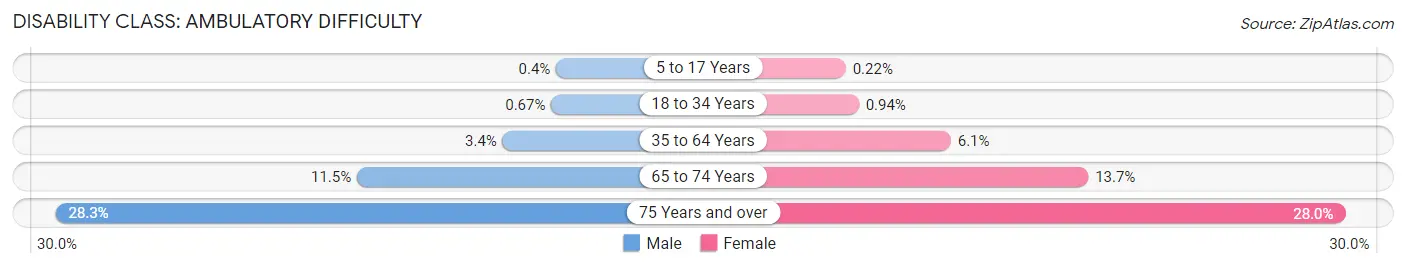
| Age Bracket | Male | Female |
| 5 to 17 Years | 44 (0.4%) | 24 (0.2%) |
| 18 to 34 Years | 93 (0.7%) | 118 (0.9%) |
| 35 to 64 Years | 739 (3.4%) | 1,276 (6.1%) |
| 65 to 74 Years | 490 (11.5%) | 613 (13.7%) |
| 75 Years and over | 578 (28.3%) | 806 (28.0%) |
Disability Class: Self-Care Difficulty
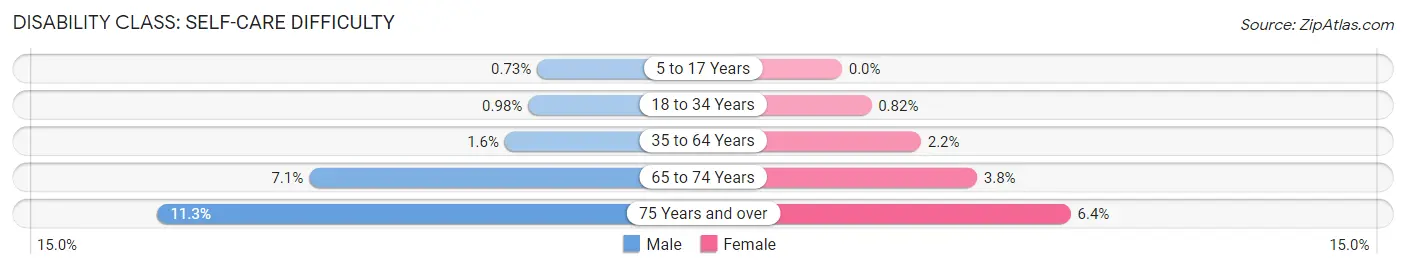
| Age Bracket | Male | Female |
| 5 to 17 Years | 80 (0.7%) | 0 (0.0%) |
| 18 to 34 Years | 137 (1.0%) | 102 (0.8%) |
| 35 to 64 Years | 356 (1.6%) | 462 (2.2%) |
| 65 to 74 Years | 302 (7.1%) | 168 (3.8%) |
| 75 Years and over | 231 (11.3%) | 183 (6.4%) |
Technology Access in Elgin
Computing Device Access in Elgin
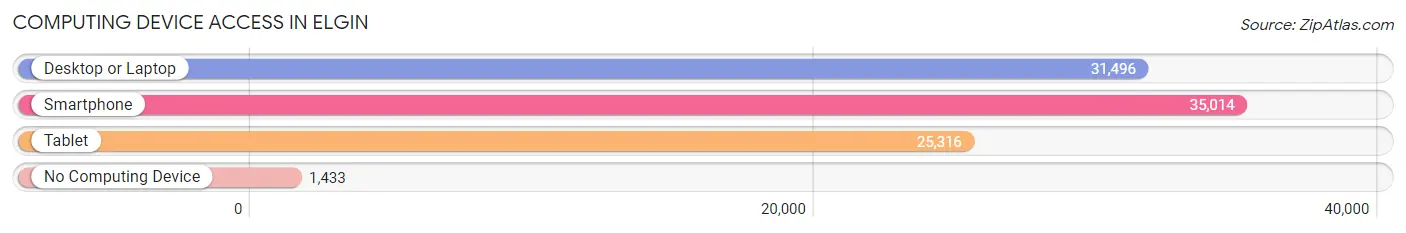
| Device Type | # Households | % Households |
| Desktop or Laptop | 31,496 | 81.7% |
| Smartphone | 35,014 | 90.9% |
| Tablet | 25,316 | 65.7% |
| No Computing Device | 1,433 | 3.7% |
| Total | 38,530 | 100.0% |
Internet Access in Elgin
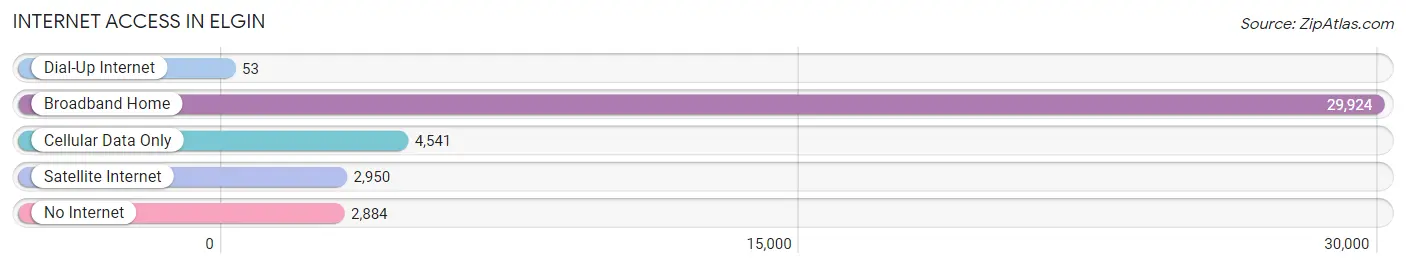
| Internet Type | # Households | % Households |
| Dial-Up Internet | 53 | 0.1% |
| Broadband Home | 29,924 | 77.7% |
| Cellular Data Only | 4,541 | 11.8% |
| Satellite Internet | 2,950 | 7.7% |
| No Internet | 2,884 | 7.5% |
| Total | 38,530 | 100.0% |
Elgin Summary
Elgin, Illinois is a city located in the northern part of the state, about 40 miles northwest of Chicago. It is the county seat of Kane County and is part of the Chicago metropolitan area. The city has a population of over 110,000 people and is the eighth-largest city in Illinois.
History
Elgin was first settled in 1835 by James T. Gifford, who named the city after his Scottish hometown. The city was officially incorporated in 1854 and was an important stop on the Underground Railroad. During the Civil War, Elgin was a major center for the production of watches and clocks, and the city was home to the National Watch Company, which was the largest watch manufacturer in the world at the time.
In the late 19th century, Elgin became a major center for the production of bicycles, and the city was home to the Elgin National Watch Company, which was the largest watch manufacturer in the world at the time. The city also became a major center for the production of dairy products, and the Elgin Dairy Company was established in 1885.
Geography
Elgin is located in northern Illinois, about 40 miles northwest of Chicago. The city is situated on the Fox River and is surrounded by several small towns and villages. The city covers an area of about 24 square miles and has a population density of about 4,500 people per square mile.
The city is located in a humid continental climate zone, with hot, humid summers and cold, snowy winters. The average annual temperature is about 48 degrees Fahrenheit, and the average annual precipitation is about 36 inches.
Economy
Elgin has a diverse economy, with a mix of manufacturing, retail, and service industries. The city is home to several large employers, including the Elgin National Watch Company, the Elgin Dairy Company, and the Elgin Community College.
The city is also home to several major retail centers, including the Elgin Mall, the Elgin Town Center, and the Elgin Outlet Mall. The city is also home to several major medical centers, including the Presence Saint Joseph Hospital and the Sherman Hospital.
Demographics
As of the 2010 census, Elgin had a population of over 110,000 people. The racial makeup of the city was 73.3% White, 11.3% African American, 0.5% Native American, 5.2% Asian, 0.1% Pacific Islander, and 8.6% from other races. Hispanic or Latino of any race were 20.2% of the population.
The median household income in Elgin was $54,845, and the median family income was $63,945. The per capita income was $25,845. About 11.3% of the population was below the poverty line.
Elgin is a diverse city, with a mix of cultures and backgrounds. The city is home to a large Hispanic population, as well as a large Asian population. The city is also home to a large number of immigrants from all over the world.
Common Questions
What is Per Capita Income in Elgin?
Per Capita income in Elgin is $35,037.
What is the Median Family Income in Elgin?
Median Family Income in Elgin is $95,415.
What is the Median Household income in Elgin?
Median Household Income in Elgin is $85,998.
What is Income or Wage Gap in Elgin?
Income or Wage Gap in Elgin is 28.7%.
Women in Elgin earn 71.3 cents for every dollar earned by a man.
What is Family Income Deficit in Elgin?
Family Income Deficit in Elgin is $9,471.
Families that are below poverty line in Elgin earn $9,471 less on average than the poverty threshold level.
What is Inequality or Gini Index in Elgin?
Inequality or Gini Index in Elgin is 0.39.
What is the Total Population of Elgin?
Total Population of Elgin is 114,190.
What is the Total Male Population of Elgin?
Total Male Population of Elgin is 58,181.
What is the Total Female Population of Elgin?
Total Female Population of Elgin is 56,009.
What is the Ratio of Males per 100 Females in Elgin?
There are 103.88 Males per 100 Females in Elgin.
What is the Ratio of Females per 100 Males in Elgin?
There are 96.27 Females per 100 Males in Elgin.
What is the Median Population Age in Elgin?
Median Population Age in Elgin is 35.5 Years.
What is the Average Family Size in Elgin
Average Family Size in Elgin is 3.5 People.
What is the Average Household Size in Elgin
Average Household Size in Elgin is 2.9 People.
How Large is the Labor Force in Elgin?
There are 60,861 People in the Labor Forcein in Elgin.
What is the Percentage of People in the Labor Force in Elgin?
69.1% of People are in the Labor Force in Elgin.
What is the Unemployment Rate in Elgin?
Unemployment Rate in Elgin is 6.0%.