Boulder Hill, IL Map & Demographics
Boulder Hill Map
Boulder Hill Overview
$29,263
PER CAPITA INCOME
$80,069
AVG FAMILY INCOME
$76,875
AVG HOUSEHOLD INCOME
24.1%
WAGE / INCOME GAP [ % ]
75.9¢/ $1
WAGE / INCOME GAP [ $ ]
$14,543
FAMILY INCOME DEFICIT
0.30
INEQUALITY / GINI INDEX
9,547
TOTAL POPULATION
4,398
MALE POPULATION
5,149
FEMALE POPULATION
85.41
MALES / 100 FEMALES
117.08
FEMALES / 100 MALES
35.0
MEDIAN AGE
3.7
AVG FAMILY SIZE
3.1
AVG HOUSEHOLD SIZE
5,311
LABOR FORCE [ PEOPLE ]
70.8%
PERCENT IN LABOR FORCE
6.4%
UNEMPLOYMENT RATE
Income in Boulder Hill
Income Overview in Boulder Hill
Per Capita Income in Boulder Hill is $29,263, while median incomes of families and households are $80,069 and $76,875 respectively.
| Characteristic | Number | Measure |
| Per Capita Income | 9,547 | $29,263 |
| Median Family Income | 2,295 | $80,069 |
| Mean Family Income | 2,295 | $91,587 |
| Median Household Income | 3,035 | $76,875 |
| Mean Household Income | 3,035 | $87,960 |
| Income Deficit | 2,295 | $14,543 |
| Wage / Income Gap (%) | 9,547 | 24.10% |
| Wage / Income Gap ($) | 9,547 | 75.90¢ per $1 |
| Gini / Inequality Index | 9,547 | 0.30 |
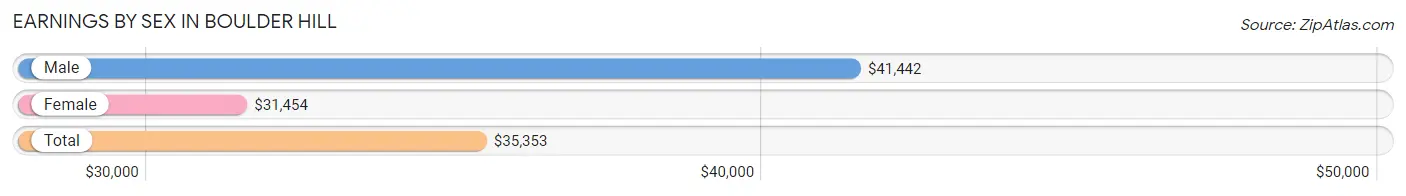
Earnings by Sex in Boulder Hill
Average Earnings in Boulder Hill are $35,353, $41,442 for men and $31,454 for women, a difference of 24.1%.
| Sex | Number | Average Earnings |
| Male | 2,793 (51.4%) | $41,442 |
| Female | 2,645 (48.6%) | $31,454 |
| Total | 5,438 (100.0%) | $35,353 |
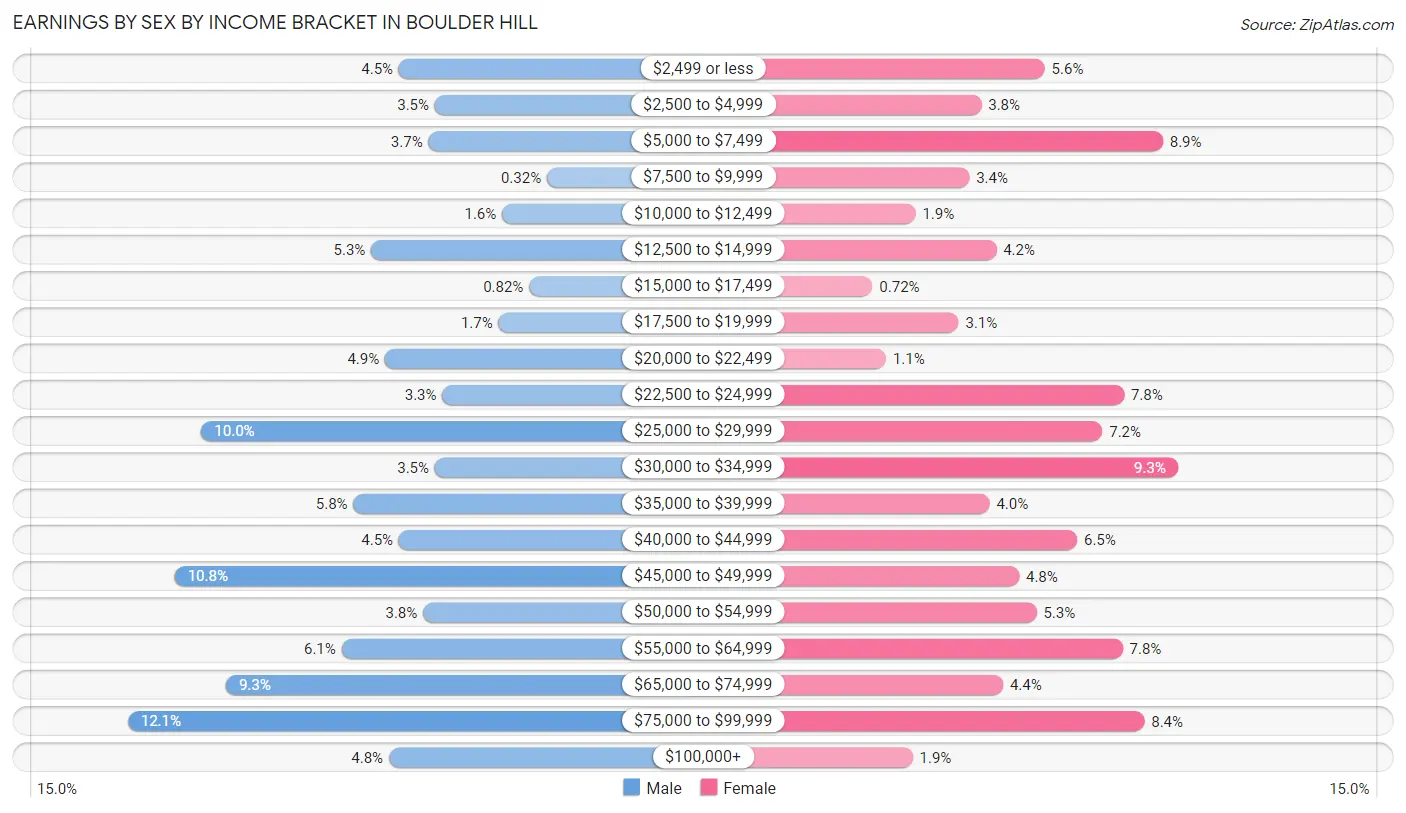
Earnings by Sex by Income Bracket in Boulder Hill
The most common earnings brackets in Boulder Hill are $75,000 to $99,999 for men (338 | 12.1%) and $30,000 to $34,999 for women (246 | 9.3%).
| Income | Male | Female |
| $2,499 or less | 125 (4.5%) | 147 (5.6%) |
| $2,500 to $4,999 | 97 (3.5%) | 100 (3.8%) |
| $5,000 to $7,499 | 102 (3.6%) | 235 (8.9%) |
| $7,500 to $9,999 | 9 (0.3%) | 91 (3.4%) |
| $10,000 to $12,499 | 44 (1.6%) | 51 (1.9%) |
| $12,500 to $14,999 | 147 (5.3%) | 111 (4.2%) |
| $15,000 to $17,499 | 23 (0.8%) | 19 (0.7%) |
| $17,500 to $19,999 | 47 (1.7%) | 83 (3.1%) |
| $20,000 to $22,499 | 136 (4.9%) | 29 (1.1%) |
| $22,500 to $24,999 | 91 (3.3%) | 206 (7.8%) |
| $25,000 to $29,999 | 280 (10.0%) | 190 (7.2%) |
| $30,000 to $34,999 | 97 (3.5%) | 246 (9.3%) |
| $35,000 to $39,999 | 161 (5.8%) | 106 (4.0%) |
| $40,000 to $44,999 | 125 (4.5%) | 171 (6.5%) |
| $45,000 to $49,999 | 301 (10.8%) | 128 (4.8%) |
| $50,000 to $54,999 | 106 (3.8%) | 141 (5.3%) |
| $55,000 to $64,999 | 170 (6.1%) | 205 (7.7%) |
| $65,000 to $74,999 | 261 (9.3%) | 116 (4.4%) |
| $75,000 to $99,999 | 338 (12.1%) | 221 (8.4%) |
| $100,000+ | 133 (4.8%) | 49 (1.8%) |
| Total | 2,793 (100.0%) | 2,645 (100.0%) |
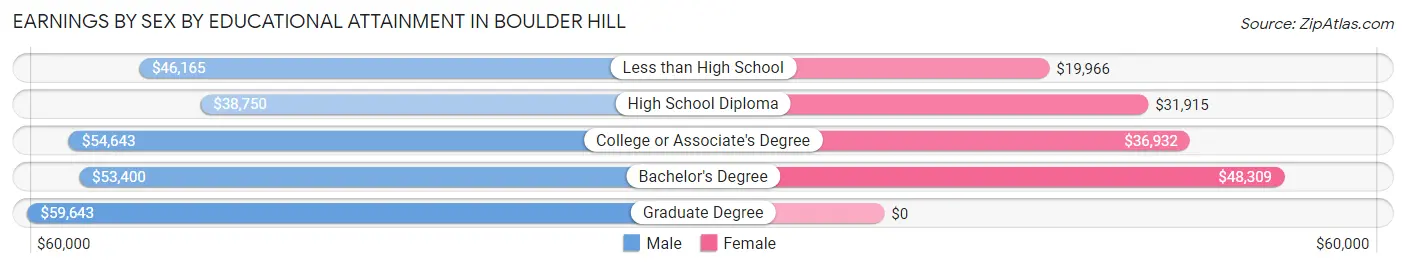
Earnings by Sex by Educational Attainment in Boulder Hill
Average earnings in Boulder Hill are $46,941 for men and $34,789 for women, a difference of 25.9%. Men with an educational attainment of graduate degree enjoy the highest average annual earnings of $59,643, while those with high school diploma education earn the least with $38,750. Women with an educational attainment of bachelor's degree earn the most with the average annual earnings of $48,309, while those with less than high school education have the smallest earnings of $19,966.
| Educational Attainment | Male Income | Female Income |
| Less than High School | $46,165 | $19,966 |
| High School Diploma | $38,750 | $31,915 |
| College or Associate's Degree | $54,643 | $36,932 |
| Bachelor's Degree | $53,400 | $48,309 |
| Graduate Degree | $59,643 | $0 |
| Total | $46,941 | $34,789 |
Family Income in Boulder Hill
Family Income Brackets in Boulder Hill
According to the Boulder Hill family income data, there are 666 families falling into the $50,000 to $74,999 income range, which is the most common income bracket and makes up 29.0% of all families. Conversely, the $10,000 to $14,999 income bracket is the least frequent group with only 5 families (0.2%) belonging to this category.
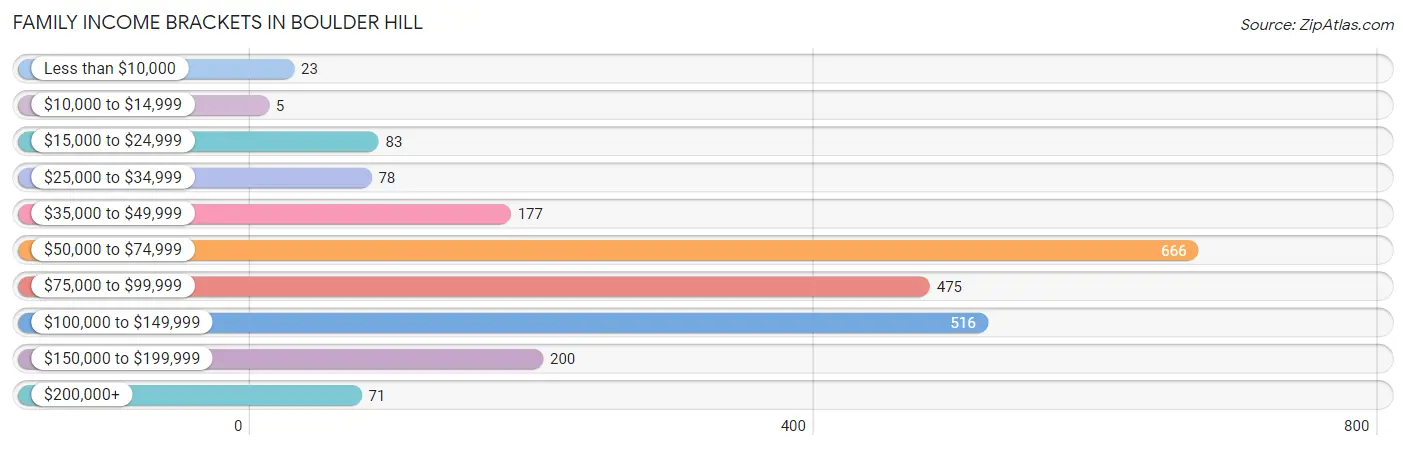
| Income Bracket | # Families | % Families |
| Less than $10,000 | 23 | 1.0% |
| $10,000 to $14,999 | 5 | 0.2% |
| $15,000 to $24,999 | 83 | 3.6% |
| $25,000 to $34,999 | 78 | 3.4% |
| $35,000 to $49,999 | 177 | 7.7% |
| $50,000 to $74,999 | 666 | 29.0% |
| $75,000 to $99,999 | 475 | 20.7% |
| $100,000 to $149,999 | 516 | 22.5% |
| $150,000 to $199,999 | 200 | 8.7% |
| $200,000+ | 71 | 3.1% |
Family Income by Famaliy Size in Boulder Hill
6-person families (85 | 3.7%) account for the highest median family income in Boulder Hill with $92,260 per family, while 2-person families (775 | 33.8%) have the highest median income of $37,344 per family member.
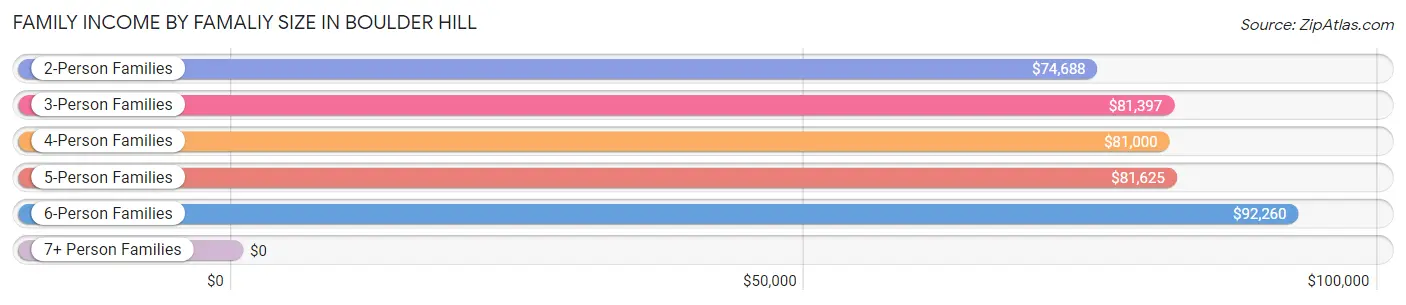
| Income Bracket | # Families | Median Income |
| 2-Person Families | 775 (33.8%) | $74,688 |
| 3-Person Families | 532 (23.2%) | $81,397 |
| 4-Person Families | 476 (20.7%) | $81,000 |
| 5-Person Families | 368 (16.0%) | $81,625 |
| 6-Person Families | 85 (3.7%) | $92,260 |
| 7+ Person Families | 59 (2.6%) | $0 |
| Total | 2,295 (100.0%) | $80,069 |
Family Income by Number of Earners in Boulder Hill
The median family income in Boulder Hill is $80,069, with families comprising 3+ earners (470) having the highest median family income of $103,289, while families with no earners (136) have the lowest median family income of $34,375, accounting for 20.5% and 5.9% of families, respectively.
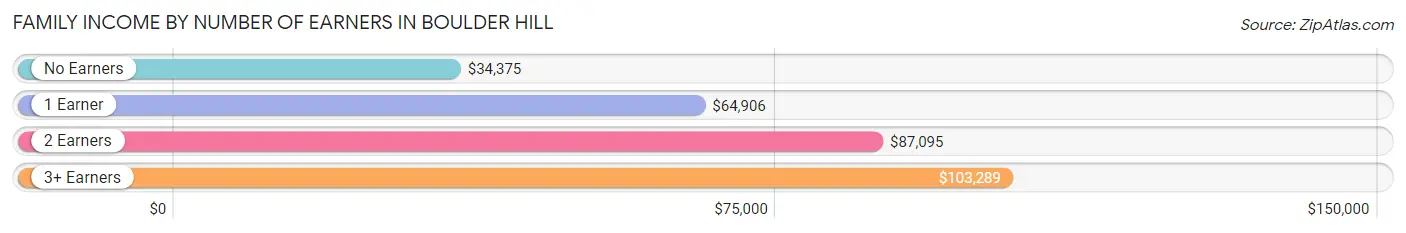
| Number of Earners | # Families | Median Income |
| No Earners | 136 (5.9%) | $34,375 |
| 1 Earner | 613 (26.7%) | $64,906 |
| 2 Earners | 1,076 (46.9%) | $87,095 |
| 3+ Earners | 470 (20.5%) | $103,289 |
| Total | 2,295 (100.0%) | $80,069 |
Household Income in Boulder Hill
Household Income Brackets in Boulder Hill
With 880 households falling in the category, the $50,000 to $74,999 income range is the most frequent in Boulder Hill, accounting for 29.0% of all households. In contrast, only 30 households (1.0%) fall into the $10,000 to $14,999 income bracket, making it the least populous group.
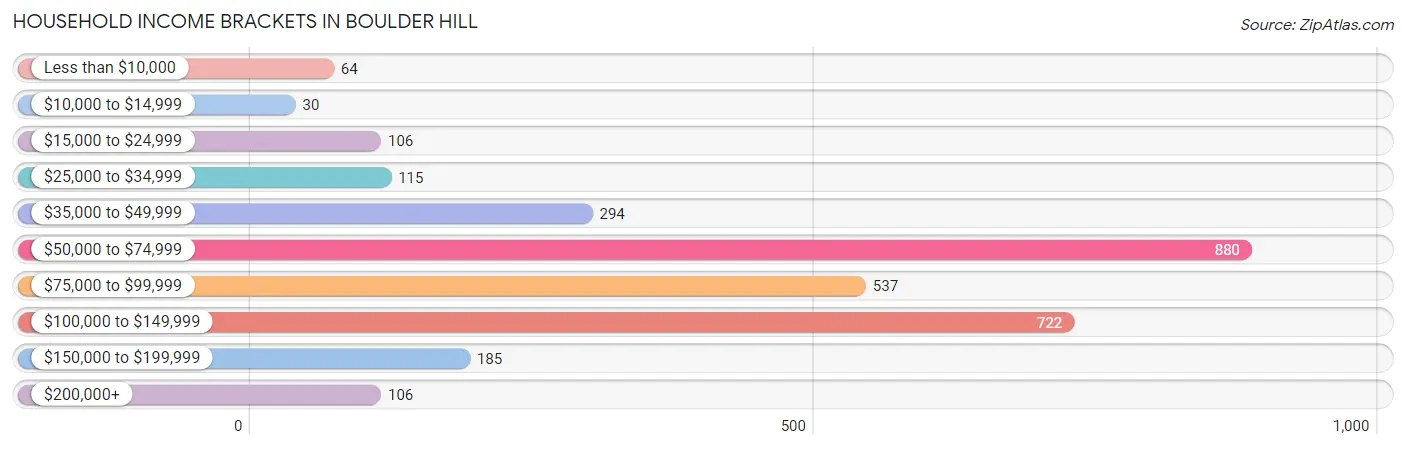
| Income Bracket | # Households | % Households |
| Less than $10,000 | 64 | 2.1% |
| $10,000 to $14,999 | 30 | 1.0% |
| $15,000 to $24,999 | 106 | 3.5% |
| $25,000 to $34,999 | 115 | 3.8% |
| $35,000 to $49,999 | 294 | 9.7% |
| $50,000 to $74,999 | 880 | 29.0% |
| $75,000 to $99,999 | 537 | 17.7% |
| $100,000 to $149,999 | 722 | 23.8% |
| $150,000 to $199,999 | 185 | 6.1% |
| $200,000+ | 106 | 3.5% |
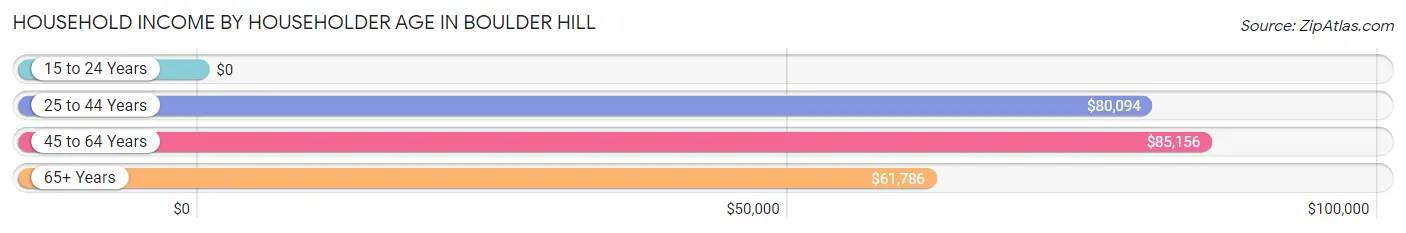
Household Income by Householder Age in Boulder Hill
The median household income in Boulder Hill is $76,875, with the highest median household income of $85,156 found in the 45 to 64 years age bracket for the primary householder. A total of 1,117 households (36.8%) fall into this category. Meanwhile, the 15 to 24 years age bracket for the primary householder has the lowest median household income of $0, with 29 households (1.0%) in this group.
| Income Bracket | # Households | Median Income |
| 15 to 24 Years | 29 (1.0%) | $0 |
| 25 to 44 Years | 1,117 (36.8%) | $80,094 |
| 45 to 64 Years | 1,117 (36.8%) | $85,156 |
| 65+ Years | 772 (25.4%) | $61,786 |
| Total | 3,035 (100.0%) | $76,875 |
Poverty in Boulder Hill
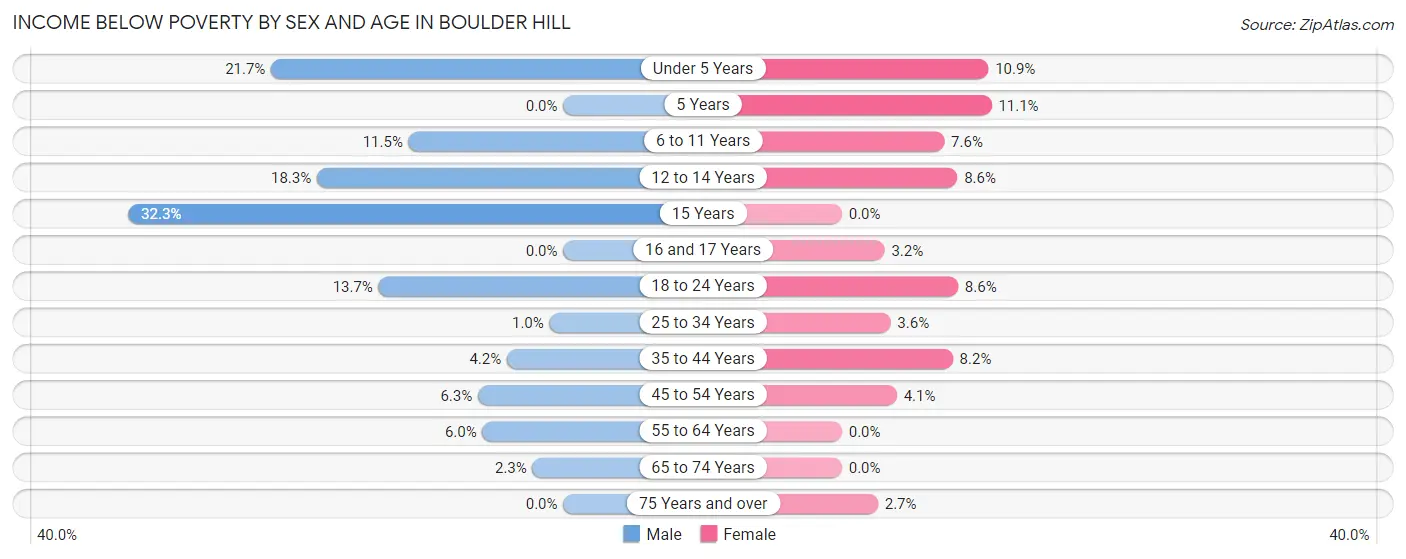
Income Below Poverty by Sex and Age in Boulder Hill
With 7.4% poverty level for males and 5.0% for females among the residents of Boulder Hill, 15 year old males and 5 year old females are the most vulnerable to poverty, with 21 males (32.3%) and 13 females (11.1%) in their respective age groups living below the poverty level.
| Age Bracket | Male | Female |
| Under 5 Years | 54 (21.7%) | 30 (10.9%) |
| 5 Years | 0 (0.0%) | 13 (11.1%) |
| 6 to 11 Years | 42 (11.5%) | 43 (7.6%) |
| 12 to 14 Years | 30 (18.3%) | 9 (8.6%) |
| 15 Years | 21 (32.3%) | 0 (0.0%) |
| 16 and 17 Years | 0 (0.0%) | 8 (3.2%) |
| 18 to 24 Years | 68 (13.7%) | 42 (8.6%) |
| 25 to 34 Years | 6 (1.0%) | 27 (3.6%) |
| 35 to 44 Years | 35 (4.2%) | 55 (8.2%) |
| 45 to 54 Years | 34 (6.3%) | 19 (4.1%) |
| 55 to 64 Years | 29 (6.0%) | 0 (0.0%) |
| 65 to 74 Years | 7 (2.3%) | 0 (0.0%) |
| 75 Years and over | 0 (0.0%) | 10 (2.7%) |
| Total | 326 (7.4%) | 256 (5.0%) |
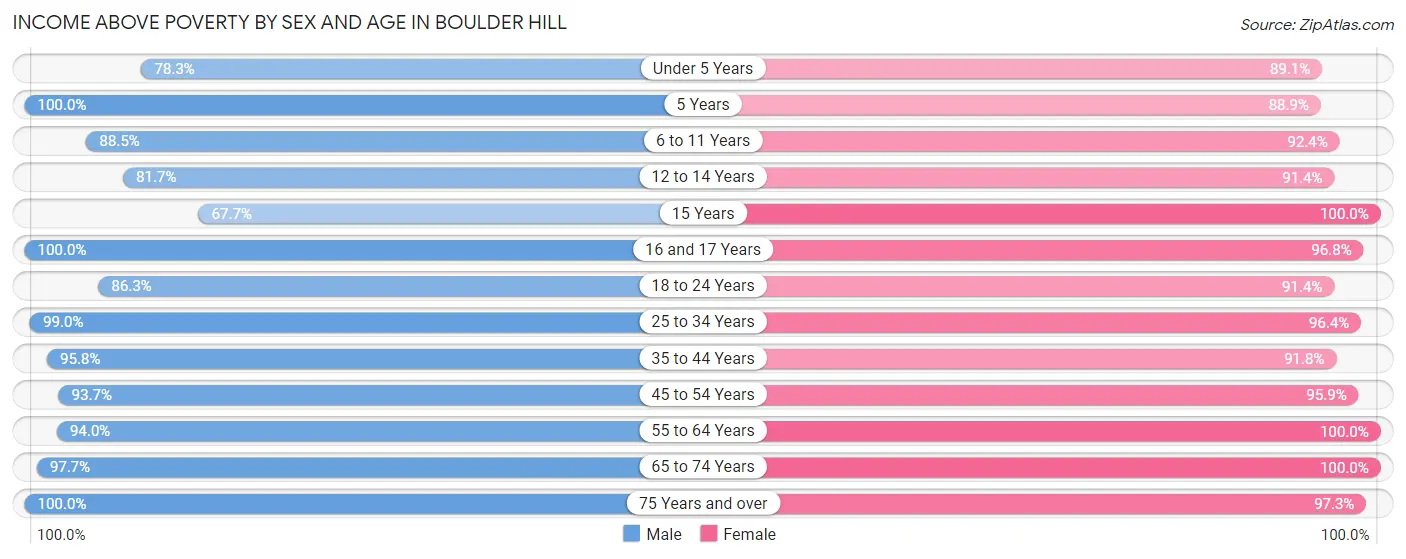
Income Above Poverty by Sex and Age in Boulder Hill
According to the poverty statistics in Boulder Hill, males aged 5 years and females aged 15 years are the age groups that are most secure financially, with 100.0% of males and 100.0% of females in these age groups living above the poverty line.
| Age Bracket | Male | Female |
| Under 5 Years | 195 (78.3%) | 246 (89.1%) |
| 5 Years | 50 (100.0%) | 104 (88.9%) |
| 6 to 11 Years | 324 (88.5%) | 523 (92.4%) |
| 12 to 14 Years | 134 (81.7%) | 96 (91.4%) |
| 15 Years | 44 (67.7%) | 76 (100.0%) |
| 16 and 17 Years | 160 (100.0%) | 244 (96.8%) |
| 18 to 24 Years | 428 (86.3%) | 445 (91.4%) |
| 25 to 34 Years | 581 (99.0%) | 720 (96.4%) |
| 35 to 44 Years | 802 (95.8%) | 613 (91.8%) |
| 45 to 54 Years | 503 (93.7%) | 447 (95.9%) |
| 55 to 64 Years | 454 (94.0%) | 493 (100.0%) |
| 65 to 74 Years | 300 (97.7%) | 522 (100.0%) |
| 75 Years and over | 85 (100.0%) | 364 (97.3%) |
| Total | 4,060 (92.6%) | 4,893 (95.0%) |
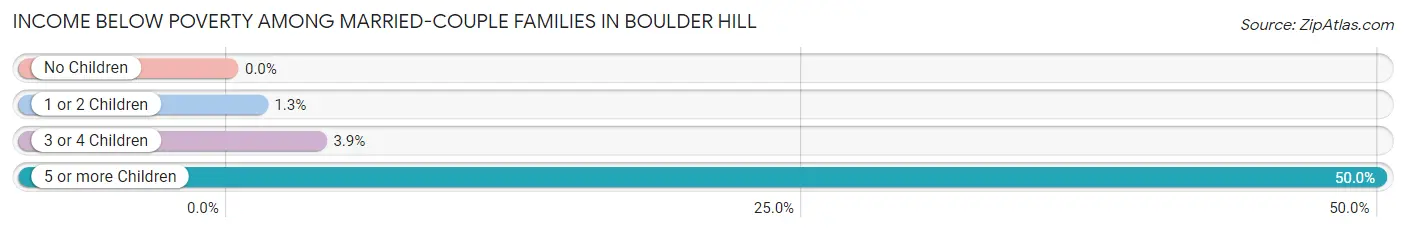
Income Below Poverty Among Married-Couple Families in Boulder Hill
The poverty statistics for married-couple families in Boulder Hill show that 2.2% or 33 of the total 1,520 families live below the poverty line. Families with 5 or more children have the highest poverty rate of 50.0%, comprising of 19 families. On the other hand, families with no children have the lowest poverty rate of 0.0%, which includes 0 families.
| Children | Above Poverty | Below Poverty |
| No Children | 702 (100.0%) | 0 (0.0%) |
| 1 or 2 Children | 616 (98.7%) | 8 (1.3%) |
| 3 or 4 Children | 150 (96.2%) | 6 (3.8%) |
| 5 or more Children | 19 (50.0%) | 19 (50.0%) |
| Total | 1,487 (97.8%) | 33 (2.2%) |
Income Below Poverty Among Single-Parent Households in Boulder Hill
According to the poverty data in Boulder Hill, 10.5% or 26 single-father households and 3.0% or 16 single-mother households are living below the poverty line. Among single-father households, those with 1 or 2 children have the highest poverty rate, with 14 households (22.6%) experiencing poverty. Likewise, among single-mother households, those with 3 or 4 children have the highest poverty rate, with 5 households (17.2%) falling below the poverty line.
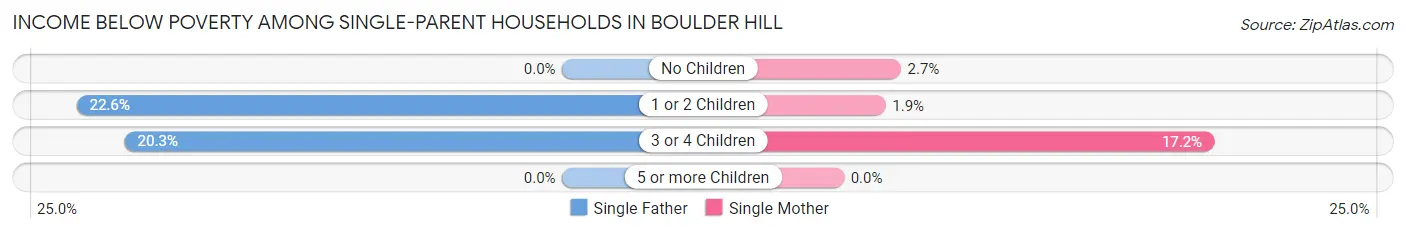
| Children | Single Father | Single Mother |
| No Children | 0 (0.0%) | 5 (2.6%) |
| 1 or 2 Children | 14 (22.6%) | 6 (1.9%) |
| 3 or 4 Children | 12 (20.3%) | 5 (17.2%) |
| 5 or more Children | 0 (0.0%) | 0 (0.0%) |
| Total | 26 (10.5%) | 16 (3.0%) |
Income Below Poverty Among Married-Couple vs Single-Parent Households in Boulder Hill
The poverty data for Boulder Hill shows that 33 of the married-couple family households (2.2%) and 42 of the single-parent households (5.4%) are living below the poverty level. Within the married-couple family households, those with 5 or more children have the highest poverty rate, with 19 households (50.0%) falling below the poverty line. Among the single-parent households, those with 3 or 4 children have the highest poverty rate, with 17 household (19.3%) living below poverty.
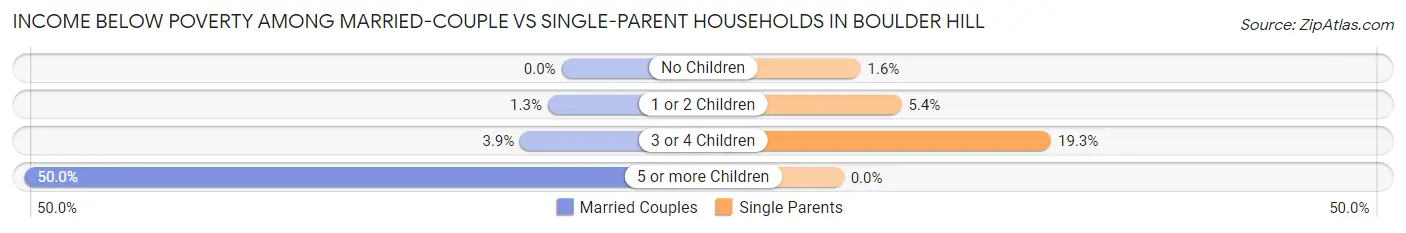
| Children | Married-Couple Families | Single-Parent Households |
| No Children | 0 (0.0%) | 5 (1.6%) |
| 1 or 2 Children | 8 (1.3%) | 20 (5.4%) |
| 3 or 4 Children | 6 (3.8%) | 17 (19.3%) |
| 5 or more Children | 19 (50.0%) | 0 (0.0%) |
| Total | 33 (2.2%) | 42 (5.4%) |
Race in Boulder Hill
The most populous races in Boulder Hill are White / Caucasian (6,603 | 69.2%), Hispanic or Latino (3,697 | 38.7%), and Some other Race (1,343 | 14.1%).
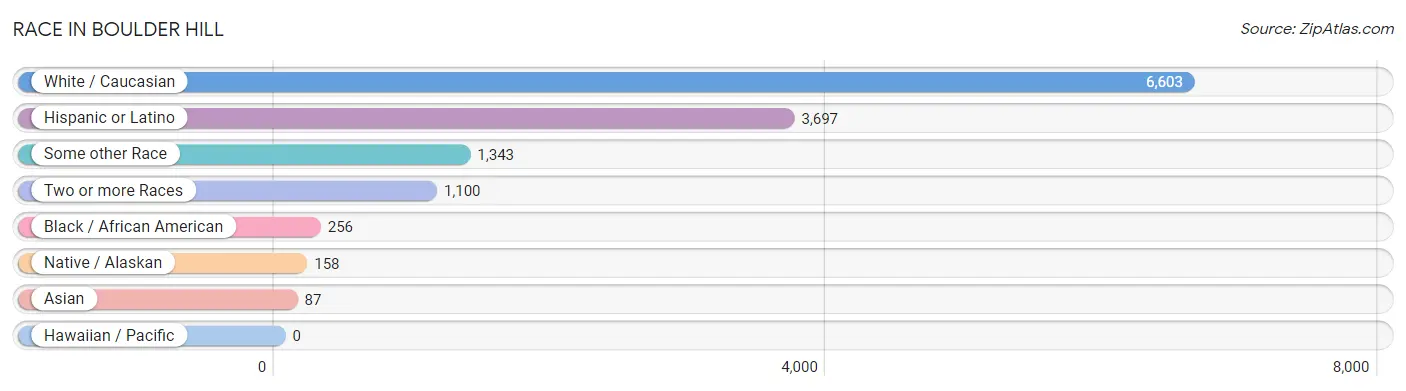
| Race | # Population | % Population |
| Asian | 87 | 0.9% |
| Black / African American | 256 | 2.7% |
| Hawaiian / Pacific | 0 | 0.0% |
| Hispanic or Latino | 3,697 | 38.7% |
| Native / Alaskan | 158 | 1.7% |
| White / Caucasian | 6,603 | 69.2% |
| Two or more Races | 1,100 | 11.5% |
| Some other Race | 1,343 | 14.1% |
| Total | 9,547 | 100.0% |
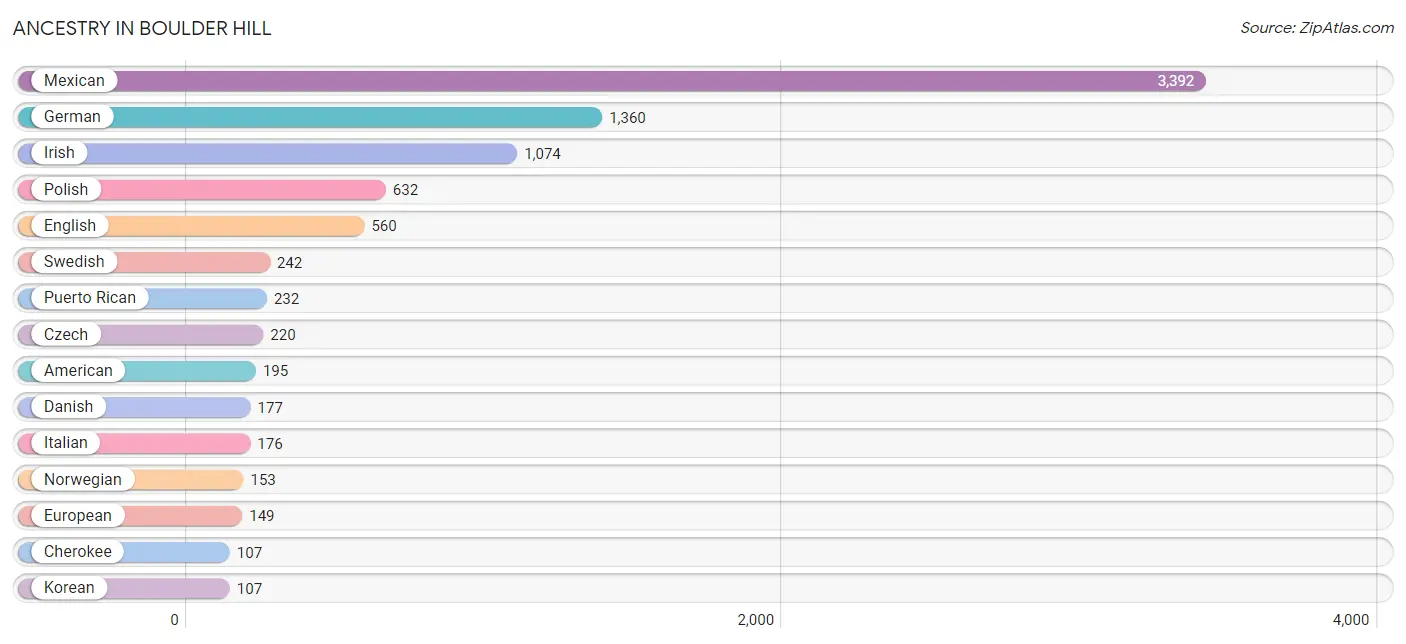
Ancestry in Boulder Hill
The most populous ancestries reported in Boulder Hill are Mexican (3,392 | 35.5%), German (1,360 | 14.2%), Irish (1,074 | 11.3%), Polish (632 | 6.6%), and English (560 | 5.9%), together accounting for 73.5% of all Boulder Hill residents.
| Ancestry | # Population | % Population |
| American | 195 | 2.0% |
| Assyrian / Chaldean / Syriac | 3 | 0.0% |
| Austrian | 6 | 0.1% |
| Belgian | 10 | 0.1% |
| Bhutanese | 101 | 1.1% |
| Burmese | 5 | 0.1% |
| Central American | 14 | 0.2% |
| Central American Indian | 74 | 0.8% |
| Cherokee | 107 | 1.1% |
| Croatian | 7 | 0.1% |
| Czech | 220 | 2.3% |
| Czechoslovakian | 3 | 0.0% |
| Danish | 177 | 1.8% |
| Dominican | 8 | 0.1% |
| Dutch | 95 | 1.0% |
| Eastern European | 11 | 0.1% |
| Ecuadorian | 37 | 0.4% |
| English | 560 | 5.9% |
| European | 149 | 1.6% |
| French | 15 | 0.2% |
| German | 1,360 | 14.2% |
| Hungarian | 35 | 0.4% |
| Indian (Asian) | 11 | 0.1% |
| Irish | 1,074 | 11.3% |
| Israeli | 6 | 0.1% |
| Italian | 176 | 1.8% |
| Jamaican | 28 | 0.3% |
| Japanese | 29 | 0.3% |
| Korean | 107 | 1.1% |
| Latvian | 17 | 0.2% |
| Lithuanian | 59 | 0.6% |
| Luxembourger | 36 | 0.4% |
| Malaysian | 9 | 0.1% |
| Mexican | 3,392 | 35.5% |
| Mexican American Indian | 78 | 0.8% |
| Norwegian | 153 | 1.6% |
| Pakistani | 27 | 0.3% |
| Polish | 632 | 6.6% |
| Portuguese | 10 | 0.1% |
| Puerto Rican | 232 | 2.4% |
| Romanian | 58 | 0.6% |
| Russian | 78 | 0.8% |
| Salvadoran | 14 | 0.2% |
| Scandinavian | 9 | 0.1% |
| Scotch-Irish | 107 | 1.1% |
| Scottish | 60 | 0.6% |
| South American | 37 | 0.4% |
| Spanish | 14 | 0.2% |
| Swedish | 242 | 2.5% |
| Swiss | 35 | 0.4% |
| Ukrainian | 8 | 0.1% |
| Welsh | 21 | 0.2% | View All 52 Rows |
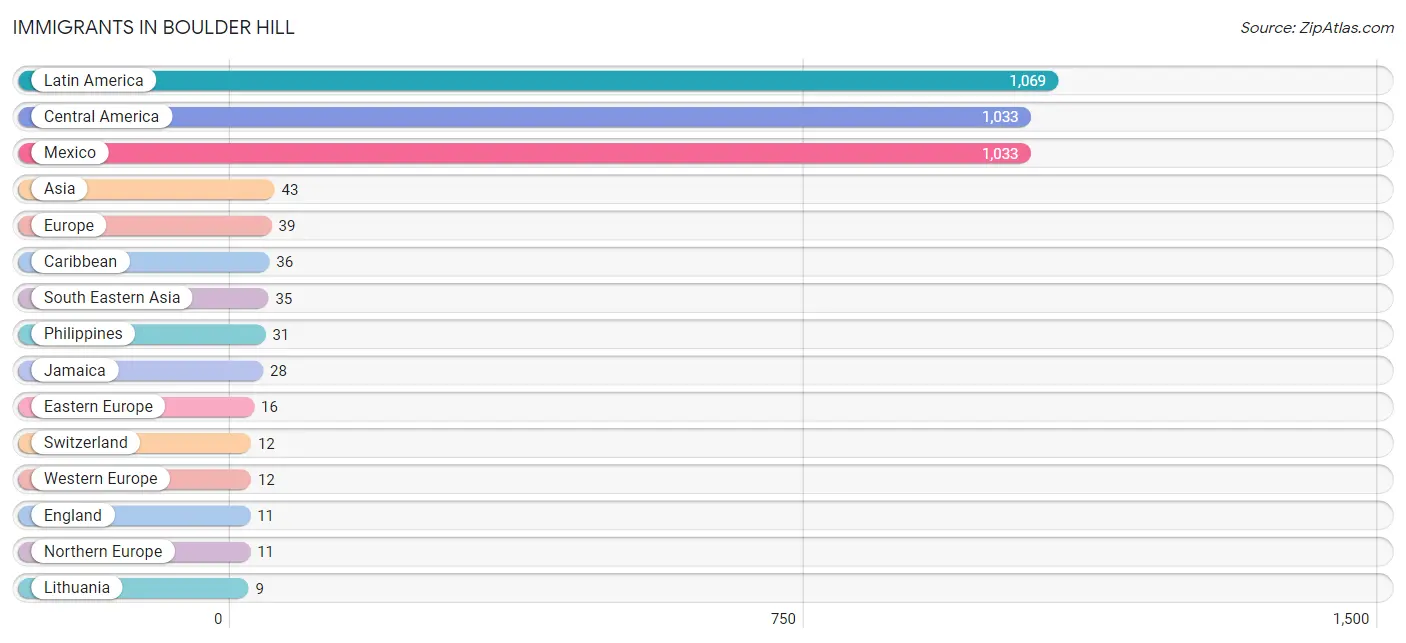
Immigrants in Boulder Hill
The most numerous immigrant groups reported in Boulder Hill came from Latin America (1,069 | 11.2%), Central America (1,033 | 10.8%), Mexico (1,033 | 10.8%), Asia (43 | 0.4%), and Europe (39 | 0.4%), together accounting for 33.7% of all Boulder Hill residents.
| Immigration Origin | # Population | % Population |
| Asia | 43 | 0.4% |
| Cambodia | 4 | 0.0% |
| Caribbean | 36 | 0.4% |
| Central America | 1,033 | 10.8% |
| Dominican Republic | 8 | 0.1% |
| Eastern Asia | 5 | 0.1% |
| Eastern Europe | 16 | 0.2% |
| England | 11 | 0.1% |
| Europe | 39 | 0.4% |
| Hungary | 7 | 0.1% |
| Jamaica | 28 | 0.3% |
| Korea | 5 | 0.1% |
| Latin America | 1,069 | 11.2% |
| Lithuania | 9 | 0.1% |
| Mexico | 1,033 | 10.8% |
| Northern Europe | 11 | 0.1% |
| Philippines | 31 | 0.3% |
| South Eastern Asia | 35 | 0.4% |
| Switzerland | 12 | 0.1% |
| Syria | 3 | 0.0% |
| Western Asia | 3 | 0.0% |
| Western Europe | 12 | 0.1% | View All 22 Rows |
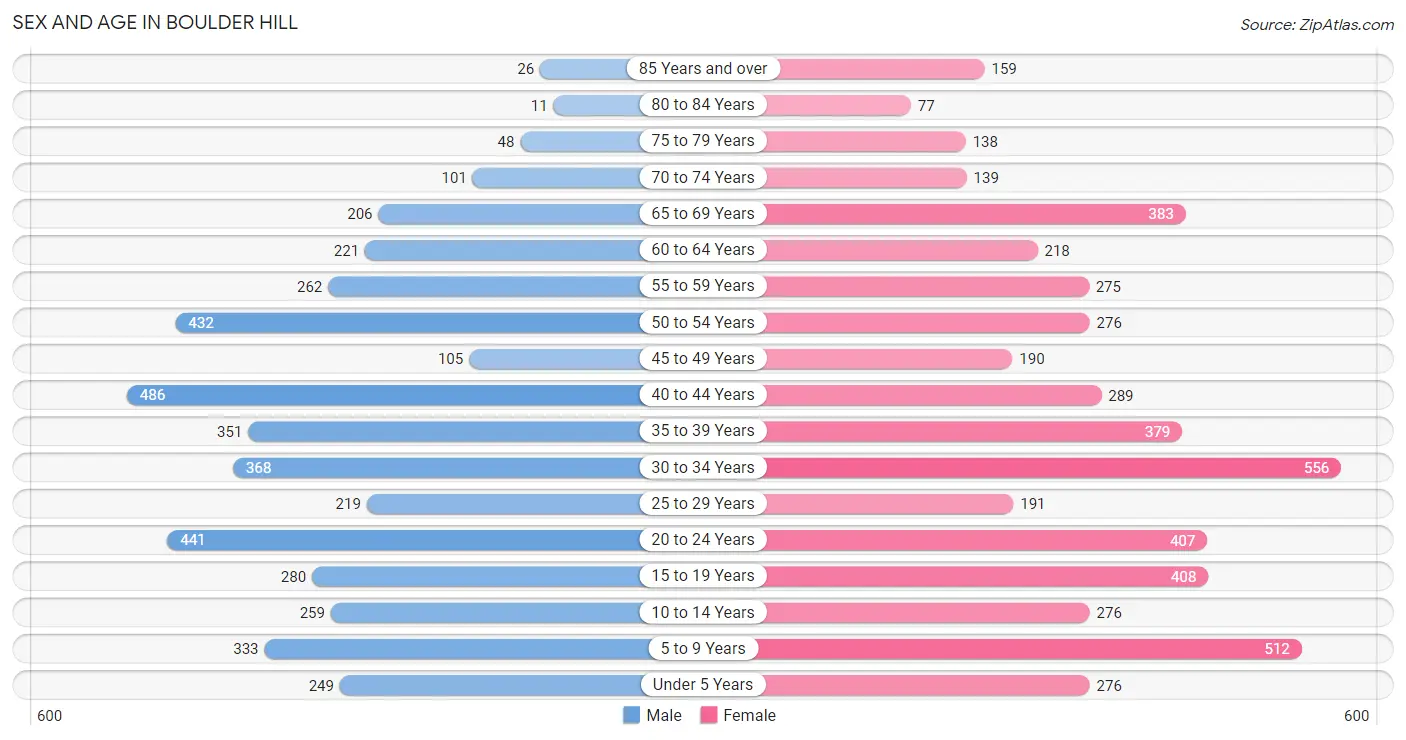
Sex and Age in Boulder Hill
Sex and Age in Boulder Hill
The most populous age groups in Boulder Hill are 40 to 44 Years (486 | 11.1%) for men and 30 to 34 Years (556 | 10.8%) for women.
| Age Bracket | Male | Female |
| Under 5 Years | 249 (5.7%) | 276 (5.4%) |
| 5 to 9 Years | 333 (7.6%) | 512 (9.9%) |
| 10 to 14 Years | 259 (5.9%) | 276 (5.4%) |
| 15 to 19 Years | 280 (6.4%) | 408 (7.9%) |
| 20 to 24 Years | 441 (10.0%) | 407 (7.9%) |
| 25 to 29 Years | 219 (5.0%) | 191 (3.7%) |
| 30 to 34 Years | 368 (8.4%) | 556 (10.8%) |
| 35 to 39 Years | 351 (8.0%) | 379 (7.4%) |
| 40 to 44 Years | 486 (11.1%) | 289 (5.6%) |
| 45 to 49 Years | 105 (2.4%) | 190 (3.7%) |
| 50 to 54 Years | 432 (9.8%) | 276 (5.4%) |
| 55 to 59 Years | 262 (6.0%) | 275 (5.3%) |
| 60 to 64 Years | 221 (5.0%) | 218 (4.2%) |
| 65 to 69 Years | 206 (4.7%) | 383 (7.4%) |
| 70 to 74 Years | 101 (2.3%) | 139 (2.7%) |
| 75 to 79 Years | 48 (1.1%) | 138 (2.7%) |
| 80 to 84 Years | 11 (0.3%) | 77 (1.5%) |
| 85 Years and over | 26 (0.6%) | 159 (3.1%) |
| Total | 4,398 (100.0%) | 5,149 (100.0%) |
Families and Households in Boulder Hill
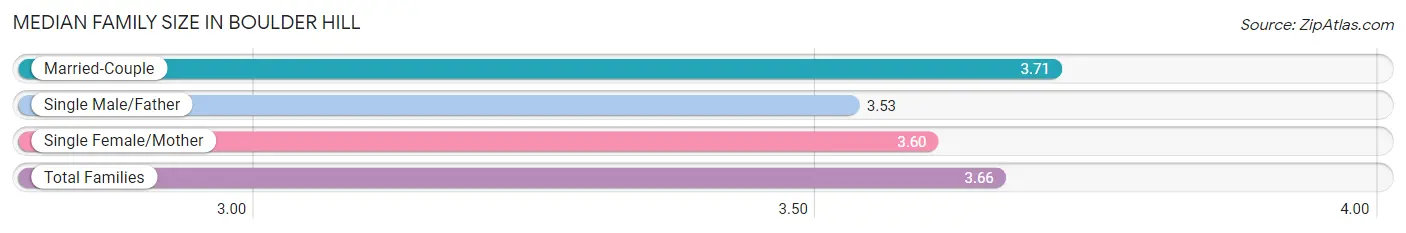
Median Family Size in Boulder Hill
The median family size in Boulder Hill is 3.66 persons per family, with married-couple families (1,520 | 66.2%) accounting for the largest median family size of 3.71 persons per family. On the other hand, single male/father families (248 | 10.8%) represent the smallest median family size with 3.53 persons per family.
| Family Type | # Families | Family Size |
| Married-Couple | 1,520 (66.2%) | 3.71 |
| Single Male/Father | 248 (10.8%) | 3.53 |
| Single Female/Mother | 527 (23.0%) | 3.60 |
| Total Families | 2,295 (100.0%) | 3.66 |
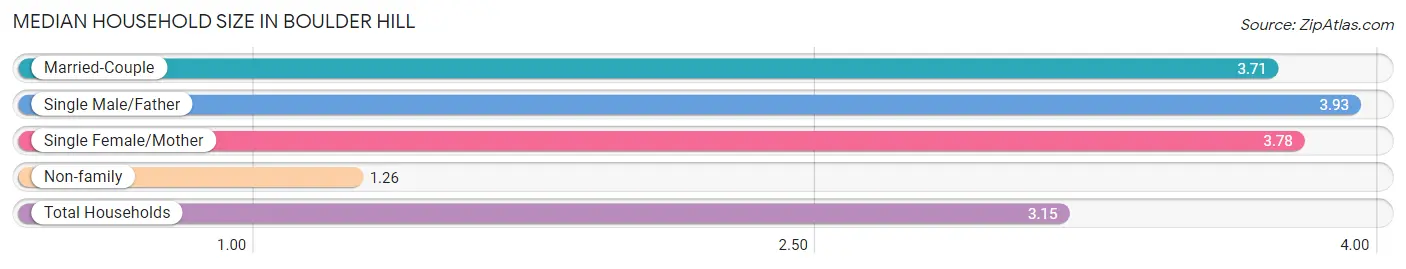
Median Household Size in Boulder Hill
The median household size in Boulder Hill is 3.15 persons per household, with single male/father households (248 | 8.2%) accounting for the largest median household size of 3.93 persons per household. non-family households (740 | 24.4%) represent the smallest median household size with 1.26 persons per household.
| Household Type | # Households | Household Size |
| Married-Couple | 1,520 (50.1%) | 3.71 |
| Single Male/Father | 248 (8.2%) | 3.93 |
| Single Female/Mother | 527 (17.4%) | 3.78 |
| Non-family | 740 (24.4%) | 1.26 |
| Total Households | 3,035 (100.0%) | 3.15 |
Household Size by Marriage Status in Boulder Hill
Out of a total of 3,035 households in Boulder Hill, 2,295 (75.6%) are family households, while 740 (24.4%) are nonfamily households. The most numerous type of family households are 2-person households, comprising 697, and the most common type of nonfamily households are 1-person households, comprising 590.
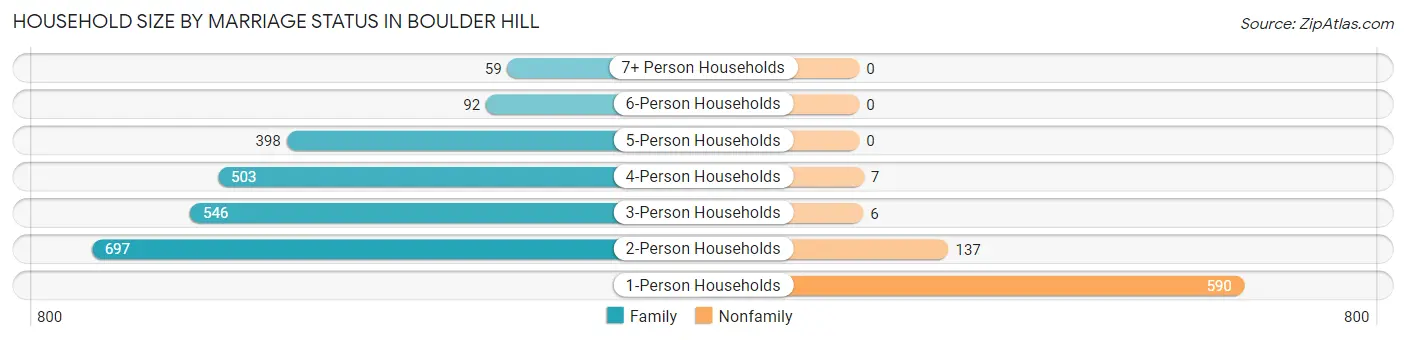
| Household Size | Family Households | Nonfamily Households |
| 1-Person Households | - | 590 (19.4%) |
| 2-Person Households | 697 (23.0%) | 137 (4.5%) |
| 3-Person Households | 546 (18.0%) | 6 (0.2%) |
| 4-Person Households | 503 (16.6%) | 7 (0.2%) |
| 5-Person Households | 398 (13.1%) | 0 (0.0%) |
| 6-Person Households | 92 (3.0%) | 0 (0.0%) |
| 7+ Person Households | 59 (1.9%) | 0 (0.0%) |
| Total | 2,295 (75.6%) | 740 (24.4%) |
Female Fertility in Boulder Hill
Fertility by Age in Boulder Hill
Average fertility rate in Boulder Hill is 24.0 births per 1,000 women. Women in the age bracket of 35 to 50 years have the highest fertility rate with 40.0 births per 1,000 women. Women in the age bracket of 35 to 50 years acount for 62.9% of all women with births.
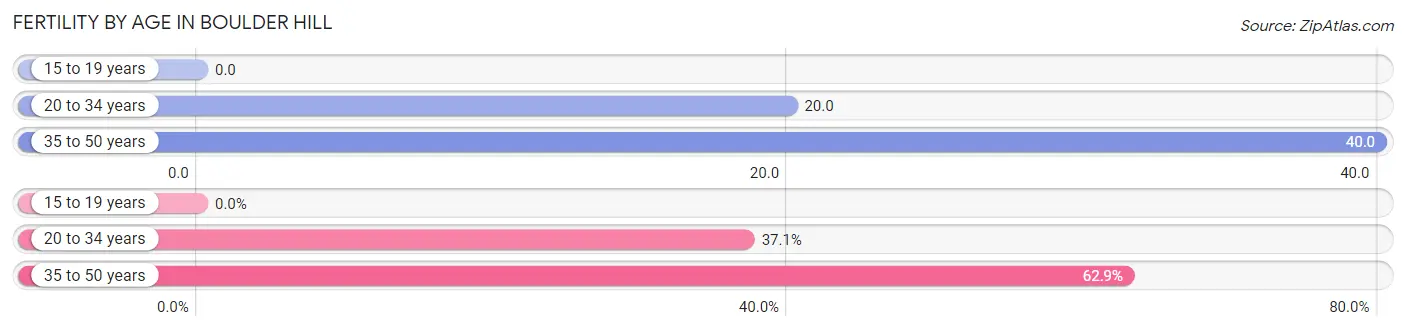
| Age Bracket | Women with Births | Births / 1,000 Women |
| 15 to 19 years | 0 (0.0%) | 0.0 |
| 20 to 34 years | 23 (37.1%) | 20.0 |
| 35 to 50 years | 39 (62.9%) | 40.0 |
| Total | 62 (100.0%) | 24.0 |
Fertility by Age by Marriage Status in Boulder Hill
91.9% of women with births (62) in Boulder Hill are married. The highest percentage of unmarried women with births falls into 20 to 34 years age bracket with 21.7% of them unmarried at the time of birth, while the lowest percentage of unmarried women with births belong to 35 to 50 years age bracket with 0.0% of them unmarried.
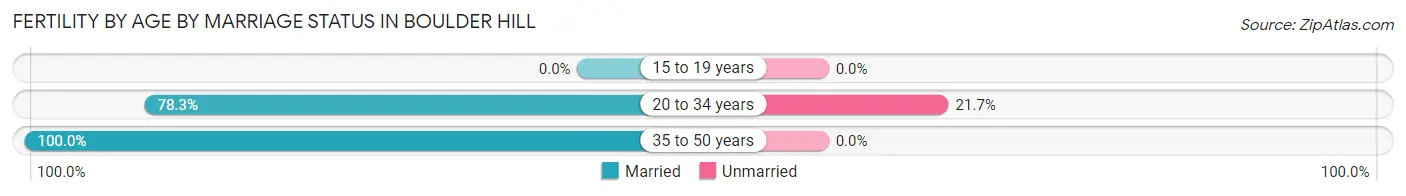
| Age Bracket | Married | Unmarried |
| 15 to 19 years | 0 (0.0%) | 0 (0.0%) |
| 20 to 34 years | 18 (78.3%) | 5 (21.7%) |
| 35 to 50 years | 39 (100.0%) | 0 (0.0%) |
| Total | 57 (91.9%) | 5 (8.1%) |
Fertility by Education in Boulder Hill
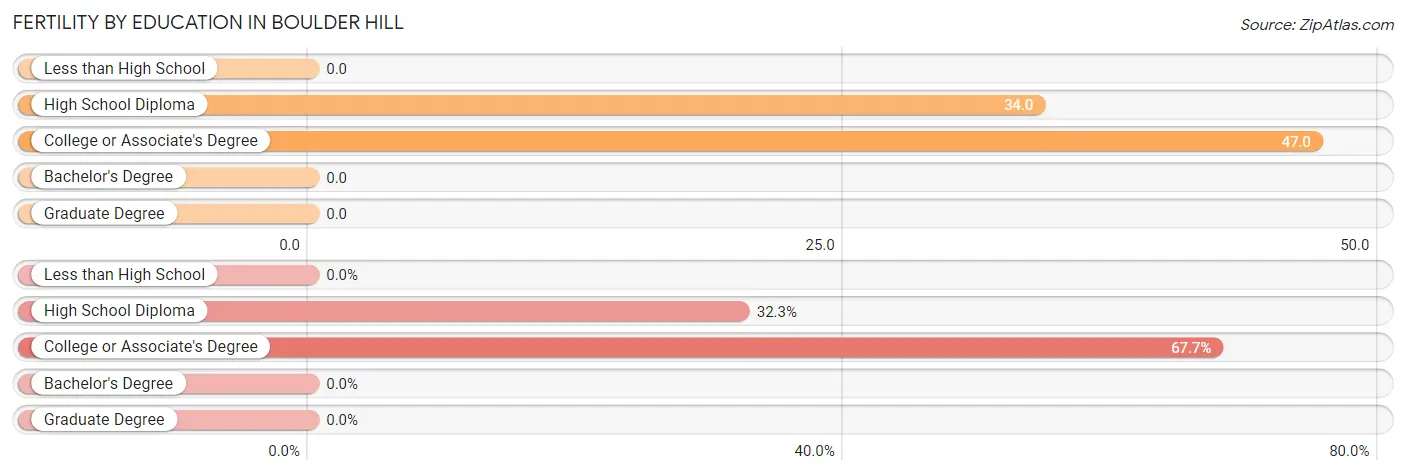
| Educational Attainment | Women with Births | Births / 1,000 Women |
| Less than High School | 0 (0.0%) | 0.0 |
| High School Diploma | 20 (32.3%) | 34.0 |
| College or Associate's Degree | 42 (67.7%) | 47.0 |
| Bachelor's Degree | 0 (0.0%) | 0.0 |
| Graduate Degree | 0 (0.0%) | 0.0 |
| Total | 62 (100.0%) | 24.0 |
Fertility by Education by Marriage Status in Boulder Hill
8.1% of women with births in Boulder Hill are unmarried. Women with the educational attainment of high school diploma are most likely to be married with 100.0% of them married at childbirth, while women with the educational attainment of college or associate's degree are least likely to be married with 11.9% of them unmarried at childbirth.
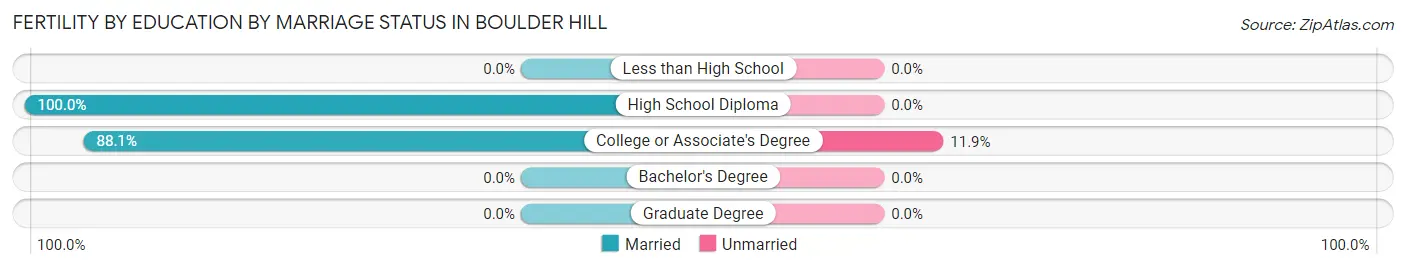
| Educational Attainment | Married | Unmarried |
| Less than High School | 0 (0.0%) | 0 (0.0%) |
| High School Diploma | 20 (100.0%) | 0 (0.0%) |
| College or Associate's Degree | 37 (88.1%) | 5 (11.9%) |
| Bachelor's Degree | 0 (0.0%) | 0 (0.0%) |
| Graduate Degree | 0 (0.0%) | 0 (0.0%) |
| Total | 57 (91.9%) | 5 (8.1%) |
Employment Characteristics in Boulder Hill
Employment by Class of Employer in Boulder Hill
Among the 4,724 employed individuals in Boulder Hill, private company employees (3,710 | 78.5%), local government employees (295 | 6.2%), and not-for-profit organizations (247 | 5.2%) make up the most common classes of employment.
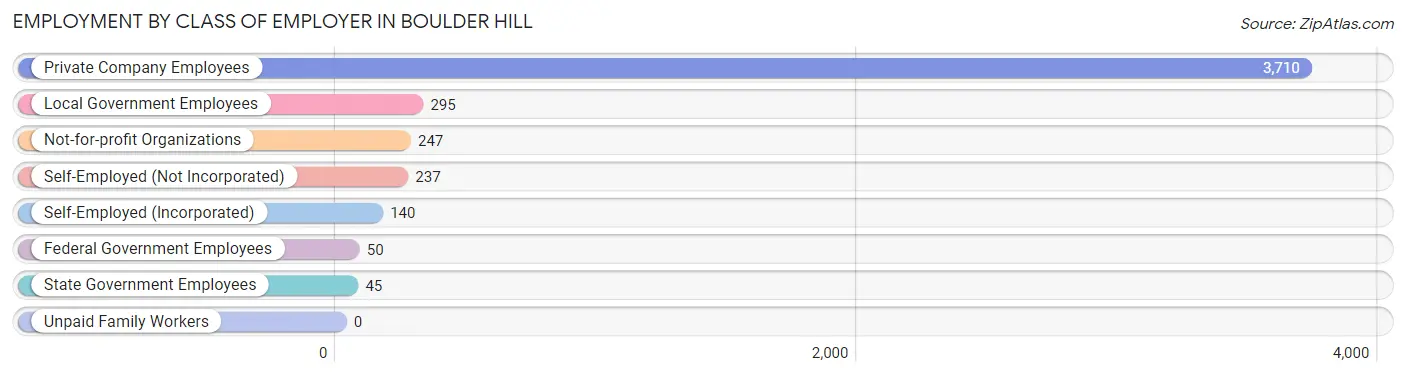
| Employer Class | # Employees | % Employees |
| Private Company Employees | 3,710 | 78.5% |
| Self-Employed (Incorporated) | 140 | 3.0% |
| Self-Employed (Not Incorporated) | 237 | 5.0% |
| Not-for-profit Organizations | 247 | 5.2% |
| Local Government Employees | 295 | 6.2% |
| State Government Employees | 45 | 0.9% |
| Federal Government Employees | 50 | 1.1% |
| Unpaid Family Workers | 0 | 0.0% |
| Total | 4,724 | 100.0% |
Employment Status by Age in Boulder Hill
According to the labor force statistics for Boulder Hill, out of the total population over 16 years of age (7,501), 70.8% or 5,311 individuals are in the labor force, with 6.4% or 340 of them unemployed. The age group with the highest labor force participation rate is 30 to 34 years, with 97.3% or 899 individuals in the labor force. Within the labor force, the 16 to 19 years age range has the highest percentage of unemployed individuals, with 22.9% or 56 of them being unemployed.
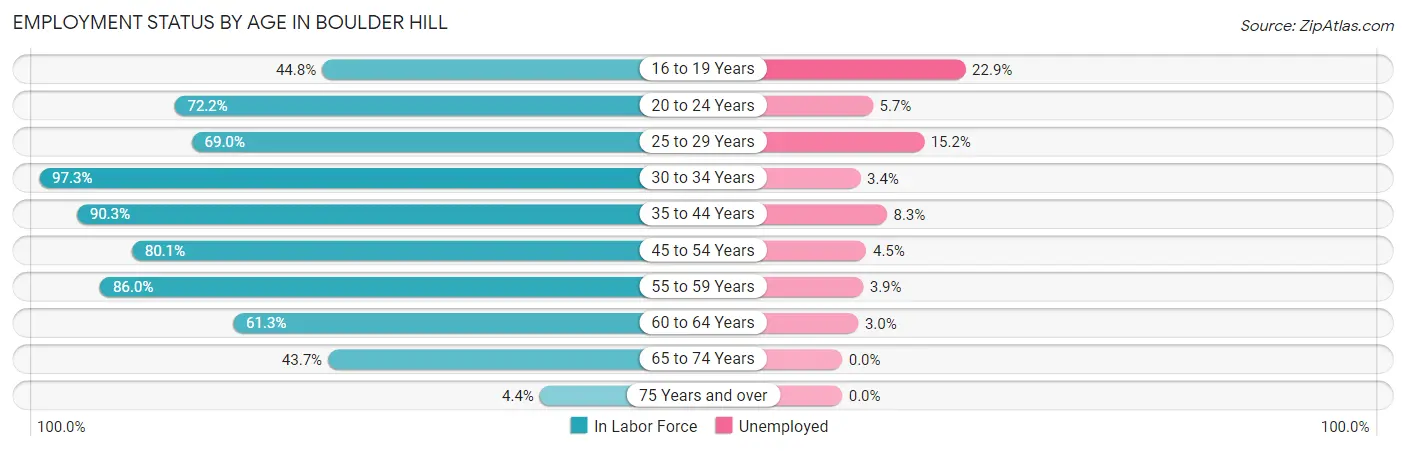
| Age Bracket | In Labor Force | Unemployed |
| 16 to 19 Years | 245 (44.8%) | 56 (22.9%) |
| 20 to 24 Years | 612 (72.2%) | 35 (5.7%) |
| 25 to 29 Years | 283 (69.0%) | 43 (15.2%) |
| 30 to 34 Years | 899 (97.3%) | 31 (3.4%) |
| 35 to 44 Years | 1,359 (90.3%) | 113 (8.3%) |
| 45 to 54 Years | 803 (80.1%) | 36 (4.5%) |
| 55 to 59 Years | 462 (86.0%) | 18 (3.9%) |
| 60 to 64 Years | 269 (61.3%) | 8 (3.0%) |
| 65 to 74 Years | 362 (43.7%) | 0 (0.0%) |
| 75 Years and over | 20 (4.4%) | 0 (0.0%) |
| Total | 5,311 (70.8%) | 340 (6.4%) |
Employment Status by Educational Attainment in Boulder Hill
According to labor force statistics for Boulder Hill, 84.6% of individuals (4,076) out of the total population between 25 and 64 years of age (4,818) are in the labor force, with 6.1% or 249 of them being unemployed. The group with the highest labor force participation rate are those with the educational attainment of bachelor's degree or higher, with 97.2% or 827 individuals in the labor force. Within the labor force, individuals with college / associate degree education have the highest percentage of unemployment, with 6.5% or 102 of them being unemployed.
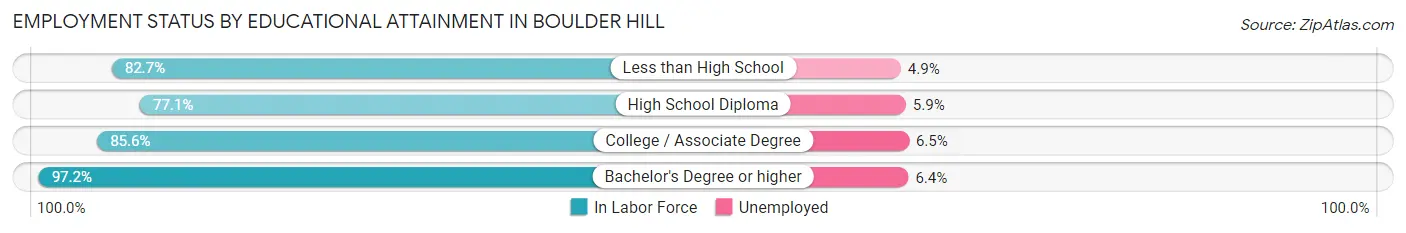
| Educational Attainment | In Labor Force | Unemployed |
| Less than High School | 489 (82.7%) | 29 (4.9%) |
| High School Diploma | 1,194 (77.1%) | 91 (5.9%) |
| College / Associate Degree | 1,564 (85.6%) | 119 (6.5%) |
| Bachelor's Degree or higher | 827 (97.2%) | 54 (6.4%) |
| Total | 4,076 (84.6%) | 294 (6.1%) |
Employment Occupations by Sex in Boulder Hill
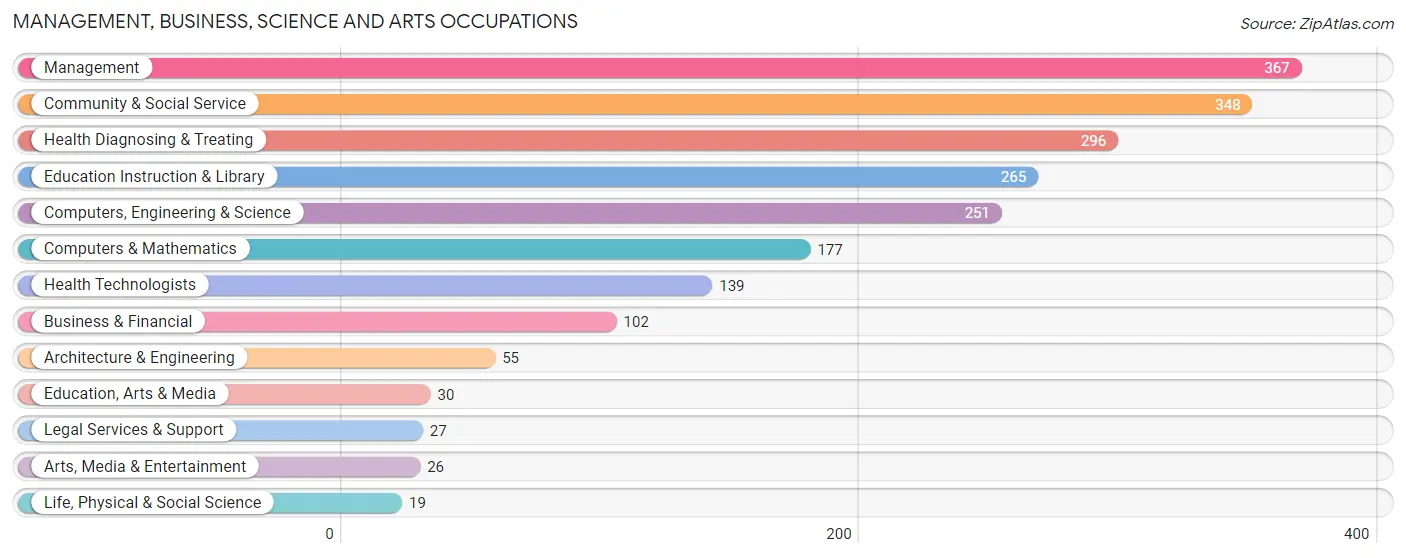
Management, Business, Science and Arts Occupations
The most common Management, Business, Science and Arts occupations in Boulder Hill are Management (367 | 7.4%), Community & Social Service (348 | 7.0%), Health Diagnosing & Treating (296 | 5.9%), Education Instruction & Library (265 | 5.3%), and Computers, Engineering & Science (251 | 5.1%).
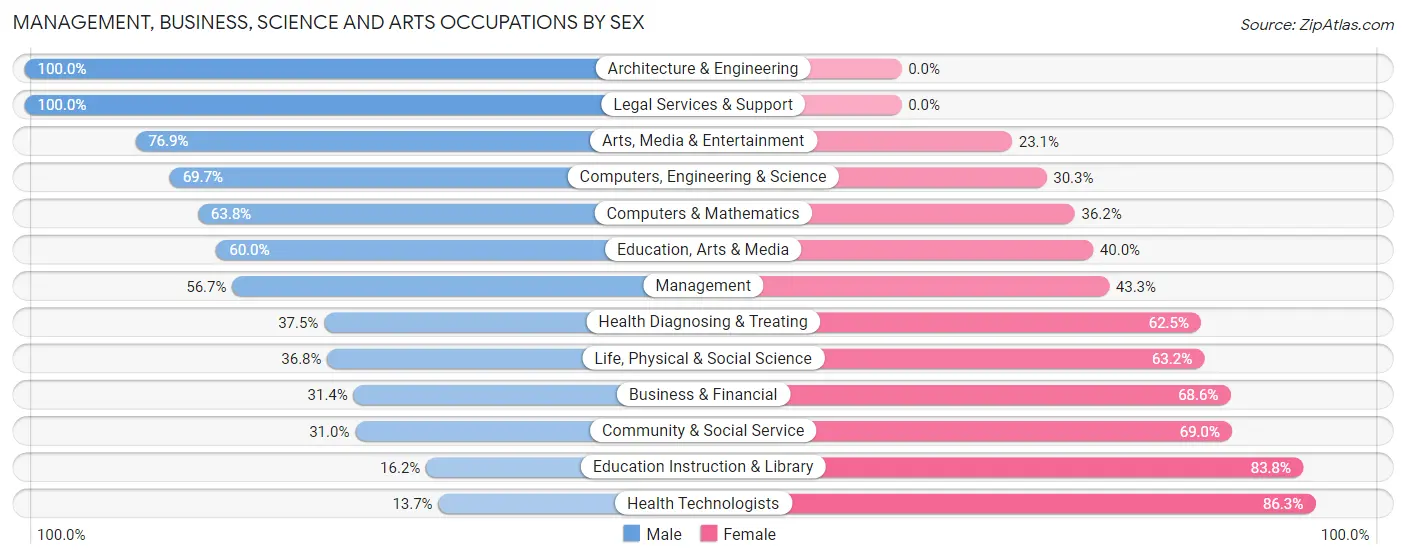
Management, Business, Science and Arts Occupations by Sex
Within the Management, Business, Science and Arts occupations in Boulder Hill, the most male-oriented occupations are Architecture & Engineering (100.0%), Legal Services & Support (100.0%), and Arts, Media & Entertainment (76.9%), while the most female-oriented occupations are Health Technologists (86.3%), Education Instruction & Library (83.8%), and Community & Social Service (69.0%).
| Occupation | Male | Female |
| Management | 208 (56.7%) | 159 (43.3%) |
| Business & Financial | 32 (31.4%) | 70 (68.6%) |
| Computers, Engineering & Science | 175 (69.7%) | 76 (30.3%) |
| Computers & Mathematics | 113 (63.8%) | 64 (36.2%) |
| Architecture & Engineering | 55 (100.0%) | 0 (0.0%) |
| Life, Physical & Social Science | 7 (36.8%) | 12 (63.2%) |
| Community & Social Service | 108 (31.0%) | 240 (69.0%) |
| Education, Arts & Media | 18 (60.0%) | 12 (40.0%) |
| Legal Services & Support | 27 (100.0%) | 0 (0.0%) |
| Education Instruction & Library | 43 (16.2%) | 222 (83.8%) |
| Arts, Media & Entertainment | 20 (76.9%) | 6 (23.1%) |
| Health Diagnosing & Treating | 111 (37.5%) | 185 (62.5%) |
| Health Technologists | 19 (13.7%) | 120 (86.3%) |
| Total (Category) | 634 (46.5%) | 730 (53.5%) |
| Total (Overall) | 2,579 (51.8%) | 2,395 (48.1%) |
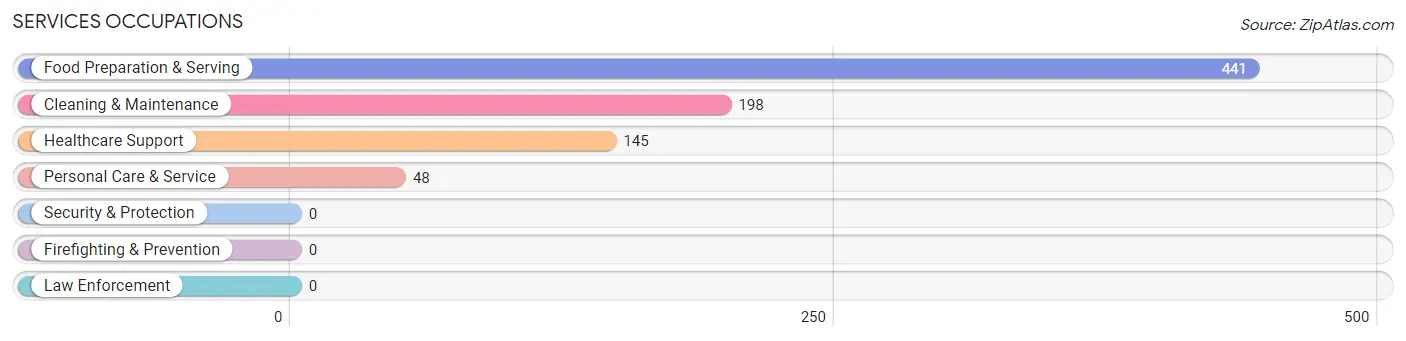
Services Occupations
The most common Services occupations in Boulder Hill are Food Preparation & Serving (441 | 8.9%), Cleaning & Maintenance (198 | 4.0%), Healthcare Support (145 | 2.9%), and Personal Care & Service (48 | 1.0%).
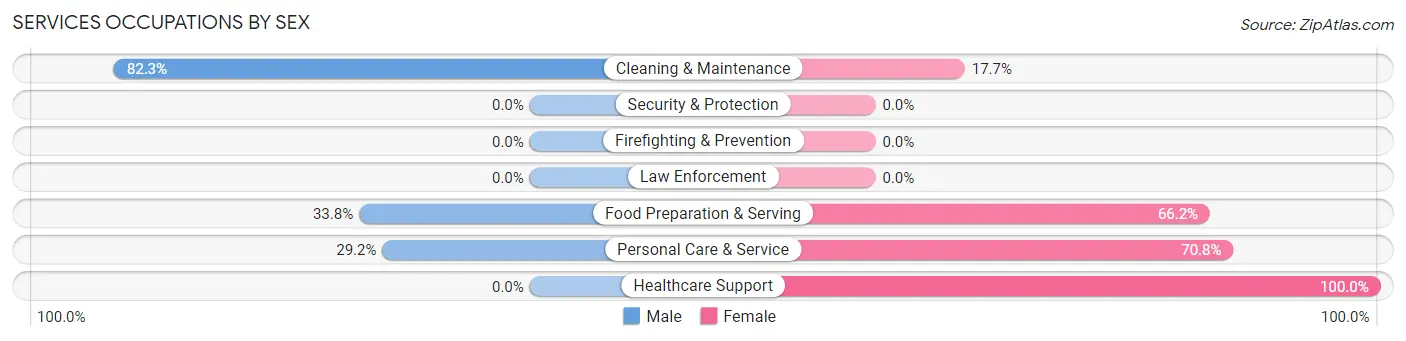
Services Occupations by Sex
Within the Services occupations in Boulder Hill, the most male-oriented occupations are Cleaning & Maintenance (82.3%), Food Preparation & Serving (33.8%), and Personal Care & Service (29.2%), while the most female-oriented occupations are Healthcare Support (100.0%), Personal Care & Service (70.8%), and Food Preparation & Serving (66.2%).
| Occupation | Male | Female |
| Healthcare Support | 0 (0.0%) | 145 (100.0%) |
| Security & Protection | 0 (0.0%) | 0 (0.0%) |
| Firefighting & Prevention | 0 (0.0%) | 0 (0.0%) |
| Law Enforcement | 0 (0.0%) | 0 (0.0%) |
| Food Preparation & Serving | 149 (33.8%) | 292 (66.2%) |
| Cleaning & Maintenance | 163 (82.3%) | 35 (17.7%) |
| Personal Care & Service | 14 (29.2%) | 34 (70.8%) |
| Total (Category) | 326 (39.2%) | 506 (60.8%) |
| Total (Overall) | 2,579 (51.8%) | 2,395 (48.1%) |
Sales and Office Occupations
The most common Sales and Office occupations in Boulder Hill are Office & Administration (655 | 13.2%), and Sales & Related (502 | 10.1%).
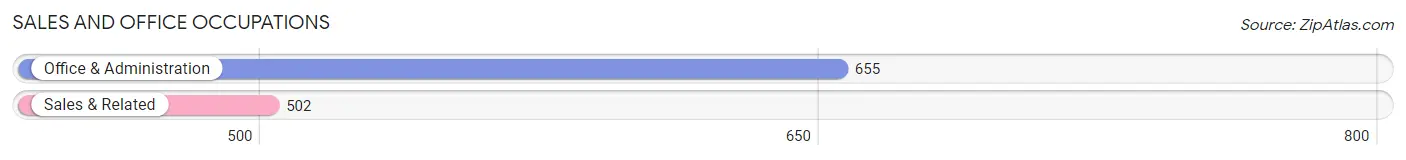
Sales and Office Occupations by Sex

| Occupation | Male | Female |
| Sales & Related | 294 (58.6%) | 208 (41.4%) |
| Office & Administration | 117 (17.9%) | 538 (82.1%) |
| Total (Category) | 411 (35.5%) | 746 (64.5%) |
| Total (Overall) | 2,579 (51.8%) | 2,395 (48.1%) |
Natural Resources, Construction and Maintenance Occupations
The most common Natural Resources, Construction and Maintenance occupations in Boulder Hill are Construction & Extraction (335 | 6.7%), and Installation, Maintenance & Repair (111 | 2.2%).
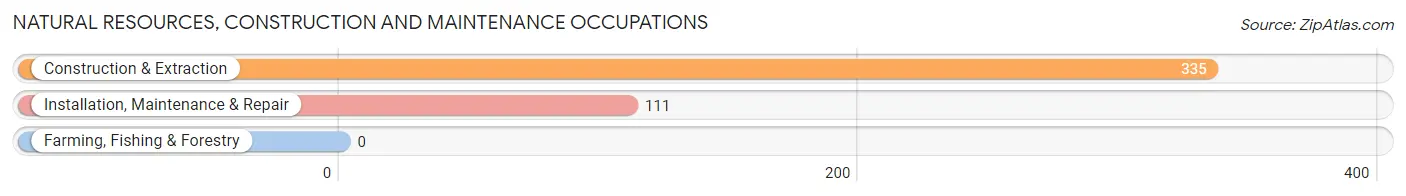
Natural Resources, Construction and Maintenance Occupations by Sex
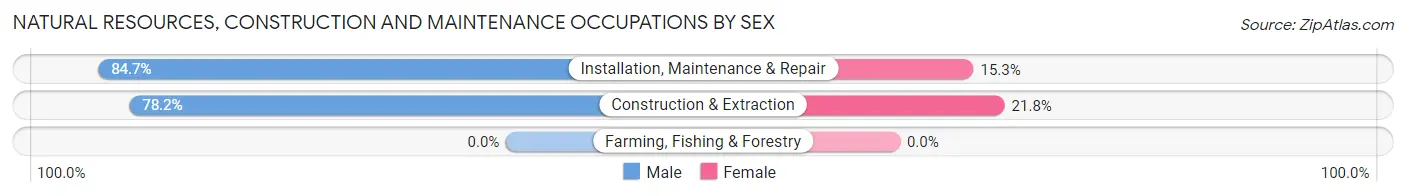
| Occupation | Male | Female |
| Farming, Fishing & Forestry | 0 (0.0%) | 0 (0.0%) |
| Construction & Extraction | 262 (78.2%) | 73 (21.8%) |
| Installation, Maintenance & Repair | 94 (84.7%) | 17 (15.3%) |
| Total (Category) | 356 (79.8%) | 90 (20.2%) |
| Total (Overall) | 2,579 (51.8%) | 2,395 (48.1%) |
Production, Transportation and Moving Occupations
The most common Production, Transportation and Moving occupations in Boulder Hill are Production (520 | 10.4%), Material Moving (493 | 9.9%), and Transportation (162 | 3.3%).
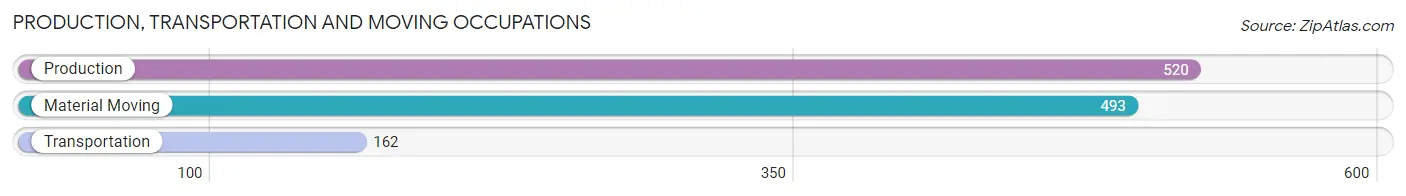
Production, Transportation and Moving Occupations by Sex
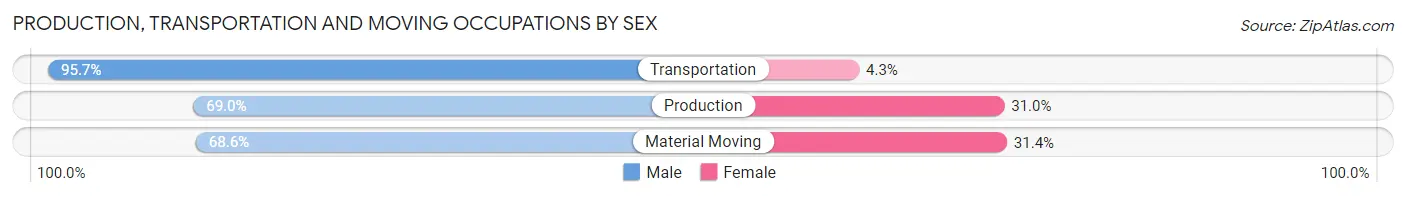
| Occupation | Male | Female |
| Production | 359 (69.0%) | 161 (31.0%) |
| Transportation | 155 (95.7%) | 7 (4.3%) |
| Material Moving | 338 (68.6%) | 155 (31.4%) |
| Total (Category) | 852 (72.5%) | 323 (27.5%) |
| Total (Overall) | 2,579 (51.8%) | 2,395 (48.1%) |
Employment Industries by Sex in Boulder Hill
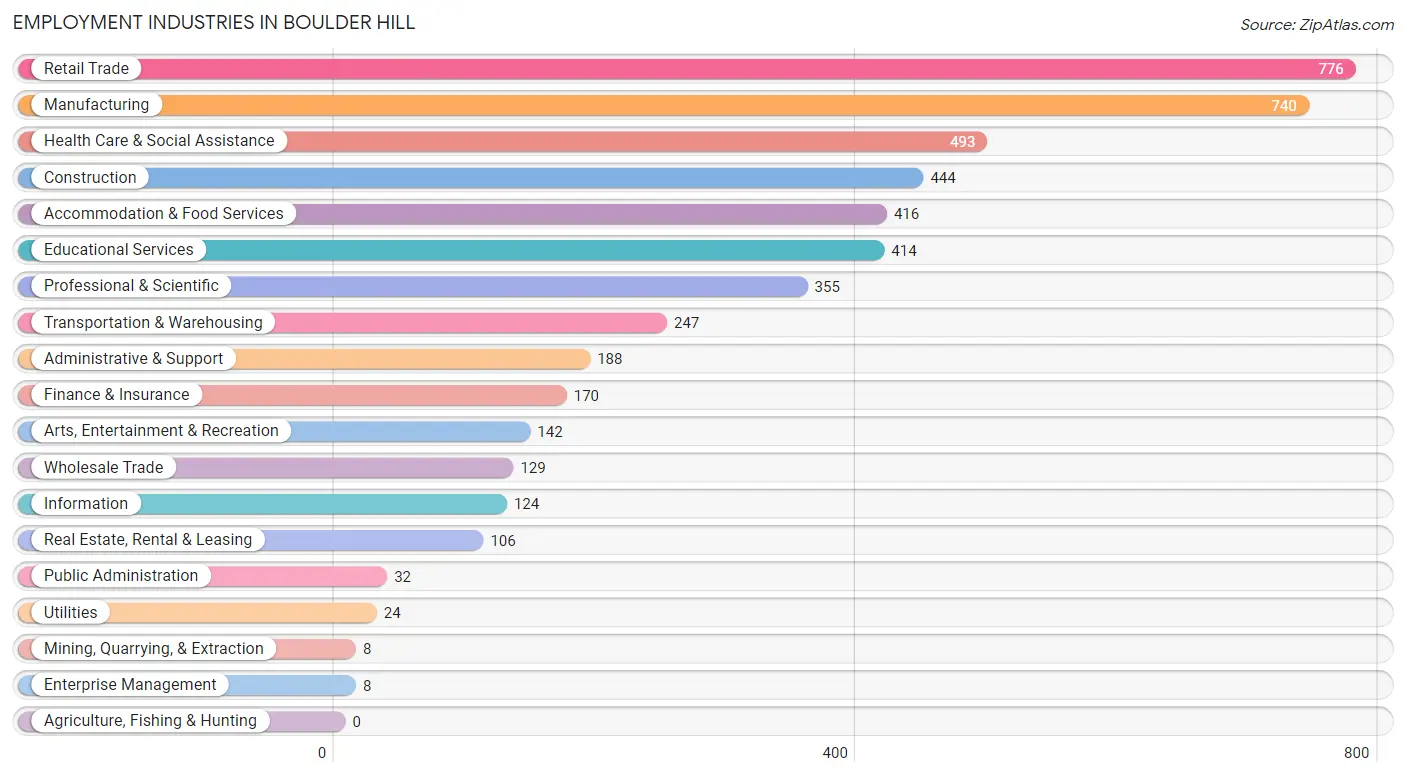
Employment Industries in Boulder Hill
The major employment industries in Boulder Hill include Retail Trade (776 | 15.6%), Manufacturing (740 | 14.9%), Health Care & Social Assistance (493 | 9.9%), Construction (444 | 8.9%), and Accommodation & Food Services (416 | 8.4%).
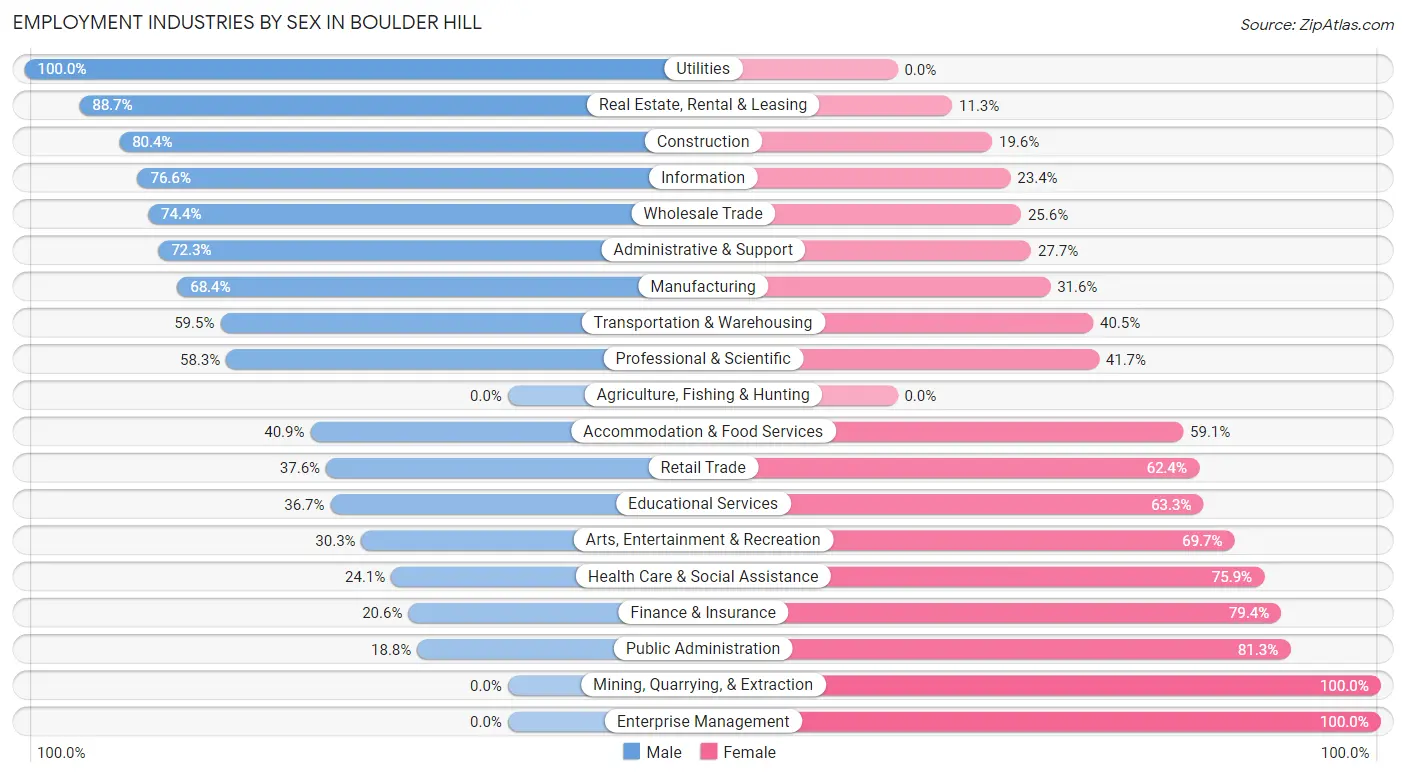
Employment Industries by Sex in Boulder Hill
The Boulder Hill industries that see more men than women are Utilities (100.0%), Real Estate, Rental & Leasing (88.7%), and Construction (80.4%), whereas the industries that tend to have a higher number of women are Mining, Quarrying, & Extraction (100.0%), Enterprise Management (100.0%), and Public Administration (81.2%).
| Industry | Male | Female |
| Agriculture, Fishing & Hunting | 0 (0.0%) | 0 (0.0%) |
| Mining, Quarrying, & Extraction | 0 (0.0%) | 8 (100.0%) |
| Construction | 357 (80.4%) | 87 (19.6%) |
| Manufacturing | 506 (68.4%) | 234 (31.6%) |
| Wholesale Trade | 96 (74.4%) | 33 (25.6%) |
| Retail Trade | 292 (37.6%) | 484 (62.4%) |
| Transportation & Warehousing | 147 (59.5%) | 100 (40.5%) |
| Utilities | 24 (100.0%) | 0 (0.0%) |
| Information | 95 (76.6%) | 29 (23.4%) |
| Finance & Insurance | 35 (20.6%) | 135 (79.4%) |
| Real Estate, Rental & Leasing | 94 (88.7%) | 12 (11.3%) |
| Professional & Scientific | 207 (58.3%) | 148 (41.7%) |
| Enterprise Management | 0 (0.0%) | 8 (100.0%) |
| Administrative & Support | 136 (72.3%) | 52 (27.7%) |
| Educational Services | 152 (36.7%) | 262 (63.3%) |
| Health Care & Social Assistance | 119 (24.1%) | 374 (75.9%) |
| Arts, Entertainment & Recreation | 43 (30.3%) | 99 (69.7%) |
| Accommodation & Food Services | 170 (40.9%) | 246 (59.1%) |
| Public Administration | 6 (18.8%) | 26 (81.2%) |
| Total | 2,579 (51.8%) | 2,395 (48.1%) |
Education in Boulder Hill
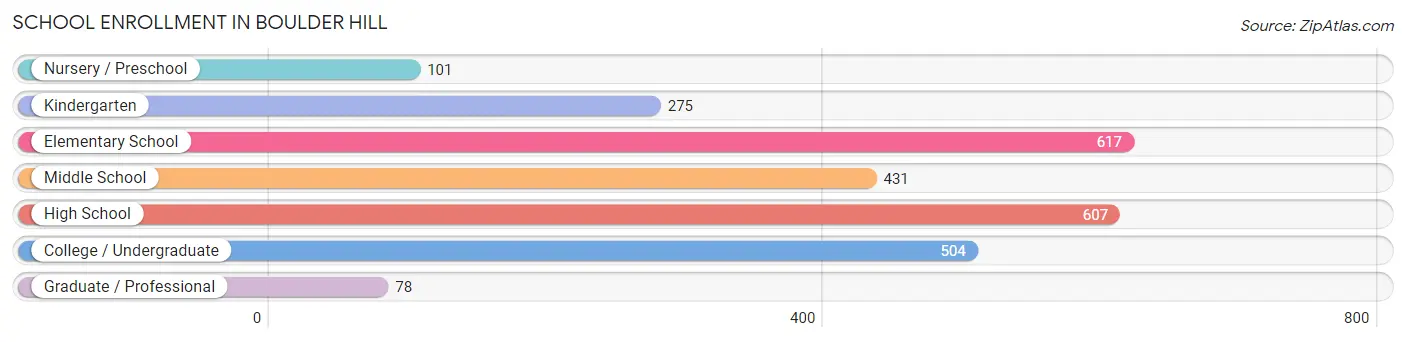
School Enrollment in Boulder Hill
The most common levels of schooling among the 2,613 students in Boulder Hill are elementary school (617 | 23.6%), high school (607 | 23.2%), and college / undergraduate (504 | 19.3%).
| School Level | # Students | % Students |
| Nursery / Preschool | 101 | 3.9% |
| Kindergarten | 275 | 10.5% |
| Elementary School | 617 | 23.6% |
| Middle School | 431 | 16.5% |
| High School | 607 | 23.2% |
| College / Undergraduate | 504 | 19.3% |
| Graduate / Professional | 78 | 3.0% |
| Total | 2,613 | 100.0% |
School Enrollment by Age by Funding Source in Boulder Hill
Out of a total of 2,613 students who are enrolled in schools in Boulder Hill, 253 (9.7%) attend a private institution, while the remaining 2,360 (90.3%) are enrolled in public schools. The age group of 20 to 24 year olds has the highest likelihood of being enrolled in private schools, with 147 (48.0% in the age bracket) enrolled. Conversely, the age group of 15 to 17 year olds has the lowest likelihood of being enrolled in a private school, with 541 (100.0% in the age bracket) attending a public institution.
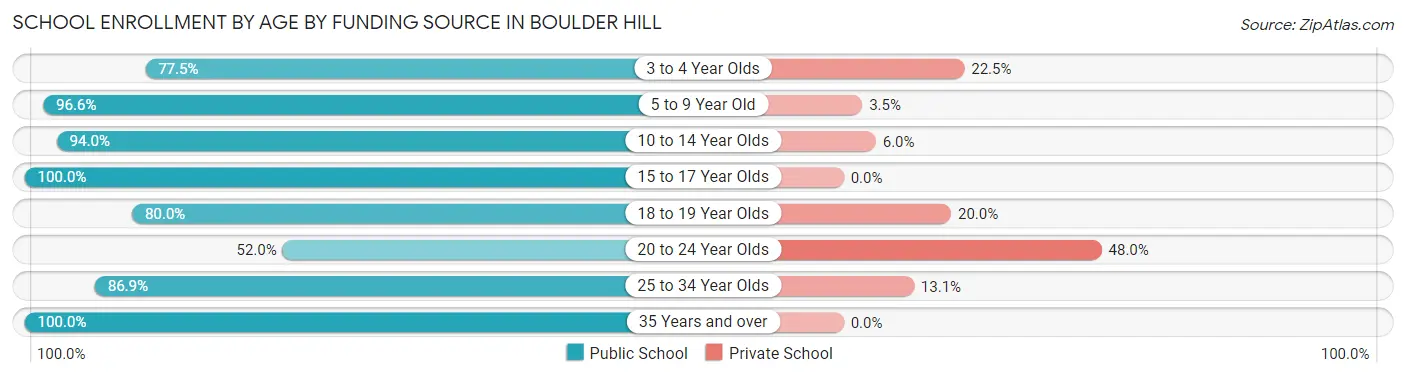
| Age Bracket | Public School | Private School |
| 3 to 4 Year Olds | 69 (77.5%) | 20 (22.5%) |
| 5 to 9 Year Old | 811 (96.6%) | 29 (3.5%) |
| 10 to 14 Year Olds | 503 (94.0%) | 32 (6.0%) |
| 15 to 17 Year Olds | 541 (100.0%) | 0 (0.0%) |
| 18 to 19 Year Olds | 48 (80.0%) | 12 (20.0%) |
| 20 to 24 Year Olds | 159 (52.0%) | 147 (48.0%) |
| 25 to 34 Year Olds | 93 (86.9%) | 14 (13.1%) |
| 35 Years and over | 135 (100.0%) | 0 (0.0%) |
| Total | 2,360 (90.3%) | 253 (9.7%) |
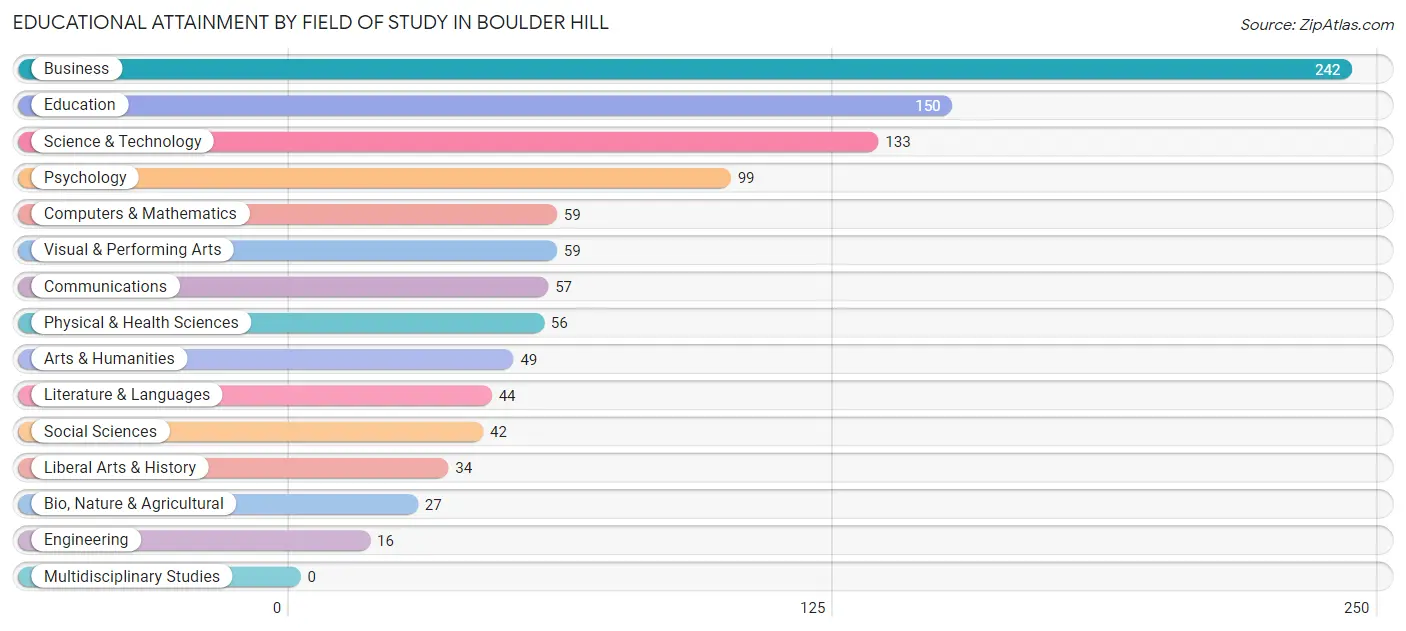
Educational Attainment by Field of Study in Boulder Hill
Business (242 | 22.7%), education (150 | 14.1%), science & technology (133 | 12.5%), psychology (99 | 9.3%), and computers & mathematics (59 | 5.5%) are the most common fields of study among 1,067 individuals in Boulder Hill who have obtained a bachelor's degree or higher.
| Field of Study | # Graduates | % Graduates |
| Computers & Mathematics | 59 | 5.5% |
| Bio, Nature & Agricultural | 27 | 2.5% |
| Physical & Health Sciences | 56 | 5.2% |
| Psychology | 99 | 9.3% |
| Social Sciences | 42 | 3.9% |
| Engineering | 16 | 1.5% |
| Multidisciplinary Studies | 0 | 0.0% |
| Science & Technology | 133 | 12.5% |
| Business | 242 | 22.7% |
| Education | 150 | 14.1% |
| Literature & Languages | 44 | 4.1% |
| Liberal Arts & History | 34 | 3.2% |
| Visual & Performing Arts | 59 | 5.5% |
| Communications | 57 | 5.3% |
| Arts & Humanities | 49 | 4.6% |
| Total | 1,067 | 100.0% |
Transportation & Commute in Boulder Hill
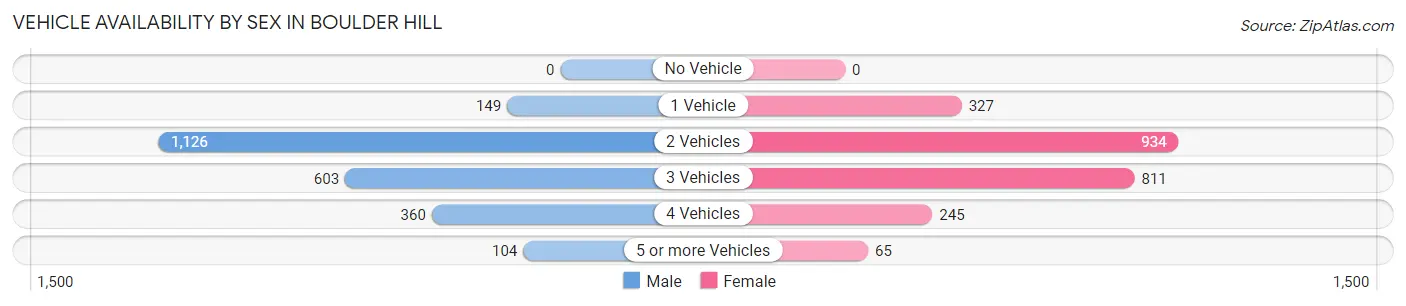
Vehicle Availability by Sex in Boulder Hill
The most prevalent vehicle ownership categories in Boulder Hill are males with 2 vehicles (1,126, accounting for 48.1%) and females with 2 vehicles (934, making up 47.3%).
| Vehicles Available | Male | Female |
| No Vehicle | 0 (0.0%) | 0 (0.0%) |
| 1 Vehicle | 149 (6.4%) | 327 (13.7%) |
| 2 Vehicles | 1,126 (48.1%) | 934 (39.2%) |
| 3 Vehicles | 603 (25.8%) | 811 (34.1%) |
| 4 Vehicles | 360 (15.4%) | 245 (10.3%) |
| 5 or more Vehicles | 104 (4.4%) | 65 (2.7%) |
| Total | 2,342 (100.0%) | 2,382 (100.0%) |
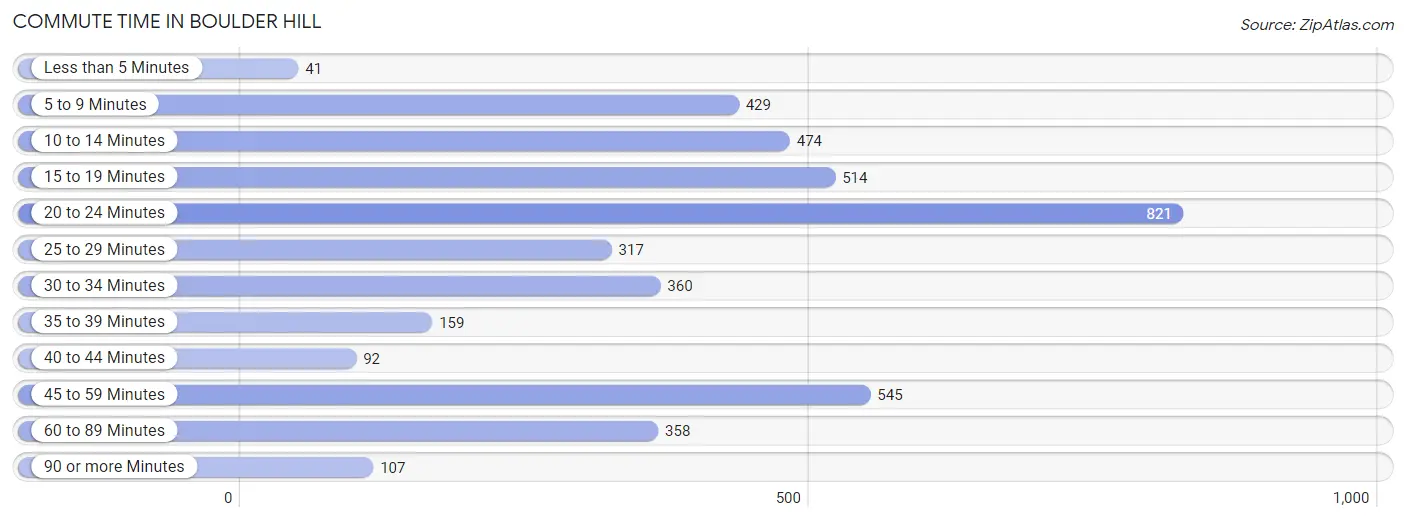
Commute Time in Boulder Hill
The most frequently occuring commute durations in Boulder Hill are 20 to 24 minutes (821 commuters, 19.5%), 45 to 59 minutes (545 commuters, 12.9%), and 15 to 19 minutes (514 commuters, 12.2%).
| Commute Time | # Commuters | % Commuters |
| Less than 5 Minutes | 41 | 1.0% |
| 5 to 9 Minutes | 429 | 10.2% |
| 10 to 14 Minutes | 474 | 11.2% |
| 15 to 19 Minutes | 514 | 12.2% |
| 20 to 24 Minutes | 821 | 19.5% |
| 25 to 29 Minutes | 317 | 7.5% |
| 30 to 34 Minutes | 360 | 8.5% |
| 35 to 39 Minutes | 159 | 3.8% |
| 40 to 44 Minutes | 92 | 2.2% |
| 45 to 59 Minutes | 545 | 12.9% |
| 60 to 89 Minutes | 358 | 8.5% |
| 90 or more Minutes | 107 | 2.5% |
Commute Time by Sex in Boulder Hill
The most common commute times in Boulder Hill are 45 to 59 minutes (355 commuters, 17.2%) for males and 20 to 24 minutes (481 commuters, 22.4%) for females.
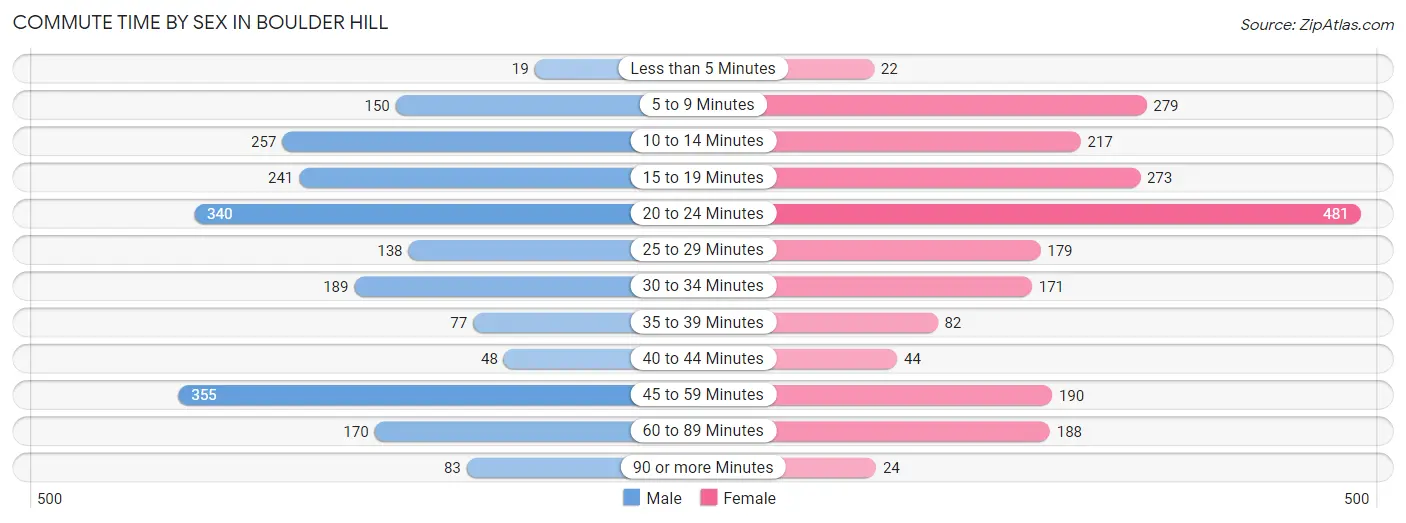
| Commute Time | Male | Female |
| Less than 5 Minutes | 19 (0.9%) | 22 (1.0%) |
| 5 to 9 Minutes | 150 (7.3%) | 279 (13.0%) |
| 10 to 14 Minutes | 257 (12.4%) | 217 (10.1%) |
| 15 to 19 Minutes | 241 (11.7%) | 273 (12.7%) |
| 20 to 24 Minutes | 340 (16.5%) | 481 (22.4%) |
| 25 to 29 Minutes | 138 (6.7%) | 179 (8.3%) |
| 30 to 34 Minutes | 189 (9.1%) | 171 (8.0%) |
| 35 to 39 Minutes | 77 (3.7%) | 82 (3.8%) |
| 40 to 44 Minutes | 48 (2.3%) | 44 (2.1%) |
| 45 to 59 Minutes | 355 (17.2%) | 190 (8.8%) |
| 60 to 89 Minutes | 170 (8.2%) | 188 (8.7%) |
| 90 or more Minutes | 83 (4.0%) | 24 (1.1%) |
Time of Departure to Work by Sex in Boulder Hill
The most frequent times of departure to work in Boulder Hill are 12:00 AM to 4:59 AM (285, 13.8%) for males and 5:00 AM to 5:29 AM (263, 12.2%) for females.
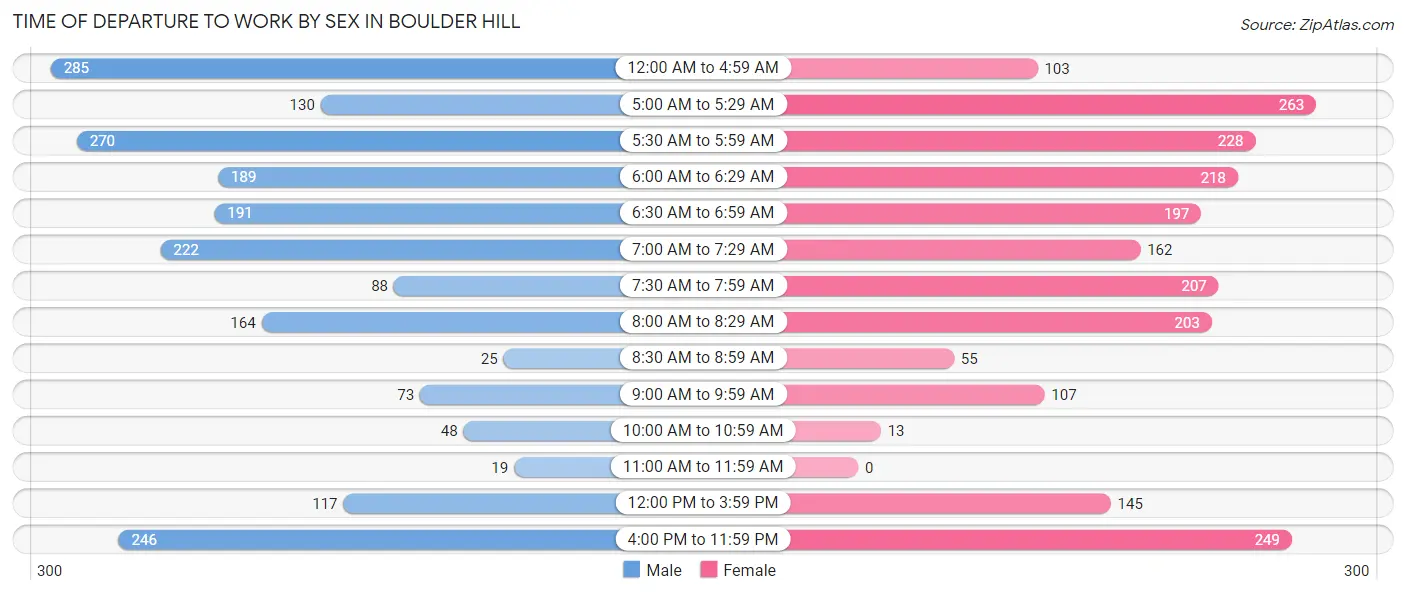
| Time of Departure | Male | Female |
| 12:00 AM to 4:59 AM | 285 (13.8%) | 103 (4.8%) |
| 5:00 AM to 5:29 AM | 130 (6.3%) | 263 (12.2%) |
| 5:30 AM to 5:59 AM | 270 (13.1%) | 228 (10.6%) |
| 6:00 AM to 6:29 AM | 189 (9.1%) | 218 (10.1%) |
| 6:30 AM to 6:59 AM | 191 (9.2%) | 197 (9.2%) |
| 7:00 AM to 7:29 AM | 222 (10.7%) | 162 (7.5%) |
| 7:30 AM to 7:59 AM | 88 (4.3%) | 207 (9.6%) |
| 8:00 AM to 8:29 AM | 164 (7.9%) | 203 (9.4%) |
| 8:30 AM to 8:59 AM | 25 (1.2%) | 55 (2.6%) |
| 9:00 AM to 9:59 AM | 73 (3.5%) | 107 (5.0%) |
| 10:00 AM to 10:59 AM | 48 (2.3%) | 13 (0.6%) |
| 11:00 AM to 11:59 AM | 19 (0.9%) | 0 (0.0%) |
| 12:00 PM to 3:59 PM | 117 (5.7%) | 145 (6.7%) |
| 4:00 PM to 11:59 PM | 246 (11.9%) | 249 (11.6%) |
| Total | 2,067 (100.0%) | 2,150 (100.0%) |
Housing Occupancy in Boulder Hill
Occupancy by Ownership in Boulder Hill
Of the total 3,035 dwellings in Boulder Hill, owner-occupied units account for 2,440 (80.4%), while renter-occupied units make up 595 (19.6%).
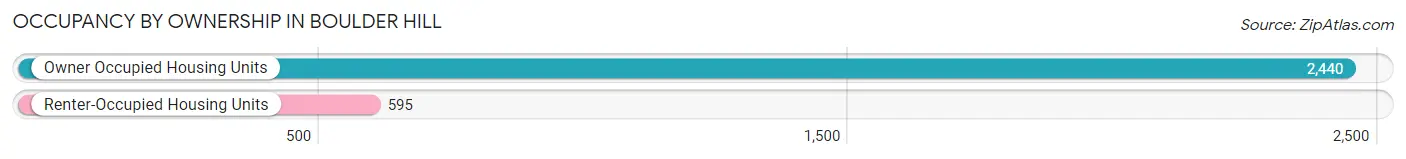
| Occupancy | # Housing Units | % Housing Units |
| Owner Occupied Housing Units | 2,440 | 80.4% |
| Renter-Occupied Housing Units | 595 | 19.6% |
| Total Occupied Housing Units | 3,035 | 100.0% |
Occupancy by Household Size in Boulder Hill
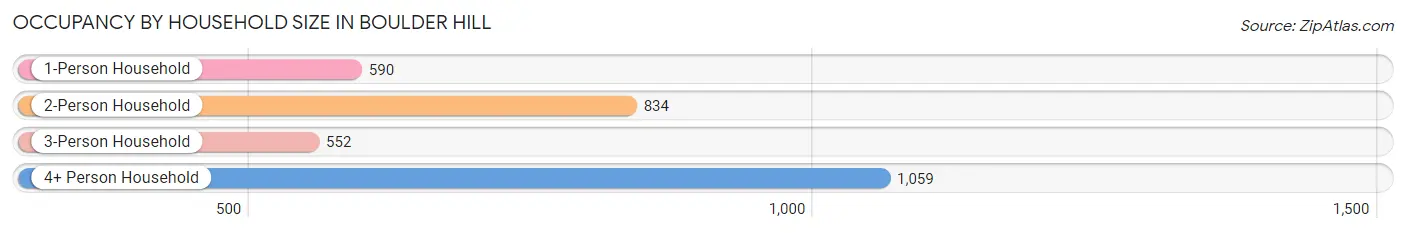
| Household Size | # Housing Units | % Housing Units |
| 1-Person Household | 590 | 19.4% |
| 2-Person Household | 834 | 27.5% |
| 3-Person Household | 552 | 18.2% |
| 4+ Person Household | 1,059 | 34.9% |
| Total Housing Units | 3,035 | 100.0% |
Occupancy by Ownership by Household Size in Boulder Hill
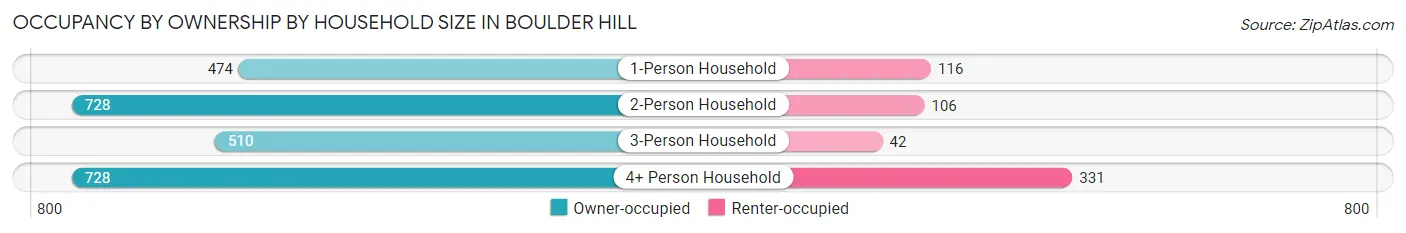
| Household Size | Owner-occupied | Renter-occupied |
| 1-Person Household | 474 (80.3%) | 116 (19.7%) |
| 2-Person Household | 728 (87.3%) | 106 (12.7%) |
| 3-Person Household | 510 (92.4%) | 42 (7.6%) |
| 4+ Person Household | 728 (68.7%) | 331 (31.3%) |
| Total Housing Units | 2,440 (80.4%) | 595 (19.6%) |
Occupancy by Educational Attainment in Boulder Hill
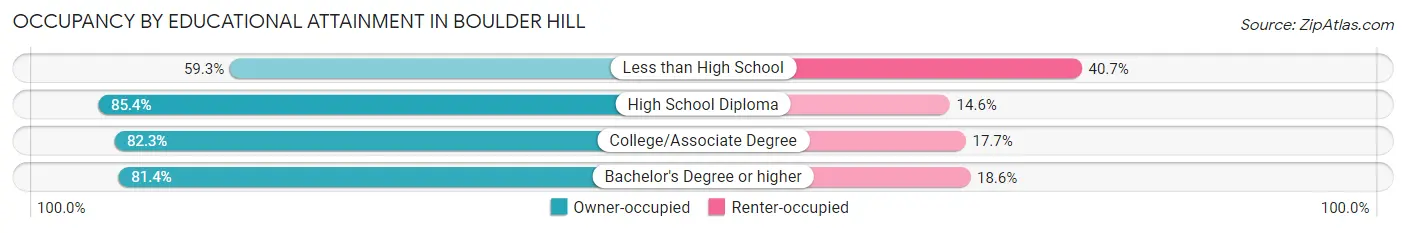
| Household Size | Owner-occupied | Renter-occupied |
| Less than High School | 198 (59.3%) | 136 (40.7%) |
| High School Diploma | 692 (85.4%) | 118 (14.6%) |
| College/Associate Degree | 1,012 (82.3%) | 218 (17.7%) |
| Bachelor's Degree or higher | 538 (81.4%) | 123 (18.6%) |
Occupancy by Age of Householder in Boulder Hill
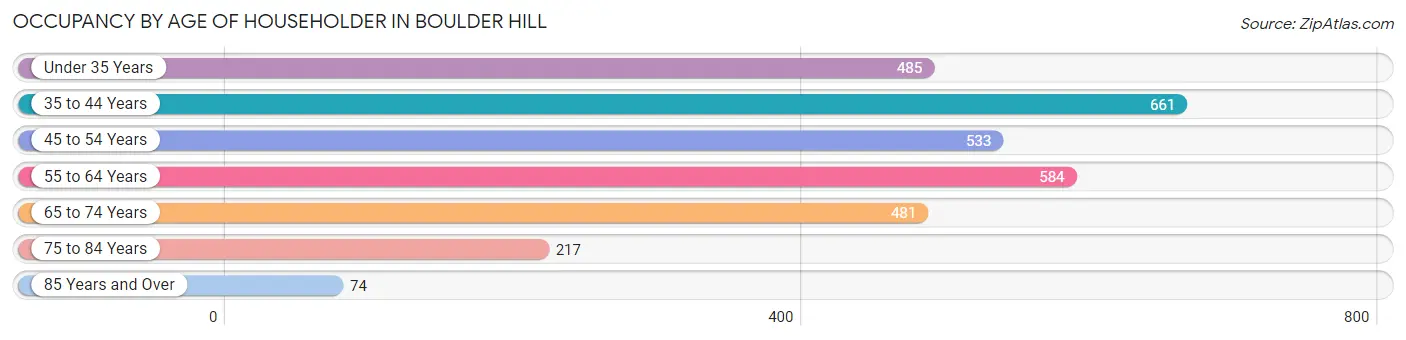
| Age Bracket | # Households | % Households |
| Under 35 Years | 485 | 16.0% |
| 35 to 44 Years | 661 | 21.8% |
| 45 to 54 Years | 533 | 17.6% |
| 55 to 64 Years | 584 | 19.2% |
| 65 to 74 Years | 481 | 15.9% |
| 75 to 84 Years | 217 | 7.1% |
| 85 Years and Over | 74 | 2.4% |
| Total | 3,035 | 100.0% |
Housing Finances in Boulder Hill
Median Income by Occupancy in Boulder Hill
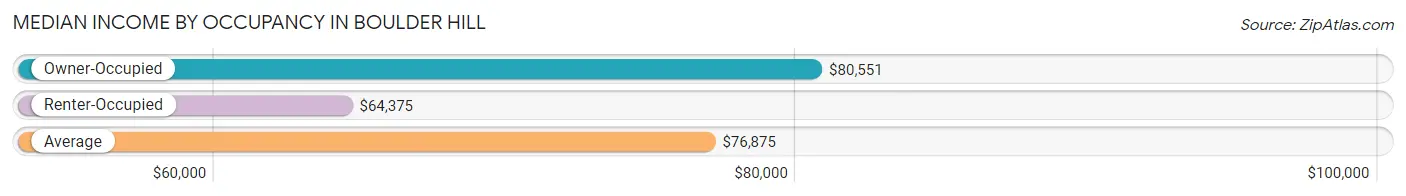
| Occupancy Type | # Households | Median Income |
| Owner-Occupied | 2,440 (80.4%) | $80,551 |
| Renter-Occupied | 595 (19.6%) | $64,375 |
| Average | 3,035 (100.0%) | $76,875 |
Occupancy by Householder Income Bracket in Boulder Hill
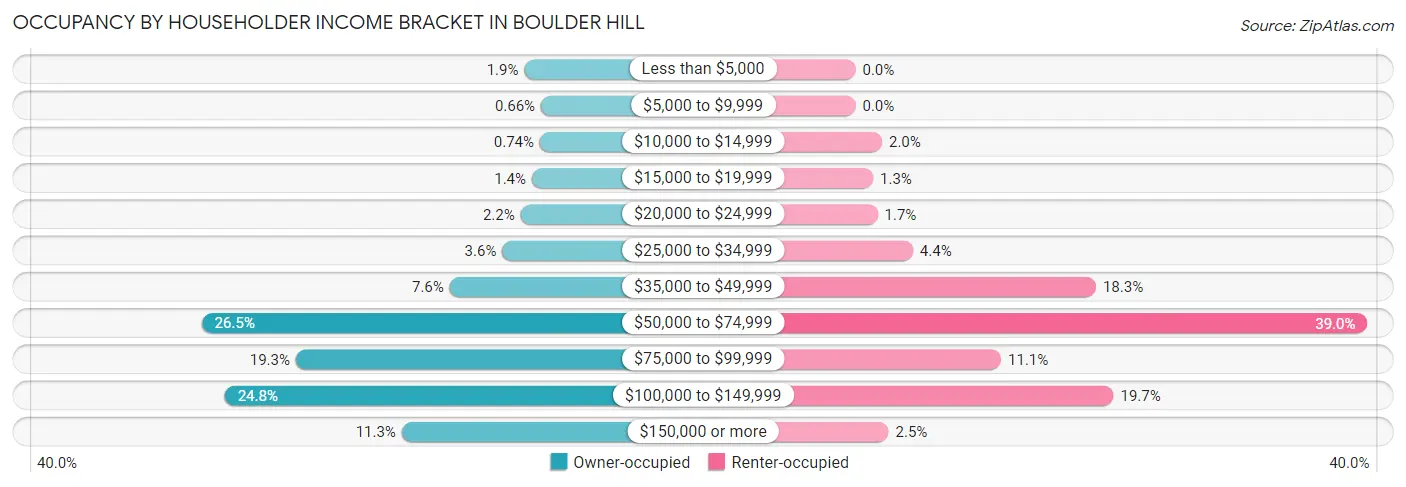
| Income Bracket | Owner-occupied | Renter-occupied |
| Less than $5,000 | 47 (1.9%) | 0 (0.0%) |
| $5,000 to $9,999 | 16 (0.7%) | 0 (0.0%) |
| $10,000 to $14,999 | 18 (0.7%) | 12 (2.0%) |
| $15,000 to $19,999 | 33 (1.3%) | 8 (1.3%) |
| $20,000 to $24,999 | 54 (2.2%) | 10 (1.7%) |
| $25,000 to $34,999 | 88 (3.6%) | 26 (4.4%) |
| $35,000 to $49,999 | 186 (7.6%) | 109 (18.3%) |
| $50,000 to $74,999 | 647 (26.5%) | 232 (39.0%) |
| $75,000 to $99,999 | 472 (19.3%) | 66 (11.1%) |
| $100,000 to $149,999 | 604 (24.7%) | 117 (19.7%) |
| $150,000 or more | 275 (11.3%) | 15 (2.5%) |
| Total | 2,440 (100.0%) | 595 (100.0%) |
Monthly Housing Cost Tiers in Boulder Hill
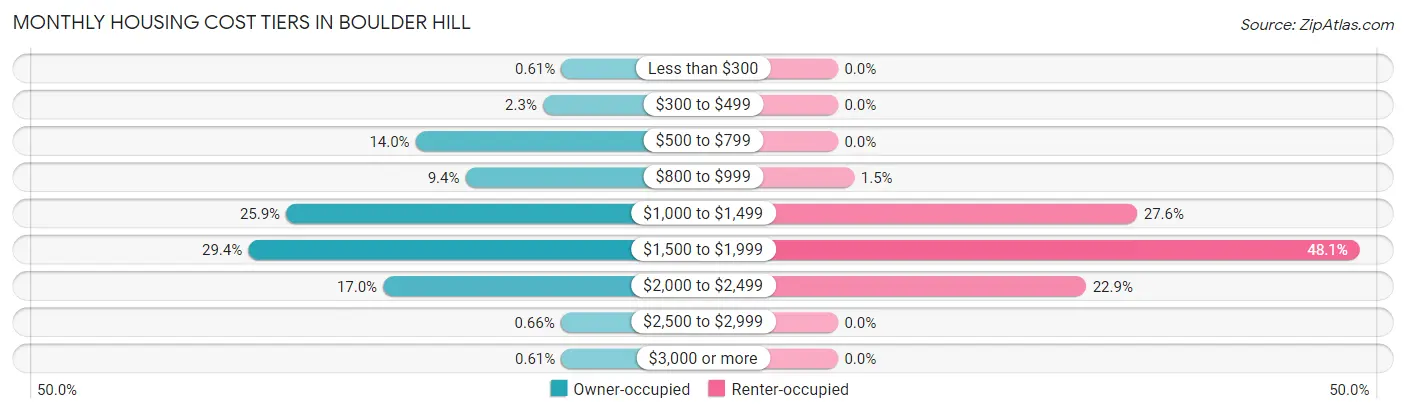
| Monthly Cost | Owner-occupied | Renter-occupied |
| Less than $300 | 15 (0.6%) | 0 (0.0%) |
| $300 to $499 | 56 (2.3%) | 0 (0.0%) |
| $500 to $799 | 342 (14.0%) | 0 (0.0%) |
| $800 to $999 | 230 (9.4%) | 9 (1.5%) |
| $1,000 to $1,499 | 633 (25.9%) | 164 (27.6%) |
| $1,500 to $1,999 | 718 (29.4%) | 286 (48.1%) |
| $2,000 to $2,499 | 415 (17.0%) | 136 (22.9%) |
| $2,500 to $2,999 | 16 (0.7%) | 0 (0.0%) |
| $3,000 or more | 15 (0.6%) | 0 (0.0%) |
| Total | 2,440 (100.0%) | 595 (100.0%) |
Physical Housing Characteristics in Boulder Hill
Housing Structures in Boulder Hill
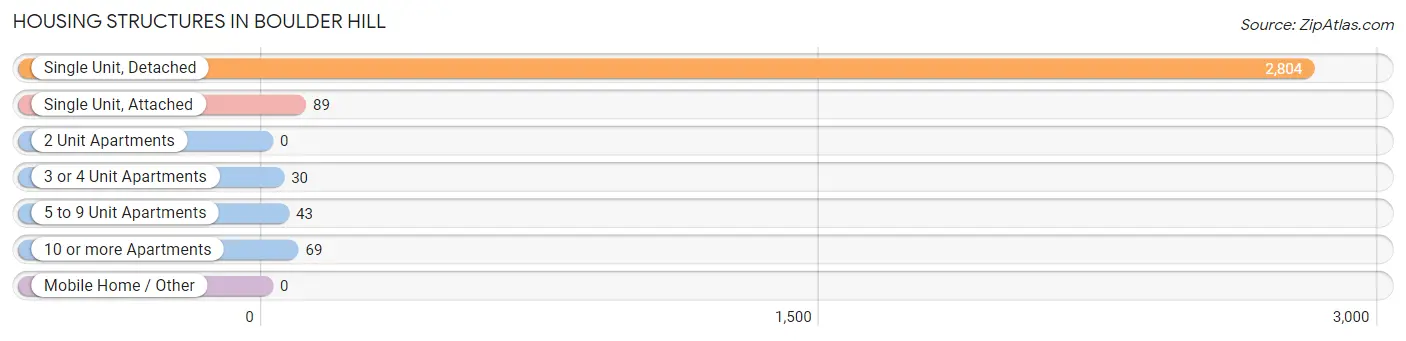
| Structure Type | # Housing Units | % Housing Units |
| Single Unit, Detached | 2,804 | 92.4% |
| Single Unit, Attached | 89 | 2.9% |
| 2 Unit Apartments | 0 | 0.0% |
| 3 or 4 Unit Apartments | 30 | 1.0% |
| 5 to 9 Unit Apartments | 43 | 1.4% |
| 10 or more Apartments | 69 | 2.3% |
| Mobile Home / Other | 0 | 0.0% |
| Total | 3,035 | 100.0% |
Housing Structures by Occupancy in Boulder Hill
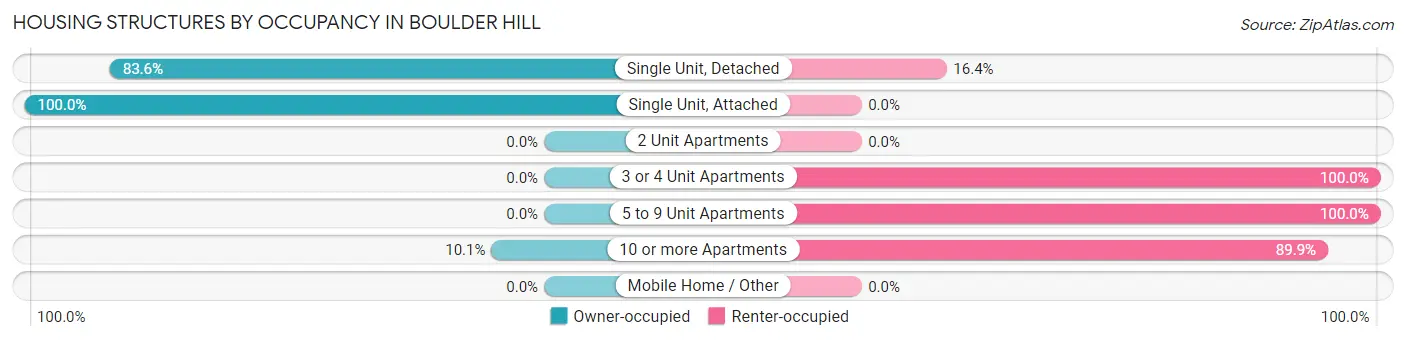
| Structure Type | Owner-occupied | Renter-occupied |
| Single Unit, Detached | 2,344 (83.6%) | 460 (16.4%) |
| Single Unit, Attached | 89 (100.0%) | 0 (0.0%) |
| 2 Unit Apartments | 0 (0.0%) | 0 (0.0%) |
| 3 or 4 Unit Apartments | 0 (0.0%) | 30 (100.0%) |
| 5 to 9 Unit Apartments | 0 (0.0%) | 43 (100.0%) |
| 10 or more Apartments | 7 (10.1%) | 62 (89.9%) |
| Mobile Home / Other | 0 (0.0%) | 0 (0.0%) |
| Total | 2,440 (80.4%) | 595 (19.6%) |
Housing Structures by Number of Rooms in Boulder Hill
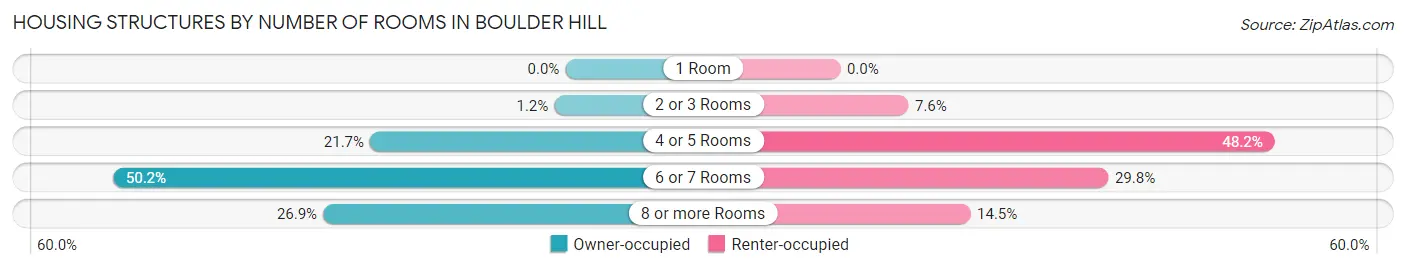
| Number of Rooms | Owner-occupied | Renter-occupied |
| 1 Room | 0 (0.0%) | 0 (0.0%) |
| 2 or 3 Rooms | 30 (1.2%) | 45 (7.6%) |
| 4 or 5 Rooms | 529 (21.7%) | 287 (48.2%) |
| 6 or 7 Rooms | 1,225 (50.2%) | 177 (29.7%) |
| 8 or more Rooms | 656 (26.9%) | 86 (14.4%) |
| Total | 2,440 (100.0%) | 595 (100.0%) |
Housing Structure by Heating Type in Boulder Hill
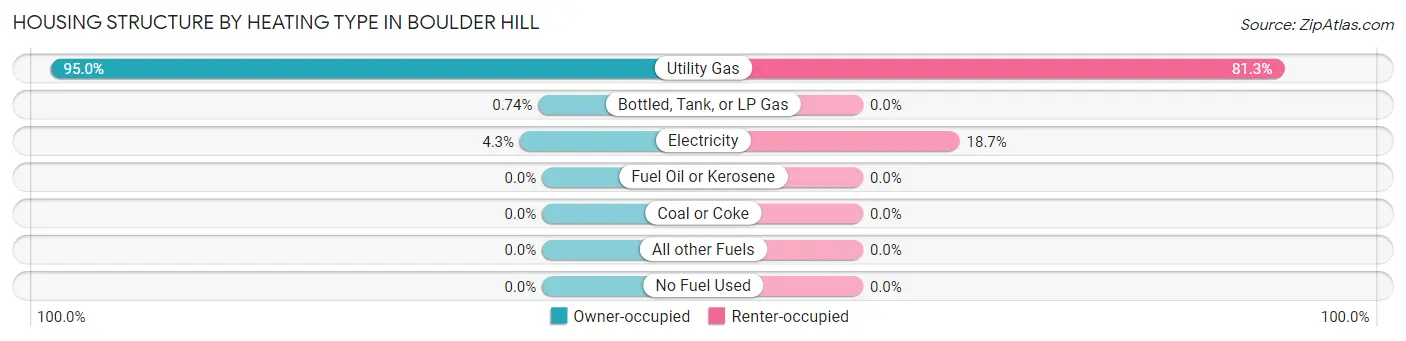
| Heating Type | Owner-occupied | Renter-occupied |
| Utility Gas | 2,317 (95.0%) | 484 (81.3%) |
| Bottled, Tank, or LP Gas | 18 (0.7%) | 0 (0.0%) |
| Electricity | 105 (4.3%) | 111 (18.7%) |
| Fuel Oil or Kerosene | 0 (0.0%) | 0 (0.0%) |
| Coal or Coke | 0 (0.0%) | 0 (0.0%) |
| All other Fuels | 0 (0.0%) | 0 (0.0%) |
| No Fuel Used | 0 (0.0%) | 0 (0.0%) |
| Total | 2,440 (100.0%) | 595 (100.0%) |
Household Vehicle Usage in Boulder Hill
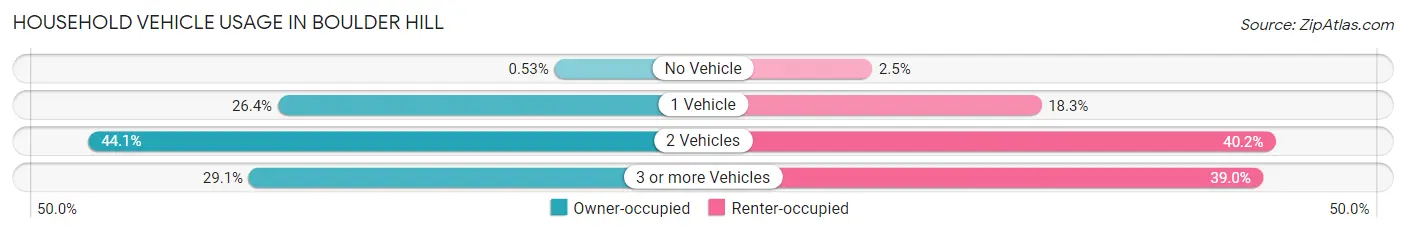
| Vehicles per Household | Owner-occupied | Renter-occupied |
| No Vehicle | 13 (0.5%) | 15 (2.5%) |
| 1 Vehicle | 643 (26.4%) | 109 (18.3%) |
| 2 Vehicles | 1,075 (44.1%) | 239 (40.2%) |
| 3 or more Vehicles | 709 (29.1%) | 232 (39.0%) |
| Total | 2,440 (100.0%) | 595 (100.0%) |
Real Estate & Mortgages in Boulder Hill
Real Estate and Mortgage Overview in Boulder Hill
| Characteristic | Without Mortgage | With Mortgage |
| Housing Units | 556 | 1,884 |
| Median Property Value | $199,300 | $218,100 |
| Median Household Income | $94,500 | $233 |
| Monthly Housing Costs | $668 | $15 |
| Real Estate Taxes | $4,550 | $28 |
Property Value by Mortgage Status in Boulder Hill
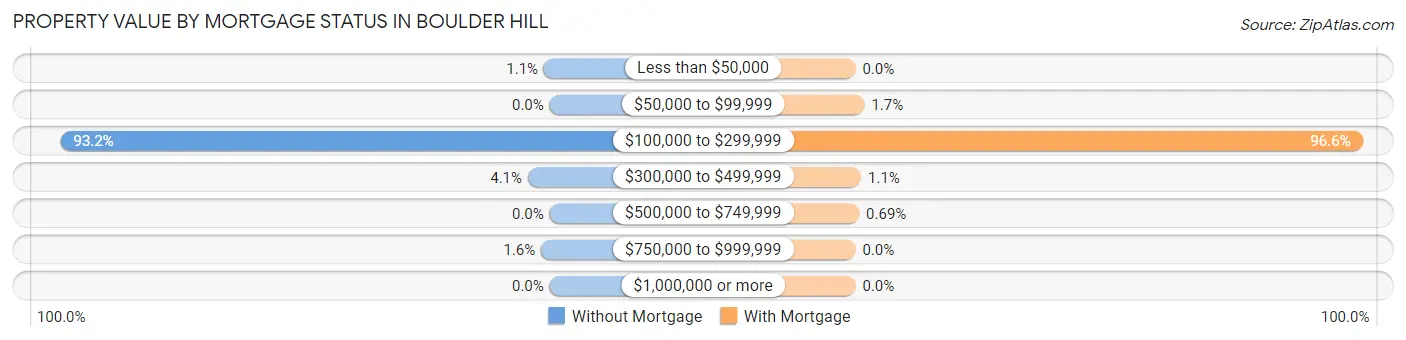
| Property Value | Without Mortgage | With Mortgage |
| Less than $50,000 | 6 (1.1%) | 0 (0.0%) |
| $50,000 to $99,999 | 0 (0.0%) | 32 (1.7%) |
| $100,000 to $299,999 | 518 (93.2%) | 1,819 (96.6%) |
| $300,000 to $499,999 | 23 (4.1%) | 20 (1.1%) |
| $500,000 to $749,999 | 0 (0.0%) | 13 (0.7%) |
| $750,000 to $999,999 | 9 (1.6%) | 0 (0.0%) |
| $1,000,000 or more | 0 (0.0%) | 0 (0.0%) |
| Total | 556 (100.0%) | 1,884 (100.0%) |
Household Income by Mortgage Status in Boulder Hill
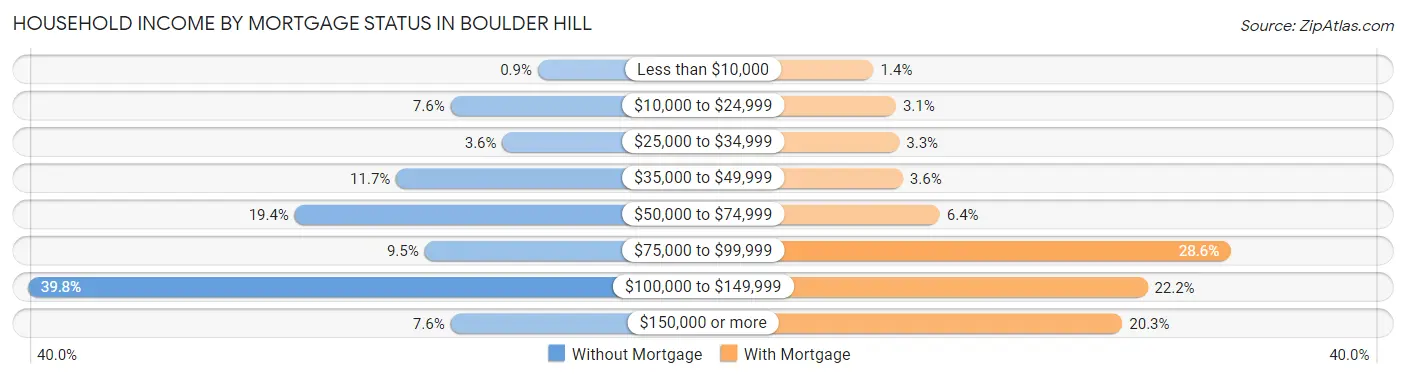
| Household Income | Without Mortgage | With Mortgage |
| Less than $10,000 | 5 (0.9%) | 26 (1.4%) |
| $10,000 to $24,999 | 42 (7.5%) | 58 (3.1%) |
| $25,000 to $34,999 | 20 (3.6%) | 63 (3.3%) |
| $35,000 to $49,999 | 65 (11.7%) | 68 (3.6%) |
| $50,000 to $74,999 | 108 (19.4%) | 121 (6.4%) |
| $75,000 to $99,999 | 53 (9.5%) | 539 (28.6%) |
| $100,000 to $149,999 | 221 (39.8%) | 419 (22.2%) |
| $150,000 or more | 42 (7.5%) | 383 (20.3%) |
| Total | 556 (100.0%) | 1,884 (100.0%) |
Property Value to Household Income Ratio in Boulder Hill
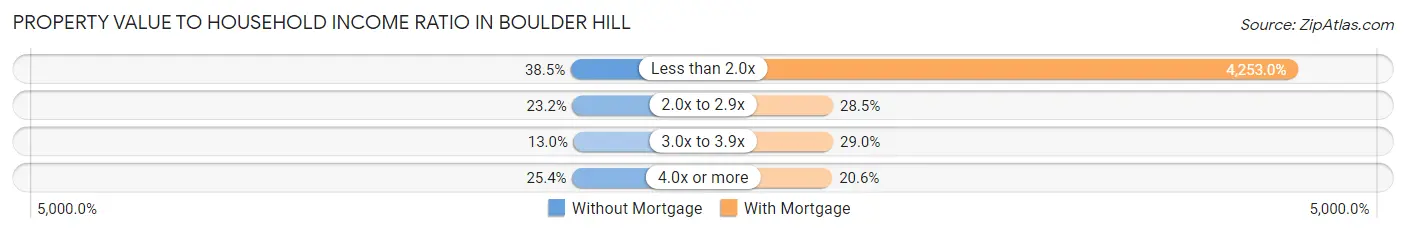
| Value-to-Income Ratio | Without Mortgage | With Mortgage |
| Less than 2.0x | 214 (38.5%) | 80,127 (4,253.0%) |
| 2.0x to 2.9x | 129 (23.2%) | 537 (28.5%) |
| 3.0x to 3.9x | 72 (13.0%) | 547 (29.0%) |
| 4.0x or more | 141 (25.4%) | 388 (20.6%) |
| Total | 556 (100.0%) | 1,884 (100.0%) |
Real Estate Taxes by Mortgage Status in Boulder Hill
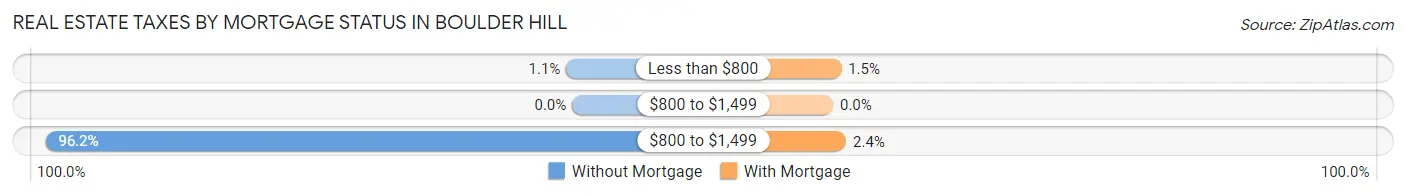
| Property Taxes | Without Mortgage | With Mortgage |
| Less than $800 | 6 (1.1%) | 28 (1.5%) |
| $800 to $1,499 | 0 (0.0%) | 0 (0.0%) |
| $800 to $1,499 | 535 (96.2%) | 45 (2.4%) |
| Total | 556 (100.0%) | 1,884 (100.0%) |
Health & Disability in Boulder Hill
Health Insurance Coverage by Age in Boulder Hill
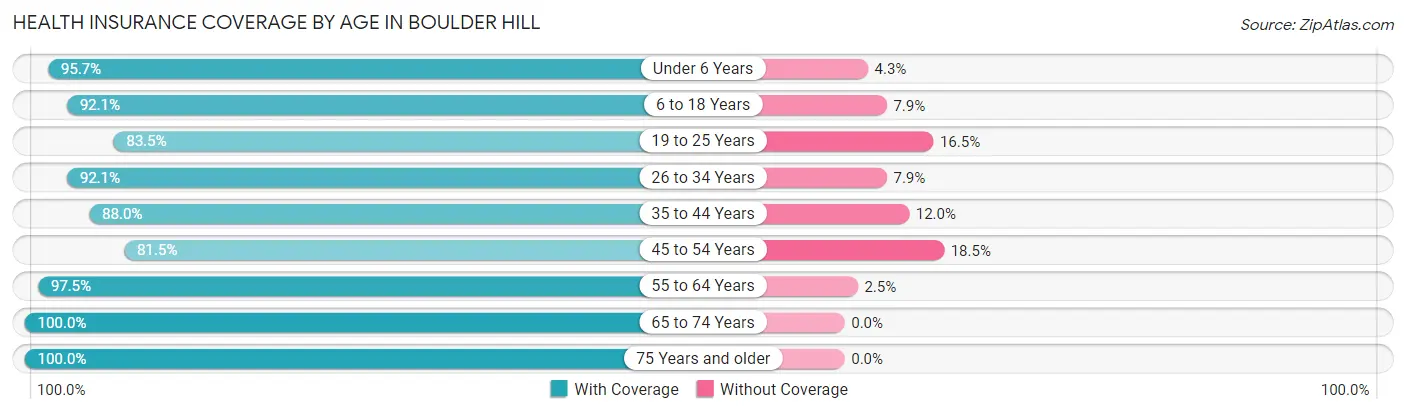
| Age Bracket | With Coverage | Without Coverage |
| Under 6 Years | 662 (95.7%) | 30 (4.3%) |
| 6 to 18 Years | 1,689 (92.1%) | 144 (7.9%) |
| 19 to 25 Years | 797 (83.5%) | 158 (16.5%) |
| 26 to 34 Years | 1,193 (92.1%) | 102 (7.9%) |
| 35 to 44 Years | 1,324 (88.0%) | 181 (12.0%) |
| 45 to 54 Years | 817 (81.5%) | 186 (18.5%) |
| 55 to 64 Years | 952 (97.5%) | 24 (2.5%) |
| 65 to 74 Years | 829 (100.0%) | 0 (0.0%) |
| 75 Years and older | 459 (100.0%) | 0 (0.0%) |
| Total | 8,722 (91.4%) | 825 (8.6%) |
Health Insurance Coverage by Citizenship Status in Boulder Hill
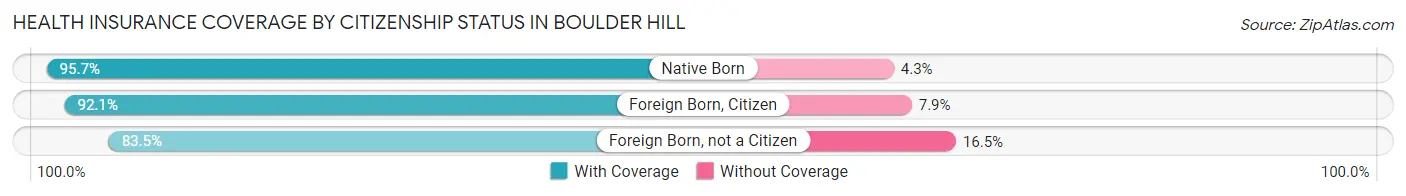
| Citizenship Status | With Coverage | Without Coverage |
| Native Born | 662 (95.7%) | 30 (4.3%) |
| Foreign Born, Citizen | 1,689 (92.1%) | 144 (7.9%) |
| Foreign Born, not a Citizen | 797 (83.5%) | 158 (16.5%) |
Health Insurance Coverage by Household Income in Boulder Hill
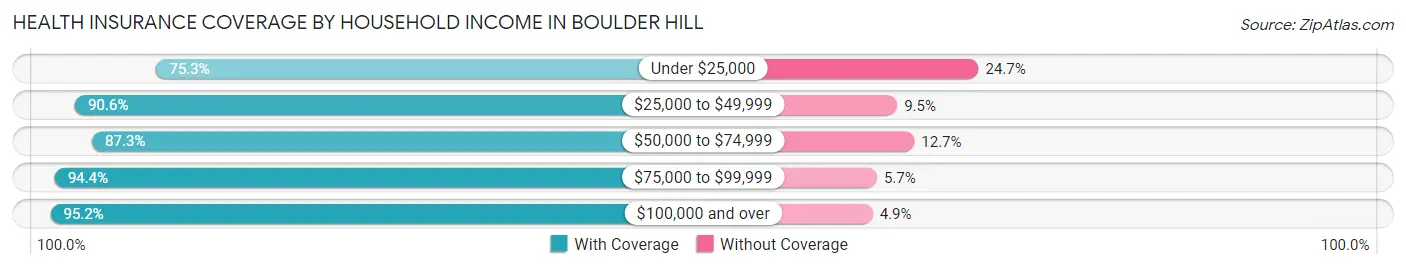
| Household Income | With Coverage | Without Coverage |
| Under $25,000 | 305 (75.3%) | 100 (24.7%) |
| $25,000 to $49,999 | 901 (90.5%) | 94 (9.5%) |
| $50,000 to $74,999 | 2,483 (87.3%) | 360 (12.7%) |
| $75,000 to $99,999 | 1,638 (94.4%) | 98 (5.7%) |
| $100,000 and over | 3,395 (95.2%) | 173 (4.9%) |
Public vs Private Health Insurance Coverage by Age in Boulder Hill
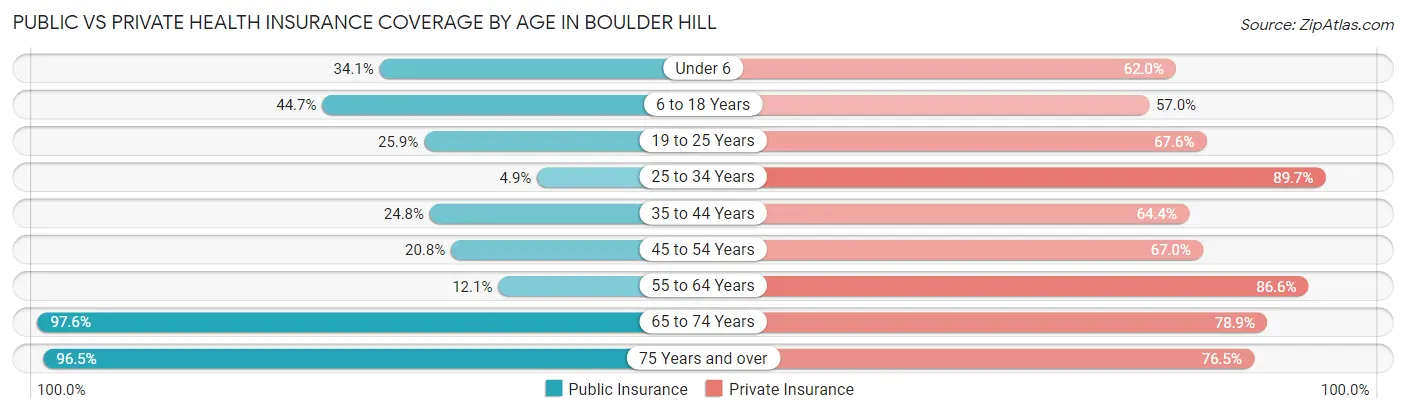
| Age Bracket | Public Insurance | Private Insurance |
| Under 6 | 236 (34.1%) | 429 (62.0%) |
| 6 to 18 Years | 820 (44.7%) | 1,045 (57.0%) |
| 19 to 25 Years | 247 (25.9%) | 646 (67.6%) |
| 25 to 34 Years | 63 (4.9%) | 1,162 (89.7%) |
| 35 to 44 Years | 373 (24.8%) | 969 (64.4%) |
| 45 to 54 Years | 209 (20.8%) | 672 (67.0%) |
| 55 to 64 Years | 118 (12.1%) | 845 (86.6%) |
| 65 to 74 Years | 809 (97.6%) | 654 (78.9%) |
| 75 Years and over | 443 (96.5%) | 351 (76.5%) |
| Total | 3,318 (34.7%) | 6,773 (70.9%) |
Disability Status by Sex by Age in Boulder Hill
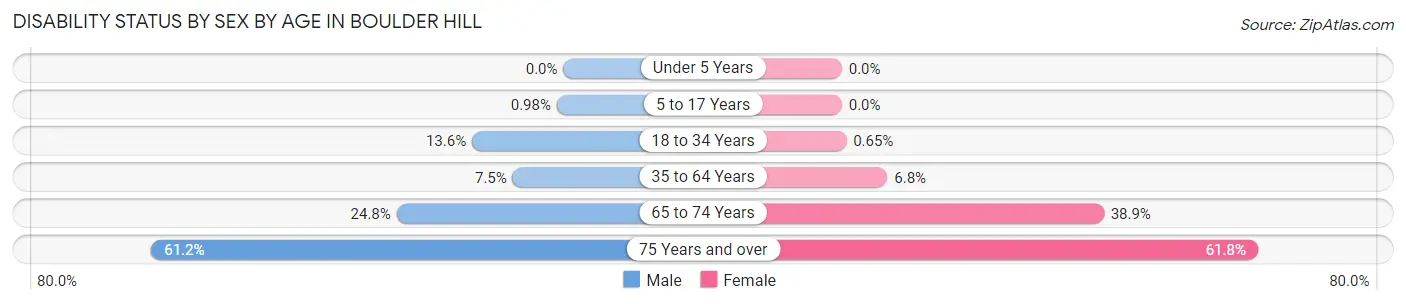
| Age Bracket | Male | Female |
| Under 5 Years | 0 (0.0%) | 0 (0.0%) |
| 5 to 17 Years | 8 (1.0%) | 0 (0.0%) |
| 18 to 34 Years | 147 (13.6%) | 8 (0.6%) |
| 35 to 64 Years | 140 (7.5%) | 110 (6.8%) |
| 65 to 74 Years | 76 (24.8%) | 203 (38.9%) |
| 75 Years and over | 52 (61.2%) | 231 (61.8%) |
Disability Class by Sex by Age in Boulder Hill
Disability Class: Hearing Difficulty
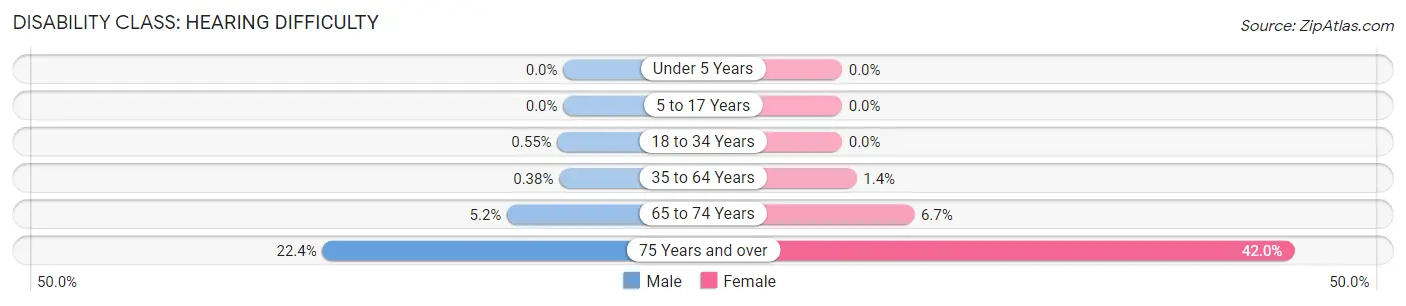
| Age Bracket | Male | Female |
| Under 5 Years | 0 (0.0%) | 0 (0.0%) |
| 5 to 17 Years | 0 (0.0%) | 0 (0.0%) |
| 18 to 34 Years | 6 (0.5%) | 0 (0.0%) |
| 35 to 64 Years | 7 (0.4%) | 22 (1.3%) |
| 65 to 74 Years | 16 (5.2%) | 35 (6.7%) |
| 75 Years and over | 19 (22.4%) | 157 (42.0%) |
Disability Class: Vision Difficulty
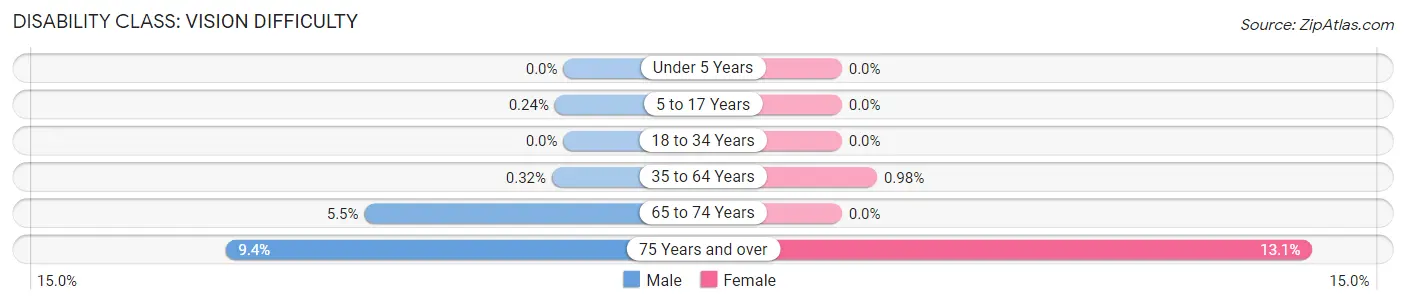
| Age Bracket | Male | Female |
| Under 5 Years | 0 (0.0%) | 0 (0.0%) |
| 5 to 17 Years | 2 (0.2%) | 0 (0.0%) |
| 18 to 34 Years | 0 (0.0%) | 0 (0.0%) |
| 35 to 64 Years | 6 (0.3%) | 16 (1.0%) |
| 65 to 74 Years | 17 (5.5%) | 0 (0.0%) |
| 75 Years and over | 8 (9.4%) | 49 (13.1%) |
Disability Class: Cognitive Difficulty
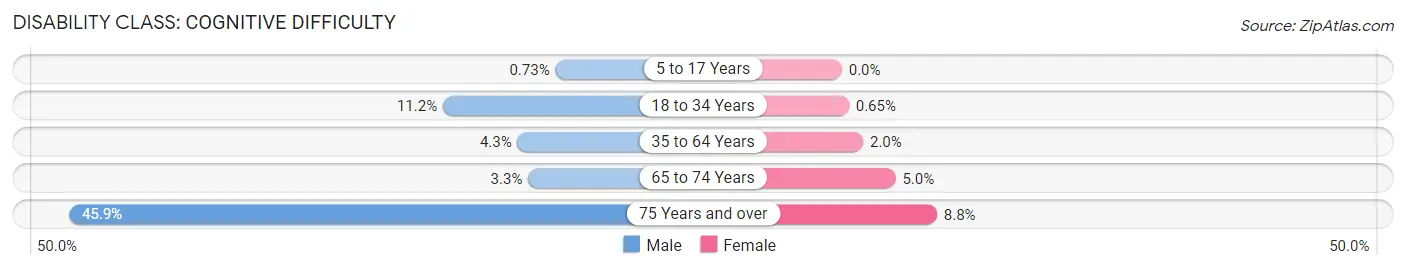
| Age Bracket | Male | Female |
| 5 to 17 Years | 6 (0.7%) | 0 (0.0%) |
| 18 to 34 Years | 121 (11.2%) | 8 (0.6%) |
| 35 to 64 Years | 79 (4.3%) | 32 (2.0%) |
| 65 to 74 Years | 10 (3.3%) | 26 (5.0%) |
| 75 Years and over | 39 (45.9%) | 33 (8.8%) |
Disability Class: Ambulatory Difficulty
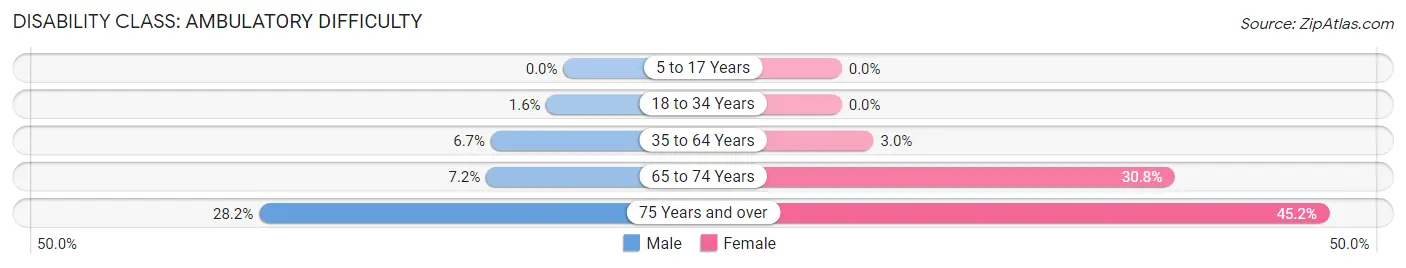
| Age Bracket | Male | Female |
| 5 to 17 Years | 0 (0.0%) | 0 (0.0%) |
| 18 to 34 Years | 17 (1.6%) | 0 (0.0%) |
| 35 to 64 Years | 125 (6.7%) | 48 (2.9%) |
| 65 to 74 Years | 22 (7.2%) | 161 (30.8%) |
| 75 Years and over | 24 (28.2%) | 169 (45.2%) |
Disability Class: Self-Care Difficulty
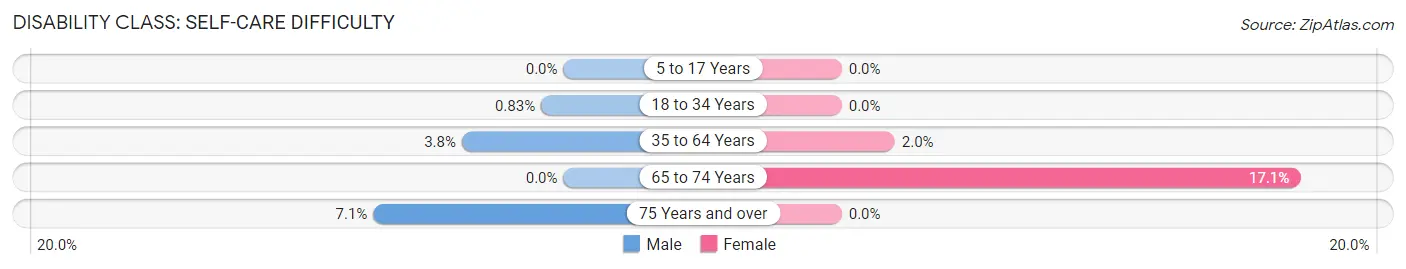
| Age Bracket | Male | Female |
| 5 to 17 Years | 0 (0.0%) | 0 (0.0%) |
| 18 to 34 Years | 9 (0.8%) | 0 (0.0%) |
| 35 to 64 Years | 70 (3.8%) | 32 (2.0%) |
| 65 to 74 Years | 0 (0.0%) | 89 (17.1%) |
| 75 Years and over | 6 (7.1%) | 0 (0.0%) |
Technology Access in Boulder Hill
Computing Device Access in Boulder Hill
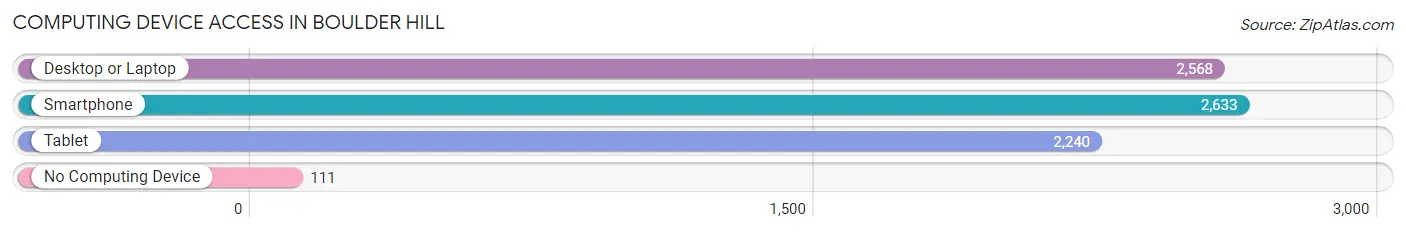
| Device Type | # Households | % Households |
| Desktop or Laptop | 2,568 | 84.6% |
| Smartphone | 2,633 | 86.8% |
| Tablet | 2,240 | 73.8% |
| No Computing Device | 111 | 3.7% |
| Total | 3,035 | 100.0% |
Internet Access in Boulder Hill
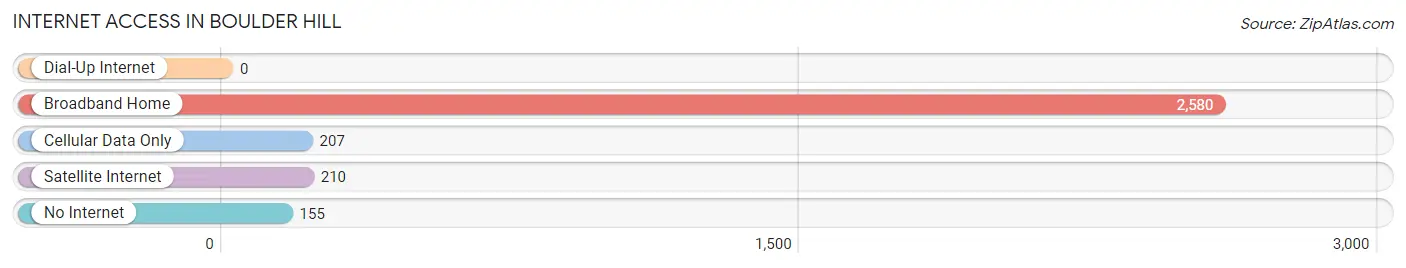
| Internet Type | # Households | % Households |
| Dial-Up Internet | 0 | 0.0% |
| Broadband Home | 2,580 | 85.0% |
| Cellular Data Only | 207 | 6.8% |
| Satellite Internet | 210 | 6.9% |
| No Internet | 155 | 5.1% |
| Total | 3,035 | 100.0% |
Boulder Hill Summary
Boulder Hill is a small unincorporated community located in Kendall County, Illinois. It is situated about 40 miles southwest of Chicago and is part of the Fox Valley region. The population of Boulder Hill was estimated to be around 4,000 in 2020.
History
Boulder Hill was first settled in the early 1800s by a group of German immigrants. The area was originally known as “Boulder Hill” due to the large number of boulders that were found in the area. The first post office was established in 1837 and the first school was built in 1845.
In the late 1800s, the area began to grow rapidly due to the construction of the Chicago and Northwestern Railroad. This allowed for the transportation of goods and people to and from the area. The railroad also helped to spur the growth of the local economy.
In the early 1900s, the area began to experience a population boom due to the influx of immigrants from Europe. This led to the construction of many new homes and businesses in the area.
Geography
Boulder Hill is located in the Fox Valley region of Illinois. It is situated about 40 miles southwest of Chicago and is bordered by the Fox River to the east and the Illinois River to the west. The area is mostly flat with some rolling hills. The climate is generally mild with hot summers and cold winters.
Economy
The economy of Boulder Hill is largely based on agriculture and manufacturing. The area is home to several large farms that produce corn, soybeans, and other crops. There are also several factories in the area that produce a variety of products including automotive parts, electronics, and food products.
The area is also home to several small businesses including restaurants, retail stores, and service providers. The local economy is also supported by tourism as the area is home to several popular attractions including the Fox Valley Mall and the Fox River State Park.
Demographics
The population of Boulder Hill was estimated to be around 4,000 in 2020. The racial makeup of the area is predominantly white (90.2%) with small percentages of African American (3.2%), Asian (2.2%), and Hispanic (2.2%) residents. The median household income in the area is $68,000 and the median home value is $220,000.
Conclusion
Boulder Hill is a small unincorporated community located in Kendall County, Illinois. It is situated about 40 miles southwest of Chicago and is part of the Fox Valley region. The population of Boulder Hill was estimated to be around 4,000 in 2020. The economy of Boulder Hill is largely based on agriculture and manufacturing. The area is also home to several small businesses and is supported by tourism. The racial makeup of the area is predominantly white with small percentages of African American, Asian, and Hispanic residents. The median household income in the area is $68,000 and the median home value is $220,000.
Common Questions
What is Per Capita Income in Boulder Hill?
Per Capita income in Boulder Hill is $29,263.
What is the Median Family Income in Boulder Hill?
Median Family Income in Boulder Hill is $80,069.
What is the Median Household income in Boulder Hill?
Median Household Income in Boulder Hill is $76,875.
What is Income or Wage Gap in Boulder Hill?
Income or Wage Gap in Boulder Hill is 24.1%.
Women in Boulder Hill earn 75.9 cents for every dollar earned by a man.
What is Family Income Deficit in Boulder Hill?
Family Income Deficit in Boulder Hill is $14,543.
Families that are below poverty line in Boulder Hill earn $14,543 less on average than the poverty threshold level.
What is Inequality or Gini Index in Boulder Hill?
Inequality or Gini Index in Boulder Hill is 0.30.
What is the Total Population of Boulder Hill?
Total Population of Boulder Hill is 9,547.
What is the Total Male Population of Boulder Hill?
Total Male Population of Boulder Hill is 4,398.
What is the Total Female Population of Boulder Hill?
Total Female Population of Boulder Hill is 5,149.
What is the Ratio of Males per 100 Females in Boulder Hill?
There are 85.41 Males per 100 Females in Boulder Hill.
What is the Ratio of Females per 100 Males in Boulder Hill?
There are 117.08 Females per 100 Males in Boulder Hill.
What is the Median Population Age in Boulder Hill?
Median Population Age in Boulder Hill is 35.0 Years.
What is the Average Family Size in Boulder Hill
Average Family Size in Boulder Hill is 3.7 People.
What is the Average Household Size in Boulder Hill
Average Household Size in Boulder Hill is 3.1 People.
How Large is the Labor Force in Boulder Hill?
There are 5,311 People in the Labor Forcein in Boulder Hill.
What is the Percentage of People in the Labor Force in Boulder Hill?
70.8% of People are in the Labor Force in Boulder Hill.
What is the Unemployment Rate in Boulder Hill?
Unemployment Rate in Boulder Hill is 6.4%.