Zip Codes with the Highest Percentage of Population Employed in Computer & Mathematics in Rochester, NY

RELATED REPORTS & OPTIONS

Computer & Mathematics
Population
Families and Households
Female Fertility
Female Fertility (Unmarried)
Race (Community Size)
Race (Percentage)
Ancestry (Community Size)
AfghanAfricanAlbanianAlsatianAmericanApacheArabArgentineanArmenianAustralianAustrianBahamianBarbadianBasqueBelgianBelizeanBhutaneseBlackfeetBolivianBrazilianBritishBritish West IndianBulgarianBurmeseCambodianCanadianCape VerdeanCelticCentral AmericanCentral American IndianCherokeeChileanChippewaChoctawColombianCosta RicanCroatianCubanCzechCzechoslovakianDanishDominicanDutchEastern EuropeanEcuadorianEgyptianEnglishEstonianEthiopianEuropeanFilipinoFinnishFrenchFrench CanadianGermanGhanaianGreekGuamanian / ChamorroGuatemalanGuyaneseHaitianHonduranHungarianIcelanderIndian (Asian)IndonesianIranianIraqiIrishIroquoisIsraeliItalianJamaicanJapaneseKenyanKoreanLatvianLebaneseLiberianLithuanianLuxembourgerMacedonianMalaysianMexicanMexican American IndianMongolianMoroccanNative HawaiianNavajoNicaraguanNigerianNorthern EuropeanNorwegianPakistaniPalestinianPanamanianParaguayanPennsylvania GermanPeruvianPolishPortuguesePuebloPuerto RicanRomanianRussianSalvadoranSamoanScandinavianScotch-IrishScottishSeminoleSerbianSlavicSlovakSloveneSomaliSouth AfricanSouth AmericanSouth American IndianSpaniardSpanishSri LankanSubsaharan AfricanSudaneseSwedishSwissSyrianThaiTrinidadian and TobagonianTurkishU.S. Virgin IslanderUkrainianVenezuelanVietnameseWelshWest IndianYugoslavianZimbabwean
Ancestry (Percentage)
AfghanAfricanAlbanianAlsatianAmericanApacheArabArgentineanArmenianAustralianAustrianBahamianBarbadianBasqueBelgianBelizeanBhutaneseBlackfeetBolivianBrazilianBritishBritish West IndianBulgarianBurmeseCambodianCanadianCape VerdeanCelticCentral AmericanCentral American IndianCherokeeChileanChippewaChoctawColombianCosta RicanCroatianCubanCzechCzechoslovakianDanishDominicanDutchEastern EuropeanEcuadorianEgyptianEnglishEstonianEthiopianEuropeanFilipinoFinnishFrenchFrench CanadianGermanGhanaianGreekGuamanian / ChamorroGuatemalanGuyaneseHaitianHonduranHungarianIcelanderIndian (Asian)IndonesianIranianIraqiIrishIroquoisIsraeliItalianJamaicanJapaneseKenyanKoreanLatvianLebaneseLiberianLithuanianLuxembourgerMacedonianMalaysianMexicanMexican American IndianMongolianMoroccanNative HawaiianNavajoNicaraguanNigerianNorthern EuropeanNorwegianPakistaniPalestinianPanamanianParaguayanPennsylvania GermanPeruvianPolishPortuguesePuebloPuerto RicanRomanianRussianSalvadoranSamoanScandinavianScotch-IrishScottishSeminoleSerbianSlavicSlovakSloveneSomaliSouth AfricanSouth AmericanSouth American IndianSpaniardSpanishSri LankanSubsaharan AfricanSudaneseSwedishSwissSyrianThaiTrinidadian and TobagonianTurkishU.S. Virgin IslanderUkrainianVenezuelanVietnameseWelshWest IndianYugoslavianZimbabwean
Immigrant Origin (Total)
AfghanistanAfricaAlbaniaArgentinaArmeniaAsiaAustraliaAustriaBangladeshBarbadosBelarusBelgiumBelizeBoliviaBosnia and HerzegovinaBrazilBulgariaBurma / MyanmarCambodiaCameroonCanadaCaribbeanCentral AmericaChileChinaColombiaCongoCosta RicaCroatiaCubaCzechoslovakiaDominican RepublicEastern AfricaEastern AsiaEastern EuropeEcuadorEgyptEl SalvadorEnglandEritreaEthiopiaEuropeFranceGermanyGhanaGreeceGrenadaGuatemalaGuyanaHaitiHondurasHong KongHungaryIndiaIranIraqIrelandIsraelItalyJamaicaJapanKazakhstanKenyaKoreaKuwaitLaosLatin AmericaLebanonLiberiaLithuaniaMalaysiaMexicoMiddle AfricaMoldovaMoroccoNepalNetherlandsNicaraguaNigeriaNorth MacedoniaNorthern AfricaNorthern EuropeOceaniaPakistanPanamaPeruPhilippinesPolandPortugalRomaniaRussiaSaudi ArabiaScotlandSenegalSerbiaSingaporeSomaliaSouth AfricaSouth AmericaSouth Central AsiaSouth Eastern AsiaSouthern EuropeSpainSri LankaSudanSwedenSyriaTaiwanThailandTrinidad and TobagoTurkeyUgandaUkraineUzbekistanVenezuelaVietnamWestern AfricaWestern AsiaWestern EuropeYemenZaireZimbabwe
Immigrant Origin (Percentage)
AfghanistanAfricaAlbaniaArgentinaArmeniaAsiaAustraliaAustriaBangladeshBarbadosBelarusBelgiumBelizeBoliviaBosnia and HerzegovinaBrazilBulgariaBurma / MyanmarCambodiaCameroonCanadaCaribbeanCentral AmericaChileChinaColombiaCongoCosta RicaCroatiaCubaCzechoslovakiaDominican RepublicEastern AfricaEastern AsiaEastern EuropeEcuadorEgyptEl SalvadorEnglandEritreaEthiopiaEuropeFranceGermanyGhanaGreeceGrenadaGuatemalaGuyanaHaitiHondurasHong KongHungaryIndiaIranIraqIrelandIsraelItalyJamaicaJapanKazakhstanKenyaKoreaKuwaitLaosLatin AmericaLebanonLiberiaLithuaniaMalaysiaMexicoMiddle AfricaMoldovaMoroccoNepalNetherlandsNicaraguaNigeriaNorth MacedoniaNorthern AfricaNorthern EuropeOceaniaPakistanPanamaPeruPhilippinesPolandPortugalRomaniaRussiaSaudi ArabiaScotlandSenegalSerbiaSingaporeSomaliaSouth AfricaSouth AmericaSouth Central AsiaSouth Eastern AsiaSouthern EuropeSpainSri LankaSudanSwedenSyriaTaiwanThailandTrinidad and TobagoTurkeyUgandaUkraineUzbekistanVenezuelaVietnamWestern AfricaWestern AsiaWestern EuropeYemenZaireZimbabwe
Income
Income (Families)
Income (Households)
Poverty
Poverty (Families)
Unemployment
Employment Occupations
Employment Industries
Employer Class
Commute Time
Commute Means
School Enrollment
Education by Degree Field
Occupancy
Finances
Physical Characteristics
Rochester
Compare Zip Codes
Comparison Subject

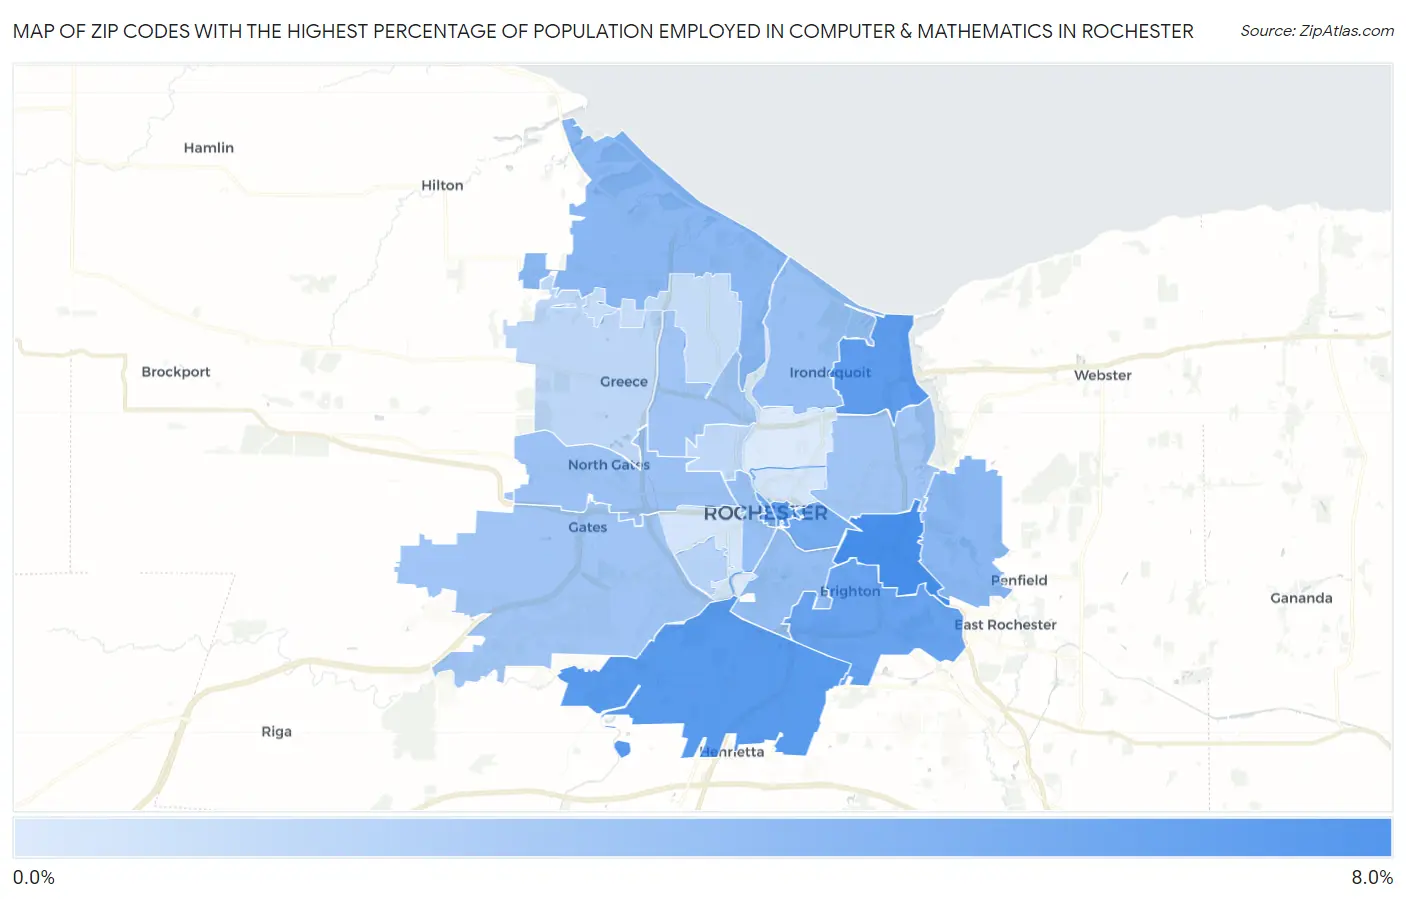
Map of Zip Codes with the Highest Percentage of Population Employed in Computer & Mathematics in Rochester

0.0%
8.0%
Zip Codes with the Highest Percentage of Population Employed in Computer & Mathematics in Rochester Map

Zip Codes with the Highest Percentage of Population Employed in Computer & Mathematics in Rochester, NY

Zip Code % Employed vs State vs National
1.146107.5%3.1%(+4.39)#473.5%(+3.99)#1,380
2.146236.7%3.1%(+3.62)#673.5%(+3.22)#1,761
3.146226.5%3.1%(+3.33)#753.5%(+2.93)#1,965
4.146046.4%3.1%(+3.25)#783.5%(+2.85)#2,017
5.146186.1%3.1%(+2.94)#973.5%(+2.54)#2,255
6.146145.4%3.1%(+2.28)#1343.5%(+1.88)#2,891
7.146075.4%3.1%(+2.27)#1363.5%(+1.87)#2,897
8.146124.6%3.1%(+1.43)#2113.5%(+1.04)#3,997
9.146254.5%3.1%(+1.34)#2193.5%(+0.943)#4,136
10.146204.1%3.1%(+0.949)#2653.5%(+0.554)#4,860
11.146083.9%3.1%(+0.733)#3083.5%(+0.338)#5,332
12.146173.9%3.1%(+0.725)#3123.5%(+0.330)#5,348
13.146063.7%3.1%(+0.526)#3373.5%(+0.132)#5,825
14.146093.5%3.1%(+0.370)#3793.5%(-0.024)#6,205
15.146243.5%3.1%(+0.364)#3823.5%(-0.031)#6,220
16.146153.5%3.1%(+0.335)#3873.5%(-0.060)#6,293
17.146192.6%3.1%(-0.578)#6033.5%(-0.973)#9,414
18.146262.3%3.1%(-0.799)#6653.5%(-1.19)#10,313
19.146132.2%3.1%(-0.921)#7013.5%(-1.32)#10,850
20.146161.9%3.1%(-1.28)#8353.5%(-1.67)#12,522
21.146051.3%3.1%(-1.85)#1,0063.5%(-2.24)#15,645
22.146111.3%3.1%(-1.86)#1,0133.5%(-2.26)#15,739
23.146270.97%3.1%(-2.16)#1,1043.5%(-2.55)#17,563
24.146210.90%3.1%(-2.23)#1,1383.5%(-2.63)#18,044

Common Questions

What are the Top 10 Zip Codes with the Highest Percentage of Population Employed in Computer & Mathematics in Rochester, NY?
Top 10 Zip Codes with the Highest Percentage of Population Employed in Computer & Mathematics in Rochester, NY are:
#1
7.5%
#2
6.7%
#3
6.5%
#4
6.4%
#5
6.1%
#6
5.4%
#7
5.4%
#8
4.6%
#9
4.5%
#10
4.1%
What zip code has the Highest Percentage of Population Employed in Computer & Mathematics in Rochester, NY?
14610 has the Highest Percentage of Population Employed in Computer & Mathematics in Rochester, NY with 7.5%.
What is the Percentage of Population Employed in Computer & Mathematics in Rochester, NY?
Percentage of Population Employed in Computer & Mathematics in Rochester is 3.3%.
What is the Percentage of Population Employed in Computer & Mathematics in New York?
Percentage of Population Employed in Computer & Mathematics in New York is 3.1%.
What is the Percentage of Population Employed in Computer & Mathematics in the United States?
Percentage of Population Employed in Computer & Mathematics in the United States is 3.5%.