Schroon Lake, NY Map & Demographics
Schroon Lake Map
Schroon Lake Overview
$34,716
PER CAPITA INCOME
$81,563
AVG FAMILY INCOME
$64,423
AVG HOUSEHOLD INCOME
29.6%
WAGE / INCOME GAP [ % ]
70.4¢/ $1
WAGE / INCOME GAP [ $ ]
0.43
INEQUALITY / GINI INDEX
926
TOTAL POPULATION
432
MALE POPULATION
494
FEMALE POPULATION
87.45
MALES / 100 FEMALES
114.35
FEMALES / 100 MALES
49.0
MEDIAN AGE
2.5
AVG FAMILY SIZE
2.3
AVG HOUSEHOLD SIZE
405
LABOR FORCE [ PEOPLE ]
51.5%
PERCENT IN LABOR FORCE
1.5%
UNEMPLOYMENT RATE
Schroon Lake Zip Codes
Schroon Lake Area Codes
Income in Schroon Lake
Income Overview in Schroon Lake
Per Capita Income in Schroon Lake is $34,716, while median incomes of families and households are $81,563 and $64,423 respectively.
| Characteristic | Number | Measure |
| Per Capita Income | 926 | $34,716 |
| Median Family Income | 314 | $81,563 |
| Mean Family Income | 314 | $93,710 |
| Median Household Income | 404 | $64,423 |
| Mean Household Income | 404 | $83,232 |
| Income Deficit | 314 | $0 |
| Wage / Income Gap (%) | 926 | 29.58% |
| Wage / Income Gap ($) | 926 | 70.42¢ per $1 |
| Gini / Inequality Index | 926 | 0.43 |
Earnings by Sex in Schroon Lake
Average Earnings in Schroon Lake are $33,864, $44,375 for men and $31,250 for women, a difference of 29.6%.
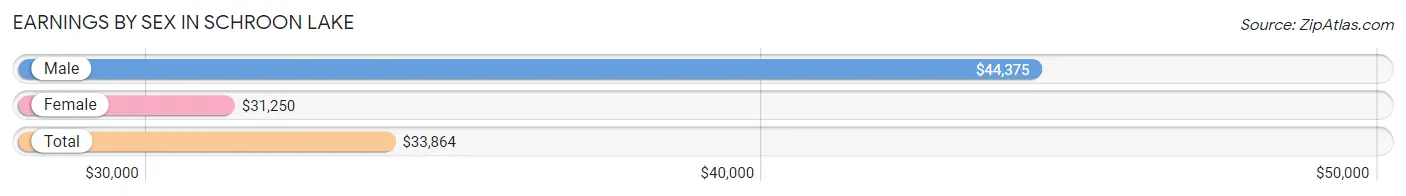
| Sex | Number | Average Earnings |
| Male | 210 (46.1%) | $44,375 |
| Female | 246 (53.9%) | $31,250 |
| Total | 456 (100.0%) | $33,864 |
Earnings by Sex by Income Bracket in Schroon Lake
The most common earnings brackets in Schroon Lake are $50,000 to $54,999 for men (41 | 19.5%) and $30,000 to $34,999 for women (50 | 20.3%).
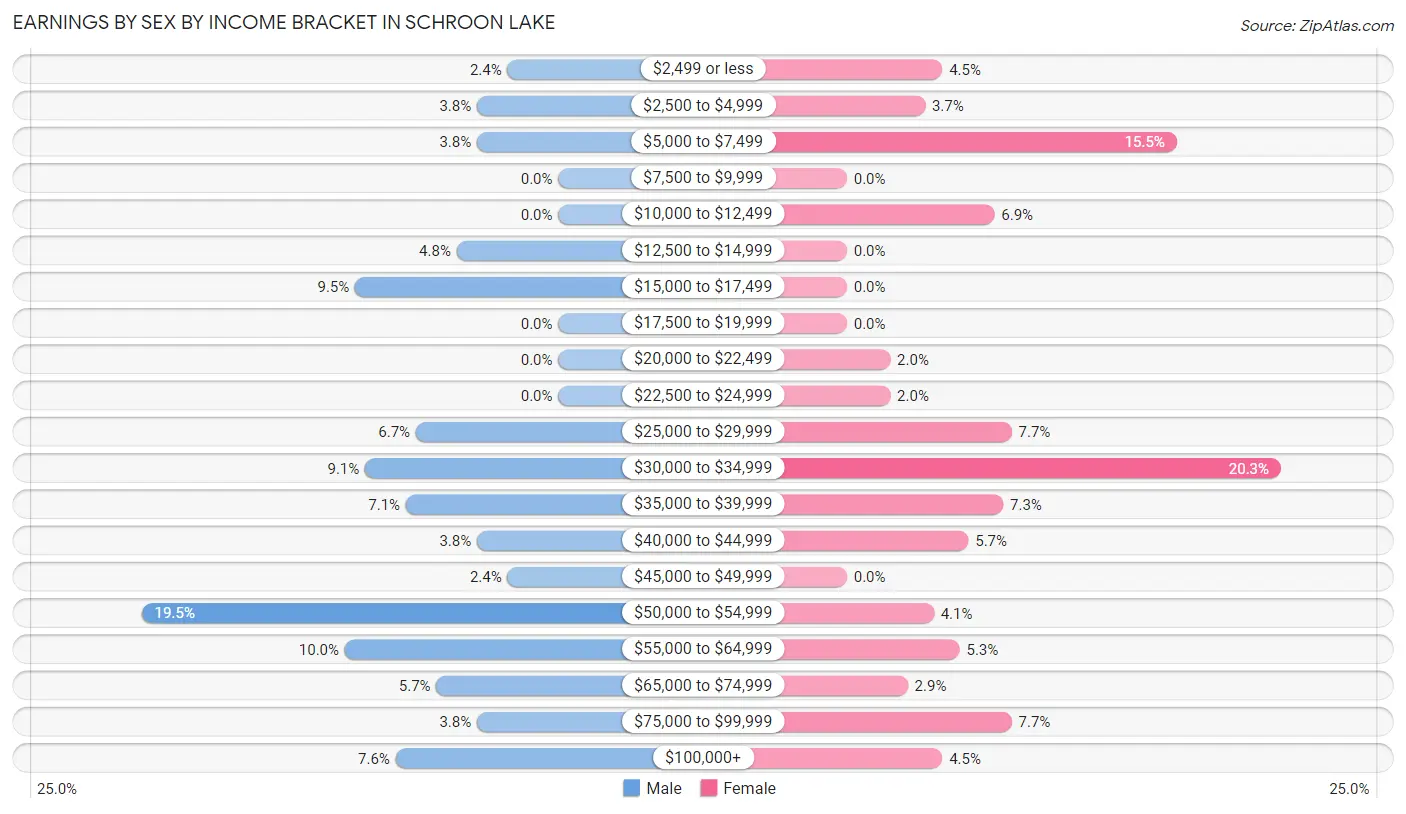
| Income | Male | Female |
| $2,499 or less | 5 (2.4%) | 11 (4.5%) |
| $2,500 to $4,999 | 8 (3.8%) | 9 (3.7%) |
| $5,000 to $7,499 | 8 (3.8%) | 38 (15.4%) |
| $7,500 to $9,999 | 0 (0.0%) | 0 (0.0%) |
| $10,000 to $12,499 | 0 (0.0%) | 17 (6.9%) |
| $12,500 to $14,999 | 10 (4.8%) | 0 (0.0%) |
| $15,000 to $17,499 | 20 (9.5%) | 0 (0.0%) |
| $17,500 to $19,999 | 0 (0.0%) | 0 (0.0%) |
| $20,000 to $22,499 | 0 (0.0%) | 5 (2.0%) |
| $22,500 to $24,999 | 0 (0.0%) | 5 (2.0%) |
| $25,000 to $29,999 | 14 (6.7%) | 19 (7.7%) |
| $30,000 to $34,999 | 19 (9.0%) | 50 (20.3%) |
| $35,000 to $39,999 | 15 (7.1%) | 18 (7.3%) |
| $40,000 to $44,999 | 8 (3.8%) | 14 (5.7%) |
| $45,000 to $49,999 | 5 (2.4%) | 0 (0.0%) |
| $50,000 to $54,999 | 41 (19.5%) | 10 (4.1%) |
| $55,000 to $64,999 | 21 (10.0%) | 13 (5.3%) |
| $65,000 to $74,999 | 12 (5.7%) | 7 (2.9%) |
| $75,000 to $99,999 | 8 (3.8%) | 19 (7.7%) |
| $100,000+ | 16 (7.6%) | 11 (4.5%) |
| Total | 210 (100.0%) | 246 (100.0%) |
Earnings by Sex by Educational Attainment in Schroon Lake
Average earnings in Schroon Lake are $52,813 for men and $32,813 for women, a difference of 37.9%. Men with an educational attainment of bachelor's degree enjoy the highest average annual earnings of $68,750, while those with high school diploma education earn the least with $35,750. Women with an educational attainment of graduate degree earn the most with the average annual earnings of $65,714, while those with high school diploma education have the smallest earnings of $29,000.
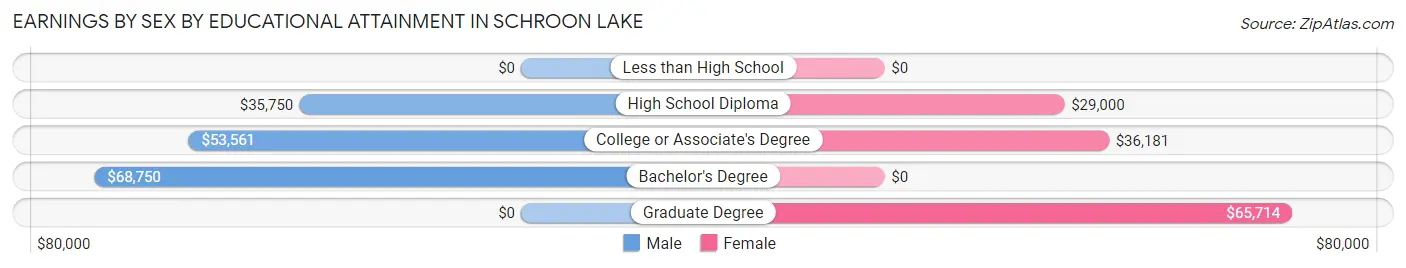
| Educational Attainment | Male Income | Female Income |
| Less than High School | - | - |
| High School Diploma | $35,750 | $29,000 |
| College or Associate's Degree | $53,561 | $36,181 |
| Bachelor's Degree | $68,750 | $0 |
| Graduate Degree | - | - |
| Total | $52,813 | $32,813 |
Family Income in Schroon Lake
Family Income Brackets in Schroon Lake
According to the Schroon Lake family income data, there are 73 families falling into the $75,000 to $99,999 income range, which is the most common income bracket and makes up 23.3% of all families.
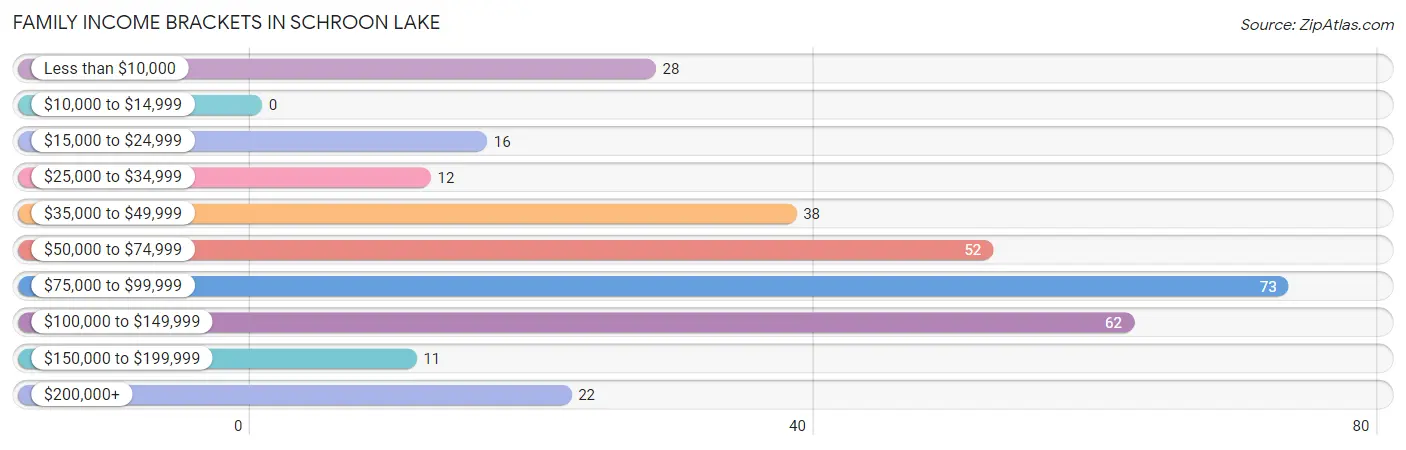
| Income Bracket | # Families | % Families |
| Less than $10,000 | 28 | 8.9% |
| $10,000 to $14,999 | 0 | 0.0% |
| $15,000 to $24,999 | 16 | 5.1% |
| $25,000 to $34,999 | 12 | 3.8% |
| $35,000 to $49,999 | 38 | 12.1% |
| $50,000 to $74,999 | 52 | 16.6% |
| $75,000 to $99,999 | 73 | 23.2% |
| $100,000 to $149,999 | 62 | 19.7% |
| $150,000 to $199,999 | 11 | 3.5% |
| $200,000+ | 22 | 7.0% |
Family Income by Famaliy Size in Schroon Lake
4-person families (96 | 30.6%) account for the highest median family income in Schroon Lake with $89,091 per family, while 2-person families (173 | 55.1%) have the highest median income of $36,042 per family member.
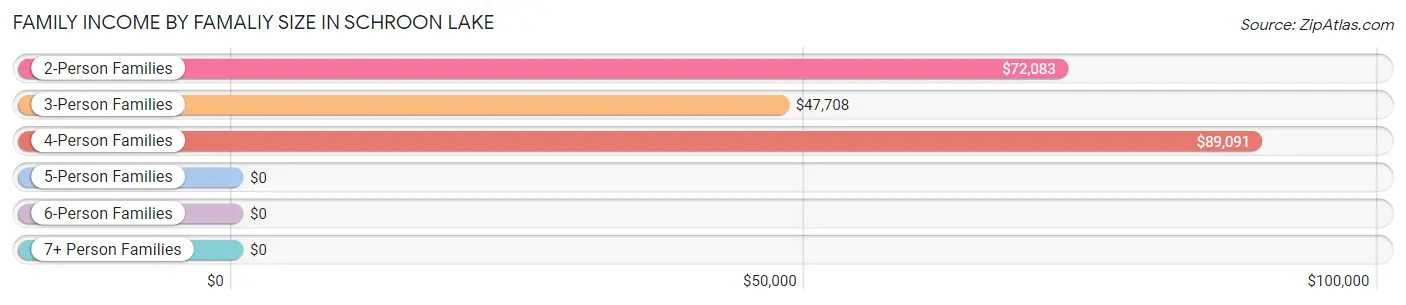
| Income Bracket | # Families | Median Income |
| 2-Person Families | 173 (55.1%) | $72,083 |
| 3-Person Families | 37 (11.8%) | $47,708 |
| 4-Person Families | 96 (30.6%) | $89,091 |
| 5-Person Families | 8 (2.5%) | $0 |
| 6-Person Families | 0 (0.0%) | $0 |
| 7+ Person Families | 0 (0.0%) | $0 |
| Total | 314 (100.0%) | $81,563 |
Family Income by Number of Earners in Schroon Lake
The median family income in Schroon Lake is $81,563, with families comprising 3+ earners (39) having the highest median family income of $128,125, while families with 1 earner (97) have the lowest median family income of $47,708, accounting for 12.4% and 30.9% of families, respectively.
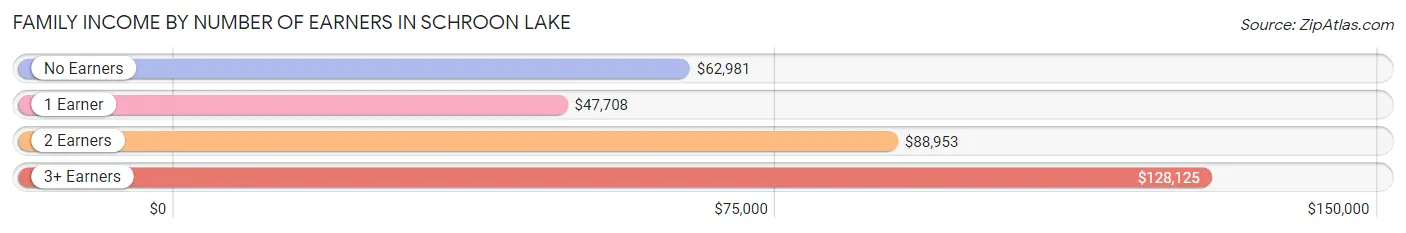
| Number of Earners | # Families | Median Income |
| No Earners | 79 (25.2%) | $62,981 |
| 1 Earner | 97 (30.9%) | $47,708 |
| 2 Earners | 99 (31.5%) | $88,953 |
| 3+ Earners | 39 (12.4%) | $128,125 |
| Total | 314 (100.0%) | $81,563 |
Household Income in Schroon Lake
Household Income Brackets in Schroon Lake
With 79 households falling in the category, the $100,000 to $149,999 income range is the most frequent in Schroon Lake, accounting for 19.6% of all households. In contrast, only 3 households (0.7%) fall into the $10,000 to $14,999 income bracket, making it the least populous group.
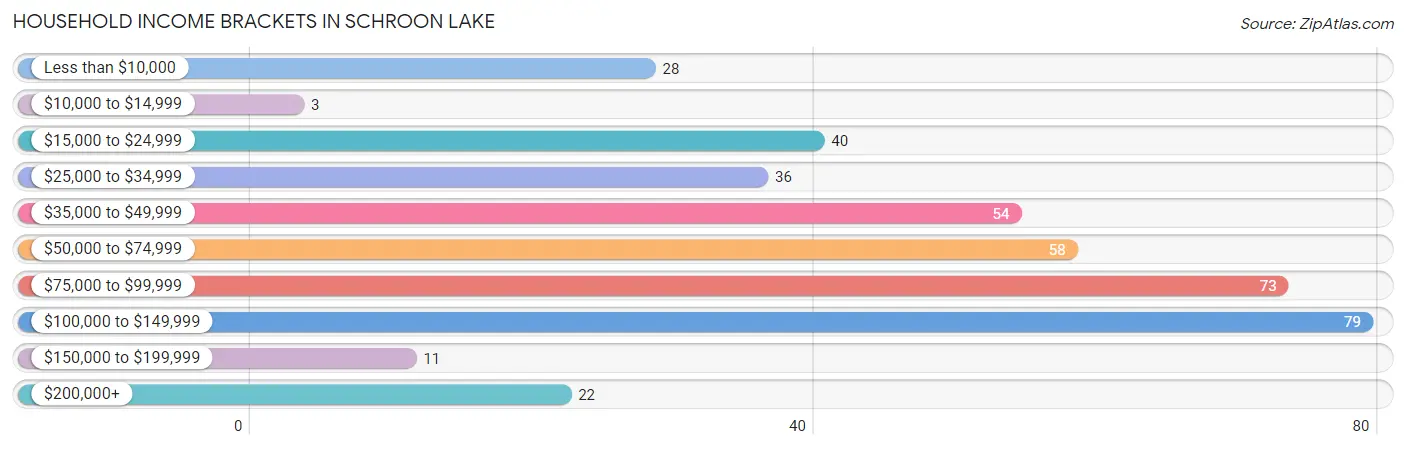
| Income Bracket | # Households | % Households |
| Less than $10,000 | 28 | 6.9% |
| $10,000 to $14,999 | 3 | 0.7% |
| $15,000 to $24,999 | 40 | 9.9% |
| $25,000 to $34,999 | 36 | 8.9% |
| $35,000 to $49,999 | 54 | 13.4% |
| $50,000 to $74,999 | 58 | 14.4% |
| $75,000 to $99,999 | 73 | 18.1% |
| $100,000 to $149,999 | 79 | 19.6% |
| $150,000 to $199,999 | 11 | 2.7% |
| $200,000+ | 22 | 5.4% |
Household Income by Householder Age in Schroon Lake
The median household income in Schroon Lake is $64,423, with the highest median household income of $91,806 found in the 45 to 64 years age bracket for the primary householder. A total of 149 households (36.9%) fall into this category. Meanwhile, the 25 to 44 years age bracket for the primary householder has the lowest median household income of $0, with 99 households (24.5%) in this group.
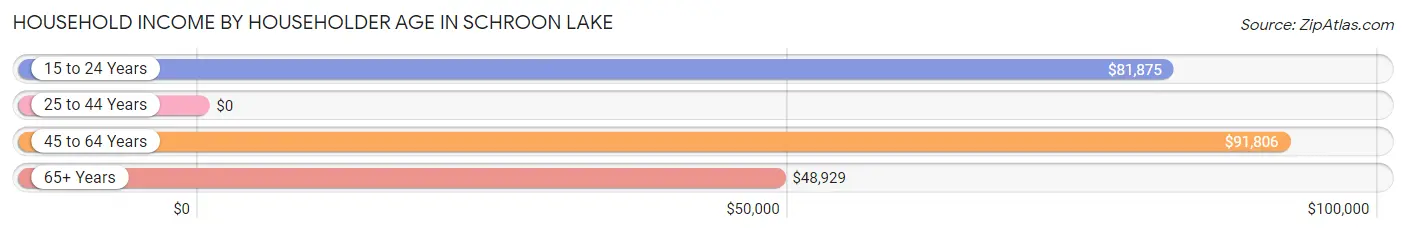
| Income Bracket | # Households | Median Income |
| 15 to 24 Years | 22 (5.4%) | $81,875 |
| 25 to 44 Years | 99 (24.5%) | $0 |
| 45 to 64 Years | 149 (36.9%) | $91,806 |
| 65+ Years | 134 (33.2%) | $48,929 |
| Total | 404 (100.0%) | $64,423 |
Poverty in Schroon Lake
Income Below Poverty by Sex and Age in Schroon Lake
With 12.5% poverty level for males and 9.3% for females among the residents of Schroon Lake, 16 and 17 year old males and 5 year old females are the most vulnerable to poverty, with 16 males (100.0%) and 2 females (100.0%) in their respective age groups living below the poverty level.
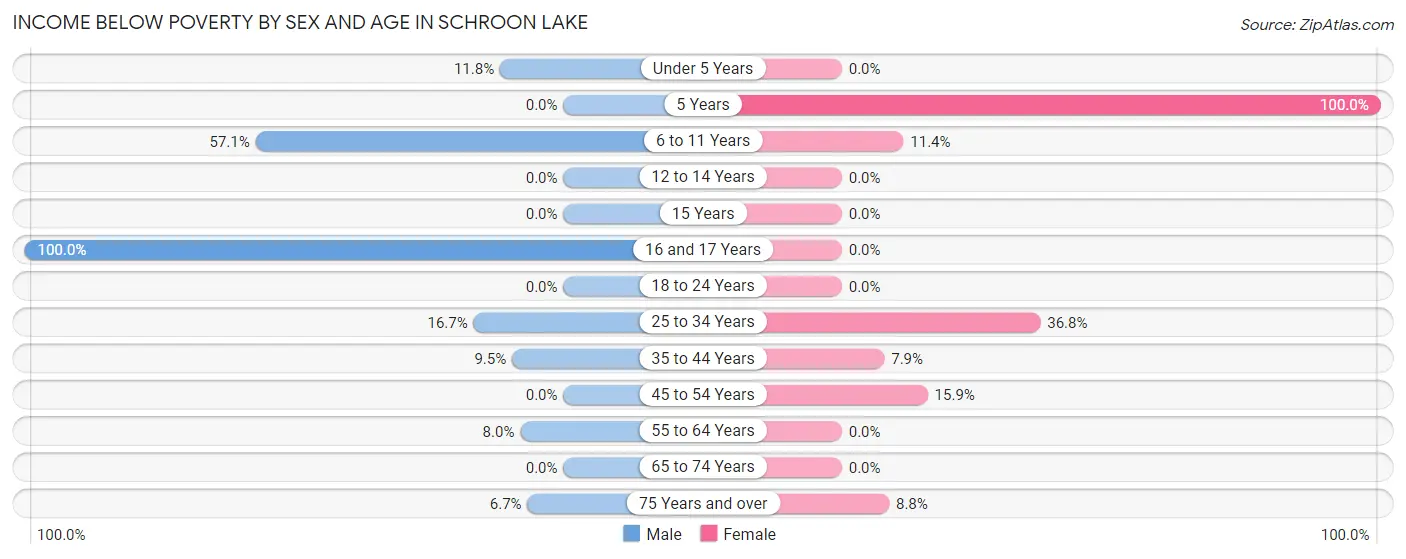
| Age Bracket | Male | Female |
| Under 5 Years | 2 (11.8%) | 0 (0.0%) |
| 5 Years | 0 (0.0%) | 2 (100.0%) |
| 6 to 11 Years | 20 (57.1%) | 8 (11.4%) |
| 12 to 14 Years | 0 (0.0%) | 0 (0.0%) |
| 15 Years | 0 (0.0%) | 0 (0.0%) |
| 16 and 17 Years | 16 (100.0%) | 0 (0.0%) |
| 18 to 24 Years | 0 (0.0%) | 0 (0.0%) |
| 25 to 34 Years | 3 (16.7%) | 14 (36.8%) |
| 35 to 44 Years | 6 (9.5%) | 6 (7.9%) |
| 45 to 54 Years | 0 (0.0%) | 11 (15.9%) |
| 55 to 64 Years | 4 (8.0%) | 0 (0.0%) |
| 65 to 74 Years | 0 (0.0%) | 0 (0.0%) |
| 75 Years and over | 3 (6.7%) | 5 (8.8%) |
| Total | 54 (12.5%) | 46 (9.3%) |
Income Above Poverty by Sex and Age in Schroon Lake
According to the poverty statistics in Schroon Lake, males aged 5 years and females aged under 5 years are the age groups that are most secure financially, with 100.0% of males and 100.0% of females in these age groups living above the poverty line.
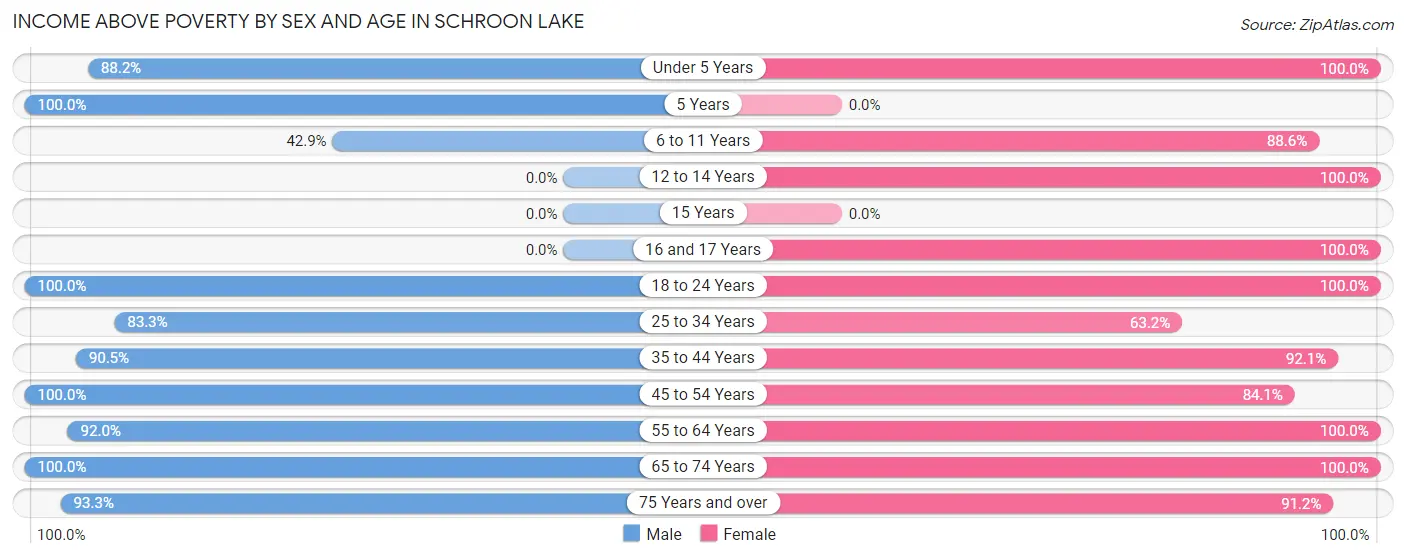
| Age Bracket | Male | Female |
| Under 5 Years | 15 (88.2%) | 5 (100.0%) |
| 5 Years | 6 (100.0%) | 0 (0.0%) |
| 6 to 11 Years | 15 (42.9%) | 62 (88.6%) |
| 12 to 14 Years | 0 (0.0%) | 4 (100.0%) |
| 15 Years | 0 (0.0%) | 0 (0.0%) |
| 16 and 17 Years | 0 (0.0%) | 6 (100.0%) |
| 18 to 24 Years | 42 (100.0%) | 35 (100.0%) |
| 25 to 34 Years | 15 (83.3%) | 24 (63.2%) |
| 35 to 44 Years | 57 (90.5%) | 70 (92.1%) |
| 45 to 54 Years | 52 (100.0%) | 58 (84.1%) |
| 55 to 64 Years | 46 (92.0%) | 73 (100.0%) |
| 65 to 74 Years | 88 (100.0%) | 59 (100.0%) |
| 75 Years and over | 42 (93.3%) | 52 (91.2%) |
| Total | 378 (87.5%) | 448 (90.7%) |
Income Below Poverty Among Married-Couple Families in Schroon Lake
The poverty statistics for married-couple families in Schroon Lake show that 2.4% or 6 of the total 248 families live below the poverty line. Families with 1 or 2 children have the highest poverty rate of 9.2%, comprising of 6 families. On the other hand, families with no children have the lowest poverty rate of 0.0%, which includes 0 families.
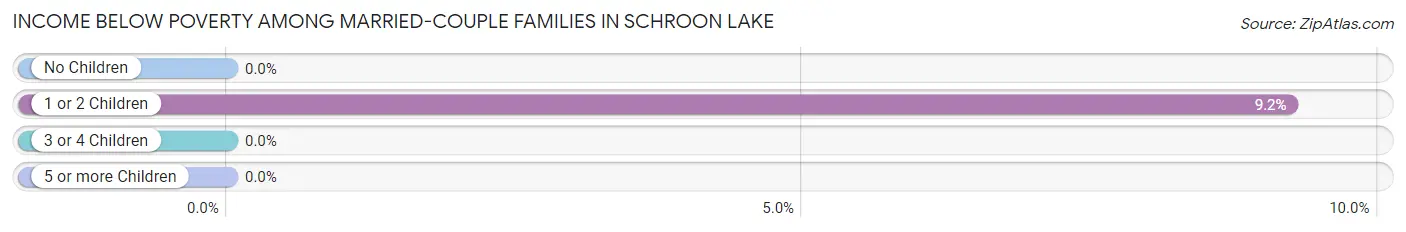
| Children | Above Poverty | Below Poverty |
| No Children | 178 (100.0%) | 0 (0.0%) |
| 1 or 2 Children | 59 (90.8%) | 6 (9.2%) |
| 3 or 4 Children | 5 (100.0%) | 0 (0.0%) |
| 5 or more Children | 0 (0.0%) | 0 (0.0%) |
| Total | 242 (97.6%) | 6 (2.4%) |
Income Below Poverty Among Single-Parent Households in Schroon Lake
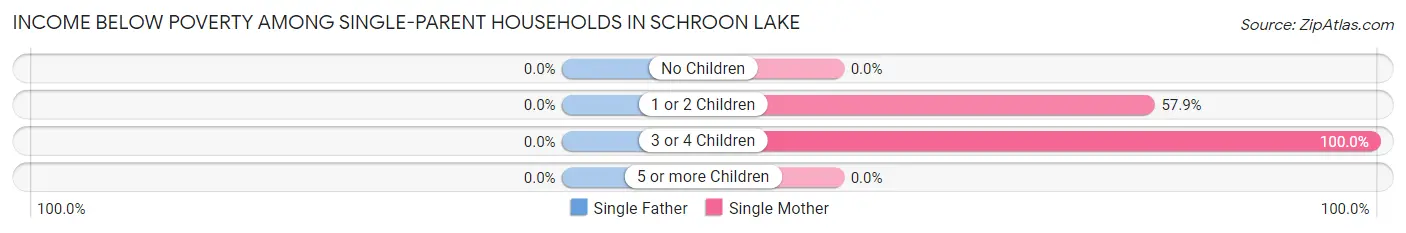
| Children | Single Father | Single Mother |
| No Children | 0 (0.0%) | 0 (0.0%) |
| 1 or 2 Children | 0 (0.0%) | 22 (57.9%) |
| 3 or 4 Children | 0 (0.0%) | 3 (100.0%) |
| 5 or more Children | 0 (0.0%) | 0 (0.0%) |
| Total | 0 (0.0%) | 25 (41.0%) |
Income Below Poverty Among Married-Couple vs Single-Parent Households in Schroon Lake
The poverty data for Schroon Lake shows that 6 of the married-couple family households (2.4%) and 25 of the single-parent households (37.9%) are living below the poverty level. Within the married-couple family households, those with 1 or 2 children have the highest poverty rate, with 6 households (9.2%) falling below the poverty line. Among the single-parent households, those with 3 or 4 children have the highest poverty rate, with 3 household (100.0%) living below poverty.
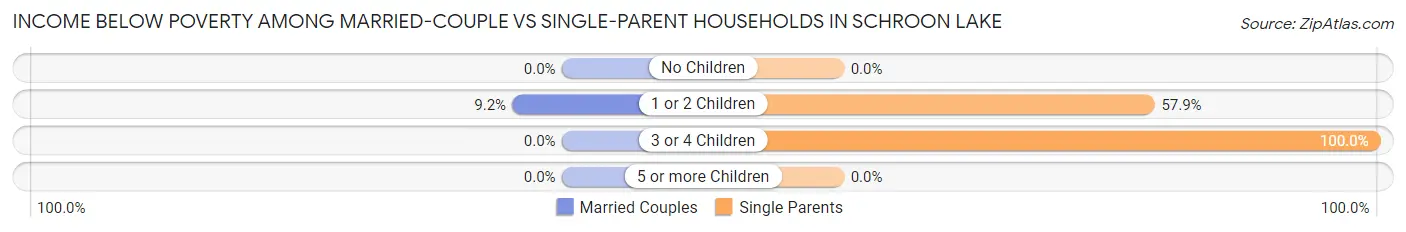
| Children | Married-Couple Families | Single-Parent Households |
| No Children | 0 (0.0%) | 0 (0.0%) |
| 1 or 2 Children | 6 (9.2%) | 22 (57.9%) |
| 3 or 4 Children | 0 (0.0%) | 3 (100.0%) |
| 5 or more Children | 0 (0.0%) | 0 (0.0%) |
| Total | 6 (2.4%) | 25 (37.9%) |
Race in Schroon Lake
The most populous races in Schroon Lake are White / Caucasian (881 | 95.1%), Two or more Races (32 | 3.5%), and Some other Race (7 | 0.8%).
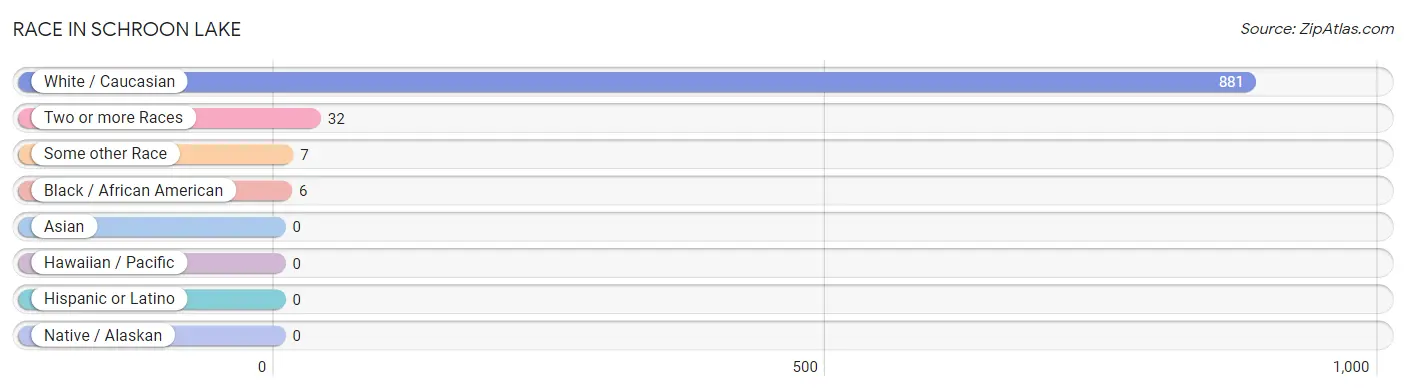
| Race | # Population | % Population |
| Asian | 0 | 0.0% |
| Black / African American | 6 | 0.6% |
| Hawaiian / Pacific | 0 | 0.0% |
| Hispanic or Latino | 0 | 0.0% |
| Native / Alaskan | 0 | 0.0% |
| White / Caucasian | 881 | 95.1% |
| Two or more Races | 32 | 3.5% |
| Some other Race | 7 | 0.8% |
| Total | 926 | 100.0% |
Ancestry in Schroon Lake
The most populous ancestries reported in Schroon Lake are Irish (151 | 16.3%), English (148 | 16.0%), German (139 | 15.0%), French (129 | 13.9%), and European (125 | 13.5%), together accounting for 74.7% of all Schroon Lake residents.
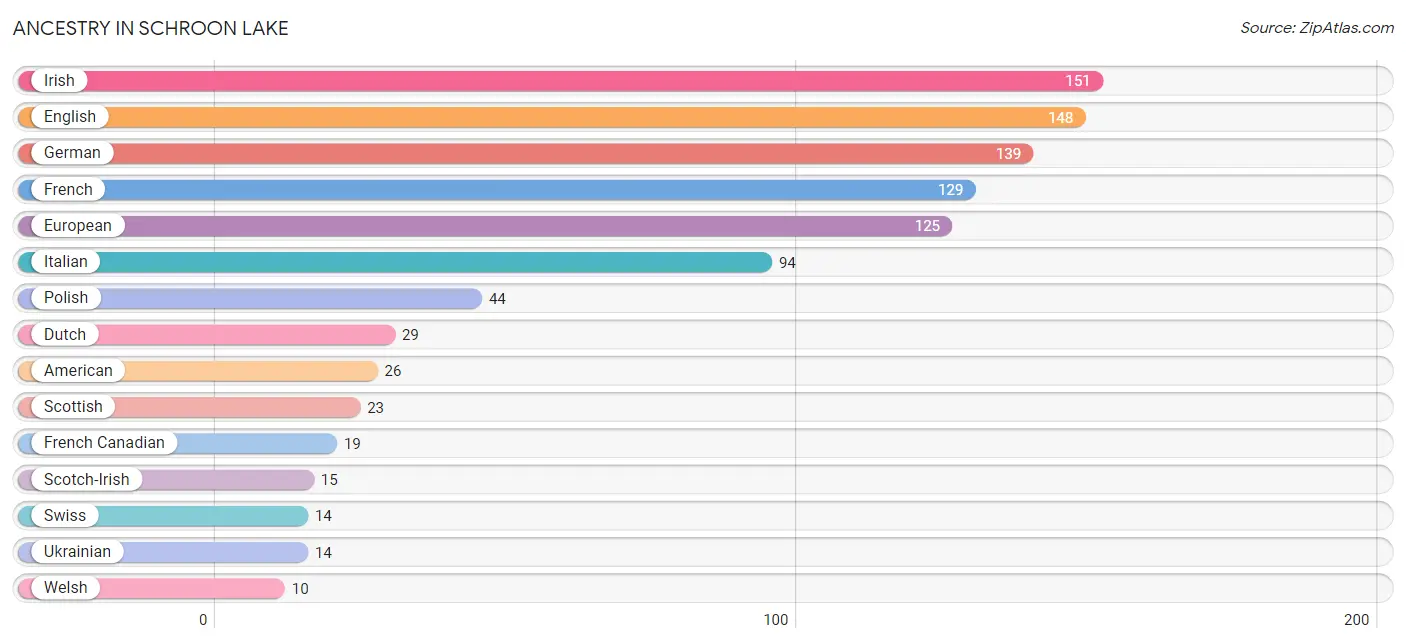
| Ancestry | # Population | % Population |
| American | 26 | 2.8% |
| Brazilian | 7 | 0.8% |
| Cajun | 7 | 0.8% |
| Danish | 6 | 0.6% |
| Dutch | 29 | 3.1% |
| Eastern European | 5 | 0.5% |
| English | 148 | 16.0% |
| European | 125 | 13.5% |
| French | 129 | 13.9% |
| French Canadian | 19 | 2.1% |
| German | 139 | 15.0% |
| Irish | 151 | 16.3% |
| Italian | 94 | 10.2% |
| Lithuanian | 8 | 0.9% |
| Polish | 44 | 4.8% |
| Russian | 6 | 0.6% |
| Scotch-Irish | 15 | 1.6% |
| Scottish | 23 | 2.5% |
| Serbian | 6 | 0.6% |
| Swedish | 5 | 0.5% |
| Swiss | 14 | 1.5% |
| Ukrainian | 14 | 1.5% |
| Welsh | 10 | 1.1% | View All 23 Rows |
Immigrants in Schroon Lake
The most numerous immigrant groups reported in Schroon Lake came from Brazil (7 | 0.8%), Latin America (7 | 0.8%), South America (7 | 0.8%), Asia (6 | 0.6%), and Philippines (6 | 0.6%), together accounting for 3.6% of all Schroon Lake residents.
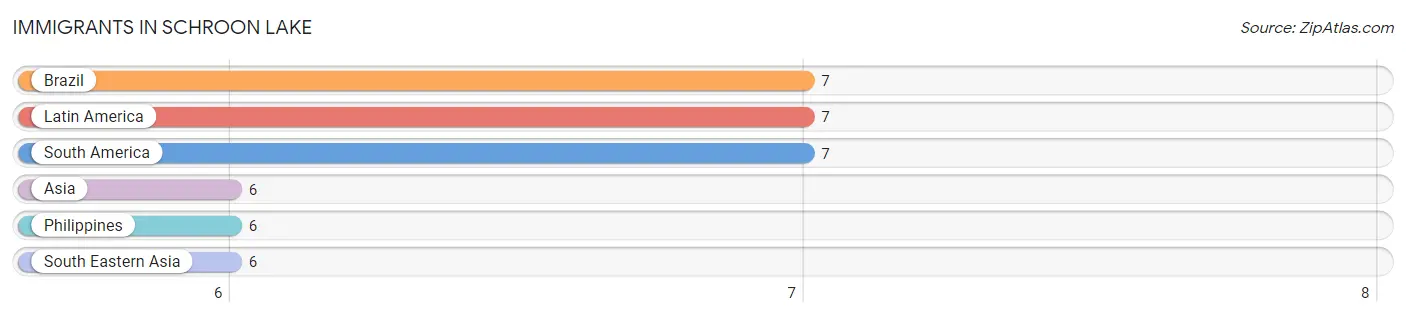
| Immigration Origin | # Population | % Population |
| Asia | 6 | 0.6% |
| Brazil | 7 | 0.8% |
| Latin America | 7 | 0.8% |
| Philippines | 6 | 0.6% |
| South America | 7 | 0.8% |
| South Eastern Asia | 6 | 0.6% | View All 6 Rows |
Sex and Age in Schroon Lake
Sex and Age in Schroon Lake
The most populous age groups in Schroon Lake are 40 to 44 Years (59 | 13.7%) for men and 5 to 9 Years (65 | 13.2%) for women.
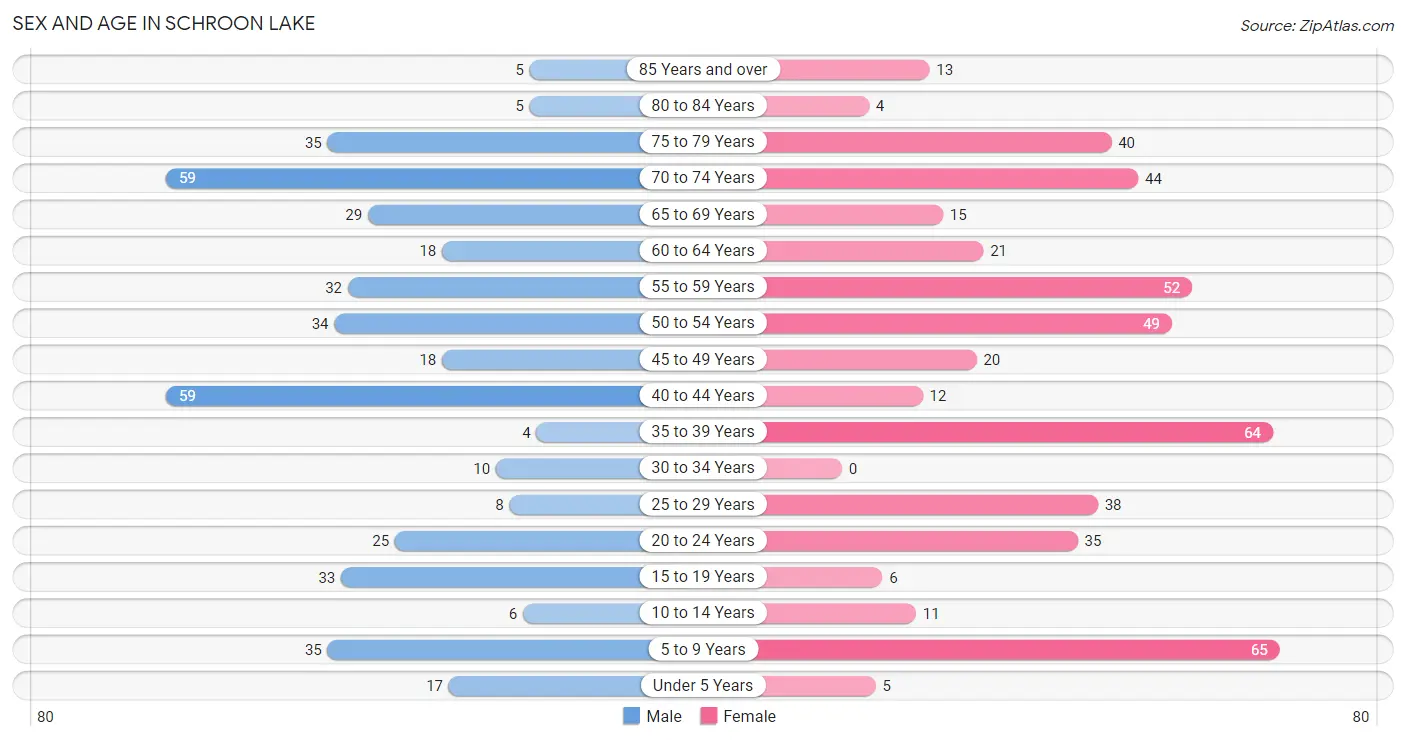
| Age Bracket | Male | Female |
| Under 5 Years | 17 (3.9%) | 5 (1.0%) |
| 5 to 9 Years | 35 (8.1%) | 65 (13.2%) |
| 10 to 14 Years | 6 (1.4%) | 11 (2.2%) |
| 15 to 19 Years | 33 (7.6%) | 6 (1.2%) |
| 20 to 24 Years | 25 (5.8%) | 35 (7.1%) |
| 25 to 29 Years | 8 (1.8%) | 38 (7.7%) |
| 30 to 34 Years | 10 (2.3%) | 0 (0.0%) |
| 35 to 39 Years | 4 (0.9%) | 64 (13.0%) |
| 40 to 44 Years | 59 (13.7%) | 12 (2.4%) |
| 45 to 49 Years | 18 (4.2%) | 20 (4.1%) |
| 50 to 54 Years | 34 (7.9%) | 49 (9.9%) |
| 55 to 59 Years | 32 (7.4%) | 52 (10.5%) |
| 60 to 64 Years | 18 (4.2%) | 21 (4.3%) |
| 65 to 69 Years | 29 (6.7%) | 15 (3.0%) |
| 70 to 74 Years | 59 (13.7%) | 44 (8.9%) |
| 75 to 79 Years | 35 (8.1%) | 40 (8.1%) |
| 80 to 84 Years | 5 (1.2%) | 4 (0.8%) |
| 85 Years and over | 5 (1.2%) | 13 (2.6%) |
| Total | 432 (100.0%) | 494 (100.0%) |
Families and Households in Schroon Lake
Median Family Size in Schroon Lake
The median family size in Schroon Lake is 2.52 persons per family, with single male/father families (5 | 1.6%) accounting for the largest median family size of 5.4 persons per family. On the other hand, single female/mother families (61 | 19.4%) represent the smallest median family size with 2.13 persons per family.
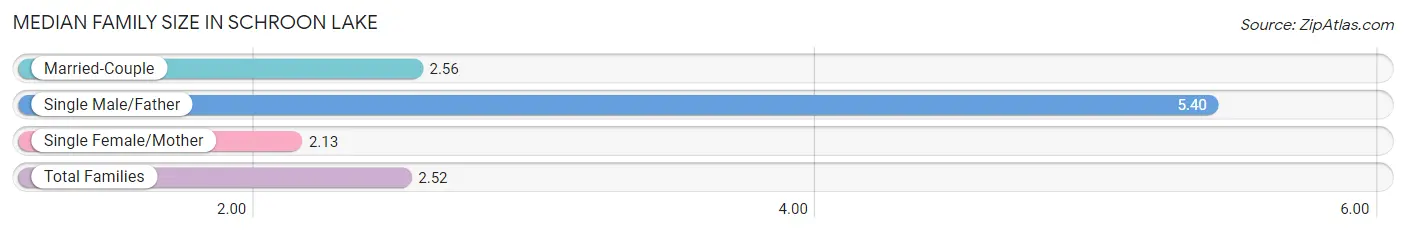
| Family Type | # Families | Family Size |
| Married-Couple | 248 (79.0%) | 2.56 |
| Single Male/Father | 5 (1.6%) | 5.40 |
| Single Female/Mother | 61 (19.4%) | 2.13 |
| Total Families | 314 (100.0%) | 2.52 |
Median Household Size in Schroon Lake
The median household size in Schroon Lake is 2.28 persons per household, with single male/father households (5 | 1.2%) accounting for the largest median household size of 5.4 persons per household. non-family households (90 | 22.3%) represent the smallest median household size with 1.24 persons per household.
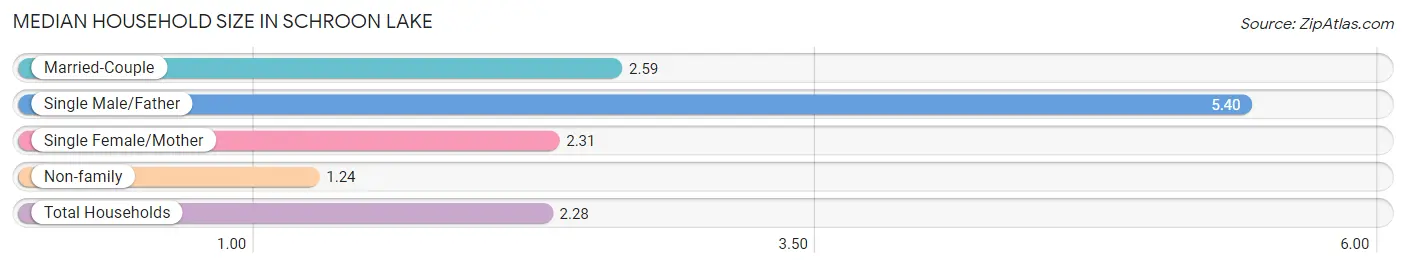
| Household Type | # Households | Household Size |
| Married-Couple | 248 (61.4%) | 2.59 |
| Single Male/Father | 5 (1.2%) | 5.40 |
| Single Female/Mother | 61 (15.1%) | 2.31 |
| Non-family | 90 (22.3%) | 1.24 |
| Total Households | 404 (100.0%) | 2.28 |
Household Size by Marriage Status in Schroon Lake
Out of a total of 404 households in Schroon Lake, 314 (77.7%) are family households, while 90 (22.3%) are nonfamily households. The most numerous type of family households are 2-person households, comprising 160, and the most common type of nonfamily households are 1-person households, comprising 76.
| Household Size | Family Households | Nonfamily Households |
| 1-Person Households | - | 76 (18.8%) |
| 2-Person Households | 160 (39.6%) | 5 (1.2%) |
| 3-Person Households | 50 (12.4%) | 9 (2.2%) |
| 4-Person Households | 96 (23.8%) | 0 (0.0%) |
| 5-Person Households | 5 (1.2%) | 0 (0.0%) |
| 6-Person Households | 3 (0.7%) | 0 (0.0%) |
| 7+ Person Households | 0 (0.0%) | 0 (0.0%) |
| Total | 314 (77.7%) | 90 (22.3%) |
Female Fertility in Schroon Lake
Fertility by Age in Schroon Lake
Average fertility rate in Schroon Lake is 34.0 births per 1,000 women. Women in the age bracket of 35 to 50 years have the highest fertility rate with 63.0 births per 1,000 women. Women in the age bracket of 35 to 50 years acount for 100.0% of all women with births.
| Age Bracket | Women with Births | Births / 1,000 Women |
| 15 to 19 years | 0 (0.0%) | 0.0 |
| 20 to 34 years | 0 (0.0%) | 0.0 |
| 35 to 50 years | 6 (100.0%) | 63.0 |
| Total | 6 (100.0%) | 34.0 |
Fertility by Age by Marriage Status in Schroon Lake
| Age Bracket | Married | Unmarried |
| 15 to 19 years | 0 (0.0%) | 0 (0.0%) |
| 20 to 34 years | 0 (0.0%) | 0 (0.0%) |
| 35 to 50 years | 6 (100.0%) | 0 (0.0%) |
| Total | 6 (100.0%) | 0 (0.0%) |
Fertility by Education in Schroon Lake
| Educational Attainment | Women with Births | Births / 1,000 Women |
| Less than High School | 0 (0.0%) | 0.0 |
| High School Diploma | 0 (0.0%) | 0.0 |
| College or Associate's Degree | 0 (0.0%) | 0.0 |
| Bachelor's Degree | 6 (100.0%) | 76.0 |
| Graduate Degree | 0 (0.0%) | 0.0 |
| Total | 6 (100.0%) | 34.0 |
Fertility by Education by Marriage Status in Schroon Lake
| Educational Attainment | Married | Unmarried |
| Less than High School | 0 (0.0%) | 0 (0.0%) |
| High School Diploma | 0 (0.0%) | 0 (0.0%) |
| College or Associate's Degree | 0 (0.0%) | 0 (0.0%) |
| Bachelor's Degree | 6 (100.0%) | 0 (0.0%) |
| Graduate Degree | 0 (0.0%) | 0 (0.0%) |
| Total | 6 (100.0%) | 0 (0.0%) |
Employment Characteristics in Schroon Lake
Employment by Class of Employer in Schroon Lake
Among the 399 employed individuals in Schroon Lake, private company employees (125 | 31.3%), not-for-profit organizations (123 | 30.8%), and state government employees (66 | 16.5%) make up the most common classes of employment.
| Employer Class | # Employees | % Employees |
| Private Company Employees | 125 | 31.3% |
| Self-Employed (Incorporated) | 10 | 2.5% |
| Self-Employed (Not Incorporated) | 51 | 12.8% |
| Not-for-profit Organizations | 123 | 30.8% |
| Local Government Employees | 14 | 3.5% |
| State Government Employees | 66 | 16.5% |
| Federal Government Employees | 5 | 1.3% |
| Unpaid Family Workers | 5 | 1.3% |
| Total | 399 | 100.0% |
Employment Status by Age in Schroon Lake
According to the labor force statistics for Schroon Lake, out of the total population over 16 years of age (787), 51.5% or 405 individuals are in the labor force, with 1.5% or 6 of them unemployed. The age group with the highest labor force participation rate is 25 to 29 years, with 93.5% or 43 individuals in the labor force. Within the labor force, the 35 to 44 years age range has the highest percentage of unemployed individuals, with 5.1% or 6 of them being unemployed.
| Age Bracket | In Labor Force | Unemployed |
| 16 to 19 Years | 6 (15.4%) | 0 (0.0%) |
| 20 to 24 Years | 51 (85.0%) | 0 (0.0%) |
| 25 to 29 Years | 43 (93.5%) | 0 (0.0%) |
| 30 to 34 Years | 7 (70.0%) | 0 (0.0%) |
| 35 to 44 Years | 117 (84.2%) | 6 (5.1%) |
| 45 to 54 Years | 94 (77.7%) | 0 (0.0%) |
| 55 to 59 Years | 39 (46.4%) | 0 (0.0%) |
| 60 to 64 Years | 16 (41.0%) | 0 (0.0%) |
| 65 to 74 Years | 25 (17.0%) | 0 (0.0%) |
| 75 Years and over | 7 (6.9%) | 0 (0.0%) |
| Total | 405 (51.5%) | 6 (1.5%) |
Employment Status by Educational Attainment in Schroon Lake
According to labor force statistics for Schroon Lake, 72.0% of individuals (316) out of the total population between 25 and 64 years of age (439) are in the labor force, with 1.9% or 6 of them being unemployed. The group with the highest labor force participation rate are those with the educational attainment of less than high school, with 100.0% or 12 individuals in the labor force. Within the labor force, individuals with less than high school education have the highest percentage of unemployment, with 50.0% or 6 of them being unemployed.
| Educational Attainment | In Labor Force | Unemployed |
| Less than High School | 12 (100.0%) | 6 (50.0%) |
| High School Diploma | 73 (67.6%) | 0 (0.0%) |
| College / Associate Degree | 107 (69.9%) | 0 (0.0%) |
| Bachelor's Degree or higher | 124 (74.7%) | 0 (0.0%) |
| Total | 316 (72.0%) | 8 (1.9%) |
Employment Occupations by Sex in Schroon Lake
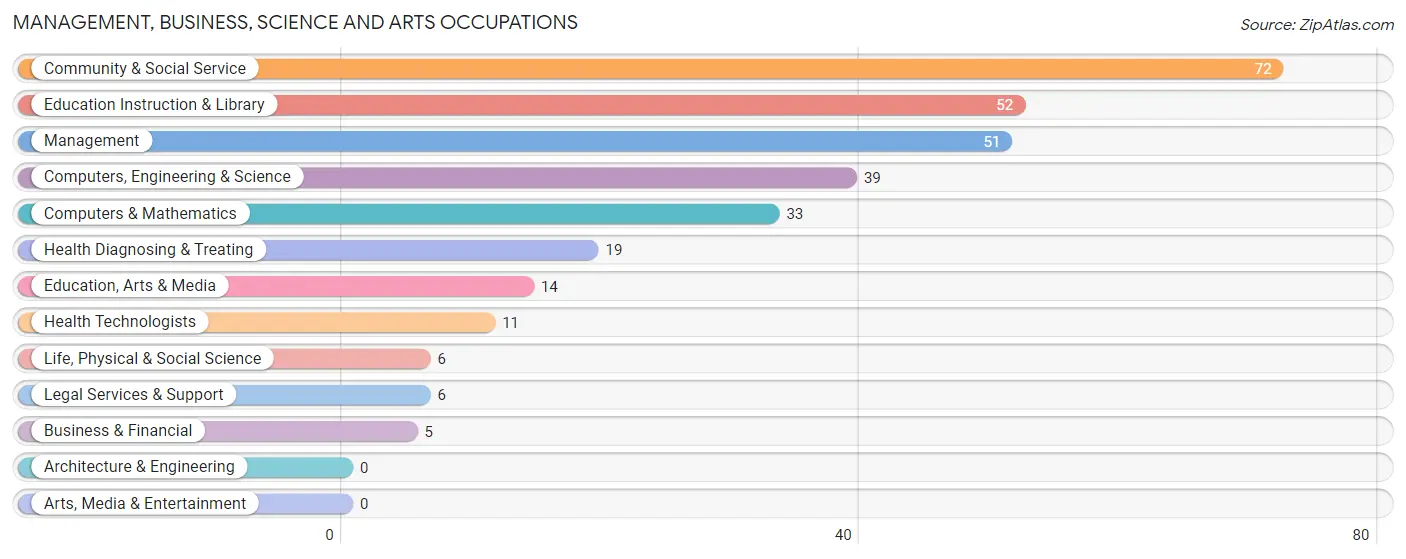
Management, Business, Science and Arts Occupations
The most common Management, Business, Science and Arts occupations in Schroon Lake are Community & Social Service (72 | 18.0%), Education Instruction & Library (52 | 13.0%), Management (51 | 12.8%), Computers, Engineering & Science (39 | 9.8%), and Computers & Mathematics (33 | 8.3%).
Management, Business, Science and Arts Occupations by Sex
Within the Management, Business, Science and Arts occupations in Schroon Lake, the most male-oriented occupations are Business & Financial (100.0%), Computers & Mathematics (100.0%), and Legal Services & Support (100.0%), while the most female-oriented occupations are Life, Physical & Social Science (100.0%), Education Instruction & Library (100.0%), and Health Diagnosing & Treating (100.0%).
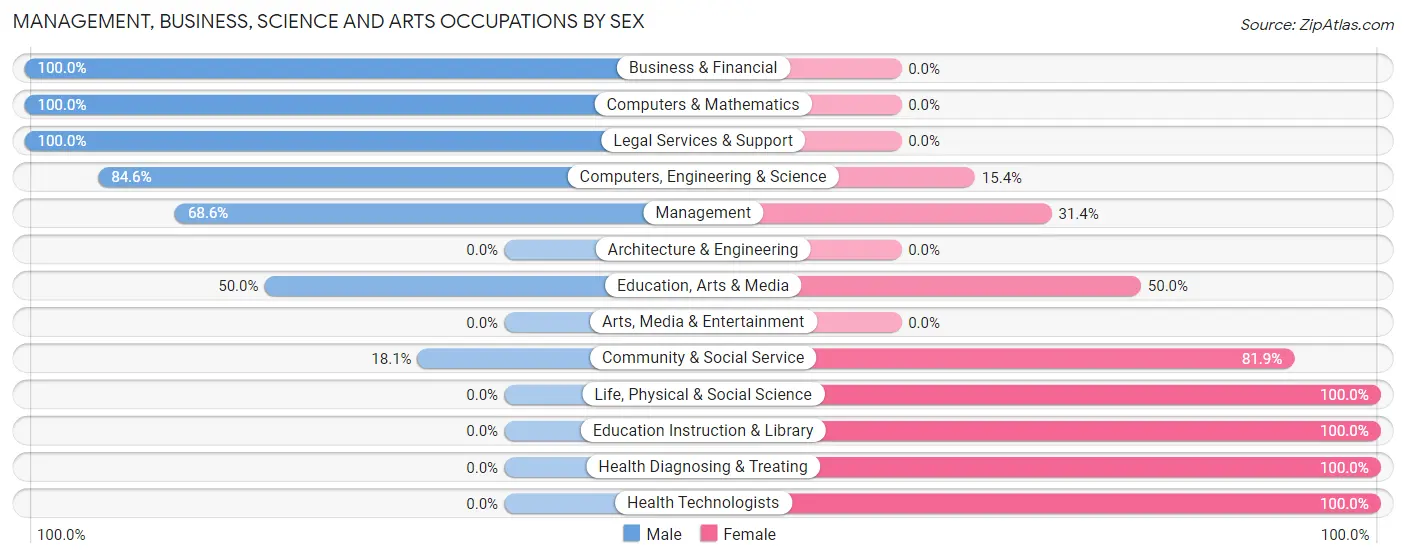
| Occupation | Male | Female |
| Management | 35 (68.6%) | 16 (31.4%) |
| Business & Financial | 5 (100.0%) | 0 (0.0%) |
| Computers, Engineering & Science | 33 (84.6%) | 6 (15.4%) |
| Computers & Mathematics | 33 (100.0%) | 0 (0.0%) |
| Architecture & Engineering | 0 (0.0%) | 0 (0.0%) |
| Life, Physical & Social Science | 0 (0.0%) | 6 (100.0%) |
| Community & Social Service | 13 (18.1%) | 59 (81.9%) |
| Education, Arts & Media | 7 (50.0%) | 7 (50.0%) |
| Legal Services & Support | 6 (100.0%) | 0 (0.0%) |
| Education Instruction & Library | 0 (0.0%) | 52 (100.0%) |
| Arts, Media & Entertainment | 0 (0.0%) | 0 (0.0%) |
| Health Diagnosing & Treating | 0 (0.0%) | 19 (100.0%) |
| Health Technologists | 0 (0.0%) | 11 (100.0%) |
| Total (Category) | 86 (46.2%) | 100 (53.8%) |
| Total (Overall) | 172 (43.1%) | 227 (56.9%) |
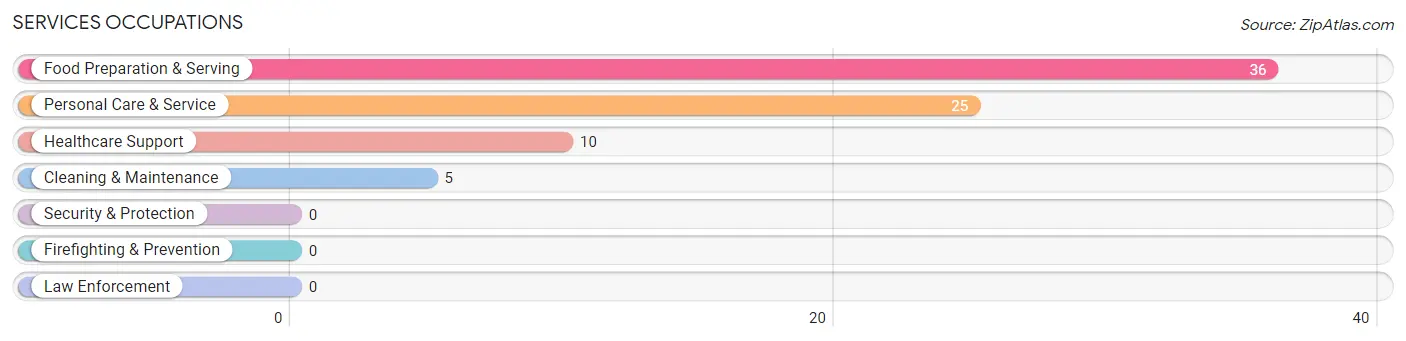
Services Occupations
The most common Services occupations in Schroon Lake are Food Preparation & Serving (36 | 9.0%), Personal Care & Service (25 | 6.3%), Healthcare Support (10 | 2.5%), and Cleaning & Maintenance (5 | 1.3%).
Services Occupations by Sex
Within the Services occupations in Schroon Lake, the most male-oriented occupations are Personal Care & Service (68.0%), and Food Preparation & Serving (16.7%), while the most female-oriented occupations are Healthcare Support (100.0%), Cleaning & Maintenance (100.0%), and Food Preparation & Serving (83.3%).
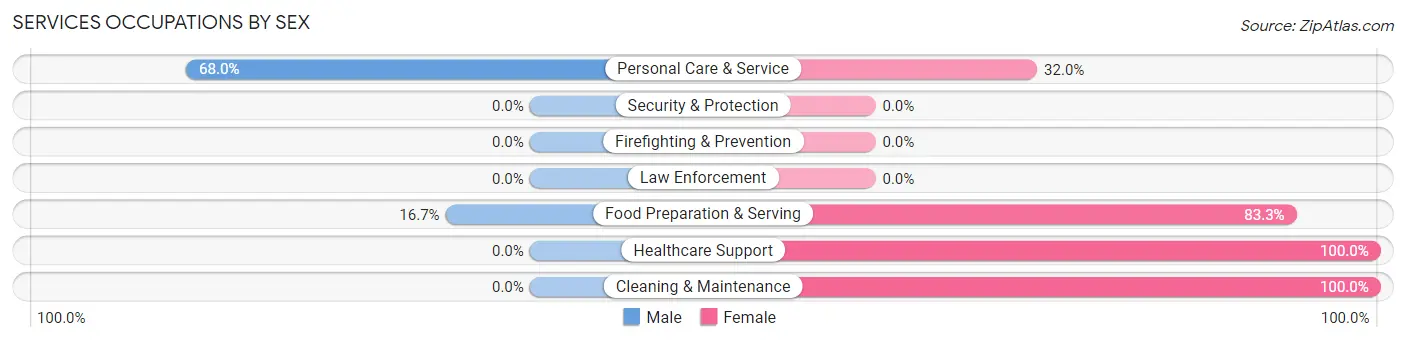
| Occupation | Male | Female |
| Healthcare Support | 0 (0.0%) | 10 (100.0%) |
| Security & Protection | 0 (0.0%) | 0 (0.0%) |
| Firefighting & Prevention | 0 (0.0%) | 0 (0.0%) |
| Law Enforcement | 0 (0.0%) | 0 (0.0%) |
| Food Preparation & Serving | 6 (16.7%) | 30 (83.3%) |
| Cleaning & Maintenance | 0 (0.0%) | 5 (100.0%) |
| Personal Care & Service | 17 (68.0%) | 8 (32.0%) |
| Total (Category) | 23 (30.3%) | 53 (69.7%) |
| Total (Overall) | 172 (43.1%) | 227 (56.9%) |
Sales and Office Occupations
The most common Sales and Office occupations in Schroon Lake are Office & Administration (74 | 18.5%), and Sales & Related (3 | 0.7%).
Sales and Office Occupations by Sex
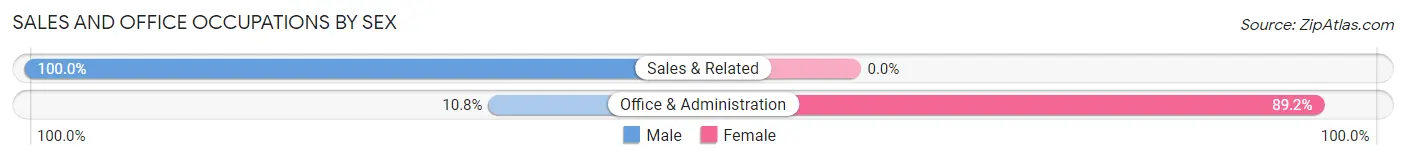
| Occupation | Male | Female |
| Sales & Related | 3 (100.0%) | 0 (0.0%) |
| Office & Administration | 8 (10.8%) | 66 (89.2%) |
| Total (Category) | 11 (14.3%) | 66 (85.7%) |
| Total (Overall) | 172 (43.1%) | 227 (56.9%) |
Natural Resources, Construction and Maintenance Occupations
The most common Natural Resources, Construction and Maintenance occupations in Schroon Lake are Construction & Extraction (30 | 7.5%), and Installation, Maintenance & Repair (15 | 3.8%).
Natural Resources, Construction and Maintenance Occupations by Sex
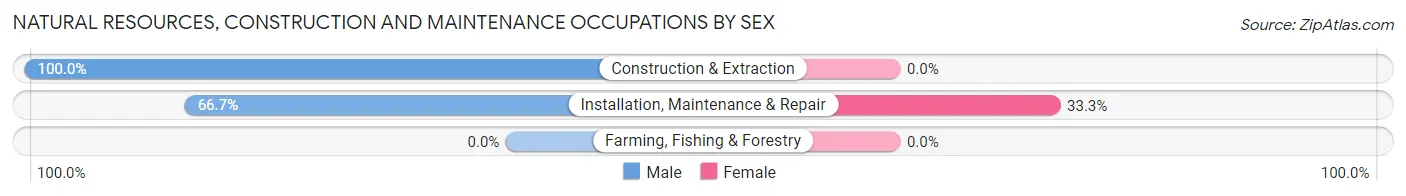
| Occupation | Male | Female |
| Farming, Fishing & Forestry | 0 (0.0%) | 0 (0.0%) |
| Construction & Extraction | 30 (100.0%) | 0 (0.0%) |
| Installation, Maintenance & Repair | 10 (66.7%) | 5 (33.3%) |
| Total (Category) | 40 (88.9%) | 5 (11.1%) |
| Total (Overall) | 172 (43.1%) | 227 (56.9%) |
Production, Transportation and Moving Occupations
The most common Production, Transportation and Moving occupations in Schroon Lake are Transportation (12 | 3.0%), and Production (3 | 0.7%).
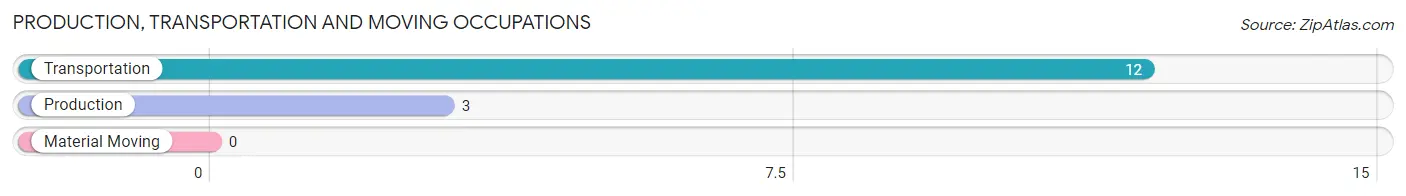
Production, Transportation and Moving Occupations by Sex
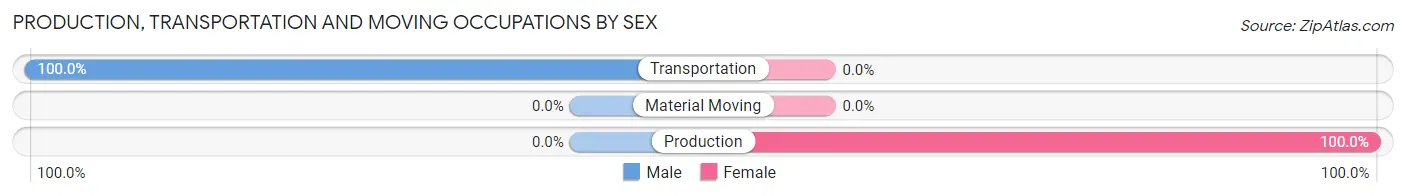
| Occupation | Male | Female |
| Production | 0 (0.0%) | 3 (100.0%) |
| Transportation | 12 (100.0%) | 0 (0.0%) |
| Material Moving | 0 (0.0%) | 0 (0.0%) |
| Total (Category) | 12 (80.0%) | 3 (20.0%) |
| Total (Overall) | 172 (43.1%) | 227 (56.9%) |
Employment Industries by Sex in Schroon Lake
Employment Industries in Schroon Lake
The major employment industries in Schroon Lake include Educational Services (106 | 26.6%), Construction (55 | 13.8%), Accommodation & Food Services (34 | 8.5%), Health Care & Social Assistance (23 | 5.8%), and Finance & Insurance (21 | 5.3%).
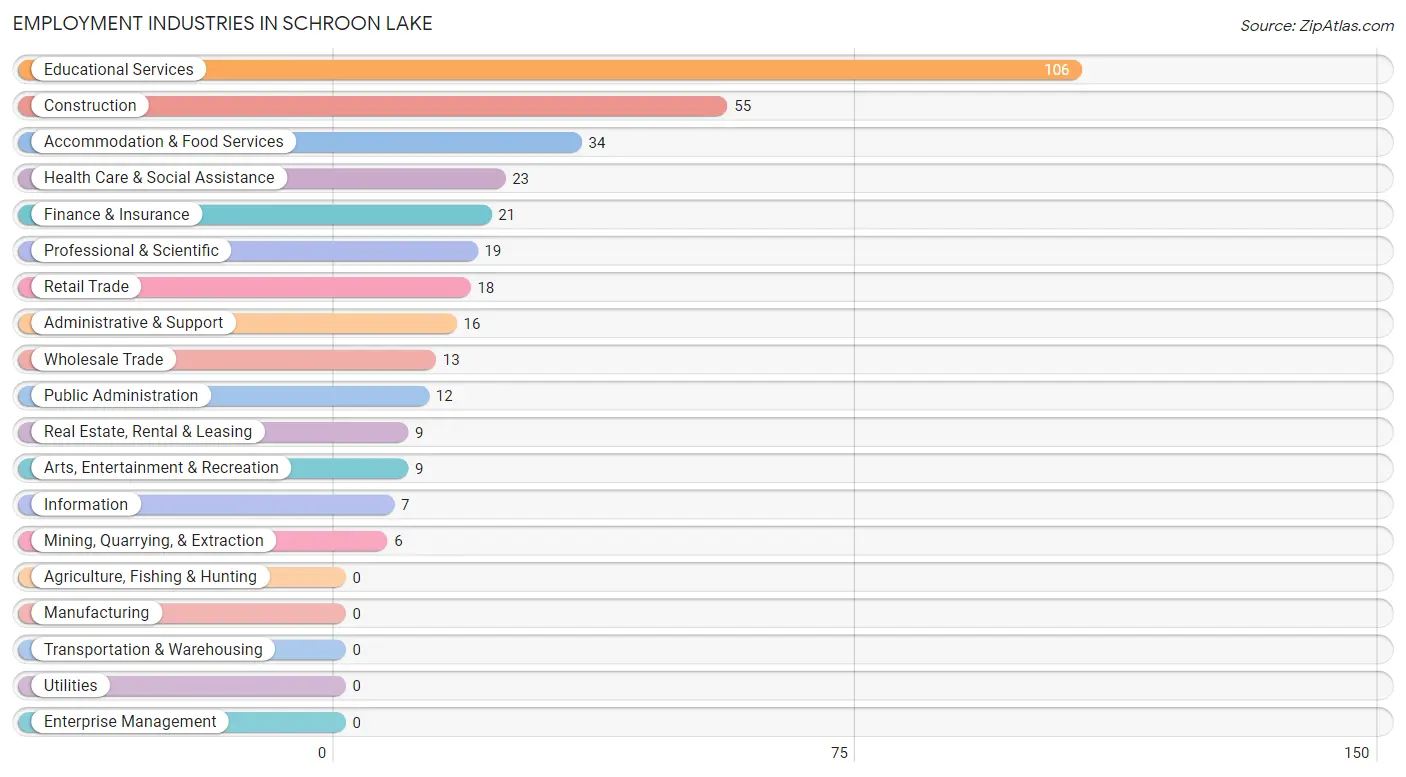
Employment Industries by Sex in Schroon Lake
The Schroon Lake industries that see more men than women are Mining, Quarrying, & Extraction (100.0%), Arts, Entertainment & Recreation (100.0%), and Construction (80.0%), whereas the industries that tend to have a higher number of women are Information (100.0%), Real Estate, Rental & Leasing (100.0%), and Health Care & Social Assistance (100.0%).
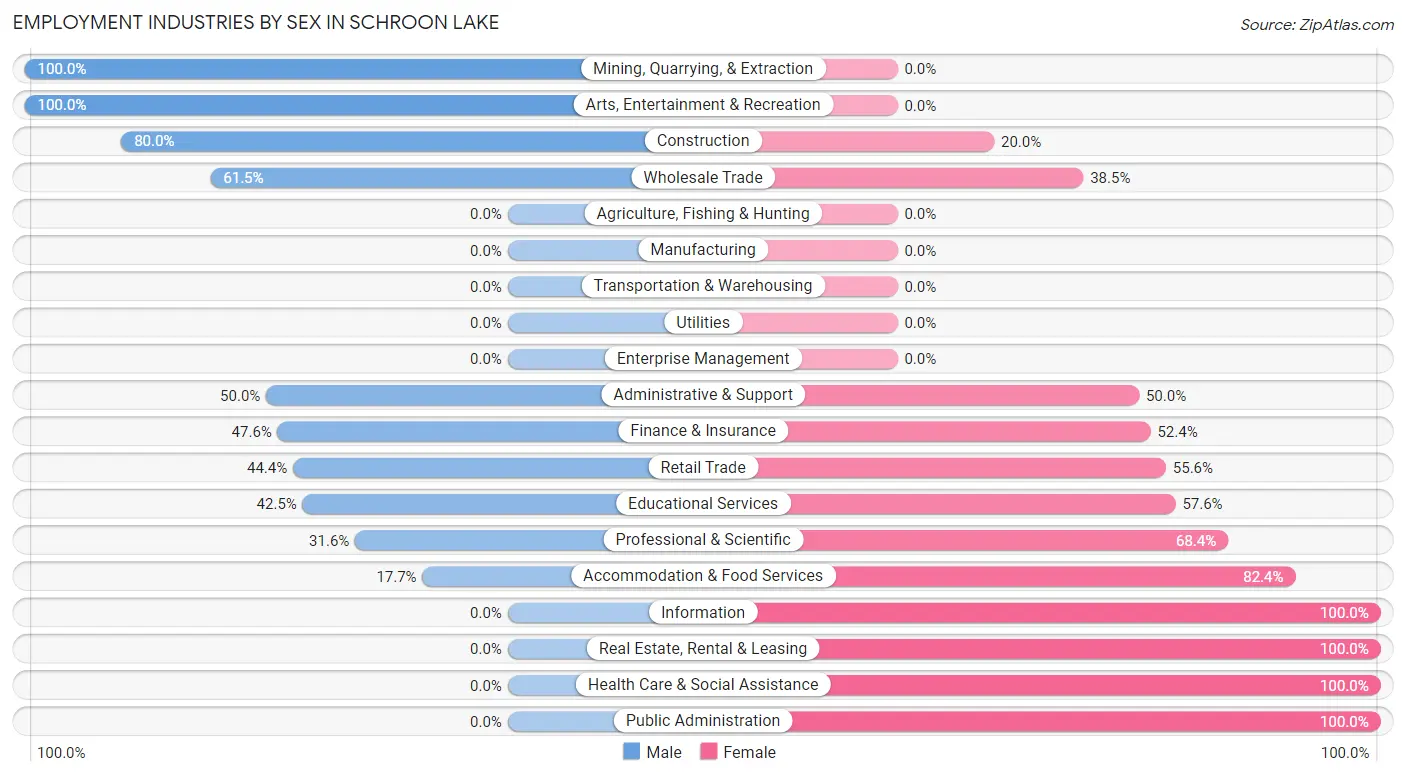
| Industry | Male | Female |
| Agriculture, Fishing & Hunting | 0 (0.0%) | 0 (0.0%) |
| Mining, Quarrying, & Extraction | 6 (100.0%) | 0 (0.0%) |
| Construction | 44 (80.0%) | 11 (20.0%) |
| Manufacturing | 0 (0.0%) | 0 (0.0%) |
| Wholesale Trade | 8 (61.5%) | 5 (38.5%) |
| Retail Trade | 8 (44.4%) | 10 (55.6%) |
| Transportation & Warehousing | 0 (0.0%) | 0 (0.0%) |
| Utilities | 0 (0.0%) | 0 (0.0%) |
| Information | 0 (0.0%) | 7 (100.0%) |
| Finance & Insurance | 10 (47.6%) | 11 (52.4%) |
| Real Estate, Rental & Leasing | 0 (0.0%) | 9 (100.0%) |
| Professional & Scientific | 6 (31.6%) | 13 (68.4%) |
| Enterprise Management | 0 (0.0%) | 0 (0.0%) |
| Administrative & Support | 8 (50.0%) | 8 (50.0%) |
| Educational Services | 45 (42.4%) | 61 (57.6%) |
| Health Care & Social Assistance | 0 (0.0%) | 23 (100.0%) |
| Arts, Entertainment & Recreation | 9 (100.0%) | 0 (0.0%) |
| Accommodation & Food Services | 6 (17.6%) | 28 (82.4%) |
| Public Administration | 0 (0.0%) | 12 (100.0%) |
| Total | 172 (43.1%) | 227 (56.9%) |
Education in Schroon Lake
School Enrollment in Schroon Lake
The most common levels of schooling among the 181 students in Schroon Lake are elementary school (94 | 51.9%), college / undergraduate (31 | 17.1%), and high school (22 | 12.1%).
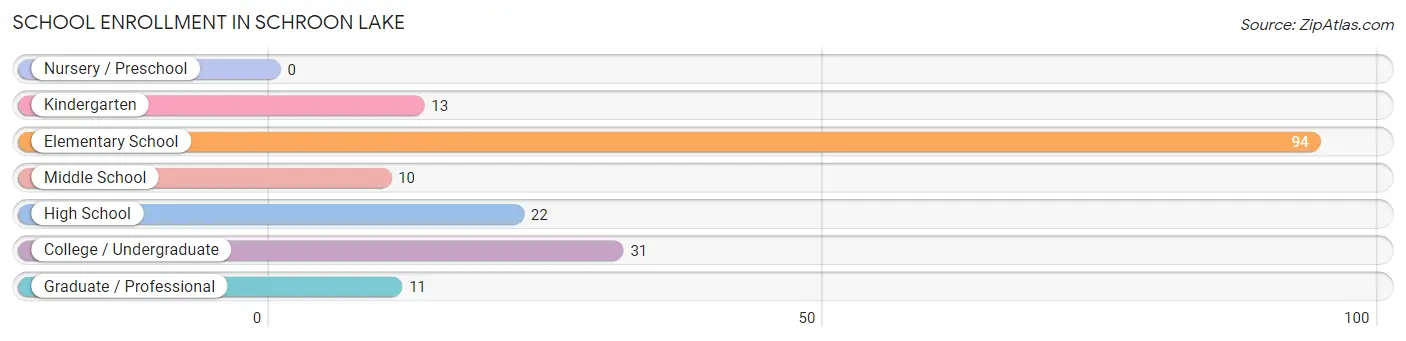
| School Level | # Students | % Students |
| Nursery / Preschool | 0 | 0.0% |
| Kindergarten | 13 | 7.2% |
| Elementary School | 94 | 51.9% |
| Middle School | 10 | 5.5% |
| High School | 22 | 12.1% |
| College / Undergraduate | 31 | 17.1% |
| Graduate / Professional | 11 | 6.1% |
| Total | 181 | 100.0% |
School Enrollment by Age by Funding Source in Schroon Lake
Out of a total of 181 students who are enrolled in schools in Schroon Lake, 42 (23.2%) attend a private institution, while the remaining 139 (76.8%) are enrolled in public schools. The age group of 35 years and over has the highest likelihood of being enrolled in private schools, with 27 (100.0% in the age bracket) enrolled. Conversely, the age group of 15 to 17 year olds has the lowest likelihood of being enrolled in a private school, with 22 (100.0% in the age bracket) attending a public institution.
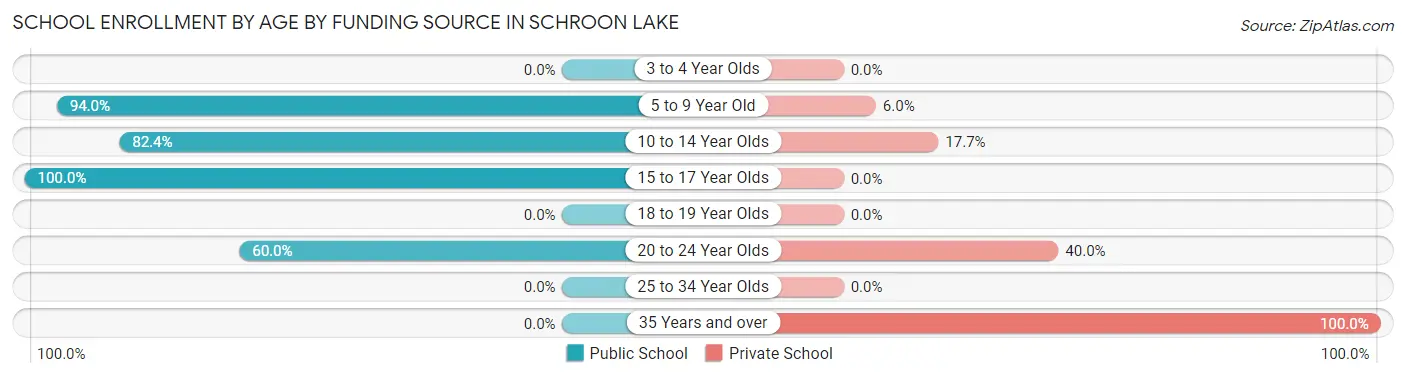
| Age Bracket | Public School | Private School |
| 3 to 4 Year Olds | 0 (0.0%) | 0 (0.0%) |
| 5 to 9 Year Old | 94 (94.0%) | 6 (6.0%) |
| 10 to 14 Year Olds | 14 (82.4%) | 3 (17.6%) |
| 15 to 17 Year Olds | 22 (100.0%) | 0 (0.0%) |
| 18 to 19 Year Olds | 0 (0.0%) | 0 (0.0%) |
| 20 to 24 Year Olds | 9 (60.0%) | 6 (40.0%) |
| 25 to 34 Year Olds | 0 (0.0%) | 0 (0.0%) |
| 35 Years and over | 0 (0.0%) | 27 (100.0%) |
| Total | 139 (76.8%) | 42 (23.2%) |
Educational Attainment by Field of Study in Schroon Lake
Education (82 | 31.1%), liberal arts & history (39 | 14.8%), business (31 | 11.7%), science & technology (25 | 9.5%), and literature & languages (23 | 8.7%) are the most common fields of study among 264 individuals in Schroon Lake who have obtained a bachelor's degree or higher.
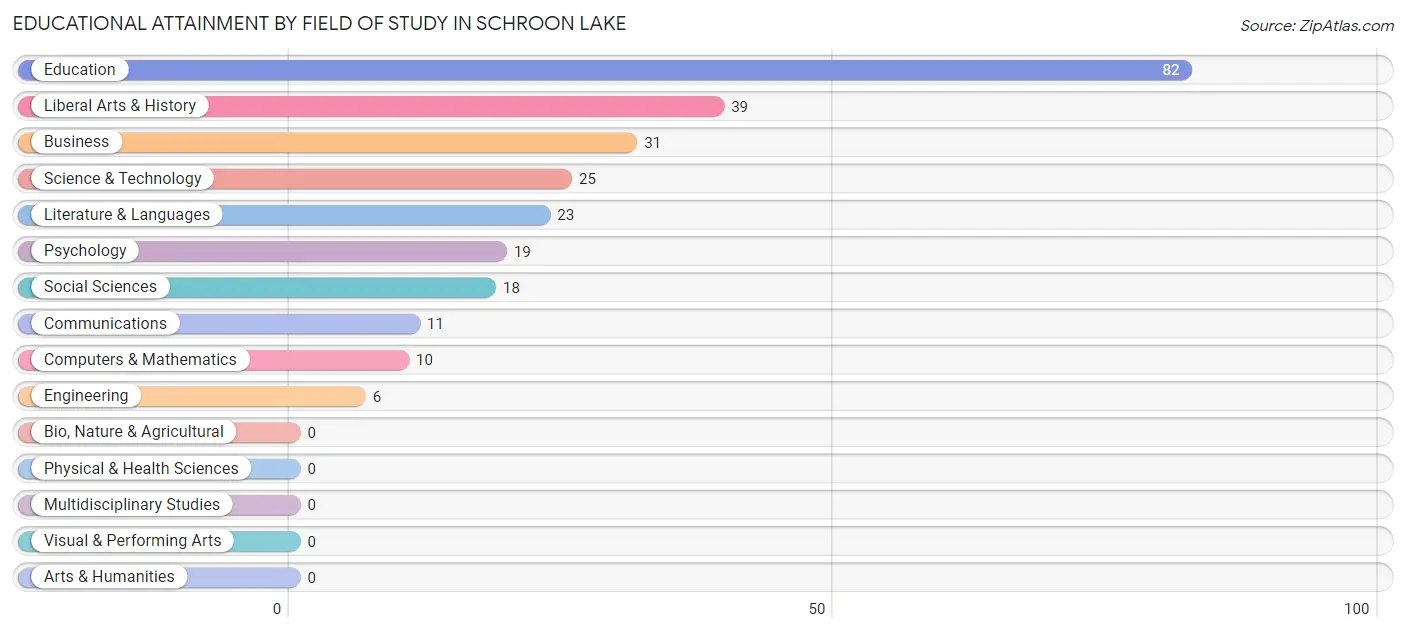
| Field of Study | # Graduates | % Graduates |
| Computers & Mathematics | 10 | 3.8% |
| Bio, Nature & Agricultural | 0 | 0.0% |
| Physical & Health Sciences | 0 | 0.0% |
| Psychology | 19 | 7.2% |
| Social Sciences | 18 | 6.8% |
| Engineering | 6 | 2.3% |
| Multidisciplinary Studies | 0 | 0.0% |
| Science & Technology | 25 | 9.5% |
| Business | 31 | 11.7% |
| Education | 82 | 31.1% |
| Literature & Languages | 23 | 8.7% |
| Liberal Arts & History | 39 | 14.8% |
| Visual & Performing Arts | 0 | 0.0% |
| Communications | 11 | 4.2% |
| Arts & Humanities | 0 | 0.0% |
| Total | 264 | 100.0% |
Transportation & Commute in Schroon Lake
Vehicle Availability by Sex in Schroon Lake
The most prevalent vehicle ownership categories in Schroon Lake are males with 2 vehicles (91, accounting for 52.9%) and females with 2 vehicles (88, making up 40.1%).
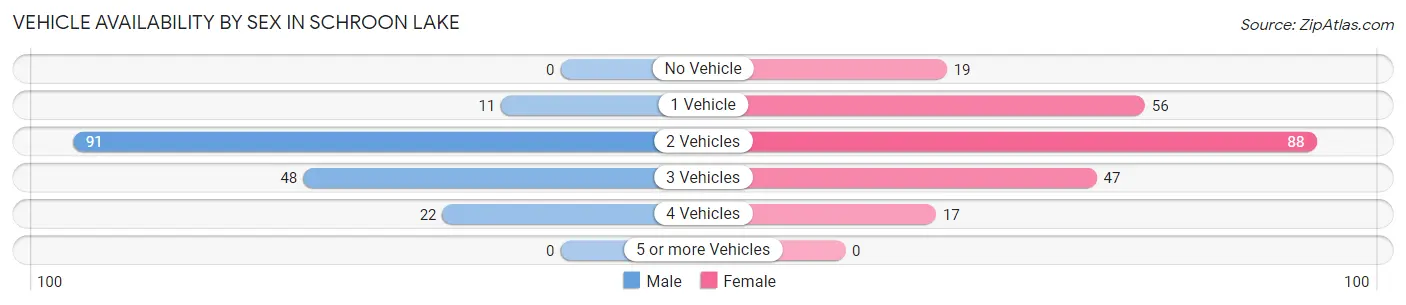
| Vehicles Available | Male | Female |
| No Vehicle | 0 (0.0%) | 19 (8.4%) |
| 1 Vehicle | 11 (6.4%) | 56 (24.7%) |
| 2 Vehicles | 91 (52.9%) | 88 (38.8%) |
| 3 Vehicles | 48 (27.9%) | 47 (20.7%) |
| 4 Vehicles | 22 (12.8%) | 17 (7.5%) |
| 5 or more Vehicles | 0 (0.0%) | 0 (0.0%) |
| Total | 172 (100.0%) | 227 (100.0%) |
Commute Time in Schroon Lake
The most frequently occuring commute durations in Schroon Lake are 5 to 9 minutes (82 commuters, 30.5%), less than 5 minutes (47 commuters, 17.5%), and 10 to 14 minutes (30 commuters, 11.2%).
| Commute Time | # Commuters | % Commuters |
| Less than 5 Minutes | 47 | 17.5% |
| 5 to 9 Minutes | 82 | 30.5% |
| 10 to 14 Minutes | 30 | 11.2% |
| 15 to 19 Minutes | 21 | 7.8% |
| 20 to 24 Minutes | 21 | 7.8% |
| 25 to 29 Minutes | 0 | 0.0% |
| 30 to 34 Minutes | 27 | 10.0% |
| 35 to 39 Minutes | 23 | 8.6% |
| 40 to 44 Minutes | 0 | 0.0% |
| 45 to 59 Minutes | 10 | 3.7% |
| 60 to 89 Minutes | 8 | 3.0% |
| 90 or more Minutes | 0 | 0.0% |
Commute Time by Sex in Schroon Lake
The most common commute times in Schroon Lake are 10 to 14 minutes (24 commuters, 22.0%) for males and 5 to 9 minutes (71 commuters, 44.4%) for females.
| Commute Time | Male | Female |
| Less than 5 Minutes | 22 (20.2%) | 25 (15.6%) |
| 5 to 9 Minutes | 11 (10.1%) | 71 (44.4%) |
| 10 to 14 Minutes | 24 (22.0%) | 6 (3.7%) |
| 15 to 19 Minutes | 10 (9.2%) | 11 (6.9%) |
| 20 to 24 Minutes | 1 (0.9%) | 20 (12.5%) |
| 25 to 29 Minutes | 0 (0.0%) | 0 (0.0%) |
| 30 to 34 Minutes | 21 (19.3%) | 6 (3.7%) |
| 35 to 39 Minutes | 17 (15.6%) | 6 (3.7%) |
| 40 to 44 Minutes | 0 (0.0%) | 0 (0.0%) |
| 45 to 59 Minutes | 3 (2.8%) | 7 (4.4%) |
| 60 to 89 Minutes | 0 (0.0%) | 8 (5.0%) |
| 90 or more Minutes | 0 (0.0%) | 0 (0.0%) |
Time of Departure to Work by Sex in Schroon Lake
The most frequent times of departure to work in Schroon Lake are 7:30 AM to 7:59 AM (38, 34.9%) for males and 8:00 AM to 8:29 AM (40, 25.0%) for females.
| Time of Departure | Male | Female |
| 12:00 AM to 4:59 AM | 0 (0.0%) | 0 (0.0%) |
| 5:00 AM to 5:29 AM | 0 (0.0%) | 0 (0.0%) |
| 5:30 AM to 5:59 AM | 8 (7.3%) | 8 (5.0%) |
| 6:00 AM to 6:29 AM | 11 (10.1%) | 11 (6.9%) |
| 6:30 AM to 6:59 AM | 0 (0.0%) | 10 (6.2%) |
| 7:00 AM to 7:29 AM | 9 (8.3%) | 21 (13.1%) |
| 7:30 AM to 7:59 AM | 38 (34.9%) | 33 (20.6%) |
| 8:00 AM to 8:29 AM | 25 (22.9%) | 40 (25.0%) |
| 8:30 AM to 8:59 AM | 0 (0.0%) | 5 (3.1%) |
| 9:00 AM to 9:59 AM | 10 (9.2%) | 14 (8.7%) |
| 10:00 AM to 10:59 AM | 0 (0.0%) | 5 (3.1%) |
| 11:00 AM to 11:59 AM | 0 (0.0%) | 0 (0.0%) |
| 12:00 PM to 3:59 PM | 8 (7.3%) | 13 (8.1%) |
| 4:00 PM to 11:59 PM | 0 (0.0%) | 0 (0.0%) |
| Total | 109 (100.0%) | 160 (100.0%) |
Housing Occupancy in Schroon Lake
Occupancy by Ownership in Schroon Lake
Of the total 404 dwellings in Schroon Lake, owner-occupied units account for 268 (66.3%), while renter-occupied units make up 136 (33.7%).
| Occupancy | # Housing Units | % Housing Units |
| Owner Occupied Housing Units | 268 | 66.3% |
| Renter-Occupied Housing Units | 136 | 33.7% |
| Total Occupied Housing Units | 404 | 100.0% |
Occupancy by Household Size in Schroon Lake
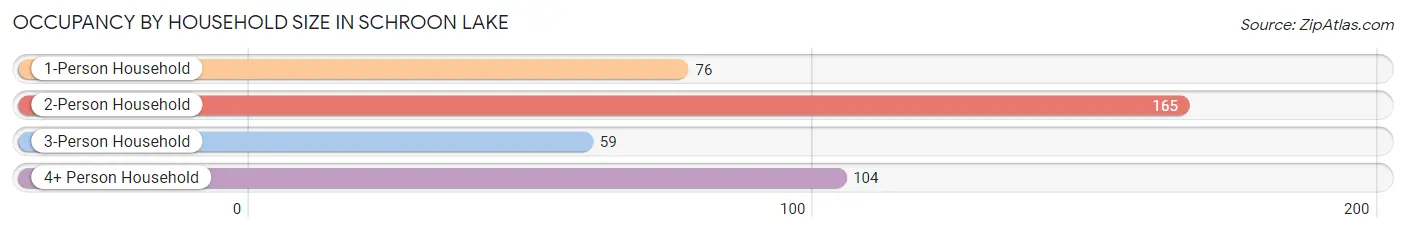
| Household Size | # Housing Units | % Housing Units |
| 1-Person Household | 76 | 18.8% |
| 2-Person Household | 165 | 40.8% |
| 3-Person Household | 59 | 14.6% |
| 4+ Person Household | 104 | 25.7% |
| Total Housing Units | 404 | 100.0% |
Occupancy by Ownership by Household Size in Schroon Lake
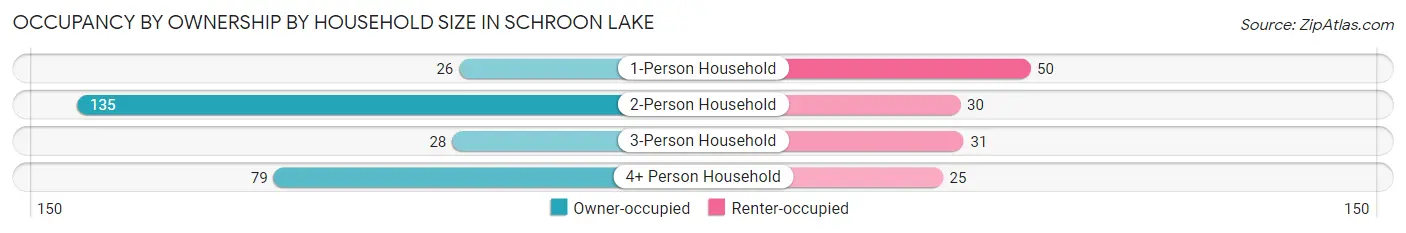
| Household Size | Owner-occupied | Renter-occupied |
| 1-Person Household | 26 (34.2%) | 50 (65.8%) |
| 2-Person Household | 135 (81.8%) | 30 (18.2%) |
| 3-Person Household | 28 (47.5%) | 31 (52.5%) |
| 4+ Person Household | 79 (76.0%) | 25 (24.0%) |
| Total Housing Units | 268 (66.3%) | 136 (33.7%) |
Occupancy by Educational Attainment in Schroon Lake
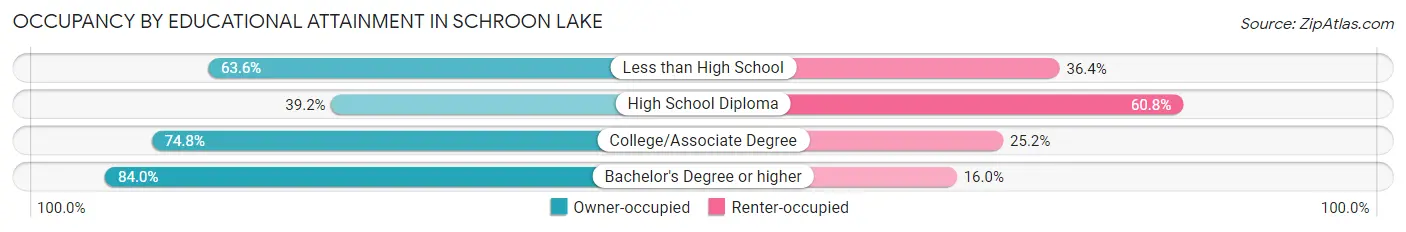
| Household Size | Owner-occupied | Renter-occupied |
| Less than High School | 14 (63.6%) | 8 (36.4%) |
| High School Diploma | 47 (39.2%) | 73 (60.8%) |
| College/Associate Degree | 107 (74.8%) | 36 (25.2%) |
| Bachelor's Degree or higher | 100 (84.0%) | 19 (16.0%) |
Occupancy by Age of Householder in Schroon Lake
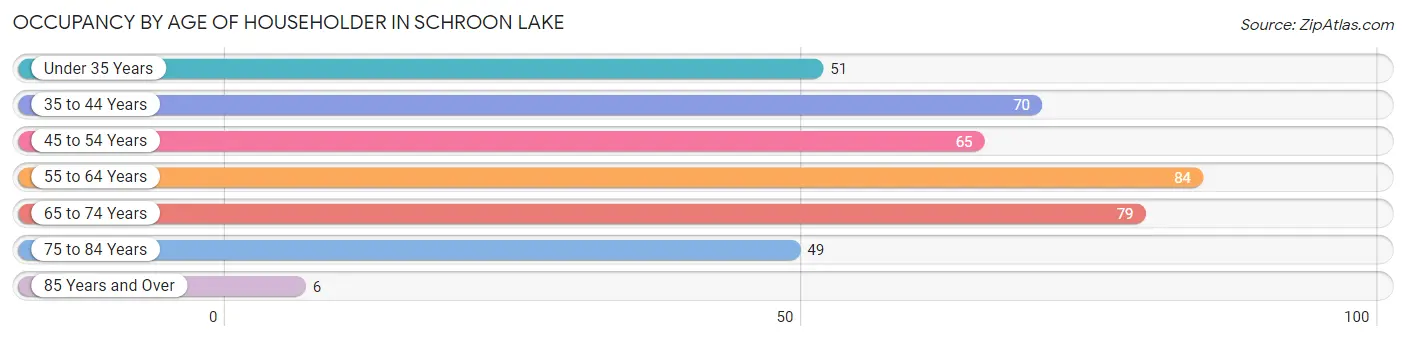
| Age Bracket | # Households | % Households |
| Under 35 Years | 51 | 12.6% |
| 35 to 44 Years | 70 | 17.3% |
| 45 to 54 Years | 65 | 16.1% |
| 55 to 64 Years | 84 | 20.8% |
| 65 to 74 Years | 79 | 19.6% |
| 75 to 84 Years | 49 | 12.1% |
| 85 Years and Over | 6 | 1.5% |
| Total | 404 | 100.0% |
Housing Finances in Schroon Lake
Median Income by Occupancy in Schroon Lake
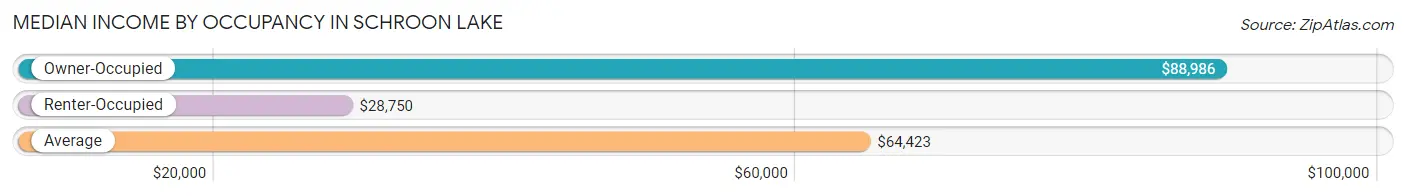
| Occupancy Type | # Households | Median Income |
| Owner-Occupied | 268 (66.3%) | $88,986 |
| Renter-Occupied | 136 (33.7%) | $28,750 |
| Average | 404 (100.0%) | $64,423 |
Occupancy by Householder Income Bracket in Schroon Lake
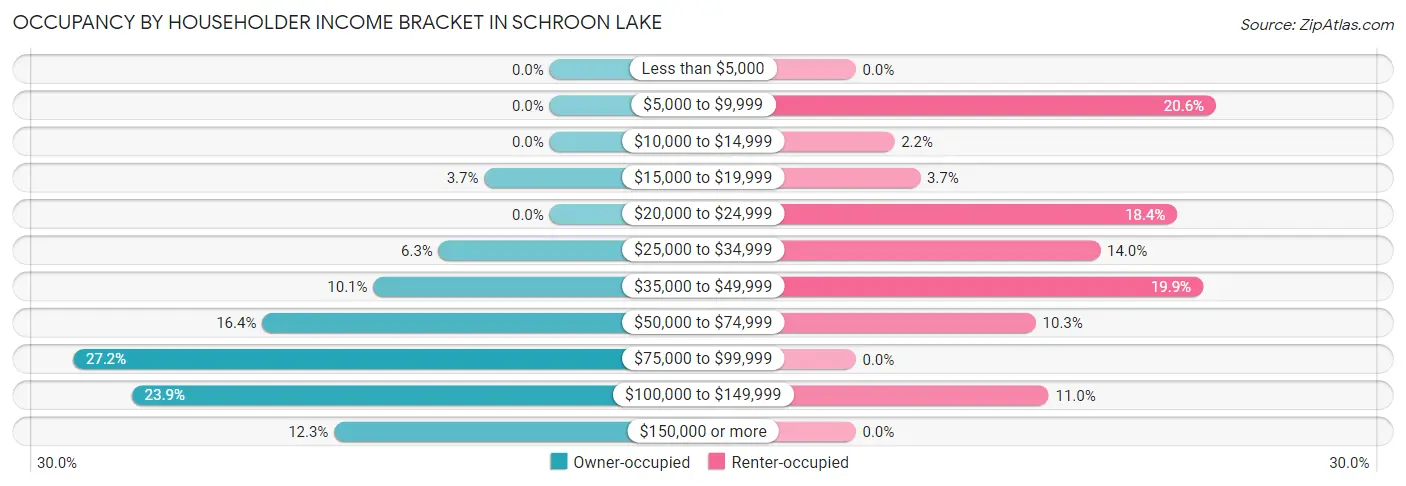
| Income Bracket | Owner-occupied | Renter-occupied |
| Less than $5,000 | 0 (0.0%) | 0 (0.0%) |
| $5,000 to $9,999 | 0 (0.0%) | 28 (20.6%) |
| $10,000 to $14,999 | 0 (0.0%) | 3 (2.2%) |
| $15,000 to $19,999 | 10 (3.7%) | 5 (3.7%) |
| $20,000 to $24,999 | 0 (0.0%) | 25 (18.4%) |
| $25,000 to $34,999 | 17 (6.3%) | 19 (14.0%) |
| $35,000 to $49,999 | 27 (10.1%) | 27 (19.9%) |
| $50,000 to $74,999 | 44 (16.4%) | 14 (10.3%) |
| $75,000 to $99,999 | 73 (27.2%) | 0 (0.0%) |
| $100,000 to $149,999 | 64 (23.9%) | 15 (11.0%) |
| $150,000 or more | 33 (12.3%) | 0 (0.0%) |
| Total | 268 (100.0%) | 136 (100.0%) |
Monthly Housing Cost Tiers in Schroon Lake
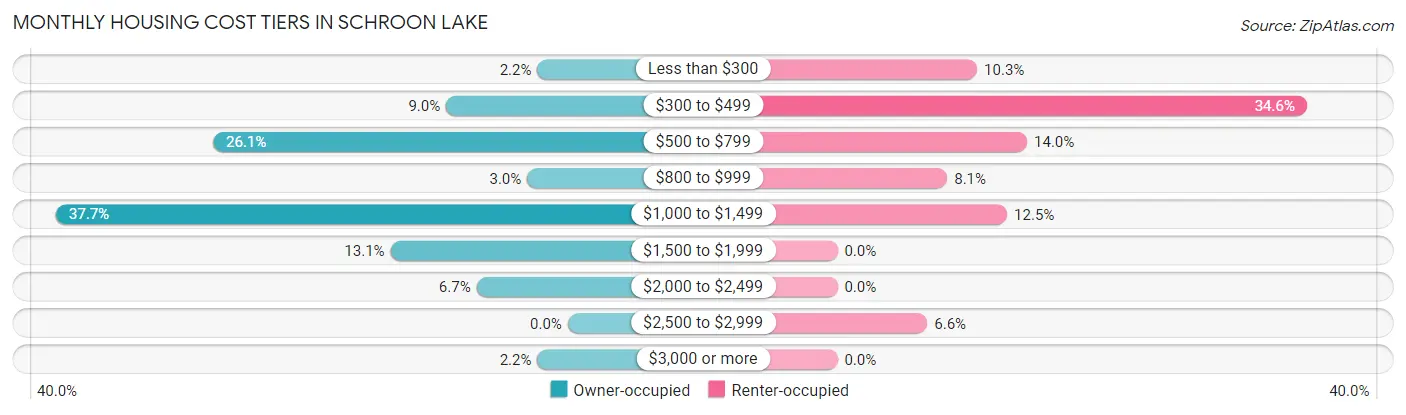
| Monthly Cost | Owner-occupied | Renter-occupied |
| Less than $300 | 6 (2.2%) | 14 (10.3%) |
| $300 to $499 | 24 (9.0%) | 47 (34.6%) |
| $500 to $799 | 70 (26.1%) | 19 (14.0%) |
| $800 to $999 | 8 (3.0%) | 11 (8.1%) |
| $1,000 to $1,499 | 101 (37.7%) | 17 (12.5%) |
| $1,500 to $1,999 | 35 (13.1%) | 0 (0.0%) |
| $2,000 to $2,499 | 18 (6.7%) | 0 (0.0%) |
| $2,500 to $2,999 | 0 (0.0%) | 9 (6.6%) |
| $3,000 or more | 6 (2.2%) | 0 (0.0%) |
| Total | 268 (100.0%) | 136 (100.0%) |
Physical Housing Characteristics in Schroon Lake
Housing Structures in Schroon Lake
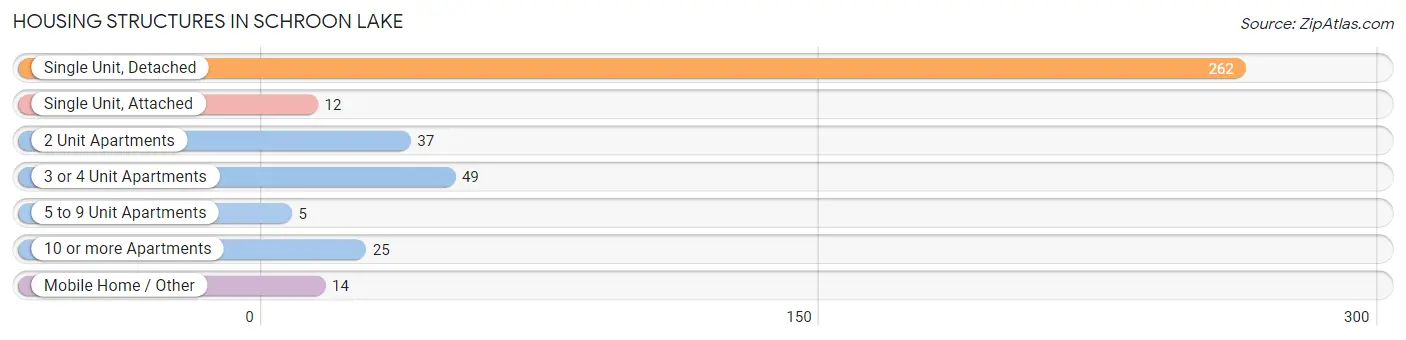
| Structure Type | # Housing Units | % Housing Units |
| Single Unit, Detached | 262 | 64.8% |
| Single Unit, Attached | 12 | 3.0% |
| 2 Unit Apartments | 37 | 9.2% |
| 3 or 4 Unit Apartments | 49 | 12.1% |
| 5 to 9 Unit Apartments | 5 | 1.2% |
| 10 or more Apartments | 25 | 6.2% |
| Mobile Home / Other | 14 | 3.5% |
| Total | 404 | 100.0% |
Housing Structures by Occupancy in Schroon Lake
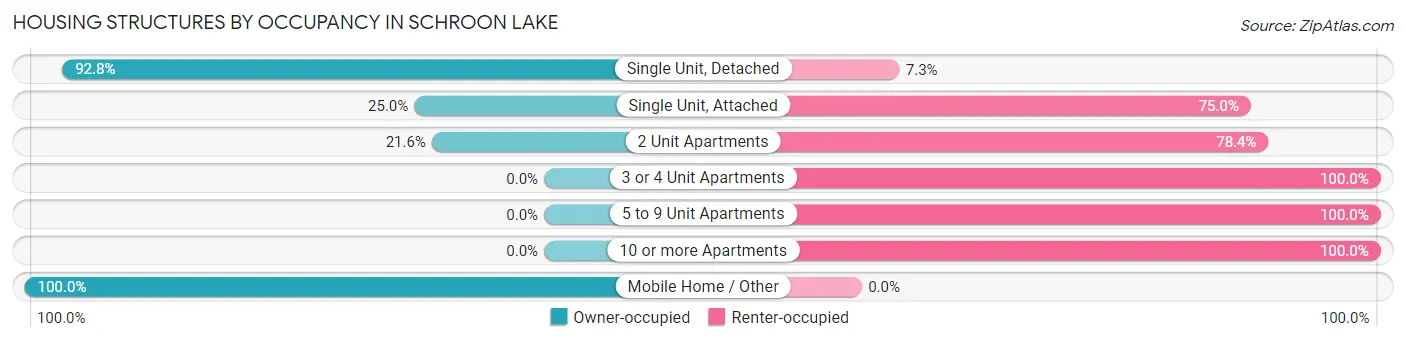
| Structure Type | Owner-occupied | Renter-occupied |
| Single Unit, Detached | 243 (92.7%) | 19 (7.2%) |
| Single Unit, Attached | 3 (25.0%) | 9 (75.0%) |
| 2 Unit Apartments | 8 (21.6%) | 29 (78.4%) |
| 3 or 4 Unit Apartments | 0 (0.0%) | 49 (100.0%) |
| 5 to 9 Unit Apartments | 0 (0.0%) | 5 (100.0%) |
| 10 or more Apartments | 0 (0.0%) | 25 (100.0%) |
| Mobile Home / Other | 14 (100.0%) | 0 (0.0%) |
| Total | 268 (66.3%) | 136 (33.7%) |
Housing Structures by Number of Rooms in Schroon Lake
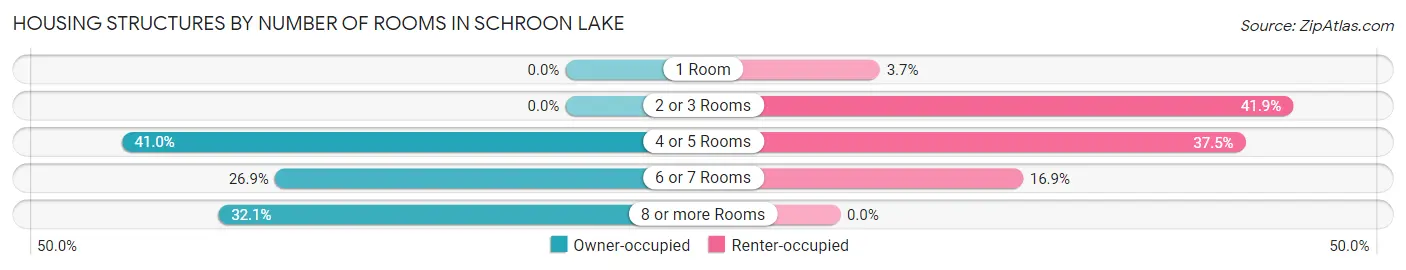
| Number of Rooms | Owner-occupied | Renter-occupied |
| 1 Room | 0 (0.0%) | 5 (3.7%) |
| 2 or 3 Rooms | 0 (0.0%) | 57 (41.9%) |
| 4 or 5 Rooms | 110 (41.0%) | 51 (37.5%) |
| 6 or 7 Rooms | 72 (26.9%) | 23 (16.9%) |
| 8 or more Rooms | 86 (32.1%) | 0 (0.0%) |
| Total | 268 (100.0%) | 136 (100.0%) |
Housing Structure by Heating Type in Schroon Lake
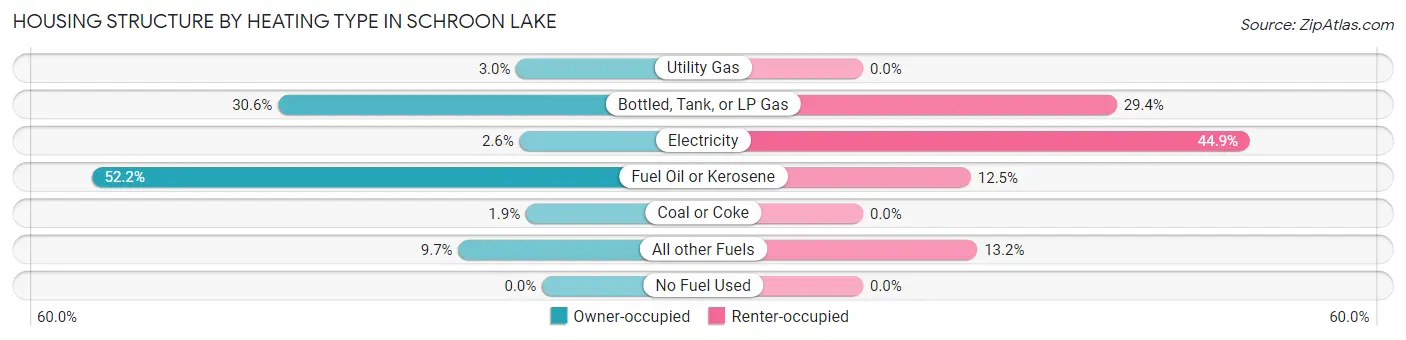
| Heating Type | Owner-occupied | Renter-occupied |
| Utility Gas | 8 (3.0%) | 0 (0.0%) |
| Bottled, Tank, or LP Gas | 82 (30.6%) | 40 (29.4%) |
| Electricity | 7 (2.6%) | 61 (44.9%) |
| Fuel Oil or Kerosene | 140 (52.2%) | 17 (12.5%) |
| Coal or Coke | 5 (1.9%) | 0 (0.0%) |
| All other Fuels | 26 (9.7%) | 18 (13.2%) |
| No Fuel Used | 0 (0.0%) | 0 (0.0%) |
| Total | 268 (100.0%) | 136 (100.0%) |
Household Vehicle Usage in Schroon Lake
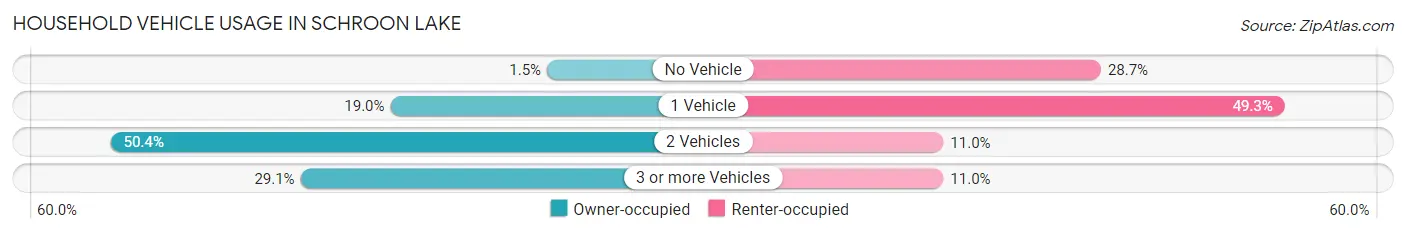
| Vehicles per Household | Owner-occupied | Renter-occupied |
| No Vehicle | 4 (1.5%) | 39 (28.7%) |
| 1 Vehicle | 51 (19.0%) | 67 (49.3%) |
| 2 Vehicles | 135 (50.4%) | 15 (11.0%) |
| 3 or more Vehicles | 78 (29.1%) | 15 (11.0%) |
| Total | 268 (100.0%) | 136 (100.0%) |
Real Estate & Mortgages in Schroon Lake
Real Estate and Mortgage Overview in Schroon Lake
| Characteristic | Without Mortgage | With Mortgage |
| Housing Units | 124 | 144 |
| Median Property Value | $302,900 | $211,800 |
| Median Household Income | $71,389 | $12 |
| Monthly Housing Costs | $631 | $6 |
| Real Estate Taxes | $3,578 | $0 |
Property Value by Mortgage Status in Schroon Lake
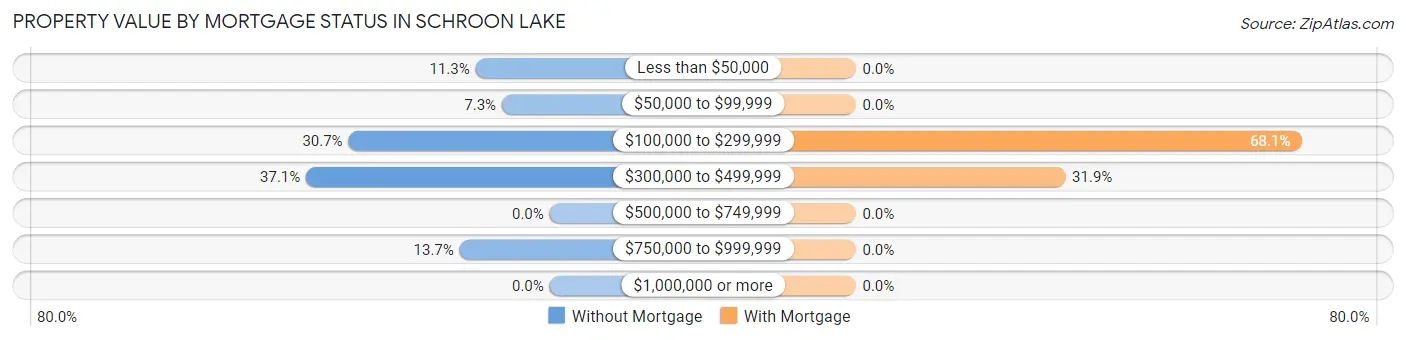
| Property Value | Without Mortgage | With Mortgage |
| Less than $50,000 | 14 (11.3%) | 0 (0.0%) |
| $50,000 to $99,999 | 9 (7.3%) | 0 (0.0%) |
| $100,000 to $299,999 | 38 (30.6%) | 98 (68.1%) |
| $300,000 to $499,999 | 46 (37.1%) | 46 (31.9%) |
| $500,000 to $749,999 | 0 (0.0%) | 0 (0.0%) |
| $750,000 to $999,999 | 17 (13.7%) | 0 (0.0%) |
| $1,000,000 or more | 0 (0.0%) | 0 (0.0%) |
| Total | 124 (100.0%) | 144 (100.0%) |
Household Income by Mortgage Status in Schroon Lake
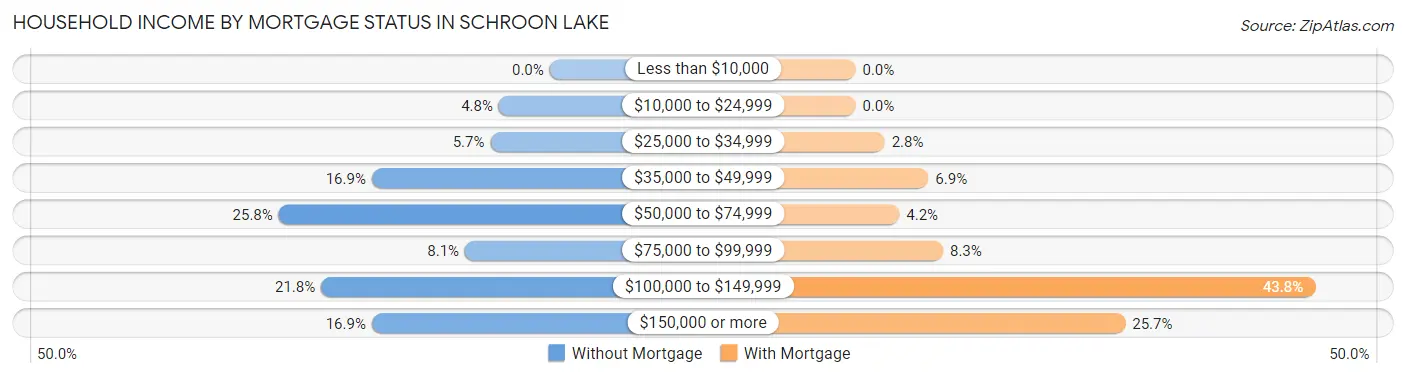
| Household Income | Without Mortgage | With Mortgage |
| Less than $10,000 | 0 (0.0%) | 0 (0.0%) |
| $10,000 to $24,999 | 6 (4.8%) | 0 (0.0%) |
| $25,000 to $34,999 | 7 (5.7%) | 4 (2.8%) |
| $35,000 to $49,999 | 21 (16.9%) | 10 (6.9%) |
| $50,000 to $74,999 | 32 (25.8%) | 6 (4.2%) |
| $75,000 to $99,999 | 10 (8.1%) | 12 (8.3%) |
| $100,000 to $149,999 | 27 (21.8%) | 63 (43.8%) |
| $150,000 or more | 21 (16.9%) | 37 (25.7%) |
| Total | 124 (100.0%) | 144 (100.0%) |
Property Value to Household Income Ratio in Schroon Lake
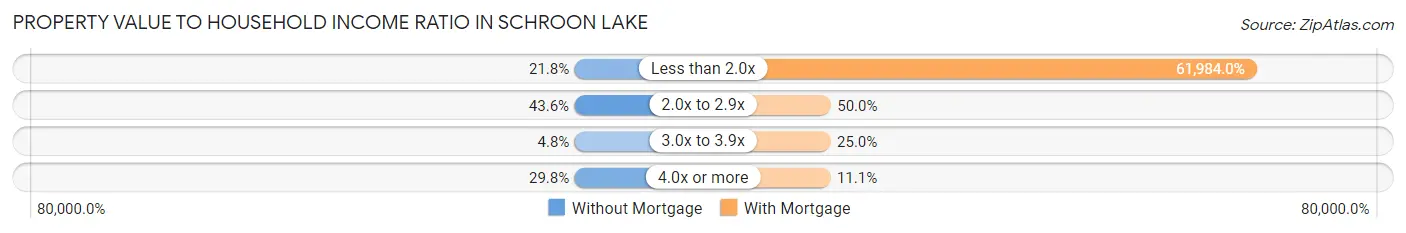
| Value-to-Income Ratio | Without Mortgage | With Mortgage |
| Less than 2.0x | 27 (21.8%) | 89,257 (61,984.0%) |
| 2.0x to 2.9x | 54 (43.5%) | 72 (50.0%) |
| 3.0x to 3.9x | 6 (4.8%) | 36 (25.0%) |
| 4.0x or more | 37 (29.8%) | 16 (11.1%) |
| Total | 124 (100.0%) | 144 (100.0%) |
Real Estate Taxes by Mortgage Status in Schroon Lake
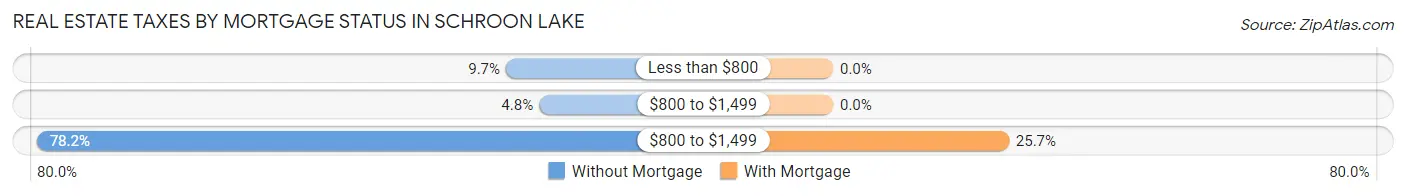
| Property Taxes | Without Mortgage | With Mortgage |
| Less than $800 | 12 (9.7%) | 0 (0.0%) |
| $800 to $1,499 | 6 (4.8%) | 0 (0.0%) |
| $800 to $1,499 | 97 (78.2%) | 37 (25.7%) |
| Total | 124 (100.0%) | 144 (100.0%) |
Health & Disability in Schroon Lake
Health Insurance Coverage by Age in Schroon Lake
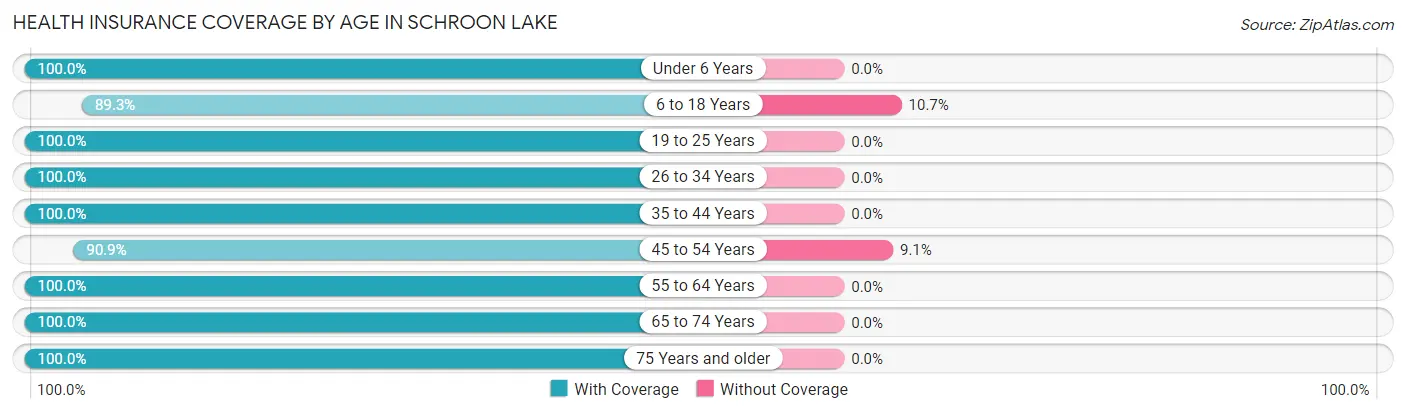
| Age Bracket | With Coverage | Without Coverage |
| Under 6 Years | 30 (100.0%) | 0 (0.0%) |
| 6 to 18 Years | 117 (89.3%) | 14 (10.7%) |
| 19 to 25 Years | 93 (100.0%) | 0 (0.0%) |
| 26 to 34 Years | 40 (100.0%) | 0 (0.0%) |
| 35 to 44 Years | 139 (100.0%) | 0 (0.0%) |
| 45 to 54 Years | 110 (90.9%) | 11 (9.1%) |
| 55 to 64 Years | 123 (100.0%) | 0 (0.0%) |
| 65 to 74 Years | 147 (100.0%) | 0 (0.0%) |
| 75 Years and older | 102 (100.0%) | 0 (0.0%) |
| Total | 901 (97.3%) | 25 (2.7%) |
Health Insurance Coverage by Citizenship Status in Schroon Lake
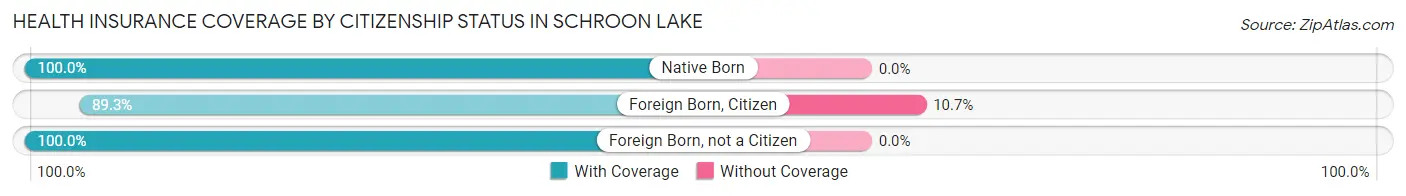
| Citizenship Status | With Coverage | Without Coverage |
| Native Born | 30 (100.0%) | 0 (0.0%) |
| Foreign Born, Citizen | 117 (89.3%) | 14 (10.7%) |
| Foreign Born, not a Citizen | 93 (100.0%) | 0 (0.0%) |
Health Insurance Coverage by Household Income in Schroon Lake
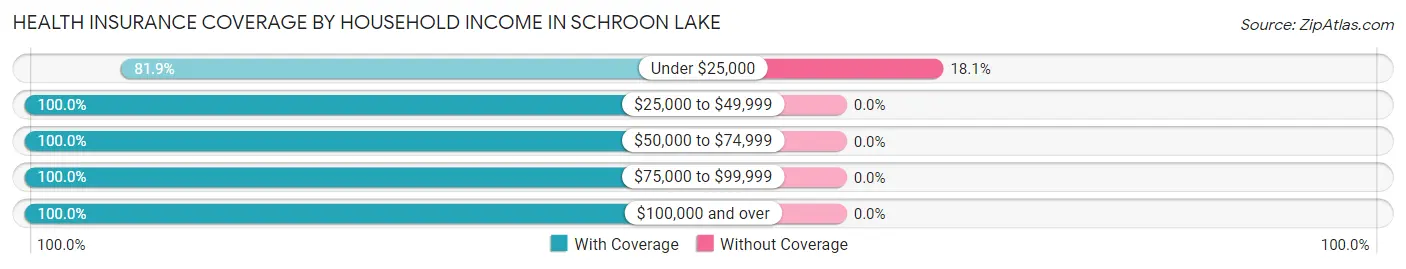
| Household Income | With Coverage | Without Coverage |
| Under $25,000 | 113 (81.9%) | 25 (18.1%) |
| $25,000 to $49,999 | 167 (100.0%) | 0 (0.0%) |
| $50,000 to $74,999 | 144 (100.0%) | 0 (0.0%) |
| $75,000 to $99,999 | 199 (100.0%) | 0 (0.0%) |
| $100,000 and over | 274 (100.0%) | 0 (0.0%) |
Public vs Private Health Insurance Coverage by Age in Schroon Lake
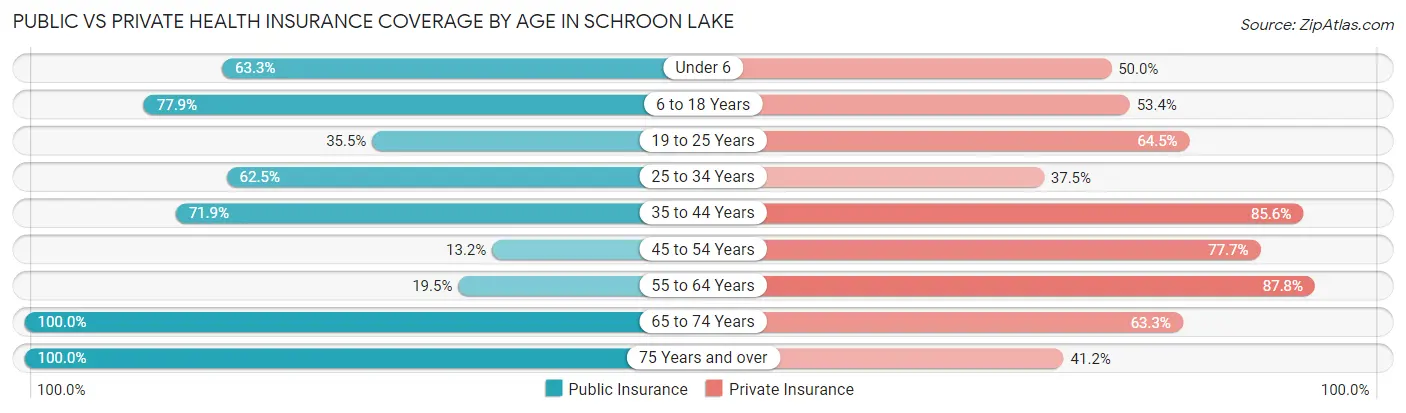
| Age Bracket | Public Insurance | Private Insurance |
| Under 6 | 19 (63.3%) | 15 (50.0%) |
| 6 to 18 Years | 102 (77.9%) | 70 (53.4%) |
| 19 to 25 Years | 33 (35.5%) | 60 (64.5%) |
| 25 to 34 Years | 25 (62.5%) | 15 (37.5%) |
| 35 to 44 Years | 100 (71.9%) | 119 (85.6%) |
| 45 to 54 Years | 16 (13.2%) | 94 (77.7%) |
| 55 to 64 Years | 24 (19.5%) | 108 (87.8%) |
| 65 to 74 Years | 147 (100.0%) | 93 (63.3%) |
| 75 Years and over | 102 (100.0%) | 42 (41.2%) |
| Total | 568 (61.3%) | 616 (66.5%) |
Disability Status by Sex by Age in Schroon Lake
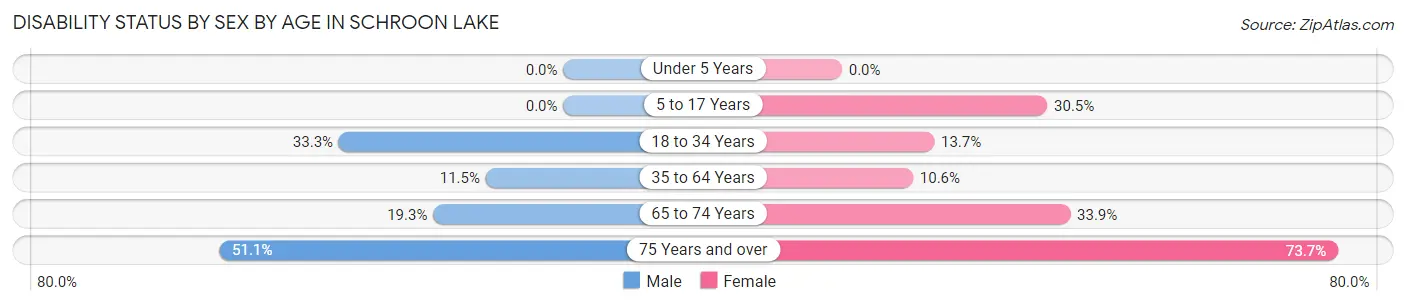
| Age Bracket | Male | Female |
| Under 5 Years | 0 (0.0%) | 0 (0.0%) |
| 5 to 17 Years | 0 (0.0%) | 25 (30.5%) |
| 18 to 34 Years | 20 (33.3%) | 10 (13.7%) |
| 35 to 64 Years | 19 (11.5%) | 23 (10.5%) |
| 65 to 74 Years | 17 (19.3%) | 20 (33.9%) |
| 75 Years and over | 23 (51.1%) | 42 (73.7%) |
Disability Class by Sex by Age in Schroon Lake
Disability Class: Hearing Difficulty
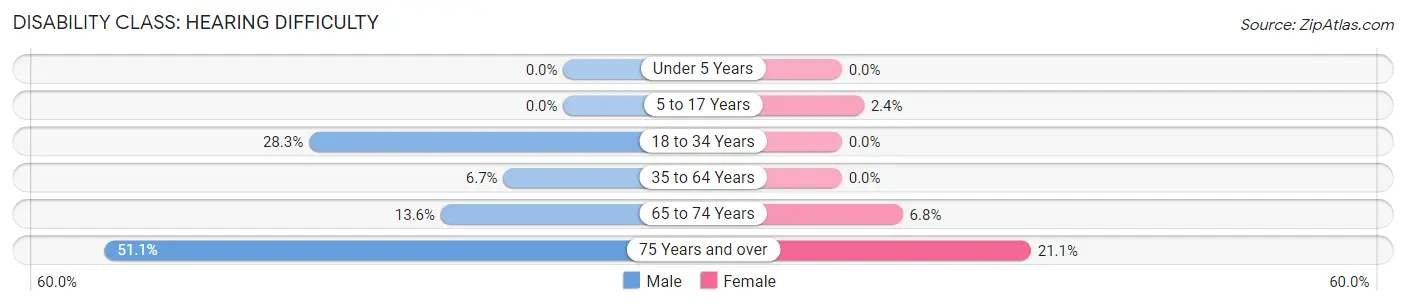
| Age Bracket | Male | Female |
| Under 5 Years | 0 (0.0%) | 0 (0.0%) |
| 5 to 17 Years | 0 (0.0%) | 2 (2.4%) |
| 18 to 34 Years | 17 (28.3%) | 0 (0.0%) |
| 35 to 64 Years | 11 (6.7%) | 0 (0.0%) |
| 65 to 74 Years | 12 (13.6%) | 4 (6.8%) |
| 75 Years and over | 23 (51.1%) | 12 (21.0%) |
Disability Class: Vision Difficulty
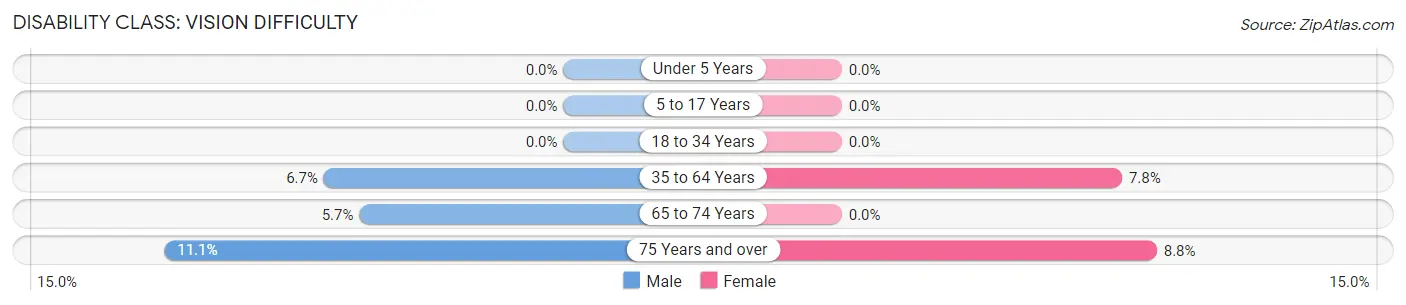
| Age Bracket | Male | Female |
| Under 5 Years | 0 (0.0%) | 0 (0.0%) |
| 5 to 17 Years | 0 (0.0%) | 0 (0.0%) |
| 18 to 34 Years | 0 (0.0%) | 0 (0.0%) |
| 35 to 64 Years | 11 (6.7%) | 17 (7.8%) |
| 65 to 74 Years | 5 (5.7%) | 0 (0.0%) |
| 75 Years and over | 5 (11.1%) | 5 (8.8%) |
Disability Class: Cognitive Difficulty
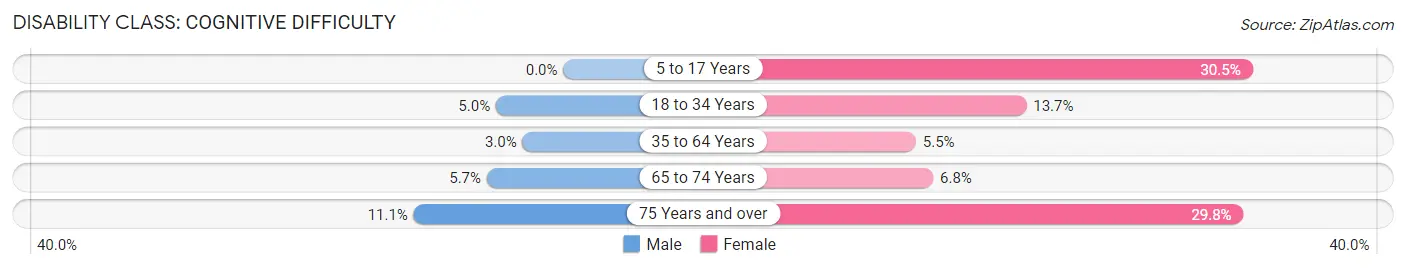
| Age Bracket | Male | Female |
| 5 to 17 Years | 0 (0.0%) | 25 (30.5%) |
| 18 to 34 Years | 3 (5.0%) | 10 (13.7%) |
| 35 to 64 Years | 5 (3.0%) | 12 (5.5%) |
| 65 to 74 Years | 5 (5.7%) | 4 (6.8%) |
| 75 Years and over | 5 (11.1%) | 17 (29.8%) |
Disability Class: Ambulatory Difficulty
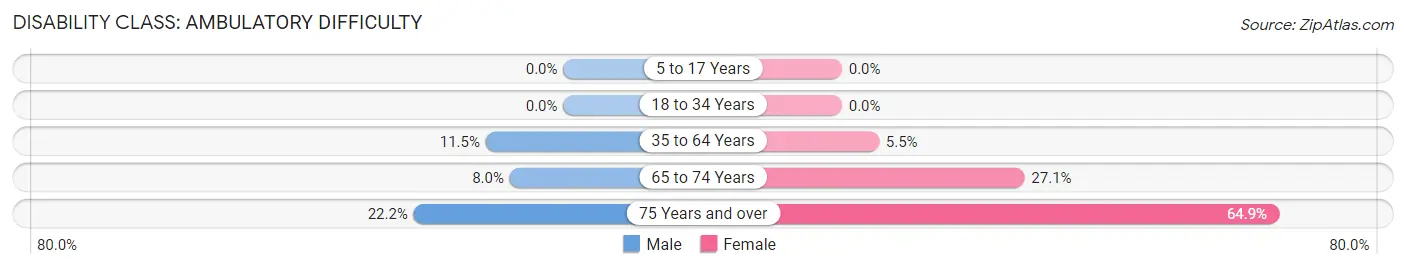
| Age Bracket | Male | Female |
| 5 to 17 Years | 0 (0.0%) | 0 (0.0%) |
| 18 to 34 Years | 0 (0.0%) | 0 (0.0%) |
| 35 to 64 Years | 19 (11.5%) | 12 (5.5%) |
| 65 to 74 Years | 7 (8.0%) | 16 (27.1%) |
| 75 Years and over | 10 (22.2%) | 37 (64.9%) |
Disability Class: Self-Care Difficulty
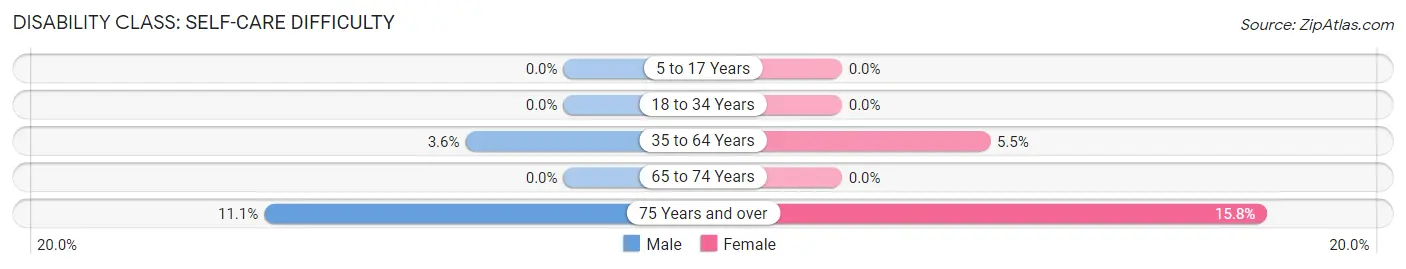
| Age Bracket | Male | Female |
| 5 to 17 Years | 0 (0.0%) | 0 (0.0%) |
| 18 to 34 Years | 0 (0.0%) | 0 (0.0%) |
| 35 to 64 Years | 6 (3.6%) | 12 (5.5%) |
| 65 to 74 Years | 0 (0.0%) | 0 (0.0%) |
| 75 Years and over | 5 (11.1%) | 9 (15.8%) |
Technology Access in Schroon Lake
Computing Device Access in Schroon Lake
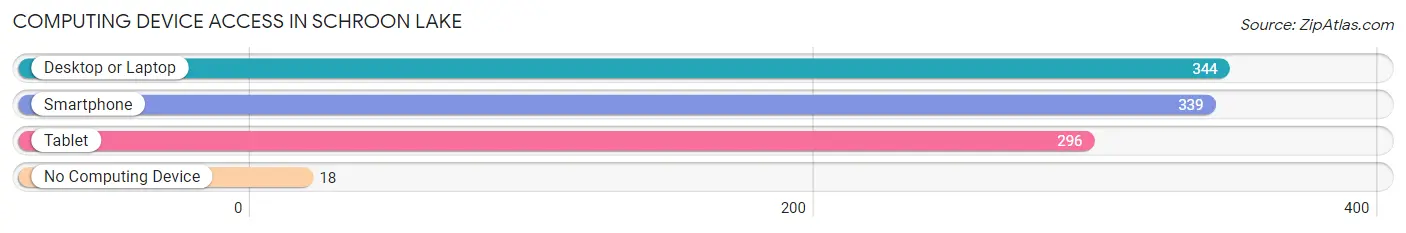
| Device Type | # Households | % Households |
| Desktop or Laptop | 344 | 85.2% |
| Smartphone | 339 | 83.9% |
| Tablet | 296 | 73.3% |
| No Computing Device | 18 | 4.5% |
| Total | 404 | 100.0% |
Internet Access in Schroon Lake
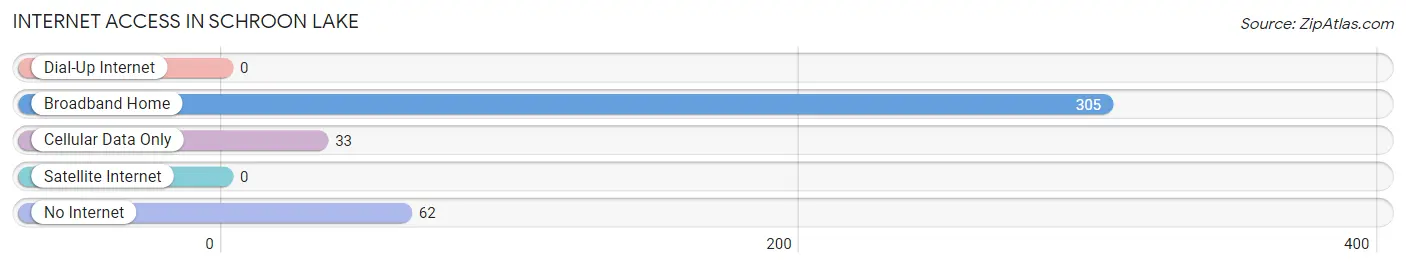
| Internet Type | # Households | % Households |
| Dial-Up Internet | 0 | 0.0% |
| Broadband Home | 305 | 75.5% |
| Cellular Data Only | 33 | 8.2% |
| Satellite Internet | 0 | 0.0% |
| No Internet | 62 | 15.3% |
| Total | 404 | 100.0% |
Schroon Lake Summary
Schroon Lake is a hamlet located in the Adirondack Mountains of Essex County, New York. It is situated on the eastern shore of the lake of the same name, and is part of the town of Schroon. The hamlet is a popular tourist destination, and is home to a variety of businesses, including restaurants, lodging, and retail stores.
History
The area around Schroon Lake has been inhabited by Native Americans for centuries. The first European settlers arrived in the area in the late 1700s, and the hamlet of Schroon Lake was established in 1812. The hamlet was named after the lake, which was named after the Schroon River, which was named after the Native American tribe that lived in the area.
The hamlet grew steadily throughout the 19th century, and by the early 20th century, it had become a popular tourist destination. The first hotel was built in 1876, and the first golf course was built in 1895. The hamlet was incorporated in 1921, and the first post office was established in 1923.
Geography
Schroon Lake is located in the Adirondack Mountains of Essex County, New York. It is situated on the eastern shore of the lake of the same name, and is part of the town of Schroon. The hamlet is located approximately 40 miles south of Plattsburgh, and is accessible via US Route 9.
The Schroon Lake area is characterized by rolling hills, forests, and numerous lakes and streams. The hamlet is located at an elevation of 1,400 feet, and is surrounded by the Adirondack Park. The lake itself is approximately 8 miles long and 1 mile wide, and is a popular destination for fishing, boating, and swimming.
Economy
The economy of Schroon Lake is largely based on tourism. The hamlet is home to a variety of businesses, including restaurants, lodging, and retail stores. The hamlet is also home to a number of marinas, which offer boat rentals and other services.
The hamlet is also home to a number of recreational activities, including golf, fishing, hiking, and skiing. The hamlet is also home to a number of festivals and events, including the Schroon Lake Arts and Crafts Festival and the Schroon Lake Music Festival.
Demographics
As of the 2010 census, the population of Schroon Lake was 1,717. The racial makeup of the hamlet was 97.2% White, 0.7% African American, 0.3% Native American, 0.3% Asian, 0.1% Pacific Islander, 0.2% from other races, and 1.2% from two or more races. Hispanic or Latino of any race were 1.2% of the population.
The median household income in Schroon Lake was $41,250, and the median family income was $50,000. The per capita income was $22,845. About 10.2% of families and 14.2% of the population were below the poverty line, including 18.2% of those under age 18 and 8.2% of those age 65 or over.
Common Questions
What is Per Capita Income in Schroon Lake?
Per Capita income in Schroon Lake is $34,716.
What is the Median Family Income in Schroon Lake?
Median Family Income in Schroon Lake is $81,563.
What is the Median Household income in Schroon Lake?
Median Household Income in Schroon Lake is $64,423.
What is Income or Wage Gap in Schroon Lake?
Income or Wage Gap in Schroon Lake is 29.6%.
Women in Schroon Lake earn 70.4 cents for every dollar earned by a man.
What is Inequality or Gini Index in Schroon Lake?
Inequality or Gini Index in Schroon Lake is 0.43.
What is the Total Population of Schroon Lake?
Total Population of Schroon Lake is 926.
What is the Total Male Population of Schroon Lake?
Total Male Population of Schroon Lake is 432.
What is the Total Female Population of Schroon Lake?
Total Female Population of Schroon Lake is 494.
What is the Ratio of Males per 100 Females in Schroon Lake?
There are 87.45 Males per 100 Females in Schroon Lake.
What is the Ratio of Females per 100 Males in Schroon Lake?
There are 114.35 Females per 100 Males in Schroon Lake.
What is the Median Population Age in Schroon Lake?
Median Population Age in Schroon Lake is 49.0 Years.
What is the Average Family Size in Schroon Lake
Average Family Size in Schroon Lake is 2.5 People.
What is the Average Household Size in Schroon Lake
Average Household Size in Schroon Lake is 2.3 People.
How Large is the Labor Force in Schroon Lake?
There are 405 People in the Labor Forcein in Schroon Lake.
What is the Percentage of People in the Labor Force in Schroon Lake?
51.5% of People are in the Labor Force in Schroon Lake.
What is the Unemployment Rate in Schroon Lake?
Unemployment Rate in Schroon Lake is 1.5%.