Zip Codes with the Highest Percentage of Population Employed in Computer & Mathematics in New York
RELATED REPORTS & OPTIONS
Computer & Mathematics
New York
Compare Zip Codes
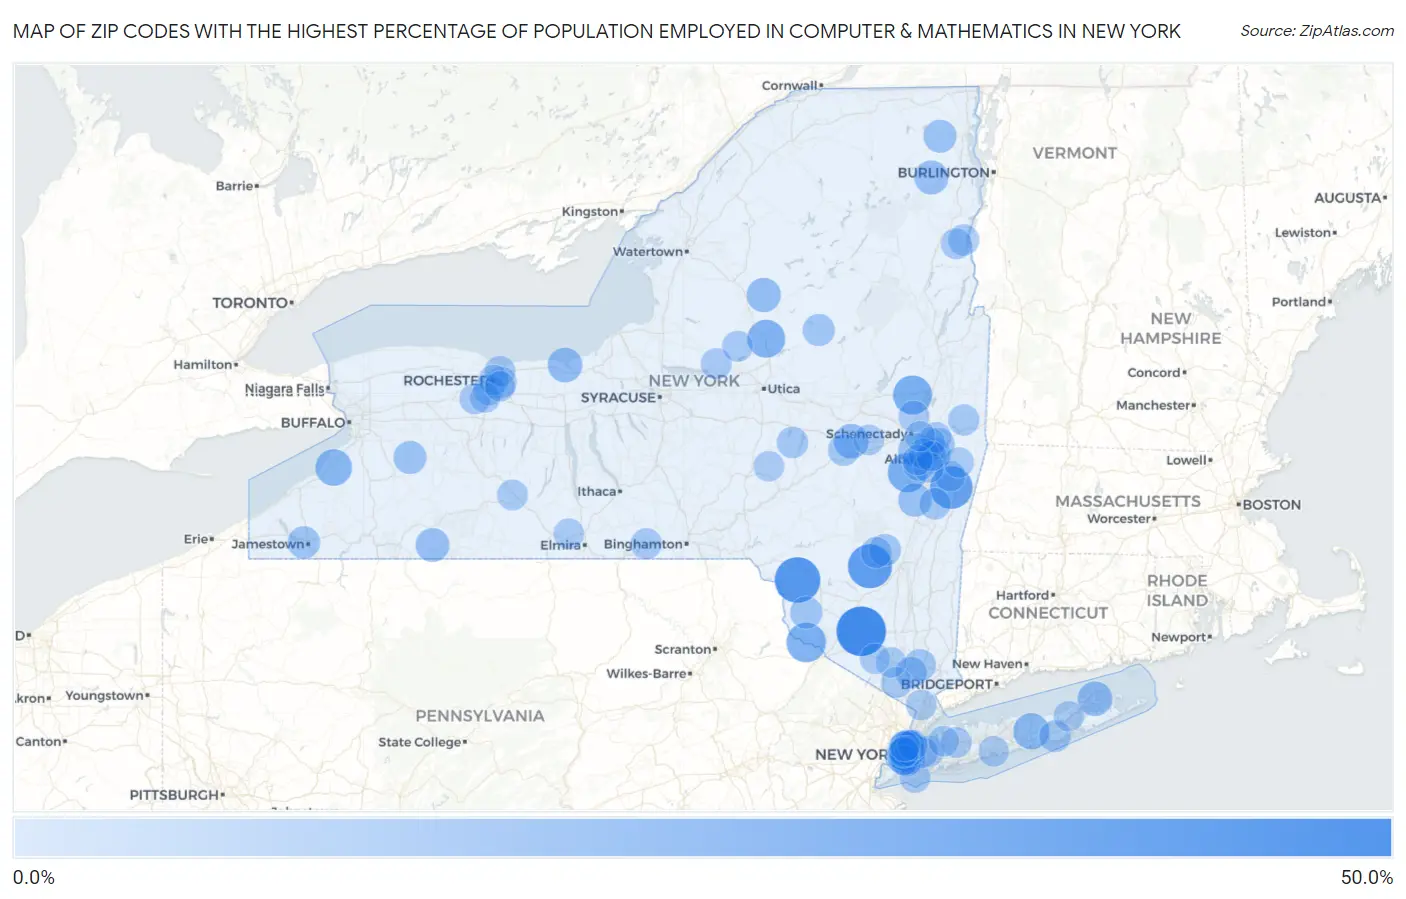
Map of Zip Codes with the Highest Percentage of Population Employed in Computer & Mathematics in New York
0.0%
50.0%
Zip Codes with the Highest Percentage of Population Employed in Computer & Mathematics in New York
| Zip Code | % Employed | vs State | vs National | |
| 1. | 10919 | 42.4% | 3.1%(+39.2)#1 | 3.5%(+38.8)#17 |
| 2. | 12724 | 34.9% | 3.1%(+31.8)#2 | 3.5%(+31.4)#32 |
| 3. | 12494 | 32.0% | 3.1%(+28.8)#3 | 3.5%(+28.4)#41 |
| 4. | 12115 | 29.3% | 3.1%(+26.1)#4 | 3.5%(+25.7)#54 |
| 5. | 12770 | 23.1% | 3.1%(+19.9)#5 | 3.5%(+19.6)#94 |
| 6. | 12041 | 22.9% | 3.1%(+19.7)#6 | 3.5%(+19.4)#97 |
| 7. | 12863 | 22.5% | 3.1%(+19.4)#7 | 3.5%(+19.0)#101 |
| 8. | 13301 | 20.0% | 3.1%(+16.9)#8 | 3.5%(+16.5)#130 |
| 9. | 14027 | 17.6% | 3.1%(+14.5)#9 | 3.5%(+14.1)#183 |
| 10. | 11973 | 16.7% | 3.1%(+13.5)#10 | 3.5%(+13.1)#198 |
| 11. | 12031 | 14.0% | 3.1%(+10.8)#11 | 3.5%(+10.5)#312 |
| 12. | 14555 | 14.0% | 3.1%(+10.8)#12 | 3.5%(+10.4)#313 |
| 13. | 11965 | 13.8% | 3.1%(+10.7)#13 | 3.5%(+10.3)#319 |
| 14. | 13312 | 13.3% | 3.1%(+10.2)#14 | 3.5%(+9.76)#345 |
| 15. | 12912 | 12.8% | 3.1%(+9.63)#15 | 3.5%(+9.23)#379 |
| 16. | 14774 | 12.4% | 3.1%(+9.26)#16 | 3.5%(+8.86)#406 |
| 17. | 12042 | 11.8% | 3.1%(+8.67)#17 | 3.5%(+8.27)#466 |
| 18. | 12084 | 11.8% | 3.1%(+8.63)#18 | 3.5%(+8.23)#472 |
| 19. | 11109 | 11.6% | 3.1%(+8.51)#19 | 3.5%(+8.11)#478 |
| 20. | 10018 | 11.4% | 3.1%(+8.28)#20 | 3.5%(+7.88)#508 |
| 21. | 14113 | 10.9% | 3.1%(+7.73)#21 | 3.5%(+7.34)#576 |
| 22. | 12918 | 10.8% | 3.1%(+7.67)#22 | 3.5%(+7.28)#588 |
| 23. | 10004 | 10.3% | 3.1%(+7.20)#23 | 3.5%(+6.81)#656 |
| 24. | 14720 | 10.1% | 3.1%(+7.00)#24 | 3.5%(+6.61)#686 |
| 25. | 12786 | 9.7% | 3.1%(+6.57)#25 | 3.5%(+6.18)#754 |
| 26. | 10005 | 9.5% | 3.1%(+6.36)#26 | 3.5%(+5.96)#803 |
| 27. | 10017 | 9.3% | 3.1%(+6.18)#27 | 3.5%(+5.78)#837 |
| 28. | 12207 | 9.2% | 3.1%(+6.06)#28 | 3.5%(+5.67)#857 |
| 29. | 13353 | 9.1% | 3.1%(+5.96)#29 | 3.5%(+5.57)#889 |
| 30. | 12204 | 9.1% | 3.1%(+5.94)#30 | 3.5%(+5.55)#891 |
| 31. | 12409 | 8.9% | 3.1%(+5.76)#31 | 3.5%(+5.36)#931 |
| 32. | 10517 | 8.8% | 3.1%(+5.65)#32 | 3.5%(+5.26)#961 |
| 33. | 11217 | 8.7% | 3.1%(+5.61)#33 | 3.5%(+5.22)#969 |
| 34. | 11977 | 8.6% | 3.1%(+5.43)#34 | 3.5%(+5.04)#1,032 |
| 35. | 12043 | 8.5% | 3.1%(+5.35)#35 | 3.5%(+4.95)#1,059 |
| 36. | 11101 | 8.4% | 3.1%(+5.30)#36 | 3.5%(+4.91)#1,072 |
| 37. | 10019 | 8.3% | 3.1%(+5.15)#37 | 3.5%(+4.76)#1,123 |
| 38. | 10038 | 8.2% | 3.1%(+5.04)#38 | 3.5%(+4.64)#1,158 |
| 39. | 12174 | 8.1% | 3.1%(+4.97)#39 | 3.5%(+4.57)#1,181 |
| 40. | 10548 | 8.1% | 3.1%(+4.93)#40 | 3.5%(+4.54)#1,193 |
| 41. | 13337 | 8.0% | 3.1%(+4.86)#41 | 3.5%(+4.47)#1,210 |
| 42. | 12183 | 7.9% | 3.1%(+4.78)#42 | 3.5%(+4.39)#1,231 |
| 43. | 12054 | 7.9% | 3.1%(+4.73)#43 | 3.5%(+4.33)#1,256 |
| 44. | 12094 | 7.6% | 3.1%(+4.44)#44 | 3.5%(+4.04)#1,360 |
| 45. | 12974 | 7.6% | 3.1%(+4.43)#45 | 3.5%(+4.03)#1,369 |
| 46. | 10010 | 7.5% | 3.1%(+4.42)#46 | 3.5%(+4.02)#1,374 |
| 47. | 14610 | 7.5% | 3.1%(+4.39)#47 | 3.5%(+3.99)#1,380 |
| 48. | 10044 | 7.5% | 3.1%(+4.39)#48 | 3.5%(+3.99)#1,381 |
| 49. | 10016 | 7.4% | 3.1%(+4.31)#49 | 3.5%(+3.92)#1,408 |
| 50. | 12457 | 7.4% | 3.1%(+4.30)#50 | 3.5%(+3.90)#1,418 |
| 51. | 10065 | 7.4% | 3.1%(+4.23)#51 | 3.5%(+3.83)#1,440 |
| 52. | 11366 | 7.3% | 3.1%(+4.17)#52 | 3.5%(+3.78)#1,464 |
| 53. | 13827 | 7.3% | 3.1%(+4.15)#53 | 3.5%(+3.76)#1,472 |
| 54. | 10006 | 7.3% | 3.1%(+4.15)#54 | 3.5%(+3.76)#1,474 |
| 55. | 14546 | 7.1% | 3.1%(+4.02)#55 | 3.5%(+3.62)#1,541 |
| 56. | 11201 | 7.1% | 3.1%(+4.00)#56 | 3.5%(+3.60)#1,557 |
| 57. | 13308 | 7.1% | 3.1%(+3.98)#57 | 3.5%(+3.58)#1,567 |
| 58. | 12027 | 7.1% | 3.1%(+3.97)#58 | 3.5%(+3.58)#1,572 |
| 59. | 11211 | 7.1% | 3.1%(+3.93)#59 | 3.5%(+3.53)#1,594 |
| 60. | 10009 | 7.0% | 3.1%(+3.91)#60 | 3.5%(+3.52)#1,598 |
| 61. | 13303 | 7.0% | 3.1%(+3.89)#61 | 3.5%(+3.49)#1,616 |
| 62. | 10970 | 7.0% | 3.1%(+3.85)#62 | 3.5%(+3.45)#1,632 |
| 63. | 12960 | 7.0% | 3.1%(+3.85)#63 | 3.5%(+3.45)#1,635 |
| 64. | 11216 | 6.9% | 3.1%(+3.78)#64 | 3.5%(+3.38)#1,676 |
| 65. | 14809 | 6.8% | 3.1%(+3.72)#65 | 3.5%(+3.32)#1,713 |
| 66. | 11697 | 6.8% | 3.1%(+3.63)#66 | 3.5%(+3.23)#1,756 |
| 67. | 14623 | 6.7% | 3.1%(+3.62)#67 | 3.5%(+3.22)#1,761 |
| 68. | 11375 | 6.7% | 3.1%(+3.58)#68 | 3.5%(+3.19)#1,786 |
| 69. | 12047 | 6.7% | 3.1%(+3.53)#69 | 3.5%(+3.14)#1,827 |
| 70. | 11215 | 6.6% | 3.1%(+3.48)#70 | 3.5%(+3.08)#1,852 |
| 71. | 10075 | 6.6% | 3.1%(+3.47)#71 | 3.5%(+3.08)#1,855 |
| 72. | 12066 | 6.6% | 3.1%(+3.47)#72 | 3.5%(+3.08)#1,856 |
| 73. | 10003 | 6.5% | 3.1%(+3.41)#73 | 3.5%(+3.02)#1,896 |
| 74. | 11753 | 6.5% | 3.1%(+3.38)#74 | 3.5%(+2.98)#1,920 |
| 75. | 14622 | 6.5% | 3.1%(+3.33)#75 | 3.5%(+2.93)#1,965 |
| 76. | 14814 | 6.4% | 3.1%(+3.32)#76 | 3.5%(+2.92)#1,971 |
| 77. | 12110 | 6.4% | 3.1%(+3.26)#77 | 3.5%(+2.86)#2,009 |
| 78. | 14604 | 6.4% | 3.1%(+3.25)#78 | 3.5%(+2.85)#2,017 |
| 79. | 10014 | 6.4% | 3.1%(+3.24)#79 | 3.5%(+2.84)#2,031 |
| 80. | 13415 | 6.3% | 3.1%(+3.22)#80 | 3.5%(+2.82)#2,041 |
| 81. | 12123 | 6.3% | 3.1%(+3.22)#81 | 3.5%(+2.82)#2,042 |
| 82. | 11222 | 6.3% | 3.1%(+3.19)#82 | 3.5%(+2.80)#2,060 |
| 83. | 11948 | 6.3% | 3.1%(+3.18)#83 | 3.5%(+2.79)#2,072 |
| 84. | 12203 | 6.3% | 3.1%(+3.18)#84 | 3.5%(+2.78)#2,076 |
| 85. | 11231 | 6.3% | 3.1%(+3.17)#85 | 3.5%(+2.77)#2,088 |
| 86. | 11576 | 6.3% | 3.1%(+3.13)#86 | 3.5%(+2.74)#2,106 |
| 87. | 10917 | 6.3% | 3.1%(+3.13)#87 | 3.5%(+2.74)#2,107 |
| 88. | 10533 | 6.2% | 3.1%(+3.12)#88 | 3.5%(+2.72)#2,118 |
| 89. | 11102 | 6.2% | 3.1%(+3.10)#89 | 3.5%(+2.70)#2,129 |
| 90. | 14586 | 6.2% | 3.1%(+3.05)#90 | 3.5%(+2.66)#2,156 |
| 91. | 12077 | 6.2% | 3.1%(+3.02)#91 | 3.5%(+2.63)#2,181 |
| 92. | 10918 | 6.1% | 3.1%(+3.00)#92 | 3.5%(+2.61)#2,198 |
| 93. | 11751 | 6.1% | 3.1%(+3.00)#93 | 3.5%(+2.61)#2,199 |
| 94. | 10013 | 6.1% | 3.1%(+2.99)#94 | 3.5%(+2.59)#2,212 |
| 95. | 10036 | 6.1% | 3.1%(+2.97)#95 | 3.5%(+2.58)#2,226 |
| 96. | 12018 | 6.1% | 3.1%(+2.94)#96 | 3.5%(+2.55)#2,252 |
| 97. | 14618 | 6.1% | 3.1%(+2.94)#97 | 3.5%(+2.54)#2,255 |
| 98. | 12210 | 6.1% | 3.1%(+2.94)#98 | 3.5%(+2.54)#2,256 |
| 99. | 12159 | 6.1% | 3.1%(+2.93)#99 | 3.5%(+2.53)#2,267 |
| 100. | 12309 | 6.1% | 3.1%(+2.92)#100 | 3.5%(+2.53)#2,270 |
Common Questions
What are the Top 10 Zip Codes with the Highest Percentage of Population Employed in Computer & Mathematics in New York?
Top 10 Zip Codes with the Highest Percentage of Population Employed in Computer & Mathematics in New York are:
What zip code has the Highest Percentage of Population Employed in Computer & Mathematics in New York?
10919 has the Highest Percentage of Population Employed in Computer & Mathematics in New York with 42.4%.
What is the Percentage of Population Employed in Computer & Mathematics in the State of New York?
Percentage of Population Employed in Computer & Mathematics in New York is 3.1%.
What is the Percentage of Population Employed in Computer & Mathematics in the United States?
Percentage of Population Employed in Computer & Mathematics in the United States is 3.5%.