Colonie, NY Map & Demographics
Colonie Map
Colonie Overview
$44,549
PER CAPITA INCOME
$113,995
AVG FAMILY INCOME
$100,093
AVG HOUSEHOLD INCOME
1.3%
WAGE / INCOME GAP [ % ]
98.7¢/ $1
WAGE / INCOME GAP [ $ ]
0.38
INEQUALITY / GINI INDEX
7,767
TOTAL POPULATION
4,087
MALE POPULATION
3,680
FEMALE POPULATION
111.06
MALES / 100 FEMALES
90.04
FEMALES / 100 MALES
45.0
MEDIAN AGE
3.2
AVG FAMILY SIZE
2.5
AVG HOUSEHOLD SIZE
3,869
LABOR FORCE [ PEOPLE ]
58.2%
PERCENT IN LABOR FORCE
2.7%
UNEMPLOYMENT RATE
Colonie Area Codes
Income in Colonie
Income Overview in Colonie
Per Capita Income in Colonie is $44,549, while median incomes of families and households are $113,995 and $100,093 respectively.
| Characteristic | Number | Measure |
| Per Capita Income | 7,767 | $44,549 |
| Median Family Income | 1,901 | $113,995 |
| Mean Family Income | 1,901 | $120,586 |
| Median Household Income | 3,058 | $100,093 |
| Mean Household Income | 3,058 | $110,755 |
| Income Deficit | 1,901 | $0 |
| Wage / Income Gap (%) | 7,767 | 1.27% |
| Wage / Income Gap ($) | 7,767 | 98.73¢ per $1 |
| Gini / Inequality Index | 7,767 | 0.38 |
Earnings by Sex in Colonie
Average Earnings in Colonie are $51,689, $52,083 for men and $51,420 for women, a difference of 1.3%.

| Sex | Number | Average Earnings |
| Male | 2,440 (57.7%) | $52,083 |
| Female | 1,786 (42.3%) | $51,420 |
| Total | 4,226 (100.0%) | $51,689 |
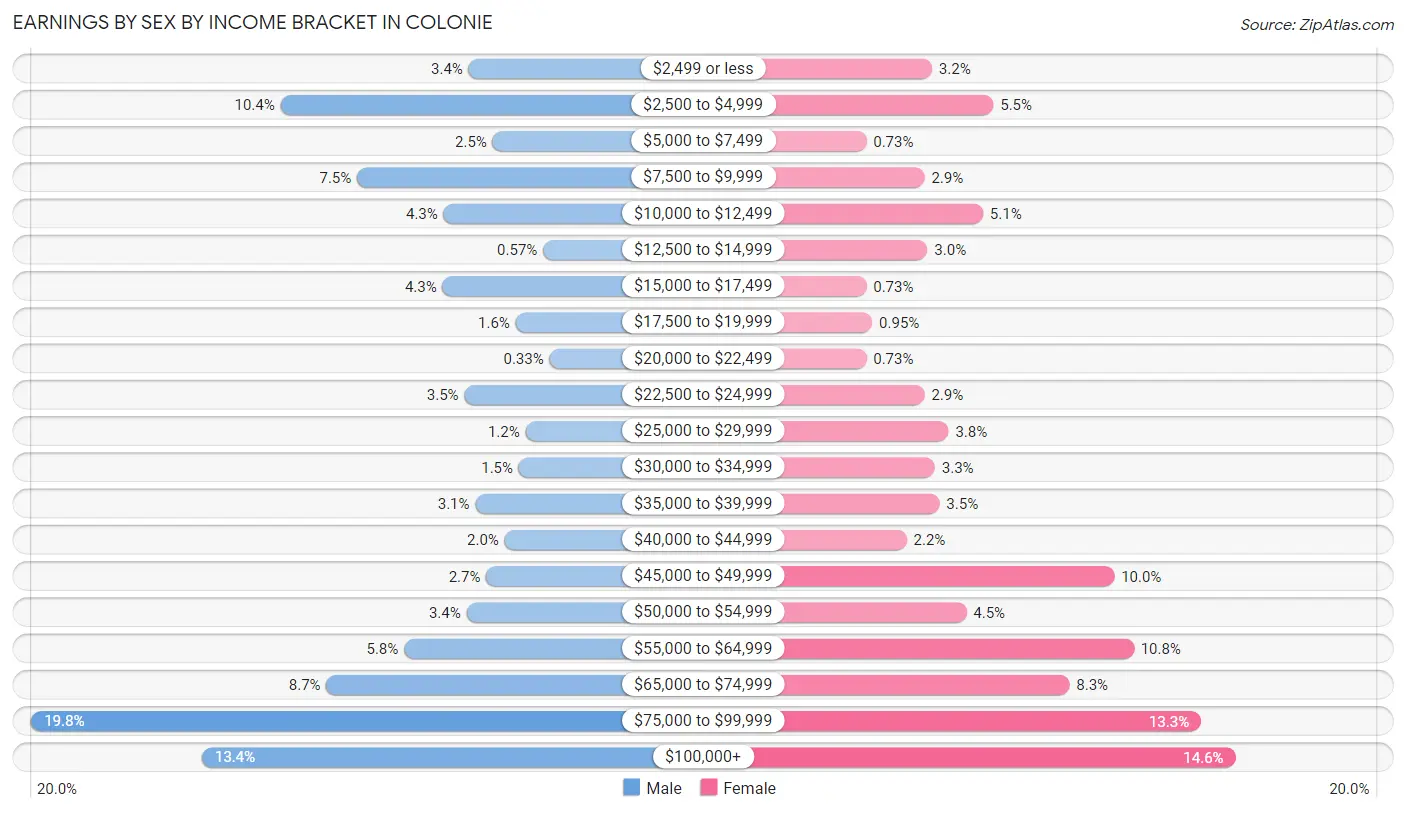
Earnings by Sex by Income Bracket in Colonie
The most common earnings brackets in Colonie are $75,000 to $99,999 for men (482 | 19.8%) and $100,000+ for women (260 | 14.6%).
| Income | Male | Female |
| $2,499 or less | 82 (3.4%) | 57 (3.2%) |
| $2,500 to $4,999 | 254 (10.4%) | 98 (5.5%) |
| $5,000 to $7,499 | 60 (2.5%) | 13 (0.7%) |
| $7,500 to $9,999 | 184 (7.5%) | 52 (2.9%) |
| $10,000 to $12,499 | 105 (4.3%) | 91 (5.1%) |
| $12,500 to $14,999 | 14 (0.6%) | 54 (3.0%) |
| $15,000 to $17,499 | 106 (4.3%) | 13 (0.7%) |
| $17,500 to $19,999 | 39 (1.6%) | 17 (0.9%) |
| $20,000 to $22,499 | 8 (0.3%) | 13 (0.7%) |
| $22,500 to $24,999 | 86 (3.5%) | 52 (2.9%) |
| $25,000 to $29,999 | 30 (1.2%) | 68 (3.8%) |
| $30,000 to $34,999 | 36 (1.5%) | 59 (3.3%) |
| $35,000 to $39,999 | 76 (3.1%) | 62 (3.5%) |
| $40,000 to $44,999 | 49 (2.0%) | 40 (2.2%) |
| $45,000 to $49,999 | 66 (2.7%) | 179 (10.0%) |
| $50,000 to $54,999 | 84 (3.4%) | 80 (4.5%) |
| $55,000 to $64,999 | 141 (5.8%) | 192 (10.7%) |
| $65,000 to $74,999 | 212 (8.7%) | 149 (8.3%) |
| $75,000 to $99,999 | 482 (19.8%) | 237 (13.3%) |
| $100,000+ | 326 (13.4%) | 260 (14.6%) |
| Total | 2,440 (100.0%) | 1,786 (100.0%) |
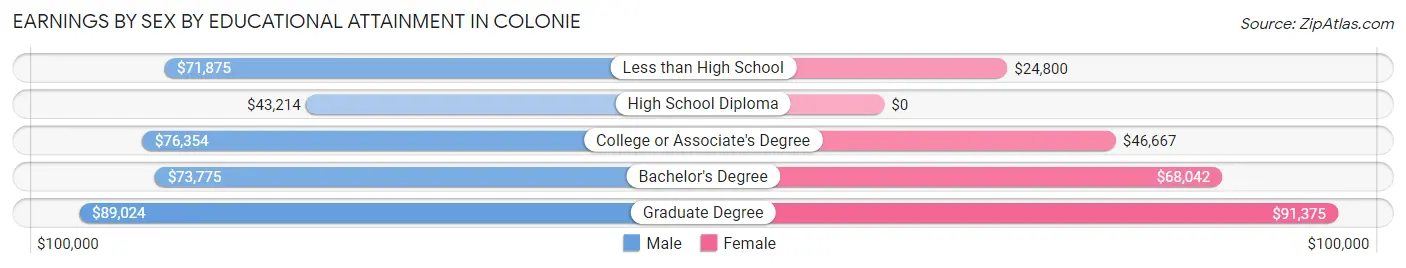
Earnings by Sex by Educational Attainment in Colonie
Average earnings in Colonie are $72,675 for men and $58,044 for women, a difference of 20.1%. Men with an educational attainment of graduate degree enjoy the highest average annual earnings of $89,024, while those with high school diploma education earn the least with $43,214. Women with an educational attainment of graduate degree earn the most with the average annual earnings of $91,375, while those with less than high school education have the smallest earnings of $24,800.
| Educational Attainment | Male Income | Female Income |
| Less than High School | $71,875 | $24,800 |
| High School Diploma | $43,214 | $0 |
| College or Associate's Degree | $76,354 | $46,667 |
| Bachelor's Degree | $73,775 | $68,042 |
| Graduate Degree | $89,024 | $91,375 |
| Total | $72,675 | $58,044 |
Family Income in Colonie
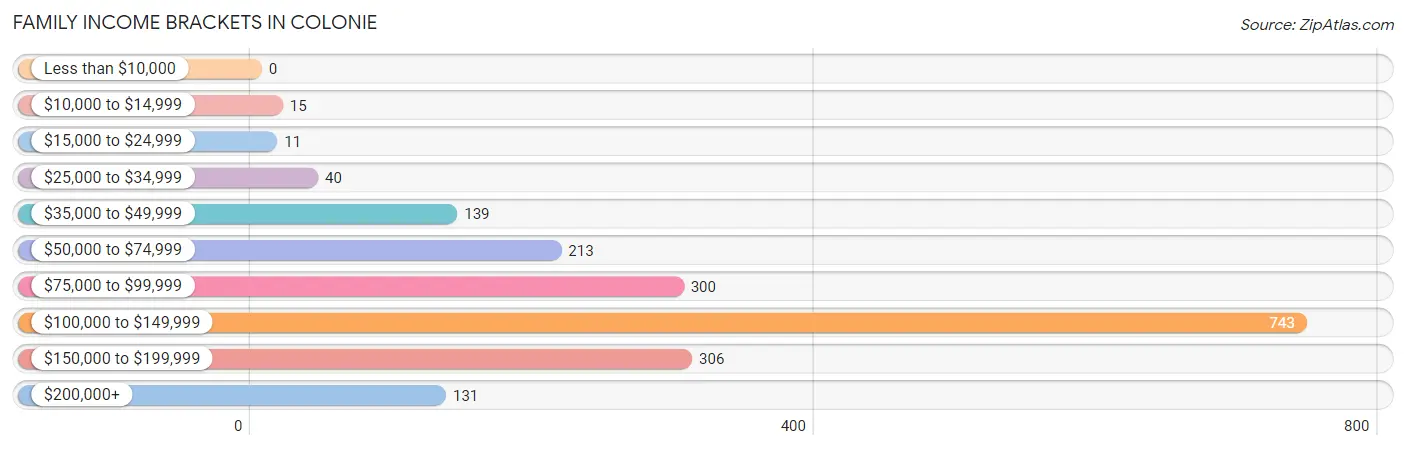
Family Income Brackets in Colonie
According to the Colonie family income data, there are 743 families falling into the $100,000 to $149,999 income range, which is the most common income bracket and makes up 39.1% of all families.
| Income Bracket | # Families | % Families |
| Less than $10,000 | 0 | 0.0% |
| $10,000 to $14,999 | 15 | 0.8% |
| $15,000 to $24,999 | 11 | 0.6% |
| $25,000 to $34,999 | 40 | 2.1% |
| $35,000 to $49,999 | 139 | 7.3% |
| $50,000 to $74,999 | 213 | 11.2% |
| $75,000 to $99,999 | 300 | 15.8% |
| $100,000 to $149,999 | 743 | 39.1% |
| $150,000 to $199,999 | 306 | 16.1% |
| $200,000+ | 131 | 6.9% |
Family Income by Famaliy Size in Colonie
4-person families (356 | 18.7%) account for the highest median family income in Colonie with $137,887 per family, while 2-person families (1,001 | 52.7%) have the highest median income of $49,864 per family member.
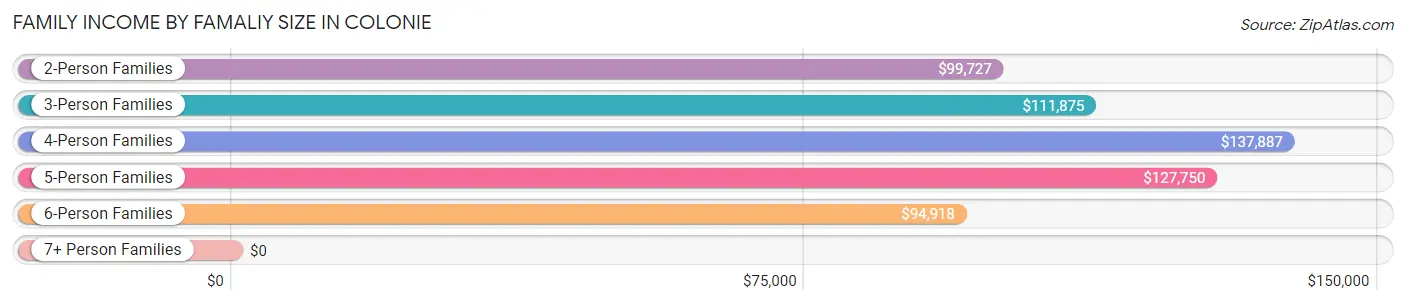
| Income Bracket | # Families | Median Income |
| 2-Person Families | 1,001 (52.7%) | $99,727 |
| 3-Person Families | 350 (18.4%) | $111,875 |
| 4-Person Families | 356 (18.7%) | $137,887 |
| 5-Person Families | 66 (3.5%) | $127,750 |
| 6-Person Families | 99 (5.2%) | $94,918 |
| 7+ Person Families | 29 (1.5%) | $0 |
| Total | 1,901 (100.0%) | $113,995 |
Family Income by Number of Earners in Colonie
The median family income in Colonie is $113,995, with families comprising 3+ earners (255) having the highest median family income of $138,698, while families with no earners (341) have the lowest median family income of $85,149, accounting for 13.4% and 17.9% of families, respectively.
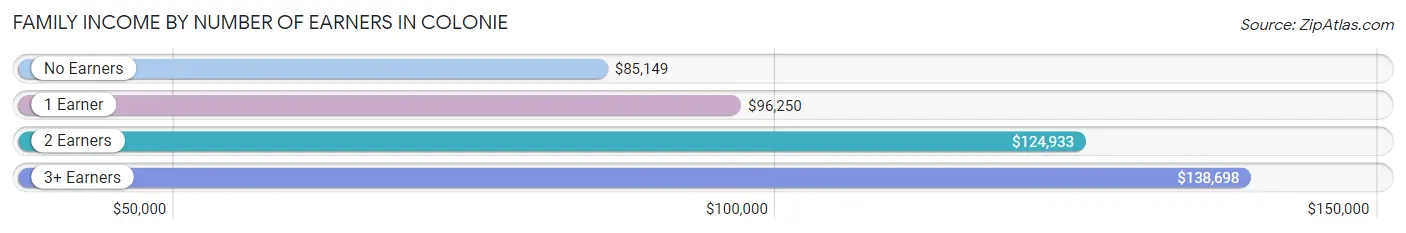
| Number of Earners | # Families | Median Income |
| No Earners | 341 (17.9%) | $85,149 |
| 1 Earner | 502 (26.4%) | $96,250 |
| 2 Earners | 803 (42.2%) | $124,933 |
| 3+ Earners | 255 (13.4%) | $138,698 |
| Total | 1,901 (100.0%) | $113,995 |
Household Income in Colonie
Household Income Brackets in Colonie
With 911 households falling in the category, the $100,000 to $149,999 income range is the most frequent in Colonie, accounting for 29.8% of all households. In contrast, only 61 households (2.0%) fall into the less than $10,000 income bracket, making it the least populous group.
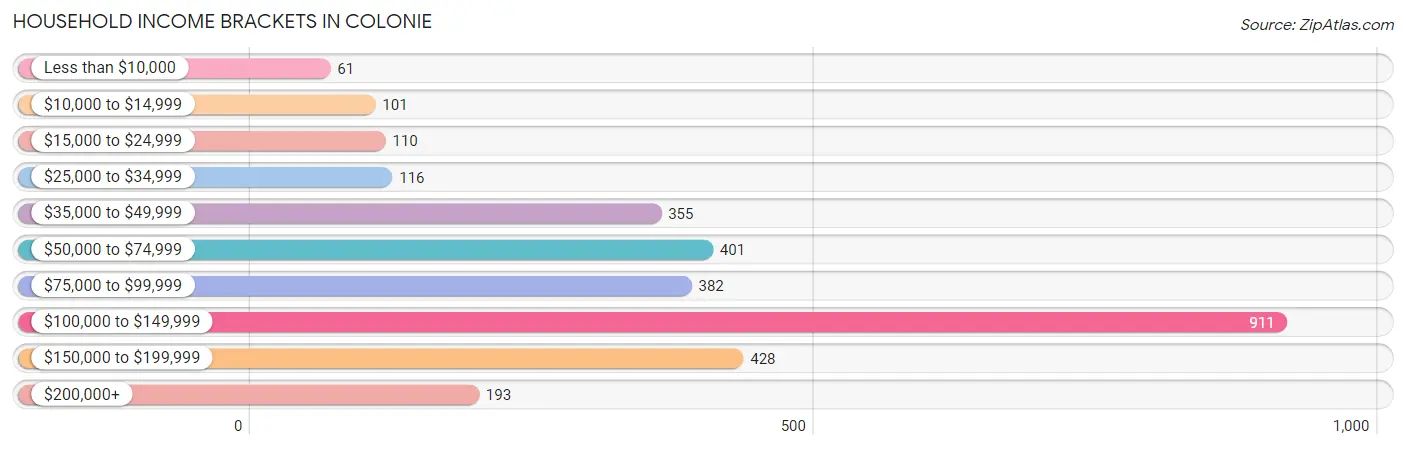
| Income Bracket | # Households | % Households |
| Less than $10,000 | 61 | 2.0% |
| $10,000 to $14,999 | 101 | 3.3% |
| $15,000 to $24,999 | 110 | 3.6% |
| $25,000 to $34,999 | 116 | 3.8% |
| $35,000 to $49,999 | 355 | 11.6% |
| $50,000 to $74,999 | 401 | 13.1% |
| $75,000 to $99,999 | 382 | 12.5% |
| $100,000 to $149,999 | 911 | 29.8% |
| $150,000 to $199,999 | 428 | 14.0% |
| $200,000+ | 193 | 6.3% |
Household Income by Householder Age in Colonie
The median household income in Colonie is $100,093, with the highest median household income of $130,453 found in the 25 to 44 years age bracket for the primary householder. A total of 607 households (19.9%) fall into this category. Meanwhile, the 15 to 24 years age bracket for the primary householder has the lowest median household income of $0, with 5 households (0.2%) in this group.
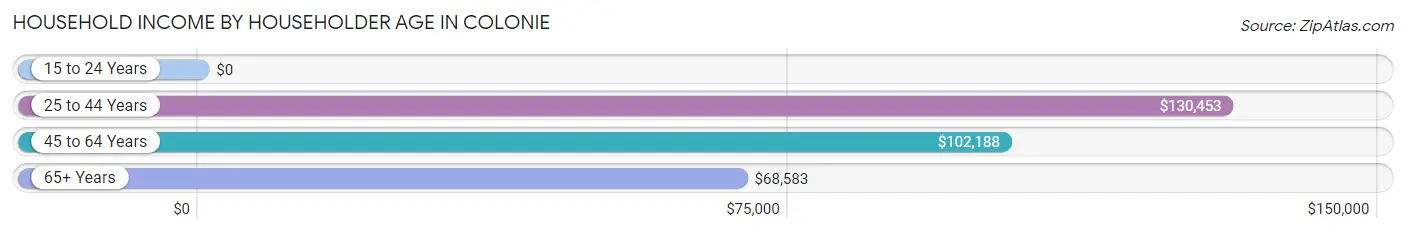
| Income Bracket | # Households | Median Income |
| 15 to 24 Years | 5 (0.2%) | $0 |
| 25 to 44 Years | 607 (19.9%) | $130,453 |
| 45 to 64 Years | 1,255 (41.0%) | $102,188 |
| 65+ Years | 1,191 (39.0%) | $68,583 |
| Total | 3,058 (100.0%) | $100,093 |
Poverty in Colonie
Income Below Poverty by Sex and Age in Colonie
With 4.0% poverty level for males and 7.2% for females among the residents of Colonie, 55 to 64 year old males and 35 to 44 year old females are the most vulnerable to poverty, with 62 males (12.2%) and 141 females (26.6%) in their respective age groups living below the poverty level.
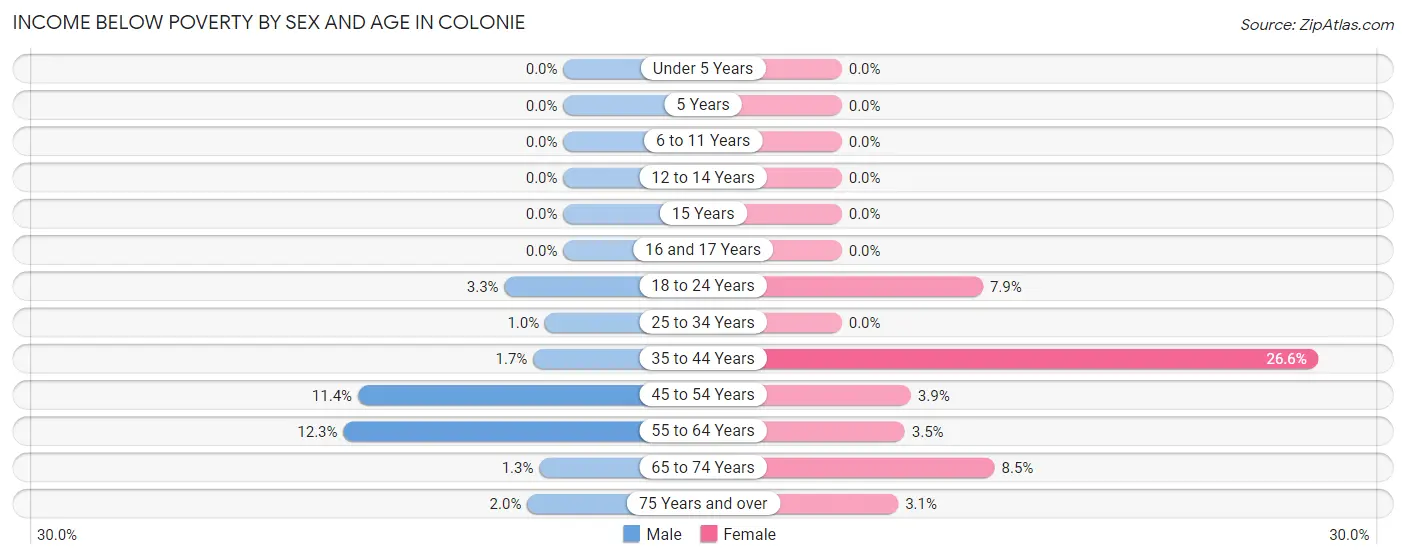
| Age Bracket | Male | Female |
| Under 5 Years | 0 (0.0%) | 0 (0.0%) |
| 5 Years | 0 (0.0%) | 0 (0.0%) |
| 6 to 11 Years | 0 (0.0%) | 0 (0.0%) |
| 12 to 14 Years | 0 (0.0%) | 0 (0.0%) |
| 15 Years | 0 (0.0%) | 0 (0.0%) |
| 16 and 17 Years | 0 (0.0%) | 0 (0.0%) |
| 18 to 24 Years | 14 (3.3%) | 22 (7.9%) |
| 25 to 34 Years | 5 (1.0%) | 0 (0.0%) |
| 35 to 44 Years | 6 (1.7%) | 141 (26.6%) |
| 45 to 54 Years | 66 (11.4%) | 21 (3.8%) |
| 55 to 64 Years | 62 (12.2%) | 19 (3.5%) |
| 65 to 74 Years | 5 (1.3%) | 49 (8.5%) |
| 75 Years and over | 7 (2.0%) | 13 (3.1%) |
| Total | 165 (4.0%) | 265 (7.2%) |
Income Above Poverty by Sex and Age in Colonie
According to the poverty statistics in Colonie, males aged under 5 years and females aged under 5 years are the age groups that are most secure financially, with 100.0% of males and 100.0% of females in these age groups living above the poverty line.
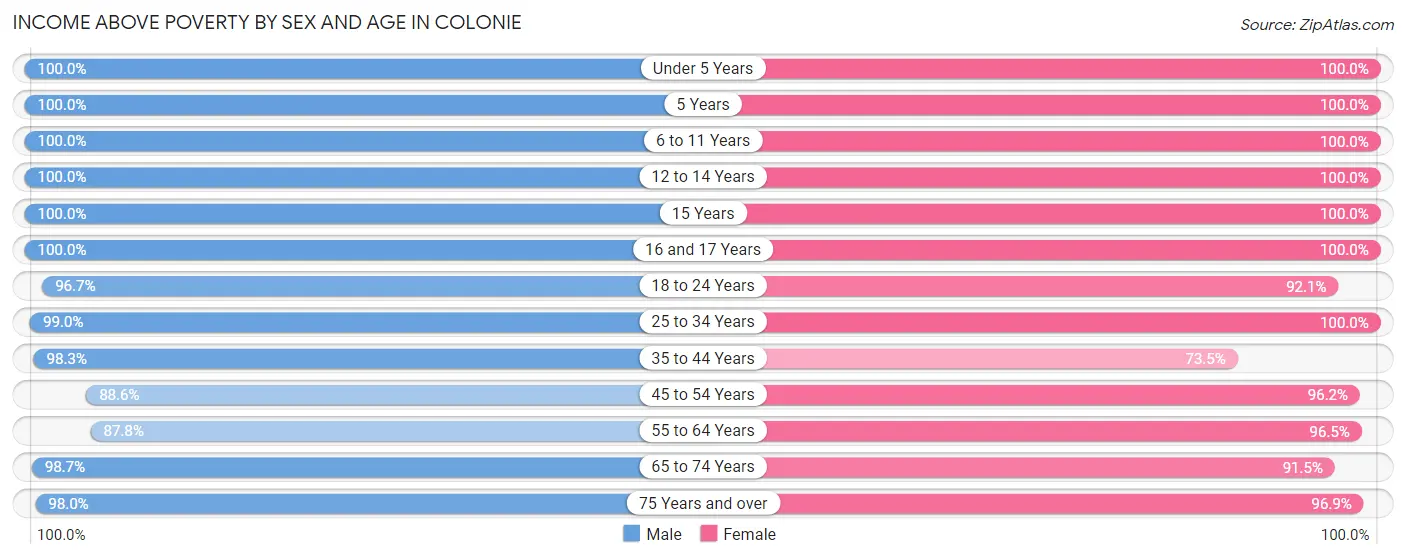
| Age Bracket | Male | Female |
| Under 5 Years | 186 (100.0%) | 137 (100.0%) |
| 5 Years | 27 (100.0%) | 14 (100.0%) |
| 6 to 11 Years | 219 (100.0%) | 234 (100.0%) |
| 12 to 14 Years | 193 (100.0%) | 62 (100.0%) |
| 15 Years | 37 (100.0%) | 10 (100.0%) |
| 16 and 17 Years | 347 (100.0%) | 29 (100.0%) |
| 18 to 24 Years | 413 (96.7%) | 258 (92.1%) |
| 25 to 34 Years | 484 (99.0%) | 306 (100.0%) |
| 35 to 44 Years | 351 (98.3%) | 390 (73.5%) |
| 45 to 54 Years | 511 (88.6%) | 525 (96.2%) |
| 55 to 64 Years | 444 (87.7%) | 522 (96.5%) |
| 65 to 74 Years | 368 (98.7%) | 527 (91.5%) |
| 75 Years and over | 342 (98.0%) | 401 (96.9%) |
| Total | 3,922 (96.0%) | 3,415 (92.8%) |
Income Below Poverty Among Married-Couple Families in Colonie
The poverty statistics for married-couple families in Colonie show that 0.9% or 12 of the total 1,348 families live below the poverty line. Families with no children have the highest poverty rate of 1.4%, comprising of 12 families. On the other hand, families with 1 or 2 children have the lowest poverty rate of 0.0%, which includes 0 families.
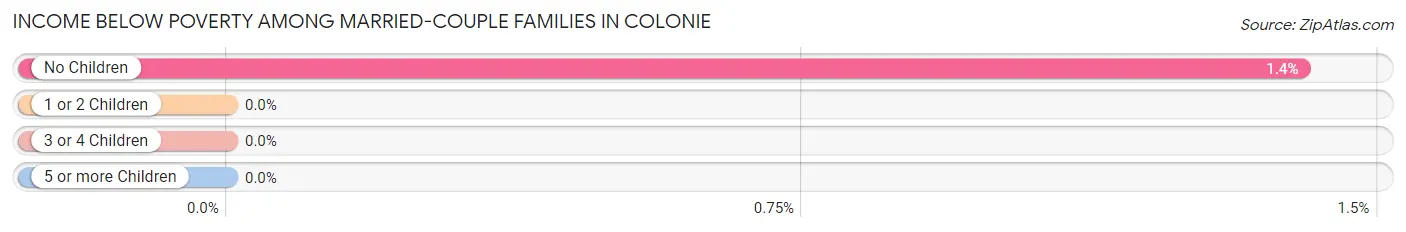
| Children | Above Poverty | Below Poverty |
| No Children | 844 (98.6%) | 12 (1.4%) |
| 1 or 2 Children | 370 (100.0%) | 0 (0.0%) |
| 3 or 4 Children | 112 (100.0%) | 0 (0.0%) |
| 5 or more Children | 10 (100.0%) | 0 (0.0%) |
| Total | 1,336 (99.1%) | 12 (0.9%) |
Income Below Poverty Among Single-Parent Households in Colonie
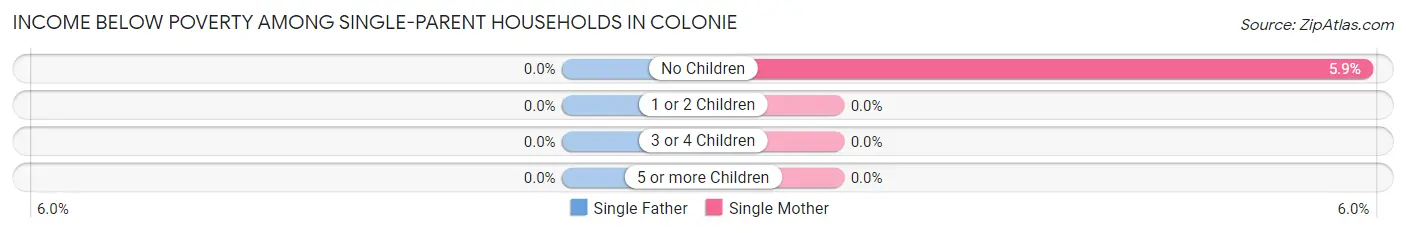
| Children | Single Father | Single Mother |
| No Children | 0 (0.0%) | 15 (5.9%) |
| 1 or 2 Children | 0 (0.0%) | 0 (0.0%) |
| 3 or 4 Children | 0 (0.0%) | 0 (0.0%) |
| 5 or more Children | 0 (0.0%) | 0 (0.0%) |
| Total | 0 (0.0%) | 15 (4.0%) |
Income Below Poverty Among Married-Couple vs Single-Parent Households in Colonie
The poverty data for Colonie shows that 12 of the married-couple family households (0.9%) and 15 of the single-parent households (2.7%) are living below the poverty level. Within the married-couple family households, those with no children have the highest poverty rate, with 12 households (1.4%) falling below the poverty line. Among the single-parent households, those with no children have the highest poverty rate, with 15 household (4.8%) living below poverty.
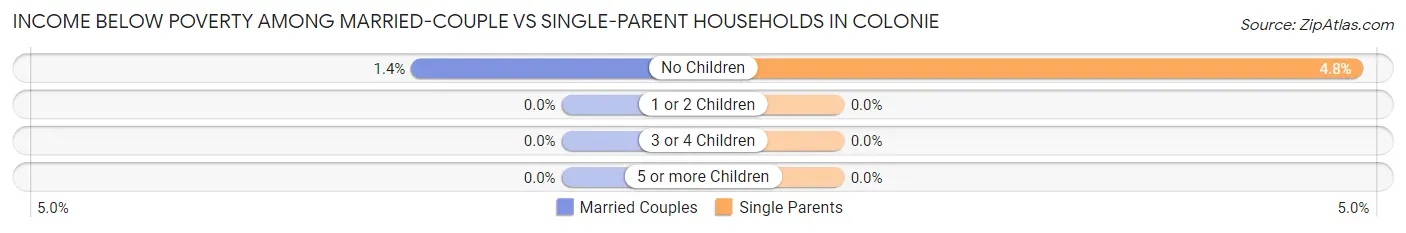
| Children | Married-Couple Families | Single-Parent Households |
| No Children | 12 (1.4%) | 15 (4.8%) |
| 1 or 2 Children | 0 (0.0%) | 0 (0.0%) |
| 3 or 4 Children | 0 (0.0%) | 0 (0.0%) |
| 5 or more Children | 0 (0.0%) | 0 (0.0%) |
| Total | 12 (0.9%) | 15 (2.7%) |
Race in Colonie
The most populous races in Colonie are White / Caucasian (6,351 | 81.8%), Asian (647 | 8.3%), and Two or more Races (531 | 6.8%).
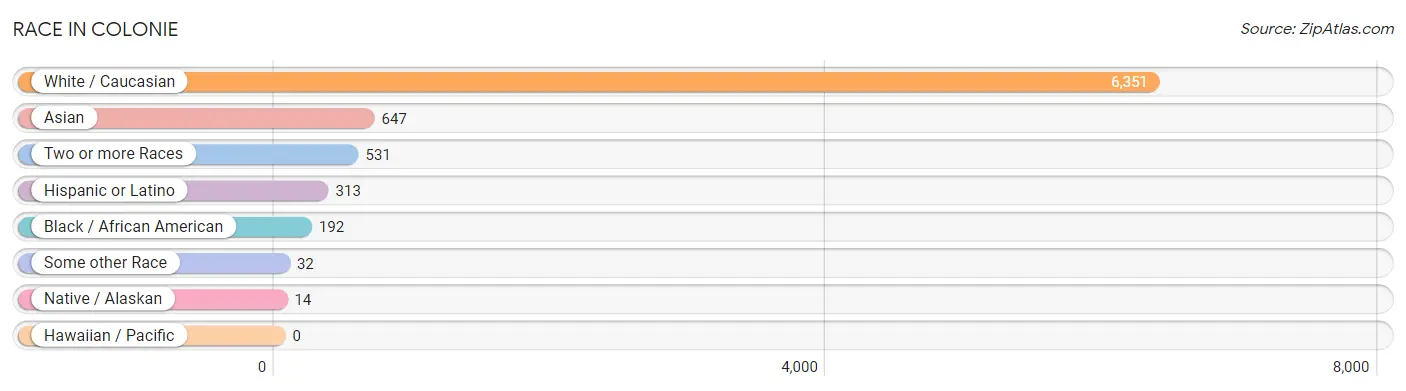
| Race | # Population | % Population |
| Asian | 647 | 8.3% |
| Black / African American | 192 | 2.5% |
| Hawaiian / Pacific | 0 | 0.0% |
| Hispanic or Latino | 313 | 4.0% |
| Native / Alaskan | 14 | 0.2% |
| White / Caucasian | 6,351 | 81.8% |
| Two or more Races | 531 | 6.8% |
| Some other Race | 32 | 0.4% |
| Total | 7,767 | 100.0% |
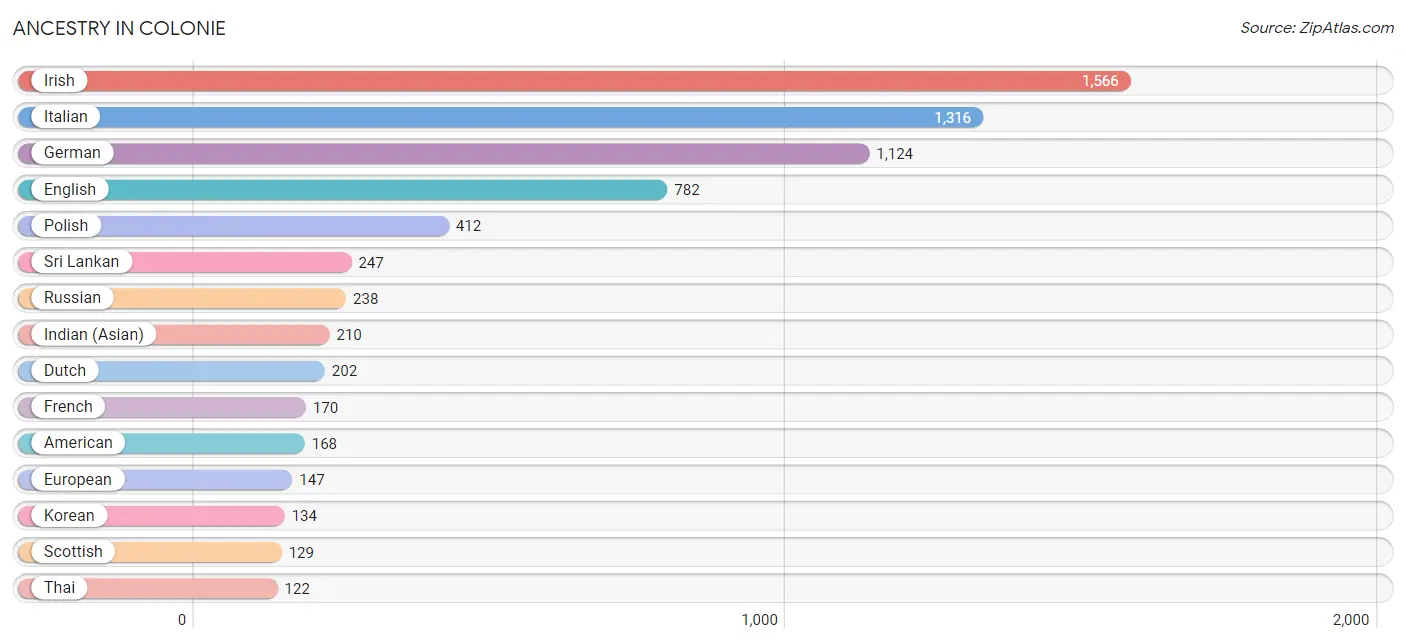
Ancestry in Colonie
The most populous ancestries reported in Colonie are Irish (1,566 | 20.2%), Italian (1,316 | 16.9%), German (1,124 | 14.5%), English (782 | 10.1%), and Polish (412 | 5.3%), together accounting for 66.9% of all Colonie residents.
| Ancestry | # Population | % Population |
| African | 37 | 0.5% |
| Albanian | 42 | 0.5% |
| American | 168 | 2.2% |
| Arab | 36 | 0.5% |
| Armenian | 119 | 1.5% |
| Austrian | 11 | 0.1% |
| Bhutanese | 30 | 0.4% |
| Brazilian | 54 | 0.7% |
| British | 80 | 1.0% |
| Central American | 38 | 0.5% |
| Cuban | 102 | 1.3% |
| Czech | 15 | 0.2% |
| Czechoslovakian | 102 | 1.3% |
| Danish | 8 | 0.1% |
| Dutch | 202 | 2.6% |
| Eastern European | 95 | 1.2% |
| English | 782 | 10.1% |
| European | 147 | 1.9% |
| Filipino | 14 | 0.2% |
| French | 170 | 2.2% |
| French Canadian | 24 | 0.3% |
| German | 1,124 | 14.5% |
| Guyanese | 9 | 0.1% |
| Hungarian | 5 | 0.1% |
| Indian (Asian) | 210 | 2.7% |
| Iraqi | 36 | 0.5% |
| Irish | 1,566 | 20.2% |
| Iroquois | 14 | 0.2% |
| Israeli | 3 | 0.0% |
| Italian | 1,316 | 16.9% |
| Jamaican | 41 | 0.5% |
| Korean | 134 | 1.7% |
| Lithuanian | 15 | 0.2% |
| Mexican | 19 | 0.2% |
| Pakistani | 1 | 0.0% |
| Pennsylvania German | 5 | 0.1% |
| Polish | 412 | 5.3% |
| Puerto Rican | 114 | 1.5% |
| Romanian | 22 | 0.3% |
| Russian | 238 | 3.1% |
| Salvadoran | 38 | 0.5% |
| Scandinavian | 46 | 0.6% |
| Scotch-Irish | 65 | 0.8% |
| Scottish | 129 | 1.7% |
| Slovak | 40 | 0.5% |
| Spaniard | 33 | 0.4% |
| Sri Lankan | 247 | 3.2% |
| Subsaharan African | 37 | 0.5% |
| Swedish | 22 | 0.3% |
| Swiss | 14 | 0.2% |
| Thai | 122 | 1.6% |
| Ukrainian | 45 | 0.6% |
| Welsh | 89 | 1.1% |
| West Indian | 6 | 0.1% | View All 54 Rows |
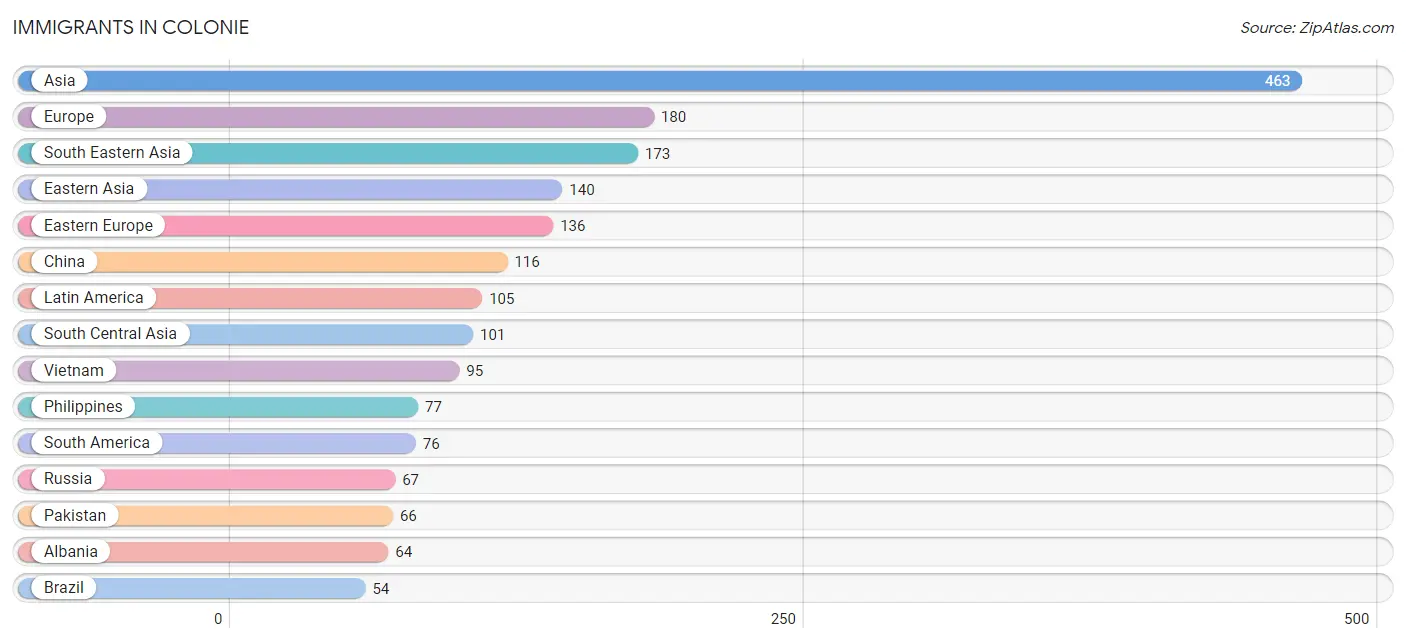
Immigrants in Colonie
The most numerous immigrant groups reported in Colonie came from Asia (463 | 6.0%), Europe (180 | 2.3%), South Eastern Asia (173 | 2.2%), Eastern Asia (140 | 1.8%), and Eastern Europe (136 | 1.8%), together accounting for 14.1% of all Colonie residents.
| Immigration Origin | # Population | % Population |
| Africa | 22 | 0.3% |
| Albania | 64 | 0.8% |
| Asia | 463 | 6.0% |
| Brazil | 54 | 0.7% |
| Canada | 5 | 0.1% |
| Caribbean | 20 | 0.3% |
| Central America | 9 | 0.1% |
| China | 116 | 1.5% |
| Eastern Asia | 140 | 1.8% |
| Eastern Europe | 136 | 1.8% |
| Egypt | 10 | 0.1% |
| El Salvador | 9 | 0.1% |
| England | 10 | 0.1% |
| Europe | 180 | 2.3% |
| Germany | 6 | 0.1% |
| Ghana | 12 | 0.2% |
| Guyana | 22 | 0.3% |
| Hong Kong | 10 | 0.1% |
| India | 30 | 0.4% |
| Iraq | 23 | 0.3% |
| Italy | 13 | 0.2% |
| Jamaica | 20 | 0.3% |
| Japan | 20 | 0.3% |
| Korea | 4 | 0.1% |
| Kuwait | 26 | 0.3% |
| Latin America | 105 | 1.3% |
| Nepal | 5 | 0.1% |
| Northern Africa | 10 | 0.1% |
| Northern Europe | 25 | 0.3% |
| Pakistan | 66 | 0.9% |
| Philippines | 77 | 1.0% |
| Russia | 67 | 0.9% |
| Scotland | 15 | 0.2% |
| South America | 76 | 1.0% |
| South Central Asia | 101 | 1.3% |
| South Eastern Asia | 173 | 2.2% |
| Southern Europe | 13 | 0.2% |
| Taiwan | 14 | 0.2% |
| Thailand | 1 | 0.0% |
| Ukraine | 5 | 0.1% |
| Vietnam | 95 | 1.2% |
| Western Africa | 12 | 0.2% |
| Western Asia | 49 | 0.6% |
| Western Europe | 6 | 0.1% | View All 44 Rows |
Sex and Age in Colonie
Sex and Age in Colonie
The most populous age groups in Colonie are 15 to 19 Years (508 | 12.4%) for men and 40 to 44 Years (319 | 8.7%) for women.
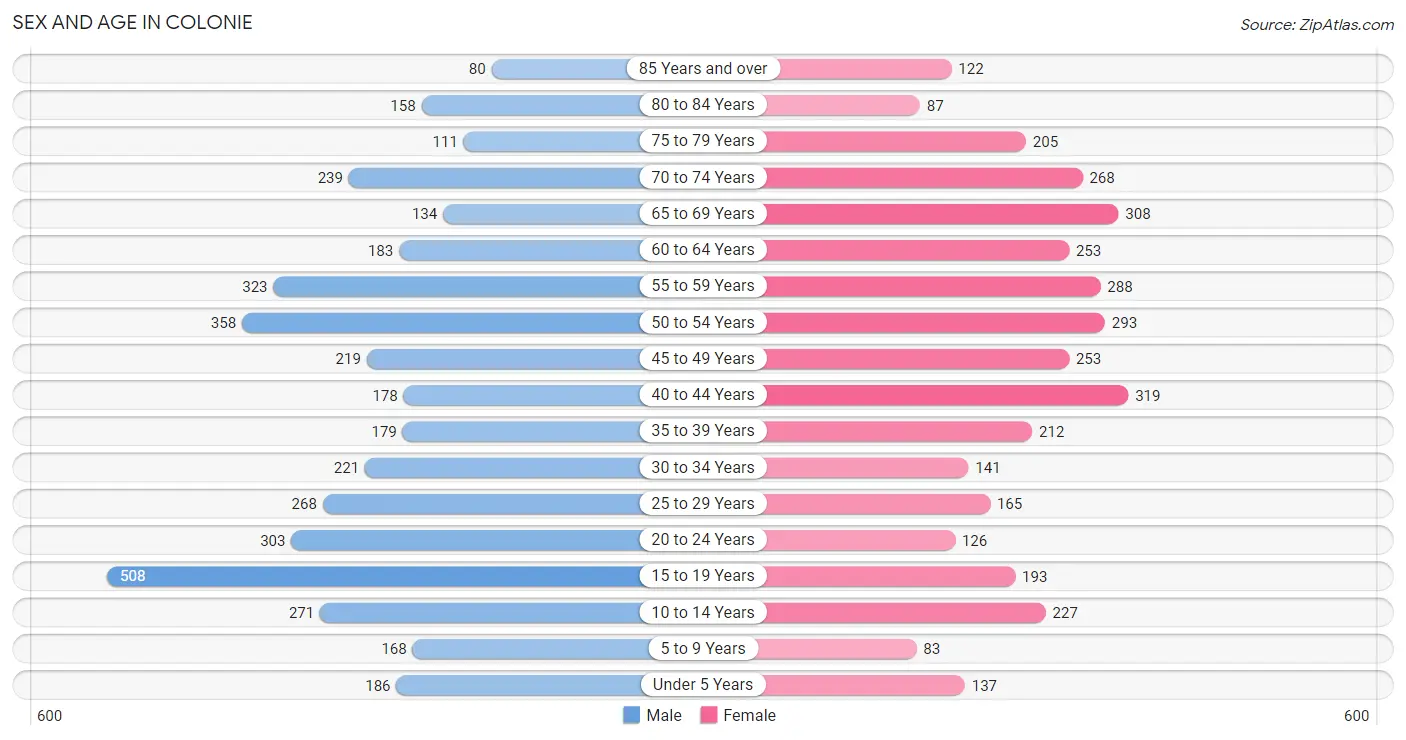
| Age Bracket | Male | Female |
| Under 5 Years | 186 (4.5%) | 137 (3.7%) |
| 5 to 9 Years | 168 (4.1%) | 83 (2.3%) |
| 10 to 14 Years | 271 (6.6%) | 227 (6.2%) |
| 15 to 19 Years | 508 (12.4%) | 193 (5.2%) |
| 20 to 24 Years | 303 (7.4%) | 126 (3.4%) |
| 25 to 29 Years | 268 (6.6%) | 165 (4.5%) |
| 30 to 34 Years | 221 (5.4%) | 141 (3.8%) |
| 35 to 39 Years | 179 (4.4%) | 212 (5.8%) |
| 40 to 44 Years | 178 (4.4%) | 319 (8.7%) |
| 45 to 49 Years | 219 (5.4%) | 253 (6.9%) |
| 50 to 54 Years | 358 (8.8%) | 293 (8.0%) |
| 55 to 59 Years | 323 (7.9%) | 288 (7.8%) |
| 60 to 64 Years | 183 (4.5%) | 253 (6.9%) |
| 65 to 69 Years | 134 (3.3%) | 308 (8.4%) |
| 70 to 74 Years | 239 (5.9%) | 268 (7.3%) |
| 75 to 79 Years | 111 (2.7%) | 205 (5.6%) |
| 80 to 84 Years | 158 (3.9%) | 87 (2.4%) |
| 85 Years and over | 80 (2.0%) | 122 (3.3%) |
| Total | 4,087 (100.0%) | 3,680 (100.0%) |
Families and Households in Colonie
Median Family Size in Colonie
The median family size in Colonie is 3.18 persons per family, with single male/father families (179 | 9.4%) accounting for the largest median family size of 4.35 persons per family. On the other hand, single female/mother families (374 | 19.7%) represent the smallest median family size with 2.82 persons per family.
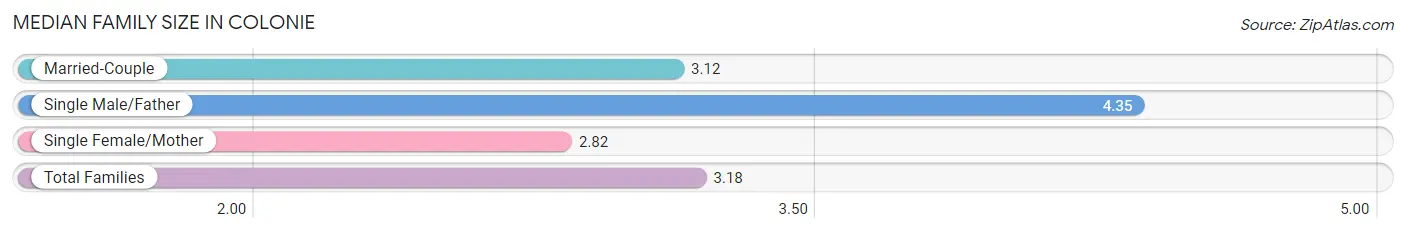
| Family Type | # Families | Family Size |
| Married-Couple | 1,348 (70.9%) | 3.12 |
| Single Male/Father | 179 (9.4%) | 4.35 |
| Single Female/Mother | 374 (19.7%) | 2.82 |
| Total Families | 1,901 (100.0%) | 3.18 |
Median Household Size in Colonie
The median household size in Colonie is 2.54 persons per household, with single male/father households (179 | 5.9%) accounting for the largest median household size of 5.31 persons per household. non-family households (1,157 | 37.8%) represent the smallest median household size with 1.27 persons per household.
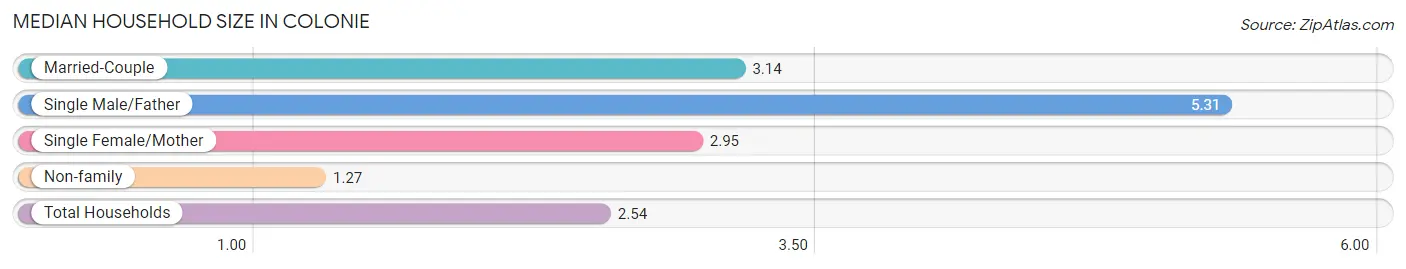
| Household Type | # Households | Household Size |
| Married-Couple | 1,348 (44.1%) | 3.14 |
| Single Male/Father | 179 (5.9%) | 5.31 |
| Single Female/Mother | 374 (12.2%) | 2.95 |
| Non-family | 1,157 (37.8%) | 1.27 |
| Total Households | 3,058 (100.0%) | 2.54 |
Household Size by Marriage Status in Colonie
Out of a total of 3,058 households in Colonie, 1,901 (62.2%) are family households, while 1,157 (37.8%) are nonfamily households. The most numerous type of family households are 2-person households, comprising 971, and the most common type of nonfamily households are 1-person households, comprising 899.
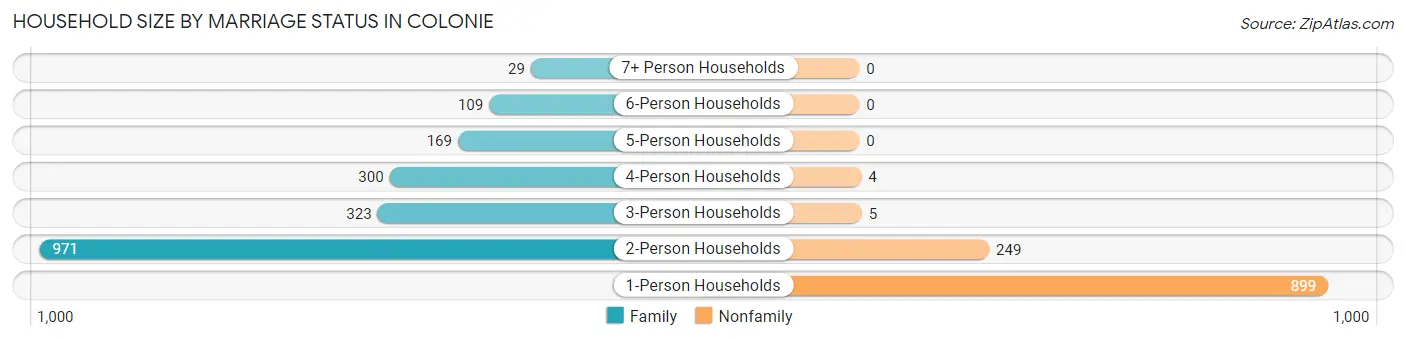
| Household Size | Family Households | Nonfamily Households |
| 1-Person Households | - | 899 (29.4%) |
| 2-Person Households | 971 (31.8%) | 249 (8.1%) |
| 3-Person Households | 323 (10.6%) | 5 (0.2%) |
| 4-Person Households | 300 (9.8%) | 4 (0.1%) |
| 5-Person Households | 169 (5.5%) | 0 (0.0%) |
| 6-Person Households | 109 (3.6%) | 0 (0.0%) |
| 7+ Person Households | 29 (0.9%) | 0 (0.0%) |
| Total | 1,901 (62.2%) | 1,157 (37.8%) |
Female Fertility in Colonie
Fertility by Age in Colonie
Average fertility rate in Colonie is 39.0 births per 1,000 women. Women in the age bracket of 20 to 34 years have the highest fertility rate with 74.0 births per 1,000 women. Women in the age bracket of 20 to 34 years acount for 57.1% of all women with births.
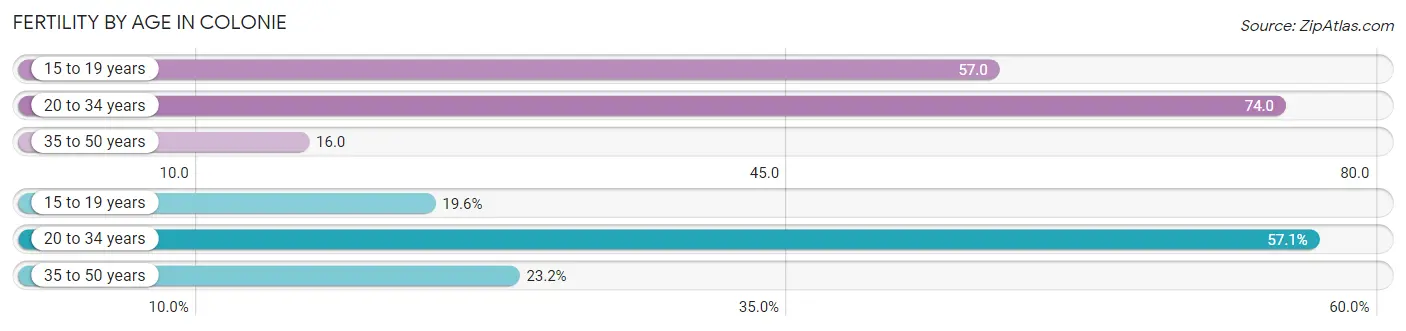
| Age Bracket | Women with Births | Births / 1,000 Women |
| 15 to 19 years | 11 (19.6%) | 57.0 |
| 20 to 34 years | 32 (57.1%) | 74.0 |
| 35 to 50 years | 13 (23.2%) | 16.0 |
| Total | 56 (100.0%) | 39.0 |
Fertility by Age by Marriage Status in Colonie
66.1% of women with births (56) in Colonie are married. The highest percentage of unmarried women with births falls into 15 to 19 years age bracket with 100.0% of them unmarried at the time of birth, while the lowest percentage of unmarried women with births belong to 20 to 34 years age bracket with 0.0% of them unmarried.
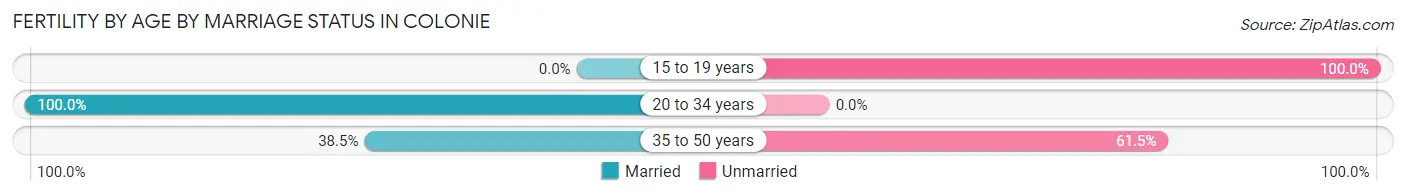
| Age Bracket | Married | Unmarried |
| 15 to 19 years | 0 (0.0%) | 11 (100.0%) |
| 20 to 34 years | 32 (100.0%) | 0 (0.0%) |
| 35 to 50 years | 5 (38.5%) | 8 (61.5%) |
| Total | 37 (66.1%) | 19 (33.9%) |
Fertility by Education in Colonie
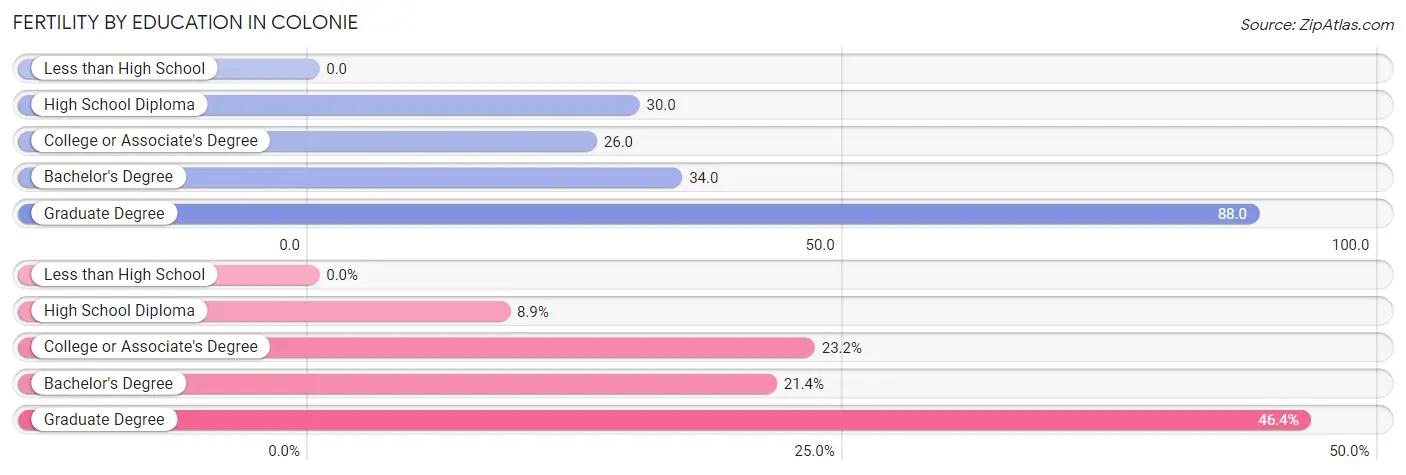
| Educational Attainment | Women with Births | Births / 1,000 Women |
| Less than High School | 0 (0.0%) | 0.0 |
| High School Diploma | 5 (8.9%) | 30.0 |
| College or Associate's Degree | 13 (23.2%) | 26.0 |
| Bachelor's Degree | 12 (21.4%) | 34.0 |
| Graduate Degree | 26 (46.4%) | 88.0 |
| Total | 56 (100.0%) | 39.0 |
Fertility by Education by Marriage Status in Colonie
33.9% of women with births in Colonie are unmarried. Women with the educational attainment of high school diploma are most likely to be married with 100.0% of them married at childbirth, while women with the educational attainment of college or associate's degree are least likely to be married with 100.0% of them unmarried at childbirth.
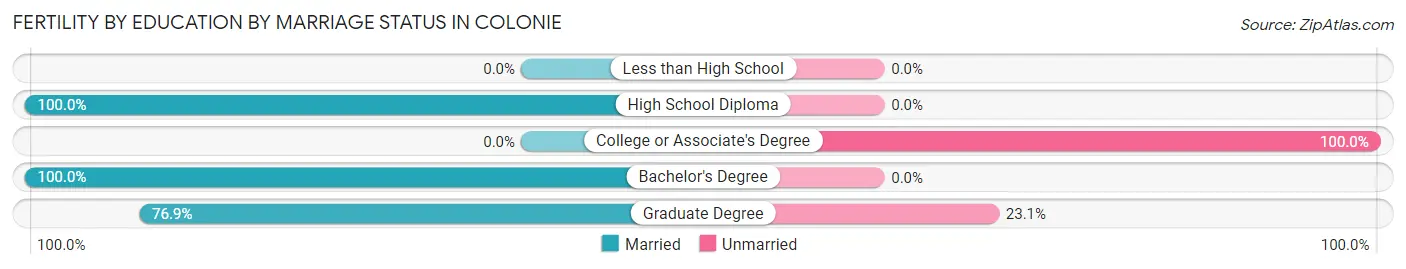
| Educational Attainment | Married | Unmarried |
| Less than High School | 0 (0.0%) | 0 (0.0%) |
| High School Diploma | 5 (100.0%) | 0 (0.0%) |
| College or Associate's Degree | 0 (0.0%) | 13 (100.0%) |
| Bachelor's Degree | 12 (100.0%) | 0 (0.0%) |
| Graduate Degree | 20 (76.9%) | 6 (23.1%) |
| Total | 37 (66.1%) | 19 (33.9%) |
Employment Characteristics in Colonie
Employment by Class of Employer in Colonie
Among the 3,750 employed individuals in Colonie, private company employees (2,160 | 57.6%), state government employees (569 | 15.2%), and not-for-profit organizations (477 | 12.7%) make up the most common classes of employment.
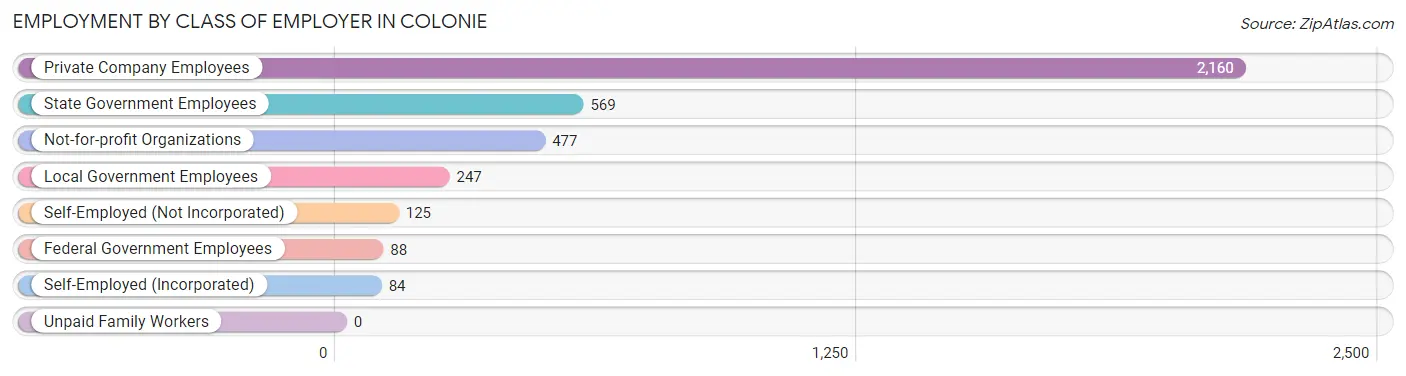
| Employer Class | # Employees | % Employees |
| Private Company Employees | 2,160 | 57.6% |
| Self-Employed (Incorporated) | 84 | 2.2% |
| Self-Employed (Not Incorporated) | 125 | 3.3% |
| Not-for-profit Organizations | 477 | 12.7% |
| Local Government Employees | 247 | 6.6% |
| State Government Employees | 569 | 15.2% |
| Federal Government Employees | 88 | 2.4% |
| Unpaid Family Workers | 0 | 0.0% |
| Total | 3,750 | 100.0% |
Employment Status by Age in Colonie
According to the labor force statistics for Colonie, out of the total population over 16 years of age (6,648), 58.2% or 3,869 individuals are in the labor force, with 2.7% or 104 of them unemployed. The age group with the highest labor force participation rate is 25 to 29 years, with 90.5% or 392 individuals in the labor force. Within the labor force, the 55 to 59 years age range has the highest percentage of unemployed individuals, with 11.1% or 49 of them being unemployed.
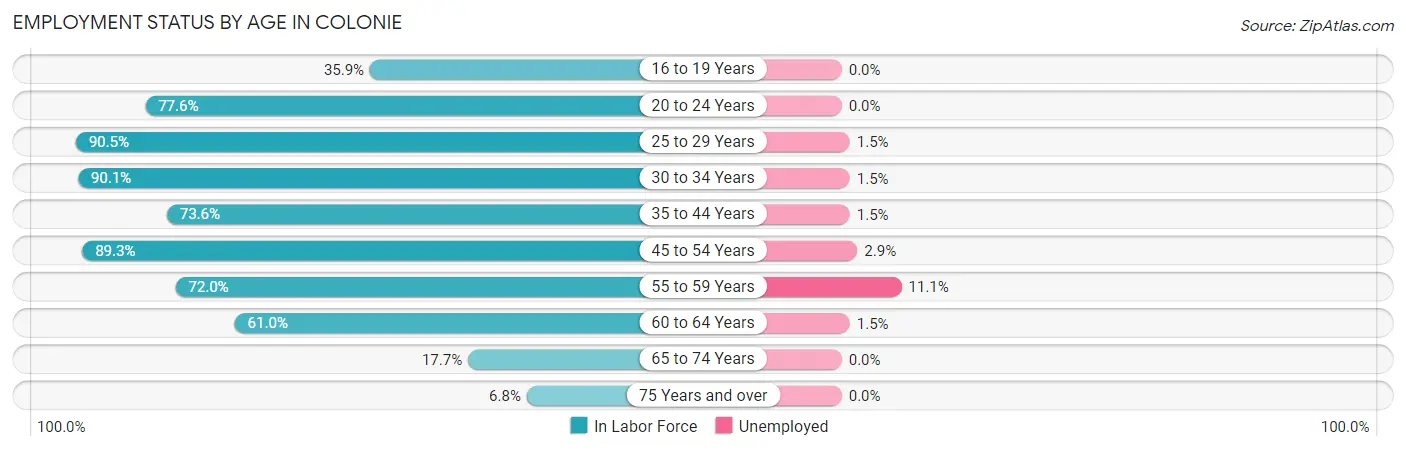
| Age Bracket | In Labor Force | Unemployed |
| 16 to 19 Years | 235 (35.9%) | 0 (0.0%) |
| 20 to 24 Years | 333 (77.6%) | 0 (0.0%) |
| 25 to 29 Years | 392 (90.5%) | 6 (1.5%) |
| 30 to 34 Years | 326 (90.1%) | 5 (1.5%) |
| 35 to 44 Years | 654 (73.6%) | 10 (1.5%) |
| 45 to 54 Years | 1,003 (89.3%) | 29 (2.9%) |
| 55 to 59 Years | 440 (72.0%) | 49 (11.1%) |
| 60 to 64 Years | 266 (61.0%) | 4 (1.5%) |
| 65 to 74 Years | 168 (17.7%) | 0 (0.0%) |
| 75 Years and over | 52 (6.8%) | 0 (0.0%) |
| Total | 3,869 (58.2%) | 104 (2.7%) |
Employment Status by Educational Attainment in Colonie
According to labor force statistics for Colonie, 80.0% of individuals (3,082) out of the total population between 25 and 64 years of age (3,853) are in the labor force, with 3.3% or 102 of them being unemployed. The group with the highest labor force participation rate are those with the educational attainment of bachelor's degree or higher, with 84.7% or 1,297 individuals in the labor force. Within the labor force, individuals with high school diploma education have the highest percentage of unemployment, with 7.9% or 39 of them being unemployed.
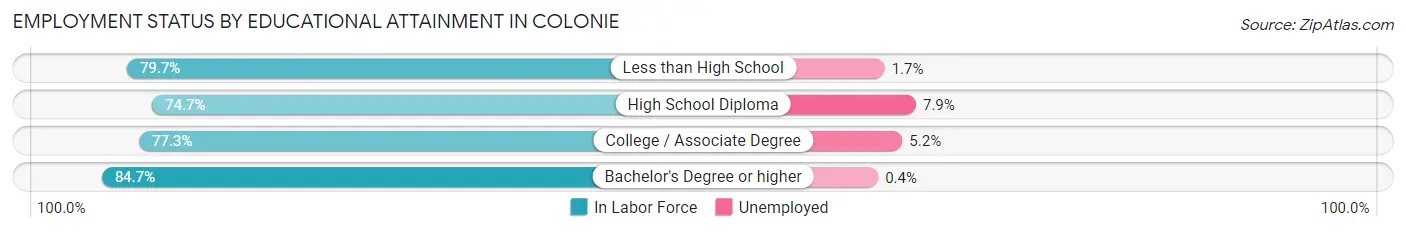
| Educational Attainment | In Labor Force | Unemployed |
| Less than High School | 239 (79.7%) | 5 (1.7%) |
| High School Diploma | 495 (74.7%) | 52 (7.9%) |
| College / Associate Degree | 1,051 (77.3%) | 71 (5.2%) |
| Bachelor's Degree or higher | 1,297 (84.7%) | 6 (0.4%) |
| Total | 3,082 (80.0%) | 127 (3.3%) |
Employment Occupations by Sex in Colonie
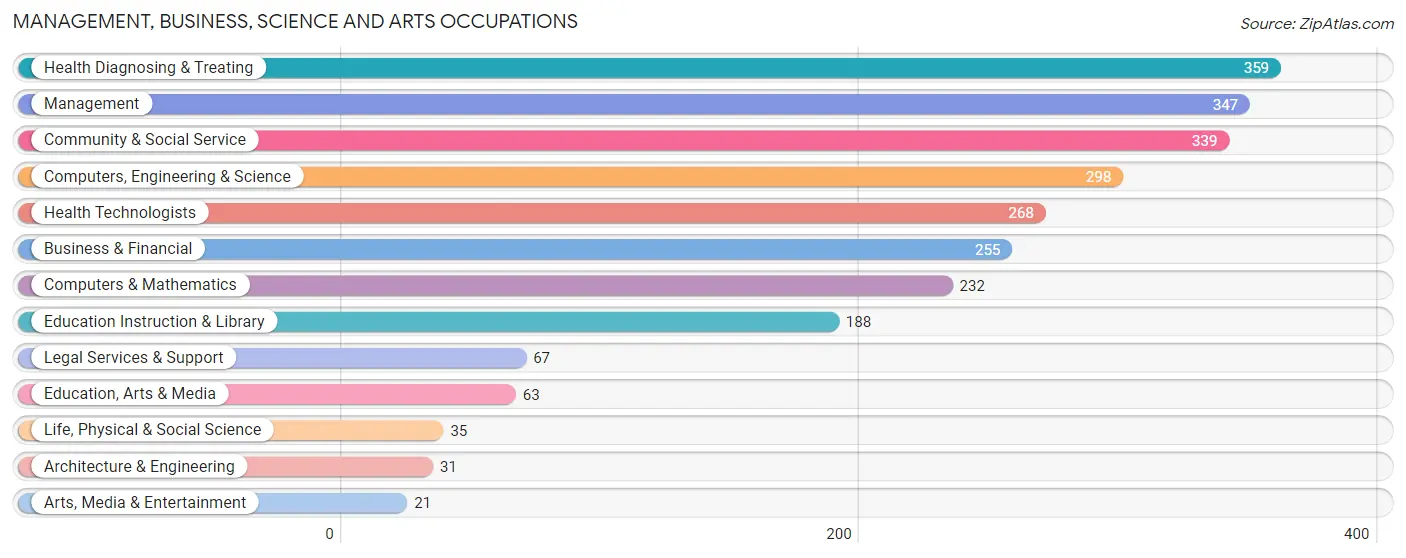
Management, Business, Science and Arts Occupations
The most common Management, Business, Science and Arts occupations in Colonie are Health Diagnosing & Treating (359 | 9.5%), Management (347 | 9.2%), Community & Social Service (339 | 9.0%), Computers, Engineering & Science (298 | 7.9%), and Health Technologists (268 | 7.1%).
Management, Business, Science and Arts Occupations by Sex
Within the Management, Business, Science and Arts occupations in Colonie, the most male-oriented occupations are Computers & Mathematics (94.4%), Computers, Engineering & Science (79.2%), and Arts, Media & Entertainment (76.2%), while the most female-oriented occupations are Life, Physical & Social Science (100.0%), Health Diagnosing & Treating (91.9%), and Health Technologists (90.7%).
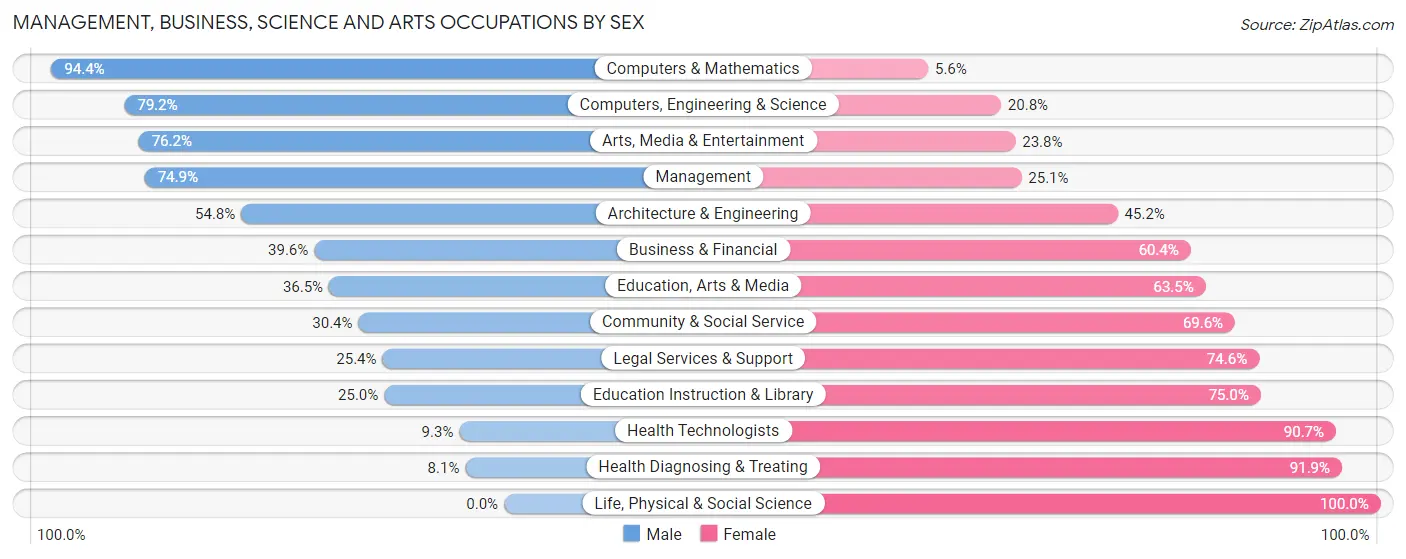
| Occupation | Male | Female |
| Management | 260 (74.9%) | 87 (25.1%) |
| Business & Financial | 101 (39.6%) | 154 (60.4%) |
| Computers, Engineering & Science | 236 (79.2%) | 62 (20.8%) |
| Computers & Mathematics | 219 (94.4%) | 13 (5.6%) |
| Architecture & Engineering | 17 (54.8%) | 14 (45.2%) |
| Life, Physical & Social Science | 0 (0.0%) | 35 (100.0%) |
| Community & Social Service | 103 (30.4%) | 236 (69.6%) |
| Education, Arts & Media | 23 (36.5%) | 40 (63.5%) |
| Legal Services & Support | 17 (25.4%) | 50 (74.6%) |
| Education Instruction & Library | 47 (25.0%) | 141 (75.0%) |
| Arts, Media & Entertainment | 16 (76.2%) | 5 (23.8%) |
| Health Diagnosing & Treating | 29 (8.1%) | 330 (91.9%) |
| Health Technologists | 25 (9.3%) | 243 (90.7%) |
| Total (Category) | 729 (45.6%) | 869 (54.4%) |
| Total (Overall) | 2,082 (55.3%) | 1,681 (44.7%) |
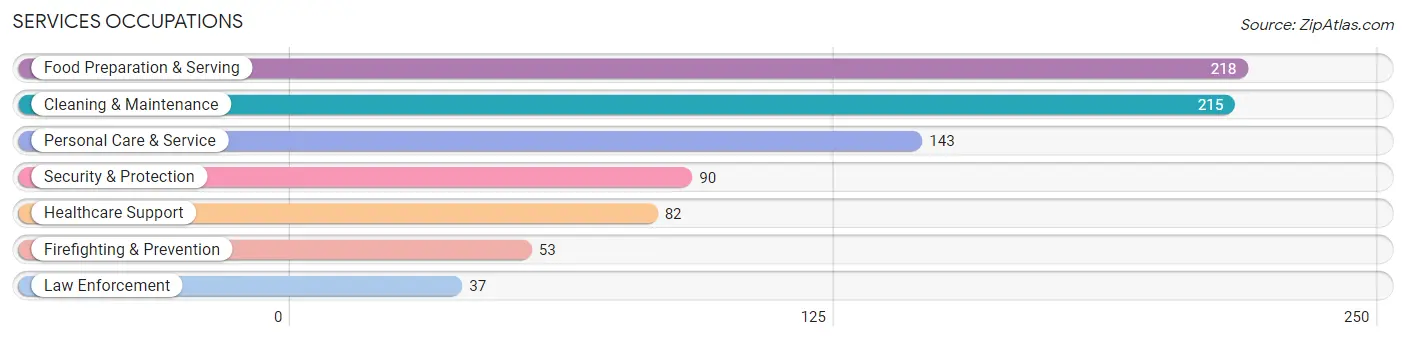
Services Occupations
The most common Services occupations in Colonie are Food Preparation & Serving (218 | 5.8%), Cleaning & Maintenance (215 | 5.7%), Personal Care & Service (143 | 3.8%), Security & Protection (90 | 2.4%), and Healthcare Support (82 | 2.2%).
Services Occupations by Sex
Within the Services occupations in Colonie, the most male-oriented occupations are Law Enforcement (100.0%), Security & Protection (94.4%), and Cleaning & Maintenance (93.5%), while the most female-oriented occupations are Healthcare Support (100.0%), Food Preparation & Serving (78.9%), and Personal Care & Service (51.0%).
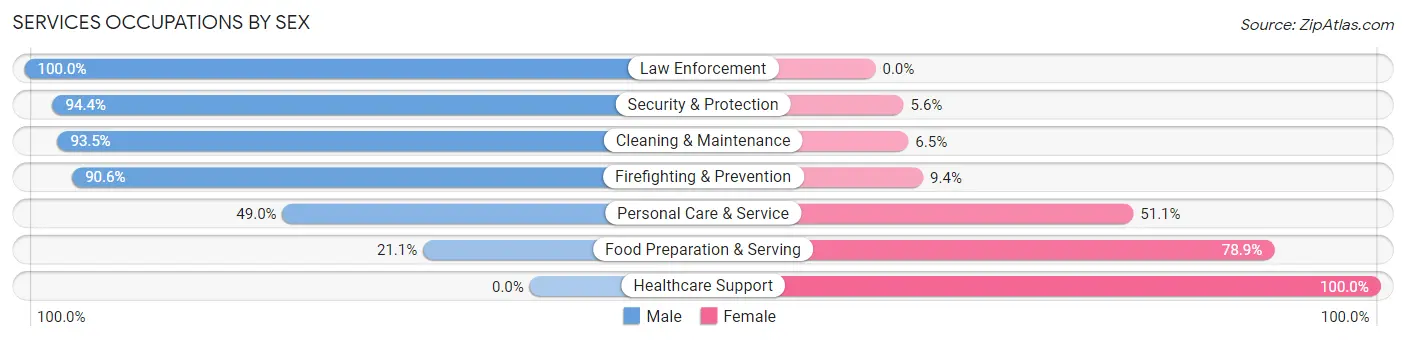
| Occupation | Male | Female |
| Healthcare Support | 0 (0.0%) | 82 (100.0%) |
| Security & Protection | 85 (94.4%) | 5 (5.6%) |
| Firefighting & Prevention | 48 (90.6%) | 5 (9.4%) |
| Law Enforcement | 37 (100.0%) | 0 (0.0%) |
| Food Preparation & Serving | 46 (21.1%) | 172 (78.9%) |
| Cleaning & Maintenance | 201 (93.5%) | 14 (6.5%) |
| Personal Care & Service | 70 (48.9%) | 73 (51.0%) |
| Total (Category) | 402 (53.7%) | 346 (46.3%) |
| Total (Overall) | 2,082 (55.3%) | 1,681 (44.7%) |
Sales and Office Occupations
The most common Sales and Office occupations in Colonie are Office & Administration (468 | 12.4%), and Sales & Related (260 | 6.9%).

Sales and Office Occupations by Sex

| Occupation | Male | Female |
| Sales & Related | 219 (84.2%) | 41 (15.8%) |
| Office & Administration | 87 (18.6%) | 381 (81.4%) |
| Total (Category) | 306 (42.0%) | 422 (58.0%) |
| Total (Overall) | 2,082 (55.3%) | 1,681 (44.7%) |
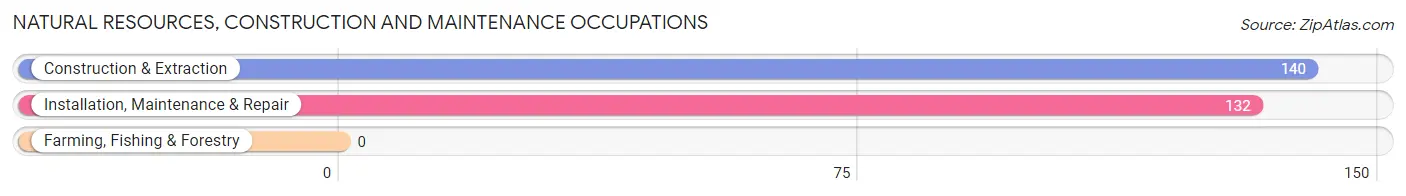
Natural Resources, Construction and Maintenance Occupations
The most common Natural Resources, Construction and Maintenance occupations in Colonie are Construction & Extraction (140 | 3.7%), and Installation, Maintenance & Repair (132 | 3.5%).
Natural Resources, Construction and Maintenance Occupations by Sex
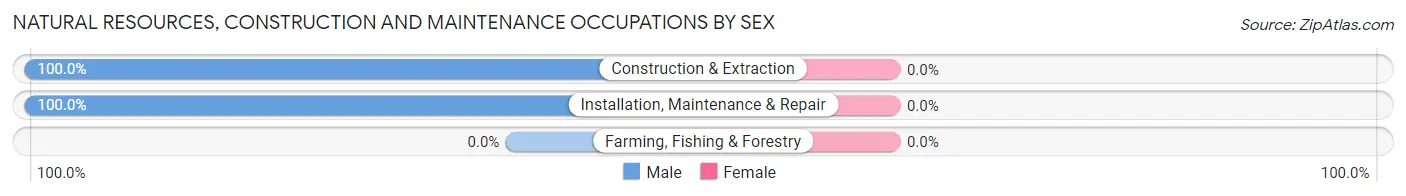
| Occupation | Male | Female |
| Farming, Fishing & Forestry | 0 (0.0%) | 0 (0.0%) |
| Construction & Extraction | 140 (100.0%) | 0 (0.0%) |
| Installation, Maintenance & Repair | 132 (100.0%) | 0 (0.0%) |
| Total (Category) | 272 (100.0%) | 0 (0.0%) |
| Total (Overall) | 2,082 (55.3%) | 1,681 (44.7%) |
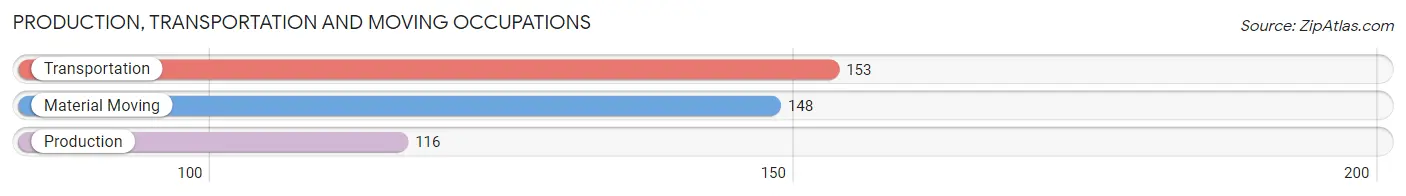
Production, Transportation and Moving Occupations
The most common Production, Transportation and Moving occupations in Colonie are Transportation (153 | 4.1%), Material Moving (148 | 3.9%), and Production (116 | 3.1%).
Production, Transportation and Moving Occupations by Sex
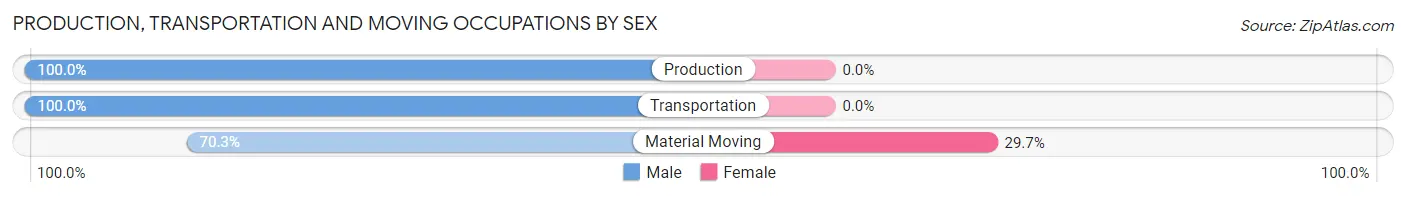
| Occupation | Male | Female |
| Production | 116 (100.0%) | 0 (0.0%) |
| Transportation | 153 (100.0%) | 0 (0.0%) |
| Material Moving | 104 (70.3%) | 44 (29.7%) |
| Total (Category) | 373 (89.4%) | 44 (10.5%) |
| Total (Overall) | 2,082 (55.3%) | 1,681 (44.7%) |
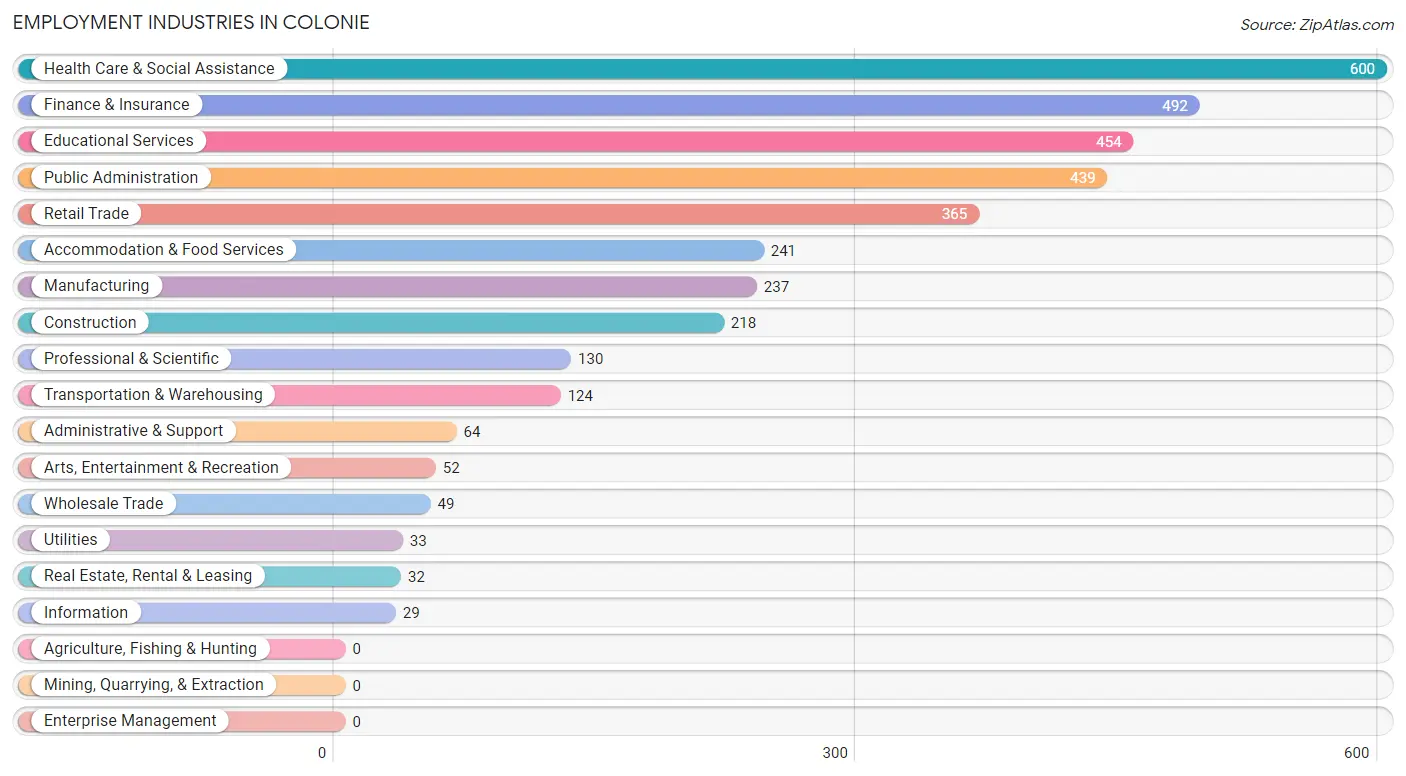
Employment Industries by Sex in Colonie
Employment Industries in Colonie
The major employment industries in Colonie include Health Care & Social Assistance (600 | 15.9%), Finance & Insurance (492 | 13.1%), Educational Services (454 | 12.1%), Public Administration (439 | 11.7%), and Retail Trade (365 | 9.7%).
Employment Industries by Sex in Colonie
The Colonie industries that see more men than women are Wholesale Trade (100.0%), Utilities (100.0%), and Real Estate, Rental & Leasing (100.0%), whereas the industries that tend to have a higher number of women are Health Care & Social Assistance (86.3%), Accommodation & Food Services (64.7%), and Professional & Scientific (56.9%).
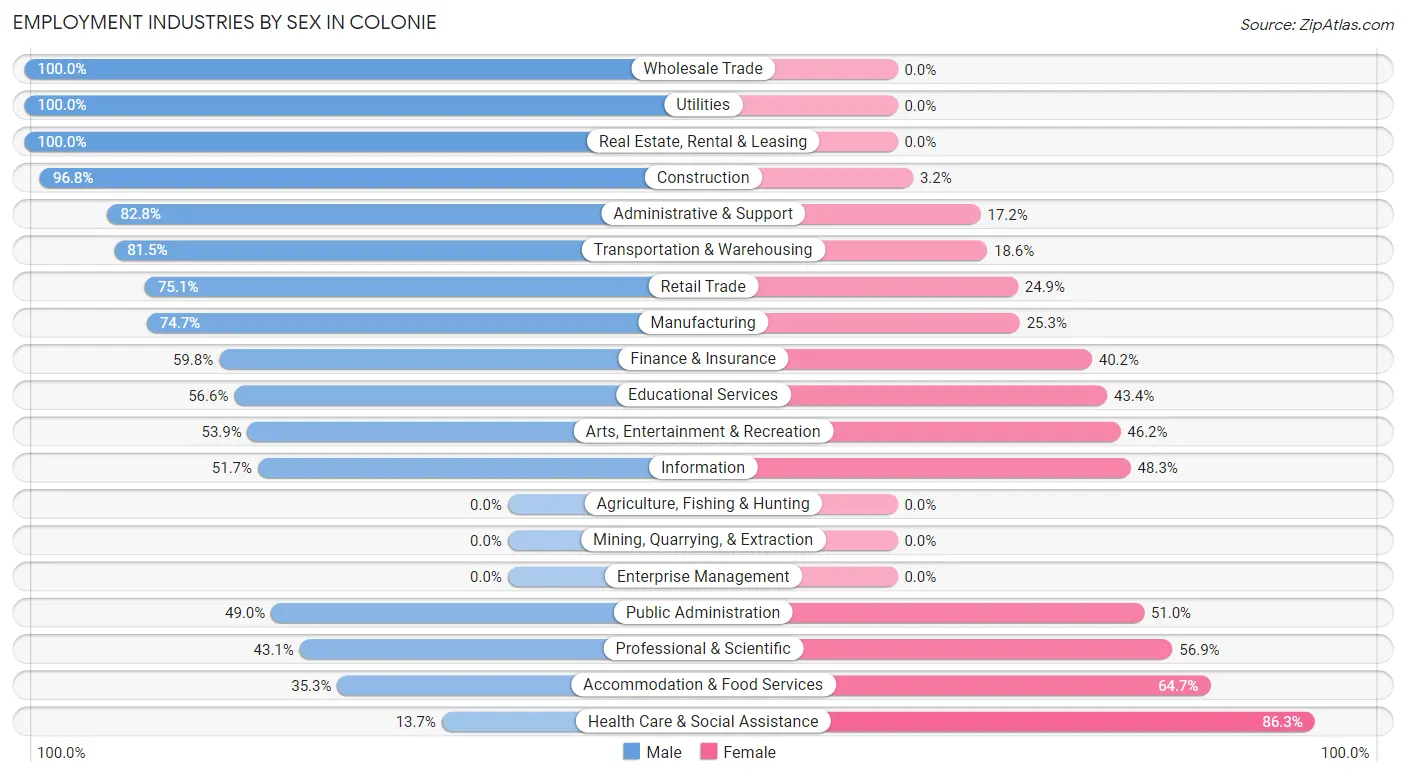
| Industry | Male | Female |
| Agriculture, Fishing & Hunting | 0 (0.0%) | 0 (0.0%) |
| Mining, Quarrying, & Extraction | 0 (0.0%) | 0 (0.0%) |
| Construction | 211 (96.8%) | 7 (3.2%) |
| Manufacturing | 177 (74.7%) | 60 (25.3%) |
| Wholesale Trade | 49 (100.0%) | 0 (0.0%) |
| Retail Trade | 274 (75.1%) | 91 (24.9%) |
| Transportation & Warehousing | 101 (81.5%) | 23 (18.5%) |
| Utilities | 33 (100.0%) | 0 (0.0%) |
| Information | 15 (51.7%) | 14 (48.3%) |
| Finance & Insurance | 294 (59.8%) | 198 (40.2%) |
| Real Estate, Rental & Leasing | 32 (100.0%) | 0 (0.0%) |
| Professional & Scientific | 56 (43.1%) | 74 (56.9%) |
| Enterprise Management | 0 (0.0%) | 0 (0.0%) |
| Administrative & Support | 53 (82.8%) | 11 (17.2%) |
| Educational Services | 257 (56.6%) | 197 (43.4%) |
| Health Care & Social Assistance | 82 (13.7%) | 518 (86.3%) |
| Arts, Entertainment & Recreation | 28 (53.8%) | 24 (46.2%) |
| Accommodation & Food Services | 85 (35.3%) | 156 (64.7%) |
| Public Administration | 215 (49.0%) | 224 (51.0%) |
| Total | 2,082 (55.3%) | 1,681 (44.7%) |
Education in Colonie
School Enrollment in Colonie
The most common levels of schooling among the 1,740 students in Colonie are high school (526 | 30.2%), middle school (416 | 23.9%), and college / undergraduate (285 | 16.4%).
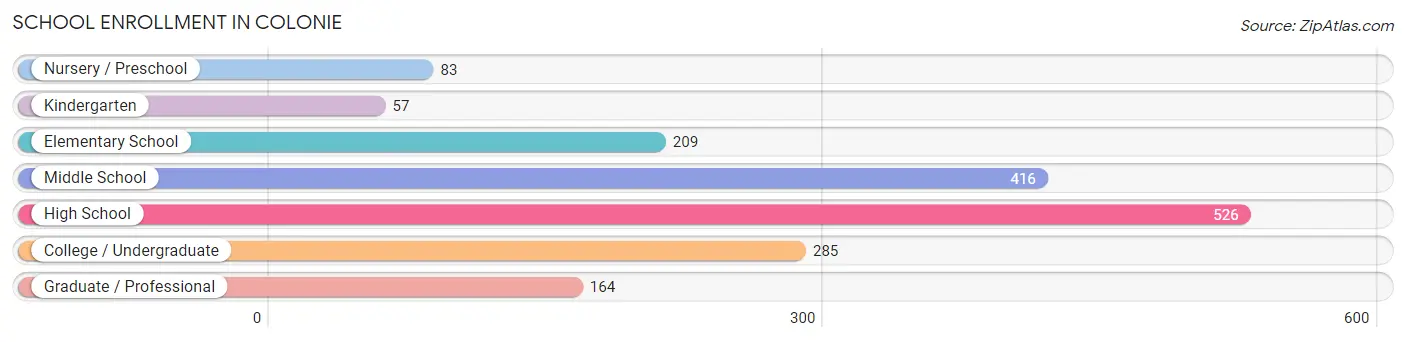
| School Level | # Students | % Students |
| Nursery / Preschool | 83 | 4.8% |
| Kindergarten | 57 | 3.3% |
| Elementary School | 209 | 12.0% |
| Middle School | 416 | 23.9% |
| High School | 526 | 30.2% |
| College / Undergraduate | 285 | 16.4% |
| Graduate / Professional | 164 | 9.4% |
| Total | 1,740 | 100.0% |
School Enrollment by Age by Funding Source in Colonie
Out of a total of 1,740 students who are enrolled in schools in Colonie, 111 (6.4%) attend a private institution, while the remaining 1,629 (93.6%) are enrolled in public schools. The age group of 25 to 34 year olds has the highest likelihood of being enrolled in private schools, with 17 (36.2% in the age bracket) enrolled. Conversely, the age group of 15 to 17 year olds has the lowest likelihood of being enrolled in a private school, with 423 (100.0% in the age bracket) attending a public institution.
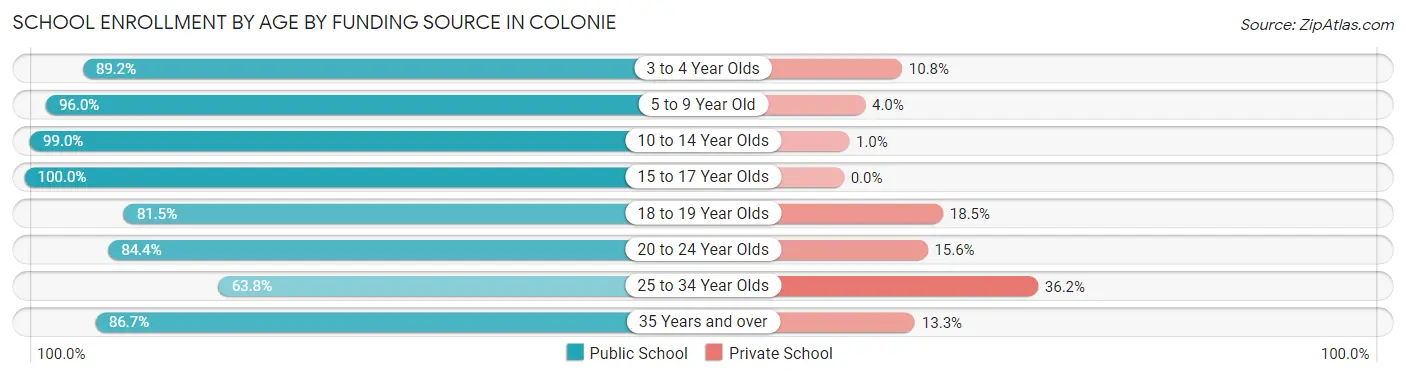
| Age Bracket | Public School | Private School |
| 3 to 4 Year Olds | 74 (89.2%) | 9 (10.8%) |
| 5 to 9 Year Old | 241 (96.0%) | 10 (4.0%) |
| 10 to 14 Year Olds | 493 (99.0%) | 5 (1.0%) |
| 15 to 17 Year Olds | 423 (100.0%) | 0 (0.0%) |
| 18 to 19 Year Olds | 150 (81.5%) | 34 (18.5%) |
| 20 to 24 Year Olds | 119 (84.4%) | 22 (15.6%) |
| 25 to 34 Year Olds | 30 (63.8%) | 17 (36.2%) |
| 35 Years and over | 98 (86.7%) | 15 (13.3%) |
| Total | 1,629 (93.6%) | 111 (6.4%) |
Educational Attainment by Field of Study in Colonie
Social sciences (285 | 13.8%), business (269 | 13.0%), computers & mathematics (221 | 10.7%), science & technology (214 | 10.3%), and education (182 | 8.8%) are the most common fields of study among 2,072 individuals in Colonie who have obtained a bachelor's degree or higher.
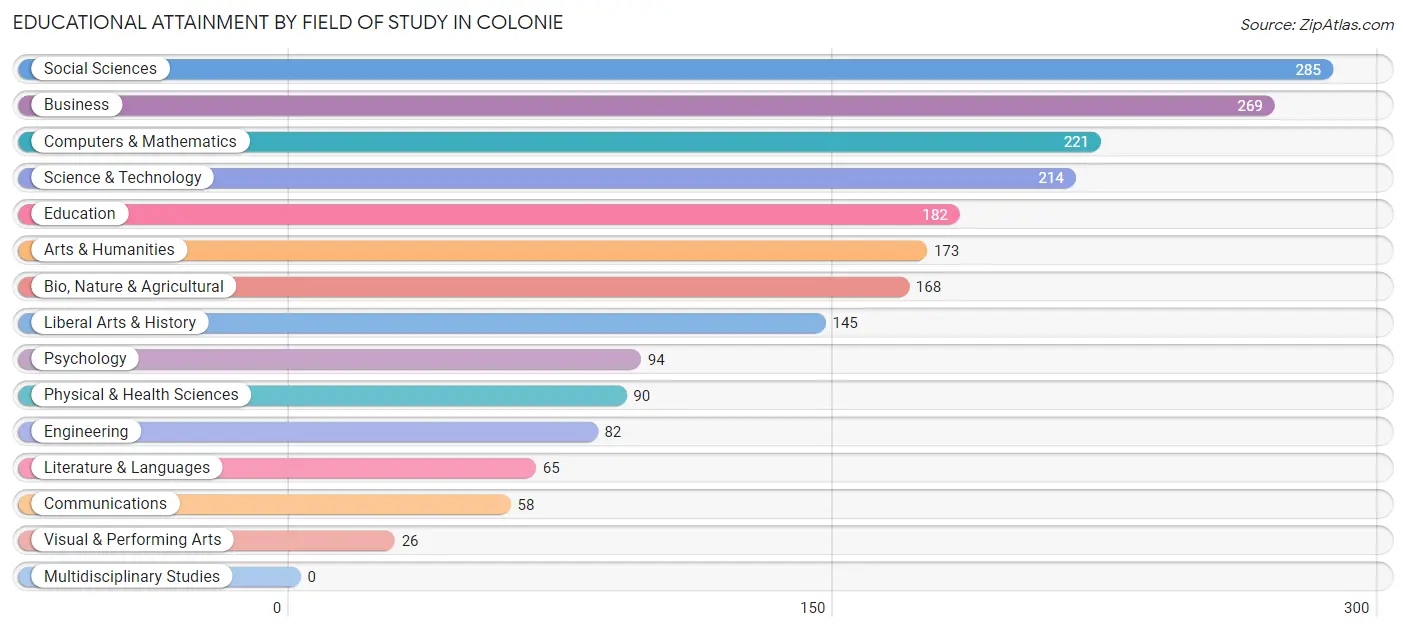
| Field of Study | # Graduates | % Graduates |
| Computers & Mathematics | 221 | 10.7% |
| Bio, Nature & Agricultural | 168 | 8.1% |
| Physical & Health Sciences | 90 | 4.3% |
| Psychology | 94 | 4.5% |
| Social Sciences | 285 | 13.8% |
| Engineering | 82 | 4.0% |
| Multidisciplinary Studies | 0 | 0.0% |
| Science & Technology | 214 | 10.3% |
| Business | 269 | 13.0% |
| Education | 182 | 8.8% |
| Literature & Languages | 65 | 3.1% |
| Liberal Arts & History | 145 | 7.0% |
| Visual & Performing Arts | 26 | 1.3% |
| Communications | 58 | 2.8% |
| Arts & Humanities | 173 | 8.4% |
| Total | 2,072 | 100.0% |
Transportation & Commute in Colonie
Vehicle Availability by Sex in Colonie
The most prevalent vehicle ownership categories in Colonie are males with 2 vehicles (678, accounting for 32.6%) and females with 2 vehicles (672, making up 40.5%).
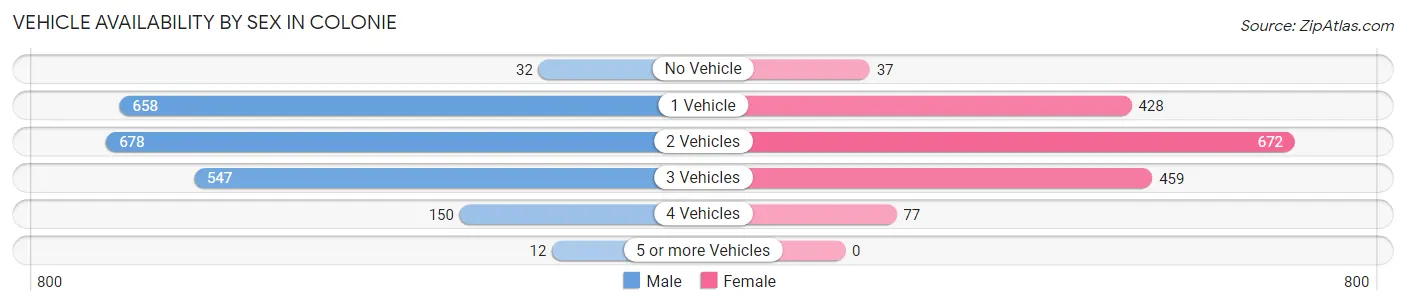
| Vehicles Available | Male | Female |
| No Vehicle | 32 (1.5%) | 37 (2.2%) |
| 1 Vehicle | 658 (31.7%) | 428 (25.6%) |
| 2 Vehicles | 678 (32.6%) | 672 (40.2%) |
| 3 Vehicles | 547 (26.3%) | 459 (27.4%) |
| 4 Vehicles | 150 (7.2%) | 77 (4.6%) |
| 5 or more Vehicles | 12 (0.6%) | 0 (0.0%) |
| Total | 2,077 (100.0%) | 1,673 (100.0%) |
Commute Time in Colonie
The most frequently occuring commute durations in Colonie are 20 to 24 minutes (752 commuters, 22.9%), 10 to 14 minutes (650 commuters, 19.8%), and 15 to 19 minutes (492 commuters, 14.9%).
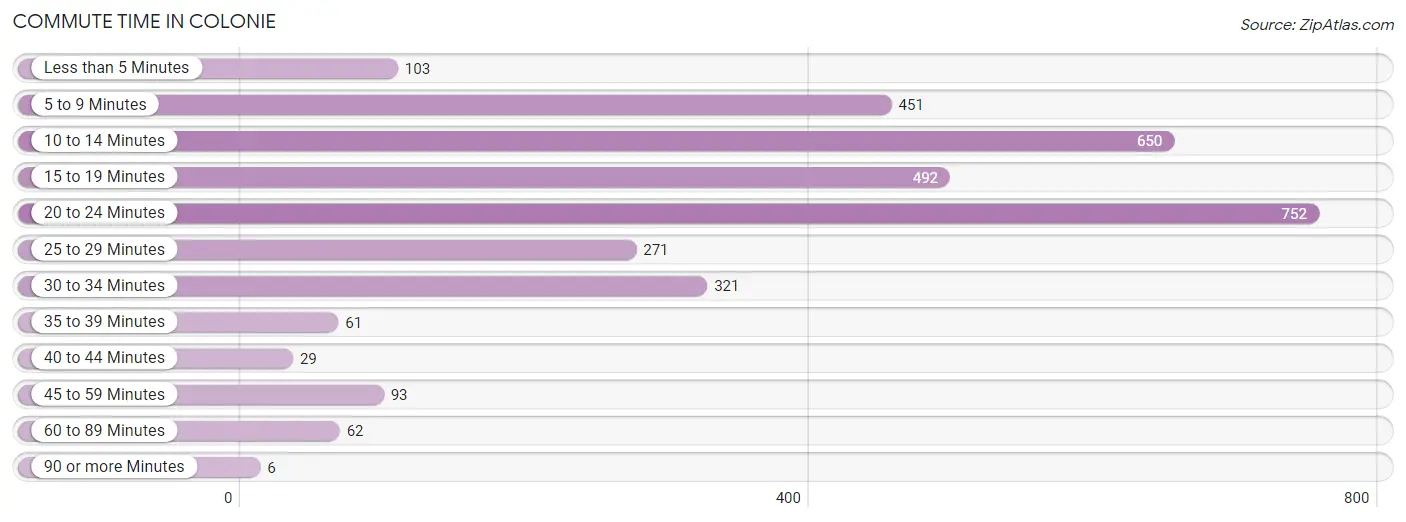
| Commute Time | # Commuters | % Commuters |
| Less than 5 Minutes | 103 | 3.1% |
| 5 to 9 Minutes | 451 | 13.7% |
| 10 to 14 Minutes | 650 | 19.8% |
| 15 to 19 Minutes | 492 | 14.9% |
| 20 to 24 Minutes | 752 | 22.9% |
| 25 to 29 Minutes | 271 | 8.2% |
| 30 to 34 Minutes | 321 | 9.8% |
| 35 to 39 Minutes | 61 | 1.8% |
| 40 to 44 Minutes | 29 | 0.9% |
| 45 to 59 Minutes | 93 | 2.8% |
| 60 to 89 Minutes | 62 | 1.9% |
| 90 or more Minutes | 6 | 0.2% |
Commute Time by Sex in Colonie
The most common commute times in Colonie are 10 to 14 minutes (355 commuters, 19.3%) for males and 20 to 24 minutes (421 commuters, 29.0%) for females.
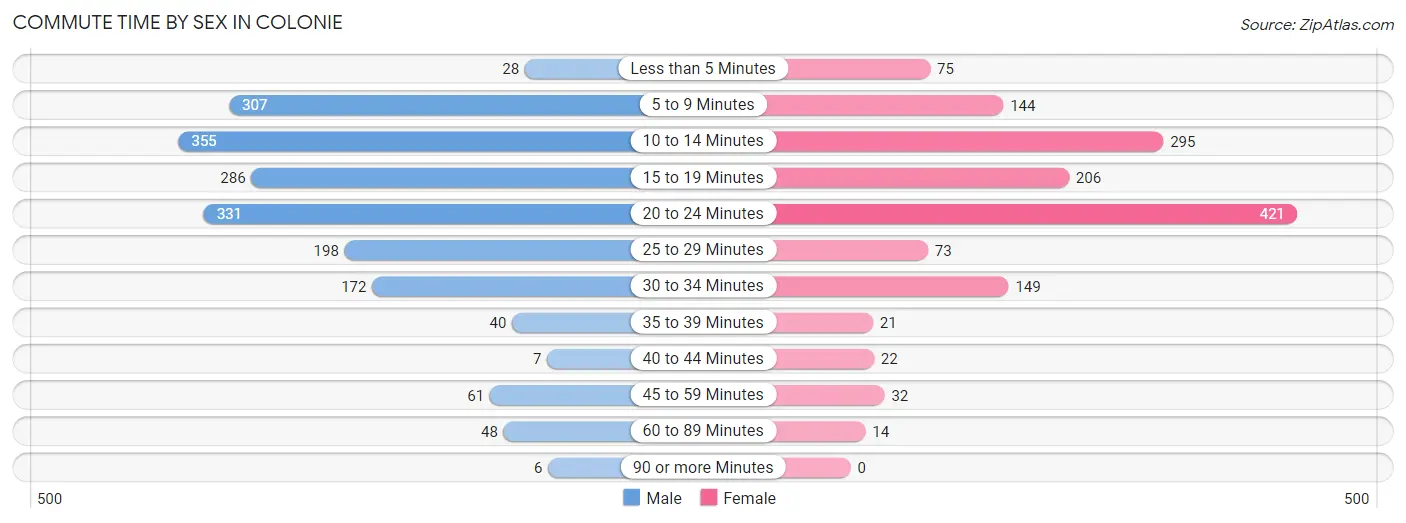
| Commute Time | Male | Female |
| Less than 5 Minutes | 28 (1.5%) | 75 (5.2%) |
| 5 to 9 Minutes | 307 (16.7%) | 144 (9.9%) |
| 10 to 14 Minutes | 355 (19.3%) | 295 (20.3%) |
| 15 to 19 Minutes | 286 (15.5%) | 206 (14.2%) |
| 20 to 24 Minutes | 331 (18.0%) | 421 (29.0%) |
| 25 to 29 Minutes | 198 (10.8%) | 73 (5.0%) |
| 30 to 34 Minutes | 172 (9.3%) | 149 (10.3%) |
| 35 to 39 Minutes | 40 (2.2%) | 21 (1.5%) |
| 40 to 44 Minutes | 7 (0.4%) | 22 (1.5%) |
| 45 to 59 Minutes | 61 (3.3%) | 32 (2.2%) |
| 60 to 89 Minutes | 48 (2.6%) | 14 (1.0%) |
| 90 or more Minutes | 6 (0.3%) | 0 (0.0%) |
Time of Departure to Work by Sex in Colonie
The most frequent times of departure to work in Colonie are 7:00 AM to 7:29 AM (283, 15.4%) for males and 7:30 AM to 7:59 AM (312, 21.5%) for females.
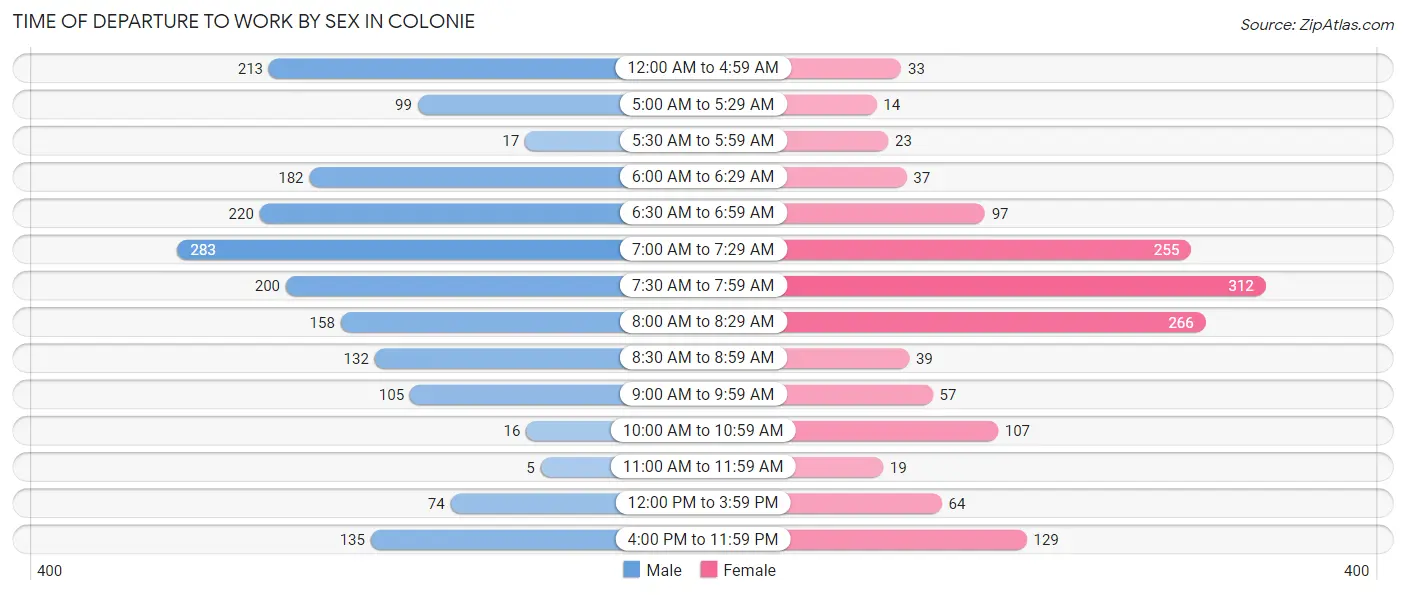
| Time of Departure | Male | Female |
| 12:00 AM to 4:59 AM | 213 (11.6%) | 33 (2.3%) |
| 5:00 AM to 5:29 AM | 99 (5.4%) | 14 (1.0%) |
| 5:30 AM to 5:59 AM | 17 (0.9%) | 23 (1.6%) |
| 6:00 AM to 6:29 AM | 182 (9.9%) | 37 (2.5%) |
| 6:30 AM to 6:59 AM | 220 (12.0%) | 97 (6.7%) |
| 7:00 AM to 7:29 AM | 283 (15.4%) | 255 (17.6%) |
| 7:30 AM to 7:59 AM | 200 (10.9%) | 312 (21.5%) |
| 8:00 AM to 8:29 AM | 158 (8.6%) | 266 (18.3%) |
| 8:30 AM to 8:59 AM | 132 (7.2%) | 39 (2.7%) |
| 9:00 AM to 9:59 AM | 105 (5.7%) | 57 (3.9%) |
| 10:00 AM to 10:59 AM | 16 (0.9%) | 107 (7.4%) |
| 11:00 AM to 11:59 AM | 5 (0.3%) | 19 (1.3%) |
| 12:00 PM to 3:59 PM | 74 (4.0%) | 64 (4.4%) |
| 4:00 PM to 11:59 PM | 135 (7.3%) | 129 (8.9%) |
| Total | 1,839 (100.0%) | 1,452 (100.0%) |
Housing Occupancy in Colonie
Occupancy by Ownership in Colonie
Of the total 3,058 dwellings in Colonie, owner-occupied units account for 2,564 (83.9%), while renter-occupied units make up 494 (16.2%).
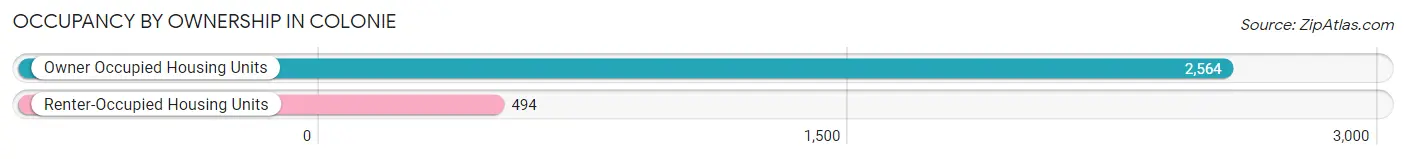
| Occupancy | # Housing Units | % Housing Units |
| Owner Occupied Housing Units | 2,564 | 83.9% |
| Renter-Occupied Housing Units | 494 | 16.2% |
| Total Occupied Housing Units | 3,058 | 100.0% |
Occupancy by Household Size in Colonie
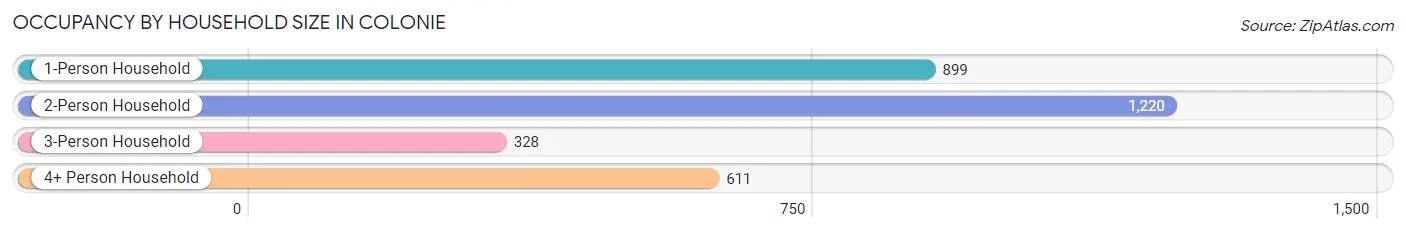
| Household Size | # Housing Units | % Housing Units |
| 1-Person Household | 899 | 29.4% |
| 2-Person Household | 1,220 | 39.9% |
| 3-Person Household | 328 | 10.7% |
| 4+ Person Household | 611 | 20.0% |
| Total Housing Units | 3,058 | 100.0% |
Occupancy by Ownership by Household Size in Colonie
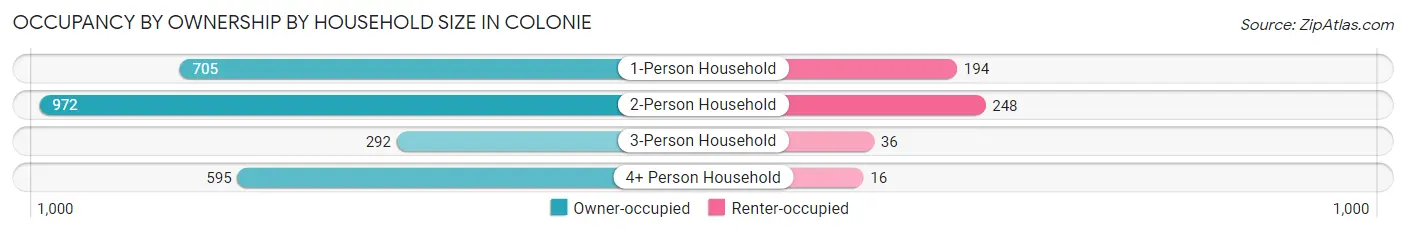
| Household Size | Owner-occupied | Renter-occupied |
| 1-Person Household | 705 (78.4%) | 194 (21.6%) |
| 2-Person Household | 972 (79.7%) | 248 (20.3%) |
| 3-Person Household | 292 (89.0%) | 36 (11.0%) |
| 4+ Person Household | 595 (97.4%) | 16 (2.6%) |
| Total Housing Units | 2,564 (83.9%) | 494 (16.2%) |
Occupancy by Educational Attainment in Colonie
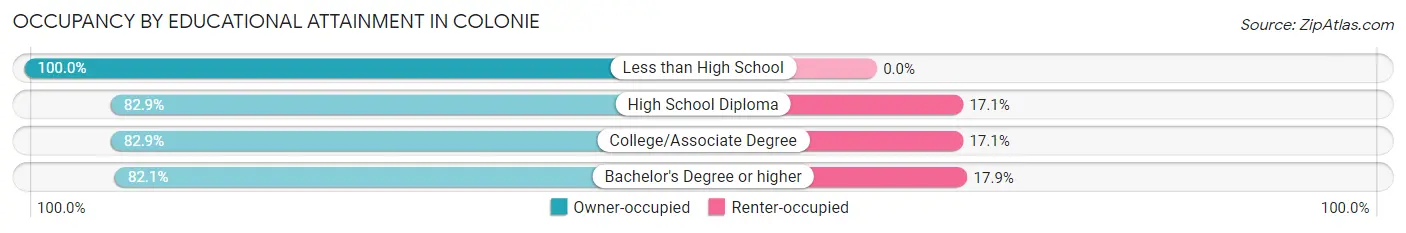
| Household Size | Owner-occupied | Renter-occupied |
| Less than High School | 229 (100.0%) | 0 (0.0%) |
| High School Diploma | 528 (82.9%) | 109 (17.1%) |
| College/Associate Degree | 819 (82.9%) | 169 (17.1%) |
| Bachelor's Degree or higher | 988 (82.1%) | 216 (17.9%) |
Occupancy by Age of Householder in Colonie
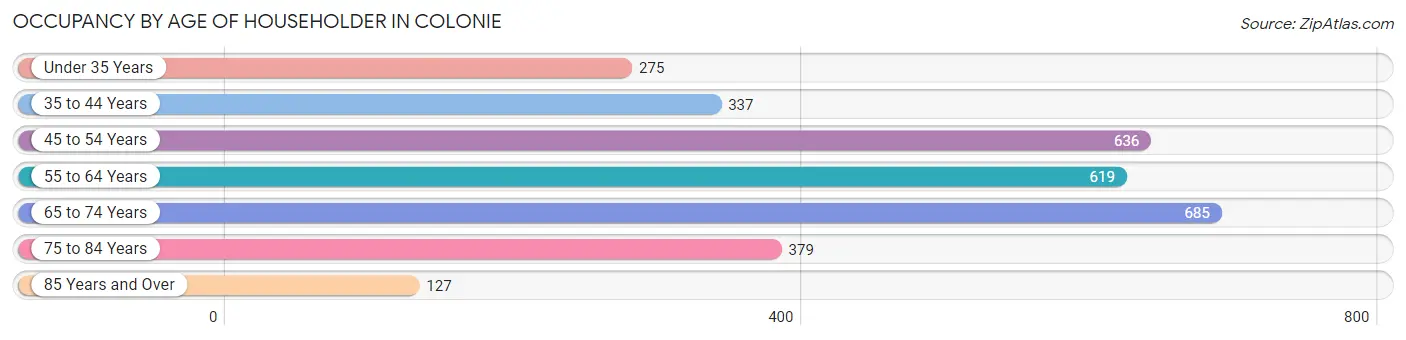
| Age Bracket | # Households | % Households |
| Under 35 Years | 275 | 9.0% |
| 35 to 44 Years | 337 | 11.0% |
| 45 to 54 Years | 636 | 20.8% |
| 55 to 64 Years | 619 | 20.2% |
| 65 to 74 Years | 685 | 22.4% |
| 75 to 84 Years | 379 | 12.4% |
| 85 Years and Over | 127 | 4.2% |
| Total | 3,058 | 100.0% |
Housing Finances in Colonie
Median Income by Occupancy in Colonie
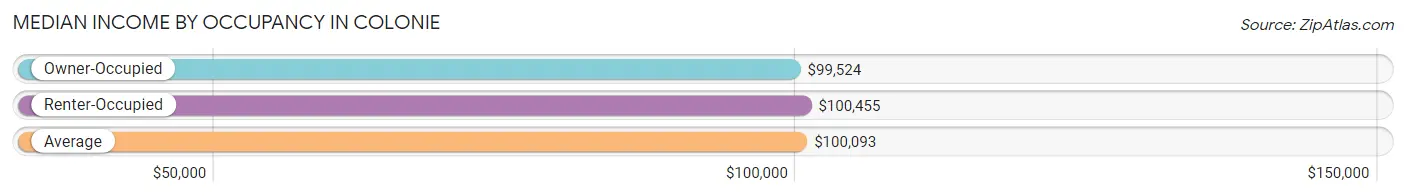
| Occupancy Type | # Households | Median Income |
| Owner-Occupied | 2,564 (83.9%) | $99,524 |
| Renter-Occupied | 494 (16.2%) | $100,455 |
| Average | 3,058 (100.0%) | $100,093 |
Occupancy by Householder Income Bracket in Colonie
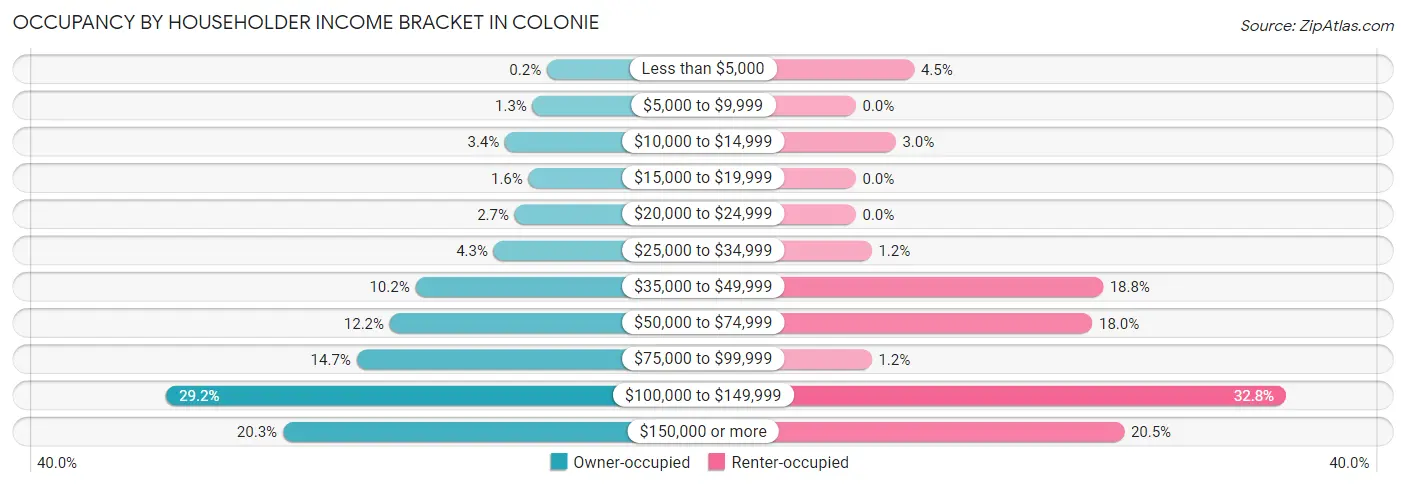
| Income Bracket | Owner-occupied | Renter-occupied |
| Less than $5,000 | 5 (0.2%) | 22 (4.4%) |
| $5,000 to $9,999 | 33 (1.3%) | 0 (0.0%) |
| $10,000 to $14,999 | 87 (3.4%) | 15 (3.0%) |
| $15,000 to $19,999 | 41 (1.6%) | 0 (0.0%) |
| $20,000 to $24,999 | 68 (2.6%) | 0 (0.0%) |
| $25,000 to $34,999 | 109 (4.3%) | 6 (1.2%) |
| $35,000 to $49,999 | 262 (10.2%) | 93 (18.8%) |
| $50,000 to $74,999 | 312 (12.2%) | 89 (18.0%) |
| $75,000 to $99,999 | 377 (14.7%) | 6 (1.2%) |
| $100,000 to $149,999 | 749 (29.2%) | 162 (32.8%) |
| $150,000 or more | 521 (20.3%) | 101 (20.4%) |
| Total | 2,564 (100.0%) | 494 (100.0%) |
Monthly Housing Cost Tiers in Colonie
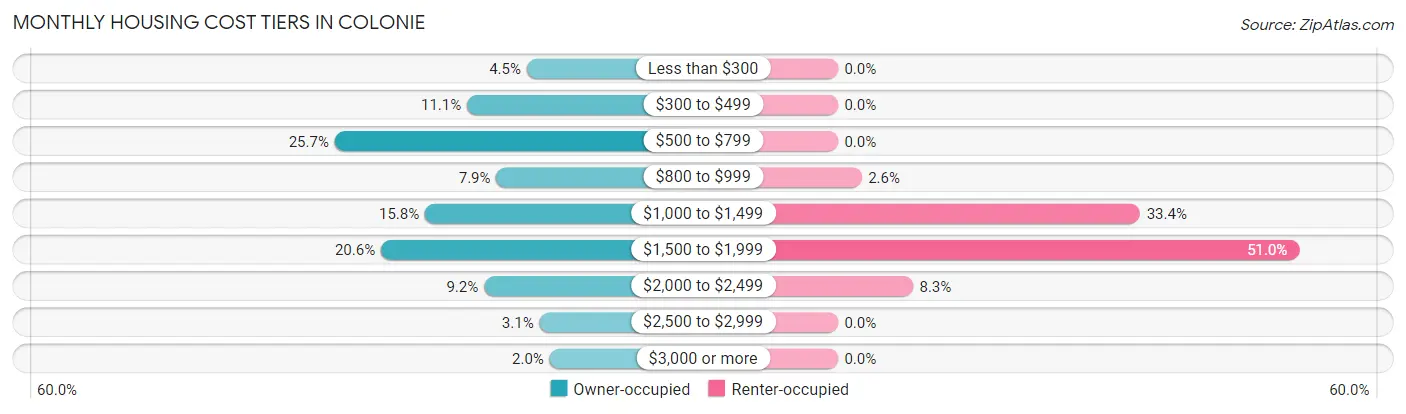
| Monthly Cost | Owner-occupied | Renter-occupied |
| Less than $300 | 116 (4.5%) | 0 (0.0%) |
| $300 to $499 | 285 (11.1%) | 0 (0.0%) |
| $500 to $799 | 660 (25.7%) | 0 (0.0%) |
| $800 to $999 | 202 (7.9%) | 13 (2.6%) |
| $1,000 to $1,499 | 404 (15.8%) | 165 (33.4%) |
| $1,500 to $1,999 | 529 (20.6%) | 252 (51.0%) |
| $2,000 to $2,499 | 237 (9.2%) | 41 (8.3%) |
| $2,500 to $2,999 | 80 (3.1%) | 0 (0.0%) |
| $3,000 or more | 51 (2.0%) | 0 (0.0%) |
| Total | 2,564 (100.0%) | 494 (100.0%) |
Physical Housing Characteristics in Colonie
Housing Structures in Colonie
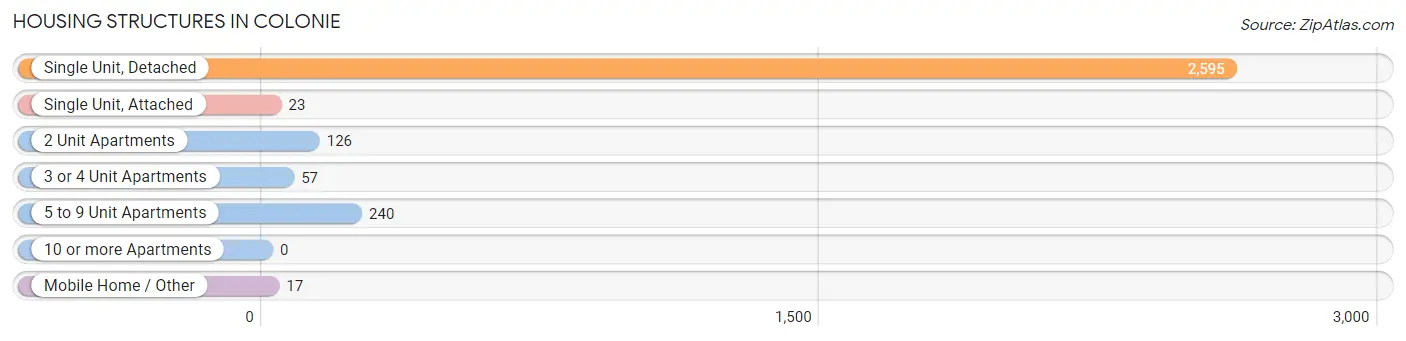
| Structure Type | # Housing Units | % Housing Units |
| Single Unit, Detached | 2,595 | 84.9% |
| Single Unit, Attached | 23 | 0.7% |
| 2 Unit Apartments | 126 | 4.1% |
| 3 or 4 Unit Apartments | 57 | 1.9% |
| 5 to 9 Unit Apartments | 240 | 7.9% |
| 10 or more Apartments | 0 | 0.0% |
| Mobile Home / Other | 17 | 0.6% |
| Total | 3,058 | 100.0% |
Housing Structures by Occupancy in Colonie
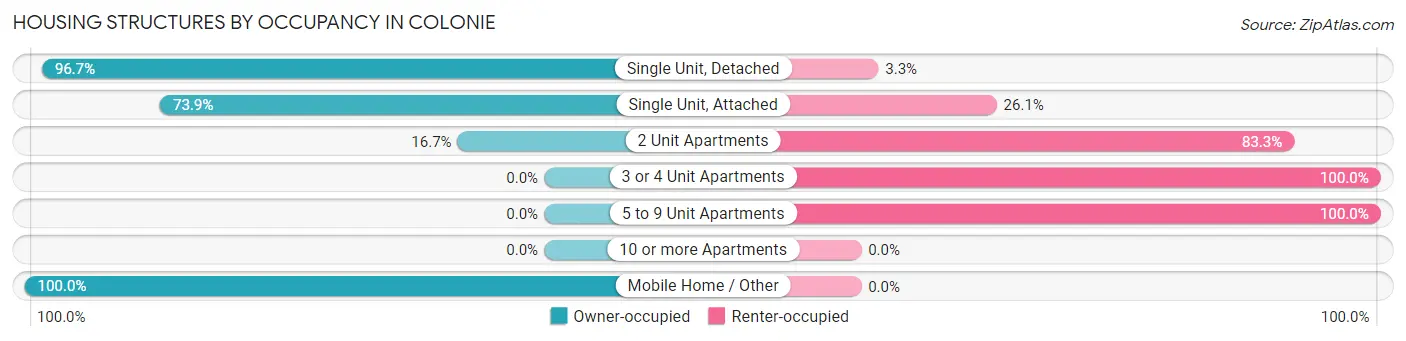
| Structure Type | Owner-occupied | Renter-occupied |
| Single Unit, Detached | 2,509 (96.7%) | 86 (3.3%) |
| Single Unit, Attached | 17 (73.9%) | 6 (26.1%) |
| 2 Unit Apartments | 21 (16.7%) | 105 (83.3%) |
| 3 or 4 Unit Apartments | 0 (0.0%) | 57 (100.0%) |
| 5 to 9 Unit Apartments | 0 (0.0%) | 240 (100.0%) |
| 10 or more Apartments | 0 (0.0%) | 0 (0.0%) |
| Mobile Home / Other | 17 (100.0%) | 0 (0.0%) |
| Total | 2,564 (83.9%) | 494 (16.2%) |
Housing Structures by Number of Rooms in Colonie
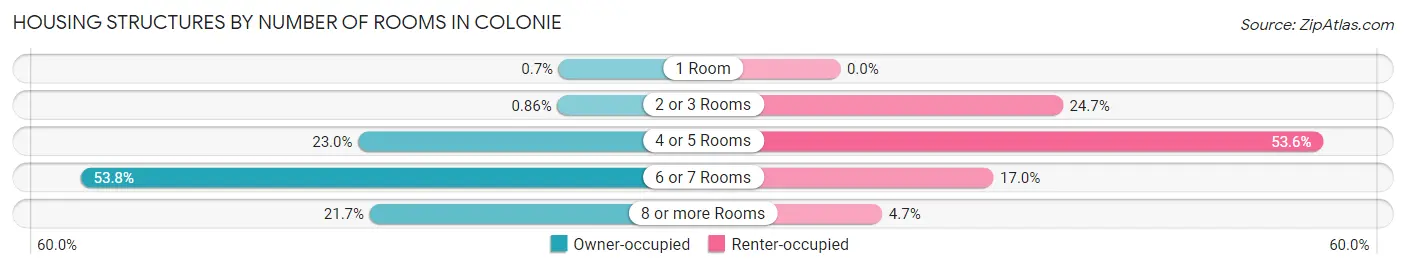
| Number of Rooms | Owner-occupied | Renter-occupied |
| 1 Room | 18 (0.7%) | 0 (0.0%) |
| 2 or 3 Rooms | 22 (0.9%) | 122 (24.7%) |
| 4 or 5 Rooms | 589 (23.0%) | 265 (53.6%) |
| 6 or 7 Rooms | 1,379 (53.8%) | 84 (17.0%) |
| 8 or more Rooms | 556 (21.7%) | 23 (4.7%) |
| Total | 2,564 (100.0%) | 494 (100.0%) |
Housing Structure by Heating Type in Colonie
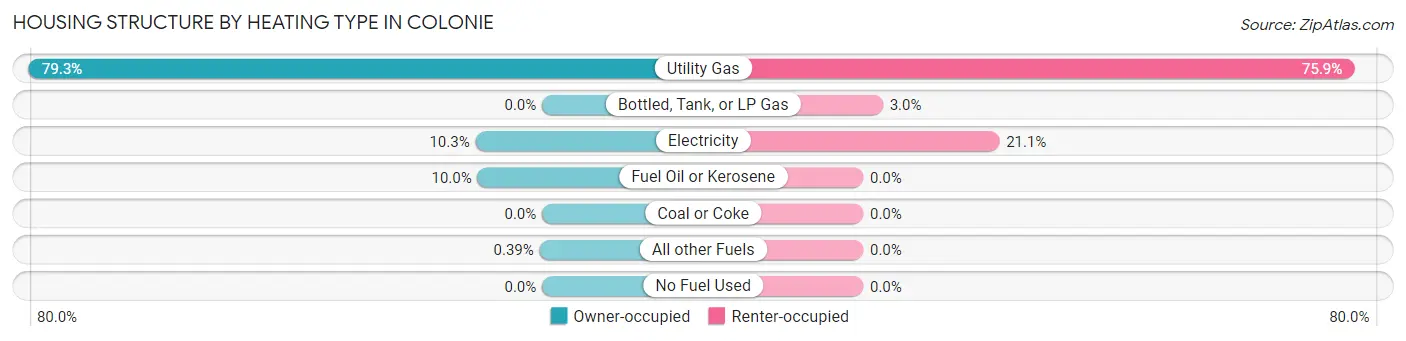
| Heating Type | Owner-occupied | Renter-occupied |
| Utility Gas | 2,034 (79.3%) | 375 (75.9%) |
| Bottled, Tank, or LP Gas | 0 (0.0%) | 15 (3.0%) |
| Electricity | 264 (10.3%) | 104 (21.0%) |
| Fuel Oil or Kerosene | 256 (10.0%) | 0 (0.0%) |
| Coal or Coke | 0 (0.0%) | 0 (0.0%) |
| All other Fuels | 10 (0.4%) | 0 (0.0%) |
| No Fuel Used | 0 (0.0%) | 0 (0.0%) |
| Total | 2,564 (100.0%) | 494 (100.0%) |
Household Vehicle Usage in Colonie
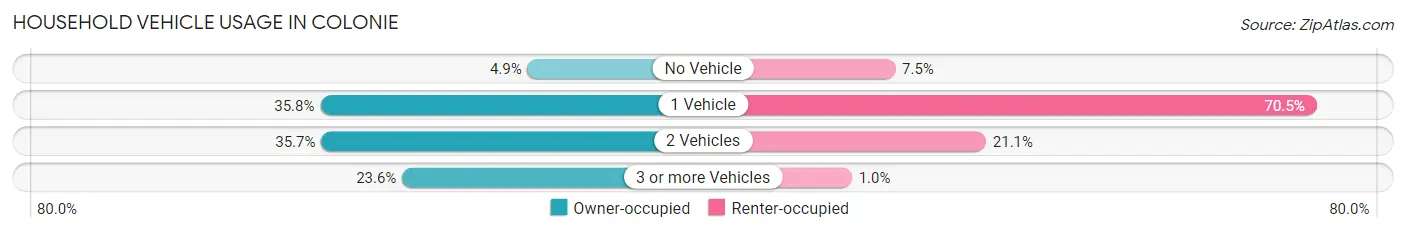
| Vehicles per Household | Owner-occupied | Renter-occupied |
| No Vehicle | 125 (4.9%) | 37 (7.5%) |
| 1 Vehicle | 919 (35.8%) | 348 (70.5%) |
| 2 Vehicles | 915 (35.7%) | 104 (21.0%) |
| 3 or more Vehicles | 605 (23.6%) | 5 (1.0%) |
| Total | 2,564 (100.0%) | 494 (100.0%) |
Real Estate & Mortgages in Colonie
Real Estate and Mortgage Overview in Colonie
| Characteristic | Without Mortgage | With Mortgage |
| Housing Units | 1,236 | 1,328 |
| Median Property Value | $252,400 | $244,400 |
| Median Household Income | $77,222 | $329 |
| Monthly Housing Costs | $568 | $51 |
| Real Estate Taxes | $3,267 | $45 |
Property Value by Mortgage Status in Colonie
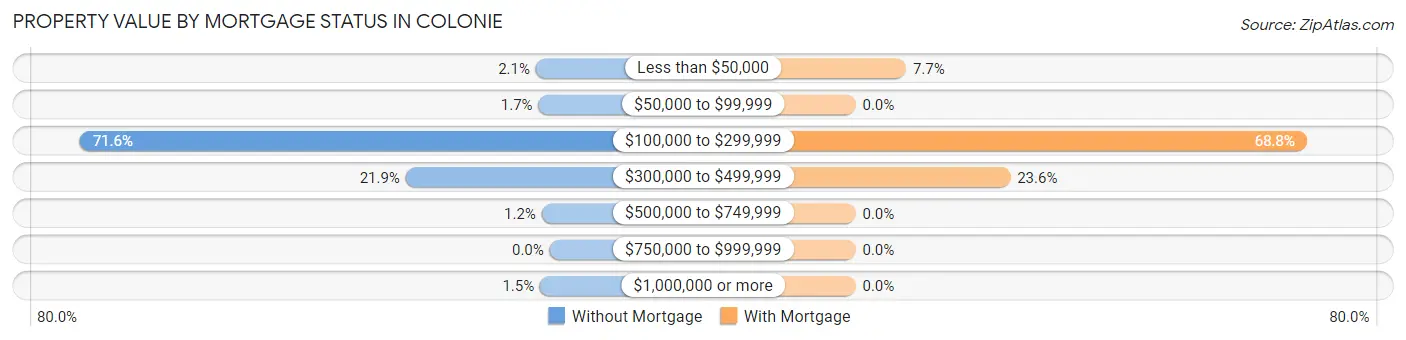
| Property Value | Without Mortgage | With Mortgage |
| Less than $50,000 | 26 (2.1%) | 102 (7.7%) |
| $50,000 to $99,999 | 21 (1.7%) | 0 (0.0%) |
| $100,000 to $299,999 | 885 (71.6%) | 913 (68.8%) |
| $300,000 to $499,999 | 271 (21.9%) | 313 (23.6%) |
| $500,000 to $749,999 | 15 (1.2%) | 0 (0.0%) |
| $750,000 to $999,999 | 0 (0.0%) | 0 (0.0%) |
| $1,000,000 or more | 18 (1.5%) | 0 (0.0%) |
| Total | 1,236 (100.0%) | 1,328 (100.0%) |
Household Income by Mortgage Status in Colonie
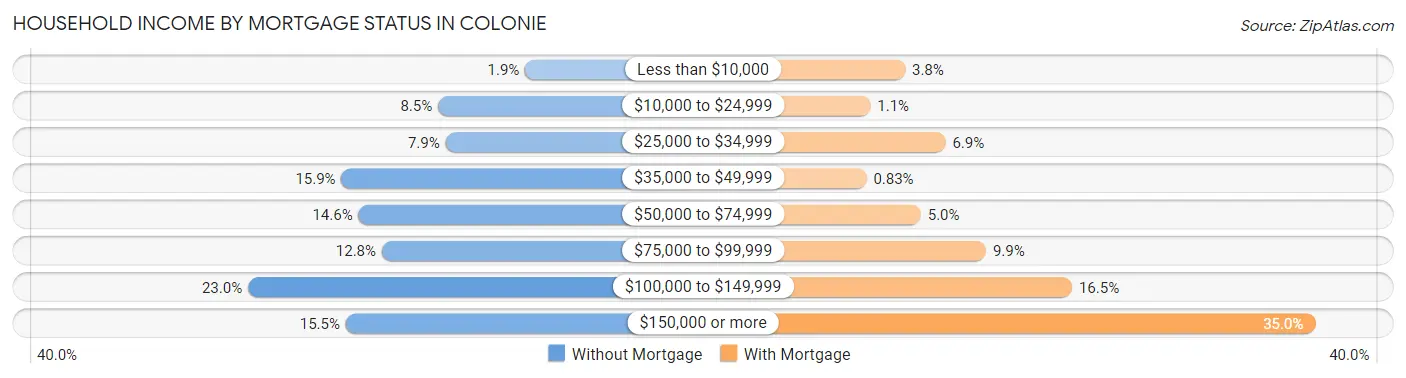
| Household Income | Without Mortgage | With Mortgage |
| Less than $10,000 | 23 (1.9%) | 50 (3.8%) |
| $10,000 to $24,999 | 105 (8.5%) | 15 (1.1%) |
| $25,000 to $34,999 | 98 (7.9%) | 91 (6.9%) |
| $35,000 to $49,999 | 196 (15.9%) | 11 (0.8%) |
| $50,000 to $74,999 | 180 (14.6%) | 66 (5.0%) |
| $75,000 to $99,999 | 158 (12.8%) | 132 (9.9%) |
| $100,000 to $149,999 | 284 (23.0%) | 219 (16.5%) |
| $150,000 or more | 192 (15.5%) | 465 (35.0%) |
| Total | 1,236 (100.0%) | 1,328 (100.0%) |
Property Value to Household Income Ratio in Colonie
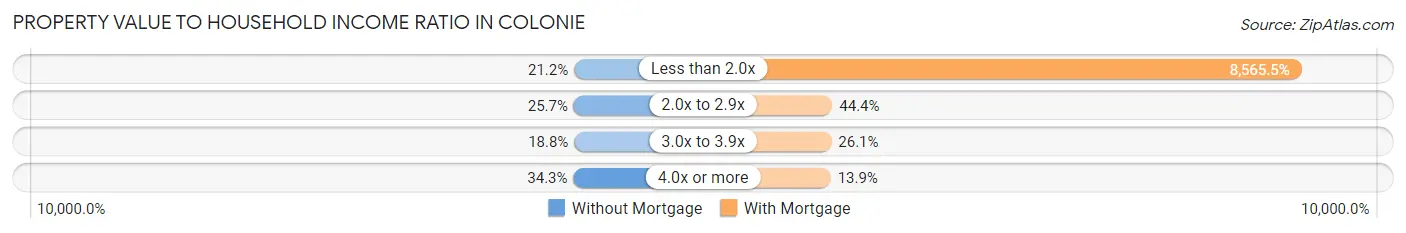
| Value-to-Income Ratio | Without Mortgage | With Mortgage |
| Less than 2.0x | 262 (21.2%) | 113,750 (8,565.5%) |
| 2.0x to 2.9x | 318 (25.7%) | 589 (44.4%) |
| 3.0x to 3.9x | 232 (18.8%) | 347 (26.1%) |
| 4.0x or more | 424 (34.3%) | 185 (13.9%) |
| Total | 1,236 (100.0%) | 1,328 (100.0%) |
Real Estate Taxes by Mortgage Status in Colonie

| Property Taxes | Without Mortgage | With Mortgage |
| Less than $800 | 37 (3.0%) | 5 (0.4%) |
| $800 to $1,499 | 99 (8.0%) | 5 (0.4%) |
| $800 to $1,499 | 1,055 (85.4%) | 129 (9.7%) |
| Total | 1,236 (100.0%) | 1,328 (100.0%) |
Health & Disability in Colonie
Health Insurance Coverage by Age in Colonie
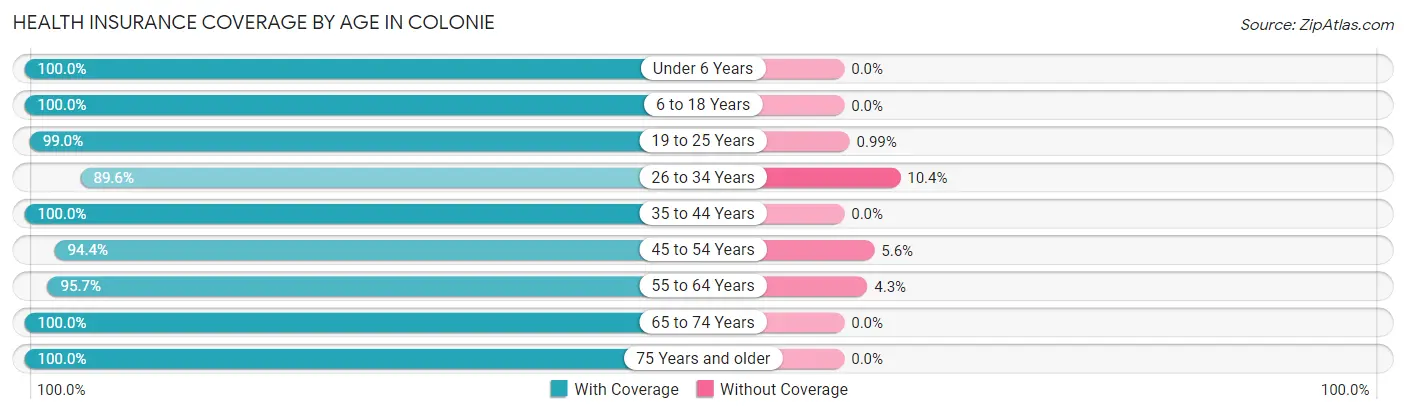
| Age Bracket | With Coverage | Without Coverage |
| Under 6 Years | 364 (100.0%) | 0 (0.0%) |
| 6 to 18 Years | 1,349 (100.0%) | 0 (0.0%) |
| 19 to 25 Years | 500 (99.0%) | 5 (1.0%) |
| 26 to 34 Years | 695 (89.6%) | 81 (10.4%) |
| 35 to 44 Years | 888 (100.0%) | 0 (0.0%) |
| 45 to 54 Years | 1,060 (94.4%) | 63 (5.6%) |
| 55 to 64 Years | 1,002 (95.7%) | 45 (4.3%) |
| 65 to 74 Years | 949 (100.0%) | 0 (0.0%) |
| 75 Years and older | 763 (100.0%) | 0 (0.0%) |
| Total | 7,570 (97.5%) | 194 (2.5%) |
Health Insurance Coverage by Citizenship Status in Colonie
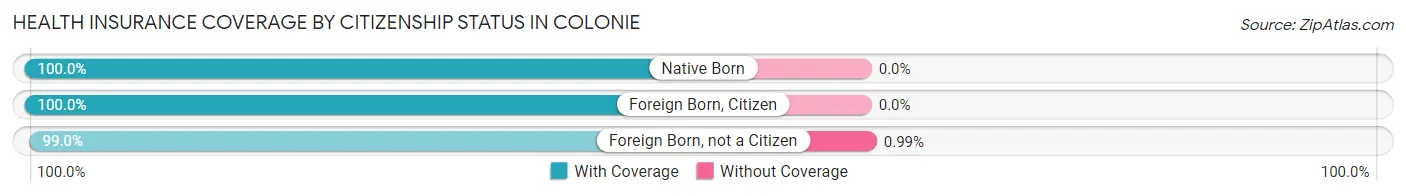
| Citizenship Status | With Coverage | Without Coverage |
| Native Born | 364 (100.0%) | 0 (0.0%) |
| Foreign Born, Citizen | 1,349 (100.0%) | 0 (0.0%) |
| Foreign Born, not a Citizen | 500 (99.0%) | 5 (1.0%) |
Health Insurance Coverage by Household Income in Colonie
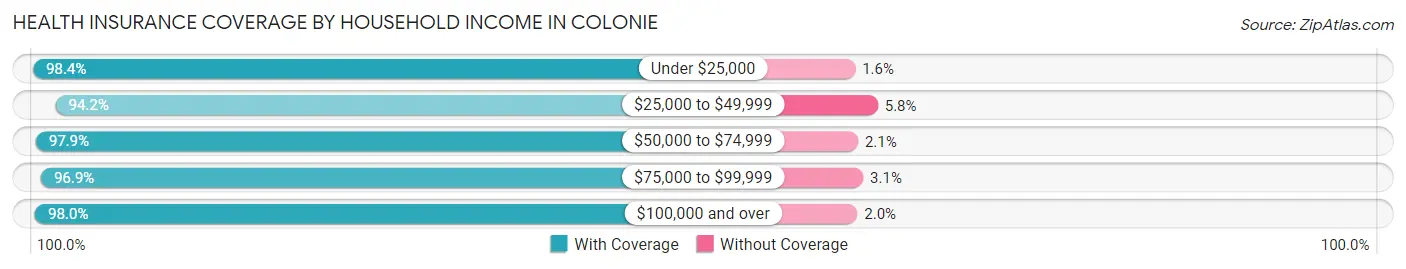
| Household Income | With Coverage | Without Coverage |
| Under $25,000 | 312 (98.4%) | 5 (1.6%) |
| $25,000 to $49,999 | 729 (94.2%) | 45 (5.8%) |
| $50,000 to $74,999 | 653 (97.9%) | 14 (2.1%) |
| $75,000 to $99,999 | 1,041 (96.9%) | 33 (3.1%) |
| $100,000 and over | 4,821 (98.0%) | 97 (2.0%) |
Public vs Private Health Insurance Coverage by Age in Colonie
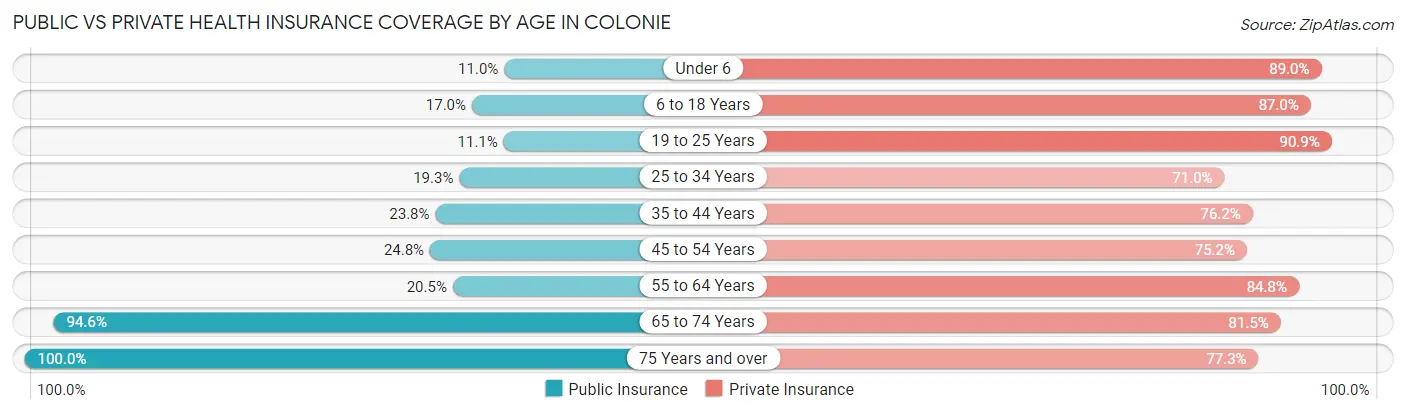
| Age Bracket | Public Insurance | Private Insurance |
| Under 6 | 40 (11.0%) | 324 (89.0%) |
| 6 to 18 Years | 229 (17.0%) | 1,174 (87.0%) |
| 19 to 25 Years | 56 (11.1%) | 459 (90.9%) |
| 25 to 34 Years | 150 (19.3%) | 551 (71.0%) |
| 35 to 44 Years | 211 (23.8%) | 677 (76.2%) |
| 45 to 54 Years | 278 (24.8%) | 844 (75.2%) |
| 55 to 64 Years | 215 (20.5%) | 888 (84.8%) |
| 65 to 74 Years | 898 (94.6%) | 773 (81.5%) |
| 75 Years and over | 763 (100.0%) | 590 (77.3%) |
| Total | 2,840 (36.6%) | 6,280 (80.9%) |
Disability Status by Sex by Age in Colonie
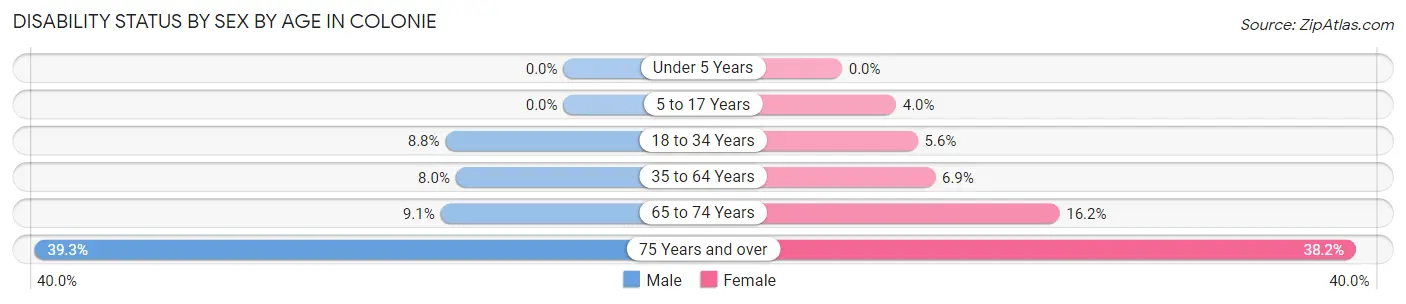
| Age Bracket | Male | Female |
| Under 5 Years | 0 (0.0%) | 0 (0.0%) |
| 5 to 17 Years | 0 (0.0%) | 14 (4.0%) |
| 18 to 34 Years | 80 (8.8%) | 33 (5.6%) |
| 35 to 64 Years | 115 (8.0%) | 112 (6.9%) |
| 65 to 74 Years | 34 (9.1%) | 93 (16.2%) |
| 75 Years and over | 137 (39.3%) | 158 (38.2%) |
Disability Class by Sex by Age in Colonie
Disability Class: Hearing Difficulty
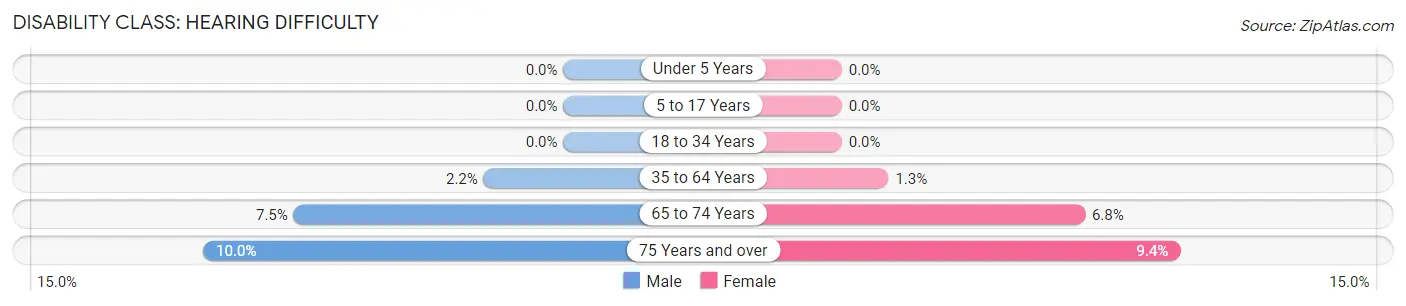
| Age Bracket | Male | Female |
| Under 5 Years | 0 (0.0%) | 0 (0.0%) |
| 5 to 17 Years | 0 (0.0%) | 0 (0.0%) |
| 18 to 34 Years | 0 (0.0%) | 0 (0.0%) |
| 35 to 64 Years | 32 (2.2%) | 21 (1.3%) |
| 65 to 74 Years | 28 (7.5%) | 39 (6.8%) |
| 75 Years and over | 35 (10.0%) | 39 (9.4%) |
Disability Class: Vision Difficulty
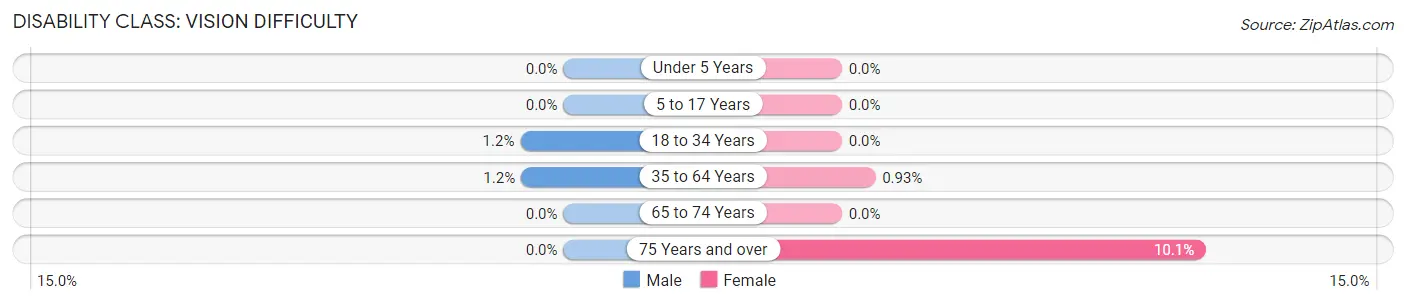
| Age Bracket | Male | Female |
| Under 5 Years | 0 (0.0%) | 0 (0.0%) |
| 5 to 17 Years | 0 (0.0%) | 0 (0.0%) |
| 18 to 34 Years | 11 (1.2%) | 0 (0.0%) |
| 35 to 64 Years | 17 (1.2%) | 15 (0.9%) |
| 65 to 74 Years | 0 (0.0%) | 0 (0.0%) |
| 75 Years and over | 0 (0.0%) | 42 (10.1%) |
Disability Class: Cognitive Difficulty
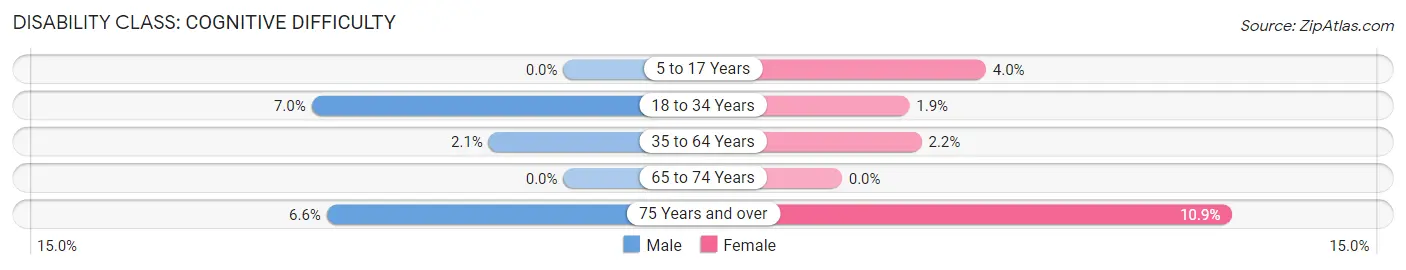
| Age Bracket | Male | Female |
| 5 to 17 Years | 0 (0.0%) | 14 (4.0%) |
| 18 to 34 Years | 64 (7.0%) | 11 (1.9%) |
| 35 to 64 Years | 30 (2.1%) | 36 (2.2%) |
| 65 to 74 Years | 0 (0.0%) | 0 (0.0%) |
| 75 Years and over | 23 (6.6%) | 45 (10.9%) |
Disability Class: Ambulatory Difficulty
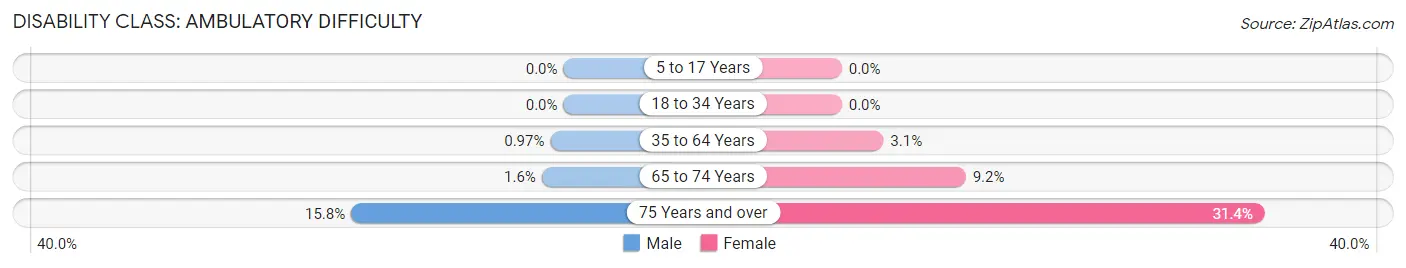
| Age Bracket | Male | Female |
| 5 to 17 Years | 0 (0.0%) | 0 (0.0%) |
| 18 to 34 Years | 0 (0.0%) | 0 (0.0%) |
| 35 to 64 Years | 14 (1.0%) | 50 (3.1%) |
| 65 to 74 Years | 6 (1.6%) | 53 (9.2%) |
| 75 Years and over | 55 (15.8%) | 130 (31.4%) |
Disability Class: Self-Care Difficulty
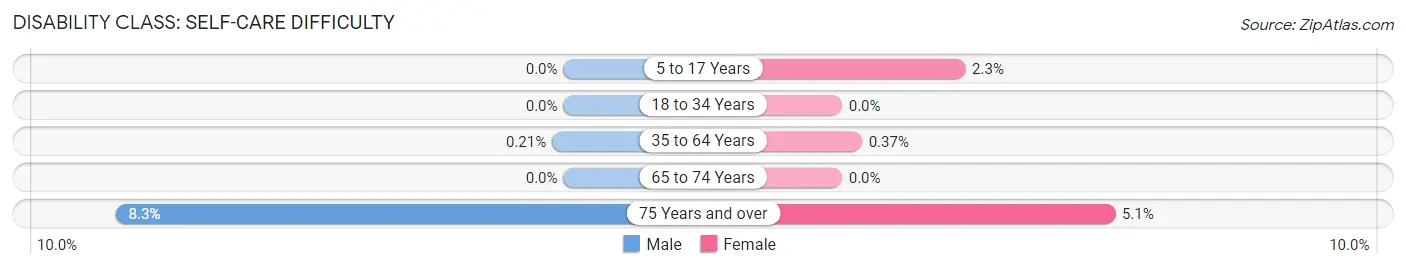
| Age Bracket | Male | Female |
| 5 to 17 Years | 0 (0.0%) | 8 (2.3%) |
| 18 to 34 Years | 0 (0.0%) | 0 (0.0%) |
| 35 to 64 Years | 3 (0.2%) | 6 (0.4%) |
| 65 to 74 Years | 0 (0.0%) | 0 (0.0%) |
| 75 Years and over | 29 (8.3%) | 21 (5.1%) |
Technology Access in Colonie
Computing Device Access in Colonie
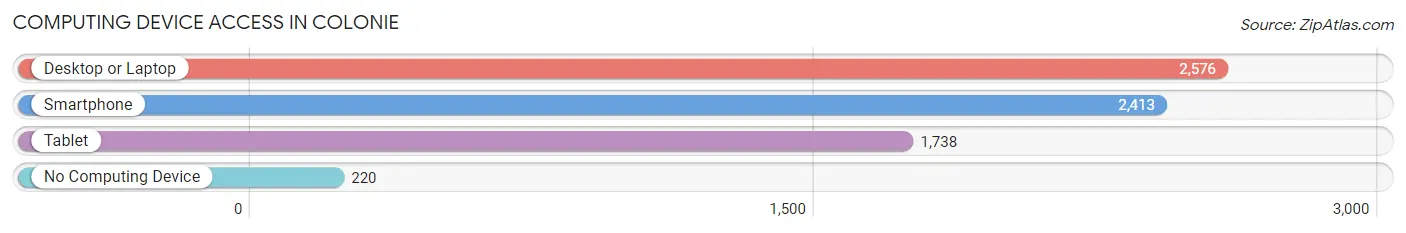
| Device Type | # Households | % Households |
| Desktop or Laptop | 2,576 | 84.2% |
| Smartphone | 2,413 | 78.9% |
| Tablet | 1,738 | 56.8% |
| No Computing Device | 220 | 7.2% |
| Total | 3,058 | 100.0% |
Internet Access in Colonie
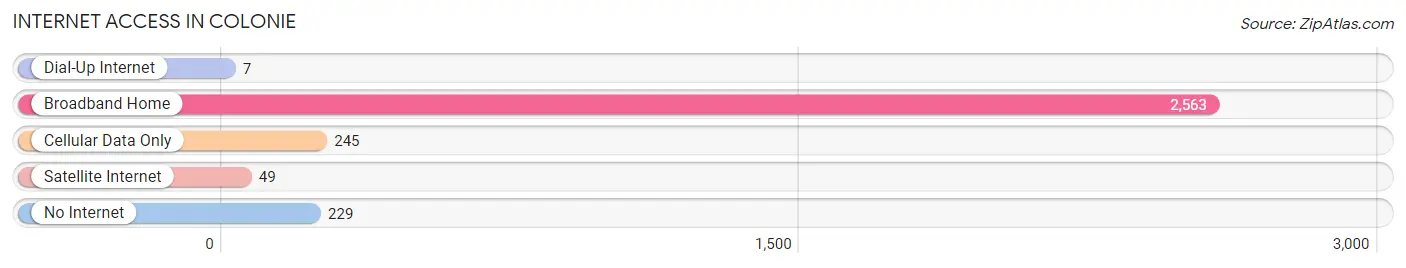
| Internet Type | # Households | % Households |
| Dial-Up Internet | 7 | 0.2% |
| Broadband Home | 2,563 | 83.8% |
| Cellular Data Only | 245 | 8.0% |
| Satellite Internet | 49 | 1.6% |
| No Internet | 229 | 7.5% |
| Total | 3,058 | 100.0% |
Colonie Summary
Colonie is a town located in Albany County, New York, United States. It is the most populous suburb of Albany, the state capital, and the third largest town in the county. The town is located in the central part of the county and is bordered by the towns of Guilderland to the west, Bethlehem to the south, and Watervliet to the east. The town of Colonie is home to over 81,000 people, making it the most populous town in the county.
History
The area that is now Colonie was originally inhabited by the Mohawk and Iroquois Native American tribes. The first European settlers arrived in the area in the late 17th century, and the town was officially established in 1791. The town was named after the Dutch colony of New Netherland, which was located in the area.
In the 19th century, the town of Colonie was a major agricultural center, with many farms and orchards. The town was also home to several mills and factories, which provided employment for many of the town's residents.
In the 20th century, the town of Colonie began to experience rapid growth as the Albany metropolitan area expanded. The town was incorporated in 1895, and by the 1950s, the population had grown to over 20,000. The town continued to grow throughout the latter half of the 20th century, and by the 2000 census, the population had grown to over 81,000.
Geography
Colonie is located in the central part of Albany County, New York. It is bordered by the towns of Guilderland to the west, Bethlehem to the south, and Watervliet to the east. The town is located approximately 10 miles north of Albany, the state capital.
The town of Colonie is located in the Mohawk Valley region of New York. The town is located on the banks of the Mohawk River, and is home to several small lakes and ponds. The town is also home to several parks and nature preserves, including the Albany Pine Bush Preserve and the Colonie Town Park.
Economy
The town of Colonie is home to a diverse economy. The town is home to several large employers, including the State University of New York at Albany, the Albany International Airport, and the Albany County Airport. The town is also home to several large retail stores, including Walmart, Target, and Best Buy.
The town of Colonie is also home to several large manufacturing companies, including General Electric, IBM, and GlobalFoundries. The town is also home to several technology companies, including CDM Smith, CDPHP, and Albany Molecular Research.
Demographics
As of the 2010 census, the town of Colonie had a population of 81,591. The racial makeup of the town was 87.3% White, 5.7% African American, 0.3% Native American, 3.2% Asian, 0.1% Pacific Islander, and 2.4% from other races. Hispanic or Latino of any race were 6.7% of the population.
The median household income in the town was $63,945, and the median family income was $76,945. The per capita income in the town was $30,945. About 5.2% of families and 7.3% of the population were below the poverty line, including 8.3% of those under age 18 and 5.2% of those age 65 or over.
Common Questions
What is Per Capita Income in Colonie?
Per Capita income in Colonie is $44,549.
What is the Median Family Income in Colonie?
Median Family Income in Colonie is $113,995.
What is the Median Household income in Colonie?
Median Household Income in Colonie is $100,093.
What is Income or Wage Gap in Colonie?
Income or Wage Gap in Colonie is 1.3%.
Women in Colonie earn 98.7 cents for every dollar earned by a man.
What is Inequality or Gini Index in Colonie?
Inequality or Gini Index in Colonie is 0.38.
What is the Total Population of Colonie?
Total Population of Colonie is 7,767.
What is the Total Male Population of Colonie?
Total Male Population of Colonie is 4,087.
What is the Total Female Population of Colonie?
Total Female Population of Colonie is 3,680.
What is the Ratio of Males per 100 Females in Colonie?
There are 111.06 Males per 100 Females in Colonie.
What is the Ratio of Females per 100 Males in Colonie?
There are 90.04 Females per 100 Males in Colonie.
What is the Median Population Age in Colonie?
Median Population Age in Colonie is 45.0 Years.
What is the Average Family Size in Colonie
Average Family Size in Colonie is 3.2 People.
What is the Average Household Size in Colonie
Average Household Size in Colonie is 2.5 People.
How Large is the Labor Force in Colonie?
There are 3,869 People in the Labor Forcein in Colonie.
What is the Percentage of People in the Labor Force in Colonie?
58.2% of People are in the Labor Force in Colonie.
What is the Unemployment Rate in Colonie?
Unemployment Rate in Colonie is 2.7%.