Arlington, NY Map & Demographics
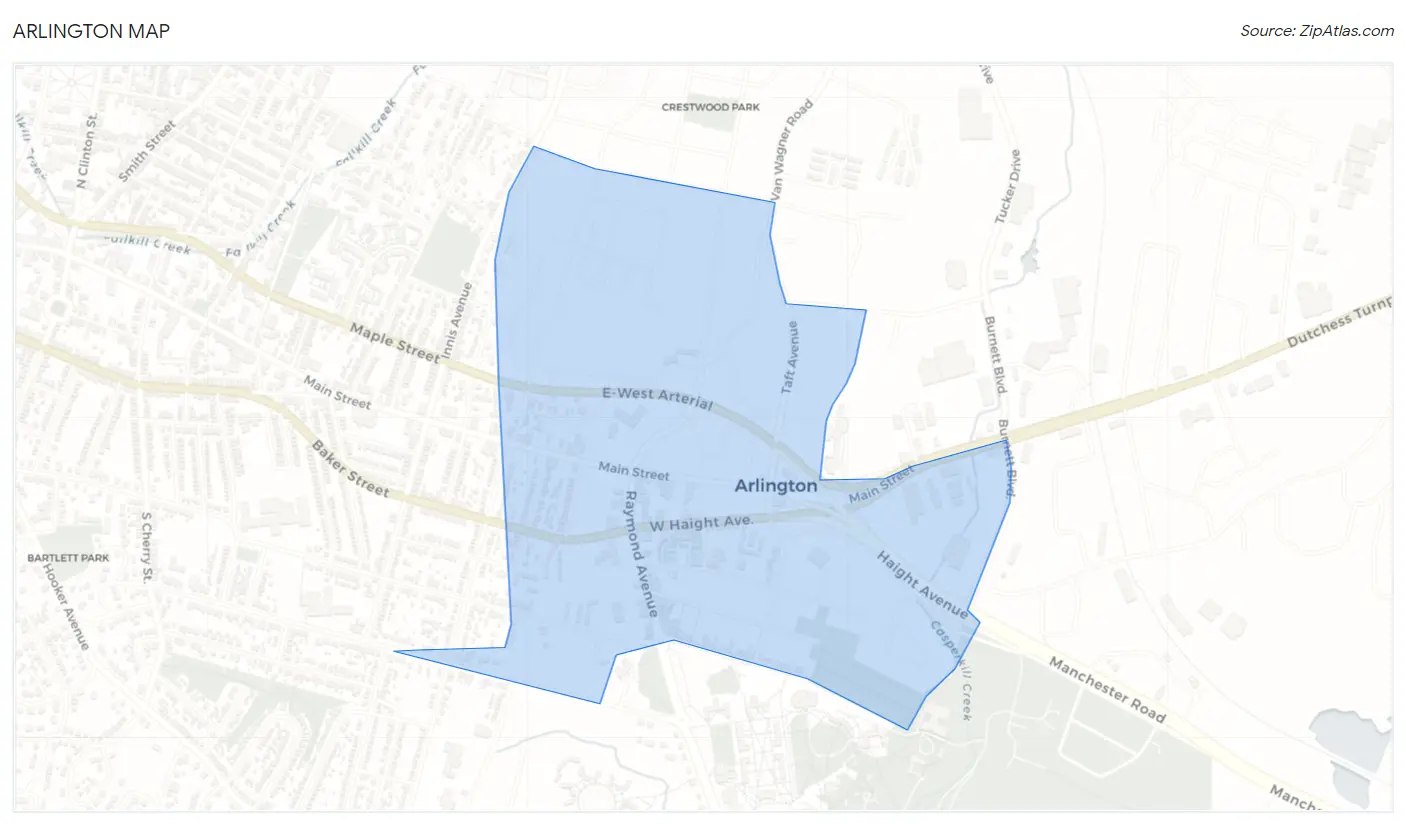
Arlington Map
Arlington Overview
$51,044
PER CAPITA INCOME
$105,121
AVG FAMILY INCOME
$77,097
AVG HOUSEHOLD INCOME
54.5%
WAGE / INCOME GAP [ % ]
45.5¢/ $1
WAGE / INCOME GAP [ $ ]
0.47
INEQUALITY / GINI INDEX
2,405
TOTAL POPULATION
1,288
MALE POPULATION
1,117
FEMALE POPULATION
115.31
MALES / 100 FEMALES
86.72
FEMALES / 100 MALES
41.3
MEDIAN AGE
3.2
AVG FAMILY SIZE
2.4
AVG HOUSEHOLD SIZE
1,455
LABOR FORCE [ PEOPLE ]
71.8%
PERCENT IN LABOR FORCE
7.6%
UNEMPLOYMENT RATE
Income in Arlington
Income Overview in Arlington
Per Capita Income in Arlington is $51,044, while median incomes of families and households are $105,121 and $77,097 respectively.
| Characteristic | Number | Measure |
| Per Capita Income | 2,405 | $51,044 |
| Median Family Income | 566 | $105,121 |
| Mean Family Income | 566 | $143,366 |
| Median Household Income | 1,018 | $77,097 |
| Mean Household Income | 1,018 | $119,183 |
| Income Deficit | 566 | $0 |
| Wage / Income Gap (%) | 2,405 | 54.51% |
| Wage / Income Gap ($) | 2,405 | 45.49¢ per $1 |
| Gini / Inequality Index | 2,405 | 0.47 |
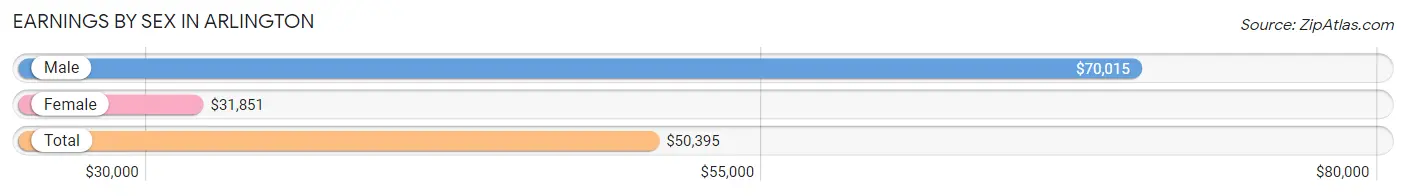
Earnings by Sex in Arlington
Average Earnings in Arlington are $50,395, $70,015 for men and $31,851 for women, a difference of 54.5%.
| Sex | Number | Average Earnings |
| Male | 757 (51.6%) | $70,015 |
| Female | 711 (48.4%) | $31,851 |
| Total | 1,468 (100.0%) | $50,395 |
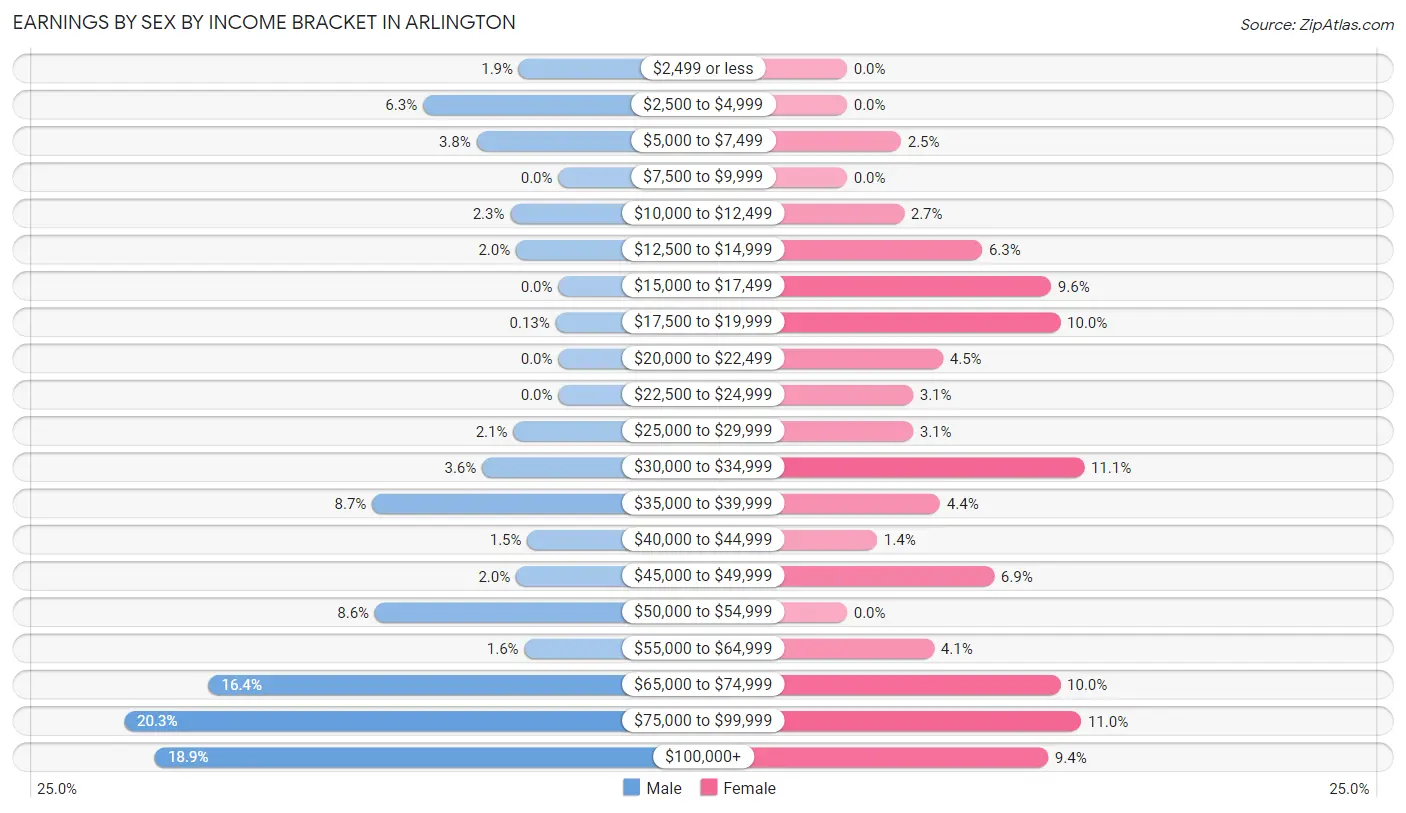
Earnings by Sex by Income Bracket in Arlington
The most common earnings brackets in Arlington are $75,000 to $99,999 for men (154 | 20.3%) and $30,000 to $34,999 for women (79 | 11.1%).
| Income | Male | Female |
| $2,499 or less | 14 (1.8%) | 0 (0.0%) |
| $2,500 to $4,999 | 48 (6.3%) | 0 (0.0%) |
| $5,000 to $7,499 | 29 (3.8%) | 18 (2.5%) |
| $7,500 to $9,999 | 0 (0.0%) | 0 (0.0%) |
| $10,000 to $12,499 | 17 (2.2%) | 19 (2.7%) |
| $12,500 to $14,999 | 15 (2.0%) | 45 (6.3%) |
| $15,000 to $17,499 | 0 (0.0%) | 68 (9.6%) |
| $17,500 to $19,999 | 1 (0.1%) | 71 (10.0%) |
| $20,000 to $22,499 | 0 (0.0%) | 32 (4.5%) |
| $22,500 to $24,999 | 0 (0.0%) | 22 (3.1%) |
| $25,000 to $29,999 | 16 (2.1%) | 22 (3.1%) |
| $30,000 to $34,999 | 27 (3.6%) | 79 (11.1%) |
| $35,000 to $39,999 | 66 (8.7%) | 31 (4.4%) |
| $40,000 to $44,999 | 11 (1.5%) | 10 (1.4%) |
| $45,000 to $49,999 | 15 (2.0%) | 49 (6.9%) |
| $50,000 to $54,999 | 65 (8.6%) | 0 (0.0%) |
| $55,000 to $64,999 | 12 (1.6%) | 29 (4.1%) |
| $65,000 to $74,999 | 124 (16.4%) | 71 (10.0%) |
| $75,000 to $99,999 | 154 (20.3%) | 78 (11.0%) |
| $100,000+ | 143 (18.9%) | 67 (9.4%) |
| Total | 757 (100.0%) | 711 (100.0%) |
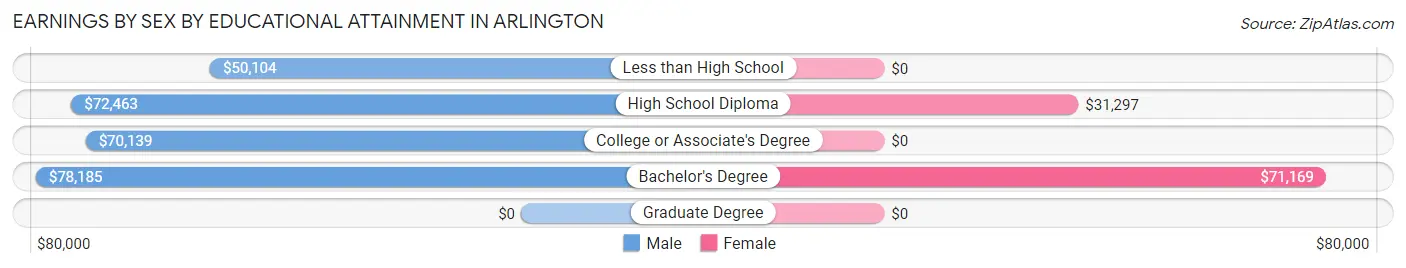
Earnings by Sex by Educational Attainment in Arlington
Average earnings in Arlington are $70,880 for men and $36,169 for women, a difference of 49.0%. Men with an educational attainment of bachelor's degree enjoy the highest average annual earnings of $78,185, while those with less than high school education earn the least with $50,104. Women with an educational attainment of bachelor's degree earn the most with the average annual earnings of $71,169, while those with high school diploma education have the smallest earnings of $31,297.
| Educational Attainment | Male Income | Female Income |
| Less than High School | $50,104 | $0 |
| High School Diploma | $72,463 | $31,297 |
| College or Associate's Degree | $70,139 | $0 |
| Bachelor's Degree | $78,185 | $71,169 |
| Graduate Degree | - | - |
| Total | $70,880 | $36,169 |
Family Income in Arlington
Family Income Brackets in Arlington
According to the Arlington family income data, there are 141 families falling into the $150,000 to $199,999 income range, which is the most common income bracket and makes up 24.9% of all families.
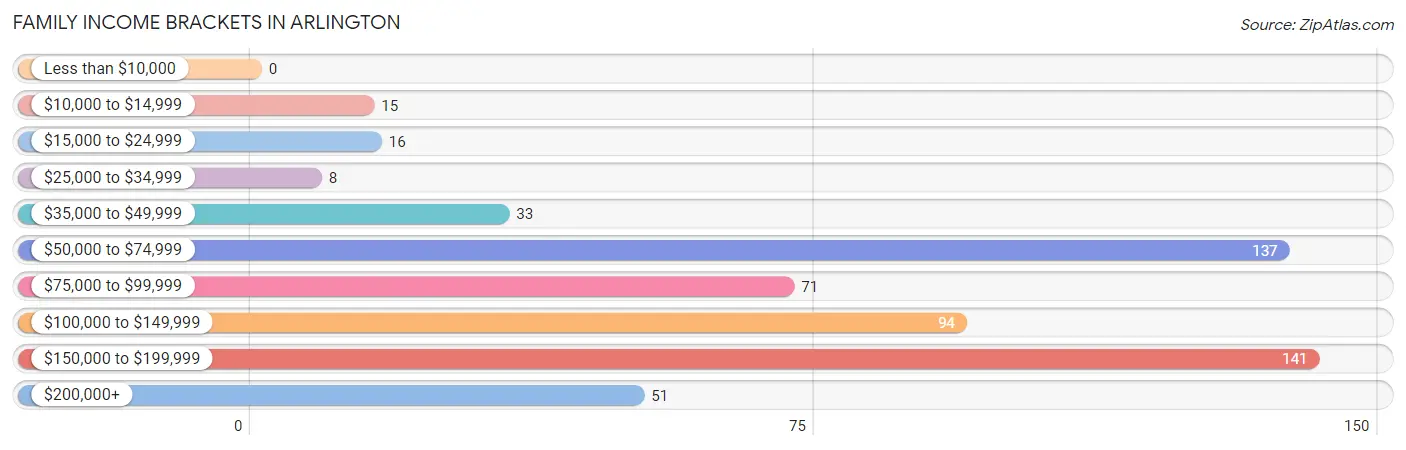
| Income Bracket | # Families | % Families |
| Less than $10,000 | 0 | 0.0% |
| $10,000 to $14,999 | 15 | 2.7% |
| $15,000 to $24,999 | 16 | 2.8% |
| $25,000 to $34,999 | 8 | 1.4% |
| $35,000 to $49,999 | 33 | 5.8% |
| $50,000 to $74,999 | 137 | 24.2% |
| $75,000 to $99,999 | 71 | 12.5% |
| $100,000 to $149,999 | 94 | 16.6% |
| $150,000 to $199,999 | 141 | 24.9% |
| $200,000+ | 51 | 9.0% |
Family Income by Famaliy Size in Arlington
5-person families (56 | 9.9%) account for the highest median family income in Arlington with $187,742 per family, while 4-person families (150 | 26.5%) have the highest median income of $41,030 per family member.
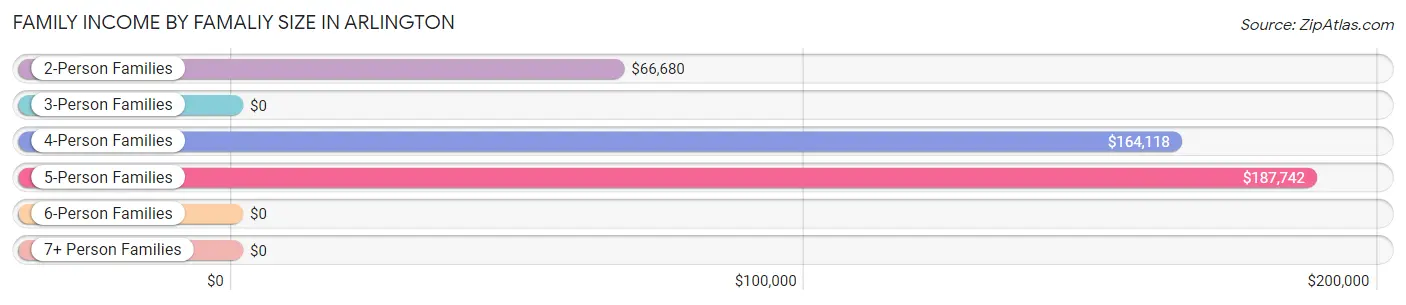
| Income Bracket | # Families | Median Income |
| 2-Person Families | 271 (47.9%) | $66,680 |
| 3-Person Families | 54 (9.5%) | $0 |
| 4-Person Families | 150 (26.5%) | $164,118 |
| 5-Person Families | 56 (9.9%) | $187,742 |
| 6-Person Families | 35 (6.2%) | $0 |
| 7+ Person Families | 0 (0.0%) | $0 |
| Total | 566 (100.0%) | $105,121 |
Family Income by Number of Earners in Arlington
The median family income in Arlington is $105,121, with families comprising 3+ earners (107) having the highest median family income of $164,210, while families with no earners (55) have the lowest median family income of $60,324, accounting for 18.9% and 9.7% of families, respectively.
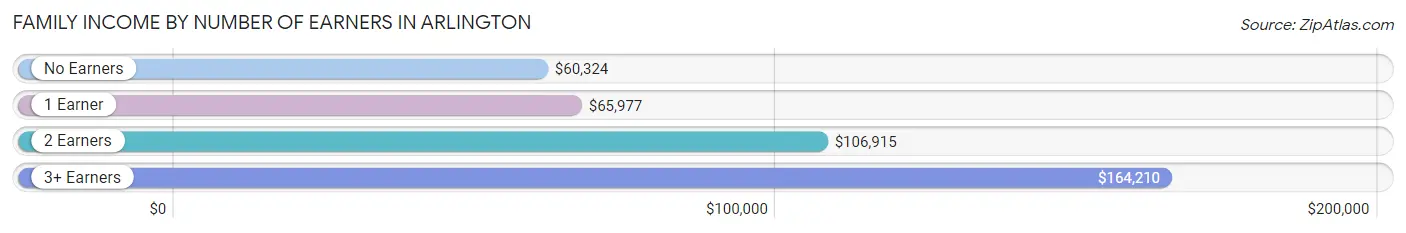
| Number of Earners | # Families | Median Income |
| No Earners | 55 (9.7%) | $60,324 |
| 1 Earner | 149 (26.3%) | $65,977 |
| 2 Earners | 255 (45.1%) | $106,915 |
| 3+ Earners | 107 (18.9%) | $164,210 |
| Total | 566 (100.0%) | $105,121 |
Household Income in Arlington
Household Income Brackets in Arlington
With 250 households falling in the category, the $50,000 to $74,999 income range is the most frequent in Arlington, accounting for 24.6% of all households. In contrast, only 18 households (1.8%) fall into the $15,000 to $24,999 income bracket, making it the least populous group.
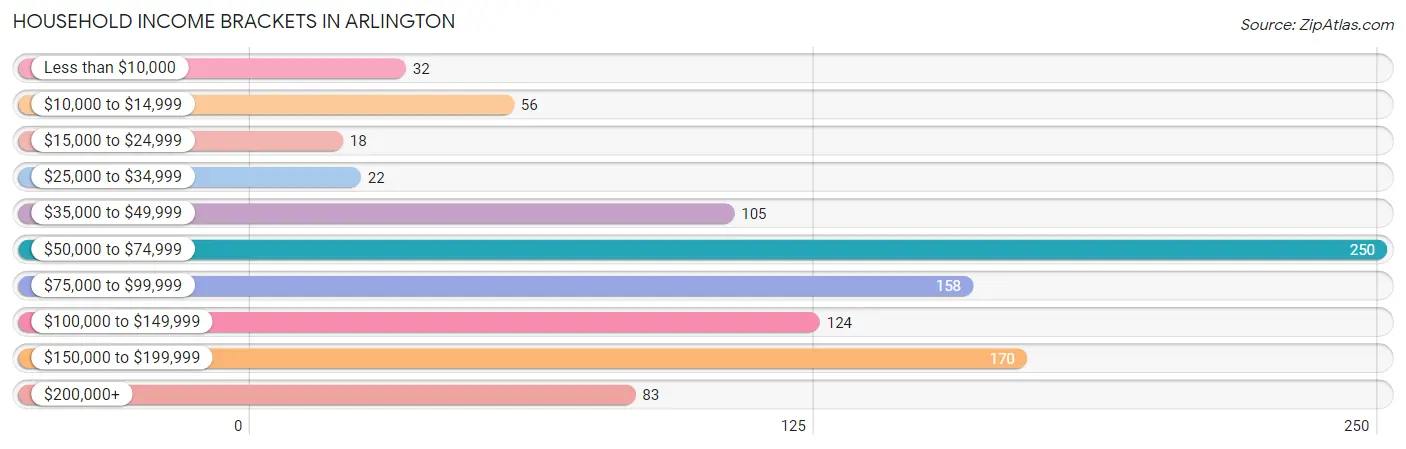
| Income Bracket | # Households | % Households |
| Less than $10,000 | 32 | 3.1% |
| $10,000 to $14,999 | 56 | 5.5% |
| $15,000 to $24,999 | 18 | 1.8% |
| $25,000 to $34,999 | 22 | 2.2% |
| $35,000 to $49,999 | 105 | 10.3% |
| $50,000 to $74,999 | 250 | 24.6% |
| $75,000 to $99,999 | 158 | 15.5% |
| $100,000 to $149,999 | 124 | 12.2% |
| $150,000 to $199,999 | 170 | 16.7% |
| $200,000+ | 83 | 8.2% |
Household Income by Householder Age in Arlington
The median household income in Arlington is $77,097, with the highest median household income of $106,230 found in the 25 to 44 years age bracket for the primary householder. A total of 405 households (39.8%) fall into this category. Meanwhile, the 15 to 24 years age bracket for the primary householder has the lowest median household income of $0, with 20 households (2.0%) in this group.
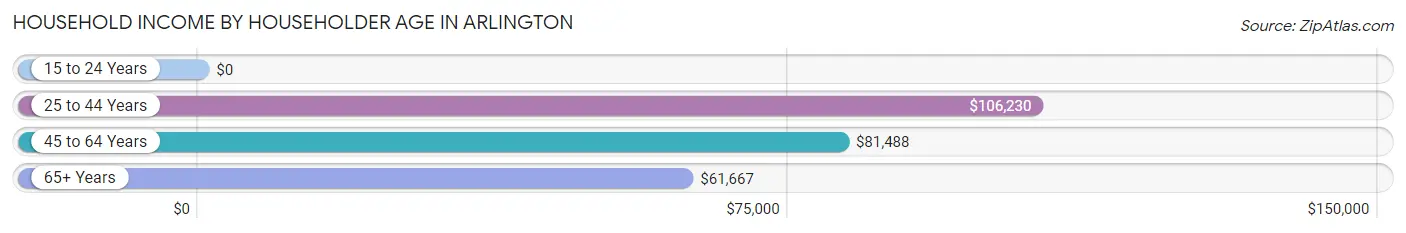
| Income Bracket | # Households | Median Income |
| 15 to 24 Years | 20 (2.0%) | $0 |
| 25 to 44 Years | 405 (39.8%) | $106,230 |
| 45 to 64 Years | 365 (35.8%) | $81,488 |
| 65+ Years | 228 (22.4%) | $61,667 |
| Total | 1,018 (100.0%) | $77,097 |
Poverty in Arlington
Income Below Poverty by Sex and Age in Arlington
With 5.6% poverty level for males and 11.7% for females among the residents of Arlington, 75 year old and over males and 16 and 17 year old females are the most vulnerable to poverty, with 1 males (20.0%) and 21 females (100.0%) in their respective age groups living below the poverty level.
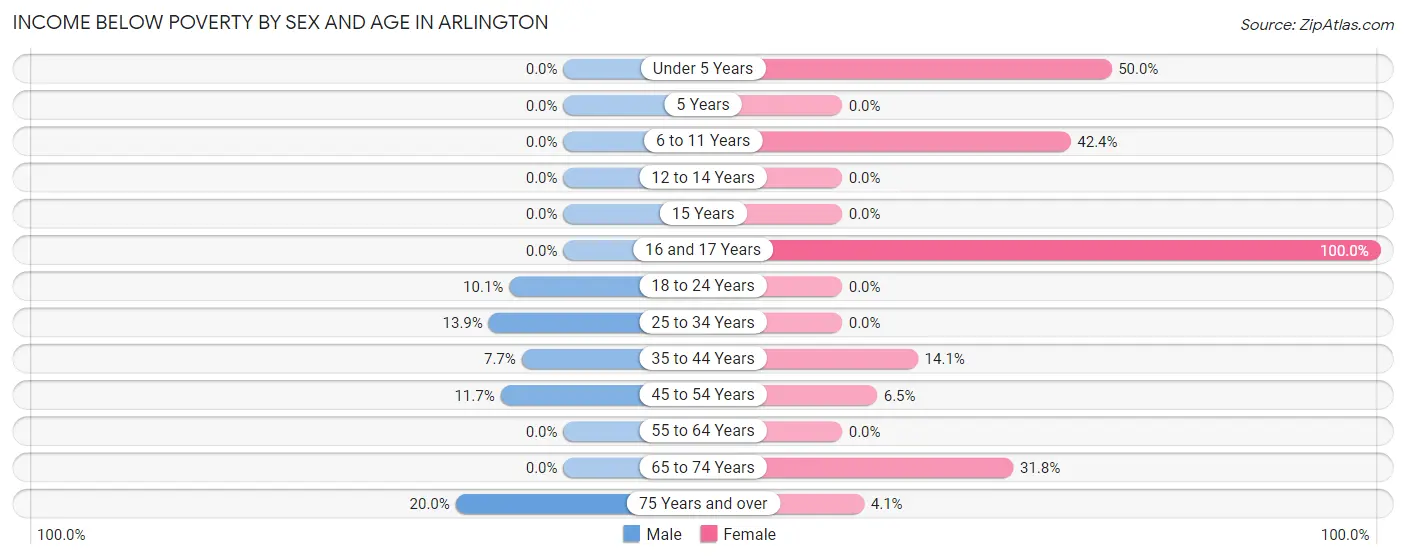
| Age Bracket | Male | Female |
| Under 5 Years | 0 (0.0%) | 12 (50.0%) |
| 5 Years | 0 (0.0%) | 0 (0.0%) |
| 6 to 11 Years | 0 (0.0%) | 14 (42.4%) |
| 12 to 14 Years | 0 (0.0%) | 0 (0.0%) |
| 15 Years | 0 (0.0%) | 0 (0.0%) |
| 16 and 17 Years | 0 (0.0%) | 21 (100.0%) |
| 18 to 24 Years | 18 (10.1%) | 0 (0.0%) |
| 25 to 34 Years | 19 (13.9%) | 0 (0.0%) |
| 35 to 44 Years | 13 (7.7%) | 30 (14.1%) |
| 45 to 54 Years | 21 (11.7%) | 12 (6.5%) |
| 55 to 64 Years | 0 (0.0%) | 0 (0.0%) |
| 65 to 74 Years | 0 (0.0%) | 34 (31.8%) |
| 75 Years and over | 1 (20.0%) | 5 (4.1%) |
| Total | 72 (5.6%) | 128 (11.7%) |
Income Above Poverty by Sex and Age in Arlington
According to the poverty statistics in Arlington, males aged under 5 years and females aged 12 to 14 years are the age groups that are most secure financially, with 100.0% of males and 100.0% of females in these age groups living above the poverty line.
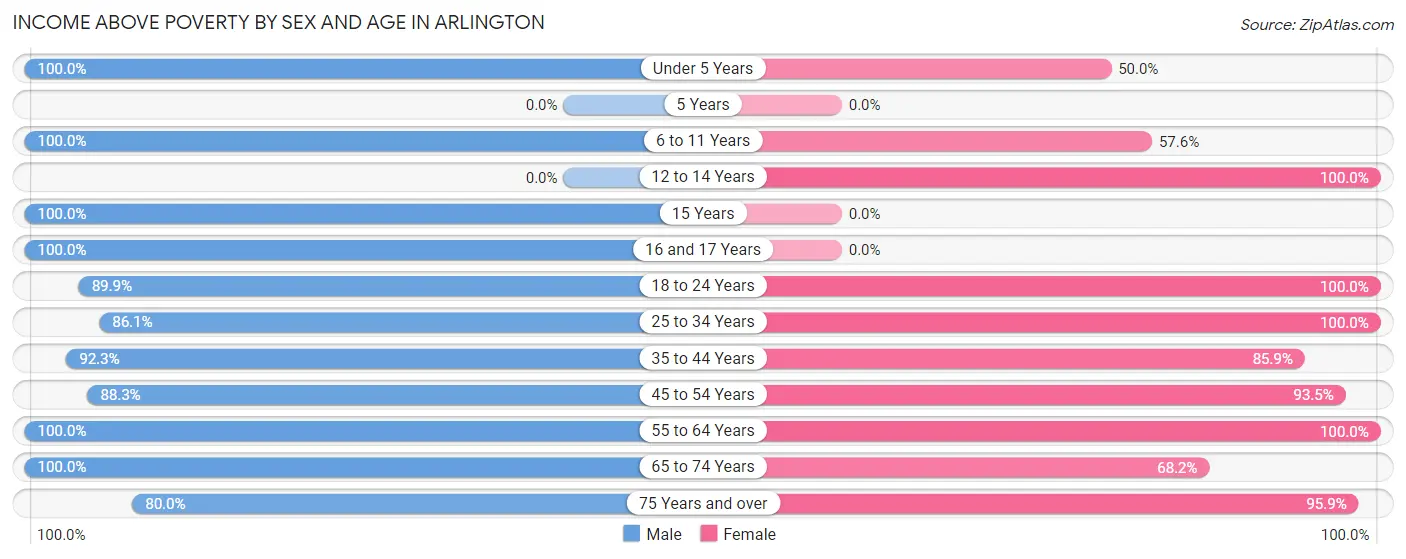
| Age Bracket | Male | Female |
| Under 5 Years | 82 (100.0%) | 12 (50.0%) |
| 5 Years | 0 (0.0%) | 0 (0.0%) |
| 6 to 11 Years | 122 (100.0%) | 19 (57.6%) |
| 12 to 14 Years | 0 (0.0%) | 23 (100.0%) |
| 15 Years | 72 (100.0%) | 0 (0.0%) |
| 16 and 17 Years | 47 (100.0%) | 0 (0.0%) |
| 18 to 24 Years | 161 (89.9%) | 70 (100.0%) |
| 25 to 34 Years | 118 (86.1%) | 203 (100.0%) |
| 35 to 44 Years | 155 (92.3%) | 183 (85.9%) |
| 45 to 54 Years | 159 (88.3%) | 173 (93.5%) |
| 55 to 64 Years | 169 (100.0%) | 94 (100.0%) |
| 65 to 74 Years | 127 (100.0%) | 73 (68.2%) |
| 75 Years and over | 4 (80.0%) | 117 (95.9%) |
| Total | 1,216 (94.4%) | 967 (88.3%) |
Income Below Poverty Among Married-Couple Families in Arlington
The poverty statistics for married-couple families in Arlington show that 4.1% or 15 of the total 365 families live below the poverty line. Families with 1 or 2 children have the highest poverty rate of 8.9%, comprising of 15 families. On the other hand, families with no children have the lowest poverty rate of 0.0%, which includes 0 families.
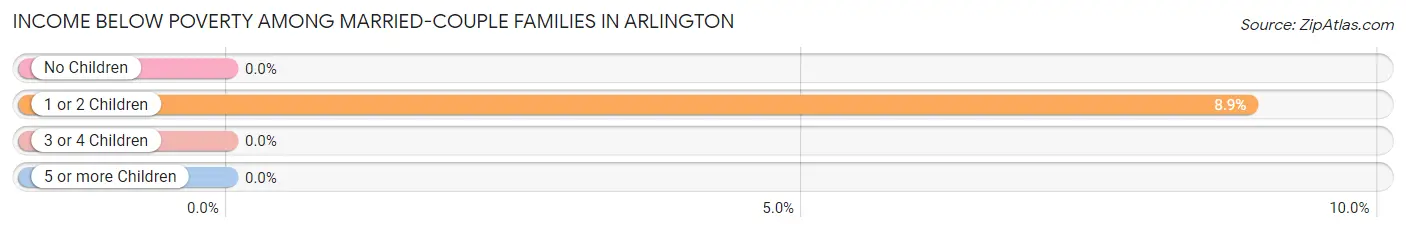
| Children | Above Poverty | Below Poverty |
| No Children | 187 (100.0%) | 0 (0.0%) |
| 1 or 2 Children | 154 (91.1%) | 15 (8.9%) |
| 3 or 4 Children | 9 (100.0%) | 0 (0.0%) |
| 5 or more Children | 0 (0.0%) | 0 (0.0%) |
| Total | 350 (95.9%) | 15 (4.1%) |
Income Below Poverty Among Single-Parent Households in Arlington
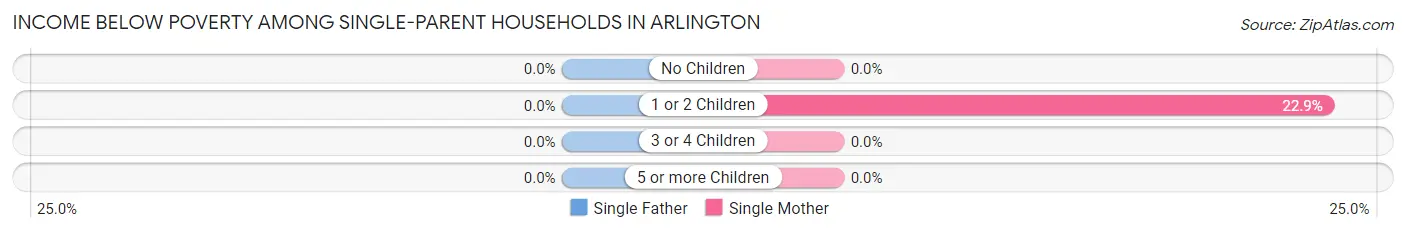
| Children | Single Father | Single Mother |
| No Children | 0 (0.0%) | 0 (0.0%) |
| 1 or 2 Children | 0 (0.0%) | 16 (22.9%) |
| 3 or 4 Children | 0 (0.0%) | 0 (0.0%) |
| 5 or more Children | 0 (0.0%) | 0 (0.0%) |
| Total | 0 (0.0%) | 16 (9.9%) |
Income Below Poverty Among Married-Couple vs Single-Parent Households in Arlington
The poverty data for Arlington shows that 15 of the married-couple family households (4.1%) and 16 of the single-parent households (8.0%) are living below the poverty level. Within the married-couple family households, those with 1 or 2 children have the highest poverty rate, with 15 households (8.9%) falling below the poverty line. Among the single-parent households, those with 1 or 2 children have the highest poverty rate, with 16 household (14.5%) living below poverty.
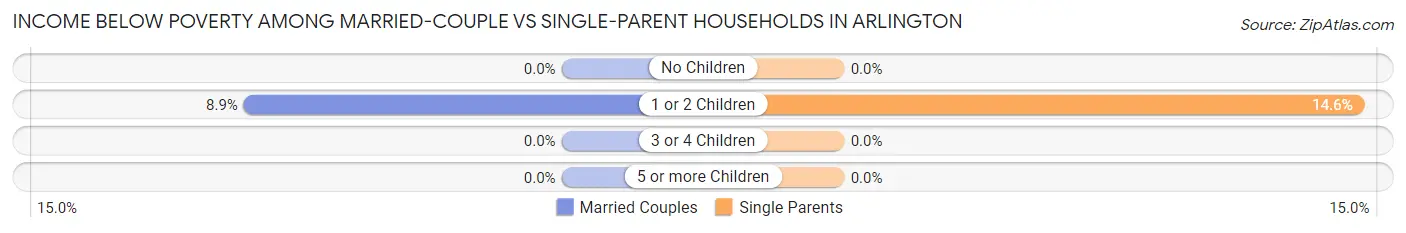
| Children | Married-Couple Families | Single-Parent Households |
| No Children | 0 (0.0%) | 0 (0.0%) |
| 1 or 2 Children | 15 (8.9%) | 16 (14.5%) |
| 3 or 4 Children | 0 (0.0%) | 0 (0.0%) |
| 5 or more Children | 0 (0.0%) | 0 (0.0%) |
| Total | 15 (4.1%) | 16 (8.0%) |
Race in Arlington
The most populous races in Arlington are White / Caucasian (980 | 40.7%), Black / African American (590 | 24.5%), and Hispanic or Latino (483 | 20.1%).
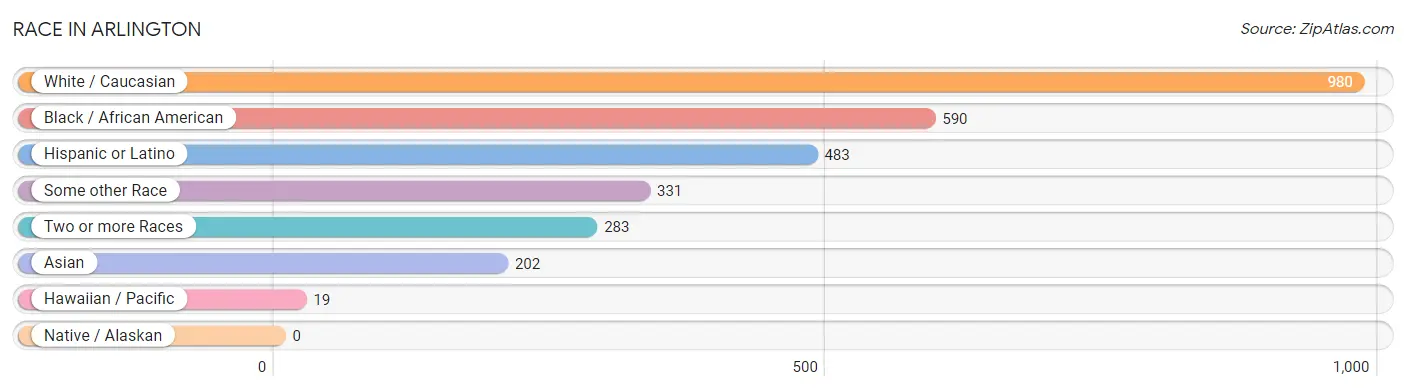
| Race | # Population | % Population |
| Asian | 202 | 8.4% |
| Black / African American | 590 | 24.5% |
| Hawaiian / Pacific | 19 | 0.8% |
| Hispanic or Latino | 483 | 20.1% |
| Native / Alaskan | 0 | 0.0% |
| White / Caucasian | 980 | 40.7% |
| Two or more Races | 283 | 11.8% |
| Some other Race | 331 | 13.8% |
| Total | 2,405 | 100.0% |
Ancestry in Arlington
The most populous ancestries reported in Arlington are Irish (315 | 13.1%), Italian (236 | 9.8%), Dominican (228 | 9.5%), Thai (182 | 7.6%), and Mexican (153 | 6.4%), together accounting for 46.3% of all Arlington residents.
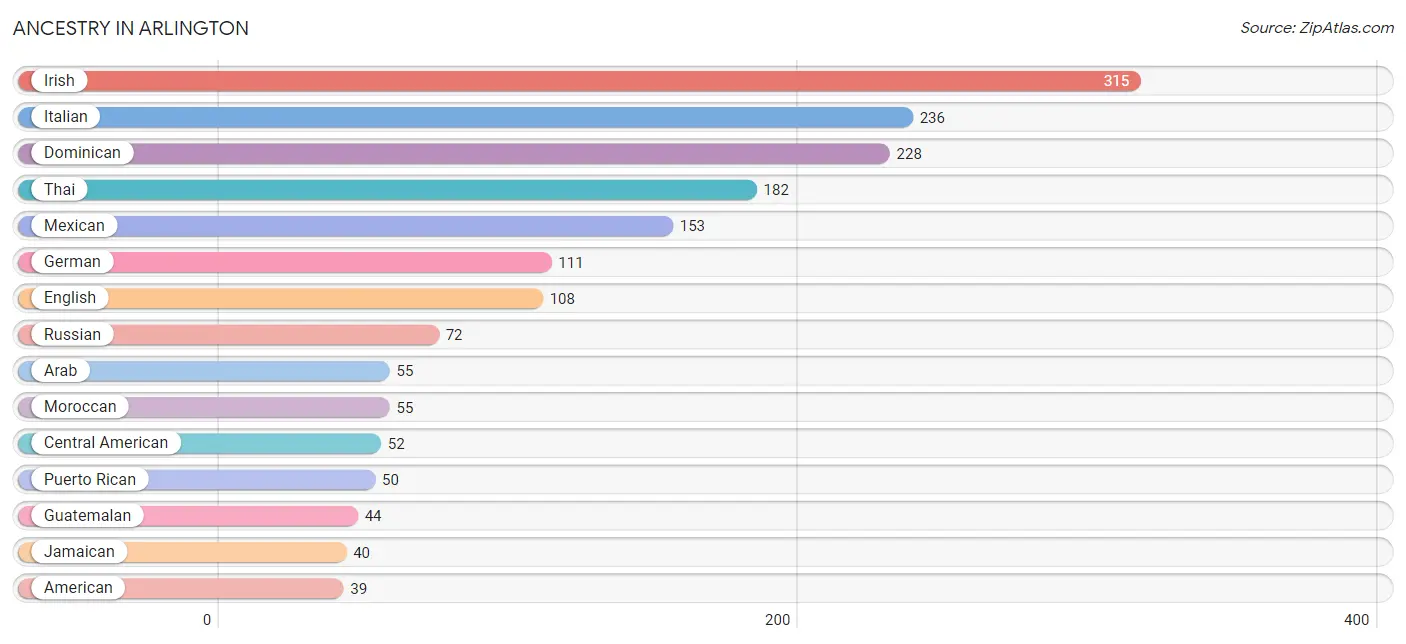
| Ancestry | # Population | % Population |
| American | 39 | 1.6% |
| Arab | 55 | 2.3% |
| Bhutanese | 34 | 1.4% |
| British | 8 | 0.3% |
| Central American | 52 | 2.2% |
| Costa Rican | 8 | 0.3% |
| Danish | 4 | 0.2% |
| Dominican | 228 | 9.5% |
| Dutch | 8 | 0.3% |
| Eastern European | 37 | 1.5% |
| English | 108 | 4.5% |
| French | 27 | 1.1% |
| French American Indian | 13 | 0.5% |
| German | 111 | 4.6% |
| Guamanian / Chamorro | 18 | 0.7% |
| Guatemalan | 44 | 1.8% |
| Indian (Asian) | 19 | 0.8% |
| Irish | 315 | 13.1% |
| Israeli | 3 | 0.1% |
| Italian | 236 | 9.8% |
| Jamaican | 40 | 1.7% |
| Mexican | 153 | 6.4% |
| Moroccan | 55 | 2.3% |
| Native Hawaiian | 19 | 0.8% |
| Nigerian | 18 | 0.7% |
| Norwegian | 11 | 0.5% |
| Polish | 31 | 1.3% |
| Portuguese | 18 | 0.7% |
| Puerto Rican | 50 | 2.1% |
| Russian | 72 | 3.0% |
| Slovak | 11 | 0.5% |
| Subsaharan African | 18 | 0.7% |
| Thai | 182 | 7.6% |
| Ukrainian | 38 | 1.6% | View All 34 Rows |
Immigrants in Arlington
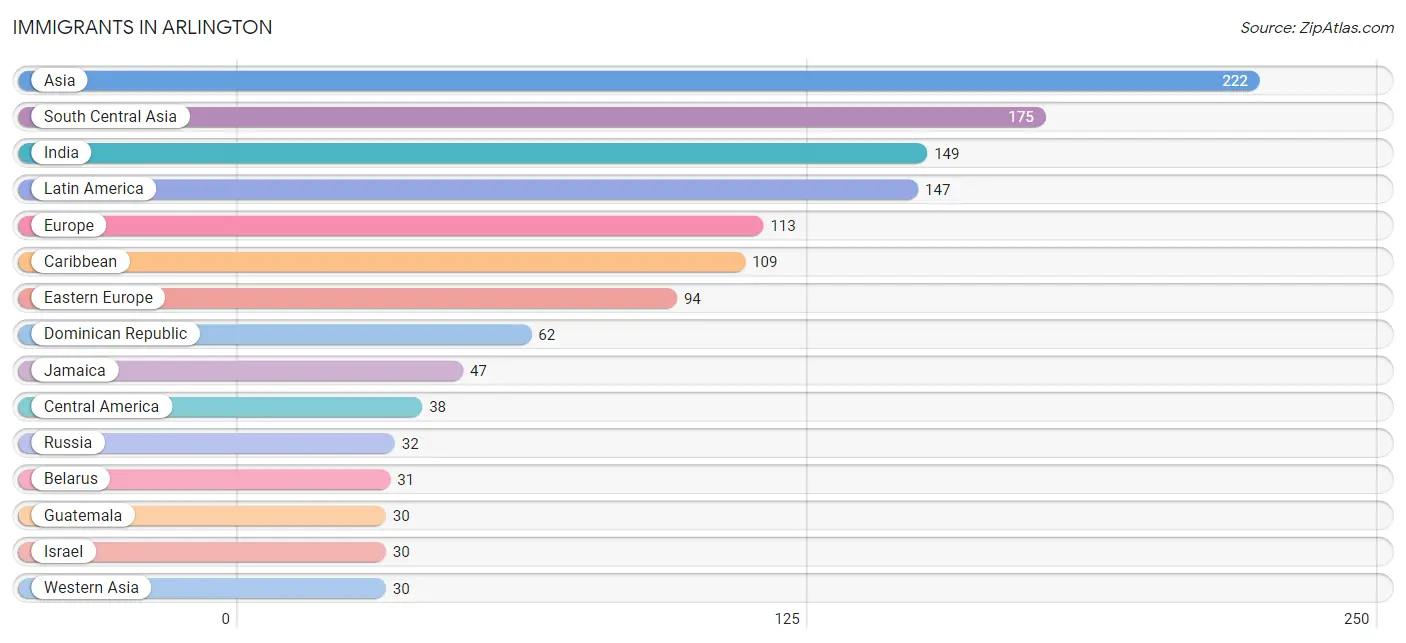
The most numerous immigrant groups reported in Arlington came from Asia (222 | 9.2%), South Central Asia (175 | 7.3%), India (149 | 6.2%), Latin America (147 | 6.1%), and Europe (113 | 4.7%), together accounting for 33.5% of all Arlington residents.
| Immigration Origin | # Population | % Population |
| Africa | 29 | 1.2% |
| Asia | 222 | 9.2% |
| Belarus | 31 | 1.3% |
| Caribbean | 109 | 4.5% |
| Central America | 38 | 1.6% |
| China | 11 | 0.5% |
| Costa Rica | 8 | 0.3% |
| Dominican Republic | 62 | 2.6% |
| Eastern Asia | 17 | 0.7% |
| Eastern Europe | 94 | 3.9% |
| Europe | 113 | 4.7% |
| Guatemala | 30 | 1.3% |
| India | 149 | 6.2% |
| Israel | 30 | 1.3% |
| Jamaica | 47 | 1.9% |
| Japan | 6 | 0.3% |
| Latin America | 147 | 6.1% |
| Latvia | 4 | 0.2% |
| Lithuania | 2 | 0.1% |
| Morocco | 29 | 1.2% |
| Northern Africa | 29 | 1.2% |
| Pakistan | 24 | 1.0% |
| Russia | 32 | 1.3% |
| South Central Asia | 175 | 7.3% |
| Southern Europe | 19 | 0.8% |
| Spain | 19 | 0.8% |
| Sri Lanka | 2 | 0.1% |
| Ukraine | 25 | 1.0% |
| Western Asia | 30 | 1.3% | View All 29 Rows |
Sex and Age in Arlington
Sex and Age in Arlington
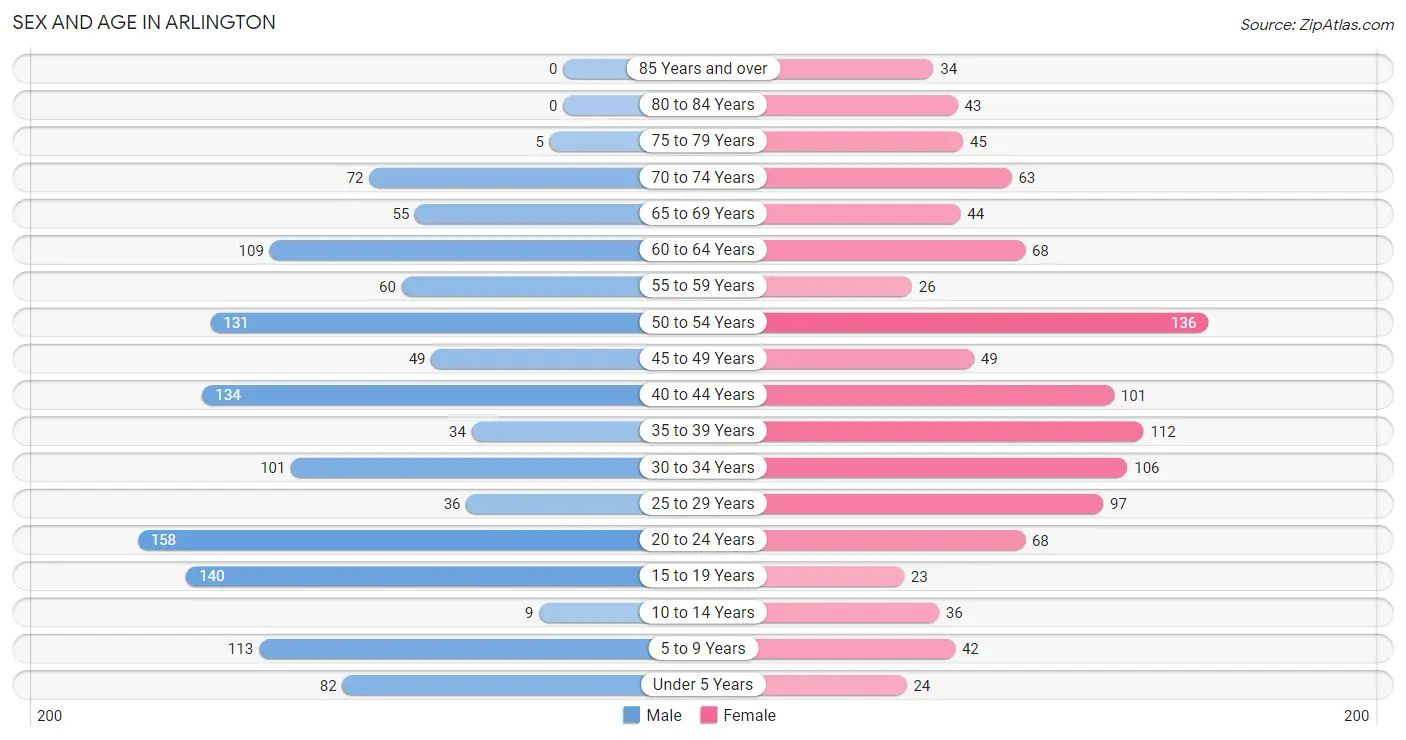
The most populous age groups in Arlington are 20 to 24 Years (158 | 12.3%) for men and 50 to 54 Years (136 | 12.2%) for women.
| Age Bracket | Male | Female |
| Under 5 Years | 82 (6.4%) | 24 (2.1%) |
| 5 to 9 Years | 113 (8.8%) | 42 (3.8%) |
| 10 to 14 Years | 9 (0.7%) | 36 (3.2%) |
| 15 to 19 Years | 140 (10.9%) | 23 (2.1%) |
| 20 to 24 Years | 158 (12.3%) | 68 (6.1%) |
| 25 to 29 Years | 36 (2.8%) | 97 (8.7%) |
| 30 to 34 Years | 101 (7.8%) | 106 (9.5%) |
| 35 to 39 Years | 34 (2.6%) | 112 (10.0%) |
| 40 to 44 Years | 134 (10.4%) | 101 (9.0%) |
| 45 to 49 Years | 49 (3.8%) | 49 (4.4%) |
| 50 to 54 Years | 131 (10.2%) | 136 (12.2%) |
| 55 to 59 Years | 60 (4.7%) | 26 (2.3%) |
| 60 to 64 Years | 109 (8.5%) | 68 (6.1%) |
| 65 to 69 Years | 55 (4.3%) | 44 (3.9%) |
| 70 to 74 Years | 72 (5.6%) | 63 (5.6%) |
| 75 to 79 Years | 5 (0.4%) | 45 (4.0%) |
| 80 to 84 Years | 0 (0.0%) | 43 (3.8%) |
| 85 Years and over | 0 (0.0%) | 34 (3.0%) |
| Total | 1,288 (100.0%) | 1,117 (100.0%) |
Families and Households in Arlington
Median Family Size in Arlington
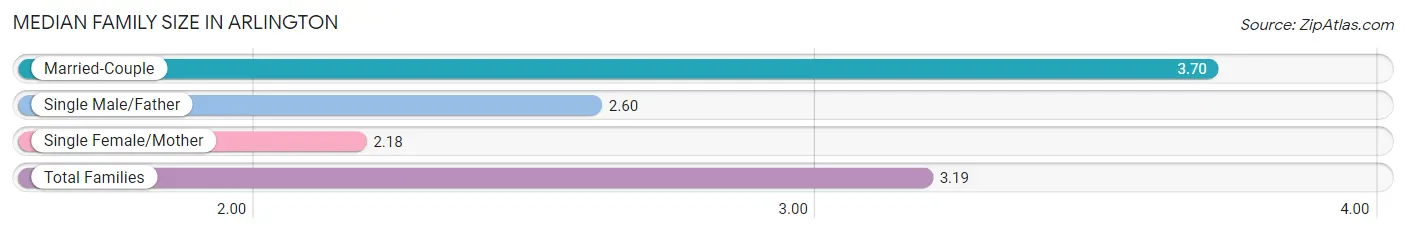
The median family size in Arlington is 3.19 persons per family, with married-couple families (365 | 64.5%) accounting for the largest median family size of 3.7 persons per family. On the other hand, single female/mother families (161 | 28.4%) represent the smallest median family size with 2.18 persons per family.
| Family Type | # Families | Family Size |
| Married-Couple | 365 (64.5%) | 3.70 |
| Single Male/Father | 40 (7.1%) | 2.60 |
| Single Female/Mother | 161 (28.4%) | 2.18 |
| Total Families | 566 (100.0%) | 3.19 |
Median Household Size in Arlington
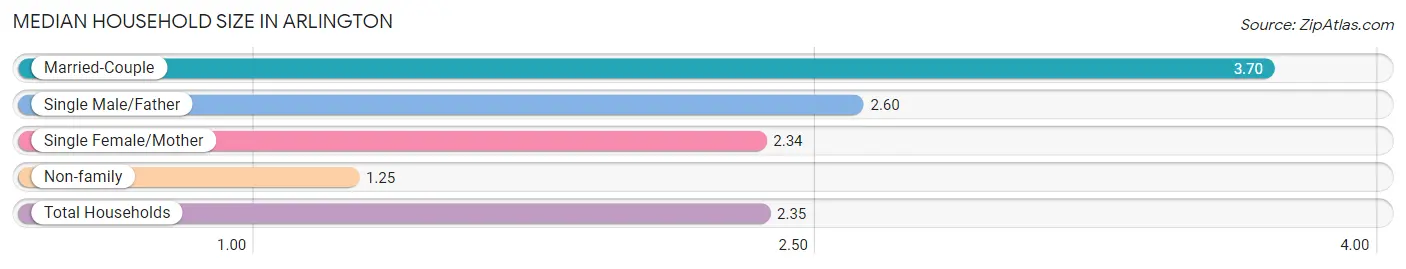
The median household size in Arlington is 2.35 persons per household, with married-couple households (365 | 35.8%) accounting for the largest median household size of 3.7 persons per household. non-family households (452 | 44.4%) represent the smallest median household size with 1.25 persons per household.
| Household Type | # Households | Household Size |
| Married-Couple | 365 (35.8%) | 3.70 |
| Single Male/Father | 40 (3.9%) | 2.60 |
| Single Female/Mother | 161 (15.8%) | 2.34 |
| Non-family | 452 (44.4%) | 1.25 |
| Total Households | 1,018 (100.0%) | 2.35 |
Household Size by Marriage Status in Arlington
Out of a total of 1,018 households in Arlington, 566 (55.6%) are family households, while 452 (44.4%) are nonfamily households. The most numerous type of family households are 2-person households, comprising 248, and the most common type of nonfamily households are 1-person households, comprising 358.
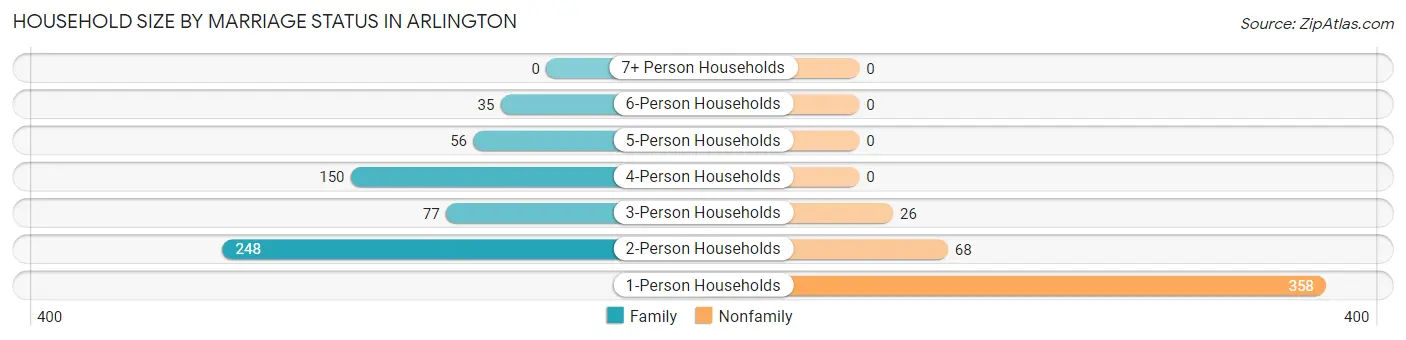
| Household Size | Family Households | Nonfamily Households |
| 1-Person Households | - | 358 (35.2%) |
| 2-Person Households | 248 (24.4%) | 68 (6.7%) |
| 3-Person Households | 77 (7.6%) | 26 (2.5%) |
| 4-Person Households | 150 (14.7%) | 0 (0.0%) |
| 5-Person Households | 56 (5.5%) | 0 (0.0%) |
| 6-Person Households | 35 (3.4%) | 0 (0.0%) |
| 7+ Person Households | 0 (0.0%) | 0 (0.0%) |
| Total | 566 (55.6%) | 452 (44.4%) |
Female Fertility in Arlington
Fertility by Age in Arlington
| Age Bracket | Women with Births | Births / 1,000 Women |
| 15 to 19 years | 0 (0.0%) | 0.0 |
| 20 to 34 years | 0 (0.0%) | 0.0 |
| 35 to 50 years | 0 (0.0%) | 0.0 |
| Total | 0 (0.0%) | 0.0 |
Fertility by Age by Marriage Status in Arlington
| Age Bracket | Married | Unmarried |
| 15 to 19 years | 0 (0.0%) | 0 (0.0%) |
| 20 to 34 years | 0 (0.0%) | 0 (0.0%) |
| 35 to 50 years | 0 (0.0%) | 0 (0.0%) |
| Total | 0 (0.0%) | 0 (0.0%) |
Fertility by Education in Arlington
| Educational Attainment | Women with Births | Births / 1,000 Women |
| Less than High School | 0 (0.0%) | 0.0 |
| High School Diploma | 0 (0.0%) | 0.0 |
| College or Associate's Degree | 0 (0.0%) | 0.0 |
| Bachelor's Degree | 0 (0.0%) | 0.0 |
| Graduate Degree | 0 (0.0%) | 0.0 |
| Total | 0 (0.0%) | 0.0 |
Fertility by Education by Marriage Status in Arlington
| Educational Attainment | Married | Unmarried |
| Less than High School | 0 (0.0%) | 0 (0.0%) |
| High School Diploma | 0 (0.0%) | 0 (0.0%) |
| College or Associate's Degree | 0 (0.0%) | 0 (0.0%) |
| Bachelor's Degree | 0 (0.0%) | 0 (0.0%) |
| Graduate Degree | 0 (0.0%) | 0 (0.0%) |
| Total | 0 (0.0%) | 0 (0.0%) |
Employment Characteristics in Arlington
Employment by Class of Employer in Arlington
Among the 1,282 employed individuals in Arlington, private company employees (845 | 65.9%), not-for-profit organizations (239 | 18.6%), and self-employed (incorporated) (71 | 5.5%) make up the most common classes of employment.
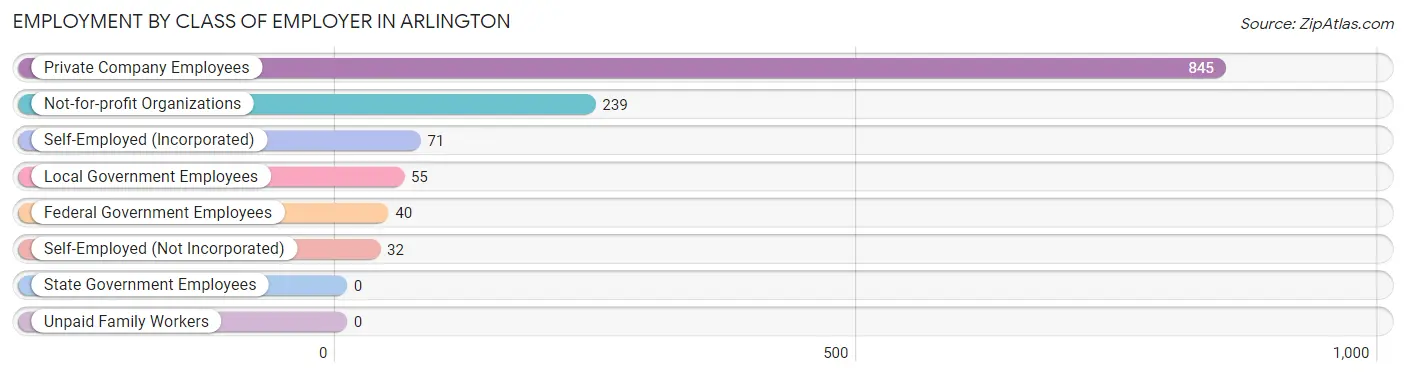
| Employer Class | # Employees | % Employees |
| Private Company Employees | 845 | 65.9% |
| Self-Employed (Incorporated) | 71 | 5.5% |
| Self-Employed (Not Incorporated) | 32 | 2.5% |
| Not-for-profit Organizations | 239 | 18.6% |
| Local Government Employees | 55 | 4.3% |
| State Government Employees | 0 | 0.0% |
| Federal Government Employees | 40 | 3.1% |
| Unpaid Family Workers | 0 | 0.0% |
| Total | 1,282 | 100.0% |
Employment Status by Age in Arlington
According to the labor force statistics for Arlington, out of the total population over 16 years of age (2,027), 71.8% or 1,455 individuals are in the labor force, with 7.6% or 111 of them unemployed. The age group with the highest labor force participation rate is 25 to 29 years, with 100.0% or 133 individuals in the labor force. Within the labor force, the 30 to 34 years age range has the highest percentage of unemployed individuals, with 36.7% or 69 of them being unemployed.
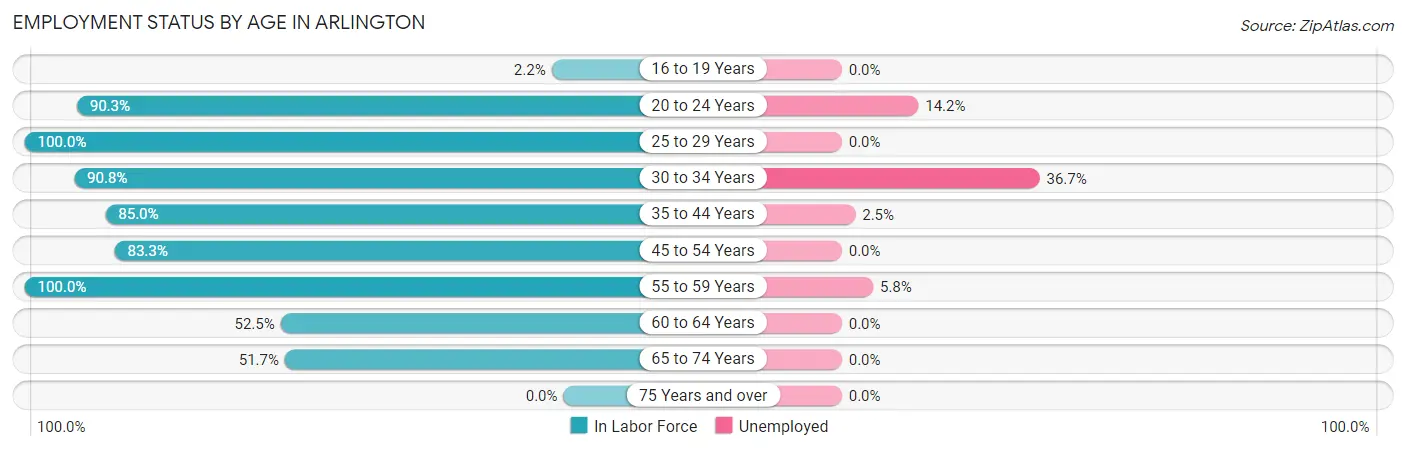
| Age Bracket | In Labor Force | Unemployed |
| 16 to 19 Years | 2 (2.2%) | 0 (0.0%) |
| 20 to 24 Years | 204 (90.3%) | 29 (14.2%) |
| 25 to 29 Years | 133 (100.0%) | 0 (0.0%) |
| 30 to 34 Years | 188 (90.8%) | 69 (36.7%) |
| 35 to 44 Years | 324 (85.0%) | 8 (2.5%) |
| 45 to 54 Years | 304 (83.3%) | 0 (0.0%) |
| 55 to 59 Years | 86 (100.0%) | 5 (5.8%) |
| 60 to 64 Years | 93 (52.5%) | 0 (0.0%) |
| 65 to 74 Years | 121 (51.7%) | 0 (0.0%) |
| 75 Years and over | 0 (0.0%) | 0 (0.0%) |
| Total | 1,455 (71.8%) | 111 (7.6%) |
Employment Status by Educational Attainment in Arlington
According to labor force statistics for Arlington, 83.6% of individuals (1,128) out of the total population between 25 and 64 years of age (1,349) are in the labor force, with 7.3% or 82 of them being unemployed. The group with the highest labor force participation rate are those with the educational attainment of bachelor's degree or higher, with 92.1% or 522 individuals in the labor force. Within the labor force, individuals with college / associate degree education have the highest percentage of unemployment, with 33.5% or 69 of them being unemployed.
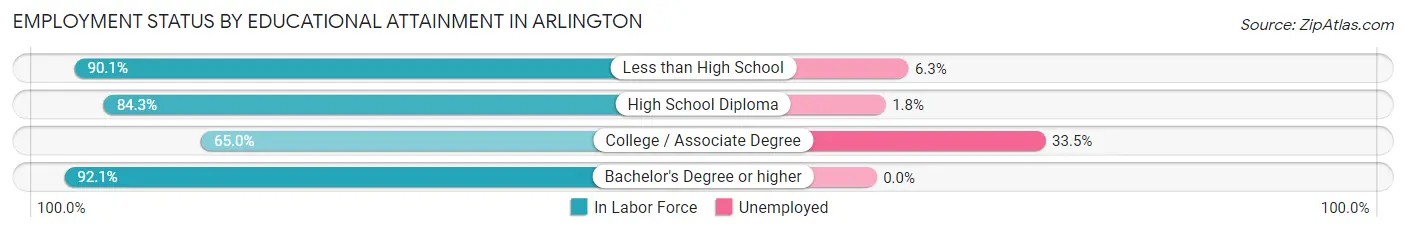
| Educational Attainment | In Labor Force | Unemployed |
| Less than High School | 127 (90.1%) | 9 (6.3%) |
| High School Diploma | 273 (84.3%) | 6 (1.8%) |
| College / Associate Degree | 206 (65.0%) | 106 (33.5%) |
| Bachelor's Degree or higher | 522 (92.1%) | 0 (0.0%) |
| Total | 1,128 (83.6%) | 98 (7.3%) |
Employment Occupations by Sex in Arlington
Management, Business, Science and Arts Occupations
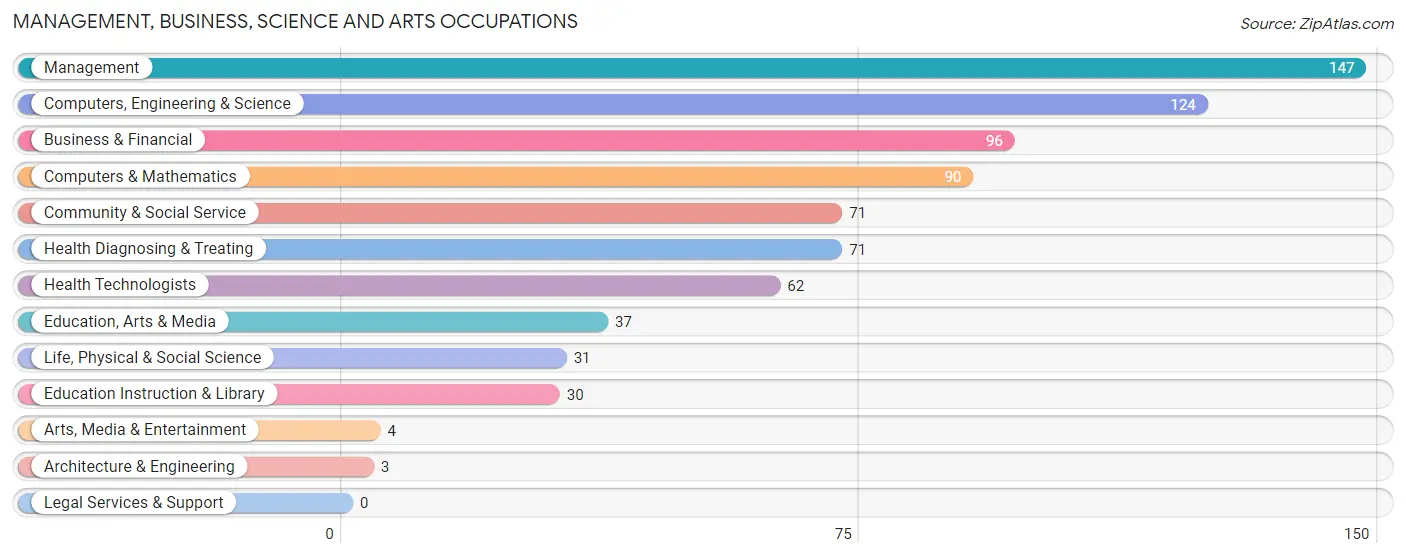
The most common Management, Business, Science and Arts occupations in Arlington are Management (147 | 10.9%), Computers, Engineering & Science (124 | 9.2%), Business & Financial (96 | 7.1%), Computers & Mathematics (90 | 6.7%), and Community & Social Service (71 | 5.3%).
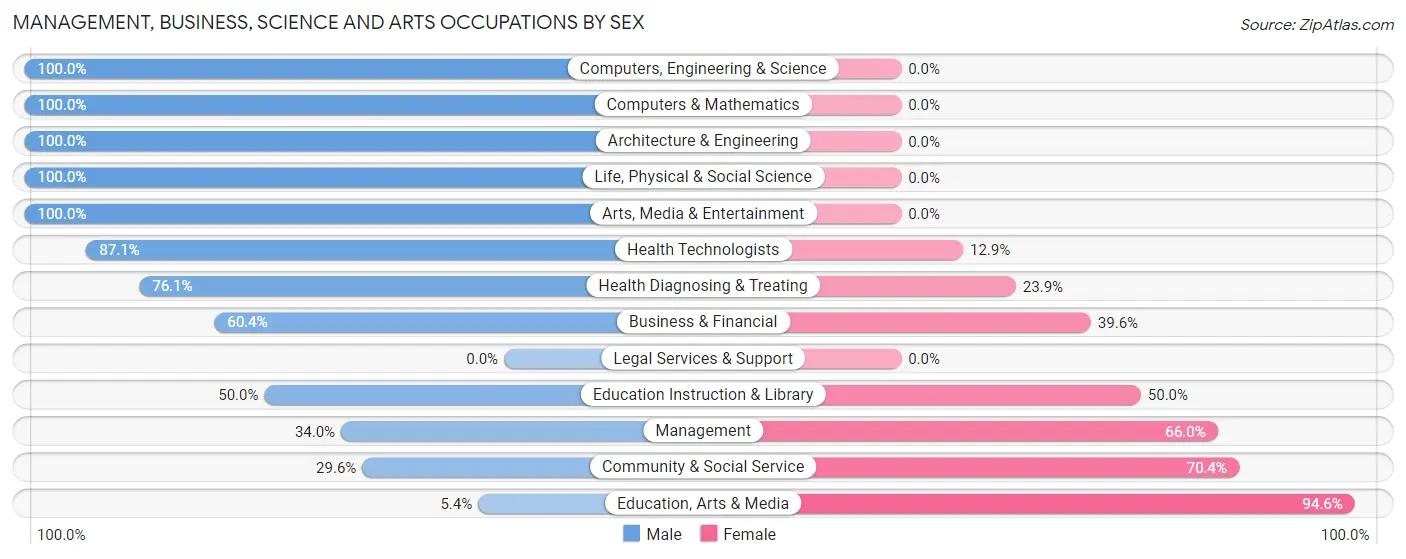
Management, Business, Science and Arts Occupations by Sex
Within the Management, Business, Science and Arts occupations in Arlington, the most male-oriented occupations are Computers, Engineering & Science (100.0%), Computers & Mathematics (100.0%), and Architecture & Engineering (100.0%), while the most female-oriented occupations are Education, Arts & Media (94.6%), Community & Social Service (70.4%), and Management (66.0%).
| Occupation | Male | Female |
| Management | 50 (34.0%) | 97 (66.0%) |
| Business & Financial | 58 (60.4%) | 38 (39.6%) |
| Computers, Engineering & Science | 124 (100.0%) | 0 (0.0%) |
| Computers & Mathematics | 90 (100.0%) | 0 (0.0%) |
| Architecture & Engineering | 3 (100.0%) | 0 (0.0%) |
| Life, Physical & Social Science | 31 (100.0%) | 0 (0.0%) |
| Community & Social Service | 21 (29.6%) | 50 (70.4%) |
| Education, Arts & Media | 2 (5.4%) | 35 (94.6%) |
| Legal Services & Support | 0 (0.0%) | 0 (0.0%) |
| Education Instruction & Library | 15 (50.0%) | 15 (50.0%) |
| Arts, Media & Entertainment | 4 (100.0%) | 0 (0.0%) |
| Health Diagnosing & Treating | 54 (76.1%) | 17 (23.9%) |
| Health Technologists | 54 (87.1%) | 8 (12.9%) |
| Total (Category) | 307 (60.3%) | 202 (39.7%) |
| Total (Overall) | 714 (53.1%) | 630 (46.9%) |
Services Occupations
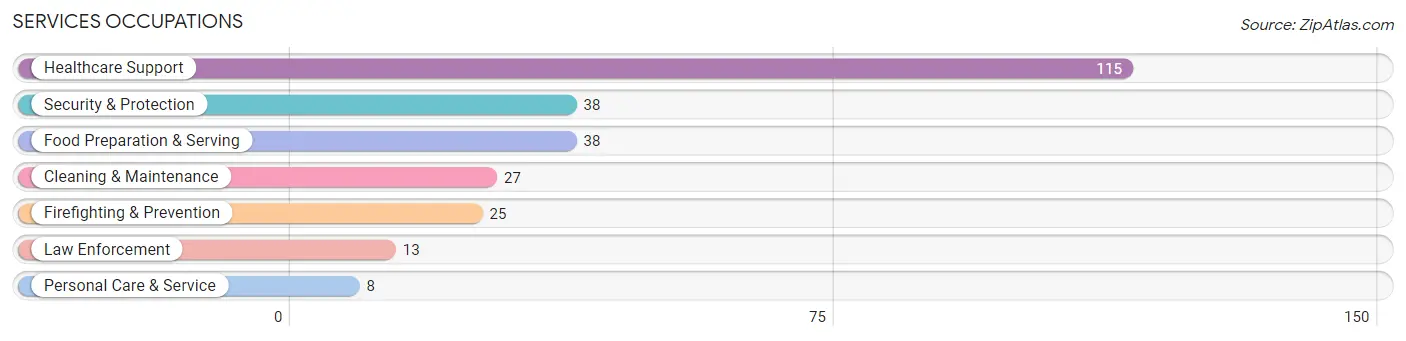
The most common Services occupations in Arlington are Healthcare Support (115 | 8.6%), Security & Protection (38 | 2.8%), Food Preparation & Serving (38 | 2.8%), Cleaning & Maintenance (27 | 2.0%), and Firefighting & Prevention (25 | 1.9%).
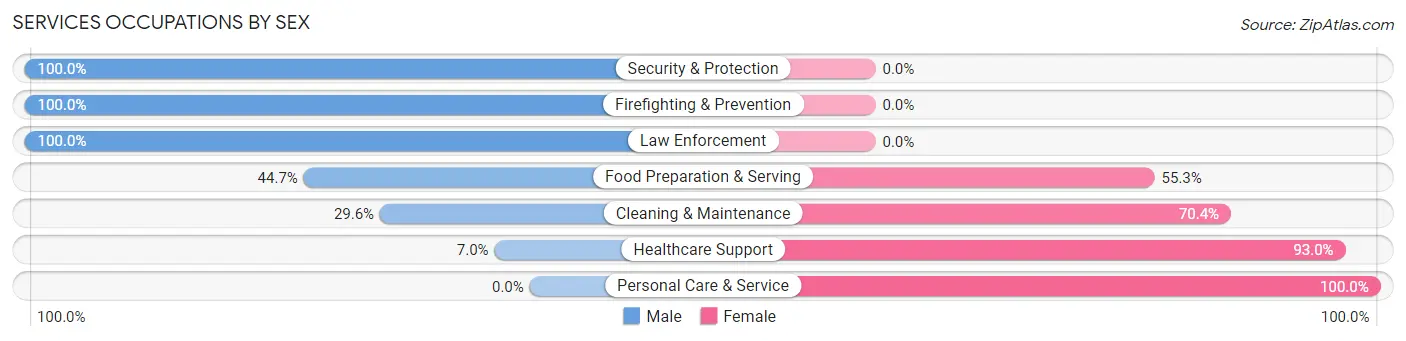
Services Occupations by Sex
Within the Services occupations in Arlington, the most male-oriented occupations are Security & Protection (100.0%), Firefighting & Prevention (100.0%), and Law Enforcement (100.0%), while the most female-oriented occupations are Personal Care & Service (100.0%), Healthcare Support (93.0%), and Cleaning & Maintenance (70.4%).
| Occupation | Male | Female |
| Healthcare Support | 8 (7.0%) | 107 (93.0%) |
| Security & Protection | 38 (100.0%) | 0 (0.0%) |
| Firefighting & Prevention | 25 (100.0%) | 0 (0.0%) |
| Law Enforcement | 13 (100.0%) | 0 (0.0%) |
| Food Preparation & Serving | 17 (44.7%) | 21 (55.3%) |
| Cleaning & Maintenance | 8 (29.6%) | 19 (70.4%) |
| Personal Care & Service | 0 (0.0%) | 8 (100.0%) |
| Total (Category) | 71 (31.4%) | 155 (68.6%) |
| Total (Overall) | 714 (53.1%) | 630 (46.9%) |
Sales and Office Occupations
The most common Sales and Office occupations in Arlington are Sales & Related (162 | 12.0%), and Office & Administration (146 | 10.9%).
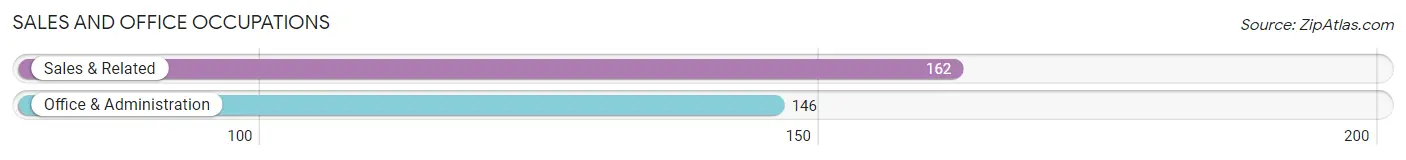
Sales and Office Occupations by Sex

| Occupation | Male | Female |
| Sales & Related | 95 (58.6%) | 67 (41.4%) |
| Office & Administration | 19 (13.0%) | 127 (87.0%) |
| Total (Category) | 114 (37.0%) | 194 (63.0%) |
| Total (Overall) | 714 (53.1%) | 630 (46.9%) |
Natural Resources, Construction and Maintenance Occupations
The most common Natural Resources, Construction and Maintenance occupations in Arlington are Installation, Maintenance & Repair (26 | 1.9%), and Construction & Extraction (15 | 1.1%).
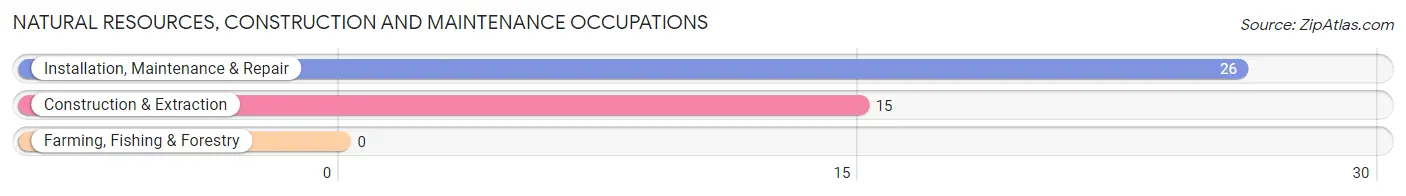
Natural Resources, Construction and Maintenance Occupations by Sex
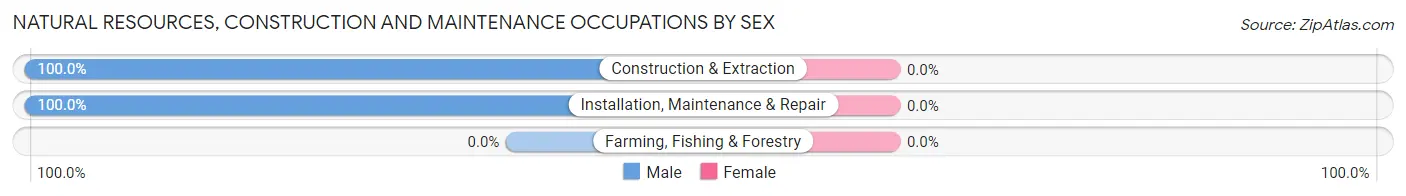
| Occupation | Male | Female |
| Farming, Fishing & Forestry | 0 (0.0%) | 0 (0.0%) |
| Construction & Extraction | 15 (100.0%) | 0 (0.0%) |
| Installation, Maintenance & Repair | 26 (100.0%) | 0 (0.0%) |
| Total (Category) | 41 (100.0%) | 0 (0.0%) |
| Total (Overall) | 714 (53.1%) | 630 (46.9%) |
Production, Transportation and Moving Occupations
The most common Production, Transportation and Moving occupations in Arlington are Production (141 | 10.5%), Material Moving (61 | 4.5%), and Transportation (58 | 4.3%).
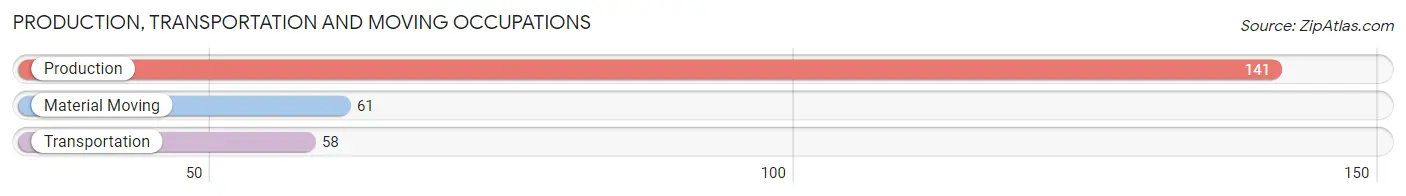
Production, Transportation and Moving Occupations by Sex
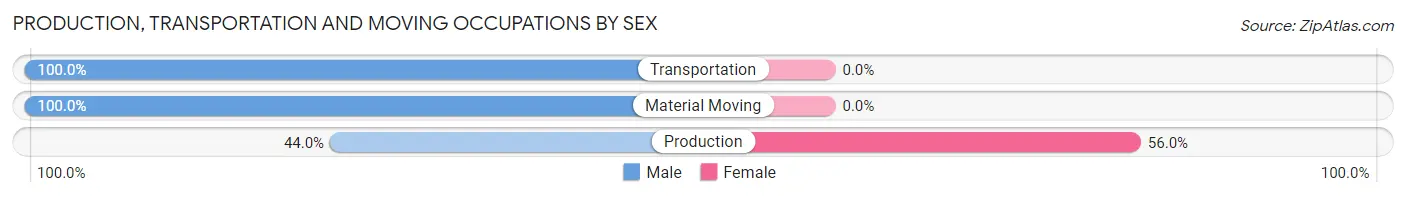
| Occupation | Male | Female |
| Production | 62 (44.0%) | 79 (56.0%) |
| Transportation | 58 (100.0%) | 0 (0.0%) |
| Material Moving | 61 (100.0%) | 0 (0.0%) |
| Total (Category) | 181 (69.6%) | 79 (30.4%) |
| Total (Overall) | 714 (53.1%) | 630 (46.9%) |
Employment Industries by Sex in Arlington
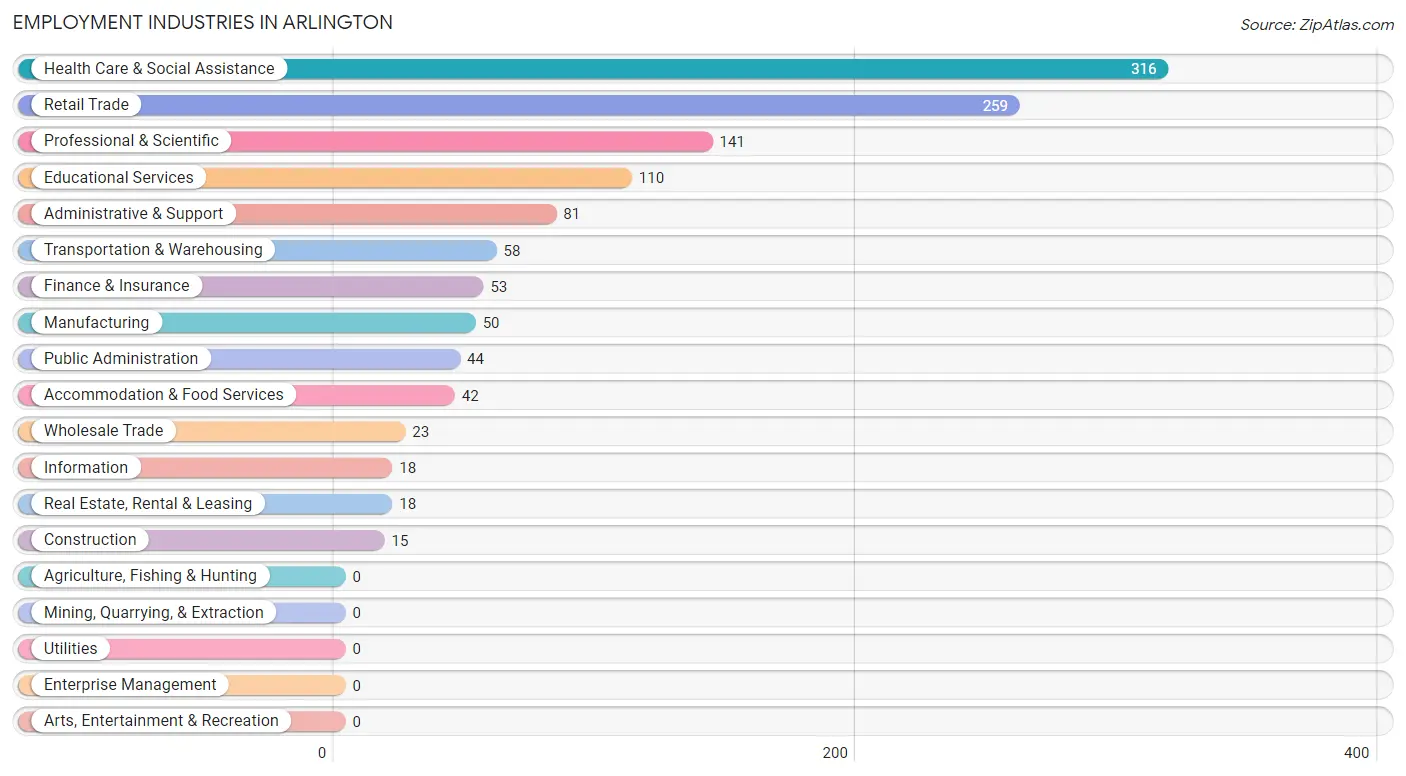
Employment Industries in Arlington
The major employment industries in Arlington include Health Care & Social Assistance (316 | 23.5%), Retail Trade (259 | 19.3%), Professional & Scientific (141 | 10.5%), Educational Services (110 | 8.2%), and Administrative & Support (81 | 6.0%).
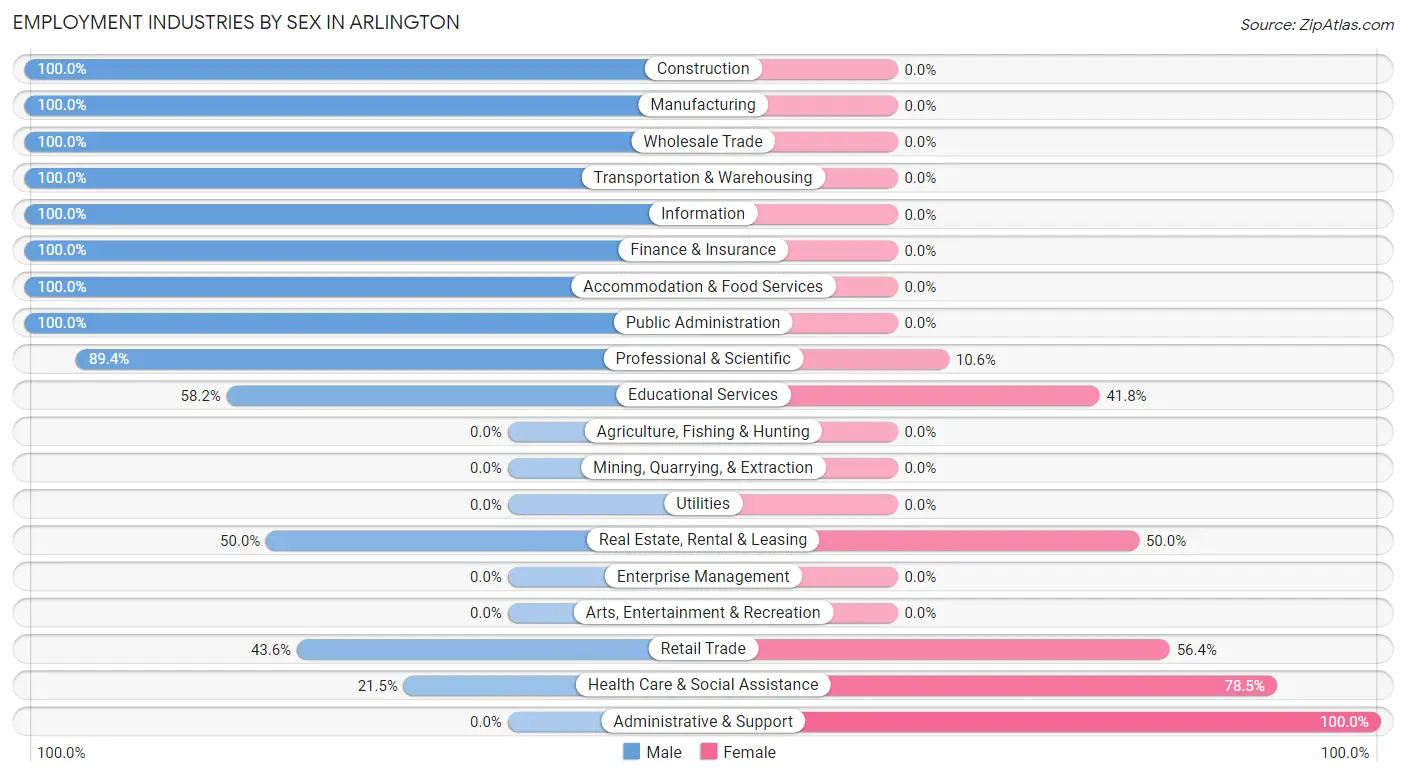
Employment Industries by Sex in Arlington
The Arlington industries that see more men than women are Construction (100.0%), Manufacturing (100.0%), and Wholesale Trade (100.0%), whereas the industries that tend to have a higher number of women are Administrative & Support (100.0%), Health Care & Social Assistance (78.5%), and Retail Trade (56.4%).
| Industry | Male | Female |
| Agriculture, Fishing & Hunting | 0 (0.0%) | 0 (0.0%) |
| Mining, Quarrying, & Extraction | 0 (0.0%) | 0 (0.0%) |
| Construction | 15 (100.0%) | 0 (0.0%) |
| Manufacturing | 50 (100.0%) | 0 (0.0%) |
| Wholesale Trade | 23 (100.0%) | 0 (0.0%) |
| Retail Trade | 113 (43.6%) | 146 (56.4%) |
| Transportation & Warehousing | 58 (100.0%) | 0 (0.0%) |
| Utilities | 0 (0.0%) | 0 (0.0%) |
| Information | 18 (100.0%) | 0 (0.0%) |
| Finance & Insurance | 53 (100.0%) | 0 (0.0%) |
| Real Estate, Rental & Leasing | 9 (50.0%) | 9 (50.0%) |
| Professional & Scientific | 126 (89.4%) | 15 (10.6%) |
| Enterprise Management | 0 (0.0%) | 0 (0.0%) |
| Administrative & Support | 0 (0.0%) | 81 (100.0%) |
| Educational Services | 64 (58.2%) | 46 (41.8%) |
| Health Care & Social Assistance | 68 (21.5%) | 248 (78.5%) |
| Arts, Entertainment & Recreation | 0 (0.0%) | 0 (0.0%) |
| Accommodation & Food Services | 42 (100.0%) | 0 (0.0%) |
| Public Administration | 44 (100.0%) | 0 (0.0%) |
| Total | 714 (53.1%) | 630 (46.9%) |
Education in Arlington
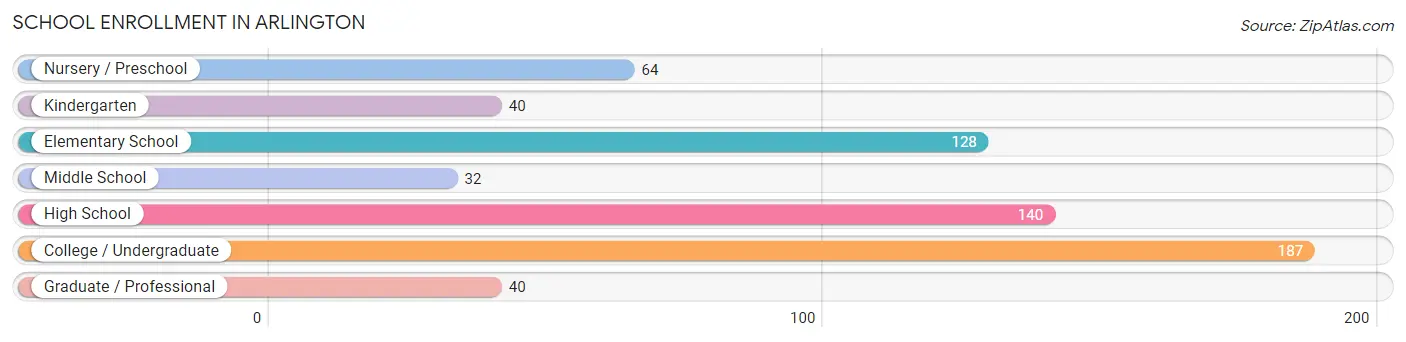
School Enrollment in Arlington
The most common levels of schooling among the 631 students in Arlington are college / undergraduate (187 | 29.6%), high school (140 | 22.2%), and elementary school (128 | 20.3%).
| School Level | # Students | % Students |
| Nursery / Preschool | 64 | 10.1% |
| Kindergarten | 40 | 6.3% |
| Elementary School | 128 | 20.3% |
| Middle School | 32 | 5.1% |
| High School | 140 | 22.2% |
| College / Undergraduate | 187 | 29.6% |
| Graduate / Professional | 40 | 6.3% |
| Total | 631 | 100.0% |
School Enrollment by Age by Funding Source in Arlington
Out of a total of 631 students who are enrolled in schools in Arlington, 169 (26.8%) attend a private institution, while the remaining 462 (73.2%) are enrolled in public schools. The age group of 3 to 4 year olds has the highest likelihood of being enrolled in private schools, with 64 (100.0% in the age bracket) enrolled. Conversely, the age group of 5 to 9 year old has the lowest likelihood of being enrolled in a private school, with 155 (100.0% in the age bracket) attending a public institution.
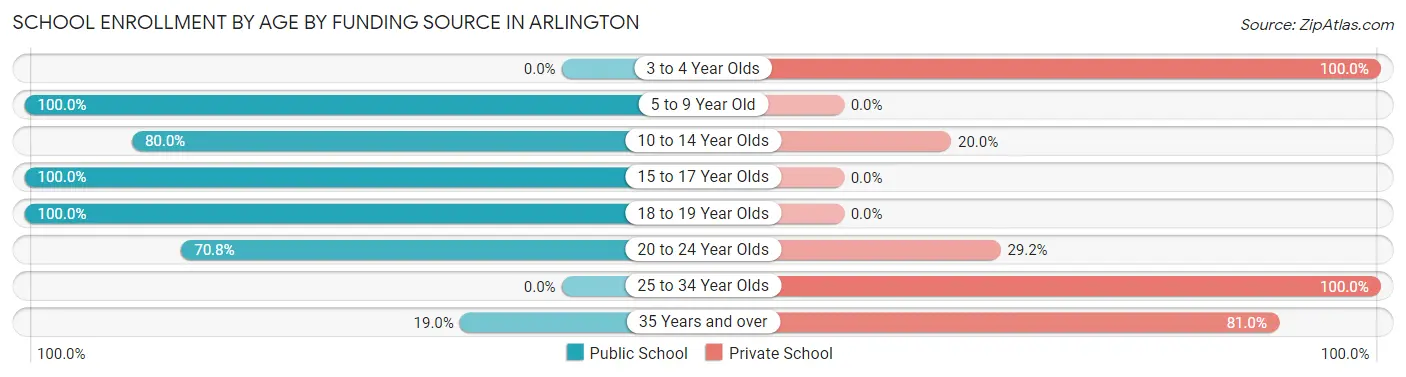
| Age Bracket | Public School | Private School |
| 3 to 4 Year Olds | 0 (0.0%) | 64 (100.0%) |
| 5 to 9 Year Old | 155 (100.0%) | 0 (0.0%) |
| 10 to 14 Year Olds | 36 (80.0%) | 9 (20.0%) |
| 15 to 17 Year Olds | 140 (100.0%) | 0 (0.0%) |
| 18 to 19 Year Olds | 23 (100.0%) | 0 (0.0%) |
| 20 to 24 Year Olds | 97 (70.8%) | 40 (29.2%) |
| 25 to 34 Year Olds | 0 (0.0%) | 9 (100.0%) |
| 35 Years and over | 11 (19.0%) | 47 (81.0%) |
| Total | 462 (73.2%) | 169 (26.8%) |
Educational Attainment by Field of Study in Arlington
Education (96 | 13.5%), computers & mathematics (79 | 11.1%), multidisciplinary studies (77 | 10.8%), arts & humanities (73 | 10.3%), and business (60 | 8.4%) are the most common fields of study among 711 individuals in Arlington who have obtained a bachelor's degree or higher.
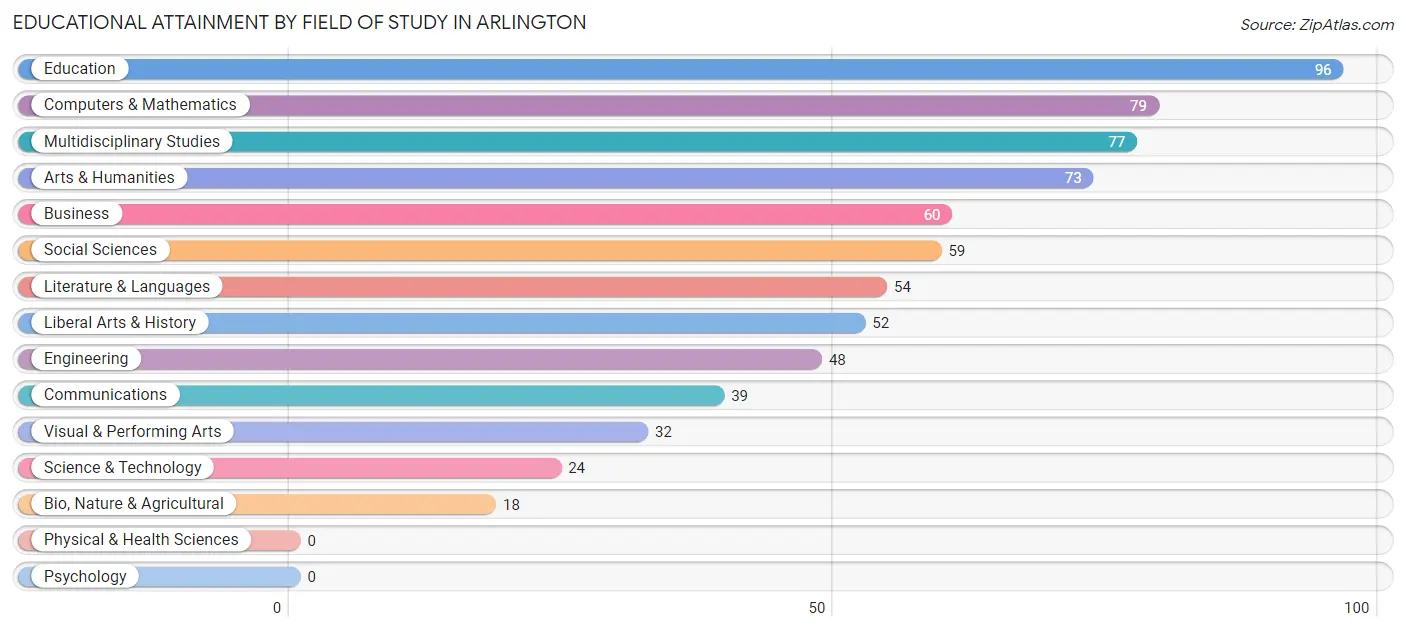
| Field of Study | # Graduates | % Graduates |
| Computers & Mathematics | 79 | 11.1% |
| Bio, Nature & Agricultural | 18 | 2.5% |
| Physical & Health Sciences | 0 | 0.0% |
| Psychology | 0 | 0.0% |
| Social Sciences | 59 | 8.3% |
| Engineering | 48 | 6.8% |
| Multidisciplinary Studies | 77 | 10.8% |
| Science & Technology | 24 | 3.4% |
| Business | 60 | 8.4% |
| Education | 96 | 13.5% |
| Literature & Languages | 54 | 7.6% |
| Liberal Arts & History | 52 | 7.3% |
| Visual & Performing Arts | 32 | 4.5% |
| Communications | 39 | 5.5% |
| Arts & Humanities | 73 | 10.3% |
| Total | 711 | 100.0% |
Transportation & Commute in Arlington
Vehicle Availability by Sex in Arlington
The most prevalent vehicle ownership categories in Arlington are males with 2 vehicles (343, accounting for 48.2%) and females with 2 vehicles (376, making up 60.4%).
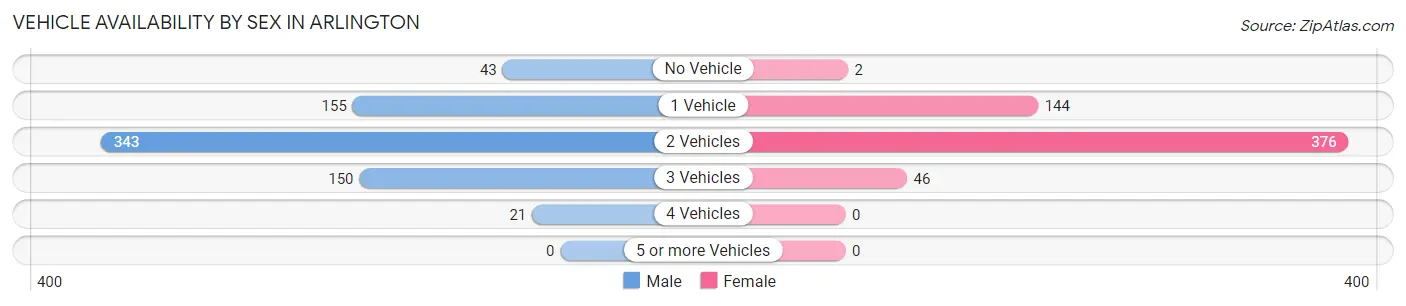
| Vehicles Available | Male | Female |
| No Vehicle | 43 (6.0%) | 2 (0.4%) |
| 1 Vehicle | 155 (21.8%) | 144 (25.4%) |
| 2 Vehicles | 343 (48.2%) | 376 (66.2%) |
| 3 Vehicles | 150 (21.1%) | 46 (8.1%) |
| 4 Vehicles | 21 (2.9%) | 0 (0.0%) |
| 5 or more Vehicles | 0 (0.0%) | 0 (0.0%) |
| Total | 712 (100.0%) | 568 (100.0%) |
Commute Time in Arlington
The most frequently occuring commute durations in Arlington are 10 to 14 minutes (236 commuters, 22.8%), 15 to 19 minutes (213 commuters, 20.6%), and 30 to 34 minutes (198 commuters, 19.2%).
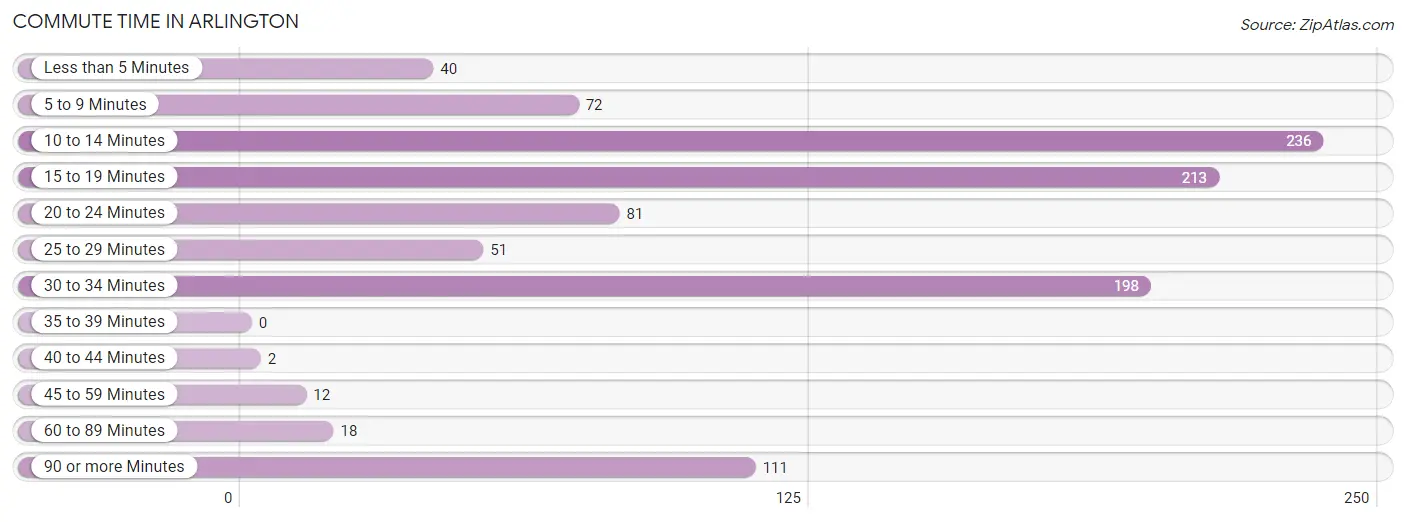
| Commute Time | # Commuters | % Commuters |
| Less than 5 Minutes | 40 | 3.9% |
| 5 to 9 Minutes | 72 | 7.0% |
| 10 to 14 Minutes | 236 | 22.8% |
| 15 to 19 Minutes | 213 | 20.6% |
| 20 to 24 Minutes | 81 | 7.8% |
| 25 to 29 Minutes | 51 | 4.9% |
| 30 to 34 Minutes | 198 | 19.2% |
| 35 to 39 Minutes | 0 | 0.0% |
| 40 to 44 Minutes | 2 | 0.2% |
| 45 to 59 Minutes | 12 | 1.2% |
| 60 to 89 Minutes | 18 | 1.7% |
| 90 or more Minutes | 111 | 10.7% |
Commute Time by Sex in Arlington
The most common commute times in Arlington are 10 to 14 minutes (184 commuters, 32.3%) for males and 15 to 19 minutes (109 commuters, 23.4%) for females.
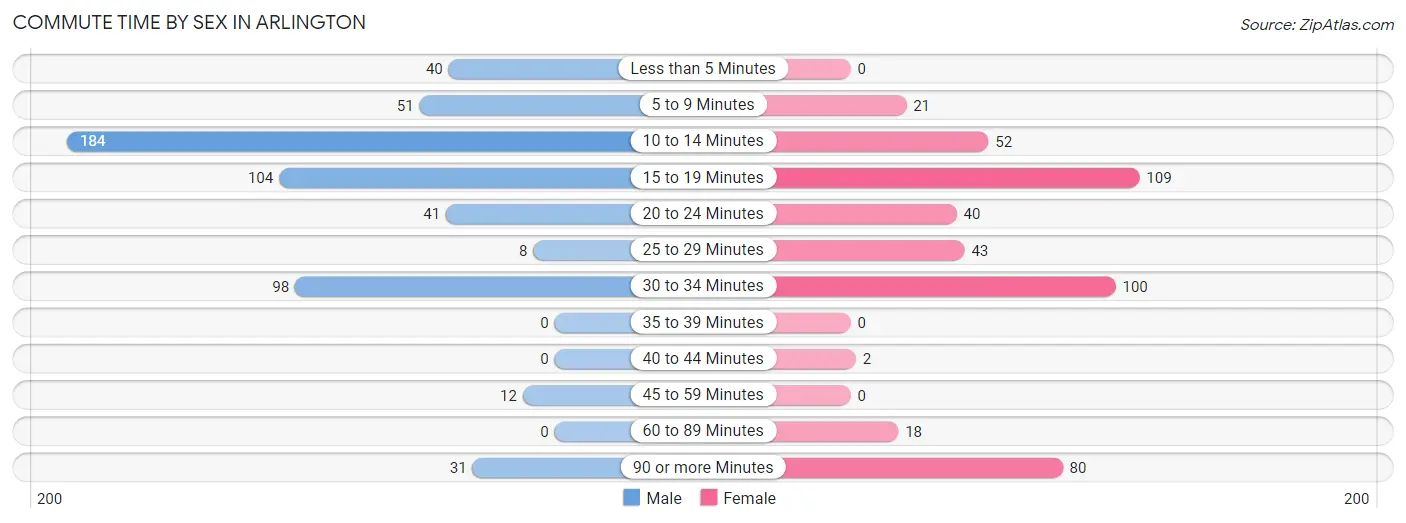
| Commute Time | Male | Female |
| Less than 5 Minutes | 40 (7.0%) | 0 (0.0%) |
| 5 to 9 Minutes | 51 (9.0%) | 21 (4.5%) |
| 10 to 14 Minutes | 184 (32.3%) | 52 (11.2%) |
| 15 to 19 Minutes | 104 (18.3%) | 109 (23.4%) |
| 20 to 24 Minutes | 41 (7.2%) | 40 (8.6%) |
| 25 to 29 Minutes | 8 (1.4%) | 43 (9.2%) |
| 30 to 34 Minutes | 98 (17.2%) | 100 (21.5%) |
| 35 to 39 Minutes | 0 (0.0%) | 0 (0.0%) |
| 40 to 44 Minutes | 0 (0.0%) | 2 (0.4%) |
| 45 to 59 Minutes | 12 (2.1%) | 0 (0.0%) |
| 60 to 89 Minutes | 0 (0.0%) | 18 (3.9%) |
| 90 or more Minutes | 31 (5.4%) | 80 (17.2%) |
Time of Departure to Work by Sex in Arlington
The most frequent times of departure to work in Arlington are 7:00 AM to 7:29 AM (141, 24.8%) for males and 7:00 AM to 7:29 AM (146, 31.4%) for females.
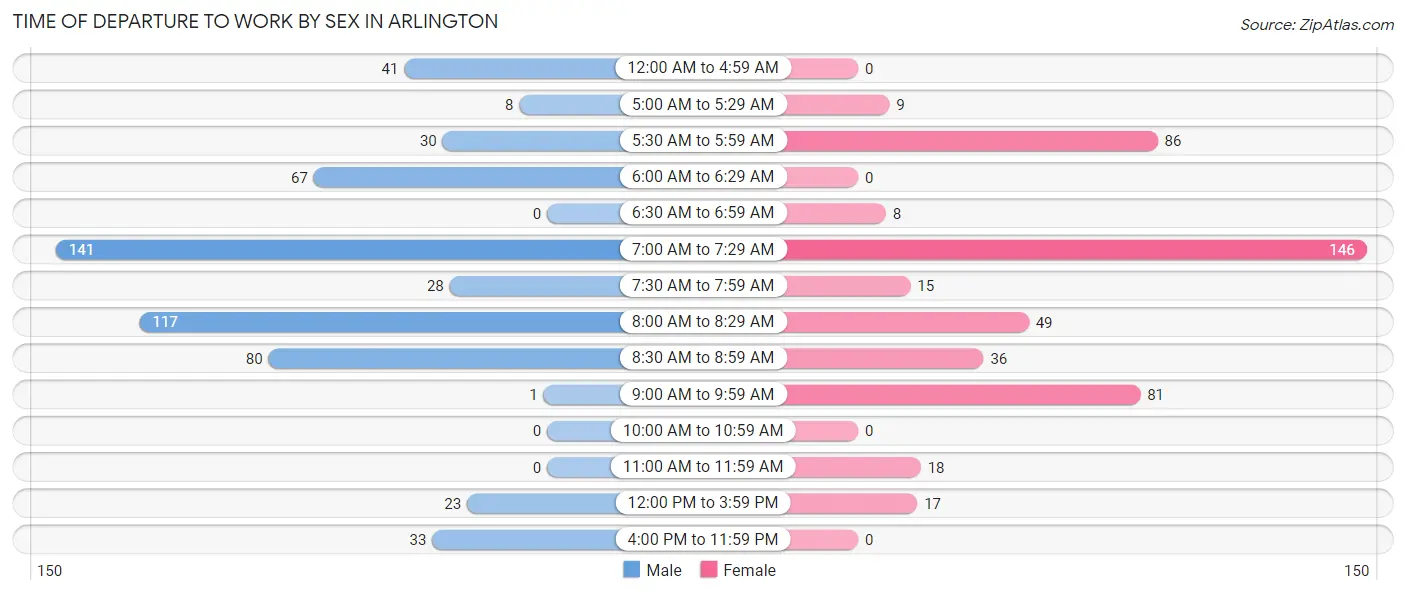
| Time of Departure | Male | Female |
| 12:00 AM to 4:59 AM | 41 (7.2%) | 0 (0.0%) |
| 5:00 AM to 5:29 AM | 8 (1.4%) | 9 (1.9%) |
| 5:30 AM to 5:59 AM | 30 (5.3%) | 86 (18.5%) |
| 6:00 AM to 6:29 AM | 67 (11.8%) | 0 (0.0%) |
| 6:30 AM to 6:59 AM | 0 (0.0%) | 8 (1.7%) |
| 7:00 AM to 7:29 AM | 141 (24.8%) | 146 (31.4%) |
| 7:30 AM to 7:59 AM | 28 (4.9%) | 15 (3.2%) |
| 8:00 AM to 8:29 AM | 117 (20.6%) | 49 (10.5%) |
| 8:30 AM to 8:59 AM | 80 (14.1%) | 36 (7.7%) |
| 9:00 AM to 9:59 AM | 1 (0.2%) | 81 (17.4%) |
| 10:00 AM to 10:59 AM | 0 (0.0%) | 0 (0.0%) |
| 11:00 AM to 11:59 AM | 0 (0.0%) | 18 (3.9%) |
| 12:00 PM to 3:59 PM | 23 (4.0%) | 17 (3.7%) |
| 4:00 PM to 11:59 PM | 33 (5.8%) | 0 (0.0%) |
| Total | 569 (100.0%) | 465 (100.0%) |
Housing Occupancy in Arlington
Occupancy by Ownership in Arlington
Of the total 1,018 dwellings in Arlington, owner-occupied units account for 360 (35.4%), while renter-occupied units make up 658 (64.6%).
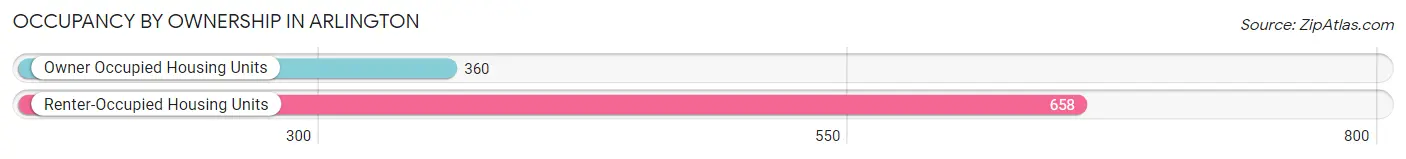
| Occupancy | # Housing Units | % Housing Units |
| Owner Occupied Housing Units | 360 | 35.4% |
| Renter-Occupied Housing Units | 658 | 64.6% |
| Total Occupied Housing Units | 1,018 | 100.0% |
Occupancy by Household Size in Arlington
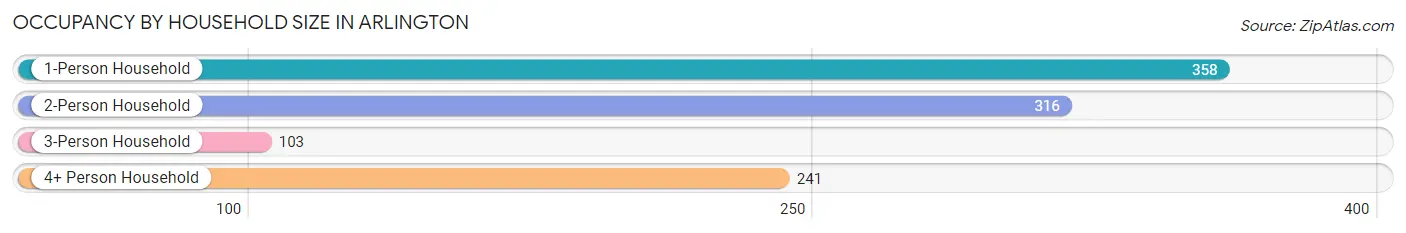
| Household Size | # Housing Units | % Housing Units |
| 1-Person Household | 358 | 35.2% |
| 2-Person Household | 316 | 31.0% |
| 3-Person Household | 103 | 10.1% |
| 4+ Person Household | 241 | 23.7% |
| Total Housing Units | 1,018 | 100.0% |
Occupancy by Ownership by Household Size in Arlington
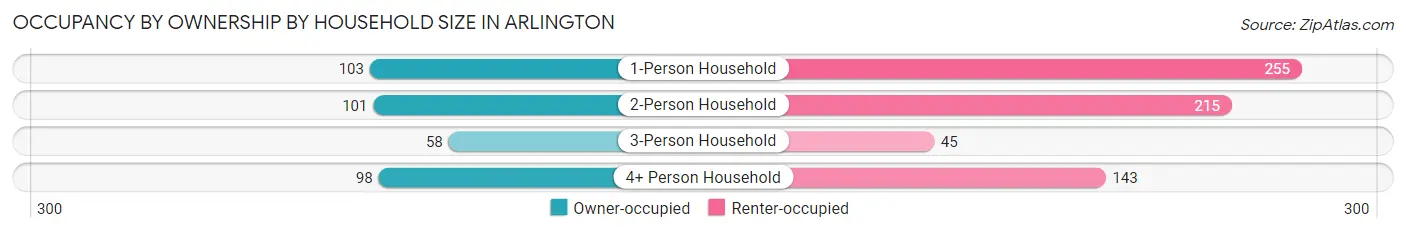
| Household Size | Owner-occupied | Renter-occupied |
| 1-Person Household | 103 (28.8%) | 255 (71.2%) |
| 2-Person Household | 101 (32.0%) | 215 (68.0%) |
| 3-Person Household | 58 (56.3%) | 45 (43.7%) |
| 4+ Person Household | 98 (40.7%) | 143 (59.3%) |
| Total Housing Units | 360 (35.4%) | 658 (64.6%) |
Occupancy by Educational Attainment in Arlington
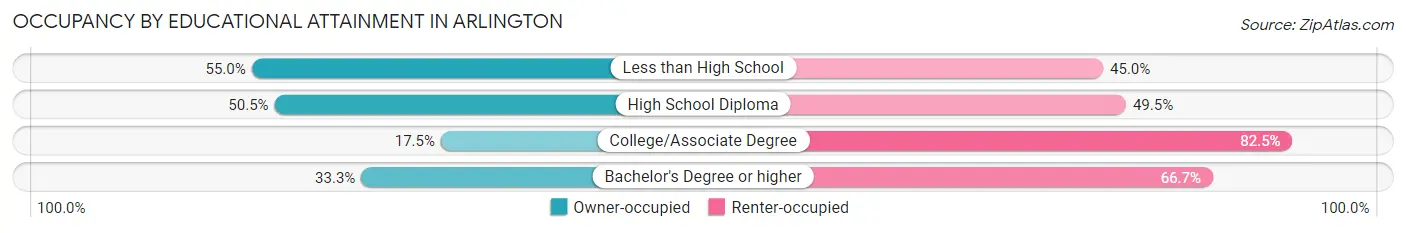
| Household Size | Owner-occupied | Renter-occupied |
| Less than High School | 44 (55.0%) | 36 (45.0%) |
| High School Diploma | 107 (50.5%) | 105 (49.5%) |
| College/Associate Degree | 36 (17.5%) | 170 (82.5%) |
| Bachelor's Degree or higher | 173 (33.3%) | 347 (66.7%) |
Occupancy by Age of Householder in Arlington
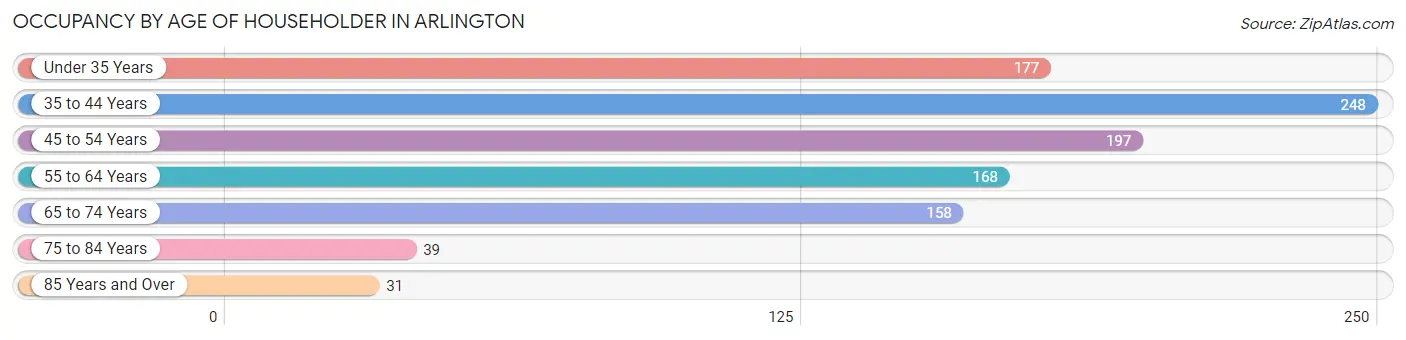
| Age Bracket | # Households | % Households |
| Under 35 Years | 177 | 17.4% |
| 35 to 44 Years | 248 | 24.4% |
| 45 to 54 Years | 197 | 19.4% |
| 55 to 64 Years | 168 | 16.5% |
| 65 to 74 Years | 158 | 15.5% |
| 75 to 84 Years | 39 | 3.8% |
| 85 Years and Over | 31 | 3.0% |
| Total | 1,018 | 100.0% |
Housing Finances in Arlington
Median Income by Occupancy in Arlington
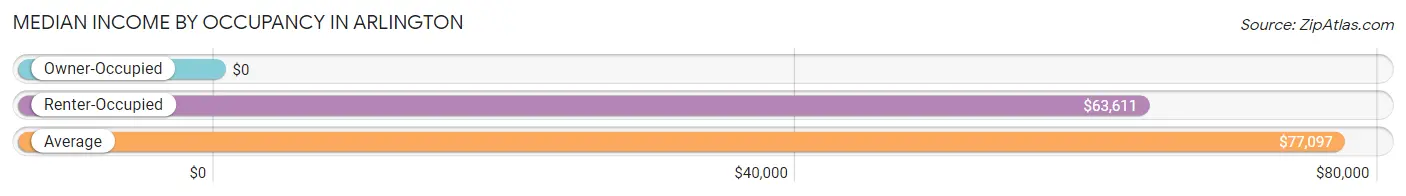
| Occupancy Type | # Households | Median Income |
| Owner-Occupied | 360 (35.4%) | $0 |
| Renter-Occupied | 658 (64.6%) | $63,611 |
| Average | 1,018 (100.0%) | $77,097 |
Occupancy by Householder Income Bracket in Arlington
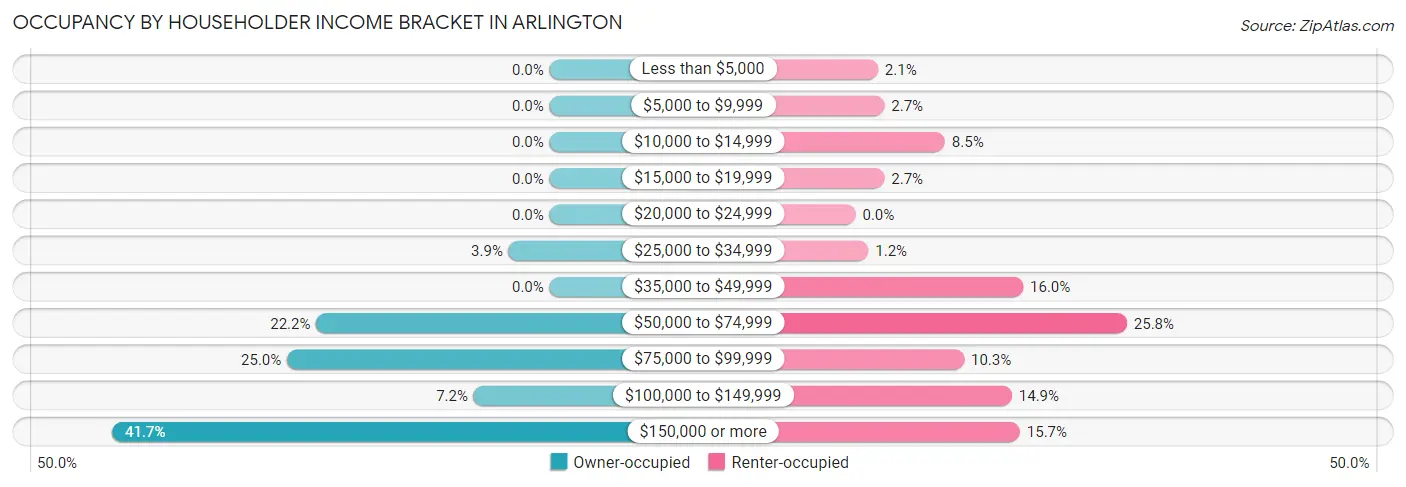
| Income Bracket | Owner-occupied | Renter-occupied |
| Less than $5,000 | 0 (0.0%) | 14 (2.1%) |
| $5,000 to $9,999 | 0 (0.0%) | 18 (2.7%) |
| $10,000 to $14,999 | 0 (0.0%) | 56 (8.5%) |
| $15,000 to $19,999 | 0 (0.0%) | 18 (2.7%) |
| $20,000 to $24,999 | 0 (0.0%) | 0 (0.0%) |
| $25,000 to $34,999 | 14 (3.9%) | 8 (1.2%) |
| $35,000 to $49,999 | 0 (0.0%) | 105 (16.0%) |
| $50,000 to $74,999 | 80 (22.2%) | 170 (25.8%) |
| $75,000 to $99,999 | 90 (25.0%) | 68 (10.3%) |
| $100,000 to $149,999 | 26 (7.2%) | 98 (14.9%) |
| $150,000 or more | 150 (41.7%) | 103 (15.7%) |
| Total | 360 (100.0%) | 658 (100.0%) |
Monthly Housing Cost Tiers in Arlington
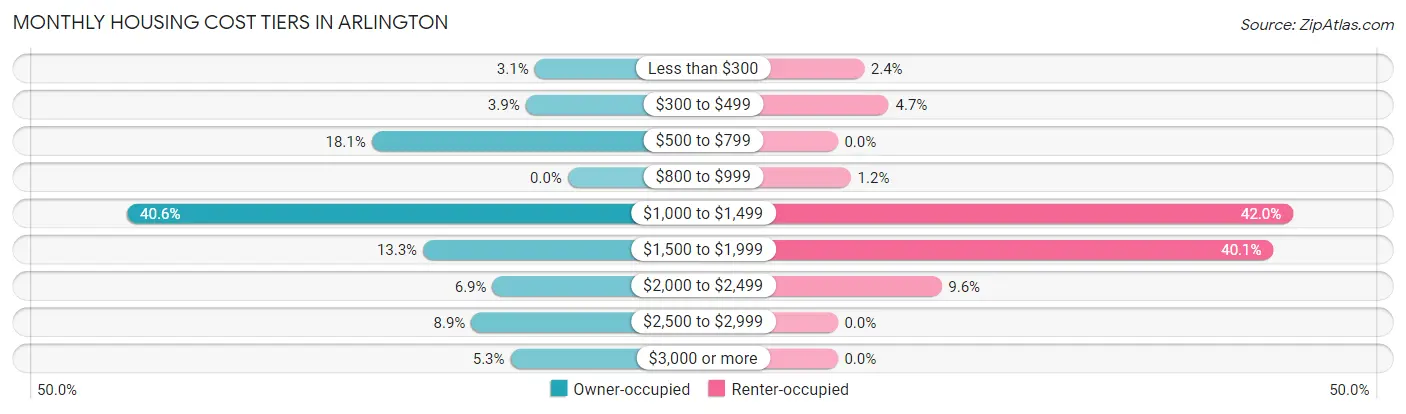
| Monthly Cost | Owner-occupied | Renter-occupied |
| Less than $300 | 11 (3.1%) | 16 (2.4%) |
| $300 to $499 | 14 (3.9%) | 31 (4.7%) |
| $500 to $799 | 65 (18.1%) | 0 (0.0%) |
| $800 to $999 | 0 (0.0%) | 8 (1.2%) |
| $1,000 to $1,499 | 146 (40.6%) | 276 (41.9%) |
| $1,500 to $1,999 | 48 (13.3%) | 264 (40.1%) |
| $2,000 to $2,499 | 25 (6.9%) | 63 (9.6%) |
| $2,500 to $2,999 | 32 (8.9%) | 0 (0.0%) |
| $3,000 or more | 19 (5.3%) | 0 (0.0%) |
| Total | 360 (100.0%) | 658 (100.0%) |
Physical Housing Characteristics in Arlington
Housing Structures in Arlington
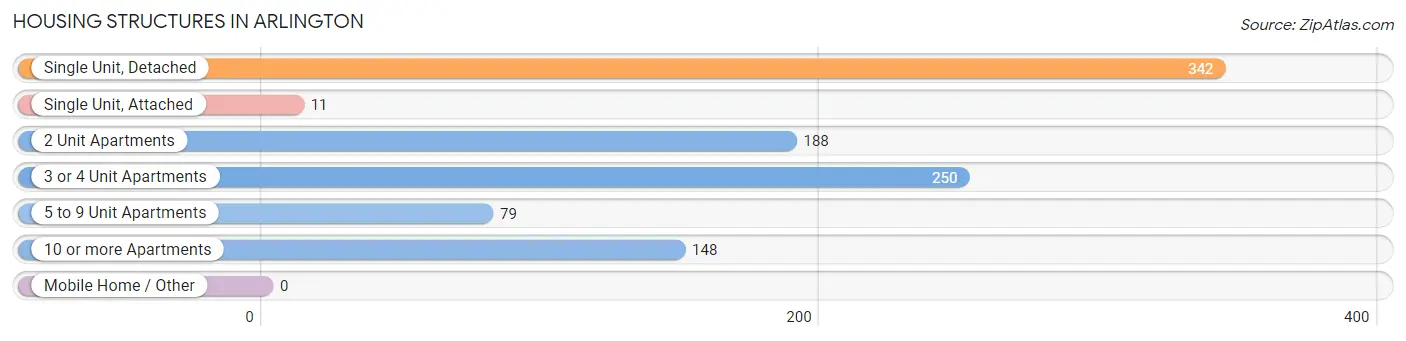
| Structure Type | # Housing Units | % Housing Units |
| Single Unit, Detached | 342 | 33.6% |
| Single Unit, Attached | 11 | 1.1% |
| 2 Unit Apartments | 188 | 18.5% |
| 3 or 4 Unit Apartments | 250 | 24.6% |
| 5 to 9 Unit Apartments | 79 | 7.8% |
| 10 or more Apartments | 148 | 14.5% |
| Mobile Home / Other | 0 | 0.0% |
| Total | 1,018 | 100.0% |
Housing Structures by Occupancy in Arlington
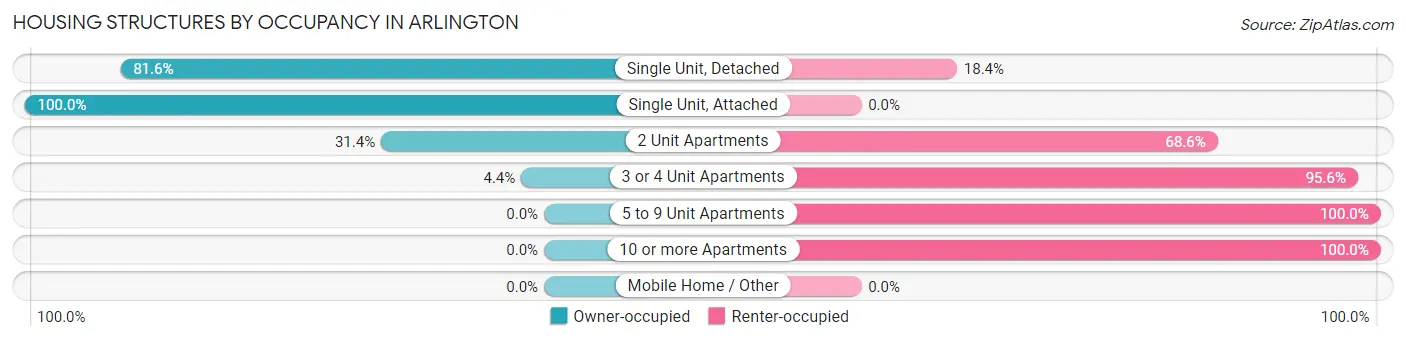
| Structure Type | Owner-occupied | Renter-occupied |
| Single Unit, Detached | 279 (81.6%) | 63 (18.4%) |
| Single Unit, Attached | 11 (100.0%) | 0 (0.0%) |
| 2 Unit Apartments | 59 (31.4%) | 129 (68.6%) |
| 3 or 4 Unit Apartments | 11 (4.4%) | 239 (95.6%) |
| 5 to 9 Unit Apartments | 0 (0.0%) | 79 (100.0%) |
| 10 or more Apartments | 0 (0.0%) | 148 (100.0%) |
| Mobile Home / Other | 0 (0.0%) | 0 (0.0%) |
| Total | 360 (35.4%) | 658 (64.6%) |
Housing Structures by Number of Rooms in Arlington
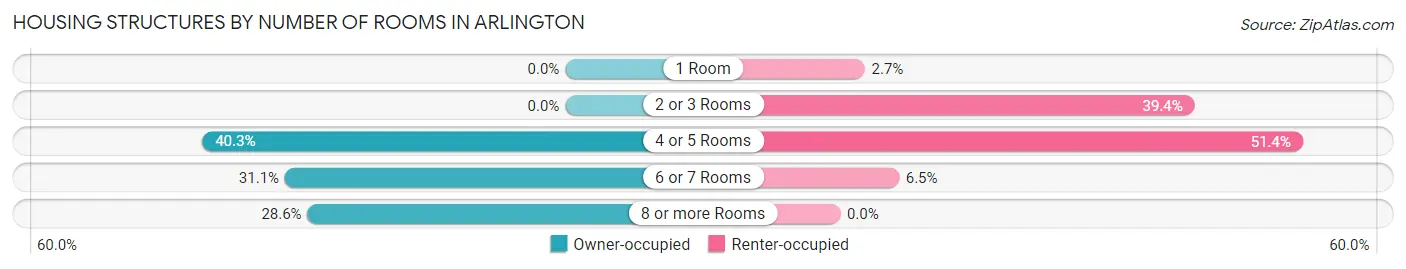
| Number of Rooms | Owner-occupied | Renter-occupied |
| 1 Room | 0 (0.0%) | 18 (2.7%) |
| 2 or 3 Rooms | 0 (0.0%) | 259 (39.4%) |
| 4 or 5 Rooms | 145 (40.3%) | 338 (51.4%) |
| 6 or 7 Rooms | 112 (31.1%) | 43 (6.5%) |
| 8 or more Rooms | 103 (28.6%) | 0 (0.0%) |
| Total | 360 (100.0%) | 658 (100.0%) |
Housing Structure by Heating Type in Arlington
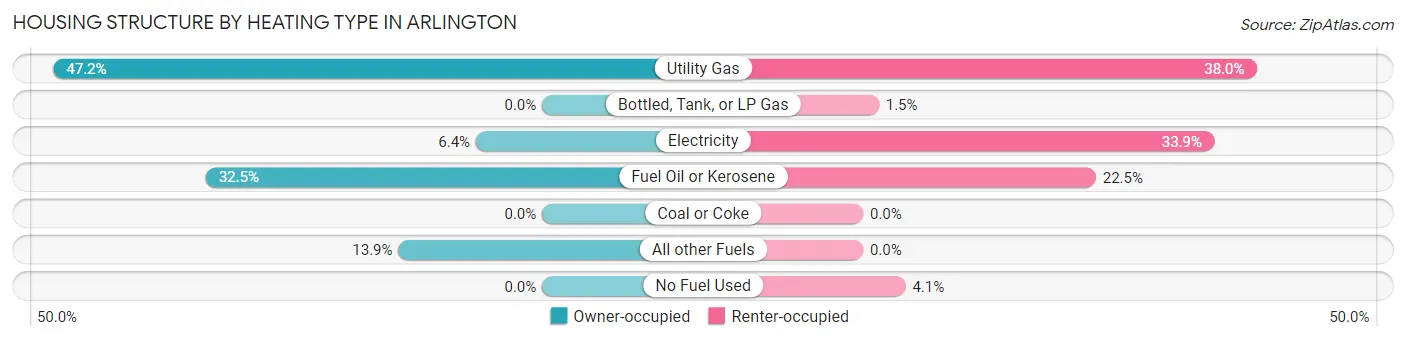
| Heating Type | Owner-occupied | Renter-occupied |
| Utility Gas | 170 (47.2%) | 250 (38.0%) |
| Bottled, Tank, or LP Gas | 0 (0.0%) | 10 (1.5%) |
| Electricity | 23 (6.4%) | 223 (33.9%) |
| Fuel Oil or Kerosene | 117 (32.5%) | 148 (22.5%) |
| Coal or Coke | 0 (0.0%) | 0 (0.0%) |
| All other Fuels | 50 (13.9%) | 0 (0.0%) |
| No Fuel Used | 0 (0.0%) | 27 (4.1%) |
| Total | 360 (100.0%) | 658 (100.0%) |
Household Vehicle Usage in Arlington
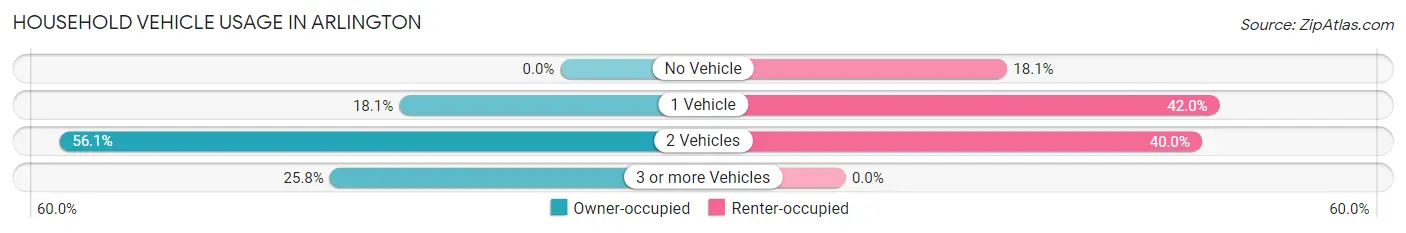
| Vehicles per Household | Owner-occupied | Renter-occupied |
| No Vehicle | 0 (0.0%) | 119 (18.1%) |
| 1 Vehicle | 65 (18.1%) | 276 (41.9%) |
| 2 Vehicles | 202 (56.1%) | 263 (40.0%) |
| 3 or more Vehicles | 93 (25.8%) | 0 (0.0%) |
| Total | 360 (100.0%) | 658 (100.0%) |
Real Estate & Mortgages in Arlington
Real Estate and Mortgage Overview in Arlington
| Characteristic | Without Mortgage | With Mortgage |
| Housing Units | 143 | 217 |
| Median Property Value | $192,100 | $274,500 |
| Median Household Income | $78,469 | $107 |
| Monthly Housing Costs | $758 | $19 |
| Real Estate Taxes | $6,023 | $0 |
Property Value by Mortgage Status in Arlington
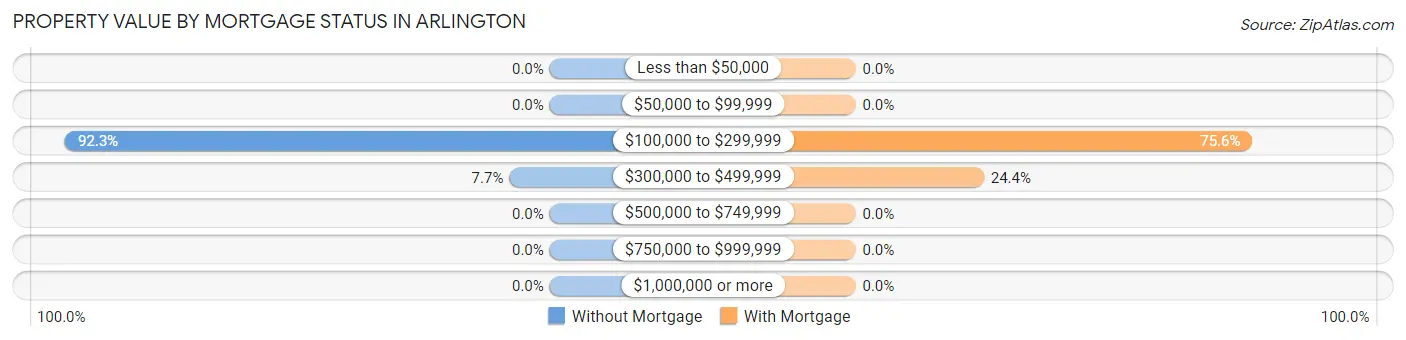
| Property Value | Without Mortgage | With Mortgage |
| Less than $50,000 | 0 (0.0%) | 0 (0.0%) |
| $50,000 to $99,999 | 0 (0.0%) | 0 (0.0%) |
| $100,000 to $299,999 | 132 (92.3%) | 164 (75.6%) |
| $300,000 to $499,999 | 11 (7.7%) | 53 (24.4%) |
| $500,000 to $749,999 | 0 (0.0%) | 0 (0.0%) |
| $750,000 to $999,999 | 0 (0.0%) | 0 (0.0%) |
| $1,000,000 or more | 0 (0.0%) | 0 (0.0%) |
| Total | 143 (100.0%) | 217 (100.0%) |
Household Income by Mortgage Status in Arlington
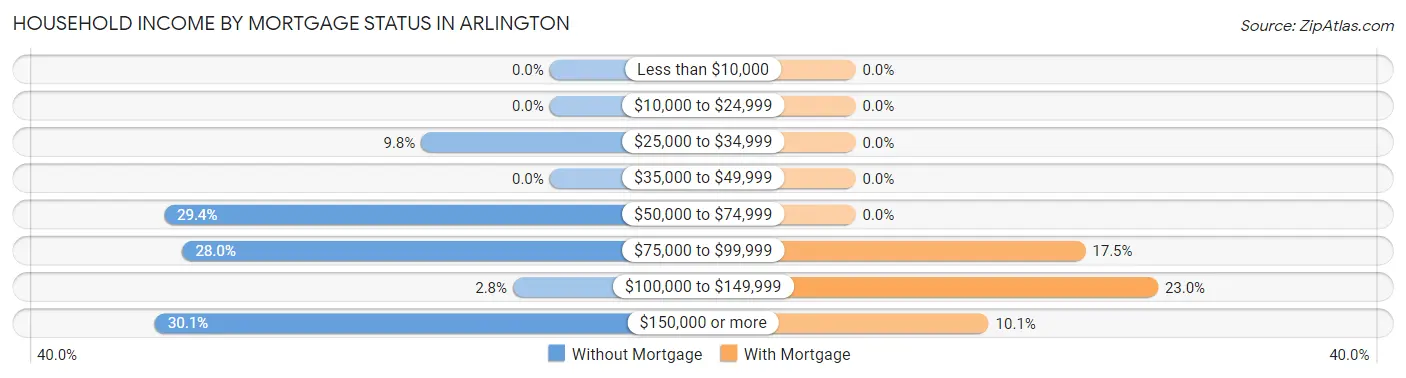
| Household Income | Without Mortgage | With Mortgage |
| Less than $10,000 | 0 (0.0%) | 0 (0.0%) |
| $10,000 to $24,999 | 0 (0.0%) | 0 (0.0%) |
| $25,000 to $34,999 | 14 (9.8%) | 0 (0.0%) |
| $35,000 to $49,999 | 0 (0.0%) | 0 (0.0%) |
| $50,000 to $74,999 | 42 (29.4%) | 0 (0.0%) |
| $75,000 to $99,999 | 40 (28.0%) | 38 (17.5%) |
| $100,000 to $149,999 | 4 (2.8%) | 50 (23.0%) |
| $150,000 or more | 43 (30.1%) | 22 (10.1%) |
| Total | 143 (100.0%) | 217 (100.0%) |
Property Value to Household Income Ratio in Arlington
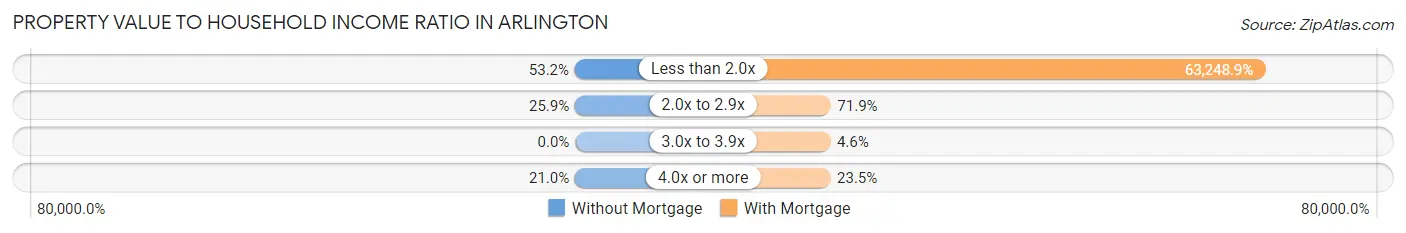
| Value-to-Income Ratio | Without Mortgage | With Mortgage |
| Less than 2.0x | 76 (53.1%) | 137,250 (63,248.9%) |
| 2.0x to 2.9x | 37 (25.9%) | 156 (71.9%) |
| 3.0x to 3.9x | 0 (0.0%) | 10 (4.6%) |
| 4.0x or more | 30 (21.0%) | 51 (23.5%) |
| Total | 143 (100.0%) | 217 (100.0%) |
Real Estate Taxes by Mortgage Status in Arlington
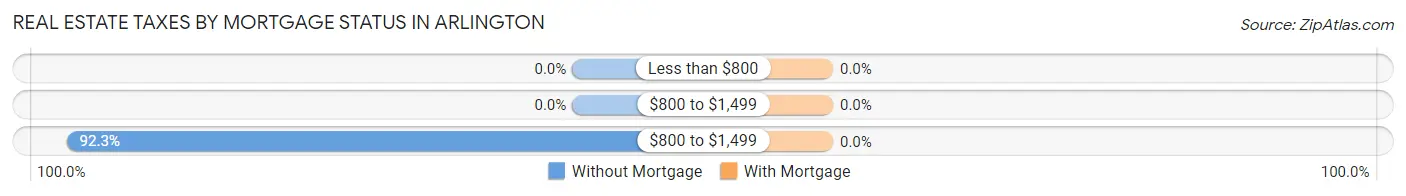
| Property Taxes | Without Mortgage | With Mortgage |
| Less than $800 | 0 (0.0%) | 0 (0.0%) |
| $800 to $1,499 | 0 (0.0%) | 0 (0.0%) |
| $800 to $1,499 | 132 (92.3%) | 0 (0.0%) |
| Total | 143 (100.0%) | 217 (100.0%) |
Health & Disability in Arlington
Health Insurance Coverage by Age in Arlington
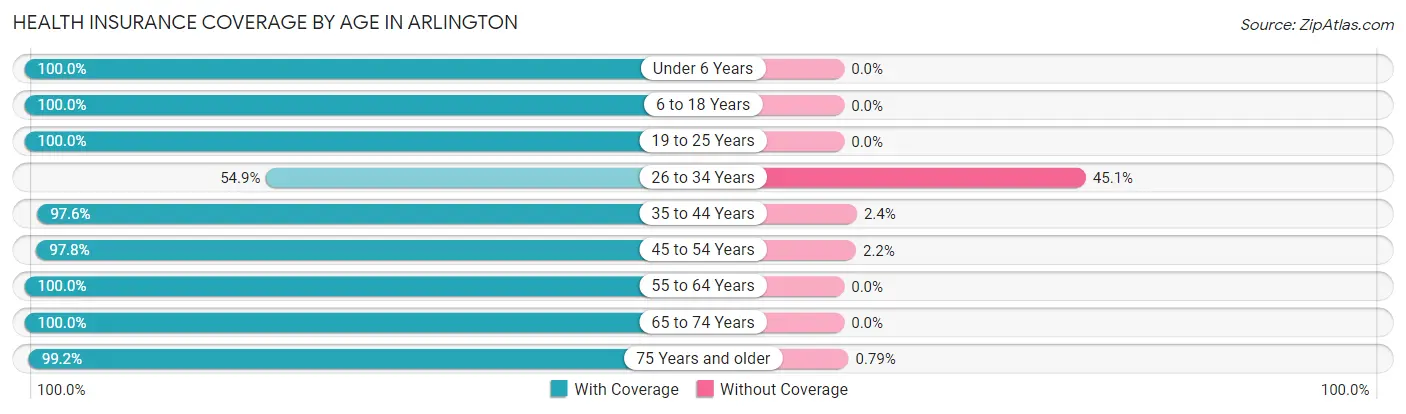
| Age Bracket | With Coverage | Without Coverage |
| Under 6 Years | 106 (100.0%) | 0 (0.0%) |
| 6 to 18 Years | 361 (100.0%) | 0 (0.0%) |
| 19 to 25 Years | 335 (100.0%) | 0 (0.0%) |
| 26 to 34 Years | 128 (54.9%) | 105 (45.1%) |
| 35 to 44 Years | 372 (97.6%) | 9 (2.4%) |
| 45 to 54 Years | 357 (97.8%) | 8 (2.2%) |
| 55 to 64 Years | 263 (100.0%) | 0 (0.0%) |
| 65 to 74 Years | 234 (100.0%) | 0 (0.0%) |
| 75 Years and older | 126 (99.2%) | 1 (0.8%) |
| Total | 2,282 (94.9%) | 123 (5.1%) |
Health Insurance Coverage by Citizenship Status in Arlington
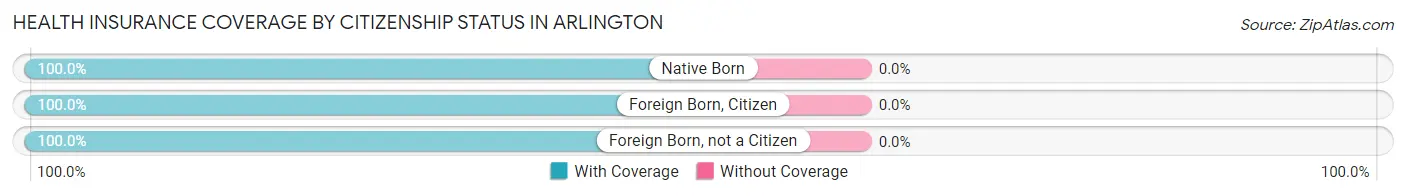
| Citizenship Status | With Coverage | Without Coverage |
| Native Born | 106 (100.0%) | 0 (0.0%) |
| Foreign Born, Citizen | 361 (100.0%) | 0 (0.0%) |
| Foreign Born, not a Citizen | 335 (100.0%) | 0 (0.0%) |
Health Insurance Coverage by Household Income in Arlington
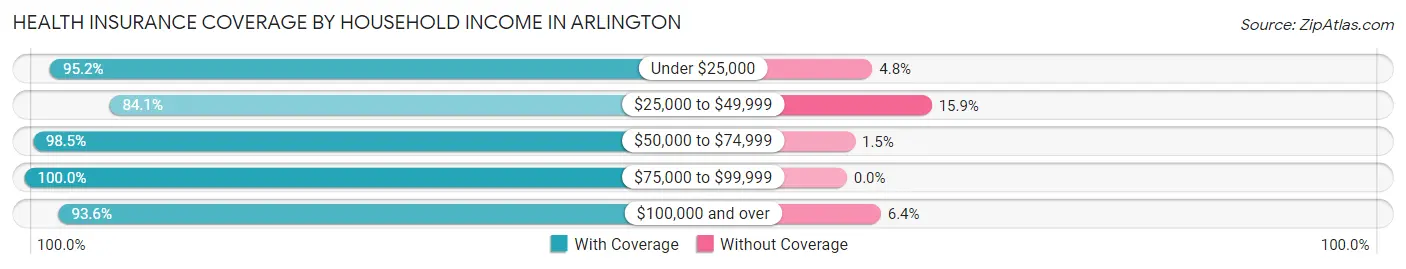
| Household Income | With Coverage | Without Coverage |
| Under $25,000 | 159 (95.2%) | 8 (4.8%) |
| $25,000 to $49,999 | 148 (84.1%) | 28 (15.9%) |
| $50,000 to $74,999 | 510 (98.5%) | 8 (1.5%) |
| $75,000 to $99,999 | 328 (100.0%) | 0 (0.0%) |
| $100,000 and over | 1,131 (93.6%) | 77 (6.4%) |
Public vs Private Health Insurance Coverage by Age in Arlington
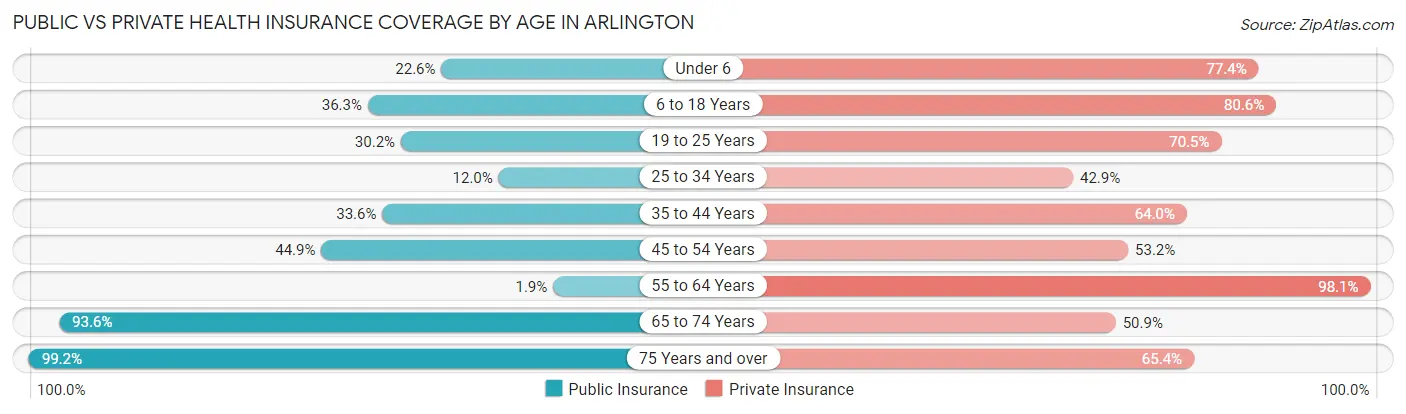
| Age Bracket | Public Insurance | Private Insurance |
| Under 6 | 24 (22.6%) | 82 (77.4%) |
| 6 to 18 Years | 131 (36.3%) | 291 (80.6%) |
| 19 to 25 Years | 101 (30.1%) | 236 (70.5%) |
| 25 to 34 Years | 28 (12.0%) | 100 (42.9%) |
| 35 to 44 Years | 128 (33.6%) | 244 (64.0%) |
| 45 to 54 Years | 164 (44.9%) | 194 (53.1%) |
| 55 to 64 Years | 5 (1.9%) | 258 (98.1%) |
| 65 to 74 Years | 219 (93.6%) | 119 (50.8%) |
| 75 Years and over | 126 (99.2%) | 83 (65.3%) |
| Total | 926 (38.5%) | 1,607 (66.8%) |
Disability Status by Sex by Age in Arlington
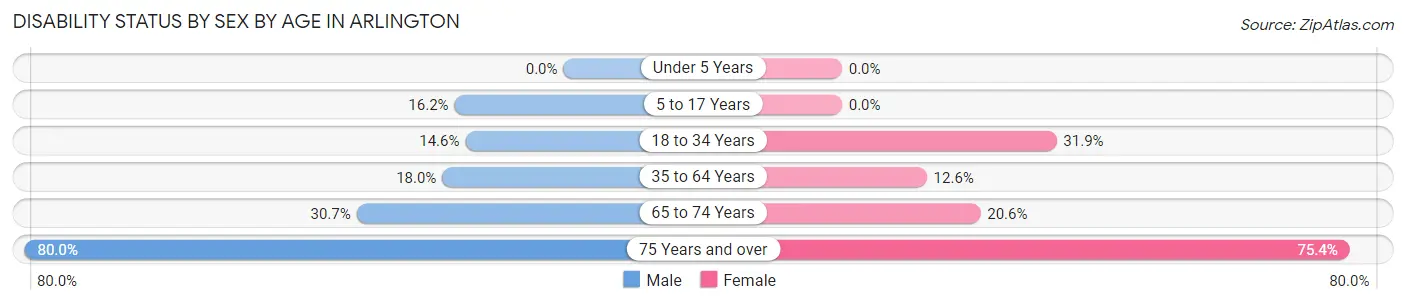
| Age Bracket | Male | Female |
| Under 5 Years | 0 (0.0%) | 0 (0.0%) |
| 5 to 17 Years | 39 (16.2%) | 0 (0.0%) |
| 18 to 34 Years | 46 (14.6%) | 87 (31.9%) |
| 35 to 64 Years | 93 (18.0%) | 62 (12.6%) |
| 65 to 74 Years | 39 (30.7%) | 22 (20.6%) |
| 75 Years and over | 4 (80.0%) | 92 (75.4%) |
Disability Class by Sex by Age in Arlington
Disability Class: Hearing Difficulty
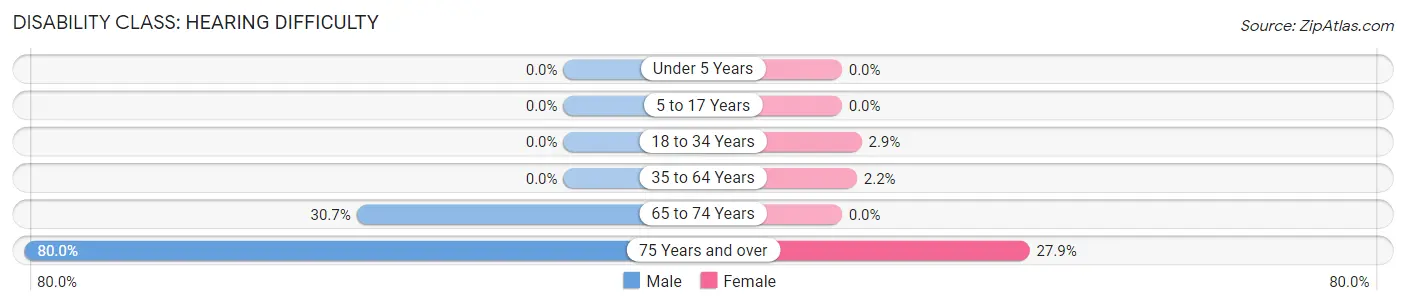
| Age Bracket | Male | Female |
| Under 5 Years | 0 (0.0%) | 0 (0.0%) |
| 5 to 17 Years | 0 (0.0%) | 0 (0.0%) |
| 18 to 34 Years | 0 (0.0%) | 8 (2.9%) |
| 35 to 64 Years | 0 (0.0%) | 11 (2.2%) |
| 65 to 74 Years | 39 (30.7%) | 0 (0.0%) |
| 75 Years and over | 4 (80.0%) | 34 (27.9%) |
Disability Class: Vision Difficulty
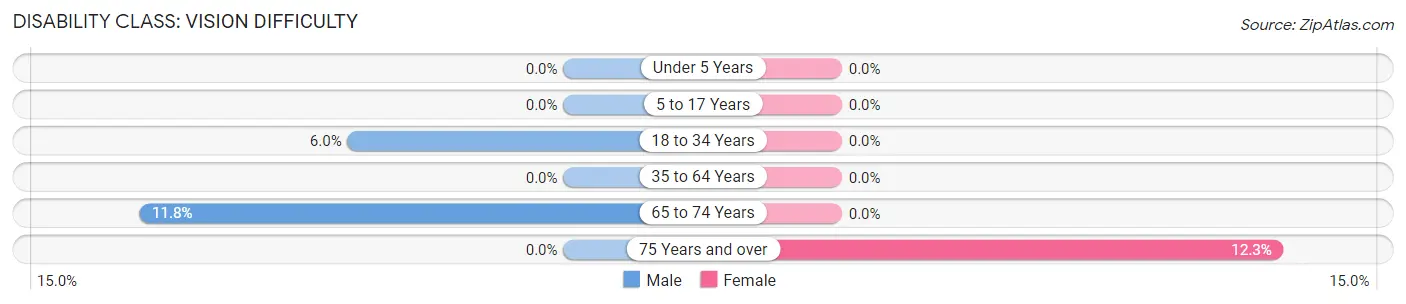
| Age Bracket | Male | Female |
| Under 5 Years | 0 (0.0%) | 0 (0.0%) |
| 5 to 17 Years | 0 (0.0%) | 0 (0.0%) |
| 18 to 34 Years | 19 (6.0%) | 0 (0.0%) |
| 35 to 64 Years | 0 (0.0%) | 0 (0.0%) |
| 65 to 74 Years | 15 (11.8%) | 0 (0.0%) |
| 75 Years and over | 0 (0.0%) | 15 (12.3%) |
Disability Class: Cognitive Difficulty
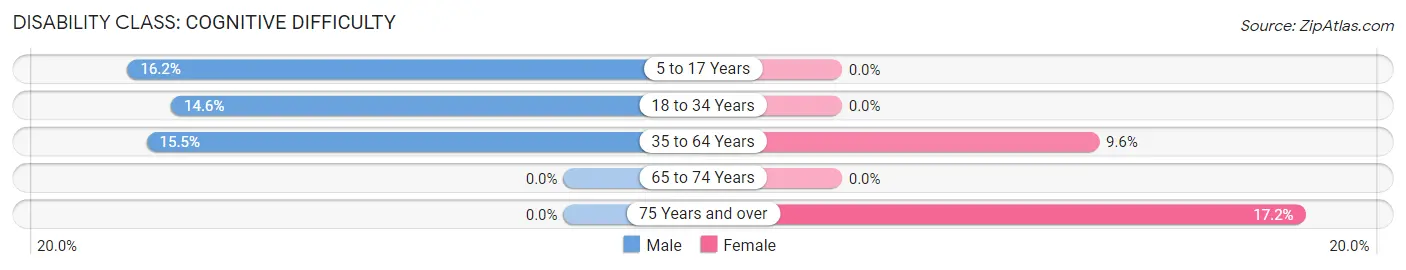
| Age Bracket | Male | Female |
| 5 to 17 Years | 39 (16.2%) | 0 (0.0%) |
| 18 to 34 Years | 46 (14.6%) | 0 (0.0%) |
| 35 to 64 Years | 80 (15.5%) | 47 (9.6%) |
| 65 to 74 Years | 0 (0.0%) | 0 (0.0%) |
| 75 Years and over | 0 (0.0%) | 21 (17.2%) |
Disability Class: Ambulatory Difficulty
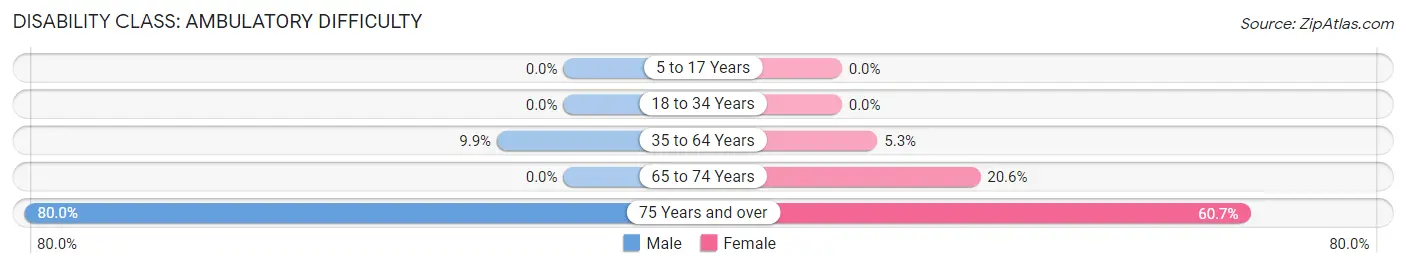
| Age Bracket | Male | Female |
| 5 to 17 Years | 0 (0.0%) | 0 (0.0%) |
| 18 to 34 Years | 0 (0.0%) | 0 (0.0%) |
| 35 to 64 Years | 51 (9.9%) | 26 (5.3%) |
| 65 to 74 Years | 0 (0.0%) | 22 (20.6%) |
| 75 Years and over | 4 (80.0%) | 74 (60.7%) |
Disability Class: Self-Care Difficulty
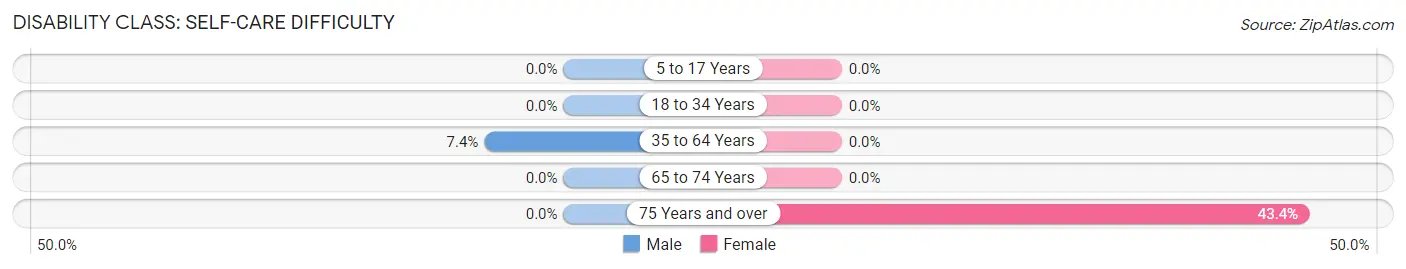
| Age Bracket | Male | Female |
| 5 to 17 Years | 0 (0.0%) | 0 (0.0%) |
| 18 to 34 Years | 0 (0.0%) | 0 (0.0%) |
| 35 to 64 Years | 38 (7.3%) | 0 (0.0%) |
| 65 to 74 Years | 0 (0.0%) | 0 (0.0%) |
| 75 Years and over | 0 (0.0%) | 53 (43.4%) |
Technology Access in Arlington
Computing Device Access in Arlington
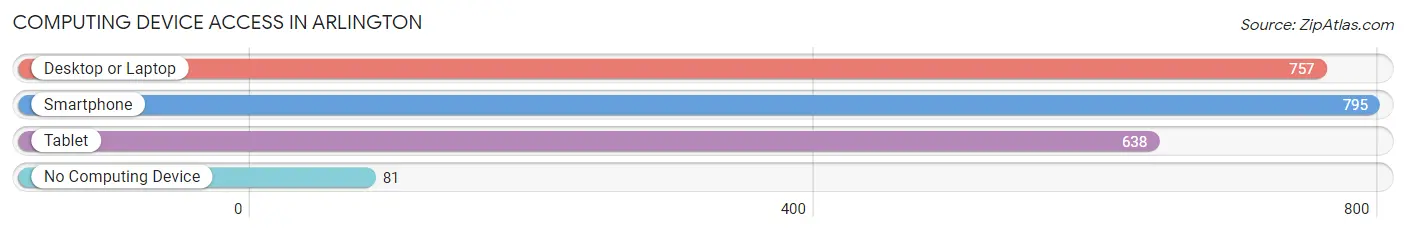
| Device Type | # Households | % Households |
| Desktop or Laptop | 757 | 74.4% |
| Smartphone | 795 | 78.1% |
| Tablet | 638 | 62.7% |
| No Computing Device | 81 | 8.0% |
| Total | 1,018 | 100.0% |
Internet Access in Arlington
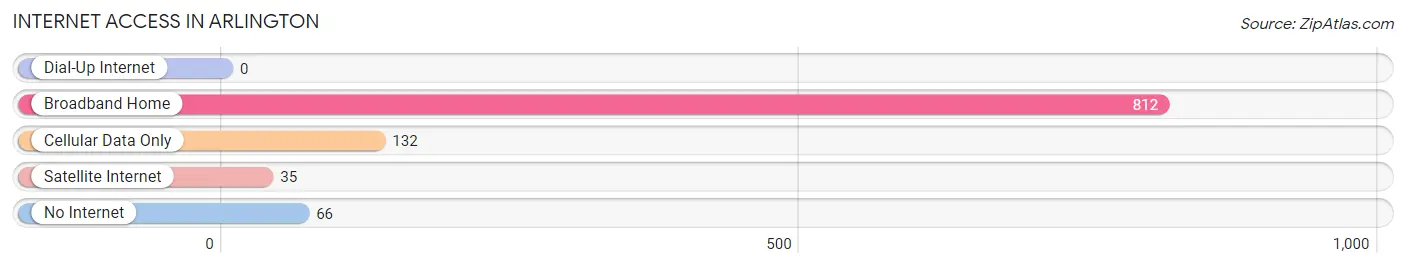
| Internet Type | # Households | % Households |
| Dial-Up Internet | 0 | 0.0% |
| Broadband Home | 812 | 79.8% |
| Cellular Data Only | 132 | 13.0% |
| Satellite Internet | 35 | 3.4% |
| No Internet | 66 | 6.5% |
| Total | 1,018 | 100.0% |
Arlington Summary
Arlington is a town located in Dutchess County, New York, United States. The population was 11,304 at the 2010 census. It is part of the Poughkeepsie–Newburgh–Middletown, NY Metropolitan Statistical Area as well as the larger New York–Newark–Bridgeport, NY-NJ-CT-PA Combined Statistical Area.
Geography
Arlington is located in the southeastern part of Dutchess County, bordered by the towns of LaGrange to the north, Poughkeepsie to the east, and the towns of Hyde Park and Pleasant Valley to the south. To the west is the Hudson River, across which are the towns of Lloyd and Esopus in Ulster County.
According to the United States Census Bureau, the town has a total area of 33.2sqmi, of which 32.7sqmi is land and 0.5sqmi, or 1.45%, is water.
History
The town of Arlington was established in 1788 from the town of Poughkeepsie. It was named after Henry Bennet, 1st Earl of Arlington, a member of the British cabinet during the reign of Charles II.
The town was originally part of the Schuyler Patent of 1788, which was granted to Philip Schuyler, a general in the American Revolution. The town was divided into two parts, the northern part being called the "Upper District" and the southern part being called the "Lower District".
The town was further divided in 1806, when the town of Poughkeepsie was re-established. The northern part of Arlington became the town of Poughkeepsie, while the southern part remained as the town of Arlington.
Economy
The economy of Arlington is largely based on agriculture and tourism. The town is home to several farms, including the historic Van Wyck Homestead, which is listed on the National Register of Historic Places.
The town is also home to several wineries, including Millbrook Vineyards & Winery, which produces award-winning wines.
The town is also home to several historic sites, including the Old Dutch Church of Sleepy Hollow, the Van Wyck Homestead, and the Old Dutch Burying Ground. These sites attract visitors from all over the world, and contribute to the town's economy.
Demographics
As of the census of 2000, there were 11,304 people, 4,072 households, and 3,039 families residing in the town. The population density was 345.2 people per square mile (133.2/km^2). There were 4,213 housing units at an average density of 128.7 per square mile (49.7/km^2). The racial makeup of the town was 92.90% White, 2.90% African American, 0.17% Native American, 1.45% Asian, 0.02% Pacific Islander, 1.45% from other races, and 1.11% from two or more races. Hispanic or Latino of any race were 4.45% of the population.
There were 4,072 households, out of which 37.2% had children under the age of 18 living with them, 62.2% were married couples living together, 8.7% had a female householder with no husband present, and 25.2% were non-families. 20.2% of all households were made up of individuals, and 7.2% had someone living alone who was 65 years of age or older. The average household size was 2.76 and the average family size was 3.20.
In the town, the population was spread out, with 27.2% under the age of 18, 5.7% from 18 to 24, 30.2% from 25 to 44, 25.2% from 45 to 64, and 11.7% who were 65 years of age or older. The median age was 38 years. For every 100 females, there were 95.2 males. For every 100 females age 18 and over, there were 91.7 males.
The median income for a household in the town was $62,813, and the median income for a family was $71,917. Males had a median income of $50,917 versus $35,917 for females. The per capita income for the town was $27,945. About 2.7% of families and 4.2% of the population were below the poverty line, including 4.2% of those under age 18 and 4.3% of those age 65 or over.
Common Questions
What is Per Capita Income in Arlington?
Per Capita income in Arlington is $51,044.
What is the Median Family Income in Arlington?
Median Family Income in Arlington is $105,121.
What is the Median Household income in Arlington?
Median Household Income in Arlington is $77,097.
What is Income or Wage Gap in Arlington?
Income or Wage Gap in Arlington is 54.5%.
Women in Arlington earn 45.5 cents for every dollar earned by a man.
What is Inequality or Gini Index in Arlington?
Inequality or Gini Index in Arlington is 0.47.
What is the Total Population of Arlington?
Total Population of Arlington is 2,405.
What is the Total Male Population of Arlington?
Total Male Population of Arlington is 1,288.
What is the Total Female Population of Arlington?
Total Female Population of Arlington is 1,117.
What is the Ratio of Males per 100 Females in Arlington?
There are 115.31 Males per 100 Females in Arlington.
What is the Ratio of Females per 100 Males in Arlington?
There are 86.72 Females per 100 Males in Arlington.
What is the Median Population Age in Arlington?
Median Population Age in Arlington is 41.3 Years.
What is the Average Family Size in Arlington
Average Family Size in Arlington is 3.2 People.
What is the Average Household Size in Arlington
Average Household Size in Arlington is 2.4 People.
How Large is the Labor Force in Arlington?
There are 1,455 People in the Labor Forcein in Arlington.
What is the Percentage of People in the Labor Force in Arlington?
71.8% of People are in the Labor Force in Arlington.
What is the Unemployment Rate in Arlington?
Unemployment Rate in Arlington is 7.6%.