Zip Codes with the Highest Percentage of Population Employed in Computer & Mathematics in New York, NY

RELATED REPORTS & OPTIONS

Computer & Mathematics
Population
Families and Households
Female Fertility
Female Fertility (Unmarried)
Race (Community Size)
Race (Percentage)
Ancestry (Community Size)
AfghanAfricanAlbanianAlsatianAmericanApacheArabArgentineanArmenianAssyrian / Chaldean / SyriacAustralianAustrianBahamianBarbadianBasqueBelgianBelizeanBermudanBhutaneseBlackfeetBolivianBrazilianBritishBritish West IndianBulgarianBurmeseCajunCambodianCanadianCape VerdeanCarpatho RusynCelticCentral AmericanCentral American IndianCherokeeChickasawChileanChippewaChoctawColombianCosta RicanCreekCroatianCubanCypriotCzechCzechoslovakianDanishDelawareDominicanDutchDutch West IndianEastern EuropeanEcuadorianEgyptianEnglishEstonianEthiopianEuropeanFilipinoFinnishFrenchFrench American IndianFrench CanadianGermanGhanaianGreekGuamanian / ChamorroGuatemalanGuyaneseHaitianHmongHonduranHungarianIcelanderIndian (Asian)IndonesianIranianIraqiIrishIroquoisIsraeliItalianJamaicanJapaneseJordanianKenyanKoreanLaotianLatvianLebaneseLiberianLithuanianLuxembourgerMacedonianMalaysianMalteseMexicanMexican American IndianMongolianMoroccanNative HawaiianNew ZealanderNicaraguanNigerianNorthern EuropeanNorwegianOkinawanPakistaniPalestinianPanamanianParaguayanPennsylvania GermanPeruvianPolishPortuguesePuebloPuerto RicanRomanianRussianSalvadoranSamoanScandinavianScotch-IrishScottishSenegaleseSerbianSierra LeoneanSiouxSlavicSlovakSloveneSomaliSouth AfricanSouth AmericanSouth American IndianSoviet UnionSpaniardSpanishSpanish AmericanSpanish American IndianSri LankanSubsaharan AfricanSudaneseSwedishSwissSyrianThaiTrinidadian and TobagonianTurkishU.S. Virgin IslanderUgandanUkrainianUruguayanVenezuelanVietnameseWelshWest IndianYugoslavianZimbabwean
Ancestry (Percentage)
AfghanAfricanAlbanianAlsatianAmericanApacheArabArgentineanArmenianAssyrian / Chaldean / SyriacAustralianAustrianBahamianBarbadianBasqueBelgianBelizeanBermudanBhutaneseBlackfeetBolivianBrazilianBritishBritish West IndianBulgarianBurmeseCajunCambodianCanadianCape VerdeanCarpatho RusynCelticCentral AmericanCentral American IndianCherokeeChickasawChileanChippewaChoctawColombianCosta RicanCreekCroatianCubanCypriotCzechCzechoslovakianDanishDelawareDominicanDutchDutch West IndianEastern EuropeanEcuadorianEgyptianEnglishEstonianEthiopianEuropeanFilipinoFinnishFrenchFrench American IndianFrench CanadianGermanGhanaianGreekGuamanian / ChamorroGuatemalanGuyaneseHaitianHmongHonduranHungarianIcelanderIndian (Asian)IndonesianIranianIraqiIrishIroquoisIsraeliItalianJamaicanJapaneseJordanianKenyanKoreanLaotianLatvianLebaneseLiberianLithuanianLuxembourgerMacedonianMalaysianMalteseMexicanMexican American IndianMongolianMoroccanNative HawaiianNew ZealanderNicaraguanNigerianNorthern EuropeanNorwegianOkinawanPakistaniPalestinianPanamanianParaguayanPennsylvania GermanPeruvianPolishPortuguesePuebloPuerto RicanRomanianRussianSalvadoranSamoanScandinavianScotch-IrishScottishSenegaleseSerbianSierra LeoneanSiouxSlavicSlovakSloveneSomaliSouth AfricanSouth AmericanSouth American IndianSoviet UnionSpaniardSpanishSpanish AmericanSpanish American IndianSri LankanSubsaharan AfricanSudaneseSwedishSwissSyrianThaiTrinidadian and TobagonianTurkishU.S. Virgin IslanderUgandanUkrainianUruguayanVenezuelanVietnameseWelshWest IndianYugoslavianZimbabwean
Immigrant Origin (Total)
AfghanistanAfricaAlbaniaArgentinaArmeniaAsiaAustraliaAustriaBahamasBangladeshBarbadosBelarusBelgiumBelizeBoliviaBosnia and HerzegovinaBrazilBulgariaBurma / MyanmarCambodiaCameroonCanadaCaribbeanCentral AmericaChileChinaColombiaCongoCosta RicaCroatiaCubaCzechoslovakiaDenmarkDominicaDominican RepublicEastern AfricaEastern AsiaEastern EuropeEcuadorEgyptEl SalvadorEnglandEritreaEthiopiaEuropeFranceGermanyGhanaGreeceGrenadaGuatemalaGuyanaHaitiHondurasHong KongHungaryIndiaIndonesiaIranIraqIrelandIsraelItalyJamaicaJapanJordanKazakhstanKenyaKoreaKuwaitLatin AmericaLatviaLebanonLiberiaLithuaniaMalaysiaMexicoMiddle AfricaMoldovaMoroccoNepalNetherlandsNicaraguaNigeriaNorth MacedoniaNorthern AfricaNorthern EuropeNorwayOceaniaPakistanPanamaPeruPhilippinesPolandPortugalRomaniaRussiaSaudi ArabiaScotlandSenegalSerbiaSierra LeoneSingaporeSomaliaSouth AfricaSouth AmericaSouth Central AsiaSouth Eastern AsiaSouthern EuropeSpainSri LankaSt. Vincent and the GrenadinesSudanSwedenSwitzerlandSyriaTaiwanThailandTrinidad and TobagoTurkeyUgandaUkraineUruguayUzbekistanVenezuelaVietnamWest IndiesWestern AfricaWestern AsiaWestern EuropeYemenZaireZimbabwe
Immigrant Origin (Percentage)
AfghanistanAfricaAlbaniaArgentinaArmeniaAsiaAustraliaAustriaBahamasBangladeshBarbadosBelarusBelgiumBelizeBoliviaBosnia and HerzegovinaBrazilBulgariaBurma / MyanmarCambodiaCameroonCanadaCaribbeanCentral AmericaChileChinaColombiaCongoCosta RicaCroatiaCubaCzechoslovakiaDenmarkDominicaDominican RepublicEastern AfricaEastern AsiaEastern EuropeEcuadorEgyptEl SalvadorEnglandEritreaEthiopiaEuropeFranceGermanyGhanaGreeceGrenadaGuatemalaGuyanaHaitiHondurasHong KongHungaryIndiaIndonesiaIranIraqIrelandIsraelItalyJamaicaJapanJordanKazakhstanKenyaKoreaKuwaitLatin AmericaLatviaLebanonLiberiaLithuaniaMalaysiaMexicoMiddle AfricaMoldovaMoroccoNepalNetherlandsNicaraguaNigeriaNorth MacedoniaNorthern AfricaNorthern EuropeNorwayOceaniaPakistanPanamaPeruPhilippinesPolandPortugalRomaniaRussiaSaudi ArabiaScotlandSenegalSerbiaSierra LeoneSingaporeSomaliaSouth AfricaSouth AmericaSouth Central AsiaSouth Eastern AsiaSouthern EuropeSpainSri LankaSt. Vincent and the GrenadinesSudanSwedenSwitzerlandSyriaTaiwanThailandTrinidad and TobagoTurkeyUgandaUkraineUruguayUzbekistanVenezuelaVietnamWest IndiesWestern AfricaWestern AsiaWestern EuropeYemenZaireZimbabwe
Income
Income (Families)
Income (Households)
Poverty
Poverty (Families)
Unemployment
Employment Occupations
Employment Industries
Employer Class
Commute Time
Commute Means
School Enrollment
Education by Degree Field
Occupancy
Finances
Physical Characteristics
New York
Compare Zip Codes
Comparison Subject

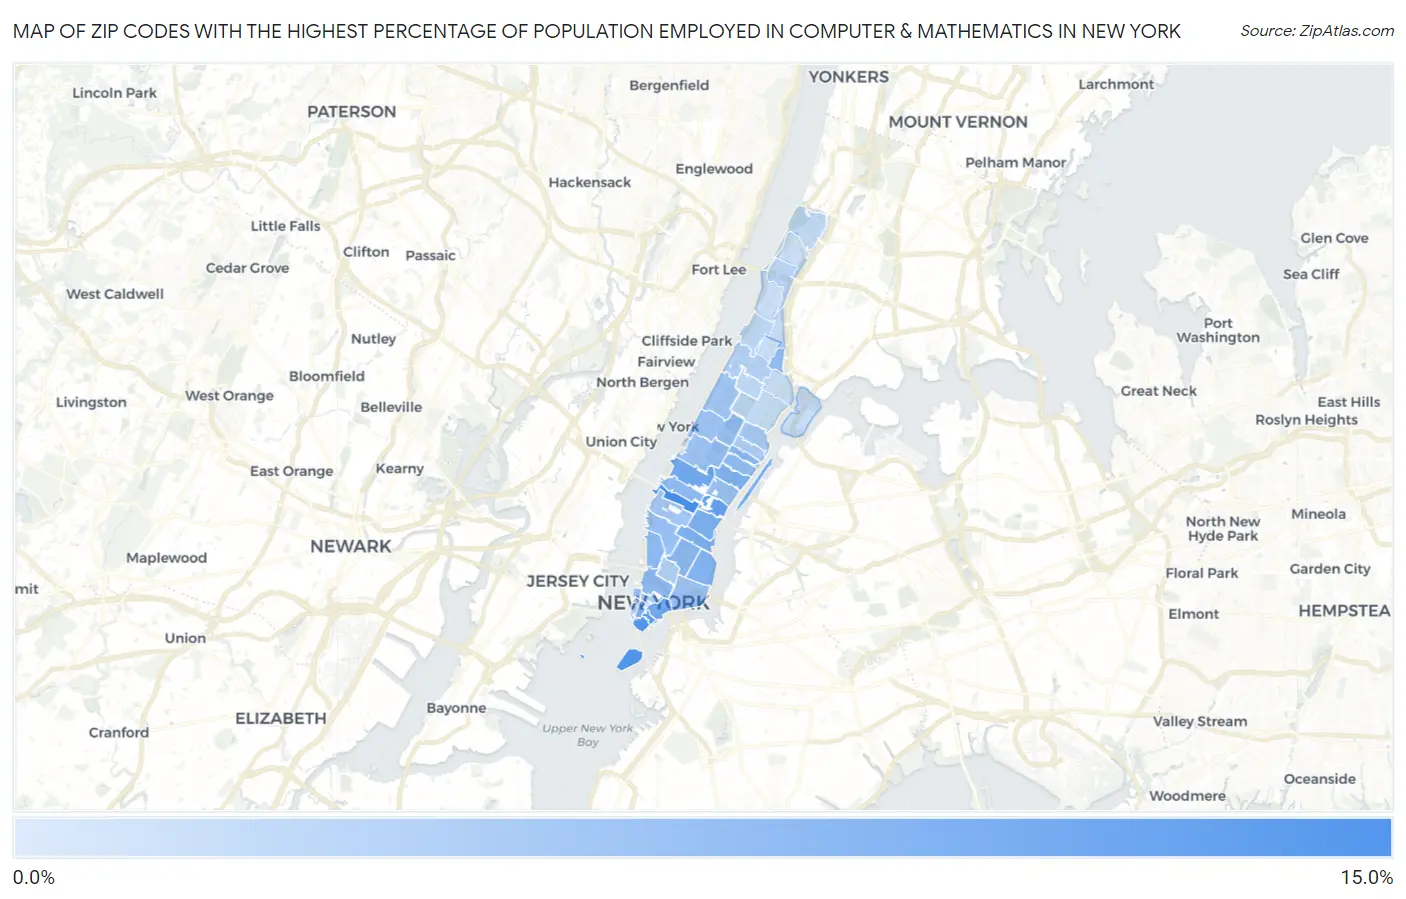
Map of Zip Codes with the Highest Percentage of Population Employed in Computer & Mathematics in New York

0.0%
15.0%
Zip Codes with the Highest Percentage of Population Employed in Computer & Mathematics in New York Map

Zip Codes with the Highest Percentage of Population Employed in Computer & Mathematics in New York, NY

Zip Code % Employed vs State vs National
1.1001811.4%3.1%(+8.28)#203.5%(+7.88)#508
2.1000410.3%3.1%(+7.20)#233.5%(+6.81)#656
3.100059.5%3.1%(+6.36)#263.5%(+5.96)#803
4.100179.3%3.1%(+6.18)#273.5%(+5.78)#837
5.100198.3%3.1%(+5.15)#373.5%(+4.76)#1,123
6.100388.2%3.1%(+5.04)#383.5%(+4.64)#1,158
7.100107.5%3.1%(+4.42)#463.5%(+4.02)#1,374
8.100447.5%3.1%(+4.39)#483.5%(+3.99)#1,381
9.100167.4%3.1%(+4.31)#493.5%(+3.92)#1,408
10.100657.4%3.1%(+4.23)#513.5%(+3.83)#1,440
11.100067.3%3.1%(+4.15)#543.5%(+3.76)#1,474
12.100097.0%3.1%(+3.91)#603.5%(+3.52)#1,598
13.100756.6%3.1%(+3.47)#713.5%(+3.08)#1,855
14.100036.5%3.1%(+3.41)#733.5%(+3.02)#1,896
15.100146.4%3.1%(+3.24)#793.5%(+2.84)#2,031
16.100136.1%3.1%(+2.99)#943.5%(+2.59)#2,212
17.100366.1%3.1%(+2.97)#953.5%(+2.58)#2,226
18.100376.0%3.1%(+2.90)#1013.5%(+2.50)#2,293
19.100216.0%3.1%(+2.85)#1053.5%(+2.46)#2,324
20.102825.7%3.1%(+2.59)#1163.5%(+2.19)#2,566
21.100115.5%3.1%(+2.38)#1263.5%(+1.98)#2,777
22.100225.5%3.1%(+2.37)#1283.5%(+1.97)#2,787
23.100245.4%3.1%(+2.26)#1373.5%(+1.87)#2,901
24.100235.4%3.1%(+2.24)#1393.5%(+1.85)#2,927
25.100025.2%3.1%(+2.03)#1583.5%(+1.64)#3,167
26.100254.9%3.1%(+1.73)#1793.5%(+1.33)#3,563
27.100014.7%3.1%(+1.53)#1933.5%(+1.13)#3,857
28.101284.6%3.1%(+1.52)#1953.5%(+1.12)#3,872
29.100284.1%3.1%(+0.975)#2623.5%(+0.581)#4,804
30.100074.1%3.1%(+0.924)#2723.5%(+0.529)#4,913
31.102803.9%3.1%(+0.815)#2893.5%(+0.420)#5,166
32.100123.9%3.1%(+0.789)#2943.5%(+0.394)#5,216
33.100273.5%3.1%(+0.399)#3723.5%(+0.004)#6,137
34.100333.0%3.1%(-0.127)#4833.5%(-0.522)#7,737
35.100312.9%3.1%(-0.258)#5213.5%(-0.653)#8,207
36.100262.7%3.1%(-0.394)#5523.5%(-0.789)#8,689
37.100342.6%3.1%(-0.500)#5773.5%(-0.895)#9,115
38.100292.4%3.1%(-0.681)#6333.5%(-1.08)#9,849
39.100392.3%3.1%(-0.815)#6693.5%(-1.21)#10,385
40.100352.2%3.1%(-0.970)#7173.5%(-1.37)#11,075
41.100302.1%3.1%(-1.04)#7363.5%(-1.43)#11,389
42.100322.0%3.1%(-1.13)#7763.5%(-1.52)#11,794
43.100401.9%3.1%(-1.21)#8073.5%(-1.61)#12,205
44.101621.3%3.1%(-1.86)#1,0113.5%(-2.25)#15,687
45.100690.68%3.1%(-2.45)#1,2003.5%(-2.84)#19,359

Common Questions

What are the Top 10 Zip Codes with the Highest Percentage of Population Employed in Computer & Mathematics in New York, NY?
Top 10 Zip Codes with the Highest Percentage of Population Employed in Computer & Mathematics in New York, NY are:
#1
11.4%
#2
10.3%
#3
9.5%
#4
9.3%
#5
8.3%
#6
8.2%
#7
7.5%
#8
7.5%
#9
7.4%
#10
7.4%
What zip code has the Highest Percentage of Population Employed in Computer & Mathematics in New York, NY?
10018 has the Highest Percentage of Population Employed in Computer & Mathematics in New York, NY with 11.4%.
What is the Percentage of Population Employed in Computer & Mathematics in New York, NY?
Percentage of Population Employed in Computer & Mathematics in New York is 3.6%.
What is the Percentage of Population Employed in Computer & Mathematics in New York?
Percentage of Population Employed in Computer & Mathematics in New York is 3.1%.
What is the Percentage of Population Employed in Computer & Mathematics in the United States?
Percentage of Population Employed in Computer & Mathematics in the United States is 3.5%.