Madison, NY Map & Demographics
Madison Map
Madison Overview
$23,184
PER CAPITA INCOME
$54,688
AVG FAMILY INCOME
$44,028
AVG HOUSEHOLD INCOME
48.9%
WAGE / INCOME GAP [ % ]
51.1¢/ $1
WAGE / INCOME GAP [ $ ]
$10,467
FAMILY INCOME DEFICIT
0.50
INEQUALITY / GINI INDEX
382
TOTAL POPULATION
172
MALE POPULATION
210
FEMALE POPULATION
81.90
MALES / 100 FEMALES
122.09
FEMALES / 100 MALES
25.9
MEDIAN AGE
3.7
AVG FAMILY SIZE
2.6
AVG HOUSEHOLD SIZE
155
LABOR FORCE [ PEOPLE ]
56.6%
PERCENT IN LABOR FORCE
1.9%
UNEMPLOYMENT RATE
Madison Zip Codes
Madison Area Codes
Income in Madison
Income Overview in Madison
Per Capita Income in Madison is $23,184, while median incomes of families and households are $54,688 and $44,028 respectively.
| Characteristic | Number | Measure |
| Per Capita Income | 382 | $23,184 |
| Median Family Income | 81 | $54,688 |
| Mean Family Income | 81 | $76,305 |
| Median Household Income | 149 | $44,028 |
| Mean Household Income | 149 | $59,942 |
| Income Deficit | 81 | $10,467 |
| Wage / Income Gap (%) | 382 | 48.88% |
| Wage / Income Gap ($) | 382 | 51.12¢ per $1 |
| Gini / Inequality Index | 382 | 0.50 |
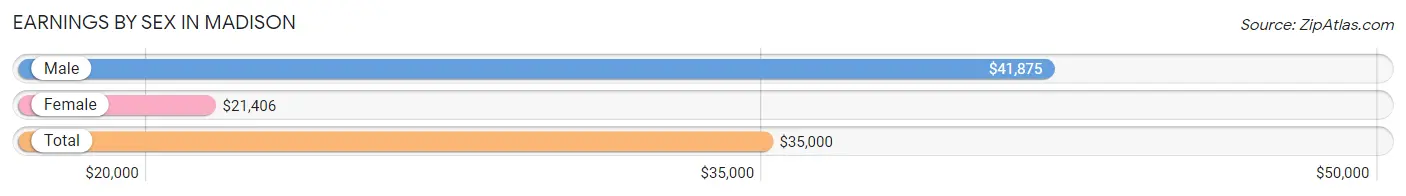
Earnings by Sex in Madison
Average Earnings in Madison are $35,000, $41,875 for men and $21,406 for women, a difference of 48.9%.
| Sex | Number | Average Earnings |
| Male | 89 (56.3%) | $41,875 |
| Female | 69 (43.7%) | $21,406 |
| Total | 158 (100.0%) | $35,000 |
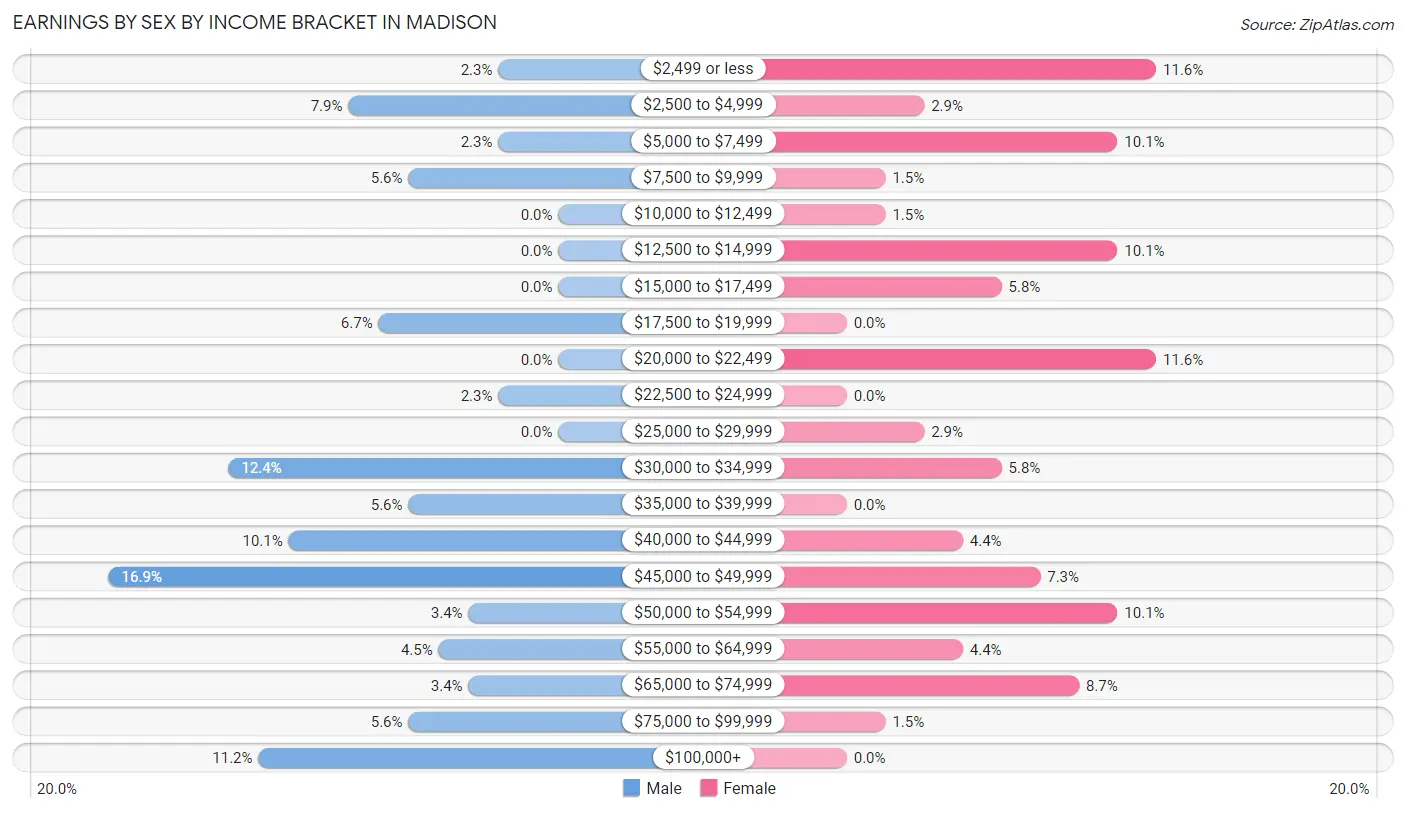
Earnings by Sex by Income Bracket in Madison
The most common earnings brackets in Madison are $45,000 to $49,999 for men (15 | 16.9%) and $2,499 or less for women (8 | 11.6%).
| Income | Male | Female |
| $2,499 or less | 2 (2.2%) | 8 (11.6%) |
| $2,500 to $4,999 | 7 (7.9%) | 2 (2.9%) |
| $5,000 to $7,499 | 2 (2.2%) | 7 (10.1%) |
| $7,500 to $9,999 | 5 (5.6%) | 1 (1.5%) |
| $10,000 to $12,499 | 0 (0.0%) | 1 (1.5%) |
| $12,500 to $14,999 | 0 (0.0%) | 7 (10.1%) |
| $15,000 to $17,499 | 0 (0.0%) | 4 (5.8%) |
| $17,500 to $19,999 | 6 (6.7%) | 0 (0.0%) |
| $20,000 to $22,499 | 0 (0.0%) | 8 (11.6%) |
| $22,500 to $24,999 | 2 (2.2%) | 0 (0.0%) |
| $25,000 to $29,999 | 0 (0.0%) | 2 (2.9%) |
| $30,000 to $34,999 | 11 (12.4%) | 4 (5.8%) |
| $35,000 to $39,999 | 5 (5.6%) | 0 (0.0%) |
| $40,000 to $44,999 | 9 (10.1%) | 3 (4.3%) |
| $45,000 to $49,999 | 15 (16.9%) | 5 (7.2%) |
| $50,000 to $54,999 | 3 (3.4%) | 7 (10.1%) |
| $55,000 to $64,999 | 4 (4.5%) | 3 (4.3%) |
| $65,000 to $74,999 | 3 (3.4%) | 6 (8.7%) |
| $75,000 to $99,999 | 5 (5.6%) | 1 (1.5%) |
| $100,000+ | 10 (11.2%) | 0 (0.0%) |
| Total | 89 (100.0%) | 69 (100.0%) |
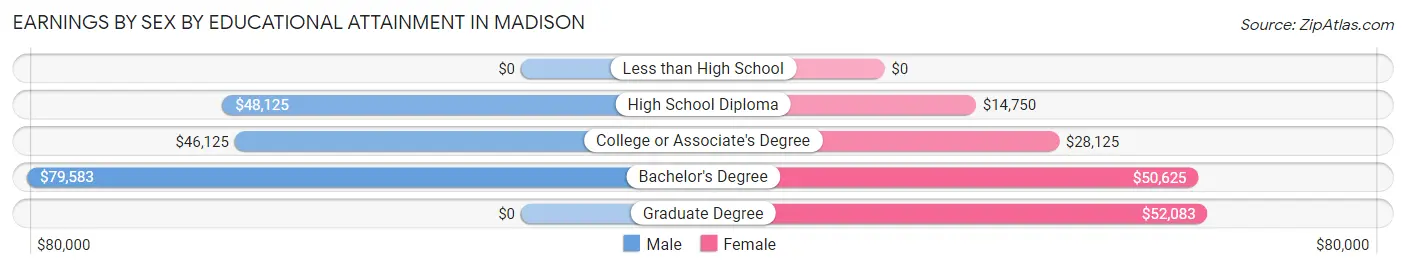
Earnings by Sex by Educational Attainment in Madison
Average earnings in Madison are $46,442 for men and $36,250 for women, a difference of 22.0%. Men with an educational attainment of bachelor's degree enjoy the highest average annual earnings of $79,583, while those with college or associate's degree education earn the least with $46,125. Women with an educational attainment of graduate degree earn the most with the average annual earnings of $52,083, while those with high school diploma education have the smallest earnings of $14,750.
| Educational Attainment | Male Income | Female Income |
| Less than High School | - | - |
| High School Diploma | $48,125 | $14,750 |
| College or Associate's Degree | $46,125 | $28,125 |
| Bachelor's Degree | $79,583 | $50,625 |
| Graduate Degree | - | - |
| Total | $46,442 | $36,250 |
Family Income in Madison
Family Income Brackets in Madison
According to the Madison family income data, there are 21 families falling into the $50,000 to $74,999 income range, which is the most common income bracket and makes up 25.9% of all families. Conversely, the less than $10,000 income bracket is the least frequent group with only 3 families (3.7%) belonging to this category.
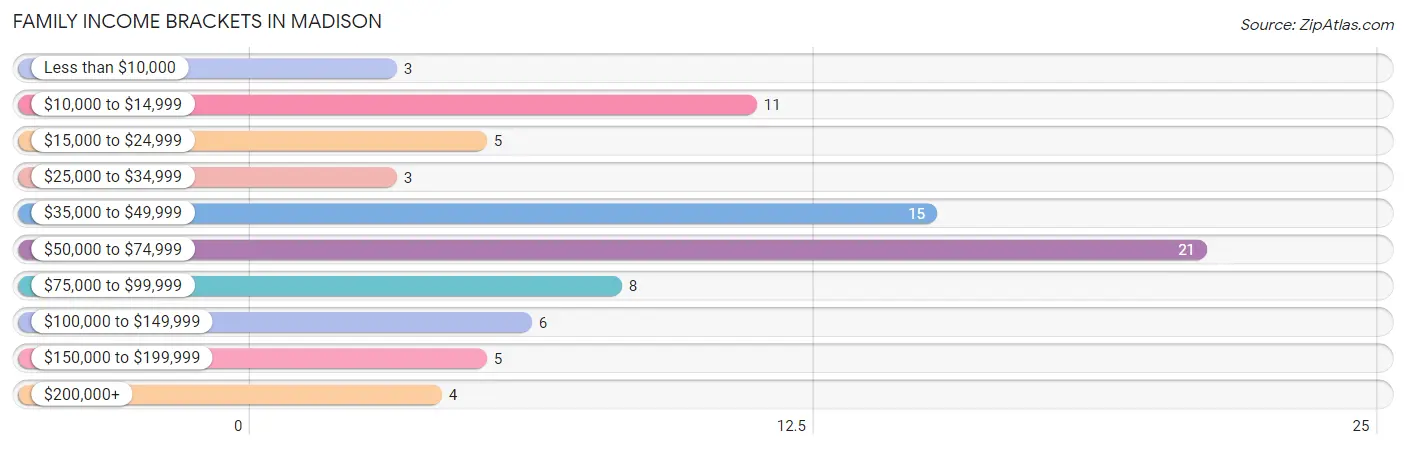
| Income Bracket | # Families | % Families |
| Less than $10,000 | 3 | 3.7% |
| $10,000 to $14,999 | 11 | 13.6% |
| $15,000 to $24,999 | 5 | 6.2% |
| $25,000 to $34,999 | 3 | 3.7% |
| $35,000 to $49,999 | 15 | 18.5% |
| $50,000 to $74,999 | 21 | 25.9% |
| $75,000 to $99,999 | 8 | 9.9% |
| $100,000 to $149,999 | 6 | 7.4% |
| $150,000 to $199,999 | 5 | 6.2% |
| $200,000+ | 4 | 4.9% |
Family Income by Famaliy Size in Madison
4-person families (27 | 33.3%) account for the highest median family income in Madison with $59,375 per family, while 3-person families (16 | 19.8%) have the highest median income of $17,917 per family member.
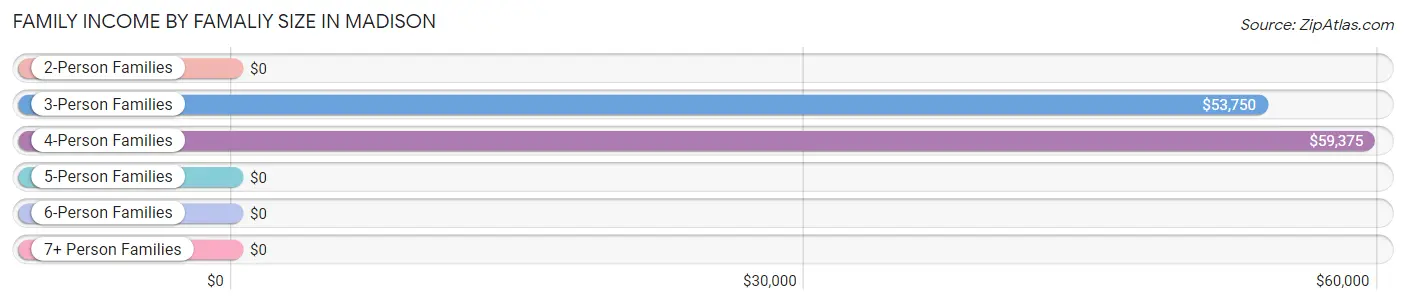
| Income Bracket | # Families | Median Income |
| 2-Person Families | 25 (30.9%) | $0 |
| 3-Person Families | 16 (19.8%) | $53,750 |
| 4-Person Families | 27 (33.3%) | $59,375 |
| 5-Person Families | 5 (6.2%) | $0 |
| 6-Person Families | 3 (3.7%) | $0 |
| 7+ Person Families | 5 (6.2%) | $0 |
| Total | 81 (100.0%) | $54,688 |
Family Income by Number of Earners in Madison
The median family income in Madison is $54,688, with families comprising 3+ earners (9) having the highest median family income of $158,750, while families with no earners (22) have the lowest median family income of $11,818, accounting for 11.1% and 27.2% of families, respectively.
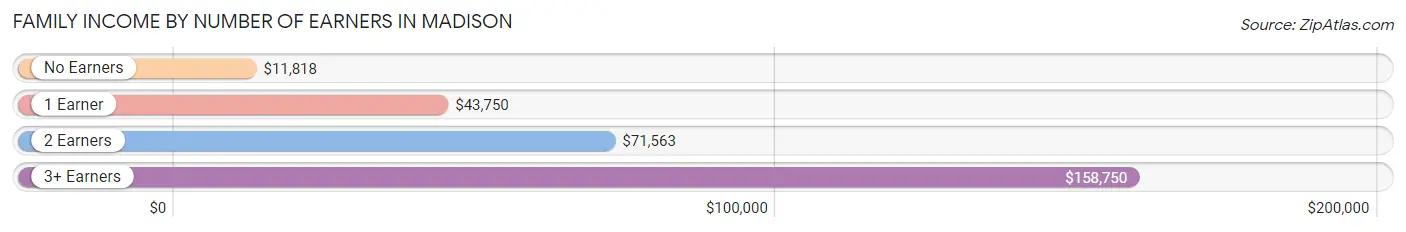
| Number of Earners | # Families | Median Income |
| No Earners | 22 (27.2%) | $11,818 |
| 1 Earner | 19 (23.5%) | $43,750 |
| 2 Earners | 31 (38.3%) | $71,563 |
| 3+ Earners | 9 (11.1%) | $158,750 |
| Total | 81 (100.0%) | $54,688 |
Household Income in Madison
Household Income Brackets in Madison
With 36 households falling in the category, the $35,000 to $49,999 income range is the most frequent in Madison, accounting for 24.2% of all households. In contrast, only 3 households (2.0%) fall into the $25,000 to $34,999 income bracket, making it the least populous group.
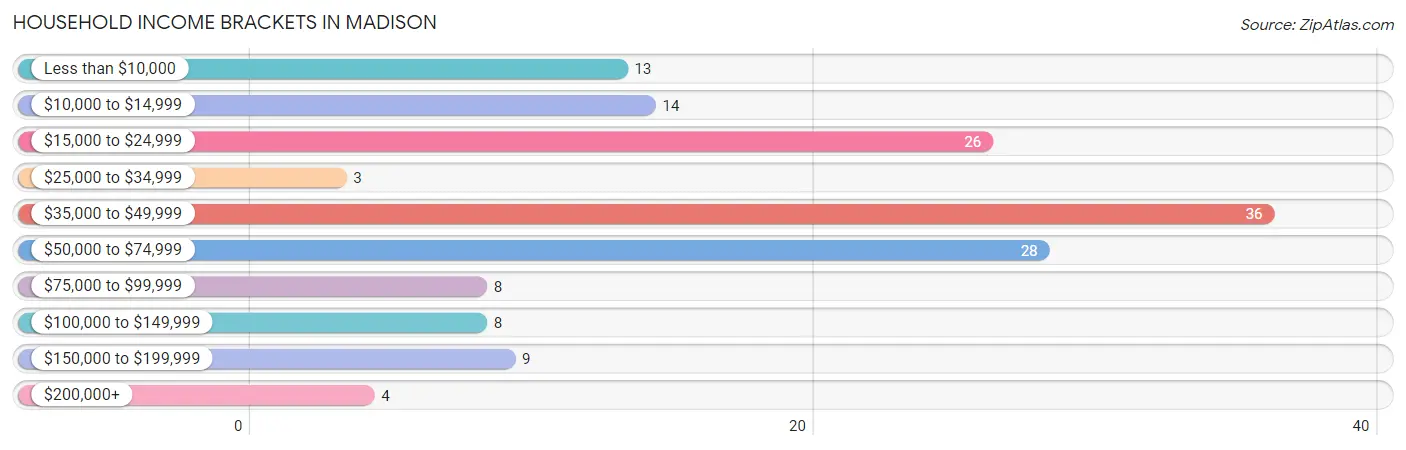
| Income Bracket | # Households | % Households |
| Less than $10,000 | 13 | 8.7% |
| $10,000 to $14,999 | 14 | 9.4% |
| $15,000 to $24,999 | 26 | 17.4% |
| $25,000 to $34,999 | 3 | 2.0% |
| $35,000 to $49,999 | 36 | 24.2% |
| $50,000 to $74,999 | 28 | 18.8% |
| $75,000 to $99,999 | 8 | 5.4% |
| $100,000 to $149,999 | 8 | 5.4% |
| $150,000 to $199,999 | 9 | 6.0% |
| $200,000+ | 4 | 2.7% |
Household Income by Householder Age in Madison
The median household income in Madison is $44,028, with the highest median household income of $60,000 found in the 45 to 64 years age bracket for the primary householder. A total of 46 households (30.9%) fall into this category. Meanwhile, the 15 to 24 years age bracket for the primary householder has the lowest median household income of $0, with 15 households (10.1%) in this group.
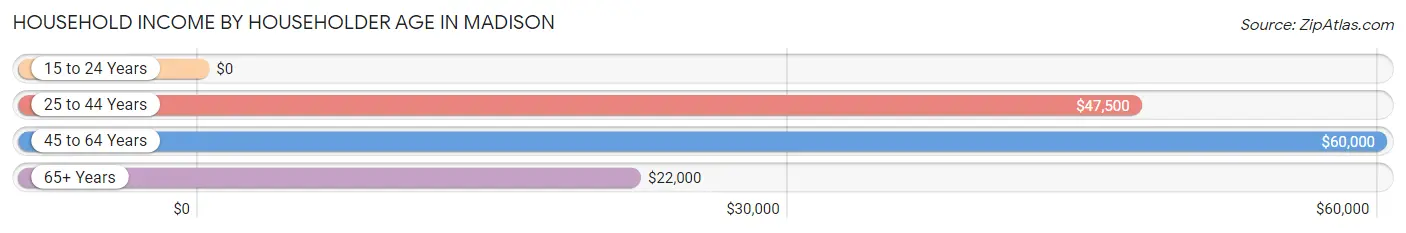
| Income Bracket | # Households | Median Income |
| 15 to 24 Years | 15 (10.1%) | $0 |
| 25 to 44 Years | 44 (29.5%) | $47,500 |
| 45 to 64 Years | 46 (30.9%) | $60,000 |
| 65+ Years | 44 (29.5%) | $22,000 |
| Total | 149 (100.0%) | $44,028 |
Poverty in Madison
Income Below Poverty by Sex and Age in Madison
With 14.0% poverty level for males and 30.0% for females among the residents of Madison, 5 year old males and 5 year old females are the most vulnerable to poverty, with 9 males (100.0%) and 6 females (100.0%) in their respective age groups living below the poverty level.
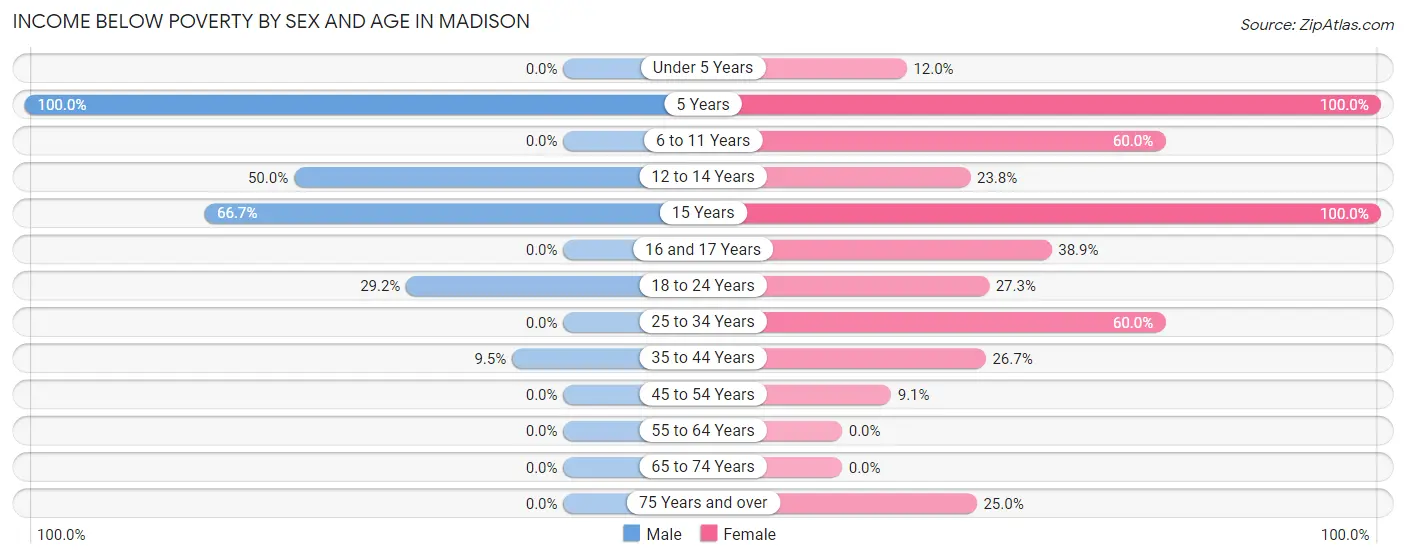
| Age Bracket | Male | Female |
| Under 5 Years | 0 (0.0%) | 3 (12.0%) |
| 5 Years | 9 (100.0%) | 6 (100.0%) |
| 6 to 11 Years | 0 (0.0%) | 9 (60.0%) |
| 12 to 14 Years | 2 (50.0%) | 5 (23.8%) |
| 15 Years | 4 (66.7%) | 2 (100.0%) |
| 16 and 17 Years | 0 (0.0%) | 7 (38.9%) |
| 18 to 24 Years | 7 (29.2%) | 6 (27.3%) |
| 25 to 34 Years | 0 (0.0%) | 12 (60.0%) |
| 35 to 44 Years | 2 (9.5%) | 4 (26.7%) |
| 45 to 54 Years | 0 (0.0%) | 2 (9.1%) |
| 55 to 64 Years | 0 (0.0%) | 0 (0.0%) |
| 65 to 74 Years | 0 (0.0%) | 0 (0.0%) |
| 75 Years and over | 0 (0.0%) | 7 (25.0%) |
| Total | 24 (14.0%) | 63 (30.0%) |
Income Above Poverty by Sex and Age in Madison
According to the poverty statistics in Madison, males aged under 5 years and females aged 55 to 64 years are the age groups that are most secure financially, with 100.0% of males and 100.0% of females in these age groups living above the poverty line.
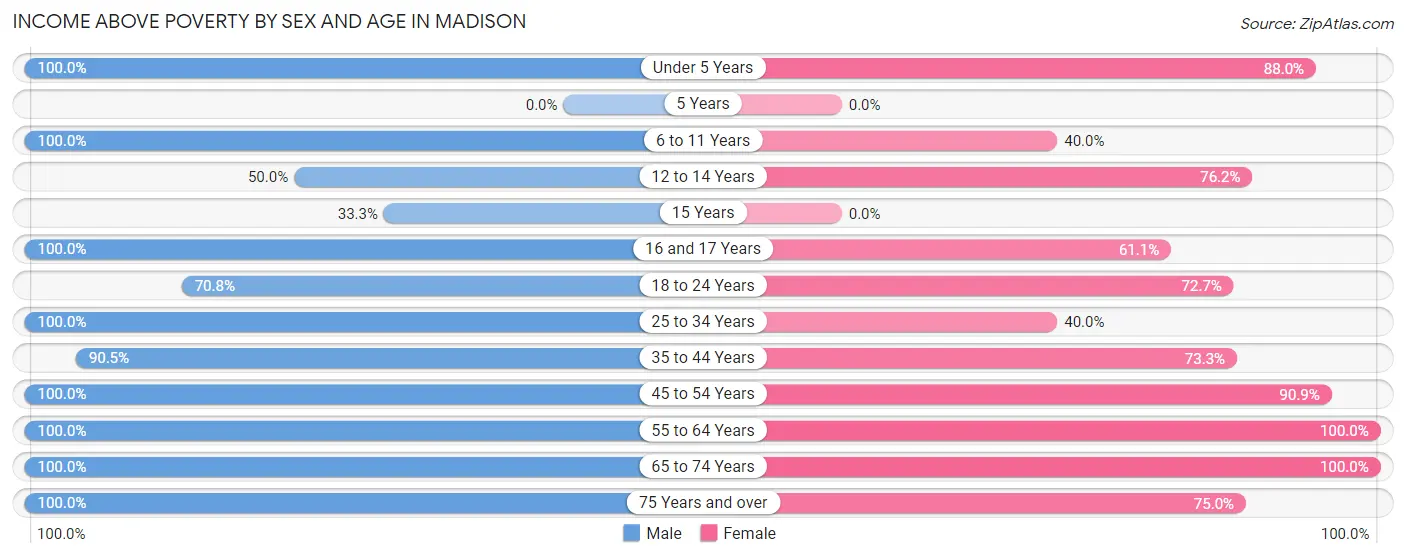
| Age Bracket | Male | Female |
| Under 5 Years | 15 (100.0%) | 22 (88.0%) |
| 5 Years | 0 (0.0%) | 0 (0.0%) |
| 6 to 11 Years | 5 (100.0%) | 6 (40.0%) |
| 12 to 14 Years | 2 (50.0%) | 16 (76.2%) |
| 15 Years | 2 (33.3%) | 0 (0.0%) |
| 16 and 17 Years | 13 (100.0%) | 11 (61.1%) |
| 18 to 24 Years | 17 (70.8%) | 16 (72.7%) |
| 25 to 34 Years | 17 (100.0%) | 8 (40.0%) |
| 35 to 44 Years | 19 (90.5%) | 11 (73.3%) |
| 45 to 54 Years | 27 (100.0%) | 20 (90.9%) |
| 55 to 64 Years | 11 (100.0%) | 4 (100.0%) |
| 65 to 74 Years | 12 (100.0%) | 12 (100.0%) |
| 75 Years and over | 8 (100.0%) | 21 (75.0%) |
| Total | 148 (86.1%) | 147 (70.0%) |
Income Below Poverty Among Married-Couple Families in Madison
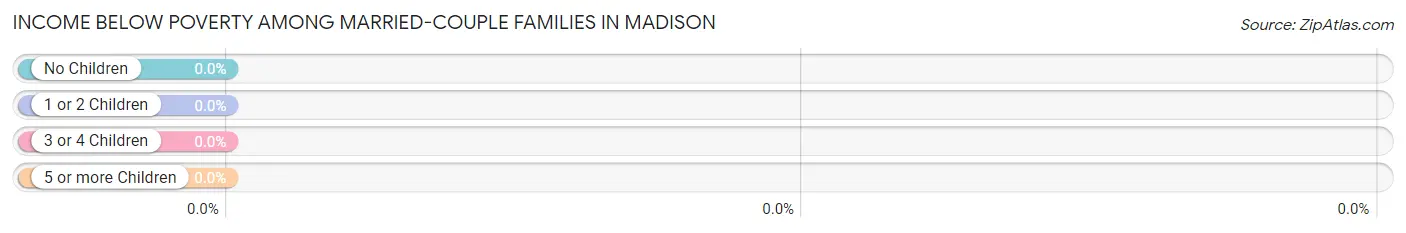
| Children | Above Poverty | Below Poverty |
| No Children | 20 (100.0%) | 0 (0.0%) |
| 1 or 2 Children | 26 (100.0%) | 0 (0.0%) |
| 3 or 4 Children | 3 (100.0%) | 0 (0.0%) |
| 5 or more Children | 3 (100.0%) | 0 (0.0%) |
| Total | 52 (100.0%) | 0 (0.0%) |
Income Below Poverty Among Single-Parent Households in Madison
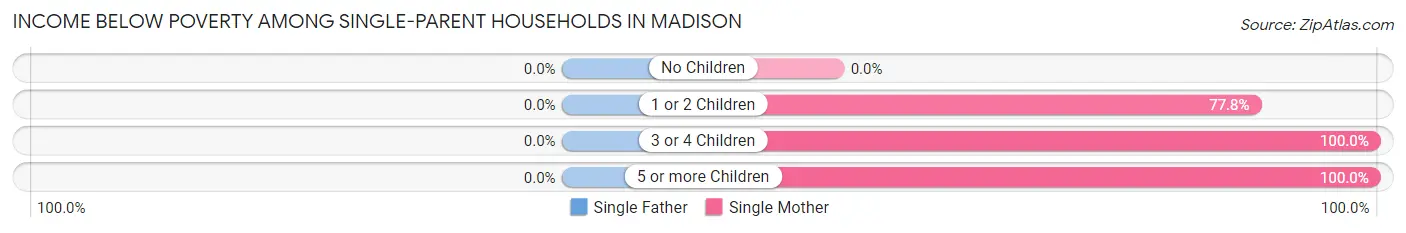
| Children | Single Father | Single Mother |
| No Children | 0 (0.0%) | 0 (0.0%) |
| 1 or 2 Children | 0 (0.0%) | 14 (77.8%) |
| 3 or 4 Children | 0 (0.0%) | 2 (100.0%) |
| 5 or more Children | 0 (0.0%) | 2 (100.0%) |
| Total | 0 (0.0%) | 18 (75.0%) |
Income Below Poverty Among Married-Couple vs Single-Parent Households in Madison
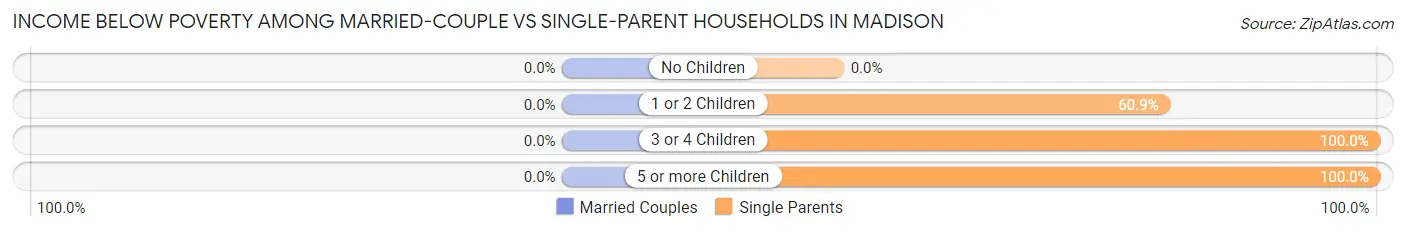
| Children | Married-Couple Families | Single-Parent Households |
| No Children | 0 (0.0%) | 0 (0.0%) |
| 1 or 2 Children | 0 (0.0%) | 14 (60.9%) |
| 3 or 4 Children | 0 (0.0%) | 2 (100.0%) |
| 5 or more Children | 0 (0.0%) | 2 (100.0%) |
| Total | 0 (0.0%) | 18 (62.1%) |
Race in Madison
The most populous races in Madison are White / Caucasian (380 | 99.5%), Hispanic or Latino (7 | 1.8%), and Black / African American (1 | 0.3%).
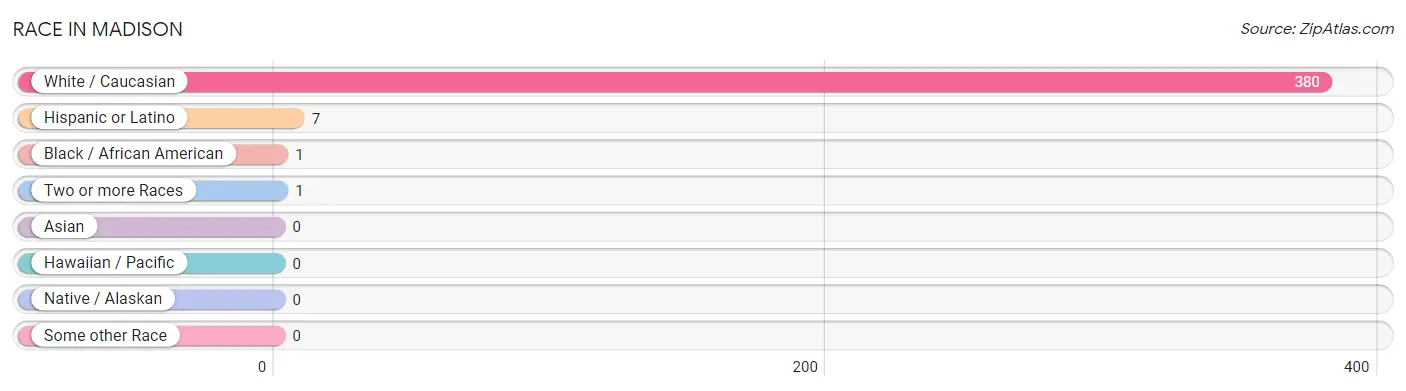
| Race | # Population | % Population |
| Asian | 0 | 0.0% |
| Black / African American | 1 | 0.3% |
| Hawaiian / Pacific | 0 | 0.0% |
| Hispanic or Latino | 7 | 1.8% |
| Native / Alaskan | 0 | 0.0% |
| White / Caucasian | 380 | 99.5% |
| Two or more Races | 1 | 0.3% |
| Some other Race | 0 | 0.0% |
| Total | 382 | 100.0% |
Ancestry in Madison
The most populous ancestries reported in Madison are German (74 | 19.4%), English (69 | 18.1%), Irish (63 | 16.5%), Italian (45 | 11.8%), and Polish (40 | 10.5%), together accounting for 76.2% of all Madison residents.
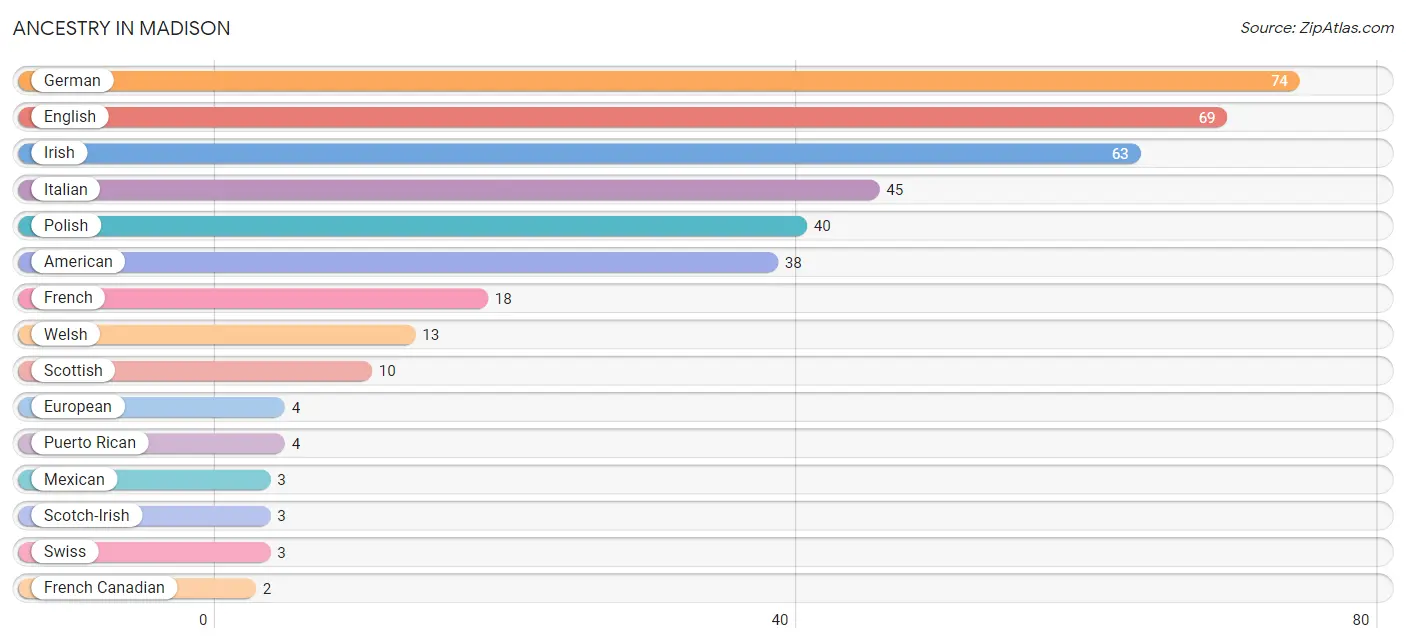
| Ancestry | # Population | % Population |
| American | 38 | 10.0% |
| Dutch | 1 | 0.3% |
| English | 69 | 18.1% |
| European | 4 | 1.1% |
| French | 18 | 4.7% |
| French Canadian | 2 | 0.5% |
| German | 74 | 19.4% |
| Irish | 63 | 16.5% |
| Italian | 45 | 11.8% |
| Mexican | 3 | 0.8% |
| Polish | 40 | 10.5% |
| Puerto Rican | 4 | 1.1% |
| Scotch-Irish | 3 | 0.8% |
| Scottish | 10 | 2.6% |
| Swiss | 3 | 0.8% |
| Ukrainian | 1 | 0.3% |
| Welsh | 13 | 3.4% | View All 17 Rows |
Immigrants in Madison

| Immigration Origin | # Population | % Population | View All 0 Rows |
Sex and Age in Madison
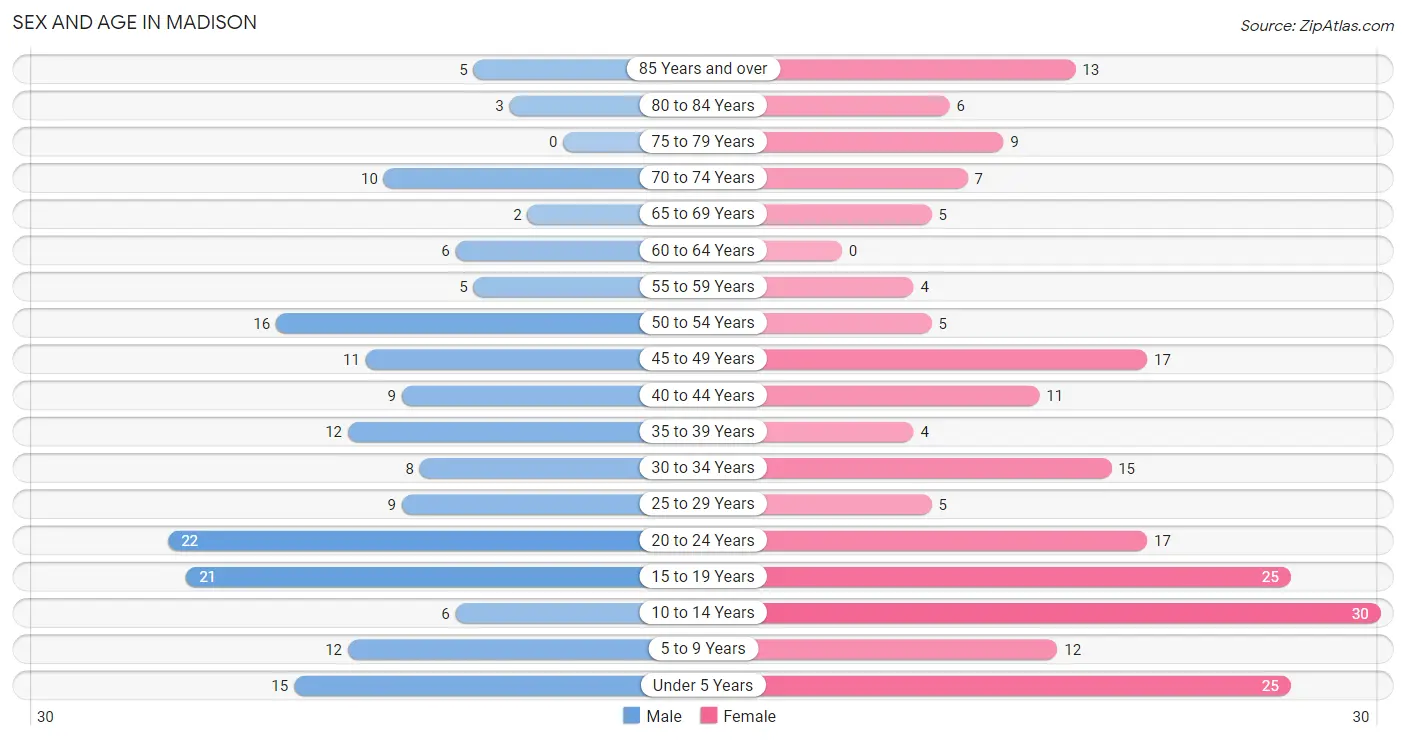
Sex and Age in Madison
The most populous age groups in Madison are 20 to 24 Years (22 | 12.8%) for men and 10 to 14 Years (30 | 14.3%) for women.
| Age Bracket | Male | Female |
| Under 5 Years | 15 (8.7%) | 25 (11.9%) |
| 5 to 9 Years | 12 (7.0%) | 12 (5.7%) |
| 10 to 14 Years | 6 (3.5%) | 30 (14.3%) |
| 15 to 19 Years | 21 (12.2%) | 25 (11.9%) |
| 20 to 24 Years | 22 (12.8%) | 17 (8.1%) |
| 25 to 29 Years | 9 (5.2%) | 5 (2.4%) |
| 30 to 34 Years | 8 (4.6%) | 15 (7.1%) |
| 35 to 39 Years | 12 (7.0%) | 4 (1.9%) |
| 40 to 44 Years | 9 (5.2%) | 11 (5.2%) |
| 45 to 49 Years | 11 (6.4%) | 17 (8.1%) |
| 50 to 54 Years | 16 (9.3%) | 5 (2.4%) |
| 55 to 59 Years | 5 (2.9%) | 4 (1.9%) |
| 60 to 64 Years | 6 (3.5%) | 0 (0.0%) |
| 65 to 69 Years | 2 (1.2%) | 5 (2.4%) |
| 70 to 74 Years | 10 (5.8%) | 7 (3.3%) |
| 75 to 79 Years | 0 (0.0%) | 9 (4.3%) |
| 80 to 84 Years | 3 (1.7%) | 6 (2.9%) |
| 85 Years and over | 5 (2.9%) | 13 (6.2%) |
| Total | 172 (100.0%) | 210 (100.0%) |
Families and Households in Madison
Median Family Size in Madison
The median family size in Madison is 3.70 persons per family, with married-couple families (52 | 64.2%) accounting for the largest median family size of 3.81 persons per family. On the other hand, single male/father families (5 | 6.2%) represent the smallest median family size with 3.40 persons per family.
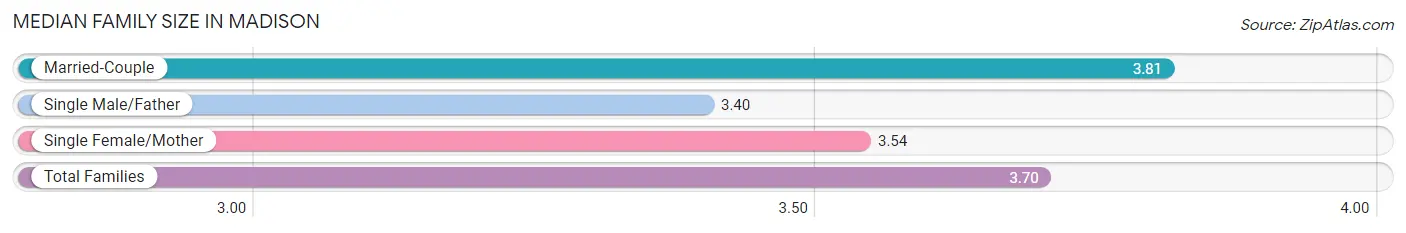
| Family Type | # Families | Family Size |
| Married-Couple | 52 (64.2%) | 3.81 |
| Single Male/Father | 5 (6.2%) | 3.40 |
| Single Female/Mother | 24 (29.6%) | 3.54 |
| Total Families | 81 (100.0%) | 3.70 |
Median Household Size in Madison
The median household size in Madison is 2.56 persons per household, with married-couple households (52 | 34.9%) accounting for the largest median household size of 3.81 persons per household. non-family households (68 | 45.6%) represent the smallest median household size with 1.12 persons per household.
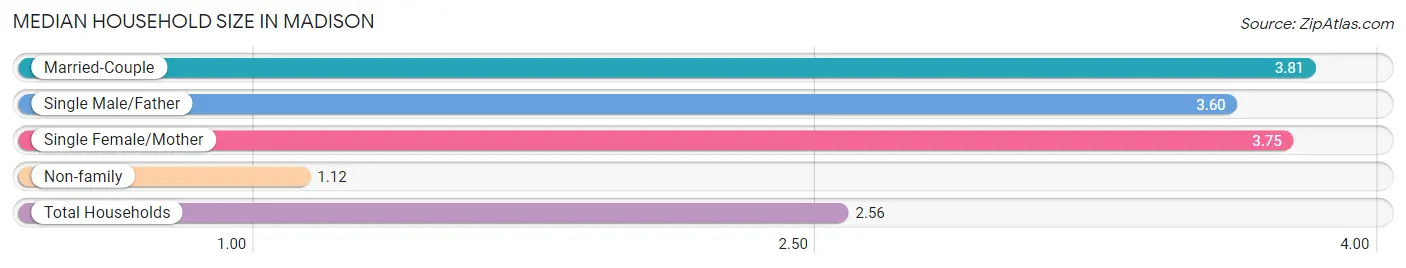
| Household Type | # Households | Household Size |
| Married-Couple | 52 (34.9%) | 3.81 |
| Single Male/Father | 5 (3.4%) | 3.60 |
| Single Female/Mother | 24 (16.1%) | 3.75 |
| Non-family | 68 (45.6%) | 1.12 |
| Total Households | 149 (100.0%) | 2.56 |
Household Size by Marriage Status in Madison
Out of a total of 149 households in Madison, 81 (54.4%) are family households, while 68 (45.6%) are nonfamily households. The most numerous type of family households are 4-person households, comprising 32, and the most common type of nonfamily households are 1-person households, comprising 57.
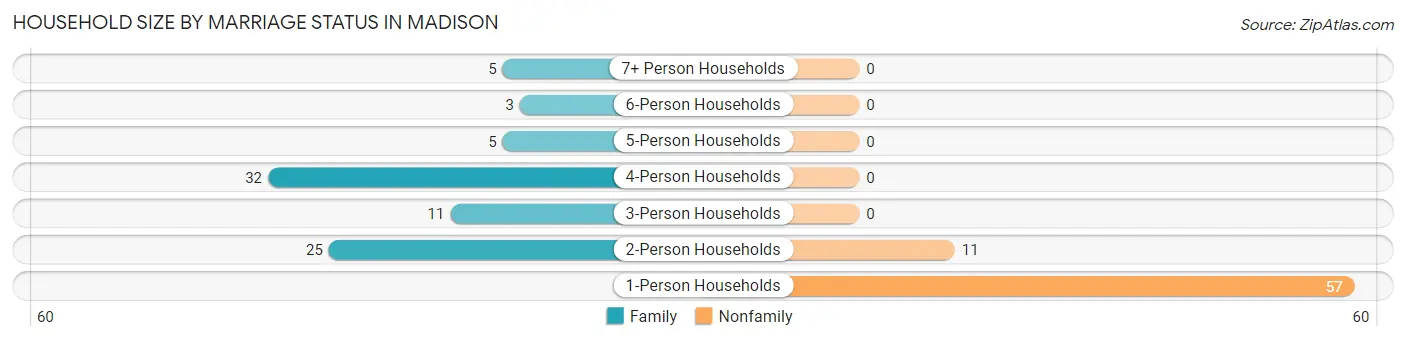
| Household Size | Family Households | Nonfamily Households |
| 1-Person Households | - | 57 (38.3%) |
| 2-Person Households | 25 (16.8%) | 11 (7.4%) |
| 3-Person Households | 11 (7.4%) | 0 (0.0%) |
| 4-Person Households | 32 (21.5%) | 0 (0.0%) |
| 5-Person Households | 5 (3.4%) | 0 (0.0%) |
| 6-Person Households | 3 (2.0%) | 0 (0.0%) |
| 7+ Person Households | 5 (3.4%) | 0 (0.0%) |
| Total | 81 (54.4%) | 68 (45.6%) |
Female Fertility in Madison
Fertility by Age in Madison
Average fertility rate in Madison is 21.0 births per 1,000 women. Women in the age bracket of 35 to 50 years have the highest fertility rate with 59.0 births per 1,000 women. Women in the age bracket of 35 to 50 years acount for 100.0% of all women with births.
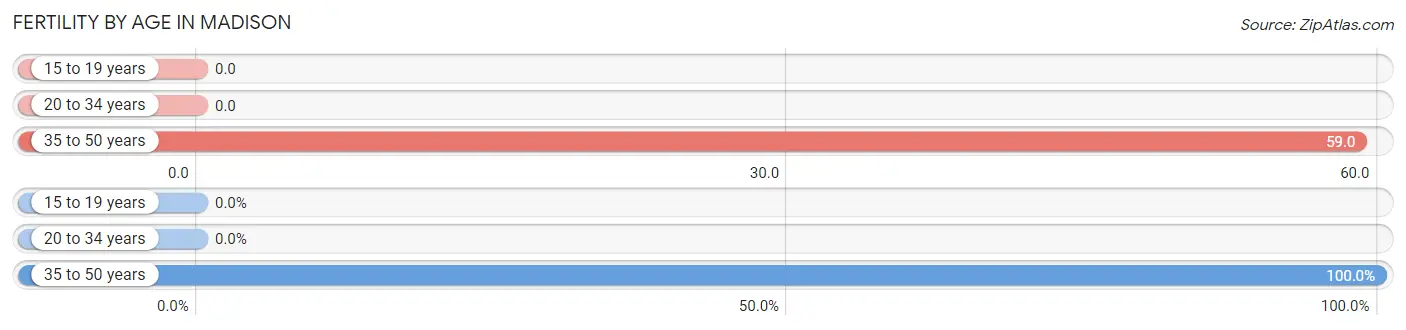
| Age Bracket | Women with Births | Births / 1,000 Women |
| 15 to 19 years | 0 (0.0%) | 0.0 |
| 20 to 34 years | 0 (0.0%) | 0.0 |
| 35 to 50 years | 2 (100.0%) | 59.0 |
| Total | 2 (100.0%) | 21.0 |
Fertility by Age by Marriage Status in Madison
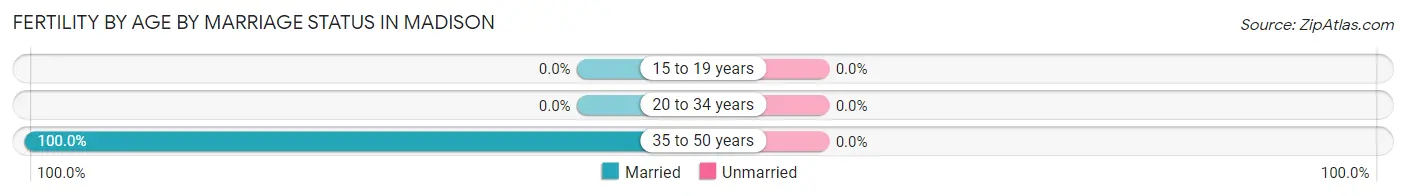
| Age Bracket | Married | Unmarried |
| 15 to 19 years | 0 (0.0%) | 0 (0.0%) |
| 20 to 34 years | 0 (0.0%) | 0 (0.0%) |
| 35 to 50 years | 2 (100.0%) | 0 (0.0%) |
| Total | 2 (100.0%) | 0 (0.0%) |
Fertility by Education in Madison
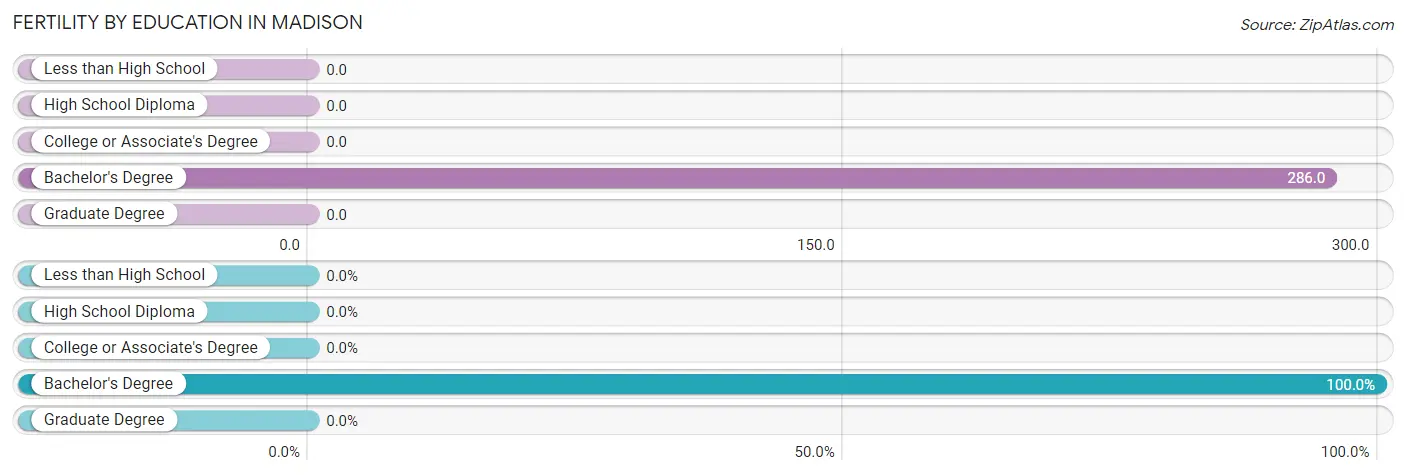
| Educational Attainment | Women with Births | Births / 1,000 Women |
| Less than High School | 0 (0.0%) | 0.0 |
| High School Diploma | 0 (0.0%) | 0.0 |
| College or Associate's Degree | 0 (0.0%) | 0.0 |
| Bachelor's Degree | 2 (100.0%) | 286.0 |
| Graduate Degree | 0 (0.0%) | 0.0 |
| Total | 2 (100.0%) | 21.0 |
Fertility by Education by Marriage Status in Madison
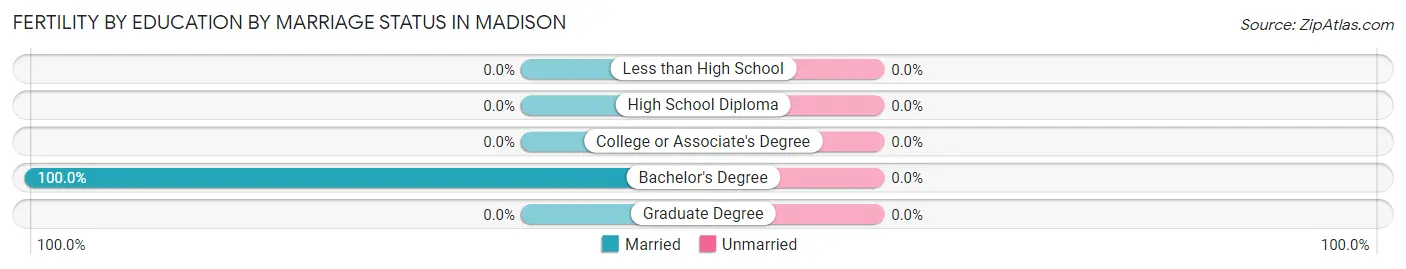
| Educational Attainment | Married | Unmarried |
| Less than High School | 0 (0.0%) | 0 (0.0%) |
| High School Diploma | 0 (0.0%) | 0 (0.0%) |
| College or Associate's Degree | 0 (0.0%) | 0 (0.0%) |
| Bachelor's Degree | 2 (100.0%) | 0 (0.0%) |
| Graduate Degree | 0 (0.0%) | 0 (0.0%) |
| Total | 2 (100.0%) | 0 (0.0%) |
Employment Characteristics in Madison
Employment by Class of Employer in Madison
Among the 152 employed individuals in Madison, private company employees (80 | 52.6%), self-employed (not incorporated) (23 | 15.1%), and not-for-profit organizations (18 | 11.8%) make up the most common classes of employment.
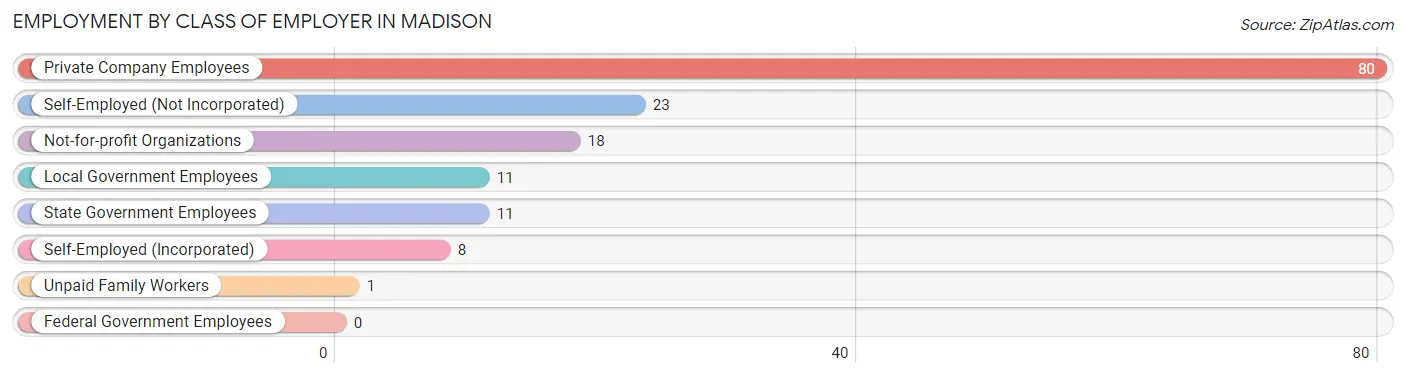
| Employer Class | # Employees | % Employees |
| Private Company Employees | 80 | 52.6% |
| Self-Employed (Incorporated) | 8 | 5.3% |
| Self-Employed (Not Incorporated) | 23 | 15.1% |
| Not-for-profit Organizations | 18 | 11.8% |
| Local Government Employees | 11 | 7.2% |
| State Government Employees | 11 | 7.2% |
| Federal Government Employees | 0 | 0.0% |
| Unpaid Family Workers | 1 | 0.7% |
| Total | 152 | 100.0% |
Employment Status by Age in Madison
According to the labor force statistics for Madison, out of the total population over 16 years of age (274), 56.6% or 155 individuals are in the labor force, with 1.9% or 3 of them unemployed. The age group with the highest labor force participation rate is 25 to 29 years, with 100.0% or 14 individuals in the labor force. Within the labor force, the 30 to 34 years age range has the highest percentage of unemployed individuals, with 27.3% or 3 of them being unemployed.
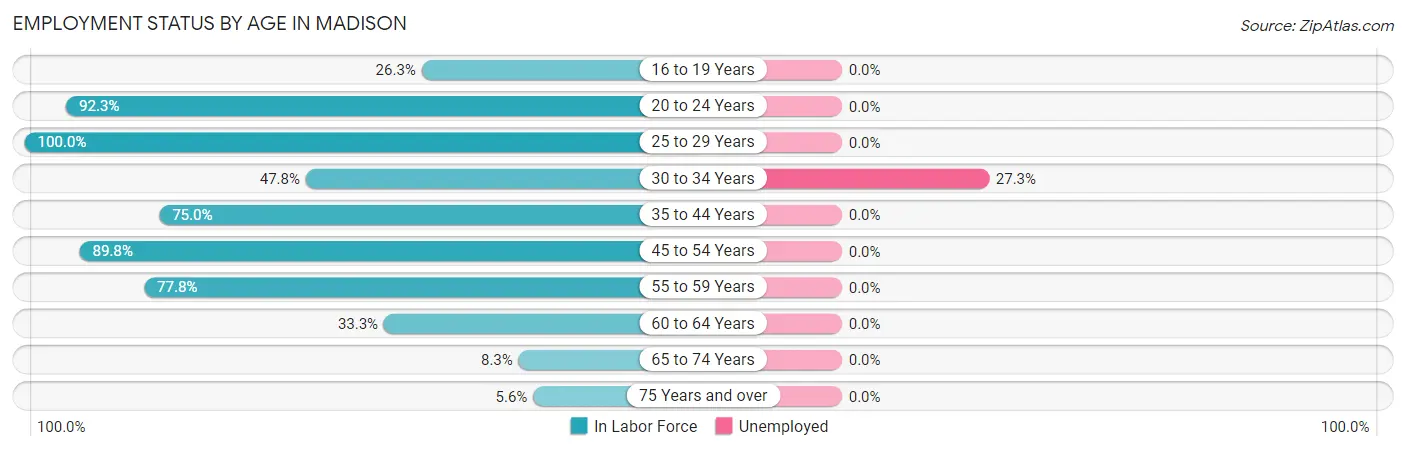
| Age Bracket | In Labor Force | Unemployed |
| 16 to 19 Years | 10 (26.3%) | 0 (0.0%) |
| 20 to 24 Years | 36 (92.3%) | 0 (0.0%) |
| 25 to 29 Years | 14 (100.0%) | 0 (0.0%) |
| 30 to 34 Years | 11 (47.8%) | 3 (27.3%) |
| 35 to 44 Years | 27 (75.0%) | 0 (0.0%) |
| 45 to 54 Years | 44 (89.8%) | 0 (0.0%) |
| 55 to 59 Years | 7 (77.8%) | 0 (0.0%) |
| 60 to 64 Years | 2 (33.3%) | 0 (0.0%) |
| 65 to 74 Years | 2 (8.3%) | 0 (0.0%) |
| 75 Years and over | 2 (5.6%) | 0 (0.0%) |
| Total | 155 (56.6%) | 3 (1.9%) |
Employment Status by Educational Attainment in Madison
According to labor force statistics for Madison, 76.6% of individuals (105) out of the total population between 25 and 64 years of age (137) are in the labor force, with 2.9% or 3 of them being unemployed. The group with the highest labor force participation rate are those with the educational attainment of less than high school, with 100.0% or 6 individuals in the labor force. Within the labor force, individuals with bachelor's degree or higher education have the highest percentage of unemployment, with 8.6% or 3 of them being unemployed.
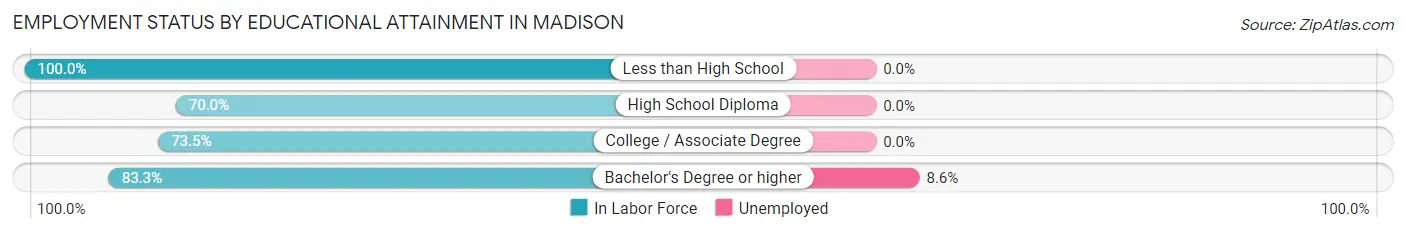
| Educational Attainment | In Labor Force | Unemployed |
| Less than High School | 6 (100.0%) | 0 (0.0%) |
| High School Diploma | 28 (70.0%) | 0 (0.0%) |
| College / Associate Degree | 36 (73.5%) | 0 (0.0%) |
| Bachelor's Degree or higher | 35 (83.3%) | 4 (8.6%) |
| Total | 105 (76.6%) | 4 (2.9%) |
Employment Occupations by Sex in Madison
Management, Business, Science and Arts Occupations
The most common Management, Business, Science and Arts occupations in Madison are Community & Social Service (17 | 11.2%), Computers, Engineering & Science (13 | 8.6%), Education Instruction & Library (12 | 7.9%), Management (11 | 7.2%), and Computers & Mathematics (10 | 6.6%).
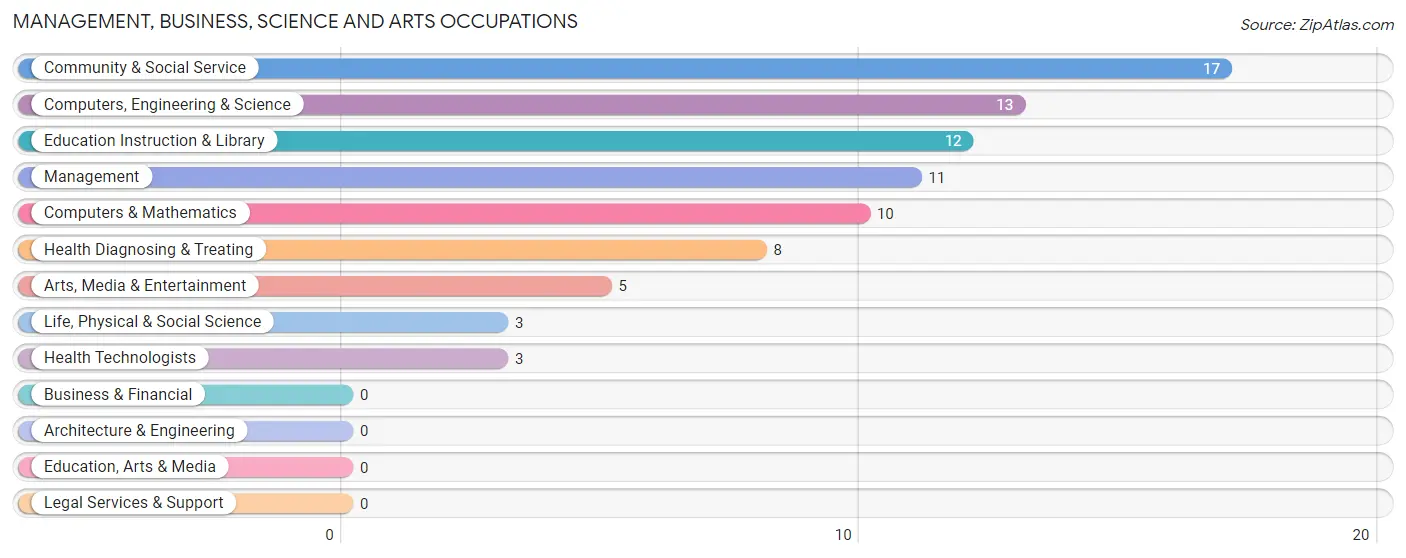
Management, Business, Science and Arts Occupations by Sex
Within the Management, Business, Science and Arts occupations in Madison, the most male-oriented occupations are Computers, Engineering & Science (100.0%), Computers & Mathematics (100.0%), and Life, Physical & Social Science (100.0%), while the most female-oriented occupations are Health Technologists (100.0%), Education Instruction & Library (83.3%), and Management (63.6%).
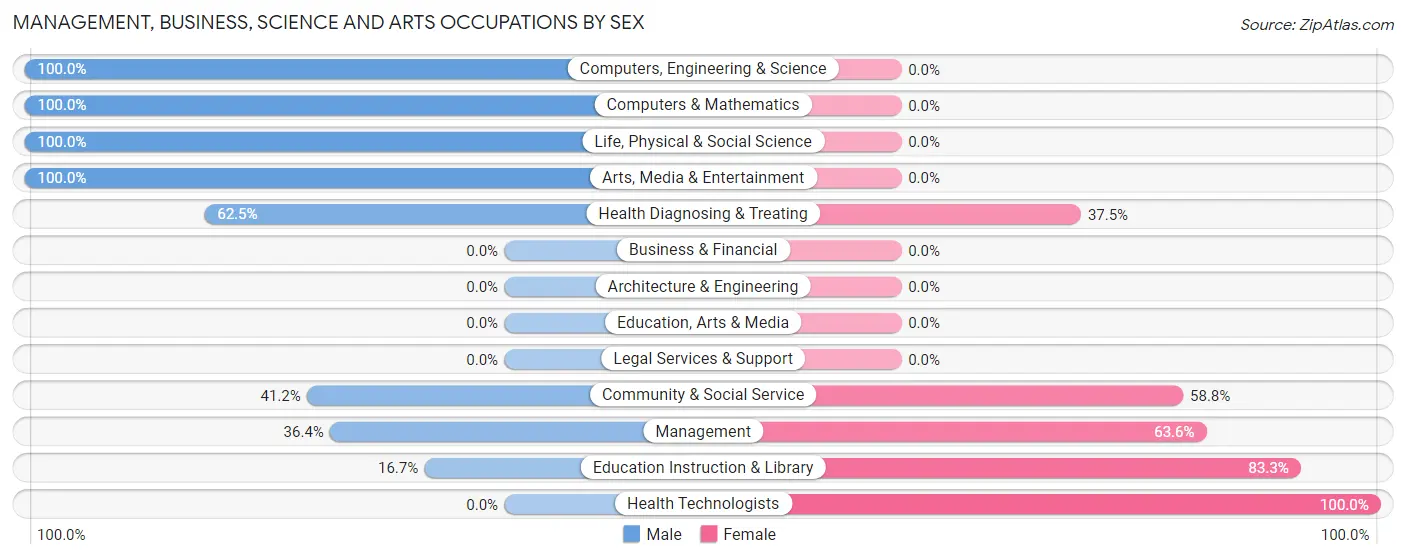
| Occupation | Male | Female |
| Management | 4 (36.4%) | 7 (63.6%) |
| Business & Financial | 0 (0.0%) | 0 (0.0%) |
| Computers, Engineering & Science | 13 (100.0%) | 0 (0.0%) |
| Computers & Mathematics | 10 (100.0%) | 0 (0.0%) |
| Architecture & Engineering | 0 (0.0%) | 0 (0.0%) |
| Life, Physical & Social Science | 3 (100.0%) | 0 (0.0%) |
| Community & Social Service | 7 (41.2%) | 10 (58.8%) |
| Education, Arts & Media | 0 (0.0%) | 0 (0.0%) |
| Legal Services & Support | 0 (0.0%) | 0 (0.0%) |
| Education Instruction & Library | 2 (16.7%) | 10 (83.3%) |
| Arts, Media & Entertainment | 5 (100.0%) | 0 (0.0%) |
| Health Diagnosing & Treating | 5 (62.5%) | 3 (37.5%) |
| Health Technologists | 0 (0.0%) | 3 (100.0%) |
| Total (Category) | 29 (59.2%) | 20 (40.8%) |
| Total (Overall) | 86 (56.6%) | 66 (43.4%) |
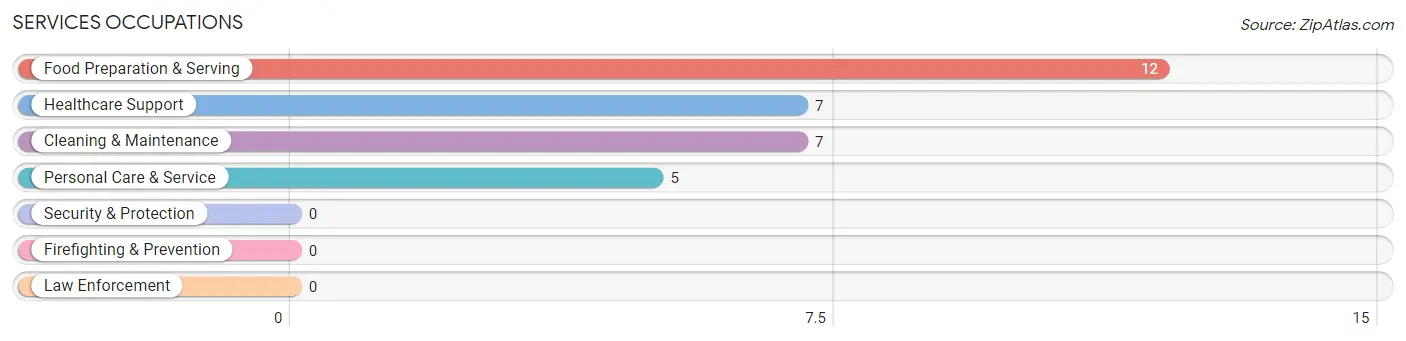
Services Occupations
The most common Services occupations in Madison are Food Preparation & Serving (12 | 7.9%), Healthcare Support (7 | 4.6%), Cleaning & Maintenance (7 | 4.6%), and Personal Care & Service (5 | 3.3%).
Services Occupations by Sex
Within the Services occupations in Madison, the most male-oriented occupations are Cleaning & Maintenance (100.0%), Food Preparation & Serving (58.3%), and Healthcare Support (28.6%), while the most female-oriented occupations are Personal Care & Service (100.0%), Healthcare Support (71.4%), and Food Preparation & Serving (41.7%).
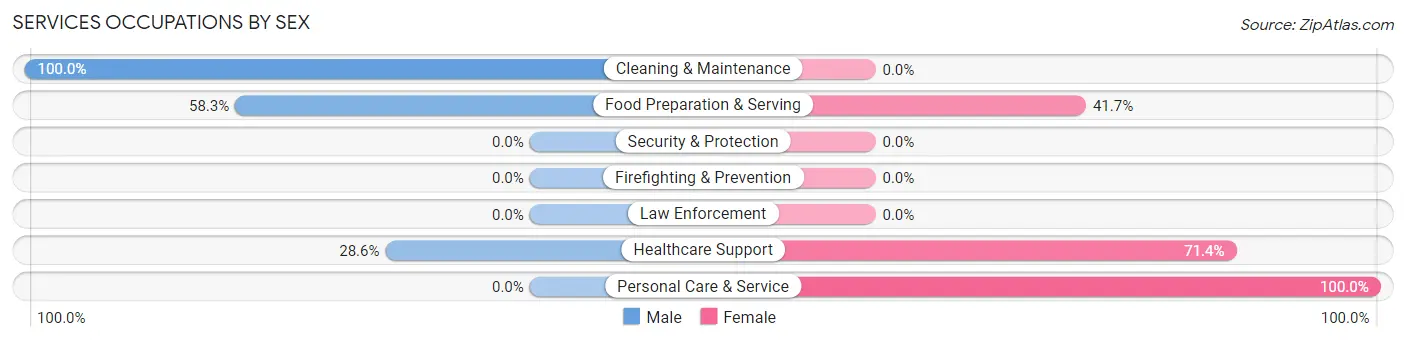
| Occupation | Male | Female |
| Healthcare Support | 2 (28.6%) | 5 (71.4%) |
| Security & Protection | 0 (0.0%) | 0 (0.0%) |
| Firefighting & Prevention | 0 (0.0%) | 0 (0.0%) |
| Law Enforcement | 0 (0.0%) | 0 (0.0%) |
| Food Preparation & Serving | 7 (58.3%) | 5 (41.7%) |
| Cleaning & Maintenance | 7 (100.0%) | 0 (0.0%) |
| Personal Care & Service | 0 (0.0%) | 5 (100.0%) |
| Total (Category) | 16 (51.6%) | 15 (48.4%) |
| Total (Overall) | 86 (56.6%) | 66 (43.4%) |
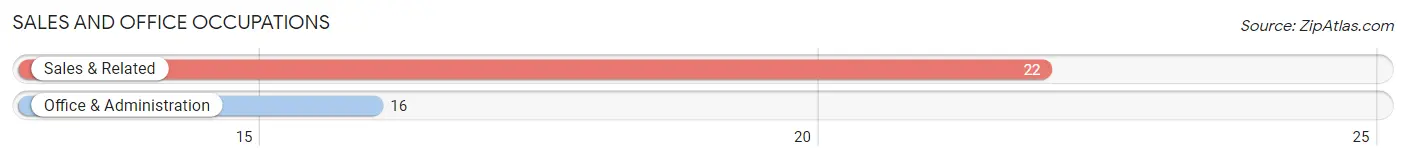
Sales and Office Occupations
The most common Sales and Office occupations in Madison are Sales & Related (22 | 14.5%), and Office & Administration (16 | 10.5%).
Sales and Office Occupations by Sex
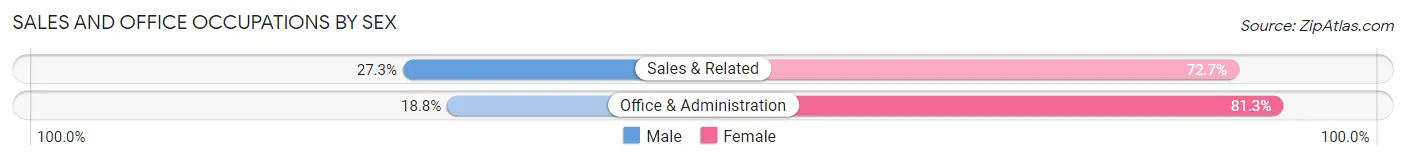
| Occupation | Male | Female |
| Sales & Related | 6 (27.3%) | 16 (72.7%) |
| Office & Administration | 3 (18.8%) | 13 (81.2%) |
| Total (Category) | 9 (23.7%) | 29 (76.3%) |
| Total (Overall) | 86 (56.6%) | 66 (43.4%) |
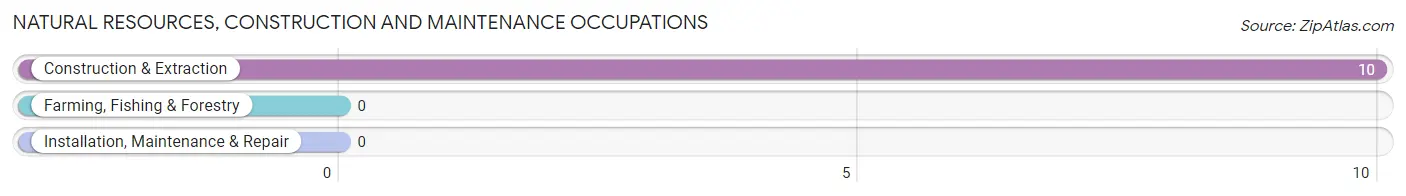
Natural Resources, Construction and Maintenance Occupations
The most common Natural Resources, Construction and Maintenance occupations in Madison are , and Construction & Extraction (10 | 6.6%).
Natural Resources, Construction and Maintenance Occupations by Sex
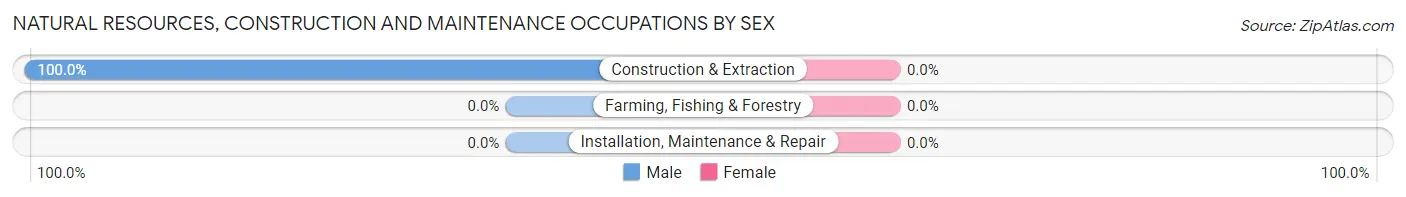
| Occupation | Male | Female |
| Farming, Fishing & Forestry | 0 (0.0%) | 0 (0.0%) |
| Construction & Extraction | 10 (100.0%) | 0 (0.0%) |
| Installation, Maintenance & Repair | 0 (0.0%) | 0 (0.0%) |
| Total (Category) | 10 (100.0%) | 0 (0.0%) |
| Total (Overall) | 86 (56.6%) | 66 (43.4%) |
Production, Transportation and Moving Occupations
The most common Production, Transportation and Moving occupations in Madison are Production (13 | 8.6%), Transportation (7 | 4.6%), and Material Moving (4 | 2.6%).
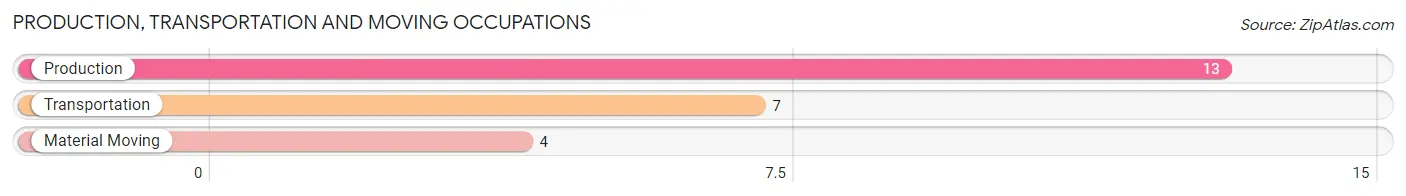
Production, Transportation and Moving Occupations by Sex
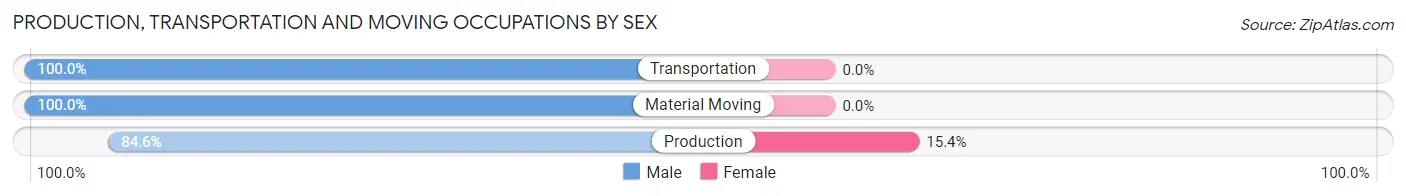
| Occupation | Male | Female |
| Production | 11 (84.6%) | 2 (15.4%) |
| Transportation | 7 (100.0%) | 0 (0.0%) |
| Material Moving | 4 (100.0%) | 0 (0.0%) |
| Total (Category) | 22 (91.7%) | 2 (8.3%) |
| Total (Overall) | 86 (56.6%) | 66 (43.4%) |
Employment Industries by Sex in Madison
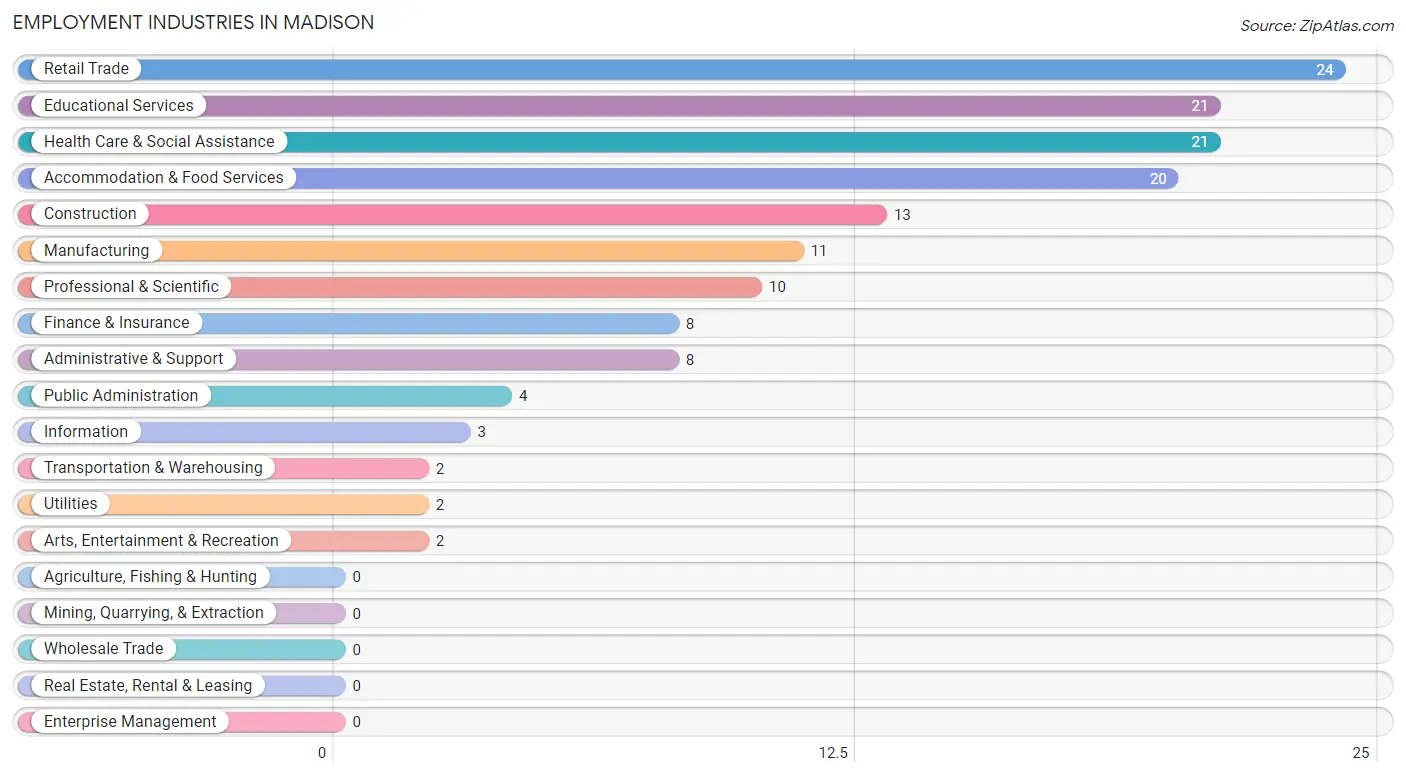
Employment Industries in Madison
The major employment industries in Madison include Retail Trade (24 | 15.8%), Educational Services (21 | 13.8%), Health Care & Social Assistance (21 | 13.8%), Accommodation & Food Services (20 | 13.2%), and Construction (13 | 8.6%).
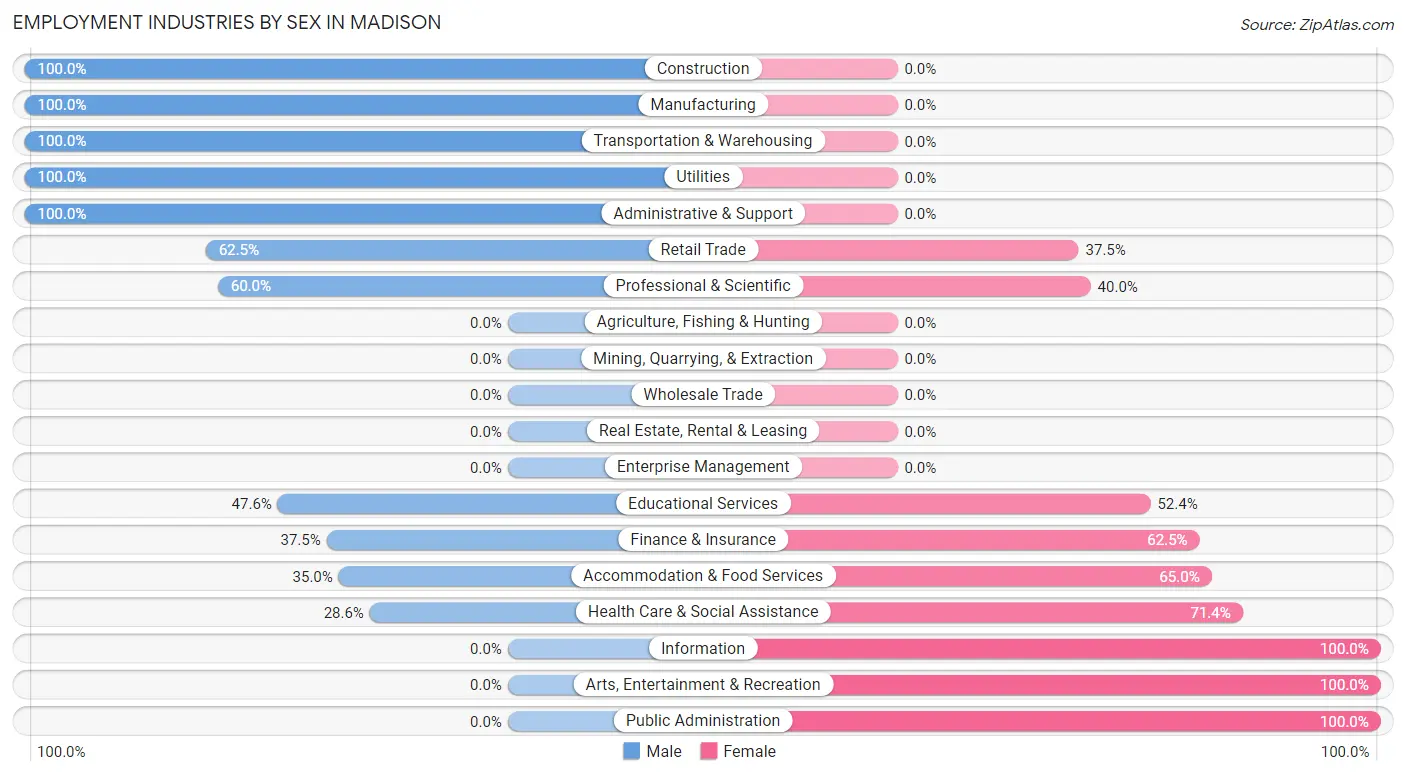
Employment Industries by Sex in Madison
The Madison industries that see more men than women are Construction (100.0%), Manufacturing (100.0%), and Transportation & Warehousing (100.0%), whereas the industries that tend to have a higher number of women are Information (100.0%), Arts, Entertainment & Recreation (100.0%), and Public Administration (100.0%).
| Industry | Male | Female |
| Agriculture, Fishing & Hunting | 0 (0.0%) | 0 (0.0%) |
| Mining, Quarrying, & Extraction | 0 (0.0%) | 0 (0.0%) |
| Construction | 13 (100.0%) | 0 (0.0%) |
| Manufacturing | 11 (100.0%) | 0 (0.0%) |
| Wholesale Trade | 0 (0.0%) | 0 (0.0%) |
| Retail Trade | 15 (62.5%) | 9 (37.5%) |
| Transportation & Warehousing | 2 (100.0%) | 0 (0.0%) |
| Utilities | 2 (100.0%) | 0 (0.0%) |
| Information | 0 (0.0%) | 3 (100.0%) |
| Finance & Insurance | 3 (37.5%) | 5 (62.5%) |
| Real Estate, Rental & Leasing | 0 (0.0%) | 0 (0.0%) |
| Professional & Scientific | 6 (60.0%) | 4 (40.0%) |
| Enterprise Management | 0 (0.0%) | 0 (0.0%) |
| Administrative & Support | 8 (100.0%) | 0 (0.0%) |
| Educational Services | 10 (47.6%) | 11 (52.4%) |
| Health Care & Social Assistance | 6 (28.6%) | 15 (71.4%) |
| Arts, Entertainment & Recreation | 0 (0.0%) | 2 (100.0%) |
| Accommodation & Food Services | 7 (35.0%) | 13 (65.0%) |
| Public Administration | 0 (0.0%) | 4 (100.0%) |
| Total | 86 (56.6%) | 66 (43.4%) |
Education in Madison
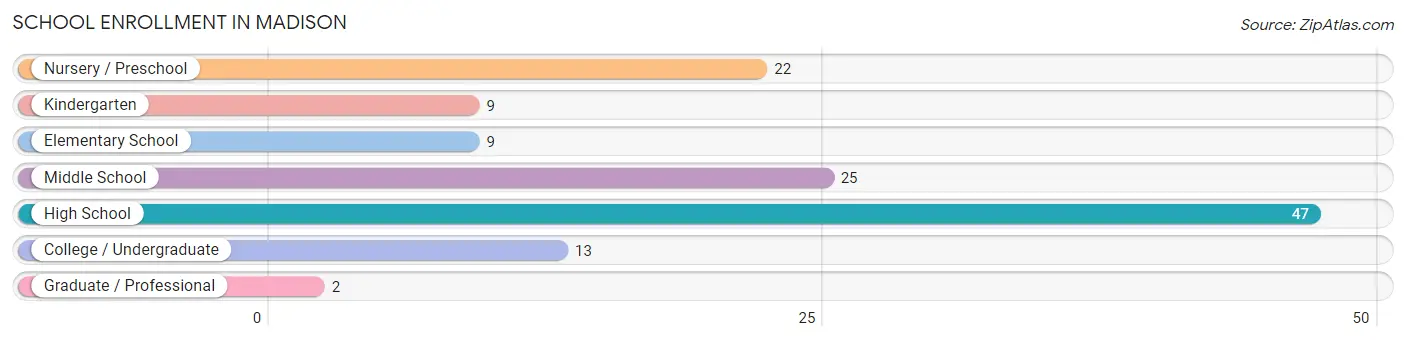
School Enrollment in Madison
The most common levels of schooling among the 127 students in Madison are high school (47 | 37.0%), middle school (25 | 19.7%), and nursery / preschool (22 | 17.3%).
| School Level | # Students | % Students |
| Nursery / Preschool | 22 | 17.3% |
| Kindergarten | 9 | 7.1% |
| Elementary School | 9 | 7.1% |
| Middle School | 25 | 19.7% |
| High School | 47 | 37.0% |
| College / Undergraduate | 13 | 10.2% |
| Graduate / Professional | 2 | 1.6% |
| Total | 127 | 100.0% |
School Enrollment by Age by Funding Source in Madison
Out of a total of 127 students who are enrolled in schools in Madison, 16 (12.6%) attend a private institution, while the remaining 111 (87.4%) are enrolled in public schools. The age group of 3 to 4 year olds has the highest likelihood of being enrolled in private schools, with 6 (46.2% in the age bracket) enrolled. Conversely, the age group of 5 to 9 year old has the lowest likelihood of being enrolled in a private school, with 24 (100.0% in the age bracket) attending a public institution.
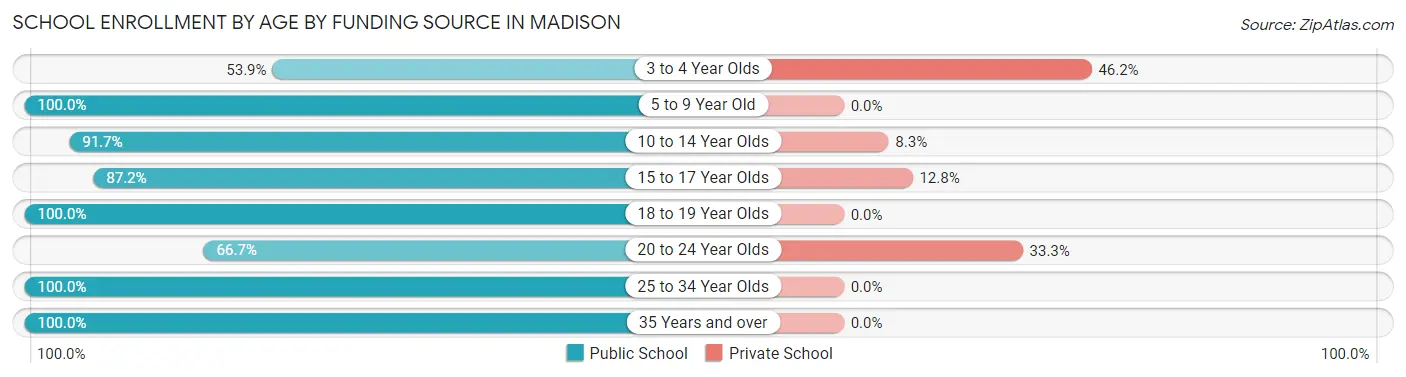
| Age Bracket | Public School | Private School |
| 3 to 4 Year Olds | 7 (53.8%) | 6 (46.2%) |
| 5 to 9 Year Old | 24 (100.0%) | 0 (0.0%) |
| 10 to 14 Year Olds | 33 (91.7%) | 3 (8.3%) |
| 15 to 17 Year Olds | 34 (87.2%) | 5 (12.8%) |
| 18 to 19 Year Olds | 2 (100.0%) | 0 (0.0%) |
| 20 to 24 Year Olds | 4 (66.7%) | 2 (33.3%) |
| 25 to 34 Year Olds | 5 (100.0%) | 0 (0.0%) |
| 35 Years and over | 2 (100.0%) | 0 (0.0%) |
| Total | 111 (87.4%) | 16 (12.6%) |
Educational Attainment by Field of Study in Madison
Business (12 | 24.5%), education (10 | 20.4%), science & technology (6 | 12.2%), bio, nature & agricultural (5 | 10.2%), and arts & humanities (5 | 10.2%) are the most common fields of study among 49 individuals in Madison who have obtained a bachelor's degree or higher.
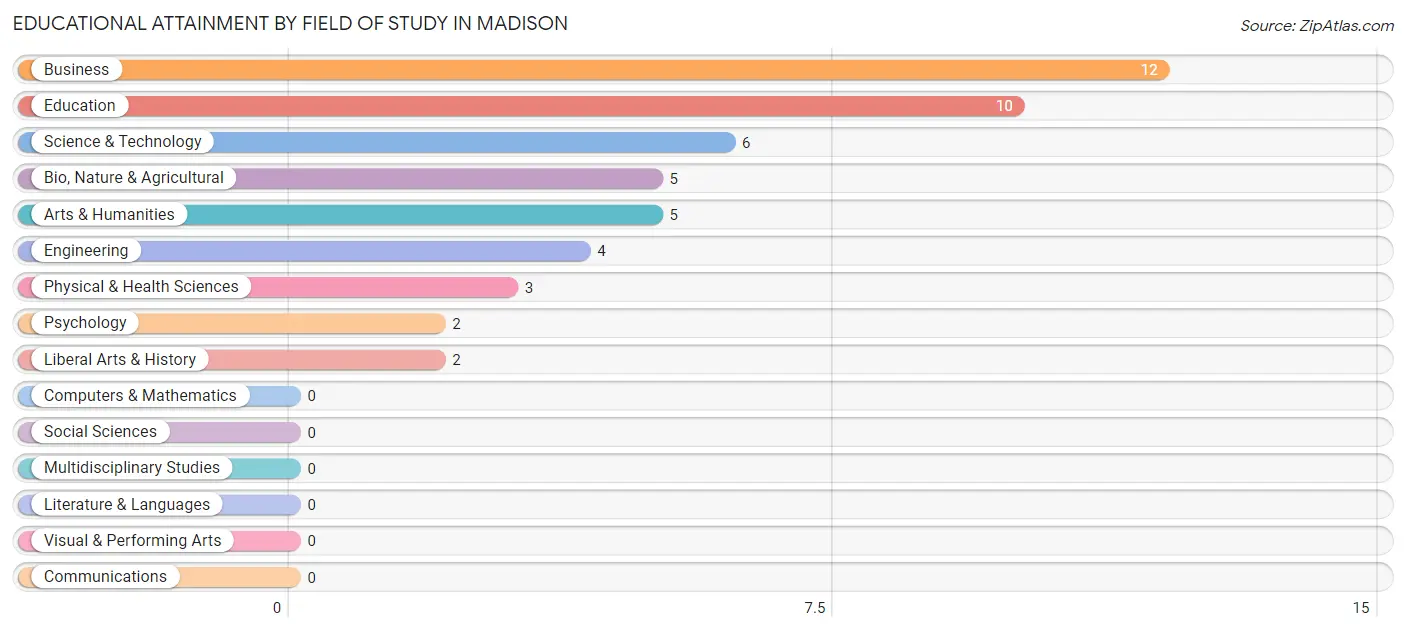
| Field of Study | # Graduates | % Graduates |
| Computers & Mathematics | 0 | 0.0% |
| Bio, Nature & Agricultural | 5 | 10.2% |
| Physical & Health Sciences | 3 | 6.1% |
| Psychology | 2 | 4.1% |
| Social Sciences | 0 | 0.0% |
| Engineering | 4 | 8.2% |
| Multidisciplinary Studies | 0 | 0.0% |
| Science & Technology | 6 | 12.2% |
| Business | 12 | 24.5% |
| Education | 10 | 20.4% |
| Literature & Languages | 0 | 0.0% |
| Liberal Arts & History | 2 | 4.1% |
| Visual & Performing Arts | 0 | 0.0% |
| Communications | 0 | 0.0% |
| Arts & Humanities | 5 | 10.2% |
| Total | 49 | 100.0% |
Transportation & Commute in Madison
Vehicle Availability by Sex in Madison
The most prevalent vehicle ownership categories in Madison are males with 1 vehicle (31, accounting for 36.0%) and females with 1 vehicle (25, making up 47.0%).
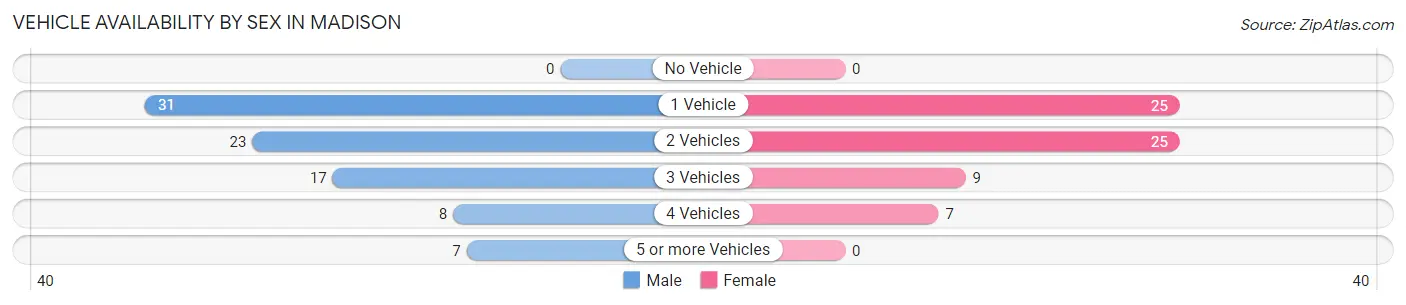
| Vehicles Available | Male | Female |
| No Vehicle | 0 (0.0%) | 0 (0.0%) |
| 1 Vehicle | 31 (36.0%) | 25 (37.9%) |
| 2 Vehicles | 23 (26.7%) | 25 (37.9%) |
| 3 Vehicles | 17 (19.8%) | 9 (13.6%) |
| 4 Vehicles | 8 (9.3%) | 7 (10.6%) |
| 5 or more Vehicles | 7 (8.1%) | 0 (0.0%) |
| Total | 86 (100.0%) | 66 (100.0%) |
Commute Time in Madison
The most frequently occuring commute durations in Madison are 30 to 34 minutes (33 commuters, 23.9%), 15 to 19 minutes (26 commuters, 18.8%), and 10 to 14 minutes (22 commuters, 15.9%).
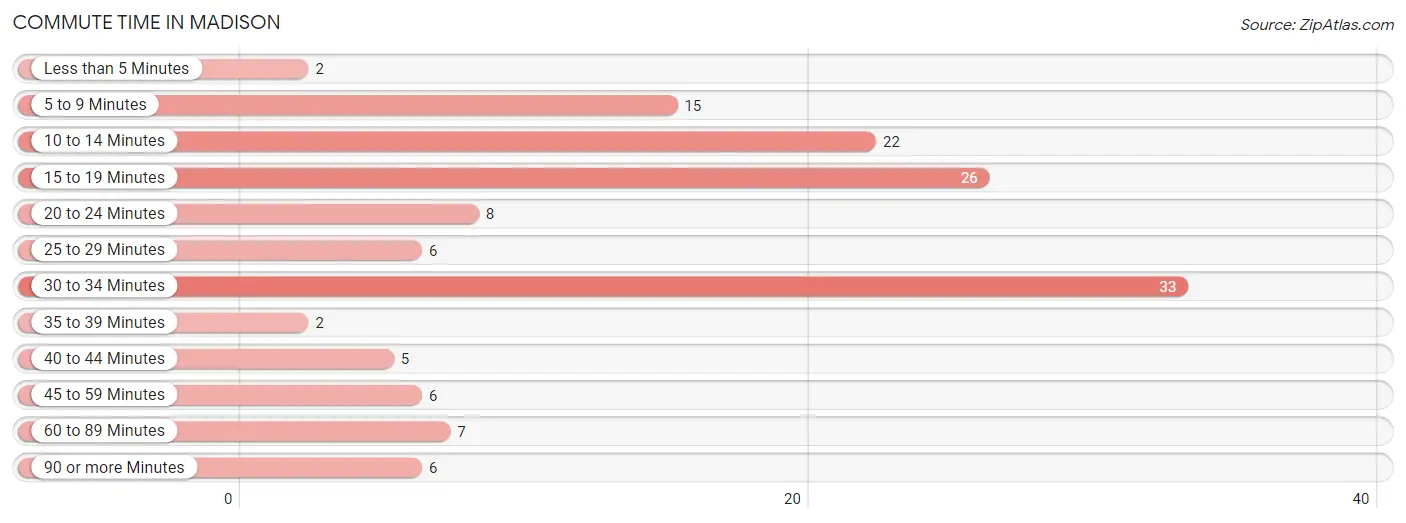
| Commute Time | # Commuters | % Commuters |
| Less than 5 Minutes | 2 | 1.5% |
| 5 to 9 Minutes | 15 | 10.9% |
| 10 to 14 Minutes | 22 | 15.9% |
| 15 to 19 Minutes | 26 | 18.8% |
| 20 to 24 Minutes | 8 | 5.8% |
| 25 to 29 Minutes | 6 | 4.3% |
| 30 to 34 Minutes | 33 | 23.9% |
| 35 to 39 Minutes | 2 | 1.5% |
| 40 to 44 Minutes | 5 | 3.6% |
| 45 to 59 Minutes | 6 | 4.3% |
| 60 to 89 Minutes | 7 | 5.1% |
| 90 or more Minutes | 6 | 4.3% |
Commute Time by Sex in Madison
The most common commute times in Madison are 30 to 34 minutes (24 commuters, 30.4%) for males and 10 to 14 minutes (14 commuters, 23.7%) for females.
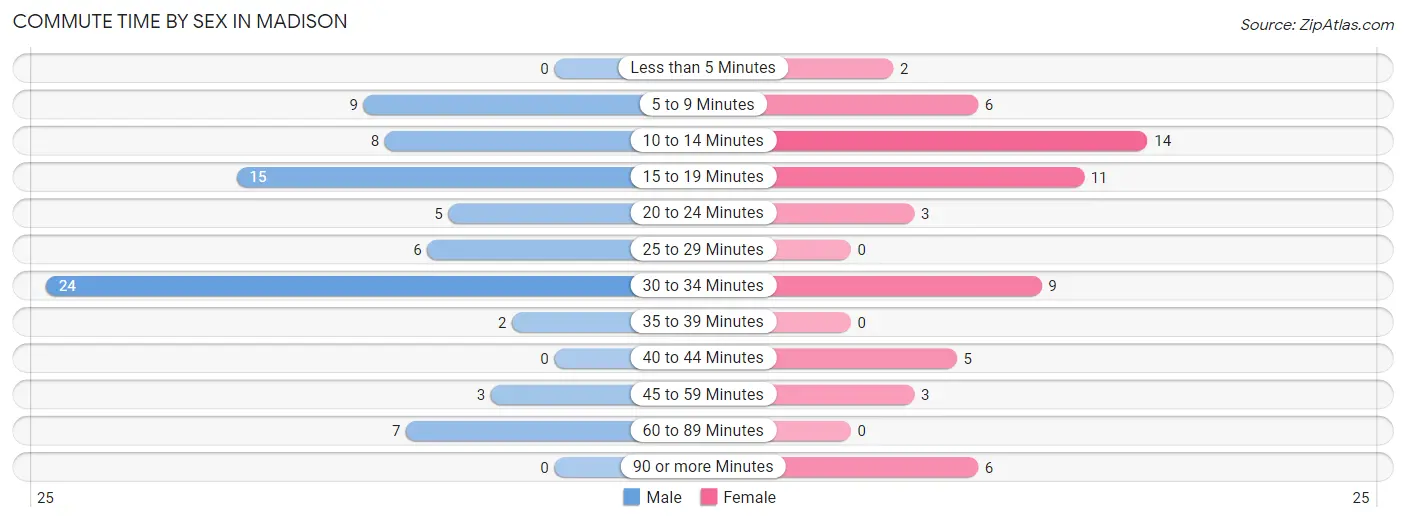
| Commute Time | Male | Female |
| Less than 5 Minutes | 0 (0.0%) | 2 (3.4%) |
| 5 to 9 Minutes | 9 (11.4%) | 6 (10.2%) |
| 10 to 14 Minutes | 8 (10.1%) | 14 (23.7%) |
| 15 to 19 Minutes | 15 (19.0%) | 11 (18.6%) |
| 20 to 24 Minutes | 5 (6.3%) | 3 (5.1%) |
| 25 to 29 Minutes | 6 (7.6%) | 0 (0.0%) |
| 30 to 34 Minutes | 24 (30.4%) | 9 (15.2%) |
| 35 to 39 Minutes | 2 (2.5%) | 0 (0.0%) |
| 40 to 44 Minutes | 0 (0.0%) | 5 (8.5%) |
| 45 to 59 Minutes | 3 (3.8%) | 3 (5.1%) |
| 60 to 89 Minutes | 7 (8.9%) | 0 (0.0%) |
| 90 or more Minutes | 0 (0.0%) | 6 (10.2%) |
Time of Departure to Work by Sex in Madison
The most frequent times of departure to work in Madison are 7:00 AM to 7:29 AM (17, 21.5%) for males and 6:30 AM to 6:59 AM (16, 27.1%) for females.
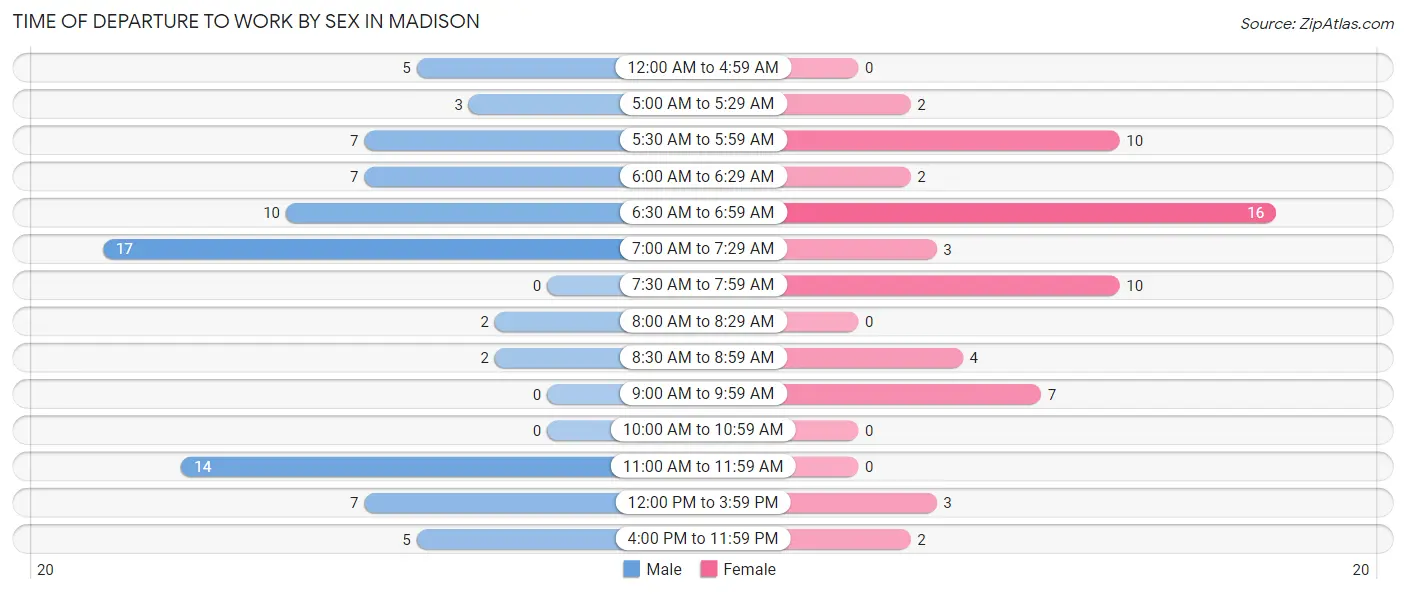
| Time of Departure | Male | Female |
| 12:00 AM to 4:59 AM | 5 (6.3%) | 0 (0.0%) |
| 5:00 AM to 5:29 AM | 3 (3.8%) | 2 (3.4%) |
| 5:30 AM to 5:59 AM | 7 (8.9%) | 10 (17.0%) |
| 6:00 AM to 6:29 AM | 7 (8.9%) | 2 (3.4%) |
| 6:30 AM to 6:59 AM | 10 (12.7%) | 16 (27.1%) |
| 7:00 AM to 7:29 AM | 17 (21.5%) | 3 (5.1%) |
| 7:30 AM to 7:59 AM | 0 (0.0%) | 10 (17.0%) |
| 8:00 AM to 8:29 AM | 2 (2.5%) | 0 (0.0%) |
| 8:30 AM to 8:59 AM | 2 (2.5%) | 4 (6.8%) |
| 9:00 AM to 9:59 AM | 0 (0.0%) | 7 (11.9%) |
| 10:00 AM to 10:59 AM | 0 (0.0%) | 0 (0.0%) |
| 11:00 AM to 11:59 AM | 14 (17.7%) | 0 (0.0%) |
| 12:00 PM to 3:59 PM | 7 (8.9%) | 3 (5.1%) |
| 4:00 PM to 11:59 PM | 5 (6.3%) | 2 (3.4%) |
| Total | 79 (100.0%) | 59 (100.0%) |
Housing Occupancy in Madison
Occupancy by Ownership in Madison
Of the total 149 dwellings in Madison, owner-occupied units account for 94 (63.1%), while renter-occupied units make up 55 (36.9%).
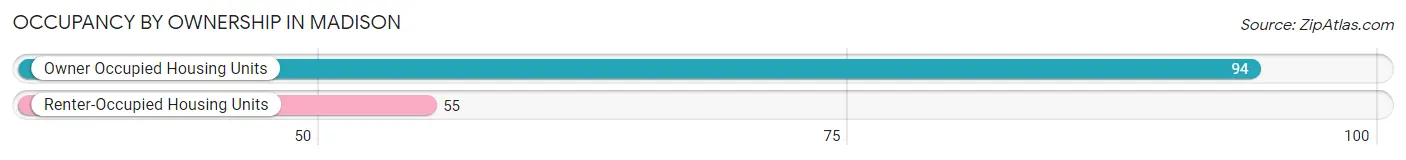
| Occupancy | # Housing Units | % Housing Units |
| Owner Occupied Housing Units | 94 | 63.1% |
| Renter-Occupied Housing Units | 55 | 36.9% |
| Total Occupied Housing Units | 149 | 100.0% |
Occupancy by Household Size in Madison
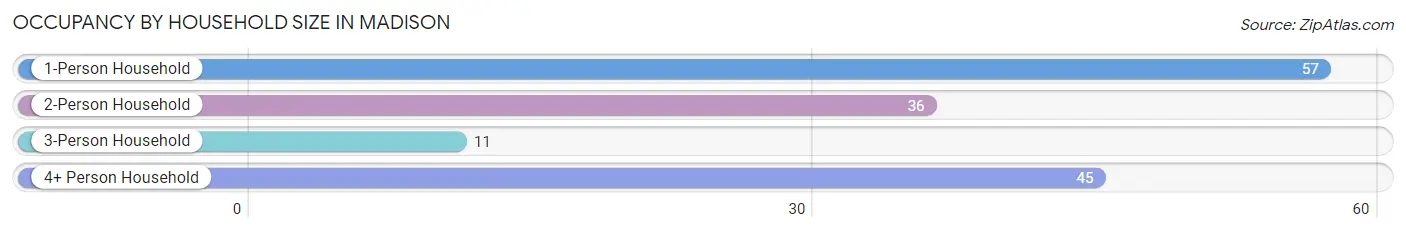
| Household Size | # Housing Units | % Housing Units |
| 1-Person Household | 57 | 38.3% |
| 2-Person Household | 36 | 24.2% |
| 3-Person Household | 11 | 7.4% |
| 4+ Person Household | 45 | 30.2% |
| Total Housing Units | 149 | 100.0% |
Occupancy by Ownership by Household Size in Madison
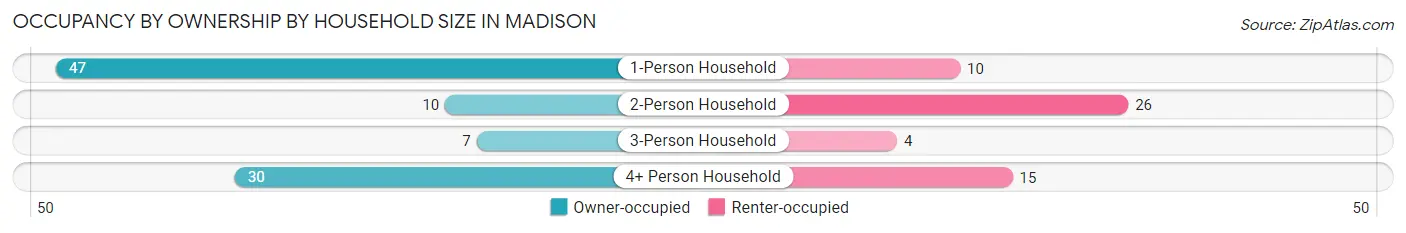
| Household Size | Owner-occupied | Renter-occupied |
| 1-Person Household | 47 (82.5%) | 10 (17.5%) |
| 2-Person Household | 10 (27.8%) | 26 (72.2%) |
| 3-Person Household | 7 (63.6%) | 4 (36.4%) |
| 4+ Person Household | 30 (66.7%) | 15 (33.3%) |
| Total Housing Units | 94 (63.1%) | 55 (36.9%) |
Occupancy by Educational Attainment in Madison
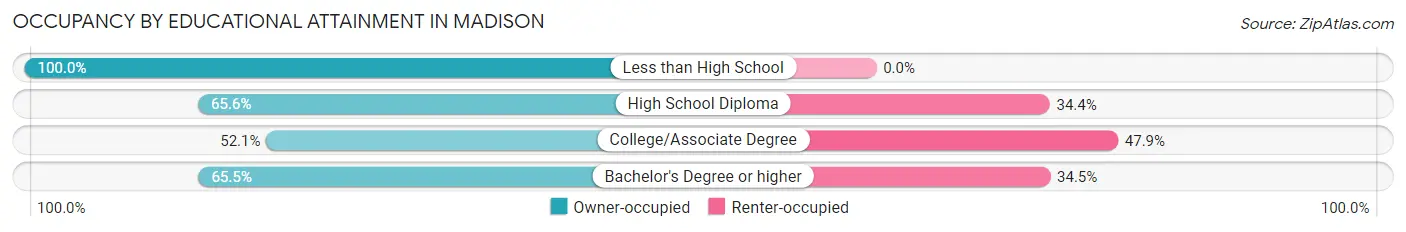
| Household Size | Owner-occupied | Renter-occupied |
| Less than High School | 8 (100.0%) | 0 (0.0%) |
| High School Diploma | 42 (65.6%) | 22 (34.4%) |
| College/Associate Degree | 25 (52.1%) | 23 (47.9%) |
| Bachelor's Degree or higher | 19 (65.5%) | 10 (34.5%) |
Occupancy by Age of Householder in Madison
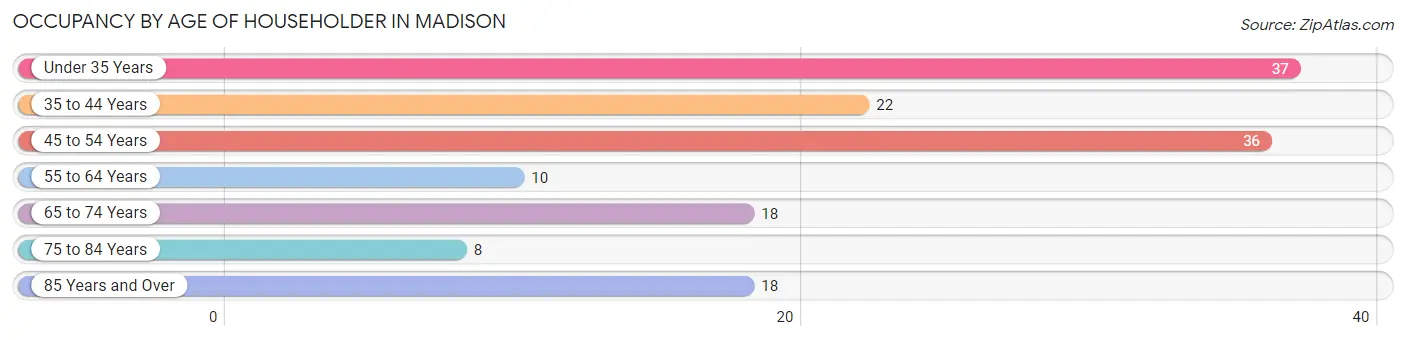
| Age Bracket | # Households | % Households |
| Under 35 Years | 37 | 24.8% |
| 35 to 44 Years | 22 | 14.8% |
| 45 to 54 Years | 36 | 24.2% |
| 55 to 64 Years | 10 | 6.7% |
| 65 to 74 Years | 18 | 12.1% |
| 75 to 84 Years | 8 | 5.4% |
| 85 Years and Over | 18 | 12.1% |
| Total | 149 | 100.0% |
Housing Finances in Madison
Median Income by Occupancy in Madison
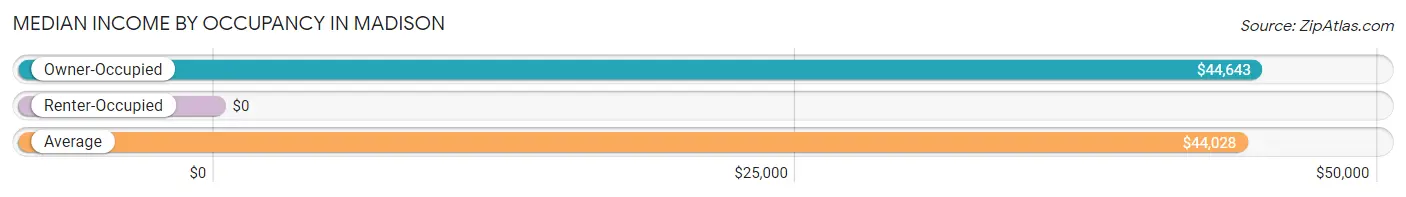
| Occupancy Type | # Households | Median Income |
| Owner-Occupied | 94 (63.1%) | $44,643 |
| Renter-Occupied | 55 (36.9%) | $0 |
| Average | 149 (100.0%) | $44,028 |
Occupancy by Householder Income Bracket in Madison
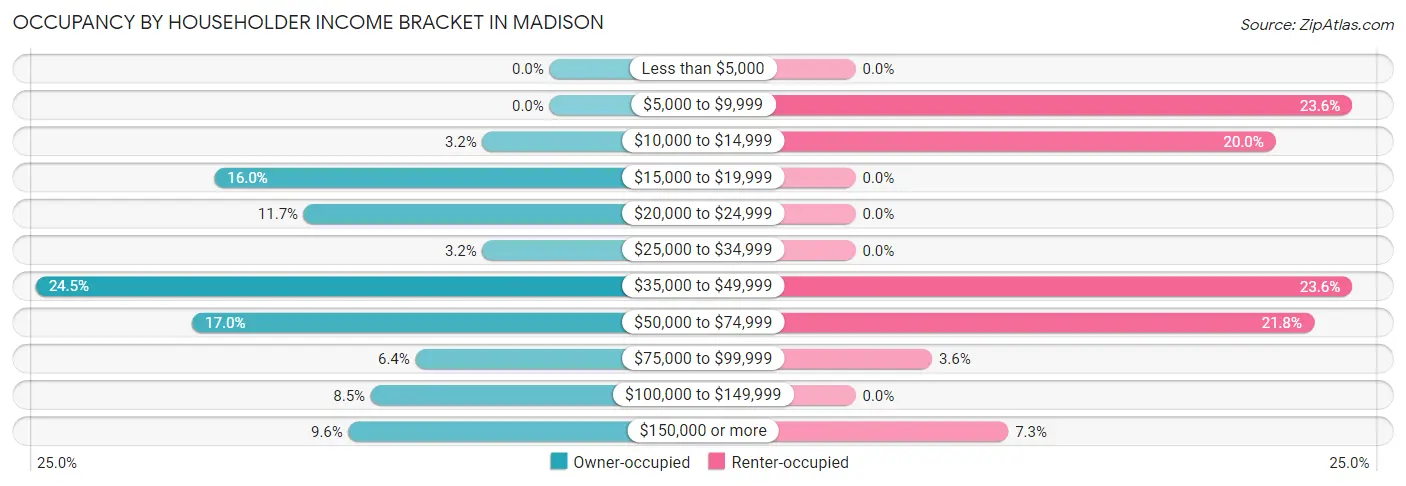
| Income Bracket | Owner-occupied | Renter-occupied |
| Less than $5,000 | 0 (0.0%) | 0 (0.0%) |
| $5,000 to $9,999 | 0 (0.0%) | 13 (23.6%) |
| $10,000 to $14,999 | 3 (3.2%) | 11 (20.0%) |
| $15,000 to $19,999 | 15 (16.0%) | 0 (0.0%) |
| $20,000 to $24,999 | 11 (11.7%) | 0 (0.0%) |
| $25,000 to $34,999 | 3 (3.2%) | 0 (0.0%) |
| $35,000 to $49,999 | 23 (24.5%) | 13 (23.6%) |
| $50,000 to $74,999 | 16 (17.0%) | 12 (21.8%) |
| $75,000 to $99,999 | 6 (6.4%) | 2 (3.6%) |
| $100,000 to $149,999 | 8 (8.5%) | 0 (0.0%) |
| $150,000 or more | 9 (9.6%) | 4 (7.3%) |
| Total | 94 (100.0%) | 55 (100.0%) |
Monthly Housing Cost Tiers in Madison
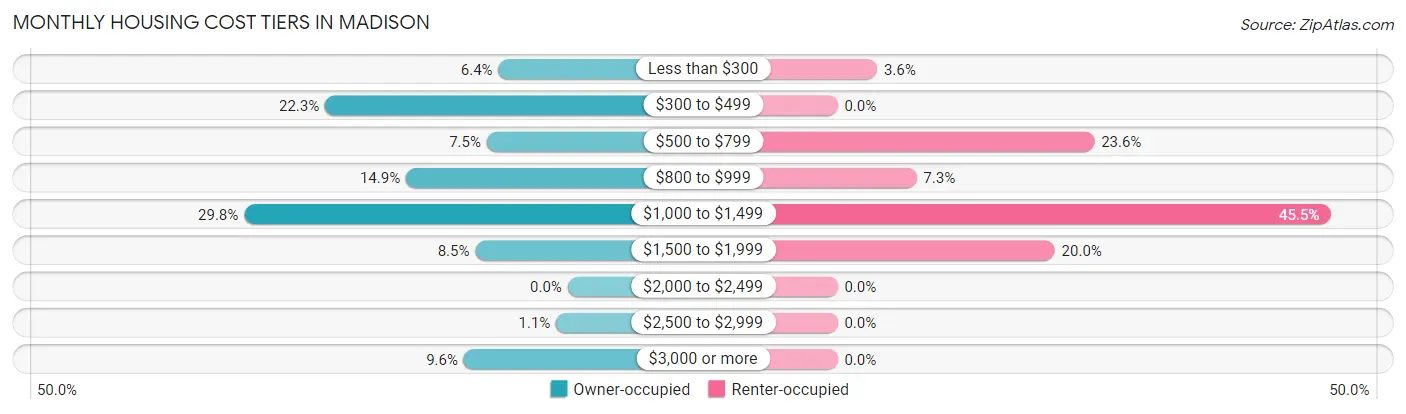
| Monthly Cost | Owner-occupied | Renter-occupied |
| Less than $300 | 6 (6.4%) | 2 (3.6%) |
| $300 to $499 | 21 (22.3%) | 0 (0.0%) |
| $500 to $799 | 7 (7.4%) | 13 (23.6%) |
| $800 to $999 | 14 (14.9%) | 4 (7.3%) |
| $1,000 to $1,499 | 28 (29.8%) | 25 (45.5%) |
| $1,500 to $1,999 | 8 (8.5%) | 11 (20.0%) |
| $2,000 to $2,499 | 0 (0.0%) | 0 (0.0%) |
| $2,500 to $2,999 | 1 (1.1%) | 0 (0.0%) |
| $3,000 or more | 9 (9.6%) | 0 (0.0%) |
| Total | 94 (100.0%) | 55 (100.0%) |
Physical Housing Characteristics in Madison
Housing Structures in Madison
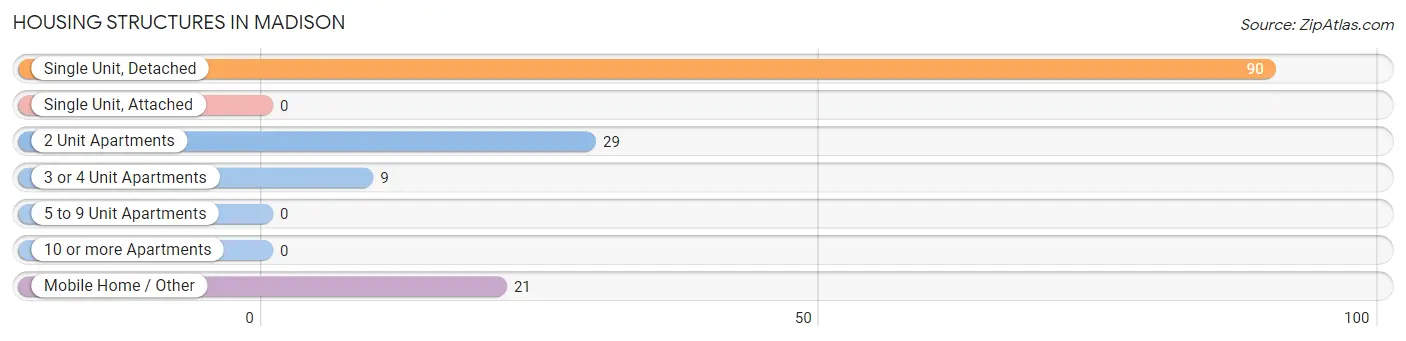
| Structure Type | # Housing Units | % Housing Units |
| Single Unit, Detached | 90 | 60.4% |
| Single Unit, Attached | 0 | 0.0% |
| 2 Unit Apartments | 29 | 19.5% |
| 3 or 4 Unit Apartments | 9 | 6.0% |
| 5 to 9 Unit Apartments | 0 | 0.0% |
| 10 or more Apartments | 0 | 0.0% |
| Mobile Home / Other | 21 | 14.1% |
| Total | 149 | 100.0% |
Housing Structures by Occupancy in Madison
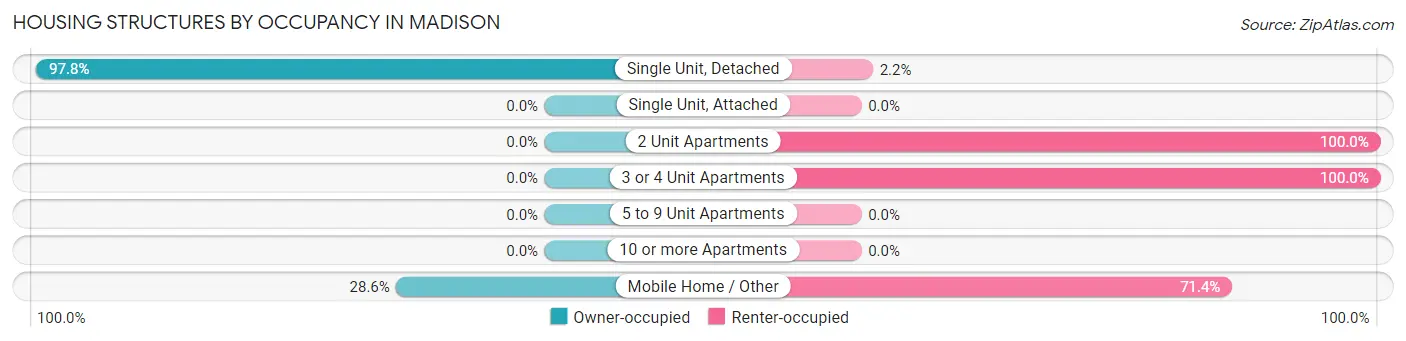
| Structure Type | Owner-occupied | Renter-occupied |
| Single Unit, Detached | 88 (97.8%) | 2 (2.2%) |
| Single Unit, Attached | 0 (0.0%) | 0 (0.0%) |
| 2 Unit Apartments | 0 (0.0%) | 29 (100.0%) |
| 3 or 4 Unit Apartments | 0 (0.0%) | 9 (100.0%) |
| 5 to 9 Unit Apartments | 0 (0.0%) | 0 (0.0%) |
| 10 or more Apartments | 0 (0.0%) | 0 (0.0%) |
| Mobile Home / Other | 6 (28.6%) | 15 (71.4%) |
| Total | 94 (63.1%) | 55 (36.9%) |
Housing Structures by Number of Rooms in Madison
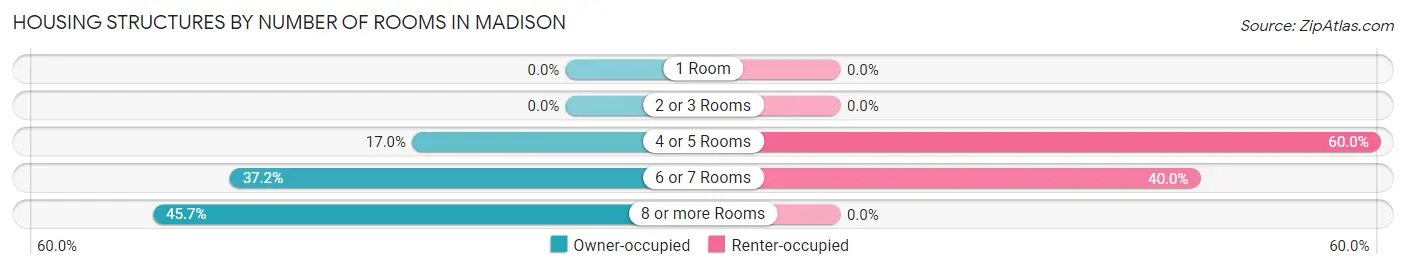
| Number of Rooms | Owner-occupied | Renter-occupied |
| 1 Room | 0 (0.0%) | 0 (0.0%) |
| 2 or 3 Rooms | 0 (0.0%) | 0 (0.0%) |
| 4 or 5 Rooms | 16 (17.0%) | 33 (60.0%) |
| 6 or 7 Rooms | 35 (37.2%) | 22 (40.0%) |
| 8 or more Rooms | 43 (45.7%) | 0 (0.0%) |
| Total | 94 (100.0%) | 55 (100.0%) |
Housing Structure by Heating Type in Madison
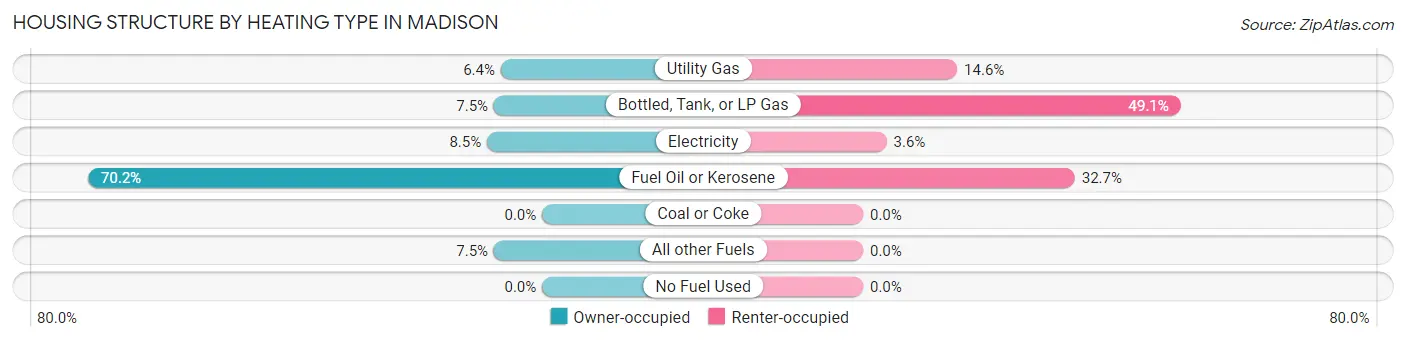
| Heating Type | Owner-occupied | Renter-occupied |
| Utility Gas | 6 (6.4%) | 8 (14.5%) |
| Bottled, Tank, or LP Gas | 7 (7.4%) | 27 (49.1%) |
| Electricity | 8 (8.5%) | 2 (3.6%) |
| Fuel Oil or Kerosene | 66 (70.2%) | 18 (32.7%) |
| Coal or Coke | 0 (0.0%) | 0 (0.0%) |
| All other Fuels | 7 (7.4%) | 0 (0.0%) |
| No Fuel Used | 0 (0.0%) | 0 (0.0%) |
| Total | 94 (100.0%) | 55 (100.0%) |
Household Vehicle Usage in Madison
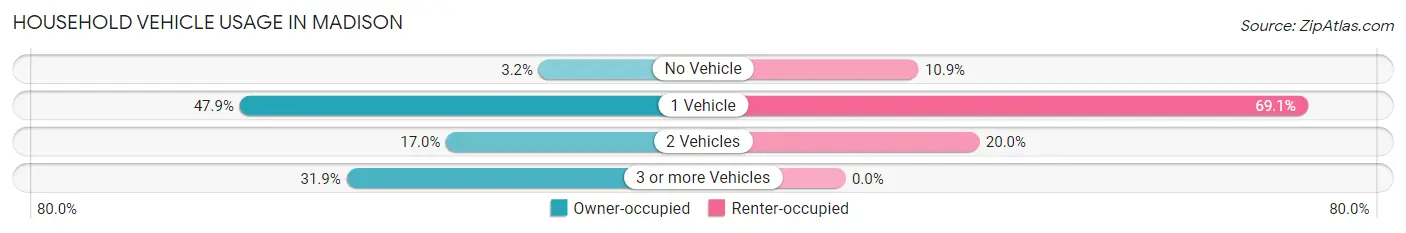
| Vehicles per Household | Owner-occupied | Renter-occupied |
| No Vehicle | 3 (3.2%) | 6 (10.9%) |
| 1 Vehicle | 45 (47.9%) | 38 (69.1%) |
| 2 Vehicles | 16 (17.0%) | 11 (20.0%) |
| 3 or more Vehicles | 30 (31.9%) | 0 (0.0%) |
| Total | 94 (100.0%) | 55 (100.0%) |
Real Estate & Mortgages in Madison
Real Estate and Mortgage Overview in Madison
| Characteristic | Without Mortgage | With Mortgage |
| Housing Units | 51 | 43 |
| Median Property Value | $90,900 | $123,200 |
| Median Household Income | $30,417 | $4 |
| Monthly Housing Costs | $492 | $9 |
| Real Estate Taxes | $2,273 | $3 |
Property Value by Mortgage Status in Madison
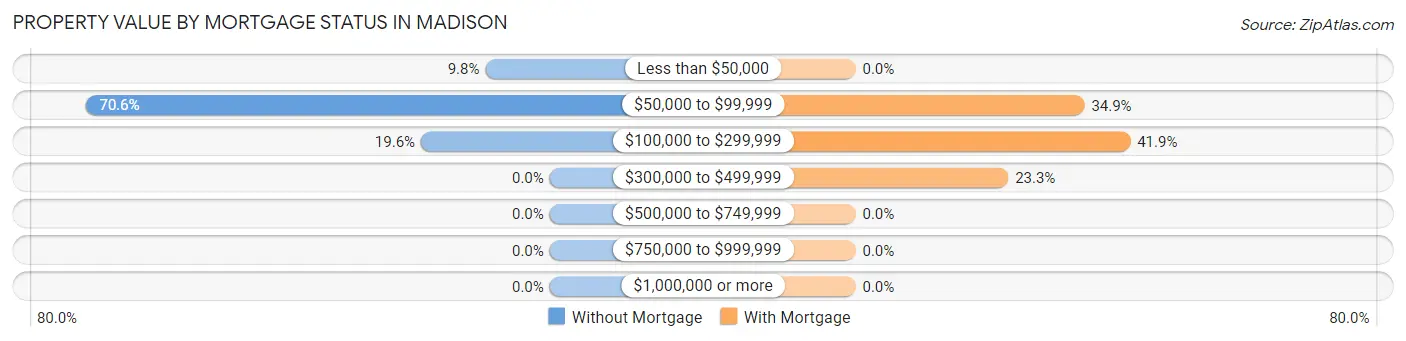
| Property Value | Without Mortgage | With Mortgage |
| Less than $50,000 | 5 (9.8%) | 0 (0.0%) |
| $50,000 to $99,999 | 36 (70.6%) | 15 (34.9%) |
| $100,000 to $299,999 | 10 (19.6%) | 18 (41.9%) |
| $300,000 to $499,999 | 0 (0.0%) | 10 (23.3%) |
| $500,000 to $749,999 | 0 (0.0%) | 0 (0.0%) |
| $750,000 to $999,999 | 0 (0.0%) | 0 (0.0%) |
| $1,000,000 or more | 0 (0.0%) | 0 (0.0%) |
| Total | 51 (100.0%) | 43 (100.0%) |
Household Income by Mortgage Status in Madison
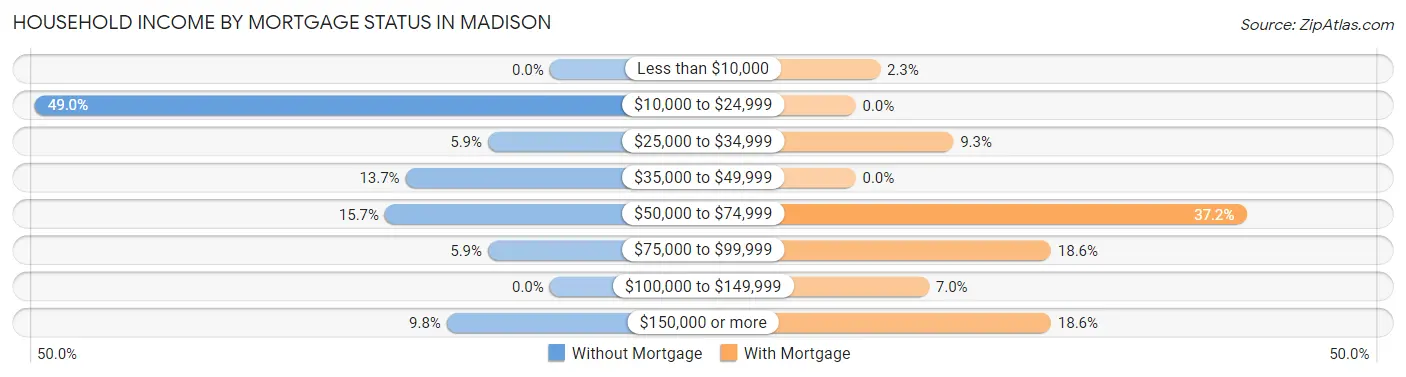
| Household Income | Without Mortgage | With Mortgage |
| Less than $10,000 | 0 (0.0%) | 1 (2.3%) |
| $10,000 to $24,999 | 25 (49.0%) | 0 (0.0%) |
| $25,000 to $34,999 | 3 (5.9%) | 4 (9.3%) |
| $35,000 to $49,999 | 7 (13.7%) | 0 (0.0%) |
| $50,000 to $74,999 | 8 (15.7%) | 16 (37.2%) |
| $75,000 to $99,999 | 3 (5.9%) | 8 (18.6%) |
| $100,000 to $149,999 | 0 (0.0%) | 3 (7.0%) |
| $150,000 or more | 5 (9.8%) | 8 (18.6%) |
| Total | 51 (100.0%) | 43 (100.0%) |
Property Value to Household Income Ratio in Madison
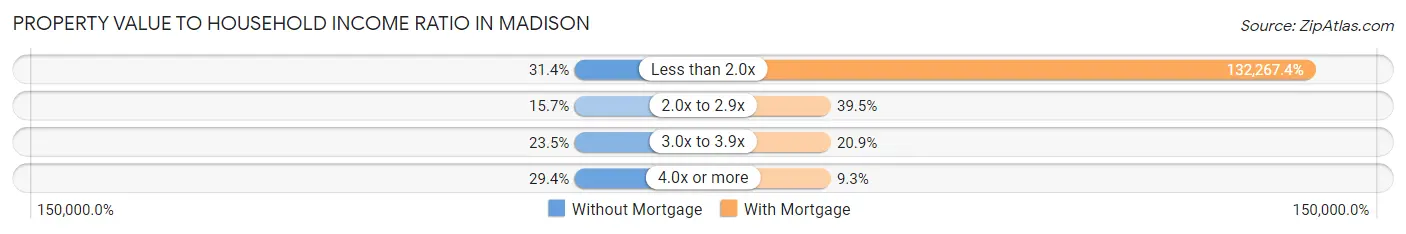
| Value-to-Income Ratio | Without Mortgage | With Mortgage |
| Less than 2.0x | 16 (31.4%) | 56,875 (132,267.4%) |
| 2.0x to 2.9x | 8 (15.7%) | 17 (39.5%) |
| 3.0x to 3.9x | 12 (23.5%) | 9 (20.9%) |
| 4.0x or more | 15 (29.4%) | 4 (9.3%) |
| Total | 51 (100.0%) | 43 (100.0%) |
Real Estate Taxes by Mortgage Status in Madison
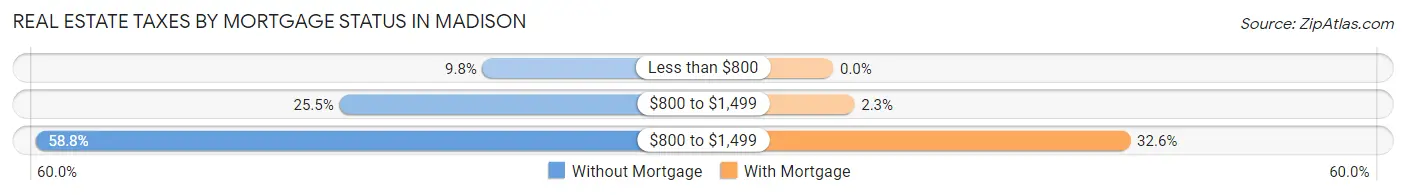
| Property Taxes | Without Mortgage | With Mortgage |
| Less than $800 | 5 (9.8%) | 0 (0.0%) |
| $800 to $1,499 | 13 (25.5%) | 1 (2.3%) |
| $800 to $1,499 | 30 (58.8%) | 14 (32.6%) |
| Total | 51 (100.0%) | 43 (100.0%) |
Health & Disability in Madison
Health Insurance Coverage by Age in Madison
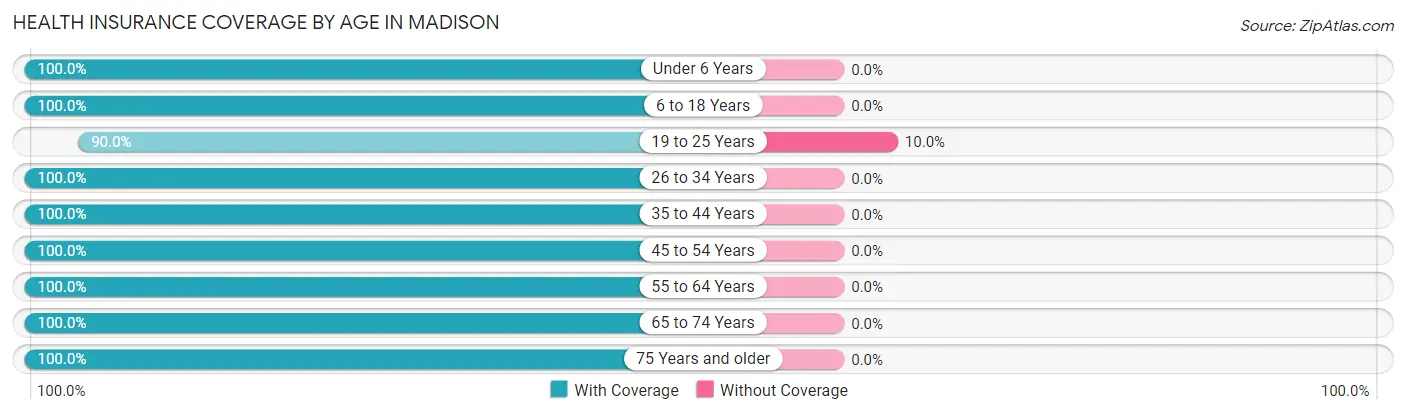
| Age Bracket | With Coverage | Without Coverage |
| Under 6 Years | 55 (100.0%) | 0 (0.0%) |
| 6 to 18 Years | 87 (100.0%) | 0 (0.0%) |
| 19 to 25 Years | 45 (90.0%) | 5 (10.0%) |
| 26 to 34 Years | 30 (100.0%) | 0 (0.0%) |
| 35 to 44 Years | 36 (100.0%) | 0 (0.0%) |
| 45 to 54 Years | 49 (100.0%) | 0 (0.0%) |
| 55 to 64 Years | 15 (100.0%) | 0 (0.0%) |
| 65 to 74 Years | 24 (100.0%) | 0 (0.0%) |
| 75 Years and older | 36 (100.0%) | 0 (0.0%) |
| Total | 377 (98.7%) | 5 (1.3%) |
Health Insurance Coverage by Citizenship Status in Madison
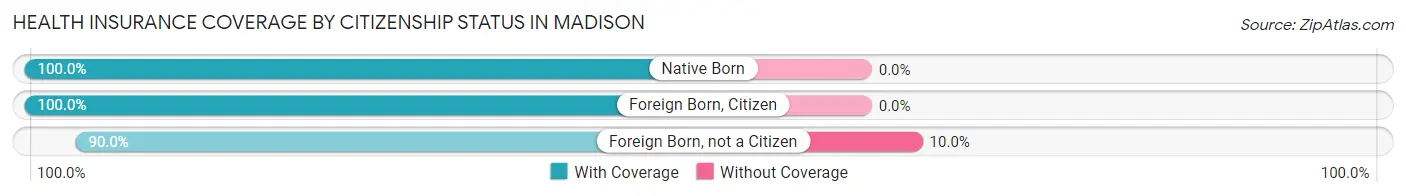
| Citizenship Status | With Coverage | Without Coverage |
| Native Born | 55 (100.0%) | 0 (0.0%) |
| Foreign Born, Citizen | 87 (100.0%) | 0 (0.0%) |
| Foreign Born, not a Citizen | 45 (90.0%) | 5 (10.0%) |
Health Insurance Coverage by Household Income in Madison
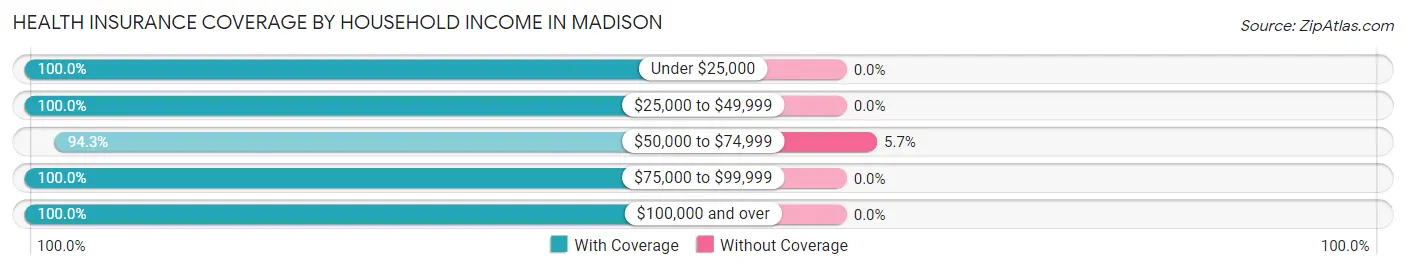
| Household Income | With Coverage | Without Coverage |
| Under $25,000 | 85 (100.0%) | 0 (0.0%) |
| $25,000 to $49,999 | 98 (100.0%) | 0 (0.0%) |
| $50,000 to $74,999 | 83 (94.3%) | 5 (5.7%) |
| $75,000 to $99,999 | 29 (100.0%) | 0 (0.0%) |
| $100,000 and over | 82 (100.0%) | 0 (0.0%) |
Public vs Private Health Insurance Coverage by Age in Madison
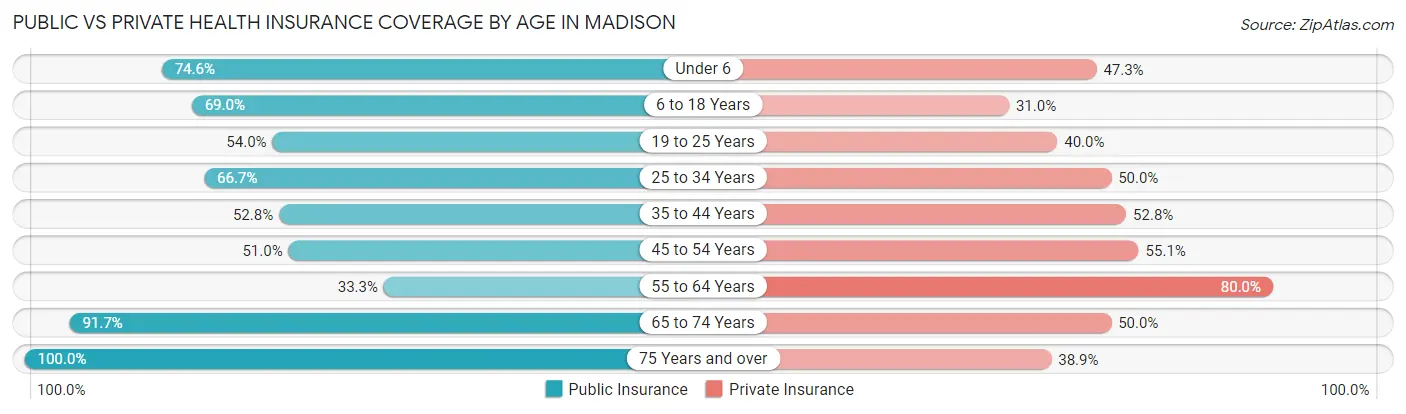
| Age Bracket | Public Insurance | Private Insurance |
| Under 6 | 41 (74.6%) | 26 (47.3%) |
| 6 to 18 Years | 60 (69.0%) | 27 (31.0%) |
| 19 to 25 Years | 27 (54.0%) | 20 (40.0%) |
| 25 to 34 Years | 20 (66.7%) | 15 (50.0%) |
| 35 to 44 Years | 19 (52.8%) | 19 (52.8%) |
| 45 to 54 Years | 25 (51.0%) | 27 (55.1%) |
| 55 to 64 Years | 5 (33.3%) | 12 (80.0%) |
| 65 to 74 Years | 22 (91.7%) | 12 (50.0%) |
| 75 Years and over | 36 (100.0%) | 14 (38.9%) |
| Total | 255 (66.7%) | 172 (45.0%) |
Disability Status by Sex by Age in Madison
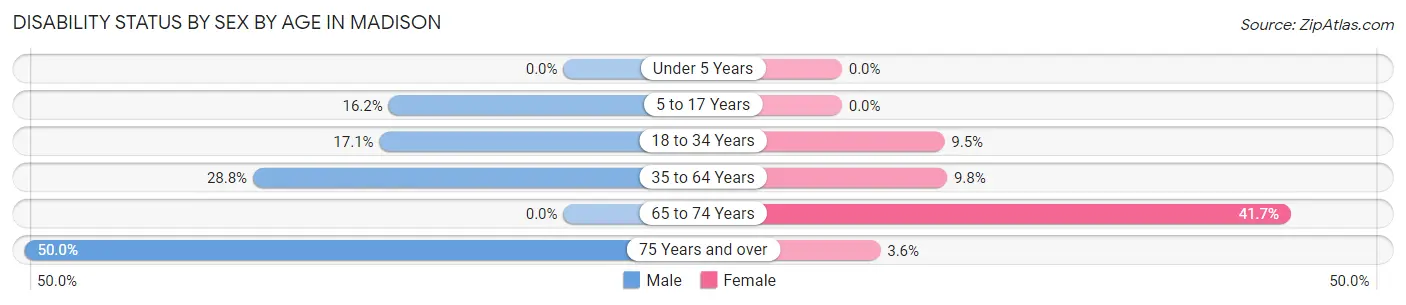
| Age Bracket | Male | Female |
| Under 5 Years | 0 (0.0%) | 0 (0.0%) |
| 5 to 17 Years | 6 (16.2%) | 0 (0.0%) |
| 18 to 34 Years | 7 (17.1%) | 4 (9.5%) |
| 35 to 64 Years | 17 (28.8%) | 4 (9.8%) |
| 65 to 74 Years | 0 (0.0%) | 5 (41.7%) |
| 75 Years and over | 4 (50.0%) | 1 (3.6%) |
Disability Class by Sex by Age in Madison
Disability Class: Hearing Difficulty
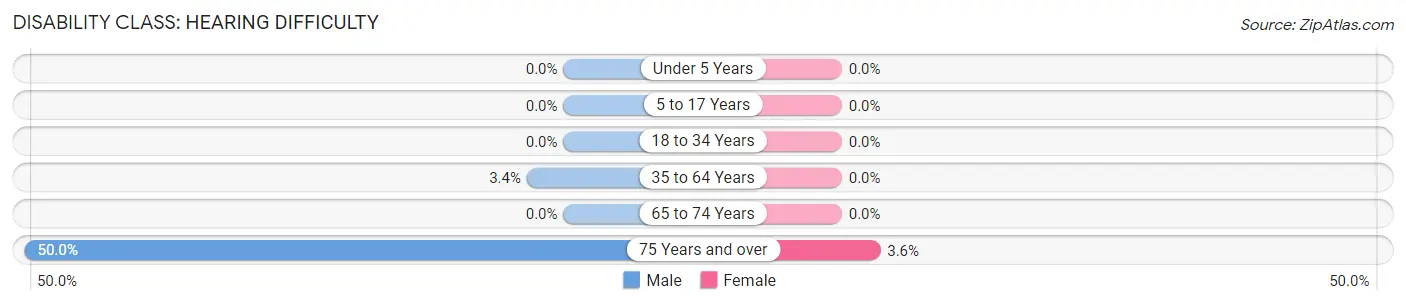
| Age Bracket | Male | Female |
| Under 5 Years | 0 (0.0%) | 0 (0.0%) |
| 5 to 17 Years | 0 (0.0%) | 0 (0.0%) |
| 18 to 34 Years | 0 (0.0%) | 0 (0.0%) |
| 35 to 64 Years | 2 (3.4%) | 0 (0.0%) |
| 65 to 74 Years | 0 (0.0%) | 0 (0.0%) |
| 75 Years and over | 4 (50.0%) | 1 (3.6%) |
Disability Class: Vision Difficulty
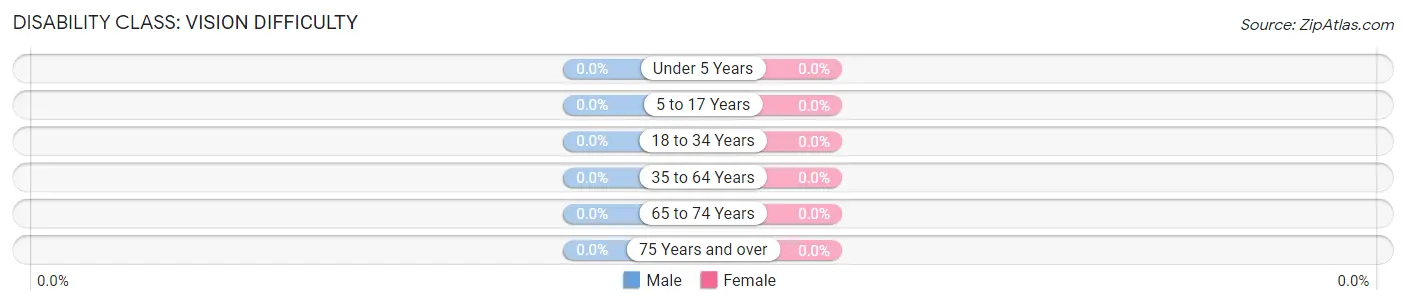
| Age Bracket | Male | Female |
| Under 5 Years | 0 (0.0%) | 0 (0.0%) |
| 5 to 17 Years | 0 (0.0%) | 0 (0.0%) |
| 18 to 34 Years | 0 (0.0%) | 0 (0.0%) |
| 35 to 64 Years | 0 (0.0%) | 0 (0.0%) |
| 65 to 74 Years | 0 (0.0%) | 0 (0.0%) |
| 75 Years and over | 0 (0.0%) | 0 (0.0%) |
Disability Class: Cognitive Difficulty
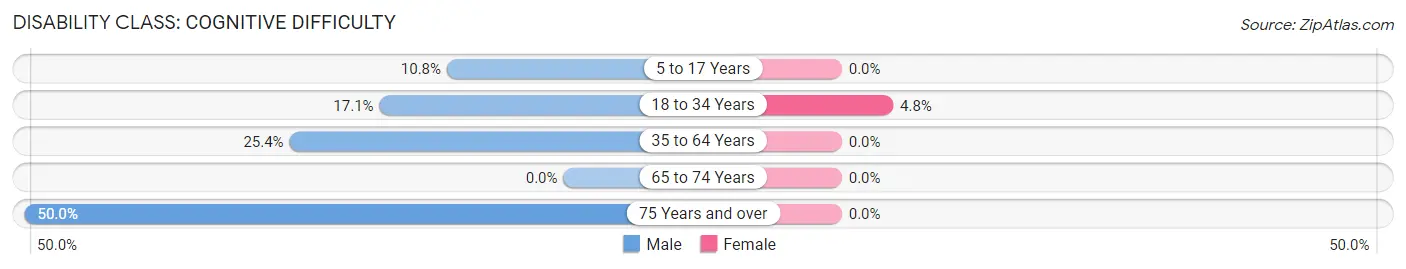
| Age Bracket | Male | Female |
| 5 to 17 Years | 4 (10.8%) | 0 (0.0%) |
| 18 to 34 Years | 7 (17.1%) | 2 (4.8%) |
| 35 to 64 Years | 15 (25.4%) | 0 (0.0%) |
| 65 to 74 Years | 0 (0.0%) | 0 (0.0%) |
| 75 Years and over | 4 (50.0%) | 0 (0.0%) |
Disability Class: Ambulatory Difficulty
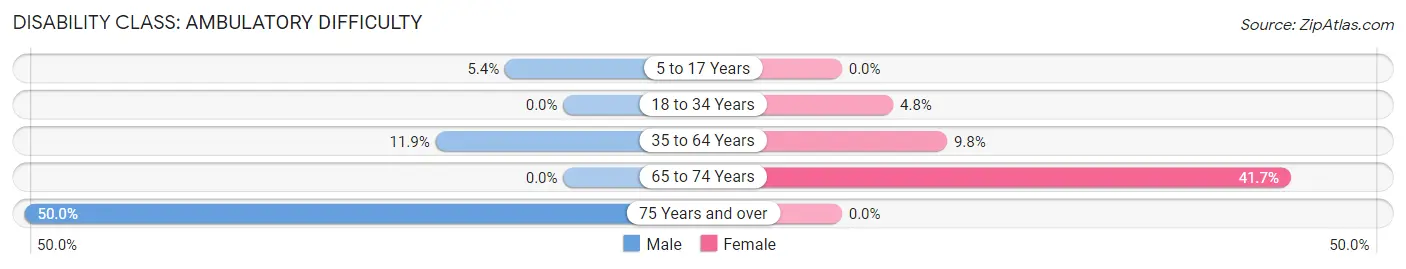
| Age Bracket | Male | Female |
| 5 to 17 Years | 2 (5.4%) | 0 (0.0%) |
| 18 to 34 Years | 0 (0.0%) | 2 (4.8%) |
| 35 to 64 Years | 7 (11.9%) | 4 (9.8%) |
| 65 to 74 Years | 0 (0.0%) | 5 (41.7%) |
| 75 Years and over | 4 (50.0%) | 0 (0.0%) |
Disability Class: Self-Care Difficulty
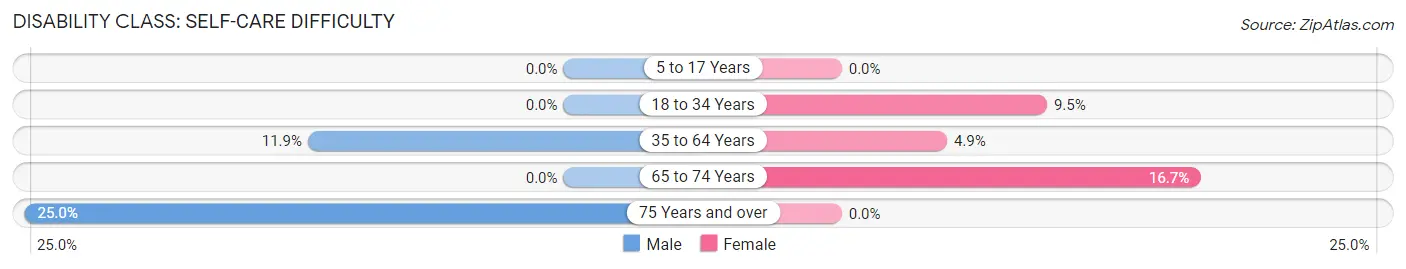
| Age Bracket | Male | Female |
| 5 to 17 Years | 0 (0.0%) | 0 (0.0%) |
| 18 to 34 Years | 0 (0.0%) | 4 (9.5%) |
| 35 to 64 Years | 7 (11.9%) | 2 (4.9%) |
| 65 to 74 Years | 0 (0.0%) | 2 (16.7%) |
| 75 Years and over | 2 (25.0%) | 0 (0.0%) |
Technology Access in Madison
Computing Device Access in Madison
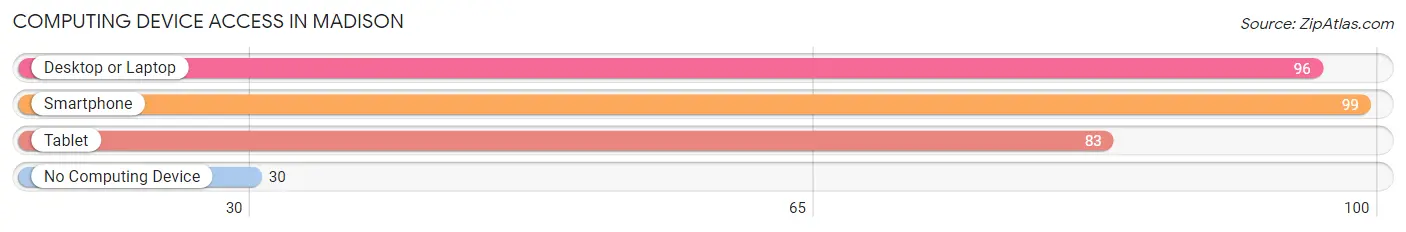
| Device Type | # Households | % Households |
| Desktop or Laptop | 96 | 64.4% |
| Smartphone | 99 | 66.4% |
| Tablet | 83 | 55.7% |
| No Computing Device | 30 | 20.1% |
| Total | 149 | 100.0% |
Internet Access in Madison
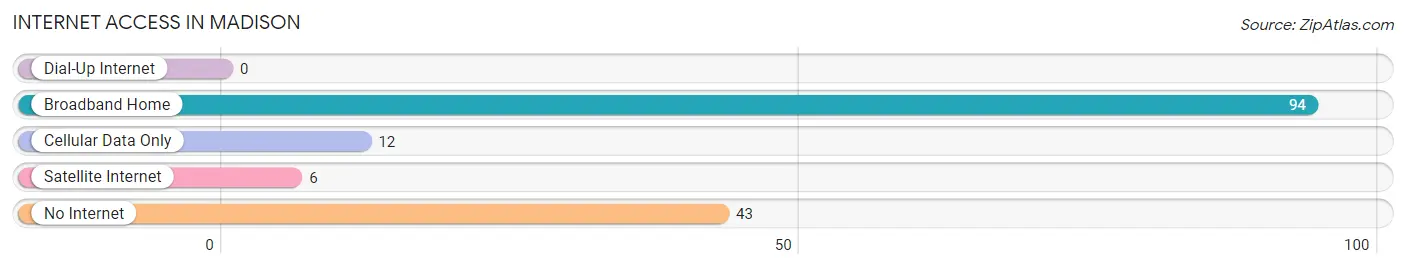
| Internet Type | # Households | % Households |
| Dial-Up Internet | 0 | 0.0% |
| Broadband Home | 94 | 63.1% |
| Cellular Data Only | 12 | 8.1% |
| Satellite Internet | 6 | 4.0% |
| No Internet | 43 | 28.9% |
| Total | 149 | 100.0% |
Madison Summary
Madison is a town located in Madison County, New York, United States. The population was 5,967 at the 2010 census. It is located in the Finger Lakes region of New York.
History
The area that is now Madison was first settled in 1793 by a group of settlers from Connecticut. The town was formed in 1806 from the Town of Hamilton in Madison County. The town was named after President James Madison.
In the early 19th century, Madison was a center of the abolitionist movement. The town was home to the first African-American church in the county, the African Methodist Episcopal Zion Church, which was founded in 1820.
Geography
Madison is located in the Finger Lakes region of New York. It is bordered by the towns of Hamilton to the north, Eaton to the east, Lebanon to the south, and Cazenovia to the west.
The town is located on the eastern edge of Madison County, and is situated on the eastern shore of Lake Moraine. The lake is a popular recreational destination, and is home to a variety of fish species.
The town is located in the Finger Lakes National Forest, which is a popular destination for hiking, camping, and other outdoor activities.
Economy
The economy of Madison is largely based on agriculture and tourism. The town is home to several wineries, including the Madison County Winery, which produces a variety of wines from local grapes.
The town is also home to several small businesses, including a variety of restaurants, shops, and other services.
Demographics
As of the 2010 census, the population of Madison was 5,967. The racial makeup of the town was 97.2% White, 0.7% African American, 0.2% Native American, 0.5% Asian, 0.1% Pacific Islander, 0.3% from other races, and 1.1% from two or more races. Hispanic or Latino of any race were 1.7% of the population.
The median income for a household in the town was $45,938, and the median income for a family was $54,844. The per capita income for the town was $22,945. About 8.2% of families and 11.2% of the population were below the poverty line, including 15.2% of those under age 18 and 6.2% of those age 65 or over.
Conclusion
Madison is a town located in Madison County, New York, United States. The town has a long history, and is home to a variety of businesses and recreational activities. The economy of Madison is largely based on agriculture and tourism, and the town has a diverse population. Madison is a great place to live, work, and visit.
Common Questions
What is Per Capita Income in Madison?
Per Capita income in Madison is $23,184.
What is the Median Family Income in Madison?
Median Family Income in Madison is $54,688.
What is the Median Household income in Madison?
Median Household Income in Madison is $44,028.
What is Income or Wage Gap in Madison?
Income or Wage Gap in Madison is 48.9%.
Women in Madison earn 51.1 cents for every dollar earned by a man.
What is Family Income Deficit in Madison?
Family Income Deficit in Madison is $10,467.
Families that are below poverty line in Madison earn $10,467 less on average than the poverty threshold level.
What is Inequality or Gini Index in Madison?
Inequality or Gini Index in Madison is 0.50.
What is the Total Population of Madison?
Total Population of Madison is 382.
What is the Total Male Population of Madison?
Total Male Population of Madison is 172.
What is the Total Female Population of Madison?
Total Female Population of Madison is 210.
What is the Ratio of Males per 100 Females in Madison?
There are 81.90 Males per 100 Females in Madison.
What is the Ratio of Females per 100 Males in Madison?
There are 122.09 Females per 100 Males in Madison.
What is the Median Population Age in Madison?
Median Population Age in Madison is 25.9 Years.
What is the Average Family Size in Madison
Average Family Size in Madison is 3.7 People.
What is the Average Household Size in Madison
Average Household Size in Madison is 2.6 People.
How Large is the Labor Force in Madison?
There are 155 People in the Labor Forcein in Madison.
What is the Percentage of People in the Labor Force in Madison?
56.6% of People are in the Labor Force in Madison.
What is the Unemployment Rate in Madison?
Unemployment Rate in Madison is 1.9%.