Lackawanna, NY Map & Demographics
Lackawanna Map
Lackawanna Overview
$26,033
PER CAPITA INCOME
$59,353
AVG FAMILY INCOME
$46,869
AVG HOUSEHOLD INCOME
18.4%
WAGE / INCOME GAP [ % ]
81.6¢/ $1
WAGE / INCOME GAP [ $ ]
0.42
INEQUALITY / GINI INDEX
19,762
TOTAL POPULATION
9,434
MALE POPULATION
10,328
FEMALE POPULATION
91.34
MALES / 100 FEMALES
109.48
FEMALES / 100 MALES
39.1
MEDIAN AGE
3.1
AVG FAMILY SIZE
2.3
AVG HOUSEHOLD SIZE
9,755
LABOR FORCE [ PEOPLE ]
61.0%
PERCENT IN LABOR FORCE
5.4%
UNEMPLOYMENT RATE
Lackawanna Area Codes
Income in Lackawanna
Income Overview in Lackawanna
Per Capita Income in Lackawanna is $26,033, while median incomes of families and households are $59,353 and $46,869 respectively.
| Characteristic | Number | Measure |
| Per Capita Income | 19,762 | $26,033 |
| Median Family Income | 4,540 | $59,353 |
| Mean Family Income | 4,540 | $69,812 |
| Median Household Income | 8,582 | $46,869 |
| Mean Household Income | 8,582 | $58,496 |
| Income Deficit | 4,540 | $0 |
| Wage / Income Gap (%) | 19,762 | 18.36% |
| Wage / Income Gap ($) | 19,762 | 81.64¢ per $1 |
| Gini / Inequality Index | 19,762 | 0.42 |
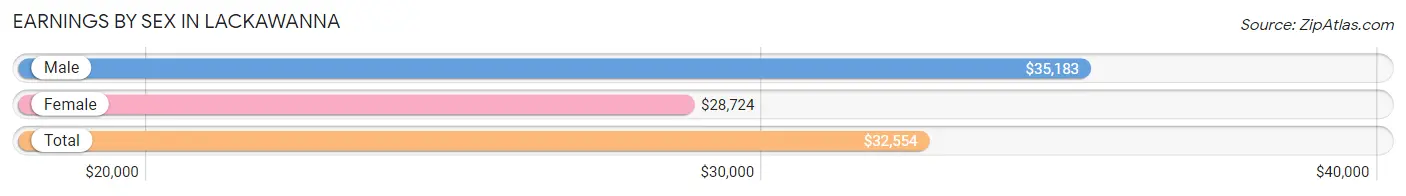
Earnings by Sex in Lackawanna
Average Earnings in Lackawanna are $32,554, $35,183 for men and $28,724 for women, a difference of 18.4%.
| Sex | Number | Average Earnings |
| Male | 5,352 (53.5%) | $35,183 |
| Female | 4,653 (46.5%) | $28,724 |
| Total | 10,005 (100.0%) | $32,554 |
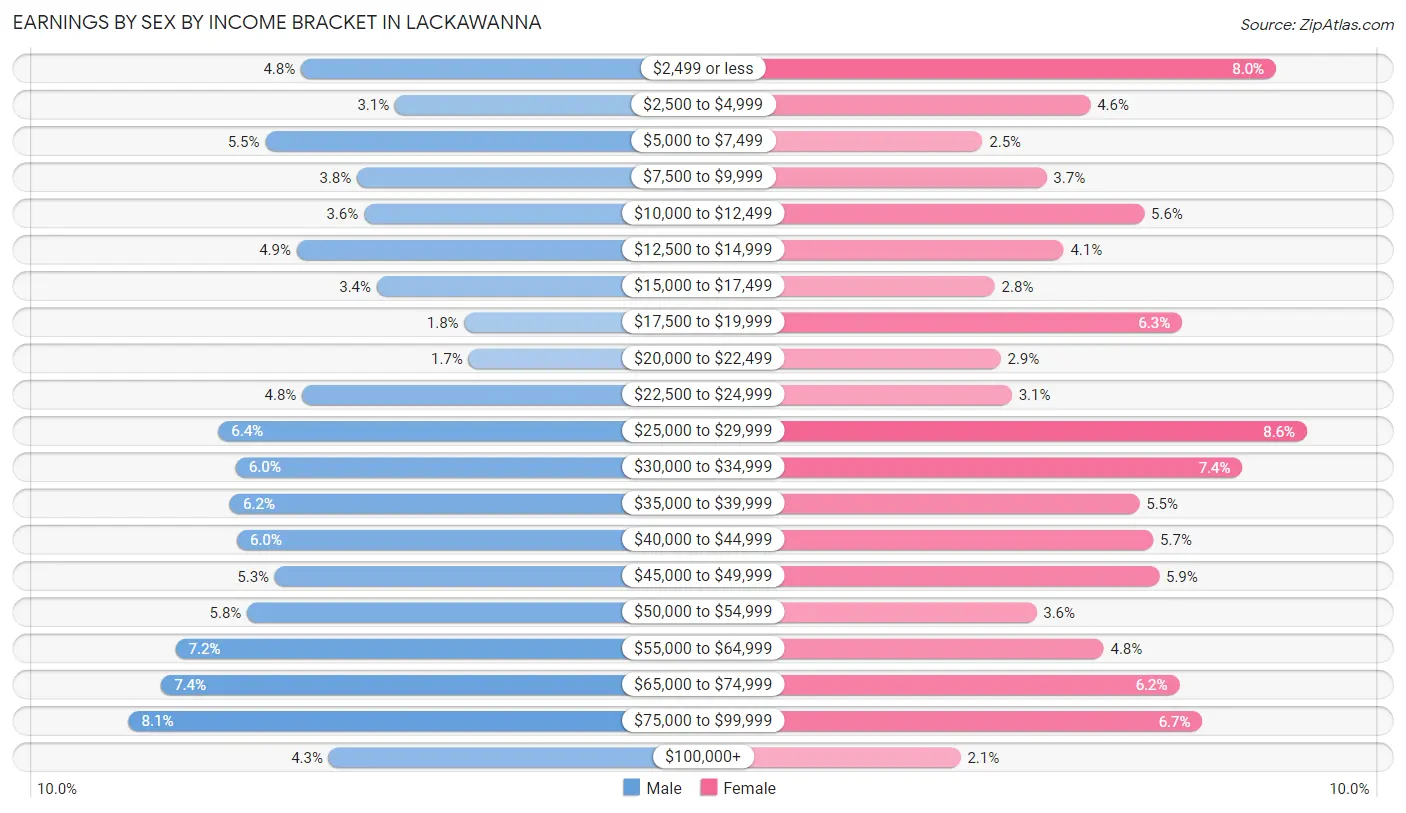
Earnings by Sex by Income Bracket in Lackawanna
The most common earnings brackets in Lackawanna are $75,000 to $99,999 for men (431 | 8.1%) and $25,000 to $29,999 for women (401 | 8.6%).
| Income | Male | Female |
| $2,499 or less | 258 (4.8%) | 374 (8.0%) |
| $2,500 to $4,999 | 164 (3.1%) | 212 (4.6%) |
| $5,000 to $7,499 | 294 (5.5%) | 118 (2.5%) |
| $7,500 to $9,999 | 202 (3.8%) | 174 (3.7%) |
| $10,000 to $12,499 | 195 (3.6%) | 259 (5.6%) |
| $12,500 to $14,999 | 262 (4.9%) | 189 (4.1%) |
| $15,000 to $17,499 | 182 (3.4%) | 129 (2.8%) |
| $17,500 to $19,999 | 94 (1.8%) | 292 (6.3%) |
| $20,000 to $22,499 | 90 (1.7%) | 134 (2.9%) |
| $22,500 to $24,999 | 257 (4.8%) | 144 (3.1%) |
| $25,000 to $29,999 | 341 (6.4%) | 401 (8.6%) |
| $30,000 to $34,999 | 323 (6.0%) | 345 (7.4%) |
| $35,000 to $39,999 | 329 (6.1%) | 255 (5.5%) |
| $40,000 to $44,999 | 322 (6.0%) | 267 (5.7%) |
| $45,000 to $49,999 | 284 (5.3%) | 272 (5.9%) |
| $50,000 to $54,999 | 312 (5.8%) | 165 (3.5%) |
| $55,000 to $64,999 | 384 (7.2%) | 224 (4.8%) |
| $65,000 to $74,999 | 398 (7.4%) | 290 (6.2%) |
| $75,000 to $99,999 | 431 (8.1%) | 310 (6.7%) |
| $100,000+ | 230 (4.3%) | 99 (2.1%) |
| Total | 5,352 (100.0%) | 4,653 (100.0%) |
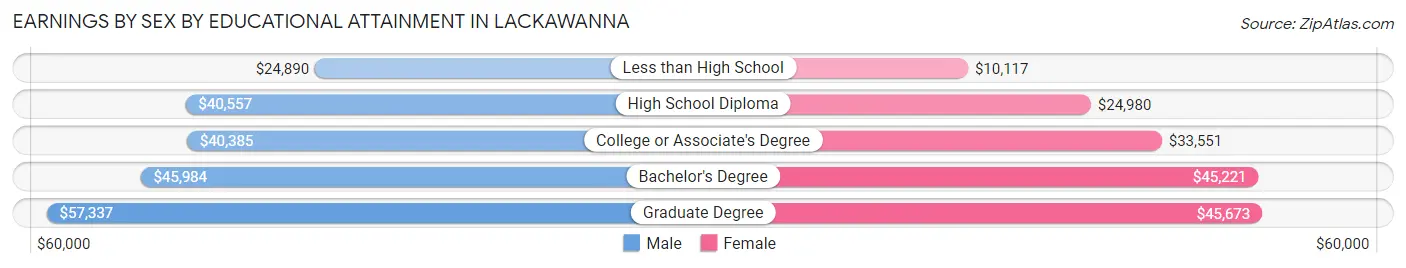
Earnings by Sex by Educational Attainment in Lackawanna
Average earnings in Lackawanna are $39,592 for men and $34,417 for women, a difference of 13.1%. Men with an educational attainment of graduate degree enjoy the highest average annual earnings of $57,337, while those with less than high school education earn the least with $24,890. Women with an educational attainment of graduate degree earn the most with the average annual earnings of $45,673, while those with less than high school education have the smallest earnings of $10,117.
| Educational Attainment | Male Income | Female Income |
| Less than High School | $24,890 | $10,117 |
| High School Diploma | $40,557 | $24,980 |
| College or Associate's Degree | $40,385 | $33,551 |
| Bachelor's Degree | $45,984 | $45,221 |
| Graduate Degree | $57,337 | $45,673 |
| Total | $39,592 | $34,417 |
Family Income in Lackawanna
Family Income Brackets in Lackawanna
According to the Lackawanna family income data, there are 885 families falling into the $50,000 to $74,999 income range, which is the most common income bracket and makes up 19.5% of all families. Conversely, the $10,000 to $14,999 income bracket is the least frequent group with only 73 families (1.6%) belonging to this category.
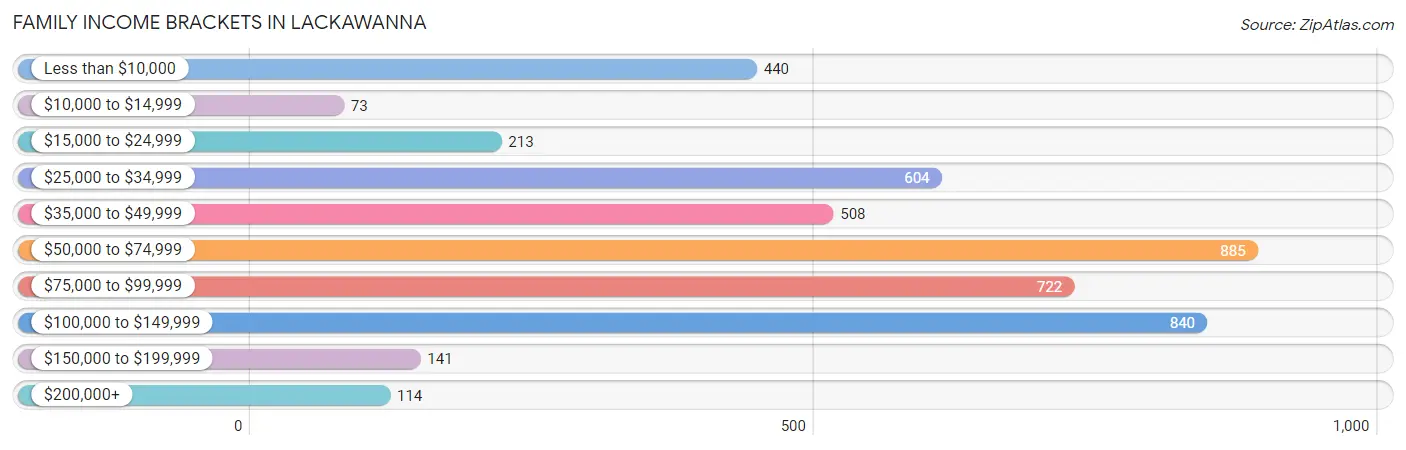
| Income Bracket | # Families | % Families |
| Less than $10,000 | 440 | 9.7% |
| $10,000 to $14,999 | 73 | 1.6% |
| $15,000 to $24,999 | 213 | 4.7% |
| $25,000 to $34,999 | 604 | 13.3% |
| $35,000 to $49,999 | 508 | 11.2% |
| $50,000 to $74,999 | 885 | 19.5% |
| $75,000 to $99,999 | 722 | 15.9% |
| $100,000 to $149,999 | 840 | 18.5% |
| $150,000 to $199,999 | 141 | 3.1% |
| $200,000+ | 114 | 2.5% |
Family Income by Famaliy Size in Lackawanna
4-person families (610 | 13.4%) account for the highest median family income in Lackawanna with $83,500 per family, while 2-person families (2,134 | 47.0%) have the highest median income of $26,604 per family member.
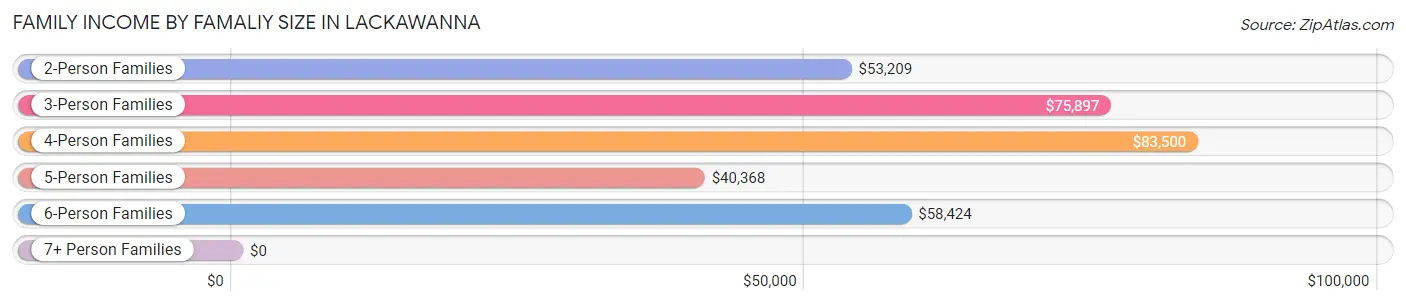
| Income Bracket | # Families | Median Income |
| 2-Person Families | 2,134 (47.0%) | $53,209 |
| 3-Person Families | 1,152 (25.4%) | $75,897 |
| 4-Person Families | 610 (13.4%) | $83,500 |
| 5-Person Families | 260 (5.7%) | $40,368 |
| 6-Person Families | 292 (6.4%) | $58,424 |
| 7+ Person Families | 92 (2.0%) | $0 |
| Total | 4,540 (100.0%) | $59,353 |
Family Income by Number of Earners in Lackawanna
The median family income in Lackawanna is $59,353, with families comprising 3+ earners (691) having the highest median family income of $96,583, while families with no earners (869) have the lowest median family income of $33,969, accounting for 15.2% and 19.1% of families, respectively.
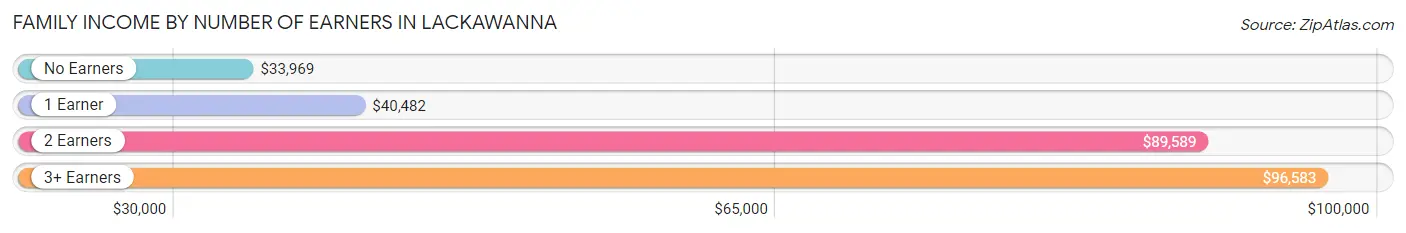
| Number of Earners | # Families | Median Income |
| No Earners | 869 (19.1%) | $33,969 |
| 1 Earner | 1,519 (33.5%) | $40,482 |
| 2 Earners | 1,461 (32.2%) | $89,589 |
| 3+ Earners | 691 (15.2%) | $96,583 |
| Total | 4,540 (100.0%) | $59,353 |
Household Income in Lackawanna
Household Income Brackets in Lackawanna
With 1,485 households falling in the category, the $50,000 to $74,999 income range is the most frequent in Lackawanna, accounting for 17.3% of all households. In contrast, only 172 households (2.0%) fall into the $200,000+ income bracket, making it the least populous group.
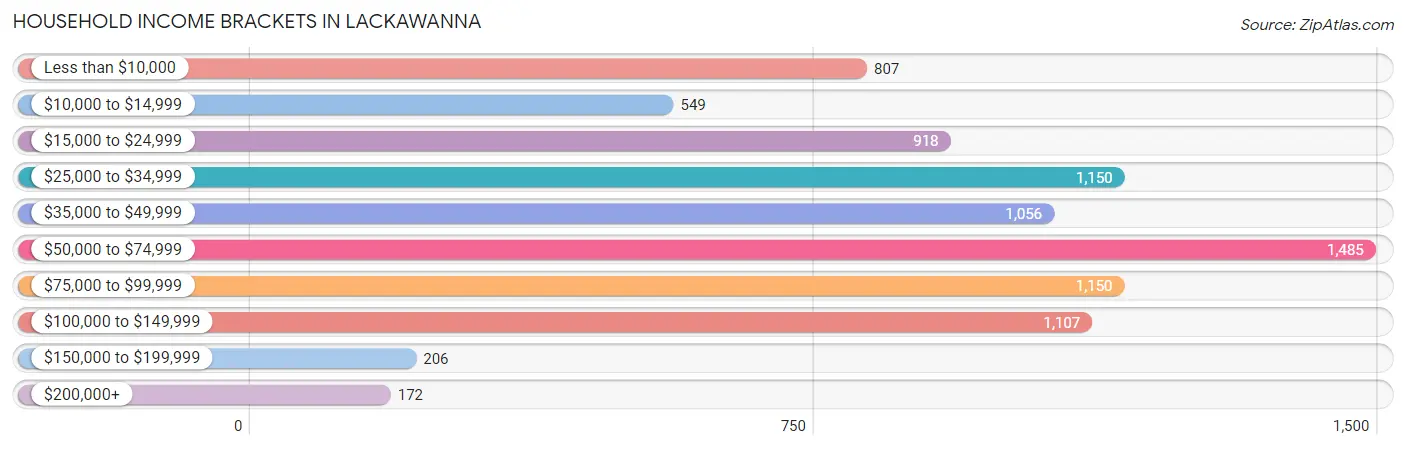
| Income Bracket | # Households | % Households |
| Less than $10,000 | 807 | 9.4% |
| $10,000 to $14,999 | 549 | 6.4% |
| $15,000 to $24,999 | 918 | 10.7% |
| $25,000 to $34,999 | 1,150 | 13.4% |
| $35,000 to $49,999 | 1,056 | 12.3% |
| $50,000 to $74,999 | 1,485 | 17.3% |
| $75,000 to $99,999 | 1,150 | 13.4% |
| $100,000 to $149,999 | 1,107 | 12.9% |
| $150,000 to $199,999 | 206 | 2.4% |
| $200,000+ | 172 | 2.0% |
Household Income by Householder Age in Lackawanna
The median household income in Lackawanna is $46,869, with the highest median household income of $58,780 found in the 45 to 64 years age bracket for the primary householder. A total of 3,648 households (42.5%) fall into this category. Meanwhile, the 15 to 24 years age bracket for the primary householder has the lowest median household income of $26,847, with 267 households (3.1%) in this group.
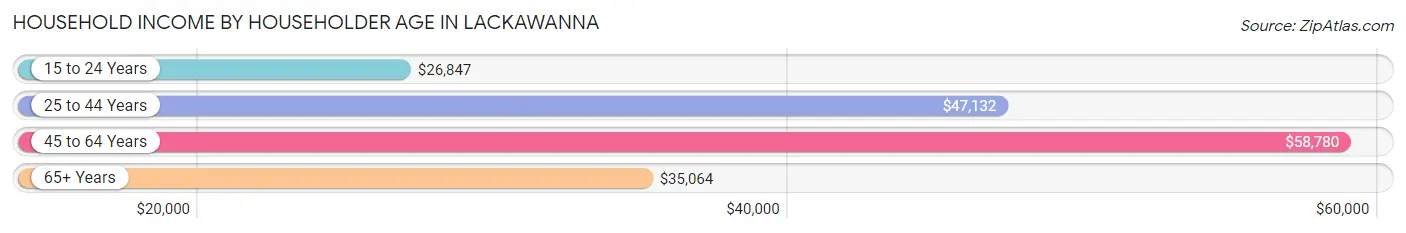
| Income Bracket | # Households | Median Income |
| 15 to 24 Years | 267 (3.1%) | $26,847 |
| 25 to 44 Years | 2,453 (28.6%) | $47,132 |
| 45 to 64 Years | 3,648 (42.5%) | $58,780 |
| 65+ Years | 2,214 (25.8%) | $35,064 |
| Total | 8,582 (100.0%) | $46,869 |
Poverty in Lackawanna
Income Below Poverty by Sex and Age in Lackawanna
With 20.7% poverty level for males and 22.3% for females among the residents of Lackawanna, 5 year old males and 15 year old females are the most vulnerable to poverty, with 52 males (72.2%) and 141 females (95.3%) in their respective age groups living below the poverty level.
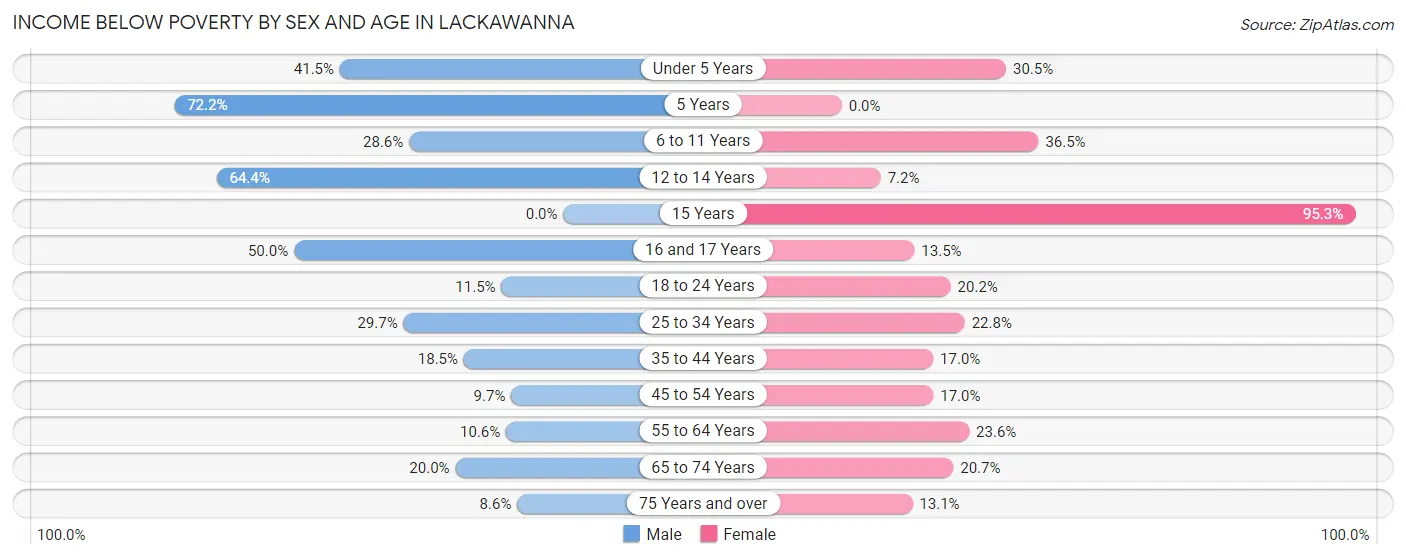
| Age Bracket | Male | Female |
| Under 5 Years | 246 (41.5%) | 268 (30.5%) |
| 5 Years | 52 (72.2%) | 0 (0.0%) |
| 6 to 11 Years | 215 (28.6%) | 265 (36.5%) |
| 12 to 14 Years | 121 (64.4%) | 12 (7.2%) |
| 15 Years | 0 (0.0%) | 141 (95.3%) |
| 16 and 17 Years | 28 (50.0%) | 36 (13.5%) |
| 18 to 24 Years | 88 (11.5%) | 153 (20.2%) |
| 25 to 34 Years | 446 (29.7%) | 397 (22.8%) |
| 35 to 44 Years | 246 (18.5%) | 124 (17.0%) |
| 45 to 54 Years | 106 (9.7%) | 273 (17.0%) |
| 55 to 64 Years | 169 (10.6%) | 313 (23.6%) |
| 65 to 74 Years | 195 (20.0%) | 181 (20.7%) |
| 75 Years and over | 31 (8.6%) | 119 (13.1%) |
| Total | 1,943 (20.7%) | 2,282 (22.3%) |
Income Above Poverty by Sex and Age in Lackawanna
According to the poverty statistics in Lackawanna, males aged 15 years and females aged 5 years are the age groups that are most secure financially, with 100.0% of males and 100.0% of females in these age groups living above the poverty line.
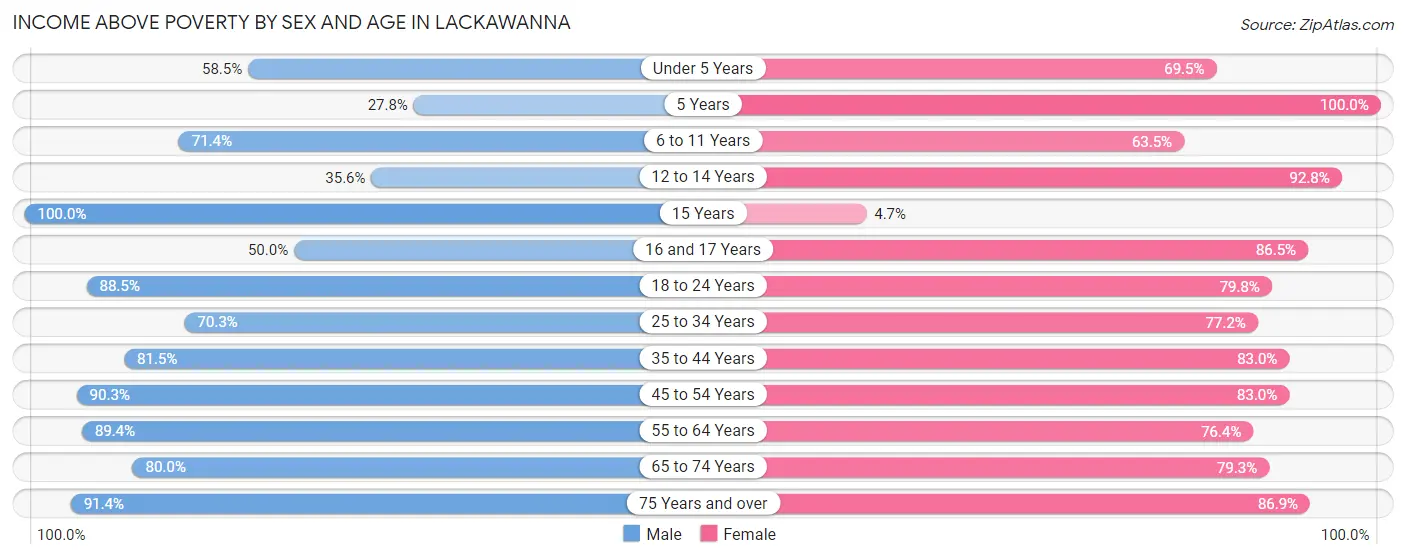
| Age Bracket | Male | Female |
| Under 5 Years | 347 (58.5%) | 611 (69.5%) |
| 5 Years | 20 (27.8%) | 106 (100.0%) |
| 6 to 11 Years | 536 (71.4%) | 461 (63.5%) |
| 12 to 14 Years | 67 (35.6%) | 154 (92.8%) |
| 15 Years | 102 (100.0%) | 7 (4.7%) |
| 16 and 17 Years | 28 (50.0%) | 231 (86.5%) |
| 18 to 24 Years | 677 (88.5%) | 604 (79.8%) |
| 25 to 34 Years | 1,057 (70.3%) | 1,343 (77.2%) |
| 35 to 44 Years | 1,086 (81.5%) | 607 (83.0%) |
| 45 to 54 Years | 990 (90.3%) | 1,335 (83.0%) |
| 55 to 64 Years | 1,422 (89.4%) | 1,011 (76.4%) |
| 65 to 74 Years | 778 (80.0%) | 694 (79.3%) |
| 75 Years and over | 331 (91.4%) | 789 (86.9%) |
| Total | 7,441 (79.3%) | 7,953 (77.7%) |
Income Below Poverty Among Married-Couple Families in Lackawanna
The poverty statistics for married-couple families in Lackawanna show that 13.1% or 350 of the total 2,681 families live below the poverty line. Families with 5 or more children have the highest poverty rate of 80.5%, comprising of 66 families. On the other hand, families with no children have the lowest poverty rate of 7.3%, which includes 114 families.
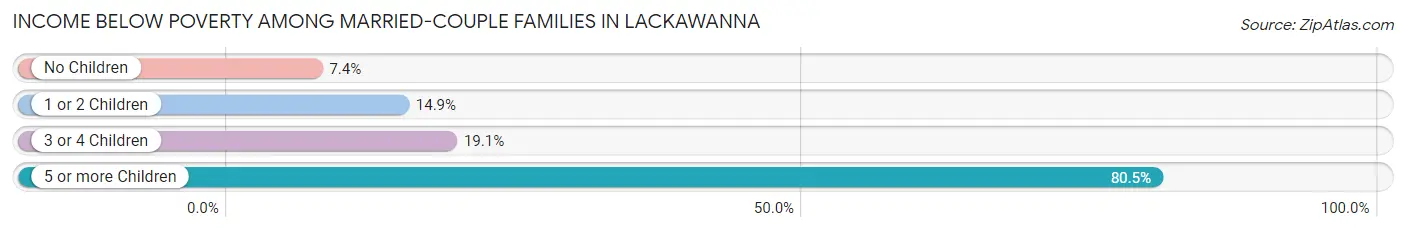
| Children | Above Poverty | Below Poverty |
| No Children | 1,438 (92.6%) | 114 (7.3%) |
| 1 or 2 Children | 601 (85.1%) | 105 (14.9%) |
| 3 or 4 Children | 276 (80.9%) | 65 (19.1%) |
| 5 or more Children | 16 (19.5%) | 66 (80.5%) |
| Total | 2,331 (87.0%) | 350 (13.1%) |
Income Below Poverty Among Single-Parent Households in Lackawanna
According to the poverty data in Lackawanna, 18.3% or 129 single-father households and 22.3% or 258 single-mother households are living below the poverty line. Among single-father households, those with 1 or 2 children have the highest poverty rate, with 129 households (54.9%) experiencing poverty. Likewise, among single-mother households, those with 5 or more children have the highest poverty rate, with 58 households (100.0%) falling below the poverty line.
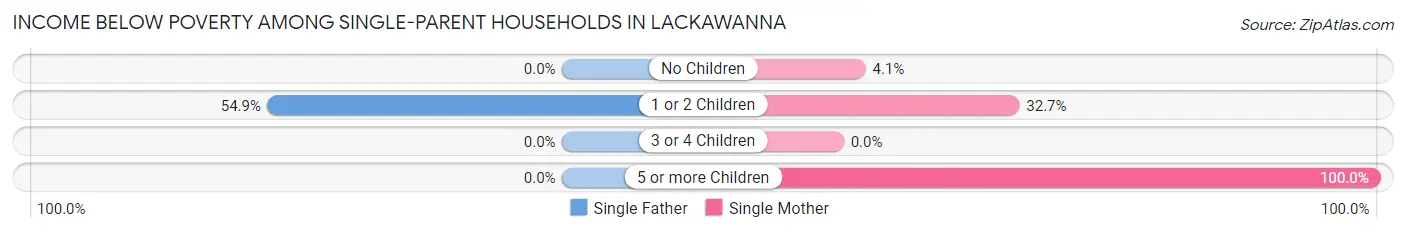
| Children | Single Father | Single Mother |
| No Children | 0 (0.0%) | 22 (4.1%) |
| 1 or 2 Children | 129 (54.9%) | 178 (32.7%) |
| 3 or 4 Children | 0 (0.0%) | 0 (0.0%) |
| 5 or more Children | 0 (0.0%) | 58 (100.0%) |
| Total | 129 (18.3%) | 258 (22.3%) |
Income Below Poverty Among Married-Couple vs Single-Parent Households in Lackawanna
The poverty data for Lackawanna shows that 350 of the married-couple family households (13.1%) and 387 of the single-parent households (20.8%) are living below the poverty level. Within the married-couple family households, those with 5 or more children have the highest poverty rate, with 66 households (80.5%) falling below the poverty line. Among the single-parent households, those with 5 or more children have the highest poverty rate, with 58 household (100.0%) living below poverty.
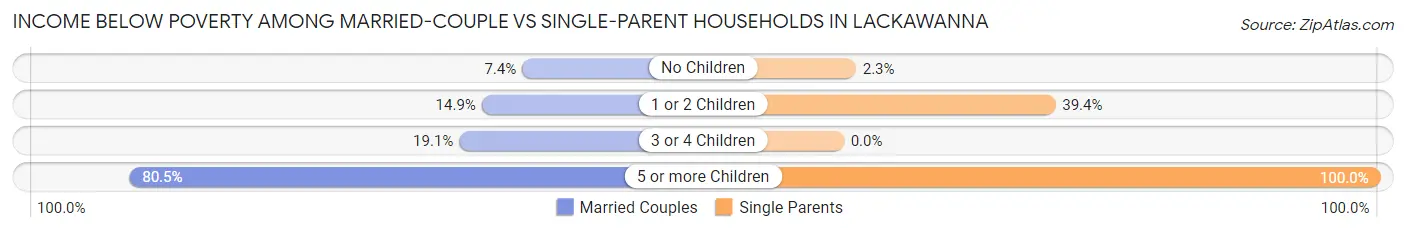
| Children | Married-Couple Families | Single-Parent Households |
| No Children | 114 (7.3%) | 22 (2.3%) |
| 1 or 2 Children | 105 (14.9%) | 307 (39.4%) |
| 3 or 4 Children | 65 (19.1%) | 0 (0.0%) |
| 5 or more Children | 66 (80.5%) | 58 (100.0%) |
| Total | 350 (13.1%) | 387 (20.8%) |
Race in Lackawanna
The most populous races in Lackawanna are White / Caucasian (14,783 | 74.8%), Black / African American (3,021 | 15.3%), and Hispanic or Latino (1,337 | 6.8%).
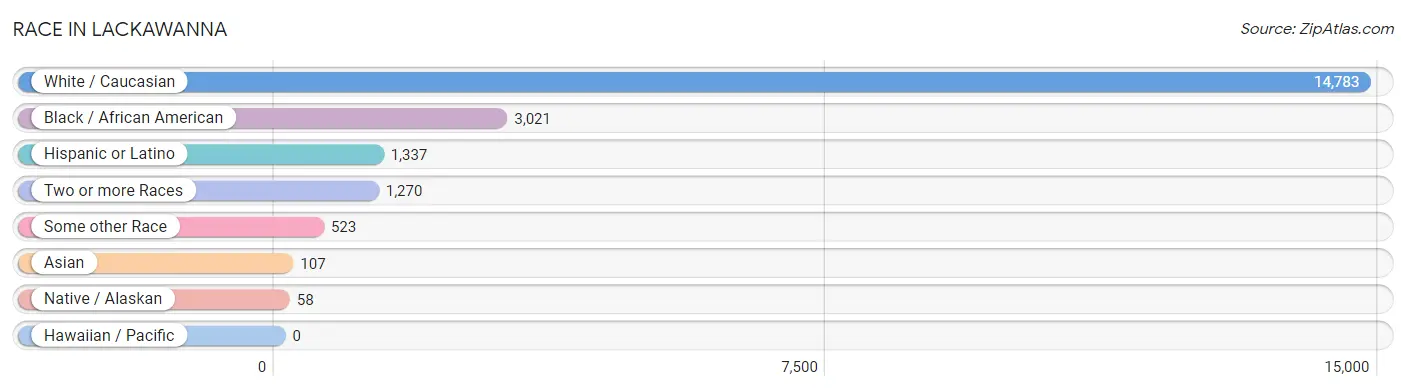
| Race | # Population | % Population |
| Asian | 107 | 0.5% |
| Black / African American | 3,021 | 15.3% |
| Hawaiian / Pacific | 0 | 0.0% |
| Hispanic or Latino | 1,337 | 6.8% |
| Native / Alaskan | 58 | 0.3% |
| White / Caucasian | 14,783 | 74.8% |
| Two or more Races | 1,270 | 6.4% |
| Some other Race | 523 | 2.6% |
| Total | 19,762 | 100.0% |
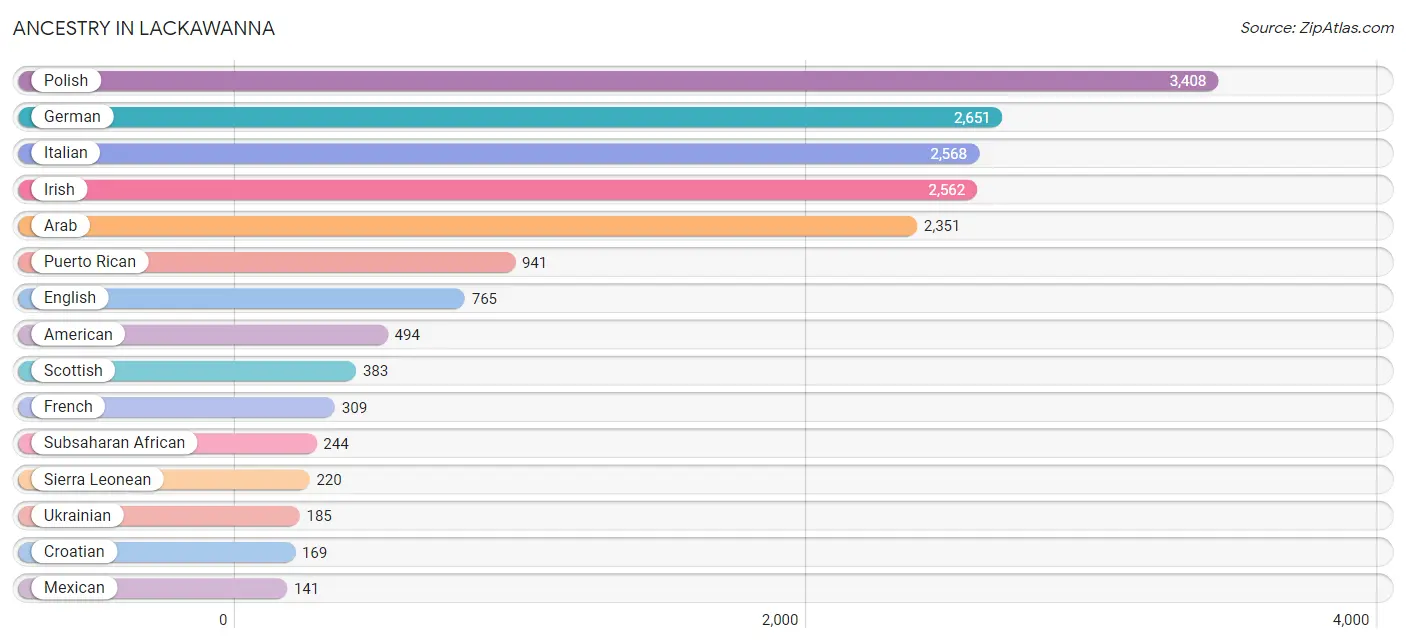
Ancestry in Lackawanna
The most populous ancestries reported in Lackawanna are Polish (3,408 | 17.2%), German (2,651 | 13.4%), Italian (2,568 | 13.0%), Irish (2,562 | 13.0%), and Arab (2,351 | 11.9%), together accounting for 68.5% of all Lackawanna residents.
| Ancestry | # Population | % Population |
| African | 24 | 0.1% |
| American | 494 | 2.5% |
| Apache | 10 | 0.1% |
| Arab | 2,351 | 11.9% |
| Austrian | 43 | 0.2% |
| Bhutanese | 18 | 0.1% |
| Blackfeet | 44 | 0.2% |
| British | 20 | 0.1% |
| Bulgarian | 1 | 0.0% |
| Canadian | 10 | 0.1% |
| Central American | 59 | 0.3% |
| Central American Indian | 26 | 0.1% |
| Chippewa | 29 | 0.2% |
| Colombian | 42 | 0.2% |
| Croatian | 169 | 0.9% |
| Cuban | 11 | 0.1% |
| Czechoslovakian | 5 | 0.0% |
| Dominican | 72 | 0.4% |
| Dutch | 50 | 0.3% |
| Eastern European | 38 | 0.2% |
| English | 765 | 3.9% |
| European | 52 | 0.3% |
| Finnish | 11 | 0.1% |
| French | 309 | 1.6% |
| French Canadian | 37 | 0.2% |
| German | 2,651 | 13.4% |
| Greek | 8 | 0.0% |
| Honduran | 35 | 0.2% |
| Hungarian | 135 | 0.7% |
| Indian (Asian) | 107 | 0.5% |
| Iraqi | 35 | 0.2% |
| Irish | 2,562 | 13.0% |
| Iroquois | 119 | 0.6% |
| Italian | 2,568 | 13.0% |
| Korean | 15 | 0.1% |
| Lebanese | 36 | 0.2% |
| Lithuanian | 44 | 0.2% |
| Macedonian | 111 | 0.6% |
| Mexican | 141 | 0.7% |
| Moroccan | 41 | 0.2% |
| Native Hawaiian | 13 | 0.1% |
| Norwegian | 19 | 0.1% |
| Polish | 3,408 | 17.2% |
| Portuguese | 39 | 0.2% |
| Puerto Rican | 941 | 4.8% |
| Russian | 76 | 0.4% |
| Salvadoran | 24 | 0.1% |
| Scotch-Irish | 13 | 0.1% |
| Scottish | 383 | 1.9% |
| Seminole | 27 | 0.1% |
| Serbian | 52 | 0.3% |
| Sierra Leonean | 220 | 1.1% |
| Sioux | 9 | 0.1% |
| Slavic | 16 | 0.1% |
| Slovak | 54 | 0.3% |
| South American | 42 | 0.2% |
| Spaniard | 16 | 0.1% |
| Spanish | 28 | 0.1% |
| Subsaharan African | 244 | 1.2% |
| Swedish | 103 | 0.5% |
| Ukrainian | 185 | 0.9% |
| Welsh | 31 | 0.2% |
| West Indian | 41 | 0.2% |
| Yugoslavian | 108 | 0.5% | View All 64 Rows |
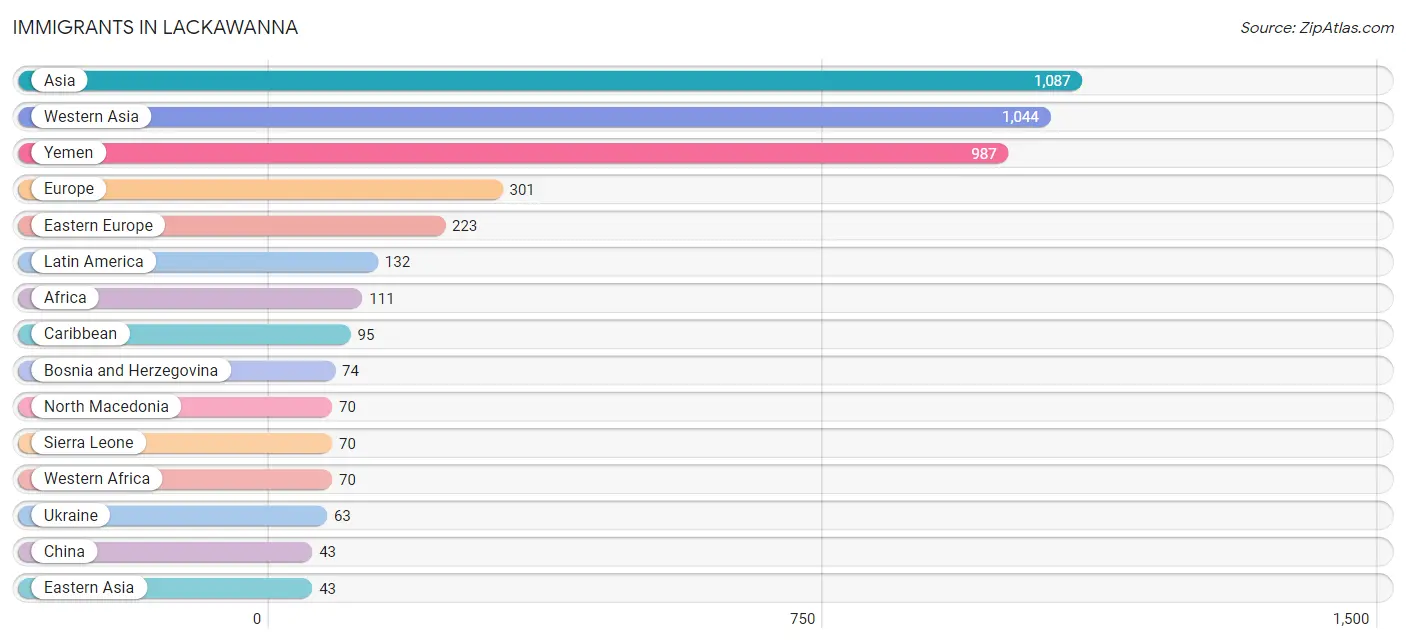
Immigrants in Lackawanna
The most numerous immigrant groups reported in Lackawanna came from Asia (1,087 | 5.5%), Western Asia (1,044 | 5.3%), Yemen (987 | 5.0%), Europe (301 | 1.5%), and Eastern Europe (223 | 1.1%), together accounting for 18.4% of all Lackawanna residents.
| Immigration Origin | # Population | % Population |
| Africa | 111 | 0.6% |
| Asia | 1,087 | 5.5% |
| Bosnia and Herzegovina | 74 | 0.4% |
| Caribbean | 95 | 0.5% |
| Central America | 36 | 0.2% |
| China | 43 | 0.2% |
| Colombia | 1 | 0.0% |
| Dominican Republic | 37 | 0.2% |
| Eastern Asia | 43 | 0.2% |
| Eastern Europe | 223 | 1.1% |
| El Salvador | 24 | 0.1% |
| Europe | 301 | 1.5% |
| Germany | 24 | 0.1% |
| Iraq | 27 | 0.1% |
| Italy | 41 | 0.2% |
| Latin America | 132 | 0.7% |
| Mexico | 12 | 0.1% |
| Morocco | 41 | 0.2% |
| North Macedonia | 70 | 0.4% |
| Northern Africa | 41 | 0.2% |
| Northern Europe | 13 | 0.1% |
| Saudi Arabia | 30 | 0.2% |
| Scotland | 13 | 0.1% |
| Serbia | 16 | 0.1% |
| Sierra Leone | 70 | 0.4% |
| South America | 1 | 0.0% |
| Southern Europe | 41 | 0.2% |
| Taiwan | 4 | 0.0% |
| Ukraine | 63 | 0.3% |
| Western Africa | 70 | 0.4% |
| Western Asia | 1,044 | 5.3% |
| Western Europe | 24 | 0.1% |
| Yemen | 987 | 5.0% | View All 33 Rows |
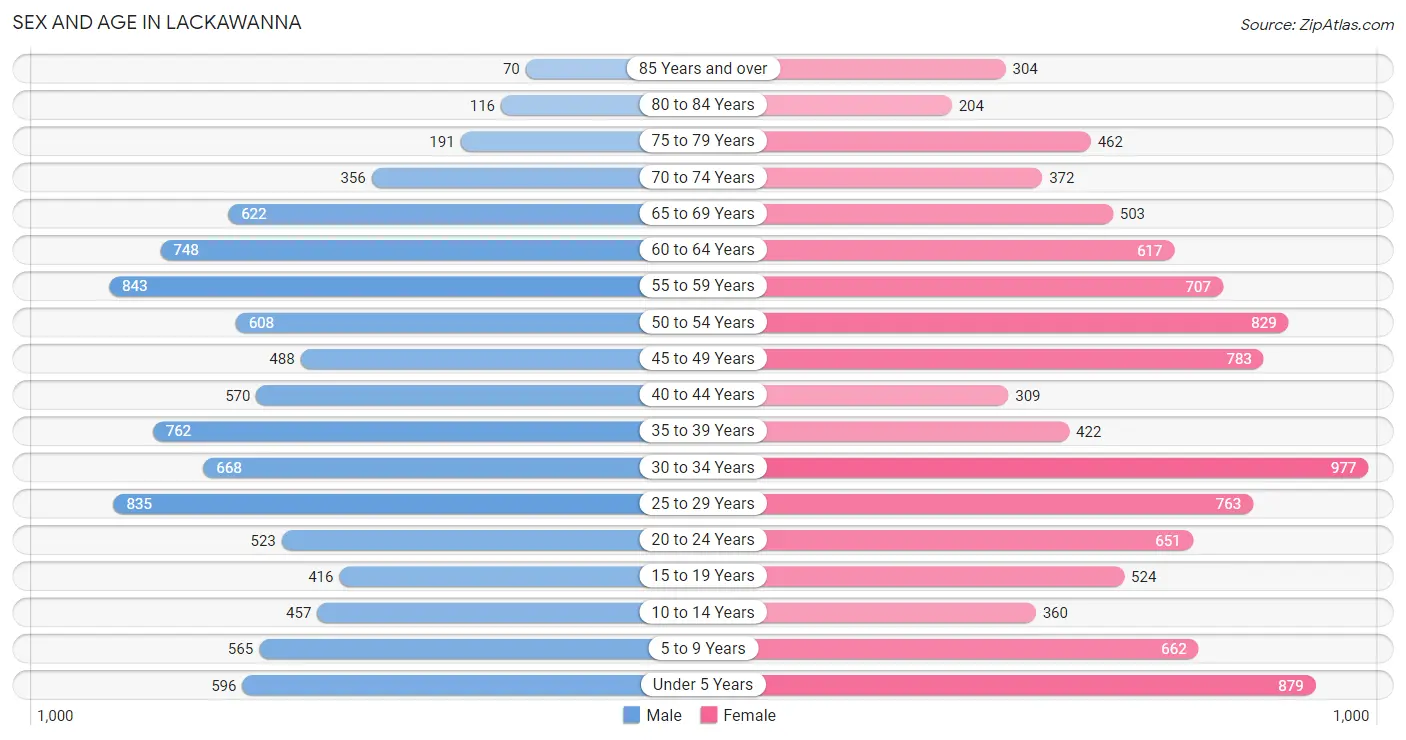
Sex and Age in Lackawanna
Sex and Age in Lackawanna
The most populous age groups in Lackawanna are 55 to 59 Years (843 | 8.9%) for men and 30 to 34 Years (977 | 9.5%) for women.
| Age Bracket | Male | Female |
| Under 5 Years | 596 (6.3%) | 879 (8.5%) |
| 5 to 9 Years | 565 (6.0%) | 662 (6.4%) |
| 10 to 14 Years | 457 (4.8%) | 360 (3.5%) |
| 15 to 19 Years | 416 (4.4%) | 524 (5.1%) |
| 20 to 24 Years | 523 (5.5%) | 651 (6.3%) |
| 25 to 29 Years | 835 (8.8%) | 763 (7.4%) |
| 30 to 34 Years | 668 (7.1%) | 977 (9.5%) |
| 35 to 39 Years | 762 (8.1%) | 422 (4.1%) |
| 40 to 44 Years | 570 (6.0%) | 309 (3.0%) |
| 45 to 49 Years | 488 (5.2%) | 783 (7.6%) |
| 50 to 54 Years | 608 (6.4%) | 829 (8.0%) |
| 55 to 59 Years | 843 (8.9%) | 707 (6.9%) |
| 60 to 64 Years | 748 (7.9%) | 617 (6.0%) |
| 65 to 69 Years | 622 (6.6%) | 503 (4.9%) |
| 70 to 74 Years | 356 (3.8%) | 372 (3.6%) |
| 75 to 79 Years | 191 (2.0%) | 462 (4.5%) |
| 80 to 84 Years | 116 (1.2%) | 204 (2.0%) |
| 85 Years and over | 70 (0.7%) | 304 (2.9%) |
| Total | 9,434 (100.0%) | 10,328 (100.0%) |
Families and Households in Lackawanna
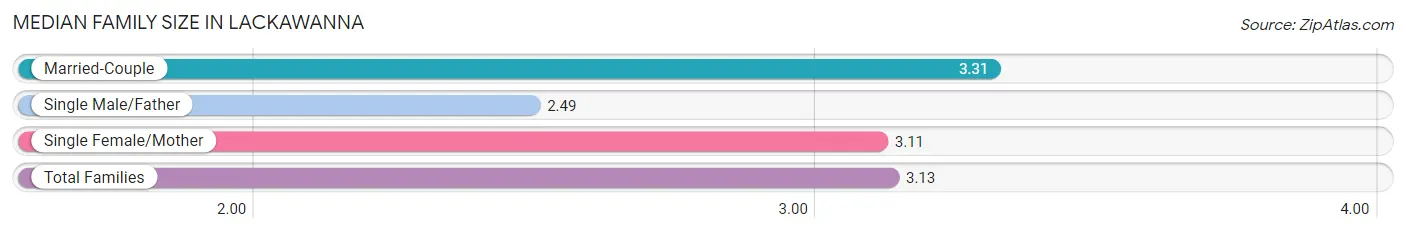
Median Family Size in Lackawanna
The median family size in Lackawanna is 3.13 persons per family, with married-couple families (2,681 | 59.1%) accounting for the largest median family size of 3.31 persons per family. On the other hand, single male/father families (704 | 15.5%) represent the smallest median family size with 2.49 persons per family.
| Family Type | # Families | Family Size |
| Married-Couple | 2,681 (59.1%) | 3.31 |
| Single Male/Father | 704 (15.5%) | 2.49 |
| Single Female/Mother | 1,155 (25.4%) | 3.11 |
| Total Families | 4,540 (100.0%) | 3.13 |
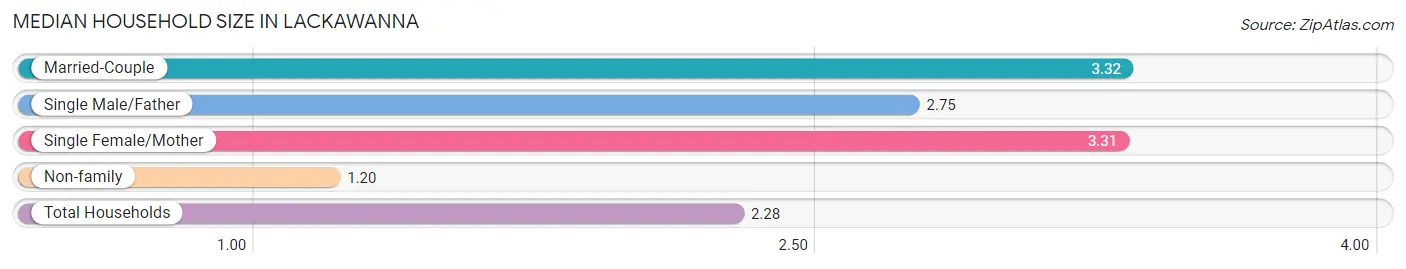
Median Household Size in Lackawanna
The median household size in Lackawanna is 2.28 persons per household, with married-couple households (2,681 | 31.2%) accounting for the largest median household size of 3.32 persons per household. non-family households (4,042 | 47.1%) represent the smallest median household size with 1.20 persons per household.
| Household Type | # Households | Household Size |
| Married-Couple | 2,681 (31.2%) | 3.32 |
| Single Male/Father | 704 (8.2%) | 2.75 |
| Single Female/Mother | 1,155 (13.5%) | 3.31 |
| Non-family | 4,042 (47.1%) | 1.20 |
| Total Households | 8,582 (100.0%) | 2.28 |
Household Size by Marriage Status in Lackawanna
Out of a total of 8,582 households in Lackawanna, 4,540 (52.9%) are family households, while 4,042 (47.1%) are nonfamily households. The most numerous type of family households are 2-person households, comprising 1,985, and the most common type of nonfamily households are 1-person households, comprising 3,347.
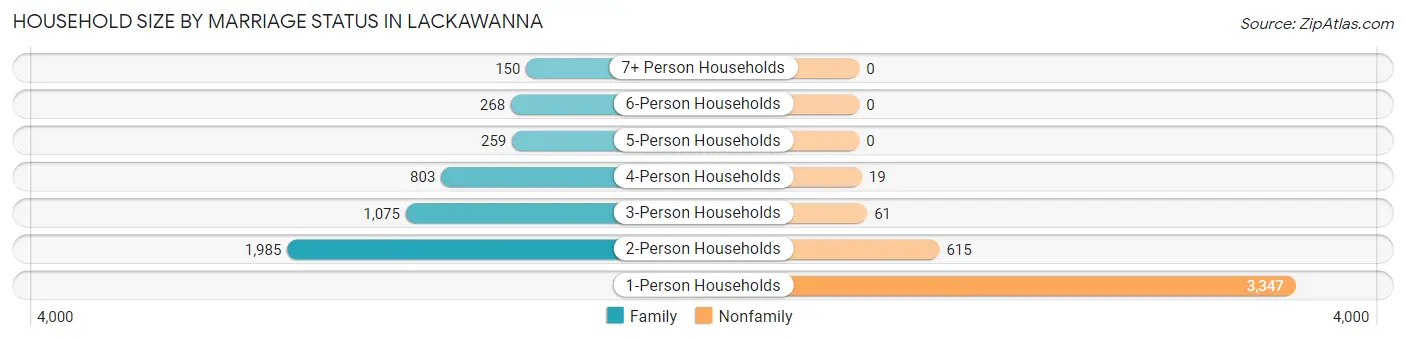
| Household Size | Family Households | Nonfamily Households |
| 1-Person Households | - | 3,347 (39.0%) |
| 2-Person Households | 1,985 (23.1%) | 615 (7.2%) |
| 3-Person Households | 1,075 (12.5%) | 61 (0.7%) |
| 4-Person Households | 803 (9.4%) | 19 (0.2%) |
| 5-Person Households | 259 (3.0%) | 0 (0.0%) |
| 6-Person Households | 268 (3.1%) | 0 (0.0%) |
| 7+ Person Households | 150 (1.8%) | 0 (0.0%) |
| Total | 4,540 (52.9%) | 4,042 (47.1%) |
Female Fertility in Lackawanna
Fertility by Age in Lackawanna
Average fertility rate in Lackawanna is 68.0 births per 1,000 women. Women in the age bracket of 20 to 34 years have the highest fertility rate with 110.0 births per 1,000 women. Women in the age bracket of 20 to 34 years acount for 84.9% of all women with births.
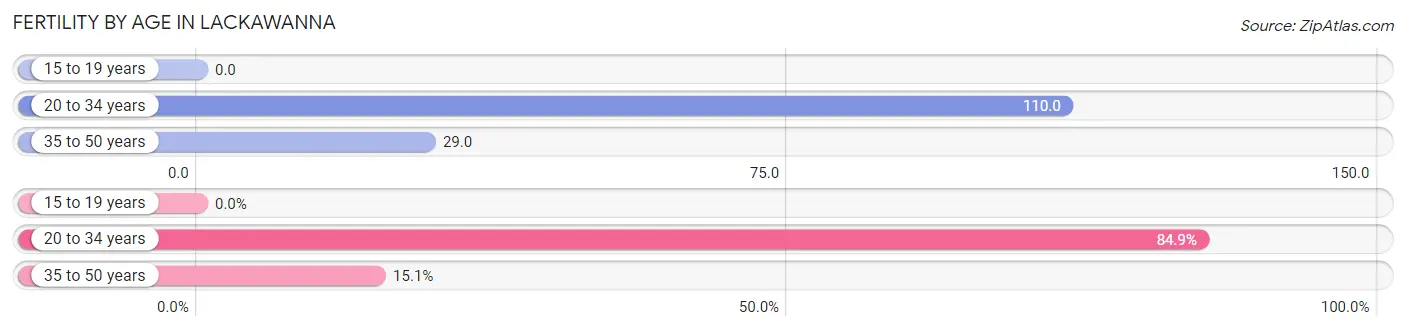
| Age Bracket | Women with Births | Births / 1,000 Women |
| 15 to 19 years | 0 (0.0%) | 0.0 |
| 20 to 34 years | 264 (84.9%) | 110.0 |
| 35 to 50 years | 47 (15.1%) | 29.0 |
| Total | 311 (100.0%) | 68.0 |
Fertility by Age by Marriage Status in Lackawanna
46.3% of women with births (311) in Lackawanna are married. The highest percentage of unmarried women with births falls into 35 to 50 years age bracket with 100.0% of them unmarried at the time of birth, while the lowest percentage of unmarried women with births belong to 20 to 34 years age bracket with 45.5% of them unmarried.
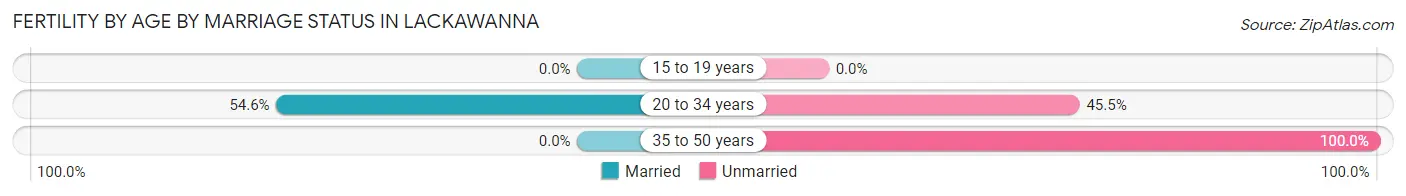
| Age Bracket | Married | Unmarried |
| 15 to 19 years | 0 (0.0%) | 0 (0.0%) |
| 20 to 34 years | 144 (54.5%) | 120 (45.5%) |
| 35 to 50 years | 0 (0.0%) | 47 (100.0%) |
| Total | 144 (46.3%) | 167 (53.7%) |
Fertility by Education in Lackawanna
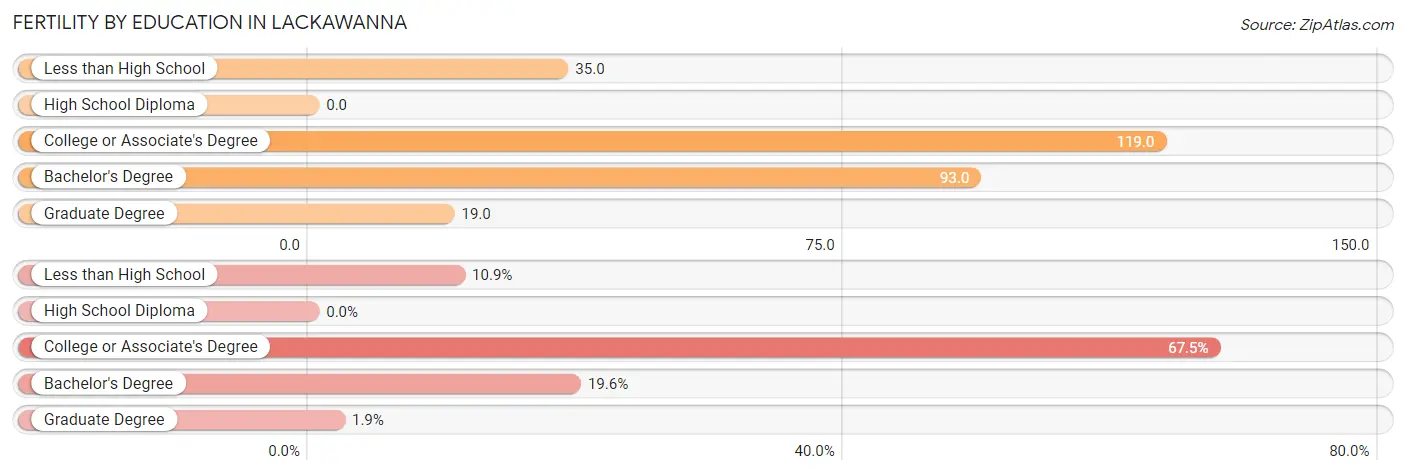
| Educational Attainment | Women with Births | Births / 1,000 Women |
| Less than High School | 34 (10.9%) | 35.0 |
| High School Diploma | 0 (0.0%) | 0.0 |
| College or Associate's Degree | 210 (67.5%) | 119.0 |
| Bachelor's Degree | 61 (19.6%) | 93.0 |
| Graduate Degree | 6 (1.9%) | 19.0 |
| Total | 311 (100.0%) | 68.0 |
Fertility by Education by Marriage Status in Lackawanna
53.7% of women with births in Lackawanna are unmarried. Women with the educational attainment of graduate degree are most likely to be married with 100.0% of them married at childbirth, while women with the educational attainment of college or associate's degree are least likely to be married with 56.7% of them unmarried at childbirth.
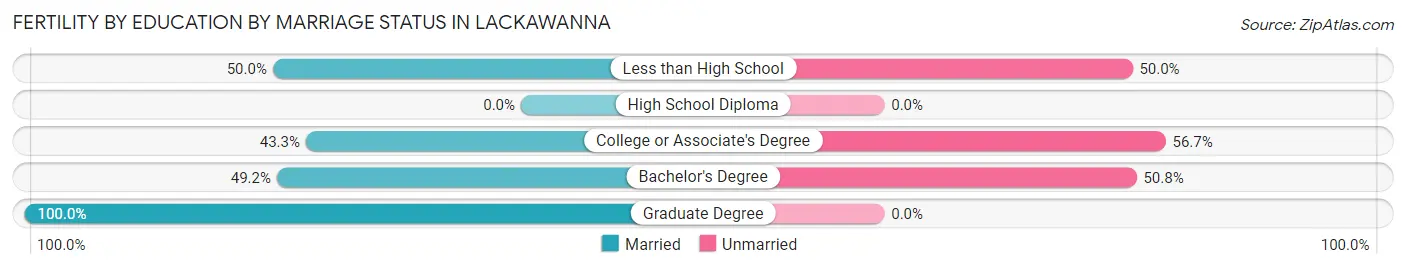
| Educational Attainment | Married | Unmarried |
| Less than High School | 17 (50.0%) | 17 (50.0%) |
| High School Diploma | 0 (0.0%) | 0 (0.0%) |
| College or Associate's Degree | 91 (43.3%) | 119 (56.7%) |
| Bachelor's Degree | 30 (49.2%) | 31 (50.8%) |
| Graduate Degree | 6 (100.0%) | 0 (0.0%) |
| Total | 144 (46.3%) | 167 (53.7%) |
Employment Characteristics in Lackawanna
Employment by Class of Employer in Lackawanna
Among the 9,039 employed individuals in Lackawanna, private company employees (6,591 | 72.9%), local government employees (692 | 7.7%), and not-for-profit organizations (621 | 6.9%) make up the most common classes of employment.
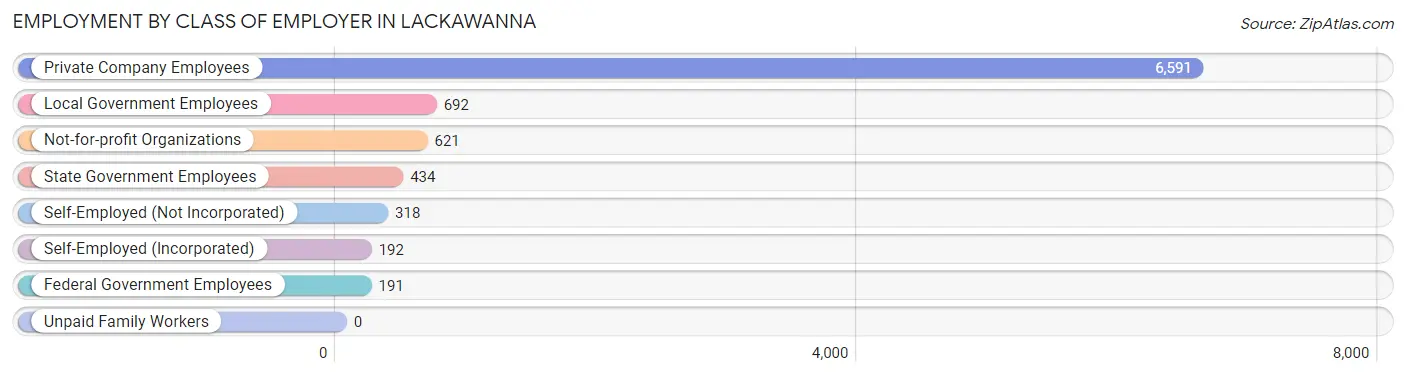
| Employer Class | # Employees | % Employees |
| Private Company Employees | 6,591 | 72.9% |
| Self-Employed (Incorporated) | 192 | 2.1% |
| Self-Employed (Not Incorporated) | 318 | 3.5% |
| Not-for-profit Organizations | 621 | 6.9% |
| Local Government Employees | 692 | 7.7% |
| State Government Employees | 434 | 4.8% |
| Federal Government Employees | 191 | 2.1% |
| Unpaid Family Workers | 0 | 0.0% |
| Total | 9,039 | 100.0% |
Employment Status by Age in Lackawanna
According to the labor force statistics for Lackawanna, out of the total population over 16 years of age (15,992), 61.0% or 9,755 individuals are in the labor force, with 5.4% or 527 of them unemployed. The age group with the highest labor force participation rate is 35 to 44 years, with 86.9% or 1,793 individuals in the labor force. Within the labor force, the 75 years and over age range has the highest percentage of unemployed individuals, with 58.8% or 11 of them being unemployed.
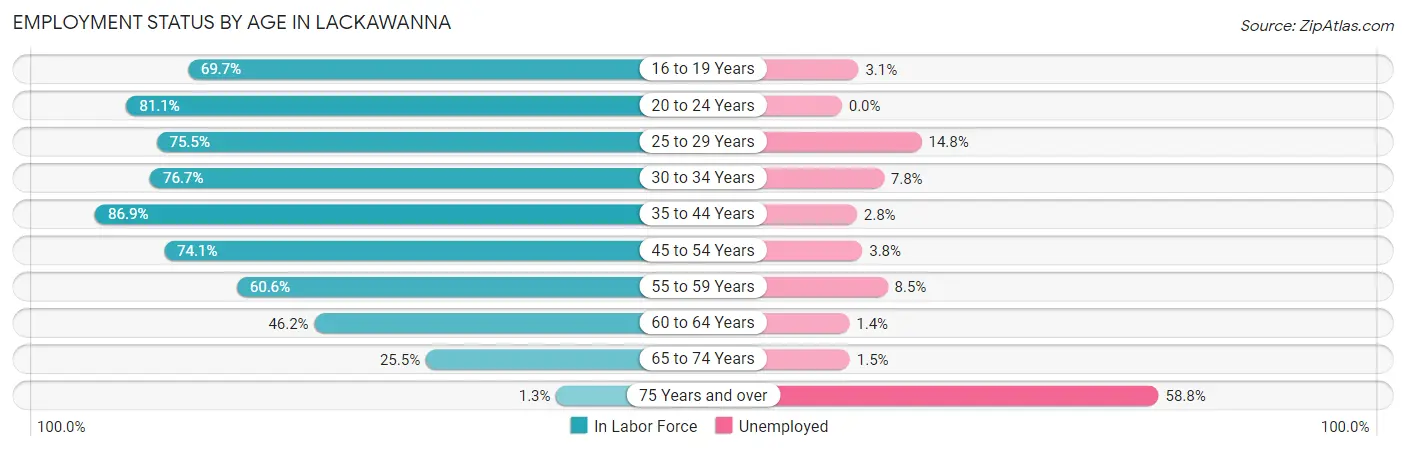
| Age Bracket | In Labor Force | Unemployed |
| 16 to 19 Years | 480 (69.7%) | 15 (3.1%) |
| 20 to 24 Years | 952 (81.1%) | 0 (0.0%) |
| 25 to 29 Years | 1,206 (75.5%) | 178 (14.8%) |
| 30 to 34 Years | 1,262 (76.7%) | 98 (7.8%) |
| 35 to 44 Years | 1,793 (86.9%) | 50 (2.8%) |
| 45 to 54 Years | 2,007 (74.1%) | 76 (3.8%) |
| 55 to 59 Years | 939 (60.6%) | 80 (8.5%) |
| 60 to 64 Years | 631 (46.2%) | 9 (1.4%) |
| 65 to 74 Years | 473 (25.5%) | 7 (1.5%) |
| 75 Years and over | 18 (1.3%) | 11 (58.8%) |
| Total | 9,755 (61.0%) | 527 (5.4%) |
Employment Status by Educational Attainment in Lackawanna
According to labor force statistics for Lackawanna, 71.7% of individuals (7,836) out of the total population between 25 and 64 years of age (10,929) are in the labor force, with 6.3% or 494 of them being unemployed. The group with the highest labor force participation rate are those with the educational attainment of bachelor's degree or higher, with 86.0% or 1,916 individuals in the labor force. Within the labor force, individuals with college / associate degree education have the highest percentage of unemployment, with 12.3% or 356 of them being unemployed.
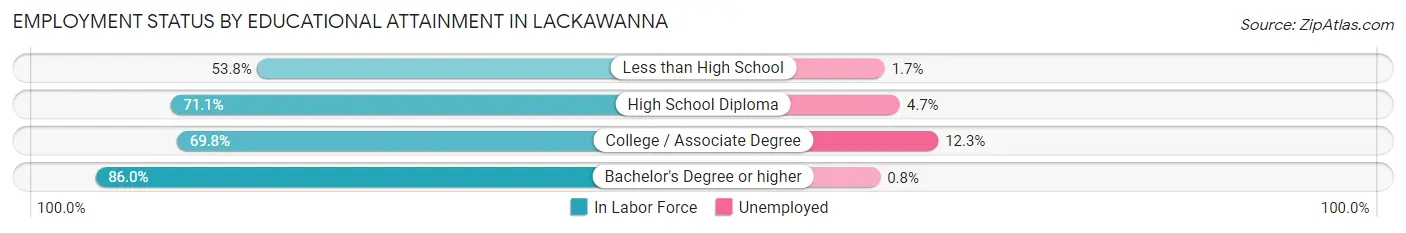
| Educational Attainment | In Labor Force | Unemployed |
| Less than High School | 659 (53.8%) | 21 (1.7%) |
| High School Diploma | 2,369 (71.1%) | 157 (4.7%) |
| College / Associate Degree | 2,893 (69.8%) | 510 (12.3%) |
| Bachelor's Degree or higher | 1,916 (86.0%) | 18 (0.8%) |
| Total | 7,836 (71.7%) | 689 (6.3%) |
Employment Occupations by Sex in Lackawanna
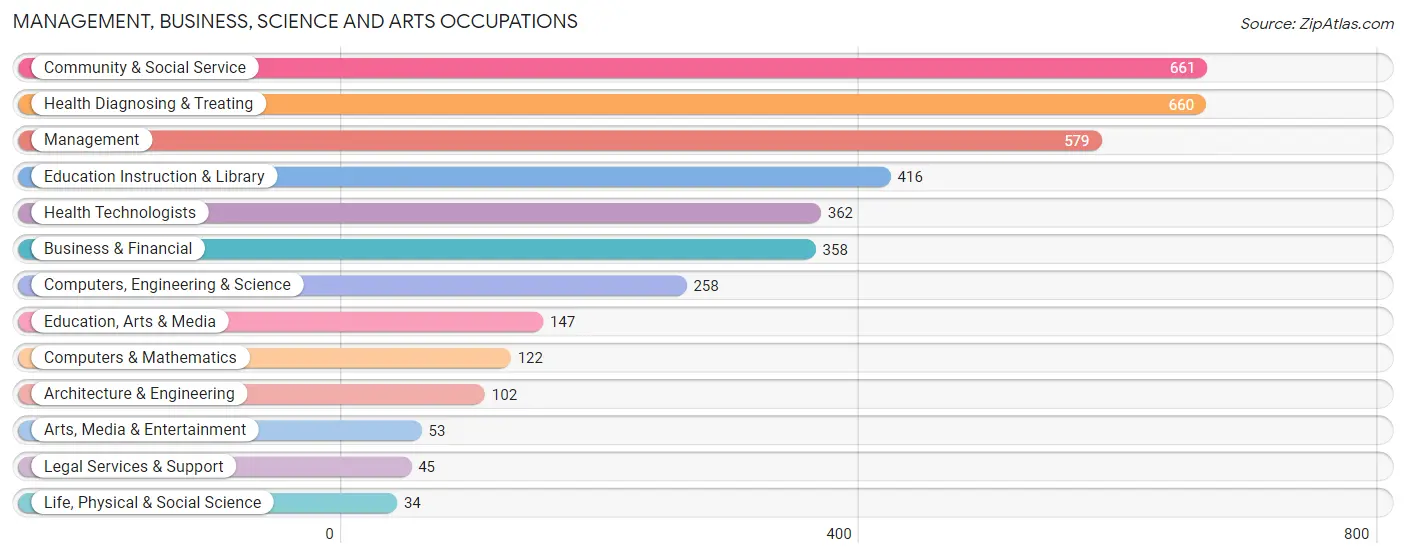
Management, Business, Science and Arts Occupations
The most common Management, Business, Science and Arts occupations in Lackawanna are Community & Social Service (661 | 7.2%), Health Diagnosing & Treating (660 | 7.1%), Management (579 | 6.3%), Education Instruction & Library (416 | 4.5%), and Health Technologists (362 | 3.9%).
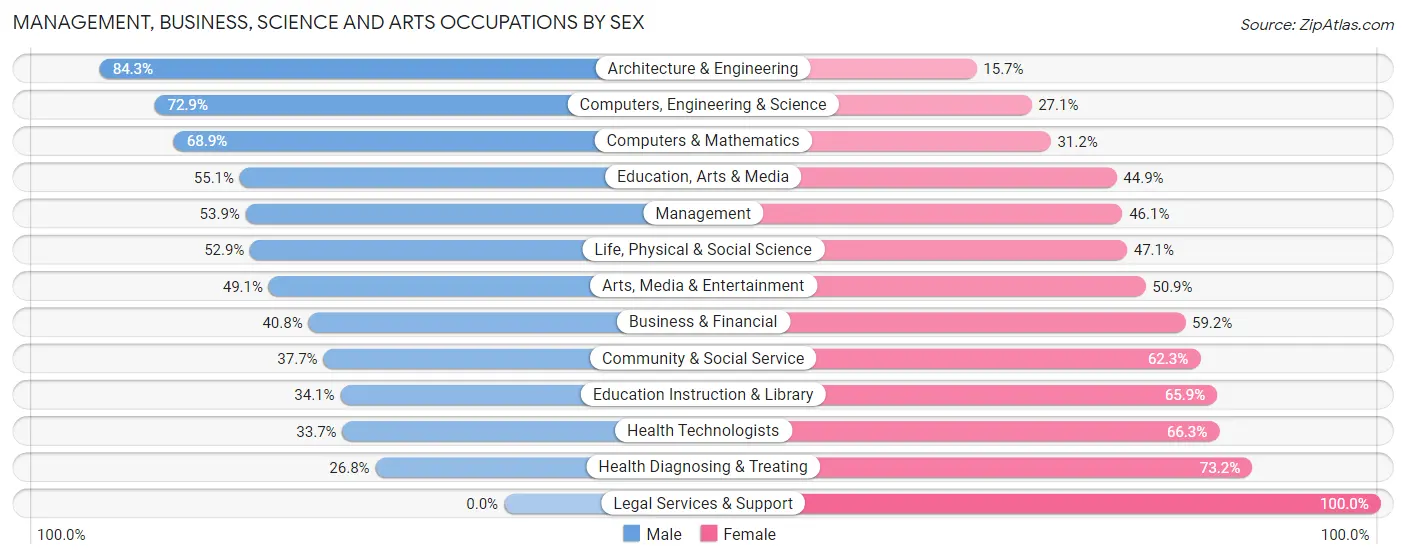
Management, Business, Science and Arts Occupations by Sex
Within the Management, Business, Science and Arts occupations in Lackawanna, the most male-oriented occupations are Architecture & Engineering (84.3%), Computers, Engineering & Science (72.9%), and Computers & Mathematics (68.9%), while the most female-oriented occupations are Legal Services & Support (100.0%), Health Diagnosing & Treating (73.2%), and Health Technologists (66.3%).
| Occupation | Male | Female |
| Management | 312 (53.9%) | 267 (46.1%) |
| Business & Financial | 146 (40.8%) | 212 (59.2%) |
| Computers, Engineering & Science | 188 (72.9%) | 70 (27.1%) |
| Computers & Mathematics | 84 (68.9%) | 38 (31.1%) |
| Architecture & Engineering | 86 (84.3%) | 16 (15.7%) |
| Life, Physical & Social Science | 18 (52.9%) | 16 (47.1%) |
| Community & Social Service | 249 (37.7%) | 412 (62.3%) |
| Education, Arts & Media | 81 (55.1%) | 66 (44.9%) |
| Legal Services & Support | 0 (0.0%) | 45 (100.0%) |
| Education Instruction & Library | 142 (34.1%) | 274 (65.9%) |
| Arts, Media & Entertainment | 26 (49.1%) | 27 (50.9%) |
| Health Diagnosing & Treating | 177 (26.8%) | 483 (73.2%) |
| Health Technologists | 122 (33.7%) | 240 (66.3%) |
| Total (Category) | 1,072 (42.6%) | 1,444 (57.4%) |
| Total (Overall) | 4,954 (53.7%) | 4,278 (46.3%) |
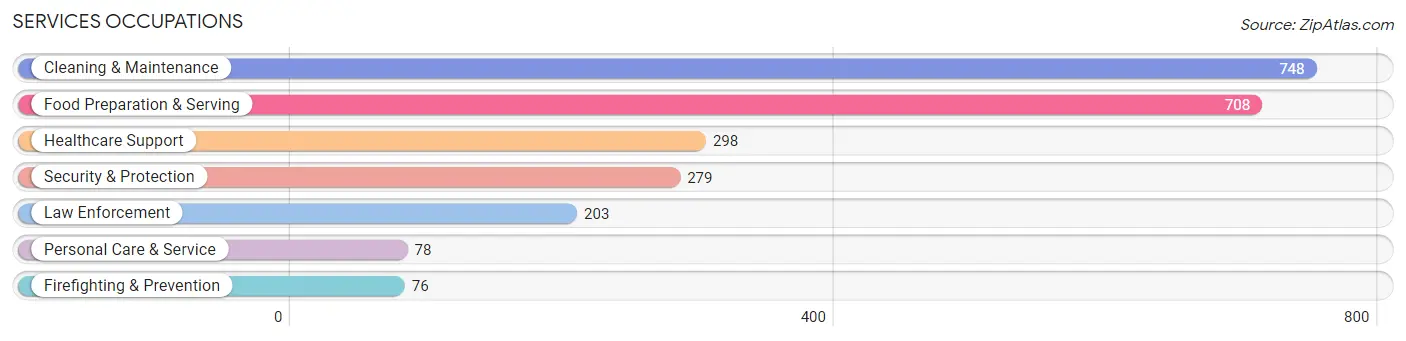
Services Occupations
The most common Services occupations in Lackawanna are Cleaning & Maintenance (748 | 8.1%), Food Preparation & Serving (708 | 7.7%), Healthcare Support (298 | 3.2%), Security & Protection (279 | 3.0%), and Law Enforcement (203 | 2.2%).
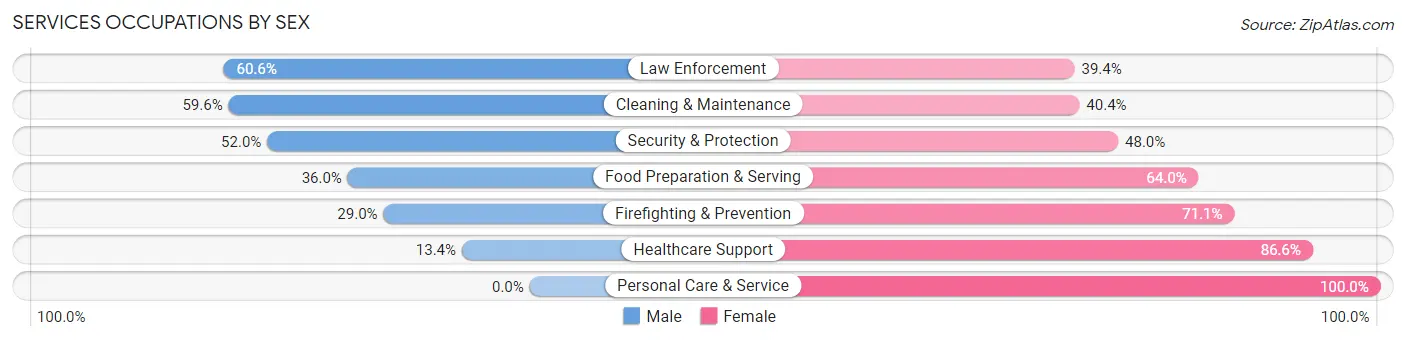
Services Occupations by Sex
Within the Services occupations in Lackawanna, the most male-oriented occupations are Law Enforcement (60.6%), Cleaning & Maintenance (59.6%), and Security & Protection (52.0%), while the most female-oriented occupations are Personal Care & Service (100.0%), Healthcare Support (86.6%), and Firefighting & Prevention (71.1%).
| Occupation | Male | Female |
| Healthcare Support | 40 (13.4%) | 258 (86.6%) |
| Security & Protection | 145 (52.0%) | 134 (48.0%) |
| Firefighting & Prevention | 22 (28.9%) | 54 (71.1%) |
| Law Enforcement | 123 (60.6%) | 80 (39.4%) |
| Food Preparation & Serving | 255 (36.0%) | 453 (64.0%) |
| Cleaning & Maintenance | 446 (59.6%) | 302 (40.4%) |
| Personal Care & Service | 0 (0.0%) | 78 (100.0%) |
| Total (Category) | 886 (42.0%) | 1,225 (58.0%) |
| Total (Overall) | 4,954 (53.7%) | 4,278 (46.3%) |
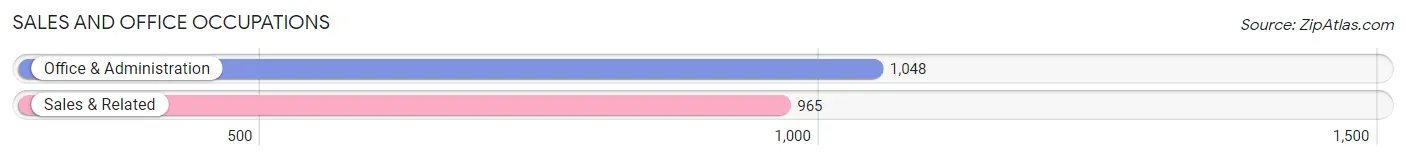
Sales and Office Occupations
The most common Sales and Office occupations in Lackawanna are Office & Administration (1,048 | 11.4%), and Sales & Related (965 | 10.4%).
Sales and Office Occupations by Sex
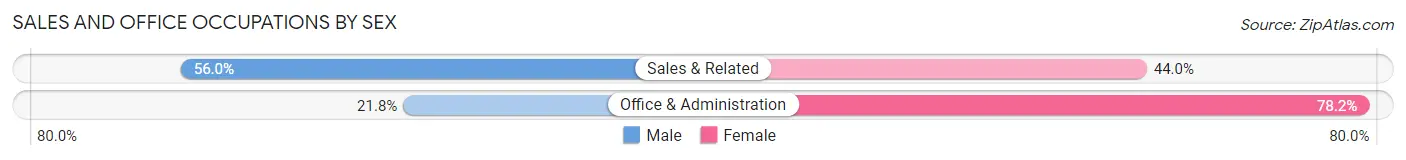
| Occupation | Male | Female |
| Sales & Related | 540 (56.0%) | 425 (44.0%) |
| Office & Administration | 228 (21.8%) | 820 (78.2%) |
| Total (Category) | 768 (38.2%) | 1,245 (61.9%) |
| Total (Overall) | 4,954 (53.7%) | 4,278 (46.3%) |
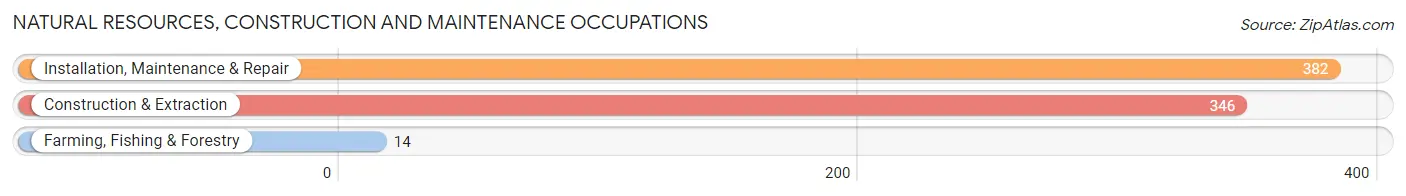
Natural Resources, Construction and Maintenance Occupations
The most common Natural Resources, Construction and Maintenance occupations in Lackawanna are Installation, Maintenance & Repair (382 | 4.1%), Construction & Extraction (346 | 3.7%), and Farming, Fishing & Forestry (14 | 0.2%).
Natural Resources, Construction and Maintenance Occupations by Sex
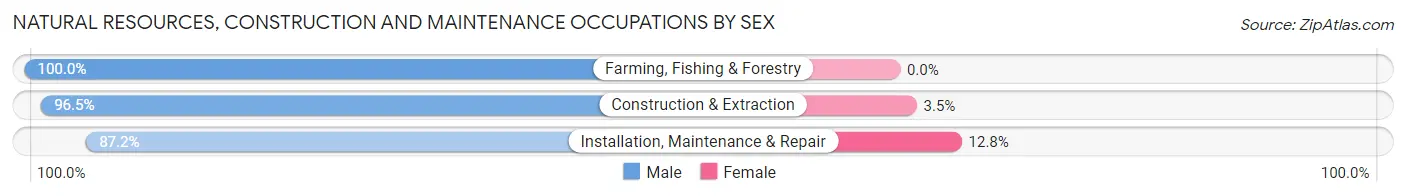
| Occupation | Male | Female |
| Farming, Fishing & Forestry | 14 (100.0%) | 0 (0.0%) |
| Construction & Extraction | 334 (96.5%) | 12 (3.5%) |
| Installation, Maintenance & Repair | 333 (87.2%) | 49 (12.8%) |
| Total (Category) | 681 (91.8%) | 61 (8.2%) |
| Total (Overall) | 4,954 (53.7%) | 4,278 (46.3%) |
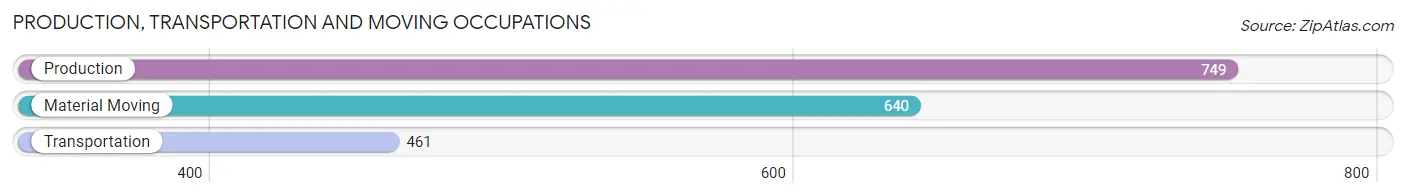
Production, Transportation and Moving Occupations
The most common Production, Transportation and Moving occupations in Lackawanna are Production (749 | 8.1%), Material Moving (640 | 6.9%), and Transportation (461 | 5.0%).
Production, Transportation and Moving Occupations by Sex
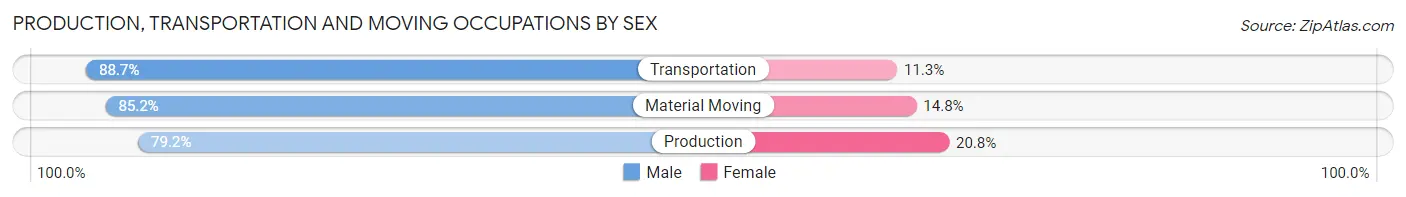
| Occupation | Male | Female |
| Production | 593 (79.2%) | 156 (20.8%) |
| Transportation | 409 (88.7%) | 52 (11.3%) |
| Material Moving | 545 (85.2%) | 95 (14.8%) |
| Total (Category) | 1,547 (83.6%) | 303 (16.4%) |
| Total (Overall) | 4,954 (53.7%) | 4,278 (46.3%) |
Employment Industries by Sex in Lackawanna
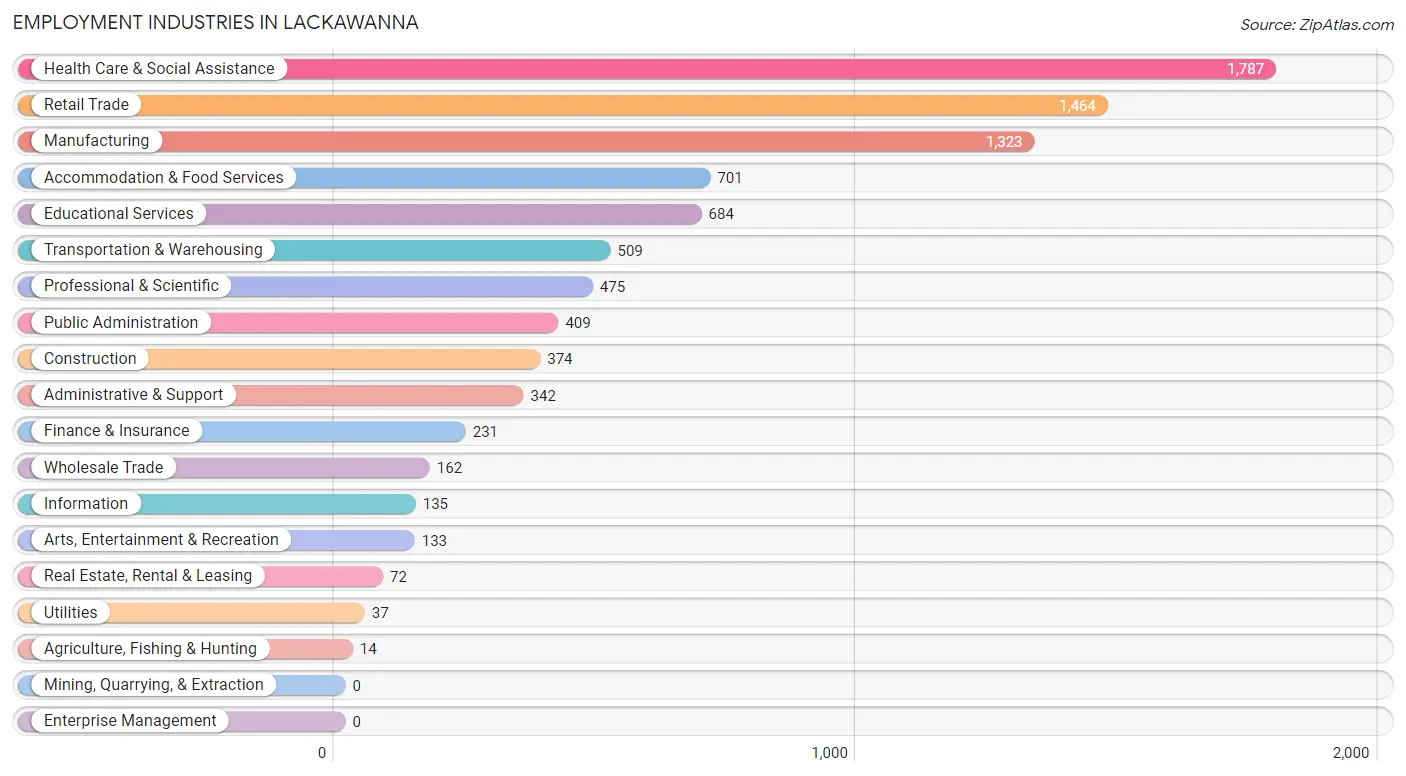
Employment Industries in Lackawanna
The major employment industries in Lackawanna include Health Care & Social Assistance (1,787 | 19.4%), Retail Trade (1,464 | 15.9%), Manufacturing (1,323 | 14.3%), Accommodation & Food Services (701 | 7.6%), and Educational Services (684 | 7.4%).
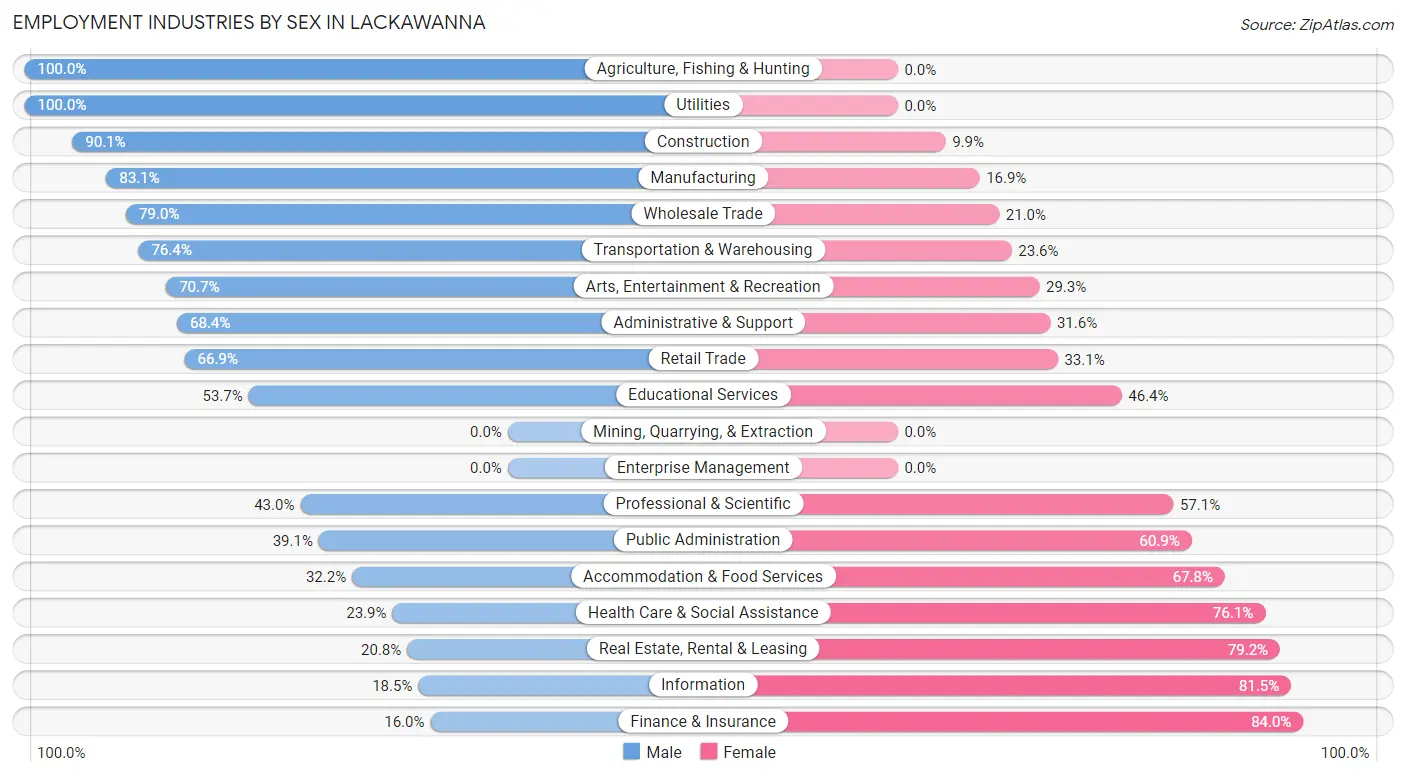
Employment Industries by Sex in Lackawanna
The Lackawanna industries that see more men than women are Agriculture, Fishing & Hunting (100.0%), Utilities (100.0%), and Construction (90.1%), whereas the industries that tend to have a higher number of women are Finance & Insurance (84.0%), Information (81.5%), and Real Estate, Rental & Leasing (79.2%).
| Industry | Male | Female |
| Agriculture, Fishing & Hunting | 14 (100.0%) | 0 (0.0%) |
| Mining, Quarrying, & Extraction | 0 (0.0%) | 0 (0.0%) |
| Construction | 337 (90.1%) | 37 (9.9%) |
| Manufacturing | 1,099 (83.1%) | 224 (16.9%) |
| Wholesale Trade | 128 (79.0%) | 34 (21.0%) |
| Retail Trade | 979 (66.9%) | 485 (33.1%) |
| Transportation & Warehousing | 389 (76.4%) | 120 (23.6%) |
| Utilities | 37 (100.0%) | 0 (0.0%) |
| Information | 25 (18.5%) | 110 (81.5%) |
| Finance & Insurance | 37 (16.0%) | 194 (84.0%) |
| Real Estate, Rental & Leasing | 15 (20.8%) | 57 (79.2%) |
| Professional & Scientific | 204 (42.9%) | 271 (57.1%) |
| Enterprise Management | 0 (0.0%) | 0 (0.0%) |
| Administrative & Support | 234 (68.4%) | 108 (31.6%) |
| Educational Services | 367 (53.6%) | 317 (46.4%) |
| Health Care & Social Assistance | 427 (23.9%) | 1,360 (76.1%) |
| Arts, Entertainment & Recreation | 94 (70.7%) | 39 (29.3%) |
| Accommodation & Food Services | 226 (32.2%) | 475 (67.8%) |
| Public Administration | 160 (39.1%) | 249 (60.9%) |
| Total | 4,954 (53.7%) | 4,278 (46.3%) |
Education in Lackawanna
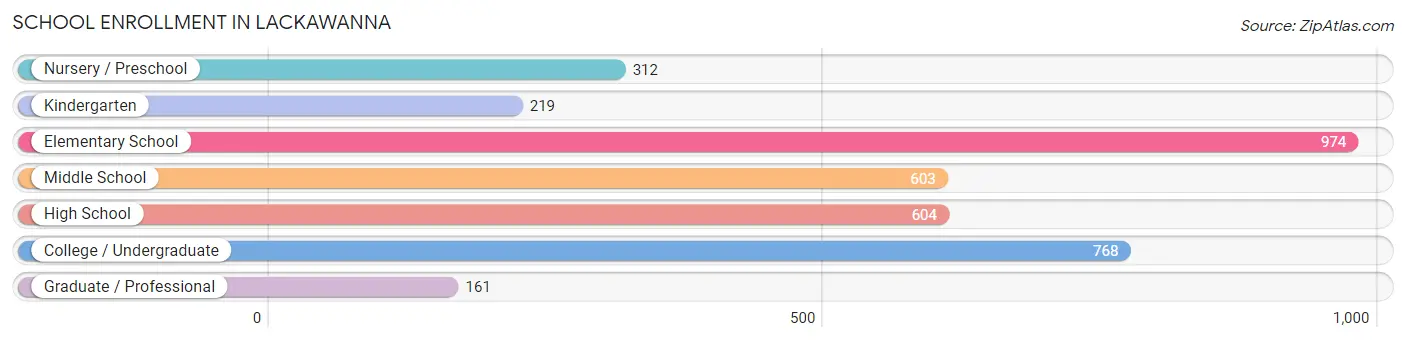
School Enrollment in Lackawanna
The most common levels of schooling among the 3,641 students in Lackawanna are elementary school (974 | 26.8%), college / undergraduate (768 | 21.1%), and high school (604 | 16.6%).
| School Level | # Students | % Students |
| Nursery / Preschool | 312 | 8.6% |
| Kindergarten | 219 | 6.0% |
| Elementary School | 974 | 26.8% |
| Middle School | 603 | 16.6% |
| High School | 604 | 16.6% |
| College / Undergraduate | 768 | 21.1% |
| Graduate / Professional | 161 | 4.4% |
| Total | 3,641 | 100.0% |
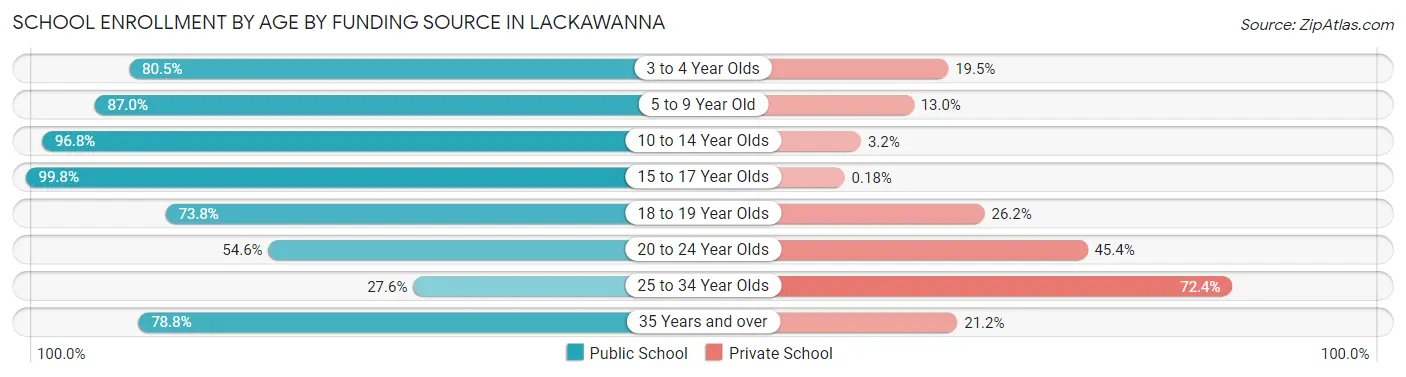
School Enrollment by Age by Funding Source in Lackawanna
Out of a total of 3,641 students who are enrolled in schools in Lackawanna, 630 (17.3%) attend a private institution, while the remaining 3,011 (82.7%) are enrolled in public schools. The age group of 25 to 34 year olds has the highest likelihood of being enrolled in private schools, with 194 (72.4% in the age bracket) enrolled. Conversely, the age group of 15 to 17 year olds has the lowest likelihood of being enrolled in a private school, with 541 (99.8% in the age bracket) attending a public institution.
| Age Bracket | Public School | Private School |
| 3 to 4 Year Olds | 273 (80.5%) | 66 (19.5%) |
| 5 to 9 Year Old | 947 (87.0%) | 142 (13.0%) |
| 10 to 14 Year Olds | 718 (96.8%) | 24 (3.2%) |
| 15 to 17 Year Olds | 541 (99.8%) | 1 (0.2%) |
| 18 to 19 Year Olds | 163 (73.8%) | 58 (26.2%) |
| 20 to 24 Year Olds | 119 (54.6%) | 99 (45.4%) |
| 25 to 34 Year Olds | 74 (27.6%) | 194 (72.4%) |
| 35 Years and over | 175 (78.8%) | 47 (21.2%) |
| Total | 3,011 (82.7%) | 630 (17.3%) |
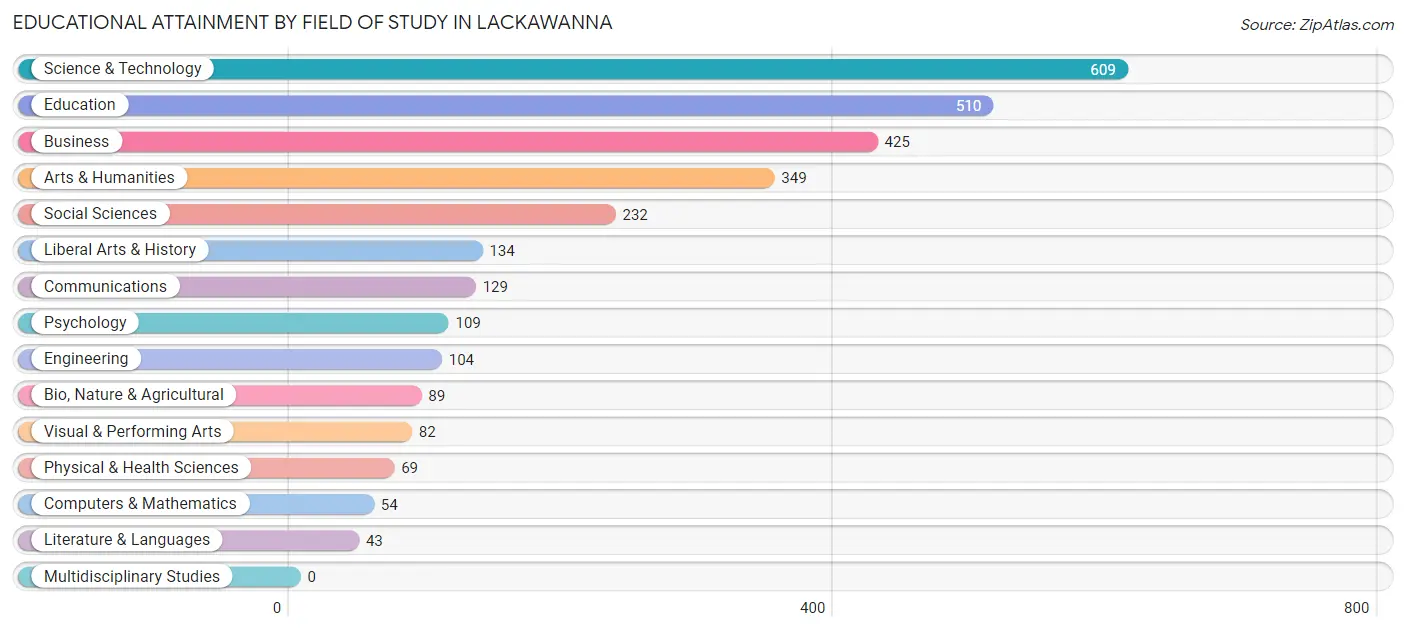
Educational Attainment by Field of Study in Lackawanna
Science & technology (609 | 20.7%), education (510 | 17.4%), business (425 | 14.5%), arts & humanities (349 | 11.9%), and social sciences (232 | 7.9%) are the most common fields of study among 2,938 individuals in Lackawanna who have obtained a bachelor's degree or higher.
| Field of Study | # Graduates | % Graduates |
| Computers & Mathematics | 54 | 1.8% |
| Bio, Nature & Agricultural | 89 | 3.0% |
| Physical & Health Sciences | 69 | 2.4% |
| Psychology | 109 | 3.7% |
| Social Sciences | 232 | 7.9% |
| Engineering | 104 | 3.5% |
| Multidisciplinary Studies | 0 | 0.0% |
| Science & Technology | 609 | 20.7% |
| Business | 425 | 14.5% |
| Education | 510 | 17.4% |
| Literature & Languages | 43 | 1.5% |
| Liberal Arts & History | 134 | 4.6% |
| Visual & Performing Arts | 82 | 2.8% |
| Communications | 129 | 4.4% |
| Arts & Humanities | 349 | 11.9% |
| Total | 2,938 | 100.0% |
Transportation & Commute in Lackawanna
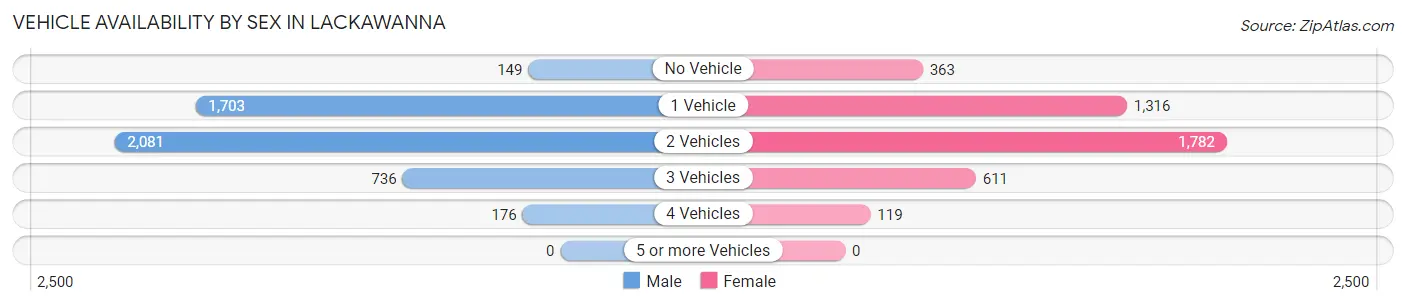
Vehicle Availability by Sex in Lackawanna
The most prevalent vehicle ownership categories in Lackawanna are males with 2 vehicles (2,081, accounting for 42.9%) and females with 2 vehicles (1,782, making up 49.6%).
| Vehicles Available | Male | Female |
| No Vehicle | 149 (3.1%) | 363 (8.7%) |
| 1 Vehicle | 1,703 (35.1%) | 1,316 (31.4%) |
| 2 Vehicles | 2,081 (42.9%) | 1,782 (42.5%) |
| 3 Vehicles | 736 (15.2%) | 611 (14.6%) |
| 4 Vehicles | 176 (3.6%) | 119 (2.8%) |
| 5 or more Vehicles | 0 (0.0%) | 0 (0.0%) |
| Total | 4,845 (100.0%) | 4,191 (100.0%) |
Commute Time in Lackawanna
The most frequently occuring commute durations in Lackawanna are 10 to 14 minutes (1,764 commuters, 20.5%), 15 to 19 minutes (1,636 commuters, 19.0%), and 20 to 24 minutes (1,463 commuters, 17.0%).
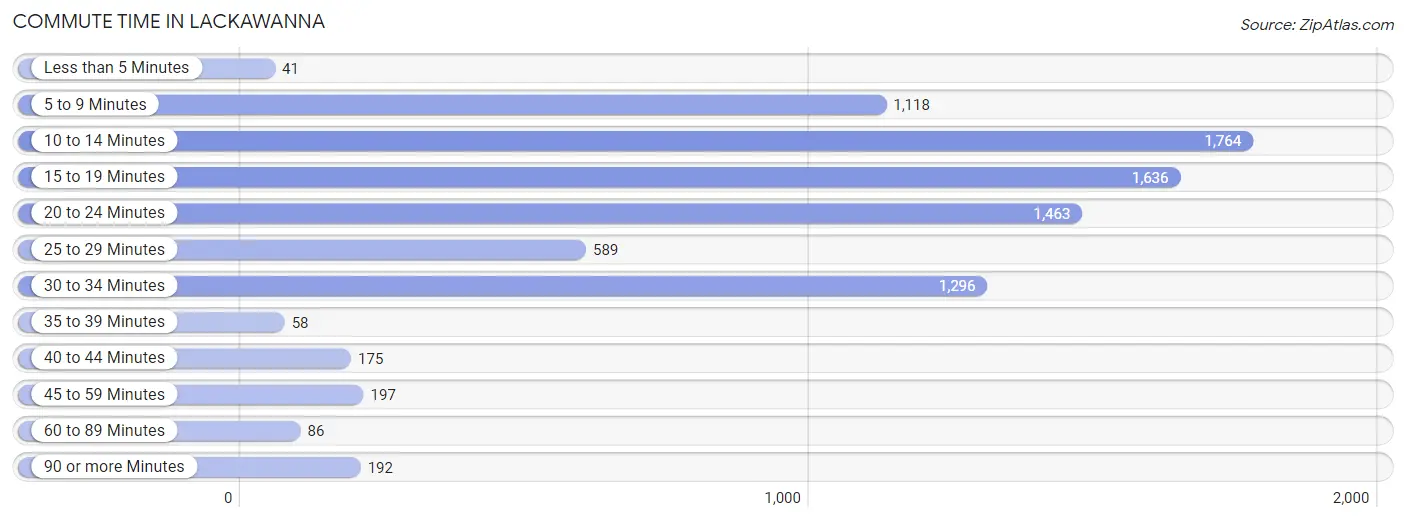
| Commute Time | # Commuters | % Commuters |
| Less than 5 Minutes | 41 | 0.5% |
| 5 to 9 Minutes | 1,118 | 13.0% |
| 10 to 14 Minutes | 1,764 | 20.5% |
| 15 to 19 Minutes | 1,636 | 19.0% |
| 20 to 24 Minutes | 1,463 | 17.0% |
| 25 to 29 Minutes | 589 | 6.8% |
| 30 to 34 Minutes | 1,296 | 15.0% |
| 35 to 39 Minutes | 58 | 0.7% |
| 40 to 44 Minutes | 175 | 2.0% |
| 45 to 59 Minutes | 197 | 2.3% |
| 60 to 89 Minutes | 86 | 1.0% |
| 90 or more Minutes | 192 | 2.2% |
Commute Time by Sex in Lackawanna
The most common commute times in Lackawanna are 15 to 19 minutes (1,004 commuters, 21.3%) for males and 10 to 14 minutes (791 commuters, 20.3%) for females.
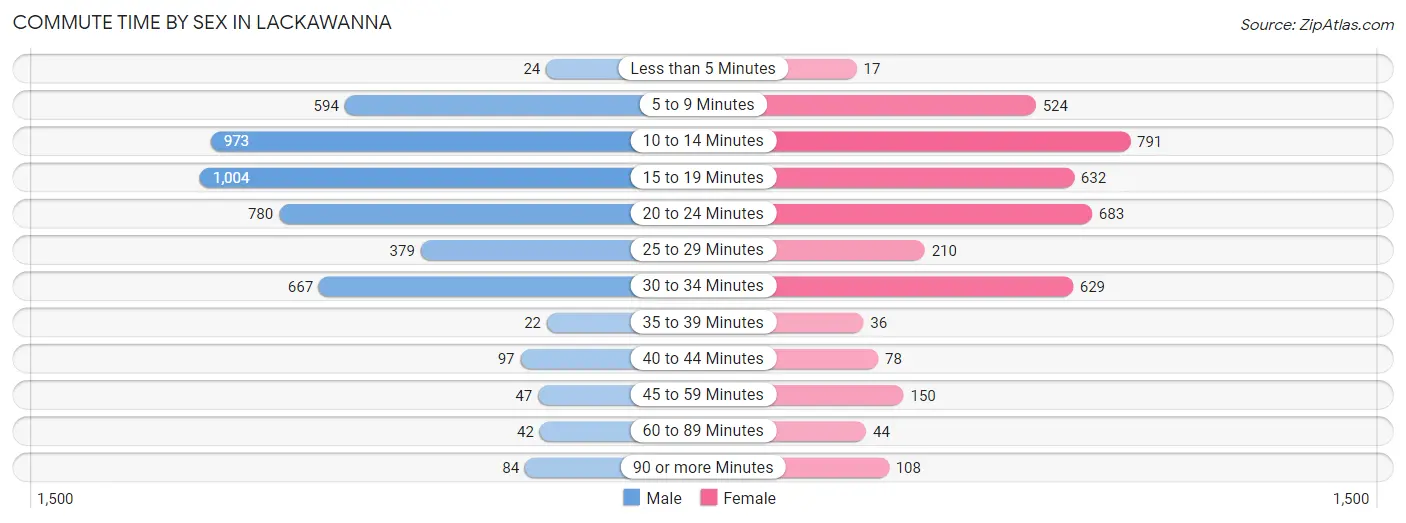
| Commute Time | Male | Female |
| Less than 5 Minutes | 24 (0.5%) | 17 (0.4%) |
| 5 to 9 Minutes | 594 (12.6%) | 524 (13.4%) |
| 10 to 14 Minutes | 973 (20.6%) | 791 (20.3%) |
| 15 to 19 Minutes | 1,004 (21.3%) | 632 (16.2%) |
| 20 to 24 Minutes | 780 (16.6%) | 683 (17.5%) |
| 25 to 29 Minutes | 379 (8.0%) | 210 (5.4%) |
| 30 to 34 Minutes | 667 (14.1%) | 629 (16.1%) |
| 35 to 39 Minutes | 22 (0.5%) | 36 (0.9%) |
| 40 to 44 Minutes | 97 (2.1%) | 78 (2.0%) |
| 45 to 59 Minutes | 47 (1.0%) | 150 (3.8%) |
| 60 to 89 Minutes | 42 (0.9%) | 44 (1.1%) |
| 90 or more Minutes | 84 (1.8%) | 108 (2.8%) |
Time of Departure to Work by Sex in Lackawanna
The most frequent times of departure to work in Lackawanna are 6:30 AM to 6:59 AM (639, 13.6%) for males and 6:30 AM to 6:59 AM (572, 14.7%) for females.
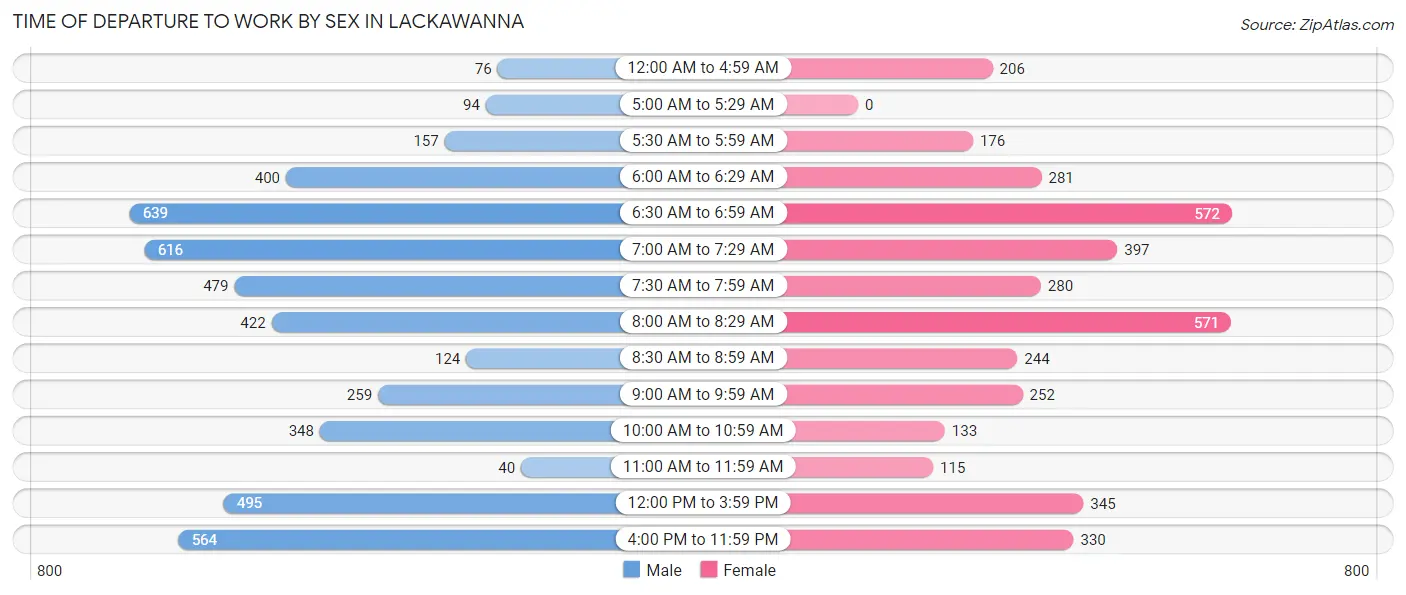
| Time of Departure | Male | Female |
| 12:00 AM to 4:59 AM | 76 (1.6%) | 206 (5.3%) |
| 5:00 AM to 5:29 AM | 94 (2.0%) | 0 (0.0%) |
| 5:30 AM to 5:59 AM | 157 (3.3%) | 176 (4.5%) |
| 6:00 AM to 6:29 AM | 400 (8.5%) | 281 (7.2%) |
| 6:30 AM to 6:59 AM | 639 (13.6%) | 572 (14.7%) |
| 7:00 AM to 7:29 AM | 616 (13.1%) | 397 (10.2%) |
| 7:30 AM to 7:59 AM | 479 (10.2%) | 280 (7.2%) |
| 8:00 AM to 8:29 AM | 422 (8.9%) | 571 (14.6%) |
| 8:30 AM to 8:59 AM | 124 (2.6%) | 244 (6.2%) |
| 9:00 AM to 9:59 AM | 259 (5.5%) | 252 (6.5%) |
| 10:00 AM to 10:59 AM | 348 (7.4%) | 133 (3.4%) |
| 11:00 AM to 11:59 AM | 40 (0.9%) | 115 (2.9%) |
| 12:00 PM to 3:59 PM | 495 (10.5%) | 345 (8.8%) |
| 4:00 PM to 11:59 PM | 564 (12.0%) | 330 (8.5%) |
| Total | 4,713 (100.0%) | 3,902 (100.0%) |
Housing Occupancy in Lackawanna
Occupancy by Ownership in Lackawanna
Of the total 8,582 dwellings in Lackawanna, owner-occupied units account for 4,765 (55.5%), while renter-occupied units make up 3,817 (44.5%).
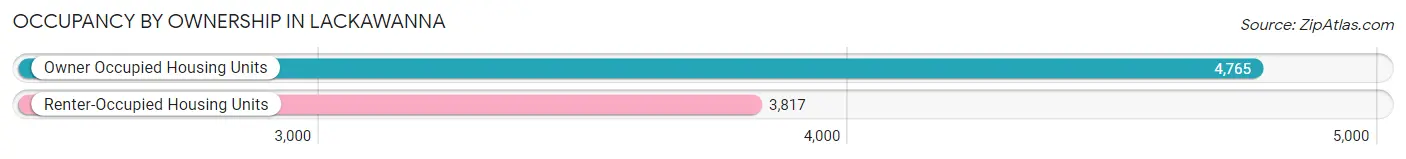
| Occupancy | # Housing Units | % Housing Units |
| Owner Occupied Housing Units | 4,765 | 55.5% |
| Renter-Occupied Housing Units | 3,817 | 44.5% |
| Total Occupied Housing Units | 8,582 | 100.0% |
Occupancy by Household Size in Lackawanna
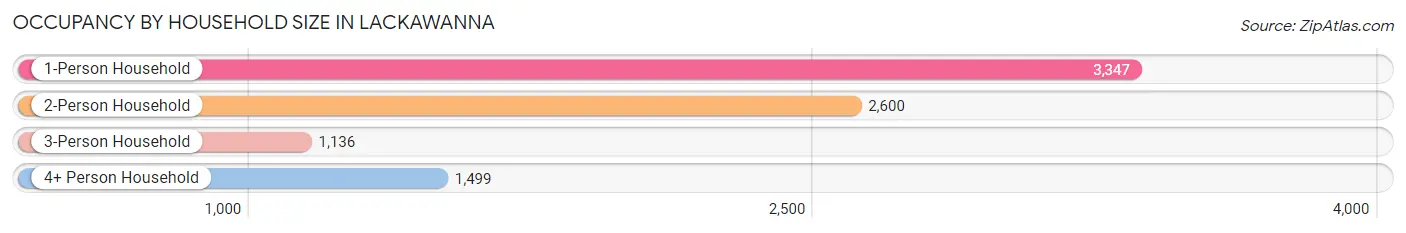
| Household Size | # Housing Units | % Housing Units |
| 1-Person Household | 3,347 | 39.0% |
| 2-Person Household | 2,600 | 30.3% |
| 3-Person Household | 1,136 | 13.2% |
| 4+ Person Household | 1,499 | 17.5% |
| Total Housing Units | 8,582 | 100.0% |
Occupancy by Ownership by Household Size in Lackawanna
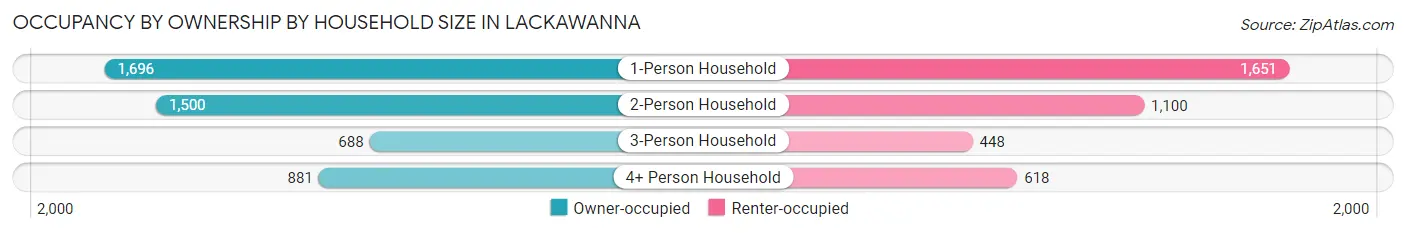
| Household Size | Owner-occupied | Renter-occupied |
| 1-Person Household | 1,696 (50.7%) | 1,651 (49.3%) |
| 2-Person Household | 1,500 (57.7%) | 1,100 (42.3%) |
| 3-Person Household | 688 (60.6%) | 448 (39.4%) |
| 4+ Person Household | 881 (58.8%) | 618 (41.2%) |
| Total Housing Units | 4,765 (55.5%) | 3,817 (44.5%) |
Occupancy by Educational Attainment in Lackawanna
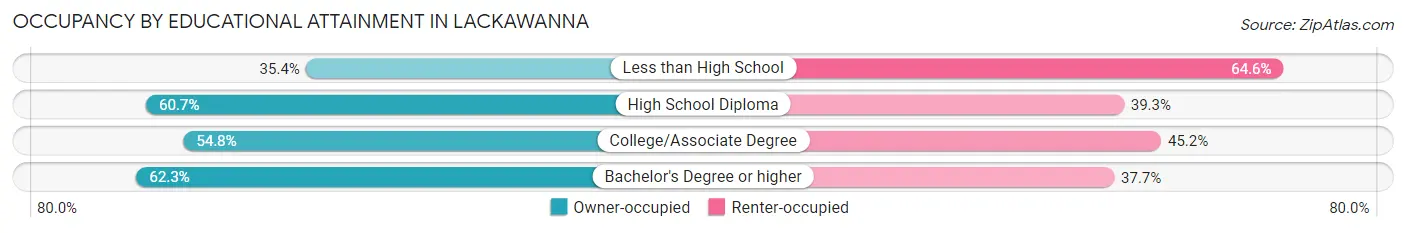
| Household Size | Owner-occupied | Renter-occupied |
| Less than High School | 402 (35.4%) | 733 (64.6%) |
| High School Diploma | 1,633 (60.7%) | 1,056 (39.3%) |
| College/Associate Degree | 1,709 (54.8%) | 1,409 (45.2%) |
| Bachelor's Degree or higher | 1,021 (62.3%) | 619 (37.7%) |
Occupancy by Age of Householder in Lackawanna
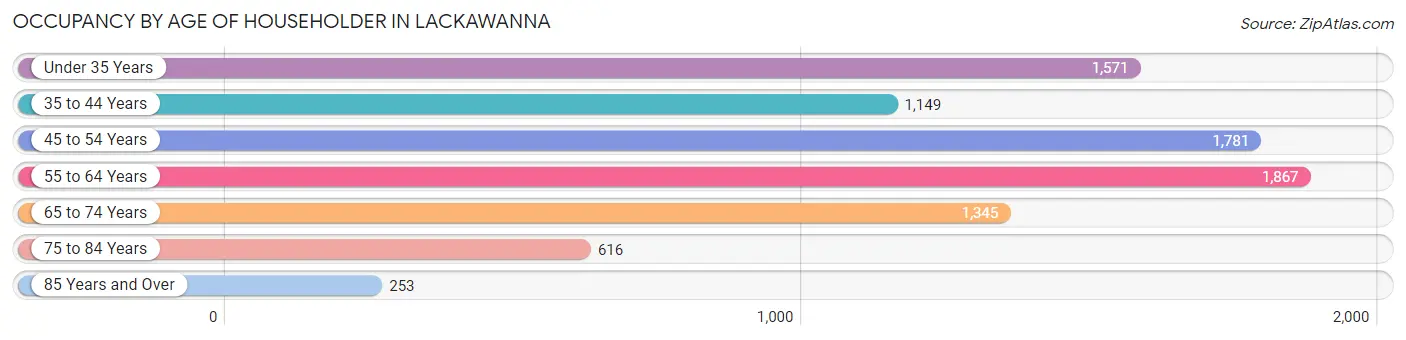
| Age Bracket | # Households | % Households |
| Under 35 Years | 1,571 | 18.3% |
| 35 to 44 Years | 1,149 | 13.4% |
| 45 to 54 Years | 1,781 | 20.7% |
| 55 to 64 Years | 1,867 | 21.7% |
| 65 to 74 Years | 1,345 | 15.7% |
| 75 to 84 Years | 616 | 7.2% |
| 85 Years and Over | 253 | 2.9% |
| Total | 8,582 | 100.0% |
Housing Finances in Lackawanna
Median Income by Occupancy in Lackawanna
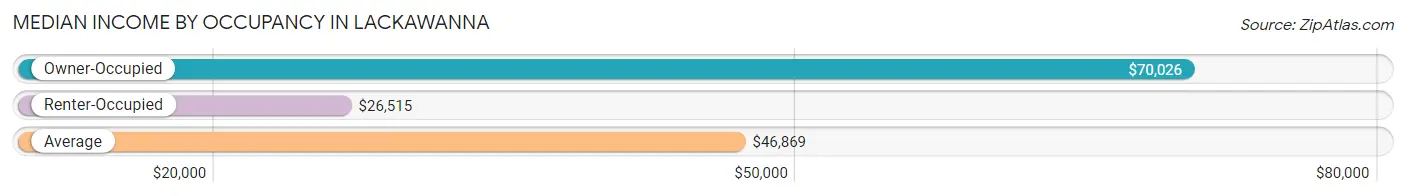
| Occupancy Type | # Households | Median Income |
| Owner-Occupied | 4,765 (55.5%) | $70,026 |
| Renter-Occupied | 3,817 (44.5%) | $26,515 |
| Average | 8,582 (100.0%) | $46,869 |
Occupancy by Householder Income Bracket in Lackawanna
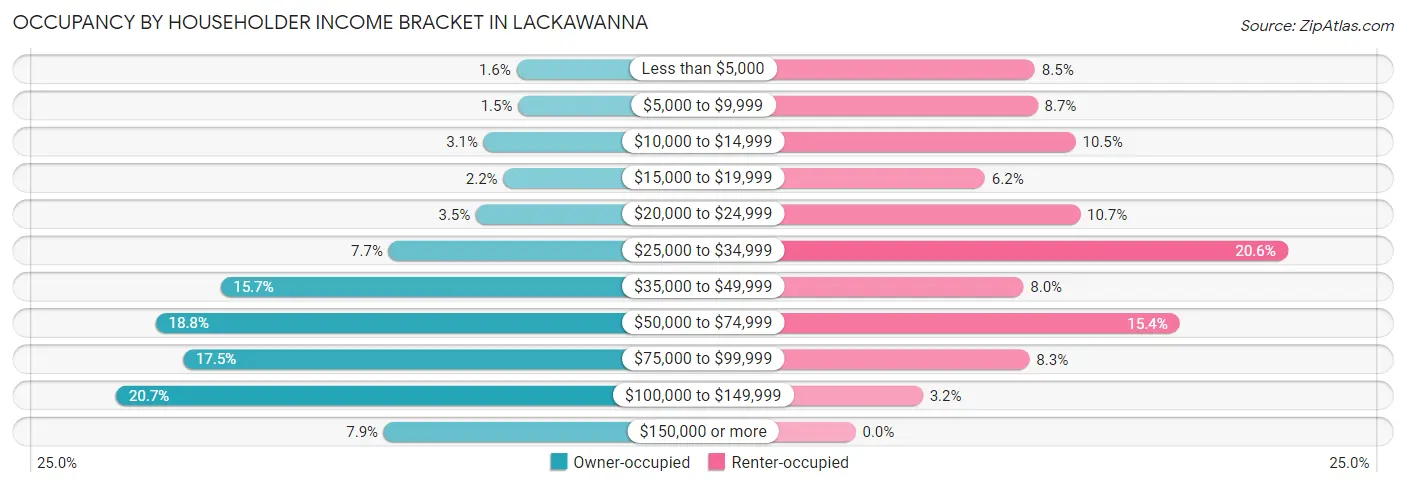
| Income Bracket | Owner-occupied | Renter-occupied |
| Less than $5,000 | 75 (1.6%) | 326 (8.5%) |
| $5,000 to $9,999 | 71 (1.5%) | 331 (8.7%) |
| $10,000 to $14,999 | 149 (3.1%) | 400 (10.5%) |
| $15,000 to $19,999 | 105 (2.2%) | 235 (6.2%) |
| $20,000 to $24,999 | 167 (3.5%) | 408 (10.7%) |
| $25,000 to $34,999 | 365 (7.7%) | 785 (20.6%) |
| $35,000 to $49,999 | 747 (15.7%) | 305 (8.0%) |
| $50,000 to $74,999 | 894 (18.8%) | 589 (15.4%) |
| $75,000 to $99,999 | 832 (17.5%) | 316 (8.3%) |
| $100,000 to $149,999 | 984 (20.6%) | 122 (3.2%) |
| $150,000 or more | 376 (7.9%) | 0 (0.0%) |
| Total | 4,765 (100.0%) | 3,817 (100.0%) |
Monthly Housing Cost Tiers in Lackawanna
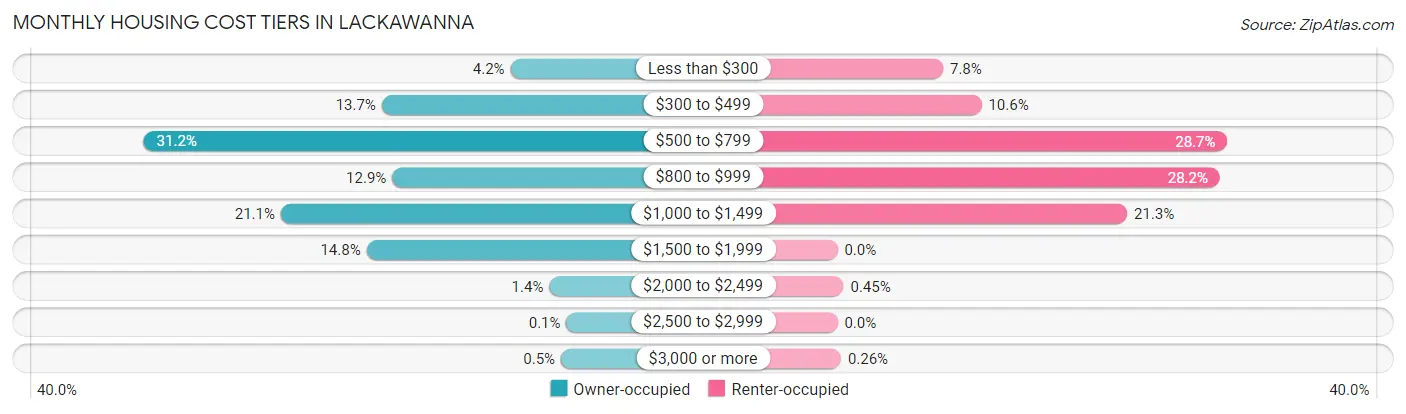
| Monthly Cost | Owner-occupied | Renter-occupied |
| Less than $300 | 201 (4.2%) | 297 (7.8%) |
| $300 to $499 | 653 (13.7%) | 405 (10.6%) |
| $500 to $799 | 1,488 (31.2%) | 1,096 (28.7%) |
| $800 to $999 | 616 (12.9%) | 1,075 (28.2%) |
| $1,000 to $1,499 | 1,007 (21.1%) | 814 (21.3%) |
| $1,500 to $1,999 | 706 (14.8%) | 0 (0.0%) |
| $2,000 to $2,499 | 65 (1.4%) | 17 (0.4%) |
| $2,500 to $2,999 | 5 (0.1%) | 0 (0.0%) |
| $3,000 or more | 24 (0.5%) | 10 (0.3%) |
| Total | 4,765 (100.0%) | 3,817 (100.0%) |
Physical Housing Characteristics in Lackawanna
Housing Structures in Lackawanna
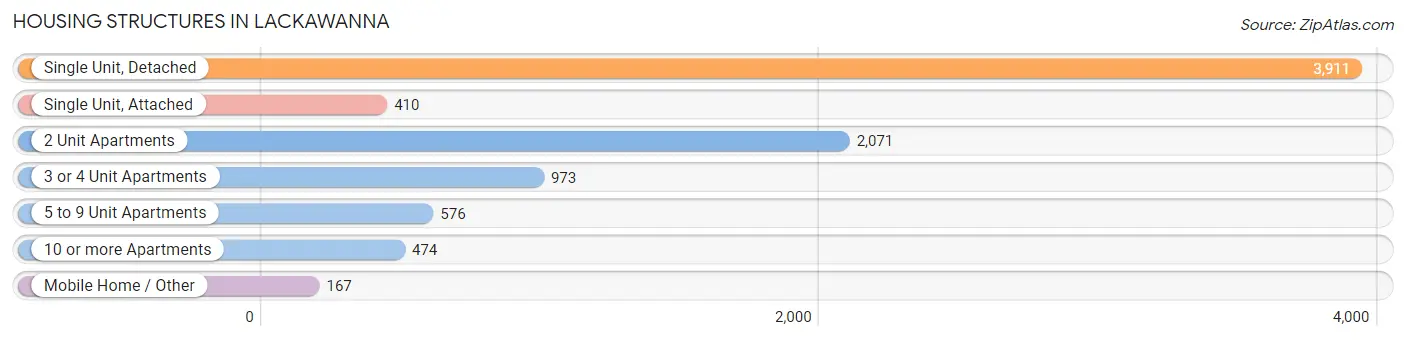
| Structure Type | # Housing Units | % Housing Units |
| Single Unit, Detached | 3,911 | 45.6% |
| Single Unit, Attached | 410 | 4.8% |
| 2 Unit Apartments | 2,071 | 24.1% |
| 3 or 4 Unit Apartments | 973 | 11.3% |
| 5 to 9 Unit Apartments | 576 | 6.7% |
| 10 or more Apartments | 474 | 5.5% |
| Mobile Home / Other | 167 | 1.9% |
| Total | 8,582 | 100.0% |
Housing Structures by Occupancy in Lackawanna
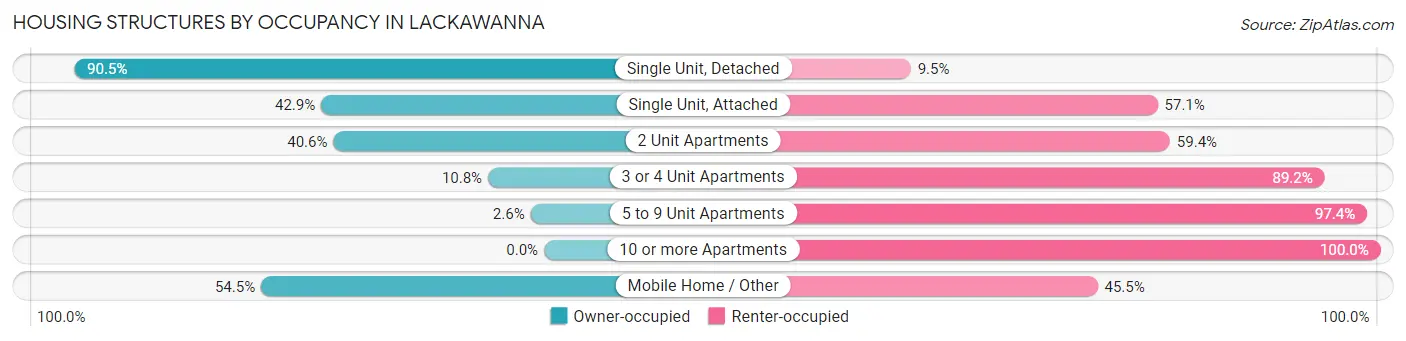
| Structure Type | Owner-occupied | Renter-occupied |
| Single Unit, Detached | 3,538 (90.5%) | 373 (9.5%) |
| Single Unit, Attached | 176 (42.9%) | 234 (57.1%) |
| 2 Unit Apartments | 840 (40.6%) | 1,231 (59.4%) |
| 3 or 4 Unit Apartments | 105 (10.8%) | 868 (89.2%) |
| 5 to 9 Unit Apartments | 15 (2.6%) | 561 (97.4%) |
| 10 or more Apartments | 0 (0.0%) | 474 (100.0%) |
| Mobile Home / Other | 91 (54.5%) | 76 (45.5%) |
| Total | 4,765 (55.5%) | 3,817 (44.5%) |
Housing Structures by Number of Rooms in Lackawanna
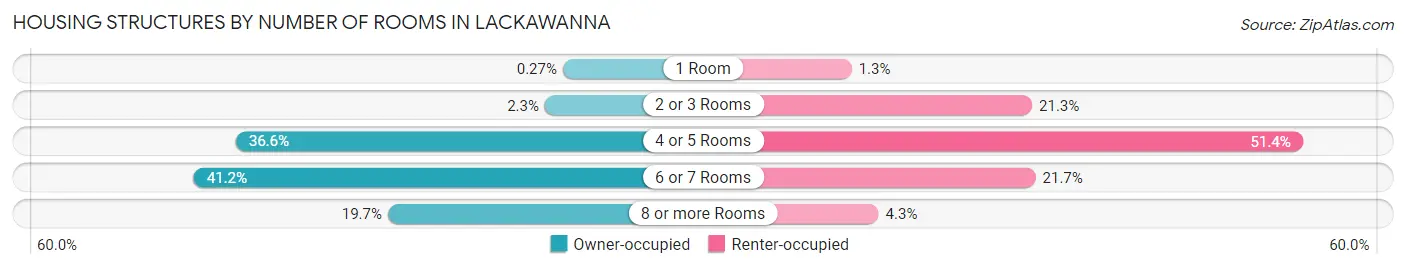
| Number of Rooms | Owner-occupied | Renter-occupied |
| 1 Room | 13 (0.3%) | 50 (1.3%) |
| 2 or 3 Rooms | 108 (2.3%) | 814 (21.3%) |
| 4 or 5 Rooms | 1,742 (36.6%) | 1,960 (51.3%) |
| 6 or 7 Rooms | 1,964 (41.2%) | 829 (21.7%) |
| 8 or more Rooms | 938 (19.7%) | 164 (4.3%) |
| Total | 4,765 (100.0%) | 3,817 (100.0%) |
Housing Structure by Heating Type in Lackawanna
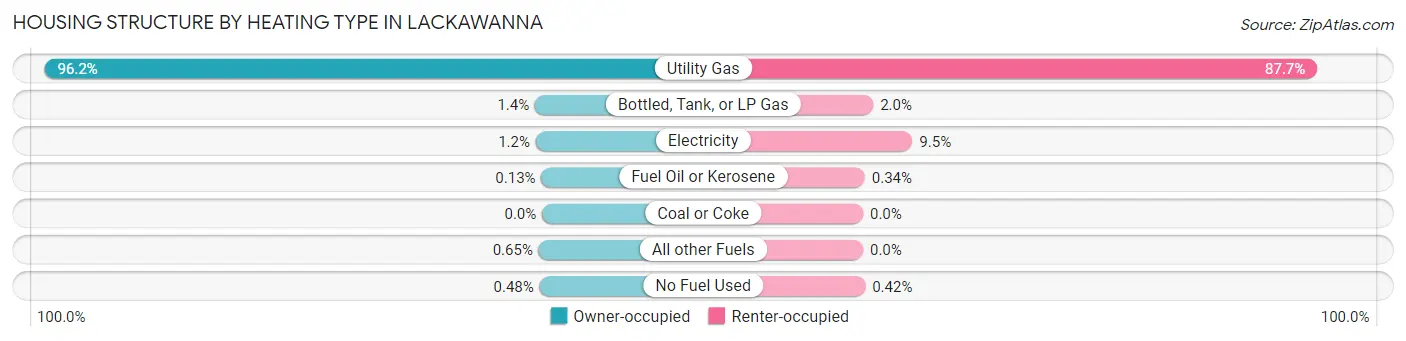
| Heating Type | Owner-occupied | Renter-occupied |
| Utility Gas | 4,582 (96.2%) | 3,349 (87.7%) |
| Bottled, Tank, or LP Gas | 65 (1.4%) | 75 (2.0%) |
| Electricity | 58 (1.2%) | 364 (9.5%) |
| Fuel Oil or Kerosene | 6 (0.1%) | 13 (0.3%) |
| Coal or Coke | 0 (0.0%) | 0 (0.0%) |
| All other Fuels | 31 (0.6%) | 0 (0.0%) |
| No Fuel Used | 23 (0.5%) | 16 (0.4%) |
| Total | 4,765 (100.0%) | 3,817 (100.0%) |
Household Vehicle Usage in Lackawanna
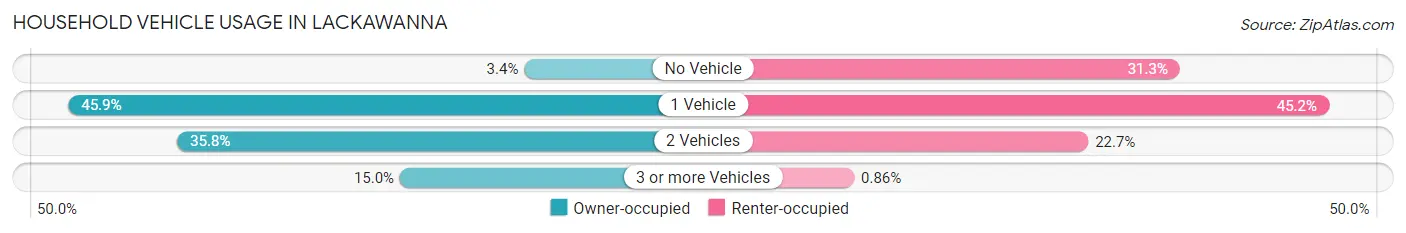
| Vehicles per Household | Owner-occupied | Renter-occupied |
| No Vehicle | 160 (3.4%) | 1,193 (31.2%) |
| 1 Vehicle | 2,188 (45.9%) | 1,724 (45.2%) |
| 2 Vehicles | 1,704 (35.8%) | 867 (22.7%) |
| 3 or more Vehicles | 713 (15.0%) | 33 (0.9%) |
| Total | 4,765 (100.0%) | 3,817 (100.0%) |
Real Estate & Mortgages in Lackawanna
Real Estate and Mortgage Overview in Lackawanna
| Characteristic | Without Mortgage | With Mortgage |
| Housing Units | 2,312 | 2,453 |
| Median Property Value | $112,500 | $122,900 |
| Median Household Income | $57,022 | $246 |
| Monthly Housing Costs | $562 | $18 |
| Real Estate Taxes | $3,436 | $44 |
Property Value by Mortgage Status in Lackawanna
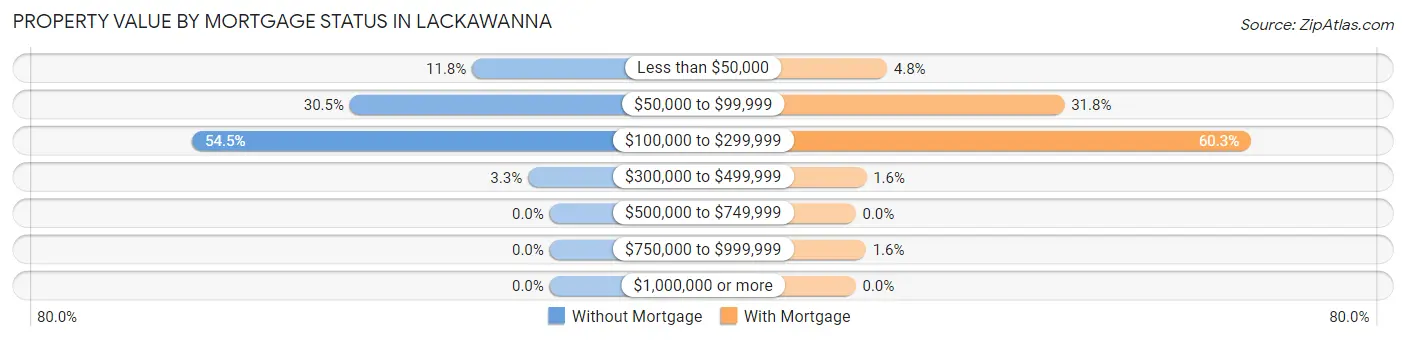
| Property Value | Without Mortgage | With Mortgage |
| Less than $50,000 | 273 (11.8%) | 117 (4.8%) |
| $50,000 to $99,999 | 704 (30.4%) | 780 (31.8%) |
| $100,000 to $299,999 | 1,259 (54.5%) | 1,478 (60.3%) |
| $300,000 to $499,999 | 76 (3.3%) | 40 (1.6%) |
| $500,000 to $749,999 | 0 (0.0%) | 0 (0.0%) |
| $750,000 to $999,999 | 0 (0.0%) | 38 (1.5%) |
| $1,000,000 or more | 0 (0.0%) | 0 (0.0%) |
| Total | 2,312 (100.0%) | 2,453 (100.0%) |
Household Income by Mortgage Status in Lackawanna
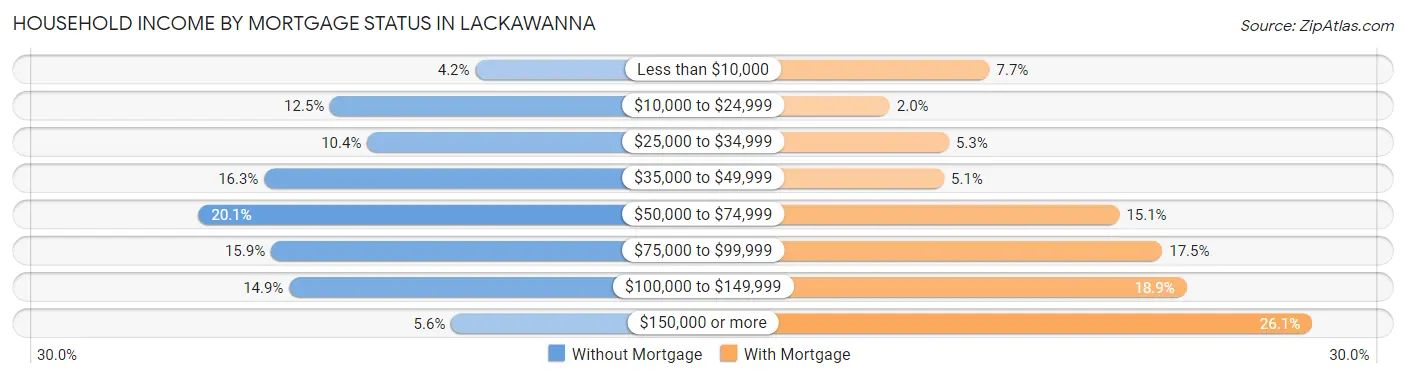
| Household Income | Without Mortgage | With Mortgage |
| Less than $10,000 | 98 (4.2%) | 188 (7.7%) |
| $10,000 to $24,999 | 290 (12.5%) | 48 (2.0%) |
| $25,000 to $34,999 | 241 (10.4%) | 131 (5.3%) |
| $35,000 to $49,999 | 377 (16.3%) | 124 (5.1%) |
| $50,000 to $74,999 | 464 (20.1%) | 370 (15.1%) |
| $75,000 to $99,999 | 368 (15.9%) | 430 (17.5%) |
| $100,000 to $149,999 | 344 (14.9%) | 464 (18.9%) |
| $150,000 or more | 130 (5.6%) | 640 (26.1%) |
| Total | 2,312 (100.0%) | 2,453 (100.0%) |
Property Value to Household Income Ratio in Lackawanna
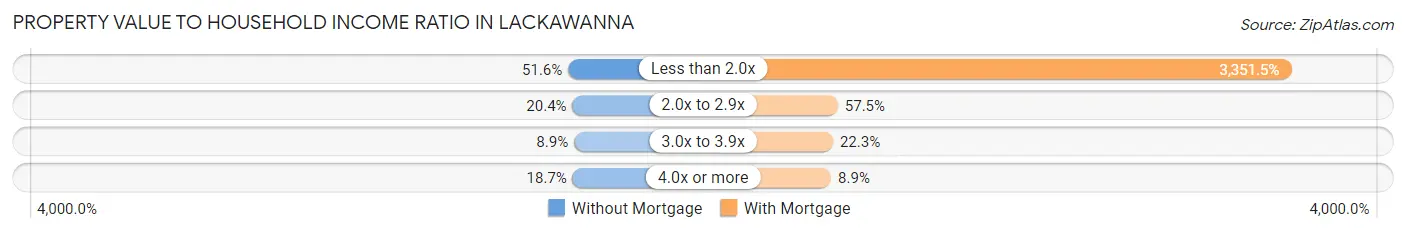
| Value-to-Income Ratio | Without Mortgage | With Mortgage |
| Less than 2.0x | 1,192 (51.6%) | 82,212 (3,351.5%) |
| 2.0x to 2.9x | 471 (20.4%) | 1,410 (57.5%) |
| 3.0x to 3.9x | 206 (8.9%) | 546 (22.3%) |
| 4.0x or more | 433 (18.7%) | 219 (8.9%) |
| Total | 2,312 (100.0%) | 2,453 (100.0%) |
Real Estate Taxes by Mortgage Status in Lackawanna
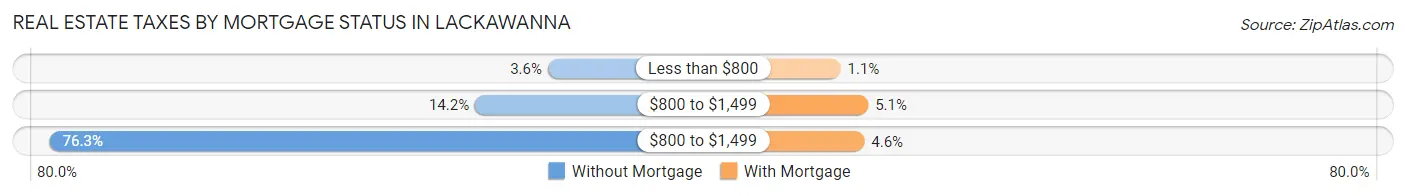
| Property Taxes | Without Mortgage | With Mortgage |
| Less than $800 | 82 (3.5%) | 27 (1.1%) |
| $800 to $1,499 | 328 (14.2%) | 126 (5.1%) |
| $800 to $1,499 | 1,765 (76.3%) | 112 (4.6%) |
| Total | 2,312 (100.0%) | 2,453 (100.0%) |
Health & Disability in Lackawanna
Health Insurance Coverage by Age in Lackawanna
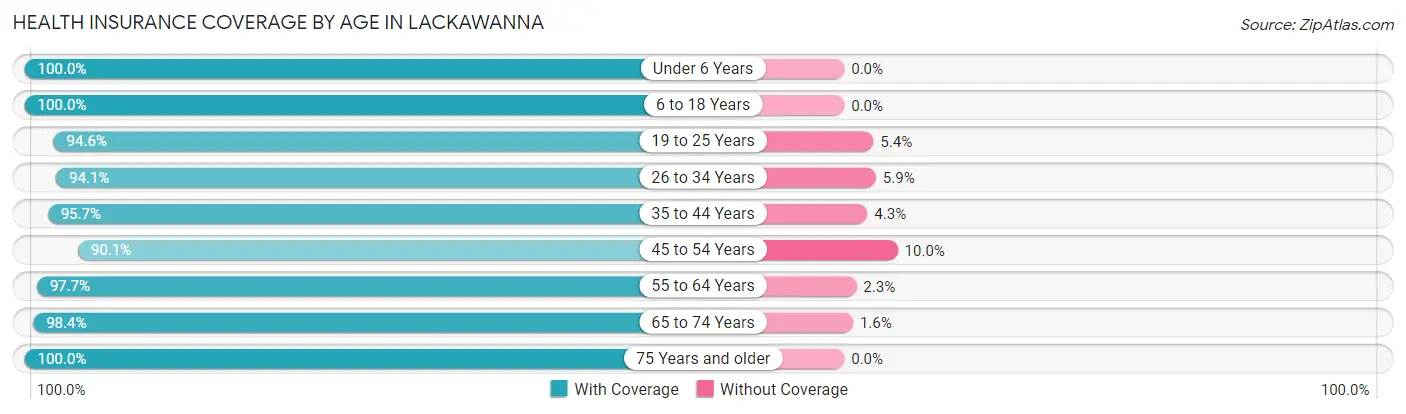
| Age Bracket | With Coverage | Without Coverage |
| Under 6 Years | 1,650 (100.0%) | 0 (0.0%) |
| 6 to 18 Years | 2,617 (100.0%) | 0 (0.0%) |
| 19 to 25 Years | 1,463 (94.6%) | 84 (5.4%) |
| 26 to 34 Years | 2,845 (94.1%) | 178 (5.9%) |
| 35 to 44 Years | 1,974 (95.7%) | 89 (4.3%) |
| 45 to 54 Years | 2,435 (90.0%) | 269 (10.0%) |
| 55 to 64 Years | 2,849 (97.7%) | 66 (2.3%) |
| 65 to 74 Years | 1,818 (98.4%) | 30 (1.6%) |
| 75 Years and older | 1,270 (100.0%) | 0 (0.0%) |
| Total | 18,921 (96.4%) | 716 (3.6%) |
Health Insurance Coverage by Citizenship Status in Lackawanna
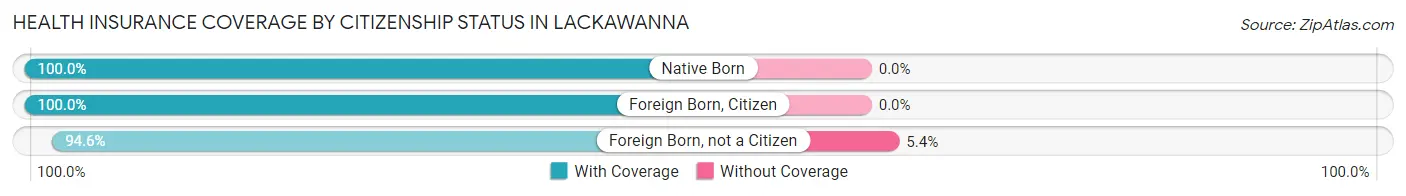
| Citizenship Status | With Coverage | Without Coverage |
| Native Born | 1,650 (100.0%) | 0 (0.0%) |
| Foreign Born, Citizen | 2,617 (100.0%) | 0 (0.0%) |
| Foreign Born, not a Citizen | 1,463 (94.6%) | 84 (5.4%) |
Health Insurance Coverage by Household Income in Lackawanna
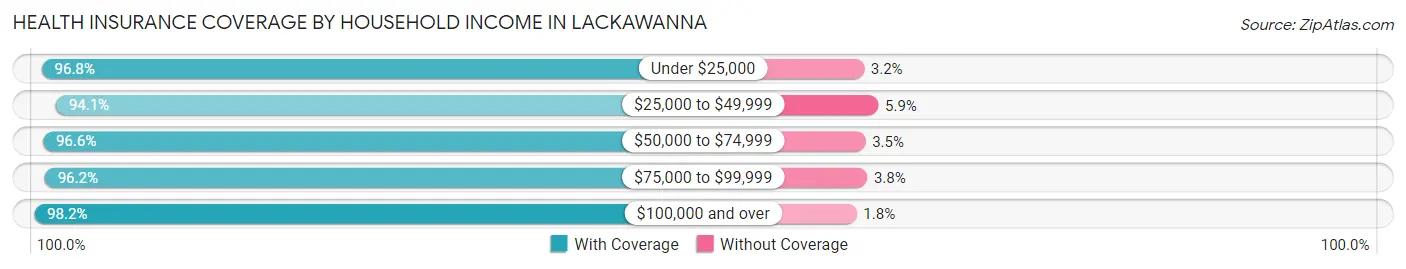
| Household Income | With Coverage | Without Coverage |
| Under $25,000 | 3,548 (96.8%) | 117 (3.2%) |
| $25,000 to $49,999 | 4,587 (94.1%) | 286 (5.9%) |
| $50,000 to $74,999 | 3,413 (96.6%) | 122 (3.5%) |
| $75,000 to $99,999 | 2,747 (96.2%) | 108 (3.8%) |
| $100,000 and over | 4,516 (98.2%) | 83 (1.8%) |
Public vs Private Health Insurance Coverage by Age in Lackawanna
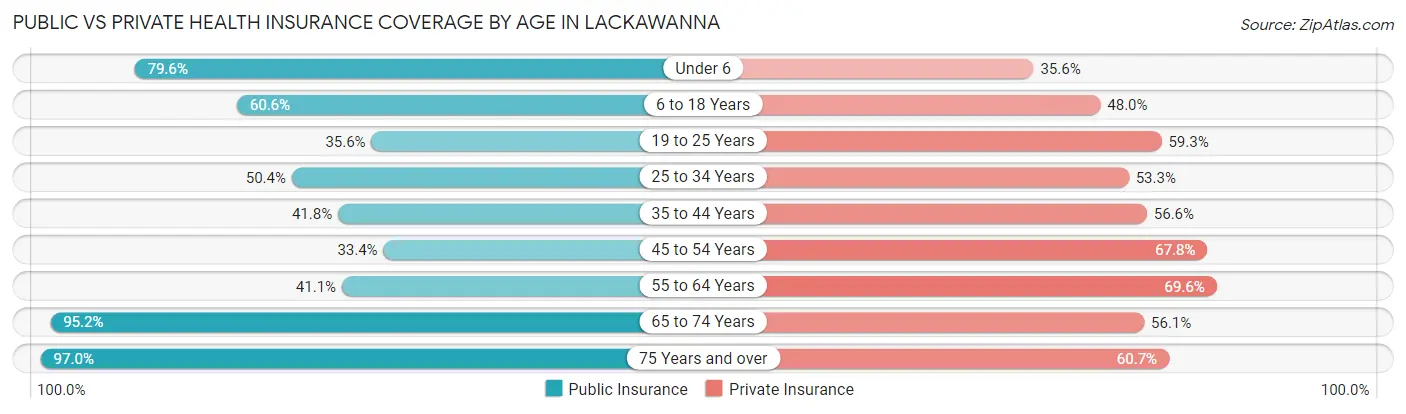
| Age Bracket | Public Insurance | Private Insurance |
| Under 6 | 1,313 (79.6%) | 587 (35.6%) |
| 6 to 18 Years | 1,586 (60.6%) | 1,256 (48.0%) |
| 19 to 25 Years | 551 (35.6%) | 918 (59.3%) |
| 25 to 34 Years | 1,524 (50.4%) | 1,610 (53.3%) |
| 35 to 44 Years | 863 (41.8%) | 1,168 (56.6%) |
| 45 to 54 Years | 903 (33.4%) | 1,834 (67.8%) |
| 55 to 64 Years | 1,198 (41.1%) | 2,028 (69.6%) |
| 65 to 74 Years | 1,760 (95.2%) | 1,037 (56.1%) |
| 75 Years and over | 1,232 (97.0%) | 771 (60.7%) |
| Total | 10,930 (55.7%) | 11,209 (57.1%) |
Disability Status by Sex by Age in Lackawanna
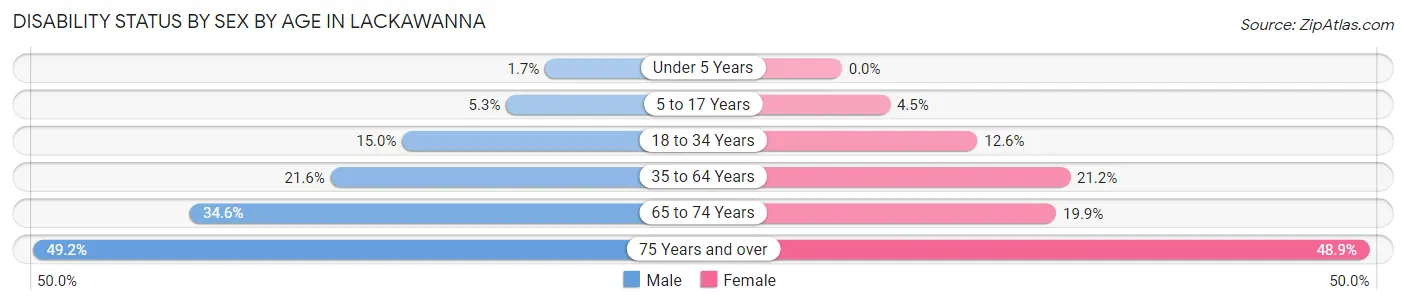
| Age Bracket | Male | Female |
| Under 5 Years | 10 (1.7%) | 0 (0.0%) |
| 5 to 17 Years | 62 (5.3%) | 64 (4.5%) |
| 18 to 34 Years | 339 (14.9%) | 314 (12.6%) |
| 35 to 64 Years | 868 (21.6%) | 776 (21.2%) |
| 65 to 74 Years | 337 (34.6%) | 174 (19.9%) |
| 75 Years and over | 178 (49.2%) | 444 (48.9%) |
Disability Class by Sex by Age in Lackawanna
Disability Class: Hearing Difficulty
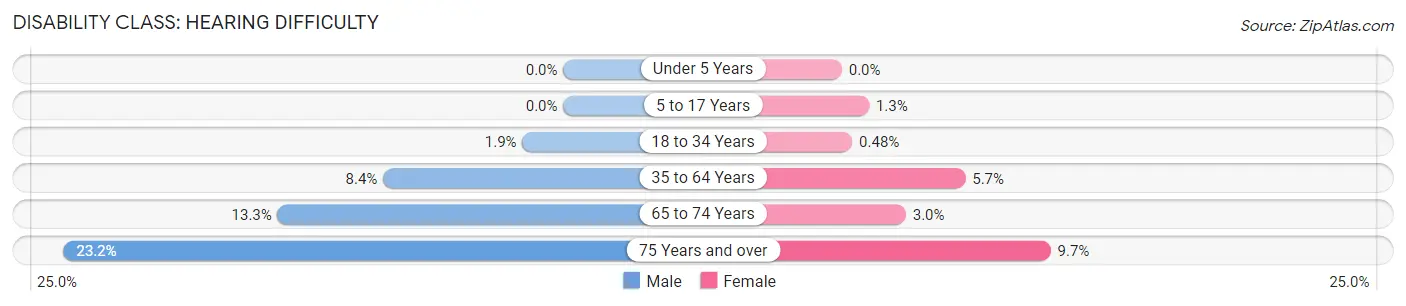
| Age Bracket | Male | Female |
| Under 5 Years | 0 (0.0%) | 0 (0.0%) |
| 5 to 17 Years | 0 (0.0%) | 18 (1.3%) |
| 18 to 34 Years | 43 (1.9%) | 12 (0.5%) |
| 35 to 64 Years | 336 (8.4%) | 210 (5.7%) |
| 65 to 74 Years | 129 (13.3%) | 26 (3.0%) |
| 75 Years and over | 84 (23.2%) | 88 (9.7%) |
Disability Class: Vision Difficulty
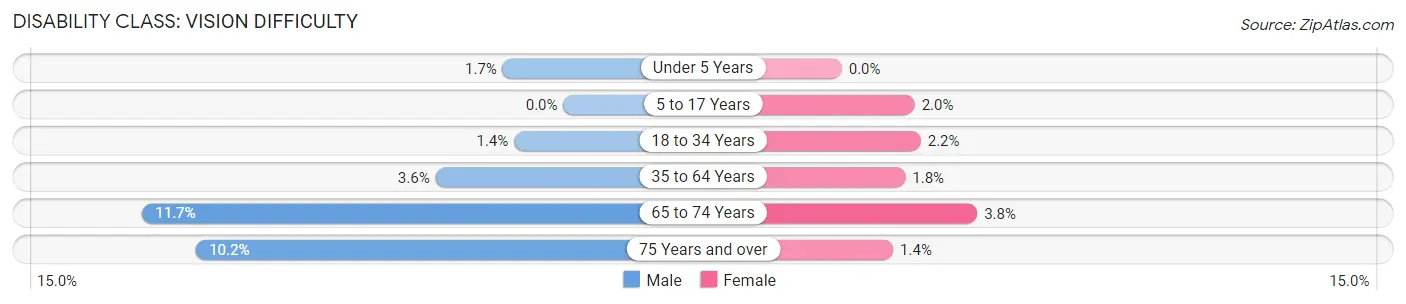
| Age Bracket | Male | Female |
| Under 5 Years | 10 (1.7%) | 0 (0.0%) |
| 5 to 17 Years | 0 (0.0%) | 29 (2.0%) |
| 18 to 34 Years | 31 (1.4%) | 55 (2.2%) |
| 35 to 64 Years | 143 (3.6%) | 65 (1.8%) |
| 65 to 74 Years | 114 (11.7%) | 33 (3.8%) |
| 75 Years and over | 37 (10.2%) | 13 (1.4%) |
Disability Class: Cognitive Difficulty
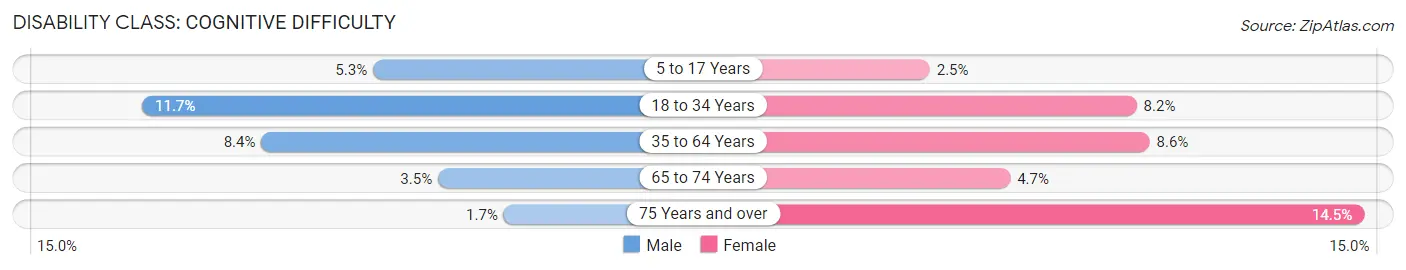
| Age Bracket | Male | Female |
| 5 to 17 Years | 62 (5.3%) | 35 (2.5%) |
| 18 to 34 Years | 266 (11.7%) | 205 (8.2%) |
| 35 to 64 Years | 338 (8.4%) | 314 (8.6%) |
| 65 to 74 Years | 34 (3.5%) | 41 (4.7%) |
| 75 Years and over | 6 (1.7%) | 132 (14.5%) |
Disability Class: Ambulatory Difficulty
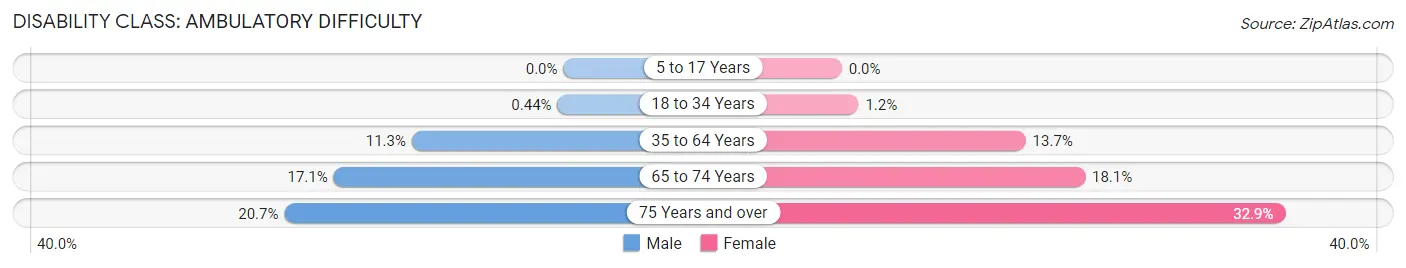
| Age Bracket | Male | Female |
| 5 to 17 Years | 0 (0.0%) | 0 (0.0%) |
| 18 to 34 Years | 10 (0.4%) | 31 (1.2%) |
| 35 to 64 Years | 452 (11.3%) | 500 (13.7%) |
| 65 to 74 Years | 166 (17.1%) | 158 (18.1%) |
| 75 Years and over | 75 (20.7%) | 299 (32.9%) |
Disability Class: Self-Care Difficulty
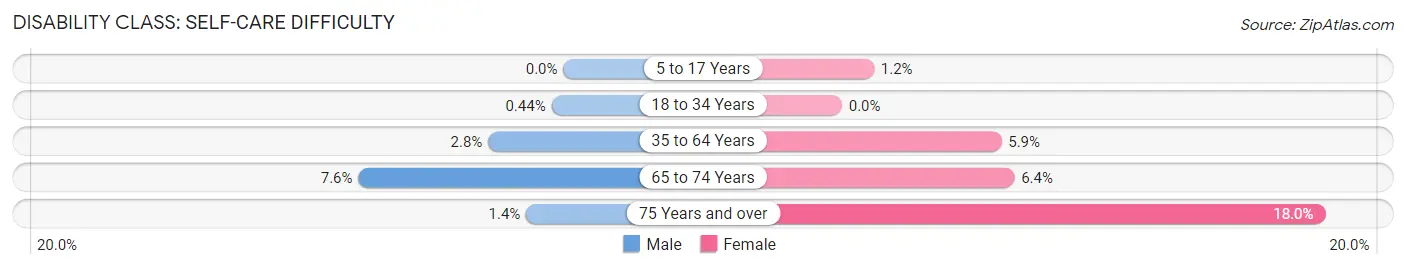
| Age Bracket | Male | Female |
| 5 to 17 Years | 0 (0.0%) | 17 (1.2%) |
| 18 to 34 Years | 10 (0.4%) | 0 (0.0%) |
| 35 to 64 Years | 112 (2.8%) | 217 (5.9%) |
| 65 to 74 Years | 74 (7.6%) | 56 (6.4%) |
| 75 Years and over | 5 (1.4%) | 163 (17.9%) |
Technology Access in Lackawanna
Computing Device Access in Lackawanna
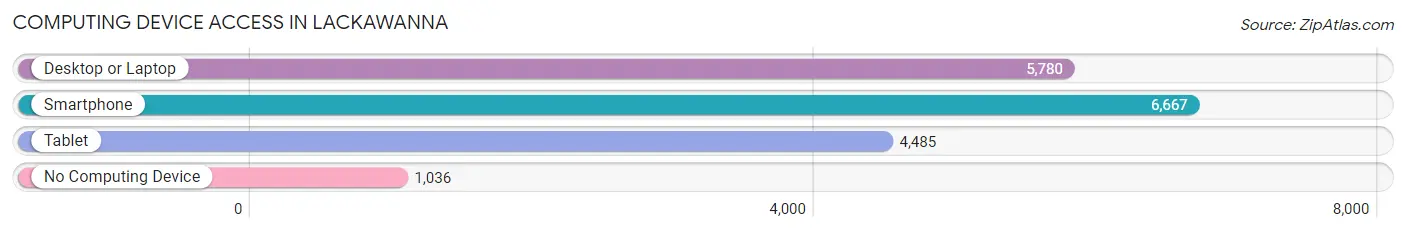
| Device Type | # Households | % Households |
| Desktop or Laptop | 5,780 | 67.3% |
| Smartphone | 6,667 | 77.7% |
| Tablet | 4,485 | 52.3% |
| No Computing Device | 1,036 | 12.1% |
| Total | 8,582 | 100.0% |
Internet Access in Lackawanna
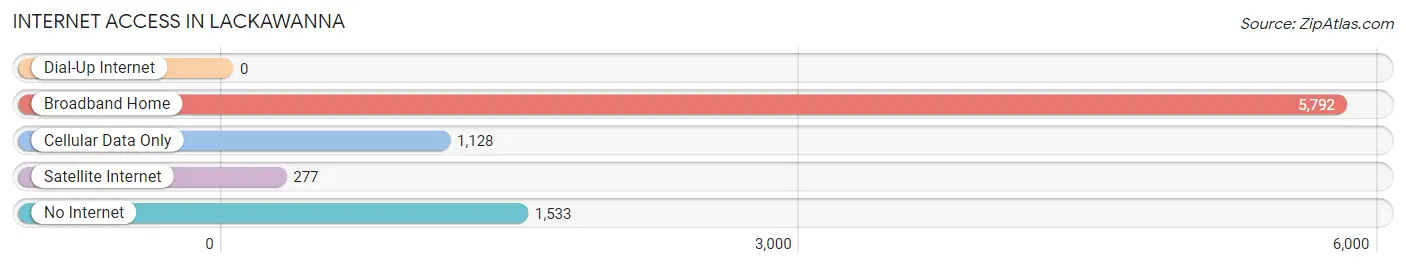
| Internet Type | # Households | % Households |
| Dial-Up Internet | 0 | 0.0% |
| Broadband Home | 5,792 | 67.5% |
| Cellular Data Only | 1,128 | 13.1% |
| Satellite Internet | 277 | 3.2% |
| No Internet | 1,533 | 17.9% |
| Total | 8,582 | 100.0% |
Lackawanna Summary
Lackawanna is a city located in Erie County, New York, United States. It is situated on the south shore of Lake Erie, just east of Buffalo. The population was 18,141 at the 2010 census. The city is named after the Lackawanna River, which flows through the city.
History
The area that is now Lackawanna was originally inhabited by the Neutral Nation of the Iroquois Confederacy. The first European settlers arrived in the area in the late 1700s, and the area was officially incorporated as the Village of Lackawanna in 1851. The village was named after the Lackawanna River, which flows through the city.
In the late 1800s, Lackawanna became a major industrial center, with steel mills, coal mines, and other industries. The city was also home to a large immigrant population, primarily from Eastern Europe.
In the early 1900s, Lackawanna was a major hub for the steel industry. The city was home to the Lackawanna Steel Company, which was one of the largest steel producers in the United States. The company employed thousands of workers and was a major contributor to the city's economy.
In the 1950s, the steel industry began to decline, and the city's economy shifted to other industries, such as manufacturing and retail. The city also began to experience a population decline, as many of the city's residents moved to the suburbs.
In the late 1990s, the city began to experience a resurgence, as new businesses and industries moved into the city. The city has also seen an influx of immigrants from Latin America and Asia, which has helped to revitalize the city's economy.
Geography
Lackawanna is located in western New York, on the south shore of Lake Erie. The city is situated on the Lackawanna River, which flows through the city. The city is bordered by the cities of Buffalo and Cheektowaga to the west, and the towns of Hamburg and West Seneca to the east.
The city has a total area of 5.2 square miles, of which 5.1 square miles is land and 0.1 square miles is water.
Economy
Lackawanna's economy is largely based on manufacturing and retail. The city is home to several large manufacturing companies, including the Lackawanna Steel Company, which produces steel products. The city is also home to several large retail stores, including Walmart, Target, and Home Depot.
The city is also home to several educational institutions, including the University at Buffalo, Buffalo State College, and Erie Community College.
Demographics
As of the 2010 census, the population of Lackawanna was 18,141. The racial makeup of the city was 79.2% White, 8.3% African American, 0.4% Native American, 2.2% Asian, 0.1% Pacific Islander, 6.2% from other races, and 3.7% from two or more races. Hispanic or Latino of any race were 14.3% of the population.
The median household income in Lackawanna was $37,941, and the median family income was $45,941. The per capita income for the city was $19,945. About 15.2% of the population was below the poverty line.
Common Questions
What is Per Capita Income in Lackawanna?
Per Capita income in Lackawanna is $26,033.
What is the Median Family Income in Lackawanna?
Median Family Income in Lackawanna is $59,353.
What is the Median Household income in Lackawanna?
Median Household Income in Lackawanna is $46,869.
What is Income or Wage Gap in Lackawanna?
Income or Wage Gap in Lackawanna is 18.4%.
Women in Lackawanna earn 81.6 cents for every dollar earned by a man.
What is Inequality or Gini Index in Lackawanna?
Inequality or Gini Index in Lackawanna is 0.42.
What is the Total Population of Lackawanna?
Total Population of Lackawanna is 19,762.
What is the Total Male Population of Lackawanna?
Total Male Population of Lackawanna is 9,434.
What is the Total Female Population of Lackawanna?
Total Female Population of Lackawanna is 10,328.
What is the Ratio of Males per 100 Females in Lackawanna?
There are 91.34 Males per 100 Females in Lackawanna.
What is the Ratio of Females per 100 Males in Lackawanna?
There are 109.48 Females per 100 Males in Lackawanna.
What is the Median Population Age in Lackawanna?
Median Population Age in Lackawanna is 39.1 Years.
What is the Average Family Size in Lackawanna
Average Family Size in Lackawanna is 3.1 People.
What is the Average Household Size in Lackawanna
Average Household Size in Lackawanna is 2.3 People.
How Large is the Labor Force in Lackawanna?
There are 9,755 People in the Labor Forcein in Lackawanna.
What is the Percentage of People in the Labor Force in Lackawanna?
61.0% of People are in the Labor Force in Lackawanna.
What is the Unemployment Rate in Lackawanna?
Unemployment Rate in Lackawanna is 5.4%.