Springville, NY Map & Demographics
Springville Map
Springville Overview
$33,248
PER CAPITA INCOME
$78,839
AVG FAMILY INCOME
$55,305
AVG HOUSEHOLD INCOME
23.8%
WAGE / INCOME GAP [ % ]
76.2¢/ $1
WAGE / INCOME GAP [ $ ]
$10,744
FAMILY INCOME DEFICIT
0.44
INEQUALITY / GINI INDEX
4,223
TOTAL POPULATION
2,062
MALE POPULATION
2,161
FEMALE POPULATION
95.42
MALES / 100 FEMALES
104.80
FEMALES / 100 MALES
41.7
MEDIAN AGE
2.8
AVG FAMILY SIZE
2.2
AVG HOUSEHOLD SIZE
1,976
LABOR FORCE [ PEOPLE ]
58.7%
PERCENT IN LABOR FORCE
4.9%
UNEMPLOYMENT RATE
Springville Zip Codes
Springville Area Codes
Income in Springville
Income Overview in Springville
Per Capita Income in Springville is $33,248, while median incomes of families and households are $78,839 and $55,305 respectively.
| Characteristic | Number | Measure |
| Per Capita Income | 4,223 | $33,248 |
| Median Family Income | 1,153 | $78,839 |
| Mean Family Income | 1,153 | $91,400 |
| Median Household Income | 1,828 | $55,305 |
| Mean Household Income | 1,828 | $73,475 |
| Income Deficit | 1,153 | $10,744 |
| Wage / Income Gap (%) | 4,223 | 23.76% |
| Wage / Income Gap ($) | 4,223 | 76.24¢ per $1 |
| Gini / Inequality Index | 4,223 | 0.44 |
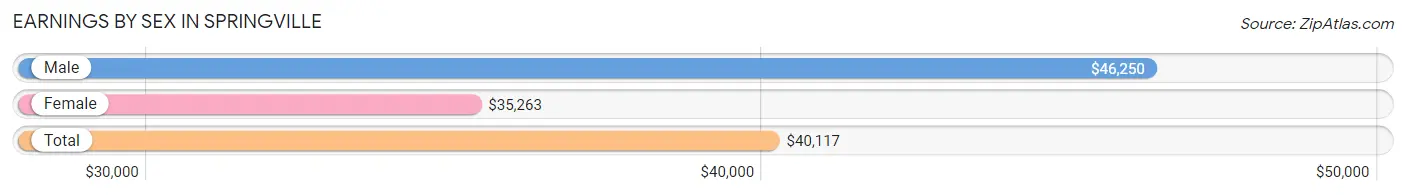
Earnings by Sex in Springville
Average Earnings in Springville are $40,117, $46,250 for men and $35,263 for women, a difference of 23.8%.
| Sex | Number | Average Earnings |
| Male | 1,008 (48.2%) | $46,250 |
| Female | 1,082 (51.8%) | $35,263 |
| Total | 2,090 (100.0%) | $40,117 |
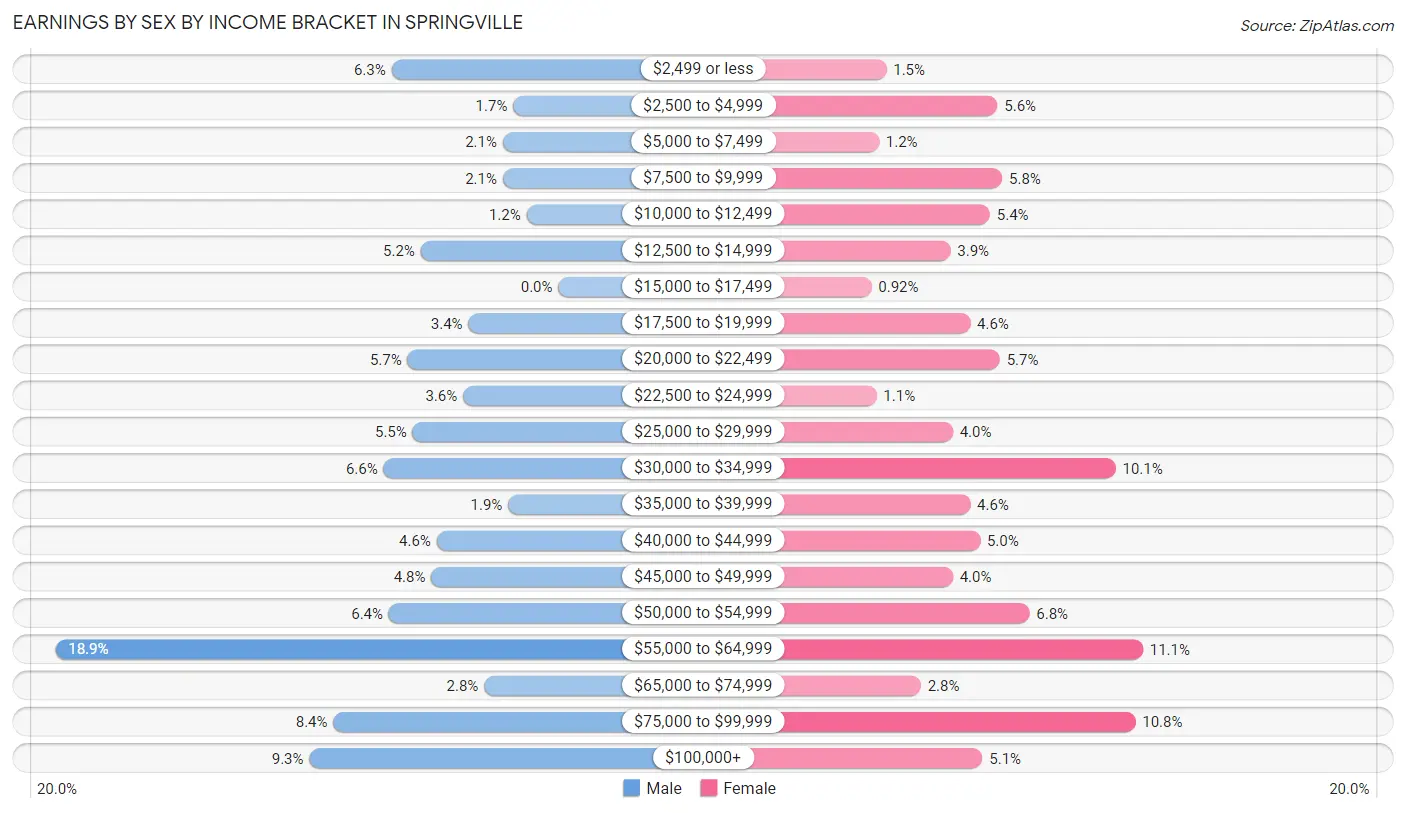
Earnings by Sex by Income Bracket in Springville
The most common earnings brackets in Springville are $55,000 to $64,999 for men (190 | 18.9%) and $55,000 to $64,999 for women (120 | 11.1%).
| Income | Male | Female |
| $2,499 or less | 63 (6.2%) | 16 (1.5%) |
| $2,500 to $4,999 | 17 (1.7%) | 61 (5.6%) |
| $5,000 to $7,499 | 21 (2.1%) | 13 (1.2%) |
| $7,500 to $9,999 | 21 (2.1%) | 63 (5.8%) |
| $10,000 to $12,499 | 12 (1.2%) | 58 (5.4%) |
| $12,500 to $14,999 | 52 (5.2%) | 42 (3.9%) |
| $15,000 to $17,499 | 0 (0.0%) | 10 (0.9%) |
| $17,500 to $19,999 | 34 (3.4%) | 50 (4.6%) |
| $20,000 to $22,499 | 57 (5.7%) | 62 (5.7%) |
| $22,500 to $24,999 | 36 (3.6%) | 12 (1.1%) |
| $25,000 to $29,999 | 55 (5.5%) | 43 (4.0%) |
| $30,000 to $34,999 | 66 (6.6%) | 109 (10.1%) |
| $35,000 to $39,999 | 19 (1.9%) | 50 (4.6%) |
| $40,000 to $44,999 | 46 (4.6%) | 54 (5.0%) |
| $45,000 to $49,999 | 48 (4.8%) | 43 (4.0%) |
| $50,000 to $54,999 | 64 (6.4%) | 74 (6.8%) |
| $55,000 to $64,999 | 190 (18.9%) | 120 (11.1%) |
| $65,000 to $74,999 | 28 (2.8%) | 30 (2.8%) |
| $75,000 to $99,999 | 85 (8.4%) | 117 (10.8%) |
| $100,000+ | 94 (9.3%) | 55 (5.1%) |
| Total | 1,008 (100.0%) | 1,082 (100.0%) |
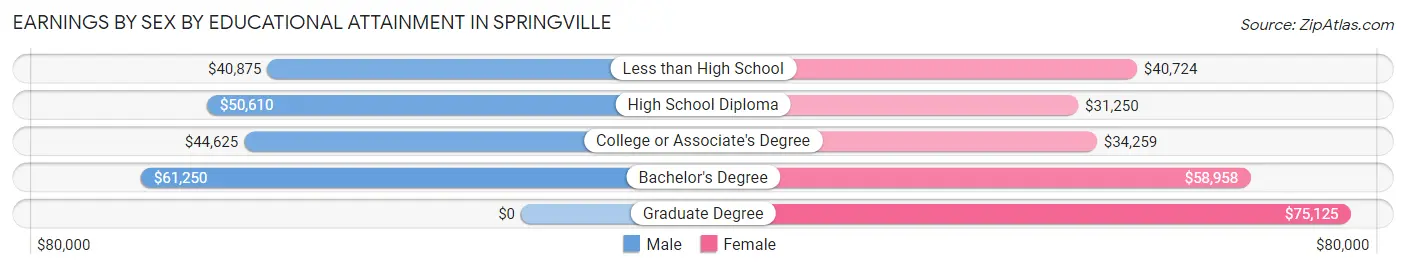
Earnings by Sex by Educational Attainment in Springville
Average earnings in Springville are $51,203 for men and $45,139 for women, a difference of 11.8%. Men with an educational attainment of bachelor's degree enjoy the highest average annual earnings of $61,250, while those with less than high school education earn the least with $40,875. Women with an educational attainment of graduate degree earn the most with the average annual earnings of $75,125, while those with high school diploma education have the smallest earnings of $31,250.
| Educational Attainment | Male Income | Female Income |
| Less than High School | $40,875 | $40,724 |
| High School Diploma | $50,610 | $31,250 |
| College or Associate's Degree | $44,625 | $34,259 |
| Bachelor's Degree | $61,250 | $58,958 |
| Graduate Degree | - | - |
| Total | $51,203 | $45,139 |
Family Income in Springville
Family Income Brackets in Springville
According to the Springville family income data, there are 277 families falling into the $100,000 to $149,999 income range, which is the most common income bracket and makes up 24.0% of all families. Conversely, the $10,000 to $14,999 income bracket is the least frequent group with only 31 families (2.7%) belonging to this category.
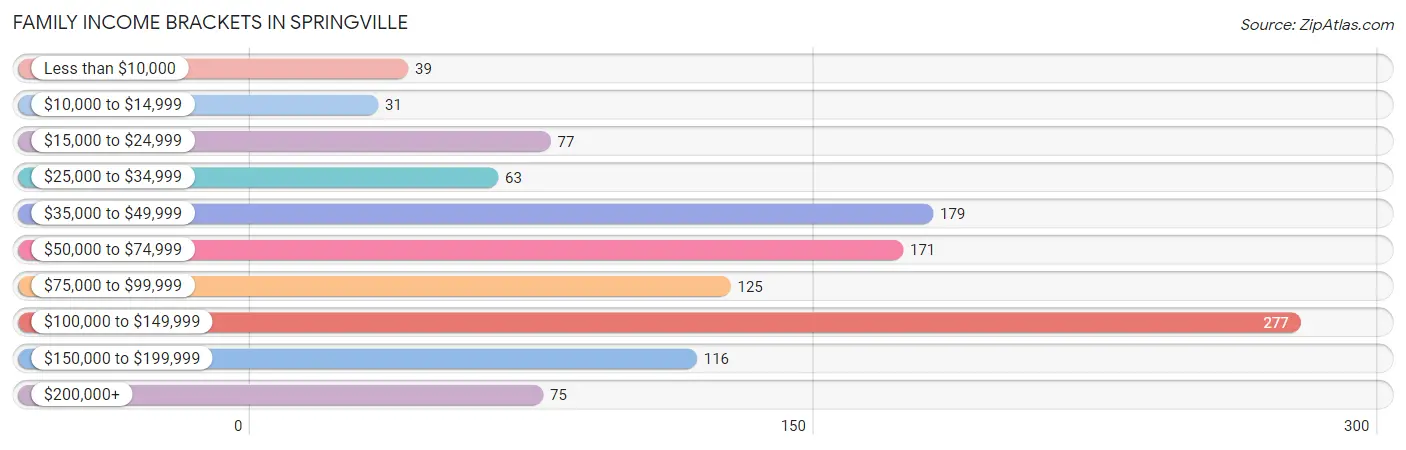
| Income Bracket | # Families | % Families |
| Less than $10,000 | 39 | 3.4% |
| $10,000 to $14,999 | 31 | 2.7% |
| $15,000 to $24,999 | 77 | 6.7% |
| $25,000 to $34,999 | 63 | 5.5% |
| $35,000 to $49,999 | 179 | 15.5% |
| $50,000 to $74,999 | 171 | 14.8% |
| $75,000 to $99,999 | 125 | 10.8% |
| $100,000 to $149,999 | 277 | 24.0% |
| $150,000 to $199,999 | 116 | 10.1% |
| $200,000+ | 75 | 6.5% |
Family Income by Famaliy Size in Springville
4-person families (114 | 9.9%) account for the highest median family income in Springville with $119,128 per family, while 3-person families (232 | 20.1%) have the highest median income of $36,296 per family member.
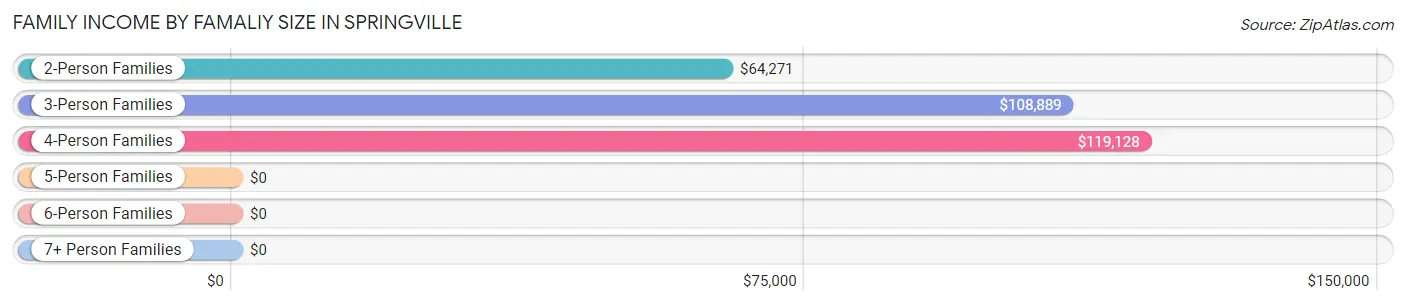
| Income Bracket | # Families | Median Income |
| 2-Person Families | 653 (56.6%) | $64,271 |
| 3-Person Families | 232 (20.1%) | $108,889 |
| 4-Person Families | 114 (9.9%) | $119,128 |
| 5-Person Families | 106 (9.2%) | $0 |
| 6-Person Families | 48 (4.2%) | $0 |
| 7+ Person Families | 0 (0.0%) | $0 |
| Total | 1,153 (100.0%) | $78,839 |
Family Income by Number of Earners in Springville
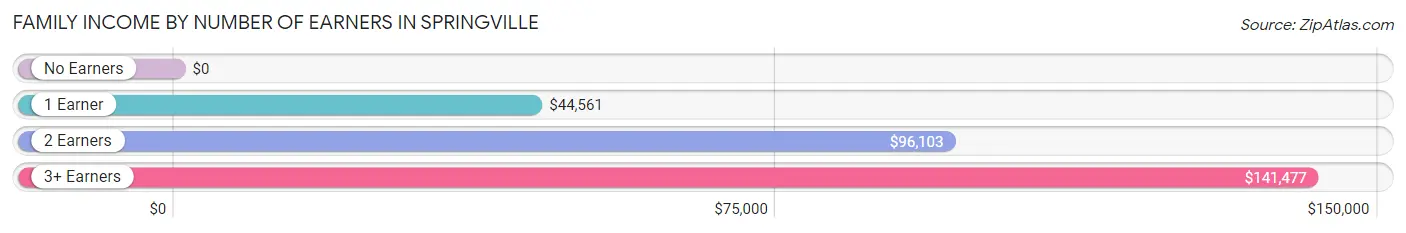
| Number of Earners | # Families | Median Income |
| No Earners | 193 (16.7%) | $0 |
| 1 Earner | 350 (30.4%) | $44,561 |
| 2 Earners | 475 (41.2%) | $96,103 |
| 3+ Earners | 135 (11.7%) | $141,477 |
| Total | 1,153 (100.0%) | $78,839 |
Household Income in Springville
Household Income Brackets in Springville
With 322 households falling in the category, the $50,000 to $74,999 income range is the most frequent in Springville, accounting for 17.6% of all households. In contrast, only 75 households (4.1%) fall into the $200,000+ income bracket, making it the least populous group.
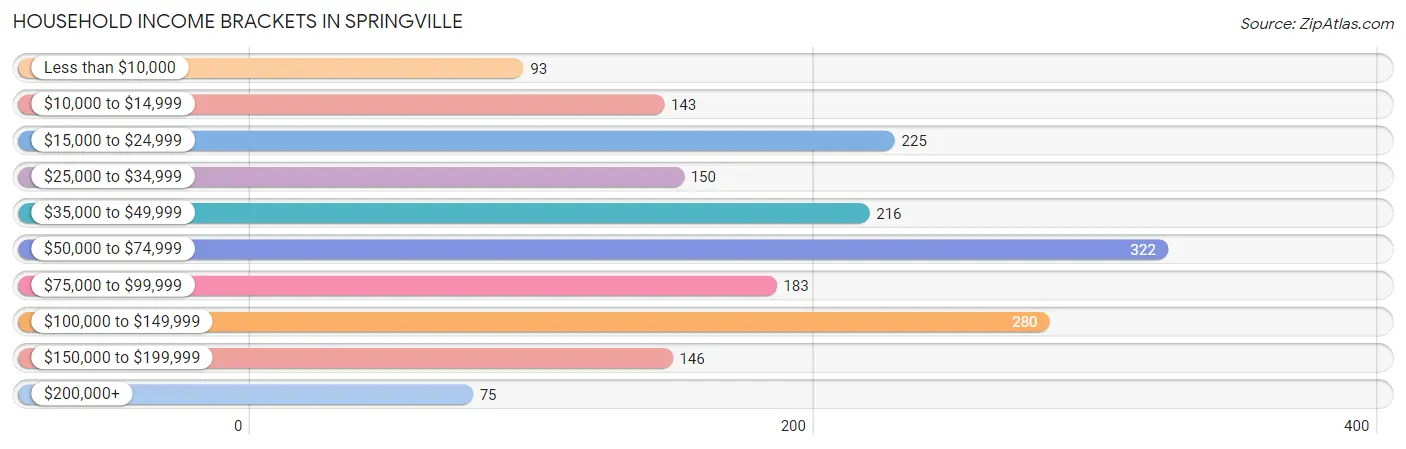
| Income Bracket | # Households | % Households |
| Less than $10,000 | 93 | 5.1% |
| $10,000 to $14,999 | 143 | 7.8% |
| $15,000 to $24,999 | 225 | 12.3% |
| $25,000 to $34,999 | 150 | 8.2% |
| $35,000 to $49,999 | 216 | 11.8% |
| $50,000 to $74,999 | 322 | 17.6% |
| $75,000 to $99,999 | 183 | 10.0% |
| $100,000 to $149,999 | 280 | 15.3% |
| $150,000 to $199,999 | 146 | 8.0% |
| $200,000+ | 75 | 4.1% |
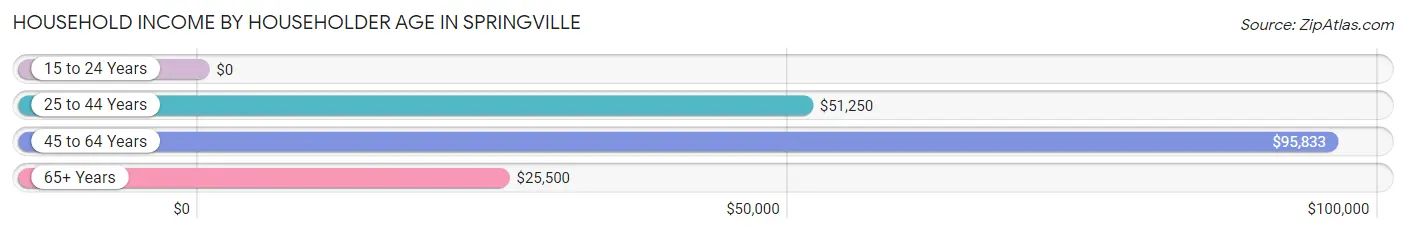
Household Income by Householder Age in Springville
The median household income in Springville is $55,305, with the highest median household income of $95,833 found in the 45 to 64 years age bracket for the primary householder. A total of 598 households (32.7%) fall into this category. Meanwhile, the 15 to 24 years age bracket for the primary householder has the lowest median household income of $0, with 20 households (1.1%) in this group.
| Income Bracket | # Households | Median Income |
| 15 to 24 Years | 20 (1.1%) | $0 |
| 25 to 44 Years | 614 (33.6%) | $51,250 |
| 45 to 64 Years | 598 (32.7%) | $95,833 |
| 65+ Years | 596 (32.6%) | $25,500 |
| Total | 1,828 (100.0%) | $55,305 |
Poverty in Springville
Income Below Poverty by Sex and Age in Springville
With 14.2% poverty level for males and 16.4% for females among the residents of Springville, 15 year old males and under 5 year old females are the most vulnerable to poverty, with 8 males (100.0%) and 32 females (48.5%) in their respective age groups living below the poverty level.
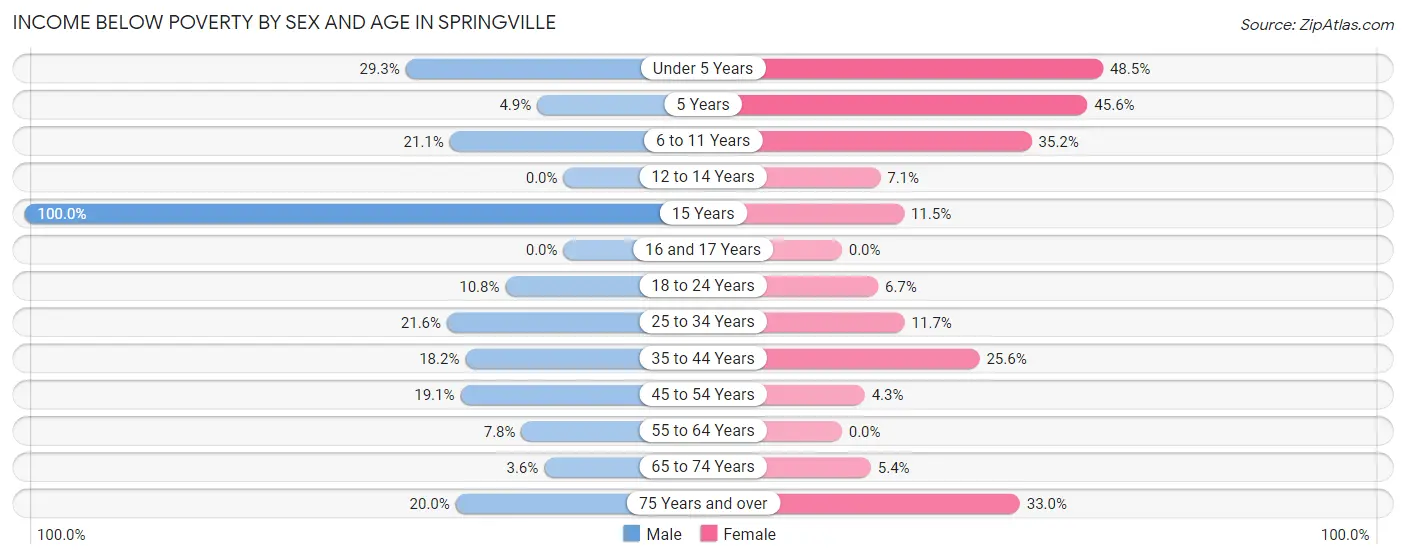
| Age Bracket | Male | Female |
| Under 5 Years | 41 (29.3%) | 32 (48.5%) |
| 5 Years | 2 (4.9%) | 31 (45.6%) |
| 6 to 11 Years | 38 (21.1%) | 62 (35.2%) |
| 12 to 14 Years | 0 (0.0%) | 3 (7.1%) |
| 15 Years | 8 (100.0%) | 3 (11.5%) |
| 16 and 17 Years | 0 (0.0%) | 0 (0.0%) |
| 18 to 24 Years | 11 (10.8%) | 14 (6.7%) |
| 25 to 34 Years | 40 (21.6%) | 30 (11.7%) |
| 35 to 44 Years | 51 (18.2%) | 69 (25.6%) |
| 45 to 54 Years | 44 (19.1%) | 11 (4.3%) |
| 55 to 64 Years | 24 (7.8%) | 0 (0.0%) |
| 65 to 74 Years | 11 (3.6%) | 11 (5.4%) |
| 75 Years and over | 16 (20.0%) | 76 (33.0%) |
| Total | 286 (14.2%) | 342 (16.4%) |
Income Above Poverty by Sex and Age in Springville
According to the poverty statistics in Springville, males aged 12 to 14 years and females aged 16 and 17 years are the age groups that are most secure financially, with 100.0% of males and 100.0% of females in these age groups living above the poverty line.
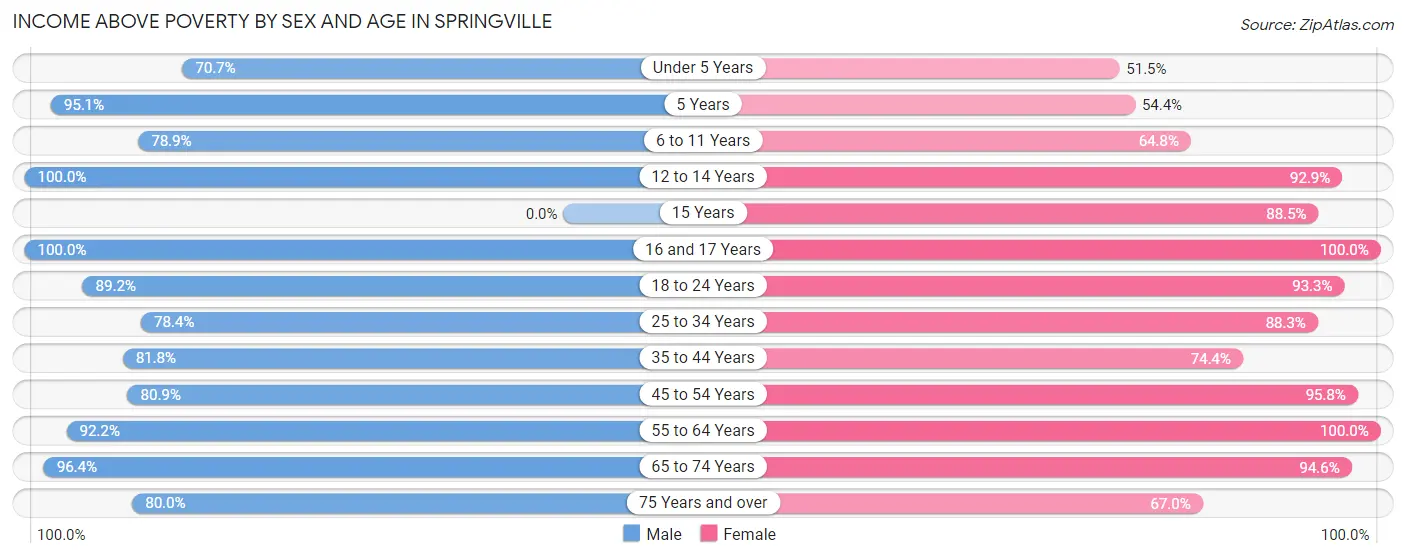
| Age Bracket | Male | Female |
| Under 5 Years | 99 (70.7%) | 34 (51.5%) |
| 5 Years | 39 (95.1%) | 37 (54.4%) |
| 6 to 11 Years | 142 (78.9%) | 114 (64.8%) |
| 12 to 14 Years | 109 (100.0%) | 39 (92.9%) |
| 15 Years | 0 (0.0%) | 23 (88.5%) |
| 16 and 17 Years | 40 (100.0%) | 35 (100.0%) |
| 18 to 24 Years | 91 (89.2%) | 194 (93.3%) |
| 25 to 34 Years | 145 (78.4%) | 227 (88.3%) |
| 35 to 44 Years | 229 (81.8%) | 201 (74.4%) |
| 45 to 54 Years | 186 (80.9%) | 248 (95.8%) |
| 55 to 64 Years | 284 (92.2%) | 246 (100.0%) |
| 65 to 74 Years | 297 (96.4%) | 193 (94.6%) |
| 75 Years and over | 64 (80.0%) | 154 (67.0%) |
| Total | 1,725 (85.8%) | 1,745 (83.6%) |
Income Below Poverty Among Married-Couple Families in Springville
The poverty statistics for married-couple families in Springville show that 7.1% or 59 of the total 833 families live below the poverty line. Families with 3 or 4 children have the highest poverty rate of 23.6%, comprising of 29 families. On the other hand, families with no children have the lowest poverty rate of 3.8%, which includes 21 families.
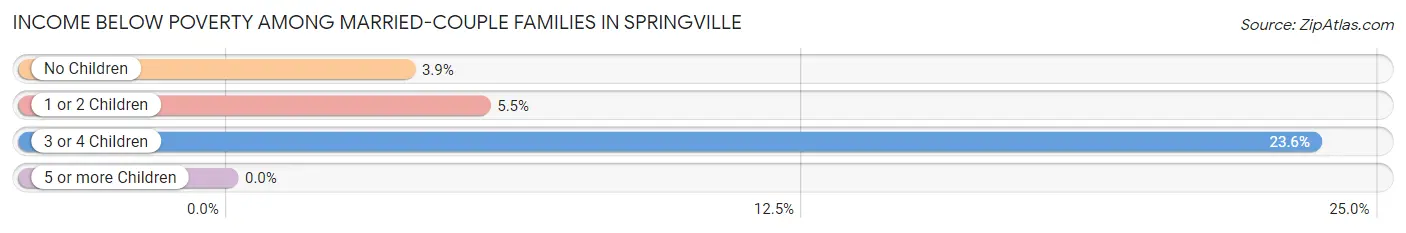
| Children | Above Poverty | Below Poverty |
| No Children | 525 (96.2%) | 21 (3.8%) |
| 1 or 2 Children | 155 (94.5%) | 9 (5.5%) |
| 3 or 4 Children | 94 (76.4%) | 29 (23.6%) |
| 5 or more Children | 0 (0.0%) | 0 (0.0%) |
| Total | 774 (92.9%) | 59 (7.1%) |
Income Below Poverty Among Single-Parent Households in Springville
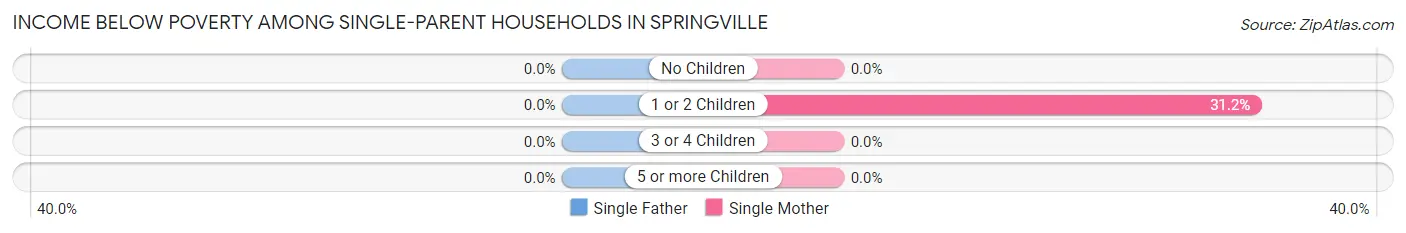
| Children | Single Father | Single Mother |
| No Children | 0 (0.0%) | 0 (0.0%) |
| 1 or 2 Children | 0 (0.0%) | 53 (31.2%) |
| 3 or 4 Children | 0 (0.0%) | 0 (0.0%) |
| 5 or more Children | 0 (0.0%) | 0 (0.0%) |
| Total | 0 (0.0%) | 53 (22.8%) |
Income Below Poverty Among Married-Couple vs Single-Parent Households in Springville
The poverty data for Springville shows that 59 of the married-couple family households (7.1%) and 53 of the single-parent households (16.6%) are living below the poverty level. Within the married-couple family households, those with 3 or 4 children have the highest poverty rate, with 29 households (23.6%) falling below the poverty line. Among the single-parent households, those with 1 or 2 children have the highest poverty rate, with 53 household (25.0%) living below poverty.
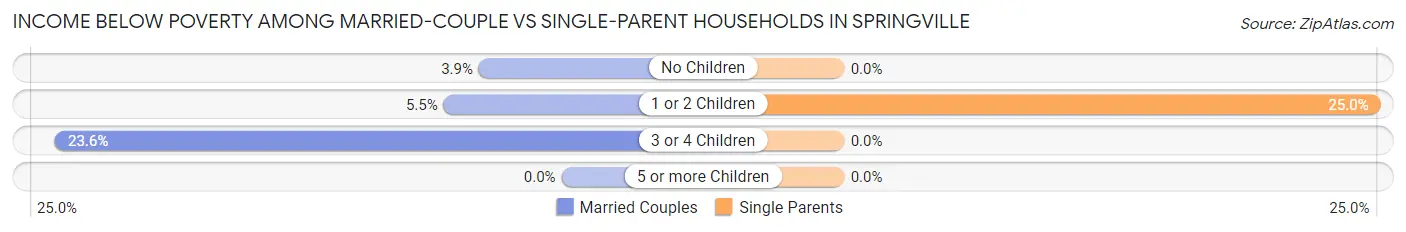
| Children | Married-Couple Families | Single-Parent Households |
| No Children | 21 (3.8%) | 0 (0.0%) |
| 1 or 2 Children | 9 (5.5%) | 53 (25.0%) |
| 3 or 4 Children | 29 (23.6%) | 0 (0.0%) |
| 5 or more Children | 0 (0.0%) | 0 (0.0%) |
| Total | 59 (7.1%) | 53 (16.6%) |
Race in Springville
The most populous races in Springville are White / Caucasian (4,093 | 96.9%), Hispanic or Latino (55 | 1.3%), and Two or more Races (54 | 1.3%).
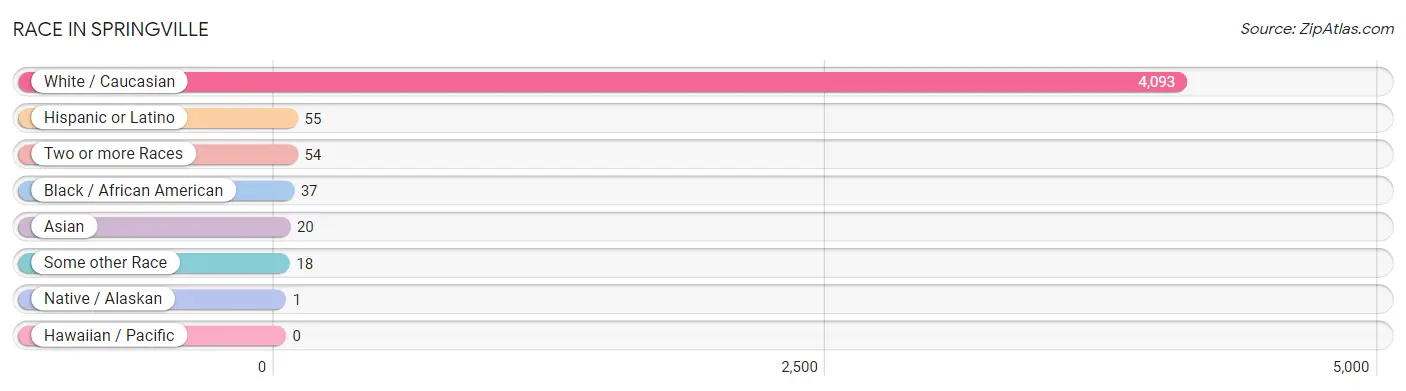
| Race | # Population | % Population |
| Asian | 20 | 0.5% |
| Black / African American | 37 | 0.9% |
| Hawaiian / Pacific | 0 | 0.0% |
| Hispanic or Latino | 55 | 1.3% |
| Native / Alaskan | 1 | 0.0% |
| White / Caucasian | 4,093 | 96.9% |
| Two or more Races | 54 | 1.3% |
| Some other Race | 18 | 0.4% |
| Total | 4,223 | 100.0% |
Ancestry in Springville
The most populous ancestries reported in Springville are German (1,512 | 35.8%), Irish (998 | 23.6%), Polish (675 | 16.0%), English (586 | 13.9%), and Italian (364 | 8.6%), together accounting for 97.9% of all Springville residents.
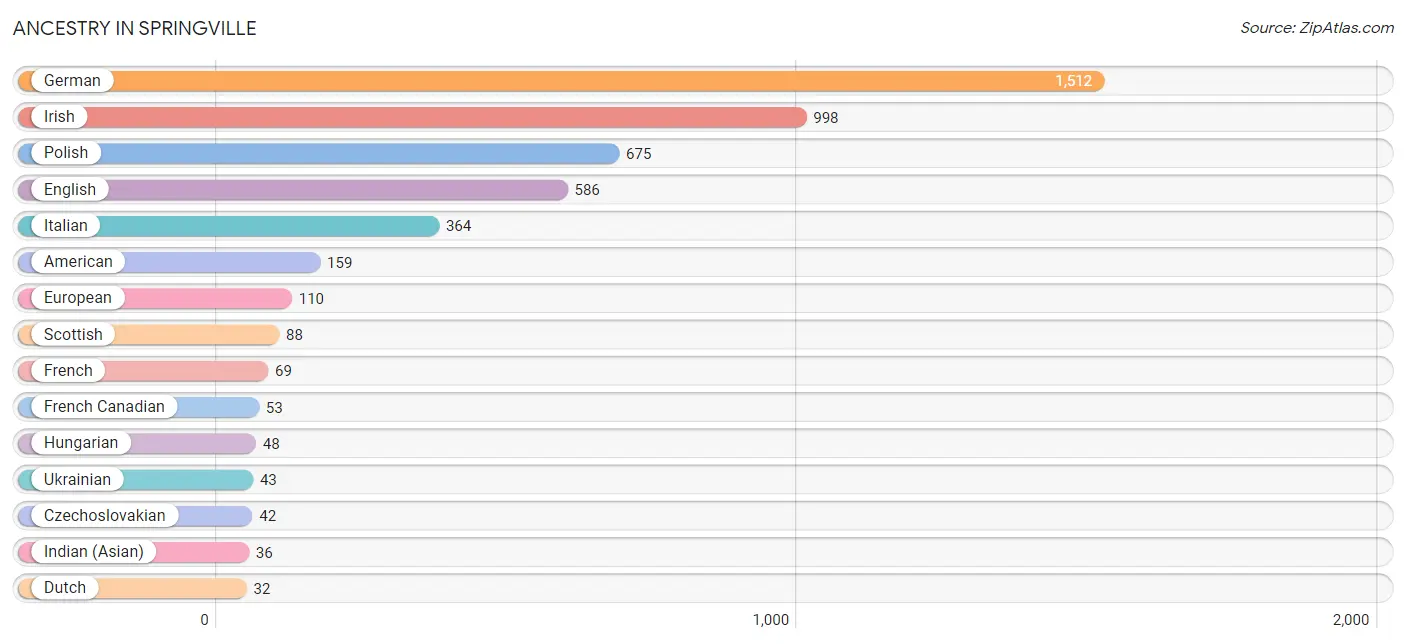
| Ancestry | # Population | % Population |
| American | 159 | 3.8% |
| Austrian | 18 | 0.4% |
| British | 10 | 0.2% |
| Canadian | 30 | 0.7% |
| Czechoslovakian | 42 | 1.0% |
| Dutch | 32 | 0.8% |
| Eastern European | 10 | 0.2% |
| English | 586 | 13.9% |
| European | 110 | 2.6% |
| Finnish | 11 | 0.3% |
| French | 69 | 1.6% |
| French Canadian | 53 | 1.3% |
| German | 1,512 | 35.8% |
| Greek | 8 | 0.2% |
| Hungarian | 48 | 1.1% |
| Indian (Asian) | 36 | 0.9% |
| Irish | 998 | 23.6% |
| Iroquois | 1 | 0.0% |
| Italian | 364 | 8.6% |
| Mexican | 16 | 0.4% |
| Native Hawaiian | 16 | 0.4% |
| Norwegian | 30 | 0.7% |
| Polish | 675 | 16.0% |
| Portuguese | 7 | 0.2% |
| Puerto Rican | 28 | 0.7% |
| Russian | 25 | 0.6% |
| Scottish | 88 | 2.1% |
| Slavic | 8 | 0.2% |
| Slovene | 13 | 0.3% |
| Spaniard | 11 | 0.3% |
| Sri Lankan | 16 | 0.4% |
| Ukrainian | 43 | 1.0% |
| Welsh | 20 | 0.5% | View All 33 Rows |
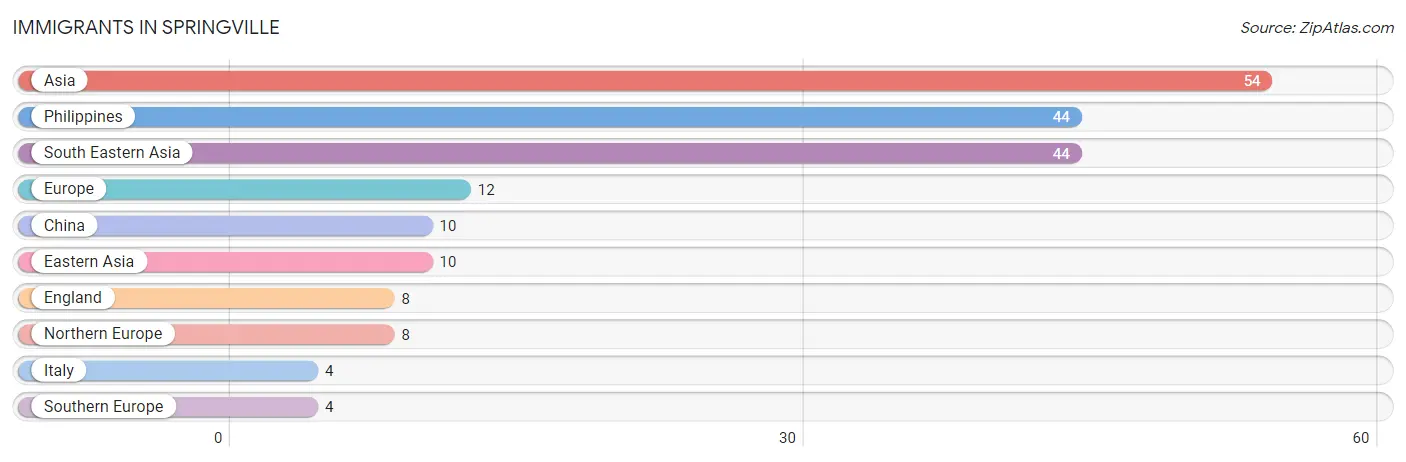
Immigrants in Springville
The most numerous immigrant groups reported in Springville came from Asia (54 | 1.3%), Philippines (44 | 1.0%), South Eastern Asia (44 | 1.0%), Europe (12 | 0.3%), and China (10 | 0.2%), together accounting for 3.9% of all Springville residents.
| Immigration Origin | # Population | % Population |
| Asia | 54 | 1.3% |
| China | 10 | 0.2% |
| Eastern Asia | 10 | 0.2% |
| England | 8 | 0.2% |
| Europe | 12 | 0.3% |
| Italy | 4 | 0.1% |
| Northern Europe | 8 | 0.2% |
| Philippines | 44 | 1.0% |
| South Eastern Asia | 44 | 1.0% |
| Southern Europe | 4 | 0.1% | View All 10 Rows |
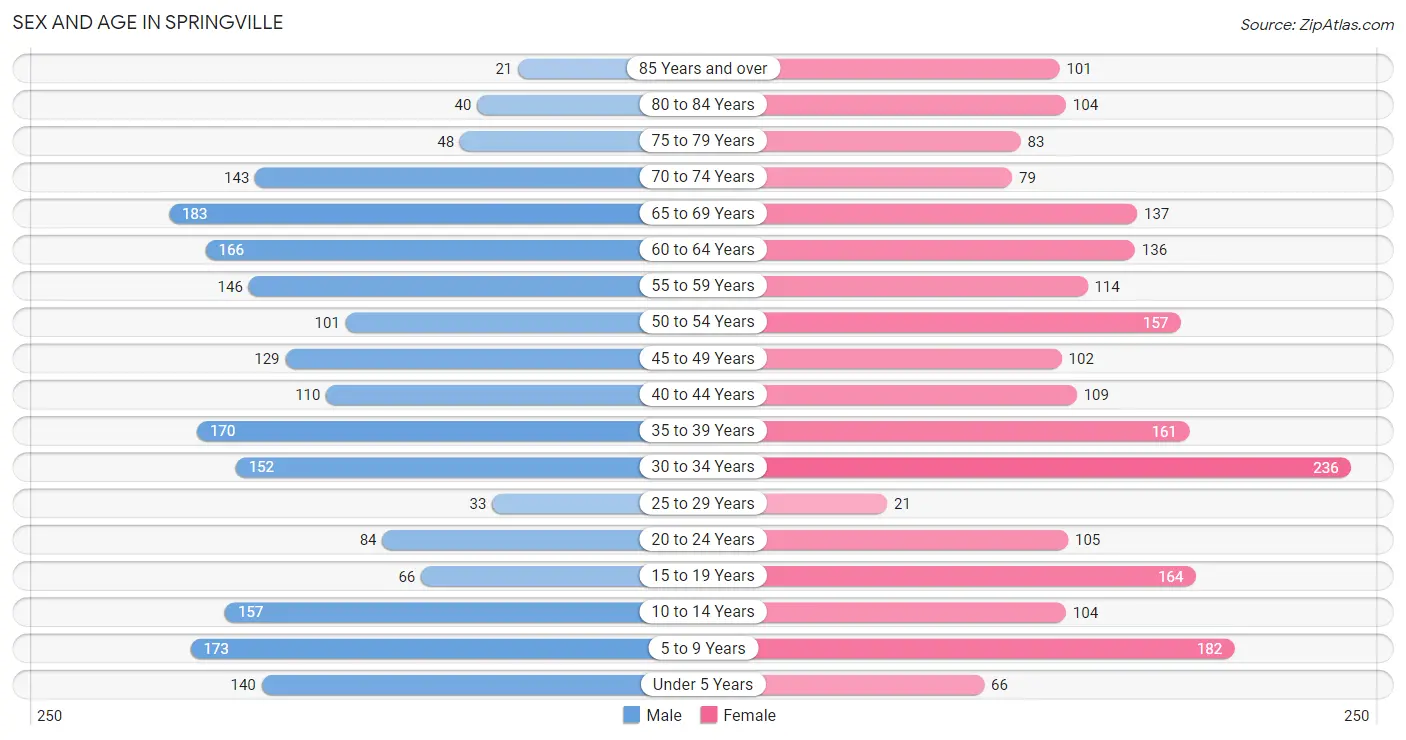
Sex and Age in Springville
Sex and Age in Springville
The most populous age groups in Springville are 65 to 69 Years (183 | 8.9%) for men and 30 to 34 Years (236 | 10.9%) for women.
| Age Bracket | Male | Female |
| Under 5 Years | 140 (6.8%) | 66 (3.0%) |
| 5 to 9 Years | 173 (8.4%) | 182 (8.4%) |
| 10 to 14 Years | 157 (7.6%) | 104 (4.8%) |
| 15 to 19 Years | 66 (3.2%) | 164 (7.6%) |
| 20 to 24 Years | 84 (4.1%) | 105 (4.9%) |
| 25 to 29 Years | 33 (1.6%) | 21 (1.0%) |
| 30 to 34 Years | 152 (7.4%) | 236 (10.9%) |
| 35 to 39 Years | 170 (8.2%) | 161 (7.4%) |
| 40 to 44 Years | 110 (5.3%) | 109 (5.0%) |
| 45 to 49 Years | 129 (6.3%) | 102 (4.7%) |
| 50 to 54 Years | 101 (4.9%) | 157 (7.3%) |
| 55 to 59 Years | 146 (7.1%) | 114 (5.3%) |
| 60 to 64 Years | 166 (8.1%) | 136 (6.3%) |
| 65 to 69 Years | 183 (8.9%) | 137 (6.3%) |
| 70 to 74 Years | 143 (6.9%) | 79 (3.7%) |
| 75 to 79 Years | 48 (2.3%) | 83 (3.8%) |
| 80 to 84 Years | 40 (1.9%) | 104 (4.8%) |
| 85 Years and over | 21 (1.0%) | 101 (4.7%) |
| Total | 2,062 (100.0%) | 2,161 (100.0%) |
Families and Households in Springville
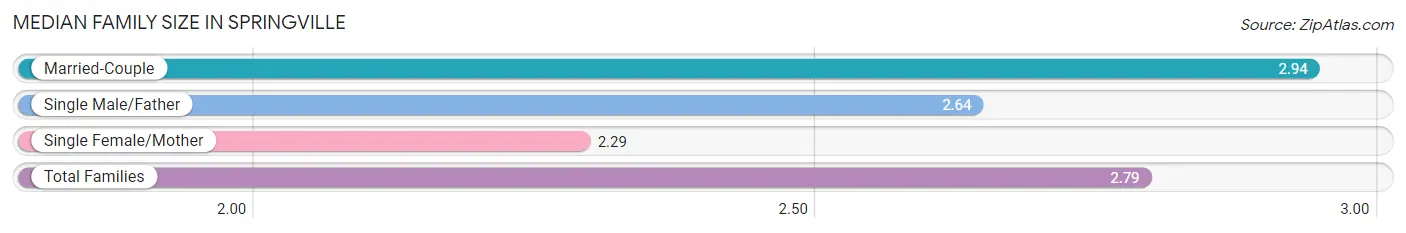
Median Family Size in Springville
The median family size in Springville is 2.79 persons per family, with married-couple families (833 | 72.3%) accounting for the largest median family size of 2.94 persons per family. On the other hand, single female/mother families (233 | 20.2%) represent the smallest median family size with 2.29 persons per family.
| Family Type | # Families | Family Size |
| Married-Couple | 833 (72.3%) | 2.94 |
| Single Male/Father | 87 (7.5%) | 2.64 |
| Single Female/Mother | 233 (20.2%) | 2.29 |
| Total Families | 1,153 (100.0%) | 2.79 |
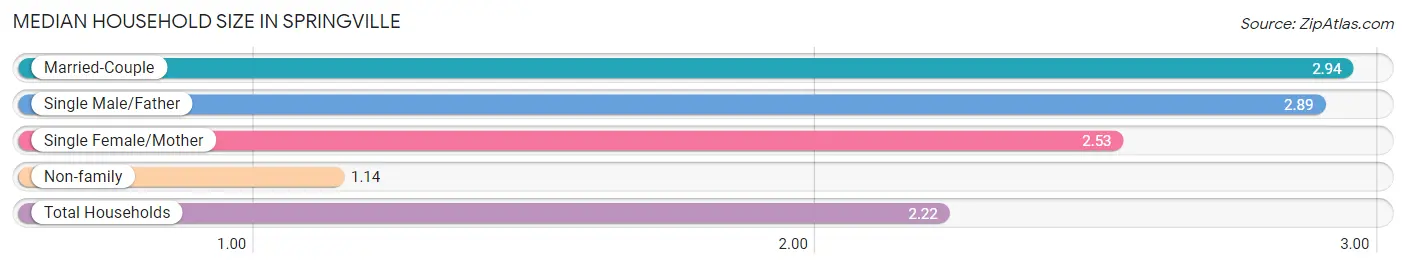
Median Household Size in Springville
The median household size in Springville is 2.22 persons per household, with married-couple households (833 | 45.6%) accounting for the largest median household size of 2.94 persons per household. non-family households (675 | 36.9%) represent the smallest median household size with 1.14 persons per household.
| Household Type | # Households | Household Size |
| Married-Couple | 833 (45.6%) | 2.94 |
| Single Male/Father | 87 (4.8%) | 2.89 |
| Single Female/Mother | 233 (12.8%) | 2.53 |
| Non-family | 675 (36.9%) | 1.14 |
| Total Households | 1,828 (100.0%) | 2.22 |
Household Size by Marriage Status in Springville
Out of a total of 1,828 households in Springville, 1,153 (63.1%) are family households, while 675 (36.9%) are nonfamily households. The most numerous type of family households are 2-person households, comprising 621, and the most common type of nonfamily households are 1-person households, comprising 586.
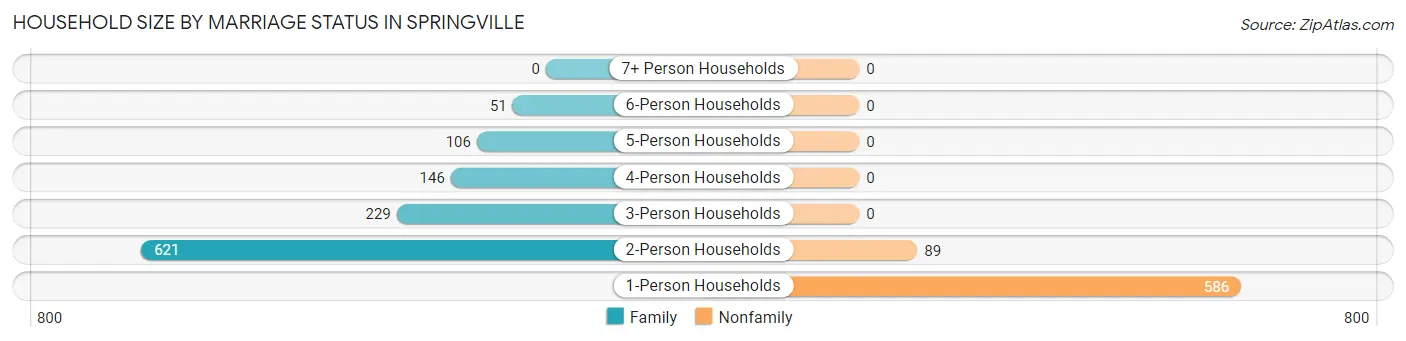
| Household Size | Family Households | Nonfamily Households |
| 1-Person Households | - | 586 (32.1%) |
| 2-Person Households | 621 (34.0%) | 89 (4.9%) |
| 3-Person Households | 229 (12.5%) | 0 (0.0%) |
| 4-Person Households | 146 (8.0%) | 0 (0.0%) |
| 5-Person Households | 106 (5.8%) | 0 (0.0%) |
| 6-Person Households | 51 (2.8%) | 0 (0.0%) |
| 7+ Person Households | 0 (0.0%) | 0 (0.0%) |
| Total | 1,153 (63.1%) | 675 (36.9%) |
Female Fertility in Springville
Fertility by Age in Springville
Average fertility rate in Springville is 20.0 births per 1,000 women. Women in the age bracket of 20 to 34 years have the highest fertility rate with 28.0 births per 1,000 women. Women in the age bracket of 20 to 34 years acount for 55.6% of all women with births.
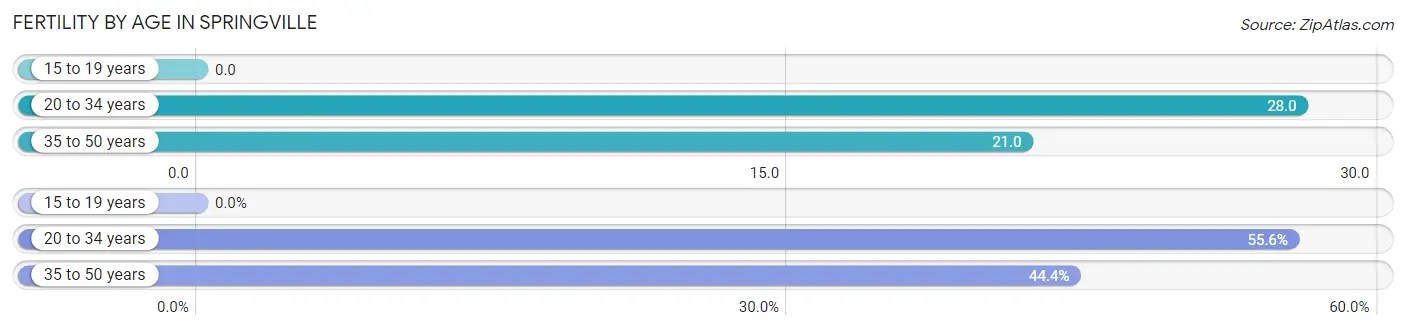
| Age Bracket | Women with Births | Births / 1,000 Women |
| 15 to 19 years | 0 (0.0%) | 0.0 |
| 20 to 34 years | 10 (55.6%) | 28.0 |
| 35 to 50 years | 8 (44.4%) | 21.0 |
| Total | 18 (100.0%) | 20.0 |
Fertility by Age by Marriage Status in Springville
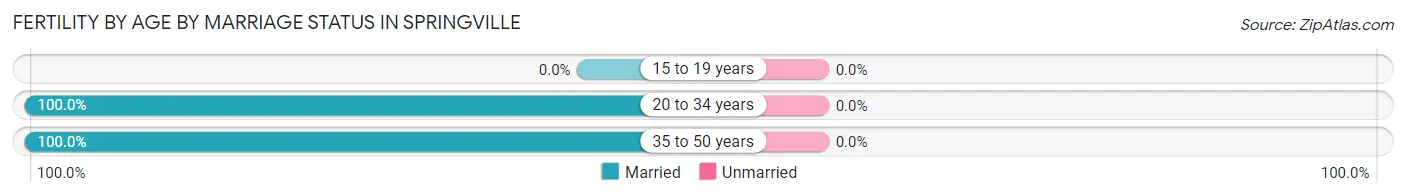
| Age Bracket | Married | Unmarried |
| 15 to 19 years | 0 (0.0%) | 0 (0.0%) |
| 20 to 34 years | 10 (100.0%) | 0 (0.0%) |
| 35 to 50 years | 8 (100.0%) | 0 (0.0%) |
| Total | 18 (100.0%) | 0 (0.0%) |
Fertility by Education in Springville
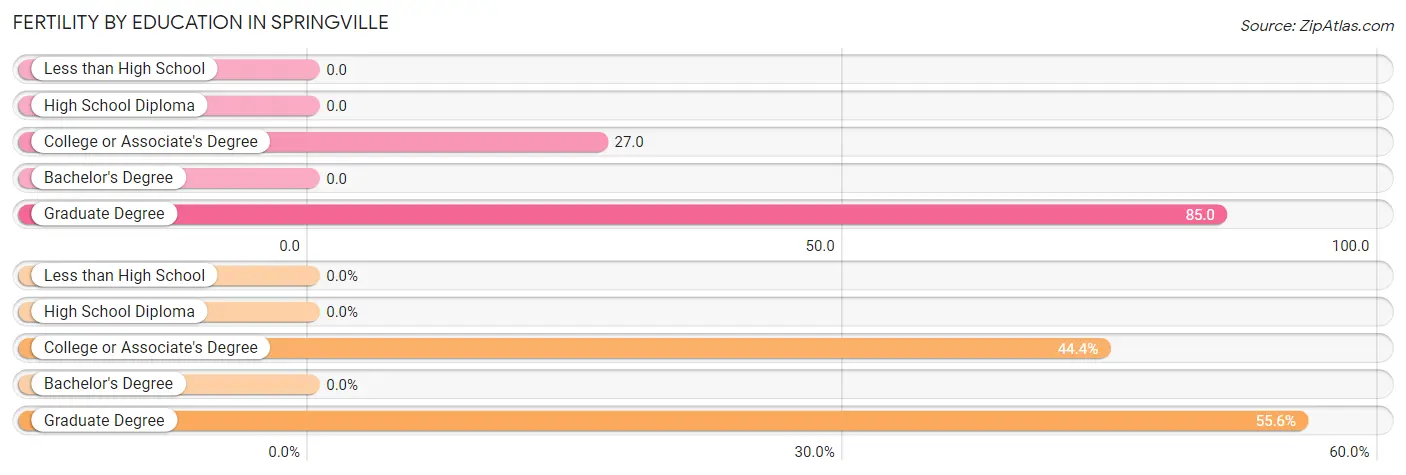
| Educational Attainment | Women with Births | Births / 1,000 Women |
| Less than High School | 0 (0.0%) | 0.0 |
| High School Diploma | 0 (0.0%) | 0.0 |
| College or Associate's Degree | 8 (44.4%) | 27.0 |
| Bachelor's Degree | 0 (0.0%) | 0.0 |
| Graduate Degree | 10 (55.6%) | 85.0 |
| Total | 18 (100.0%) | 20.0 |
Fertility by Education by Marriage Status in Springville
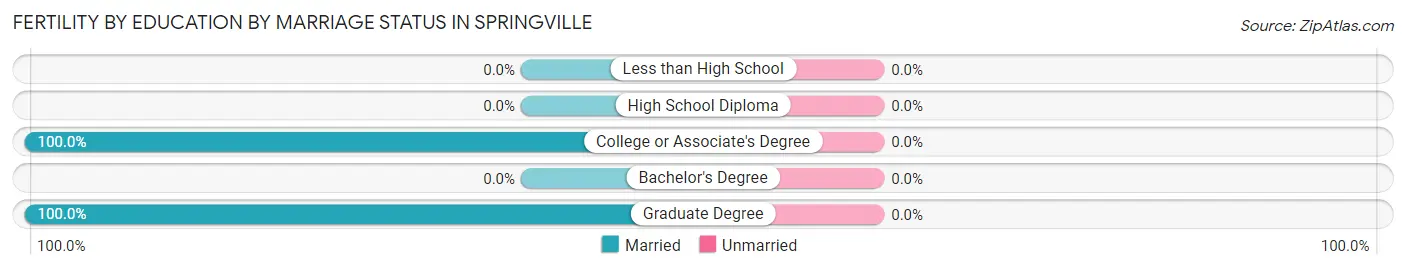
| Educational Attainment | Married | Unmarried |
| Less than High School | 0 (0.0%) | 0 (0.0%) |
| High School Diploma | 0 (0.0%) | 0 (0.0%) |
| College or Associate's Degree | 8 (100.0%) | 0 (0.0%) |
| Bachelor's Degree | 0 (0.0%) | 0 (0.0%) |
| Graduate Degree | 10 (100.0%) | 0 (0.0%) |
| Total | 18 (100.0%) | 0 (0.0%) |
Employment Characteristics in Springville
Employment by Class of Employer in Springville
Among the 1,799 employed individuals in Springville, private company employees (1,227 | 68.2%), not-for-profit organizations (237 | 13.2%), and local government employees (149 | 8.3%) make up the most common classes of employment.
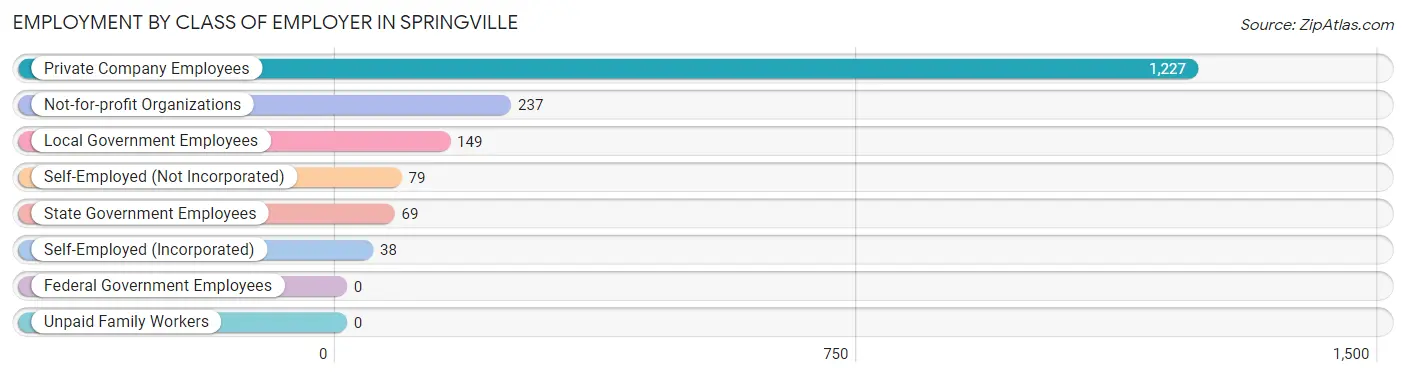
| Employer Class | # Employees | % Employees |
| Private Company Employees | 1,227 | 68.2% |
| Self-Employed (Incorporated) | 38 | 2.1% |
| Self-Employed (Not Incorporated) | 79 | 4.4% |
| Not-for-profit Organizations | 237 | 13.2% |
| Local Government Employees | 149 | 8.3% |
| State Government Employees | 69 | 3.8% |
| Federal Government Employees | 0 | 0.0% |
| Unpaid Family Workers | 0 | 0.0% |
| Total | 1,799 | 100.0% |
Employment Status by Age in Springville
According to the labor force statistics for Springville, out of the total population over 16 years of age (3,367), 58.7% or 1,976 individuals are in the labor force, with 4.9% or 97 of them unemployed. The age group with the highest labor force participation rate is 20 to 24 years, with 100.0% or 189 individuals in the labor force. Within the labor force, the 30 to 34 years age range has the highest percentage of unemployed individuals, with 13.3% or 44 of them being unemployed.
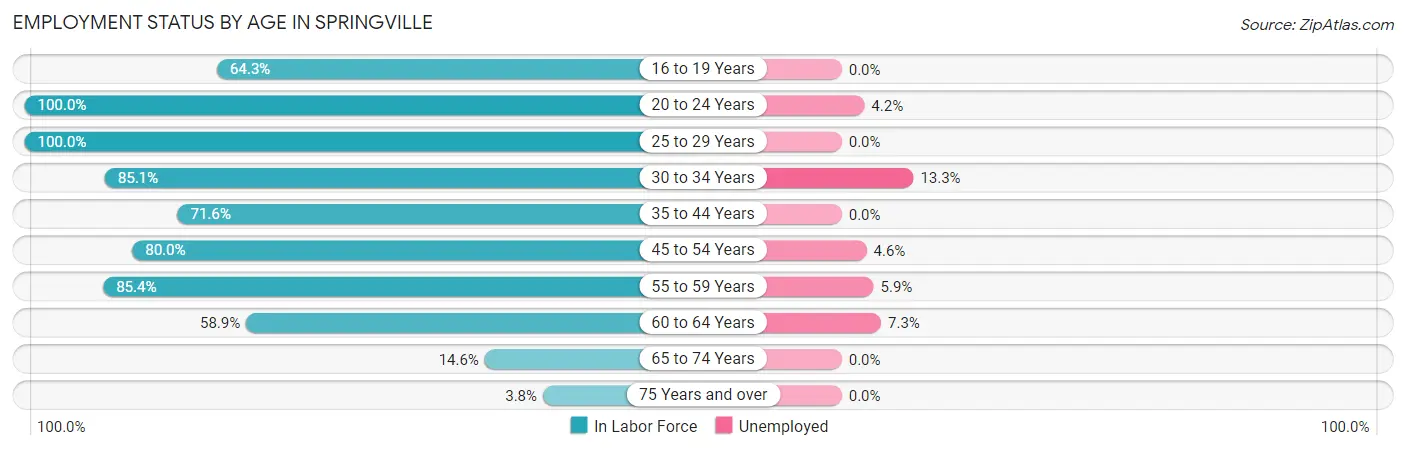
| Age Bracket | In Labor Force | Unemployed |
| 16 to 19 Years | 126 (64.3%) | 0 (0.0%) |
| 20 to 24 Years | 189 (100.0%) | 8 (4.2%) |
| 25 to 29 Years | 54 (100.0%) | 0 (0.0%) |
| 30 to 34 Years | 330 (85.1%) | 44 (13.3%) |
| 35 to 44 Years | 394 (71.6%) | 0 (0.0%) |
| 45 to 54 Years | 391 (80.0%) | 18 (4.6%) |
| 55 to 59 Years | 222 (85.4%) | 13 (5.9%) |
| 60 to 64 Years | 178 (58.9%) | 13 (7.3%) |
| 65 to 74 Years | 79 (14.6%) | 0 (0.0%) |
| 75 Years and over | 15 (3.8%) | 0 (0.0%) |
| Total | 1,976 (58.7%) | 97 (4.9%) |
Employment Status by Educational Attainment in Springville
According to labor force statistics for Springville, 76.8% of individuals (1,569) out of the total population between 25 and 64 years of age (2,043) are in the labor force, with 5.6% or 88 of them being unemployed. The group with the highest labor force participation rate are those with the educational attainment of bachelor's degree or higher, with 93.2% or 497 individuals in the labor force. Within the labor force, individuals with less than high school education have the highest percentage of unemployment, with 18.8% or 18 of them being unemployed.
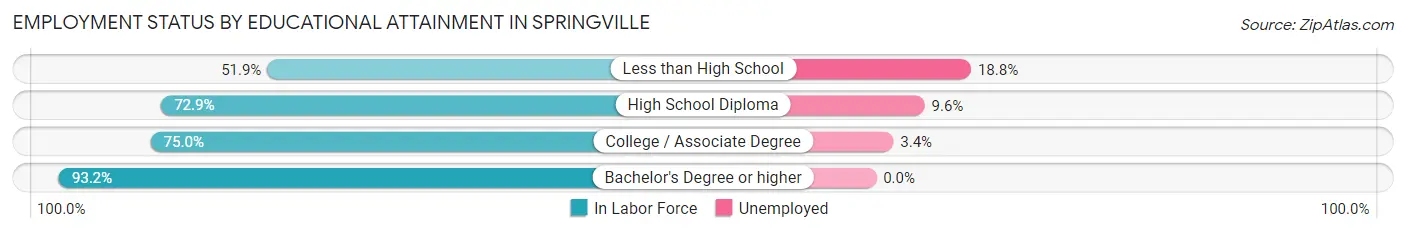
| Educational Attainment | In Labor Force | Unemployed |
| Less than High School | 96 (51.9%) | 35 (18.8%) |
| High School Diploma | 593 (72.9%) | 78 (9.6%) |
| College / Associate Degree | 383 (75.0%) | 17 (3.4%) |
| Bachelor's Degree or higher | 497 (93.2%) | 0 (0.0%) |
| Total | 1,569 (76.8%) | 114 (5.6%) |
Employment Occupations by Sex in Springville
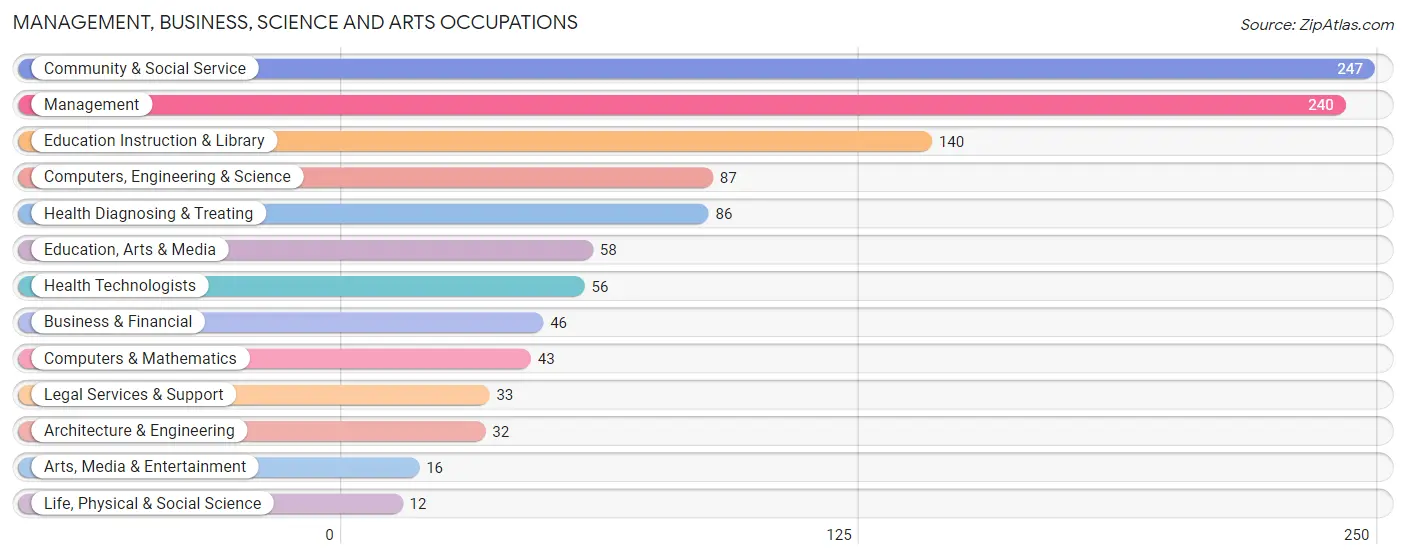
Management, Business, Science and Arts Occupations
The most common Management, Business, Science and Arts occupations in Springville are Community & Social Service (247 | 13.1%), Management (240 | 12.8%), Education Instruction & Library (140 | 7.4%), Computers, Engineering & Science (87 | 4.6%), and Health Diagnosing & Treating (86 | 4.6%).
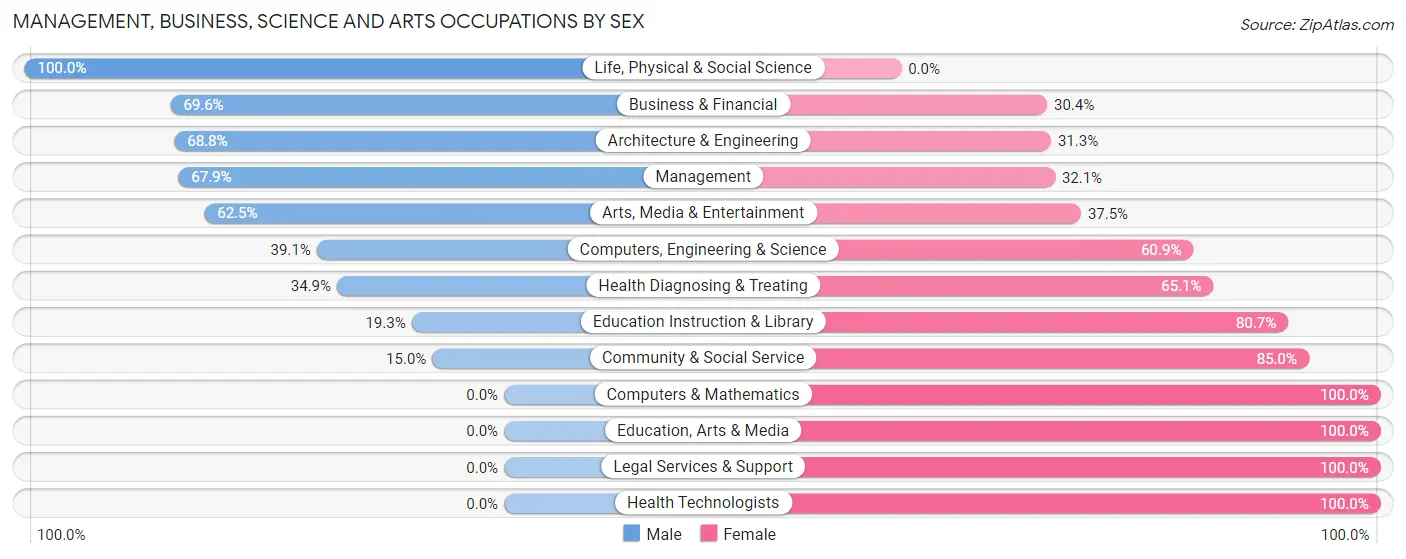
Management, Business, Science and Arts Occupations by Sex
Within the Management, Business, Science and Arts occupations in Springville, the most male-oriented occupations are Life, Physical & Social Science (100.0%), Business & Financial (69.6%), and Architecture & Engineering (68.8%), while the most female-oriented occupations are Computers & Mathematics (100.0%), Education, Arts & Media (100.0%), and Legal Services & Support (100.0%).
| Occupation | Male | Female |
| Management | 163 (67.9%) | 77 (32.1%) |
| Business & Financial | 32 (69.6%) | 14 (30.4%) |
| Computers, Engineering & Science | 34 (39.1%) | 53 (60.9%) |
| Computers & Mathematics | 0 (0.0%) | 43 (100.0%) |
| Architecture & Engineering | 22 (68.8%) | 10 (31.2%) |
| Life, Physical & Social Science | 12 (100.0%) | 0 (0.0%) |
| Community & Social Service | 37 (15.0%) | 210 (85.0%) |
| Education, Arts & Media | 0 (0.0%) | 58 (100.0%) |
| Legal Services & Support | 0 (0.0%) | 33 (100.0%) |
| Education Instruction & Library | 27 (19.3%) | 113 (80.7%) |
| Arts, Media & Entertainment | 10 (62.5%) | 6 (37.5%) |
| Health Diagnosing & Treating | 30 (34.9%) | 56 (65.1%) |
| Health Technologists | 0 (0.0%) | 56 (100.0%) |
| Total (Category) | 296 (41.9%) | 410 (58.1%) |
| Total (Overall) | 929 (49.4%) | 953 (50.6%) |
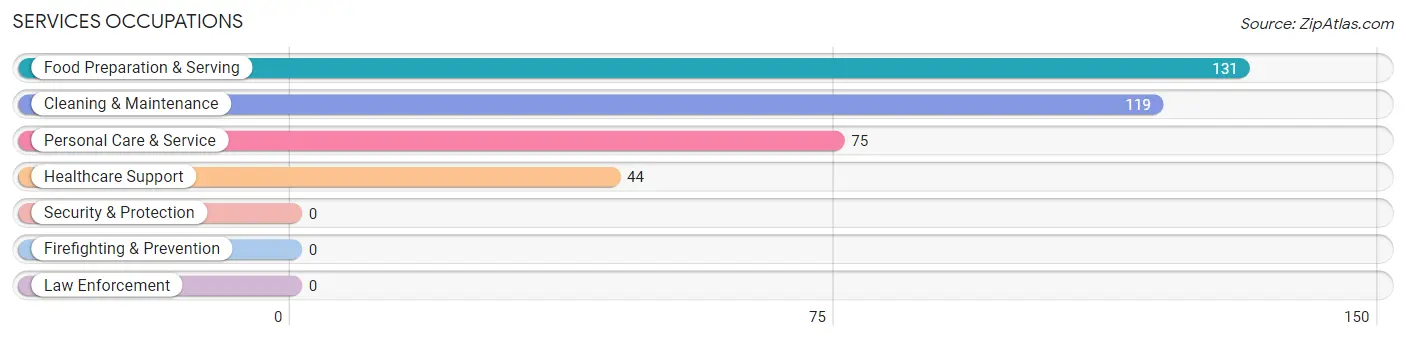
Services Occupations
The most common Services occupations in Springville are Food Preparation & Serving (131 | 7.0%), Cleaning & Maintenance (119 | 6.3%), Personal Care & Service (75 | 4.0%), and Healthcare Support (44 | 2.3%).
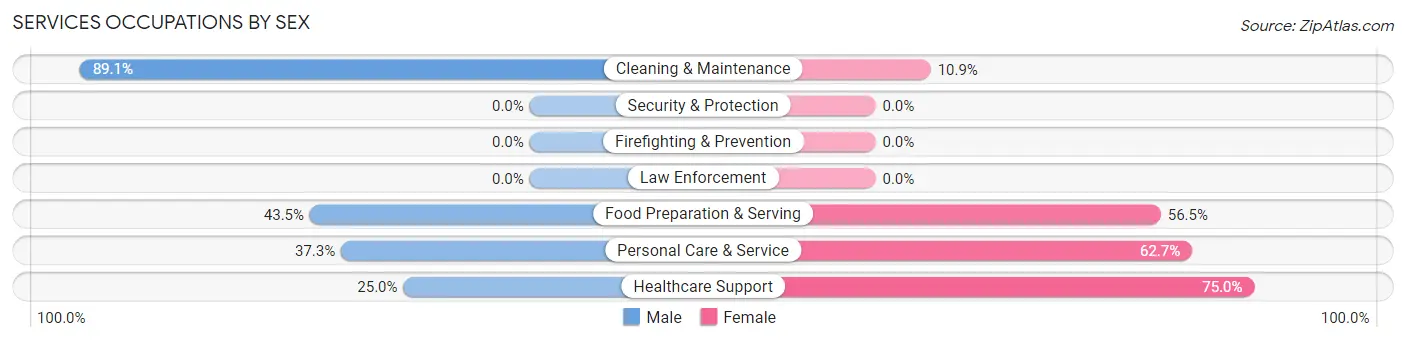
Services Occupations by Sex
Within the Services occupations in Springville, the most male-oriented occupations are Cleaning & Maintenance (89.1%), Food Preparation & Serving (43.5%), and Personal Care & Service (37.3%), while the most female-oriented occupations are Healthcare Support (75.0%), Personal Care & Service (62.7%), and Food Preparation & Serving (56.5%).
| Occupation | Male | Female |
| Healthcare Support | 11 (25.0%) | 33 (75.0%) |
| Security & Protection | 0 (0.0%) | 0 (0.0%) |
| Firefighting & Prevention | 0 (0.0%) | 0 (0.0%) |
| Law Enforcement | 0 (0.0%) | 0 (0.0%) |
| Food Preparation & Serving | 57 (43.5%) | 74 (56.5%) |
| Cleaning & Maintenance | 106 (89.1%) | 13 (10.9%) |
| Personal Care & Service | 28 (37.3%) | 47 (62.7%) |
| Total (Category) | 202 (54.7%) | 167 (45.3%) |
| Total (Overall) | 929 (49.4%) | 953 (50.6%) |
Sales and Office Occupations
The most common Sales and Office occupations in Springville are Sales & Related (259 | 13.8%), and Office & Administration (178 | 9.5%).

Sales and Office Occupations by Sex
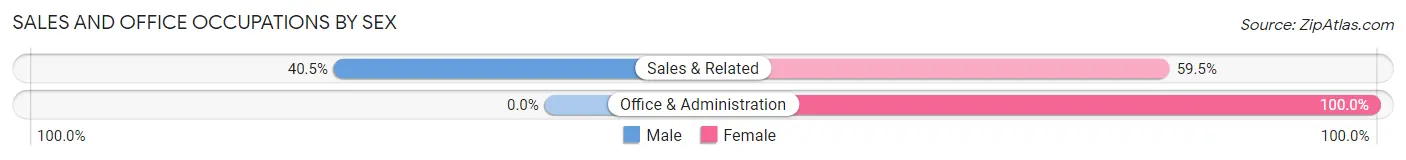
| Occupation | Male | Female |
| Sales & Related | 105 (40.5%) | 154 (59.5%) |
| Office & Administration | 0 (0.0%) | 178 (100.0%) |
| Total (Category) | 105 (24.0%) | 332 (76.0%) |
| Total (Overall) | 929 (49.4%) | 953 (50.6%) |
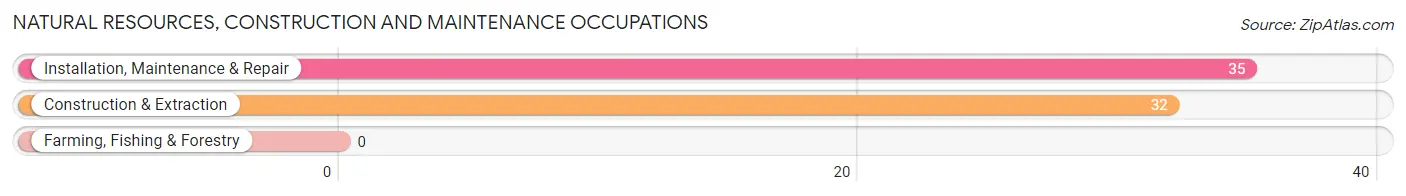
Natural Resources, Construction and Maintenance Occupations
The most common Natural Resources, Construction and Maintenance occupations in Springville are Installation, Maintenance & Repair (35 | 1.9%), and Construction & Extraction (32 | 1.7%).
Natural Resources, Construction and Maintenance Occupations by Sex
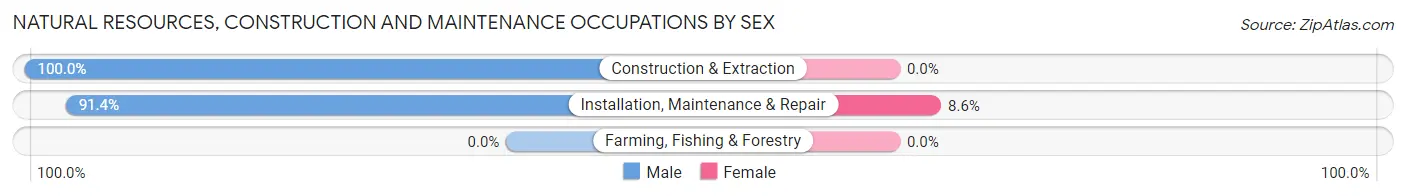
| Occupation | Male | Female |
| Farming, Fishing & Forestry | 0 (0.0%) | 0 (0.0%) |
| Construction & Extraction | 32 (100.0%) | 0 (0.0%) |
| Installation, Maintenance & Repair | 32 (91.4%) | 3 (8.6%) |
| Total (Category) | 64 (95.5%) | 3 (4.5%) |
| Total (Overall) | 929 (49.4%) | 953 (50.6%) |
Production, Transportation and Moving Occupations
The most common Production, Transportation and Moving occupations in Springville are Production (145 | 7.7%), Transportation (99 | 5.3%), and Material Moving (59 | 3.1%).
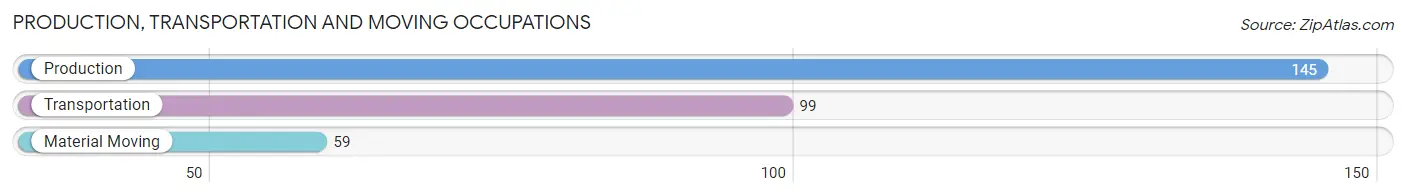
Production, Transportation and Moving Occupations by Sex
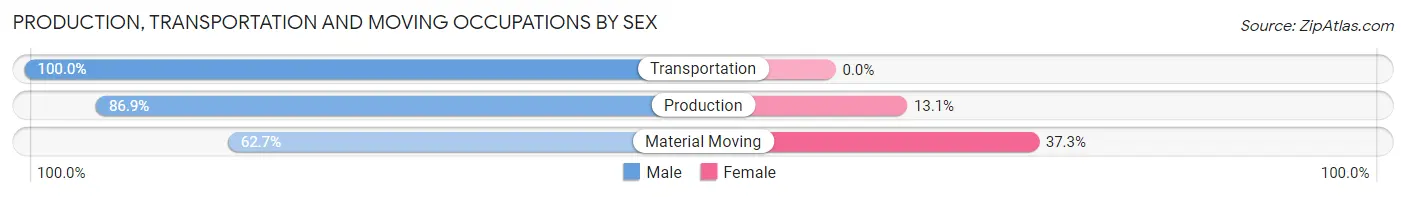
| Occupation | Male | Female |
| Production | 126 (86.9%) | 19 (13.1%) |
| Transportation | 99 (100.0%) | 0 (0.0%) |
| Material Moving | 37 (62.7%) | 22 (37.3%) |
| Total (Category) | 262 (86.5%) | 41 (13.5%) |
| Total (Overall) | 929 (49.4%) | 953 (50.6%) |
Employment Industries by Sex in Springville
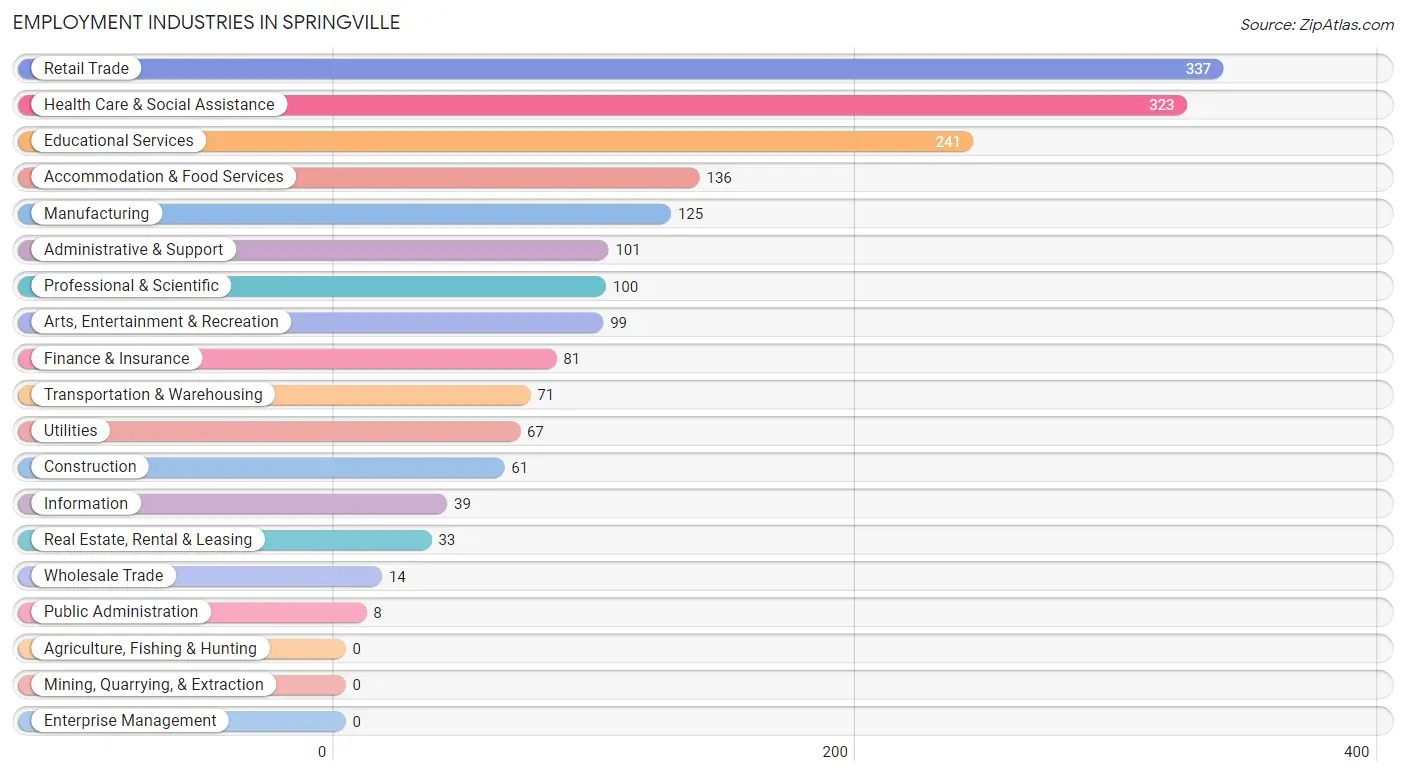
Employment Industries in Springville
The major employment industries in Springville include Retail Trade (337 | 17.9%), Health Care & Social Assistance (323 | 17.2%), Educational Services (241 | 12.8%), Accommodation & Food Services (136 | 7.2%), and Manufacturing (125 | 6.6%).
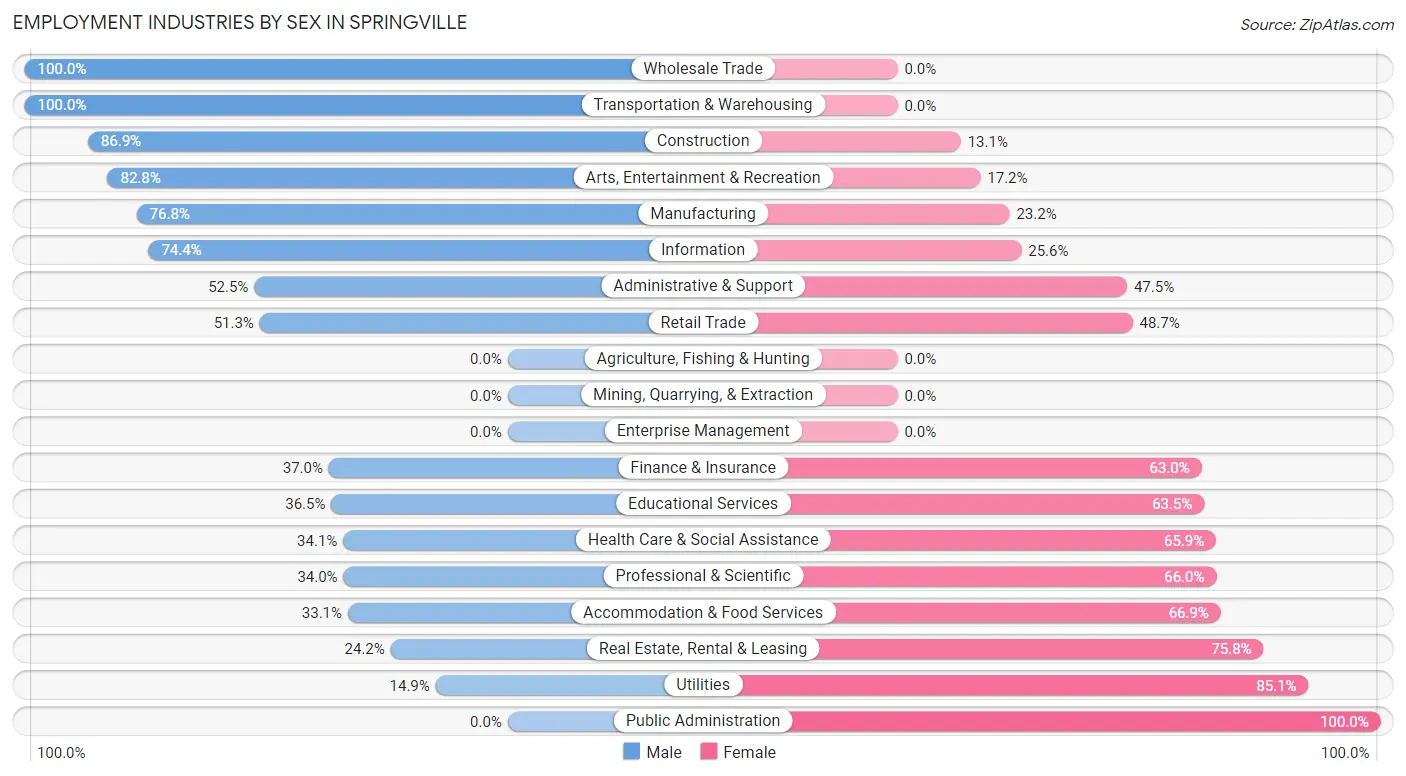
Employment Industries by Sex in Springville
The Springville industries that see more men than women are Wholesale Trade (100.0%), Transportation & Warehousing (100.0%), and Construction (86.9%), whereas the industries that tend to have a higher number of women are Public Administration (100.0%), Utilities (85.1%), and Real Estate, Rental & Leasing (75.8%).
| Industry | Male | Female |
| Agriculture, Fishing & Hunting | 0 (0.0%) | 0 (0.0%) |
| Mining, Quarrying, & Extraction | 0 (0.0%) | 0 (0.0%) |
| Construction | 53 (86.9%) | 8 (13.1%) |
| Manufacturing | 96 (76.8%) | 29 (23.2%) |
| Wholesale Trade | 14 (100.0%) | 0 (0.0%) |
| Retail Trade | 173 (51.3%) | 164 (48.7%) |
| Transportation & Warehousing | 71 (100.0%) | 0 (0.0%) |
| Utilities | 10 (14.9%) | 57 (85.1%) |
| Information | 29 (74.4%) | 10 (25.6%) |
| Finance & Insurance | 30 (37.0%) | 51 (63.0%) |
| Real Estate, Rental & Leasing | 8 (24.2%) | 25 (75.8%) |
| Professional & Scientific | 34 (34.0%) | 66 (66.0%) |
| Enterprise Management | 0 (0.0%) | 0 (0.0%) |
| Administrative & Support | 53 (52.5%) | 48 (47.5%) |
| Educational Services | 88 (36.5%) | 153 (63.5%) |
| Health Care & Social Assistance | 110 (34.1%) | 213 (65.9%) |
| Arts, Entertainment & Recreation | 82 (82.8%) | 17 (17.2%) |
| Accommodation & Food Services | 45 (33.1%) | 91 (66.9%) |
| Public Administration | 0 (0.0%) | 8 (100.0%) |
| Total | 929 (49.4%) | 953 (50.6%) |
Education in Springville
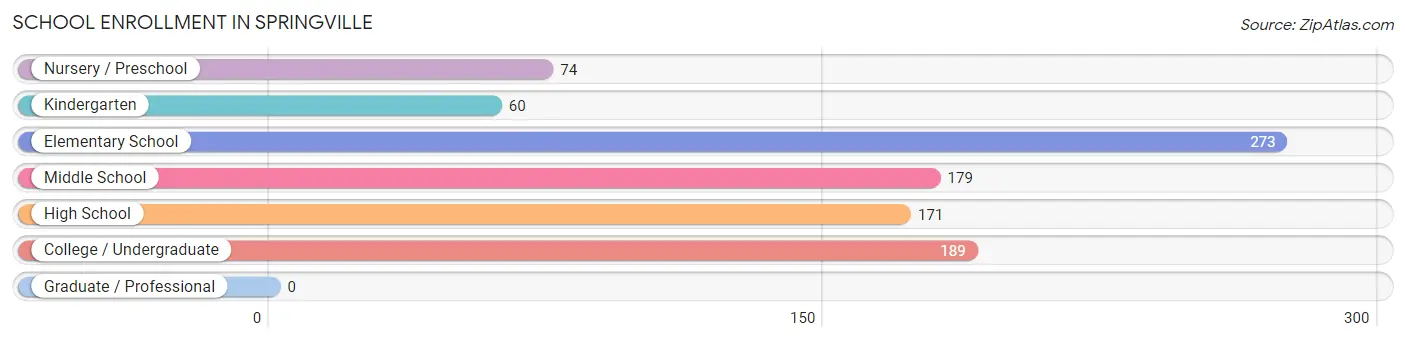
School Enrollment in Springville
The most common levels of schooling among the 946 students in Springville are elementary school (273 | 28.9%), college / undergraduate (189 | 20.0%), and middle school (179 | 18.9%).
| School Level | # Students | % Students |
| Nursery / Preschool | 74 | 7.8% |
| Kindergarten | 60 | 6.3% |
| Elementary School | 273 | 28.9% |
| Middle School | 179 | 18.9% |
| High School | 171 | 18.1% |
| College / Undergraduate | 189 | 20.0% |
| Graduate / Professional | 0 | 0.0% |
| Total | 946 | 100.0% |
School Enrollment by Age by Funding Source in Springville
Out of a total of 946 students who are enrolled in schools in Springville, 66 (7.0%) attend a private institution, while the remaining 880 (93.0%) are enrolled in public schools. The age group of 20 to 24 year olds has the highest likelihood of being enrolled in private schools, with 9 (18.4% in the age bracket) enrolled. Conversely, the age group of 3 to 4 year olds has the lowest likelihood of being enrolled in a private school, with 37 (100.0% in the age bracket) attending a public institution.
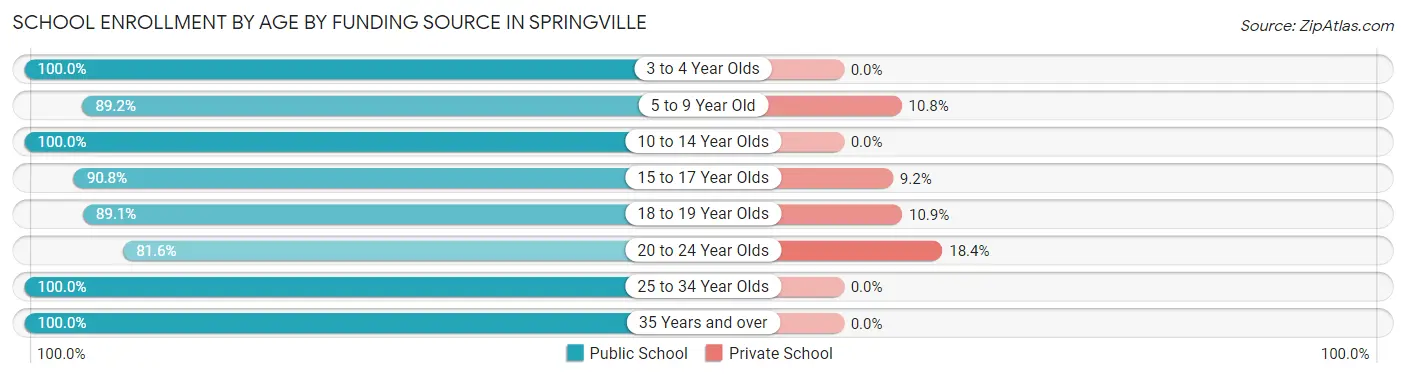
| Age Bracket | Public School | Private School |
| 3 to 4 Year Olds | 37 (100.0%) | 0 (0.0%) |
| 5 to 9 Year Old | 306 (89.2%) | 37 (10.8%) |
| 10 to 14 Year Olds | 261 (100.0%) | 0 (0.0%) |
| 15 to 17 Year Olds | 99 (90.8%) | 10 (9.2%) |
| 18 to 19 Year Olds | 82 (89.1%) | 10 (10.9%) |
| 20 to 24 Year Olds | 40 (81.6%) | 9 (18.4%) |
| 25 to 34 Year Olds | 21 (100.0%) | 0 (0.0%) |
| 35 Years and over | 34 (100.0%) | 0 (0.0%) |
| Total | 880 (93.0%) | 66 (7.0%) |
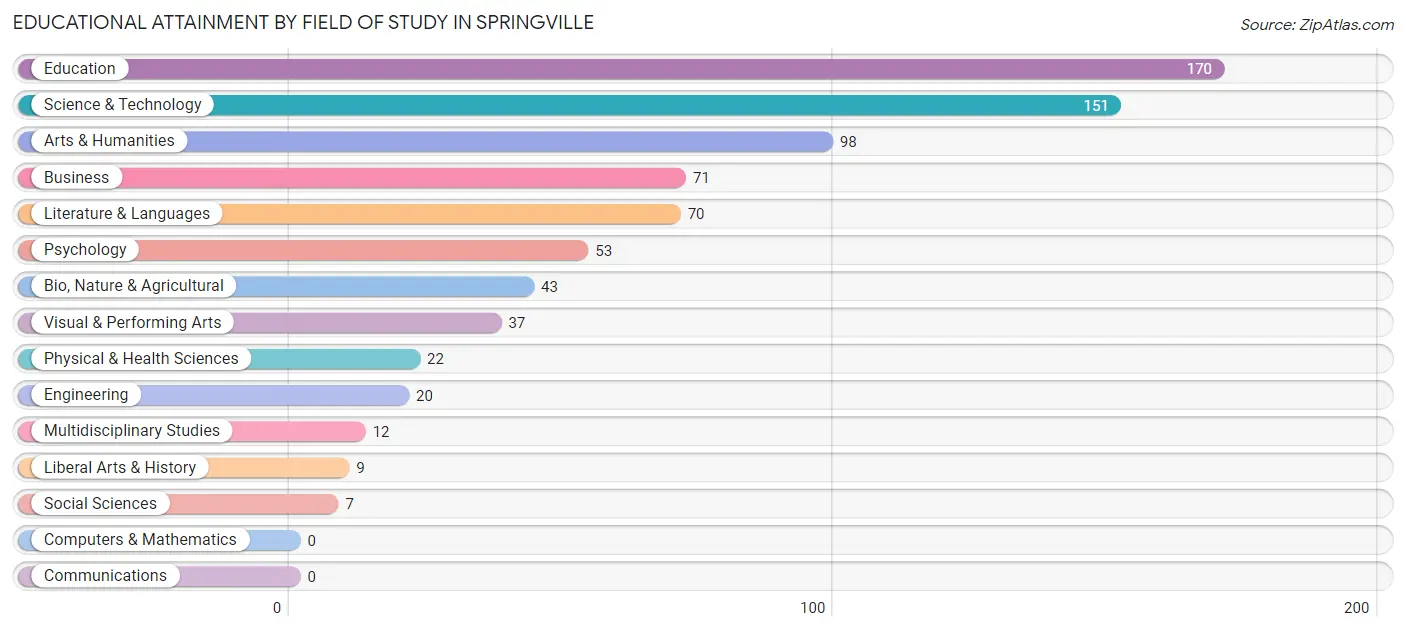
Educational Attainment by Field of Study in Springville
Education (170 | 22.3%), science & technology (151 | 19.8%), arts & humanities (98 | 12.8%), business (71 | 9.3%), and literature & languages (70 | 9.2%) are the most common fields of study among 763 individuals in Springville who have obtained a bachelor's degree or higher.
| Field of Study | # Graduates | % Graduates |
| Computers & Mathematics | 0 | 0.0% |
| Bio, Nature & Agricultural | 43 | 5.6% |
| Physical & Health Sciences | 22 | 2.9% |
| Psychology | 53 | 7.0% |
| Social Sciences | 7 | 0.9% |
| Engineering | 20 | 2.6% |
| Multidisciplinary Studies | 12 | 1.6% |
| Science & Technology | 151 | 19.8% |
| Business | 71 | 9.3% |
| Education | 170 | 22.3% |
| Literature & Languages | 70 | 9.2% |
| Liberal Arts & History | 9 | 1.2% |
| Visual & Performing Arts | 37 | 4.9% |
| Communications | 0 | 0.0% |
| Arts & Humanities | 98 | 12.8% |
| Total | 763 | 100.0% |
Transportation & Commute in Springville
Vehicle Availability by Sex in Springville
The most prevalent vehicle ownership categories in Springville are males with 2 vehicles (433, accounting for 49.7%) and females with 2 vehicles (570, making up 47.0%).
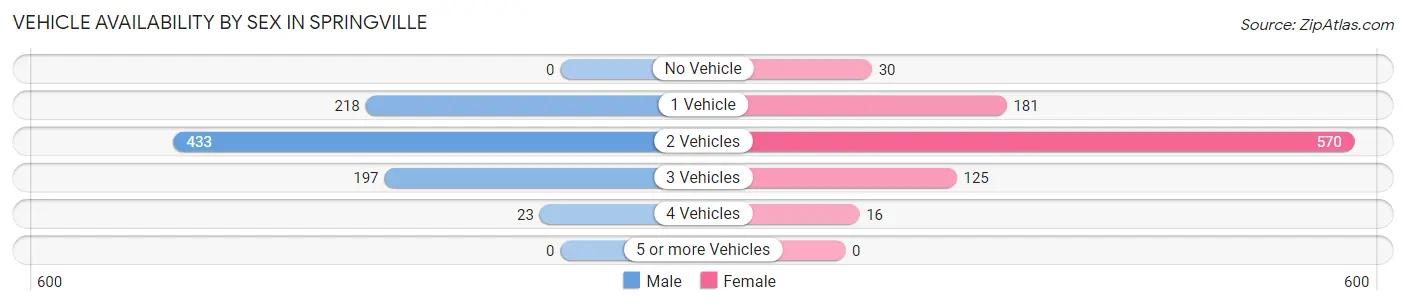
| Vehicles Available | Male | Female |
| No Vehicle | 0 (0.0%) | 30 (3.3%) |
| 1 Vehicle | 218 (25.0%) | 181 (19.6%) |
| 2 Vehicles | 433 (49.7%) | 570 (61.8%) |
| 3 Vehicles | 197 (22.6%) | 125 (13.6%) |
| 4 Vehicles | 23 (2.6%) | 16 (1.7%) |
| 5 or more Vehicles | 0 (0.0%) | 0 (0.0%) |
| Total | 871 (100.0%) | 922 (100.0%) |
Commute Time in Springville
The most frequently occuring commute durations in Springville are 5 to 9 minutes (372 commuters, 22.3%), less than 5 minutes (313 commuters, 18.8%), and 25 to 29 minutes (188 commuters, 11.3%).
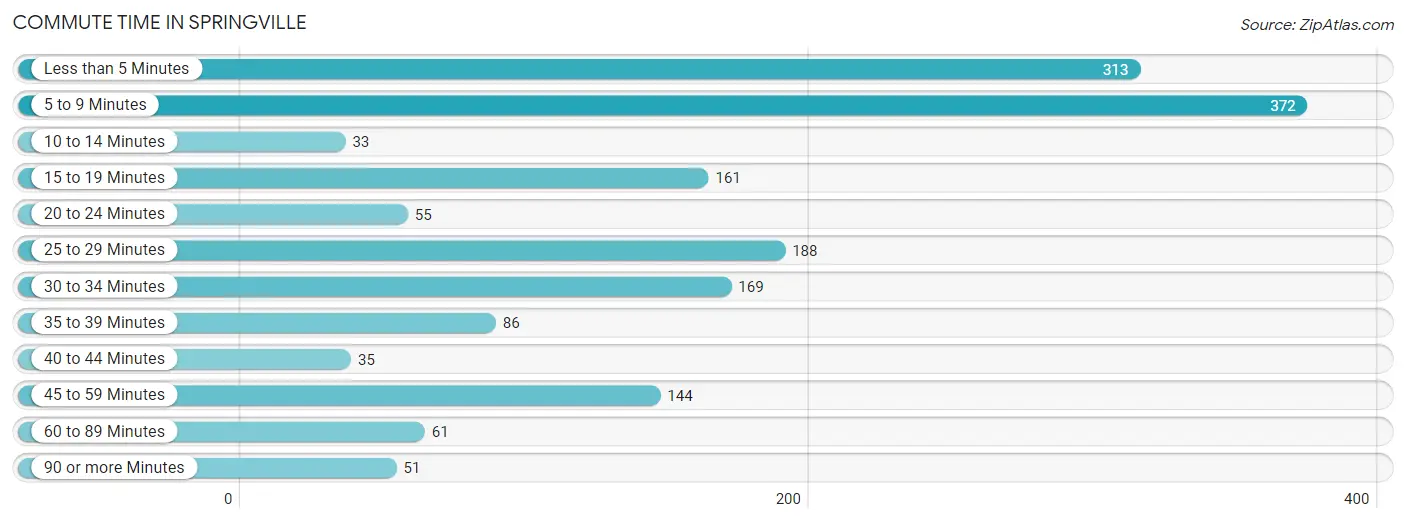
| Commute Time | # Commuters | % Commuters |
| Less than 5 Minutes | 313 | 18.8% |
| 5 to 9 Minutes | 372 | 22.3% |
| 10 to 14 Minutes | 33 | 2.0% |
| 15 to 19 Minutes | 161 | 9.7% |
| 20 to 24 Minutes | 55 | 3.3% |
| 25 to 29 Minutes | 188 | 11.3% |
| 30 to 34 Minutes | 169 | 10.1% |
| 35 to 39 Minutes | 86 | 5.2% |
| 40 to 44 Minutes | 35 | 2.1% |
| 45 to 59 Minutes | 144 | 8.6% |
| 60 to 89 Minutes | 61 | 3.7% |
| 90 or more Minutes | 51 | 3.1% |
Commute Time by Sex in Springville
The most common commute times in Springville are 5 to 9 minutes (232 commuters, 27.4%) for males and less than 5 minutes (255 commuters, 31.0%) for females.
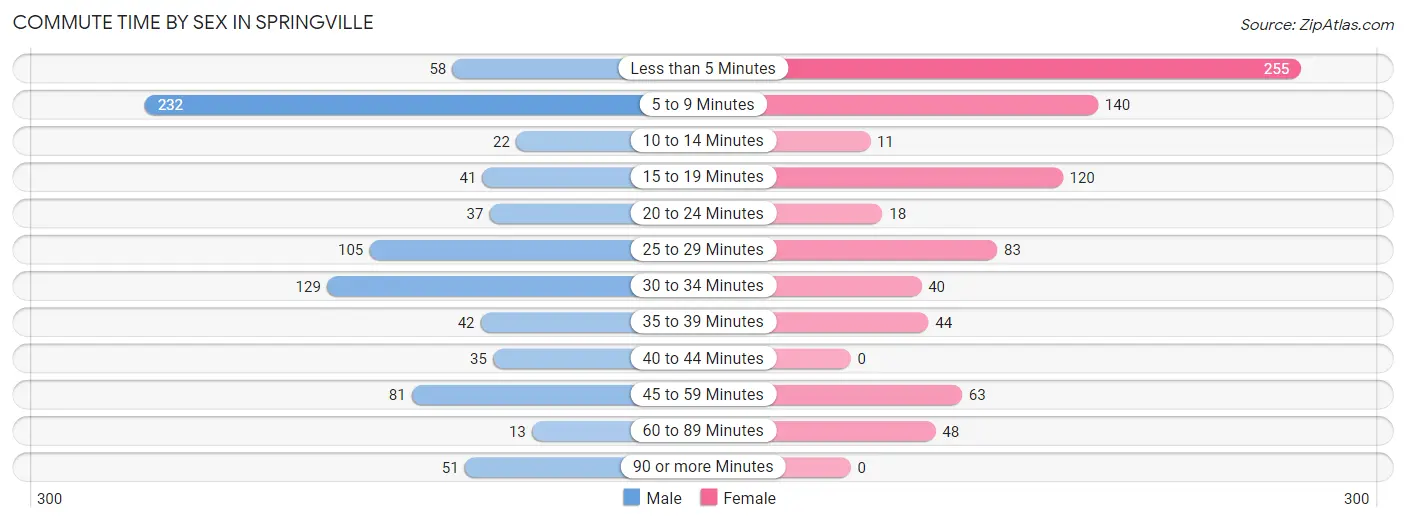
| Commute Time | Male | Female |
| Less than 5 Minutes | 58 (6.9%) | 255 (31.0%) |
| 5 to 9 Minutes | 232 (27.4%) | 140 (17.0%) |
| 10 to 14 Minutes | 22 (2.6%) | 11 (1.3%) |
| 15 to 19 Minutes | 41 (4.9%) | 120 (14.6%) |
| 20 to 24 Minutes | 37 (4.4%) | 18 (2.2%) |
| 25 to 29 Minutes | 105 (12.4%) | 83 (10.1%) |
| 30 to 34 Minutes | 129 (15.2%) | 40 (4.9%) |
| 35 to 39 Minutes | 42 (5.0%) | 44 (5.3%) |
| 40 to 44 Minutes | 35 (4.1%) | 0 (0.0%) |
| 45 to 59 Minutes | 81 (9.6%) | 63 (7.7%) |
| 60 to 89 Minutes | 13 (1.5%) | 48 (5.8%) |
| 90 or more Minutes | 51 (6.0%) | 0 (0.0%) |
Time of Departure to Work by Sex in Springville
The most frequent times of departure to work in Springville are 6:30 AM to 6:59 AM (145, 17.1%) for males and 7:00 AM to 7:29 AM (126, 15.3%) for females.

| Time of Departure | Male | Female |
| 12:00 AM to 4:59 AM | 101 (11.9%) | 27 (3.3%) |
| 5:00 AM to 5:29 AM | 51 (6.0%) | 33 (4.0%) |
| 5:30 AM to 5:59 AM | 20 (2.4%) | 48 (5.8%) |
| 6:00 AM to 6:29 AM | 59 (7.0%) | 42 (5.1%) |
| 6:30 AM to 6:59 AM | 145 (17.1%) | 118 (14.4%) |
| 7:00 AM to 7:29 AM | 119 (14.1%) | 126 (15.3%) |
| 7:30 AM to 7:59 AM | 44 (5.2%) | 51 (6.2%) |
| 8:00 AM to 8:29 AM | 56 (6.6%) | 89 (10.8%) |
| 8:30 AM to 8:59 AM | 92 (10.9%) | 23 (2.8%) |
| 9:00 AM to 9:59 AM | 54 (6.4%) | 49 (6.0%) |
| 10:00 AM to 10:59 AM | 27 (3.2%) | 69 (8.4%) |
| 11:00 AM to 11:59 AM | 0 (0.0%) | 0 (0.0%) |
| 12:00 PM to 3:59 PM | 58 (6.9%) | 39 (4.7%) |
| 4:00 PM to 11:59 PM | 20 (2.4%) | 108 (13.1%) |
| Total | 846 (100.0%) | 822 (100.0%) |
Housing Occupancy in Springville
Occupancy by Ownership in Springville
Of the total 1,828 dwellings in Springville, owner-occupied units account for 1,058 (57.9%), while renter-occupied units make up 770 (42.1%).
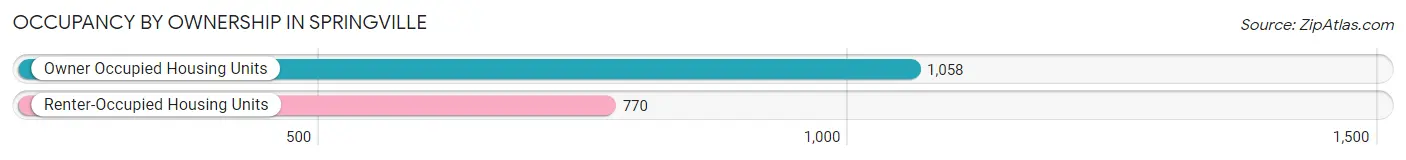
| Occupancy | # Housing Units | % Housing Units |
| Owner Occupied Housing Units | 1,058 | 57.9% |
| Renter-Occupied Housing Units | 770 | 42.1% |
| Total Occupied Housing Units | 1,828 | 100.0% |
Occupancy by Household Size in Springville
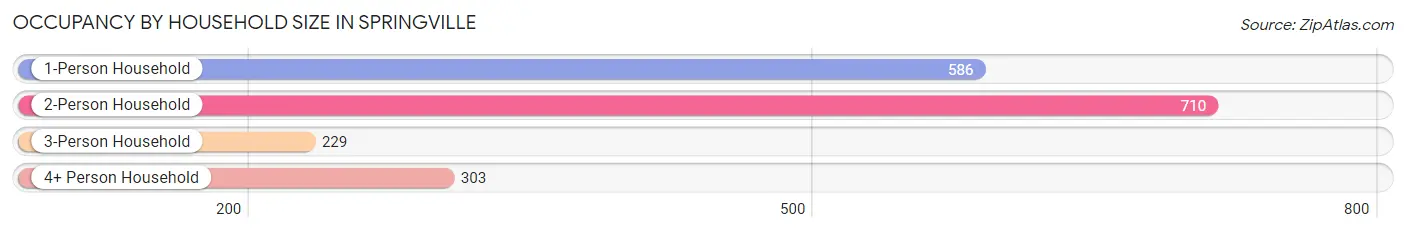
| Household Size | # Housing Units | % Housing Units |
| 1-Person Household | 586 | 32.1% |
| 2-Person Household | 710 | 38.8% |
| 3-Person Household | 229 | 12.5% |
| 4+ Person Household | 303 | 16.6% |
| Total Housing Units | 1,828 | 100.0% |
Occupancy by Ownership by Household Size in Springville
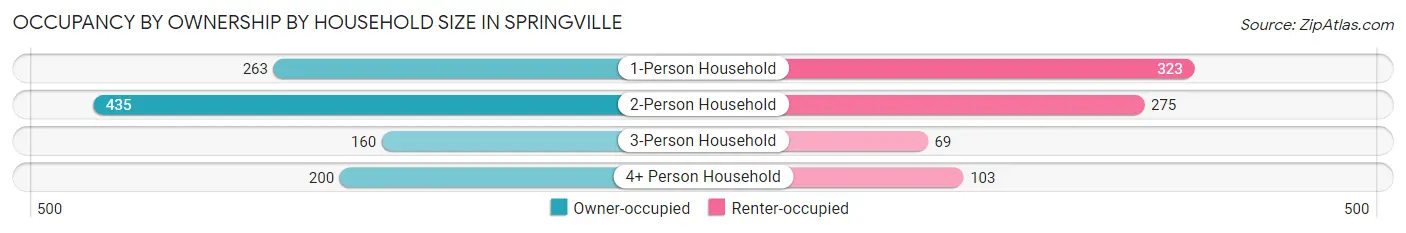
| Household Size | Owner-occupied | Renter-occupied |
| 1-Person Household | 263 (44.9%) | 323 (55.1%) |
| 2-Person Household | 435 (61.3%) | 275 (38.7%) |
| 3-Person Household | 160 (69.9%) | 69 (30.1%) |
| 4+ Person Household | 200 (66.0%) | 103 (34.0%) |
| Total Housing Units | 1,058 (57.9%) | 770 (42.1%) |
Occupancy by Educational Attainment in Springville
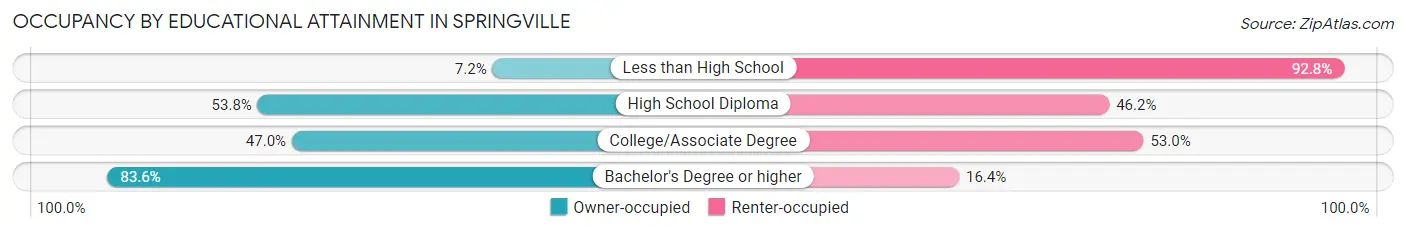
| Household Size | Owner-occupied | Renter-occupied |
| Less than High School | 6 (7.2%) | 77 (92.8%) |
| High School Diploma | 426 (53.8%) | 366 (46.2%) |
| College/Associate Degree | 219 (47.0%) | 247 (53.0%) |
| Bachelor's Degree or higher | 407 (83.6%) | 80 (16.4%) |
Occupancy by Age of Householder in Springville
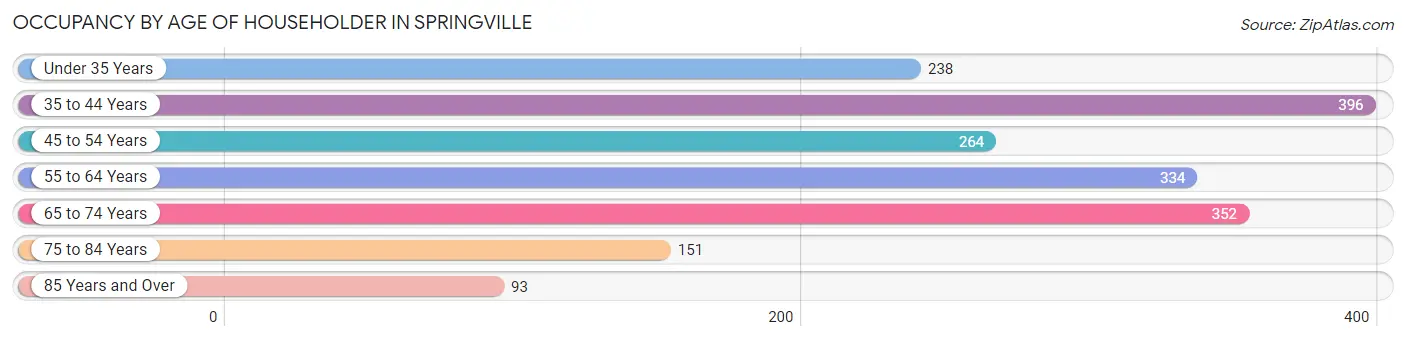
| Age Bracket | # Households | % Households |
| Under 35 Years | 238 | 13.0% |
| 35 to 44 Years | 396 | 21.7% |
| 45 to 54 Years | 264 | 14.4% |
| 55 to 64 Years | 334 | 18.3% |
| 65 to 74 Years | 352 | 19.3% |
| 75 to 84 Years | 151 | 8.3% |
| 85 Years and Over | 93 | 5.1% |
| Total | 1,828 | 100.0% |
Housing Finances in Springville
Median Income by Occupancy in Springville
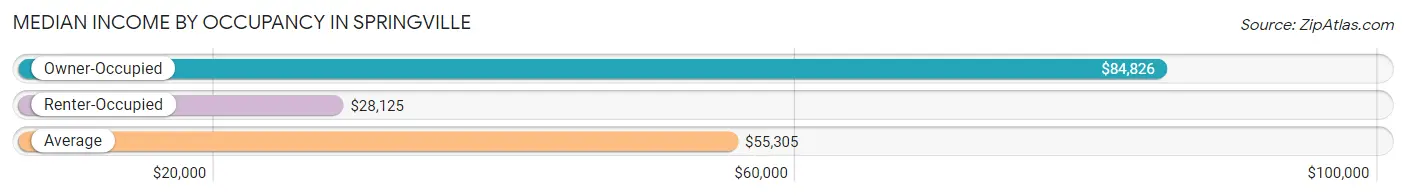
| Occupancy Type | # Households | Median Income |
| Owner-Occupied | 1,058 (57.9%) | $84,826 |
| Renter-Occupied | 770 (42.1%) | $28,125 |
| Average | 1,828 (100.0%) | $55,305 |
Occupancy by Householder Income Bracket in Springville
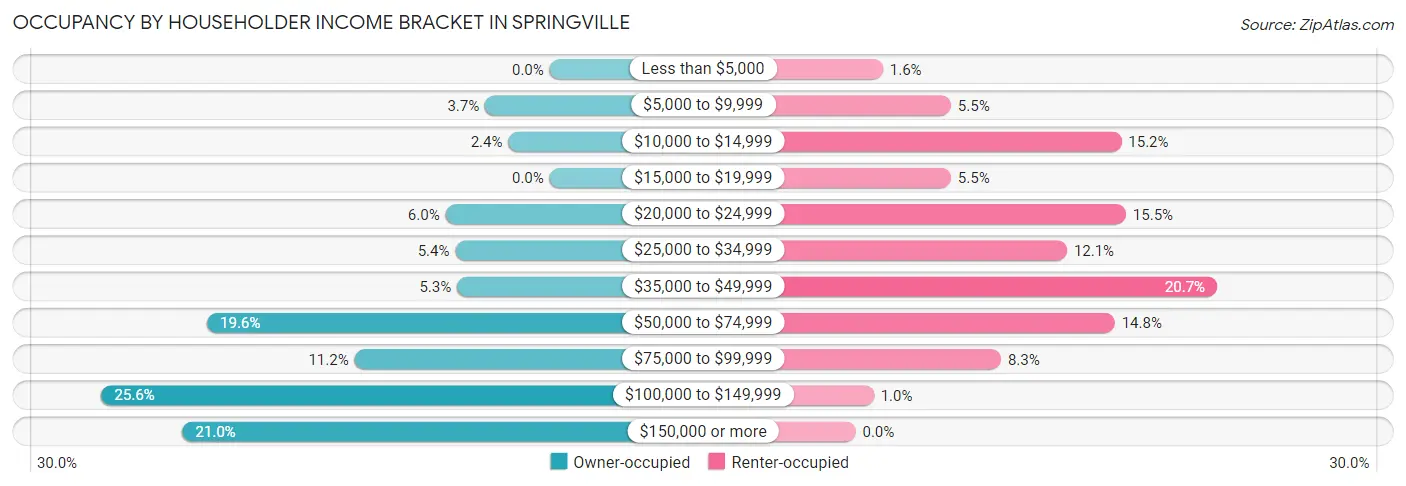
| Income Bracket | Owner-occupied | Renter-occupied |
| Less than $5,000 | 0 (0.0%) | 12 (1.6%) |
| $5,000 to $9,999 | 39 (3.7%) | 42 (5.4%) |
| $10,000 to $14,999 | 25 (2.4%) | 117 (15.2%) |
| $15,000 to $19,999 | 0 (0.0%) | 42 (5.4%) |
| $20,000 to $24,999 | 63 (5.9%) | 119 (15.4%) |
| $25,000 to $34,999 | 57 (5.4%) | 93 (12.1%) |
| $35,000 to $49,999 | 56 (5.3%) | 159 (20.6%) |
| $50,000 to $74,999 | 207 (19.6%) | 114 (14.8%) |
| $75,000 to $99,999 | 118 (11.2%) | 64 (8.3%) |
| $100,000 to $149,999 | 271 (25.6%) | 8 (1.0%) |
| $150,000 or more | 222 (21.0%) | 0 (0.0%) |
| Total | 1,058 (100.0%) | 770 (100.0%) |
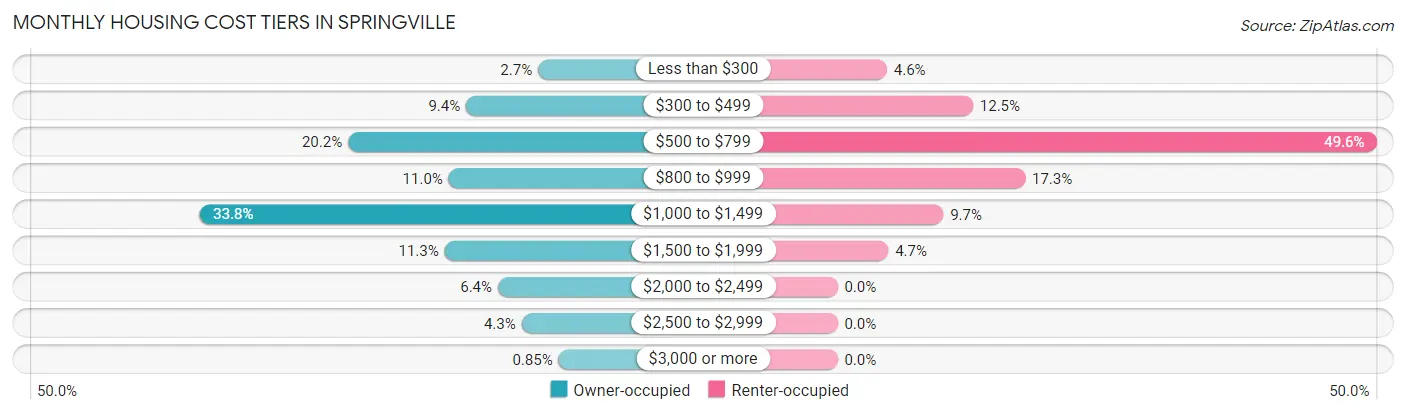
Monthly Housing Cost Tiers in Springville
| Monthly Cost | Owner-occupied | Renter-occupied |
| Less than $300 | 29 (2.7%) | 35 (4.5%) |
| $300 to $499 | 99 (9.4%) | 96 (12.5%) |
| $500 to $799 | 214 (20.2%) | 382 (49.6%) |
| $800 to $999 | 116 (11.0%) | 133 (17.3%) |
| $1,000 to $1,499 | 358 (33.8%) | 75 (9.7%) |
| $1,500 to $1,999 | 120 (11.3%) | 36 (4.7%) |
| $2,000 to $2,499 | 68 (6.4%) | 0 (0.0%) |
| $2,500 to $2,999 | 45 (4.3%) | 0 (0.0%) |
| $3,000 or more | 9 (0.9%) | 0 (0.0%) |
| Total | 1,058 (100.0%) | 770 (100.0%) |
Physical Housing Characteristics in Springville
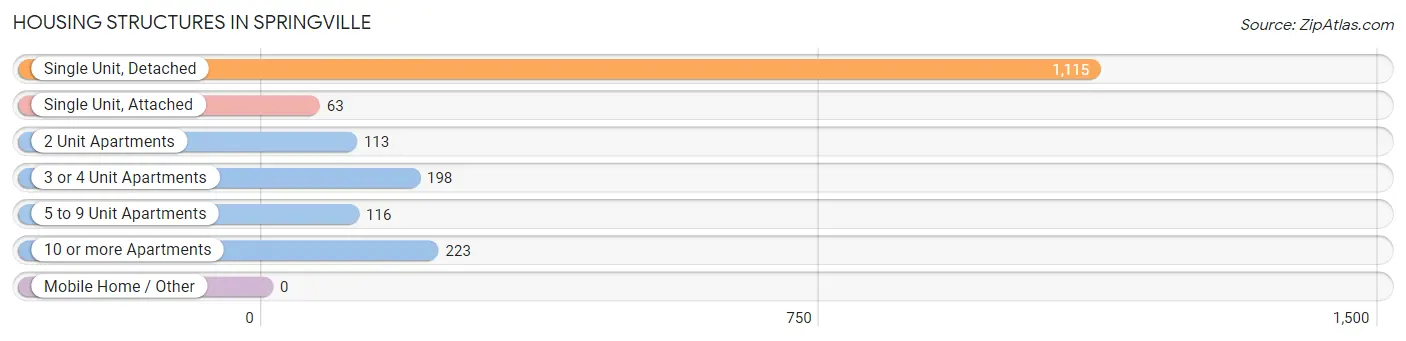
Housing Structures in Springville
| Structure Type | # Housing Units | % Housing Units |
| Single Unit, Detached | 1,115 | 61.0% |
| Single Unit, Attached | 63 | 3.5% |
| 2 Unit Apartments | 113 | 6.2% |
| 3 or 4 Unit Apartments | 198 | 10.8% |
| 5 to 9 Unit Apartments | 116 | 6.4% |
| 10 or more Apartments | 223 | 12.2% |
| Mobile Home / Other | 0 | 0.0% |
| Total | 1,828 | 100.0% |
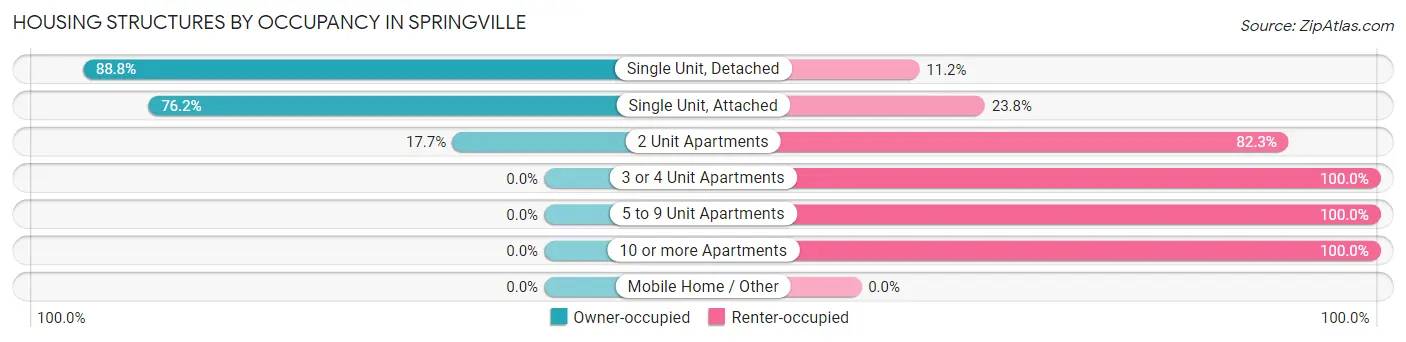
Housing Structures by Occupancy in Springville
| Structure Type | Owner-occupied | Renter-occupied |
| Single Unit, Detached | 990 (88.8%) | 125 (11.2%) |
| Single Unit, Attached | 48 (76.2%) | 15 (23.8%) |
| 2 Unit Apartments | 20 (17.7%) | 93 (82.3%) |
| 3 or 4 Unit Apartments | 0 (0.0%) | 198 (100.0%) |
| 5 to 9 Unit Apartments | 0 (0.0%) | 116 (100.0%) |
| 10 or more Apartments | 0 (0.0%) | 223 (100.0%) |
| Mobile Home / Other | 0 (0.0%) | 0 (0.0%) |
| Total | 1,058 (57.9%) | 770 (42.1%) |
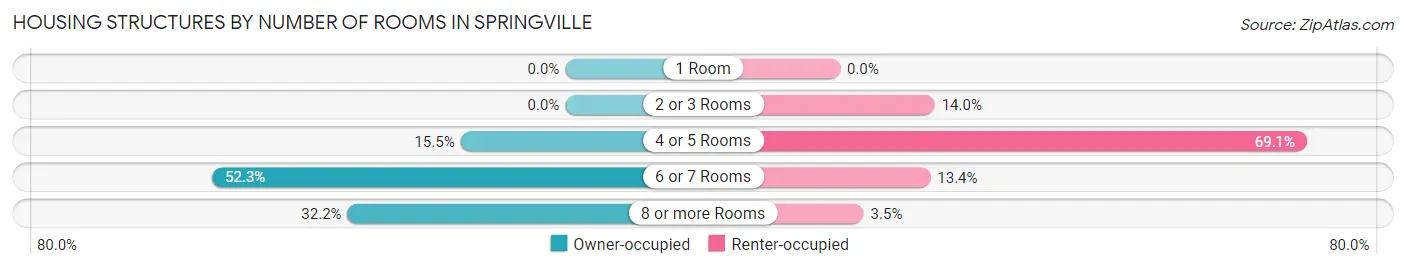
Housing Structures by Number of Rooms in Springville
| Number of Rooms | Owner-occupied | Renter-occupied |
| 1 Room | 0 (0.0%) | 0 (0.0%) |
| 2 or 3 Rooms | 0 (0.0%) | 108 (14.0%) |
| 4 or 5 Rooms | 164 (15.5%) | 532 (69.1%) |
| 6 or 7 Rooms | 553 (52.3%) | 103 (13.4%) |
| 8 or more Rooms | 341 (32.2%) | 27 (3.5%) |
| Total | 1,058 (100.0%) | 770 (100.0%) |
Housing Structure by Heating Type in Springville
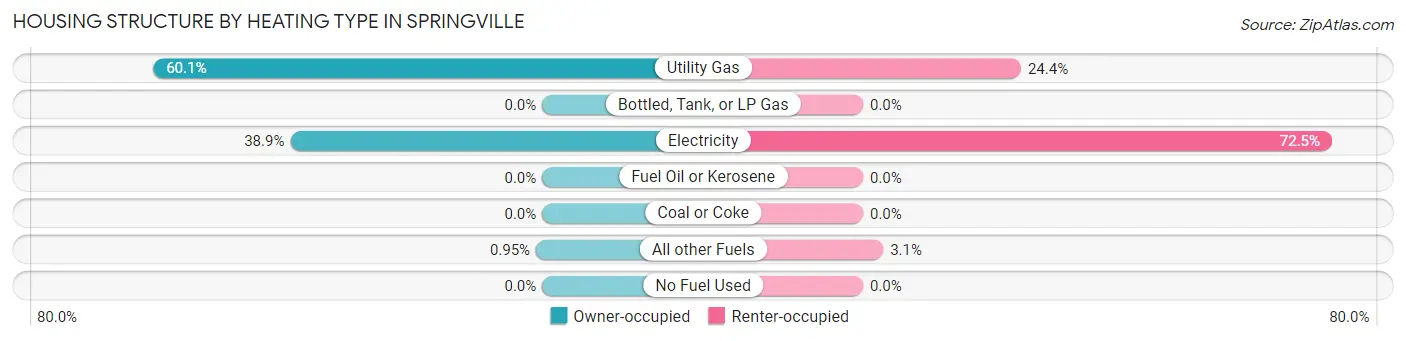
| Heating Type | Owner-occupied | Renter-occupied |
| Utility Gas | 636 (60.1%) | 188 (24.4%) |
| Bottled, Tank, or LP Gas | 0 (0.0%) | 0 (0.0%) |
| Electricity | 412 (38.9%) | 558 (72.5%) |
| Fuel Oil or Kerosene | 0 (0.0%) | 0 (0.0%) |
| Coal or Coke | 0 (0.0%) | 0 (0.0%) |
| All other Fuels | 10 (0.9%) | 24 (3.1%) |
| No Fuel Used | 0 (0.0%) | 0 (0.0%) |
| Total | 1,058 (100.0%) | 770 (100.0%) |
Household Vehicle Usage in Springville
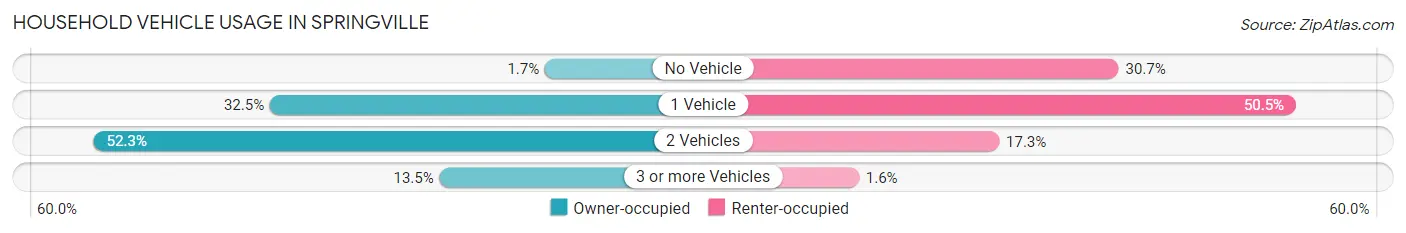
| Vehicles per Household | Owner-occupied | Renter-occupied |
| No Vehicle | 18 (1.7%) | 236 (30.6%) |
| 1 Vehicle | 344 (32.5%) | 389 (50.5%) |
| 2 Vehicles | 553 (52.3%) | 133 (17.3%) |
| 3 or more Vehicles | 143 (13.5%) | 12 (1.6%) |
| Total | 1,058 (100.0%) | 770 (100.0%) |
Real Estate & Mortgages in Springville
Real Estate and Mortgage Overview in Springville
| Characteristic | Without Mortgage | With Mortgage |
| Housing Units | 373 | 685 |
| Median Property Value | $157,100 | $169,400 |
| Median Household Income | $54,464 | $189 |
| Monthly Housing Costs | $551 | $9 |
| Real Estate Taxes | $3,163 | $22 |
Property Value by Mortgage Status in Springville
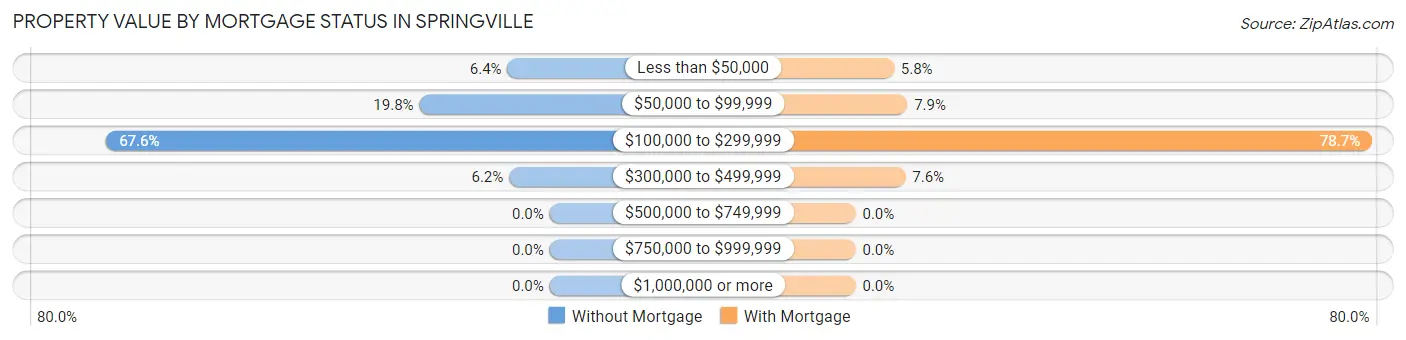
| Property Value | Without Mortgage | With Mortgage |
| Less than $50,000 | 24 (6.4%) | 40 (5.8%) |
| $50,000 to $99,999 | 74 (19.8%) | 54 (7.9%) |
| $100,000 to $299,999 | 252 (67.6%) | 539 (78.7%) |
| $300,000 to $499,999 | 23 (6.2%) | 52 (7.6%) |
| $500,000 to $749,999 | 0 (0.0%) | 0 (0.0%) |
| $750,000 to $999,999 | 0 (0.0%) | 0 (0.0%) |
| $1,000,000 or more | 0 (0.0%) | 0 (0.0%) |
| Total | 373 (100.0%) | 685 (100.0%) |
Household Income by Mortgage Status in Springville
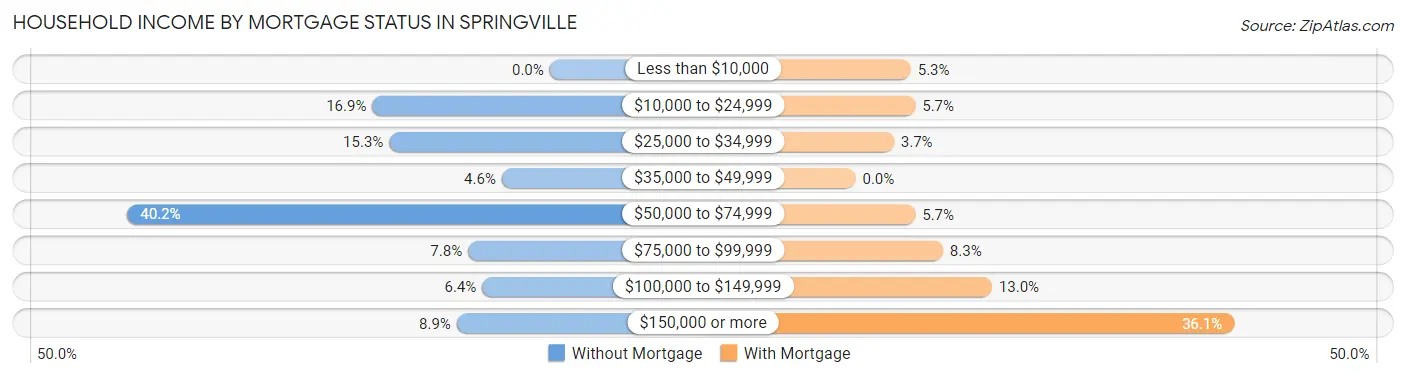
| Household Income | Without Mortgage | With Mortgage |
| Less than $10,000 | 0 (0.0%) | 36 (5.3%) |
| $10,000 to $24,999 | 63 (16.9%) | 39 (5.7%) |
| $25,000 to $34,999 | 57 (15.3%) | 25 (3.6%) |
| $35,000 to $49,999 | 17 (4.6%) | 0 (0.0%) |
| $50,000 to $74,999 | 150 (40.2%) | 39 (5.7%) |
| $75,000 to $99,999 | 29 (7.8%) | 57 (8.3%) |
| $100,000 to $149,999 | 24 (6.4%) | 89 (13.0%) |
| $150,000 or more | 33 (8.8%) | 247 (36.1%) |
| Total | 373 (100.0%) | 685 (100.0%) |
Property Value to Household Income Ratio in Springville
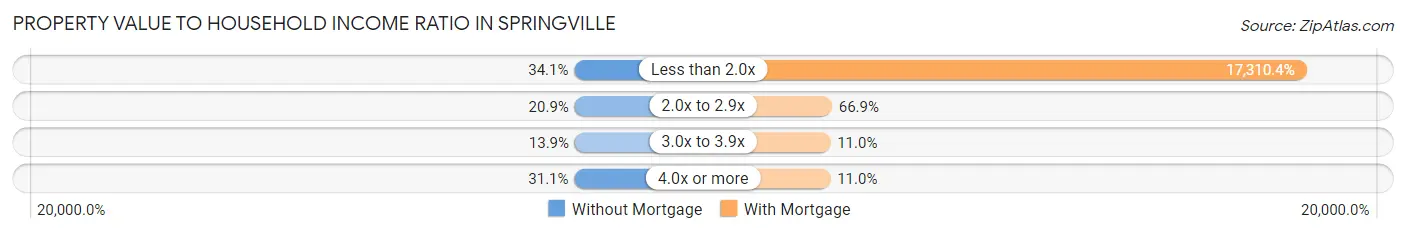
| Value-to-Income Ratio | Without Mortgage | With Mortgage |
| Less than 2.0x | 127 (34.1%) | 118,576 (17,310.4%) |
| 2.0x to 2.9x | 78 (20.9%) | 458 (66.9%) |
| 3.0x to 3.9x | 52 (13.9%) | 75 (11.0%) |
| 4.0x or more | 116 (31.1%) | 75 (11.0%) |
| Total | 373 (100.0%) | 685 (100.0%) |
Real Estate Taxes by Mortgage Status in Springville
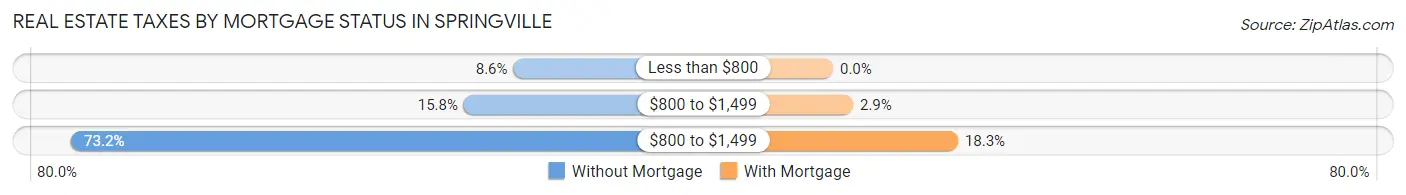
| Property Taxes | Without Mortgage | With Mortgage |
| Less than $800 | 32 (8.6%) | 0 (0.0%) |
| $800 to $1,499 | 59 (15.8%) | 20 (2.9%) |
| $800 to $1,499 | 273 (73.2%) | 125 (18.2%) |
| Total | 373 (100.0%) | 685 (100.0%) |
Health & Disability in Springville
Health Insurance Coverage by Age in Springville
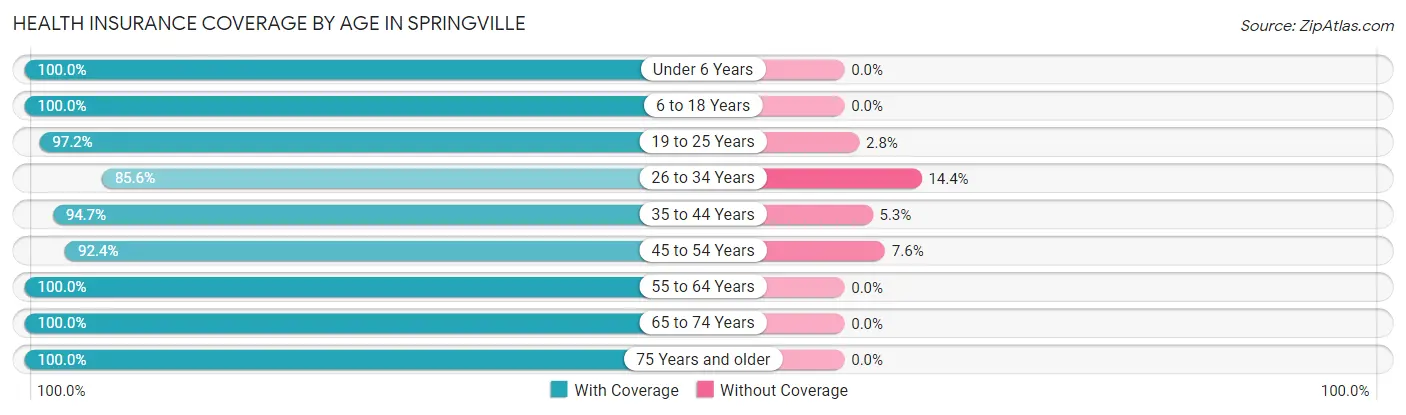
| Age Bracket | With Coverage | Without Coverage |
| Under 6 Years | 315 (100.0%) | 0 (0.0%) |
| 6 to 18 Years | 647 (100.0%) | 0 (0.0%) |
| 19 to 25 Years | 282 (97.2%) | 8 (2.8%) |
| 26 to 34 Years | 369 (85.6%) | 62 (14.4%) |
| 35 to 44 Years | 521 (94.7%) | 29 (5.3%) |
| 45 to 54 Years | 452 (92.4%) | 37 (7.6%) |
| 55 to 64 Years | 554 (100.0%) | 0 (0.0%) |
| 65 to 74 Years | 512 (100.0%) | 0 (0.0%) |
| 75 Years and older | 310 (100.0%) | 0 (0.0%) |
| Total | 3,962 (96.7%) | 136 (3.3%) |
Health Insurance Coverage by Citizenship Status in Springville
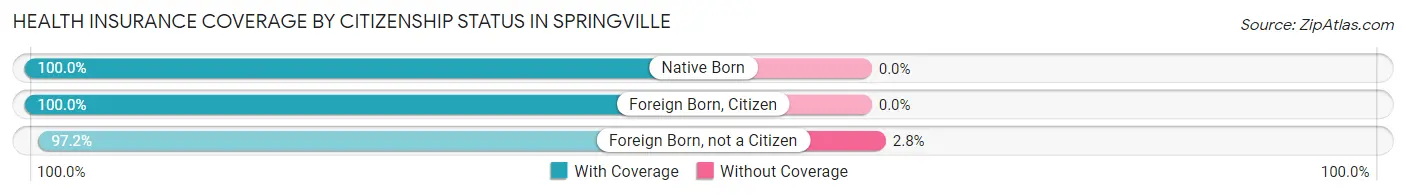
| Citizenship Status | With Coverage | Without Coverage |
| Native Born | 315 (100.0%) | 0 (0.0%) |
| Foreign Born, Citizen | 647 (100.0%) | 0 (0.0%) |
| Foreign Born, not a Citizen | 282 (97.2%) | 8 (2.8%) |
Health Insurance Coverage by Household Income in Springville
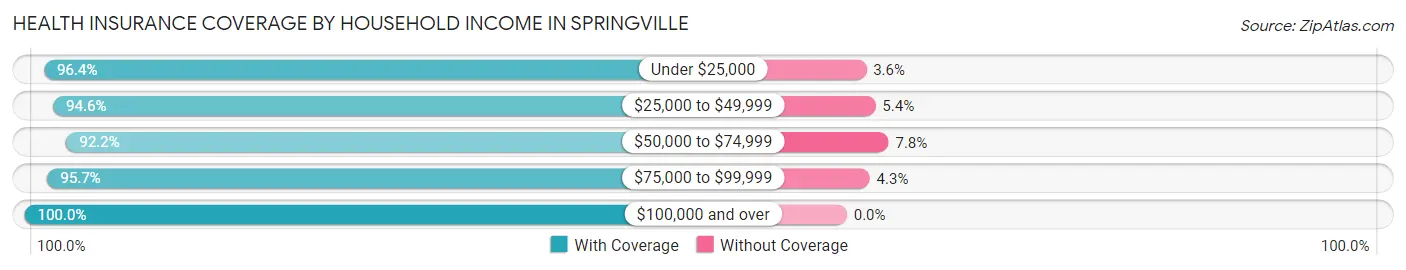
| Household Income | With Coverage | Without Coverage |
| Under $25,000 | 662 (96.4%) | 25 (3.6%) |
| $25,000 to $49,999 | 865 (94.6%) | 49 (5.4%) |
| $50,000 to $74,999 | 519 (92.2%) | 44 (7.8%) |
| $75,000 to $99,999 | 403 (95.7%) | 18 (4.3%) |
| $100,000 and over | 1,474 (100.0%) | 0 (0.0%) |
Public vs Private Health Insurance Coverage by Age in Springville
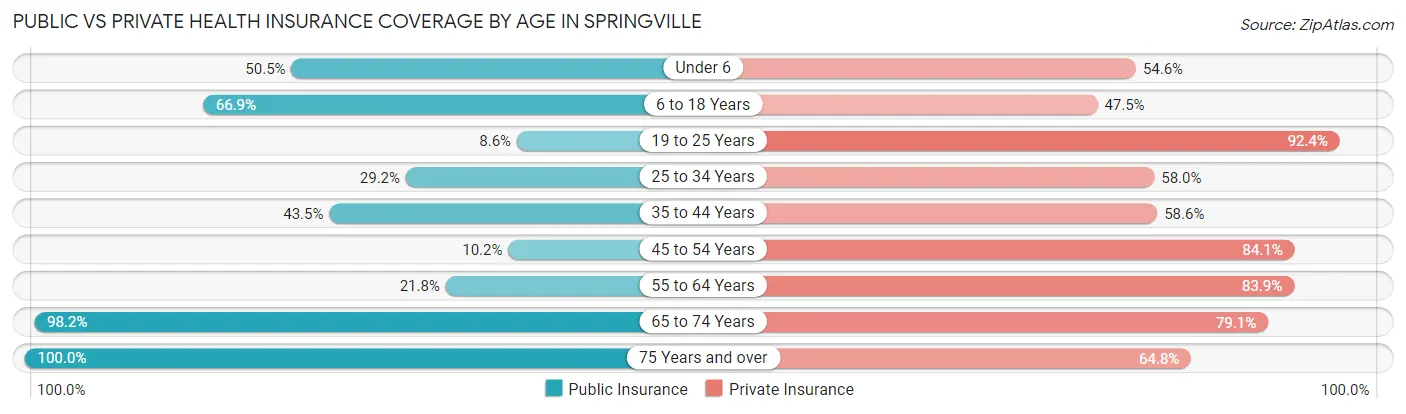
| Age Bracket | Public Insurance | Private Insurance |
| Under 6 | 159 (50.5%) | 172 (54.6%) |
| 6 to 18 Years | 433 (66.9%) | 307 (47.4%) |
| 19 to 25 Years | 25 (8.6%) | 268 (92.4%) |
| 25 to 34 Years | 126 (29.2%) | 250 (58.0%) |
| 35 to 44 Years | 239 (43.4%) | 322 (58.6%) |
| 45 to 54 Years | 50 (10.2%) | 411 (84.1%) |
| 55 to 64 Years | 121 (21.8%) | 465 (83.9%) |
| 65 to 74 Years | 503 (98.2%) | 405 (79.1%) |
| 75 Years and over | 310 (100.0%) | 201 (64.8%) |
| Total | 1,966 (48.0%) | 2,801 (68.3%) |
Disability Status by Sex by Age in Springville
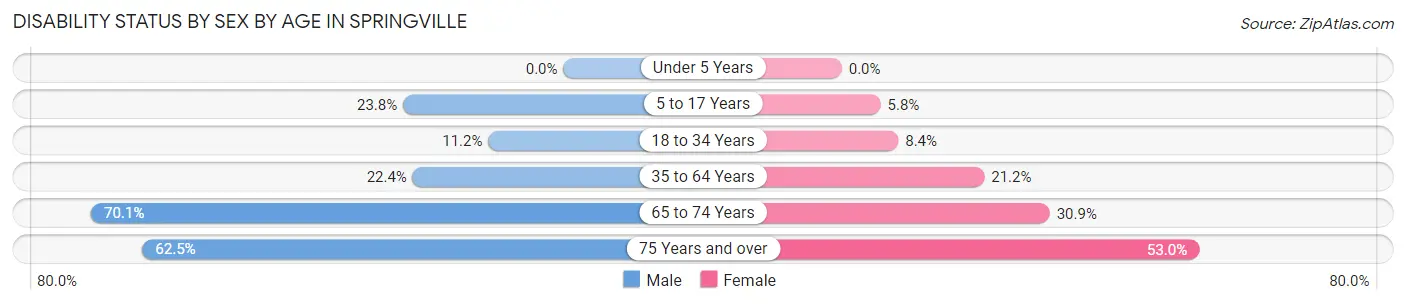
| Age Bracket | Male | Female |
| Under 5 Years | 0 (0.0%) | 0 (0.0%) |
| 5 to 17 Years | 90 (23.8%) | 20 (5.8%) |
| 18 to 34 Years | 32 (11.2%) | 39 (8.4%) |
| 35 to 64 Years | 183 (22.4%) | 164 (21.2%) |
| 65 to 74 Years | 216 (70.1%) | 63 (30.9%) |
| 75 Years and over | 50 (62.5%) | 122 (53.0%) |
Disability Class by Sex by Age in Springville
Disability Class: Hearing Difficulty
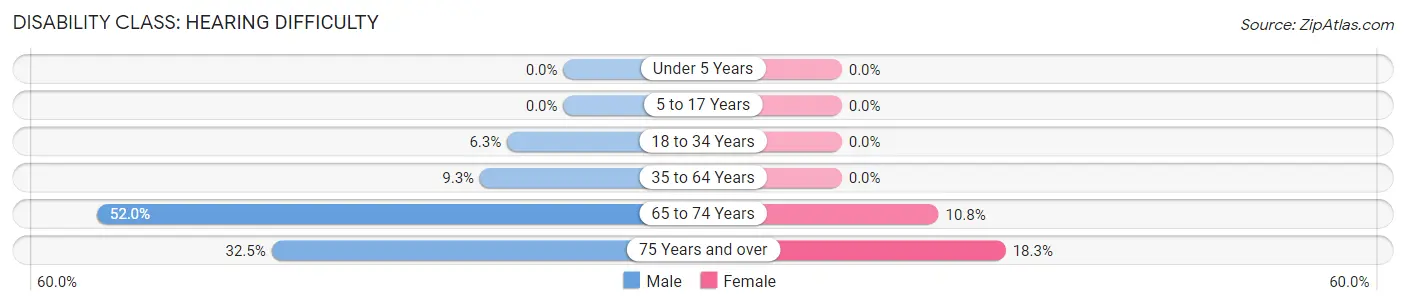
| Age Bracket | Male | Female |
| Under 5 Years | 0 (0.0%) | 0 (0.0%) |
| 5 to 17 Years | 0 (0.0%) | 0 (0.0%) |
| 18 to 34 Years | 18 (6.3%) | 0 (0.0%) |
| 35 to 64 Years | 76 (9.3%) | 0 (0.0%) |
| 65 to 74 Years | 160 (51.9%) | 22 (10.8%) |
| 75 Years and over | 26 (32.5%) | 42 (18.3%) |
Disability Class: Vision Difficulty
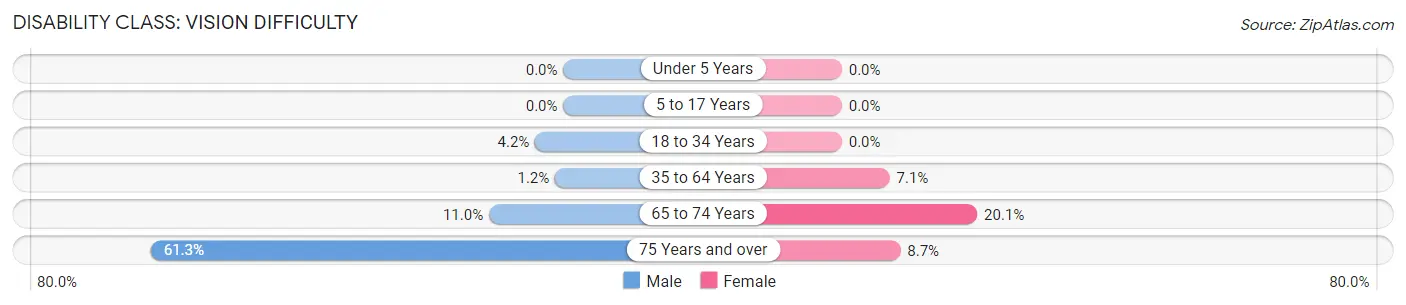
| Age Bracket | Male | Female |
| Under 5 Years | 0 (0.0%) | 0 (0.0%) |
| 5 to 17 Years | 0 (0.0%) | 0 (0.0%) |
| 18 to 34 Years | 12 (4.2%) | 0 (0.0%) |
| 35 to 64 Years | 10 (1.2%) | 55 (7.1%) |
| 65 to 74 Years | 34 (11.0%) | 41 (20.1%) |
| 75 Years and over | 49 (61.3%) | 20 (8.7%) |
Disability Class: Cognitive Difficulty
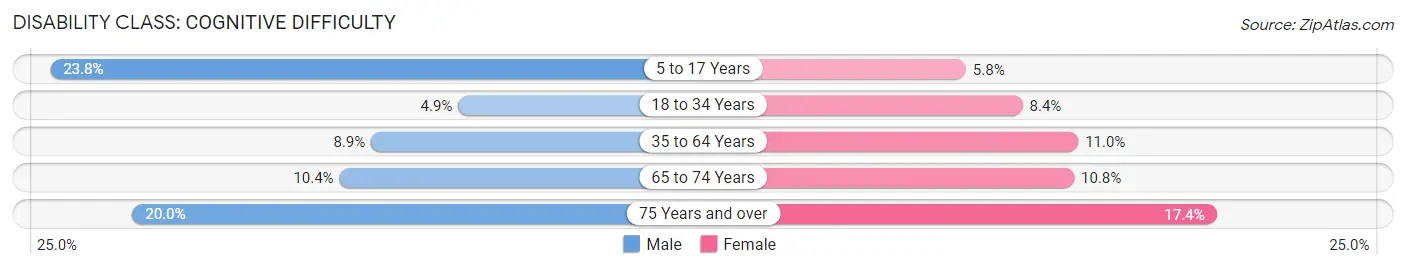
| Age Bracket | Male | Female |
| 5 to 17 Years | 90 (23.8%) | 20 (5.8%) |
| 18 to 34 Years | 14 (4.9%) | 39 (8.4%) |
| 35 to 64 Years | 73 (8.9%) | 85 (11.0%) |
| 65 to 74 Years | 32 (10.4%) | 22 (10.8%) |
| 75 Years and over | 16 (20.0%) | 40 (17.4%) |
Disability Class: Ambulatory Difficulty
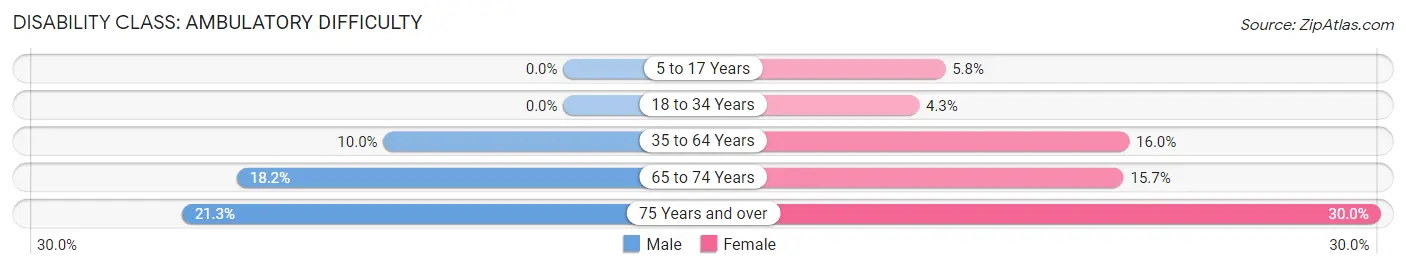
| Age Bracket | Male | Female |
| 5 to 17 Years | 0 (0.0%) | 20 (5.8%) |
| 18 to 34 Years | 0 (0.0%) | 20 (4.3%) |
| 35 to 64 Years | 82 (10.0%) | 124 (16.0%) |
| 65 to 74 Years | 56 (18.2%) | 32 (15.7%) |
| 75 Years and over | 17 (21.2%) | 69 (30.0%) |
Disability Class: Self-Care Difficulty
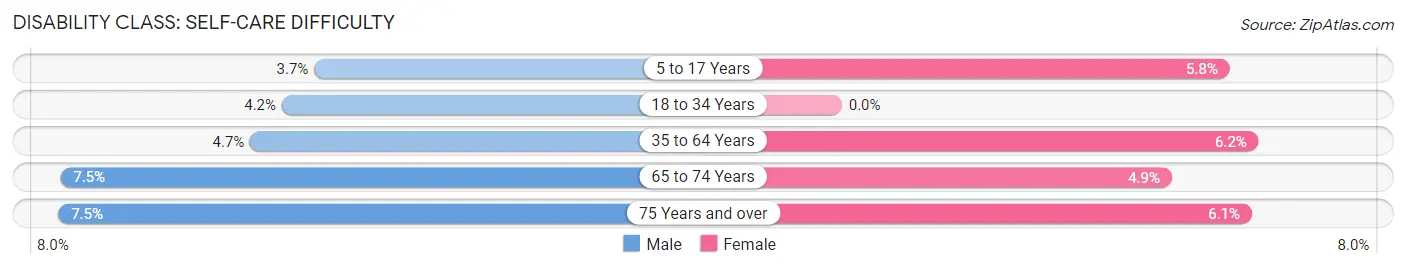
| Age Bracket | Male | Female |
| 5 to 17 Years | 14 (3.7%) | 20 (5.8%) |
| 18 to 34 Years | 12 (4.2%) | 0 (0.0%) |
| 35 to 64 Years | 38 (4.6%) | 48 (6.2%) |
| 65 to 74 Years | 23 (7.5%) | 10 (4.9%) |
| 75 Years and over | 6 (7.5%) | 14 (6.1%) |
Technology Access in Springville
Computing Device Access in Springville
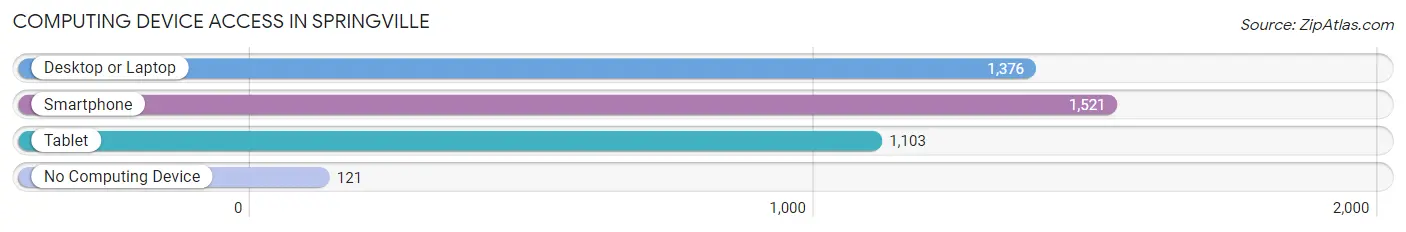
| Device Type | # Households | % Households |
| Desktop or Laptop | 1,376 | 75.3% |
| Smartphone | 1,521 | 83.2% |
| Tablet | 1,103 | 60.3% |
| No Computing Device | 121 | 6.6% |
| Total | 1,828 | 100.0% |
Internet Access in Springville
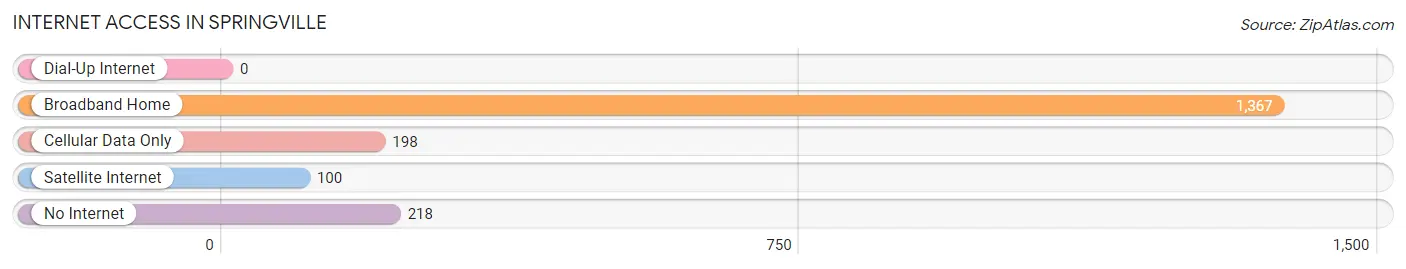
| Internet Type | # Households | % Households |
| Dial-Up Internet | 0 | 0.0% |
| Broadband Home | 1,367 | 74.8% |
| Cellular Data Only | 198 | 10.8% |
| Satellite Internet | 100 | 5.5% |
| No Internet | 218 | 11.9% |
| Total | 1,828 | 100.0% |
Springville Summary
History
The town of Springville, New York is located in the south-central part of the state, in Erie County. It is part of the Buffalo-Niagara Falls metropolitan area. The town was first settled in 1804 by a group of settlers from Connecticut. The town was originally known as "Cold Spring," but was later changed to Springville in 1818.
The town was an important stop on the Underground Railroad, with many of the town's residents helping to hide and transport escaped slaves. The town was also home to a number of mills, including a grist mill, a saw mill, and a woolen mill. These mills provided employment for many of the town's residents.
The town was also home to a number of churches, including the First Presbyterian Church, which was founded in 1820. The town also had a number of schools, including the Springville Academy, which was founded in 1824.
Geography
Springville is located in the south-central part of Erie County, New York. It is bordered by the towns of Concord to the north, Colden to the east, Boston to the south, and Sardinia to the west. The town is located in the foothills of the Appalachian Mountains, and is part of the Buffalo-Niagara Falls metropolitan area.
The town has a total area of 33.2 square miles, of which 33.1 square miles is land and 0.1 square miles is water. The town is located in the Finger Lakes region of New York, and is home to a number of lakes, including Cazenovia Lake, Ellicott Creek, and Springville Lake.
Economy
The economy of Springville is largely based on agriculture and tourism. The town is home to a number of farms, which produce a variety of crops, including corn, soybeans, and hay. The town is also home to a number of wineries, which produce a variety of wines.
The town is also home to a number of businesses, including manufacturing, retail, and service industries. The town is home to a number of restaurants, as well as a number of shops and stores. The town is also home to a number of hotels and motels, which cater to tourists visiting the area.
Demographics
As of the 2010 census, the town of Springville had a population of 5,919. The racial makeup of the town was 97.2% White, 0.7% African American, 0.3% Native American, 0.4% Asian, 0.1% Pacific Islander, 0.3% from other races, and 1.0% from two or more races. Hispanic or Latino of any race were 1.7% of the population.
The median household income in the town was $50,945, and the median family income was $60,917. The per capita income for the town was $24,945. About 6.2% of families and 8.3% of the population were below the poverty line, including 10.2% of those under age 18 and 5.2% of those age 65 or over.
Common Questions
What is Per Capita Income in Springville?
Per Capita income in Springville is $33,248.
What is the Median Family Income in Springville?
Median Family Income in Springville is $78,839.
What is the Median Household income in Springville?
Median Household Income in Springville is $55,305.
What is Income or Wage Gap in Springville?
Income or Wage Gap in Springville is 23.8%.
Women in Springville earn 76.2 cents for every dollar earned by a man.
What is Family Income Deficit in Springville?
Family Income Deficit in Springville is $10,744.
Families that are below poverty line in Springville earn $10,744 less on average than the poverty threshold level.
What is Inequality or Gini Index in Springville?
Inequality or Gini Index in Springville is 0.44.
What is the Total Population of Springville?
Total Population of Springville is 4,223.
What is the Total Male Population of Springville?
Total Male Population of Springville is 2,062.
What is the Total Female Population of Springville?
Total Female Population of Springville is 2,161.
What is the Ratio of Males per 100 Females in Springville?
There are 95.42 Males per 100 Females in Springville.
What is the Ratio of Females per 100 Males in Springville?
There are 104.80 Females per 100 Males in Springville.
What is the Median Population Age in Springville?
Median Population Age in Springville is 41.7 Years.
What is the Average Family Size in Springville
Average Family Size in Springville is 2.8 People.
What is the Average Household Size in Springville
Average Household Size in Springville is 2.2 People.
How Large is the Labor Force in Springville?
There are 1,976 People in the Labor Forcein in Springville.
What is the Percentage of People in the Labor Force in Springville?
58.7% of People are in the Labor Force in Springville.
What is the Unemployment Rate in Springville?
Unemployment Rate in Springville is 4.9%.