Canastota, NY Map & Demographics
Canastota Map
Canastota Overview
$31,410
PER CAPITA INCOME
$75,815
AVG FAMILY INCOME
$69,541
AVG HOUSEHOLD INCOME
34.7%
WAGE / INCOME GAP [ % ]
65.3¢/ $1
WAGE / INCOME GAP [ $ ]
0.37
INEQUALITY / GINI INDEX
4,550
TOTAL POPULATION
2,212
MALE POPULATION
2,338
FEMALE POPULATION
94.61
MALES / 100 FEMALES
105.70
FEMALES / 100 MALES
43.4
MEDIAN AGE
3.1
AVG FAMILY SIZE
2.5
AVG HOUSEHOLD SIZE
2,467
LABOR FORCE [ PEOPLE ]
69.6%
PERCENT IN LABOR FORCE
3.3%
UNEMPLOYMENT RATE
Canastota Zip Codes
Canastota Area Codes
Income in Canastota
Income Overview in Canastota
Per Capita Income in Canastota is $31,410, while median incomes of families and households are $75,815 and $69,541 respectively.
| Characteristic | Number | Measure |
| Per Capita Income | 4,550 | $31,410 |
| Median Family Income | 1,081 | $75,815 |
| Mean Family Income | 1,081 | $88,416 |
| Median Household Income | 1,837 | $69,541 |
| Mean Household Income | 1,837 | $74,419 |
| Income Deficit | 1,081 | $0 |
| Wage / Income Gap (%) | 4,550 | 34.66% |
| Wage / Income Gap ($) | 4,550 | 65.34¢ per $1 |
| Gini / Inequality Index | 4,550 | 0.37 |
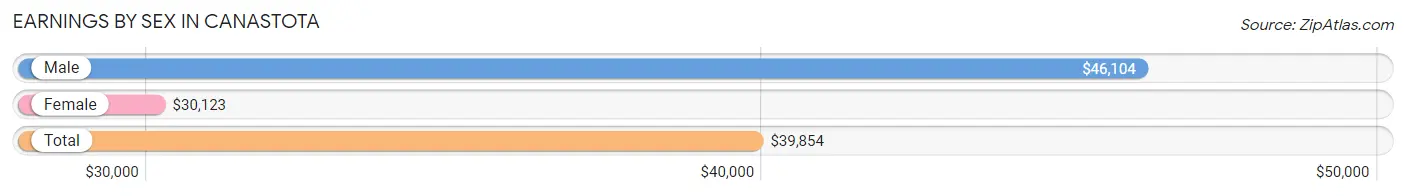
Earnings by Sex in Canastota
Average Earnings in Canastota are $39,854, $46,104 for men and $30,123 for women, a difference of 34.7%.
| Sex | Number | Average Earnings |
| Male | 1,194 (47.5%) | $46,104 |
| Female | 1,322 (52.5%) | $30,123 |
| Total | 2,516 (100.0%) | $39,854 |
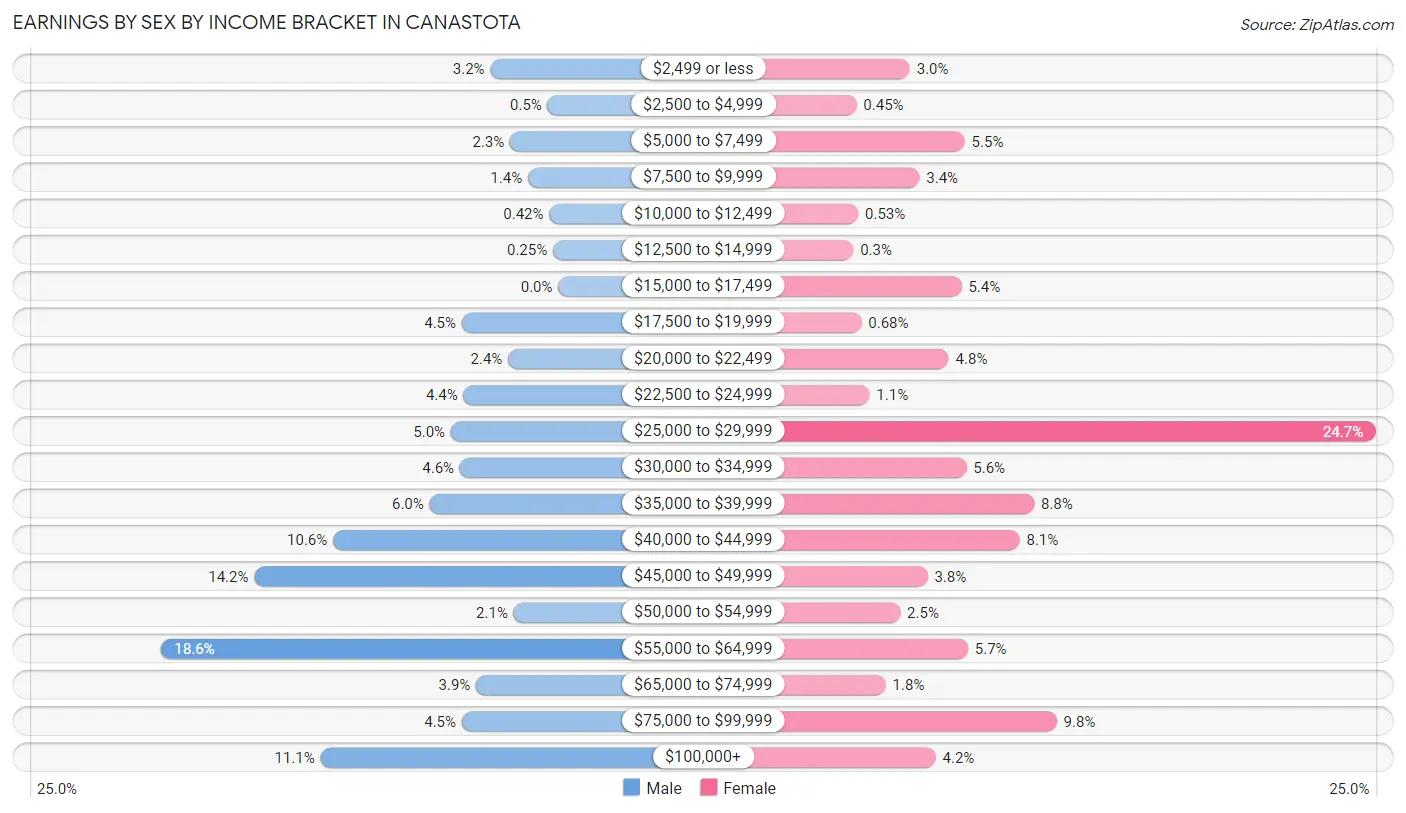
Earnings by Sex by Income Bracket in Canastota
The most common earnings brackets in Canastota are $55,000 to $64,999 for men (222 | 18.6%) and $25,000 to $29,999 for women (327 | 24.7%).
| Income | Male | Female |
| $2,499 or less | 38 (3.2%) | 39 (2.9%) |
| $2,500 to $4,999 | 6 (0.5%) | 6 (0.4%) |
| $5,000 to $7,499 | 27 (2.3%) | 73 (5.5%) |
| $7,500 to $9,999 | 17 (1.4%) | 45 (3.4%) |
| $10,000 to $12,499 | 5 (0.4%) | 7 (0.5%) |
| $12,500 to $14,999 | 3 (0.3%) | 4 (0.3%) |
| $15,000 to $17,499 | 0 (0.0%) | 71 (5.4%) |
| $17,500 to $19,999 | 54 (4.5%) | 9 (0.7%) |
| $20,000 to $22,499 | 28 (2.4%) | 63 (4.8%) |
| $22,500 to $24,999 | 53 (4.4%) | 14 (1.1%) |
| $25,000 to $29,999 | 60 (5.0%) | 327 (24.7%) |
| $30,000 to $34,999 | 55 (4.6%) | 74 (5.6%) |
| $35,000 to $39,999 | 72 (6.0%) | 116 (8.8%) |
| $40,000 to $44,999 | 126 (10.5%) | 107 (8.1%) |
| $45,000 to $49,999 | 170 (14.2%) | 50 (3.8%) |
| $50,000 to $54,999 | 25 (2.1%) | 33 (2.5%) |
| $55,000 to $64,999 | 222 (18.6%) | 75 (5.7%) |
| $65,000 to $74,999 | 46 (3.8%) | 24 (1.8%) |
| $75,000 to $99,999 | 54 (4.5%) | 130 (9.8%) |
| $100,000+ | 133 (11.1%) | 55 (4.2%) |
| Total | 1,194 (100.0%) | 1,322 (100.0%) |
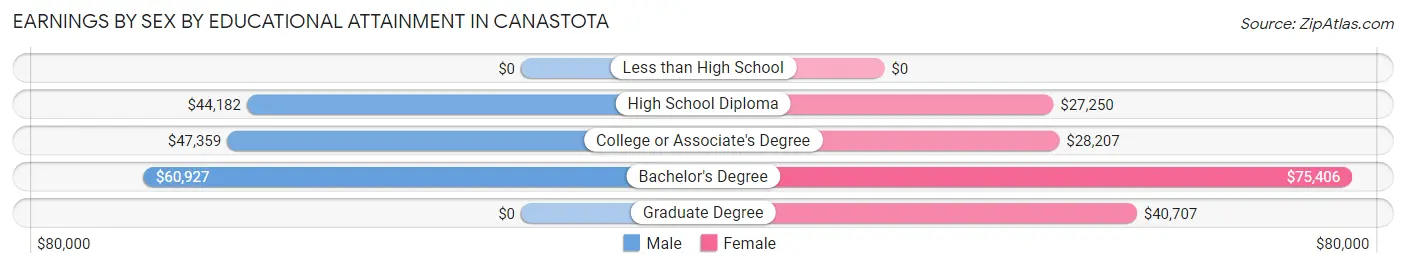
Earnings by Sex by Educational Attainment in Canastota
Average earnings in Canastota are $46,135 for men and $29,748 for women, a difference of 35.5%. Men with an educational attainment of bachelor's degree enjoy the highest average annual earnings of $60,927, while those with high school diploma education earn the least with $44,182. Women with an educational attainment of bachelor's degree earn the most with the average annual earnings of $75,406, while those with high school diploma education have the smallest earnings of $27,250.
| Educational Attainment | Male Income | Female Income |
| Less than High School | - | - |
| High School Diploma | $44,182 | $27,250 |
| College or Associate's Degree | $47,359 | $28,207 |
| Bachelor's Degree | $60,927 | $75,406 |
| Graduate Degree | - | - |
| Total | $46,135 | $29,748 |
Family Income in Canastota
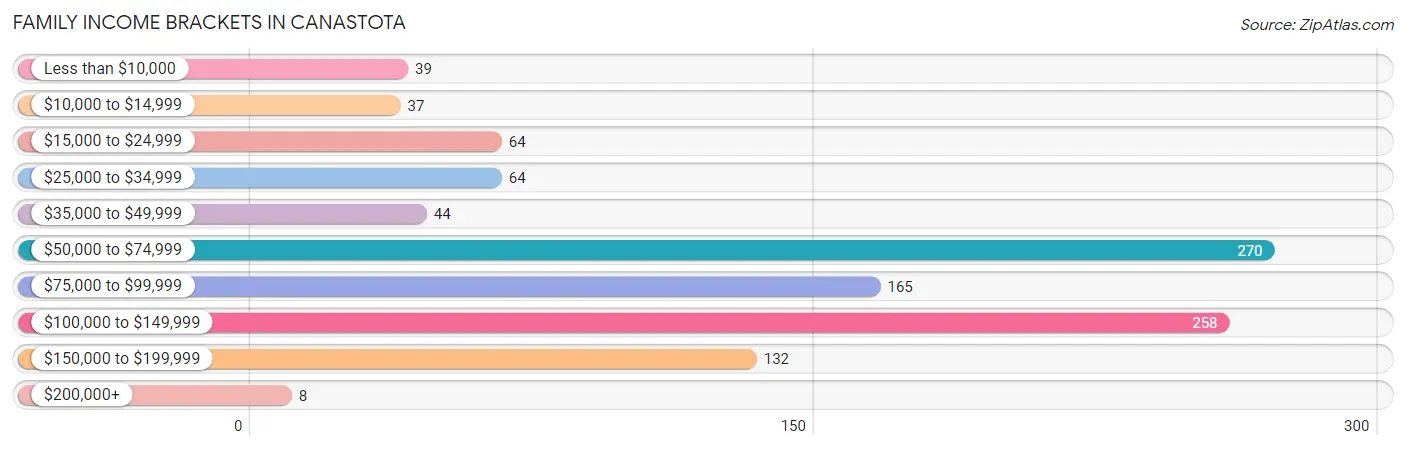
Family Income Brackets in Canastota
According to the Canastota family income data, there are 270 families falling into the $50,000 to $74,999 income range, which is the most common income bracket and makes up 25.0% of all families. Conversely, the $200,000+ income bracket is the least frequent group with only 8 families (0.7%) belonging to this category.
| Income Bracket | # Families | % Families |
| Less than $10,000 | 39 | 3.6% |
| $10,000 to $14,999 | 37 | 3.4% |
| $15,000 to $24,999 | 64 | 5.9% |
| $25,000 to $34,999 | 64 | 5.9% |
| $35,000 to $49,999 | 44 | 4.1% |
| $50,000 to $74,999 | 270 | 25.0% |
| $75,000 to $99,999 | 165 | 15.3% |
| $100,000 to $149,999 | 258 | 23.9% |
| $150,000 to $199,999 | 132 | 12.2% |
| $200,000+ | 8 | 0.7% |
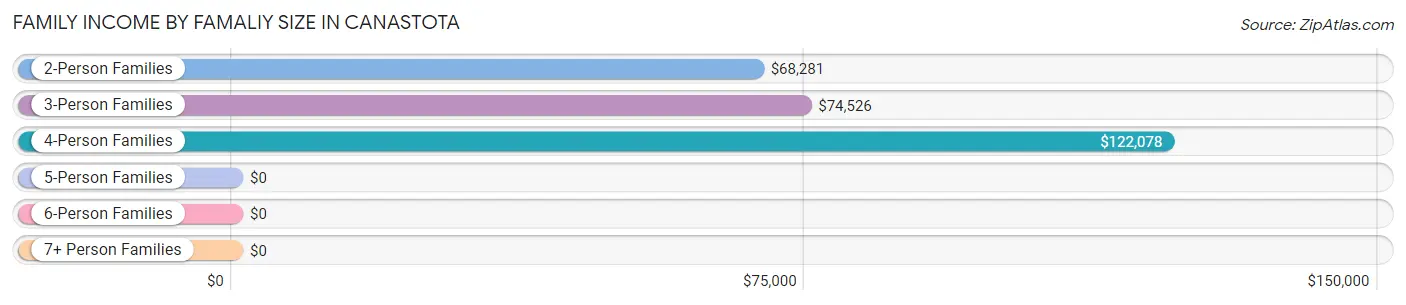
Family Income by Famaliy Size in Canastota
4-person families (307 | 28.4%) account for the highest median family income in Canastota with $122,078 per family, while 2-person families (367 | 34.0%) have the highest median income of $34,140 per family member.
| Income Bracket | # Families | Median Income |
| 2-Person Families | 367 (34.0%) | $68,281 |
| 3-Person Families | 349 (32.3%) | $74,526 |
| 4-Person Families | 307 (28.4%) | $122,078 |
| 5-Person Families | 26 (2.4%) | $0 |
| 6-Person Families | 32 (3.0%) | $0 |
| 7+ Person Families | 0 (0.0%) | $0 |
| Total | 1,081 (100.0%) | $75,815 |
Family Income by Number of Earners in Canastota
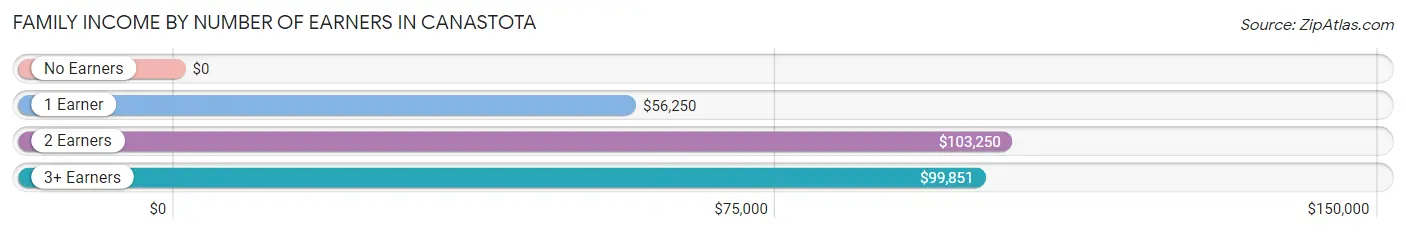
| Number of Earners | # Families | Median Income |
| No Earners | 120 (11.1%) | $0 |
| 1 Earner | 319 (29.5%) | $56,250 |
| 2 Earners | 549 (50.8%) | $103,250 |
| 3+ Earners | 93 (8.6%) | $99,851 |
| Total | 1,081 (100.0%) | $75,815 |
Household Income in Canastota
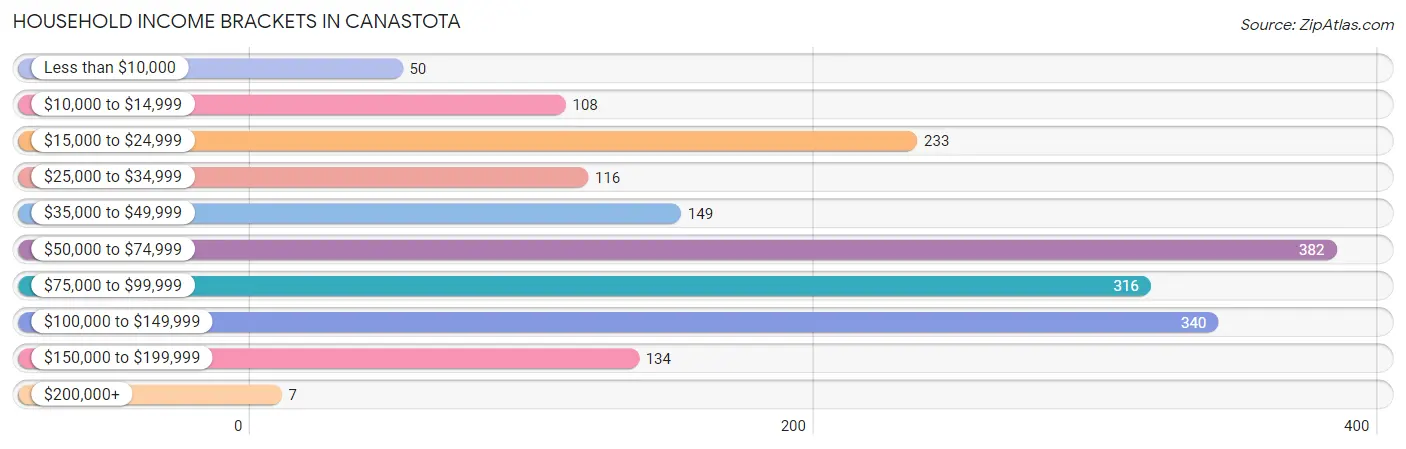
Household Income Brackets in Canastota
With 382 households falling in the category, the $50,000 to $74,999 income range is the most frequent in Canastota, accounting for 20.8% of all households. In contrast, only 7 households (0.4%) fall into the $200,000+ income bracket, making it the least populous group.
| Income Bracket | # Households | % Households |
| Less than $10,000 | 50 | 2.7% |
| $10,000 to $14,999 | 108 | 5.9% |
| $15,000 to $24,999 | 233 | 12.7% |
| $25,000 to $34,999 | 116 | 6.3% |
| $35,000 to $49,999 | 149 | 8.1% |
| $50,000 to $74,999 | 382 | 20.8% |
| $75,000 to $99,999 | 316 | 17.2% |
| $100,000 to $149,999 | 340 | 18.5% |
| $150,000 to $199,999 | 134 | 7.3% |
| $200,000+ | 7 | 0.4% |
Household Income by Householder Age in Canastota
The median household income in Canastota is $69,541, with the highest median household income of $82,038 found in the 45 to 64 years age bracket for the primary householder. A total of 781 households (42.5%) fall into this category. Meanwhile, the 15 to 24 years age bracket for the primary householder has the lowest median household income of $0, with 39 households (2.1%) in this group.
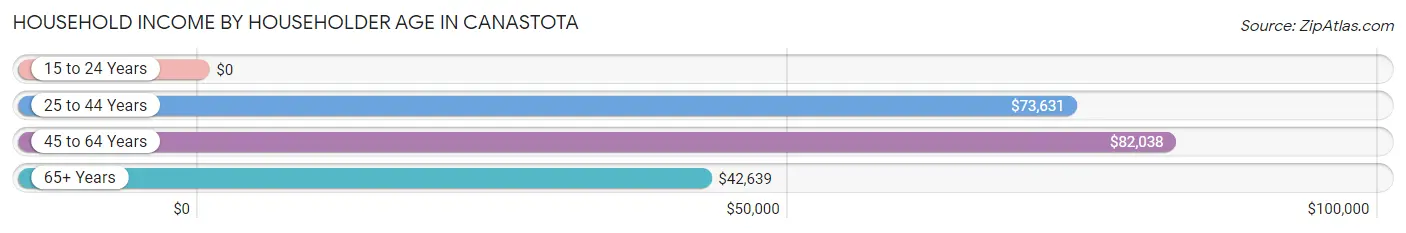
| Income Bracket | # Households | Median Income |
| 15 to 24 Years | 39 (2.1%) | $0 |
| 25 to 44 Years | 457 (24.9%) | $73,631 |
| 45 to 64 Years | 781 (42.5%) | $82,038 |
| 65+ Years | 560 (30.5%) | $42,639 |
| Total | 1,837 (100.0%) | $69,541 |
Poverty in Canastota
Income Below Poverty by Sex and Age in Canastota
With 12.9% poverty level for males and 10.1% for females among the residents of Canastota, 6 to 11 year old males and under 5 year old females are the most vulnerable to poverty, with 55 males (54.5%) and 22 females (27.2%) in their respective age groups living below the poverty level.
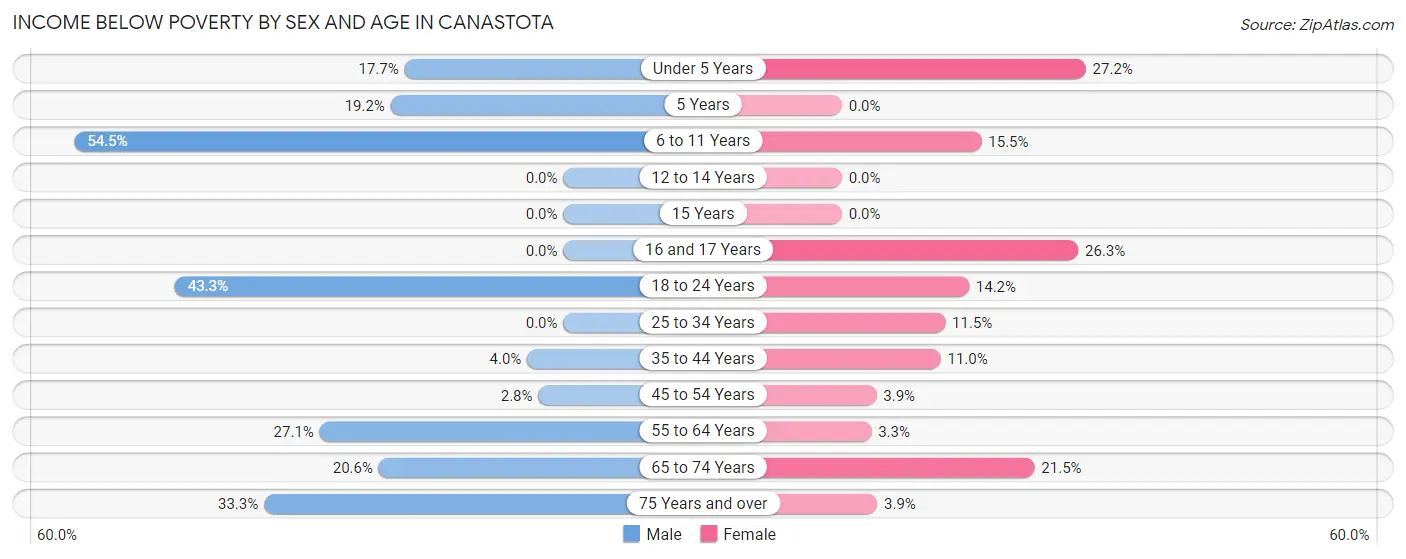
| Age Bracket | Male | Female |
| Under 5 Years | 23 (17.7%) | 22 (27.2%) |
| 5 Years | 20 (19.2%) | 0 (0.0%) |
| 6 to 11 Years | 55 (54.5%) | 30 (15.5%) |
| 12 to 14 Years | 0 (0.0%) | 0 (0.0%) |
| 15 Years | 0 (0.0%) | 0 (0.0%) |
| 16 and 17 Years | 0 (0.0%) | 5 (26.3%) |
| 18 to 24 Years | 45 (43.3%) | 15 (14.1%) |
| 25 to 34 Years | 0 (0.0%) | 32 (11.5%) |
| 35 to 44 Years | 10 (4.0%) | 34 (11.0%) |
| 45 to 54 Years | 11 (2.8%) | 16 (3.8%) |
| 55 to 64 Years | 57 (27.1%) | 9 (3.3%) |
| 65 to 74 Years | 45 (20.5%) | 65 (21.4%) |
| 75 Years and over | 20 (33.3%) | 7 (3.9%) |
| Total | 286 (12.9%) | 235 (10.1%) |
Income Above Poverty by Sex and Age in Canastota
According to the poverty statistics in Canastota, males aged 12 to 14 years and females aged 5 years are the age groups that are most secure financially, with 100.0% of males and 100.0% of females in these age groups living above the poverty line.
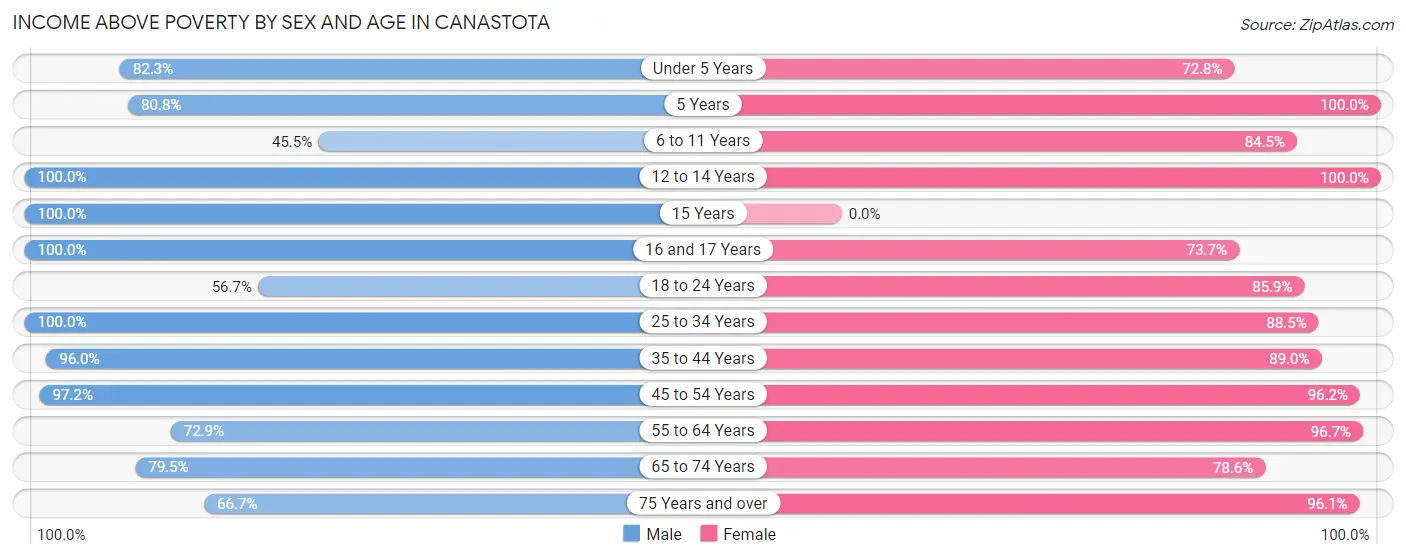
| Age Bracket | Male | Female |
| Under 5 Years | 107 (82.3%) | 59 (72.8%) |
| 5 Years | 84 (80.8%) | 6 (100.0%) |
| 6 to 11 Years | 46 (45.5%) | 163 (84.5%) |
| 12 to 14 Years | 85 (100.0%) | 175 (100.0%) |
| 15 Years | 131 (100.0%) | 0 (0.0%) |
| 16 and 17 Years | 18 (100.0%) | 14 (73.7%) |
| 18 to 24 Years | 59 (56.7%) | 91 (85.9%) |
| 25 to 34 Years | 406 (100.0%) | 246 (88.5%) |
| 35 to 44 Years | 238 (96.0%) | 275 (89.0%) |
| 45 to 54 Years | 385 (97.2%) | 400 (96.2%) |
| 55 to 64 Years | 153 (72.9%) | 265 (96.7%) |
| 65 to 74 Years | 174 (79.4%) | 238 (78.5%) |
| 75 Years and over | 40 (66.7%) | 171 (96.1%) |
| Total | 1,926 (87.1%) | 2,103 (89.9%) |
Income Below Poverty Among Married-Couple Families in Canastota
The poverty statistics for married-couple families in Canastota show that 4.9% or 32 of the total 654 families live below the poverty line. Families with no children have the highest poverty rate of 10.7%, comprising of 30 families. On the other hand, families with 3 or 4 children have the lowest poverty rate of 0.0%, which includes 0 families.
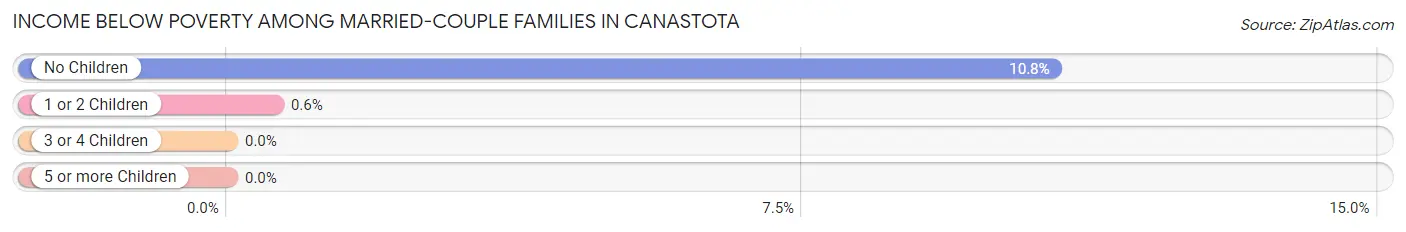
| Children | Above Poverty | Below Poverty |
| No Children | 249 (89.2%) | 30 (10.7%) |
| 1 or 2 Children | 331 (99.4%) | 2 (0.6%) |
| 3 or 4 Children | 42 (100.0%) | 0 (0.0%) |
| 5 or more Children | 0 (0.0%) | 0 (0.0%) |
| Total | 622 (95.1%) | 32 (4.9%) |
Income Below Poverty Among Single-Parent Households in Canastota
According to the poverty data in Canastota, 12.1% or 17 single-father households and 15.7% or 45 single-mother households are living below the poverty line. Among single-father households, those with 1 or 2 children have the highest poverty rate, with 17 households (19.8%) experiencing poverty. Likewise, among single-mother households, those with 3 or 4 children have the highest poverty rate, with 12 households (32.4%) falling below the poverty line.
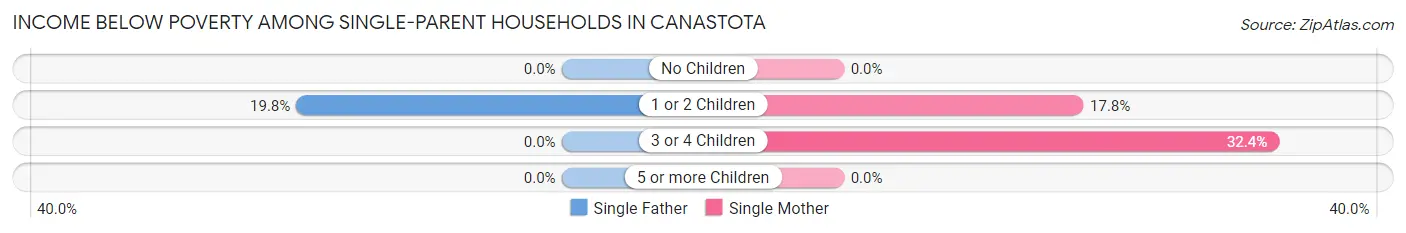
| Children | Single Father | Single Mother |
| No Children | 0 (0.0%) | 0 (0.0%) |
| 1 or 2 Children | 17 (19.8%) | 33 (17.8%) |
| 3 or 4 Children | 0 (0.0%) | 12 (32.4%) |
| 5 or more Children | 0 (0.0%) | 0 (0.0%) |
| Total | 17 (12.1%) | 45 (15.7%) |
Income Below Poverty Among Married-Couple vs Single-Parent Households in Canastota
The poverty data for Canastota shows that 32 of the married-couple family households (4.9%) and 62 of the single-parent households (14.5%) are living below the poverty level. Within the married-couple family households, those with no children have the highest poverty rate, with 30 households (10.7%) falling below the poverty line. Among the single-parent households, those with 3 or 4 children have the highest poverty rate, with 12 household (32.4%) living below poverty.
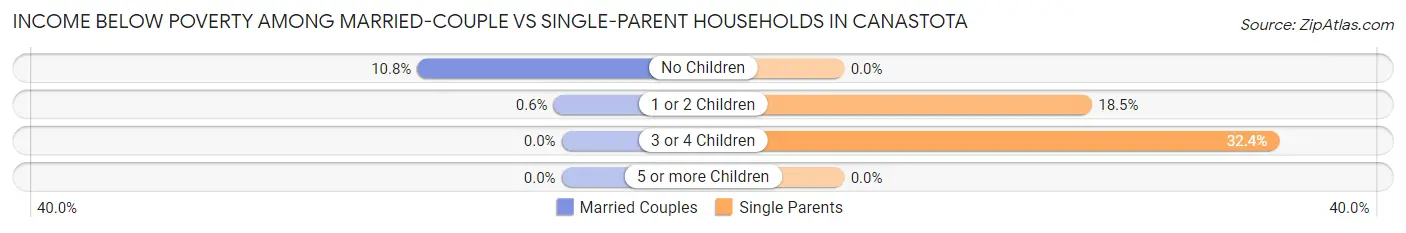
| Children | Married-Couple Families | Single-Parent Households |
| No Children | 30 (10.7%) | 0 (0.0%) |
| 1 or 2 Children | 2 (0.6%) | 50 (18.4%) |
| 3 or 4 Children | 0 (0.0%) | 12 (32.4%) |
| 5 or more Children | 0 (0.0%) | 0 (0.0%) |
| Total | 32 (4.9%) | 62 (14.5%) |
Race in Canastota
The most populous races in Canastota are White / Caucasian (3,670 | 80.7%), Two or more Races (592 | 13.0%), and Black / African American (269 | 5.9%).
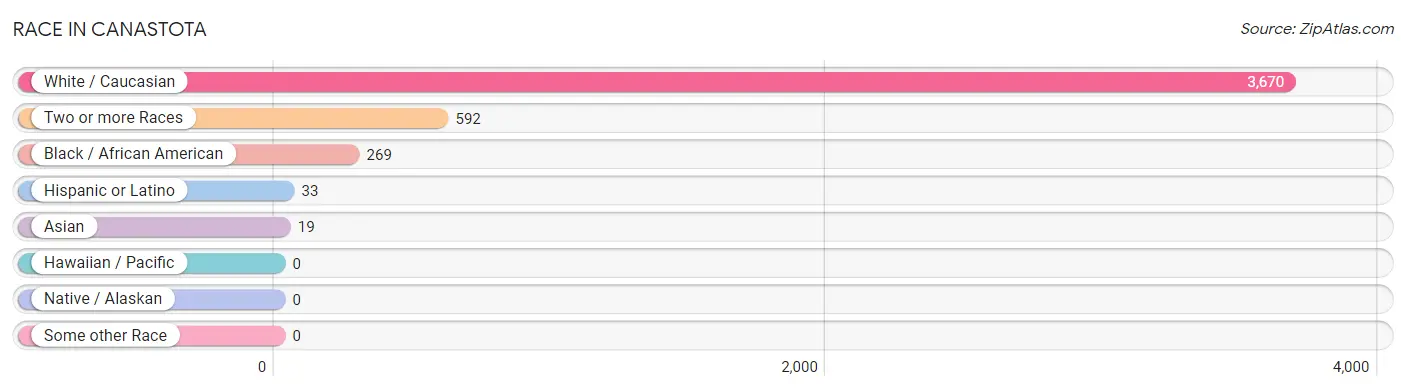
| Race | # Population | % Population |
| Asian | 19 | 0.4% |
| Black / African American | 269 | 5.9% |
| Hawaiian / Pacific | 0 | 0.0% |
| Hispanic or Latino | 33 | 0.7% |
| Native / Alaskan | 0 | 0.0% |
| White / Caucasian | 3,670 | 80.7% |
| Two or more Races | 592 | 13.0% |
| Some other Race | 0 | 0.0% |
| Total | 4,550 | 100.0% |
Ancestry in Canastota
The most populous ancestries reported in Canastota are German (977 | 21.5%), Italian (821 | 18.0%), Irish (752 | 16.5%), English (534 | 11.7%), and American (507 | 11.1%), together accounting for 78.9% of all Canastota residents.
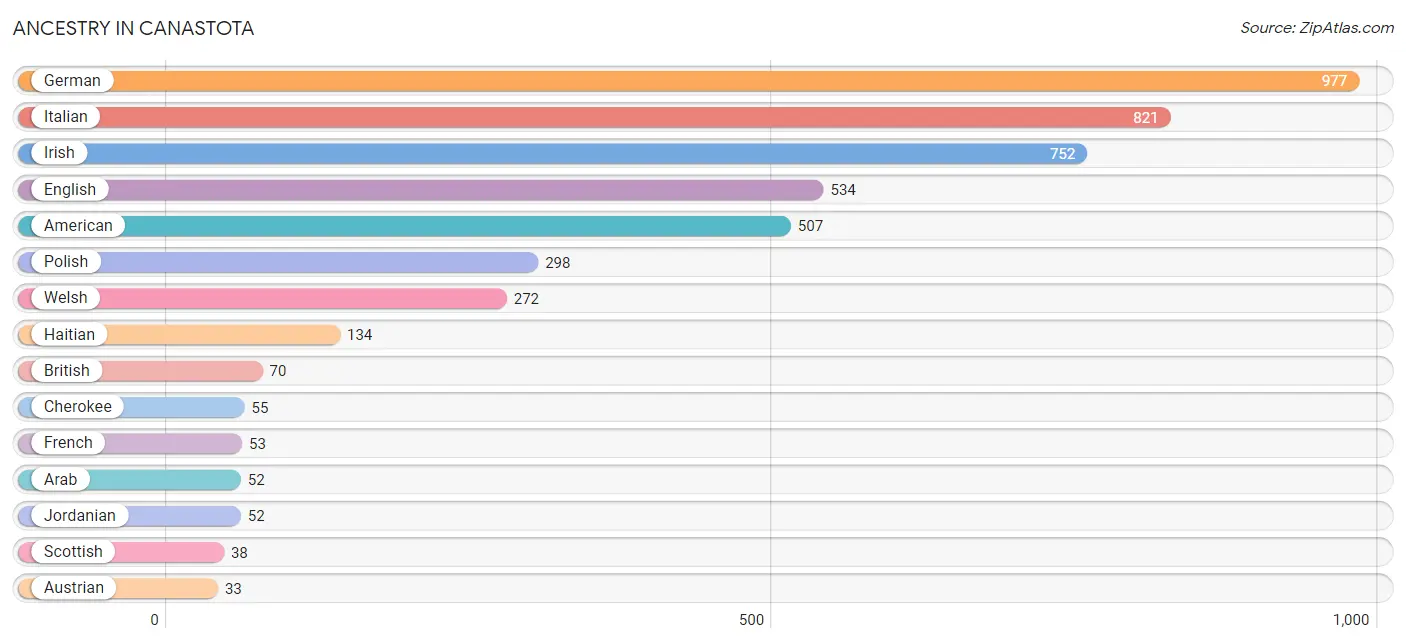
| Ancestry | # Population | % Population |
| American | 507 | 11.1% |
| Arab | 52 | 1.1% |
| Armenian | 3 | 0.1% |
| Austrian | 33 | 0.7% |
| Bhutanese | 29 | 0.6% |
| British | 70 | 1.5% |
| Burmese | 1 | 0.0% |
| Canadian | 3 | 0.1% |
| Cherokee | 55 | 1.2% |
| Czech | 2 | 0.0% |
| Dutch | 27 | 0.6% |
| English | 534 | 11.7% |
| European | 25 | 0.5% |
| French | 53 | 1.2% |
| French Canadian | 3 | 0.1% |
| German | 977 | 21.5% |
| Haitian | 134 | 2.9% |
| Hungarian | 22 | 0.5% |
| Inupiat | 10 | 0.2% |
| Irish | 752 | 16.5% |
| Italian | 821 | 18.0% |
| Jamaican | 4 | 0.1% |
| Jordanian | 52 | 1.1% |
| Polish | 298 | 6.6% |
| Puerto Rican | 33 | 0.7% |
| Scotch-Irish | 4 | 0.1% |
| Scottish | 38 | 0.8% |
| South African | 26 | 0.6% |
| Subsaharan African | 30 | 0.7% |
| Welsh | 272 | 6.0% |
| Zimbabwean | 4 | 0.1% | View All 31 Rows |
Immigrants in Canastota
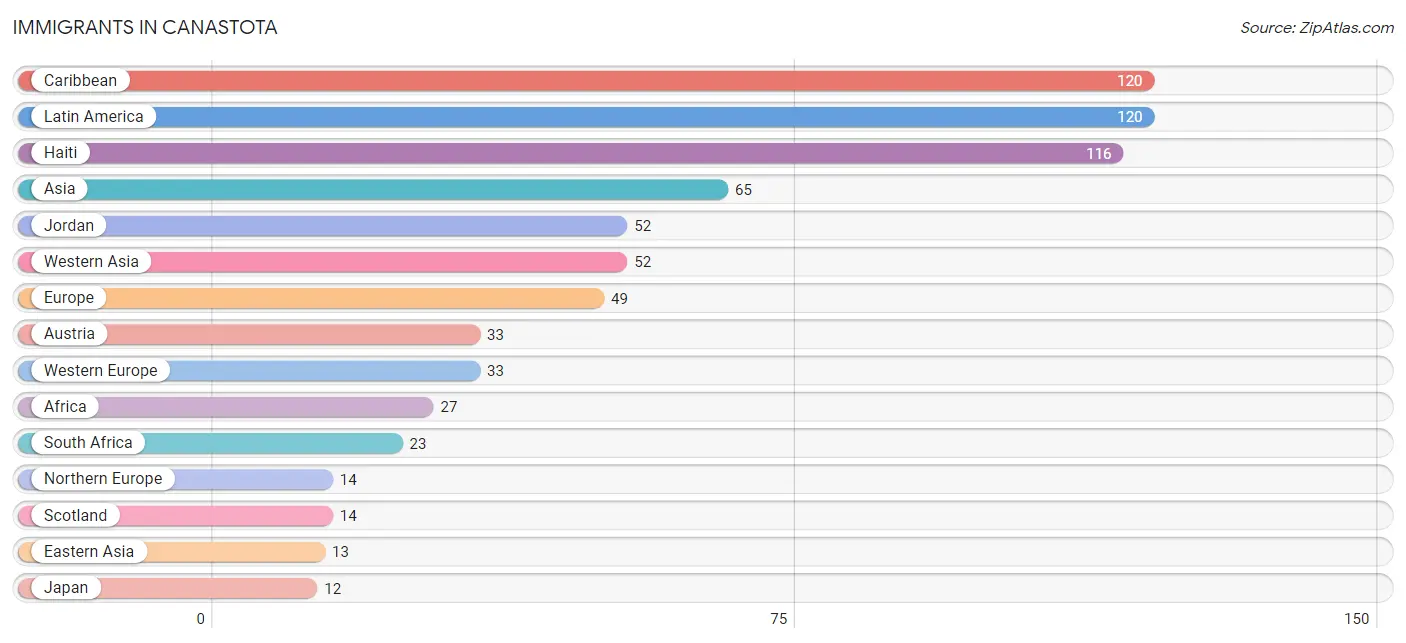
The most numerous immigrant groups reported in Canastota came from Caribbean (120 | 2.6%), Latin America (120 | 2.6%), Haiti (116 | 2.5%), Asia (65 | 1.4%), and Jordan (52 | 1.1%), together accounting for 10.4% of all Canastota residents.
| Immigration Origin | # Population | % Population |
| Africa | 27 | 0.6% |
| Asia | 65 | 1.4% |
| Austria | 33 | 0.7% |
| Caribbean | 120 | 2.6% |
| Eastern Africa | 4 | 0.1% |
| Eastern Asia | 13 | 0.3% |
| Europe | 49 | 1.1% |
| Haiti | 116 | 2.5% |
| Italy | 2 | 0.0% |
| Jamaica | 4 | 0.1% |
| Japan | 12 | 0.3% |
| Jordan | 52 | 1.1% |
| Korea | 1 | 0.0% |
| Latin America | 120 | 2.6% |
| Northern Europe | 14 | 0.3% |
| Scotland | 14 | 0.3% |
| South Africa | 23 | 0.5% |
| Southern Europe | 2 | 0.0% |
| Western Asia | 52 | 1.1% |
| Western Europe | 33 | 0.7% |
| Zimbabwe | 4 | 0.1% | View All 21 Rows |
Sex and Age in Canastota
Sex and Age in Canastota
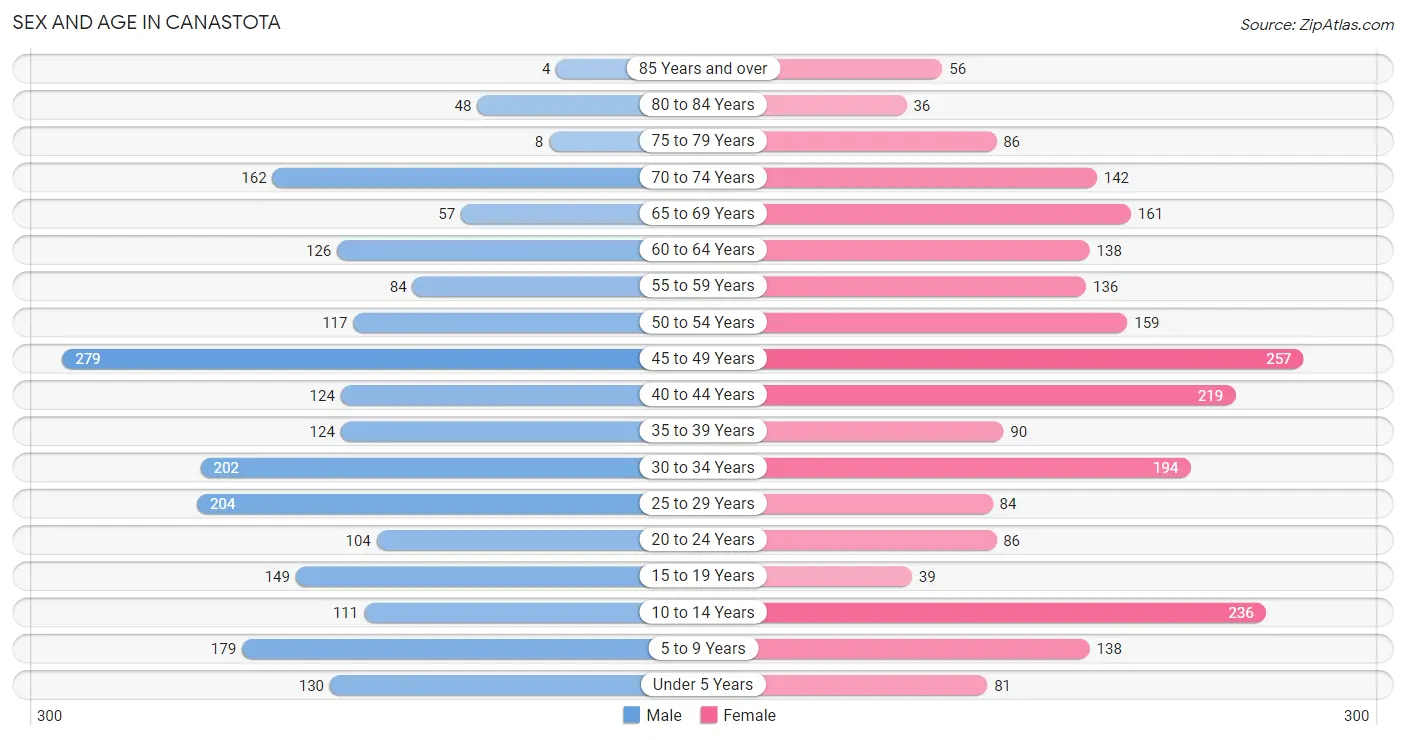
The most populous age groups in Canastota are 45 to 49 Years (279 | 12.6%) for men and 45 to 49 Years (257 | 11.0%) for women.
| Age Bracket | Male | Female |
| Under 5 Years | 130 (5.9%) | 81 (3.5%) |
| 5 to 9 Years | 179 (8.1%) | 138 (5.9%) |
| 10 to 14 Years | 111 (5.0%) | 236 (10.1%) |
| 15 to 19 Years | 149 (6.7%) | 39 (1.7%) |
| 20 to 24 Years | 104 (4.7%) | 86 (3.7%) |
| 25 to 29 Years | 204 (9.2%) | 84 (3.6%) |
| 30 to 34 Years | 202 (9.1%) | 194 (8.3%) |
| 35 to 39 Years | 124 (5.6%) | 90 (3.8%) |
| 40 to 44 Years | 124 (5.6%) | 219 (9.4%) |
| 45 to 49 Years | 279 (12.6%) | 257 (11.0%) |
| 50 to 54 Years | 117 (5.3%) | 159 (6.8%) |
| 55 to 59 Years | 84 (3.8%) | 136 (5.8%) |
| 60 to 64 Years | 126 (5.7%) | 138 (5.9%) |
| 65 to 69 Years | 57 (2.6%) | 161 (6.9%) |
| 70 to 74 Years | 162 (7.3%) | 142 (6.1%) |
| 75 to 79 Years | 8 (0.4%) | 86 (3.7%) |
| 80 to 84 Years | 48 (2.2%) | 36 (1.5%) |
| 85 Years and over | 4 (0.2%) | 56 (2.4%) |
| Total | 2,212 (100.0%) | 2,338 (100.0%) |
Families and Households in Canastota
Median Family Size in Canastota
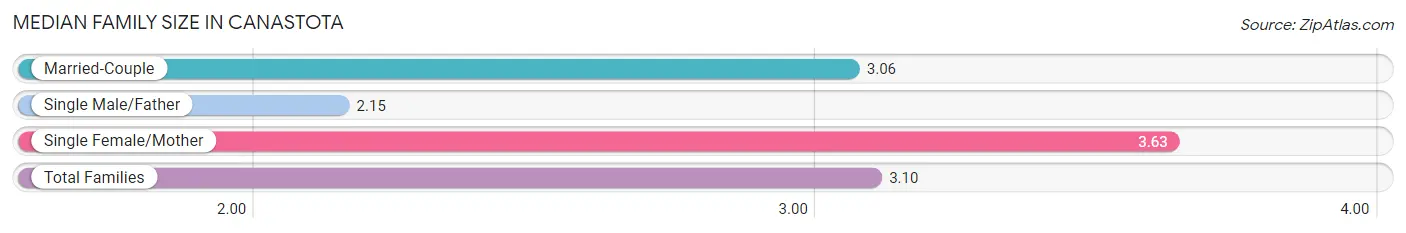
The median family size in Canastota is 3.10 persons per family, with single female/mother families (287 | 26.6%) accounting for the largest median family size of 3.63 persons per family. On the other hand, single male/father families (140 | 13.0%) represent the smallest median family size with 2.15 persons per family.
| Family Type | # Families | Family Size |
| Married-Couple | 654 (60.5%) | 3.06 |
| Single Male/Father | 140 (13.0%) | 2.15 |
| Single Female/Mother | 287 (26.6%) | 3.63 |
| Total Families | 1,081 (100.0%) | 3.10 |
Median Household Size in Canastota
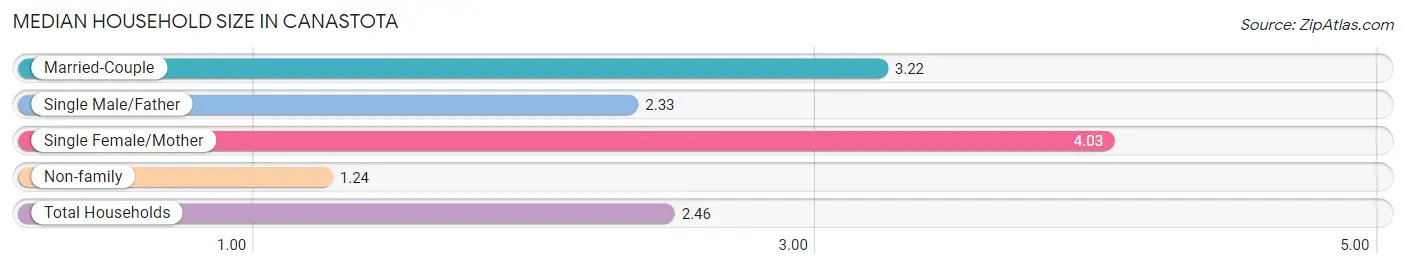
The median household size in Canastota is 2.46 persons per household, with single female/mother households (287 | 15.6%) accounting for the largest median household size of 4.03 persons per household. non-family households (756 | 41.1%) represent the smallest median household size with 1.24 persons per household.
| Household Type | # Households | Household Size |
| Married-Couple | 654 (35.6%) | 3.22 |
| Single Male/Father | 140 (7.6%) | 2.33 |
| Single Female/Mother | 287 (15.6%) | 4.03 |
| Non-family | 756 (41.1%) | 1.24 |
| Total Households | 1,837 (100.0%) | 2.46 |
Household Size by Marriage Status in Canastota
Out of a total of 1,837 households in Canastota, 1,081 (58.9%) are family households, while 756 (41.1%) are nonfamily households. The most numerous type of family households are 3-person households, comprising 344, and the most common type of nonfamily households are 1-person households, comprising 574.
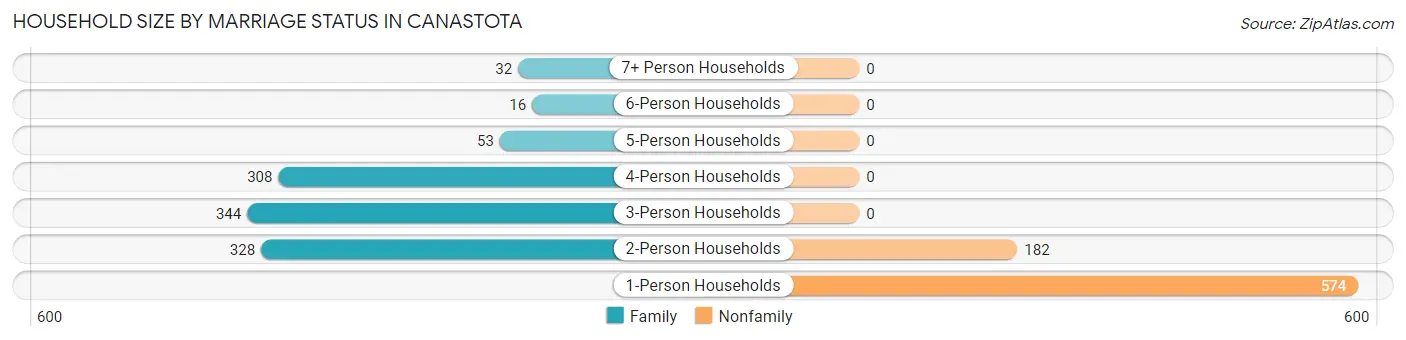
| Household Size | Family Households | Nonfamily Households |
| 1-Person Households | - | 574 (31.2%) |
| 2-Person Households | 328 (17.9%) | 182 (9.9%) |
| 3-Person Households | 344 (18.7%) | 0 (0.0%) |
| 4-Person Households | 308 (16.8%) | 0 (0.0%) |
| 5-Person Households | 53 (2.9%) | 0 (0.0%) |
| 6-Person Households | 16 (0.9%) | 0 (0.0%) |
| 7+ Person Households | 32 (1.7%) | 0 (0.0%) |
| Total | 1,081 (58.9%) | 756 (41.1%) |
Female Fertility in Canastota
Fertility by Age in Canastota
Average fertility rate in Canastota is 6.0 births per 1,000 women. Women in the age bracket of 20 to 34 years have the highest fertility rate with 16.0 births per 1,000 women. Women in the age bracket of 20 to 34 years acount for 100.0% of all women with births.
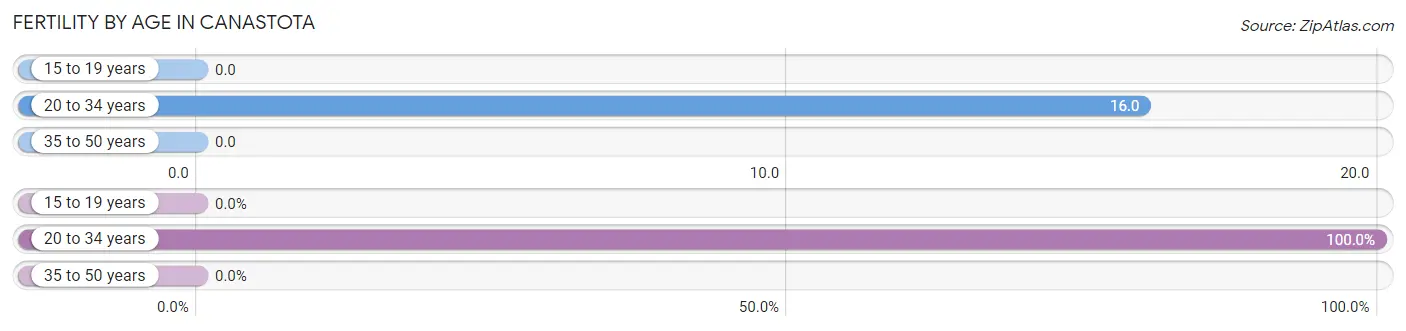
| Age Bracket | Women with Births | Births / 1,000 Women |
| 15 to 19 years | 0 (0.0%) | 0.0 |
| 20 to 34 years | 6 (100.0%) | 16.0 |
| 35 to 50 years | 0 (0.0%) | 0.0 |
| Total | 6 (100.0%) | 6.0 |
Fertility by Age by Marriage Status in Canastota
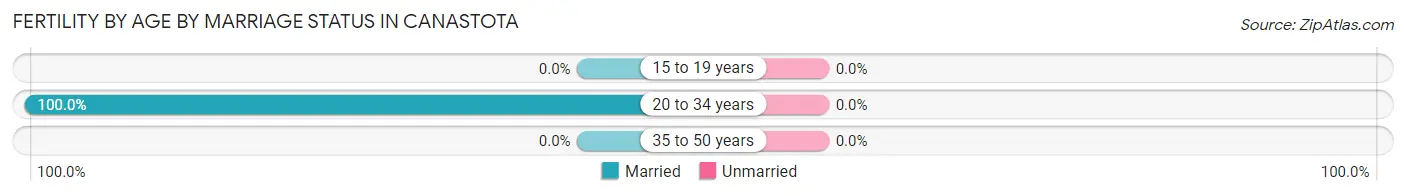
| Age Bracket | Married | Unmarried |
| 15 to 19 years | 0 (0.0%) | 0 (0.0%) |
| 20 to 34 years | 6 (100.0%) | 0 (0.0%) |
| 35 to 50 years | 0 (0.0%) | 0 (0.0%) |
| Total | 6 (100.0%) | 0 (0.0%) |
Fertility by Education in Canastota
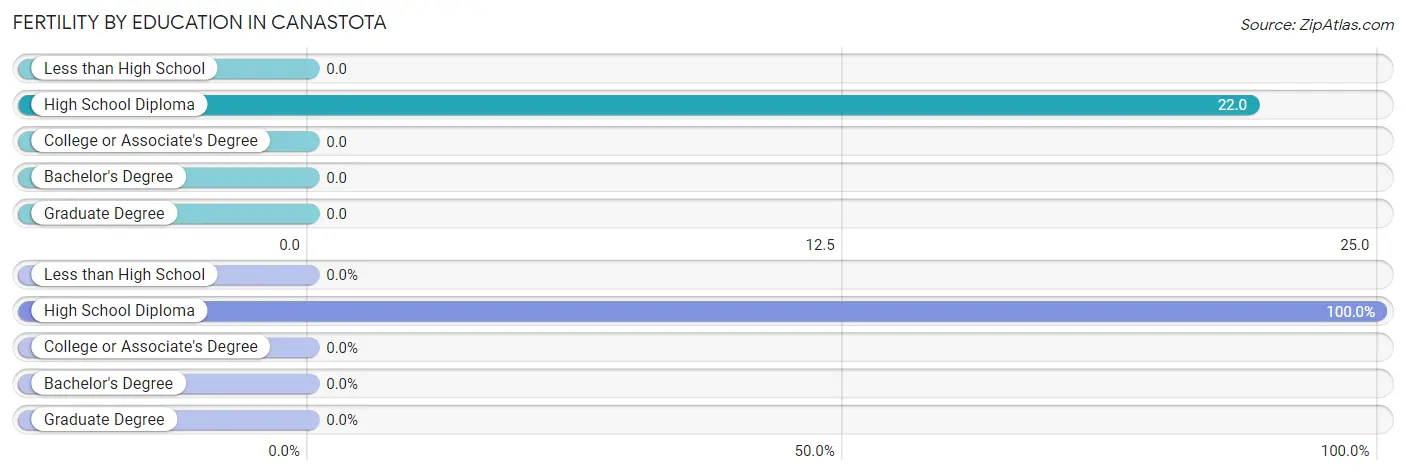
| Educational Attainment | Women with Births | Births / 1,000 Women |
| Less than High School | 0 (0.0%) | 0.0 |
| High School Diploma | 6 (100.0%) | 22.0 |
| College or Associate's Degree | 0 (0.0%) | 0.0 |
| Bachelor's Degree | 0 (0.0%) | 0.0 |
| Graduate Degree | 0 (0.0%) | 0.0 |
| Total | 6 (100.0%) | 6.0 |
Fertility by Education by Marriage Status in Canastota
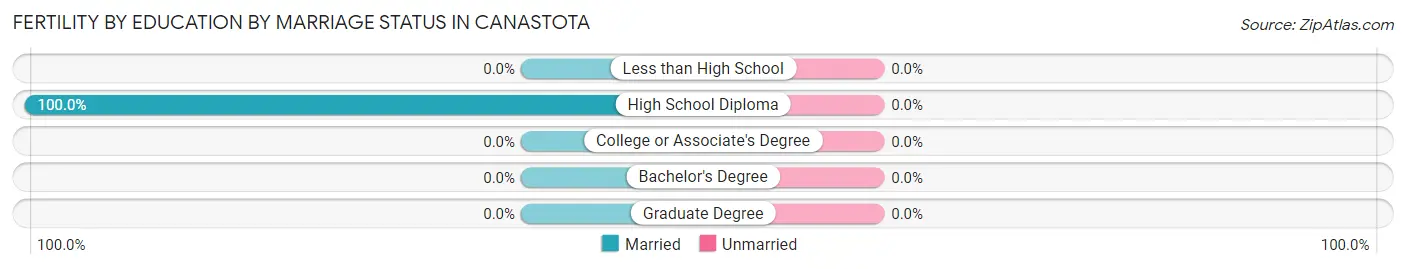
| Educational Attainment | Married | Unmarried |
| Less than High School | 0 (0.0%) | 0 (0.0%) |
| High School Diploma | 6 (100.0%) | 0 (0.0%) |
| College or Associate's Degree | 0 (0.0%) | 0 (0.0%) |
| Bachelor's Degree | 0 (0.0%) | 0 (0.0%) |
| Graduate Degree | 0 (0.0%) | 0 (0.0%) |
| Total | 6 (100.0%) | 0 (0.0%) |
Employment Characteristics in Canastota
Employment by Class of Employer in Canastota
Among the 2,384 employed individuals in Canastota, private company employees (1,560 | 65.4%), not-for-profit organizations (382 | 16.0%), and local government employees (160 | 6.7%) make up the most common classes of employment.
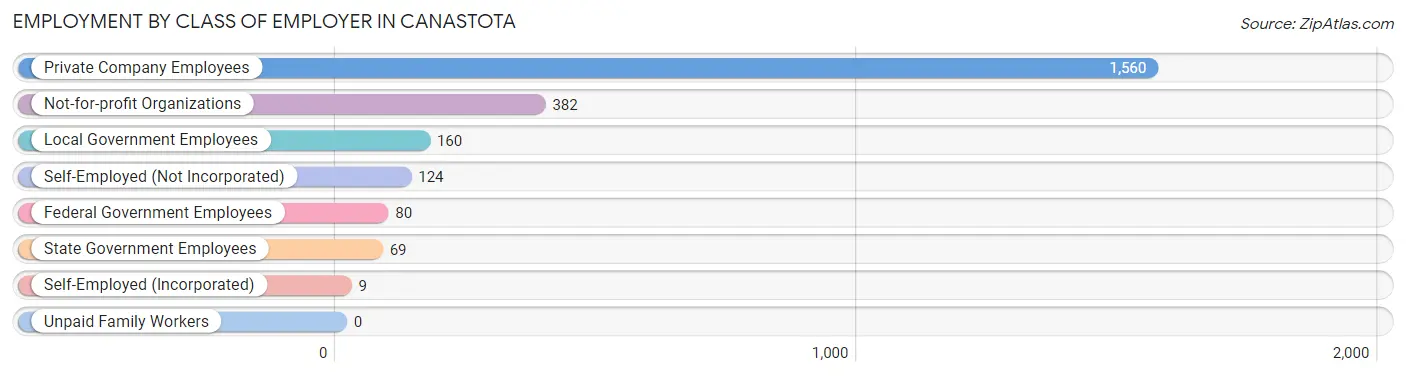
| Employer Class | # Employees | % Employees |
| Private Company Employees | 1,560 | 65.4% |
| Self-Employed (Incorporated) | 9 | 0.4% |
| Self-Employed (Not Incorporated) | 124 | 5.2% |
| Not-for-profit Organizations | 382 | 16.0% |
| Local Government Employees | 160 | 6.7% |
| State Government Employees | 69 | 2.9% |
| Federal Government Employees | 80 | 3.4% |
| Unpaid Family Workers | 0 | 0.0% |
| Total | 2,384 | 100.0% |
Employment Status by Age in Canastota
According to the labor force statistics for Canastota, out of the total population over 16 years of age (3,544), 69.6% or 2,467 individuals are in the labor force, with 3.3% or 81 of them unemployed. The age group with the highest labor force participation rate is 45 to 54 years, with 98.3% or 798 individuals in the labor force. Within the labor force, the 16 to 19 years age range has the highest percentage of unemployed individuals, with 44.4% or 4 of them being unemployed.
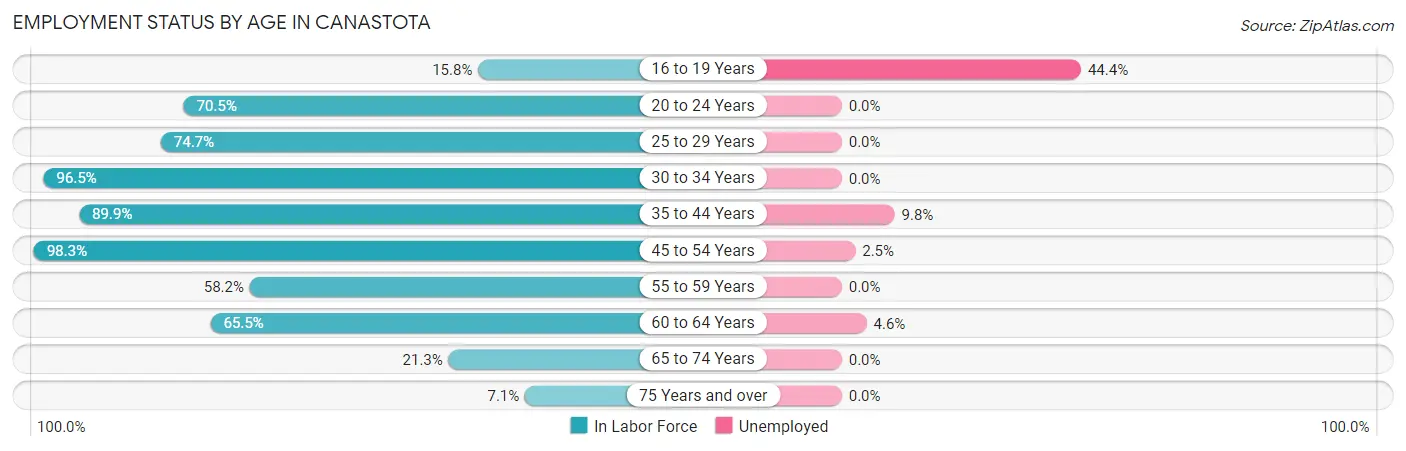
| Age Bracket | In Labor Force | Unemployed |
| 16 to 19 Years | 9 (15.8%) | 4 (44.4%) |
| 20 to 24 Years | 134 (70.5%) | 0 (0.0%) |
| 25 to 29 Years | 215 (74.7%) | 0 (0.0%) |
| 30 to 34 Years | 382 (96.5%) | 0 (0.0%) |
| 35 to 44 Years | 501 (89.9%) | 49 (9.8%) |
| 45 to 54 Years | 798 (98.3%) | 20 (2.5%) |
| 55 to 59 Years | 128 (58.2%) | 0 (0.0%) |
| 60 to 64 Years | 173 (65.5%) | 8 (4.6%) |
| 65 to 74 Years | 111 (21.3%) | 0 (0.0%) |
| 75 Years and over | 17 (7.1%) | 0 (0.0%) |
| Total | 2,467 (69.6%) | 81 (3.3%) |
Employment Status by Educational Attainment in Canastota
According to labor force statistics for Canastota, 86.6% of individuals (2,197) out of the total population between 25 and 64 years of age (2,537) are in the labor force, with 3.5% or 77 of them being unemployed. The group with the highest labor force participation rate are those with the educational attainment of college / associate degree, with 92.7% or 1,054 individuals in the labor force. Within the labor force, individuals with high school diploma education have the highest percentage of unemployment, with 6.9% or 51 of them being unemployed.
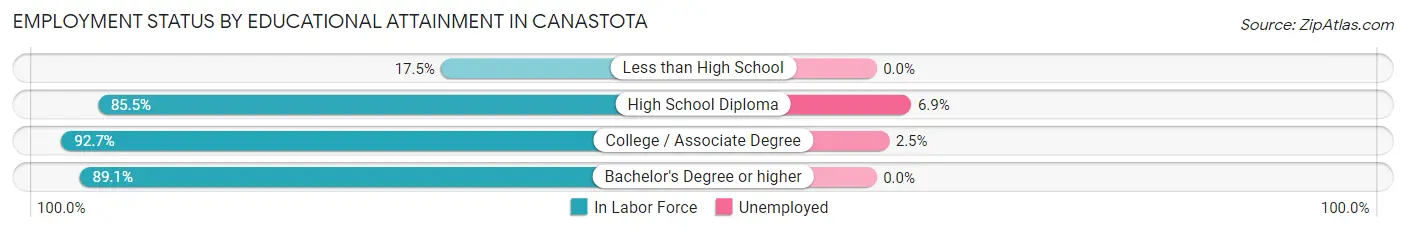
| Educational Attainment | In Labor Force | Unemployed |
| Less than High School | 18 (17.5%) | 0 (0.0%) |
| High School Diploma | 740 (85.5%) | 60 (6.9%) |
| College / Associate Degree | 1,054 (92.7%) | 28 (2.5%) |
| Bachelor's Degree or higher | 385 (89.1%) | 0 (0.0%) |
| Total | 2,197 (86.6%) | 89 (3.5%) |
Employment Occupations by Sex in Canastota
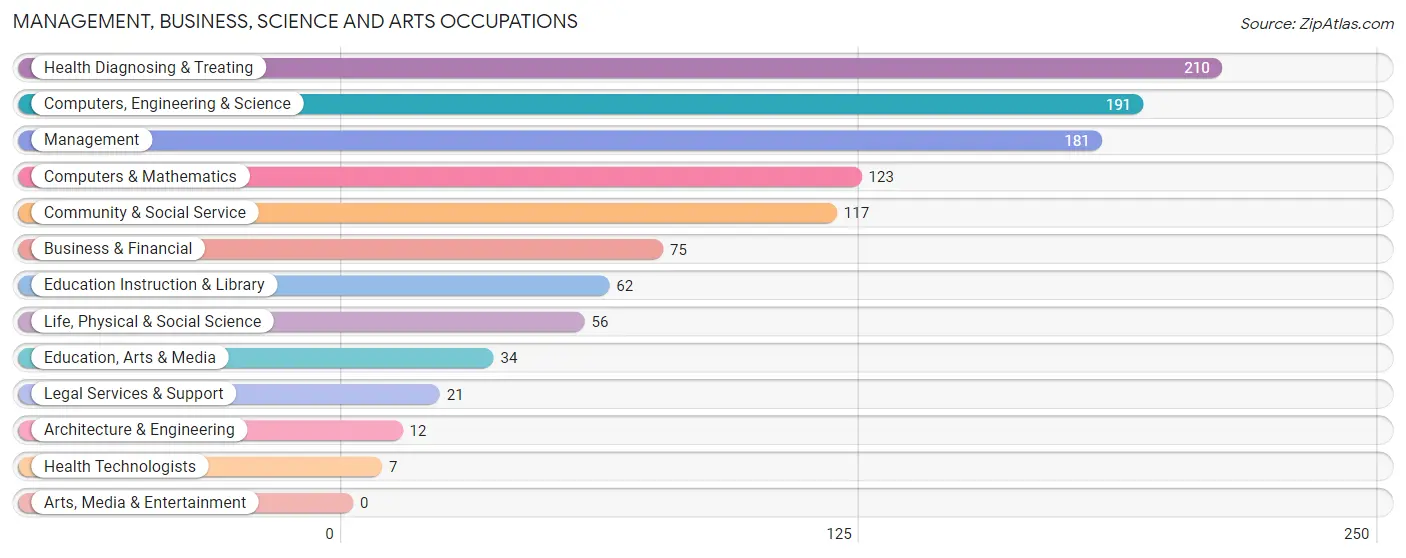
Management, Business, Science and Arts Occupations
The most common Management, Business, Science and Arts occupations in Canastota are Health Diagnosing & Treating (210 | 8.8%), Computers, Engineering & Science (191 | 8.1%), Management (181 | 7.6%), Computers & Mathematics (123 | 5.2%), and Community & Social Service (117 | 4.9%).
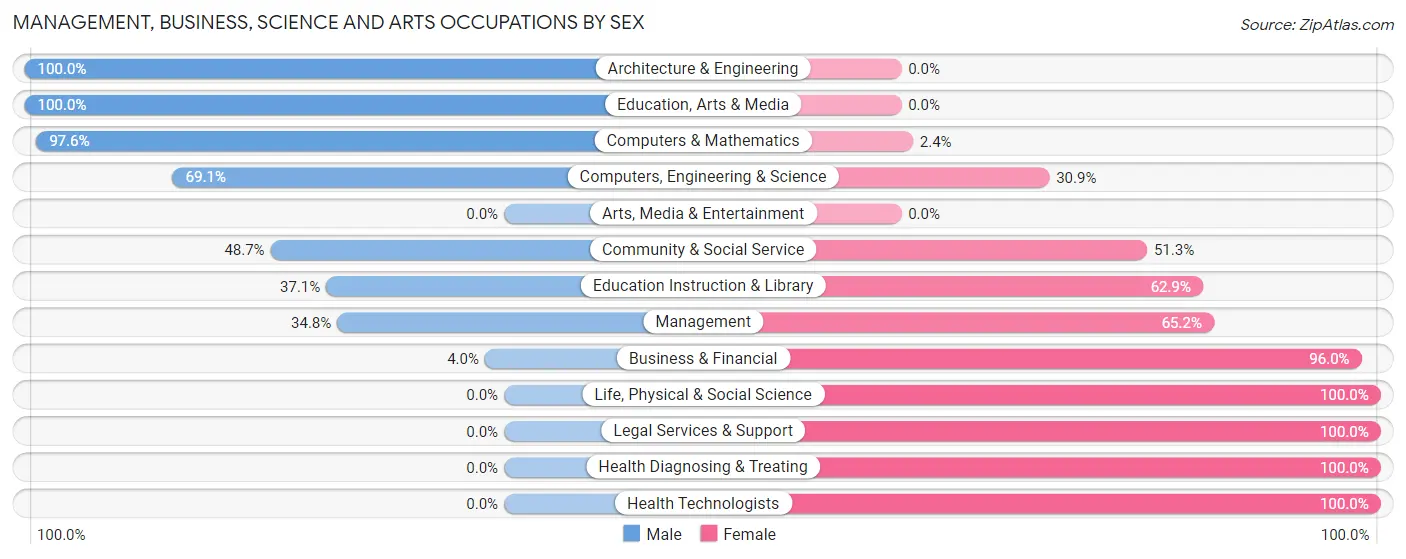
Management, Business, Science and Arts Occupations by Sex
Within the Management, Business, Science and Arts occupations in Canastota, the most male-oriented occupations are Architecture & Engineering (100.0%), Education, Arts & Media (100.0%), and Computers & Mathematics (97.6%), while the most female-oriented occupations are Life, Physical & Social Science (100.0%), Legal Services & Support (100.0%), and Health Diagnosing & Treating (100.0%).
| Occupation | Male | Female |
| Management | 63 (34.8%) | 118 (65.2%) |
| Business & Financial | 3 (4.0%) | 72 (96.0%) |
| Computers, Engineering & Science | 132 (69.1%) | 59 (30.9%) |
| Computers & Mathematics | 120 (97.6%) | 3 (2.4%) |
| Architecture & Engineering | 12 (100.0%) | 0 (0.0%) |
| Life, Physical & Social Science | 0 (0.0%) | 56 (100.0%) |
| Community & Social Service | 57 (48.7%) | 60 (51.3%) |
| Education, Arts & Media | 34 (100.0%) | 0 (0.0%) |
| Legal Services & Support | 0 (0.0%) | 21 (100.0%) |
| Education Instruction & Library | 23 (37.1%) | 39 (62.9%) |
| Arts, Media & Entertainment | 0 (0.0%) | 0 (0.0%) |
| Health Diagnosing & Treating | 0 (0.0%) | 210 (100.0%) |
| Health Technologists | 0 (0.0%) | 7 (100.0%) |
| Total (Category) | 255 (33.0%) | 519 (67.0%) |
| Total (Overall) | 1,070 (45.1%) | 1,303 (54.9%) |
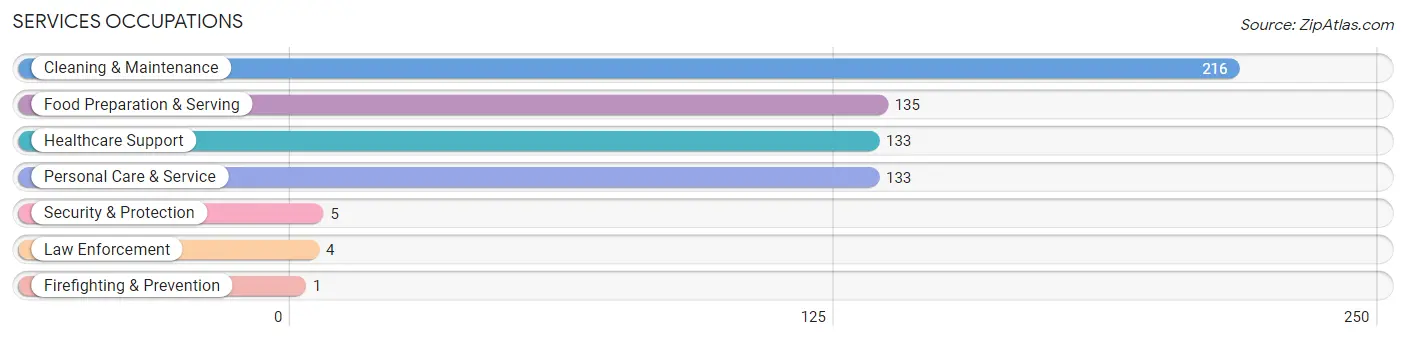
Services Occupations
The most common Services occupations in Canastota are Cleaning & Maintenance (216 | 9.1%), Food Preparation & Serving (135 | 5.7%), Healthcare Support (133 | 5.6%), Personal Care & Service (133 | 5.6%), and Security & Protection (5 | 0.2%).
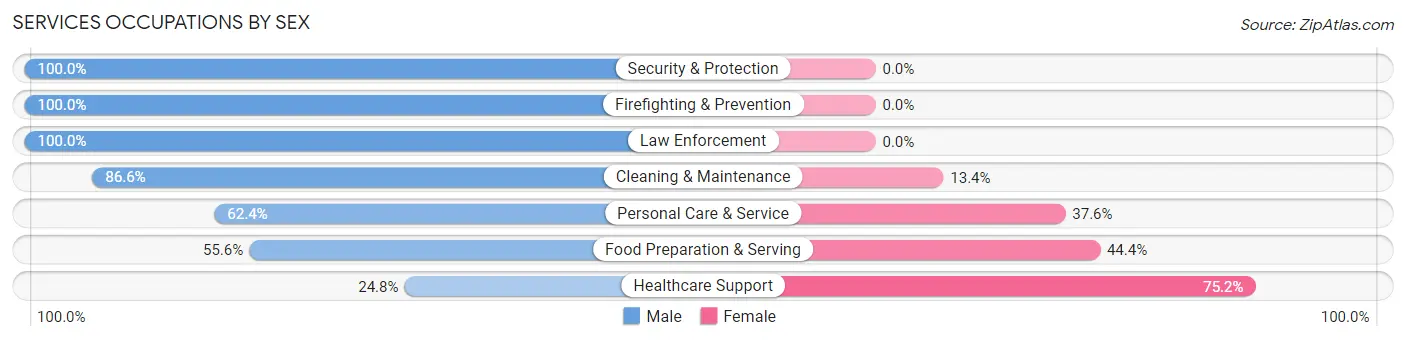
Services Occupations by Sex
Within the Services occupations in Canastota, the most male-oriented occupations are Security & Protection (100.0%), Firefighting & Prevention (100.0%), and Law Enforcement (100.0%), while the most female-oriented occupations are Healthcare Support (75.2%), Food Preparation & Serving (44.4%), and Personal Care & Service (37.6%).
| Occupation | Male | Female |
| Healthcare Support | 33 (24.8%) | 100 (75.2%) |
| Security & Protection | 5 (100.0%) | 0 (0.0%) |
| Firefighting & Prevention | 1 (100.0%) | 0 (0.0%) |
| Law Enforcement | 4 (100.0%) | 0 (0.0%) |
| Food Preparation & Serving | 75 (55.6%) | 60 (44.4%) |
| Cleaning & Maintenance | 187 (86.6%) | 29 (13.4%) |
| Personal Care & Service | 83 (62.4%) | 50 (37.6%) |
| Total (Category) | 383 (61.6%) | 239 (38.4%) |
| Total (Overall) | 1,070 (45.1%) | 1,303 (54.9%) |
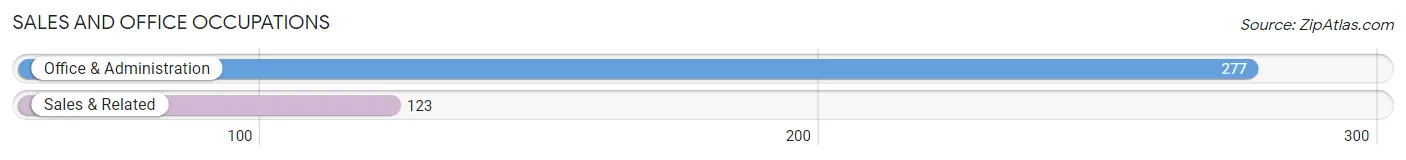
Sales and Office Occupations
The most common Sales and Office occupations in Canastota are Office & Administration (277 | 11.7%), and Sales & Related (123 | 5.2%).
Sales and Office Occupations by Sex
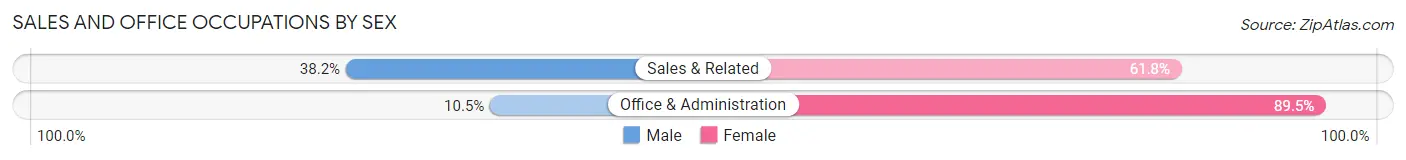
| Occupation | Male | Female |
| Sales & Related | 47 (38.2%) | 76 (61.8%) |
| Office & Administration | 29 (10.5%) | 248 (89.5%) |
| Total (Category) | 76 (19.0%) | 324 (81.0%) |
| Total (Overall) | 1,070 (45.1%) | 1,303 (54.9%) |
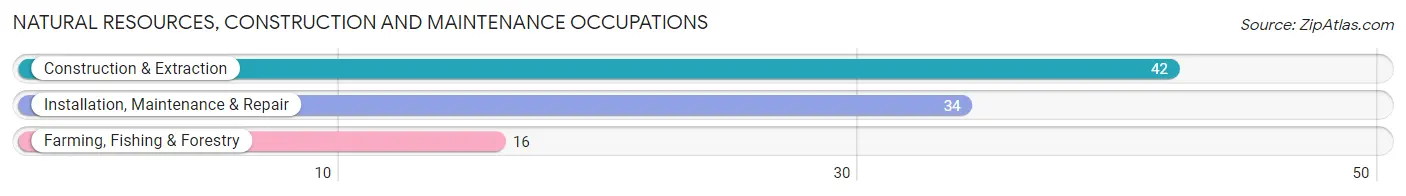
Natural Resources, Construction and Maintenance Occupations
The most common Natural Resources, Construction and Maintenance occupations in Canastota are Construction & Extraction (42 | 1.8%), Installation, Maintenance & Repair (34 | 1.4%), and Farming, Fishing & Forestry (16 | 0.7%).
Natural Resources, Construction and Maintenance Occupations by Sex
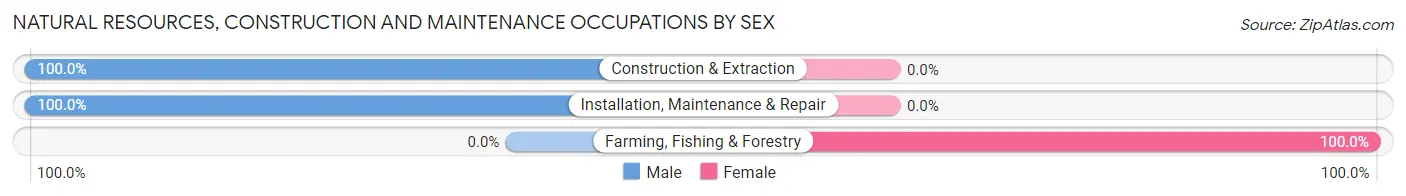
| Occupation | Male | Female |
| Farming, Fishing & Forestry | 0 (0.0%) | 16 (100.0%) |
| Construction & Extraction | 42 (100.0%) | 0 (0.0%) |
| Installation, Maintenance & Repair | 34 (100.0%) | 0 (0.0%) |
| Total (Category) | 76 (82.6%) | 16 (17.4%) |
| Total (Overall) | 1,070 (45.1%) | 1,303 (54.9%) |
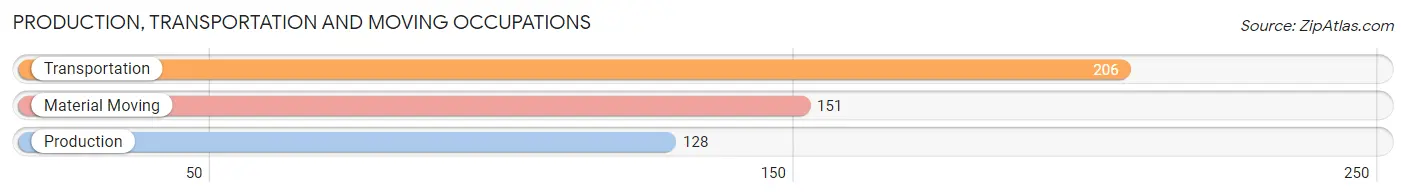
Production, Transportation and Moving Occupations
The most common Production, Transportation and Moving occupations in Canastota are Transportation (206 | 8.7%), Material Moving (151 | 6.4%), and Production (128 | 5.4%).
Production, Transportation and Moving Occupations by Sex
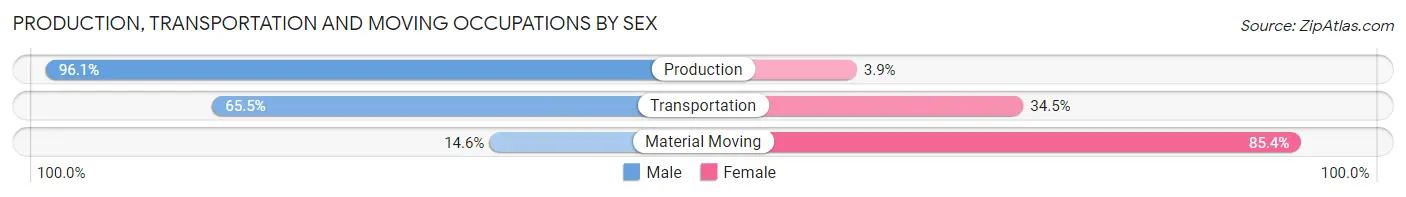
| Occupation | Male | Female |
| Production | 123 (96.1%) | 5 (3.9%) |
| Transportation | 135 (65.5%) | 71 (34.5%) |
| Material Moving | 22 (14.6%) | 129 (85.4%) |
| Total (Category) | 280 (57.7%) | 205 (42.3%) |
| Total (Overall) | 1,070 (45.1%) | 1,303 (54.9%) |
Employment Industries by Sex in Canastota
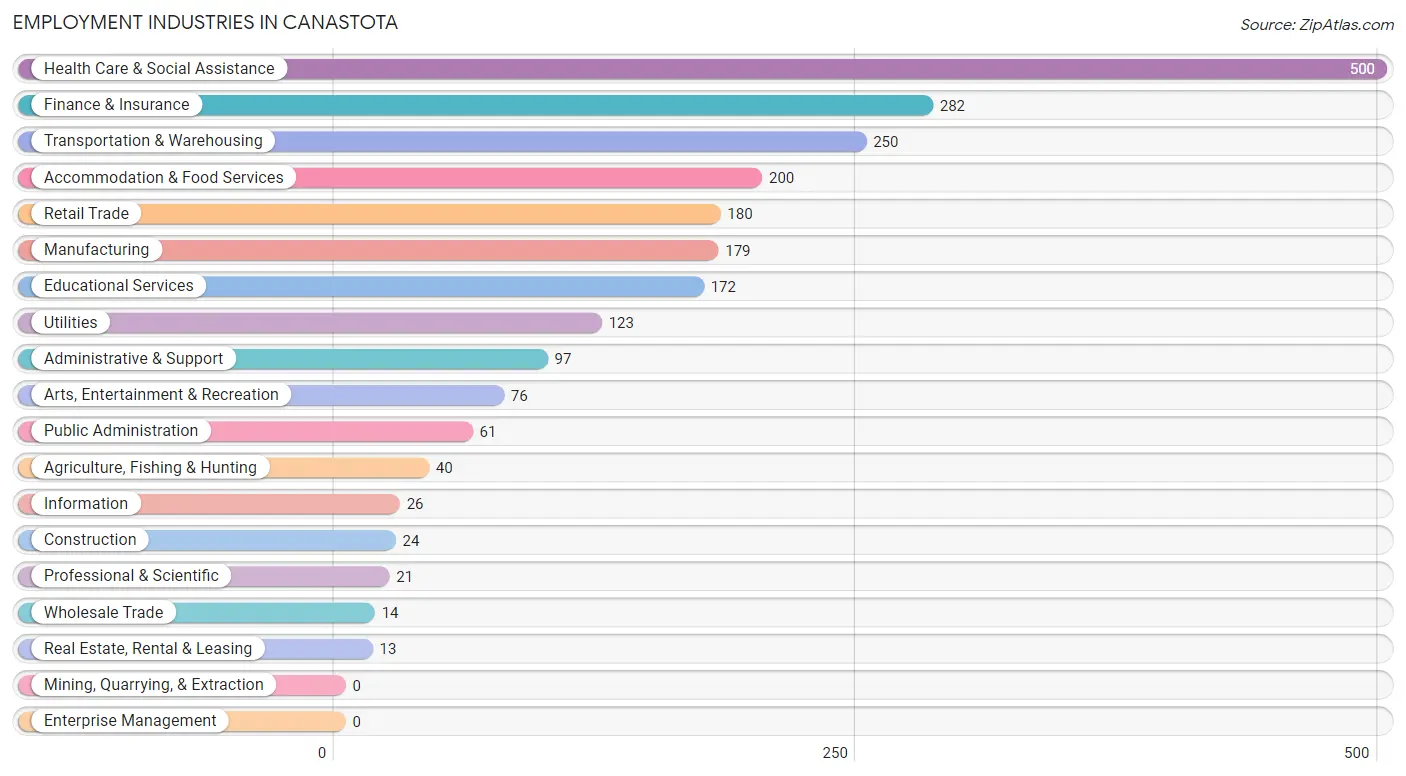
Employment Industries in Canastota
The major employment industries in Canastota include Health Care & Social Assistance (500 | 21.1%), Finance & Insurance (282 | 11.9%), Transportation & Warehousing (250 | 10.5%), Accommodation & Food Services (200 | 8.4%), and Retail Trade (180 | 7.6%).
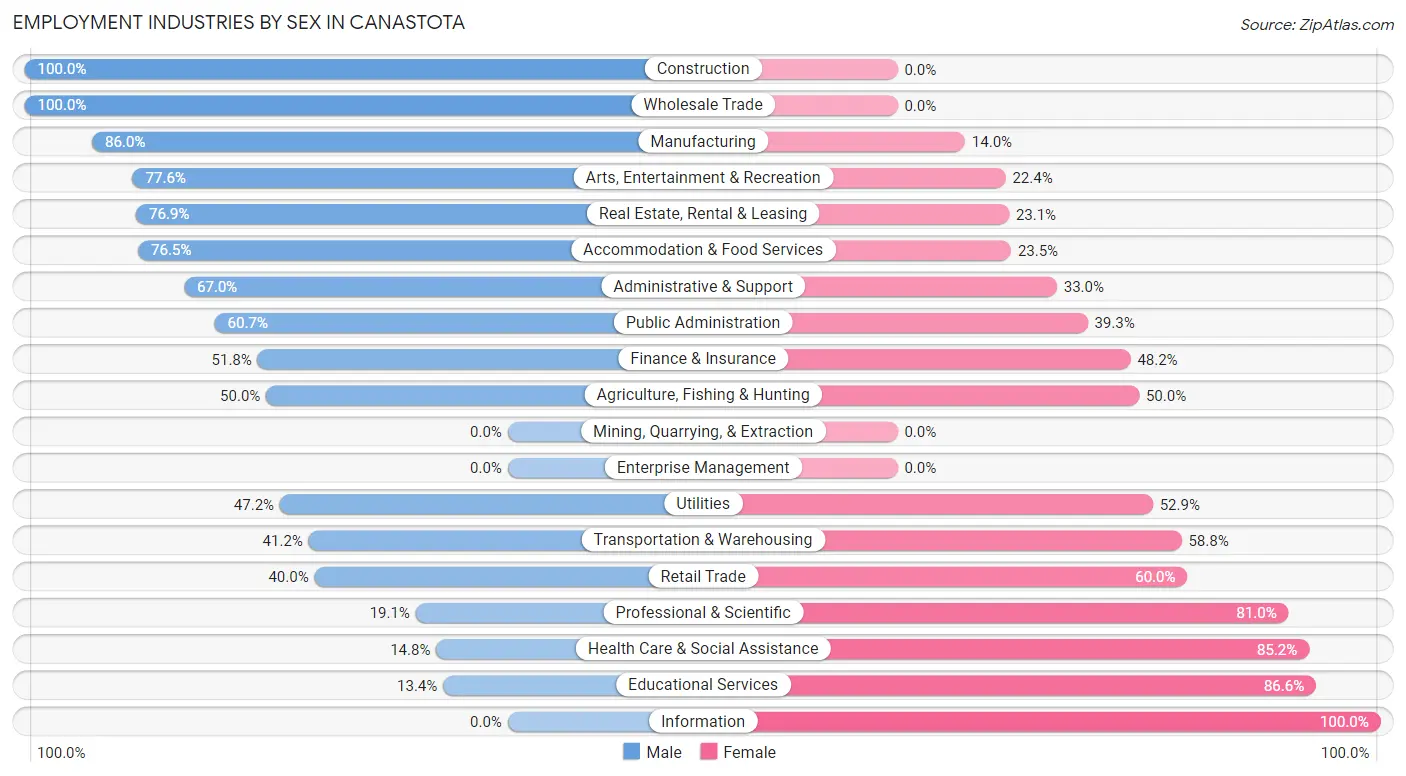
Employment Industries by Sex in Canastota
The Canastota industries that see more men than women are Construction (100.0%), Wholesale Trade (100.0%), and Manufacturing (86.0%), whereas the industries that tend to have a higher number of women are Information (100.0%), Educational Services (86.6%), and Health Care & Social Assistance (85.2%).
| Industry | Male | Female |
| Agriculture, Fishing & Hunting | 20 (50.0%) | 20 (50.0%) |
| Mining, Quarrying, & Extraction | 0 (0.0%) | 0 (0.0%) |
| Construction | 24 (100.0%) | 0 (0.0%) |
| Manufacturing | 154 (86.0%) | 25 (14.0%) |
| Wholesale Trade | 14 (100.0%) | 0 (0.0%) |
| Retail Trade | 72 (40.0%) | 108 (60.0%) |
| Transportation & Warehousing | 103 (41.2%) | 147 (58.8%) |
| Utilities | 58 (47.1%) | 65 (52.8%) |
| Information | 0 (0.0%) | 26 (100.0%) |
| Finance & Insurance | 146 (51.8%) | 136 (48.2%) |
| Real Estate, Rental & Leasing | 10 (76.9%) | 3 (23.1%) |
| Professional & Scientific | 4 (19.1%) | 17 (80.9%) |
| Enterprise Management | 0 (0.0%) | 0 (0.0%) |
| Administrative & Support | 65 (67.0%) | 32 (33.0%) |
| Educational Services | 23 (13.4%) | 149 (86.6%) |
| Health Care & Social Assistance | 74 (14.8%) | 426 (85.2%) |
| Arts, Entertainment & Recreation | 59 (77.6%) | 17 (22.4%) |
| Accommodation & Food Services | 153 (76.5%) | 47 (23.5%) |
| Public Administration | 37 (60.7%) | 24 (39.3%) |
| Total | 1,070 (45.1%) | 1,303 (54.9%) |
Education in Canastota
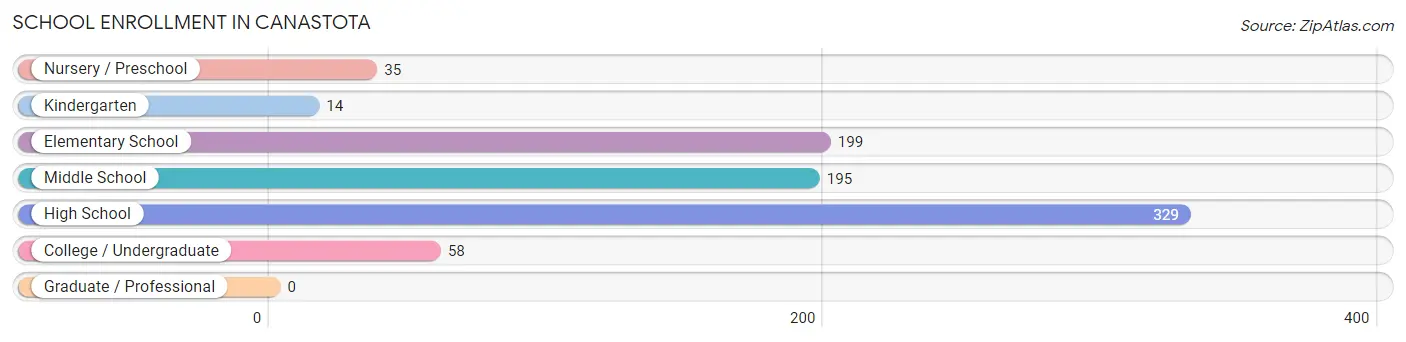
School Enrollment in Canastota
The most common levels of schooling among the 830 students in Canastota are high school (329 | 39.6%), elementary school (199 | 24.0%), and middle school (195 | 23.5%).
| School Level | # Students | % Students |
| Nursery / Preschool | 35 | 4.2% |
| Kindergarten | 14 | 1.7% |
| Elementary School | 199 | 24.0% |
| Middle School | 195 | 23.5% |
| High School | 329 | 39.6% |
| College / Undergraduate | 58 | 7.0% |
| Graduate / Professional | 0 | 0.0% |
| Total | 830 | 100.0% |
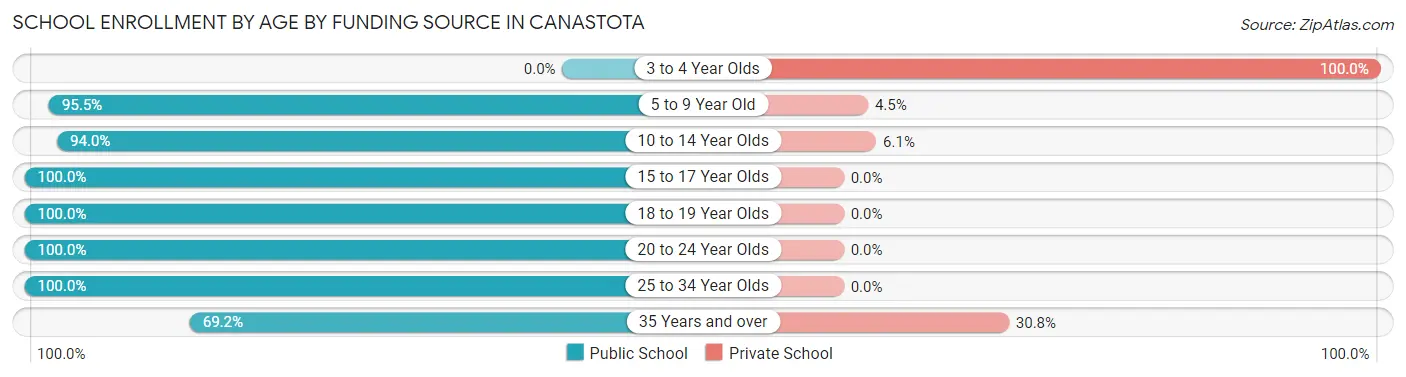
School Enrollment by Age by Funding Source in Canastota
Out of a total of 830 students who are enrolled in schools in Canastota, 41 (4.9%) attend a private institution, while the remaining 789 (95.1%) are enrolled in public schools. The age group of 3 to 4 year olds has the highest likelihood of being enrolled in private schools, with 5 (100.0% in the age bracket) enrolled. Conversely, the age group of 15 to 17 year olds has the lowest likelihood of being enrolled in a private school, with 168 (100.0% in the age bracket) attending a public institution.
| Age Bracket | Public School | Private School |
| 3 to 4 Year Olds | 0 (0.0%) | 5 (100.0%) |
| 5 to 9 Year Old | 232 (95.5%) | 11 (4.5%) |
| 10 to 14 Year Olds | 326 (94.0%) | 21 (6.0%) |
| 15 to 17 Year Olds | 168 (100.0%) | 0 (0.0%) |
| 18 to 19 Year Olds | 17 (100.0%) | 0 (0.0%) |
| 20 to 24 Year Olds | 5 (100.0%) | 0 (0.0%) |
| 25 to 34 Year Olds | 32 (100.0%) | 0 (0.0%) |
| 35 Years and over | 9 (69.2%) | 4 (30.8%) |
| Total | 789 (95.1%) | 41 (4.9%) |
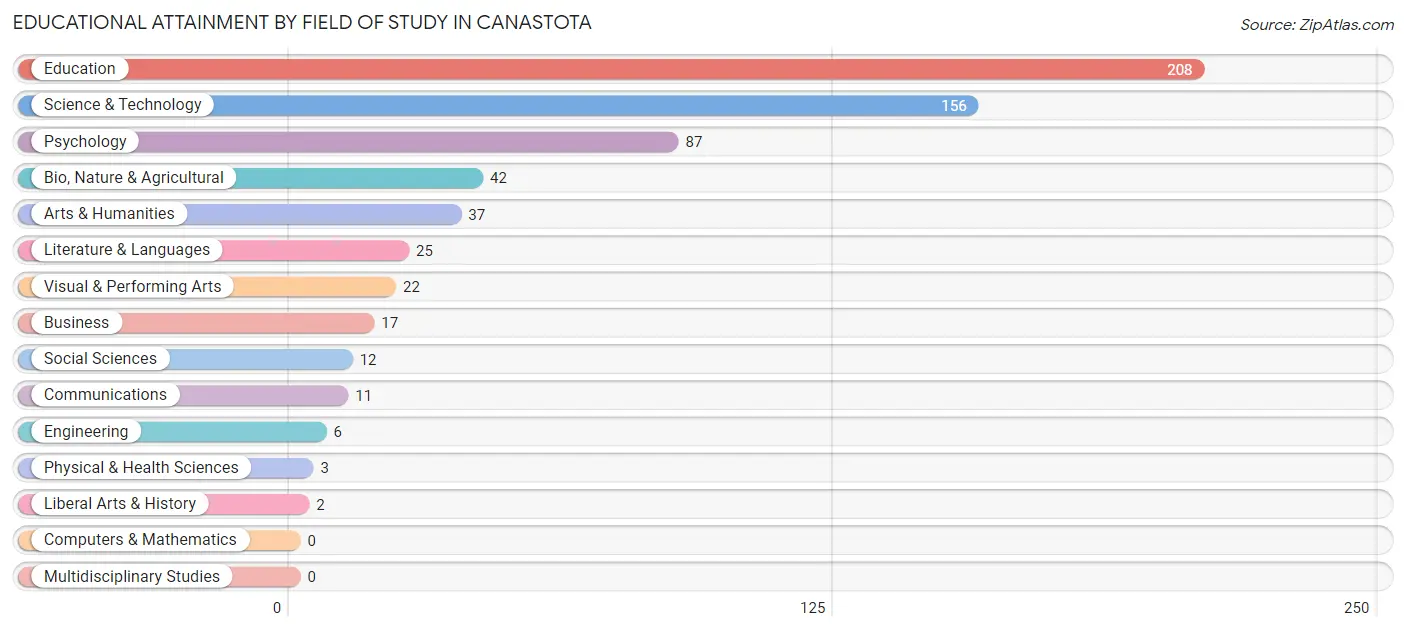
Educational Attainment by Field of Study in Canastota
Education (208 | 33.1%), science & technology (156 | 24.8%), psychology (87 | 13.9%), bio, nature & agricultural (42 | 6.7%), and arts & humanities (37 | 5.9%) are the most common fields of study among 628 individuals in Canastota who have obtained a bachelor's degree or higher.
| Field of Study | # Graduates | % Graduates |
| Computers & Mathematics | 0 | 0.0% |
| Bio, Nature & Agricultural | 42 | 6.7% |
| Physical & Health Sciences | 3 | 0.5% |
| Psychology | 87 | 13.9% |
| Social Sciences | 12 | 1.9% |
| Engineering | 6 | 1.0% |
| Multidisciplinary Studies | 0 | 0.0% |
| Science & Technology | 156 | 24.8% |
| Business | 17 | 2.7% |
| Education | 208 | 33.1% |
| Literature & Languages | 25 | 4.0% |
| Liberal Arts & History | 2 | 0.3% |
| Visual & Performing Arts | 22 | 3.5% |
| Communications | 11 | 1.8% |
| Arts & Humanities | 37 | 5.9% |
| Total | 628 | 100.0% |
Transportation & Commute in Canastota
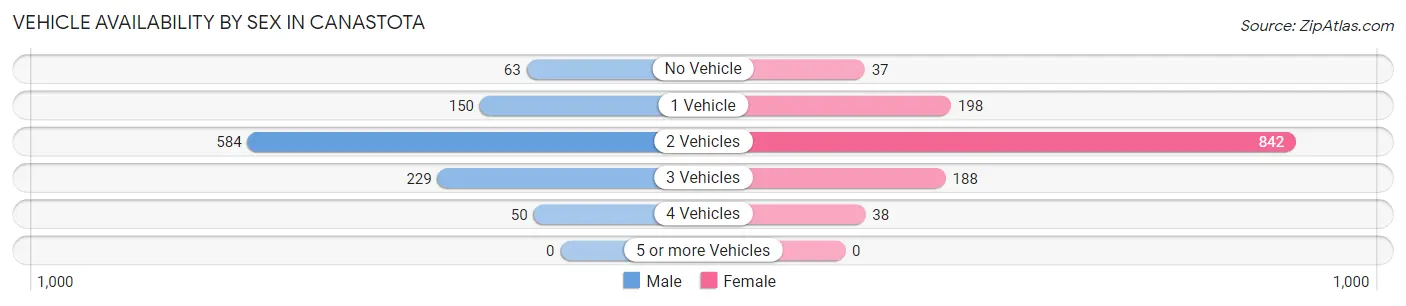
Vehicle Availability by Sex in Canastota
The most prevalent vehicle ownership categories in Canastota are males with 2 vehicles (584, accounting for 54.3%) and females with 2 vehicles (842, making up 44.8%).
| Vehicles Available | Male | Female |
| No Vehicle | 63 (5.9%) | 37 (2.8%) |
| 1 Vehicle | 150 (13.9%) | 198 (15.2%) |
| 2 Vehicles | 584 (54.3%) | 842 (64.6%) |
| 3 Vehicles | 229 (21.3%) | 188 (14.4%) |
| 4 Vehicles | 50 (4.6%) | 38 (2.9%) |
| 5 or more Vehicles | 0 (0.0%) | 0 (0.0%) |
| Total | 1,076 (100.0%) | 1,303 (100.0%) |
Commute Time in Canastota
The most frequently occuring commute durations in Canastota are 30 to 34 minutes (641 commuters, 28.3%), 25 to 29 minutes (380 commuters, 16.8%), and 20 to 24 minutes (351 commuters, 15.5%).
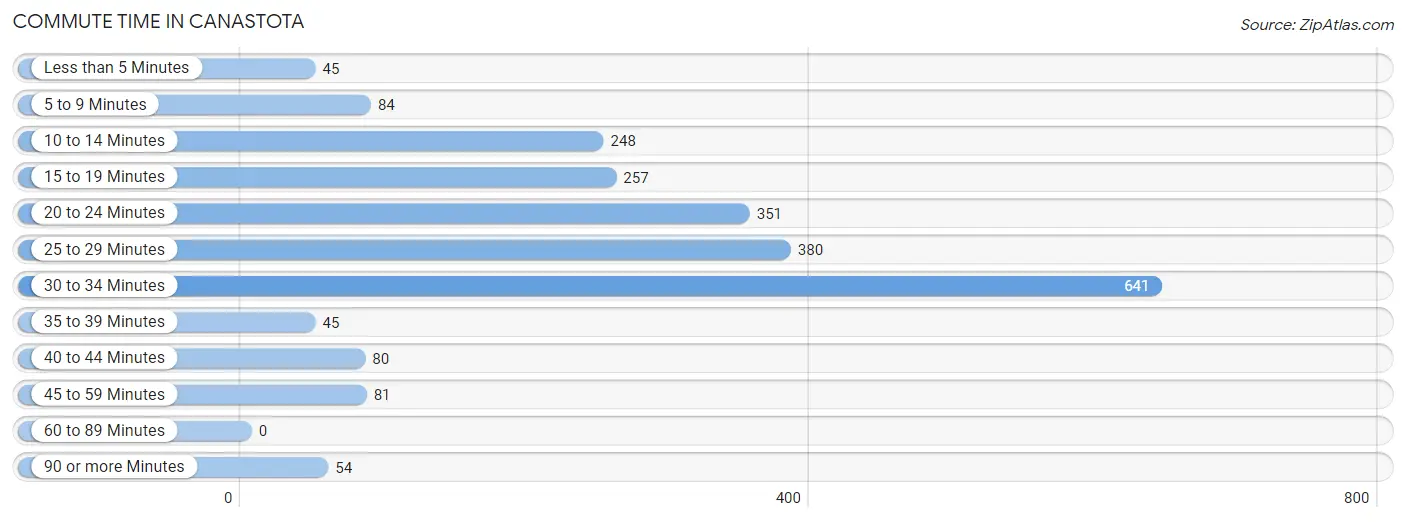
| Commute Time | # Commuters | % Commuters |
| Less than 5 Minutes | 45 | 2.0% |
| 5 to 9 Minutes | 84 | 3.7% |
| 10 to 14 Minutes | 248 | 10.9% |
| 15 to 19 Minutes | 257 | 11.3% |
| 20 to 24 Minutes | 351 | 15.5% |
| 25 to 29 Minutes | 380 | 16.8% |
| 30 to 34 Minutes | 641 | 28.3% |
| 35 to 39 Minutes | 45 | 2.0% |
| 40 to 44 Minutes | 80 | 3.5% |
| 45 to 59 Minutes | 81 | 3.6% |
| 60 to 89 Minutes | 0 | 0.0% |
| 90 or more Minutes | 54 | 2.4% |
Commute Time by Sex in Canastota
The most common commute times in Canastota are 30 to 34 minutes (226 commuters, 21.8%) for males and 30 to 34 minutes (415 commuters, 33.7%) for females.
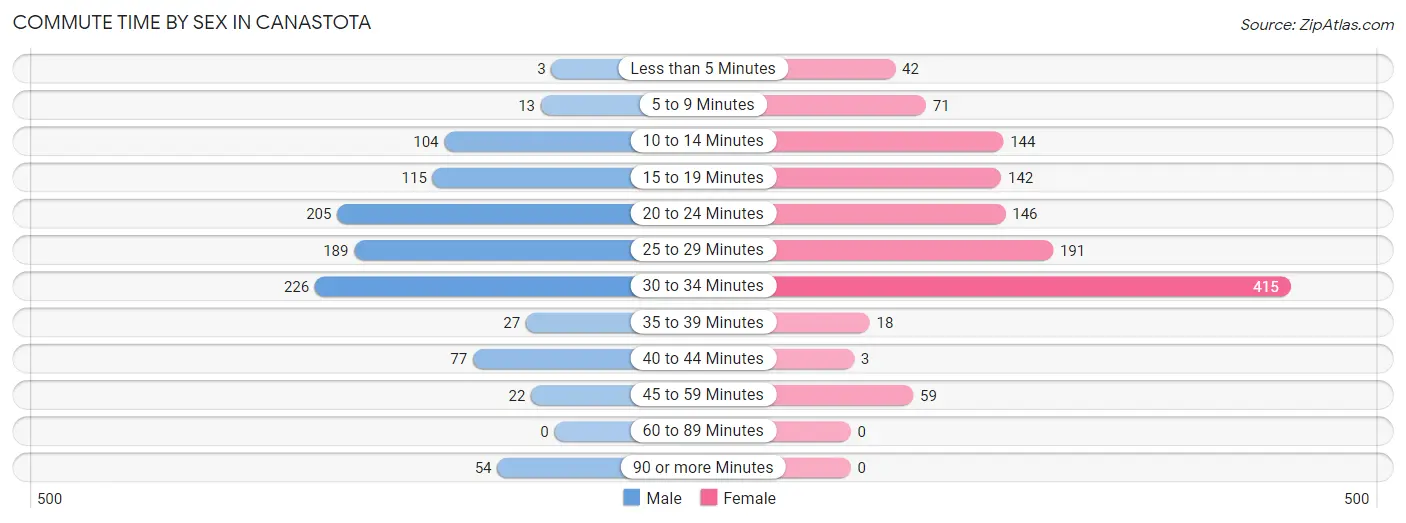
| Commute Time | Male | Female |
| Less than 5 Minutes | 3 (0.3%) | 42 (3.4%) |
| 5 to 9 Minutes | 13 (1.3%) | 71 (5.8%) |
| 10 to 14 Minutes | 104 (10.1%) | 144 (11.7%) |
| 15 to 19 Minutes | 115 (11.1%) | 142 (11.5%) |
| 20 to 24 Minutes | 205 (19.8%) | 146 (11.9%) |
| 25 to 29 Minutes | 189 (18.3%) | 191 (15.5%) |
| 30 to 34 Minutes | 226 (21.8%) | 415 (33.7%) |
| 35 to 39 Minutes | 27 (2.6%) | 18 (1.5%) |
| 40 to 44 Minutes | 77 (7.4%) | 3 (0.2%) |
| 45 to 59 Minutes | 22 (2.1%) | 59 (4.8%) |
| 60 to 89 Minutes | 0 (0.0%) | 0 (0.0%) |
| 90 or more Minutes | 54 (5.2%) | 0 (0.0%) |
Time of Departure to Work by Sex in Canastota
The most frequent times of departure to work in Canastota are 7:00 AM to 7:29 AM (270, 26.1%) for males and 7:00 AM to 7:29 AM (303, 24.6%) for females.
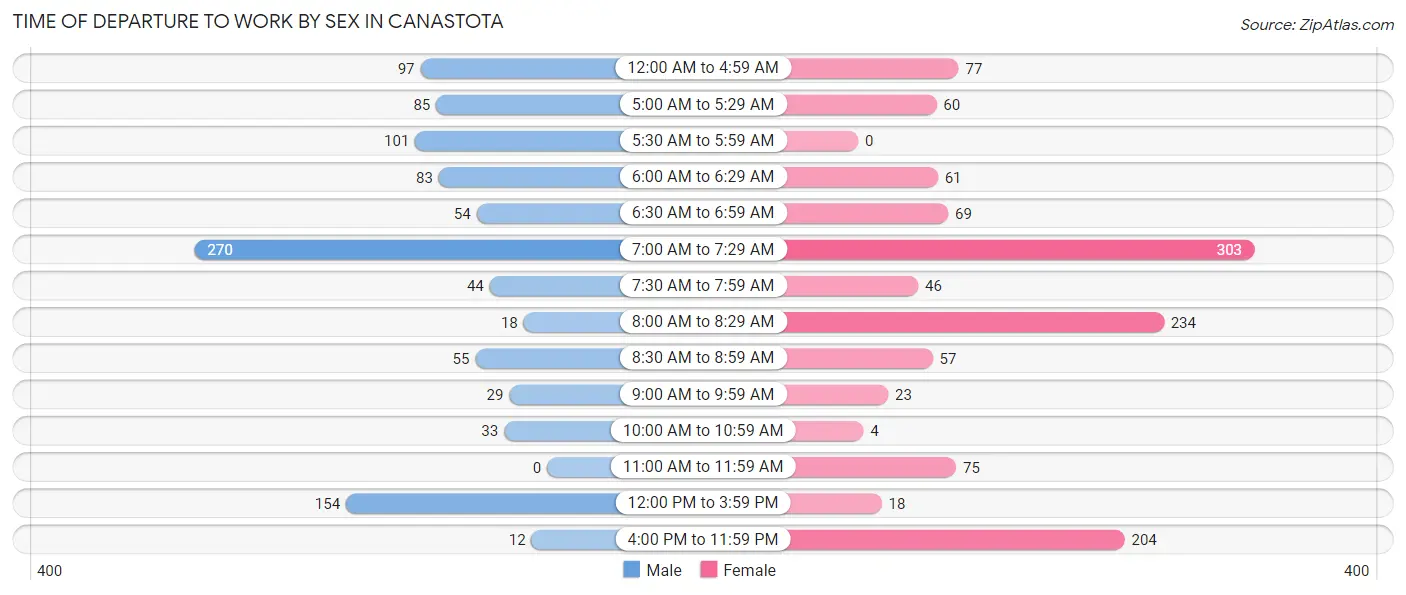
| Time of Departure | Male | Female |
| 12:00 AM to 4:59 AM | 97 (9.4%) | 77 (6.3%) |
| 5:00 AM to 5:29 AM | 85 (8.2%) | 60 (4.9%) |
| 5:30 AM to 5:59 AM | 101 (9.8%) | 0 (0.0%) |
| 6:00 AM to 6:29 AM | 83 (8.0%) | 61 (5.0%) |
| 6:30 AM to 6:59 AM | 54 (5.2%) | 69 (5.6%) |
| 7:00 AM to 7:29 AM | 270 (26.1%) | 303 (24.6%) |
| 7:30 AM to 7:59 AM | 44 (4.3%) | 46 (3.7%) |
| 8:00 AM to 8:29 AM | 18 (1.7%) | 234 (19.0%) |
| 8:30 AM to 8:59 AM | 55 (5.3%) | 57 (4.6%) |
| 9:00 AM to 9:59 AM | 29 (2.8%) | 23 (1.9%) |
| 10:00 AM to 10:59 AM | 33 (3.2%) | 4 (0.3%) |
| 11:00 AM to 11:59 AM | 0 (0.0%) | 75 (6.1%) |
| 12:00 PM to 3:59 PM | 154 (14.9%) | 18 (1.5%) |
| 4:00 PM to 11:59 PM | 12 (1.2%) | 204 (16.6%) |
| Total | 1,035 (100.0%) | 1,231 (100.0%) |
Housing Occupancy in Canastota
Occupancy by Ownership in Canastota
Of the total 1,837 dwellings in Canastota, owner-occupied units account for 1,170 (63.7%), while renter-occupied units make up 667 (36.3%).
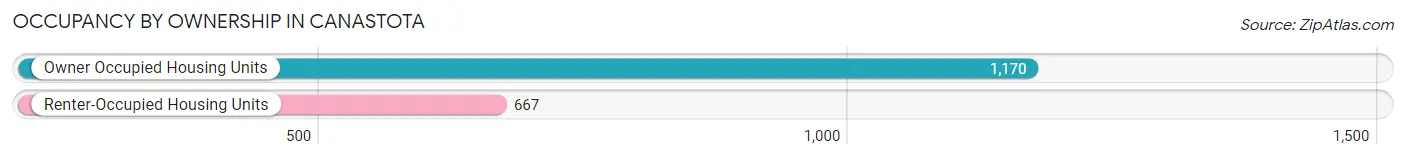
| Occupancy | # Housing Units | % Housing Units |
| Owner Occupied Housing Units | 1,170 | 63.7% |
| Renter-Occupied Housing Units | 667 | 36.3% |
| Total Occupied Housing Units | 1,837 | 100.0% |
Occupancy by Household Size in Canastota
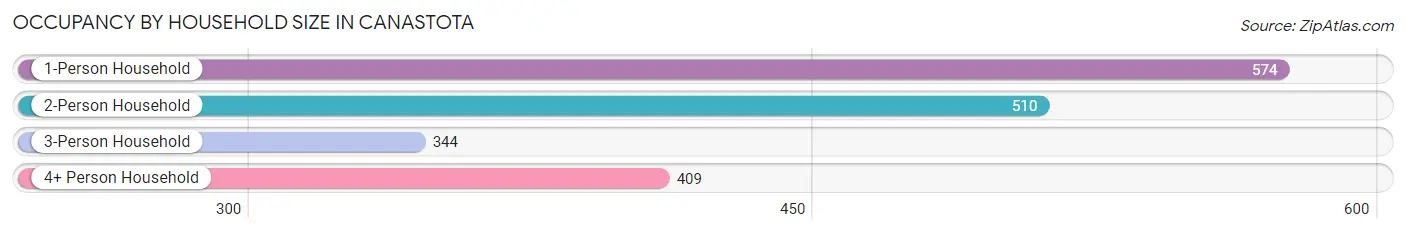
| Household Size | # Housing Units | % Housing Units |
| 1-Person Household | 574 | 31.2% |
| 2-Person Household | 510 | 27.8% |
| 3-Person Household | 344 | 18.7% |
| 4+ Person Household | 409 | 22.3% |
| Total Housing Units | 1,837 | 100.0% |
Occupancy by Ownership by Household Size in Canastota
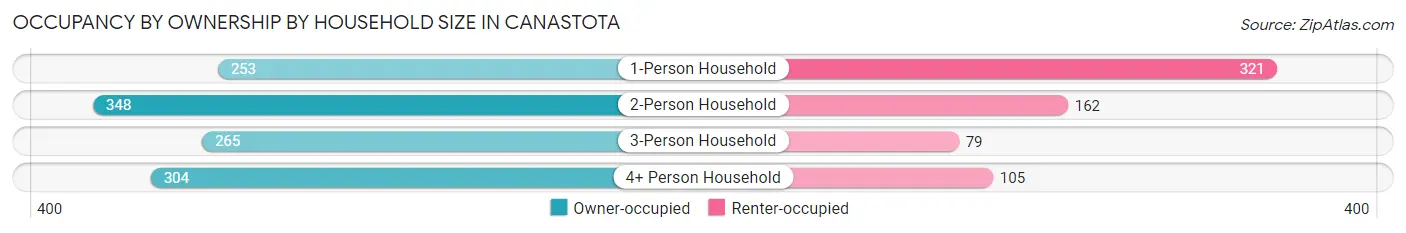
| Household Size | Owner-occupied | Renter-occupied |
| 1-Person Household | 253 (44.1%) | 321 (55.9%) |
| 2-Person Household | 348 (68.2%) | 162 (31.8%) |
| 3-Person Household | 265 (77.0%) | 79 (23.0%) |
| 4+ Person Household | 304 (74.3%) | 105 (25.7%) |
| Total Housing Units | 1,170 (63.7%) | 667 (36.3%) |
Occupancy by Educational Attainment in Canastota
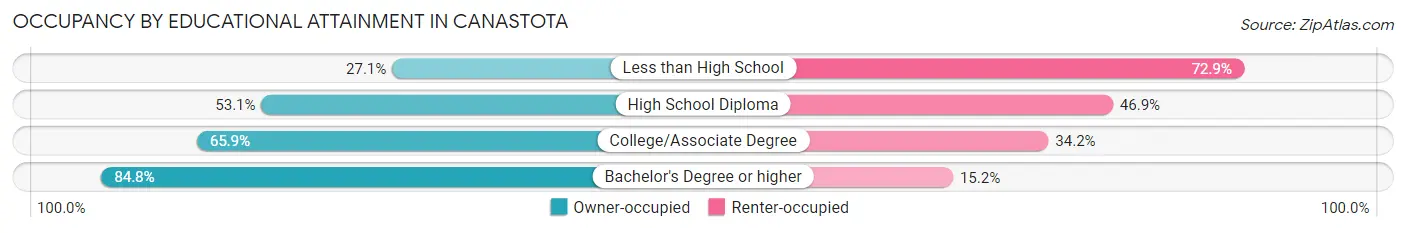
| Household Size | Owner-occupied | Renter-occupied |
| Less than High School | 35 (27.1%) | 94 (72.9%) |
| High School Diploma | 303 (53.1%) | 268 (46.9%) |
| College/Associate Degree | 459 (65.8%) | 238 (34.2%) |
| Bachelor's Degree or higher | 373 (84.8%) | 67 (15.2%) |
Occupancy by Age of Householder in Canastota
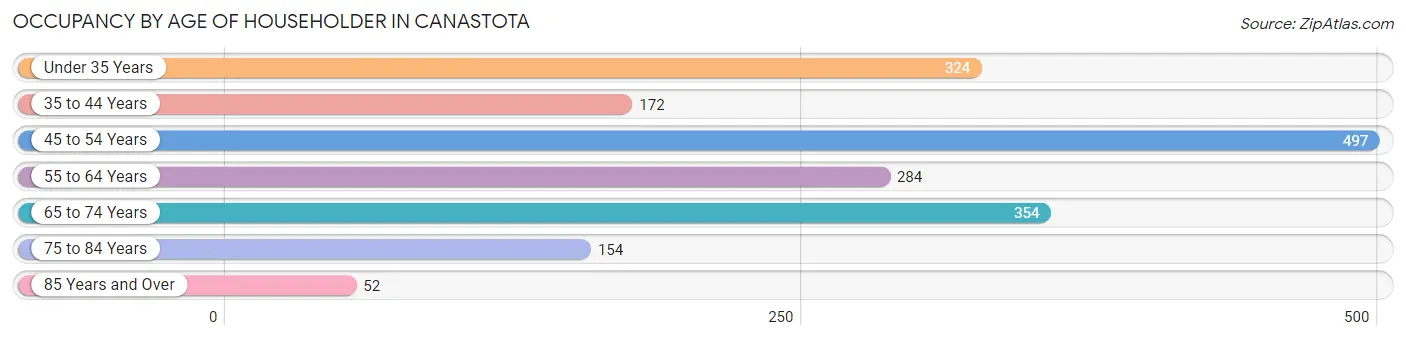
| Age Bracket | # Households | % Households |
| Under 35 Years | 324 | 17.6% |
| 35 to 44 Years | 172 | 9.4% |
| 45 to 54 Years | 497 | 27.1% |
| 55 to 64 Years | 284 | 15.5% |
| 65 to 74 Years | 354 | 19.3% |
| 75 to 84 Years | 154 | 8.4% |
| 85 Years and Over | 52 | 2.8% |
| Total | 1,837 | 100.0% |
Housing Finances in Canastota
Median Income by Occupancy in Canastota
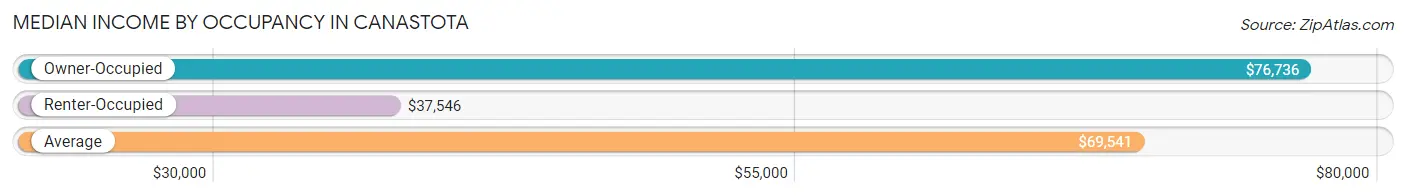
| Occupancy Type | # Households | Median Income |
| Owner-Occupied | 1,170 (63.7%) | $76,736 |
| Renter-Occupied | 667 (36.3%) | $37,546 |
| Average | 1,837 (100.0%) | $69,541 |
Occupancy by Householder Income Bracket in Canastota
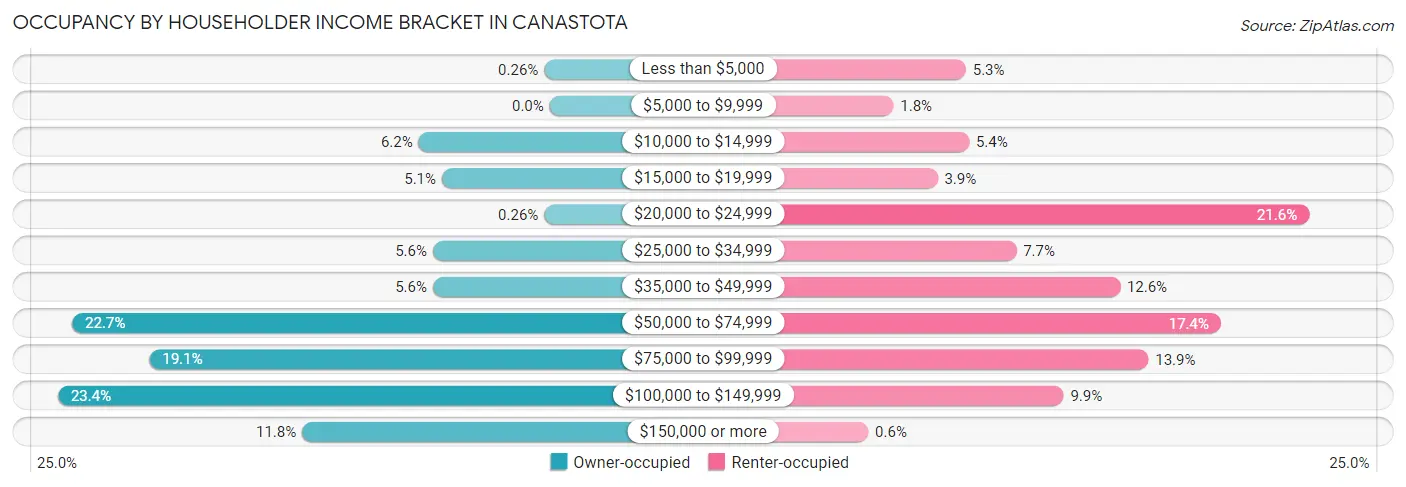
| Income Bracket | Owner-occupied | Renter-occupied |
| Less than $5,000 | 3 (0.3%) | 35 (5.2%) |
| $5,000 to $9,999 | 0 (0.0%) | 12 (1.8%) |
| $10,000 to $14,999 | 73 (6.2%) | 36 (5.4%) |
| $15,000 to $19,999 | 60 (5.1%) | 26 (3.9%) |
| $20,000 to $24,999 | 3 (0.3%) | 144 (21.6%) |
| $25,000 to $34,999 | 65 (5.6%) | 51 (7.6%) |
| $35,000 to $49,999 | 65 (5.6%) | 84 (12.6%) |
| $50,000 to $74,999 | 266 (22.7%) | 116 (17.4%) |
| $75,000 to $99,999 | 223 (19.1%) | 93 (13.9%) |
| $100,000 to $149,999 | 274 (23.4%) | 66 (9.9%) |
| $150,000 or more | 138 (11.8%) | 4 (0.6%) |
| Total | 1,170 (100.0%) | 667 (100.0%) |
Monthly Housing Cost Tiers in Canastota
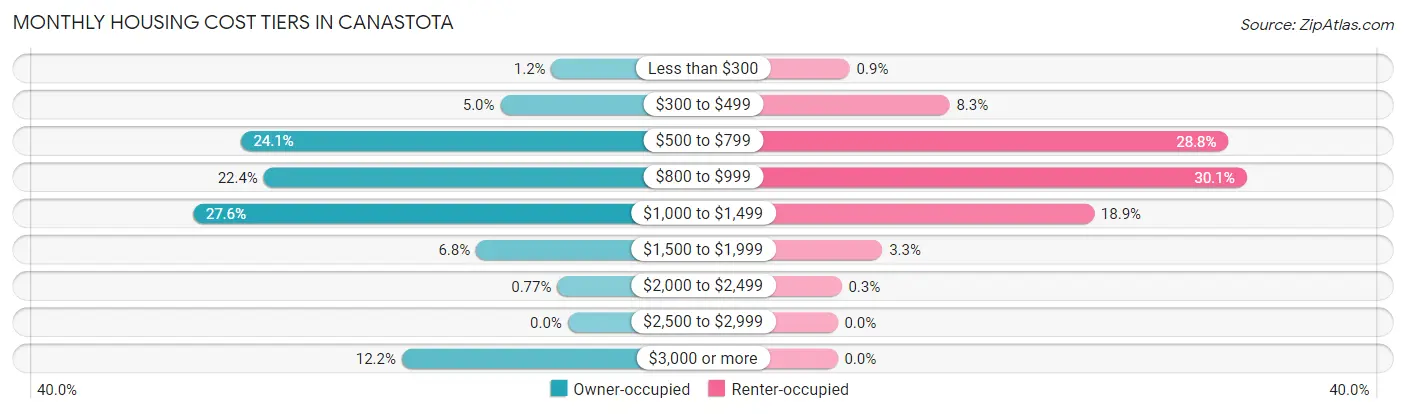
| Monthly Cost | Owner-occupied | Renter-occupied |
| Less than $300 | 14 (1.2%) | 6 (0.9%) |
| $300 to $499 | 58 (5.0%) | 55 (8.3%) |
| $500 to $799 | 282 (24.1%) | 192 (28.8%) |
| $800 to $999 | 262 (22.4%) | 201 (30.1%) |
| $1,000 to $1,499 | 323 (27.6%) | 126 (18.9%) |
| $1,500 to $1,999 | 79 (6.8%) | 22 (3.3%) |
| $2,000 to $2,499 | 9 (0.8%) | 2 (0.3%) |
| $2,500 to $2,999 | 0 (0.0%) | 0 (0.0%) |
| $3,000 or more | 143 (12.2%) | 0 (0.0%) |
| Total | 1,170 (100.0%) | 667 (100.0%) |
Physical Housing Characteristics in Canastota
Housing Structures in Canastota
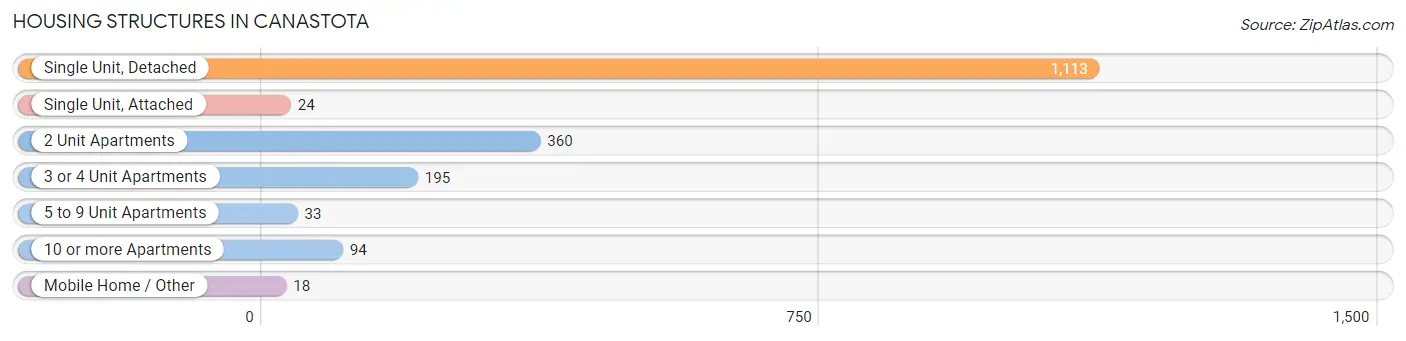
| Structure Type | # Housing Units | % Housing Units |
| Single Unit, Detached | 1,113 | 60.6% |
| Single Unit, Attached | 24 | 1.3% |
| 2 Unit Apartments | 360 | 19.6% |
| 3 or 4 Unit Apartments | 195 | 10.6% |
| 5 to 9 Unit Apartments | 33 | 1.8% |
| 10 or more Apartments | 94 | 5.1% |
| Mobile Home / Other | 18 | 1.0% |
| Total | 1,837 | 100.0% |
Housing Structures by Occupancy in Canastota
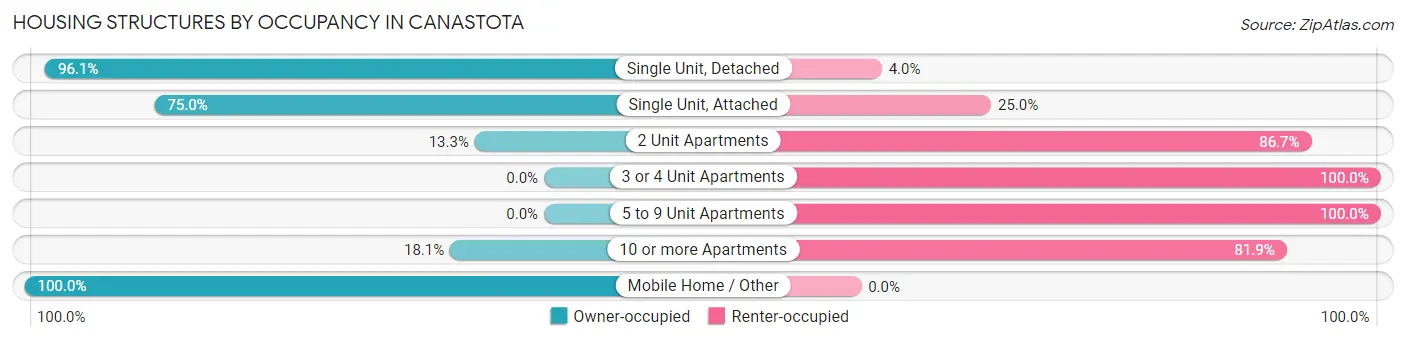
| Structure Type | Owner-occupied | Renter-occupied |
| Single Unit, Detached | 1,069 (96.1%) | 44 (4.0%) |
| Single Unit, Attached | 18 (75.0%) | 6 (25.0%) |
| 2 Unit Apartments | 48 (13.3%) | 312 (86.7%) |
| 3 or 4 Unit Apartments | 0 (0.0%) | 195 (100.0%) |
| 5 to 9 Unit Apartments | 0 (0.0%) | 33 (100.0%) |
| 10 or more Apartments | 17 (18.1%) | 77 (81.9%) |
| Mobile Home / Other | 18 (100.0%) | 0 (0.0%) |
| Total | 1,170 (63.7%) | 667 (36.3%) |
Housing Structures by Number of Rooms in Canastota
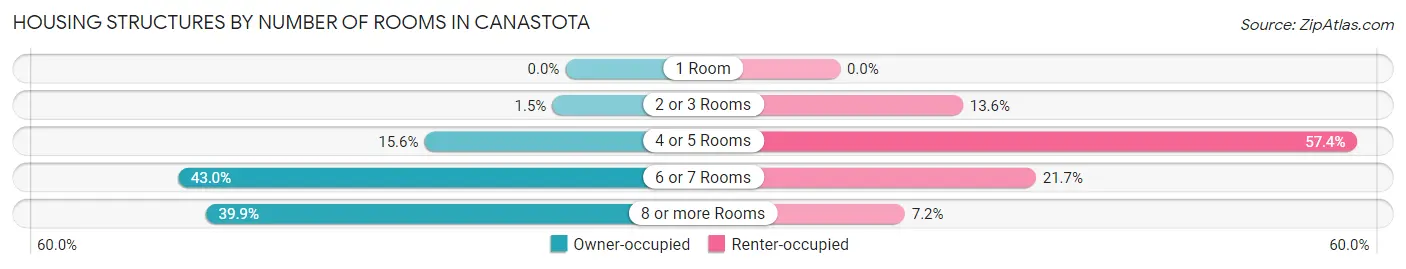
| Number of Rooms | Owner-occupied | Renter-occupied |
| 1 Room | 0 (0.0%) | 0 (0.0%) |
| 2 or 3 Rooms | 17 (1.5%) | 91 (13.6%) |
| 4 or 5 Rooms | 183 (15.6%) | 383 (57.4%) |
| 6 or 7 Rooms | 503 (43.0%) | 145 (21.7%) |
| 8 or more Rooms | 467 (39.9%) | 48 (7.2%) |
| Total | 1,170 (100.0%) | 667 (100.0%) |
Housing Structure by Heating Type in Canastota
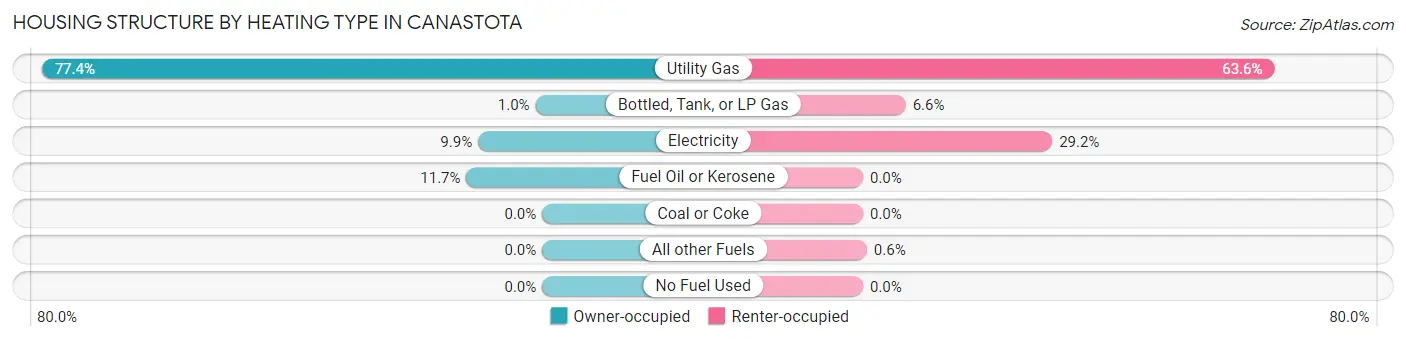
| Heating Type | Owner-occupied | Renter-occupied |
| Utility Gas | 905 (77.3%) | 424 (63.6%) |
| Bottled, Tank, or LP Gas | 12 (1.0%) | 44 (6.6%) |
| Electricity | 116 (9.9%) | 195 (29.2%) |
| Fuel Oil or Kerosene | 137 (11.7%) | 0 (0.0%) |
| Coal or Coke | 0 (0.0%) | 0 (0.0%) |
| All other Fuels | 0 (0.0%) | 4 (0.6%) |
| No Fuel Used | 0 (0.0%) | 0 (0.0%) |
| Total | 1,170 (100.0%) | 667 (100.0%) |
Household Vehicle Usage in Canastota
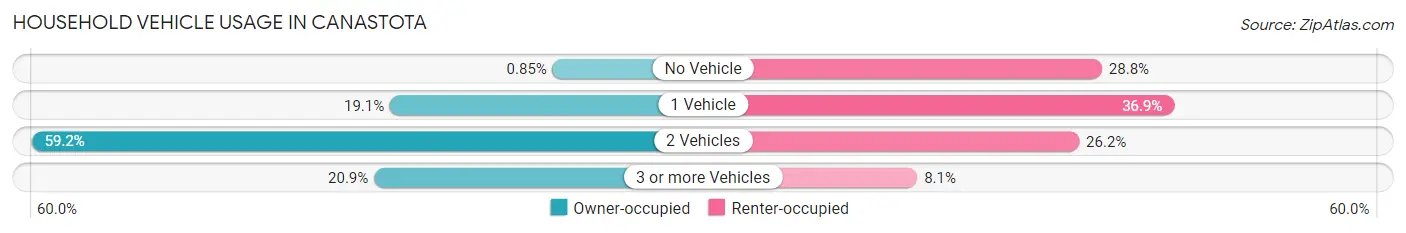
| Vehicles per Household | Owner-occupied | Renter-occupied |
| No Vehicle | 10 (0.9%) | 192 (28.8%) |
| 1 Vehicle | 223 (19.1%) | 246 (36.9%) |
| 2 Vehicles | 693 (59.2%) | 175 (26.2%) |
| 3 or more Vehicles | 244 (20.8%) | 54 (8.1%) |
| Total | 1,170 (100.0%) | 667 (100.0%) |
Real Estate & Mortgages in Canastota
Real Estate and Mortgage Overview in Canastota
| Characteristic | Without Mortgage | With Mortgage |
| Housing Units | 356 | 814 |
| Median Property Value | $142,400 | $128,200 |
| Median Household Income | $57,368 | $124 |
| Monthly Housing Costs | $740 | $140 |
| Real Estate Taxes | $5,518 | $3 |
Property Value by Mortgage Status in Canastota
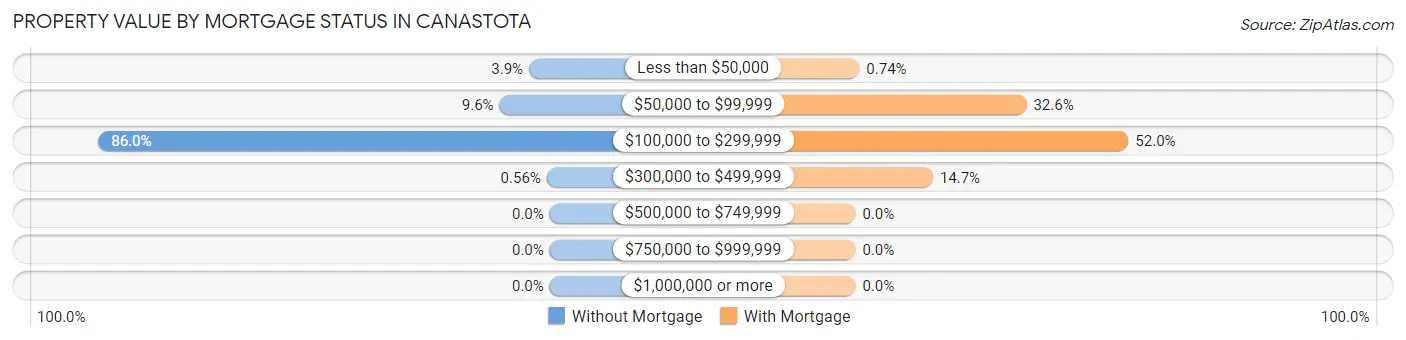
| Property Value | Without Mortgage | With Mortgage |
| Less than $50,000 | 14 (3.9%) | 6 (0.7%) |
| $50,000 to $99,999 | 34 (9.6%) | 265 (32.6%) |
| $100,000 to $299,999 | 306 (86.0%) | 423 (52.0%) |
| $300,000 to $499,999 | 2 (0.6%) | 120 (14.7%) |
| $500,000 to $749,999 | 0 (0.0%) | 0 (0.0%) |
| $750,000 to $999,999 | 0 (0.0%) | 0 (0.0%) |
| $1,000,000 or more | 0 (0.0%) | 0 (0.0%) |
| Total | 356 (100.0%) | 814 (100.0%) |
Household Income by Mortgage Status in Canastota
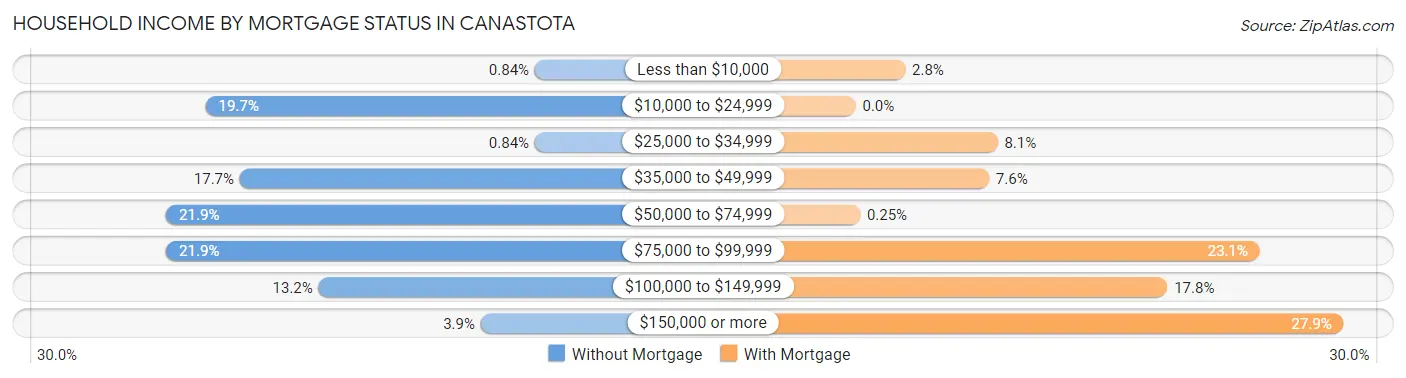
| Household Income | Without Mortgage | With Mortgage |
| Less than $10,000 | 3 (0.8%) | 23 (2.8%) |
| $10,000 to $24,999 | 70 (19.7%) | 0 (0.0%) |
| $25,000 to $34,999 | 3 (0.8%) | 66 (8.1%) |
| $35,000 to $49,999 | 63 (17.7%) | 62 (7.6%) |
| $50,000 to $74,999 | 78 (21.9%) | 2 (0.3%) |
| $75,000 to $99,999 | 78 (21.9%) | 188 (23.1%) |
| $100,000 to $149,999 | 47 (13.2%) | 145 (17.8%) |
| $150,000 or more | 14 (3.9%) | 227 (27.9%) |
| Total | 356 (100.0%) | 814 (100.0%) |
Property Value to Household Income Ratio in Canastota
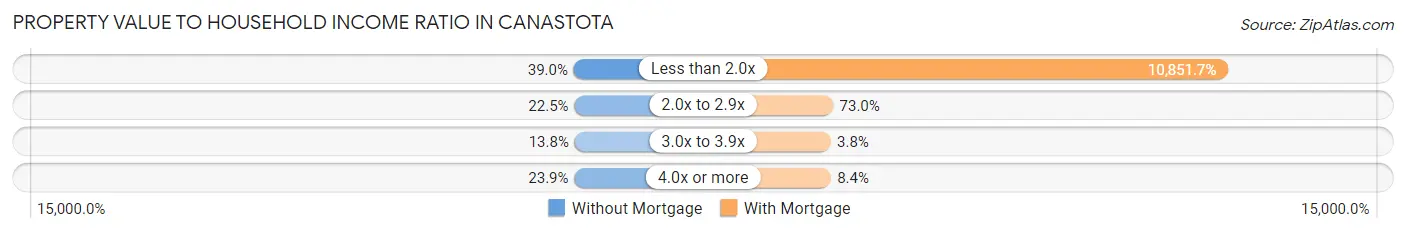
| Value-to-Income Ratio | Without Mortgage | With Mortgage |
| Less than 2.0x | 139 (39.0%) | 88,333 (10,851.7%) |
| 2.0x to 2.9x | 80 (22.5%) | 594 (73.0%) |
| 3.0x to 3.9x | 49 (13.8%) | 31 (3.8%) |
| 4.0x or more | 85 (23.9%) | 68 (8.4%) |
| Total | 356 (100.0%) | 814 (100.0%) |
Real Estate Taxes by Mortgage Status in Canastota
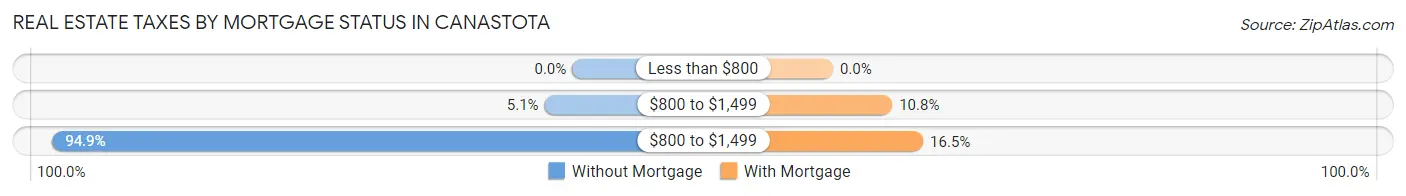
| Property Taxes | Without Mortgage | With Mortgage |
| Less than $800 | 0 (0.0%) | 0 (0.0%) |
| $800 to $1,499 | 18 (5.1%) | 88 (10.8%) |
| $800 to $1,499 | 338 (94.9%) | 134 (16.5%) |
| Total | 356 (100.0%) | 814 (100.0%) |
Health & Disability in Canastota
Health Insurance Coverage by Age in Canastota
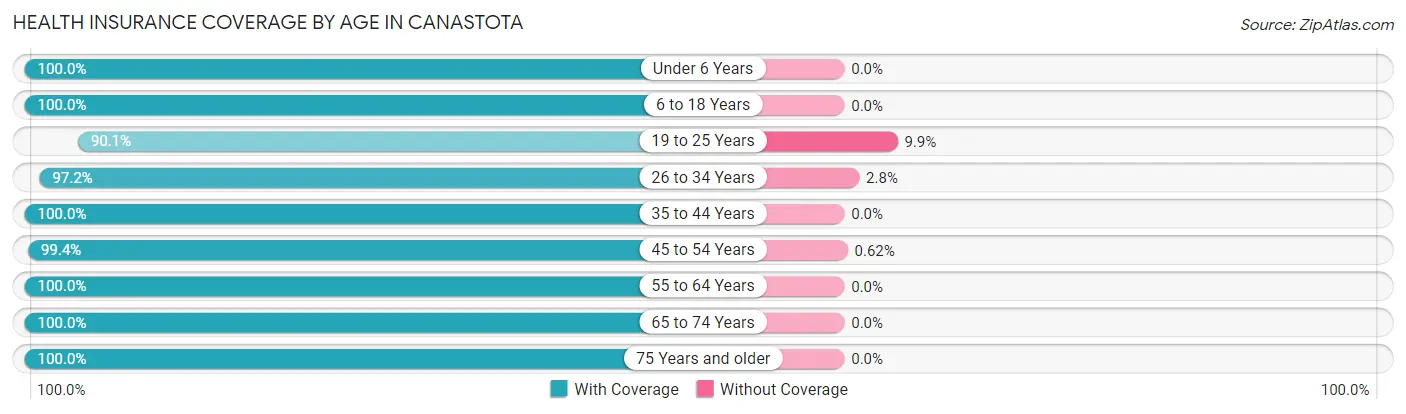
| Age Bracket | With Coverage | Without Coverage |
| Under 6 Years | 321 (100.0%) | 0 (0.0%) |
| 6 to 18 Years | 737 (100.0%) | 0 (0.0%) |
| 19 to 25 Years | 227 (90.1%) | 25 (9.9%) |
| 26 to 34 Years | 596 (97.2%) | 17 (2.8%) |
| 35 to 44 Years | 557 (100.0%) | 0 (0.0%) |
| 45 to 54 Years | 807 (99.4%) | 5 (0.6%) |
| 55 to 64 Years | 484 (100.0%) | 0 (0.0%) |
| 65 to 74 Years | 522 (100.0%) | 0 (0.0%) |
| 75 Years and older | 238 (100.0%) | 0 (0.0%) |
| Total | 4,489 (99.0%) | 47 (1.0%) |
Health Insurance Coverage by Citizenship Status in Canastota
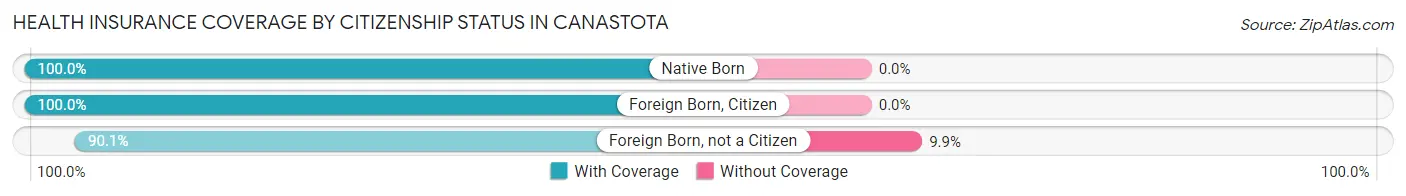
| Citizenship Status | With Coverage | Without Coverage |
| Native Born | 321 (100.0%) | 0 (0.0%) |
| Foreign Born, Citizen | 737 (100.0%) | 0 (0.0%) |
| Foreign Born, not a Citizen | 227 (90.1%) | 25 (9.9%) |
Health Insurance Coverage by Household Income in Canastota
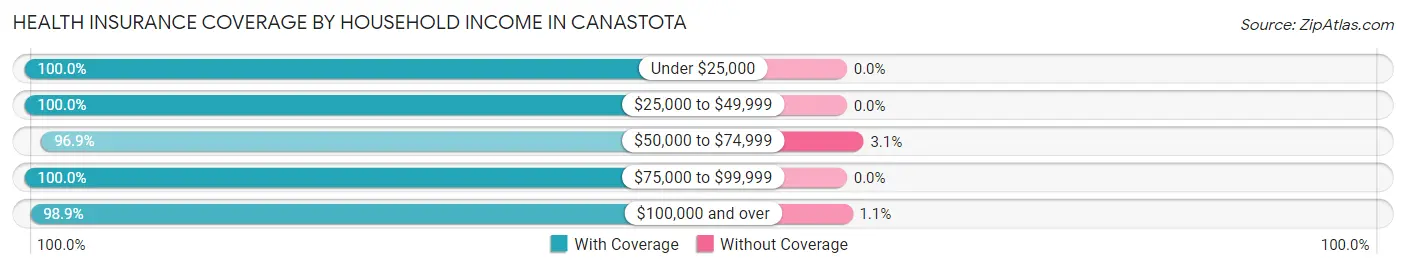
| Household Income | With Coverage | Without Coverage |
| Under $25,000 | 583 (100.0%) | 0 (0.0%) |
| $25,000 to $49,999 | 507 (100.0%) | 0 (0.0%) |
| $50,000 to $74,999 | 930 (96.9%) | 30 (3.1%) |
| $75,000 to $99,999 | 866 (100.0%) | 0 (0.0%) |
| $100,000 and over | 1,581 (98.9%) | 17 (1.1%) |
Public vs Private Health Insurance Coverage by Age in Canastota
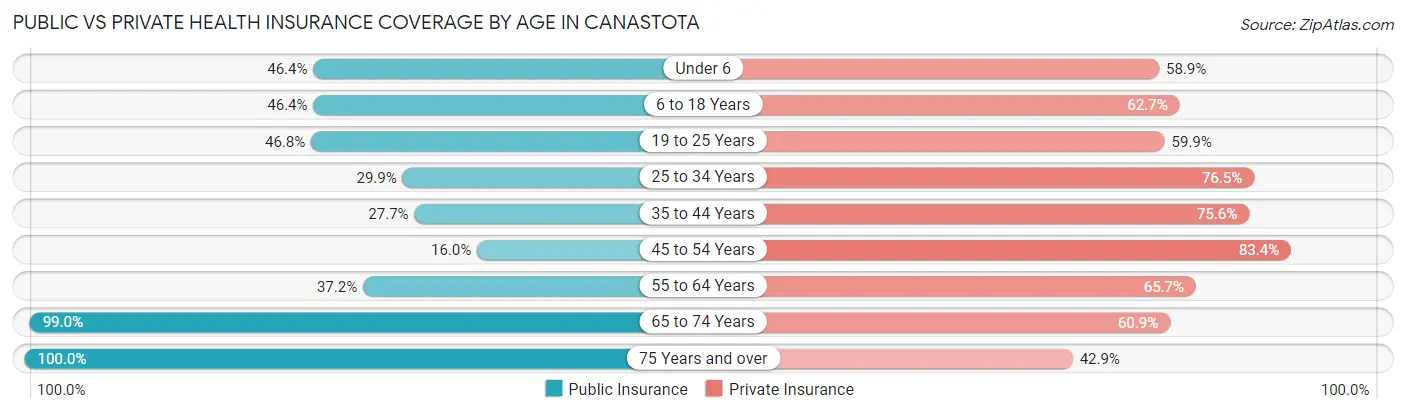
| Age Bracket | Public Insurance | Private Insurance |
| Under 6 | 149 (46.4%) | 189 (58.9%) |
| 6 to 18 Years | 342 (46.4%) | 462 (62.7%) |
| 19 to 25 Years | 118 (46.8%) | 151 (59.9%) |
| 25 to 34 Years | 183 (29.8%) | 469 (76.5%) |
| 35 to 44 Years | 154 (27.7%) | 421 (75.6%) |
| 45 to 54 Years | 130 (16.0%) | 677 (83.4%) |
| 55 to 64 Years | 180 (37.2%) | 318 (65.7%) |
| 65 to 74 Years | 517 (99.0%) | 318 (60.9%) |
| 75 Years and over | 238 (100.0%) | 102 (42.9%) |
| Total | 2,011 (44.3%) | 3,107 (68.5%) |
Disability Status by Sex by Age in Canastota
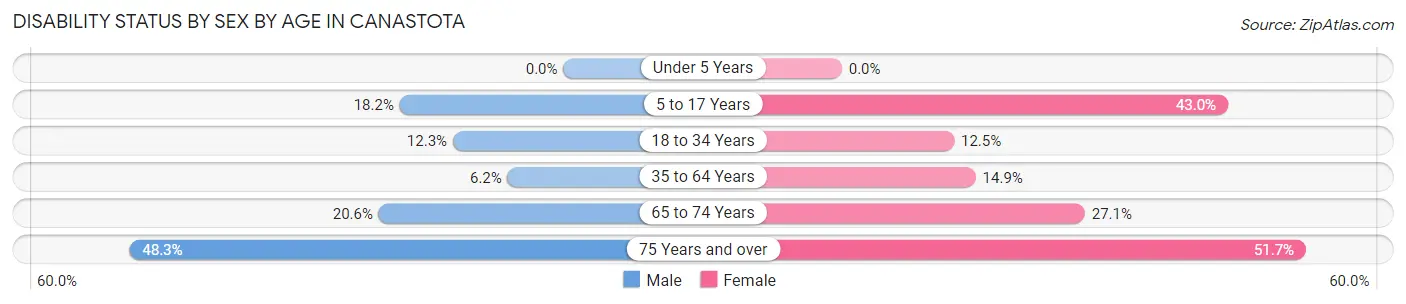
| Age Bracket | Male | Female |
| Under 5 Years | 0 (0.0%) | 0 (0.0%) |
| 5 to 17 Years | 80 (18.2%) | 169 (43.0%) |
| 18 to 34 Years | 61 (12.3%) | 48 (12.5%) |
| 35 to 64 Years | 53 (6.2%) | 149 (14.9%) |
| 65 to 74 Years | 45 (20.5%) | 82 (27.1%) |
| 75 Years and over | 29 (48.3%) | 92 (51.7%) |
Disability Class by Sex by Age in Canastota
Disability Class: Hearing Difficulty
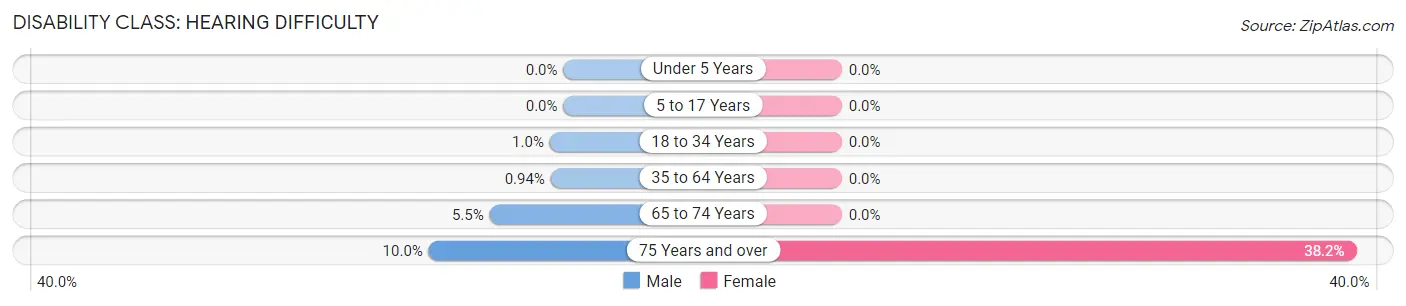
| Age Bracket | Male | Female |
| Under 5 Years | 0 (0.0%) | 0 (0.0%) |
| 5 to 17 Years | 0 (0.0%) | 0 (0.0%) |
| 18 to 34 Years | 5 (1.0%) | 0 (0.0%) |
| 35 to 64 Years | 8 (0.9%) | 0 (0.0%) |
| 65 to 74 Years | 12 (5.5%) | 0 (0.0%) |
| 75 Years and over | 6 (10.0%) | 68 (38.2%) |
Disability Class: Vision Difficulty
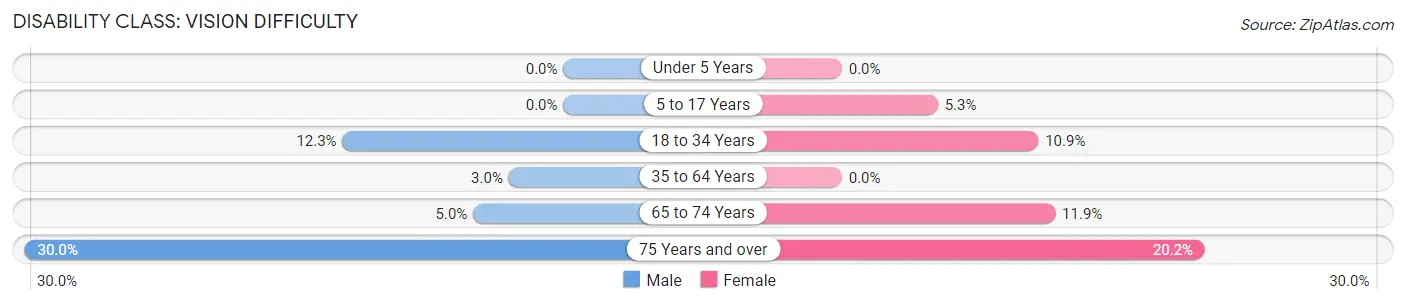
| Age Bracket | Male | Female |
| Under 5 Years | 0 (0.0%) | 0 (0.0%) |
| 5 to 17 Years | 0 (0.0%) | 21 (5.3%) |
| 18 to 34 Years | 61 (12.3%) | 42 (10.9%) |
| 35 to 64 Years | 26 (3.0%) | 0 (0.0%) |
| 65 to 74 Years | 11 (5.0%) | 36 (11.9%) |
| 75 Years and over | 18 (30.0%) | 36 (20.2%) |
Disability Class: Cognitive Difficulty
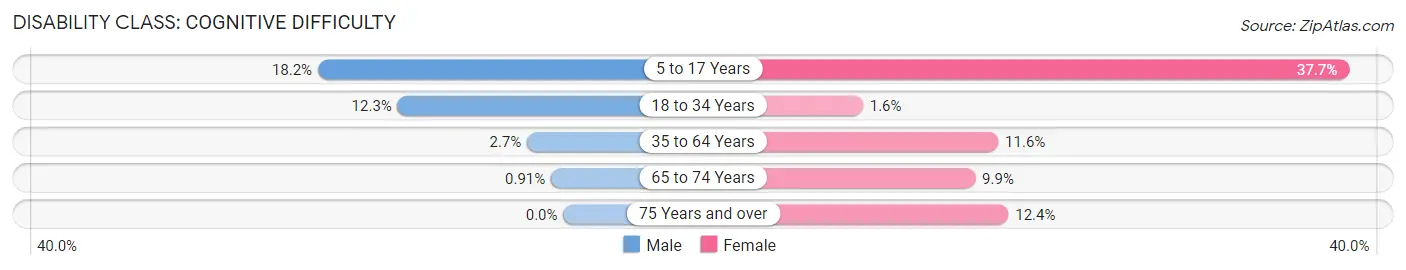
| Age Bracket | Male | Female |
| 5 to 17 Years | 80 (18.2%) | 148 (37.7%) |
| 18 to 34 Years | 61 (12.3%) | 6 (1.6%) |
| 35 to 64 Years | 23 (2.7%) | 116 (11.6%) |
| 65 to 74 Years | 2 (0.9%) | 30 (9.9%) |
| 75 Years and over | 0 (0.0%) | 22 (12.4%) |
Disability Class: Ambulatory Difficulty
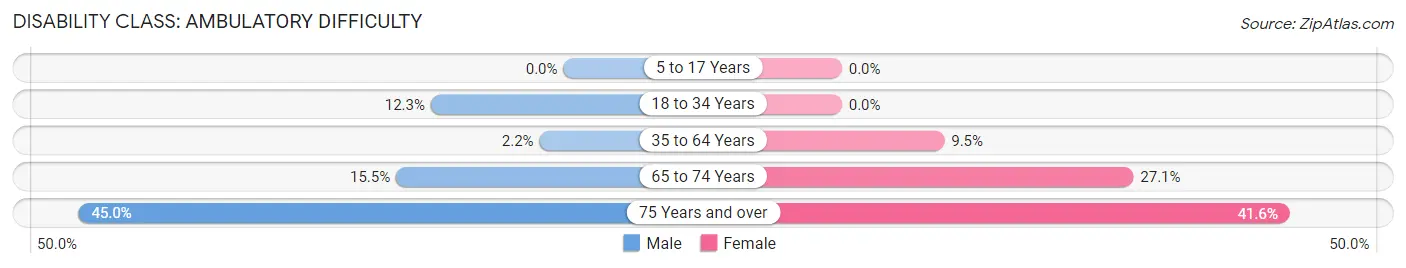
| Age Bracket | Male | Female |
| 5 to 17 Years | 0 (0.0%) | 0 (0.0%) |
| 18 to 34 Years | 61 (12.3%) | 0 (0.0%) |
| 35 to 64 Years | 19 (2.2%) | 95 (9.5%) |
| 65 to 74 Years | 34 (15.5%) | 82 (27.1%) |
| 75 Years and over | 27 (45.0%) | 74 (41.6%) |
Disability Class: Self-Care Difficulty
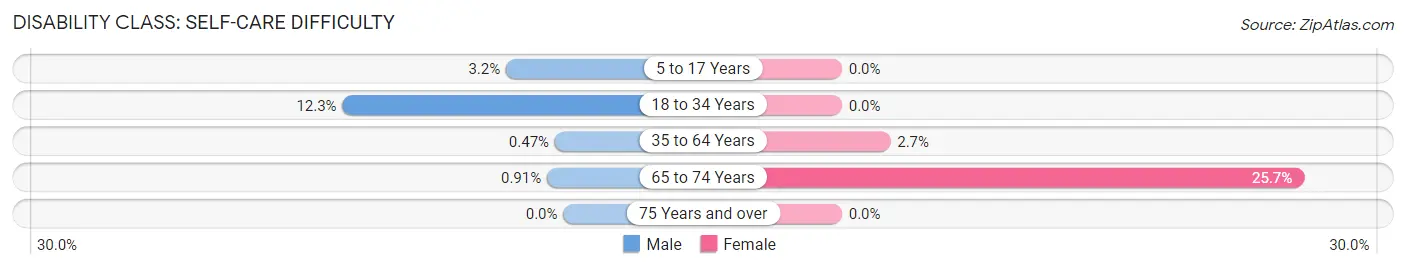
| Age Bracket | Male | Female |
| 5 to 17 Years | 14 (3.2%) | 0 (0.0%) |
| 18 to 34 Years | 61 (12.3%) | 0 (0.0%) |
| 35 to 64 Years | 4 (0.5%) | 27 (2.7%) |
| 65 to 74 Years | 2 (0.9%) | 78 (25.7%) |
| 75 Years and over | 0 (0.0%) | 0 (0.0%) |
Technology Access in Canastota
Computing Device Access in Canastota
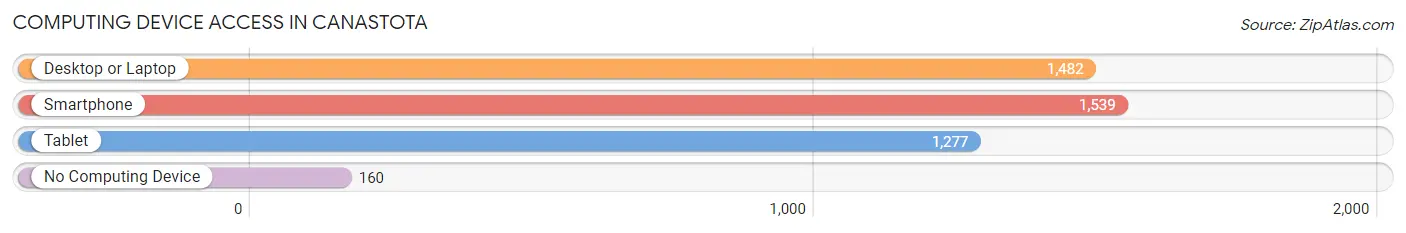
| Device Type | # Households | % Households |
| Desktop or Laptop | 1,482 | 80.7% |
| Smartphone | 1,539 | 83.8% |
| Tablet | 1,277 | 69.5% |
| No Computing Device | 160 | 8.7% |
| Total | 1,837 | 100.0% |
Internet Access in Canastota
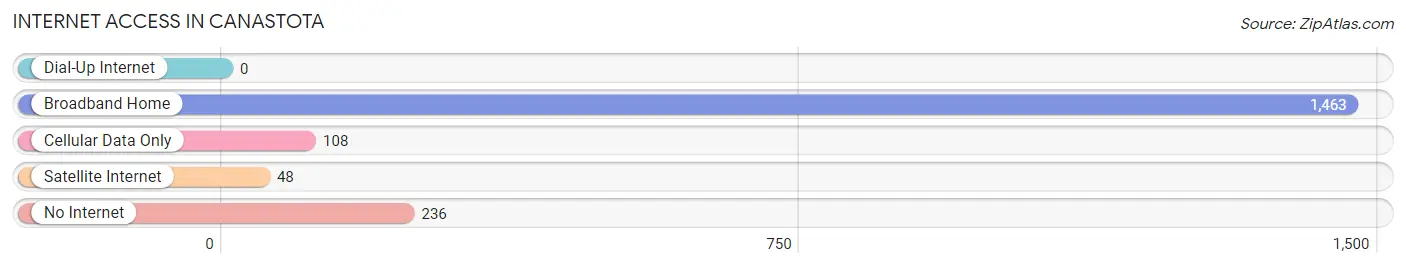
| Internet Type | # Households | % Households |
| Dial-Up Internet | 0 | 0.0% |
| Broadband Home | 1,463 | 79.6% |
| Cellular Data Only | 108 | 5.9% |
| Satellite Internet | 48 | 2.6% |
| No Internet | 236 | 12.9% |
| Total | 1,837 | 100.0% |
Canastota Summary
Canastota is a village located in Madison County, New York, United States. The population was 4,085 at the 2010 census. It is part of the Syracuse Metropolitan Statistical Area.
History
The area that is now Canastota was originally inhabited by the Oneida tribe of the Iroquois Confederacy. The first European settlers arrived in the area in the late 1700s. The village was founded in 1802 and was originally known as "Canastoga". The name was changed to "Canastota" in 1808.
The village was an important stop on the Erie Canal, which was completed in 1825. The canal brought economic prosperity to the area, and the village grew rapidly. By the mid-1800s, Canastota was a thriving commercial center with several mills, factories, and stores.
The village was incorporated in 1835. In the late 1800s, the village was home to several brickyards, a brewery, and a cigar factory. The village also had a thriving agricultural industry, with several farms producing dairy products, fruits, and vegetables.
Geography
Canastota is located at 43°3′25″N 75°45′45″W (43.056944, -75.762500). According to the United States Census Bureau, the village has a total area of 1.3 square miles (3.4 km2), all of it land.
The village is located on the eastern shore of Oneida Lake, which is part of the Erie Canal system. The village is located at the intersection of New York State Route 5 and New York State Route 13.
Economy
Canastota's economy is largely based on agriculture and tourism. The village is home to several farms that produce dairy products, fruits, and vegetables. The village is also home to several wineries and breweries, as well as several restaurants and shops.
The village is also home to several manufacturing companies, including a paper mill, a plastics factory, and a metal fabrication plant.
Demographics
As of the census of 2010, there were 4,085 people, 1,619 households, and 1,072 families residing in the village. The population density was 3,097.7 people per square mile (1,196.2/km2). There were 1,741 housing units at an average density of 1,323.8 per square mile (510.7/km2). The racial makeup of the village was 97.2% White, 0.7% African American, 0.2% Native American, 0.4% Asian, 0.2% from other races, and 1.3% from two or more races. Hispanic or Latino of any race were 1.3% of the population.
There were 1,619 households, out of which 30.2% had children under the age of 18 living with them, 48.2% were married couples living together, 12.7% had a female householder with no husband present, and 33.7% were non-families. 28.2% of all households were made up of individuals, and 12.7% had someone living alone who was 65 years of age or older. The average household size was 2.50 and the average family size was 3.06.
In the village, the population was spread out, with 25.2% under the age of 18, 7.2% from 18 to 24, 28.2% from 25 to 44, 24.2% from 45 to 64, and 15.2% who were 65 years of age or older. The median age was 38 years. For every 100 females, there were 92.2 males. For every 100 females age 18 and over, there were 88.3 males.
The median income for a household in the village was $41,964, and the median income for a family was $50,000. Males had a median income of $36,964 versus $25,000 for females. The per capita income for the village was $19,945. About 6.2% of families and 8.2% of the population were below the poverty line, including 10.2% of those under age 18 and 6.2% of those age 65 or over.
Common Questions
What is Per Capita Income in Canastota?
Per Capita income in Canastota is $31,410.
What is the Median Family Income in Canastota?
Median Family Income in Canastota is $75,815.
What is the Median Household income in Canastota?
Median Household Income in Canastota is $69,541.
What is Income or Wage Gap in Canastota?
Income or Wage Gap in Canastota is 34.7%.
Women in Canastota earn 65.3 cents for every dollar earned by a man.
What is Inequality or Gini Index in Canastota?
Inequality or Gini Index in Canastota is 0.37.
What is the Total Population of Canastota?
Total Population of Canastota is 4,550.
What is the Total Male Population of Canastota?
Total Male Population of Canastota is 2,212.
What is the Total Female Population of Canastota?
Total Female Population of Canastota is 2,338.
What is the Ratio of Males per 100 Females in Canastota?
There are 94.61 Males per 100 Females in Canastota.
What is the Ratio of Females per 100 Males in Canastota?
There are 105.70 Females per 100 Males in Canastota.
What is the Median Population Age in Canastota?
Median Population Age in Canastota is 43.4 Years.
What is the Average Family Size in Canastota
Average Family Size in Canastota is 3.1 People.
What is the Average Household Size in Canastota
Average Household Size in Canastota is 2.5 People.
How Large is the Labor Force in Canastota?
There are 2,467 People in the Labor Forcein in Canastota.
What is the Percentage of People in the Labor Force in Canastota?
69.6% of People are in the Labor Force in Canastota.
What is the Unemployment Rate in Canastota?
Unemployment Rate in Canastota is 3.3%.