North Great River, NY Map & Demographics
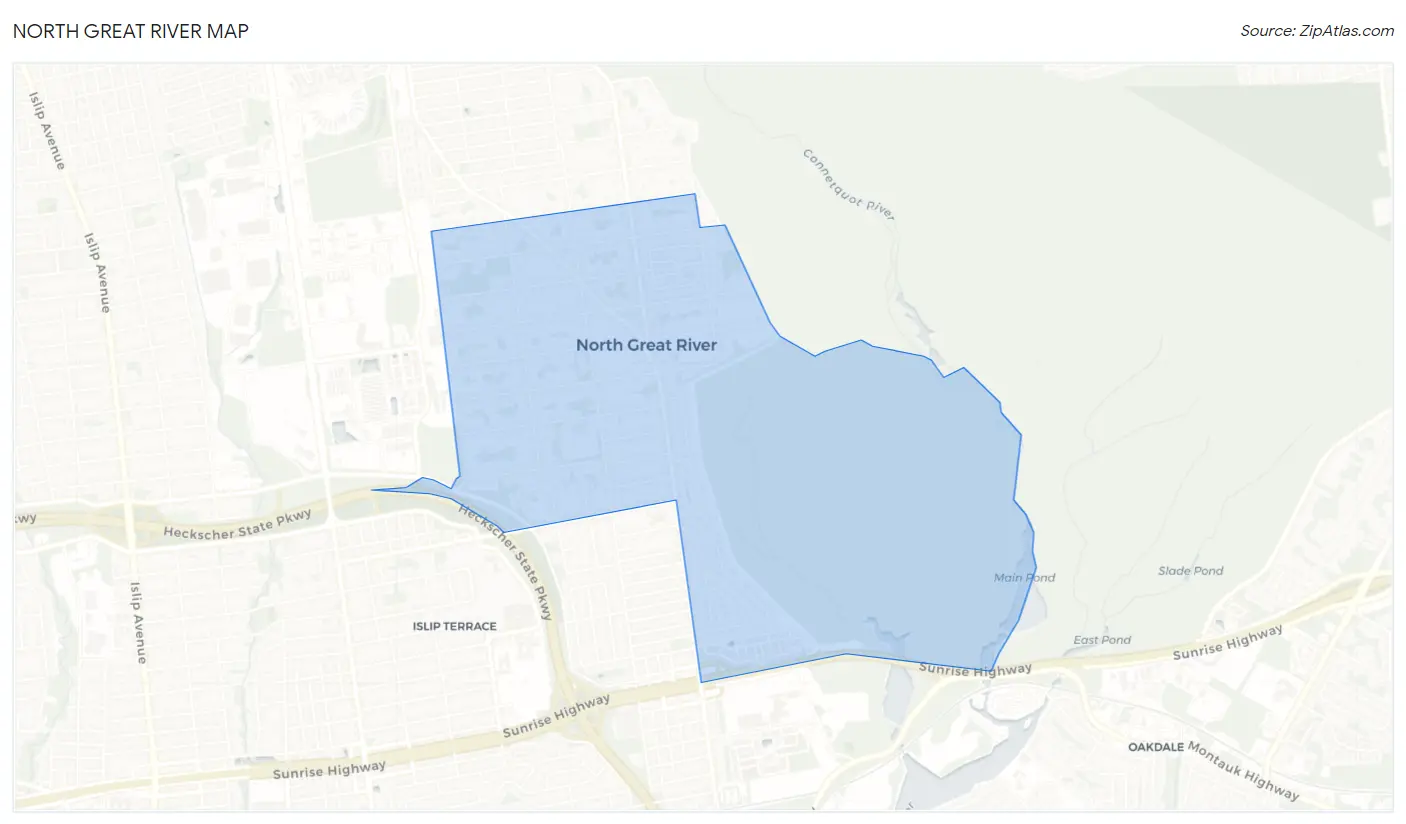
North Great River Map
North Great River Overview
$61,105
PER CAPITA INCOME
$161,282
AVG FAMILY INCOME
$144,246
AVG HOUSEHOLD INCOME
6.7%
WAGE / INCOME GAP [ % ]
93.3¢/ $1
WAGE / INCOME GAP [ $ ]
0.40
INEQUALITY / GINI INDEX
3,680
TOTAL POPULATION
1,911
MALE POPULATION
1,769
FEMALE POPULATION
108.03
MALES / 100 FEMALES
92.57
FEMALES / 100 MALES
50.3
MEDIAN AGE
3.2
AVG FAMILY SIZE
2.8
AVG HOUSEHOLD SIZE
2,026
LABOR FORCE [ PEOPLE ]
64.2%
PERCENT IN LABOR FORCE
1.5%
UNEMPLOYMENT RATE
Income in North Great River
Income Overview in North Great River
Per Capita Income in North Great River is $61,105, while median incomes of families and households are $161,282 and $144,246 respectively.
| Characteristic | Number | Measure |
| Per Capita Income | 3,680 | $61,105 |
| Median Family Income | 1,048 | $161,282 |
| Mean Family Income | 1,048 | $179,032 |
| Median Household Income | 1,295 | $144,246 |
| Mean Household Income | 1,295 | $166,023 |
| Income Deficit | 1,048 | $0 |
| Wage / Income Gap (%) | 3,680 | 6.74% |
| Wage / Income Gap ($) | 3,680 | 93.26¢ per $1 |
| Gini / Inequality Index | 3,680 | 0.40 |
Earnings by Sex in North Great River
Average Earnings in North Great River are $66,000, $63,242 for men and $67,813 for women, a difference of 6.7%.
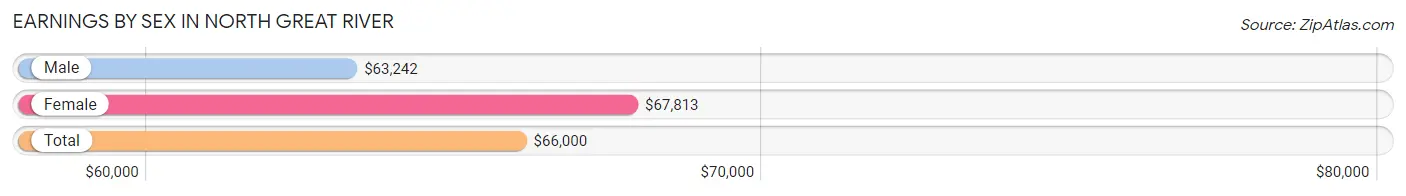
| Sex | Number | Average Earnings |
| Male | 1,043 (49.4%) | $63,242 |
| Female | 1,069 (50.6%) | $67,813 |
| Total | 2,112 (100.0%) | $66,000 |
Earnings by Sex by Income Bracket in North Great River
The most common earnings brackets in North Great River are $100,000+ for men (321 | 30.8%) and $100,000+ for women (275 | 25.7%).
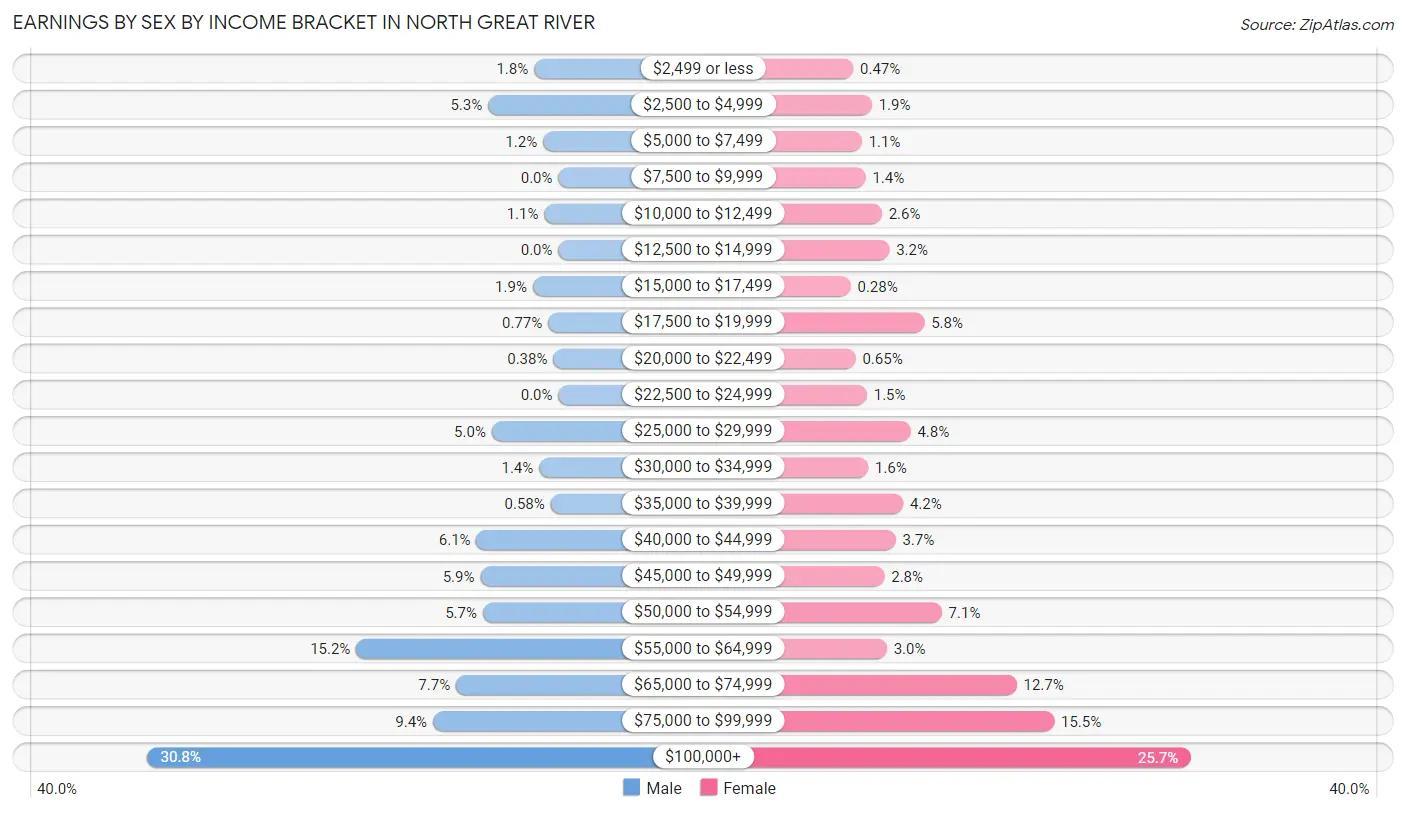
| Income | Male | Female |
| $2,499 or less | 19 (1.8%) | 5 (0.5%) |
| $2,500 to $4,999 | 55 (5.3%) | 20 (1.9%) |
| $5,000 to $7,499 | 12 (1.1%) | 12 (1.1%) |
| $7,500 to $9,999 | 0 (0.0%) | 15 (1.4%) |
| $10,000 to $12,499 | 11 (1.1%) | 28 (2.6%) |
| $12,500 to $14,999 | 0 (0.0%) | 34 (3.2%) |
| $15,000 to $17,499 | 20 (1.9%) | 3 (0.3%) |
| $17,500 to $19,999 | 8 (0.8%) | 62 (5.8%) |
| $20,000 to $22,499 | 4 (0.4%) | 7 (0.6%) |
| $22,500 to $24,999 | 0 (0.0%) | 16 (1.5%) |
| $25,000 to $29,999 | 52 (5.0%) | 51 (4.8%) |
| $30,000 to $34,999 | 15 (1.4%) | 17 (1.6%) |
| $35,000 to $39,999 | 6 (0.6%) | 45 (4.2%) |
| $40,000 to $44,999 | 64 (6.1%) | 39 (3.6%) |
| $45,000 to $49,999 | 61 (5.9%) | 30 (2.8%) |
| $50,000 to $54,999 | 59 (5.7%) | 76 (7.1%) |
| $55,000 to $64,999 | 158 (15.1%) | 32 (3.0%) |
| $65,000 to $74,999 | 80 (7.7%) | 136 (12.7%) |
| $75,000 to $99,999 | 98 (9.4%) | 166 (15.5%) |
| $100,000+ | 321 (30.8%) | 275 (25.7%) |
| Total | 1,043 (100.0%) | 1,069 (100.0%) |
Earnings by Sex by Educational Attainment in North Great River
Average earnings in North Great River are $67,647 for men and $71,667 for women, a difference of 5.6%. Men with an educational attainment of graduate degree enjoy the highest average annual earnings of $126,250, while those with less than high school education earn the least with $55,769. Women with an educational attainment of graduate degree earn the most with the average annual earnings of $105,972, while those with less than high school education have the smallest earnings of $25,938.
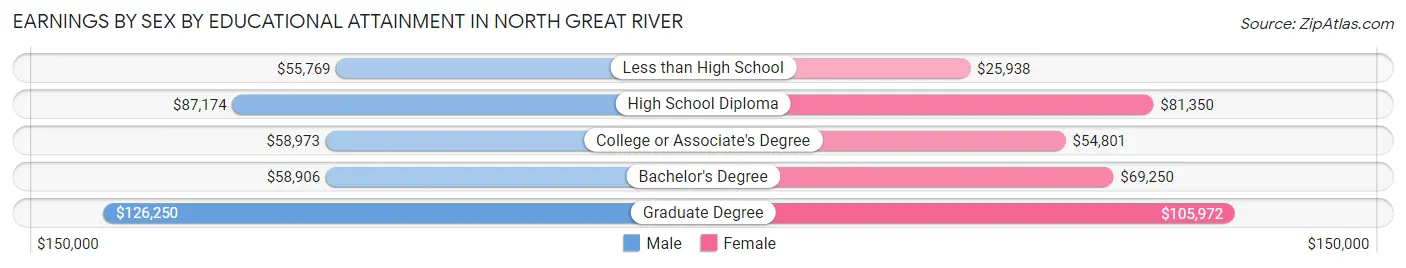
| Educational Attainment | Male Income | Female Income |
| Less than High School | $55,769 | $25,938 |
| High School Diploma | $87,174 | $81,350 |
| College or Associate's Degree | $58,973 | $54,801 |
| Bachelor's Degree | $58,906 | $69,250 |
| Graduate Degree | $126,250 | $105,972 |
| Total | $67,647 | $71,667 |
Family Income in North Great River
Family Income Brackets in North Great River
According to the North Great River family income data, there are 297 families falling into the $200,000+ income range, which is the most common income bracket and makes up 28.3% of all families.
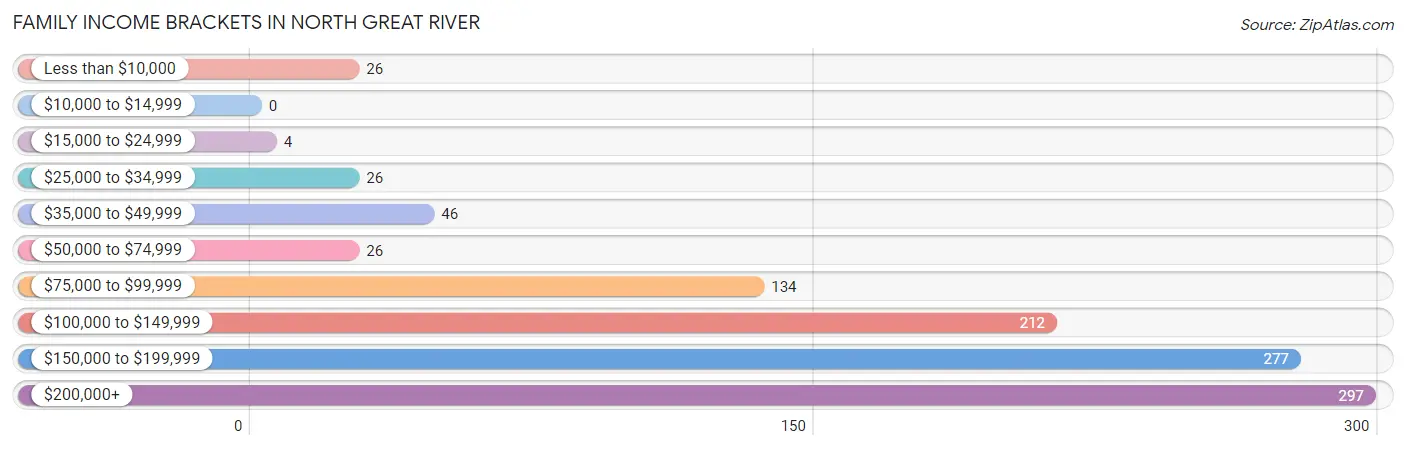
| Income Bracket | # Families | % Families |
| Less than $10,000 | 26 | 2.5% |
| $10,000 to $14,999 | 0 | 0.0% |
| $15,000 to $24,999 | 4 | 0.4% |
| $25,000 to $34,999 | 26 | 2.5% |
| $35,000 to $49,999 | 46 | 4.4% |
| $50,000 to $74,999 | 26 | 2.5% |
| $75,000 to $99,999 | 134 | 12.8% |
| $100,000 to $149,999 | 212 | 20.2% |
| $150,000 to $199,999 | 277 | 26.4% |
| $200,000+ | 297 | 28.3% |
Family Income by Famaliy Size in North Great River
6-person families (66 | 6.3%) account for the highest median family income in North Great River with $250,001 per family, while 3-person families (298 | 28.4%) have the highest median income of $56,429 per family member.
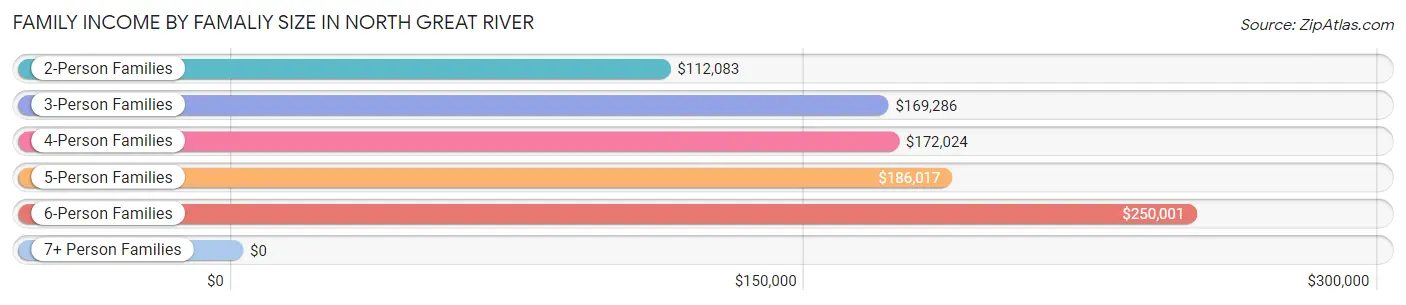
| Income Bracket | # Families | Median Income |
| 2-Person Families | 475 (45.3%) | $112,083 |
| 3-Person Families | 298 (28.4%) | $169,286 |
| 4-Person Families | 142 (13.6%) | $172,024 |
| 5-Person Families | 67 (6.4%) | $186,017 |
| 6-Person Families | 66 (6.3%) | $250,001 |
| 7+ Person Families | 0 (0.0%) | $0 |
| Total | 1,048 (100.0%) | $161,282 |
Family Income by Number of Earners in North Great River
The median family income in North Great River is $161,282, with families comprising 3+ earners (184) having the highest median family income of $250,001, while families with no earners (168) have the lowest median family income of $78,110, accounting for 17.6% and 16.0% of families, respectively.
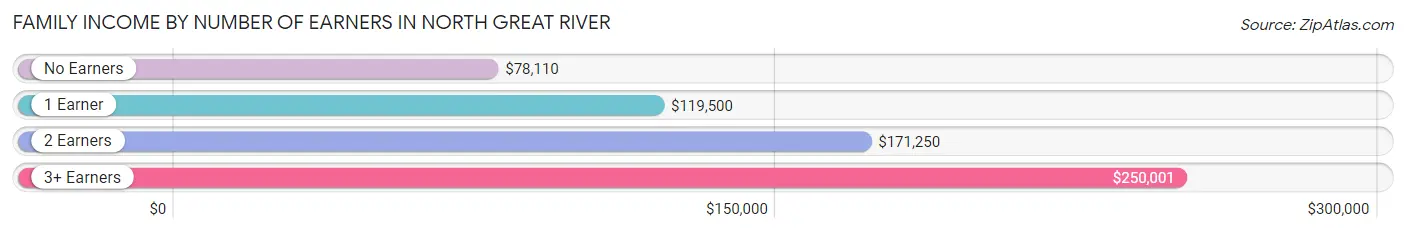
| Number of Earners | # Families | Median Income |
| No Earners | 168 (16.0%) | $78,110 |
| 1 Earner | 152 (14.5%) | $119,500 |
| 2 Earners | 544 (51.9%) | $171,250 |
| 3+ Earners | 184 (17.6%) | $250,001 |
| Total | 1,048 (100.0%) | $161,282 |
Household Income in North Great River
Household Income Brackets in North Great River
With 338 households falling in the category, the $200,000+ income range is the most frequent in North Great River, accounting for 26.1% of all households. In contrast, only 6 households (0.5%) fall into the $10,000 to $14,999 income bracket, making it the least populous group.
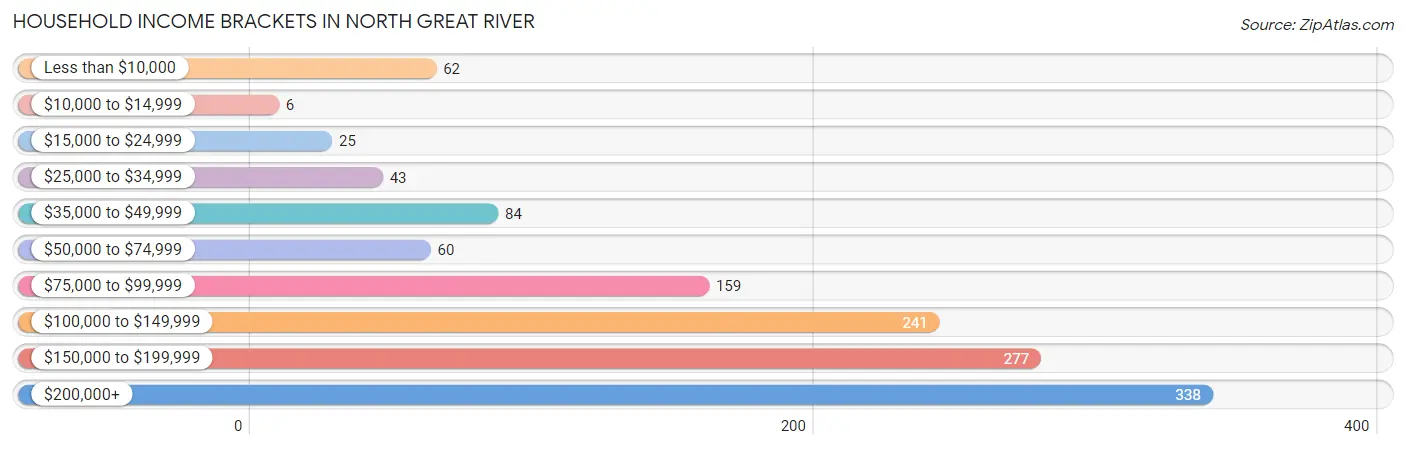
| Income Bracket | # Households | % Households |
| Less than $10,000 | 62 | 4.8% |
| $10,000 to $14,999 | 6 | 0.5% |
| $15,000 to $24,999 | 25 | 1.9% |
| $25,000 to $34,999 | 43 | 3.3% |
| $35,000 to $49,999 | 84 | 6.5% |
| $50,000 to $74,999 | 60 | 4.6% |
| $75,000 to $99,999 | 159 | 12.3% |
| $100,000 to $149,999 | 241 | 18.6% |
| $150,000 to $199,999 | 277 | 21.4% |
| $200,000+ | 338 | 26.1% |
Household Income by Householder Age in North Great River
The median household income in North Great River is $144,246, with the highest median household income of $169,821 found in the 45 to 64 years age bracket for the primary householder. A total of 621 households (47.9%) fall into this category.
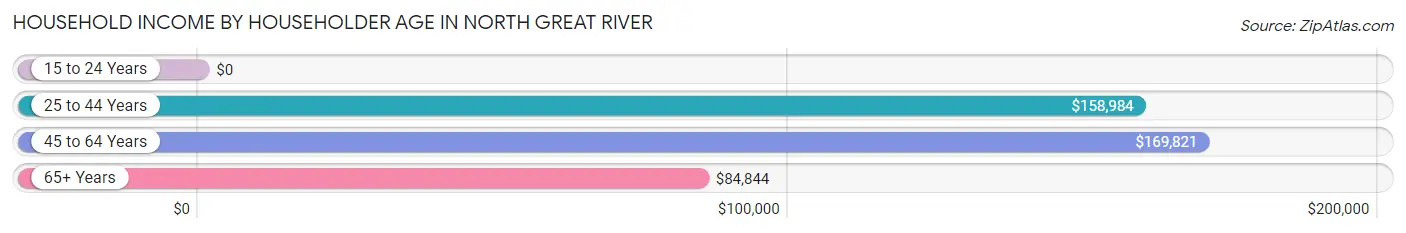
| Income Bracket | # Households | Median Income |
| 15 to 24 Years | 0 (0.0%) | $0 |
| 25 to 44 Years | 185 (14.3%) | $158,984 |
| 45 to 64 Years | 621 (47.9%) | $169,821 |
| 65+ Years | 489 (37.8%) | $84,844 |
| Total | 1,295 (100.0%) | $144,246 |
Poverty in North Great River
Income Below Poverty by Sex and Age in North Great River
With 2.1% poverty level for males and 3.6% for females among the residents of North Great River, 75 year old and over males and 75 year old and over females are the most vulnerable to poverty, with 12 males (4.4%) and 26 females (10.6%) in their respective age groups living below the poverty level.
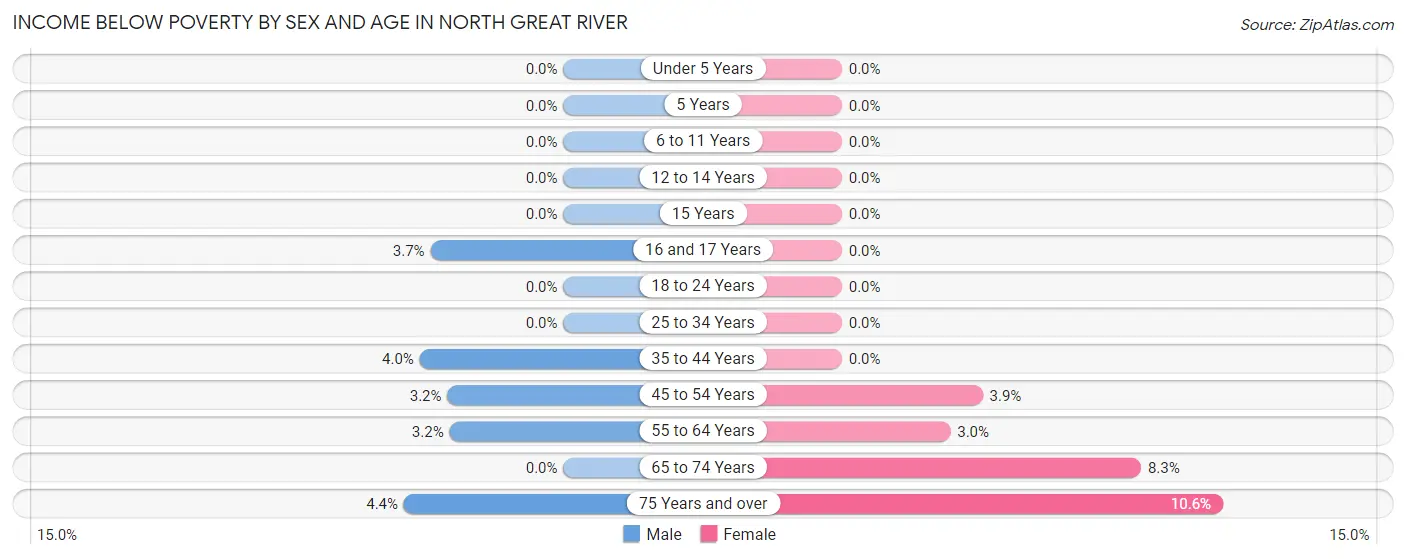
| Age Bracket | Male | Female |
| Under 5 Years | 0 (0.0%) | 0 (0.0%) |
| 5 Years | 0 (0.0%) | 0 (0.0%) |
| 6 to 11 Years | 0 (0.0%) | 0 (0.0%) |
| 12 to 14 Years | 0 (0.0%) | 0 (0.0%) |
| 15 Years | 0 (0.0%) | 0 (0.0%) |
| 16 and 17 Years | 1 (3.7%) | 0 (0.0%) |
| 18 to 24 Years | 0 (0.0%) | 0 (0.0%) |
| 25 to 34 Years | 0 (0.0%) | 0 (0.0%) |
| 35 to 44 Years | 10 (4.0%) | 0 (0.0%) |
| 45 to 54 Years | 6 (3.2%) | 12 (3.9%) |
| 55 to 64 Years | 11 (3.2%) | 12 (3.0%) |
| 65 to 74 Years | 0 (0.0%) | 13 (8.3%) |
| 75 Years and over | 12 (4.4%) | 26 (10.6%) |
| Total | 40 (2.1%) | 63 (3.6%) |
Income Above Poverty by Sex and Age in North Great River
According to the poverty statistics in North Great River, males aged under 5 years and females aged under 5 years are the age groups that are most secure financially, with 100.0% of males and 100.0% of females in these age groups living above the poverty line.
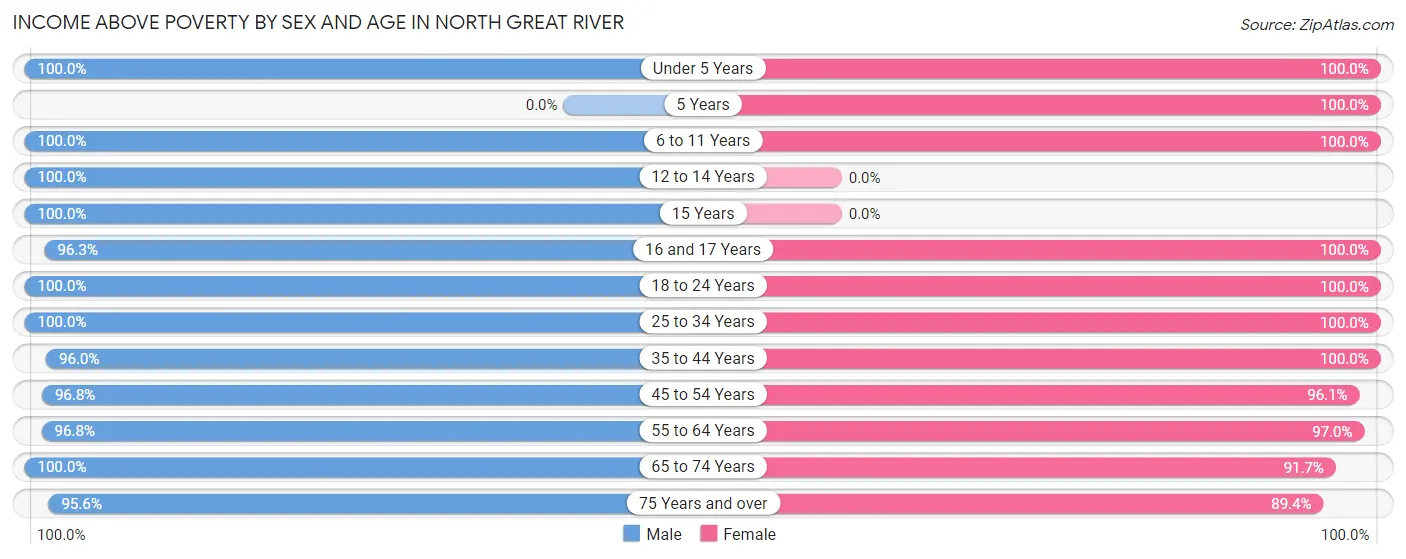
| Age Bracket | Male | Female |
| Under 5 Years | 40 (100.0%) | 32 (100.0%) |
| 5 Years | 0 (0.0%) | 8 (100.0%) |
| 6 to 11 Years | 207 (100.0%) | 123 (100.0%) |
| 12 to 14 Years | 101 (100.0%) | 0 (0.0%) |
| 15 Years | 14 (100.0%) | 0 (0.0%) |
| 16 and 17 Years | 26 (96.3%) | 63 (100.0%) |
| 18 to 24 Years | 72 (100.0%) | 113 (100.0%) |
| 25 to 34 Years | 239 (100.0%) | 159 (100.0%) |
| 35 to 44 Years | 240 (96.0%) | 166 (100.0%) |
| 45 to 54 Years | 180 (96.8%) | 294 (96.1%) |
| 55 to 64 Years | 336 (96.8%) | 386 (97.0%) |
| 65 to 74 Years | 158 (100.0%) | 143 (91.7%) |
| 75 Years and over | 258 (95.6%) | 219 (89.4%) |
| Total | 1,871 (97.9%) | 1,706 (96.4%) |
Income Below Poverty Among Married-Couple Families in North Great River
The poverty statistics for married-couple families in North Great River show that 2.3% or 18 of the total 793 families live below the poverty line. Families with no children have the highest poverty rate of 3.9%, comprising of 18 families. On the other hand, families with 1 or 2 children have the lowest poverty rate of 0.0%, which includes 0 families.
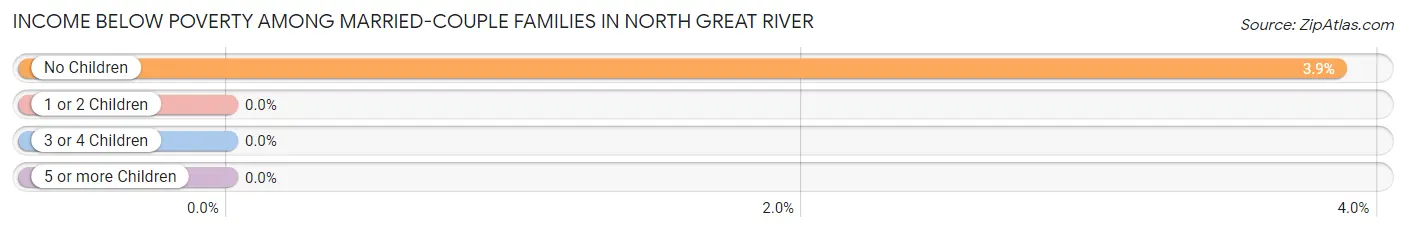
| Children | Above Poverty | Below Poverty |
| No Children | 448 (96.1%) | 18 (3.9%) |
| 1 or 2 Children | 288 (100.0%) | 0 (0.0%) |
| 3 or 4 Children | 39 (100.0%) | 0 (0.0%) |
| 5 or more Children | 0 (0.0%) | 0 (0.0%) |
| Total | 775 (97.7%) | 18 (2.3%) |
Income Below Poverty Among Single-Parent Households in North Great River
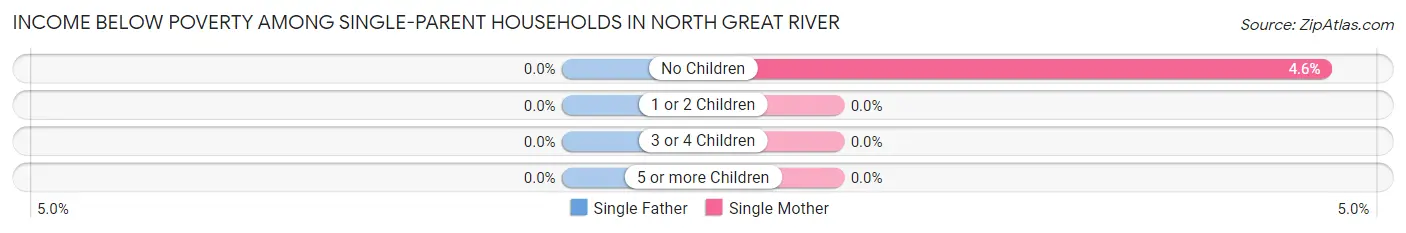
| Children | Single Father | Single Mother |
| No Children | 0 (0.0%) | 8 (4.5%) |
| 1 or 2 Children | 0 (0.0%) | 0 (0.0%) |
| 3 or 4 Children | 0 (0.0%) | 0 (0.0%) |
| 5 or more Children | 0 (0.0%) | 0 (0.0%) |
| Total | 0 (0.0%) | 8 (3.9%) |
Income Below Poverty Among Married-Couple vs Single-Parent Households in North Great River
The poverty data for North Great River shows that 18 of the married-couple family households (2.3%) and 8 of the single-parent households (3.1%) are living below the poverty level. Within the married-couple family households, those with no children have the highest poverty rate, with 18 households (3.9%) falling below the poverty line. Among the single-parent households, those with no children have the highest poverty rate, with 8 household (3.7%) living below poverty.
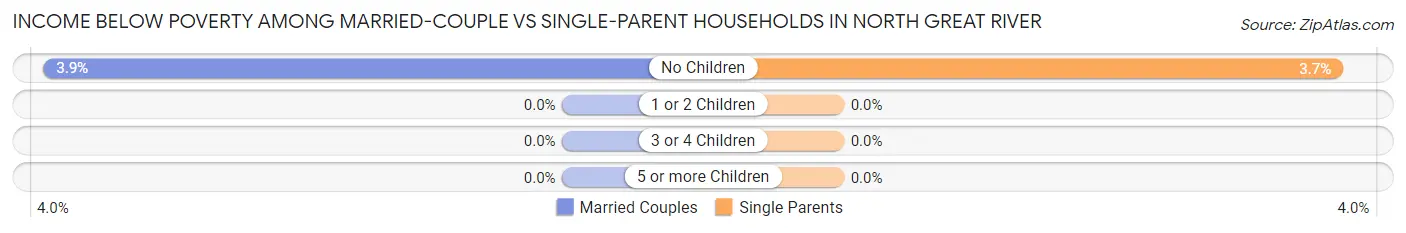
| Children | Married-Couple Families | Single-Parent Households |
| No Children | 18 (3.9%) | 8 (3.7%) |
| 1 or 2 Children | 0 (0.0%) | 0 (0.0%) |
| 3 or 4 Children | 0 (0.0%) | 0 (0.0%) |
| 5 or more Children | 0 (0.0%) | 0 (0.0%) |
| Total | 18 (2.3%) | 8 (3.1%) |
Race in North Great River
The most populous races in North Great River are White / Caucasian (2,697 | 73.3%), Hispanic or Latino (739 | 20.1%), and Two or more Races (479 | 13.0%).
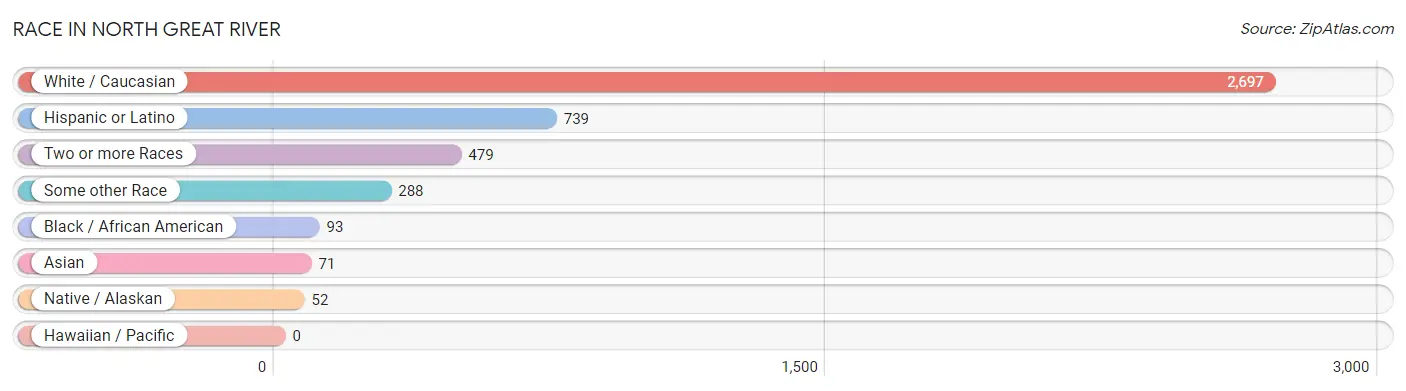
| Race | # Population | % Population |
| Asian | 71 | 1.9% |
| Black / African American | 93 | 2.5% |
| Hawaiian / Pacific | 0 | 0.0% |
| Hispanic or Latino | 739 | 20.1% |
| Native / Alaskan | 52 | 1.4% |
| White / Caucasian | 2,697 | 73.3% |
| Two or more Races | 479 | 13.0% |
| Some other Race | 288 | 7.8% |
| Total | 3,680 | 100.0% |
Ancestry in North Great River
The most populous ancestries reported in North Great River are Italian (1,004 | 27.3%), Irish (428 | 11.6%), German (353 | 9.6%), American (285 | 7.7%), and Central American (247 | 6.7%), together accounting for 63.0% of all North Great River residents.
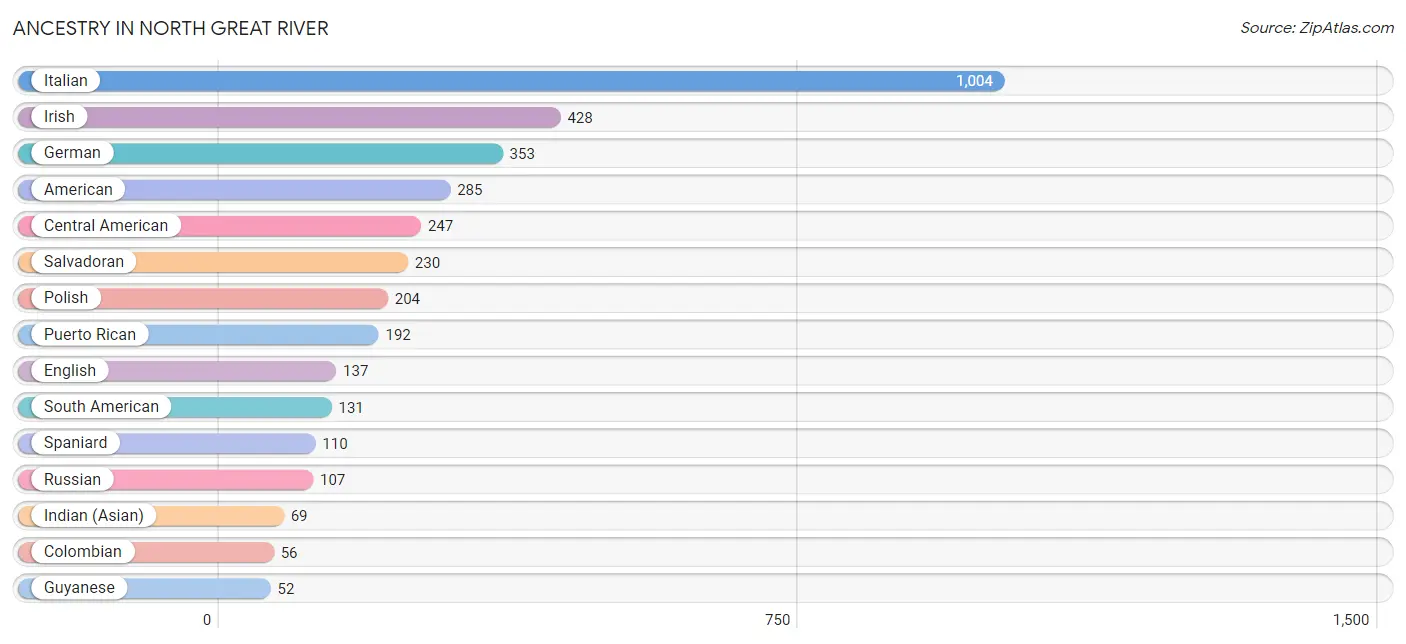
| Ancestry | # Population | % Population |
| Albanian | 41 | 1.1% |
| American | 285 | 7.7% |
| Arab | 12 | 0.3% |
| Austrian | 13 | 0.4% |
| Bhutanese | 26 | 0.7% |
| British | 8 | 0.2% |
| Central American | 247 | 6.7% |
| Chilean | 39 | 1.1% |
| Colombian | 56 | 1.5% |
| Cypriot | 37 | 1.0% |
| Czech | 13 | 0.4% |
| Danish | 8 | 0.2% |
| Dominican | 15 | 0.4% |
| Ecuadorian | 16 | 0.4% |
| Egyptian | 12 | 0.3% |
| English | 137 | 3.7% |
| European | 43 | 1.2% |
| French | 16 | 0.4% |
| French Canadian | 6 | 0.2% |
| German | 353 | 9.6% |
| Ghanaian | 1 | 0.0% |
| Greek | 12 | 0.3% |
| Guatemalan | 17 | 0.5% |
| Guyanese | 52 | 1.4% |
| Hungarian | 16 | 0.4% |
| Indian (Asian) | 69 | 1.9% |
| Irish | 428 | 11.6% |
| Italian | 1,004 | 27.3% |
| Lithuanian | 46 | 1.3% |
| Maltese | 6 | 0.2% |
| Mexican | 44 | 1.2% |
| Northern European | 19 | 0.5% |
| Norwegian | 12 | 0.3% |
| Peruvian | 20 | 0.5% |
| Polish | 204 | 5.5% |
| Portuguese | 20 | 0.5% |
| Puerto Rican | 192 | 5.2% |
| Russian | 107 | 2.9% |
| Salvadoran | 230 | 6.2% |
| Scotch-Irish | 12 | 0.3% |
| Scottish | 28 | 0.8% |
| Slovak | 20 | 0.5% |
| South American | 131 | 3.6% |
| Spaniard | 110 | 3.0% |
| Subsaharan African | 1 | 0.0% |
| Swedish | 23 | 0.6% |
| Thai | 7 | 0.2% |
| Trinidadian and Tobagonian | 13 | 0.4% | View All 48 Rows |
Immigrants in North Great River
The most numerous immigrant groups reported in North Great River came from Latin America (352 | 9.6%), South America (153 | 4.2%), Caribbean (140 | 3.8%), Chile (78 | 2.1%), and Dominican Republic (71 | 1.9%), together accounting for 21.6% of all North Great River residents.
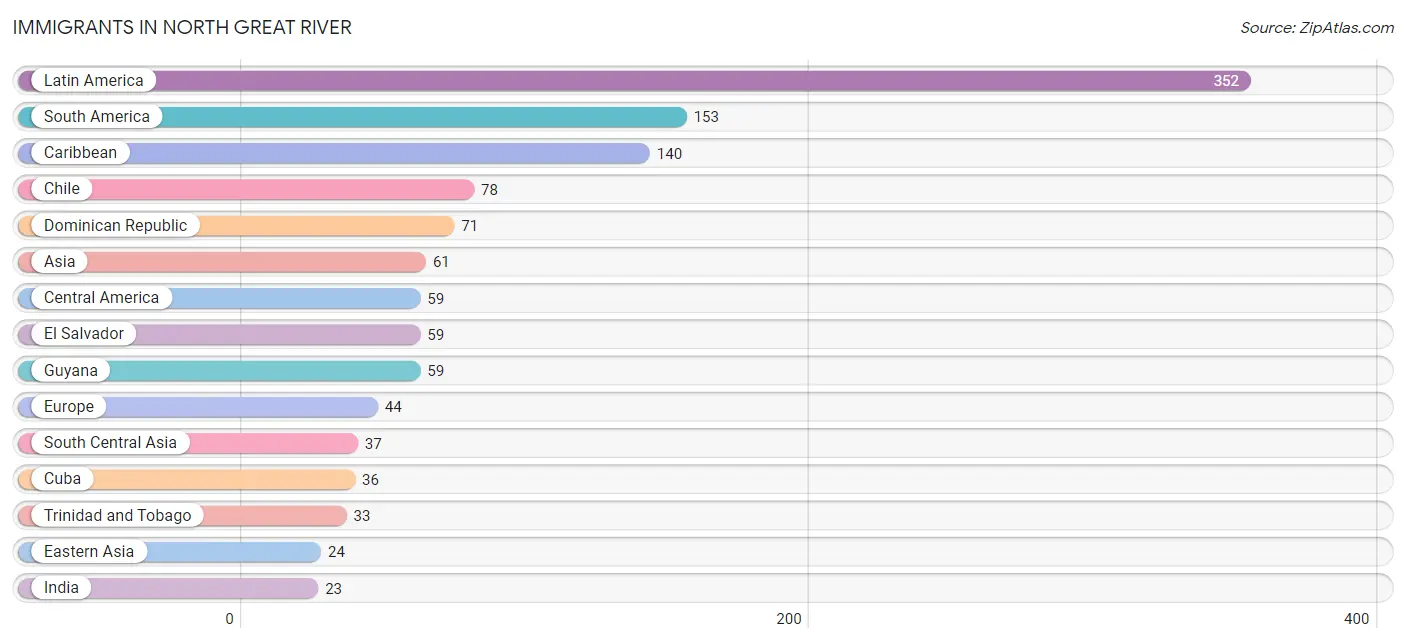
| Immigration Origin | # Population | % Population |
| Africa | 13 | 0.4% |
| Asia | 61 | 1.7% |
| Caribbean | 140 | 3.8% |
| Central America | 59 | 1.6% |
| Chile | 78 | 2.1% |
| China | 16 | 0.4% |
| Colombia | 16 | 0.4% |
| Cuba | 36 | 1.0% |
| Dominican Republic | 71 | 1.9% |
| Eastern Asia | 24 | 0.6% |
| Eastern Europe | 9 | 0.2% |
| Egypt | 12 | 0.3% |
| El Salvador | 59 | 1.6% |
| Europe | 44 | 1.2% |
| Germany | 7 | 0.2% |
| Ghana | 1 | 0.0% |
| Guyana | 59 | 1.6% |
| India | 23 | 0.6% |
| Italy | 6 | 0.2% |
| Japan | 8 | 0.2% |
| Latin America | 352 | 9.6% |
| Northern Africa | 12 | 0.3% |
| Northern Europe | 9 | 0.2% |
| Pakistan | 14 | 0.4% |
| Poland | 9 | 0.2% |
| Scotland | 9 | 0.2% |
| South America | 153 | 4.2% |
| South Central Asia | 37 | 1.0% |
| Southern Europe | 19 | 0.5% |
| Spain | 13 | 0.4% |
| Trinidad and Tobago | 33 | 0.9% |
| Western Africa | 1 | 0.0% |
| Western Europe | 7 | 0.2% | View All 33 Rows |
Sex and Age in North Great River
Sex and Age in North Great River
The most populous age groups in North Great River are 10 to 14 Years (260 | 13.6%) for men and 60 to 64 Years (223 | 12.6%) for women.
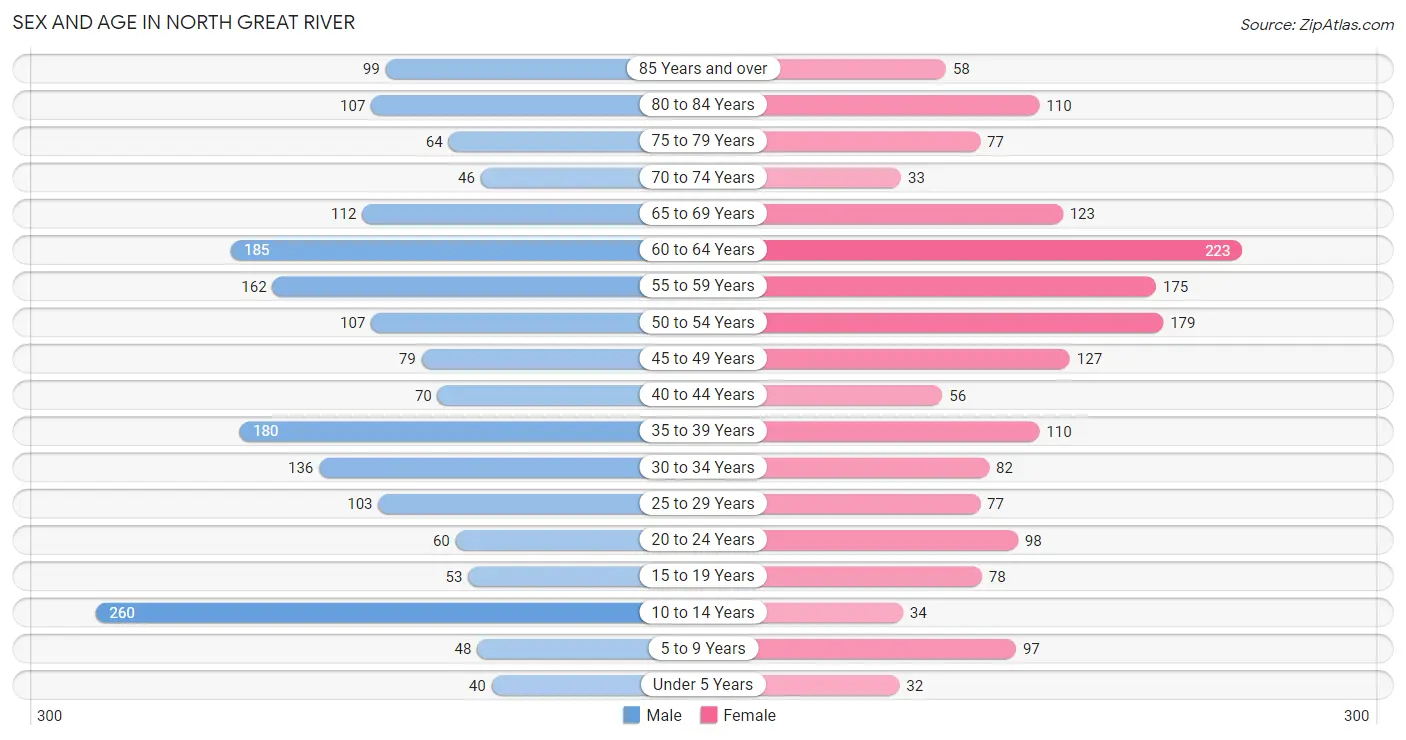
| Age Bracket | Male | Female |
| Under 5 Years | 40 (2.1%) | 32 (1.8%) |
| 5 to 9 Years | 48 (2.5%) | 97 (5.5%) |
| 10 to 14 Years | 260 (13.6%) | 34 (1.9%) |
| 15 to 19 Years | 53 (2.8%) | 78 (4.4%) |
| 20 to 24 Years | 60 (3.1%) | 98 (5.5%) |
| 25 to 29 Years | 103 (5.4%) | 77 (4.3%) |
| 30 to 34 Years | 136 (7.1%) | 82 (4.6%) |
| 35 to 39 Years | 180 (9.4%) | 110 (6.2%) |
| 40 to 44 Years | 70 (3.7%) | 56 (3.2%) |
| 45 to 49 Years | 79 (4.1%) | 127 (7.2%) |
| 50 to 54 Years | 107 (5.6%) | 179 (10.1%) |
| 55 to 59 Years | 162 (8.5%) | 175 (9.9%) |
| 60 to 64 Years | 185 (9.7%) | 223 (12.6%) |
| 65 to 69 Years | 112 (5.9%) | 123 (7.0%) |
| 70 to 74 Years | 46 (2.4%) | 33 (1.9%) |
| 75 to 79 Years | 64 (3.4%) | 77 (4.3%) |
| 80 to 84 Years | 107 (5.6%) | 110 (6.2%) |
| 85 Years and over | 99 (5.2%) | 58 (3.3%) |
| Total | 1,911 (100.0%) | 1,769 (100.0%) |
Families and Households in North Great River
Median Family Size in North Great River
The median family size in North Great River is 3.23 persons per family, with single male/father families (52 | 5.0%) accounting for the largest median family size of 3.73 persons per family. On the other hand, single female/mother families (203 | 19.4%) represent the smallest median family size with 2.68 persons per family.
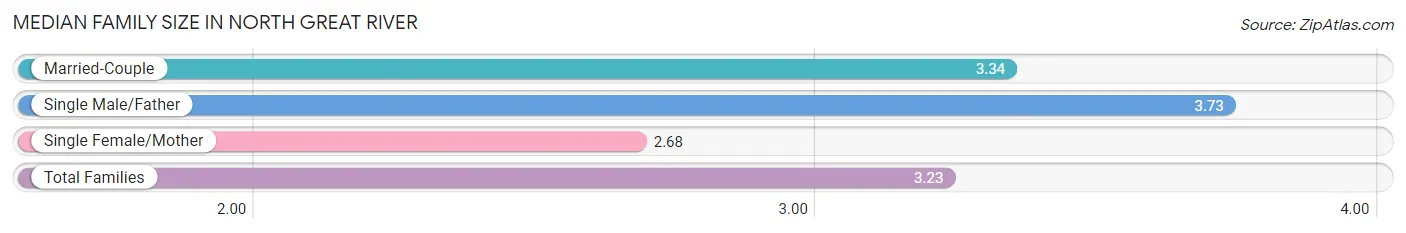
| Family Type | # Families | Family Size |
| Married-Couple | 793 (75.7%) | 3.34 |
| Single Male/Father | 52 (5.0%) | 3.73 |
| Single Female/Mother | 203 (19.4%) | 2.68 |
| Total Families | 1,048 (100.0%) | 3.23 |
Median Household Size in North Great River
The median household size in North Great River is 2.84 persons per household, with single male/father households (52 | 4.0%) accounting for the largest median household size of 3.73 persons per household. non-family households (247 | 19.1%) represent the smallest median household size with 1.07 persons per household.
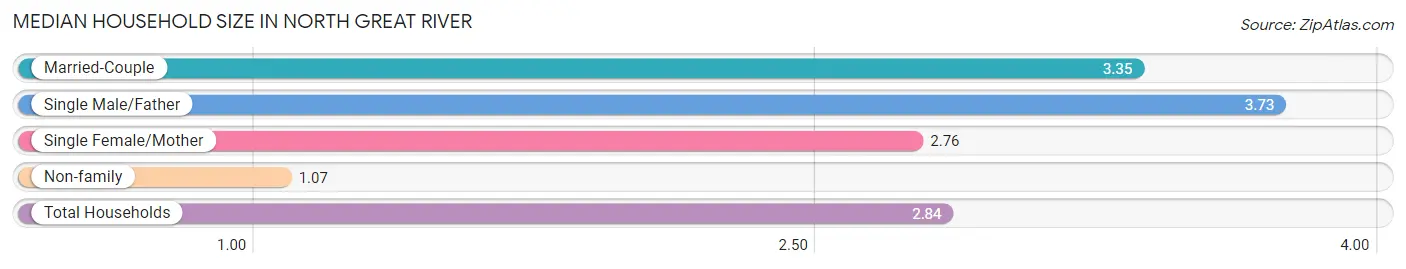
| Household Type | # Households | Household Size |
| Married-Couple | 793 (61.2%) | 3.35 |
| Single Male/Father | 52 (4.0%) | 3.73 |
| Single Female/Mother | 203 (15.7%) | 2.76 |
| Non-family | 247 (19.1%) | 1.07 |
| Total Households | 1,295 (100.0%) | 2.84 |
Household Size by Marriage Status in North Great River
Out of a total of 1,295 households in North Great River, 1,048 (80.9%) are family households, while 247 (19.1%) are nonfamily households. The most numerous type of family households are 2-person households, comprising 468, and the most common type of nonfamily households are 1-person households, comprising 225.
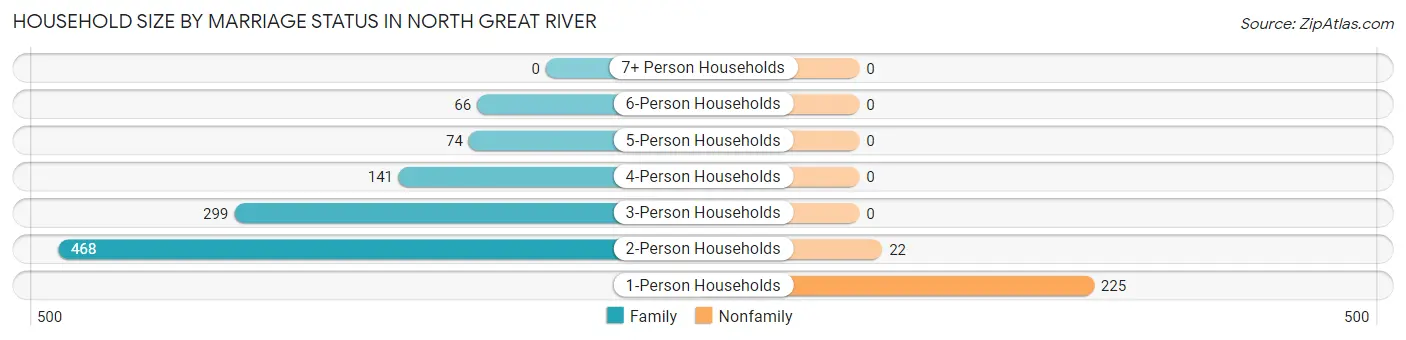
| Household Size | Family Households | Nonfamily Households |
| 1-Person Households | - | 225 (17.4%) |
| 2-Person Households | 468 (36.1%) | 22 (1.7%) |
| 3-Person Households | 299 (23.1%) | 0 (0.0%) |
| 4-Person Households | 141 (10.9%) | 0 (0.0%) |
| 5-Person Households | 74 (5.7%) | 0 (0.0%) |
| 6-Person Households | 66 (5.1%) | 0 (0.0%) |
| 7+ Person Households | 0 (0.0%) | 0 (0.0%) |
| Total | 1,048 (80.9%) | 247 (19.1%) |
Female Fertility in North Great River
Fertility by Age in North Great River
Average fertility rate in North Great River is 52.0 births per 1,000 women. Women in the age bracket of 35 to 50 years have the highest fertility rate with 100.0 births per 1,000 women. Women in the age bracket of 35 to 50 years acount for 100.0% of all women with births.
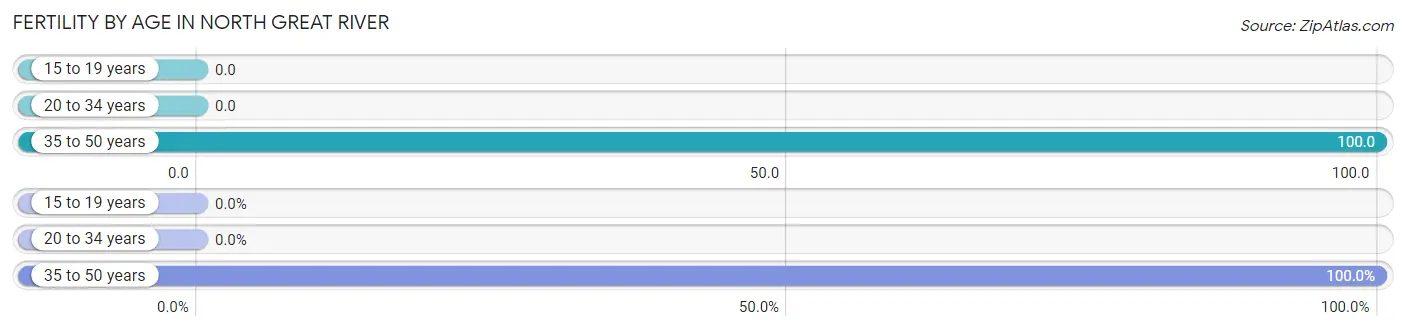
| Age Bracket | Women with Births | Births / 1,000 Women |
| 15 to 19 years | 0 (0.0%) | 0.0 |
| 20 to 34 years | 0 (0.0%) | 0.0 |
| 35 to 50 years | 36 (100.0%) | 100.0 |
| Total | 36 (100.0%) | 52.0 |
Fertility by Age by Marriage Status in North Great River
30.6% of women with births (36) in North Great River are married. The highest percentage of unmarried women with births falls into 35 to 50 years age bracket with 69.4% of them unmarried at the time of birth, while the lowest percentage of unmarried women with births belong to 35 to 50 years age bracket with 69.4% of them unmarried.
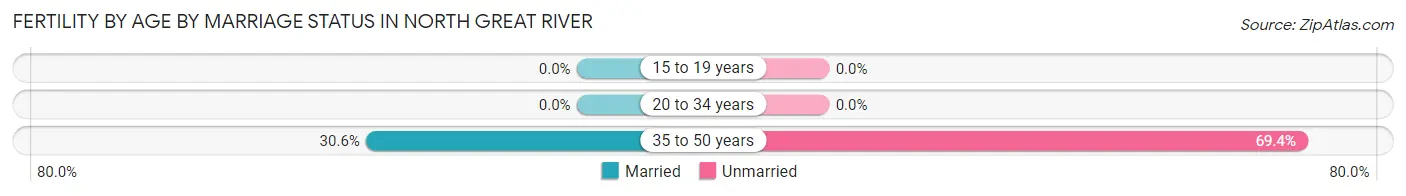
| Age Bracket | Married | Unmarried |
| 15 to 19 years | 0 (0.0%) | 0 (0.0%) |
| 20 to 34 years | 0 (0.0%) | 0 (0.0%) |
| 35 to 50 years | 11 (30.6%) | 25 (69.4%) |
| Total | 11 (30.6%) | 25 (69.4%) |
Fertility by Education in North Great River
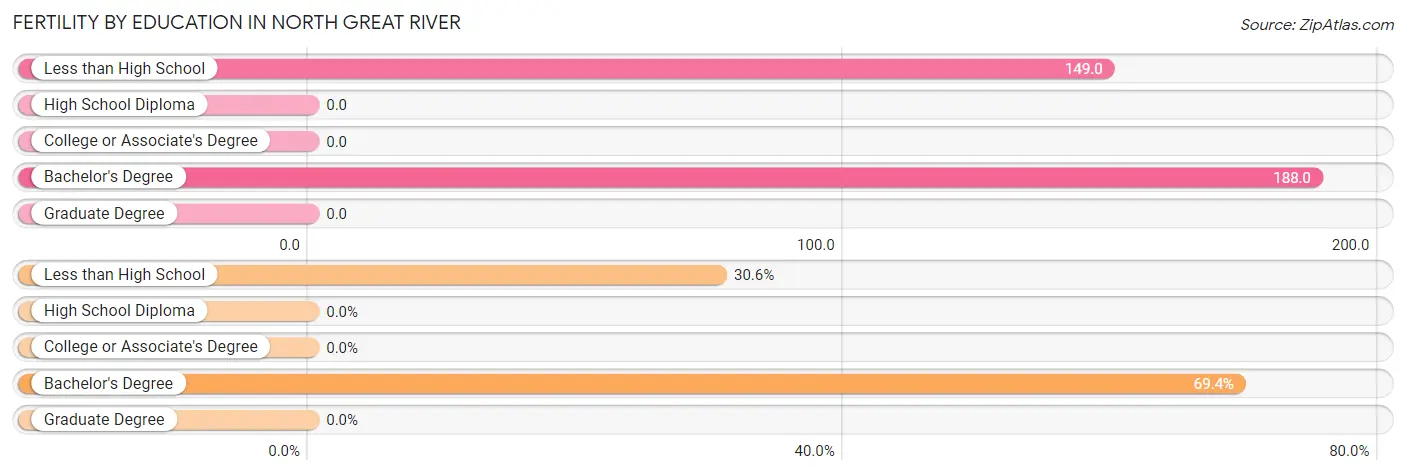
| Educational Attainment | Women with Births | Births / 1,000 Women |
| Less than High School | 11 (30.6%) | 149.0 |
| High School Diploma | 0 (0.0%) | 0.0 |
| College or Associate's Degree | 0 (0.0%) | 0.0 |
| Bachelor's Degree | 25 (69.4%) | 188.0 |
| Graduate Degree | 0 (0.0%) | 0.0 |
| Total | 36 (100.0%) | 52.0 |
Fertility by Education by Marriage Status in North Great River
69.4% of women with births in North Great River are unmarried. Women with the educational attainment of less than high school are most likely to be married with 100.0% of them married at childbirth, while women with the educational attainment of bachelor's degree are least likely to be married with 100.0% of them unmarried at childbirth.
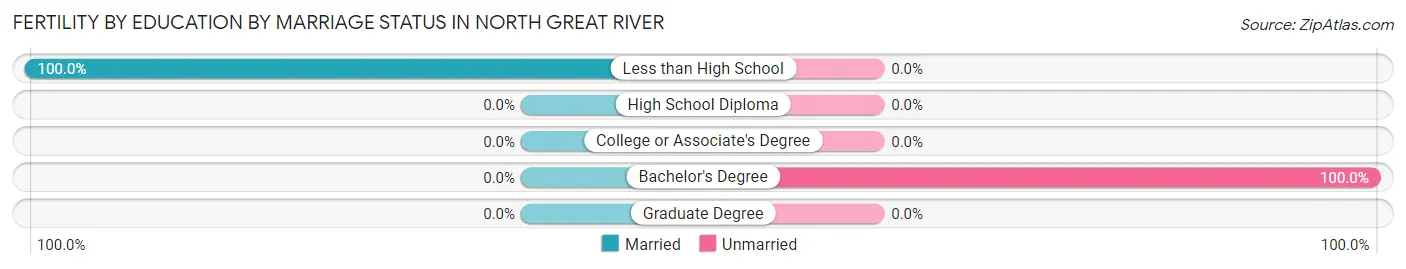
| Educational Attainment | Married | Unmarried |
| Less than High School | 11 (100.0%) | 0 (0.0%) |
| High School Diploma | 0 (0.0%) | 0 (0.0%) |
| College or Associate's Degree | 0 (0.0%) | 0 (0.0%) |
| Bachelor's Degree | 0 (0.0%) | 25 (100.0%) |
| Graduate Degree | 0 (0.0%) | 0 (0.0%) |
| Total | 11 (30.6%) | 25 (69.4%) |
Employment Characteristics in North Great River
Employment by Class of Employer in North Great River
Among the 1,946 employed individuals in North Great River, private company employees (1,292 | 66.4%), state government employees (207 | 10.6%), and local government employees (145 | 7.4%) make up the most common classes of employment.
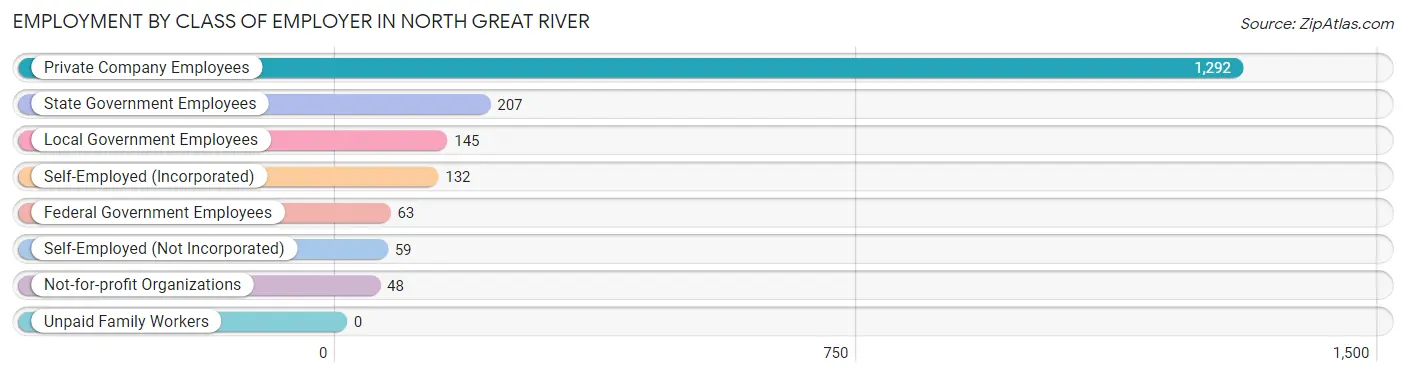
| Employer Class | # Employees | % Employees |
| Private Company Employees | 1,292 | 66.4% |
| Self-Employed (Incorporated) | 132 | 6.8% |
| Self-Employed (Not Incorporated) | 59 | 3.0% |
| Not-for-profit Organizations | 48 | 2.5% |
| Local Government Employees | 145 | 7.4% |
| State Government Employees | 207 | 10.6% |
| Federal Government Employees | 63 | 3.2% |
| Unpaid Family Workers | 0 | 0.0% |
| Total | 1,946 | 100.0% |
Employment Status by Age in North Great River
According to the labor force statistics for North Great River, out of the total population over 16 years of age (3,155), 64.2% or 2,026 individuals are in the labor force, with 1.5% or 30 of them unemployed. The age group with the highest labor force participation rate is 45 to 54 years, with 95.7% or 471 individuals in the labor force. Within the labor force, the 30 to 34 years age range has the highest percentage of unemployed individuals, with 7.9% or 15 of them being unemployed.
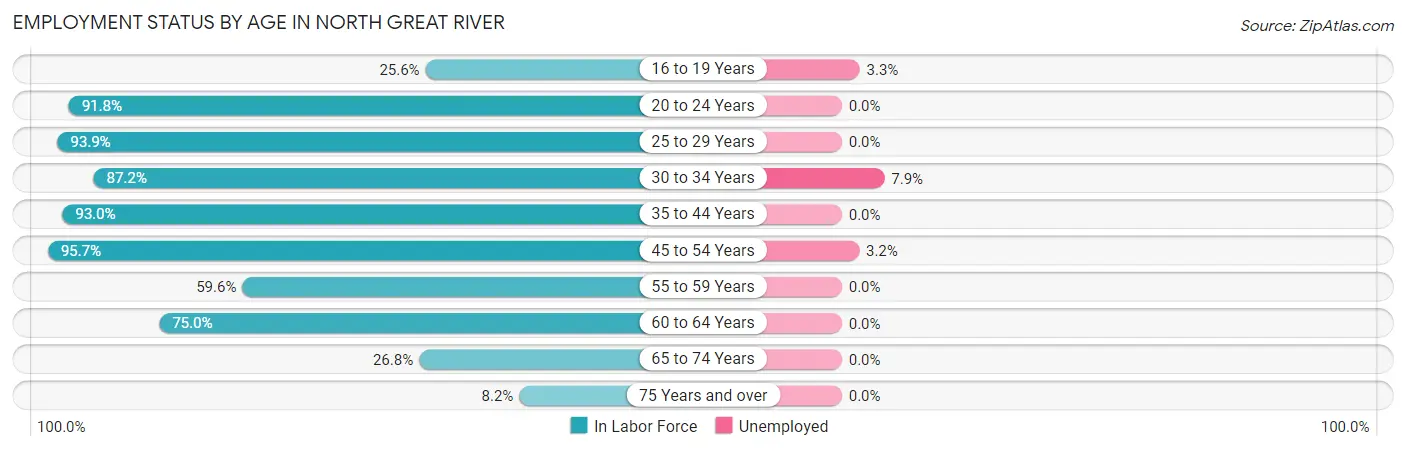
| Age Bracket | In Labor Force | Unemployed |
| 16 to 19 Years | 30 (25.6%) | 1 (3.3%) |
| 20 to 24 Years | 145 (91.8%) | 0 (0.0%) |
| 25 to 29 Years | 169 (93.9%) | 0 (0.0%) |
| 30 to 34 Years | 190 (87.2%) | 15 (7.9%) |
| 35 to 44 Years | 387 (93.0%) | 0 (0.0%) |
| 45 to 54 Years | 471 (95.7%) | 15 (3.2%) |
| 55 to 59 Years | 201 (59.6%) | 0 (0.0%) |
| 60 to 64 Years | 306 (75.0%) | 0 (0.0%) |
| 65 to 74 Years | 84 (26.8%) | 0 (0.0%) |
| 75 Years and over | 42 (8.2%) | 0 (0.0%) |
| Total | 2,026 (64.2%) | 30 (1.5%) |
Employment Status by Educational Attainment in North Great River
According to labor force statistics for North Great River, 84.1% of individuals (1,725) out of the total population between 25 and 64 years of age (2,051) are in the labor force, with 1.7% or 29 of them being unemployed. The group with the highest labor force participation rate are those with the educational attainment of bachelor's degree or higher, with 86.3% or 567 individuals in the labor force. Within the labor force, individuals with high school diploma education have the highest percentage of unemployment, with 5.7% or 30 of them being unemployed.
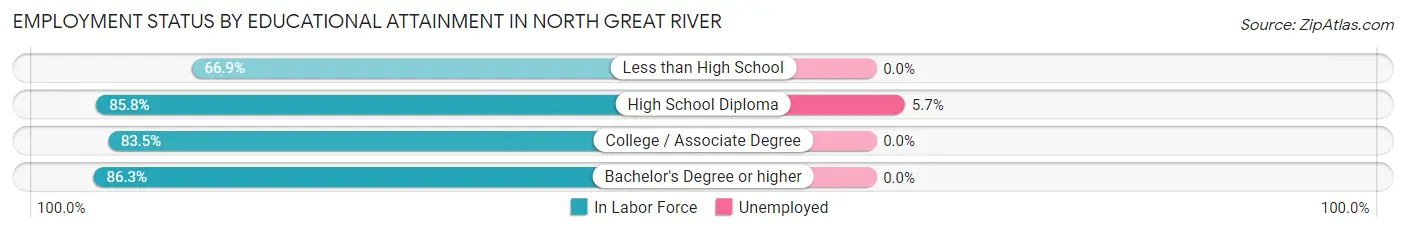
| Educational Attainment | In Labor Force | Unemployed |
| Less than High School | 85 (66.9%) | 0 (0.0%) |
| High School Diploma | 525 (85.8%) | 35 (5.7%) |
| College / Associate Degree | 547 (83.5%) | 0 (0.0%) |
| Bachelor's Degree or higher | 567 (86.3%) | 0 (0.0%) |
| Total | 1,725 (84.1%) | 35 (1.7%) |
Employment Occupations by Sex in North Great River
Management, Business, Science and Arts Occupations
The most common Management, Business, Science and Arts occupations in North Great River are Community & Social Service (247 | 12.4%), Business & Financial (159 | 8.0%), Management (156 | 7.8%), Education Instruction & Library (156 | 7.8%), and Computers, Engineering & Science (103 | 5.2%).
Management, Business, Science and Arts Occupations by Sex
Within the Management, Business, Science and Arts occupations in North Great River, the most male-oriented occupations are Architecture & Engineering (100.0%), Life, Physical & Social Science (100.0%), and Computers, Engineering & Science (80.6%), while the most female-oriented occupations are Legal Services & Support (100.0%), Education Instruction & Library (100.0%), and Health Technologists (100.0%).
| Occupation | Male | Female |
| Management | 91 (58.3%) | 65 (41.7%) |
| Business & Financial | 50 (31.5%) | 109 (68.5%) |
| Computers, Engineering & Science | 83 (80.6%) | 20 (19.4%) |
| Computers & Mathematics | 46 (69.7%) | 20 (30.3%) |
| Architecture & Engineering | 30 (100.0%) | 0 (0.0%) |
| Life, Physical & Social Science | 7 (100.0%) | 0 (0.0%) |
| Community & Social Service | 10 (4.1%) | 237 (96.0%) |
| Education, Arts & Media | 1 (1.8%) | 56 (98.3%) |
| Legal Services & Support | 0 (0.0%) | 17 (100.0%) |
| Education Instruction & Library | 0 (0.0%) | 156 (100.0%) |
| Arts, Media & Entertainment | 9 (52.9%) | 8 (47.1%) |
| Health Diagnosing & Treating | 15 (15.0%) | 85 (85.0%) |
| Health Technologists | 0 (0.0%) | 65 (100.0%) |
| Total (Category) | 249 (32.6%) | 516 (67.4%) |
| Total (Overall) | 991 (49.7%) | 1,003 (50.3%) |
Services Occupations
The most common Services occupations in North Great River are Personal Care & Service (82 | 4.1%), Healthcare Support (67 | 3.4%), Security & Protection (44 | 2.2%), Cleaning & Maintenance (37 | 1.9%), and Firefighting & Prevention (24 | 1.2%).
Services Occupations by Sex
Within the Services occupations in North Great River, the most male-oriented occupations are Security & Protection (100.0%), Firefighting & Prevention (100.0%), and Law Enforcement (100.0%), while the most female-oriented occupations are Healthcare Support (100.0%), and Personal Care & Service (39.0%).
| Occupation | Male | Female |
| Healthcare Support | 0 (0.0%) | 67 (100.0%) |
| Security & Protection | 44 (100.0%) | 0 (0.0%) |
| Firefighting & Prevention | 24 (100.0%) | 0 (0.0%) |
| Law Enforcement | 20 (100.0%) | 0 (0.0%) |
| Food Preparation & Serving | 14 (100.0%) | 0 (0.0%) |
| Cleaning & Maintenance | 37 (100.0%) | 0 (0.0%) |
| Personal Care & Service | 50 (61.0%) | 32 (39.0%) |
| Total (Category) | 145 (59.4%) | 99 (40.6%) |
| Total (Overall) | 991 (49.7%) | 1,003 (50.3%) |
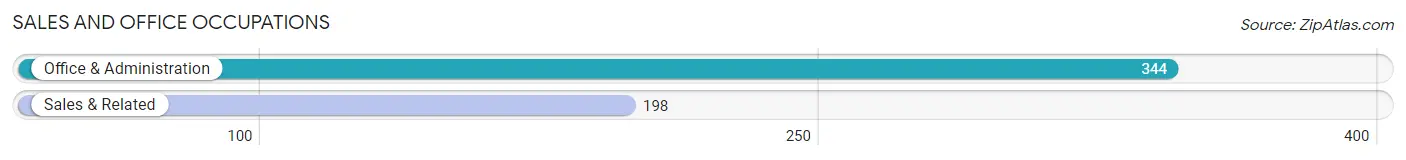
Sales and Office Occupations
The most common Sales and Office occupations in North Great River are Office & Administration (344 | 17.2%), and Sales & Related (198 | 9.9%).
Sales and Office Occupations by Sex
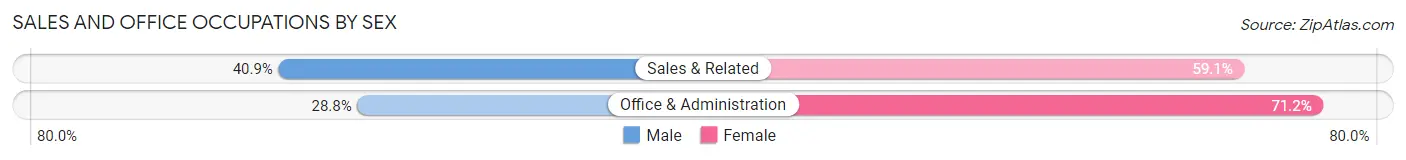
| Occupation | Male | Female |
| Sales & Related | 81 (40.9%) | 117 (59.1%) |
| Office & Administration | 99 (28.8%) | 245 (71.2%) |
| Total (Category) | 180 (33.2%) | 362 (66.8%) |
| Total (Overall) | 991 (49.7%) | 1,003 (50.3%) |
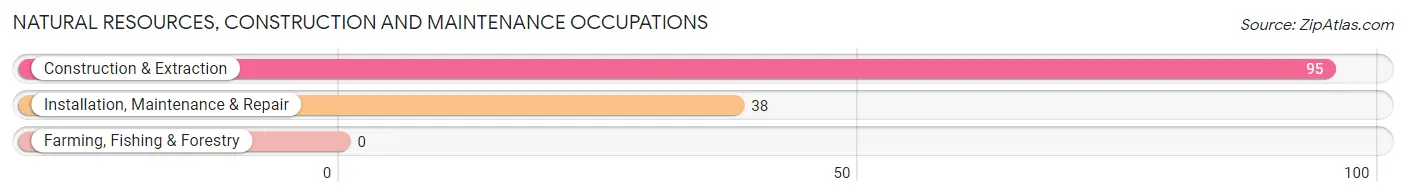
Natural Resources, Construction and Maintenance Occupations
The most common Natural Resources, Construction and Maintenance occupations in North Great River are Construction & Extraction (95 | 4.8%), and Installation, Maintenance & Repair (38 | 1.9%).
Natural Resources, Construction and Maintenance Occupations by Sex
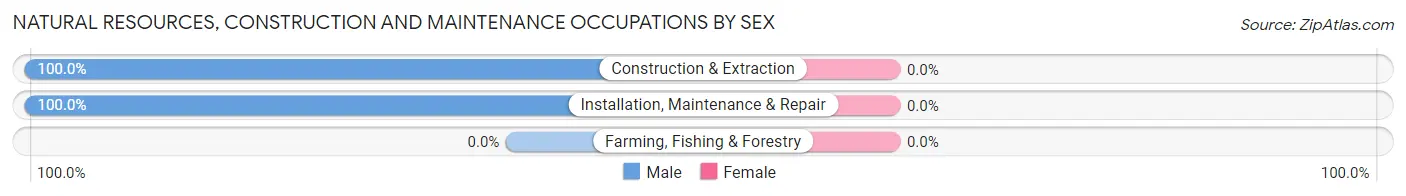
| Occupation | Male | Female |
| Farming, Fishing & Forestry | 0 (0.0%) | 0 (0.0%) |
| Construction & Extraction | 95 (100.0%) | 0 (0.0%) |
| Installation, Maintenance & Repair | 38 (100.0%) | 0 (0.0%) |
| Total (Category) | 133 (100.0%) | 0 (0.0%) |
| Total (Overall) | 991 (49.7%) | 1,003 (50.3%) |
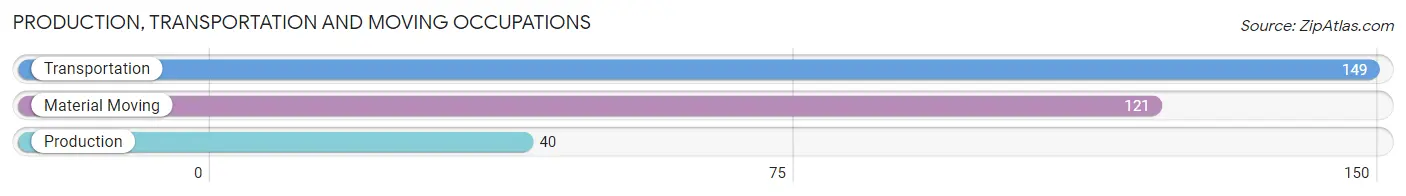
Production, Transportation and Moving Occupations
The most common Production, Transportation and Moving occupations in North Great River are Transportation (149 | 7.5%), Material Moving (121 | 6.1%), and Production (40 | 2.0%).
Production, Transportation and Moving Occupations by Sex
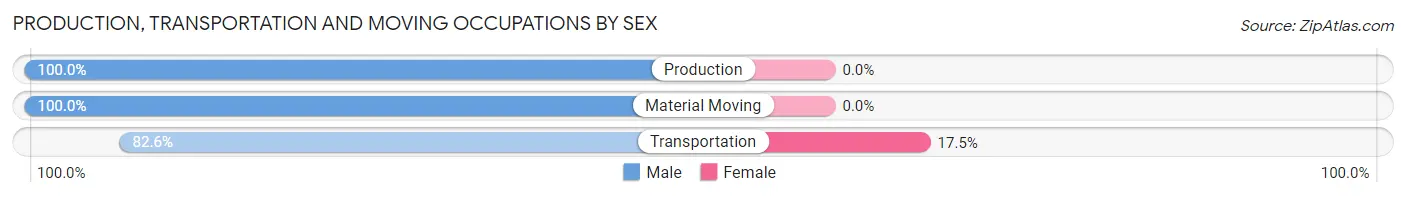
| Occupation | Male | Female |
| Production | 40 (100.0%) | 0 (0.0%) |
| Transportation | 123 (82.6%) | 26 (17.4%) |
| Material Moving | 121 (100.0%) | 0 (0.0%) |
| Total (Category) | 284 (91.6%) | 26 (8.4%) |
| Total (Overall) | 991 (49.7%) | 1,003 (50.3%) |
Employment Industries by Sex in North Great River
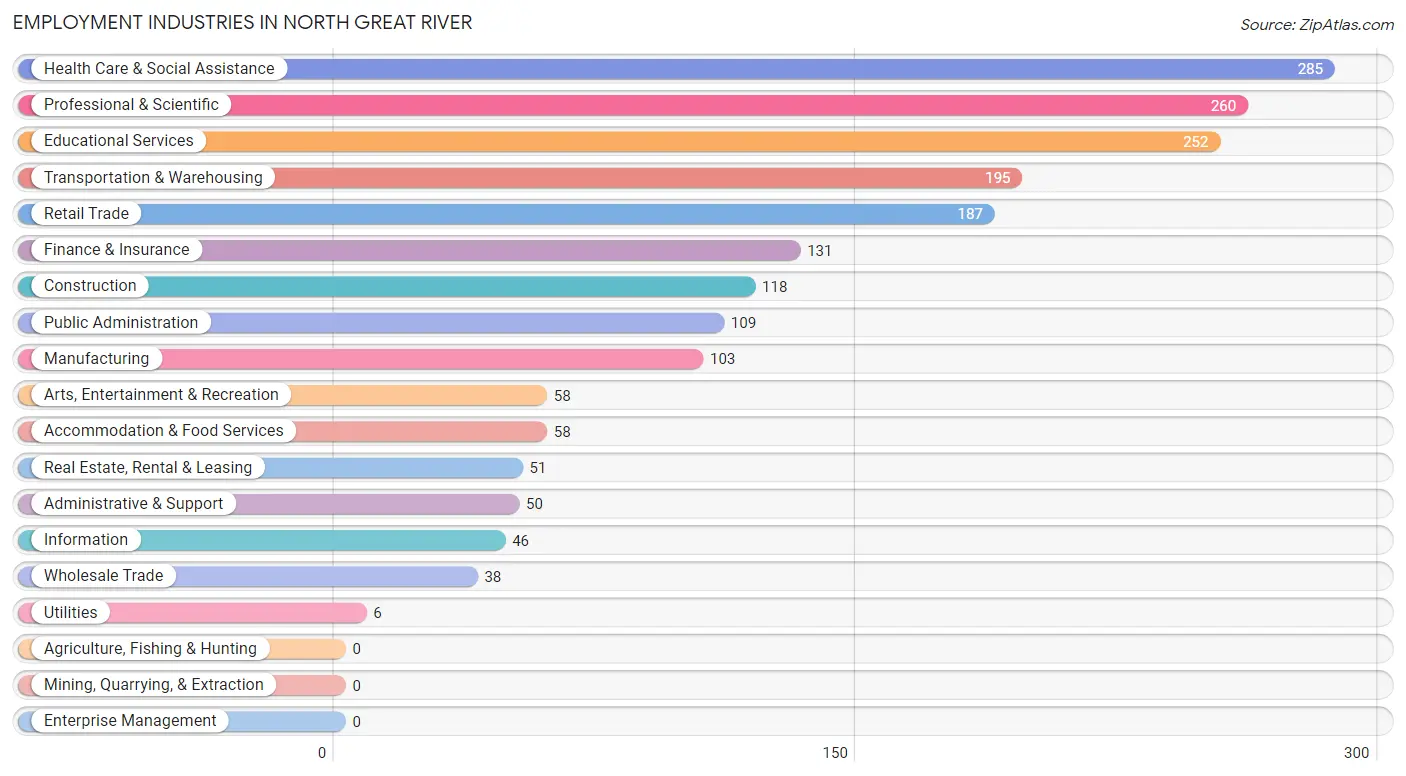
Employment Industries in North Great River
The major employment industries in North Great River include Health Care & Social Assistance (285 | 14.3%), Professional & Scientific (260 | 13.0%), Educational Services (252 | 12.6%), Transportation & Warehousing (195 | 9.8%), and Retail Trade (187 | 9.4%).
Employment Industries by Sex in North Great River
The North Great River industries that see more men than women are Wholesale Trade (100.0%), Utilities (100.0%), and Information (100.0%), whereas the industries that tend to have a higher number of women are Educational Services (79.0%), Accommodation & Food Services (75.9%), and Professional & Scientific (71.2%).
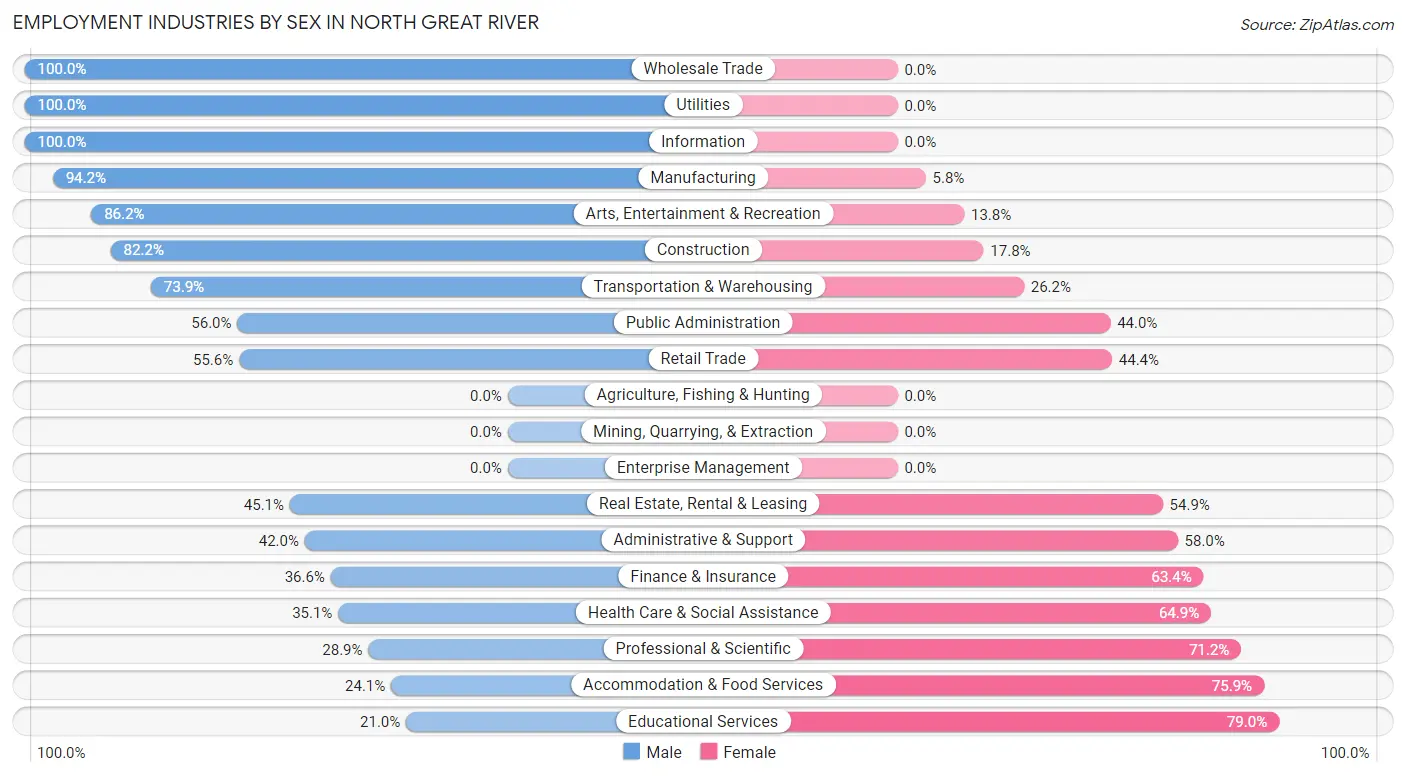
| Industry | Male | Female |
| Agriculture, Fishing & Hunting | 0 (0.0%) | 0 (0.0%) |
| Mining, Quarrying, & Extraction | 0 (0.0%) | 0 (0.0%) |
| Construction | 97 (82.2%) | 21 (17.8%) |
| Manufacturing | 97 (94.2%) | 6 (5.8%) |
| Wholesale Trade | 38 (100.0%) | 0 (0.0%) |
| Retail Trade | 104 (55.6%) | 83 (44.4%) |
| Transportation & Warehousing | 144 (73.9%) | 51 (26.2%) |
| Utilities | 6 (100.0%) | 0 (0.0%) |
| Information | 46 (100.0%) | 0 (0.0%) |
| Finance & Insurance | 48 (36.6%) | 83 (63.4%) |
| Real Estate, Rental & Leasing | 23 (45.1%) | 28 (54.9%) |
| Professional & Scientific | 75 (28.8%) | 185 (71.2%) |
| Enterprise Management | 0 (0.0%) | 0 (0.0%) |
| Administrative & Support | 21 (42.0%) | 29 (58.0%) |
| Educational Services | 53 (21.0%) | 199 (79.0%) |
| Health Care & Social Assistance | 100 (35.1%) | 185 (64.9%) |
| Arts, Entertainment & Recreation | 50 (86.2%) | 8 (13.8%) |
| Accommodation & Food Services | 14 (24.1%) | 44 (75.9%) |
| Public Administration | 61 (56.0%) | 48 (44.0%) |
| Total | 991 (49.7%) | 1,003 (50.3%) |
Education in North Great River
School Enrollment in North Great River
The most common levels of schooling among the 734 students in North Great River are high school (200 | 27.3%), middle school (191 | 26.0%), and elementary school (148 | 20.2%).
| School Level | # Students | % Students |
| Nursery / Preschool | 32 | 4.4% |
| Kindergarten | 16 | 2.2% |
| Elementary School | 148 | 20.2% |
| Middle School | 191 | 26.0% |
| High School | 200 | 27.3% |
| College / Undergraduate | 103 | 14.0% |
| Graduate / Professional | 44 | 6.0% |
| Total | 734 | 100.0% |
School Enrollment by Age by Funding Source in North Great River
Out of a total of 734 students who are enrolled in schools in North Great River, 93 (12.7%) attend a private institution, while the remaining 641 (87.3%) are enrolled in public schools. The age group of 15 to 17 year olds has the highest likelihood of being enrolled in private schools, with 60 (57.7% in the age bracket) enrolled. Conversely, the age group of 3 to 4 year olds has the lowest likelihood of being enrolled in a private school, with 32 (100.0% in the age bracket) attending a public institution.
| Age Bracket | Public School | Private School |
| 3 to 4 Year Olds | 32 (100.0%) | 0 (0.0%) |
| 5 to 9 Year Old | 145 (100.0%) | 0 (0.0%) |
| 10 to 14 Year Olds | 294 (100.0%) | 0 (0.0%) |
| 15 to 17 Year Olds | 44 (42.3%) | 60 (57.7%) |
| 18 to 19 Year Olds | 12 (100.0%) | 0 (0.0%) |
| 20 to 24 Year Olds | 81 (77.1%) | 24 (22.9%) |
| 25 to 34 Year Olds | 16 (64.0%) | 9 (36.0%) |
| 35 Years and over | 17 (100.0%) | 0 (0.0%) |
| Total | 641 (87.3%) | 93 (12.7%) |
Educational Attainment by Field of Study in North Great River
Business (271 | 27.0%), education (138 | 13.8%), bio, nature & agricultural (104 | 10.4%), science & technology (93 | 9.3%), and psychology (78 | 7.8%) are the most common fields of study among 1,003 individuals in North Great River who have obtained a bachelor's degree or higher.
| Field of Study | # Graduates | % Graduates |
| Computers & Mathematics | 15 | 1.5% |
| Bio, Nature & Agricultural | 104 | 10.4% |
| Physical & Health Sciences | 29 | 2.9% |
| Psychology | 78 | 7.8% |
| Social Sciences | 76 | 7.6% |
| Engineering | 46 | 4.6% |
| Multidisciplinary Studies | 0 | 0.0% |
| Science & Technology | 93 | 9.3% |
| Business | 271 | 27.0% |
| Education | 138 | 13.8% |
| Literature & Languages | 69 | 6.9% |
| Liberal Arts & History | 63 | 6.3% |
| Visual & Performing Arts | 0 | 0.0% |
| Communications | 0 | 0.0% |
| Arts & Humanities | 21 | 2.1% |
| Total | 1,003 | 100.0% |
Transportation & Commute in North Great River
Vehicle Availability by Sex in North Great River
The most prevalent vehicle ownership categories in North Great River are males with 2 vehicles (396, accounting for 40.0%) and females with 2 vehicles (453, making up 41.5%).
| Vehicles Available | Male | Female |
| No Vehicle | 0 (0.0%) | 0 (0.0%) |
| 1 Vehicle | 56 (5.7%) | 69 (7.2%) |
| 2 Vehicles | 396 (40.0%) | 453 (47.4%) |
| 3 Vehicles | 203 (20.5%) | 226 (23.7%) |
| 4 Vehicles | 297 (30.0%) | 193 (20.2%) |
| 5 or more Vehicles | 38 (3.8%) | 14 (1.5%) |
| Total | 990 (100.0%) | 955 (100.0%) |
Commute Time in North Great River
The most frequently occuring commute durations in North Great River are 10 to 14 minutes (354 commuters, 19.8%), 20 to 24 minutes (307 commuters, 17.1%), and 25 to 29 minutes (203 commuters, 11.3%).
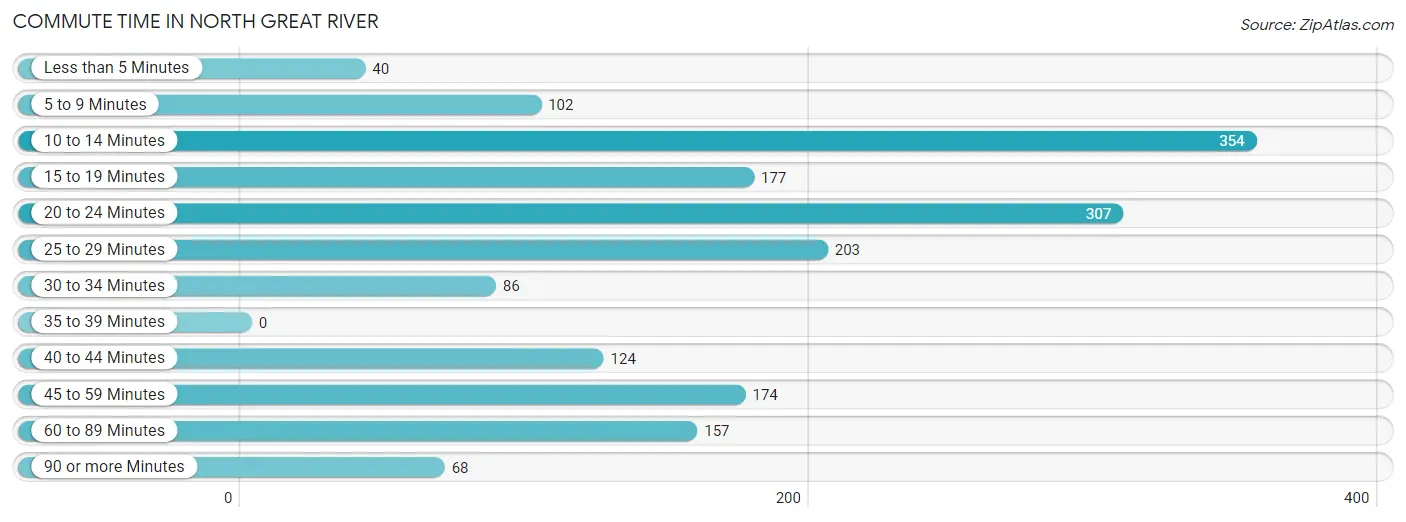
| Commute Time | # Commuters | % Commuters |
| Less than 5 Minutes | 40 | 2.2% |
| 5 to 9 Minutes | 102 | 5.7% |
| 10 to 14 Minutes | 354 | 19.8% |
| 15 to 19 Minutes | 177 | 9.9% |
| 20 to 24 Minutes | 307 | 17.1% |
| 25 to 29 Minutes | 203 | 11.3% |
| 30 to 34 Minutes | 86 | 4.8% |
| 35 to 39 Minutes | 0 | 0.0% |
| 40 to 44 Minutes | 124 | 6.9% |
| 45 to 59 Minutes | 174 | 9.7% |
| 60 to 89 Minutes | 157 | 8.8% |
| 90 or more Minutes | 68 | 3.8% |
Commute Time by Sex in North Great River
The most common commute times in North Great River are 10 to 14 minutes (168 commuters, 18.5%) for males and 10 to 14 minutes (186 commuters, 21.0%) for females.
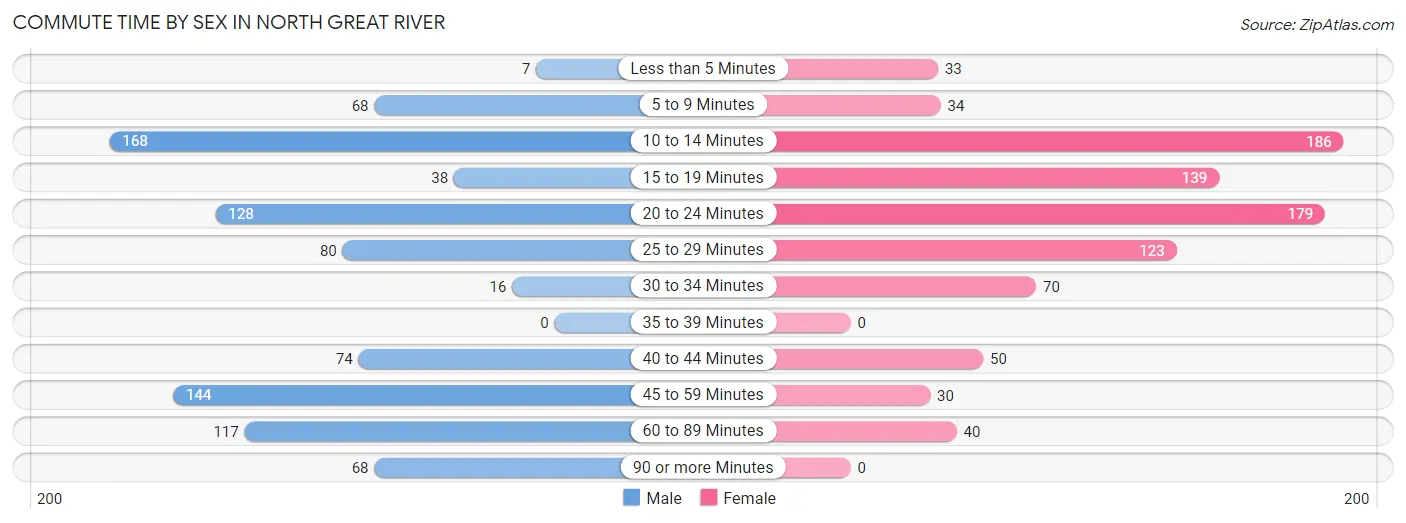
| Commute Time | Male | Female |
| Less than 5 Minutes | 7 (0.8%) | 33 (3.7%) |
| 5 to 9 Minutes | 68 (7.5%) | 34 (3.8%) |
| 10 to 14 Minutes | 168 (18.5%) | 186 (21.0%) |
| 15 to 19 Minutes | 38 (4.2%) | 139 (15.7%) |
| 20 to 24 Minutes | 128 (14.1%) | 179 (20.3%) |
| 25 to 29 Minutes | 80 (8.8%) | 123 (13.9%) |
| 30 to 34 Minutes | 16 (1.8%) | 70 (7.9%) |
| 35 to 39 Minutes | 0 (0.0%) | 0 (0.0%) |
| 40 to 44 Minutes | 74 (8.2%) | 50 (5.7%) |
| 45 to 59 Minutes | 144 (15.9%) | 30 (3.4%) |
| 60 to 89 Minutes | 117 (12.9%) | 40 (4.5%) |
| 90 or more Minutes | 68 (7.5%) | 0 (0.0%) |
Time of Departure to Work by Sex in North Great River
The most frequent times of departure to work in North Great River are 7:00 AM to 7:29 AM (195, 21.5%) for males and 9:00 AM to 9:59 AM (178, 20.1%) for females.
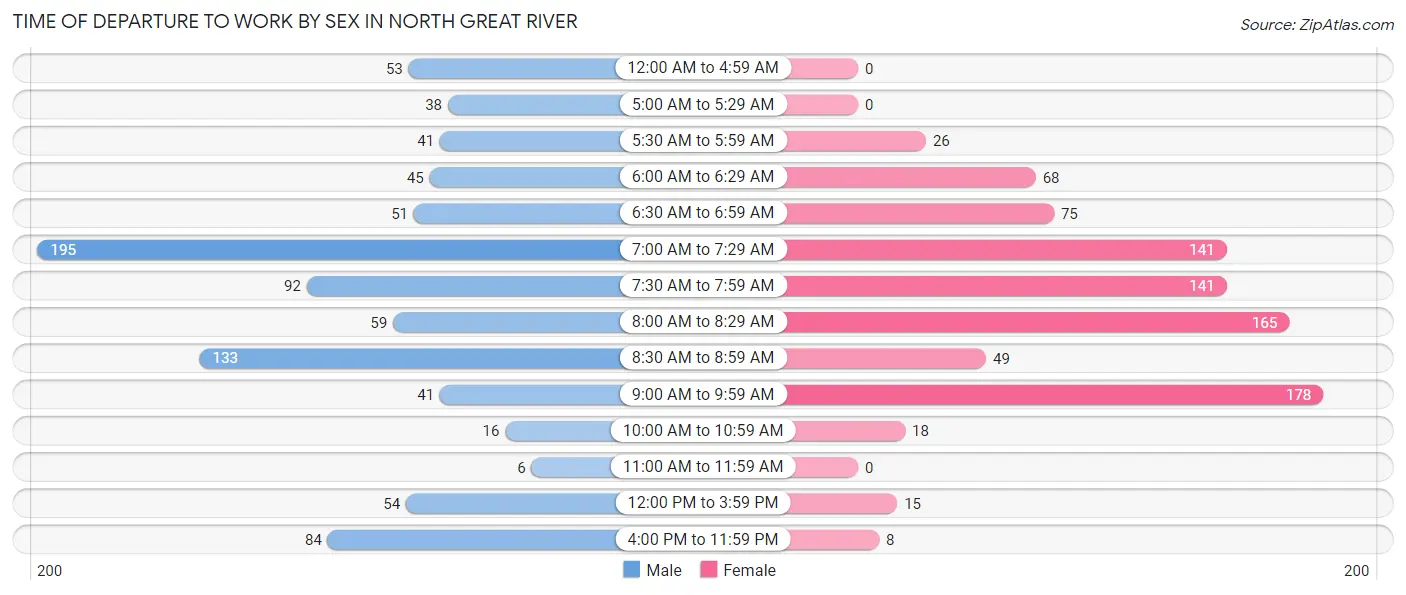
| Time of Departure | Male | Female |
| 12:00 AM to 4:59 AM | 53 (5.8%) | 0 (0.0%) |
| 5:00 AM to 5:29 AM | 38 (4.2%) | 0 (0.0%) |
| 5:30 AM to 5:59 AM | 41 (4.5%) | 26 (2.9%) |
| 6:00 AM to 6:29 AM | 45 (5.0%) | 68 (7.7%) |
| 6:30 AM to 6:59 AM | 51 (5.6%) | 75 (8.5%) |
| 7:00 AM to 7:29 AM | 195 (21.5%) | 141 (16.0%) |
| 7:30 AM to 7:59 AM | 92 (10.1%) | 141 (16.0%) |
| 8:00 AM to 8:29 AM | 59 (6.5%) | 165 (18.7%) |
| 8:30 AM to 8:59 AM | 133 (14.6%) | 49 (5.5%) |
| 9:00 AM to 9:59 AM | 41 (4.5%) | 178 (20.1%) |
| 10:00 AM to 10:59 AM | 16 (1.8%) | 18 (2.0%) |
| 11:00 AM to 11:59 AM | 6 (0.7%) | 0 (0.0%) |
| 12:00 PM to 3:59 PM | 54 (5.9%) | 15 (1.7%) |
| 4:00 PM to 11:59 PM | 84 (9.2%) | 8 (0.9%) |
| Total | 908 (100.0%) | 884 (100.0%) |
Housing Occupancy in North Great River
Occupancy by Ownership in North Great River
Of the total 1,295 dwellings in North Great River, owner-occupied units account for 1,069 (82.6%), while renter-occupied units make up 226 (17.4%).
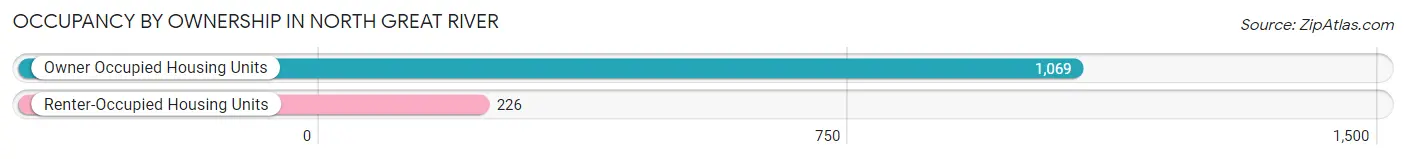
| Occupancy | # Housing Units | % Housing Units |
| Owner Occupied Housing Units | 1,069 | 82.6% |
| Renter-Occupied Housing Units | 226 | 17.4% |
| Total Occupied Housing Units | 1,295 | 100.0% |
Occupancy by Household Size in North Great River
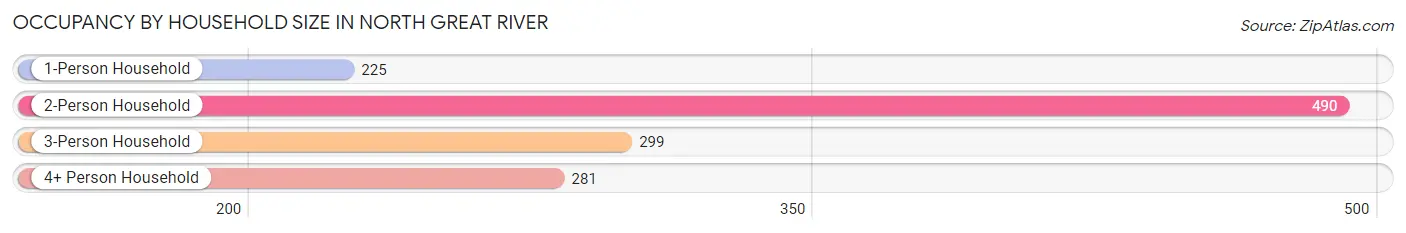
| Household Size | # Housing Units | % Housing Units |
| 1-Person Household | 225 | 17.4% |
| 2-Person Household | 490 | 37.8% |
| 3-Person Household | 299 | 23.1% |
| 4+ Person Household | 281 | 21.7% |
| Total Housing Units | 1,295 | 100.0% |
Occupancy by Ownership by Household Size in North Great River
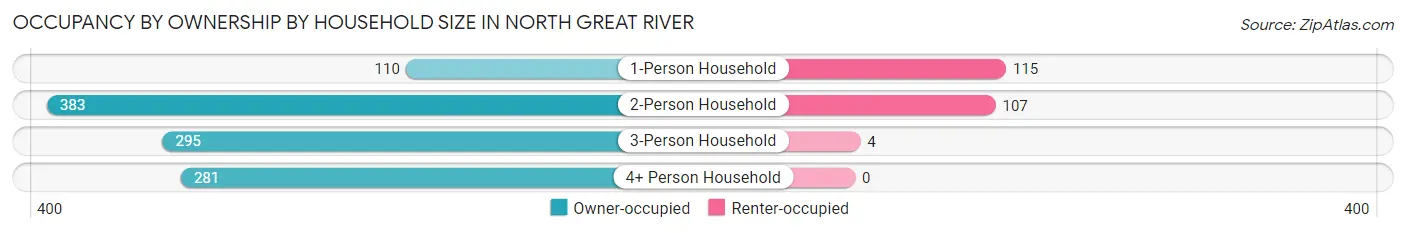
| Household Size | Owner-occupied | Renter-occupied |
| 1-Person Household | 110 (48.9%) | 115 (51.1%) |
| 2-Person Household | 383 (78.2%) | 107 (21.8%) |
| 3-Person Household | 295 (98.7%) | 4 (1.3%) |
| 4+ Person Household | 281 (100.0%) | 0 (0.0%) |
| Total Housing Units | 1,069 (82.6%) | 226 (17.4%) |
Occupancy by Educational Attainment in North Great River
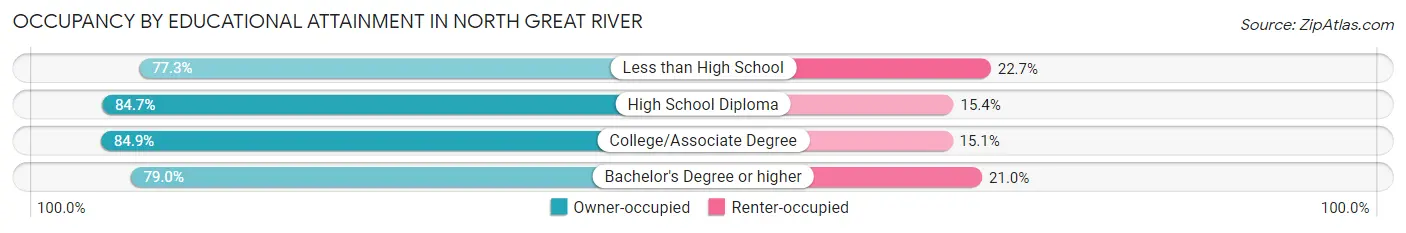
| Household Size | Owner-occupied | Renter-occupied |
| Less than High School | 34 (77.3%) | 10 (22.7%) |
| High School Diploma | 364 (84.7%) | 66 (15.3%) |
| College/Associate Degree | 325 (84.9%) | 58 (15.1%) |
| Bachelor's Degree or higher | 346 (79.0%) | 92 (21.0%) |
Occupancy by Age of Householder in North Great River
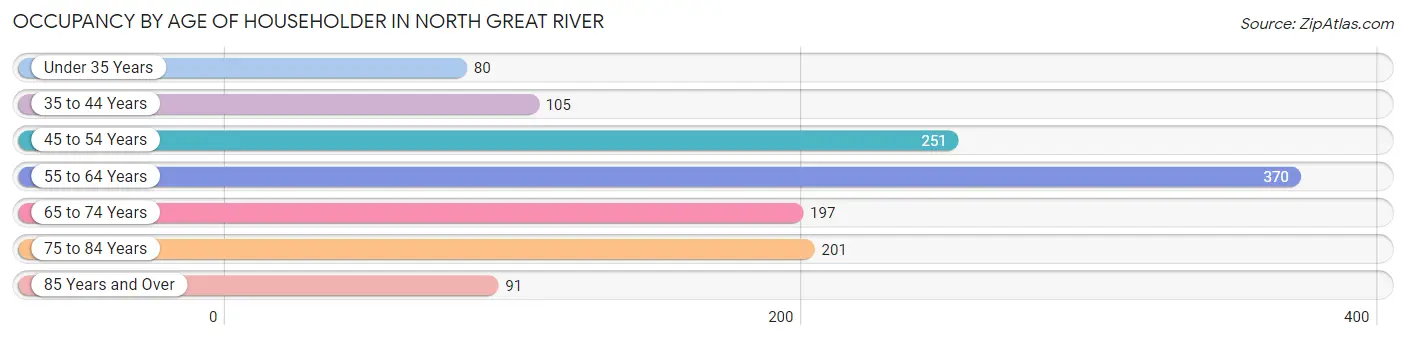
| Age Bracket | # Households | % Households |
| Under 35 Years | 80 | 6.2% |
| 35 to 44 Years | 105 | 8.1% |
| 45 to 54 Years | 251 | 19.4% |
| 55 to 64 Years | 370 | 28.6% |
| 65 to 74 Years | 197 | 15.2% |
| 75 to 84 Years | 201 | 15.5% |
| 85 Years and Over | 91 | 7.0% |
| Total | 1,295 | 100.0% |
Housing Finances in North Great River
Median Income by Occupancy in North Great River
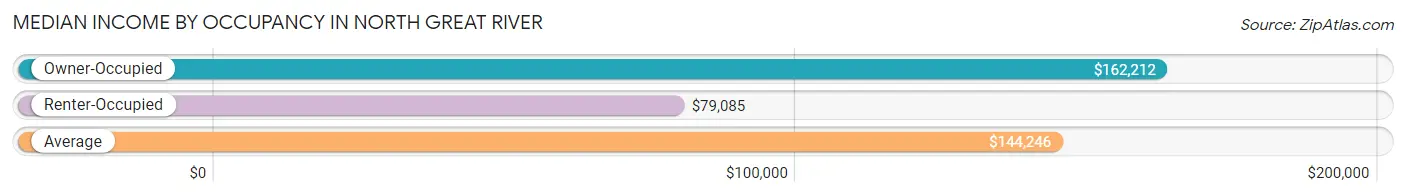
| Occupancy Type | # Households | Median Income |
| Owner-Occupied | 1,069 (82.6%) | $162,212 |
| Renter-Occupied | 226 (17.4%) | $79,085 |
| Average | 1,295 (100.0%) | $144,246 |
Occupancy by Householder Income Bracket in North Great River
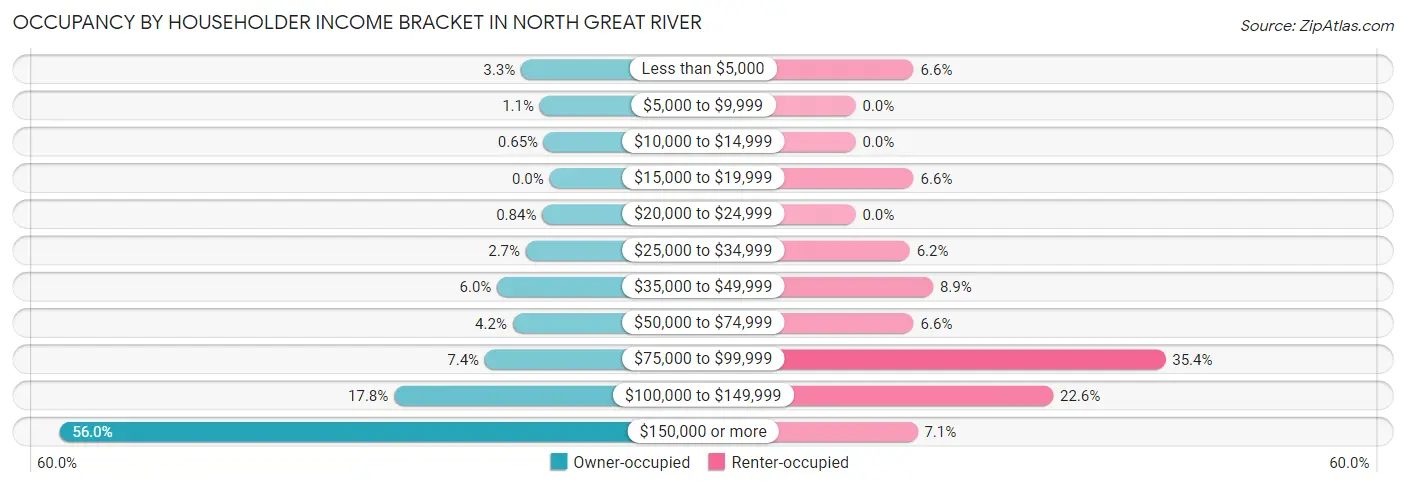
| Income Bracket | Owner-occupied | Renter-occupied |
| Less than $5,000 | 35 (3.3%) | 15 (6.6%) |
| $5,000 to $9,999 | 12 (1.1%) | 0 (0.0%) |
| $10,000 to $14,999 | 7 (0.6%) | 0 (0.0%) |
| $15,000 to $19,999 | 0 (0.0%) | 15 (6.6%) |
| $20,000 to $24,999 | 9 (0.8%) | 0 (0.0%) |
| $25,000 to $34,999 | 29 (2.7%) | 14 (6.2%) |
| $35,000 to $49,999 | 64 (6.0%) | 20 (8.8%) |
| $50,000 to $74,999 | 45 (4.2%) | 15 (6.6%) |
| $75,000 to $99,999 | 79 (7.4%) | 80 (35.4%) |
| $100,000 to $149,999 | 190 (17.8%) | 51 (22.6%) |
| $150,000 or more | 599 (56.0%) | 16 (7.1%) |
| Total | 1,069 (100.0%) | 226 (100.0%) |
Monthly Housing Cost Tiers in North Great River
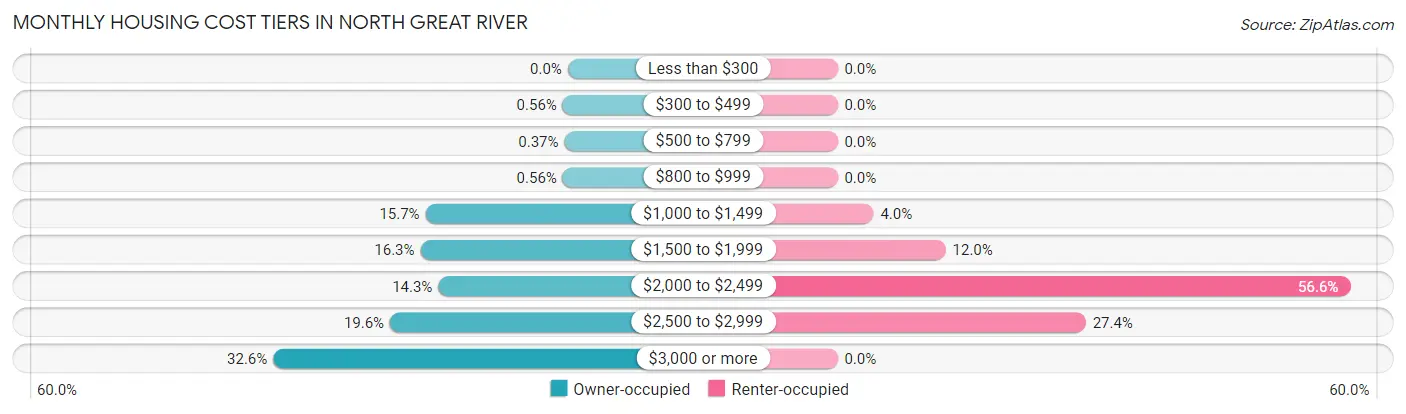
| Monthly Cost | Owner-occupied | Renter-occupied |
| Less than $300 | 0 (0.0%) | 0 (0.0%) |
| $300 to $499 | 6 (0.6%) | 0 (0.0%) |
| $500 to $799 | 4 (0.4%) | 0 (0.0%) |
| $800 to $999 | 6 (0.6%) | 0 (0.0%) |
| $1,000 to $1,499 | 168 (15.7%) | 9 (4.0%) |
| $1,500 to $1,999 | 174 (16.3%) | 27 (11.9%) |
| $2,000 to $2,499 | 153 (14.3%) | 128 (56.6%) |
| $2,500 to $2,999 | 210 (19.6%) | 62 (27.4%) |
| $3,000 or more | 348 (32.6%) | 0 (0.0%) |
| Total | 1,069 (100.0%) | 226 (100.0%) |
Physical Housing Characteristics in North Great River
Housing Structures in North Great River
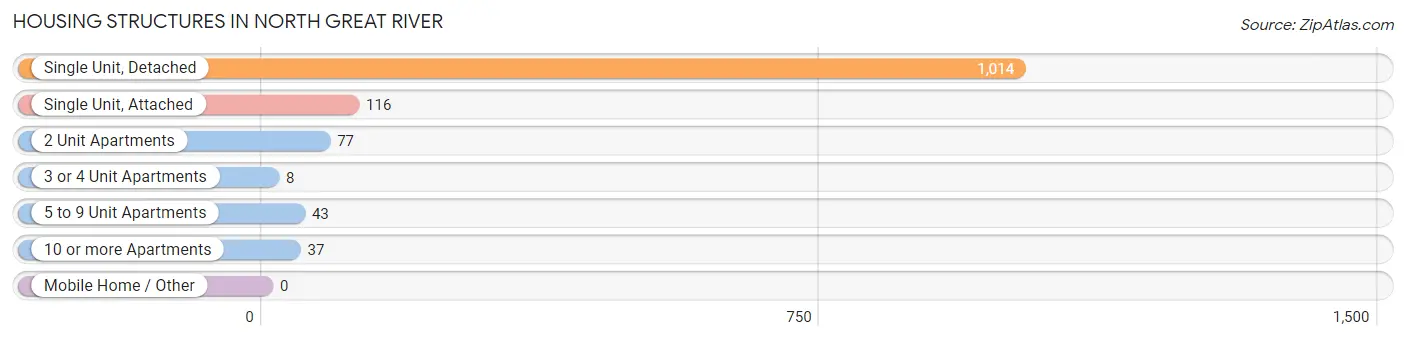
| Structure Type | # Housing Units | % Housing Units |
| Single Unit, Detached | 1,014 | 78.3% |
| Single Unit, Attached | 116 | 9.0% |
| 2 Unit Apartments | 77 | 5.9% |
| 3 or 4 Unit Apartments | 8 | 0.6% |
| 5 to 9 Unit Apartments | 43 | 3.3% |
| 10 or more Apartments | 37 | 2.9% |
| Mobile Home / Other | 0 | 0.0% |
| Total | 1,295 | 100.0% |
Housing Structures by Occupancy in North Great River
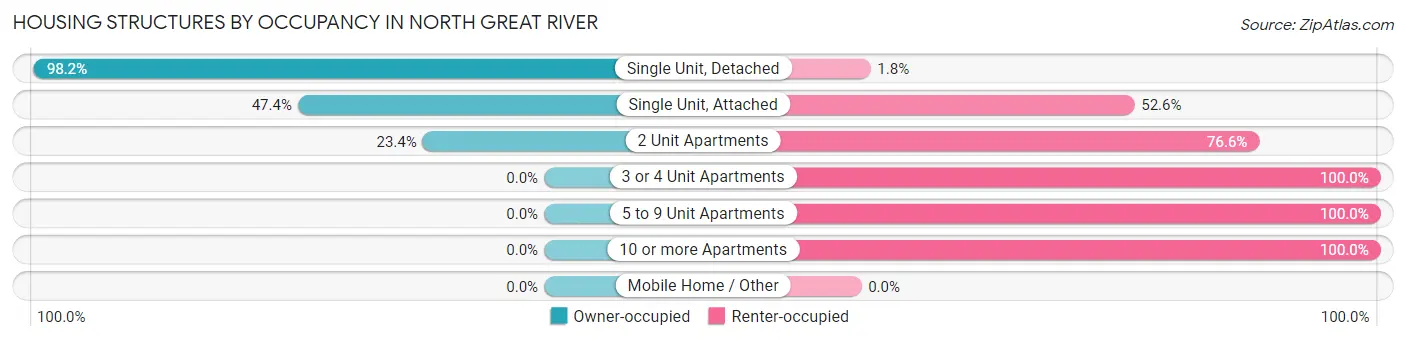
| Structure Type | Owner-occupied | Renter-occupied |
| Single Unit, Detached | 996 (98.2%) | 18 (1.8%) |
| Single Unit, Attached | 55 (47.4%) | 61 (52.6%) |
| 2 Unit Apartments | 18 (23.4%) | 59 (76.6%) |
| 3 or 4 Unit Apartments | 0 (0.0%) | 8 (100.0%) |
| 5 to 9 Unit Apartments | 0 (0.0%) | 43 (100.0%) |
| 10 or more Apartments | 0 (0.0%) | 37 (100.0%) |
| Mobile Home / Other | 0 (0.0%) | 0 (0.0%) |
| Total | 1,069 (82.6%) | 226 (17.4%) |
Housing Structures by Number of Rooms in North Great River
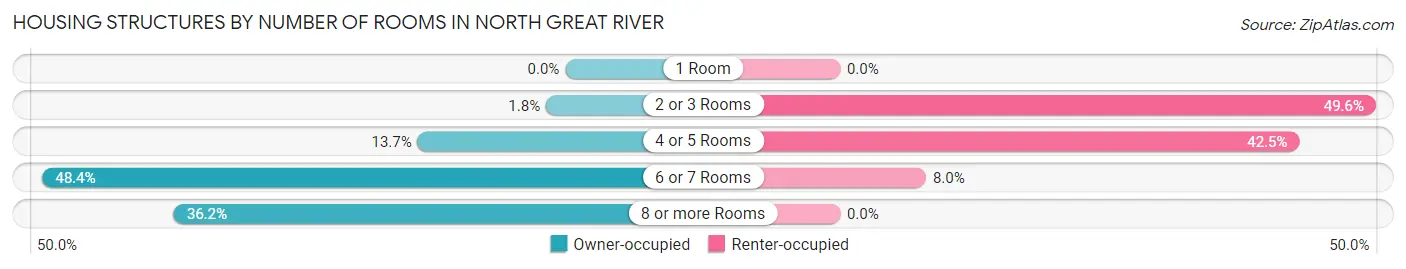
| Number of Rooms | Owner-occupied | Renter-occupied |
| 1 Room | 0 (0.0%) | 0 (0.0%) |
| 2 or 3 Rooms | 19 (1.8%) | 112 (49.6%) |
| 4 or 5 Rooms | 146 (13.7%) | 96 (42.5%) |
| 6 or 7 Rooms | 517 (48.4%) | 18 (8.0%) |
| 8 or more Rooms | 387 (36.2%) | 0 (0.0%) |
| Total | 1,069 (100.0%) | 226 (100.0%) |
Housing Structure by Heating Type in North Great River
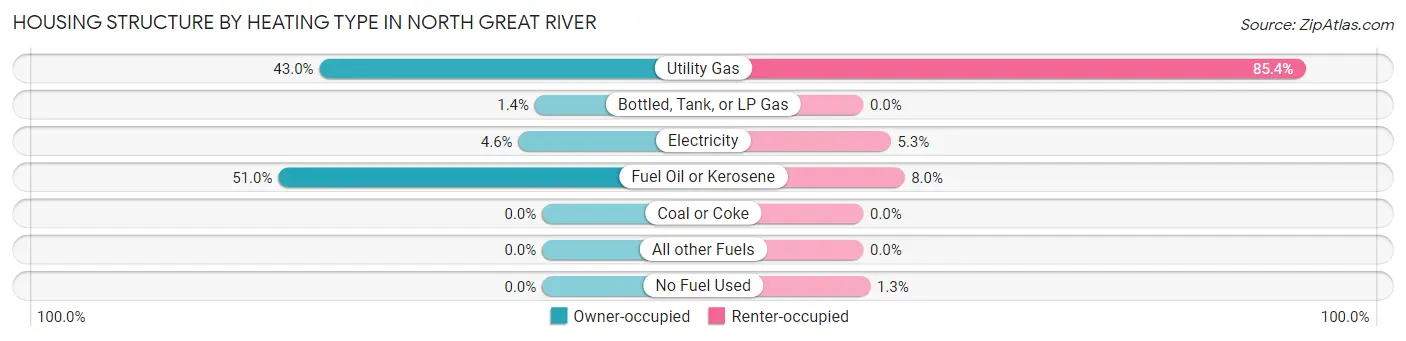
| Heating Type | Owner-occupied | Renter-occupied |
| Utility Gas | 460 (43.0%) | 193 (85.4%) |
| Bottled, Tank, or LP Gas | 15 (1.4%) | 0 (0.0%) |
| Electricity | 49 (4.6%) | 12 (5.3%) |
| Fuel Oil or Kerosene | 545 (51.0%) | 18 (8.0%) |
| Coal or Coke | 0 (0.0%) | 0 (0.0%) |
| All other Fuels | 0 (0.0%) | 0 (0.0%) |
| No Fuel Used | 0 (0.0%) | 3 (1.3%) |
| Total | 1,069 (100.0%) | 226 (100.0%) |
Household Vehicle Usage in North Great River
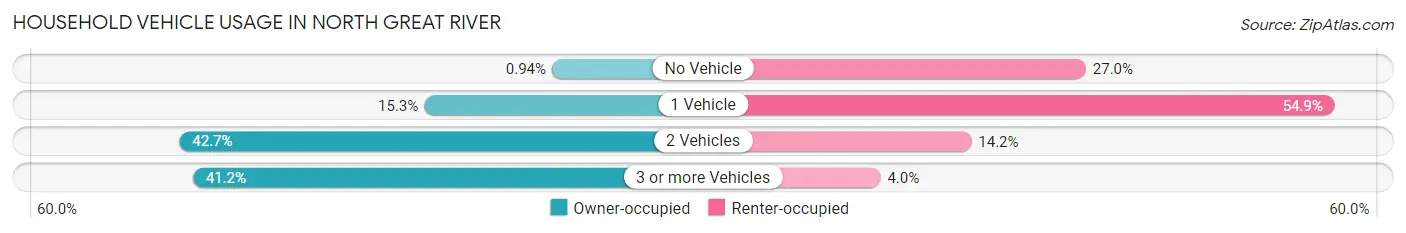
| Vehicles per Household | Owner-occupied | Renter-occupied |
| No Vehicle | 10 (0.9%) | 61 (27.0%) |
| 1 Vehicle | 163 (15.2%) | 124 (54.9%) |
| 2 Vehicles | 456 (42.7%) | 32 (14.2%) |
| 3 or more Vehicles | 440 (41.2%) | 9 (4.0%) |
| Total | 1,069 (100.0%) | 226 (100.0%) |
Real Estate & Mortgages in North Great River
Real Estate and Mortgage Overview in North Great River
| Characteristic | Without Mortgage | With Mortgage |
| Housing Units | 307 | 762 |
| Median Property Value | $465,000 | $460,200 |
| Median Household Income | $166,250 | $431 |
| Monthly Housing Costs | $1,501 | $348 |
| Real Estate Taxes | $10,001 | $0 |
Property Value by Mortgage Status in North Great River
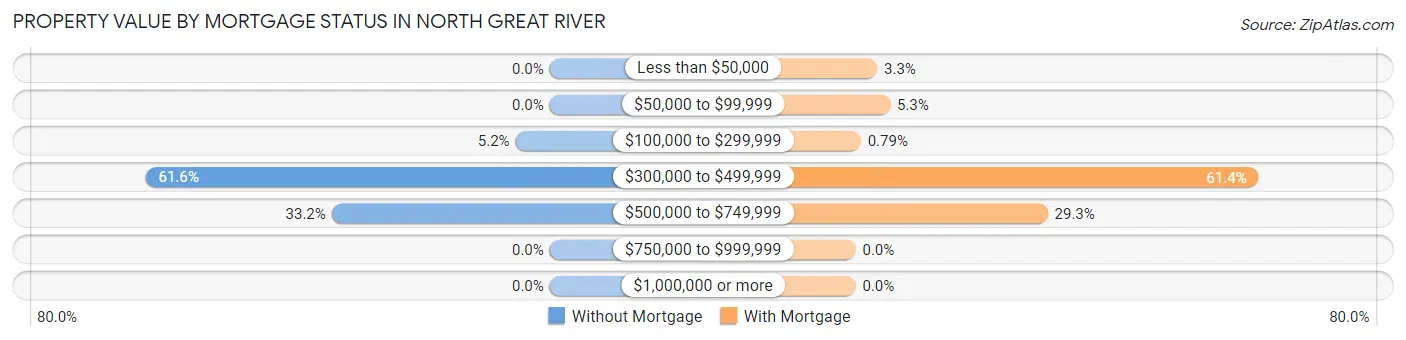
| Property Value | Without Mortgage | With Mortgage |
| Less than $50,000 | 0 (0.0%) | 25 (3.3%) |
| $50,000 to $99,999 | 0 (0.0%) | 40 (5.2%) |
| $100,000 to $299,999 | 16 (5.2%) | 6 (0.8%) |
| $300,000 to $499,999 | 189 (61.6%) | 468 (61.4%) |
| $500,000 to $749,999 | 102 (33.2%) | 223 (29.3%) |
| $750,000 to $999,999 | 0 (0.0%) | 0 (0.0%) |
| $1,000,000 or more | 0 (0.0%) | 0 (0.0%) |
| Total | 307 (100.0%) | 762 (100.0%) |
Household Income by Mortgage Status in North Great River
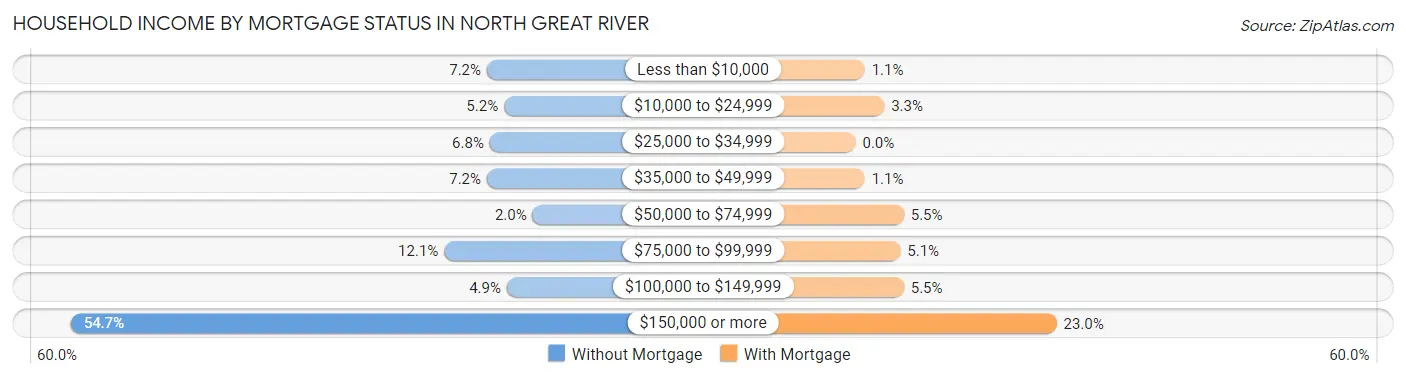
| Household Income | Without Mortgage | With Mortgage |
| Less than $10,000 | 22 (7.2%) | 8 (1.1%) |
| $10,000 to $24,999 | 16 (5.2%) | 25 (3.3%) |
| $25,000 to $34,999 | 21 (6.8%) | 0 (0.0%) |
| $35,000 to $49,999 | 22 (7.2%) | 8 (1.1%) |
| $50,000 to $74,999 | 6 (1.9%) | 42 (5.5%) |
| $75,000 to $99,999 | 37 (12.0%) | 39 (5.1%) |
| $100,000 to $149,999 | 15 (4.9%) | 42 (5.5%) |
| $150,000 or more | 168 (54.7%) | 175 (23.0%) |
| Total | 307 (100.0%) | 762 (100.0%) |
Property Value to Household Income Ratio in North Great River
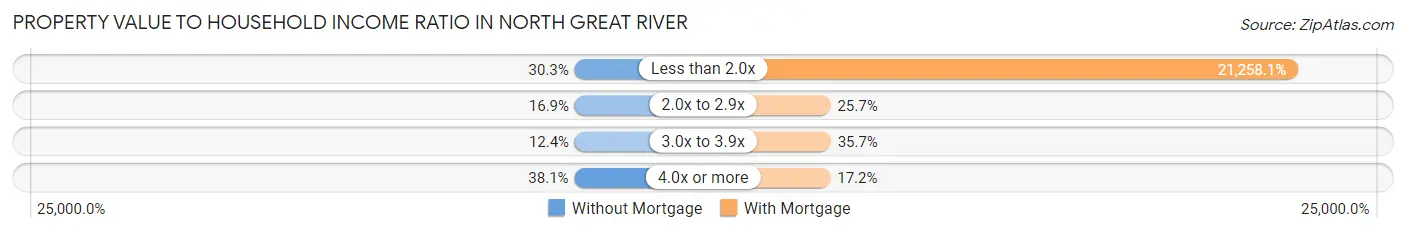
| Value-to-Income Ratio | Without Mortgage | With Mortgage |
| Less than 2.0x | 93 (30.3%) | 161,987 (21,258.1%) |
| 2.0x to 2.9x | 52 (16.9%) | 196 (25.7%) |
| 3.0x to 3.9x | 38 (12.4%) | 272 (35.7%) |
| 4.0x or more | 117 (38.1%) | 131 (17.2%) |
| Total | 307 (100.0%) | 762 (100.0%) |
Real Estate Taxes by Mortgage Status in North Great River
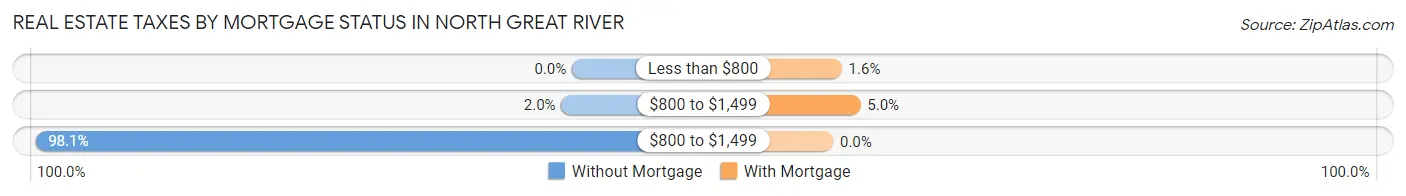
| Property Taxes | Without Mortgage | With Mortgage |
| Less than $800 | 0 (0.0%) | 12 (1.6%) |
| $800 to $1,499 | 6 (1.9%) | 38 (5.0%) |
| $800 to $1,499 | 301 (98.1%) | 0 (0.0%) |
| Total | 307 (100.0%) | 762 (100.0%) |
Health & Disability in North Great River
Health Insurance Coverage by Age in North Great River
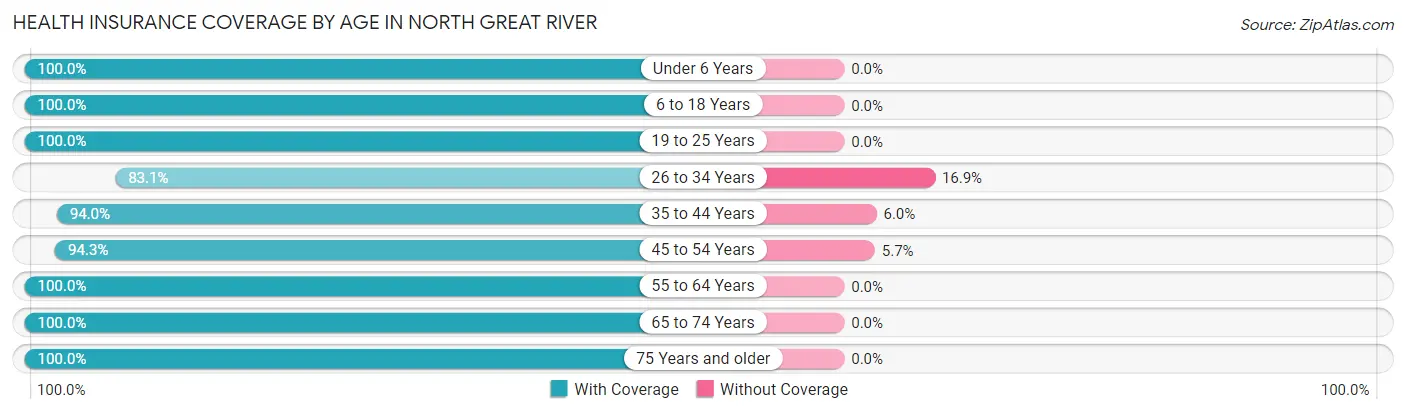
| Age Bracket | With Coverage | Without Coverage |
| Under 6 Years | 80 (100.0%) | 0 (0.0%) |
| 6 to 18 Years | 547 (100.0%) | 0 (0.0%) |
| 19 to 25 Years | 210 (100.0%) | 0 (0.0%) |
| 26 to 34 Years | 300 (83.1%) | 61 (16.9%) |
| 35 to 44 Years | 391 (94.0%) | 25 (6.0%) |
| 45 to 54 Years | 464 (94.3%) | 28 (5.7%) |
| 55 to 64 Years | 745 (100.0%) | 0 (0.0%) |
| 65 to 74 Years | 314 (100.0%) | 0 (0.0%) |
| 75 Years and older | 515 (100.0%) | 0 (0.0%) |
| Total | 3,566 (96.9%) | 114 (3.1%) |
Health Insurance Coverage by Citizenship Status in North Great River
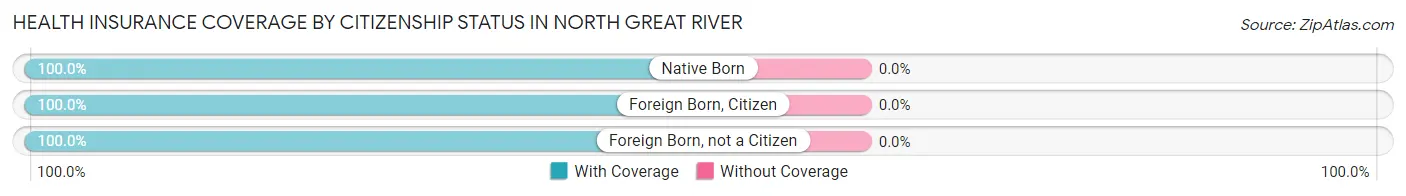
| Citizenship Status | With Coverage | Without Coverage |
| Native Born | 80 (100.0%) | 0 (0.0%) |
| Foreign Born, Citizen | 547 (100.0%) | 0 (0.0%) |
| Foreign Born, not a Citizen | 210 (100.0%) | 0 (0.0%) |
Health Insurance Coverage by Household Income in North Great River
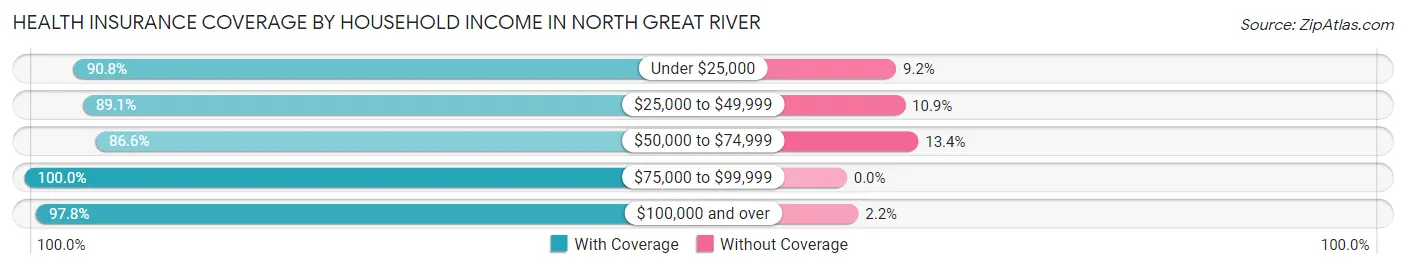
| Household Income | With Coverage | Without Coverage |
| Under $25,000 | 118 (90.8%) | 12 (9.2%) |
| $25,000 to $49,999 | 204 (89.1%) | 25 (10.9%) |
| $50,000 to $74,999 | 97 (86.6%) | 15 (13.4%) |
| $75,000 to $99,999 | 334 (100.0%) | 0 (0.0%) |
| $100,000 and over | 2,809 (97.8%) | 62 (2.2%) |
Public vs Private Health Insurance Coverage by Age in North Great River
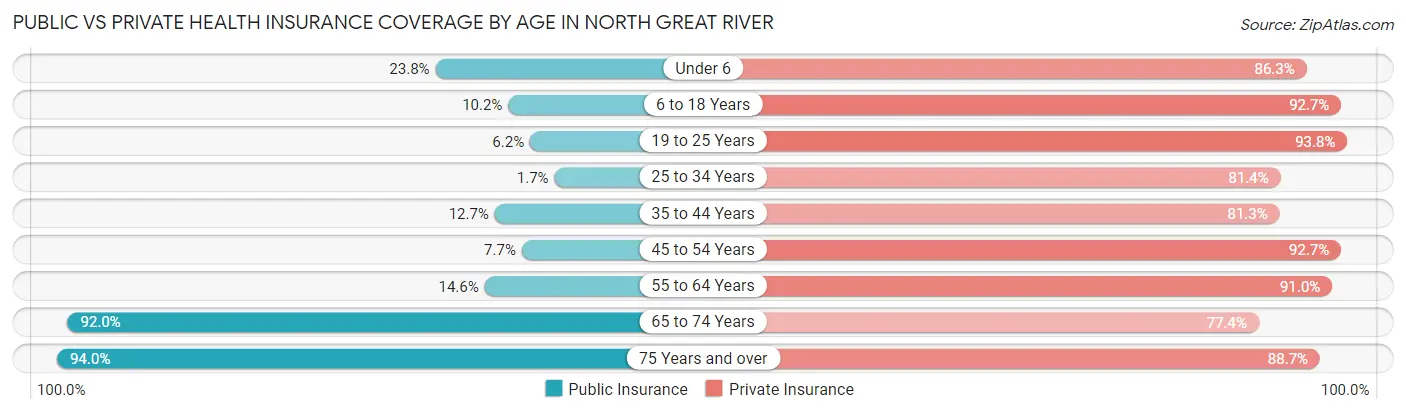
| Age Bracket | Public Insurance | Private Insurance |
| Under 6 | 19 (23.7%) | 69 (86.3%) |
| 6 to 18 Years | 56 (10.2%) | 507 (92.7%) |
| 19 to 25 Years | 13 (6.2%) | 197 (93.8%) |
| 25 to 34 Years | 6 (1.7%) | 294 (81.4%) |
| 35 to 44 Years | 53 (12.7%) | 338 (81.2%) |
| 45 to 54 Years | 38 (7.7%) | 456 (92.7%) |
| 55 to 64 Years | 109 (14.6%) | 678 (91.0%) |
| 65 to 74 Years | 289 (92.0%) | 243 (77.4%) |
| 75 Years and over | 484 (94.0%) | 457 (88.7%) |
| Total | 1,067 (29.0%) | 3,239 (88.0%) |
Disability Status by Sex by Age in North Great River
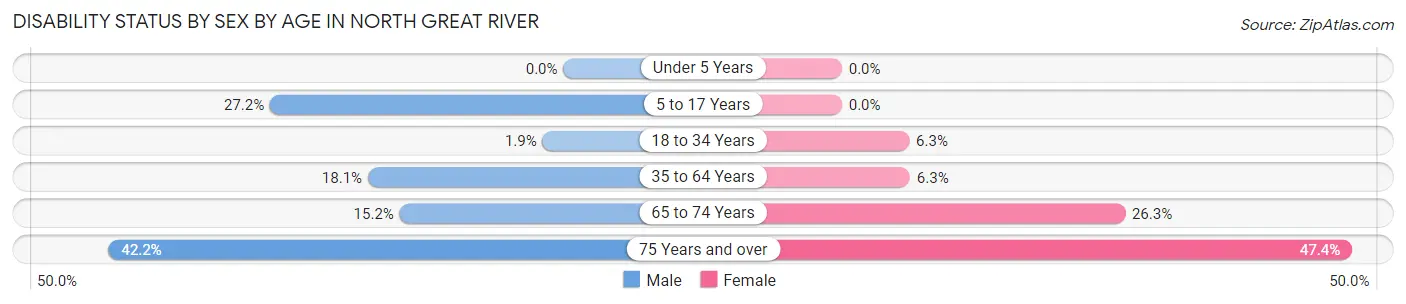
| Age Bracket | Male | Female |
| Under 5 Years | 0 (0.0%) | 0 (0.0%) |
| 5 to 17 Years | 95 (27.2%) | 0 (0.0%) |
| 18 to 34 Years | 6 (1.9%) | 17 (6.2%) |
| 35 to 64 Years | 142 (18.1%) | 55 (6.3%) |
| 65 to 74 Years | 24 (15.2%) | 41 (26.3%) |
| 75 Years and over | 114 (42.2%) | 116 (47.3%) |
Disability Class by Sex by Age in North Great River
Disability Class: Hearing Difficulty
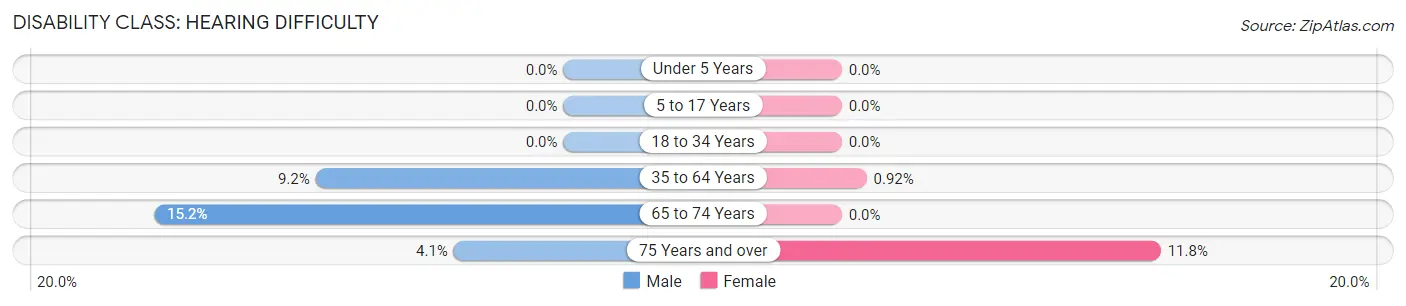
| Age Bracket | Male | Female |
| Under 5 Years | 0 (0.0%) | 0 (0.0%) |
| 5 to 17 Years | 0 (0.0%) | 0 (0.0%) |
| 18 to 34 Years | 0 (0.0%) | 0 (0.0%) |
| 35 to 64 Years | 72 (9.2%) | 8 (0.9%) |
| 65 to 74 Years | 24 (15.2%) | 0 (0.0%) |
| 75 Years and over | 11 (4.1%) | 29 (11.8%) |
Disability Class: Vision Difficulty
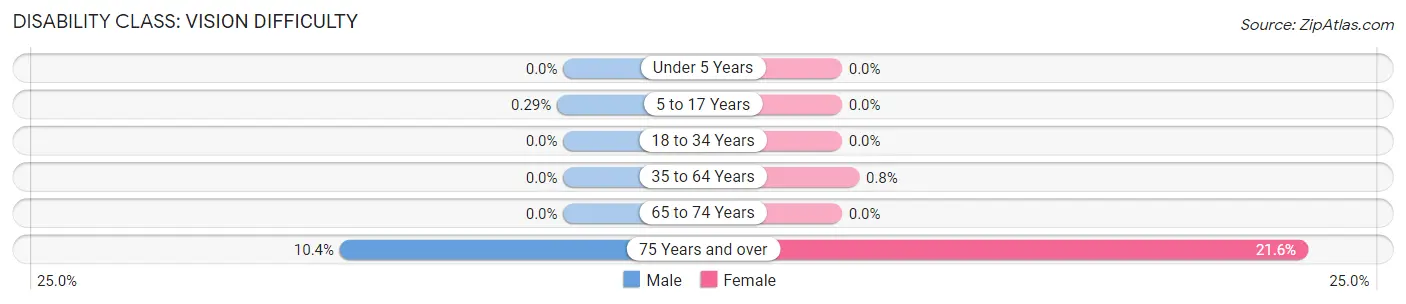
| Age Bracket | Male | Female |
| Under 5 Years | 0 (0.0%) | 0 (0.0%) |
| 5 to 17 Years | 1 (0.3%) | 0 (0.0%) |
| 18 to 34 Years | 0 (0.0%) | 0 (0.0%) |
| 35 to 64 Years | 0 (0.0%) | 7 (0.8%) |
| 65 to 74 Years | 0 (0.0%) | 0 (0.0%) |
| 75 Years and over | 28 (10.4%) | 53 (21.6%) |
Disability Class: Cognitive Difficulty
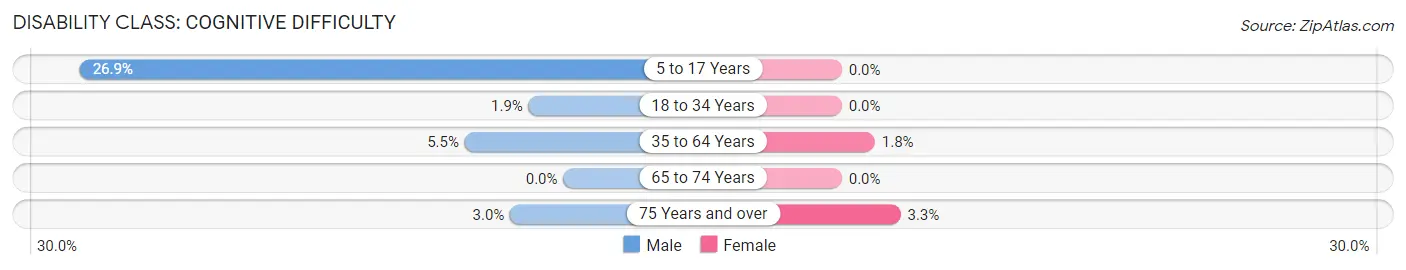
| Age Bracket | Male | Female |
| 5 to 17 Years | 94 (26.9%) | 0 (0.0%) |
| 18 to 34 Years | 6 (1.9%) | 0 (0.0%) |
| 35 to 64 Years | 43 (5.5%) | 16 (1.8%) |
| 65 to 74 Years | 0 (0.0%) | 0 (0.0%) |
| 75 Years and over | 8 (3.0%) | 8 (3.3%) |
Disability Class: Ambulatory Difficulty
| Age Bracket | Male | Female |
| 5 to 17 Years | 0 (0.0%) | 0 (0.0%) |
| 18 to 34 Years | 0 (0.0%) | 0 (0.0%) |
| 35 to 64 Years | 67 (8.6%) | 40 (4.6%) |
| 65 to 74 Years | 0 (0.0%) | 41 (26.3%) |
| 75 Years and over | 62 (23.0%) | 40 (16.3%) |
Disability Class: Self-Care Difficulty
| Age Bracket | Male | Female |
| 5 to 17 Years | 57 (16.3%) | 0 (0.0%) |
| 18 to 34 Years | 0 (0.0%) | 0 (0.0%) |
| 35 to 64 Years | 43 (5.5%) | 33 (3.8%) |
| 65 to 74 Years | 0 (0.0%) | 41 (26.3%) |
| 75 Years and over | 22 (8.2%) | 17 (6.9%) |
Technology Access in North Great River
Computing Device Access in North Great River
| Device Type | # Households | % Households |
| Desktop or Laptop | 1,070 | 82.6% |
| Smartphone | 1,133 | 87.5% |
| Tablet | 910 | 70.3% |
| No Computing Device | 63 | 4.9% |
| Total | 1,295 | 100.0% |
Internet Access in North Great River
| Internet Type | # Households | % Households |
| Dial-Up Internet | 0 | 0.0% |
| Broadband Home | 956 | 73.8% |
| Cellular Data Only | 209 | 16.1% |
| Satellite Internet | 22 | 1.7% |
| No Internet | 116 | 9.0% |
| Total | 1,295 | 100.0% |
North Great River Summary
Great River, New York is a hamlet located in the Town of Islip in Suffolk County, New York. It is situated on the south shore of Long Island, approximately 40 miles east of New York City. The hamlet is bordered by the hamlets of Oakdale to the west, Bohemia to the east, and Baywood to the south.
History
The area that is now Great River was originally inhabited by the Secatogue Indians, a branch of the Algonquin tribe. The Secatogue Indians were a peaceful tribe that lived off the land, fishing and hunting in the area. The first European settlers arrived in the area in the late 1600s, and the hamlet was officially established in 1790.
The hamlet was originally known as “South Islip”, but was later renamed “Great River” in 1845. The name was chosen to reflect the fact that the hamlet is located on the Great South Bay.
Geography
Great River is located on the south shore of Long Island, approximately 40 miles east of New York City. The hamlet is bordered by the hamlets of Oakdale to the west, Bohemia to the east, and Baywood to the south.
The hamlet is situated on the Great South Bay, which is part of the Atlantic Ocean. The bay is a popular destination for fishing, boating, and other recreational activities.
The hamlet is also home to several parks, including the Great River Park, which offers a variety of outdoor activities such as fishing, hiking, and picnicking.
Economy
The economy of Great River is largely based on tourism and recreation. The hamlet is home to several marinas, which offer boat rentals and other services. The hamlet is also home to several restaurants, bars, and other businesses that cater to tourists and locals alike.
The hamlet is also home to several manufacturing and industrial businesses, including a paper mill and a plastics factory.
Demographics
As of the 2010 census, the population of Great River was 5,845. The population is largely white (90.2%), with a small percentage of African Americans (3.2%), Asians (2.3%), and other races (4.3%).
The median household income in Great River is $90,845, and the median home value is $521,000. The hamlet has a high rate of homeownership (83.3%), and the majority of residents are college-educated (63.2%).
Conclusion
Great River, New York is a hamlet located in the Town of Islip in Suffolk County, New York. It is situated on the south shore of Long Island, approximately 40 miles east of New York City. The hamlet is bordered by the hamlets of Oakdale to the west, Bohemia to the east, and Baywood to the south. The economy of Great River is largely based on tourism and recreation, and the population is largely white. The median household income in Great River is $90,845, and the median home value is $521,000. The hamlet has a high rate of homeownership, and the majority of residents are college-educated.
Common Questions
What is Per Capita Income in North Great River?
Per Capita income in North Great River is $61,105.
What is the Median Family Income in North Great River?
Median Family Income in North Great River is $161,282.
What is the Median Household income in North Great River?
Median Household Income in North Great River is $144,246.
What is Income or Wage Gap in North Great River?
Income or Wage Gap in North Great River is 6.7%.
Women in North Great River earn 93.3 cents for every dollar earned by a man.
What is Inequality or Gini Index in North Great River?
Inequality or Gini Index in North Great River is 0.40.
What is the Total Population of North Great River?
Total Population of North Great River is 3,680.
What is the Total Male Population of North Great River?
Total Male Population of North Great River is 1,911.
What is the Total Female Population of North Great River?
Total Female Population of North Great River is 1,769.
What is the Ratio of Males per 100 Females in North Great River?
There are 108.03 Males per 100 Females in North Great River.
What is the Ratio of Females per 100 Males in North Great River?
There are 92.57 Females per 100 Males in North Great River.
What is the Median Population Age in North Great River?
Median Population Age in North Great River is 50.3 Years.
What is the Average Family Size in North Great River
Average Family Size in North Great River is 3.2 People.
What is the Average Household Size in North Great River
Average Household Size in North Great River is 2.8 People.
How Large is the Labor Force in North Great River?
There are 2,026 People in the Labor Forcein in North Great River.
What is the Percentage of People in the Labor Force in North Great River?
64.2% of People are in the Labor Force in North Great River.
What is the Unemployment Rate in North Great River?
Unemployment Rate in North Great River is 1.5%.