East Rochester, NY Map & Demographics
East Rochester Map
East Rochester Overview
$32,958
PER CAPITA INCOME
$73,245
AVG FAMILY INCOME
$65,134
AVG HOUSEHOLD INCOME
12.8%
WAGE / INCOME GAP [ % ]
87.2¢/ $1
WAGE / INCOME GAP [ $ ]
0.33
INEQUALITY / GINI INDEX
6,321
TOTAL POPULATION
3,259
MALE POPULATION
3,062
FEMALE POPULATION
106.43
MALES / 100 FEMALES
93.96
FEMALES / 100 MALES
40.0
MEDIAN AGE
2.8
AVG FAMILY SIZE
2.1
AVG HOUSEHOLD SIZE
3,696
LABOR FORCE [ PEOPLE ]
68.0%
PERCENT IN LABOR FORCE
6.8%
UNEMPLOYMENT RATE
East Rochester Zip Codes
East Rochester Area Codes
Income in East Rochester
Income Overview in East Rochester
Per Capita Income in East Rochester is $32,958, while median incomes of families and households are $73,245 and $65,134 respectively.
| Characteristic | Number | Measure |
| Per Capita Income | 6,321 | $32,958 |
| Median Family Income | 1,462 | $73,245 |
| Mean Family Income | 1,462 | $76,625 |
| Median Household Income | 2,919 | $65,134 |
| Mean Household Income | 2,919 | $68,857 |
| Income Deficit | 1,462 | $0 |
| Wage / Income Gap (%) | 6,321 | 12.82% |
| Wage / Income Gap ($) | 6,321 | 87.18¢ per $1 |
| Gini / Inequality Index | 6,321 | 0.33 |
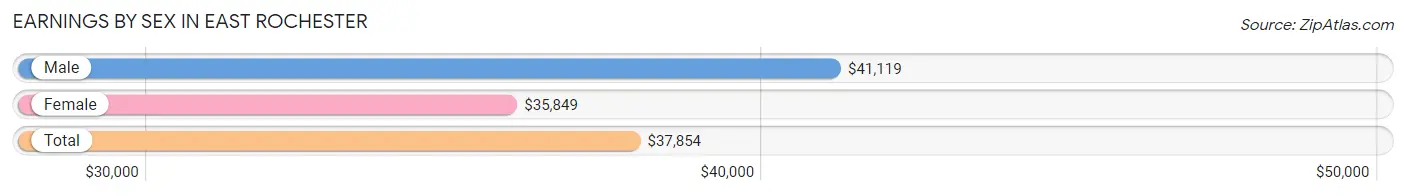
Earnings by Sex in East Rochester
Average Earnings in East Rochester are $37,854, $41,119 for men and $35,849 for women, a difference of 12.8%.
| Sex | Number | Average Earnings |
| Male | 2,004 (52.9%) | $41,119 |
| Female | 1,785 (47.1%) | $35,849 |
| Total | 3,789 (100.0%) | $37,854 |
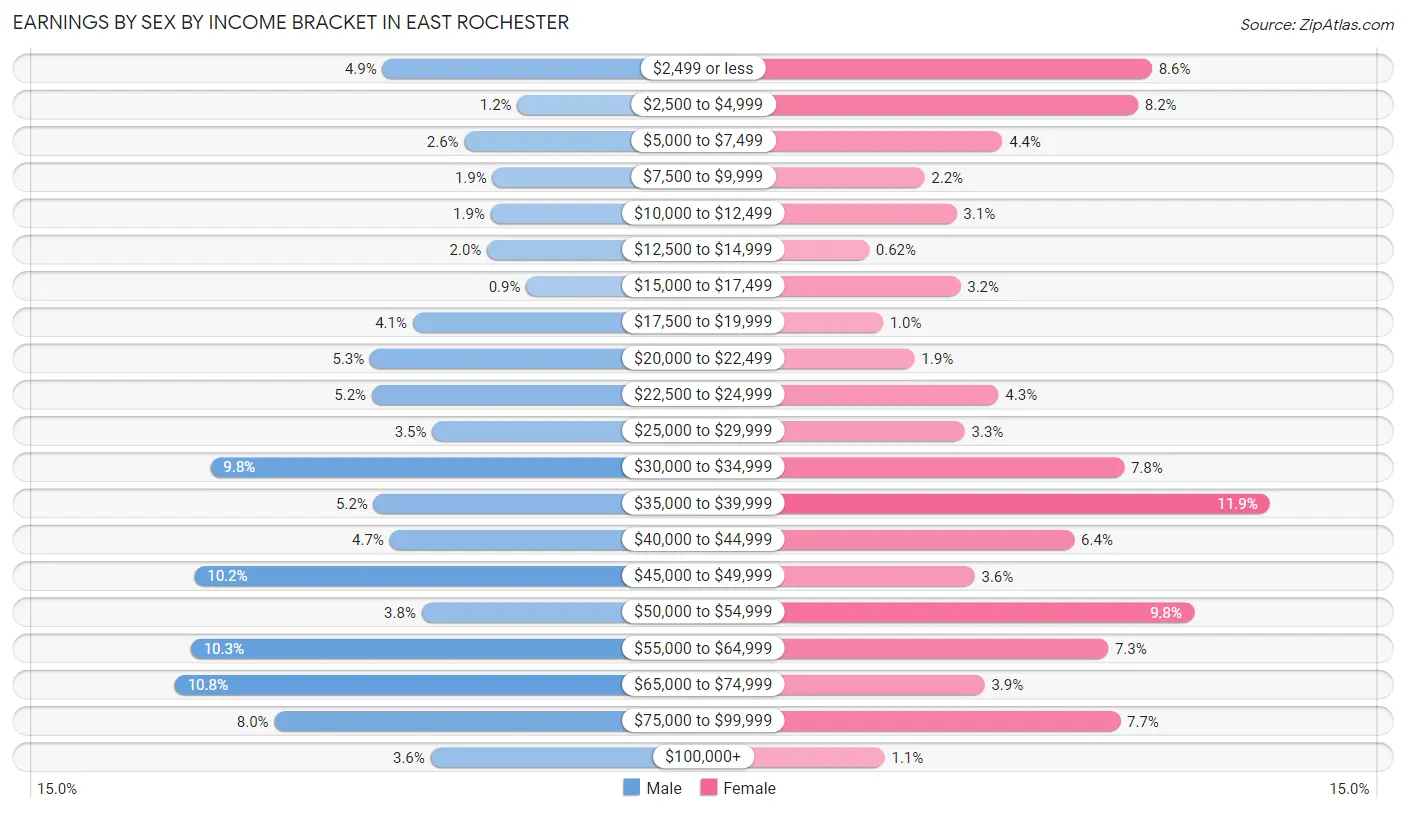
Earnings by Sex by Income Bracket in East Rochester
The most common earnings brackets in East Rochester are $65,000 to $74,999 for men (216 | 10.8%) and $35,000 to $39,999 for women (212 | 11.9%).
| Income | Male | Female |
| $2,499 or less | 99 (4.9%) | 153 (8.6%) |
| $2,500 to $4,999 | 23 (1.1%) | 146 (8.2%) |
| $5,000 to $7,499 | 53 (2.6%) | 78 (4.4%) |
| $7,500 to $9,999 | 37 (1.8%) | 39 (2.2%) |
| $10,000 to $12,499 | 38 (1.9%) | 55 (3.1%) |
| $12,500 to $14,999 | 40 (2.0%) | 11 (0.6%) |
| $15,000 to $17,499 | 18 (0.9%) | 57 (3.2%) |
| $17,500 to $19,999 | 82 (4.1%) | 18 (1.0%) |
| $20,000 to $22,499 | 106 (5.3%) | 34 (1.9%) |
| $22,500 to $24,999 | 105 (5.2%) | 76 (4.3%) |
| $25,000 to $29,999 | 71 (3.5%) | 59 (3.3%) |
| $30,000 to $34,999 | 196 (9.8%) | 139 (7.8%) |
| $35,000 to $39,999 | 104 (5.2%) | 212 (11.9%) |
| $40,000 to $44,999 | 95 (4.7%) | 114 (6.4%) |
| $45,000 to $49,999 | 205 (10.2%) | 64 (3.6%) |
| $50,000 to $54,999 | 77 (3.8%) | 174 (9.8%) |
| $55,000 to $64,999 | 207 (10.3%) | 131 (7.3%) |
| $65,000 to $74,999 | 216 (10.8%) | 69 (3.9%) |
| $75,000 to $99,999 | 160 (8.0%) | 137 (7.7%) |
| $100,000+ | 72 (3.6%) | 19 (1.1%) |
| Total | 2,004 (100.0%) | 1,785 (100.0%) |
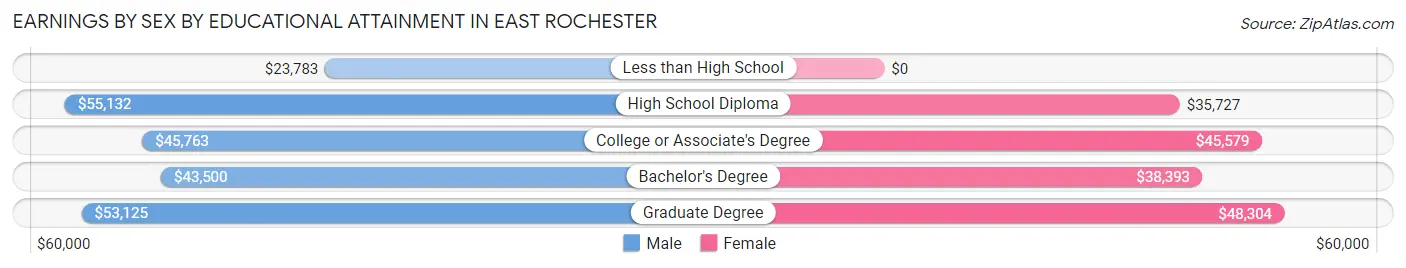
Earnings by Sex by Educational Attainment in East Rochester
Average earnings in East Rochester are $45,366 for men and $39,573 for women, a difference of 12.8%. Men with an educational attainment of high school diploma enjoy the highest average annual earnings of $55,132, while those with less than high school education earn the least with $23,783. Women with an educational attainment of graduate degree earn the most with the average annual earnings of $48,304, while those with high school diploma education have the smallest earnings of $35,727.
| Educational Attainment | Male Income | Female Income |
| Less than High School | $23,783 | $0 |
| High School Diploma | $55,132 | $35,727 |
| College or Associate's Degree | $45,763 | $45,579 |
| Bachelor's Degree | $43,500 | $38,393 |
| Graduate Degree | $53,125 | $48,304 |
| Total | $45,366 | $39,573 |
Family Income in East Rochester
Family Income Brackets in East Rochester
According to the East Rochester family income data, there are 548 families falling into the $50,000 to $74,999 income range, which is the most common income bracket and makes up 37.5% of all families. Conversely, the $200,000+ income bracket is the least frequent group with only 12 families (0.8%) belonging to this category.
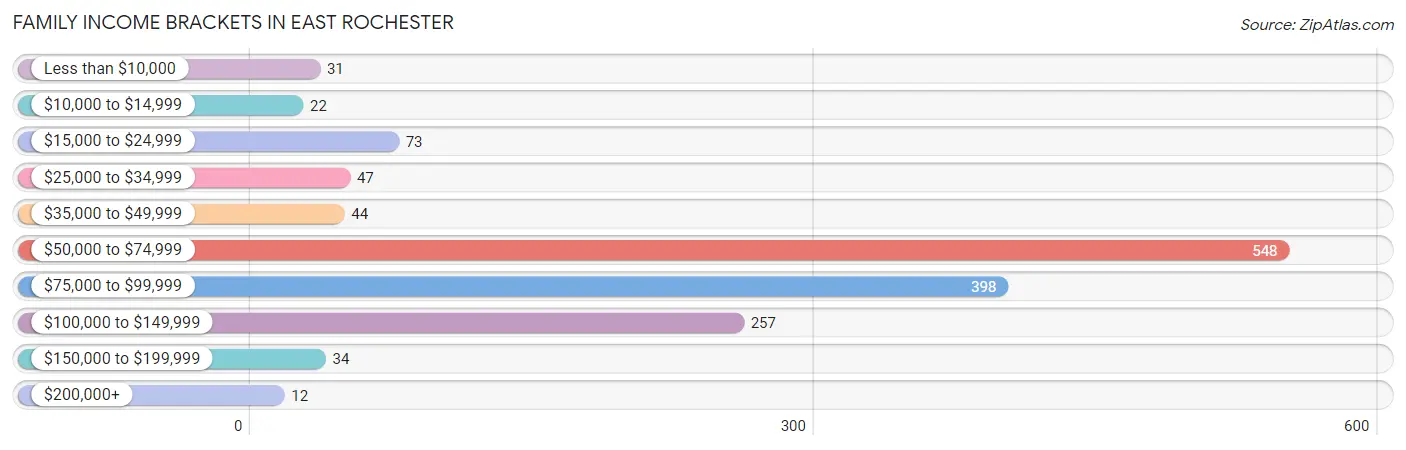
| Income Bracket | # Families | % Families |
| Less than $10,000 | 31 | 2.1% |
| $10,000 to $14,999 | 22 | 1.5% |
| $15,000 to $24,999 | 73 | 5.0% |
| $25,000 to $34,999 | 47 | 3.2% |
| $35,000 to $49,999 | 44 | 3.0% |
| $50,000 to $74,999 | 548 | 37.5% |
| $75,000 to $99,999 | 398 | 27.2% |
| $100,000 to $149,999 | 257 | 17.6% |
| $150,000 to $199,999 | 34 | 2.3% |
| $200,000+ | 12 | 0.8% |
Family Income by Famaliy Size in East Rochester
5-person families (80 | 5.5%) account for the highest median family income in East Rochester with $117,321 per family, while 2-person families (859 | 58.8%) have the highest median income of $34,262 per family member.
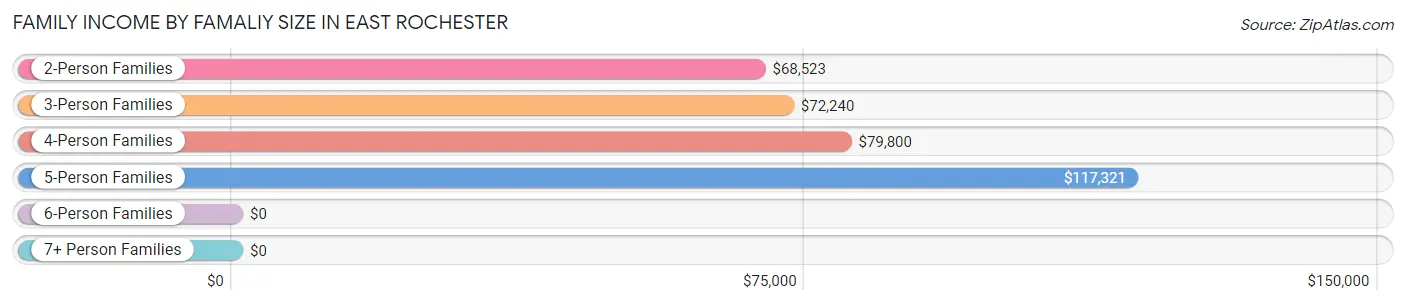
| Income Bracket | # Families | Median Income |
| 2-Person Families | 859 (58.8%) | $68,523 |
| 3-Person Families | 331 (22.6%) | $72,240 |
| 4-Person Families | 192 (13.1%) | $79,800 |
| 5-Person Families | 80 (5.5%) | $117,321 |
| 6-Person Families | 0 (0.0%) | $0 |
| 7+ Person Families | 0 (0.0%) | $0 |
| Total | 1,462 (100.0%) | $73,245 |
Family Income by Number of Earners in East Rochester
The median family income in East Rochester is $73,245, with families comprising 3+ earners (82) having the highest median family income of $116,071, while families with no earners (270) have the lowest median family income of $54,277, accounting for 5.6% and 18.5% of families, respectively.
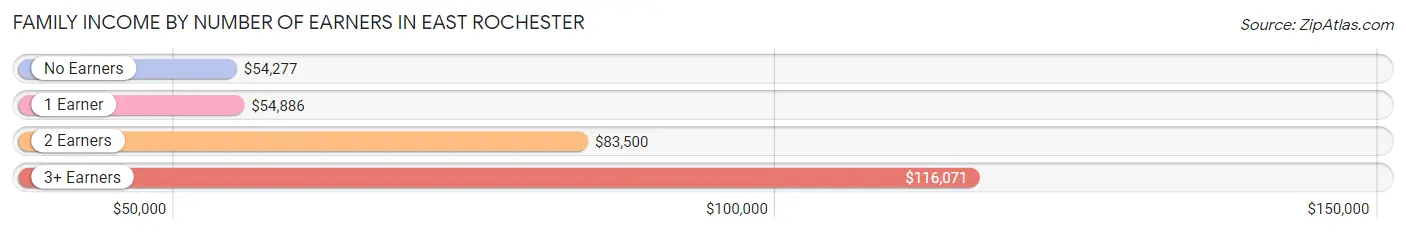
| Number of Earners | # Families | Median Income |
| No Earners | 270 (18.5%) | $54,277 |
| 1 Earner | 406 (27.8%) | $54,886 |
| 2 Earners | 704 (48.1%) | $83,500 |
| 3+ Earners | 82 (5.6%) | $116,071 |
| Total | 1,462 (100.0%) | $73,245 |
Household Income in East Rochester
Household Income Brackets in East Rochester
With 800 households falling in the category, the $50,000 to $74,999 income range is the most frequent in East Rochester, accounting for 27.4% of all households. In contrast, only 38 households (1.3%) fall into the $200,000+ income bracket, making it the least populous group.
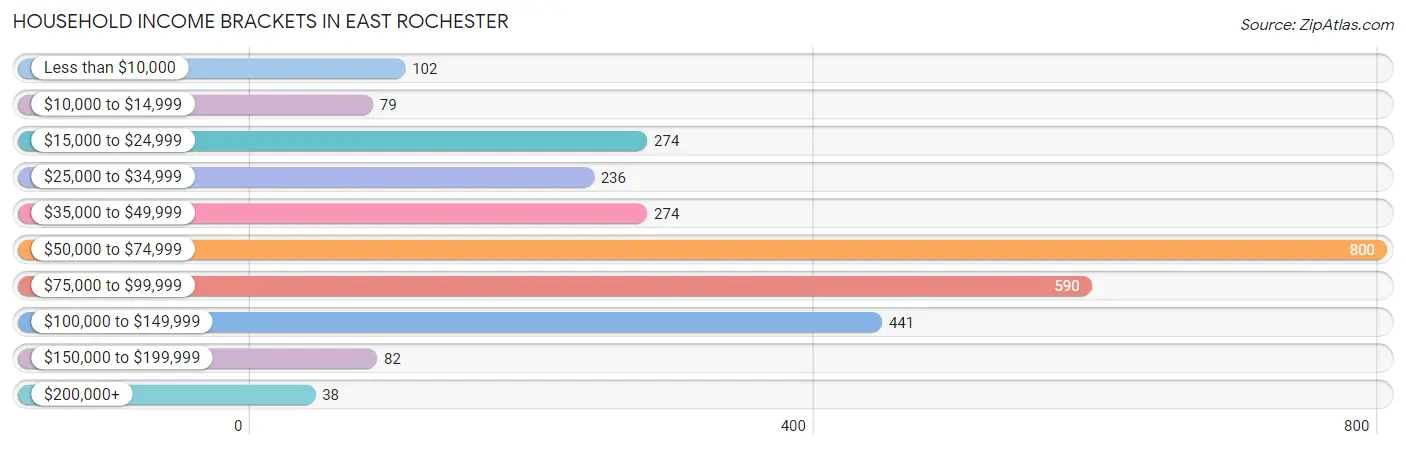
| Income Bracket | # Households | % Households |
| Less than $10,000 | 102 | 3.5% |
| $10,000 to $14,999 | 79 | 2.7% |
| $15,000 to $24,999 | 274 | 9.4% |
| $25,000 to $34,999 | 236 | 8.1% |
| $35,000 to $49,999 | 274 | 9.4% |
| $50,000 to $74,999 | 800 | 27.4% |
| $75,000 to $99,999 | 590 | 20.2% |
| $100,000 to $149,999 | 441 | 15.1% |
| $150,000 to $199,999 | 82 | 2.8% |
| $200,000+ | 38 | 1.3% |
Household Income by Householder Age in East Rochester
The median household income in East Rochester is $65,134, with the highest median household income of $73,789 found in the 25 to 44 years age bracket for the primary householder. A total of 1,070 households (36.7%) fall into this category. Meanwhile, the 15 to 24 years age bracket for the primary householder has the lowest median household income of $34,194, with 98 households (3.4%) in this group.
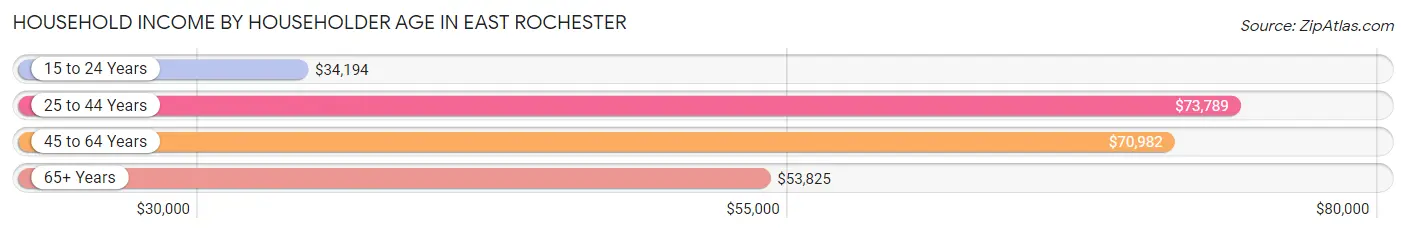
| Income Bracket | # Households | Median Income |
| 15 to 24 Years | 98 (3.4%) | $34,194 |
| 25 to 44 Years | 1,070 (36.7%) | $73,789 |
| 45 to 64 Years | 925 (31.7%) | $70,982 |
| 65+ Years | 826 (28.3%) | $53,825 |
| Total | 2,919 (100.0%) | $65,134 |
Poverty in East Rochester
Income Below Poverty by Sex and Age in East Rochester
With 6.5% poverty level for males and 14.0% for females among the residents of East Rochester, 16 and 17 year old males and 18 to 24 year old females are the most vulnerable to poverty, with 18 males (23.4%) and 191 females (51.2%) in their respective age groups living below the poverty level.
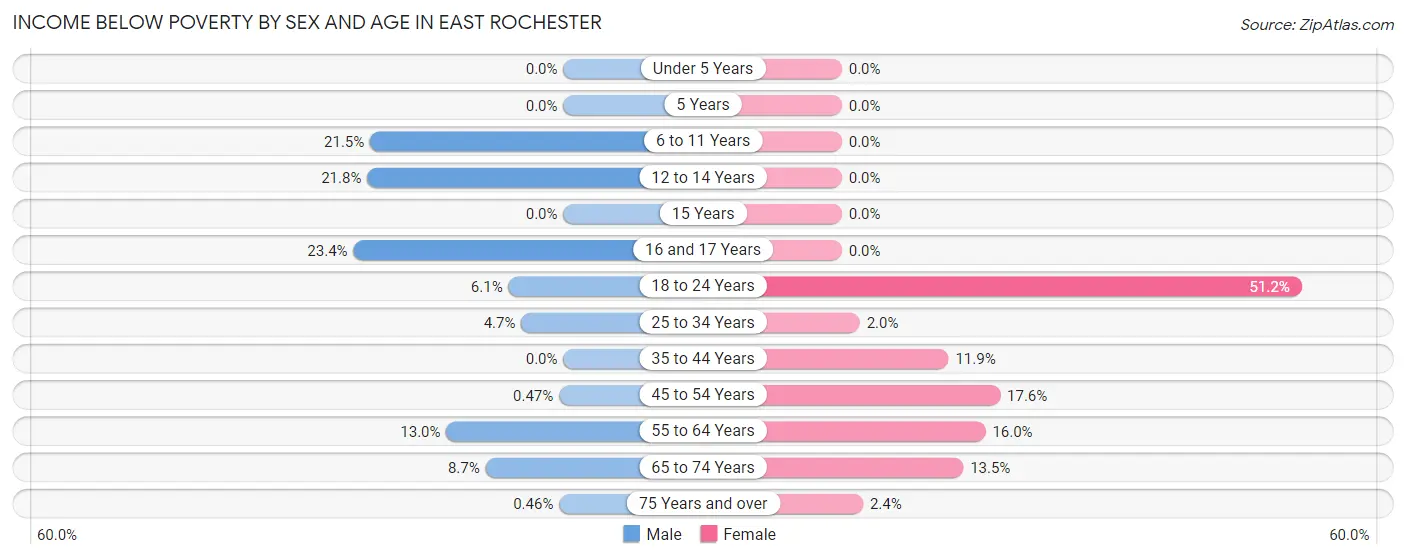
| Age Bracket | Male | Female |
| Under 5 Years | 0 (0.0%) | 0 (0.0%) |
| 5 Years | 0 (0.0%) | 0 (0.0%) |
| 6 to 11 Years | 34 (21.5%) | 0 (0.0%) |
| 12 to 14 Years | 19 (21.8%) | 0 (0.0%) |
| 15 Years | 0 (0.0%) | 0 (0.0%) |
| 16 and 17 Years | 18 (23.4%) | 0 (0.0%) |
| 18 to 24 Years | 14 (6.1%) | 191 (51.2%) |
| 25 to 34 Years | 36 (4.7%) | 11 (2.0%) |
| 35 to 44 Years | 0 (0.0%) | 36 (11.9%) |
| 45 to 54 Years | 2 (0.5%) | 61 (17.6%) |
| 55 to 64 Years | 58 (13.0%) | 68 (16.0%) |
| 65 to 74 Years | 29 (8.7%) | 48 (13.5%) |
| 75 Years and over | 1 (0.5%) | 6 (2.4%) |
| Total | 211 (6.5%) | 421 (14.0%) |
Income Above Poverty by Sex and Age in East Rochester
According to the poverty statistics in East Rochester, males aged under 5 years and females aged under 5 years are the age groups that are most secure financially, with 100.0% of males and 100.0% of females in these age groups living above the poverty line.
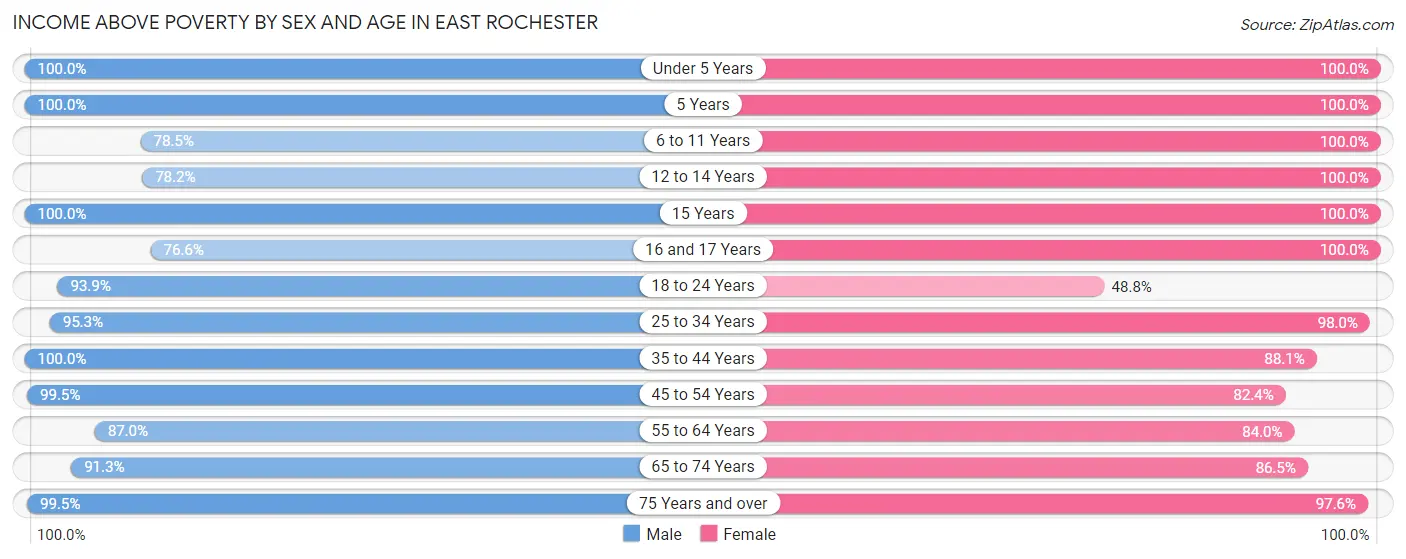
| Age Bracket | Male | Female |
| Under 5 Years | 128 (100.0%) | 101 (100.0%) |
| 5 Years | 25 (100.0%) | 28 (100.0%) |
| 6 to 11 Years | 124 (78.5%) | 124 (100.0%) |
| 12 to 14 Years | 68 (78.2%) | 114 (100.0%) |
| 15 Years | 21 (100.0%) | 38 (100.0%) |
| 16 and 17 Years | 59 (76.6%) | 9 (100.0%) |
| 18 to 24 Years | 215 (93.9%) | 182 (48.8%) |
| 25 to 34 Years | 734 (95.3%) | 538 (98.0%) |
| 35 to 44 Years | 327 (100.0%) | 267 (88.1%) |
| 45 to 54 Years | 420 (99.5%) | 285 (82.4%) |
| 55 to 64 Years | 387 (87.0%) | 357 (84.0%) |
| 65 to 74 Years | 306 (91.3%) | 307 (86.5%) |
| 75 Years and over | 216 (99.5%) | 248 (97.6%) |
| Total | 3,030 (93.5%) | 2,598 (86.1%) |
Income Below Poverty Among Married-Couple Families in East Rochester
The poverty statistics for married-couple families in East Rochester show that 3.6% or 34 of the total 946 families live below the poverty line. Families with no children have the highest poverty rate of 5.0%, comprising of 34 families. On the other hand, families with 1 or 2 children have the lowest poverty rate of 0.0%, which includes 0 families.
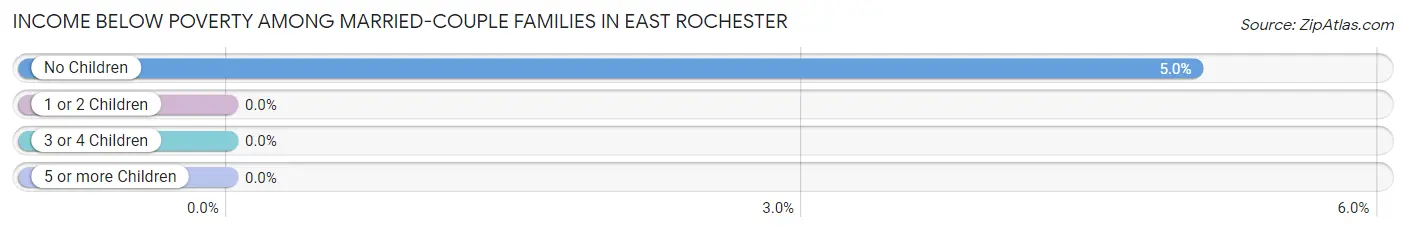
| Children | Above Poverty | Below Poverty |
| No Children | 640 (95.0%) | 34 (5.0%) |
| 1 or 2 Children | 230 (100.0%) | 0 (0.0%) |
| 3 or 4 Children | 42 (100.0%) | 0 (0.0%) |
| 5 or more Children | 0 (0.0%) | 0 (0.0%) |
| Total | 912 (96.4%) | 34 (3.6%) |
Income Below Poverty Among Single-Parent Households in East Rochester
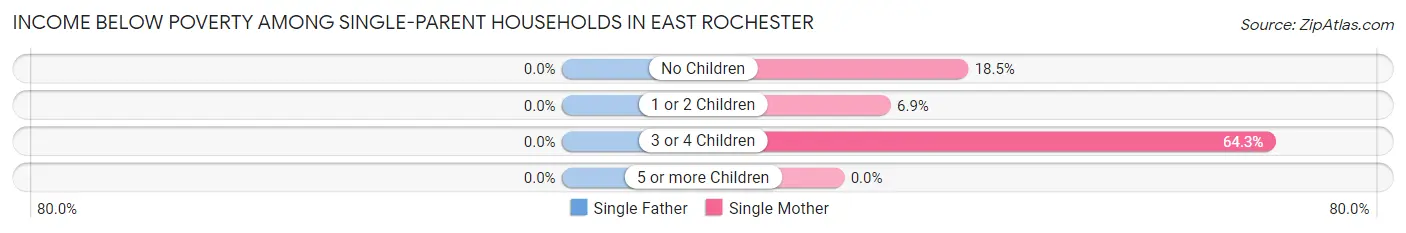
| Children | Single Father | Single Mother |
| No Children | 0 (0.0%) | 34 (18.5%) |
| 1 or 2 Children | 0 (0.0%) | 11 (6.9%) |
| 3 or 4 Children | 0 (0.0%) | 18 (64.3%) |
| 5 or more Children | 0 (0.0%) | 0 (0.0%) |
| Total | 0 (0.0%) | 63 (17.0%) |
Income Below Poverty Among Married-Couple vs Single-Parent Households in East Rochester
The poverty data for East Rochester shows that 34 of the married-couple family households (3.6%) and 63 of the single-parent households (12.2%) are living below the poverty level. Within the married-couple family households, those with no children have the highest poverty rate, with 34 households (5.0%) falling below the poverty line. Among the single-parent households, those with 3 or 4 children have the highest poverty rate, with 18 household (34.0%) living below poverty.
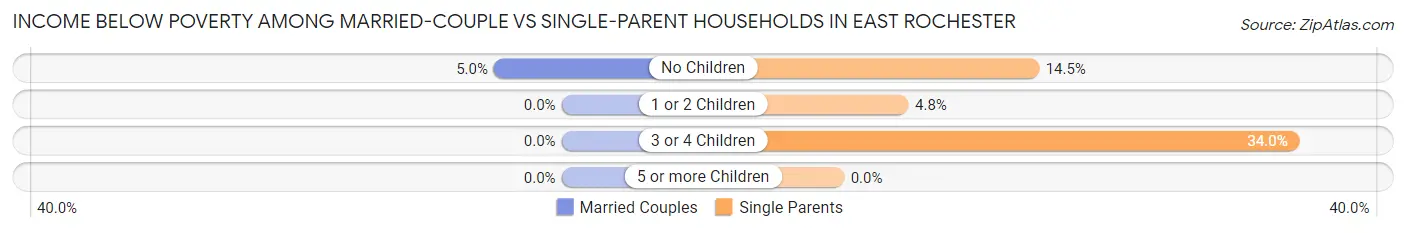
| Children | Married-Couple Families | Single-Parent Households |
| No Children | 34 (5.0%) | 34 (14.5%) |
| 1 or 2 Children | 0 (0.0%) | 11 (4.8%) |
| 3 or 4 Children | 0 (0.0%) | 18 (34.0%) |
| 5 or more Children | 0 (0.0%) | 0 (0.0%) |
| Total | 34 (3.6%) | 63 (12.2%) |
Race in East Rochester
The most populous races in East Rochester are White / Caucasian (5,698 | 90.1%), Hispanic or Latino (291 | 4.6%), and Two or more Races (217 | 3.4%).
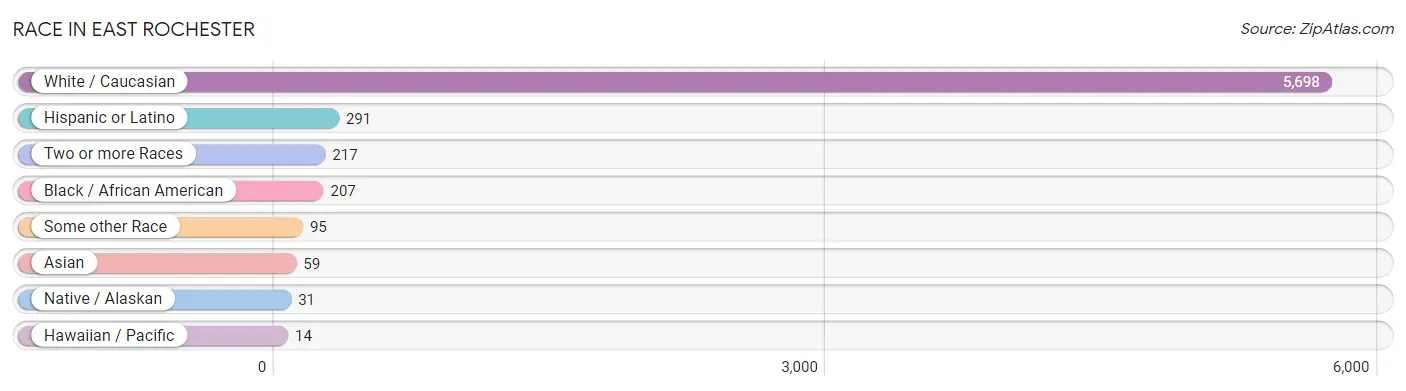
| Race | # Population | % Population |
| Asian | 59 | 0.9% |
| Black / African American | 207 | 3.3% |
| Hawaiian / Pacific | 14 | 0.2% |
| Hispanic or Latino | 291 | 4.6% |
| Native / Alaskan | 31 | 0.5% |
| White / Caucasian | 5,698 | 90.1% |
| Two or more Races | 217 | 3.4% |
| Some other Race | 95 | 1.5% |
| Total | 6,321 | 100.0% |
Ancestry in East Rochester
The most populous ancestries reported in East Rochester are Italian (1,644 | 26.0%), Irish (921 | 14.6%), German (832 | 13.2%), American (753 | 11.9%), and English (516 | 8.2%), together accounting for 73.8% of all East Rochester residents.
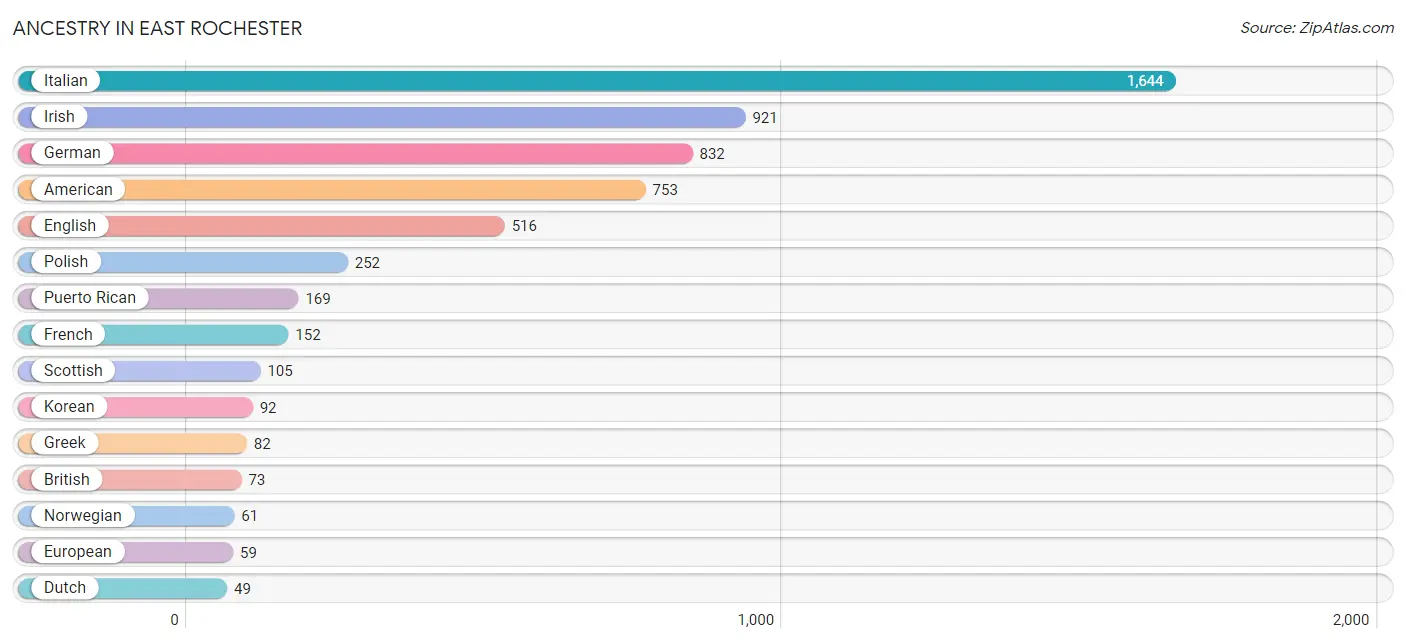
| Ancestry | # Population | % Population |
| Albanian | 22 | 0.4% |
| American | 753 | 11.9% |
| Arab | 11 | 0.2% |
| Brazilian | 10 | 0.2% |
| British | 73 | 1.1% |
| Burmese | 17 | 0.3% |
| Canadian | 26 | 0.4% |
| Celtic | 8 | 0.1% |
| Central American | 25 | 0.4% |
| Cuban | 13 | 0.2% |
| Czech | 12 | 0.2% |
| Danish | 4 | 0.1% |
| Dutch | 49 | 0.8% |
| Ecuadorian | 25 | 0.4% |
| English | 516 | 8.2% |
| European | 59 | 0.9% |
| Finnish | 12 | 0.2% |
| French | 152 | 2.4% |
| French Canadian | 3 | 0.1% |
| German | 832 | 13.2% |
| Greek | 82 | 1.3% |
| Guamanian / Chamorro | 28 | 0.4% |
| Guatemalan | 25 | 0.4% |
| Indian (Asian) | 8 | 0.1% |
| Irish | 921 | 14.6% |
| Iroquois | 37 | 0.6% |
| Italian | 1,644 | 26.0% |
| Jamaican | 11 | 0.2% |
| Korean | 92 | 1.5% |
| Lebanese | 11 | 0.2% |
| Mexican | 29 | 0.5% |
| Northern European | 18 | 0.3% |
| Norwegian | 61 | 1.0% |
| Pennsylvania German | 6 | 0.1% |
| Polish | 252 | 4.0% |
| Portuguese | 33 | 0.5% |
| Puerto Rican | 169 | 2.7% |
| Russian | 33 | 0.5% |
| Scandinavian | 7 | 0.1% |
| Scotch-Irish | 46 | 0.7% |
| Scottish | 105 | 1.7% |
| Sioux | 5 | 0.1% |
| South American | 25 | 0.4% |
| Spaniard | 11 | 0.2% |
| Spanish | 19 | 0.3% |
| Swiss | 14 | 0.2% |
| Ukrainian | 12 | 0.2% |
| Welsh | 33 | 0.5% | View All 48 Rows |
Immigrants in East Rochester
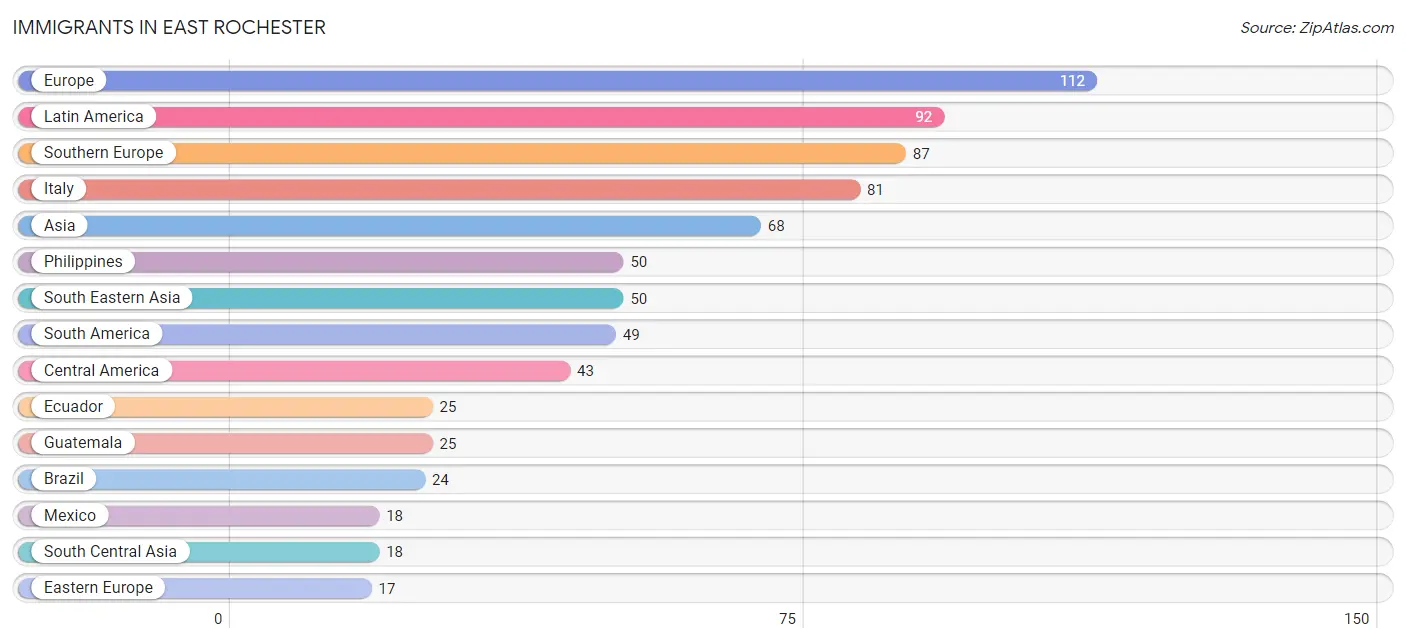
The most numerous immigrant groups reported in East Rochester came from Europe (112 | 1.8%), Latin America (92 | 1.5%), Southern Europe (87 | 1.4%), Italy (81 | 1.3%), and Asia (68 | 1.1%), together accounting for 7.0% of all East Rochester residents.
| Immigration Origin | # Population | % Population |
| Asia | 68 | 1.1% |
| Brazil | 24 | 0.4% |
| Canada | 7 | 0.1% |
| Central America | 43 | 0.7% |
| Eastern Europe | 17 | 0.3% |
| Ecuador | 25 | 0.4% |
| Europe | 112 | 1.8% |
| Greece | 6 | 0.1% |
| Guatemala | 25 | 0.4% |
| Hungary | 17 | 0.3% |
| Italy | 81 | 1.3% |
| Kazakhstan | 17 | 0.3% |
| Latin America | 92 | 1.5% |
| Mexico | 18 | 0.3% |
| Northern Europe | 8 | 0.1% |
| Philippines | 50 | 0.8% |
| South America | 49 | 0.8% |
| South Central Asia | 18 | 0.3% |
| South Eastern Asia | 50 | 0.8% |
| Southern Europe | 87 | 1.4% |
| Sri Lanka | 1 | 0.0% | View All 21 Rows |
Sex and Age in East Rochester
Sex and Age in East Rochester
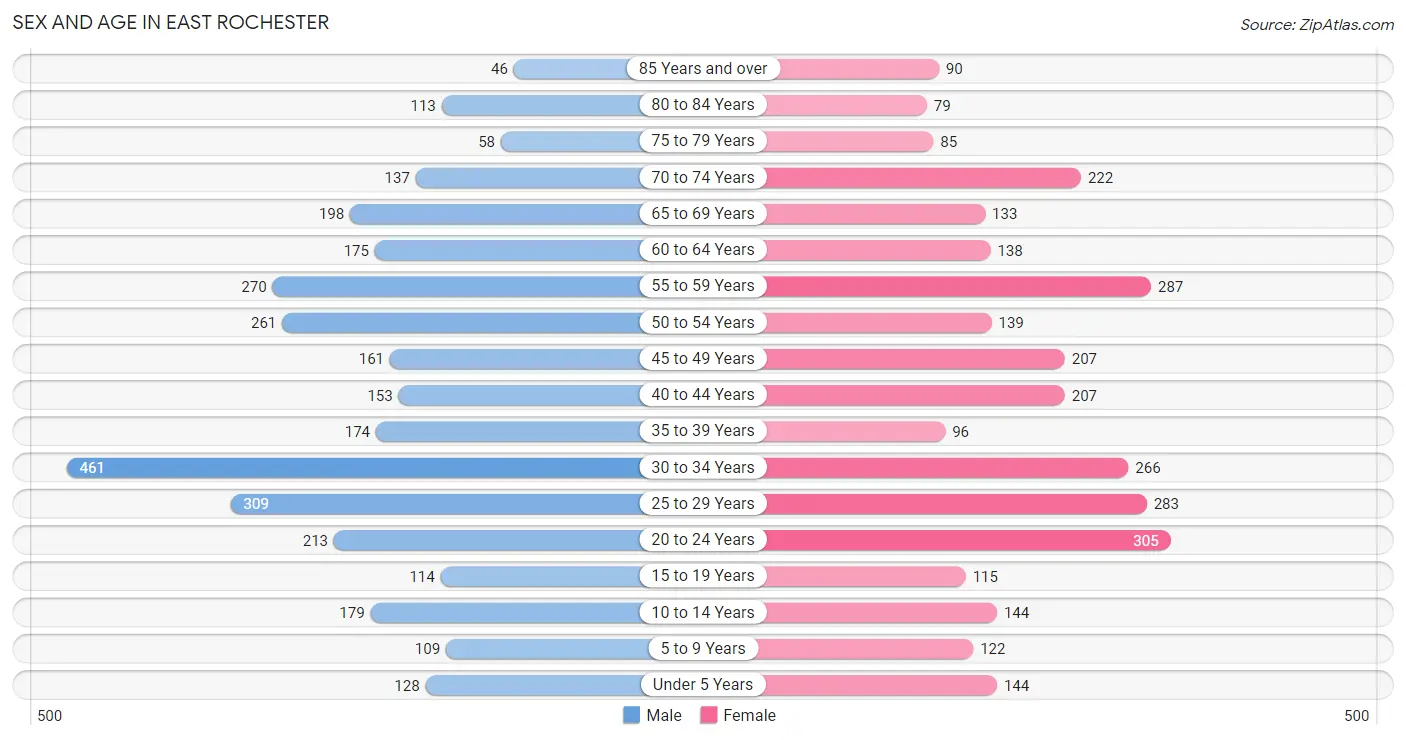
The most populous age groups in East Rochester are 30 to 34 Years (461 | 14.1%) for men and 20 to 24 Years (305 | 10.0%) for women.
| Age Bracket | Male | Female |
| Under 5 Years | 128 (3.9%) | 144 (4.7%) |
| 5 to 9 Years | 109 (3.3%) | 122 (4.0%) |
| 10 to 14 Years | 179 (5.5%) | 144 (4.7%) |
| 15 to 19 Years | 114 (3.5%) | 115 (3.8%) |
| 20 to 24 Years | 213 (6.5%) | 305 (10.0%) |
| 25 to 29 Years | 309 (9.5%) | 283 (9.2%) |
| 30 to 34 Years | 461 (14.1%) | 266 (8.7%) |
| 35 to 39 Years | 174 (5.3%) | 96 (3.1%) |
| 40 to 44 Years | 153 (4.7%) | 207 (6.8%) |
| 45 to 49 Years | 161 (4.9%) | 207 (6.8%) |
| 50 to 54 Years | 261 (8.0%) | 139 (4.5%) |
| 55 to 59 Years | 270 (8.3%) | 287 (9.4%) |
| 60 to 64 Years | 175 (5.4%) | 138 (4.5%) |
| 65 to 69 Years | 198 (6.1%) | 133 (4.3%) |
| 70 to 74 Years | 137 (4.2%) | 222 (7.2%) |
| 75 to 79 Years | 58 (1.8%) | 85 (2.8%) |
| 80 to 84 Years | 113 (3.5%) | 79 (2.6%) |
| 85 Years and over | 46 (1.4%) | 90 (2.9%) |
| Total | 3,259 (100.0%) | 3,062 (100.0%) |
Families and Households in East Rochester
Median Family Size in East Rochester
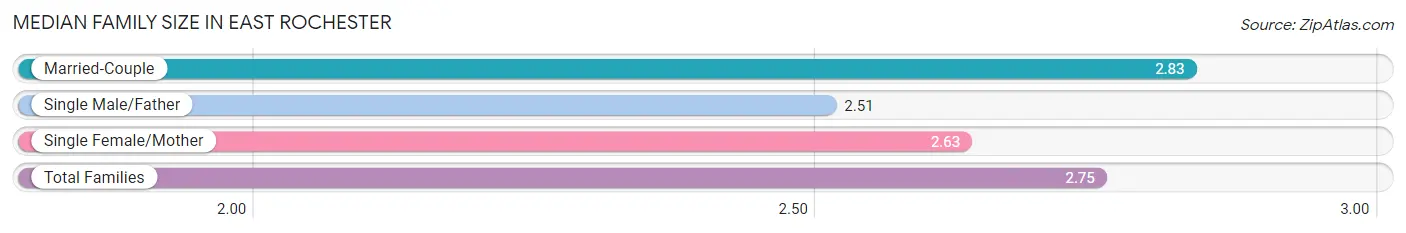
The median family size in East Rochester is 2.75 persons per family, with married-couple families (946 | 64.7%) accounting for the largest median family size of 2.83 persons per family. On the other hand, single male/father families (145 | 9.9%) represent the smallest median family size with 2.51 persons per family.
| Family Type | # Families | Family Size |
| Married-Couple | 946 (64.7%) | 2.83 |
| Single Male/Father | 145 (9.9%) | 2.51 |
| Single Female/Mother | 371 (25.4%) | 2.63 |
| Total Families | 1,462 (100.0%) | 2.75 |
Median Household Size in East Rochester
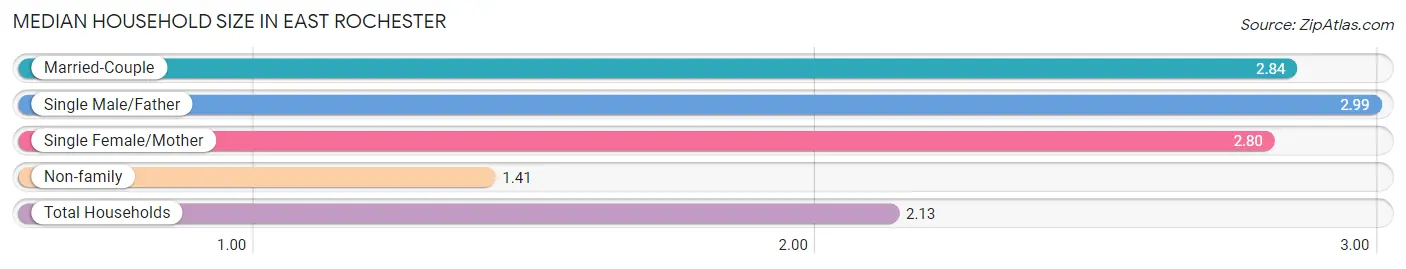
The median household size in East Rochester is 2.13 persons per household, with single male/father households (145 | 5.0%) accounting for the largest median household size of 2.99 persons per household. non-family households (1,457 | 49.9%) represent the smallest median household size with 1.41 persons per household.
| Household Type | # Households | Household Size |
| Married-Couple | 946 (32.4%) | 2.84 |
| Single Male/Father | 145 (5.0%) | 2.99 |
| Single Female/Mother | 371 (12.7%) | 2.80 |
| Non-family | 1,457 (49.9%) | 1.41 |
| Total Households | 2,919 (100.0%) | 2.13 |
Household Size by Marriage Status in East Rochester
Out of a total of 2,919 households in East Rochester, 1,462 (50.1%) are family households, while 1,457 (49.9%) are nonfamily households. The most numerous type of family households are 2-person households, comprising 788, and the most common type of nonfamily households are 1-person households, comprising 922.
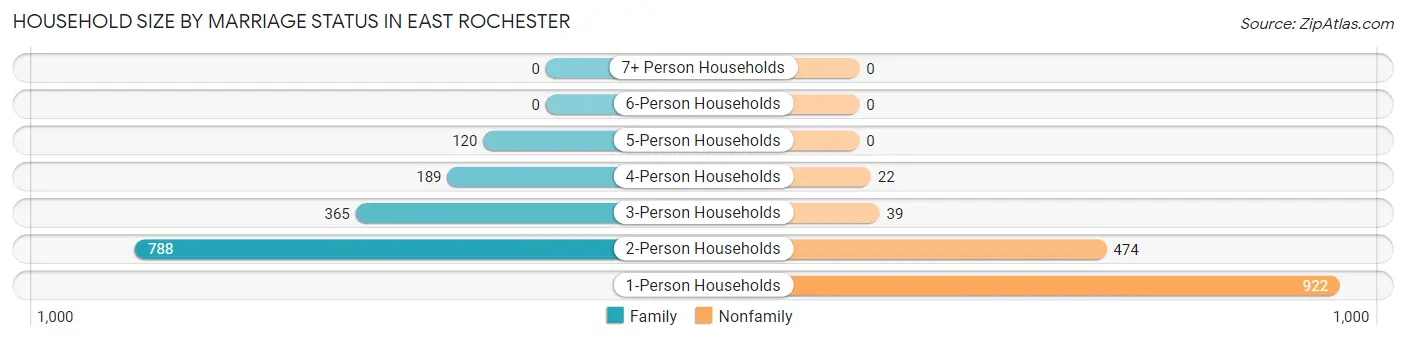
| Household Size | Family Households | Nonfamily Households |
| 1-Person Households | - | 922 (31.6%) |
| 2-Person Households | 788 (27.0%) | 474 (16.2%) |
| 3-Person Households | 365 (12.5%) | 39 (1.3%) |
| 4-Person Households | 189 (6.5%) | 22 (0.7%) |
| 5-Person Households | 120 (4.1%) | 0 (0.0%) |
| 6-Person Households | 0 (0.0%) | 0 (0.0%) |
| 7+ Person Households | 0 (0.0%) | 0 (0.0%) |
| Total | 1,462 (50.1%) | 1,457 (49.9%) |
Female Fertility in East Rochester
Fertility by Age in East Rochester
Average fertility rate in East Rochester is 32.0 births per 1,000 women. Women in the age bracket of 20 to 34 years have the highest fertility rate with 57.0 births per 1,000 women. Women in the age bracket of 20 to 34 years acount for 100.0% of all women with births.
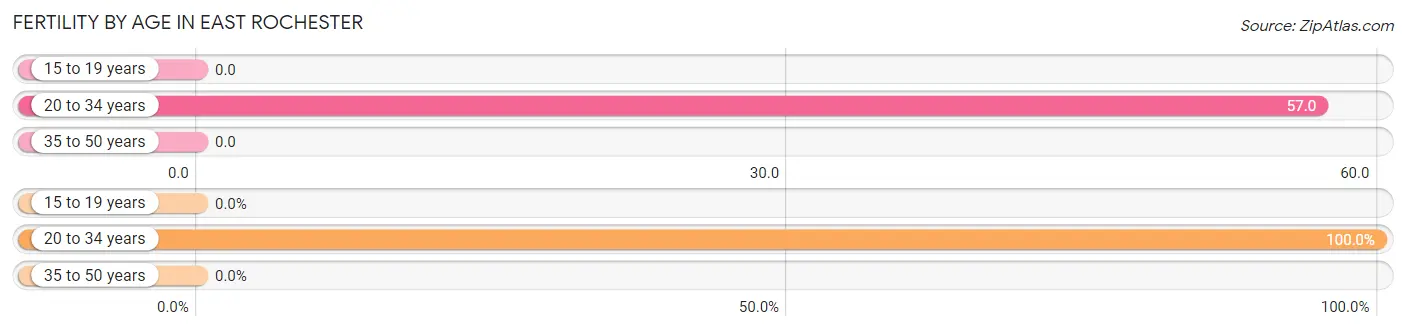
| Age Bracket | Women with Births | Births / 1,000 Women |
| 15 to 19 years | 0 (0.0%) | 0.0 |
| 20 to 34 years | 49 (100.0%) | 57.0 |
| 35 to 50 years | 0 (0.0%) | 0.0 |
| Total | 49 (100.0%) | 32.0 |
Fertility by Age by Marriage Status in East Rochester
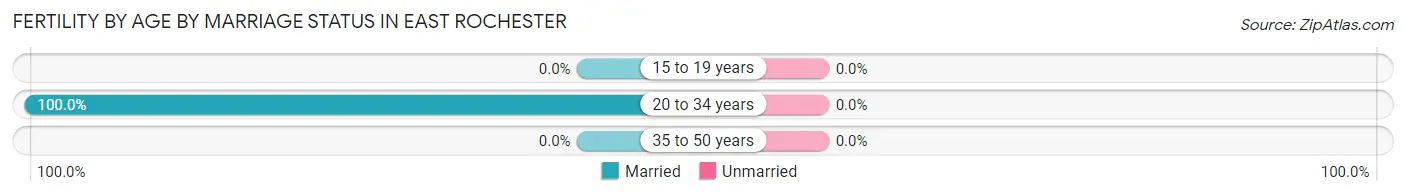
| Age Bracket | Married | Unmarried |
| 15 to 19 years | 0 (0.0%) | 0 (0.0%) |
| 20 to 34 years | 49 (100.0%) | 0 (0.0%) |
| 35 to 50 years | 0 (0.0%) | 0 (0.0%) |
| Total | 49 (100.0%) | 0 (0.0%) |
Fertility by Education in East Rochester
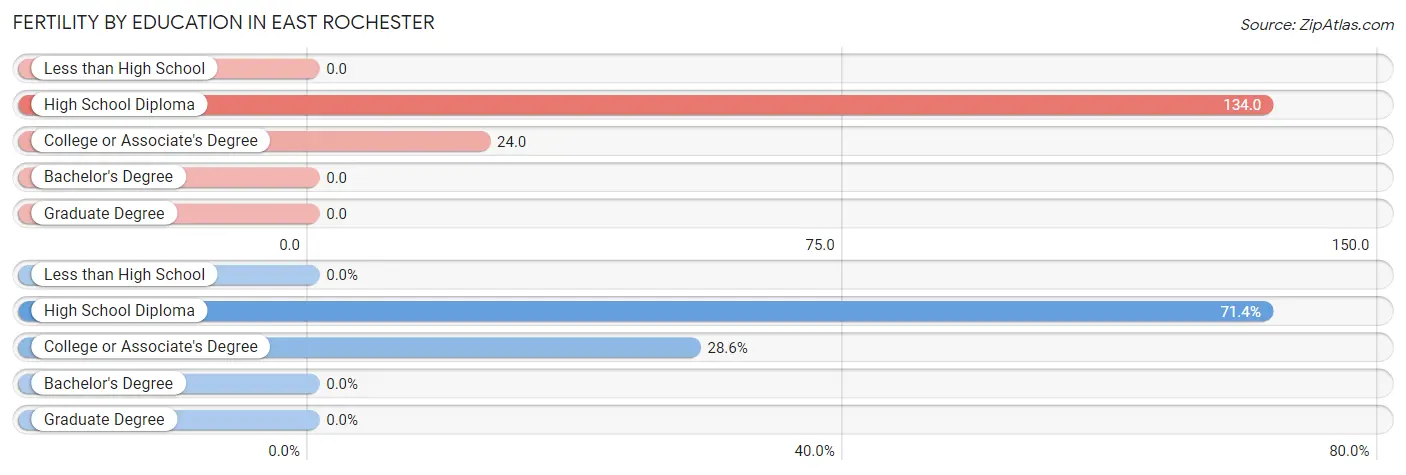
| Educational Attainment | Women with Births | Births / 1,000 Women |
| Less than High School | 0 (0.0%) | 0.0 |
| High School Diploma | 35 (71.4%) | 134.0 |
| College or Associate's Degree | 14 (28.6%) | 24.0 |
| Bachelor's Degree | 0 (0.0%) | 0.0 |
| Graduate Degree | 0 (0.0%) | 0.0 |
| Total | 49 (100.0%) | 32.0 |
Fertility by Education by Marriage Status in East Rochester
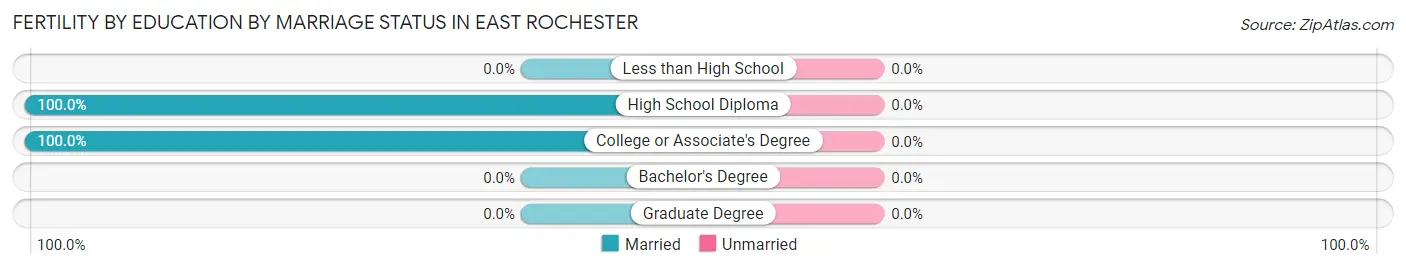
| Educational Attainment | Married | Unmarried |
| Less than High School | 0 (0.0%) | 0 (0.0%) |
| High School Diploma | 35 (100.0%) | 0 (0.0%) |
| College or Associate's Degree | 14 (100.0%) | 0 (0.0%) |
| Bachelor's Degree | 0 (0.0%) | 0 (0.0%) |
| Graduate Degree | 0 (0.0%) | 0 (0.0%) |
| Total | 49 (100.0%) | 0 (0.0%) |
Employment Characteristics in East Rochester
Employment by Class of Employer in East Rochester
Among the 3,385 employed individuals in East Rochester, private company employees (2,225 | 65.7%), not-for-profit organizations (449 | 13.3%), and local government employees (373 | 11.0%) make up the most common classes of employment.
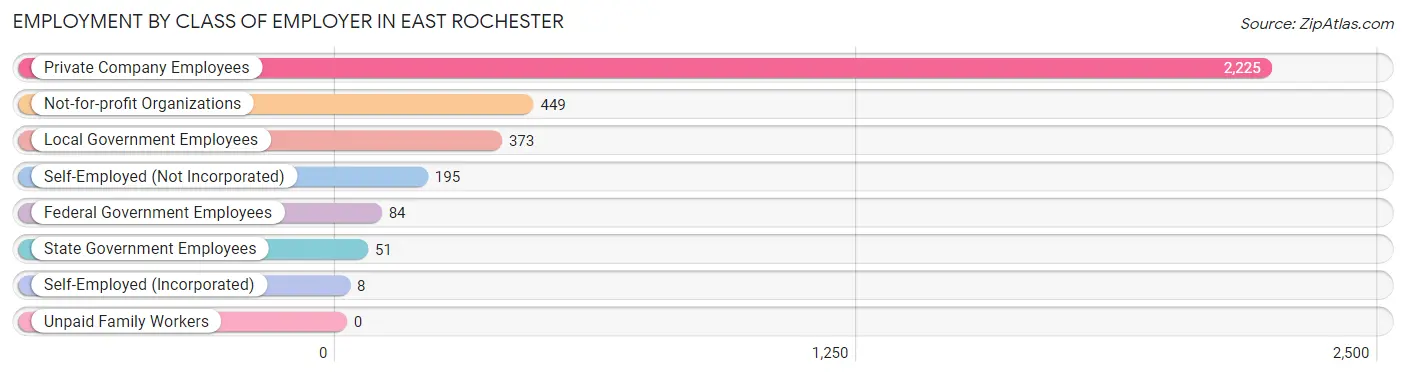
| Employer Class | # Employees | % Employees |
| Private Company Employees | 2,225 | 65.7% |
| Self-Employed (Incorporated) | 8 | 0.2% |
| Self-Employed (Not Incorporated) | 195 | 5.8% |
| Not-for-profit Organizations | 449 | 13.3% |
| Local Government Employees | 373 | 11.0% |
| State Government Employees | 51 | 1.5% |
| Federal Government Employees | 84 | 2.5% |
| Unpaid Family Workers | 0 | 0.0% |
| Total | 3,385 | 100.0% |
Employment Status by Age in East Rochester
According to the labor force statistics for East Rochester, out of the total population over 16 years of age (5,436), 68.0% or 3,696 individuals are in the labor force, with 6.8% or 251 of them unemployed. The age group with the highest labor force participation rate is 25 to 29 years, with 94.9% or 562 individuals in the labor force. Within the labor force, the 16 to 19 years age range has the highest percentage of unemployed individuals, with 18.1% or 17 of them being unemployed.
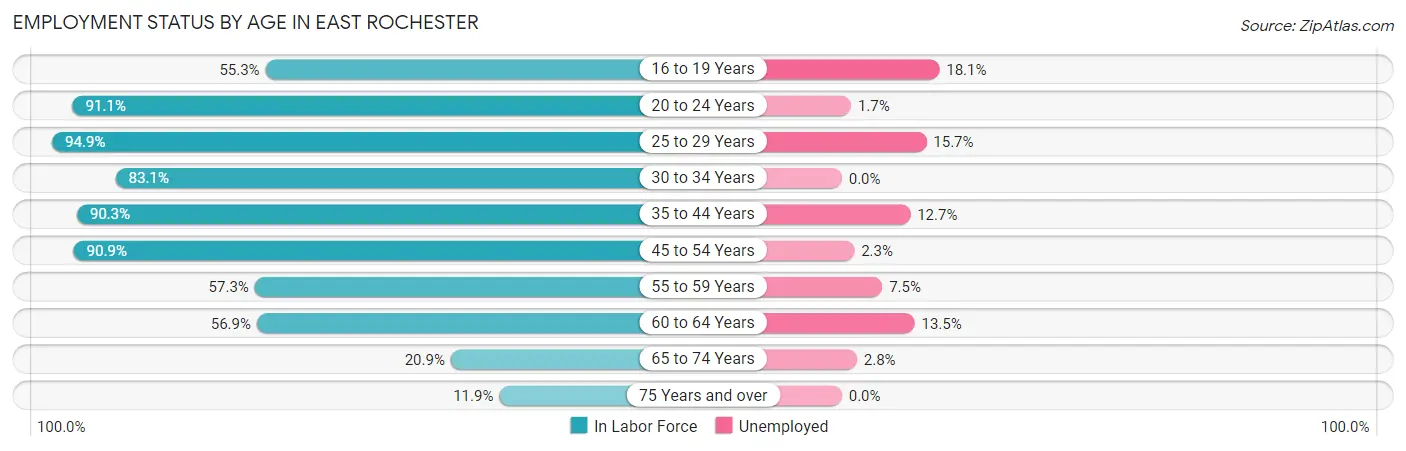
| Age Bracket | In Labor Force | Unemployed |
| 16 to 19 Years | 94 (55.3%) | 17 (18.1%) |
| 20 to 24 Years | 472 (91.1%) | 8 (1.7%) |
| 25 to 29 Years | 562 (94.9%) | 88 (15.7%) |
| 30 to 34 Years | 604 (83.1%) | 0 (0.0%) |
| 35 to 44 Years | 569 (90.3%) | 72 (12.7%) |
| 45 to 54 Years | 698 (90.9%) | 16 (2.3%) |
| 55 to 59 Years | 319 (57.3%) | 24 (7.5%) |
| 60 to 64 Years | 178 (56.9%) | 24 (13.5%) |
| 65 to 74 Years | 144 (20.9%) | 4 (2.8%) |
| 75 Years and over | 56 (11.9%) | 0 (0.0%) |
| Total | 3,696 (68.0%) | 251 (6.8%) |
Employment Status by Educational Attainment in East Rochester
According to labor force statistics for East Rochester, 81.7% of individuals (2,931) out of the total population between 25 and 64 years of age (3,587) are in the labor force, with 7.6% or 223 of them being unemployed. The group with the highest labor force participation rate are those with the educational attainment of bachelor's degree or higher, with 92.9% or 1,140 individuals in the labor force. Within the labor force, individuals with bachelor's degree or higher education have the highest percentage of unemployment, with 8.9% or 101 of them being unemployed.
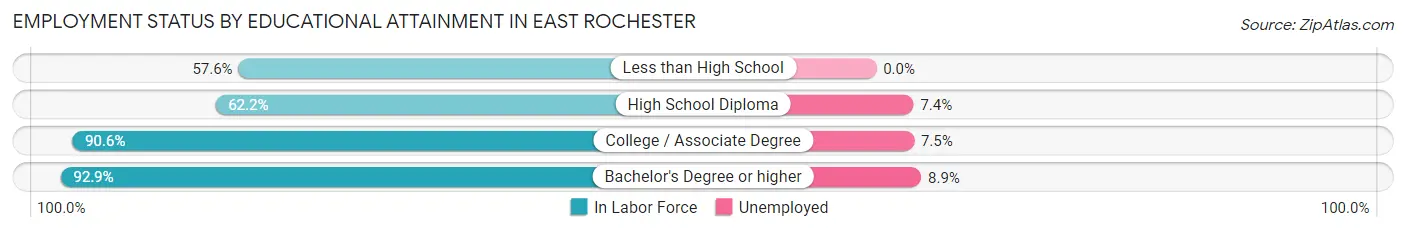
| Educational Attainment | In Labor Force | Unemployed |
| Less than High School | 141 (57.6%) | 0 (0.0%) |
| High School Diploma | 585 (62.2%) | 70 (7.4%) |
| College / Associate Degree | 1,065 (90.6%) | 88 (7.5%) |
| Bachelor's Degree or higher | 1,140 (92.9%) | 109 (8.9%) |
| Total | 2,931 (81.7%) | 273 (7.6%) |
Employment Occupations by Sex in East Rochester
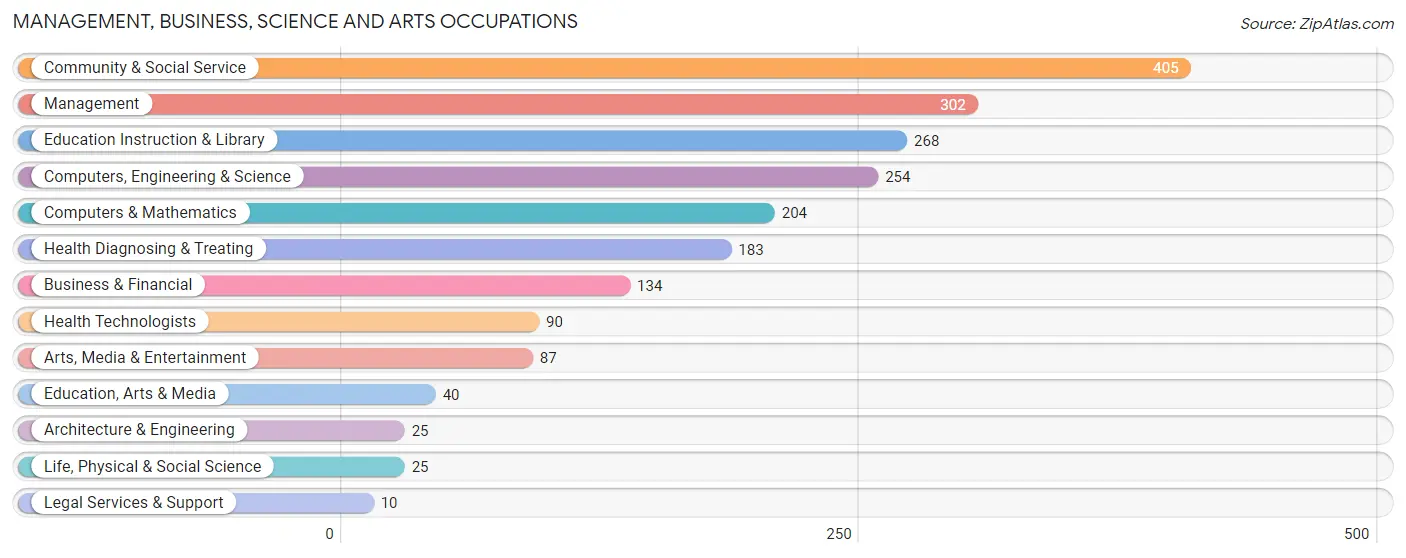
Management, Business, Science and Arts Occupations
The most common Management, Business, Science and Arts occupations in East Rochester are Community & Social Service (405 | 11.8%), Management (302 | 8.8%), Education Instruction & Library (268 | 7.8%), Computers, Engineering & Science (254 | 7.4%), and Computers & Mathematics (204 | 5.9%).
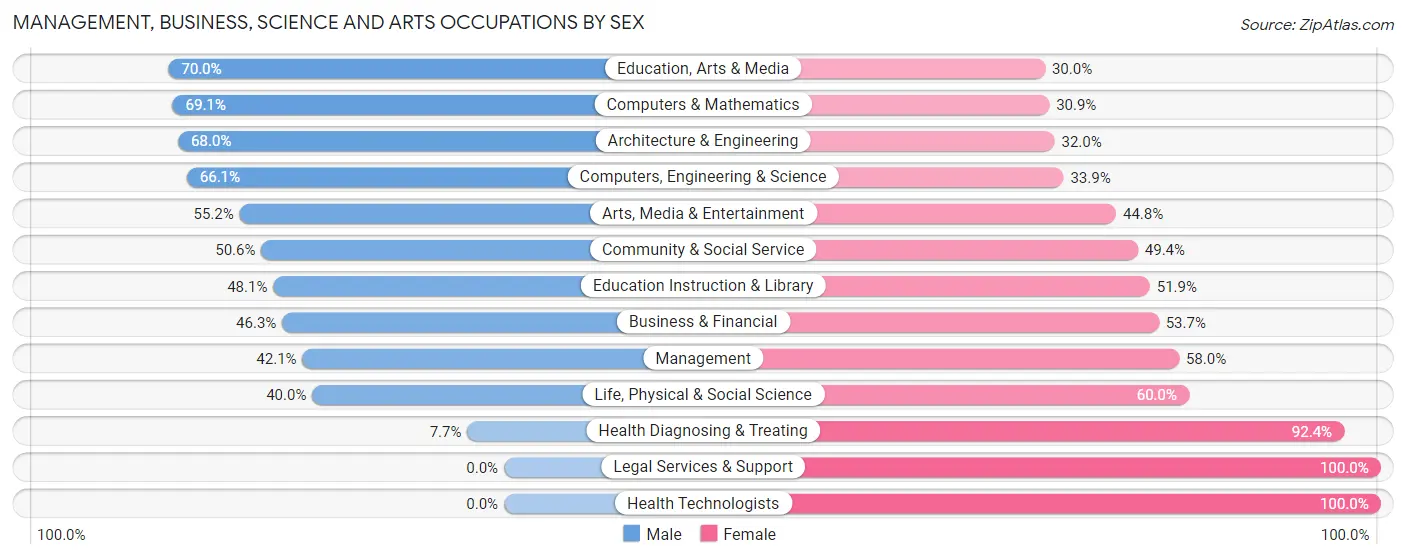
Management, Business, Science and Arts Occupations by Sex
Within the Management, Business, Science and Arts occupations in East Rochester, the most male-oriented occupations are Education, Arts & Media (70.0%), Computers & Mathematics (69.1%), and Architecture & Engineering (68.0%), while the most female-oriented occupations are Legal Services & Support (100.0%), Health Technologists (100.0%), and Health Diagnosing & Treating (92.3%).
| Occupation | Male | Female |
| Management | 127 (42.0%) | 175 (58.0%) |
| Business & Financial | 62 (46.3%) | 72 (53.7%) |
| Computers, Engineering & Science | 168 (66.1%) | 86 (33.9%) |
| Computers & Mathematics | 141 (69.1%) | 63 (30.9%) |
| Architecture & Engineering | 17 (68.0%) | 8 (32.0%) |
| Life, Physical & Social Science | 10 (40.0%) | 15 (60.0%) |
| Community & Social Service | 205 (50.6%) | 200 (49.4%) |
| Education, Arts & Media | 28 (70.0%) | 12 (30.0%) |
| Legal Services & Support | 0 (0.0%) | 10 (100.0%) |
| Education Instruction & Library | 129 (48.1%) | 139 (51.9%) |
| Arts, Media & Entertainment | 48 (55.2%) | 39 (44.8%) |
| Health Diagnosing & Treating | 14 (7.6%) | 169 (92.3%) |
| Health Technologists | 0 (0.0%) | 90 (100.0%) |
| Total (Category) | 576 (45.1%) | 702 (54.9%) |
| Total (Overall) | 1,835 (53.3%) | 1,608 (46.7%) |
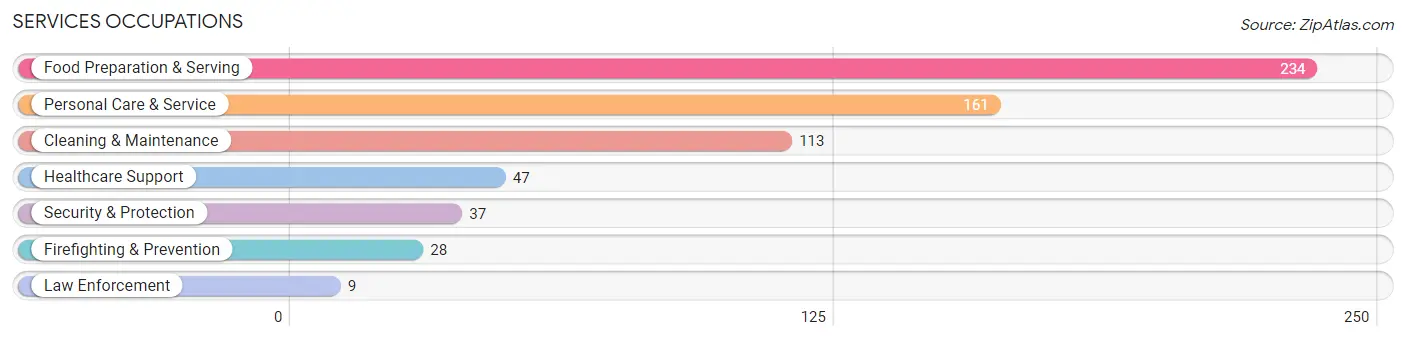
Services Occupations
The most common Services occupations in East Rochester are Food Preparation & Serving (234 | 6.8%), Personal Care & Service (161 | 4.7%), Cleaning & Maintenance (113 | 3.3%), Healthcare Support (47 | 1.4%), and Security & Protection (37 | 1.1%).
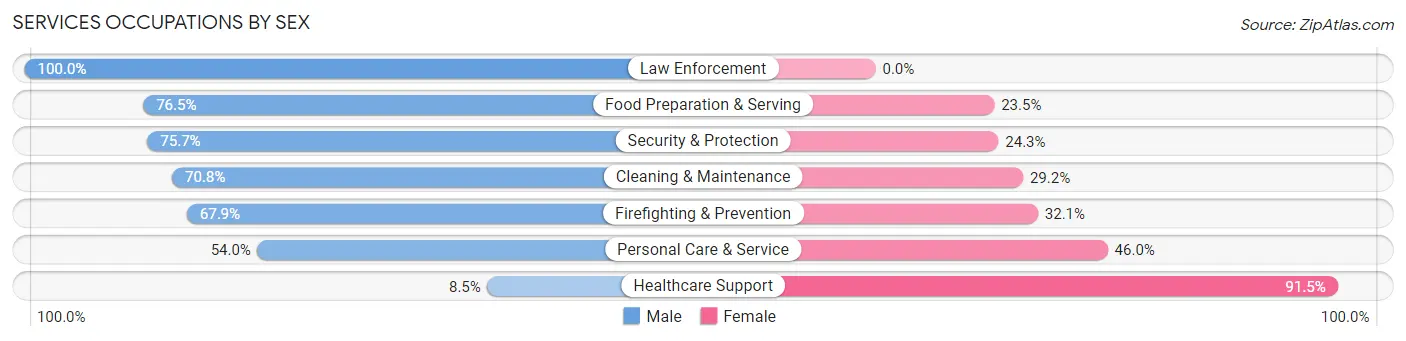
Services Occupations by Sex
Within the Services occupations in East Rochester, the most male-oriented occupations are Law Enforcement (100.0%), Food Preparation & Serving (76.5%), and Security & Protection (75.7%), while the most female-oriented occupations are Healthcare Support (91.5%), Personal Care & Service (46.0%), and Firefighting & Prevention (32.1%).
| Occupation | Male | Female |
| Healthcare Support | 4 (8.5%) | 43 (91.5%) |
| Security & Protection | 28 (75.7%) | 9 (24.3%) |
| Firefighting & Prevention | 19 (67.9%) | 9 (32.1%) |
| Law Enforcement | 9 (100.0%) | 0 (0.0%) |
| Food Preparation & Serving | 179 (76.5%) | 55 (23.5%) |
| Cleaning & Maintenance | 80 (70.8%) | 33 (29.2%) |
| Personal Care & Service | 87 (54.0%) | 74 (46.0%) |
| Total (Category) | 378 (63.8%) | 214 (36.1%) |
| Total (Overall) | 1,835 (53.3%) | 1,608 (46.7%) |
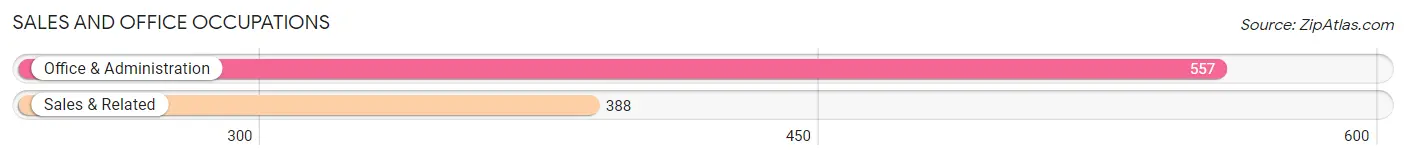
Sales and Office Occupations
The most common Sales and Office occupations in East Rochester are Office & Administration (557 | 16.2%), and Sales & Related (388 | 11.3%).
Sales and Office Occupations by Sex
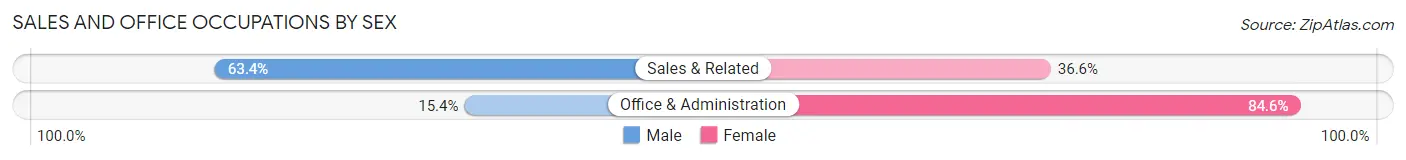
| Occupation | Male | Female |
| Sales & Related | 246 (63.4%) | 142 (36.6%) |
| Office & Administration | 86 (15.4%) | 471 (84.6%) |
| Total (Category) | 332 (35.1%) | 613 (64.9%) |
| Total (Overall) | 1,835 (53.3%) | 1,608 (46.7%) |
Natural Resources, Construction and Maintenance Occupations
The most common Natural Resources, Construction and Maintenance occupations in East Rochester are Installation, Maintenance & Repair (146 | 4.2%), and Construction & Extraction (137 | 4.0%).

Natural Resources, Construction and Maintenance Occupations by Sex
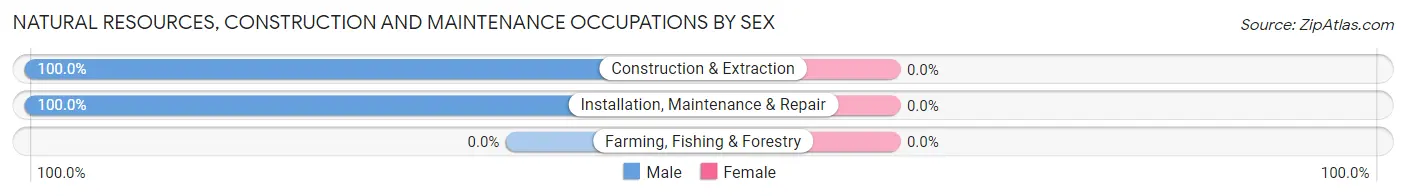
| Occupation | Male | Female |
| Farming, Fishing & Forestry | 0 (0.0%) | 0 (0.0%) |
| Construction & Extraction | 137 (100.0%) | 0 (0.0%) |
| Installation, Maintenance & Repair | 146 (100.0%) | 0 (0.0%) |
| Total (Category) | 283 (100.0%) | 0 (0.0%) |
| Total (Overall) | 1,835 (53.3%) | 1,608 (46.7%) |
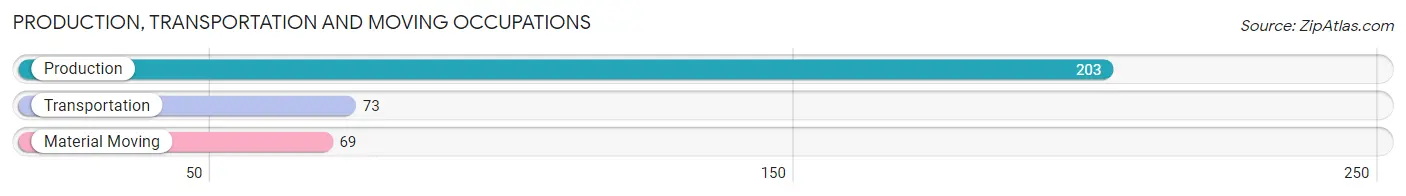
Production, Transportation and Moving Occupations
The most common Production, Transportation and Moving occupations in East Rochester are Production (203 | 5.9%), Transportation (73 | 2.1%), and Material Moving (69 | 2.0%).
Production, Transportation and Moving Occupations by Sex
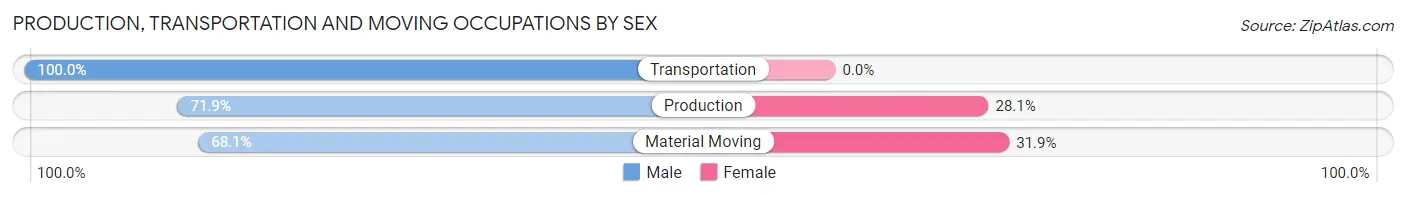
| Occupation | Male | Female |
| Production | 146 (71.9%) | 57 (28.1%) |
| Transportation | 73 (100.0%) | 0 (0.0%) |
| Material Moving | 47 (68.1%) | 22 (31.9%) |
| Total (Category) | 266 (77.1%) | 79 (22.9%) |
| Total (Overall) | 1,835 (53.3%) | 1,608 (46.7%) |
Employment Industries by Sex in East Rochester
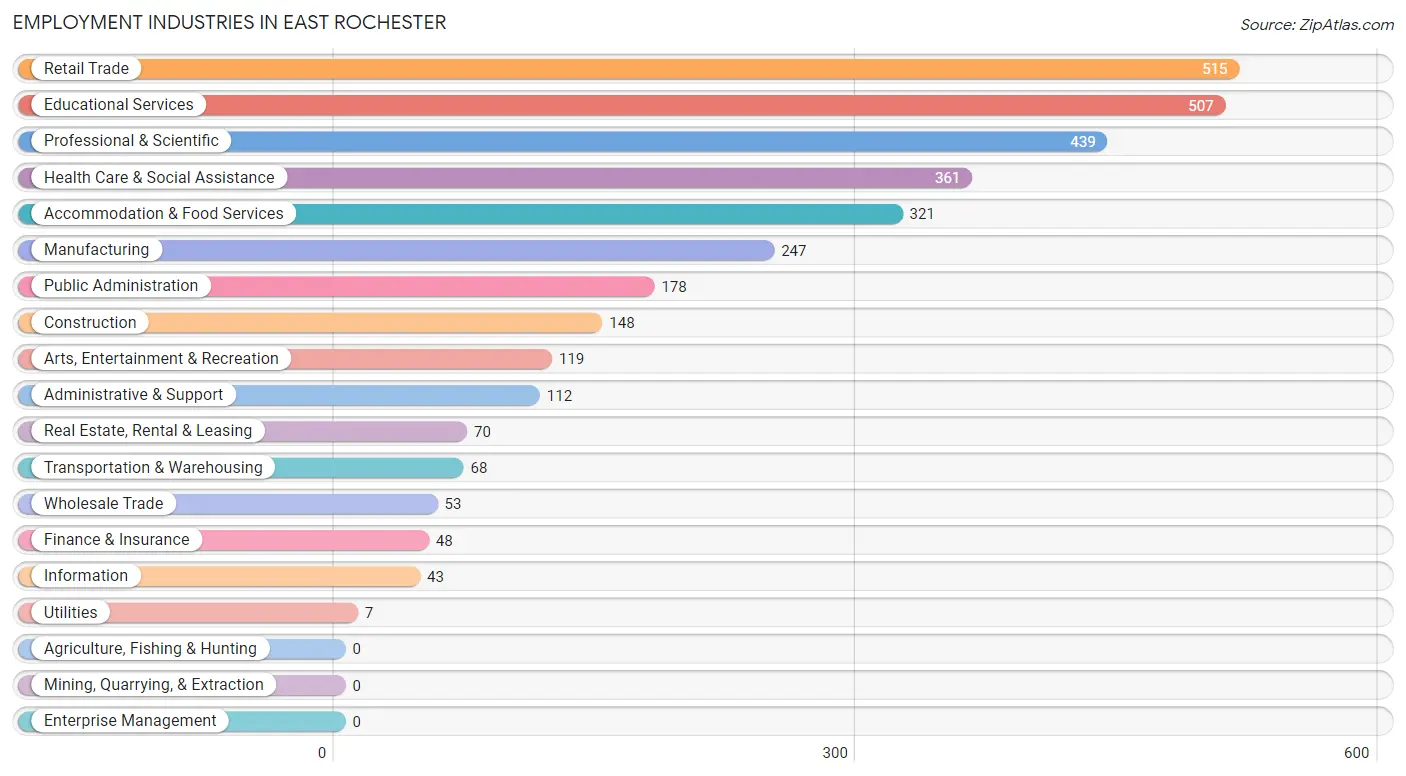
Employment Industries in East Rochester
The major employment industries in East Rochester include Retail Trade (515 | 15.0%), Educational Services (507 | 14.7%), Professional & Scientific (439 | 12.8%), Health Care & Social Assistance (361 | 10.5%), and Accommodation & Food Services (321 | 9.3%).
Employment Industries by Sex in East Rochester
The East Rochester industries that see more men than women are Wholesale Trade (100.0%), Utilities (100.0%), and Information (100.0%), whereas the industries that tend to have a higher number of women are Finance & Insurance (85.4%), Health Care & Social Assistance (76.4%), and Administrative & Support (72.3%).
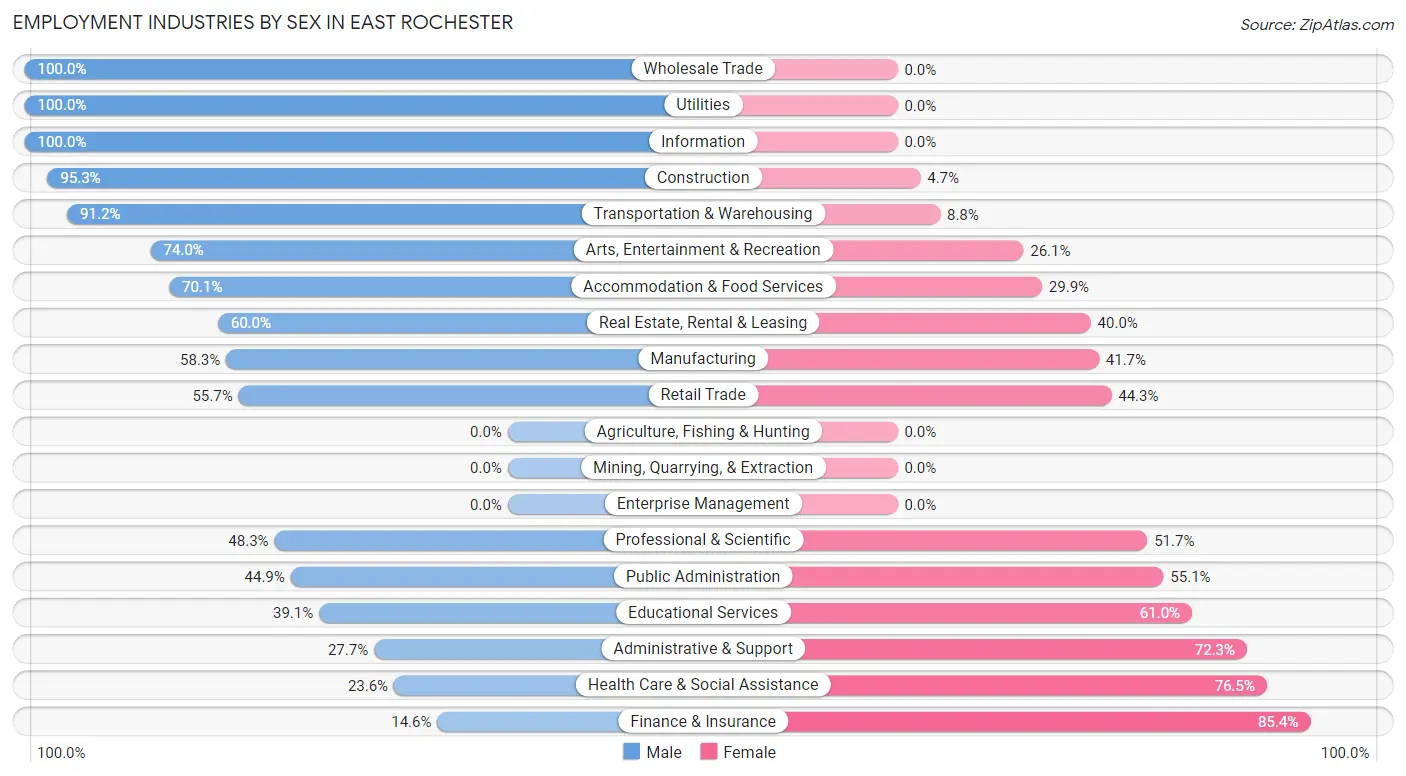
| Industry | Male | Female |
| Agriculture, Fishing & Hunting | 0 (0.0%) | 0 (0.0%) |
| Mining, Quarrying, & Extraction | 0 (0.0%) | 0 (0.0%) |
| Construction | 141 (95.3%) | 7 (4.7%) |
| Manufacturing | 144 (58.3%) | 103 (41.7%) |
| Wholesale Trade | 53 (100.0%) | 0 (0.0%) |
| Retail Trade | 287 (55.7%) | 228 (44.3%) |
| Transportation & Warehousing | 62 (91.2%) | 6 (8.8%) |
| Utilities | 7 (100.0%) | 0 (0.0%) |
| Information | 43 (100.0%) | 0 (0.0%) |
| Finance & Insurance | 7 (14.6%) | 41 (85.4%) |
| Real Estate, Rental & Leasing | 42 (60.0%) | 28 (40.0%) |
| Professional & Scientific | 212 (48.3%) | 227 (51.7%) |
| Enterprise Management | 0 (0.0%) | 0 (0.0%) |
| Administrative & Support | 31 (27.7%) | 81 (72.3%) |
| Educational Services | 198 (39.1%) | 309 (61.0%) |
| Health Care & Social Assistance | 85 (23.5%) | 276 (76.4%) |
| Arts, Entertainment & Recreation | 88 (74.0%) | 31 (26.1%) |
| Accommodation & Food Services | 225 (70.1%) | 96 (29.9%) |
| Public Administration | 80 (44.9%) | 98 (55.1%) |
| Total | 1,835 (53.3%) | 1,608 (46.7%) |
Education in East Rochester
School Enrollment in East Rochester
The most common levels of schooling among the 1,075 students in East Rochester are college / undergraduate (273 | 25.4%), high school (267 | 24.8%), and middle school (180 | 16.7%).
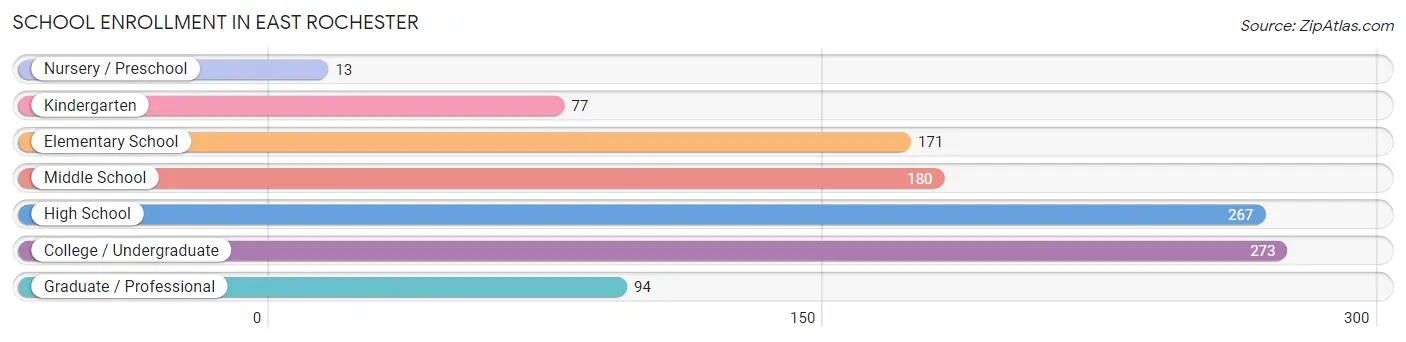
| School Level | # Students | % Students |
| Nursery / Preschool | 13 | 1.2% |
| Kindergarten | 77 | 7.2% |
| Elementary School | 171 | 15.9% |
| Middle School | 180 | 16.7% |
| High School | 267 | 24.8% |
| College / Undergraduate | 273 | 25.4% |
| Graduate / Professional | 94 | 8.7% |
| Total | 1,075 | 100.0% |
School Enrollment by Age by Funding Source in East Rochester
Out of a total of 1,075 students who are enrolled in schools in East Rochester, 305 (28.4%) attend a private institution, while the remaining 770 (71.6%) are enrolled in public schools. The age group of 3 to 4 year olds has the highest likelihood of being enrolled in private schools, with 13 (100.0% in the age bracket) enrolled. Conversely, the age group of 5 to 9 year old has the lowest likelihood of being enrolled in a private school, with 206 (100.0% in the age bracket) attending a public institution.
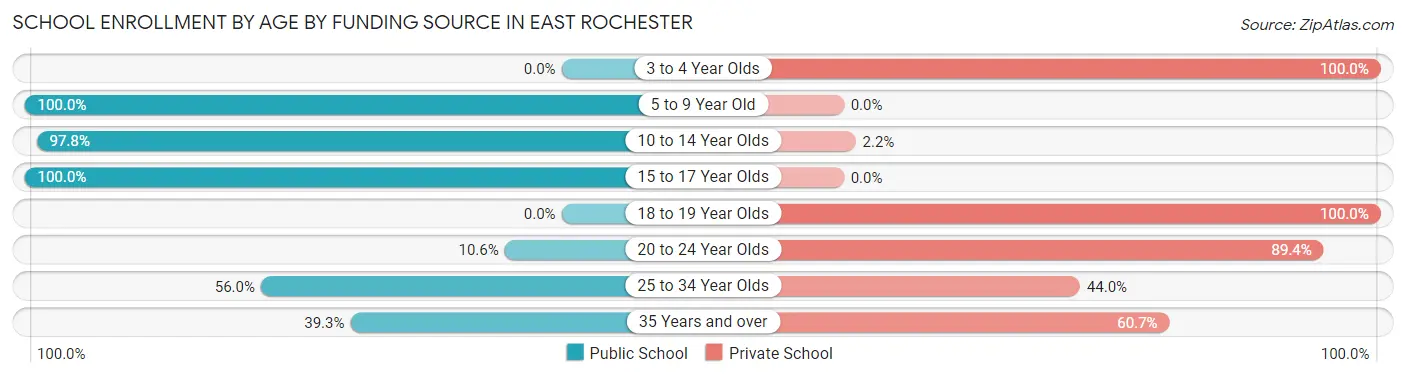
| Age Bracket | Public School | Private School |
| 3 to 4 Year Olds | 0 (0.0%) | 13 (100.0%) |
| 5 to 9 Year Old | 206 (100.0%) | 0 (0.0%) |
| 10 to 14 Year Olds | 307 (97.8%) | 7 (2.2%) |
| 15 to 17 Year Olds | 145 (100.0%) | 0 (0.0%) |
| 18 to 19 Year Olds | 0 (0.0%) | 10 (100.0%) |
| 20 to 24 Year Olds | 21 (10.6%) | 177 (89.4%) |
| 25 to 34 Year Olds | 56 (56.0%) | 44 (44.0%) |
| 35 Years and over | 35 (39.3%) | 54 (60.7%) |
| Total | 770 (71.6%) | 305 (28.4%) |
Educational Attainment by Field of Study in East Rochester
Education (243 | 15.3%), business (234 | 14.7%), liberal arts & history (180 | 11.3%), science & technology (173 | 10.9%), and arts & humanities (146 | 9.2%) are the most common fields of study among 1,587 individuals in East Rochester who have obtained a bachelor's degree or higher.
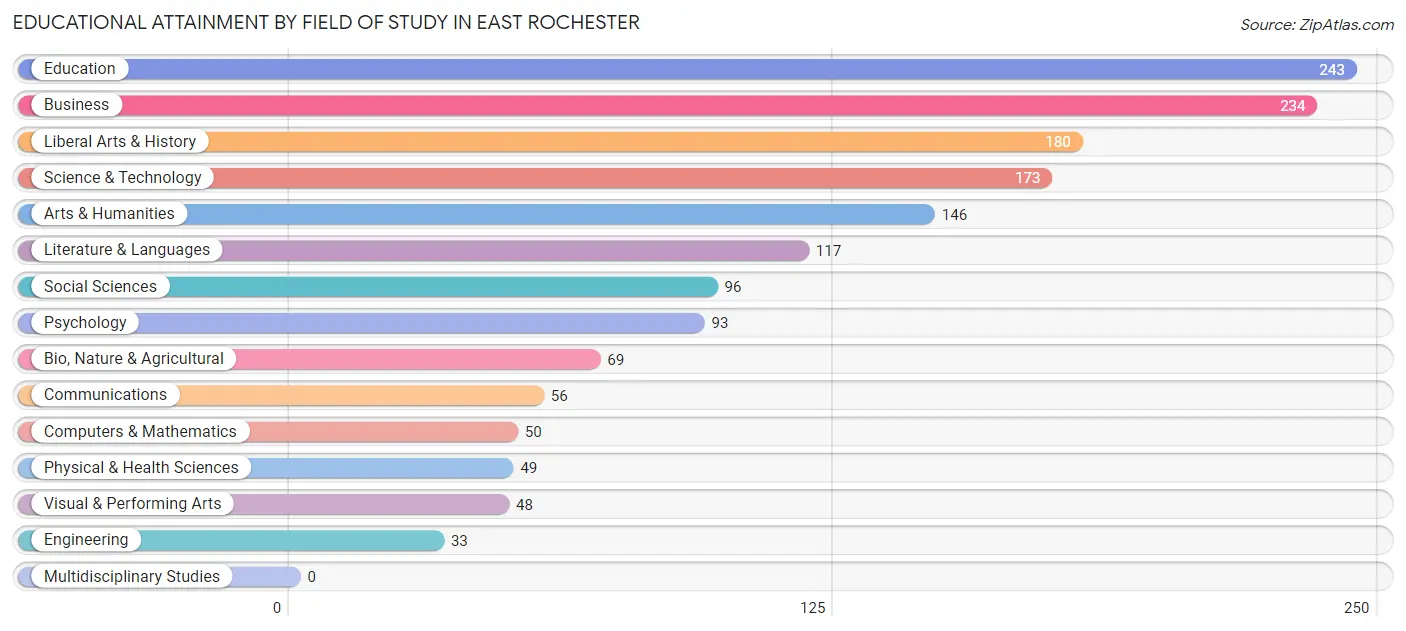
| Field of Study | # Graduates | % Graduates |
| Computers & Mathematics | 50 | 3.2% |
| Bio, Nature & Agricultural | 69 | 4.3% |
| Physical & Health Sciences | 49 | 3.1% |
| Psychology | 93 | 5.9% |
| Social Sciences | 96 | 6.0% |
| Engineering | 33 | 2.1% |
| Multidisciplinary Studies | 0 | 0.0% |
| Science & Technology | 173 | 10.9% |
| Business | 234 | 14.7% |
| Education | 243 | 15.3% |
| Literature & Languages | 117 | 7.4% |
| Liberal Arts & History | 180 | 11.3% |
| Visual & Performing Arts | 48 | 3.0% |
| Communications | 56 | 3.5% |
| Arts & Humanities | 146 | 9.2% |
| Total | 1,587 | 100.0% |
Transportation & Commute in East Rochester
Vehicle Availability by Sex in East Rochester
The most prevalent vehicle ownership categories in East Rochester are males with 2 vehicles (920, accounting for 51.3%) and females with 2 vehicles (707, making up 58.1%).
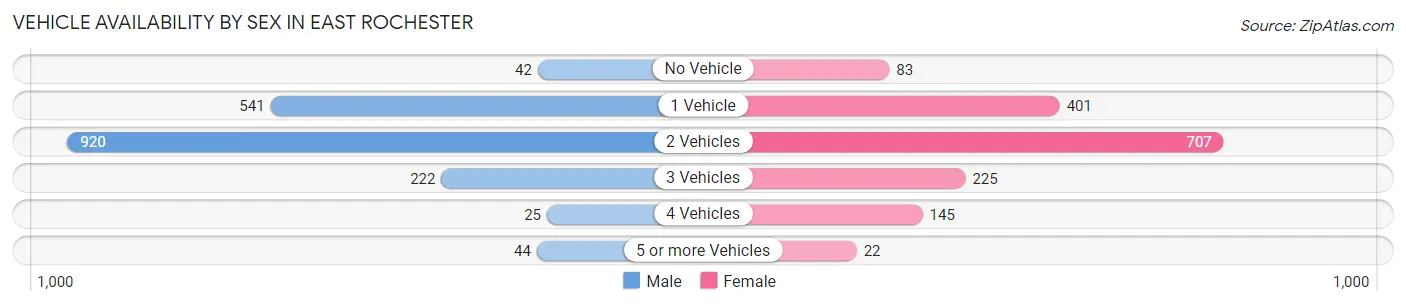
| Vehicles Available | Male | Female |
| No Vehicle | 42 (2.3%) | 83 (5.2%) |
| 1 Vehicle | 541 (30.2%) | 401 (25.3%) |
| 2 Vehicles | 920 (51.3%) | 707 (44.7%) |
| 3 Vehicles | 222 (12.4%) | 225 (14.2%) |
| 4 Vehicles | 25 (1.4%) | 145 (9.2%) |
| 5 or more Vehicles | 44 (2.5%) | 22 (1.4%) |
| Total | 1,794 (100.0%) | 1,583 (100.0%) |
Commute Time in East Rochester
The most frequently occuring commute durations in East Rochester are 15 to 19 minutes (843 commuters, 26.8%), 5 to 9 minutes (517 commuters, 16.5%), and 10 to 14 minutes (494 commuters, 15.7%).
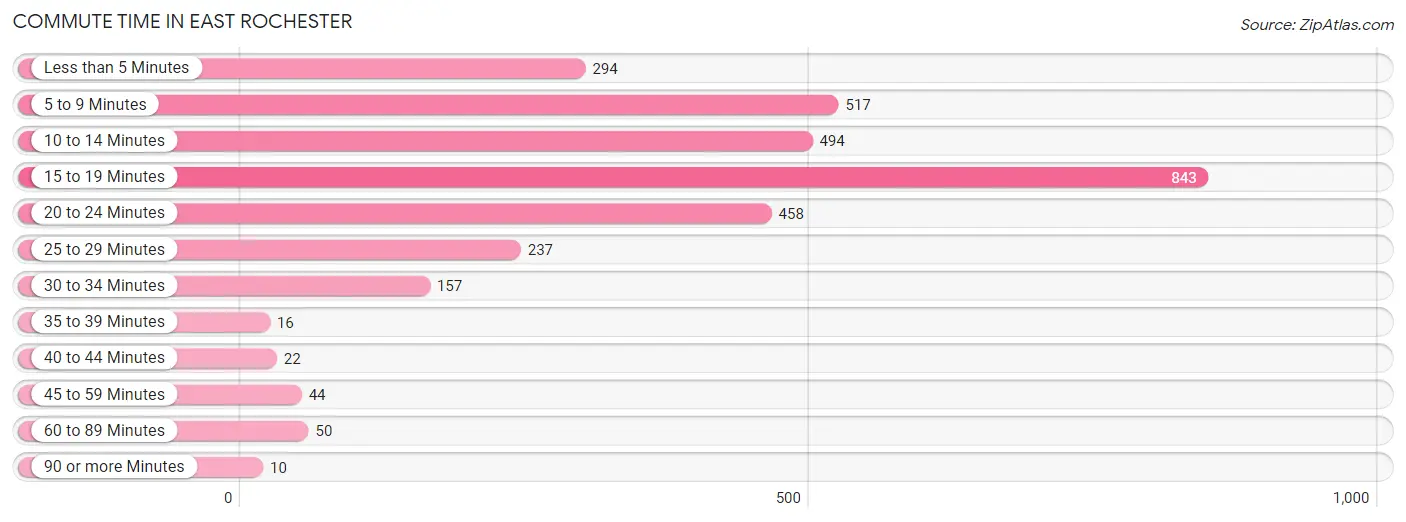
| Commute Time | # Commuters | % Commuters |
| Less than 5 Minutes | 294 | 9.4% |
| 5 to 9 Minutes | 517 | 16.5% |
| 10 to 14 Minutes | 494 | 15.7% |
| 15 to 19 Minutes | 843 | 26.8% |
| 20 to 24 Minutes | 458 | 14.6% |
| 25 to 29 Minutes | 237 | 7.5% |
| 30 to 34 Minutes | 157 | 5.0% |
| 35 to 39 Minutes | 16 | 0.5% |
| 40 to 44 Minutes | 22 | 0.7% |
| 45 to 59 Minutes | 44 | 1.4% |
| 60 to 89 Minutes | 50 | 1.6% |
| 90 or more Minutes | 10 | 0.3% |
Commute Time by Sex in East Rochester
The most common commute times in East Rochester are 15 to 19 minutes (426 commuters, 24.4%) for males and 15 to 19 minutes (417 commuters, 29.8%) for females.
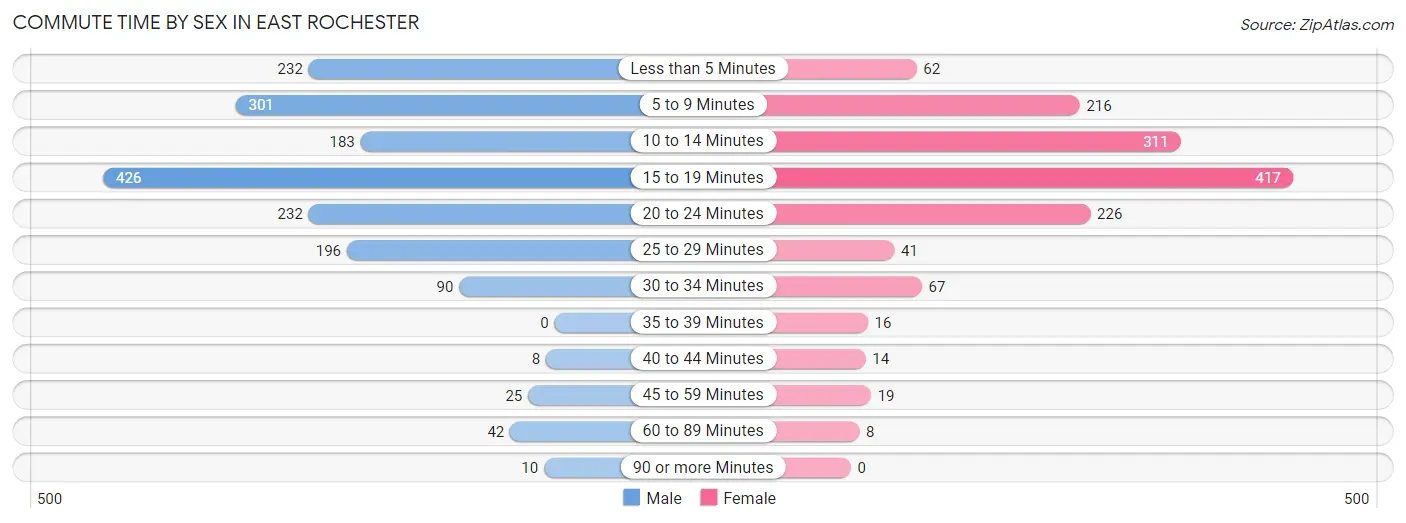
| Commute Time | Male | Female |
| Less than 5 Minutes | 232 (13.3%) | 62 (4.4%) |
| 5 to 9 Minutes | 301 (17.2%) | 216 (15.5%) |
| 10 to 14 Minutes | 183 (10.5%) | 311 (22.3%) |
| 15 to 19 Minutes | 426 (24.4%) | 417 (29.8%) |
| 20 to 24 Minutes | 232 (13.3%) | 226 (16.2%) |
| 25 to 29 Minutes | 196 (11.2%) | 41 (2.9%) |
| 30 to 34 Minutes | 90 (5.2%) | 67 (4.8%) |
| 35 to 39 Minutes | 0 (0.0%) | 16 (1.1%) |
| 40 to 44 Minutes | 8 (0.5%) | 14 (1.0%) |
| 45 to 59 Minutes | 25 (1.4%) | 19 (1.4%) |
| 60 to 89 Minutes | 42 (2.4%) | 8 (0.6%) |
| 90 or more Minutes | 10 (0.6%) | 0 (0.0%) |
Time of Departure to Work by Sex in East Rochester
The most frequent times of departure to work in East Rochester are 7:00 AM to 7:29 AM (280, 16.1%) for males and 7:00 AM to 7:29 AM (301, 21.5%) for females.
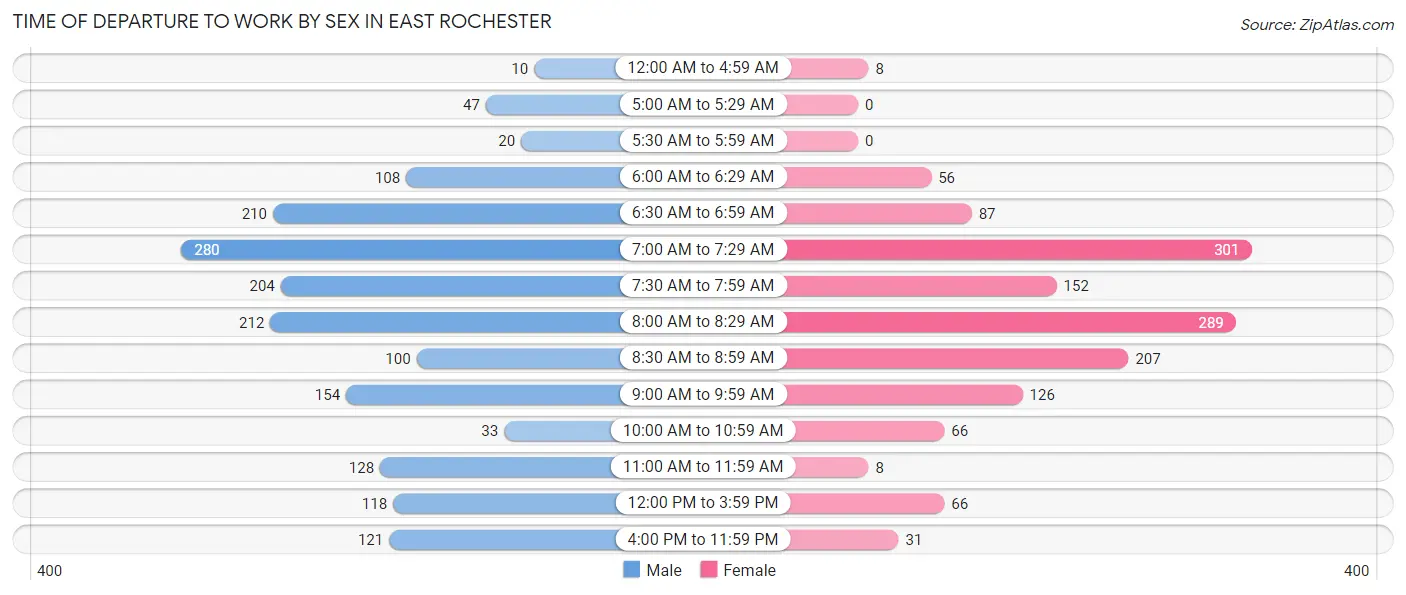
| Time of Departure | Male | Female |
| 12:00 AM to 4:59 AM | 10 (0.6%) | 8 (0.6%) |
| 5:00 AM to 5:29 AM | 47 (2.7%) | 0 (0.0%) |
| 5:30 AM to 5:59 AM | 20 (1.1%) | 0 (0.0%) |
| 6:00 AM to 6:29 AM | 108 (6.2%) | 56 (4.0%) |
| 6:30 AM to 6:59 AM | 210 (12.0%) | 87 (6.2%) |
| 7:00 AM to 7:29 AM | 280 (16.1%) | 301 (21.5%) |
| 7:30 AM to 7:59 AM | 204 (11.7%) | 152 (10.9%) |
| 8:00 AM to 8:29 AM | 212 (12.1%) | 289 (20.7%) |
| 8:30 AM to 8:59 AM | 100 (5.7%) | 207 (14.8%) |
| 9:00 AM to 9:59 AM | 154 (8.8%) | 126 (9.0%) |
| 10:00 AM to 10:59 AM | 33 (1.9%) | 66 (4.7%) |
| 11:00 AM to 11:59 AM | 128 (7.3%) | 8 (0.6%) |
| 12:00 PM to 3:59 PM | 118 (6.8%) | 66 (4.7%) |
| 4:00 PM to 11:59 PM | 121 (6.9%) | 31 (2.2%) |
| Total | 1,745 (100.0%) | 1,397 (100.0%) |
Housing Occupancy in East Rochester
Occupancy by Ownership in East Rochester
Of the total 2,919 dwellings in East Rochester, owner-occupied units account for 1,802 (61.7%), while renter-occupied units make up 1,117 (38.3%).
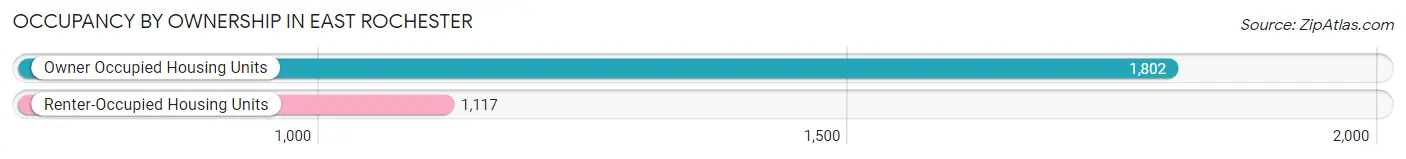
| Occupancy | # Housing Units | % Housing Units |
| Owner Occupied Housing Units | 1,802 | 61.7% |
| Renter-Occupied Housing Units | 1,117 | 38.3% |
| Total Occupied Housing Units | 2,919 | 100.0% |
Occupancy by Household Size in East Rochester
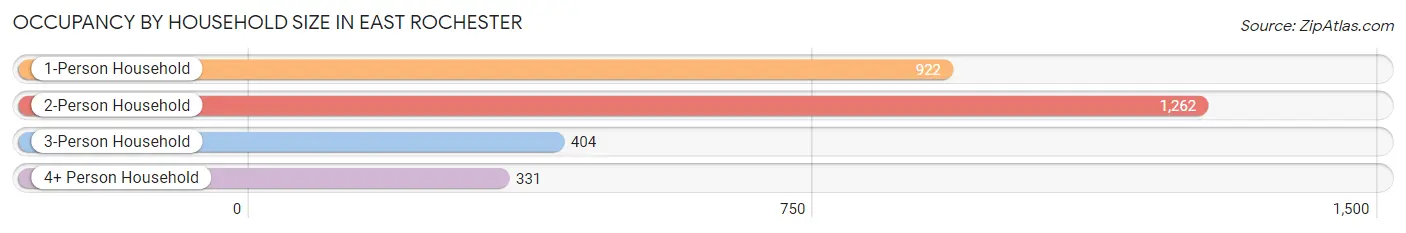
| Household Size | # Housing Units | % Housing Units |
| 1-Person Household | 922 | 31.6% |
| 2-Person Household | 1,262 | 43.2% |
| 3-Person Household | 404 | 13.8% |
| 4+ Person Household | 331 | 11.3% |
| Total Housing Units | 2,919 | 100.0% |
Occupancy by Ownership by Household Size in East Rochester
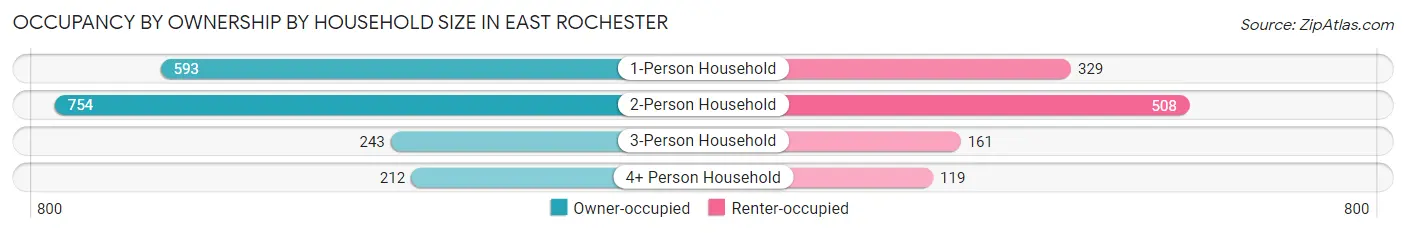
| Household Size | Owner-occupied | Renter-occupied |
| 1-Person Household | 593 (64.3%) | 329 (35.7%) |
| 2-Person Household | 754 (59.8%) | 508 (40.3%) |
| 3-Person Household | 243 (60.2%) | 161 (39.9%) |
| 4+ Person Household | 212 (64.0%) | 119 (35.9%) |
| Total Housing Units | 1,802 (61.7%) | 1,117 (38.3%) |
Occupancy by Educational Attainment in East Rochester
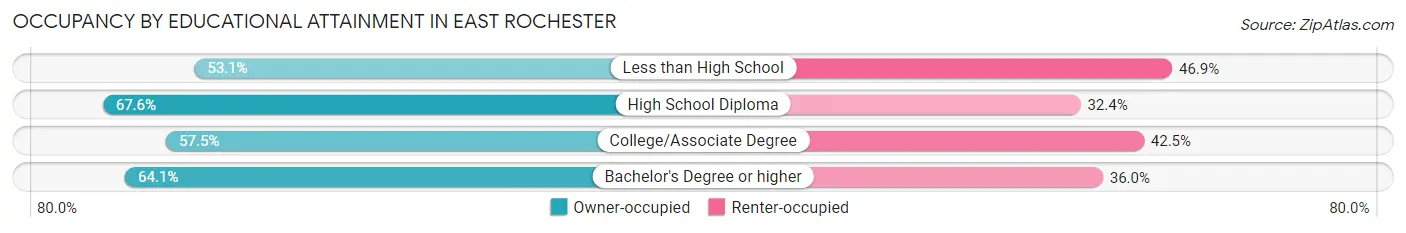
| Household Size | Owner-occupied | Renter-occupied |
| Less than High School | 121 (53.1%) | 107 (46.9%) |
| High School Diploma | 440 (67.6%) | 211 (32.4%) |
| College/Associate Degree | 580 (57.5%) | 428 (42.5%) |
| Bachelor's Degree or higher | 661 (64.0%) | 371 (35.9%) |
Occupancy by Age of Householder in East Rochester
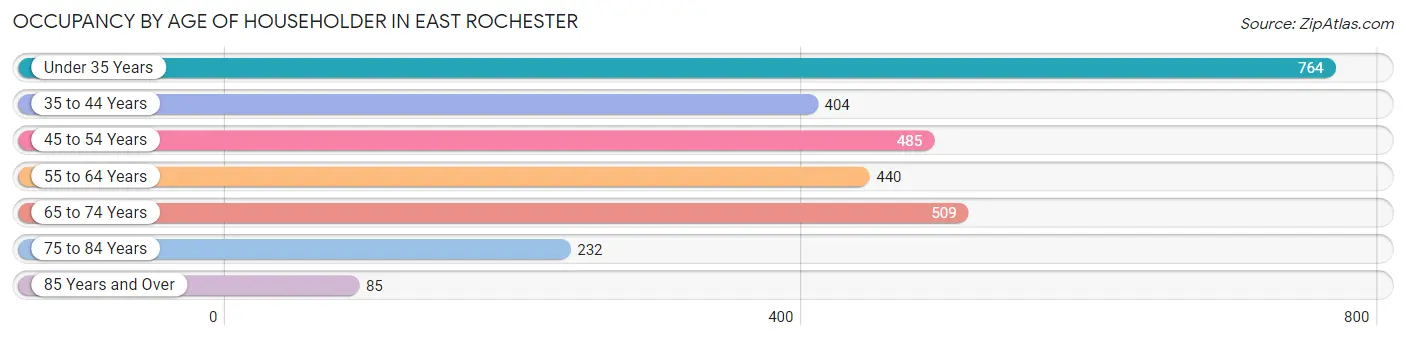
| Age Bracket | # Households | % Households |
| Under 35 Years | 764 | 26.2% |
| 35 to 44 Years | 404 | 13.8% |
| 45 to 54 Years | 485 | 16.6% |
| 55 to 64 Years | 440 | 15.1% |
| 65 to 74 Years | 509 | 17.4% |
| 75 to 84 Years | 232 | 8.0% |
| 85 Years and Over | 85 | 2.9% |
| Total | 2,919 | 100.0% |
Housing Finances in East Rochester
Median Income by Occupancy in East Rochester
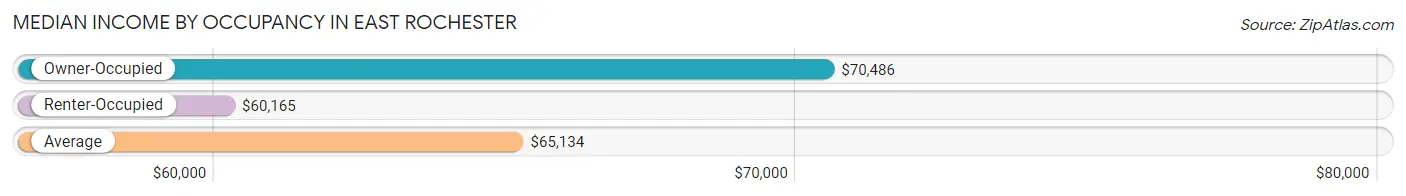
| Occupancy Type | # Households | Median Income |
| Owner-Occupied | 1,802 (61.7%) | $70,486 |
| Renter-Occupied | 1,117 (38.3%) | $60,165 |
| Average | 2,919 (100.0%) | $65,134 |
Occupancy by Householder Income Bracket in East Rochester
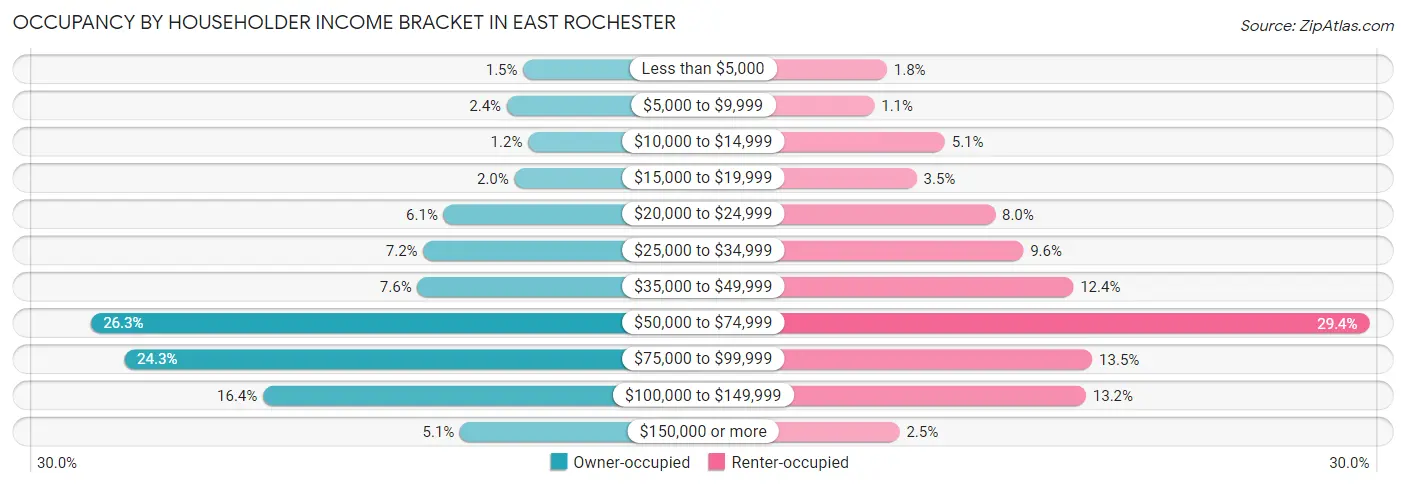
| Income Bracket | Owner-occupied | Renter-occupied |
| Less than $5,000 | 27 (1.5%) | 20 (1.8%) |
| $5,000 to $9,999 | 44 (2.4%) | 12 (1.1%) |
| $10,000 to $14,999 | 22 (1.2%) | 57 (5.1%) |
| $15,000 to $19,999 | 36 (2.0%) | 39 (3.5%) |
| $20,000 to $24,999 | 109 (6.0%) | 89 (8.0%) |
| $25,000 to $34,999 | 130 (7.2%) | 107 (9.6%) |
| $35,000 to $49,999 | 136 (7.5%) | 139 (12.4%) |
| $50,000 to $74,999 | 473 (26.3%) | 328 (29.4%) |
| $75,000 to $99,999 | 438 (24.3%) | 151 (13.5%) |
| $100,000 to $149,999 | 295 (16.4%) | 147 (13.2%) |
| $150,000 or more | 92 (5.1%) | 28 (2.5%) |
| Total | 1,802 (100.0%) | 1,117 (100.0%) |
Monthly Housing Cost Tiers in East Rochester
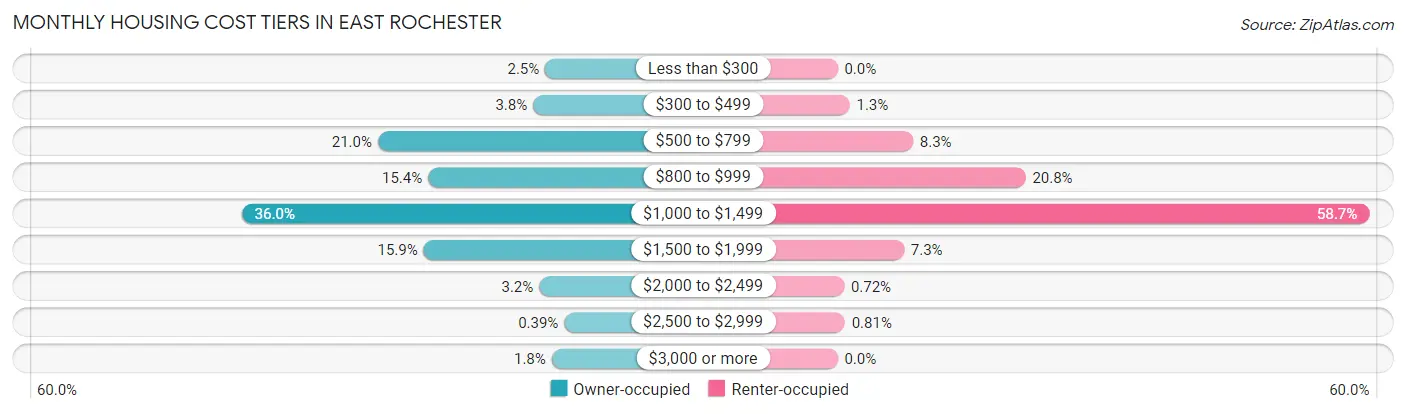
| Monthly Cost | Owner-occupied | Renter-occupied |
| Less than $300 | 45 (2.5%) | 0 (0.0%) |
| $300 to $499 | 69 (3.8%) | 15 (1.3%) |
| $500 to $799 | 378 (21.0%) | 93 (8.3%) |
| $800 to $999 | 278 (15.4%) | 232 (20.8%) |
| $1,000 to $1,499 | 649 (36.0%) | 656 (58.7%) |
| $1,500 to $1,999 | 287 (15.9%) | 82 (7.3%) |
| $2,000 to $2,499 | 57 (3.2%) | 8 (0.7%) |
| $2,500 to $2,999 | 7 (0.4%) | 9 (0.8%) |
| $3,000 or more | 32 (1.8%) | 0 (0.0%) |
| Total | 1,802 (100.0%) | 1,117 (100.0%) |
Physical Housing Characteristics in East Rochester
Housing Structures in East Rochester
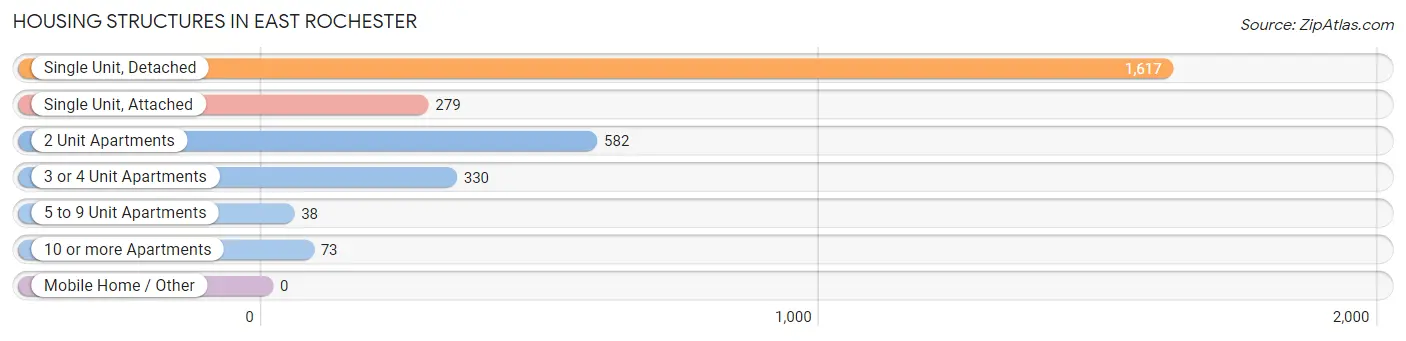
| Structure Type | # Housing Units | % Housing Units |
| Single Unit, Detached | 1,617 | 55.4% |
| Single Unit, Attached | 279 | 9.6% |
| 2 Unit Apartments | 582 | 19.9% |
| 3 or 4 Unit Apartments | 330 | 11.3% |
| 5 to 9 Unit Apartments | 38 | 1.3% |
| 10 or more Apartments | 73 | 2.5% |
| Mobile Home / Other | 0 | 0.0% |
| Total | 2,919 | 100.0% |
Housing Structures by Occupancy in East Rochester
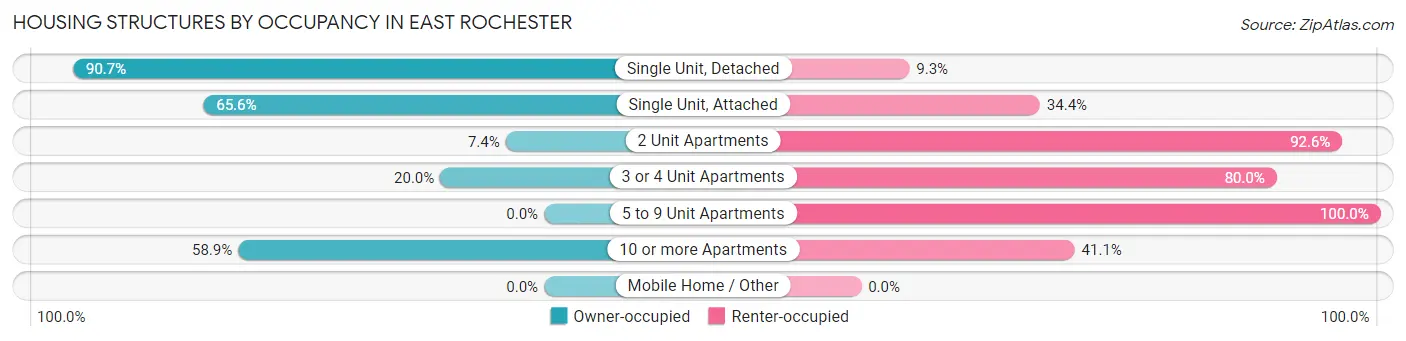
| Structure Type | Owner-occupied | Renter-occupied |
| Single Unit, Detached | 1,467 (90.7%) | 150 (9.3%) |
| Single Unit, Attached | 183 (65.6%) | 96 (34.4%) |
| 2 Unit Apartments | 43 (7.4%) | 539 (92.6%) |
| 3 or 4 Unit Apartments | 66 (20.0%) | 264 (80.0%) |
| 5 to 9 Unit Apartments | 0 (0.0%) | 38 (100.0%) |
| 10 or more Apartments | 43 (58.9%) | 30 (41.1%) |
| Mobile Home / Other | 0 (0.0%) | 0 (0.0%) |
| Total | 1,802 (61.7%) | 1,117 (38.3%) |
Housing Structures by Number of Rooms in East Rochester
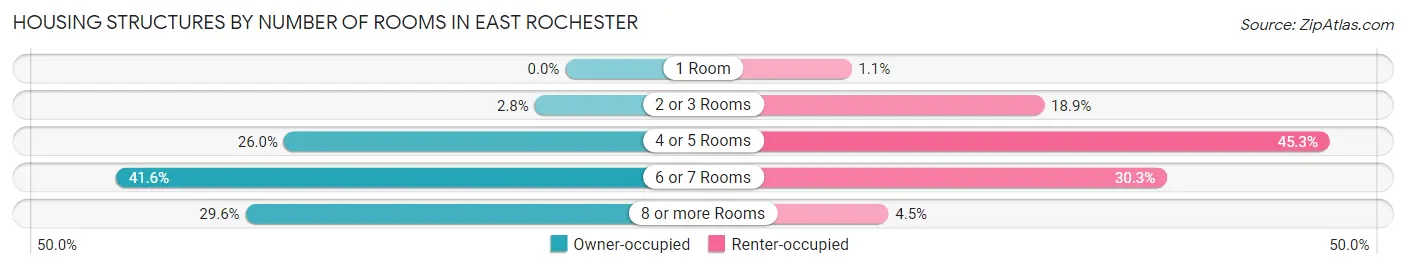
| Number of Rooms | Owner-occupied | Renter-occupied |
| 1 Room | 0 (0.0%) | 12 (1.1%) |
| 2 or 3 Rooms | 51 (2.8%) | 211 (18.9%) |
| 4 or 5 Rooms | 469 (26.0%) | 506 (45.3%) |
| 6 or 7 Rooms | 749 (41.6%) | 338 (30.3%) |
| 8 or more Rooms | 533 (29.6%) | 50 (4.5%) |
| Total | 1,802 (100.0%) | 1,117 (100.0%) |
Housing Structure by Heating Type in East Rochester
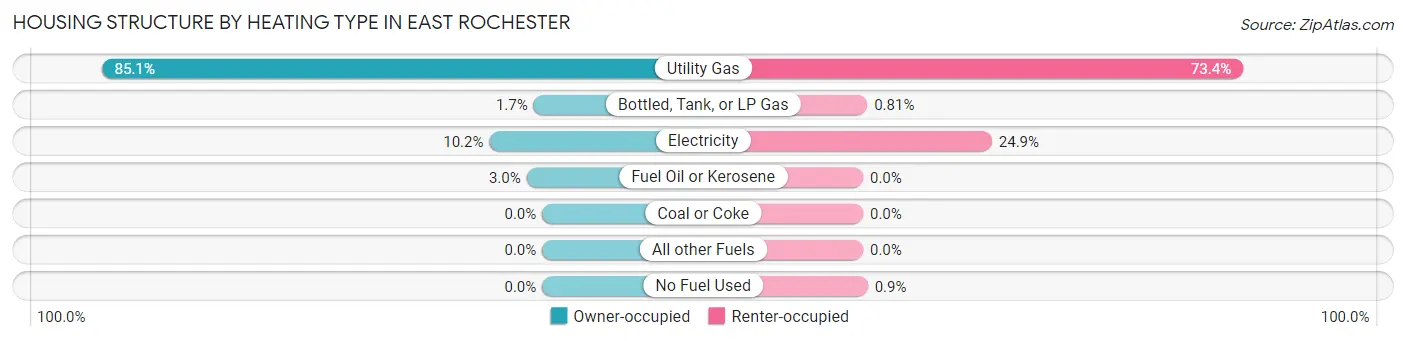
| Heating Type | Owner-occupied | Renter-occupied |
| Utility Gas | 1,534 (85.1%) | 820 (73.4%) |
| Bottled, Tank, or LP Gas | 30 (1.7%) | 9 (0.8%) |
| Electricity | 184 (10.2%) | 278 (24.9%) |
| Fuel Oil or Kerosene | 54 (3.0%) | 0 (0.0%) |
| Coal or Coke | 0 (0.0%) | 0 (0.0%) |
| All other Fuels | 0 (0.0%) | 0 (0.0%) |
| No Fuel Used | 0 (0.0%) | 10 (0.9%) |
| Total | 1,802 (100.0%) | 1,117 (100.0%) |
Household Vehicle Usage in East Rochester
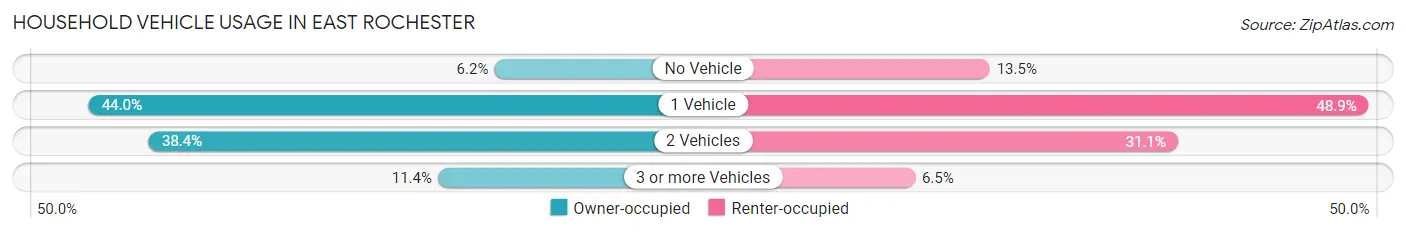
| Vehicles per Household | Owner-occupied | Renter-occupied |
| No Vehicle | 111 (6.2%) | 151 (13.5%) |
| 1 Vehicle | 793 (44.0%) | 546 (48.9%) |
| 2 Vehicles | 692 (38.4%) | 347 (31.1%) |
| 3 or more Vehicles | 206 (11.4%) | 73 (6.5%) |
| Total | 1,802 (100.0%) | 1,117 (100.0%) |
Real Estate & Mortgages in East Rochester
Real Estate and Mortgage Overview in East Rochester
| Characteristic | Without Mortgage | With Mortgage |
| Housing Units | 565 | 1,237 |
| Median Property Value | $129,500 | $123,600 |
| Median Household Income | $60,257 | $81 |
| Monthly Housing Costs | $682 | $32 |
| Real Estate Taxes | $4,529 | $9 |
Property Value by Mortgage Status in East Rochester
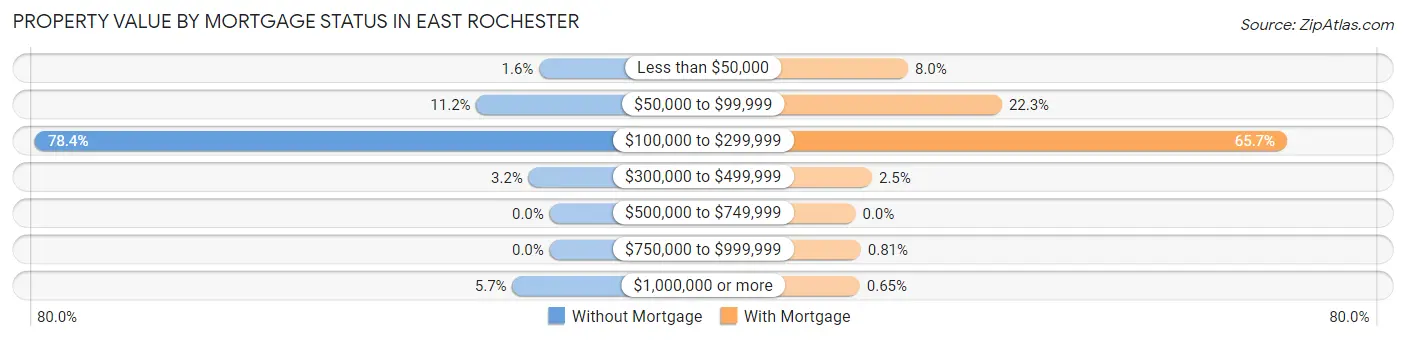
| Property Value | Without Mortgage | With Mortgage |
| Less than $50,000 | 9 (1.6%) | 99 (8.0%) |
| $50,000 to $99,999 | 63 (11.2%) | 276 (22.3%) |
| $100,000 to $299,999 | 443 (78.4%) | 813 (65.7%) |
| $300,000 to $499,999 | 18 (3.2%) | 31 (2.5%) |
| $500,000 to $749,999 | 0 (0.0%) | 0 (0.0%) |
| $750,000 to $999,999 | 0 (0.0%) | 10 (0.8%) |
| $1,000,000 or more | 32 (5.7%) | 8 (0.6%) |
| Total | 565 (100.0%) | 1,237 (100.0%) |
Household Income by Mortgage Status in East Rochester
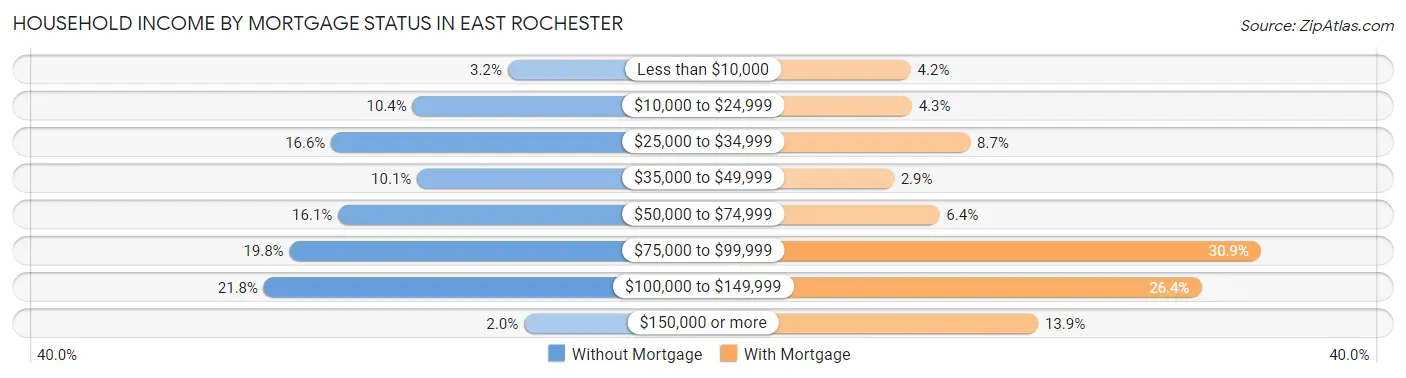
| Household Income | Without Mortgage | With Mortgage |
| Less than $10,000 | 18 (3.2%) | 52 (4.2%) |
| $10,000 to $24,999 | 59 (10.4%) | 53 (4.3%) |
| $25,000 to $34,999 | 94 (16.6%) | 108 (8.7%) |
| $35,000 to $49,999 | 57 (10.1%) | 36 (2.9%) |
| $50,000 to $74,999 | 91 (16.1%) | 79 (6.4%) |
| $75,000 to $99,999 | 112 (19.8%) | 382 (30.9%) |
| $100,000 to $149,999 | 123 (21.8%) | 326 (26.4%) |
| $150,000 or more | 11 (1.9%) | 172 (13.9%) |
| Total | 565 (100.0%) | 1,237 (100.0%) |
Property Value to Household Income Ratio in East Rochester
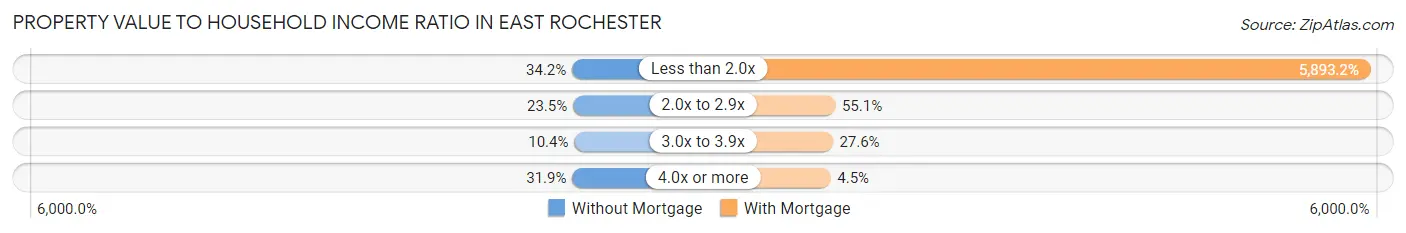
| Value-to-Income Ratio | Without Mortgage | With Mortgage |
| Less than 2.0x | 193 (34.2%) | 72,899 (5,893.2%) |
| 2.0x to 2.9x | 133 (23.5%) | 682 (55.1%) |
| 3.0x to 3.9x | 59 (10.4%) | 341 (27.6%) |
| 4.0x or more | 180 (31.9%) | 56 (4.5%) |
| Total | 565 (100.0%) | 1,237 (100.0%) |
Real Estate Taxes by Mortgage Status in East Rochester
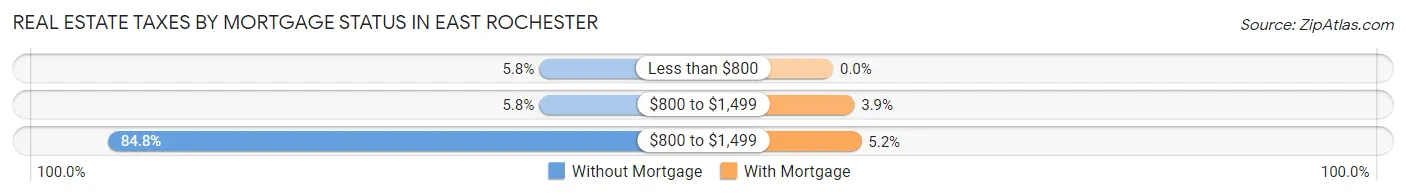
| Property Taxes | Without Mortgage | With Mortgage |
| Less than $800 | 33 (5.8%) | 0 (0.0%) |
| $800 to $1,499 | 33 (5.8%) | 48 (3.9%) |
| $800 to $1,499 | 479 (84.8%) | 64 (5.2%) |
| Total | 565 (100.0%) | 1,237 (100.0%) |
Health & Disability in East Rochester
Health Insurance Coverage by Age in East Rochester
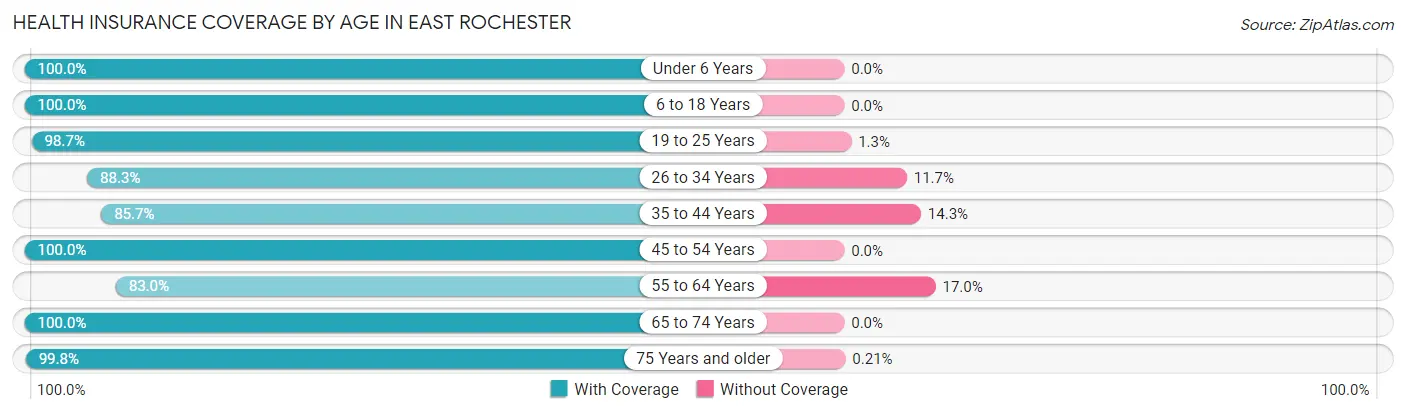
| Age Bracket | With Coverage | Without Coverage |
| Under 6 Years | 325 (100.0%) | 0 (0.0%) |
| 6 to 18 Years | 680 (100.0%) | 0 (0.0%) |
| 19 to 25 Years | 610 (98.7%) | 8 (1.3%) |
| 26 to 34 Years | 1,121 (88.3%) | 148 (11.7%) |
| 35 to 44 Years | 540 (85.7%) | 90 (14.3%) |
| 45 to 54 Years | 768 (100.0%) | 0 (0.0%) |
| 55 to 64 Years | 722 (83.0%) | 148 (17.0%) |
| 65 to 74 Years | 690 (100.0%) | 0 (0.0%) |
| 75 Years and older | 470 (99.8%) | 1 (0.2%) |
| Total | 5,926 (93.8%) | 395 (6.2%) |
Health Insurance Coverage by Citizenship Status in East Rochester
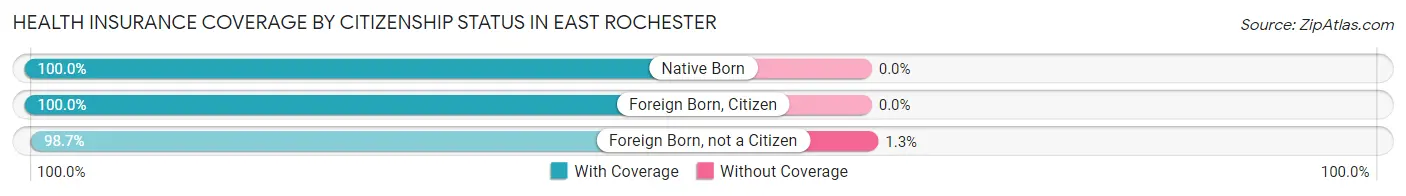
| Citizenship Status | With Coverage | Without Coverage |
| Native Born | 325 (100.0%) | 0 (0.0%) |
| Foreign Born, Citizen | 680 (100.0%) | 0 (0.0%) |
| Foreign Born, not a Citizen | 610 (98.7%) | 8 (1.3%) |
Health Insurance Coverage by Household Income in East Rochester
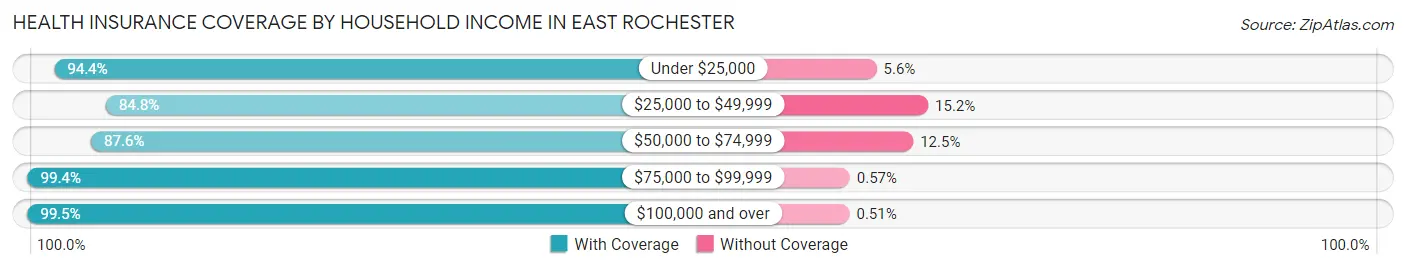
| Household Income | With Coverage | Without Coverage |
| Under $25,000 | 643 (94.4%) | 38 (5.6%) |
| $25,000 to $49,999 | 712 (84.8%) | 128 (15.2%) |
| $50,000 to $74,999 | 1,491 (87.5%) | 212 (12.4%) |
| $75,000 to $99,999 | 1,392 (99.4%) | 8 (0.6%) |
| $100,000 and over | 1,575 (99.5%) | 8 (0.5%) |
Public vs Private Health Insurance Coverage by Age in East Rochester
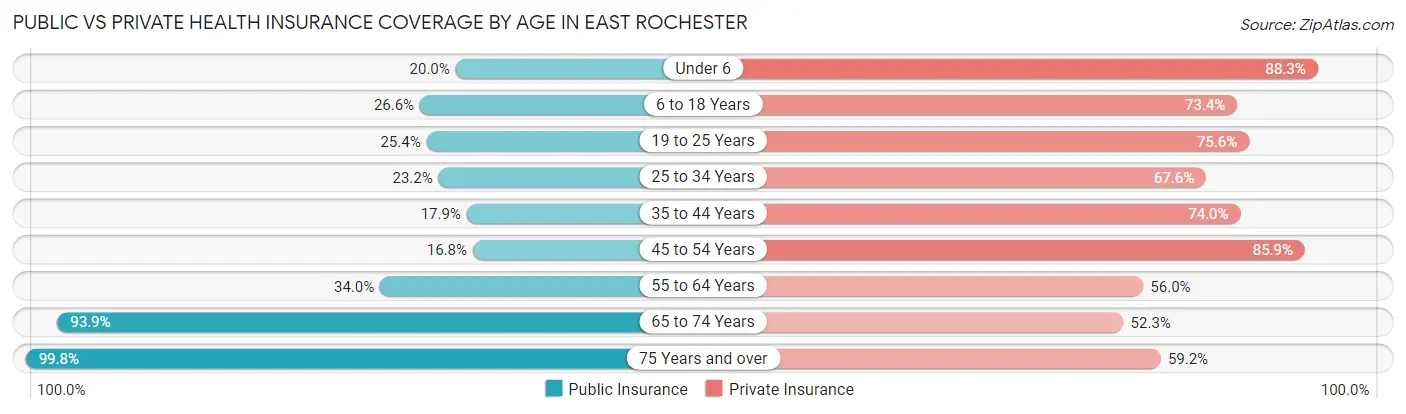
| Age Bracket | Public Insurance | Private Insurance |
| Under 6 | 65 (20.0%) | 287 (88.3%) |
| 6 to 18 Years | 181 (26.6%) | 499 (73.4%) |
| 19 to 25 Years | 157 (25.4%) | 467 (75.6%) |
| 25 to 34 Years | 294 (23.2%) | 858 (67.6%) |
| 35 to 44 Years | 113 (17.9%) | 466 (74.0%) |
| 45 to 54 Years | 129 (16.8%) | 660 (85.9%) |
| 55 to 64 Years | 296 (34.0%) | 487 (56.0%) |
| 65 to 74 Years | 648 (93.9%) | 361 (52.3%) |
| 75 Years and over | 470 (99.8%) | 279 (59.2%) |
| Total | 2,353 (37.2%) | 4,364 (69.0%) |
Disability Status by Sex by Age in East Rochester
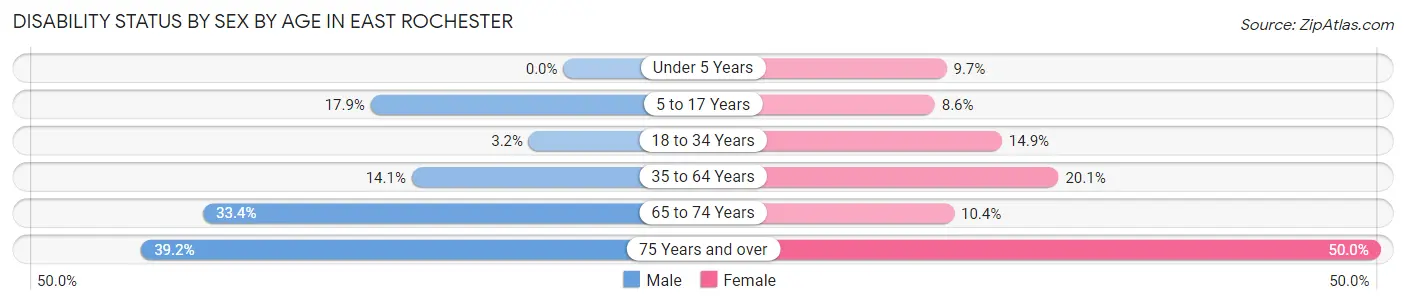
| Age Bracket | Male | Female |
| Under 5 Years | 0 (0.0%) | 14 (9.7%) |
| 5 to 17 Years | 69 (17.9%) | 27 (8.6%) |
| 18 to 34 Years | 32 (3.2%) | 137 (14.9%) |
| 35 to 64 Years | 168 (14.1%) | 216 (20.1%) |
| 65 to 74 Years | 112 (33.4%) | 37 (10.4%) |
| 75 Years and over | 85 (39.2%) | 127 (50.0%) |
Disability Class by Sex by Age in East Rochester
Disability Class: Hearing Difficulty
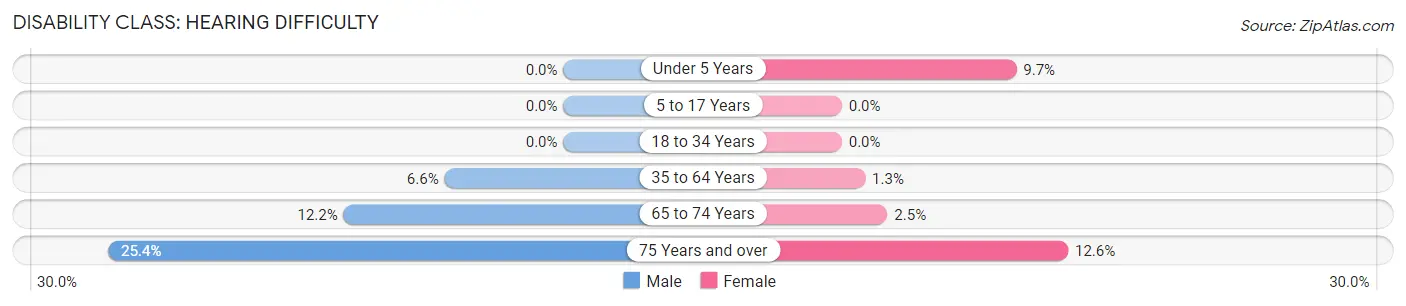
| Age Bracket | Male | Female |
| Under 5 Years | 0 (0.0%) | 14 (9.7%) |
| 5 to 17 Years | 0 (0.0%) | 0 (0.0%) |
| 18 to 34 Years | 0 (0.0%) | 0 (0.0%) |
| 35 to 64 Years | 79 (6.6%) | 14 (1.3%) |
| 65 to 74 Years | 41 (12.2%) | 9 (2.5%) |
| 75 Years and over | 55 (25.4%) | 32 (12.6%) |
Disability Class: Vision Difficulty
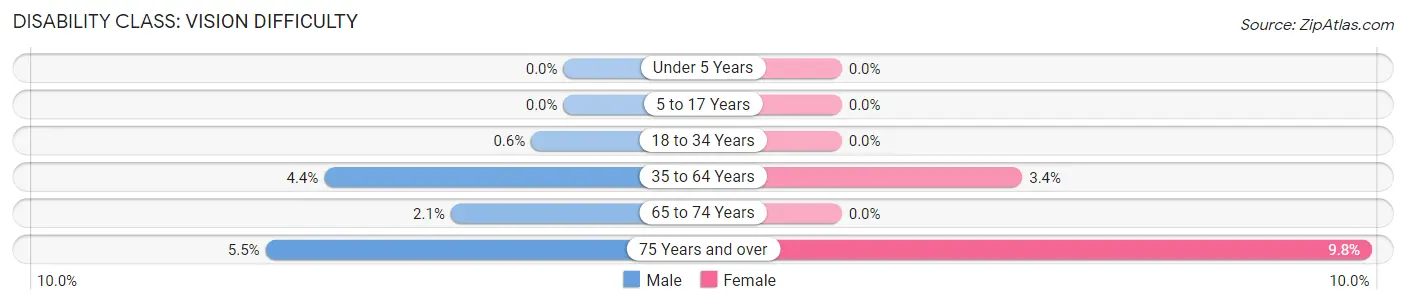
| Age Bracket | Male | Female |
| Under 5 Years | 0 (0.0%) | 0 (0.0%) |
| 5 to 17 Years | 0 (0.0%) | 0 (0.0%) |
| 18 to 34 Years | 6 (0.6%) | 0 (0.0%) |
| 35 to 64 Years | 53 (4.4%) | 36 (3.4%) |
| 65 to 74 Years | 7 (2.1%) | 0 (0.0%) |
| 75 Years and over | 12 (5.5%) | 25 (9.8%) |
Disability Class: Cognitive Difficulty
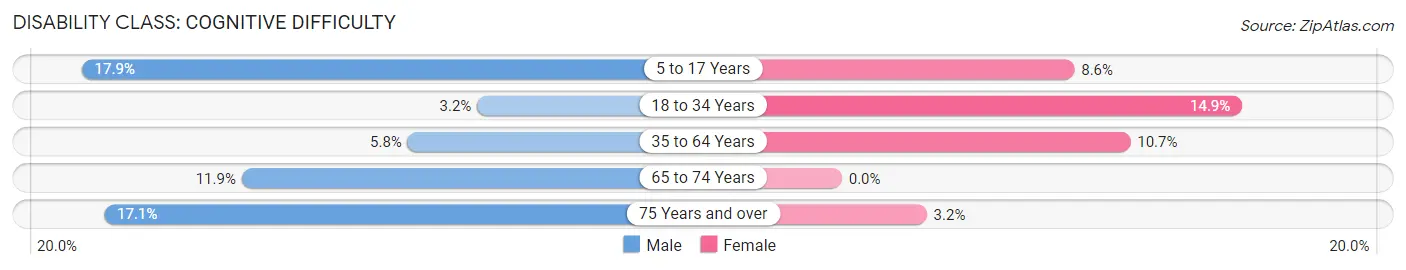
| Age Bracket | Male | Female |
| 5 to 17 Years | 69 (17.9%) | 27 (8.6%) |
| 18 to 34 Years | 32 (3.2%) | 137 (14.9%) |
| 35 to 64 Years | 69 (5.8%) | 115 (10.7%) |
| 65 to 74 Years | 40 (11.9%) | 0 (0.0%) |
| 75 Years and over | 37 (17.1%) | 8 (3.2%) |
Disability Class: Ambulatory Difficulty
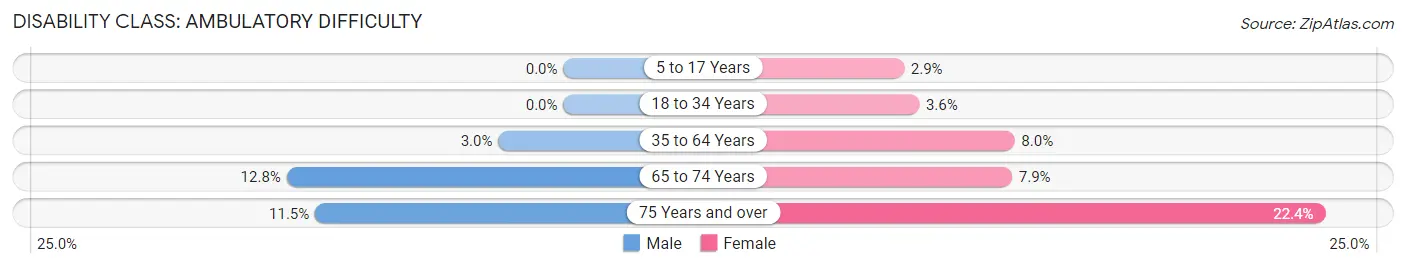
| Age Bracket | Male | Female |
| 5 to 17 Years | 0 (0.0%) | 9 (2.9%) |
| 18 to 34 Years | 0 (0.0%) | 33 (3.6%) |
| 35 to 64 Years | 36 (3.0%) | 86 (8.0%) |
| 65 to 74 Years | 43 (12.8%) | 28 (7.9%) |
| 75 Years and over | 25 (11.5%) | 57 (22.4%) |
Disability Class: Self-Care Difficulty
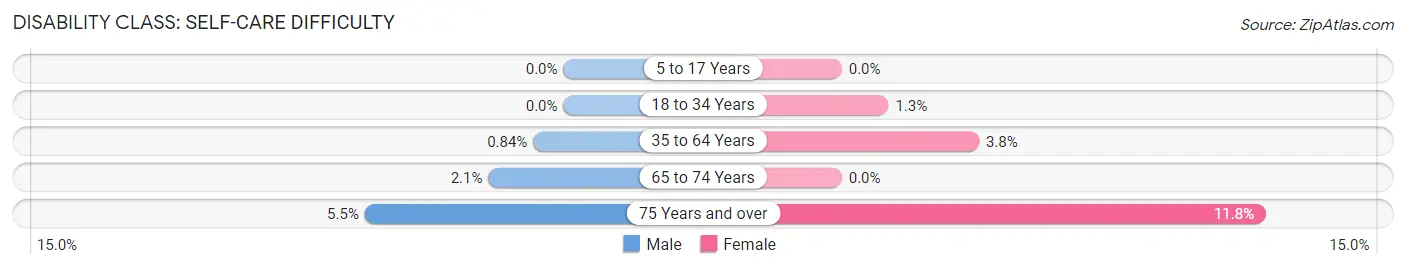
| Age Bracket | Male | Female |
| 5 to 17 Years | 0 (0.0%) | 0 (0.0%) |
| 18 to 34 Years | 0 (0.0%) | 12 (1.3%) |
| 35 to 64 Years | 10 (0.8%) | 41 (3.8%) |
| 65 to 74 Years | 7 (2.1%) | 0 (0.0%) |
| 75 Years and over | 12 (5.5%) | 30 (11.8%) |
Technology Access in East Rochester
Computing Device Access in East Rochester
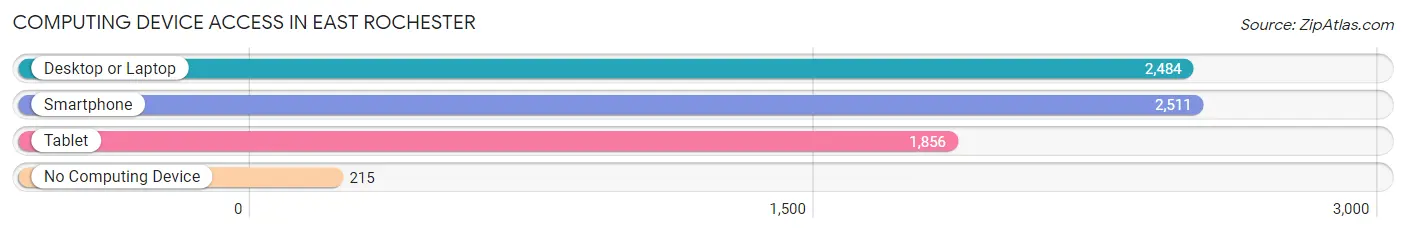
| Device Type | # Households | % Households |
| Desktop or Laptop | 2,484 | 85.1% |
| Smartphone | 2,511 | 86.0% |
| Tablet | 1,856 | 63.6% |
| No Computing Device | 215 | 7.4% |
| Total | 2,919 | 100.0% |
Internet Access in East Rochester
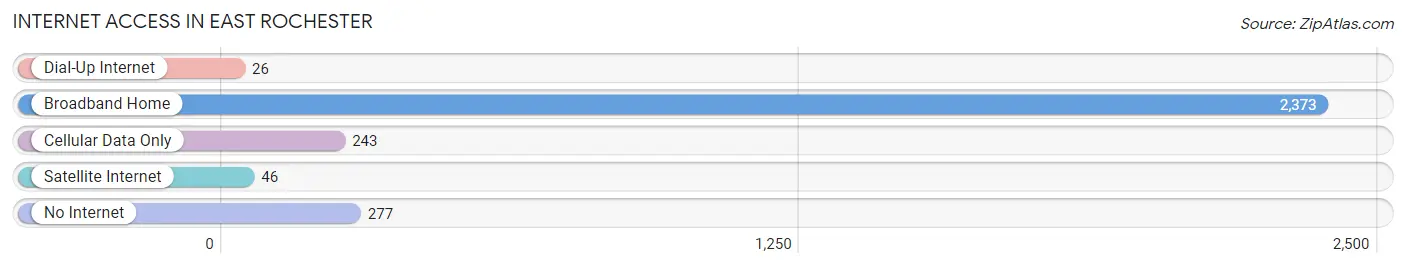
| Internet Type | # Households | % Households |
| Dial-Up Internet | 26 | 0.9% |
| Broadband Home | 2,373 | 81.3% |
| Cellular Data Only | 243 | 8.3% |
| Satellite Internet | 46 | 1.6% |
| No Internet | 277 | 9.5% |
| Total | 2,919 | 100.0% |
East Rochester Summary
History
East Rochester, New York is a small village located in Monroe County, New York. It is located just east of the city of Rochester and is part of the Rochester Metropolitan Statistical Area. The village was first settled in 1803 and was incorporated in 1867.
The village of East Rochester was originally part of the town of Pittsford, which was established in 1789. The area was first settled by a group of Quakers from Pennsylvania who were looking for a place to practice their religion without persecution. The Quakers built a meeting house in 1803 and the village of East Rochester was officially established.
The village grew slowly over the next few decades, but it was not until the mid-1800s that it began to experience significant growth. This was due to the construction of the Erie Canal, which ran through the village and provided a convenient transportation route for goods and people. The canal also helped to spur the development of industry in the area, including flour mills, sawmills, and other manufacturing businesses.
The village continued to grow throughout the late 19th and early 20th centuries, and by the 1950s it had become a thriving community. The village was home to a variety of businesses, including a movie theater, a bowling alley, and a variety of shops and restaurants.
Geography
East Rochester is located in Monroe County, New York, just east of the city of Rochester. It is part of the Rochester Metropolitan Statistical Area. The village is situated on the Genesee River and is bordered by the towns of Pittsford, Brighton, and Penfield.
The village covers an area of 1.3 square miles and has a population of approximately 6,000 people. The terrain is mostly flat, with some rolling hills in the northern part of the village. The climate is humid continental, with cold winters and hot, humid summers.
Economy
The economy of East Rochester is largely based on the service industry. The village is home to a variety of businesses, including restaurants, retail stores, and professional services. The village is also home to a number of manufacturing businesses, including a paper mill, a printing company, and a plastics manufacturer.
The village is also home to a number of educational institutions, including the East Rochester Union Free School District, which serves the village and the surrounding area. The district includes four elementary schools, one middle school, and one high school.
Demographics
As of the 2010 census, the population of East Rochester was 6,082. The racial makeup of the village was 94.3% White, 1.7% African American, 0.3% Native American, 1.2% Asian, 0.1% Pacific Islander, 0.7% from other races, and 1.9% from two or more races. Hispanic or Latino of any race were 3.2% of the population.
The median household income in East Rochester was $50,945, and the median family income was $60,945. The per capita income was $25,945. About 5.3% of families and 7.2% of the population were below the poverty line, including 8.3% of those under age 18 and 4.2% of those age 65 or over.
Common Questions
What is Per Capita Income in East Rochester?
Per Capita income in East Rochester is $32,958.
What is the Median Family Income in East Rochester?
Median Family Income in East Rochester is $73,245.
What is the Median Household income in East Rochester?
Median Household Income in East Rochester is $65,134.
What is Income or Wage Gap in East Rochester?
Income or Wage Gap in East Rochester is 12.8%.
Women in East Rochester earn 87.2 cents for every dollar earned by a man.
What is Inequality or Gini Index in East Rochester?
Inequality or Gini Index in East Rochester is 0.33.
What is the Total Population of East Rochester?
Total Population of East Rochester is 6,321.
What is the Total Male Population of East Rochester?
Total Male Population of East Rochester is 3,259.
What is the Total Female Population of East Rochester?
Total Female Population of East Rochester is 3,062.
What is the Ratio of Males per 100 Females in East Rochester?
There are 106.43 Males per 100 Females in East Rochester.
What is the Ratio of Females per 100 Males in East Rochester?
There are 93.96 Females per 100 Males in East Rochester.
What is the Median Population Age in East Rochester?
Median Population Age in East Rochester is 40.0 Years.
What is the Average Family Size in East Rochester
Average Family Size in East Rochester is 2.8 People.
What is the Average Household Size in East Rochester
Average Household Size in East Rochester is 2.1 People.
How Large is the Labor Force in East Rochester?
There are 3,696 People in the Labor Forcein in East Rochester.
What is the Percentage of People in the Labor Force in East Rochester?
68.0% of People are in the Labor Force in East Rochester.
What is the Unemployment Rate in East Rochester?
Unemployment Rate in East Rochester is 6.8%.