Franklinville, NY Map & Demographics
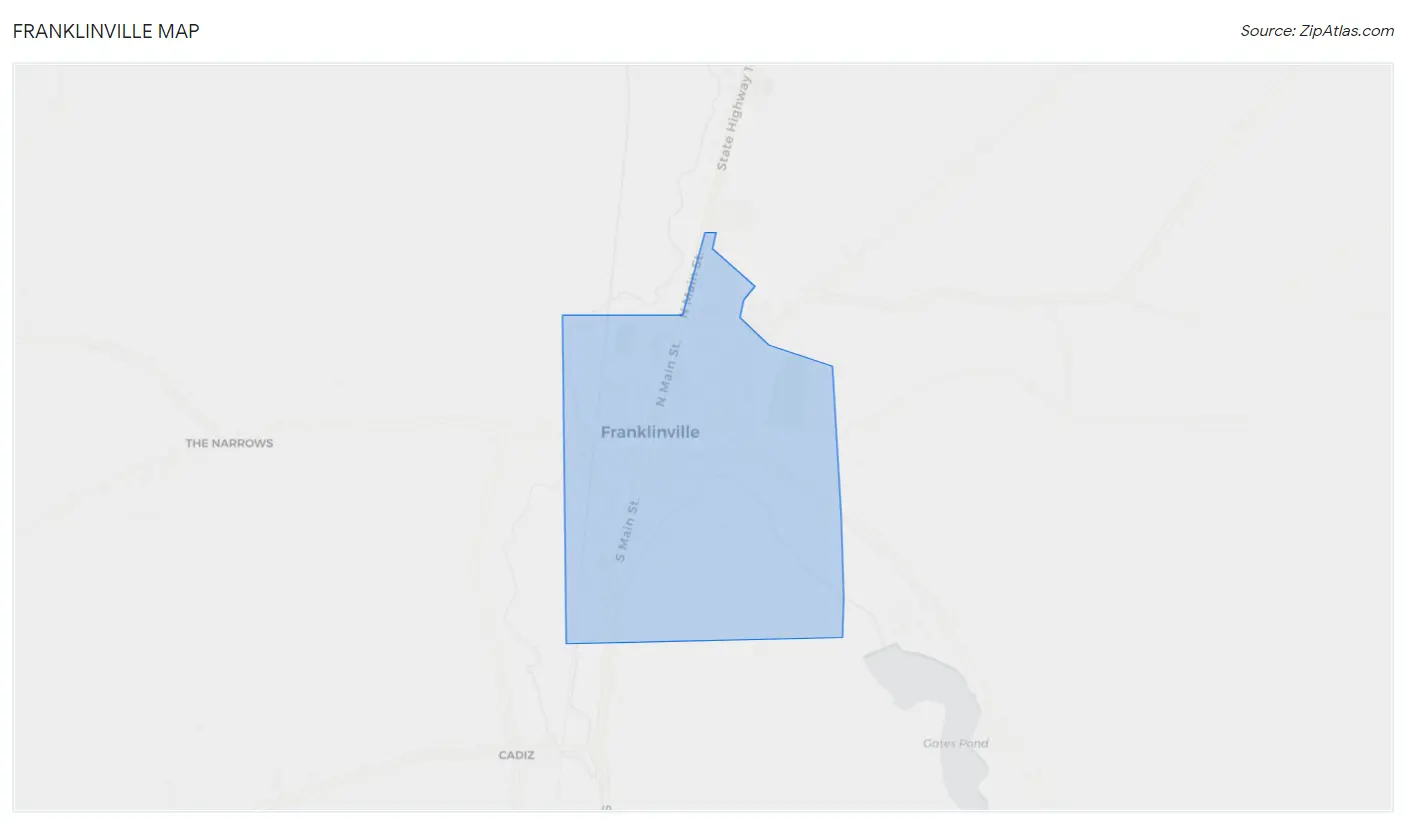
Franklinville Map
Franklinville Overview
$26,813
PER CAPITA INCOME
$82,500
AVG FAMILY INCOME
$68,438
AVG HOUSEHOLD INCOME
41.9%
WAGE / INCOME GAP [ % ]
58.1¢/ $1
WAGE / INCOME GAP [ $ ]
0.38
INEQUALITY / GINI INDEX
2,035
TOTAL POPULATION
959
MALE POPULATION
1,076
FEMALE POPULATION
89.13
MALES / 100 FEMALES
112.20
FEMALES / 100 MALES
35.7
MEDIAN AGE
3.3
AVG FAMILY SIZE
2.8
AVG HOUSEHOLD SIZE
984
LABOR FORCE [ PEOPLE ]
65.8%
PERCENT IN LABOR FORCE
6.3%
UNEMPLOYMENT RATE
Franklinville Zip Codes
Income in Franklinville
Income Overview in Franklinville
Per Capita Income in Franklinville is $26,813, while median incomes of families and households are $82,500 and $68,438 respectively.
| Characteristic | Number | Measure |
| Per Capita Income | 2,035 | $26,813 |
| Median Family Income | 522 | $82,500 |
| Mean Family Income | 522 | $87,303 |
| Median Household Income | 709 | $68,438 |
| Mean Household Income | 709 | $77,532 |
| Income Deficit | 522 | $0 |
| Wage / Income Gap (%) | 2,035 | 41.91% |
| Wage / Income Gap ($) | 2,035 | 58.09¢ per $1 |
| Gini / Inequality Index | 2,035 | 0.38 |
Earnings by Sex in Franklinville
Average Earnings in Franklinville are $33,844, $39,400 for men and $22,888 for women, a difference of 41.9%.
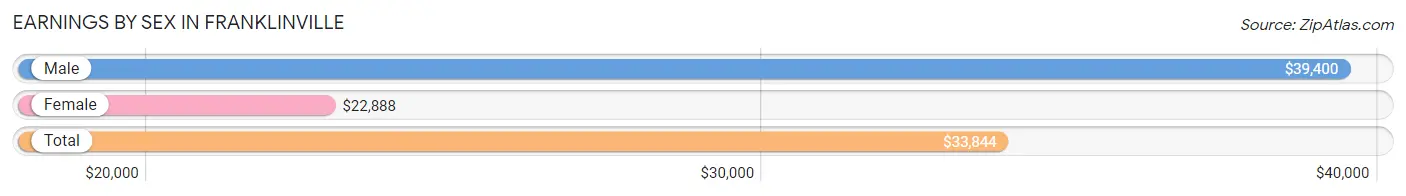
| Sex | Number | Average Earnings |
| Male | 560 (53.5%) | $39,400 |
| Female | 487 (46.5%) | $22,888 |
| Total | 1,047 (100.0%) | $33,844 |
Earnings by Sex by Income Bracket in Franklinville
The most common earnings brackets in Franklinville are $40,000 to $44,999 for men (65 | 11.6%) and $10,000 to $12,499 for women (59 | 12.1%).
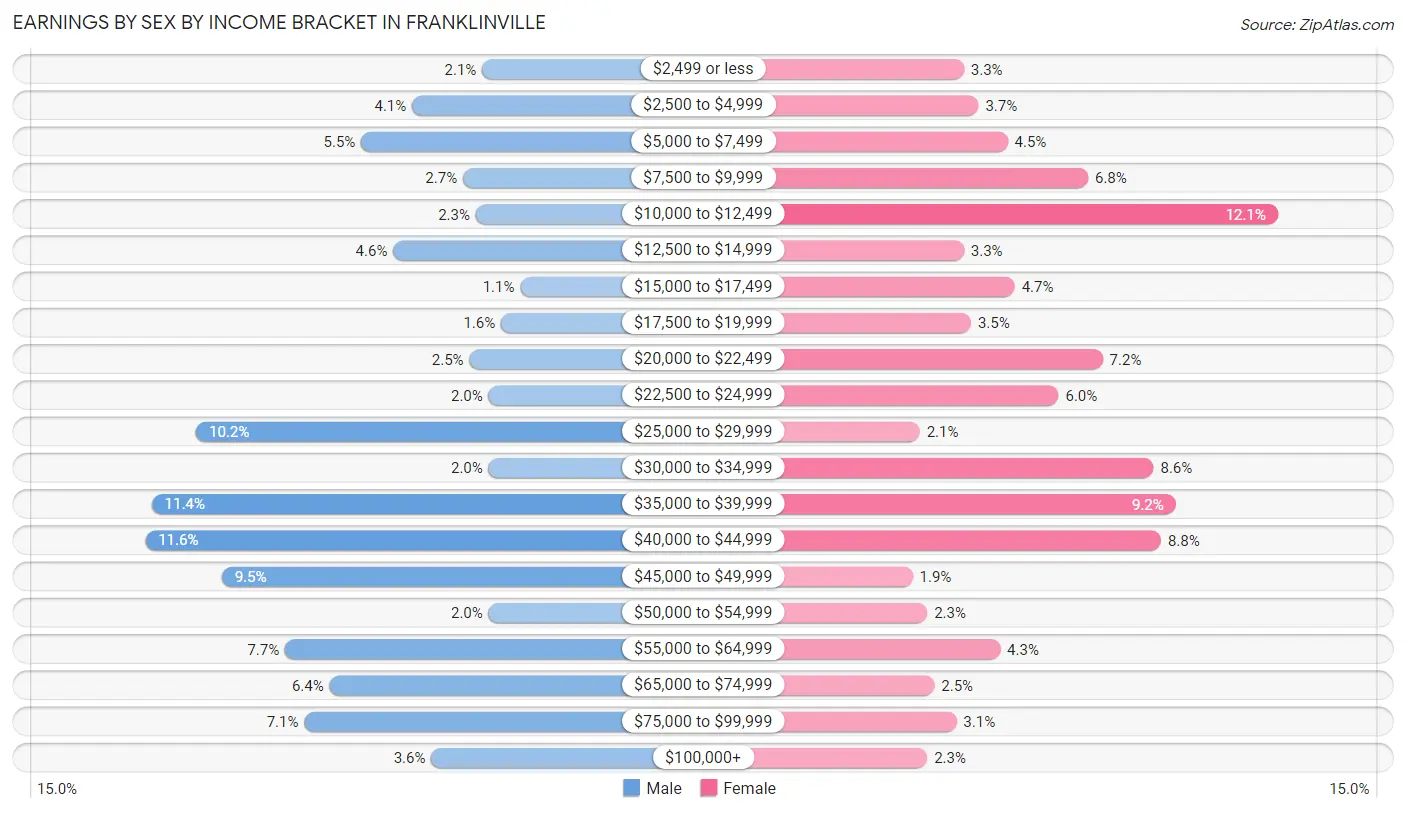
| Income | Male | Female |
| $2,499 or less | 12 (2.1%) | 16 (3.3%) |
| $2,500 to $4,999 | 23 (4.1%) | 18 (3.7%) |
| $5,000 to $7,499 | 31 (5.5%) | 22 (4.5%) |
| $7,500 to $9,999 | 15 (2.7%) | 33 (6.8%) |
| $10,000 to $12,499 | 13 (2.3%) | 59 (12.1%) |
| $12,500 to $14,999 | 26 (4.6%) | 16 (3.3%) |
| $15,000 to $17,499 | 6 (1.1%) | 23 (4.7%) |
| $17,500 to $19,999 | 9 (1.6%) | 17 (3.5%) |
| $20,000 to $22,499 | 14 (2.5%) | 35 (7.2%) |
| $22,500 to $24,999 | 11 (2.0%) | 29 (5.9%) |
| $25,000 to $29,999 | 57 (10.2%) | 10 (2.1%) |
| $30,000 to $34,999 | 11 (2.0%) | 42 (8.6%) |
| $35,000 to $39,999 | 64 (11.4%) | 45 (9.2%) |
| $40,000 to $44,999 | 65 (11.6%) | 43 (8.8%) |
| $45,000 to $49,999 | 53 (9.5%) | 9 (1.8%) |
| $50,000 to $54,999 | 11 (2.0%) | 11 (2.3%) |
| $55,000 to $64,999 | 43 (7.7%) | 21 (4.3%) |
| $65,000 to $74,999 | 36 (6.4%) | 12 (2.5%) |
| $75,000 to $99,999 | 40 (7.1%) | 15 (3.1%) |
| $100,000+ | 20 (3.6%) | 11 (2.3%) |
| Total | 560 (100.0%) | 487 (100.0%) |
Earnings by Sex by Educational Attainment in Franklinville
Average earnings in Franklinville are $41,667 for men and $27,500 for women, a difference of 34.0%. Men with an educational attainment of graduate degree enjoy the highest average annual earnings of $78,393, while those with less than high school education earn the least with $29,750. Women with an educational attainment of graduate degree earn the most with the average annual earnings of $69,000, while those with high school diploma education have the smallest earnings of $15,208.
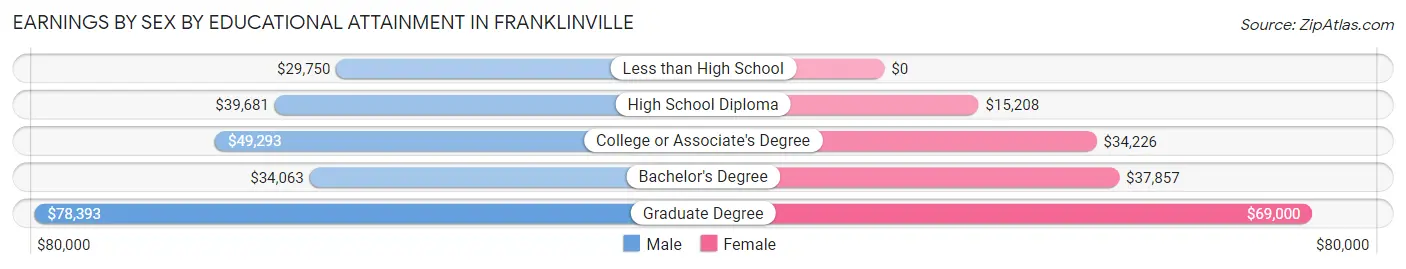
| Educational Attainment | Male Income | Female Income |
| Less than High School | $29,750 | $0 |
| High School Diploma | $39,681 | $15,208 |
| College or Associate's Degree | $49,293 | $34,226 |
| Bachelor's Degree | $34,063 | $37,857 |
| Graduate Degree | $78,393 | $69,000 |
| Total | $41,667 | $27,500 |
Family Income in Franklinville
Family Income Brackets in Franklinville
According to the Franklinville family income data, there are 149 families falling into the $75,000 to $99,999 income range, which is the most common income bracket and makes up 28.5% of all families. Conversely, the less than $10,000 income bracket is the least frequent group with only 10 families (1.9%) belonging to this category.
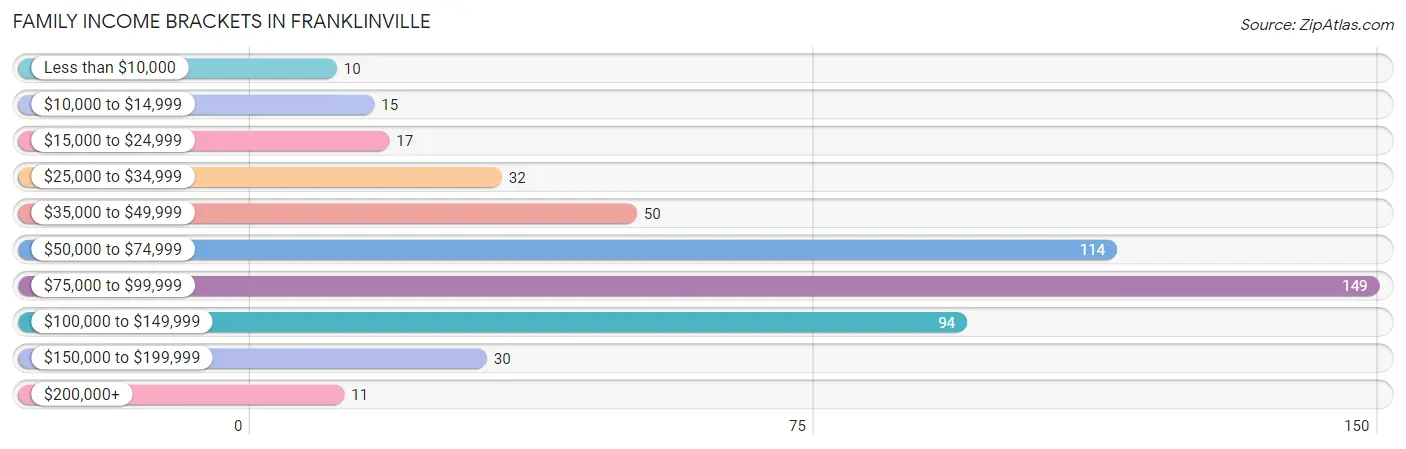
| Income Bracket | # Families | % Families |
| Less than $10,000 | 10 | 1.9% |
| $10,000 to $14,999 | 15 | 2.9% |
| $15,000 to $24,999 | 17 | 3.3% |
| $25,000 to $34,999 | 32 | 6.1% |
| $35,000 to $49,999 | 50 | 9.6% |
| $50,000 to $74,999 | 114 | 21.8% |
| $75,000 to $99,999 | 149 | 28.5% |
| $100,000 to $149,999 | 94 | 18.0% |
| $150,000 to $199,999 | 30 | 5.7% |
| $200,000+ | 11 | 2.1% |
Family Income by Famaliy Size in Franklinville
4-person families (81 | 15.5%) account for the highest median family income in Franklinville with $92,589 per family, while 2-person families (205 | 39.3%) have the highest median income of $36,438 per family member.
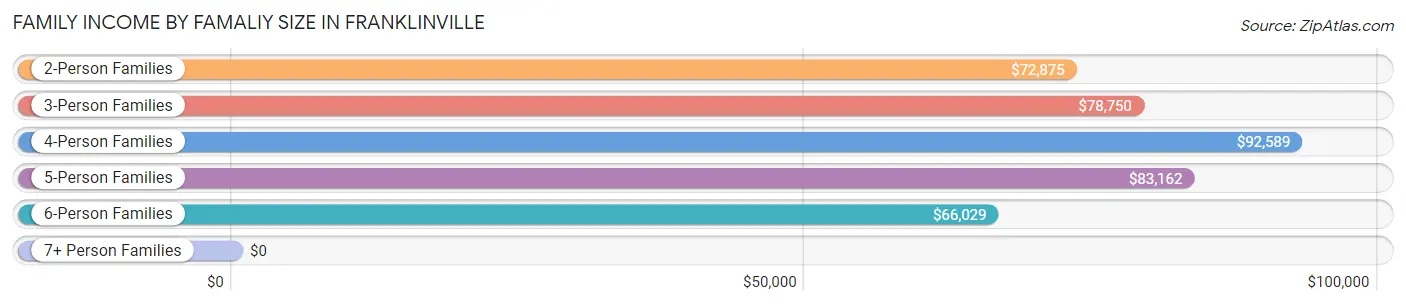
| Income Bracket | # Families | Median Income |
| 2-Person Families | 205 (39.3%) | $72,875 |
| 3-Person Families | 100 (19.2%) | $78,750 |
| 4-Person Families | 81 (15.5%) | $92,589 |
| 5-Person Families | 97 (18.6%) | $83,162 |
| 6-Person Families | 24 (4.6%) | $66,029 |
| 7+ Person Families | 15 (2.9%) | $0 |
| Total | 522 (100.0%) | $82,500 |
Family Income by Number of Earners in Franklinville
The median family income in Franklinville is $82,500, with families comprising 3+ earners (56) having the highest median family income of $111,500, while families with 1 earner (105) have the lowest median family income of $55,417, accounting for 10.7% and 20.1% of families, respectively.
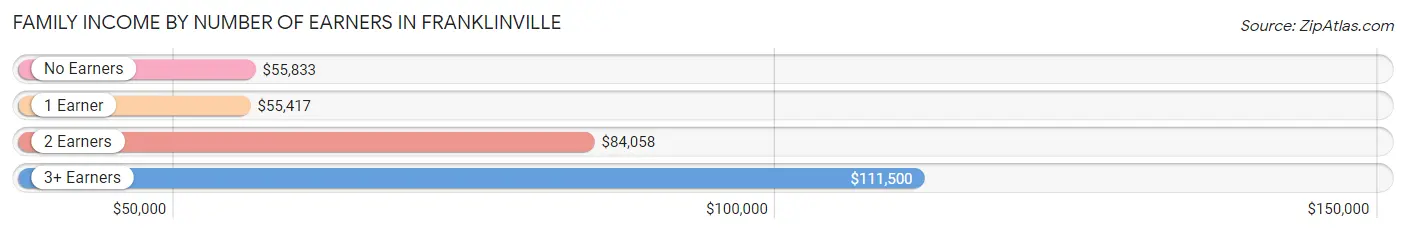
| Number of Earners | # Families | Median Income |
| No Earners | 66 (12.6%) | $55,833 |
| 1 Earner | 105 (20.1%) | $55,417 |
| 2 Earners | 295 (56.5%) | $84,058 |
| 3+ Earners | 56 (10.7%) | $111,500 |
| Total | 522 (100.0%) | $82,500 |
Household Income in Franklinville
Household Income Brackets in Franklinville
With 179 households falling in the category, the $75,000 to $99,999 income range is the most frequent in Franklinville, accounting for 25.3% of all households. In contrast, only 15 households (2.1%) fall into the $200,000+ income bracket, making it the least populous group.
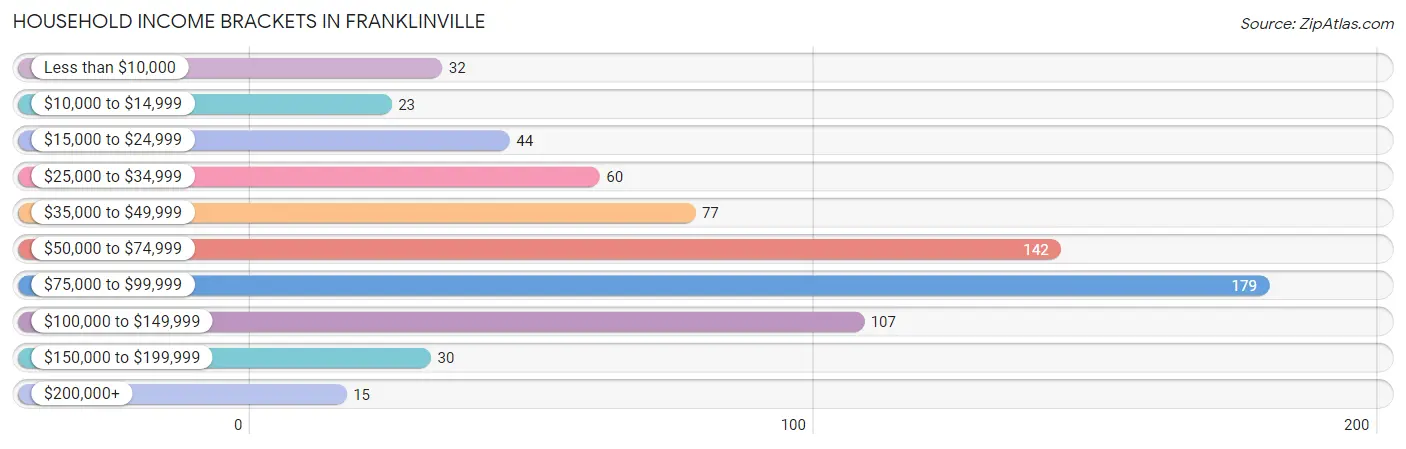
| Income Bracket | # Households | % Households |
| Less than $10,000 | 32 | 4.5% |
| $10,000 to $14,999 | 23 | 3.2% |
| $15,000 to $24,999 | 44 | 6.2% |
| $25,000 to $34,999 | 60 | 8.5% |
| $35,000 to $49,999 | 77 | 10.9% |
| $50,000 to $74,999 | 142 | 20.0% |
| $75,000 to $99,999 | 179 | 25.2% |
| $100,000 to $149,999 | 107 | 15.1% |
| $150,000 to $199,999 | 30 | 4.2% |
| $200,000+ | 15 | 2.1% |
Household Income by Householder Age in Franklinville
The median household income in Franklinville is $68,438, with the highest median household income of $83,448 found in the 25 to 44 years age bracket for the primary householder. A total of 275 households (38.8%) fall into this category. Meanwhile, the 15 to 24 years age bracket for the primary householder has the lowest median household income of $0, with 25 households (3.5%) in this group.
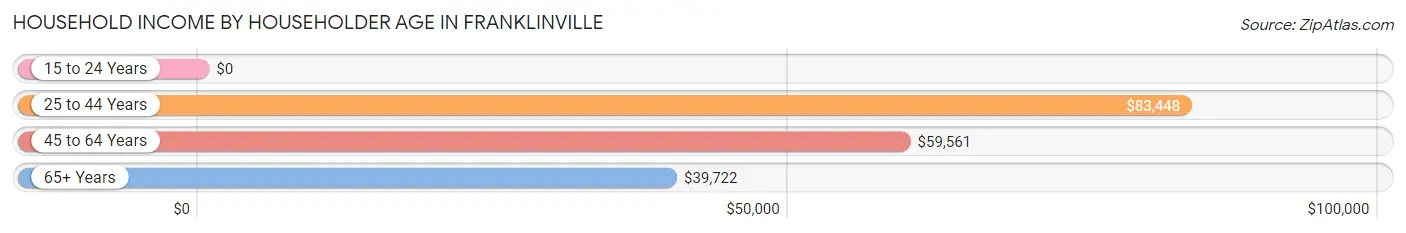
| Income Bracket | # Households | Median Income |
| 15 to 24 Years | 25 (3.5%) | $0 |
| 25 to 44 Years | 275 (38.8%) | $83,448 |
| 45 to 64 Years | 271 (38.2%) | $59,561 |
| 65+ Years | 138 (19.5%) | $39,722 |
| Total | 709 (100.0%) | $68,438 |
Poverty in Franklinville
Income Below Poverty by Sex and Age in Franklinville
With 13.6% poverty level for males and 13.4% for females among the residents of Franklinville, 5 year old males and 15 year old females are the most vulnerable to poverty, with 4 males (36.4%) and 11 females (36.7%) in their respective age groups living below the poverty level.
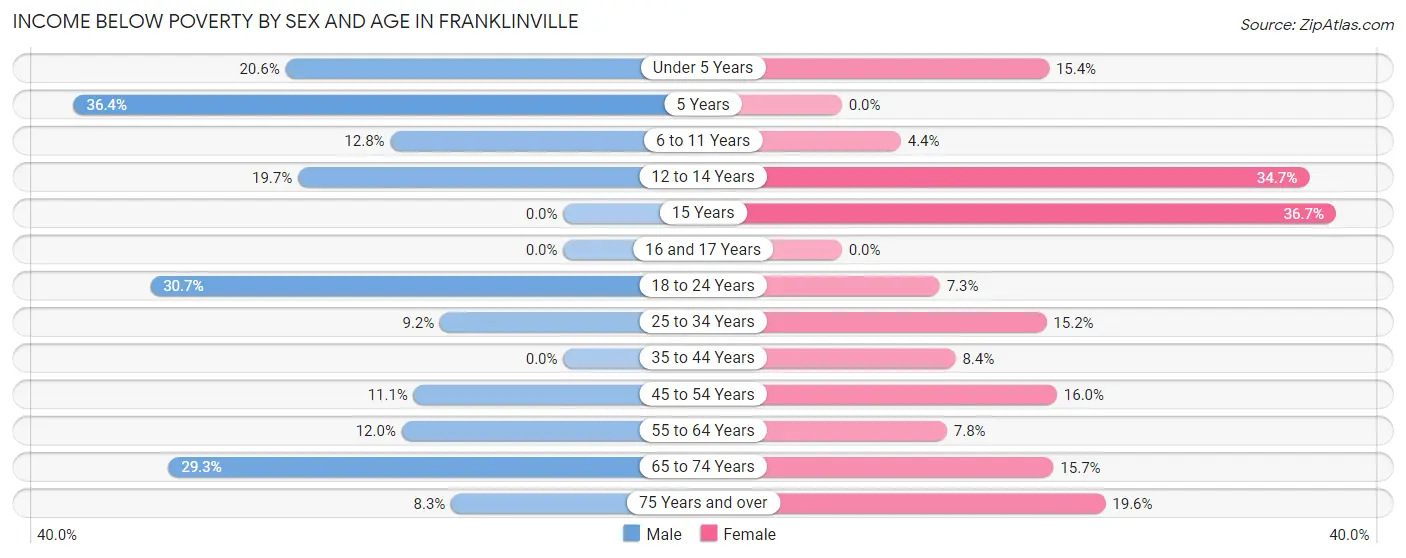
| Age Bracket | Male | Female |
| Under 5 Years | 13 (20.6%) | 10 (15.4%) |
| 5 Years | 4 (36.4%) | 0 (0.0%) |
| 6 to 11 Years | 14 (12.8%) | 6 (4.4%) |
| 12 to 14 Years | 13 (19.7%) | 17 (34.7%) |
| 15 Years | 0 (0.0%) | 11 (36.7%) |
| 16 and 17 Years | 0 (0.0%) | 0 (0.0%) |
| 18 to 24 Years | 23 (30.7%) | 4 (7.3%) |
| 25 to 34 Years | 14 (9.1%) | 24 (15.2%) |
| 35 to 44 Years | 0 (0.0%) | 13 (8.4%) |
| 45 to 54 Years | 12 (11.1%) | 19 (16.0%) |
| 55 to 64 Years | 12 (12.0%) | 11 (7.8%) |
| 65 to 74 Years | 22 (29.3%) | 11 (15.7%) |
| 75 Years and over | 3 (8.3%) | 18 (19.6%) |
| Total | 130 (13.6%) | 144 (13.4%) |
Income Above Poverty by Sex and Age in Franklinville
According to the poverty statistics in Franklinville, males aged 15 years and females aged 5 years are the age groups that are most secure financially, with 100.0% of males and 100.0% of females in these age groups living above the poverty line.
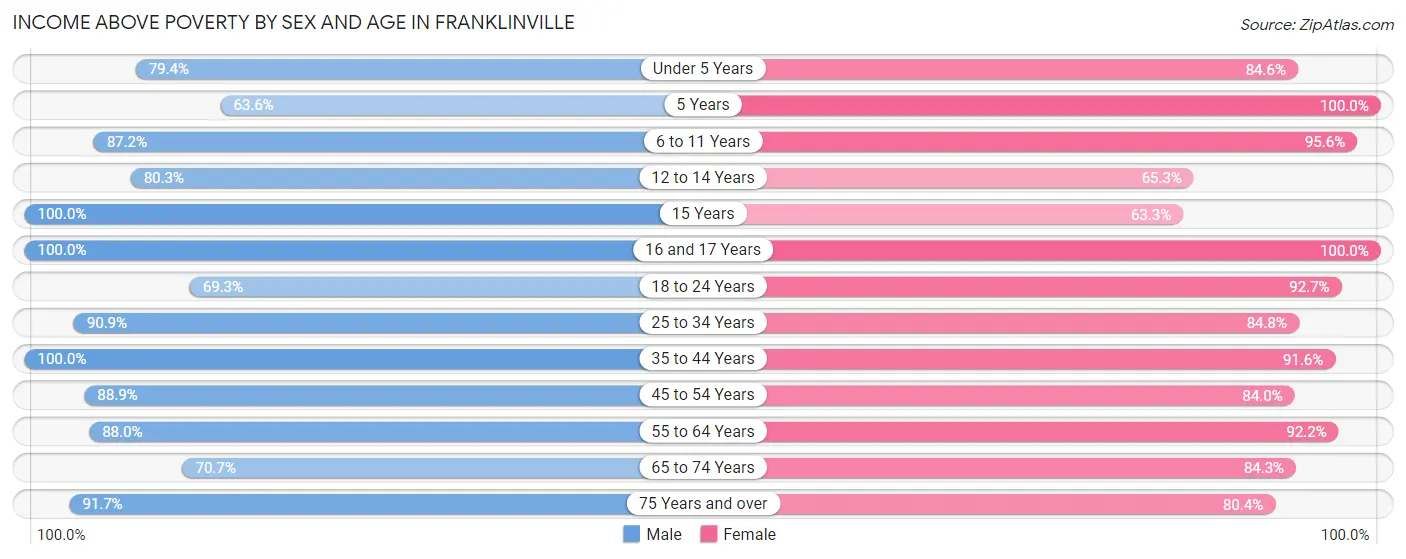
| Age Bracket | Male | Female |
| Under 5 Years | 50 (79.4%) | 55 (84.6%) |
| 5 Years | 7 (63.6%) | 4 (100.0%) |
| 6 to 11 Years | 95 (87.2%) | 131 (95.6%) |
| 12 to 14 Years | 53 (80.3%) | 32 (65.3%) |
| 15 Years | 5 (100.0%) | 19 (63.3%) |
| 16 and 17 Years | 14 (100.0%) | 2 (100.0%) |
| 18 to 24 Years | 52 (69.3%) | 51 (92.7%) |
| 25 to 34 Years | 139 (90.8%) | 134 (84.8%) |
| 35 to 44 Years | 144 (100.0%) | 141 (91.6%) |
| 45 to 54 Years | 96 (88.9%) | 100 (84.0%) |
| 55 to 64 Years | 88 (88.0%) | 130 (92.2%) |
| 65 to 74 Years | 53 (70.7%) | 59 (84.3%) |
| 75 Years and over | 33 (91.7%) | 74 (80.4%) |
| Total | 829 (86.4%) | 932 (86.6%) |
Income Below Poverty Among Married-Couple Families in Franklinville
The poverty statistics for married-couple families in Franklinville show that 7.1% or 30 of the total 422 families live below the poverty line. Families with 3 or 4 children have the highest poverty rate of 26.7%, comprising of 20 families. On the other hand, families with 1 or 2 children have the lowest poverty rate of 1.8%, which includes 3 families.
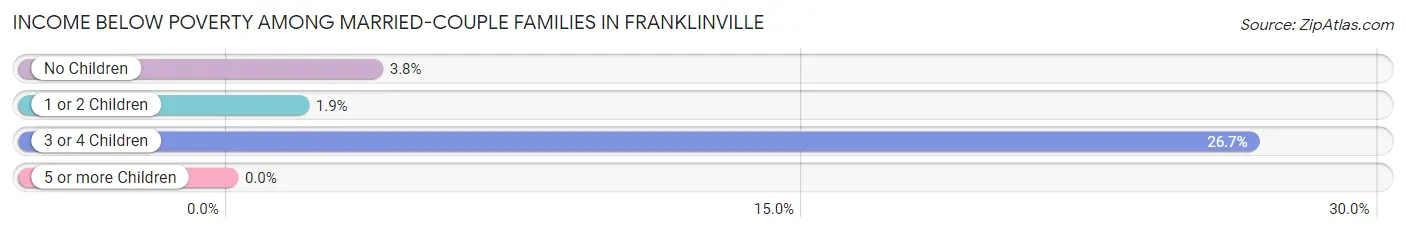
| Children | Above Poverty | Below Poverty |
| No Children | 178 (96.2%) | 7 (3.8%) |
| 1 or 2 Children | 159 (98.2%) | 3 (1.8%) |
| 3 or 4 Children | 55 (73.3%) | 20 (26.7%) |
| 5 or more Children | 0 (0.0%) | 0 (0.0%) |
| Total | 392 (92.9%) | 30 (7.1%) |
Income Below Poverty Among Single-Parent Households in Franklinville
According to the poverty data in Franklinville, 10.0% or 2 single-father households and 30.0% or 24 single-mother households are living below the poverty line. Among single-father households, those with 1 or 2 children have the highest poverty rate, with 2 households (10.0%) experiencing poverty. Likewise, among single-mother households, those with 1 or 2 children have the highest poverty rate, with 17 households (41.5%) falling below the poverty line.
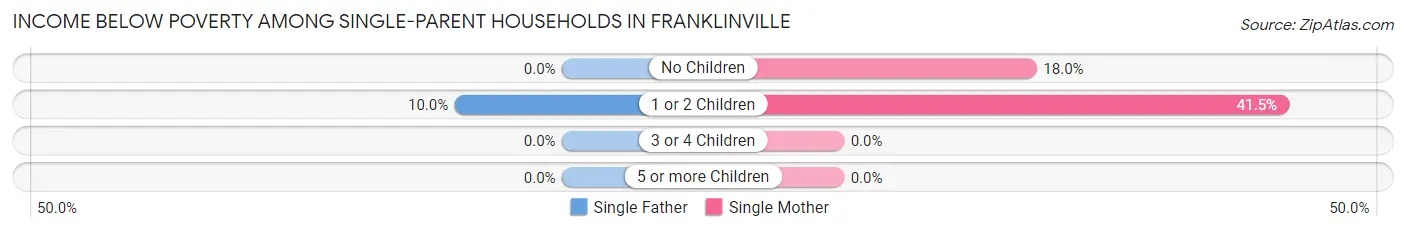
| Children | Single Father | Single Mother |
| No Children | 0 (0.0%) | 7 (17.9%) |
| 1 or 2 Children | 2 (10.0%) | 17 (41.5%) |
| 3 or 4 Children | 0 (0.0%) | 0 (0.0%) |
| 5 or more Children | 0 (0.0%) | 0 (0.0%) |
| Total | 2 (10.0%) | 24 (30.0%) |
Income Below Poverty Among Married-Couple vs Single-Parent Households in Franklinville
The poverty data for Franklinville shows that 30 of the married-couple family households (7.1%) and 26 of the single-parent households (26.0%) are living below the poverty level. Within the married-couple family households, those with 3 or 4 children have the highest poverty rate, with 20 households (26.7%) falling below the poverty line. Among the single-parent households, those with 1 or 2 children have the highest poverty rate, with 19 household (31.1%) living below poverty.
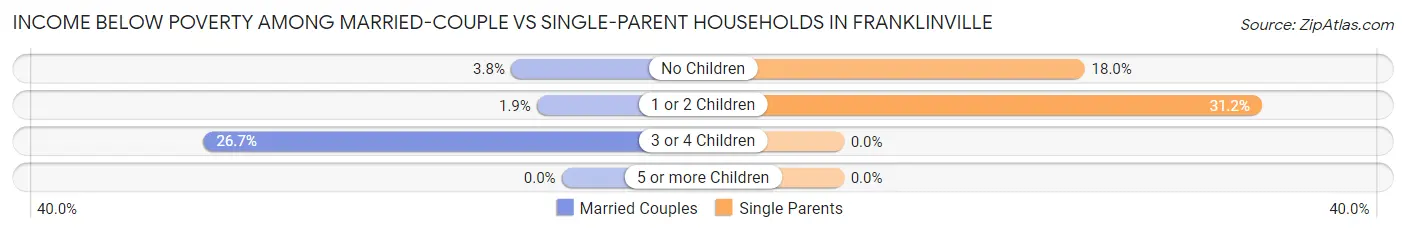
| Children | Married-Couple Families | Single-Parent Households |
| No Children | 7 (3.8%) | 7 (17.9%) |
| 1 or 2 Children | 3 (1.8%) | 19 (31.1%) |
| 3 or 4 Children | 20 (26.7%) | 0 (0.0%) |
| 5 or more Children | 0 (0.0%) | 0 (0.0%) |
| Total | 30 (7.1%) | 26 (26.0%) |
Race in Franklinville
The most populous races in Franklinville are White / Caucasian (1,757 | 86.3%), Two or more Races (233 | 11.5%), and Hispanic or Latino (213 | 10.5%).
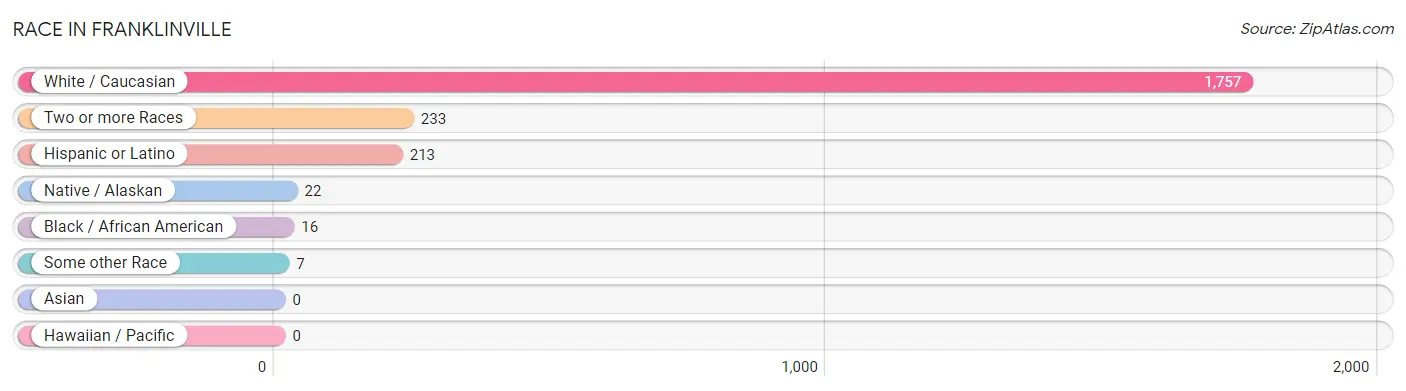
| Race | # Population | % Population |
| Asian | 0 | 0.0% |
| Black / African American | 16 | 0.8% |
| Hawaiian / Pacific | 0 | 0.0% |
| Hispanic or Latino | 213 | 10.5% |
| Native / Alaskan | 22 | 1.1% |
| White / Caucasian | 1,757 | 86.3% |
| Two or more Races | 233 | 11.5% |
| Some other Race | 7 | 0.3% |
| Total | 2,035 | 100.0% |
Ancestry in Franklinville
The most populous ancestries reported in Franklinville are German (533 | 26.2%), English (477 | 23.4%), Irish (300 | 14.7%), Polish (289 | 14.2%), and Mexican (197 | 9.7%), together accounting for 88.3% of all Franklinville residents.
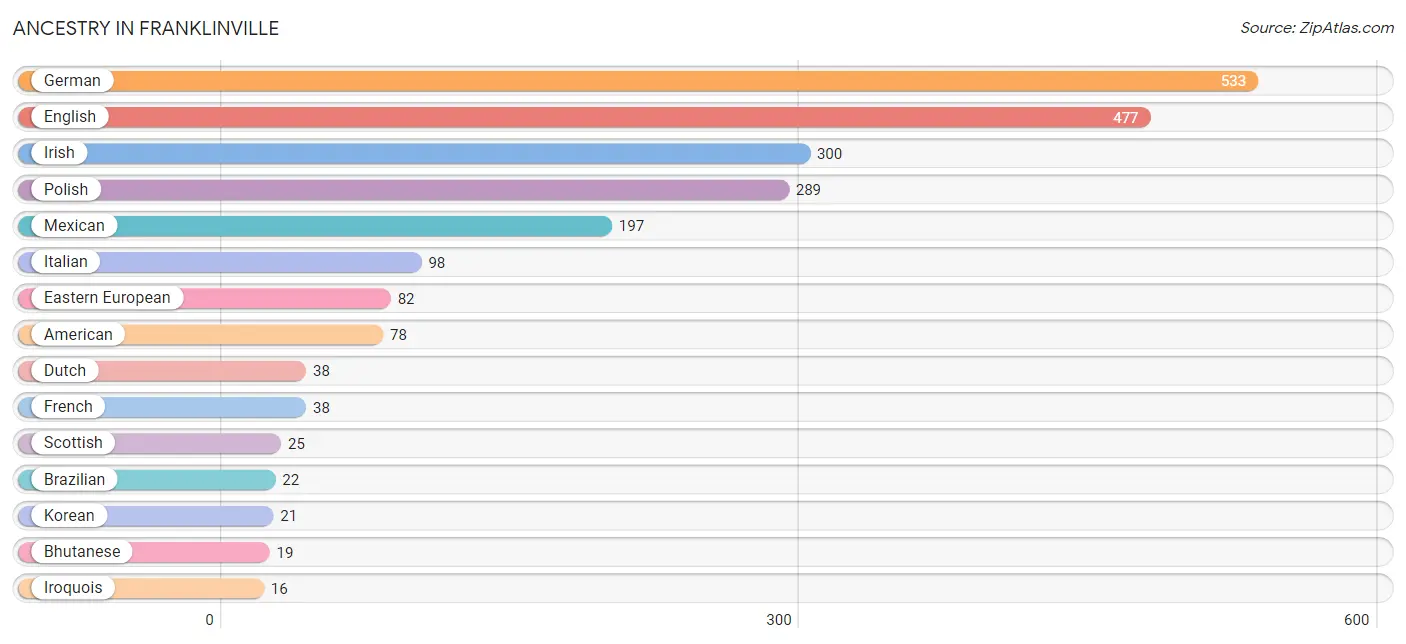
| Ancestry | # Population | % Population |
| American | 78 | 3.8% |
| Bhutanese | 19 | 0.9% |
| Brazilian | 22 | 1.1% |
| British | 10 | 0.5% |
| Central American | 5 | 0.3% |
| Cherokee | 9 | 0.4% |
| Colombian | 7 | 0.3% |
| Costa Rican | 5 | 0.3% |
| Czechoslovakian | 7 | 0.3% |
| Danish | 3 | 0.2% |
| Dutch | 38 | 1.9% |
| Eastern European | 82 | 4.0% |
| English | 477 | 23.4% |
| French | 38 | 1.9% |
| French Canadian | 10 | 0.5% |
| German | 533 | 26.2% |
| Hungarian | 3 | 0.2% |
| Irish | 300 | 14.7% |
| Iroquois | 16 | 0.8% |
| Italian | 98 | 4.8% |
| Korean | 21 | 1.0% |
| Mexican | 197 | 9.7% |
| Native Hawaiian | 13 | 0.6% |
| Northern European | 9 | 0.4% |
| Norwegian | 3 | 0.2% |
| Pennsylvania German | 4 | 0.2% |
| Polish | 289 | 14.2% |
| Puerto Rican | 4 | 0.2% |
| Scotch-Irish | 8 | 0.4% |
| Scottish | 25 | 1.2% |
| South American | 7 | 0.3% |
| Swedish | 14 | 0.7% |
| Welsh | 5 | 0.3% | View All 33 Rows |
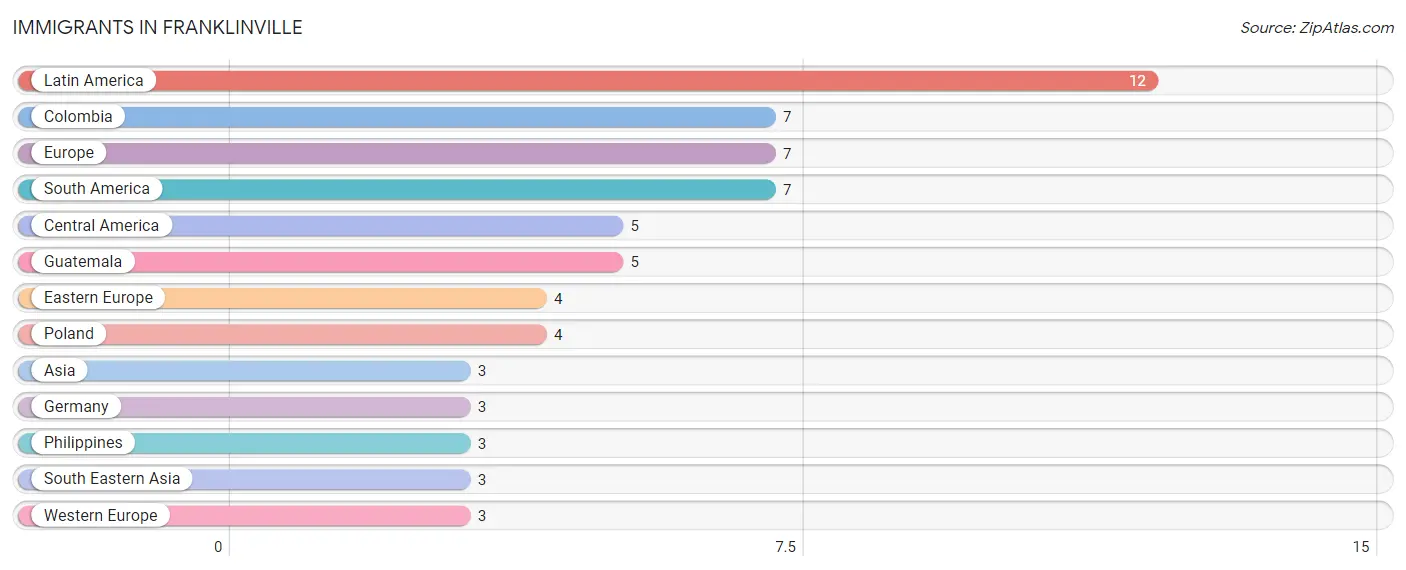
Immigrants in Franklinville
The most numerous immigrant groups reported in Franklinville came from Latin America (12 | 0.6%), Colombia (7 | 0.3%), Europe (7 | 0.3%), South America (7 | 0.3%), and Central America (5 | 0.3%), together accounting for 1.9% of all Franklinville residents.
| Immigration Origin | # Population | % Population |
| Asia | 3 | 0.2% |
| Central America | 5 | 0.3% |
| Colombia | 7 | 0.3% |
| Eastern Europe | 4 | 0.2% |
| Europe | 7 | 0.3% |
| Germany | 3 | 0.2% |
| Guatemala | 5 | 0.3% |
| Latin America | 12 | 0.6% |
| Philippines | 3 | 0.2% |
| Poland | 4 | 0.2% |
| South America | 7 | 0.3% |
| South Eastern Asia | 3 | 0.2% |
| Western Europe | 3 | 0.2% | View All 13 Rows |
Sex and Age in Franklinville
Sex and Age in Franklinville
The most populous age groups in Franklinville are 40 to 44 Years (110 | 11.5%) for men and 40 to 44 Years (114 | 10.6%) for women.
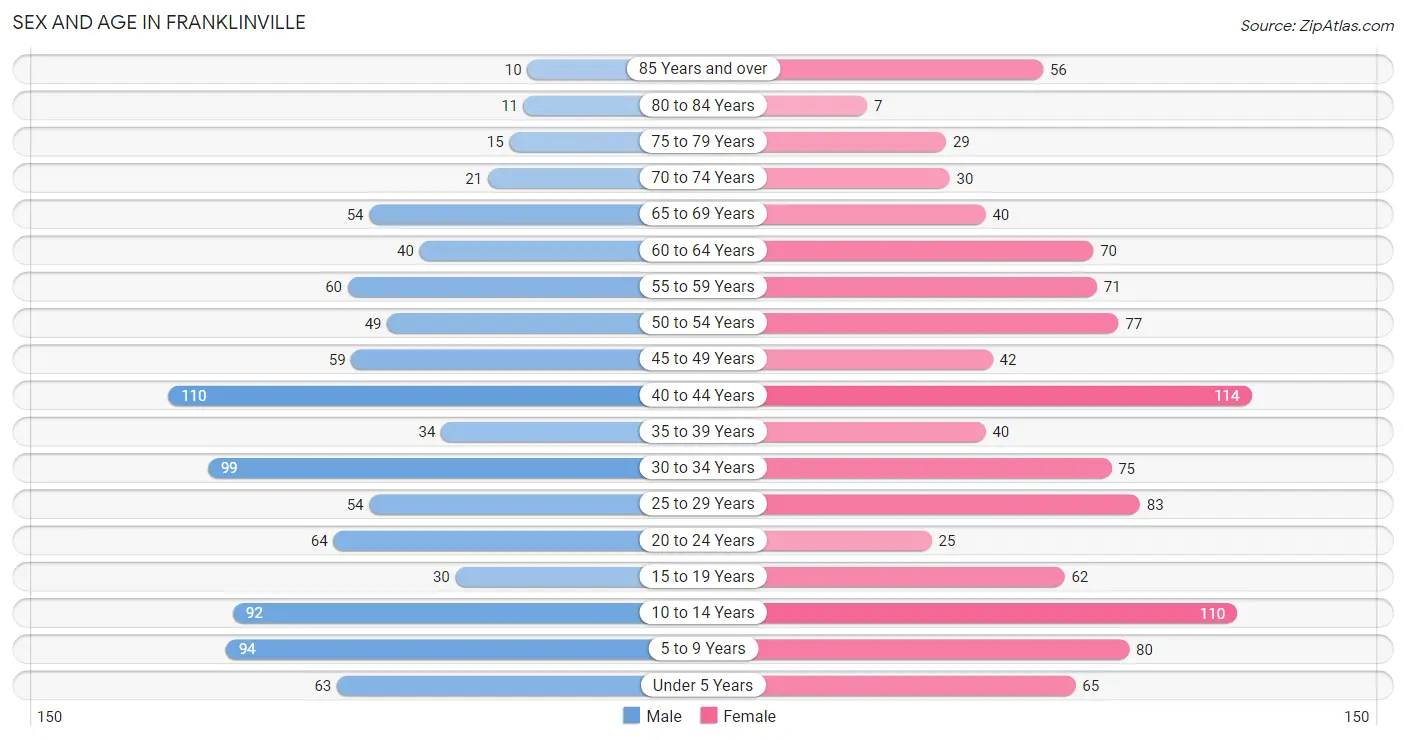
| Age Bracket | Male | Female |
| Under 5 Years | 63 (6.6%) | 65 (6.0%) |
| 5 to 9 Years | 94 (9.8%) | 80 (7.4%) |
| 10 to 14 Years | 92 (9.6%) | 110 (10.2%) |
| 15 to 19 Years | 30 (3.1%) | 62 (5.8%) |
| 20 to 24 Years | 64 (6.7%) | 25 (2.3%) |
| 25 to 29 Years | 54 (5.6%) | 83 (7.7%) |
| 30 to 34 Years | 99 (10.3%) | 75 (7.0%) |
| 35 to 39 Years | 34 (3.5%) | 40 (3.7%) |
| 40 to 44 Years | 110 (11.5%) | 114 (10.6%) |
| 45 to 49 Years | 59 (6.1%) | 42 (3.9%) |
| 50 to 54 Years | 49 (5.1%) | 77 (7.2%) |
| 55 to 59 Years | 60 (6.3%) | 71 (6.6%) |
| 60 to 64 Years | 40 (4.2%) | 70 (6.5%) |
| 65 to 69 Years | 54 (5.6%) | 40 (3.7%) |
| 70 to 74 Years | 21 (2.2%) | 30 (2.8%) |
| 75 to 79 Years | 15 (1.6%) | 29 (2.7%) |
| 80 to 84 Years | 11 (1.1%) | 7 (0.6%) |
| 85 Years and over | 10 (1.0%) | 56 (5.2%) |
| Total | 959 (100.0%) | 1,076 (100.0%) |
Families and Households in Franklinville
Median Family Size in Franklinville
The median family size in Franklinville is 3.30 persons per family, with married-couple families (422 | 80.8%) accounting for the largest median family size of 3.5 persons per family. On the other hand, single female/mother families (80 | 15.3%) represent the smallest median family size with 2.40 persons per family.
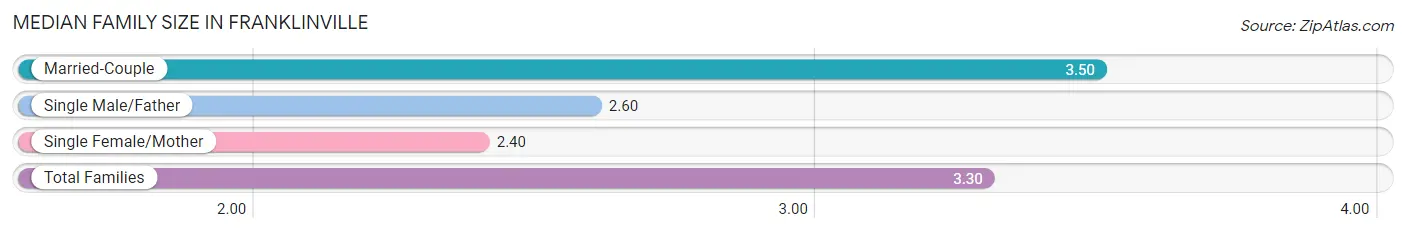
| Family Type | # Families | Family Size |
| Married-Couple | 422 (80.8%) | 3.50 |
| Single Male/Father | 20 (3.8%) | 2.60 |
| Single Female/Mother | 80 (15.3%) | 2.40 |
| Total Families | 522 (100.0%) | 3.30 |
Median Household Size in Franklinville
The median household size in Franklinville is 2.82 persons per household, with married-couple households (422 | 59.5%) accounting for the largest median household size of 3.5 persons per household. non-family households (187 | 26.4%) represent the smallest median household size with 1.27 persons per household.
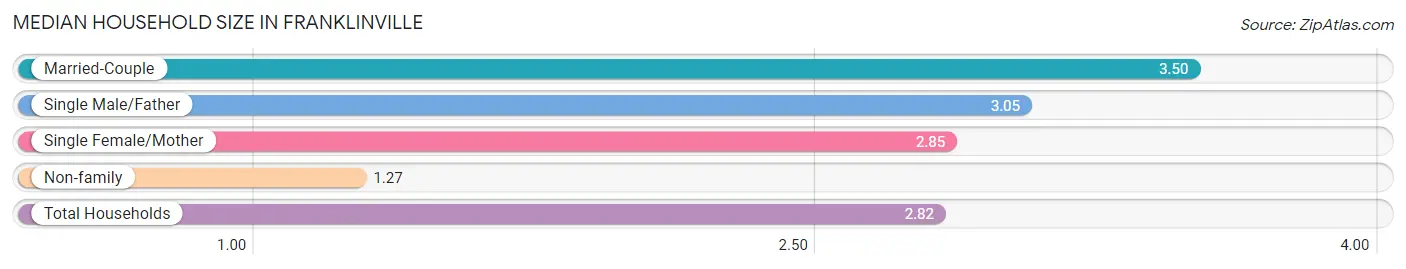
| Household Type | # Households | Household Size |
| Married-Couple | 422 (59.5%) | 3.50 |
| Single Male/Father | 20 (2.8%) | 3.05 |
| Single Female/Mother | 80 (11.3%) | 2.85 |
| Non-family | 187 (26.4%) | 1.27 |
| Total Households | 709 (100.0%) | 2.82 |
Household Size by Marriage Status in Franklinville
Out of a total of 709 households in Franklinville, 522 (73.6%) are family households, while 187 (26.4%) are nonfamily households. The most numerous type of family households are 2-person households, comprising 191, and the most common type of nonfamily households are 1-person households, comprising 128.
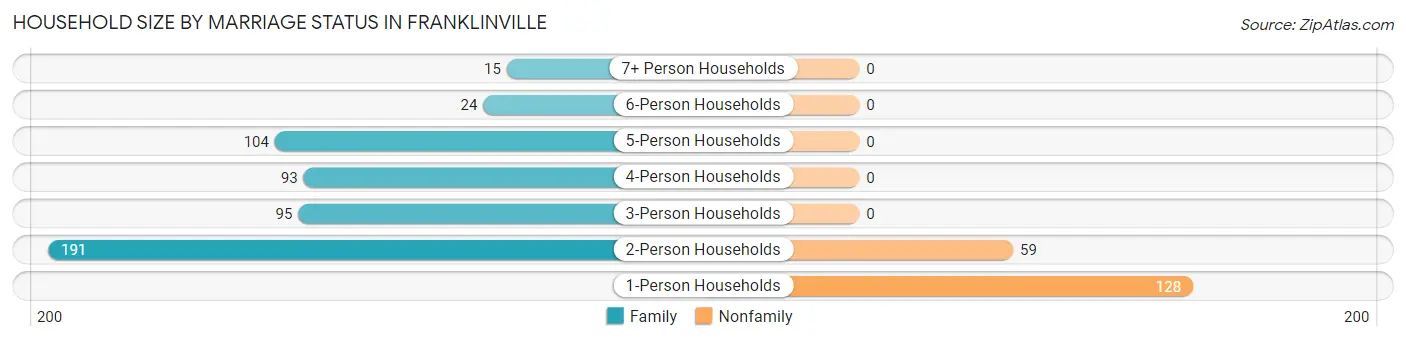
| Household Size | Family Households | Nonfamily Households |
| 1-Person Households | - | 128 (18.0%) |
| 2-Person Households | 191 (26.9%) | 59 (8.3%) |
| 3-Person Households | 95 (13.4%) | 0 (0.0%) |
| 4-Person Households | 93 (13.1%) | 0 (0.0%) |
| 5-Person Households | 104 (14.7%) | 0 (0.0%) |
| 6-Person Households | 24 (3.4%) | 0 (0.0%) |
| 7+ Person Households | 15 (2.1%) | 0 (0.0%) |
| Total | 522 (73.6%) | 187 (26.4%) |
Female Fertility in Franklinville
Fertility by Age in Franklinville
Average fertility rate in Franklinville is 42.0 births per 1,000 women. Women in the age bracket of 20 to 34 years have the highest fertility rate with 104.0 births per 1,000 women. Women in the age bracket of 20 to 34 years acount for 100.0% of all women with births.
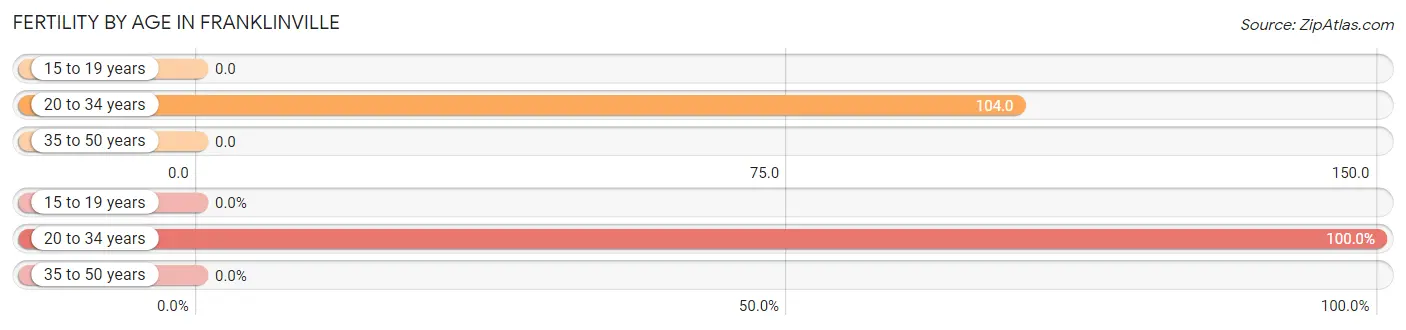
| Age Bracket | Women with Births | Births / 1,000 Women |
| 15 to 19 years | 0 (0.0%) | 0.0 |
| 20 to 34 years | 19 (100.0%) | 104.0 |
| 35 to 50 years | 0 (0.0%) | 0.0 |
| Total | 19 (100.0%) | 42.0 |
Fertility by Age by Marriage Status in Franklinville
26.3% of women with births (19) in Franklinville are married. The highest percentage of unmarried women with births falls into 20 to 34 years age bracket with 73.7% of them unmarried at the time of birth, while the lowest percentage of unmarried women with births belong to 20 to 34 years age bracket with 73.7% of them unmarried.
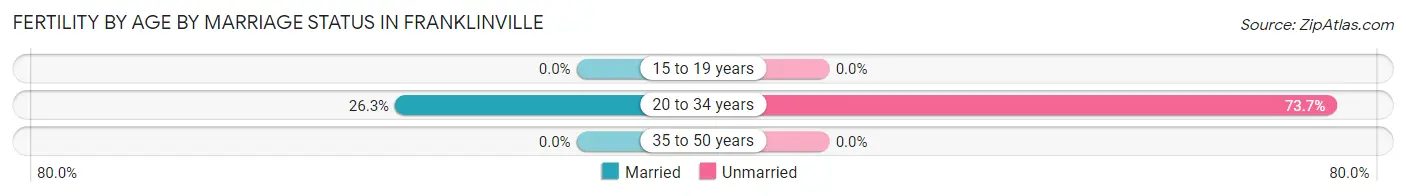
| Age Bracket | Married | Unmarried |
| 15 to 19 years | 0 (0.0%) | 0 (0.0%) |
| 20 to 34 years | 5 (26.3%) | 14 (73.7%) |
| 35 to 50 years | 0 (0.0%) | 0 (0.0%) |
| Total | 5 (26.3%) | 14 (73.7%) |
Fertility by Education in Franklinville
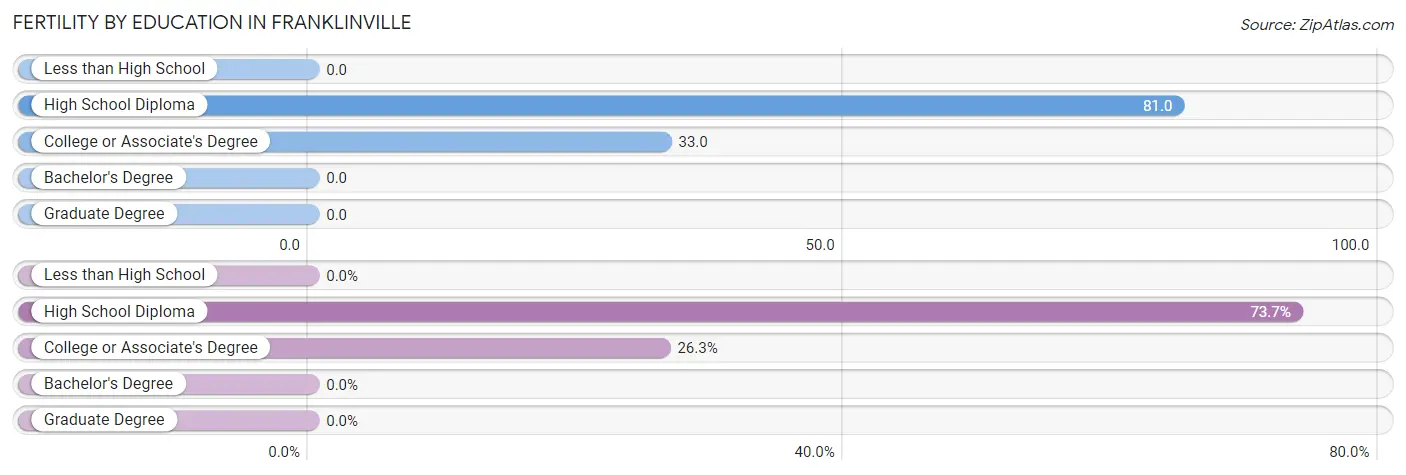
| Educational Attainment | Women with Births | Births / 1,000 Women |
| Less than High School | 0 (0.0%) | 0.0 |
| High School Diploma | 14 (73.7%) | 81.0 |
| College or Associate's Degree | 5 (26.3%) | 33.0 |
| Bachelor's Degree | 0 (0.0%) | 0.0 |
| Graduate Degree | 0 (0.0%) | 0.0 |
| Total | 19 (100.0%) | 42.0 |
Fertility by Education by Marriage Status in Franklinville
73.7% of women with births in Franklinville are unmarried. Women with the educational attainment of college or associate's degree are most likely to be married with 100.0% of them married at childbirth, while women with the educational attainment of high school diploma are least likely to be married with 100.0% of them unmarried at childbirth.
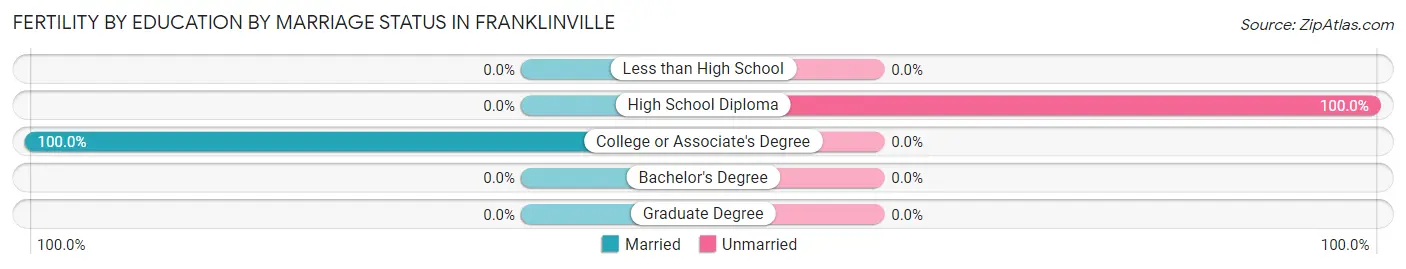
| Educational Attainment | Married | Unmarried |
| Less than High School | 0 (0.0%) | 0 (0.0%) |
| High School Diploma | 0 (0.0%) | 14 (100.0%) |
| College or Associate's Degree | 5 (100.0%) | 0 (0.0%) |
| Bachelor's Degree | 0 (0.0%) | 0 (0.0%) |
| Graduate Degree | 0 (0.0%) | 0 (0.0%) |
| Total | 5 (26.3%) | 14 (73.7%) |
Employment Characteristics in Franklinville
Employment by Class of Employer in Franklinville
Among the 910 employed individuals in Franklinville, private company employees (557 | 61.2%), self-employed (not incorporated) (111 | 12.2%), and local government employees (96 | 10.5%) make up the most common classes of employment.
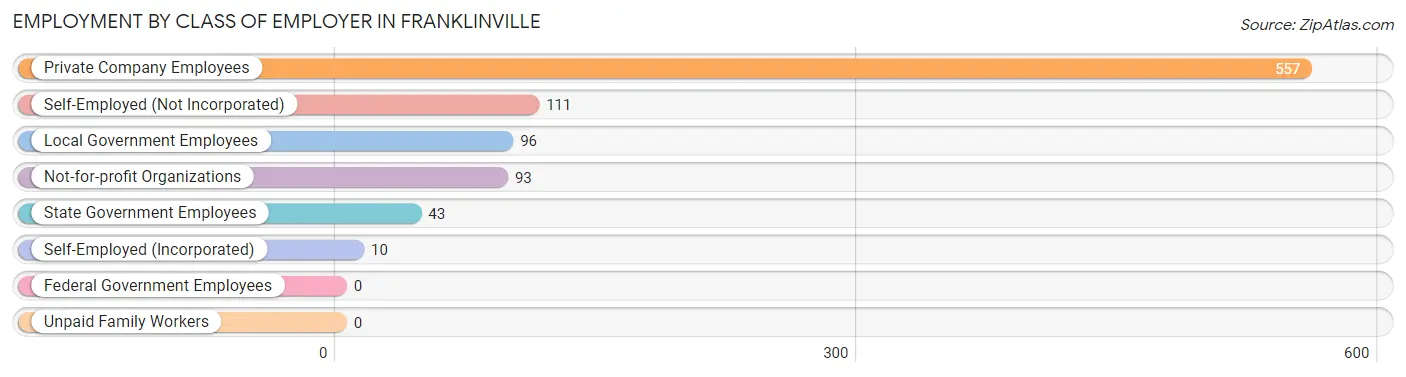
| Employer Class | # Employees | % Employees |
| Private Company Employees | 557 | 61.2% |
| Self-Employed (Incorporated) | 10 | 1.1% |
| Self-Employed (Not Incorporated) | 111 | 12.2% |
| Not-for-profit Organizations | 93 | 10.2% |
| Local Government Employees | 96 | 10.5% |
| State Government Employees | 43 | 4.7% |
| Federal Government Employees | 0 | 0.0% |
| Unpaid Family Workers | 0 | 0.0% |
| Total | 910 | 100.0% |
Employment Status by Age in Franklinville
According to the labor force statistics for Franklinville, out of the total population over 16 years of age (1,496), 65.8% or 984 individuals are in the labor force, with 6.3% or 62 of them unemployed. The age group with the highest labor force participation rate is 25 to 29 years, with 83.9% or 115 individuals in the labor force. Within the labor force, the 65 to 74 years age range has the highest percentage of unemployed individuals, with 24.3% or 9 of them being unemployed.
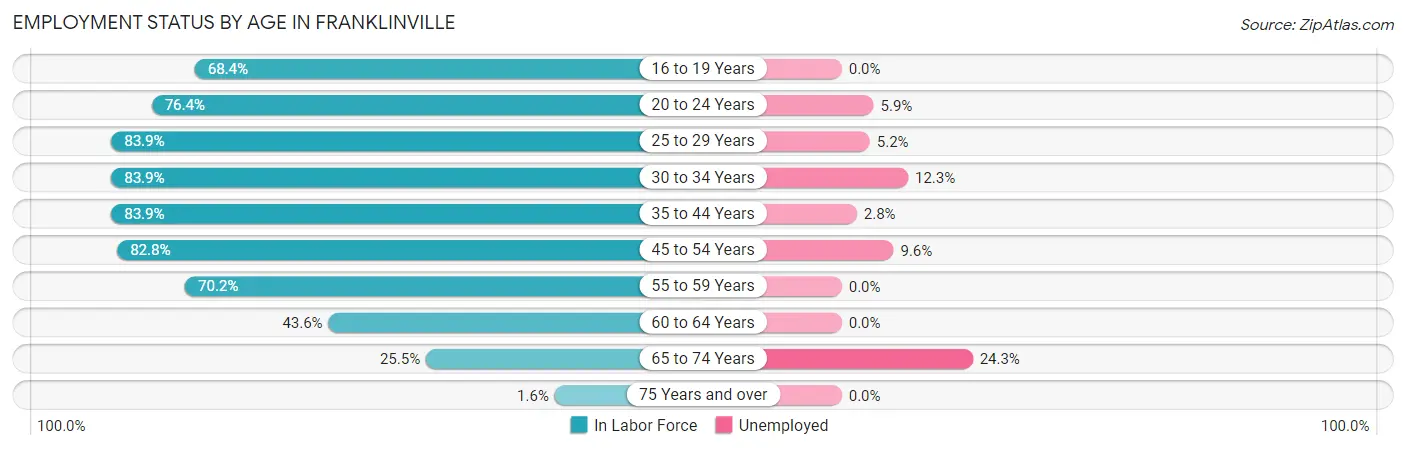
| Age Bracket | In Labor Force | Unemployed |
| 16 to 19 Years | 39 (68.4%) | 0 (0.0%) |
| 20 to 24 Years | 68 (76.4%) | 4 (5.9%) |
| 25 to 29 Years | 115 (83.9%) | 6 (5.2%) |
| 30 to 34 Years | 146 (83.9%) | 18 (12.3%) |
| 35 to 44 Years | 250 (83.9%) | 7 (2.8%) |
| 45 to 54 Years | 188 (82.8%) | 18 (9.6%) |
| 55 to 59 Years | 92 (70.2%) | 0 (0.0%) |
| 60 to 64 Years | 48 (43.6%) | 0 (0.0%) |
| 65 to 74 Years | 37 (25.5%) | 9 (24.3%) |
| 75 Years and over | 2 (1.6%) | 0 (0.0%) |
| Total | 984 (65.8%) | 62 (6.3%) |
Employment Status by Educational Attainment in Franklinville
According to labor force statistics for Franklinville, 77.9% of individuals (839) out of the total population between 25 and 64 years of age (1,077) are in the labor force, with 5.8% or 49 of them being unemployed. The group with the highest labor force participation rate are those with the educational attainment of high school diploma, with 83.7% or 384 individuals in the labor force. Within the labor force, individuals with college / associate degree education have the highest percentage of unemployment, with 8.6% or 25 of them being unemployed.
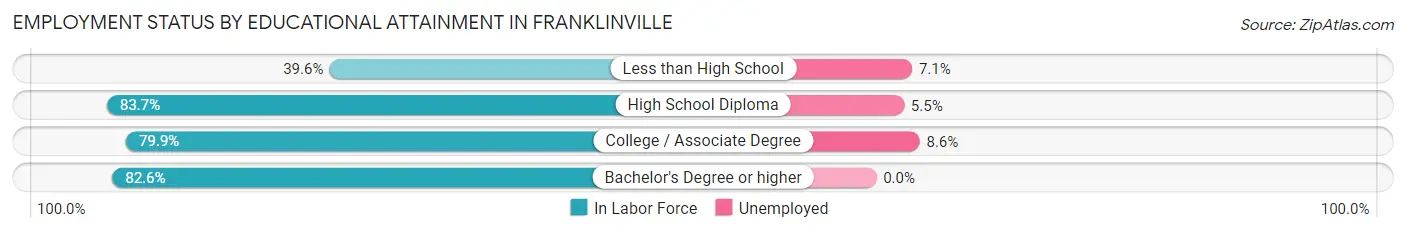
| Educational Attainment | In Labor Force | Unemployed |
| Less than High School | 42 (39.6%) | 8 (7.1%) |
| High School Diploma | 384 (83.7%) | 25 (5.5%) |
| College / Associate Degree | 290 (79.9%) | 31 (8.6%) |
| Bachelor's Degree or higher | 123 (82.6%) | 0 (0.0%) |
| Total | 839 (77.9%) | 62 (5.8%) |
Employment Occupations by Sex in Franklinville
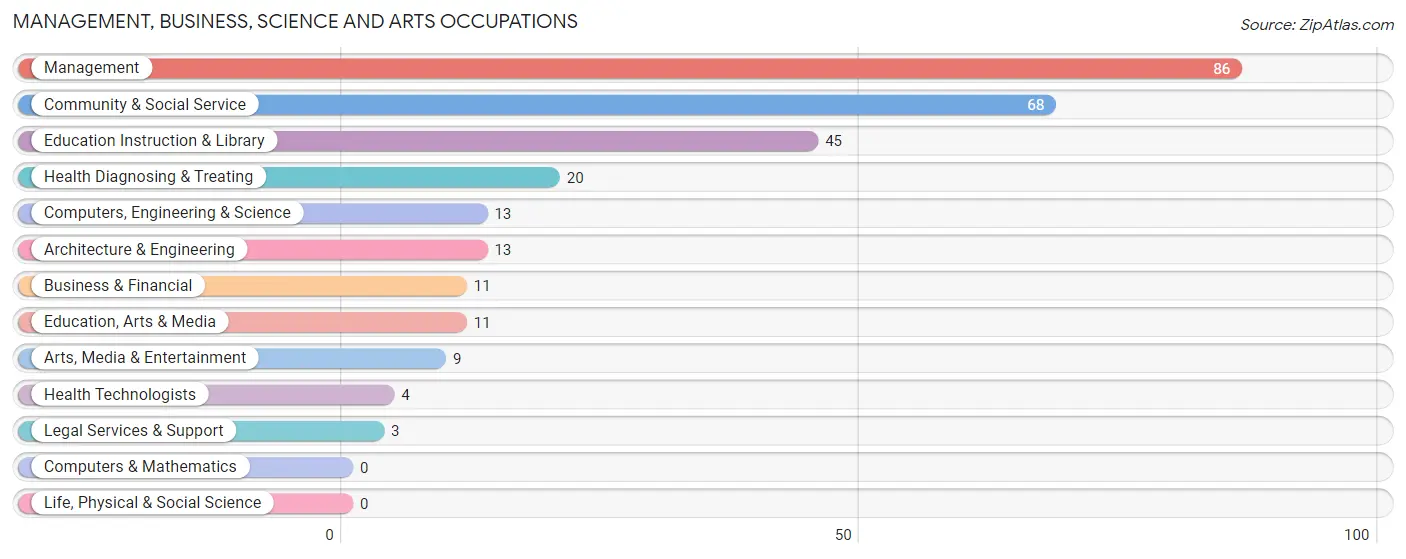
Management, Business, Science and Arts Occupations
The most common Management, Business, Science and Arts occupations in Franklinville are Management (86 | 9.3%), Community & Social Service (68 | 7.4%), Education Instruction & Library (45 | 4.9%), Health Diagnosing & Treating (20 | 2.2%), and Computers, Engineering & Science (13 | 1.4%).
Management, Business, Science and Arts Occupations by Sex
Within the Management, Business, Science and Arts occupations in Franklinville, the most male-oriented occupations are Computers, Engineering & Science (100.0%), Architecture & Engineering (100.0%), and Legal Services & Support (100.0%), while the most female-oriented occupations are Health Technologists (100.0%), Business & Financial (63.6%), and Education, Arts & Media (63.6%).
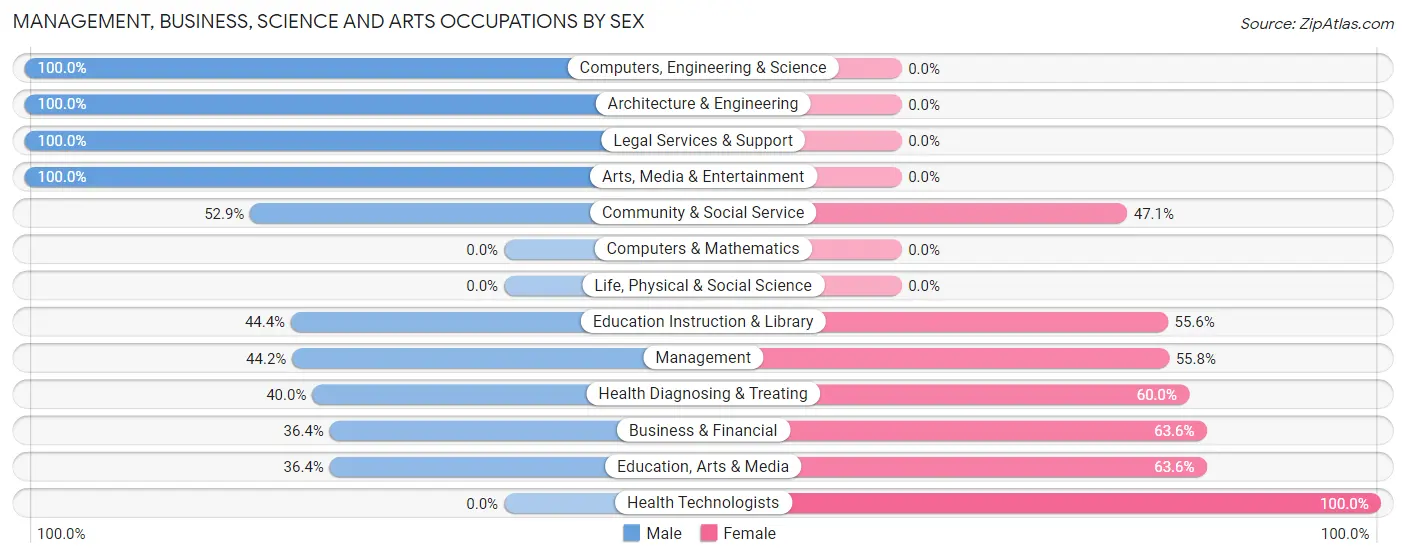
| Occupation | Male | Female |
| Management | 38 (44.2%) | 48 (55.8%) |
| Business & Financial | 4 (36.4%) | 7 (63.6%) |
| Computers, Engineering & Science | 13 (100.0%) | 0 (0.0%) |
| Computers & Mathematics | 0 (0.0%) | 0 (0.0%) |
| Architecture & Engineering | 13 (100.0%) | 0 (0.0%) |
| Life, Physical & Social Science | 0 (0.0%) | 0 (0.0%) |
| Community & Social Service | 36 (52.9%) | 32 (47.1%) |
| Education, Arts & Media | 4 (36.4%) | 7 (63.6%) |
| Legal Services & Support | 3 (100.0%) | 0 (0.0%) |
| Education Instruction & Library | 20 (44.4%) | 25 (55.6%) |
| Arts, Media & Entertainment | 9 (100.0%) | 0 (0.0%) |
| Health Diagnosing & Treating | 8 (40.0%) | 12 (60.0%) |
| Health Technologists | 0 (0.0%) | 4 (100.0%) |
| Total (Category) | 99 (50.0%) | 99 (50.0%) |
| Total (Overall) | 492 (53.3%) | 431 (46.7%) |
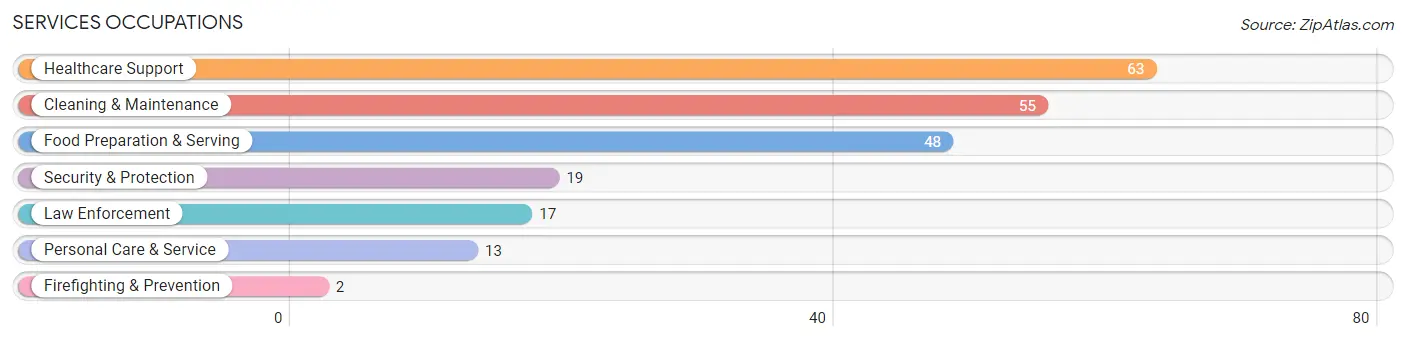
Services Occupations
The most common Services occupations in Franklinville are Healthcare Support (63 | 6.8%), Cleaning & Maintenance (55 | 6.0%), Food Preparation & Serving (48 | 5.2%), Security & Protection (19 | 2.1%), and Law Enforcement (17 | 1.8%).
Services Occupations by Sex
Within the Services occupations in Franklinville, the most male-oriented occupations are Law Enforcement (100.0%), Security & Protection (89.5%), and Personal Care & Service (76.9%), while the most female-oriented occupations are Firefighting & Prevention (100.0%), Healthcare Support (90.5%), and Food Preparation & Serving (81.2%).
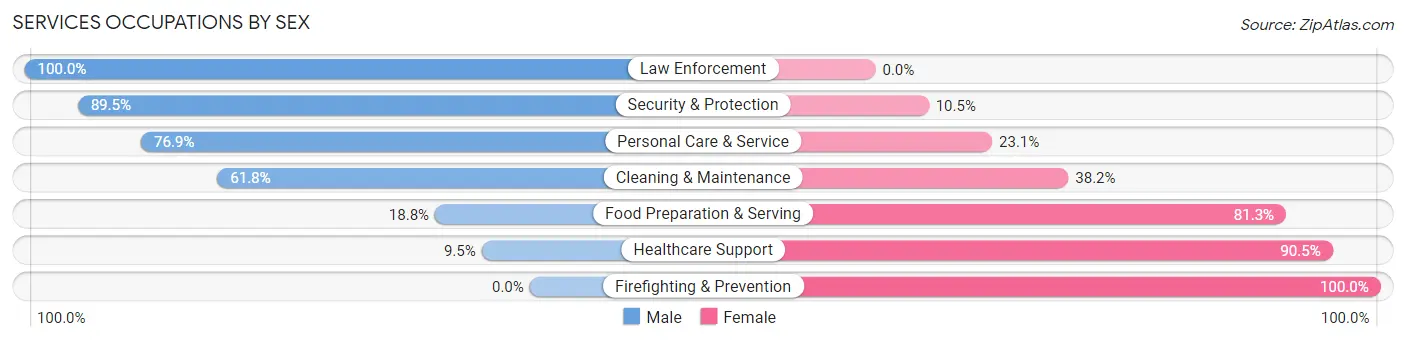
| Occupation | Male | Female |
| Healthcare Support | 6 (9.5%) | 57 (90.5%) |
| Security & Protection | 17 (89.5%) | 2 (10.5%) |
| Firefighting & Prevention | 0 (0.0%) | 2 (100.0%) |
| Law Enforcement | 17 (100.0%) | 0 (0.0%) |
| Food Preparation & Serving | 9 (18.8%) | 39 (81.2%) |
| Cleaning & Maintenance | 34 (61.8%) | 21 (38.2%) |
| Personal Care & Service | 10 (76.9%) | 3 (23.1%) |
| Total (Category) | 76 (38.4%) | 122 (61.6%) |
| Total (Overall) | 492 (53.3%) | 431 (46.7%) |
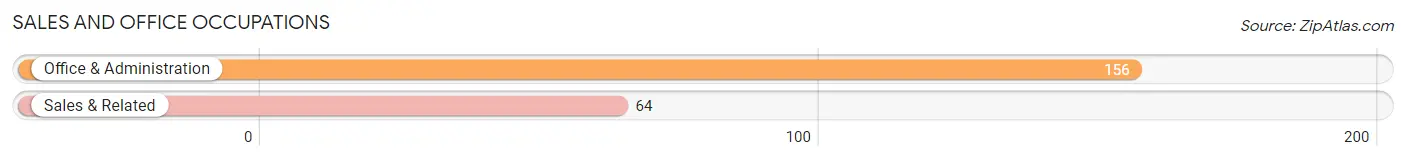
Sales and Office Occupations
The most common Sales and Office occupations in Franklinville are Office & Administration (156 | 16.9%), and Sales & Related (64 | 6.9%).
Sales and Office Occupations by Sex

| Occupation | Male | Female |
| Sales & Related | 45 (70.3%) | 19 (29.7%) |
| Office & Administration | 21 (13.5%) | 135 (86.5%) |
| Total (Category) | 66 (30.0%) | 154 (70.0%) |
| Total (Overall) | 492 (53.3%) | 431 (46.7%) |
Natural Resources, Construction and Maintenance Occupations
The most common Natural Resources, Construction and Maintenance occupations in Franklinville are Construction & Extraction (87 | 9.4%), and Installation, Maintenance & Repair (32 | 3.5%).

Natural Resources, Construction and Maintenance Occupations by Sex

| Occupation | Male | Female |
| Farming, Fishing & Forestry | 0 (0.0%) | 0 (0.0%) |
| Construction & Extraction | 87 (100.0%) | 0 (0.0%) |
| Installation, Maintenance & Repair | 32 (100.0%) | 0 (0.0%) |
| Total (Category) | 119 (100.0%) | 0 (0.0%) |
| Total (Overall) | 492 (53.3%) | 431 (46.7%) |
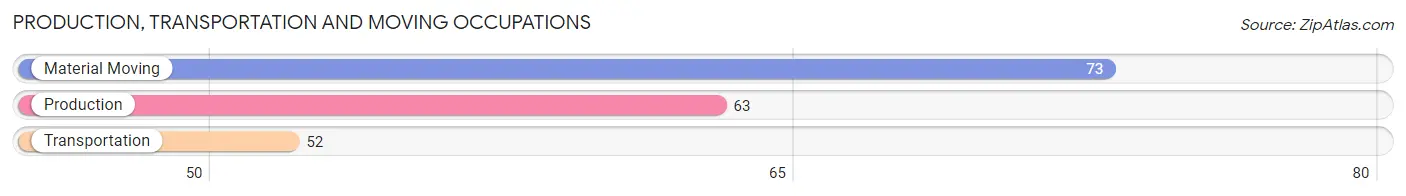
Production, Transportation and Moving Occupations
The most common Production, Transportation and Moving occupations in Franklinville are Material Moving (73 | 7.9%), Production (63 | 6.8%), and Transportation (52 | 5.6%).
Production, Transportation and Moving Occupations by Sex
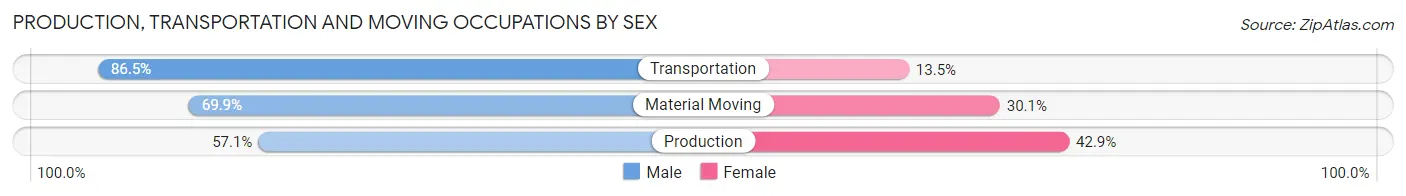
| Occupation | Male | Female |
| Production | 36 (57.1%) | 27 (42.9%) |
| Transportation | 45 (86.5%) | 7 (13.5%) |
| Material Moving | 51 (69.9%) | 22 (30.1%) |
| Total (Category) | 132 (70.2%) | 56 (29.8%) |
| Total (Overall) | 492 (53.3%) | 431 (46.7%) |
Employment Industries by Sex in Franklinville
Employment Industries in Franklinville
The major employment industries in Franklinville include Manufacturing (154 | 16.7%), Retail Trade (136 | 14.7%), Health Care & Social Assistance (117 | 12.7%), Educational Services (108 | 11.7%), and Construction (85 | 9.2%).
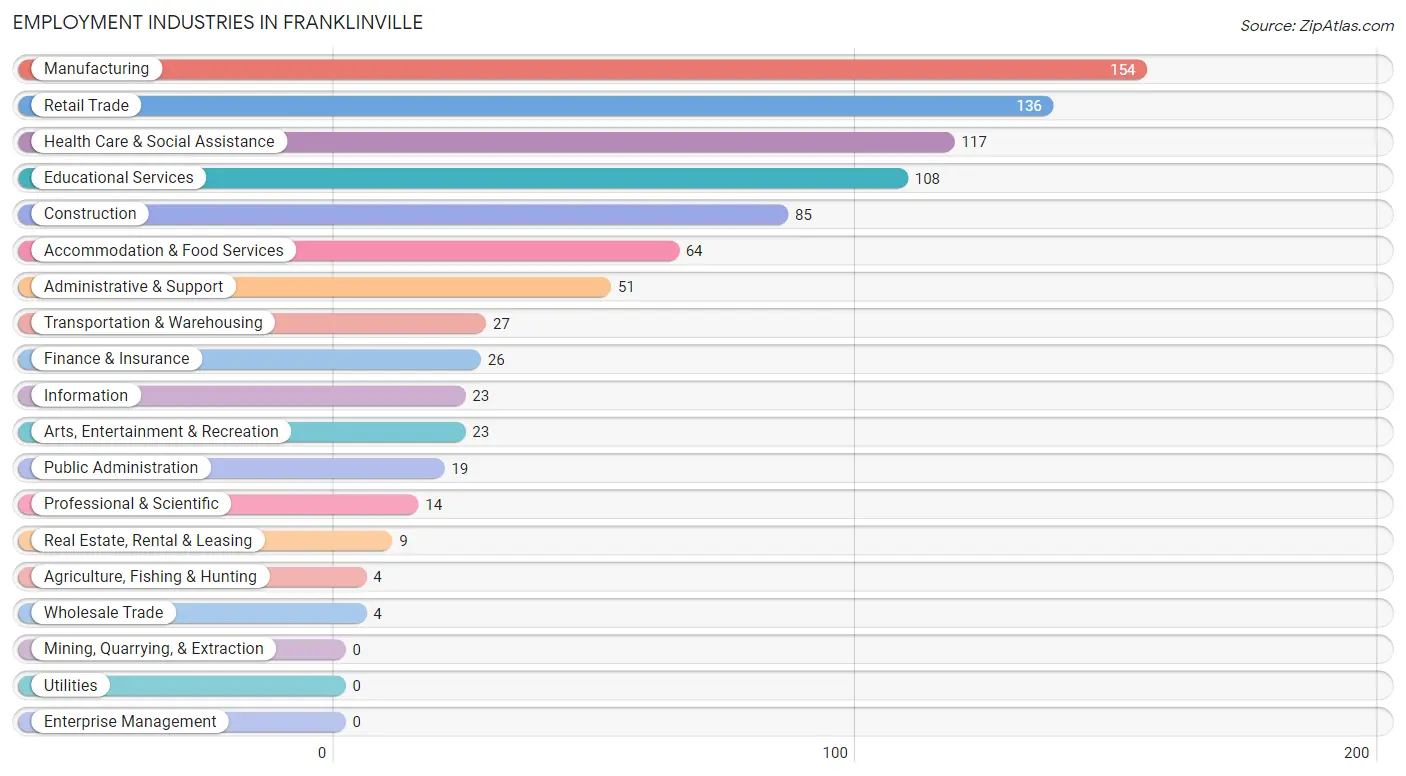
Employment Industries by Sex in Franklinville
The Franklinville industries that see more men than women are Agriculture, Fishing & Hunting (100.0%), Construction (100.0%), and Wholesale Trade (100.0%), whereas the industries that tend to have a higher number of women are Finance & Insurance (92.3%), Health Care & Social Assistance (77.8%), and Retail Trade (69.9%).
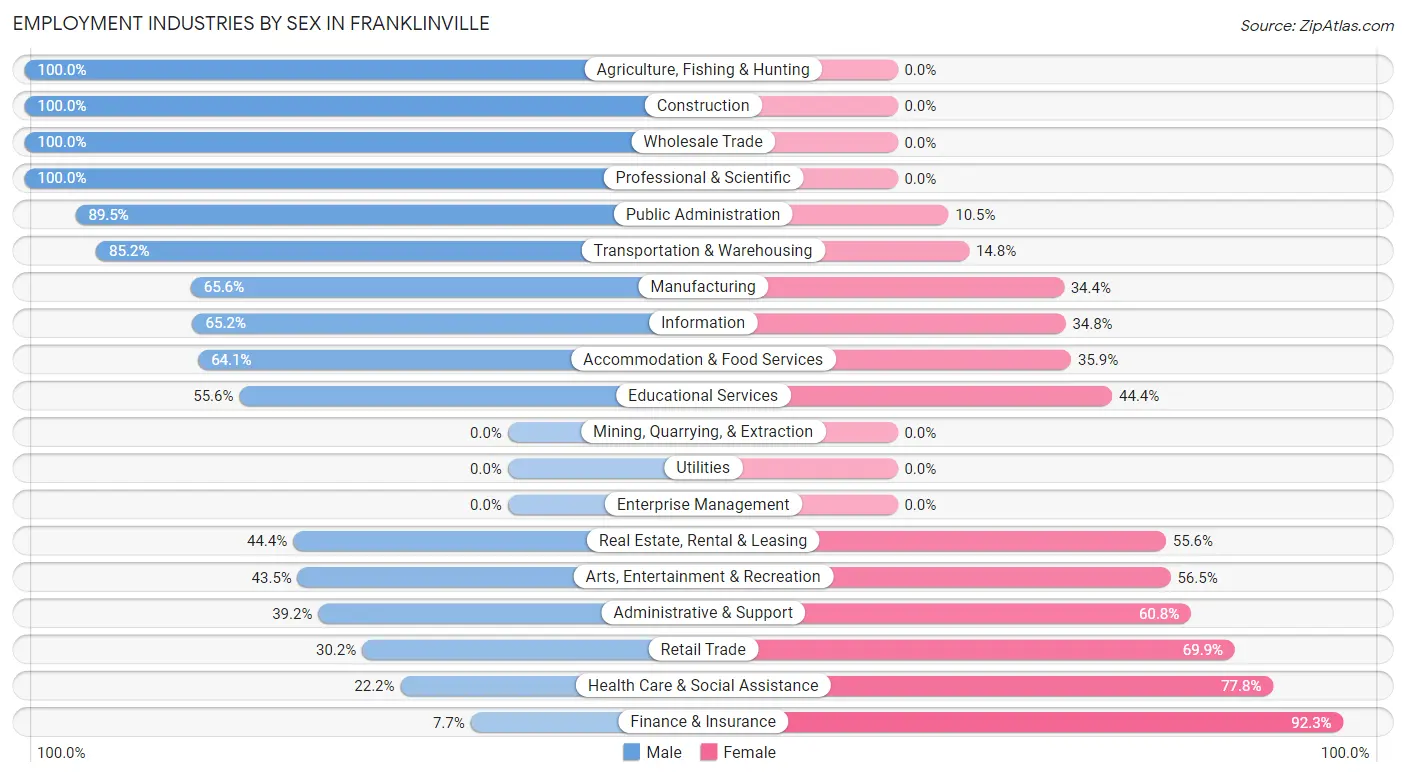
| Industry | Male | Female |
| Agriculture, Fishing & Hunting | 4 (100.0%) | 0 (0.0%) |
| Mining, Quarrying, & Extraction | 0 (0.0%) | 0 (0.0%) |
| Construction | 85 (100.0%) | 0 (0.0%) |
| Manufacturing | 101 (65.6%) | 53 (34.4%) |
| Wholesale Trade | 4 (100.0%) | 0 (0.0%) |
| Retail Trade | 41 (30.1%) | 95 (69.9%) |
| Transportation & Warehousing | 23 (85.2%) | 4 (14.8%) |
| Utilities | 0 (0.0%) | 0 (0.0%) |
| Information | 15 (65.2%) | 8 (34.8%) |
| Finance & Insurance | 2 (7.7%) | 24 (92.3%) |
| Real Estate, Rental & Leasing | 4 (44.4%) | 5 (55.6%) |
| Professional & Scientific | 14 (100.0%) | 0 (0.0%) |
| Enterprise Management | 0 (0.0%) | 0 (0.0%) |
| Administrative & Support | 20 (39.2%) | 31 (60.8%) |
| Educational Services | 60 (55.6%) | 48 (44.4%) |
| Health Care & Social Assistance | 26 (22.2%) | 91 (77.8%) |
| Arts, Entertainment & Recreation | 10 (43.5%) | 13 (56.5%) |
| Accommodation & Food Services | 41 (64.1%) | 23 (35.9%) |
| Public Administration | 17 (89.5%) | 2 (10.5%) |
| Total | 492 (53.3%) | 431 (46.7%) |
Education in Franklinville
School Enrollment in Franklinville
The most common levels of schooling among the 481 students in Franklinville are elementary school (181 | 37.6%), middle school (156 | 32.4%), and high school (65 | 13.5%).
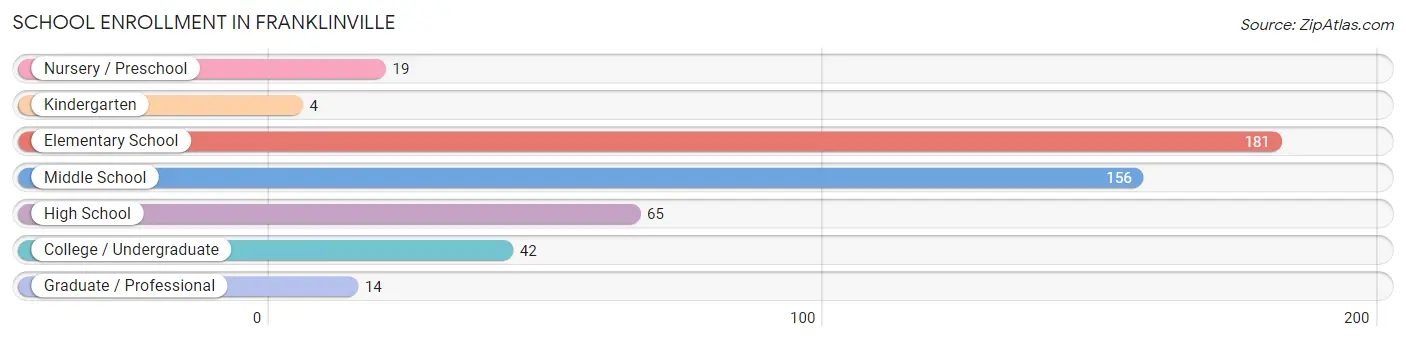
| School Level | # Students | % Students |
| Nursery / Preschool | 19 | 4.0% |
| Kindergarten | 4 | 0.8% |
| Elementary School | 181 | 37.6% |
| Middle School | 156 | 32.4% |
| High School | 65 | 13.5% |
| College / Undergraduate | 42 | 8.7% |
| Graduate / Professional | 14 | 2.9% |
| Total | 481 | 100.0% |
School Enrollment by Age by Funding Source in Franklinville
Out of a total of 481 students who are enrolled in schools in Franklinville, 35 (7.3%) attend a private institution, while the remaining 446 (92.7%) are enrolled in public schools. The age group of 25 to 34 year olds has the highest likelihood of being enrolled in private schools, with 14 (58.3% in the age bracket) enrolled. Conversely, the age group of 3 to 4 year olds has the lowest likelihood of being enrolled in a private school, with 8 (100.0% in the age bracket) attending a public institution.
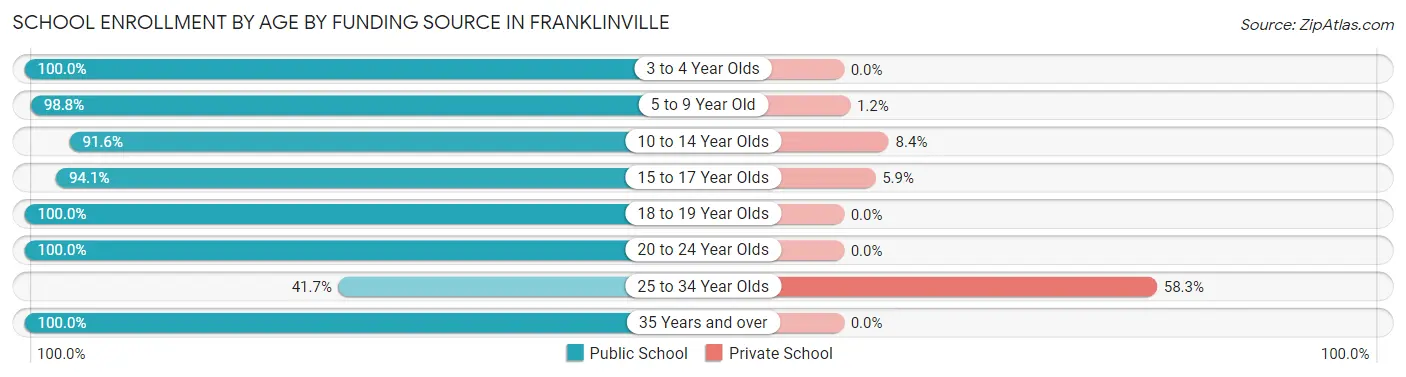
| Age Bracket | Public School | Private School |
| 3 to 4 Year Olds | 8 (100.0%) | 0 (0.0%) |
| 5 to 9 Year Old | 169 (98.8%) | 2 (1.2%) |
| 10 to 14 Year Olds | 175 (91.6%) | 16 (8.4%) |
| 15 to 17 Year Olds | 48 (94.1%) | 3 (5.9%) |
| 18 to 19 Year Olds | 9 (100.0%) | 0 (0.0%) |
| 20 to 24 Year Olds | 22 (100.0%) | 0 (0.0%) |
| 25 to 34 Year Olds | 10 (41.7%) | 14 (58.3%) |
| 35 Years and over | 5 (100.0%) | 0 (0.0%) |
| Total | 446 (92.7%) | 35 (7.3%) |
Educational Attainment by Field of Study in Franklinville
Education (62 | 27.6%), science & technology (37 | 16.4%), literature & languages (22 | 9.8%), communications (20 | 8.9%), and physical & health sciences (14 | 6.2%) are the most common fields of study among 225 individuals in Franklinville who have obtained a bachelor's degree or higher.
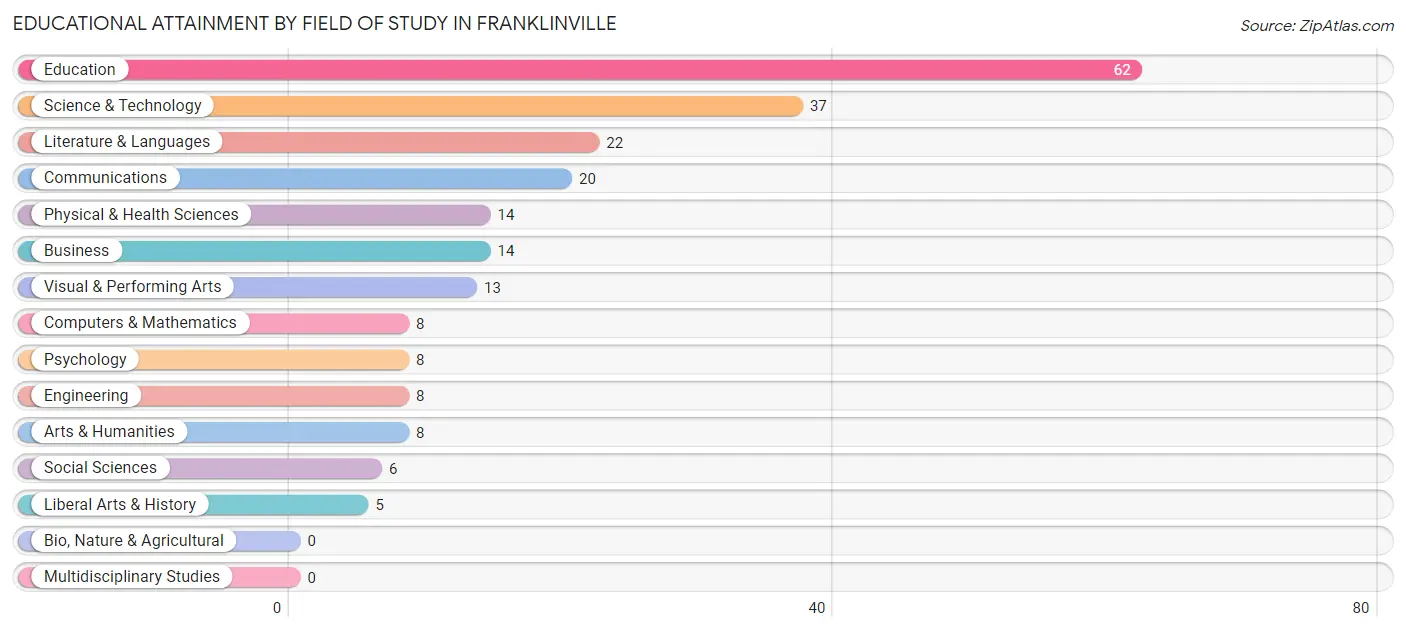
| Field of Study | # Graduates | % Graduates |
| Computers & Mathematics | 8 | 3.6% |
| Bio, Nature & Agricultural | 0 | 0.0% |
| Physical & Health Sciences | 14 | 6.2% |
| Psychology | 8 | 3.6% |
| Social Sciences | 6 | 2.7% |
| Engineering | 8 | 3.6% |
| Multidisciplinary Studies | 0 | 0.0% |
| Science & Technology | 37 | 16.4% |
| Business | 14 | 6.2% |
| Education | 62 | 27.6% |
| Literature & Languages | 22 | 9.8% |
| Liberal Arts & History | 5 | 2.2% |
| Visual & Performing Arts | 13 | 5.8% |
| Communications | 20 | 8.9% |
| Arts & Humanities | 8 | 3.6% |
| Total | 225 | 100.0% |
Transportation & Commute in Franklinville
Vehicle Availability by Sex in Franklinville
The most prevalent vehicle ownership categories in Franklinville are males with 2 vehicles (183, accounting for 38.3%) and females with 2 vehicles (141, making up 43.5%).
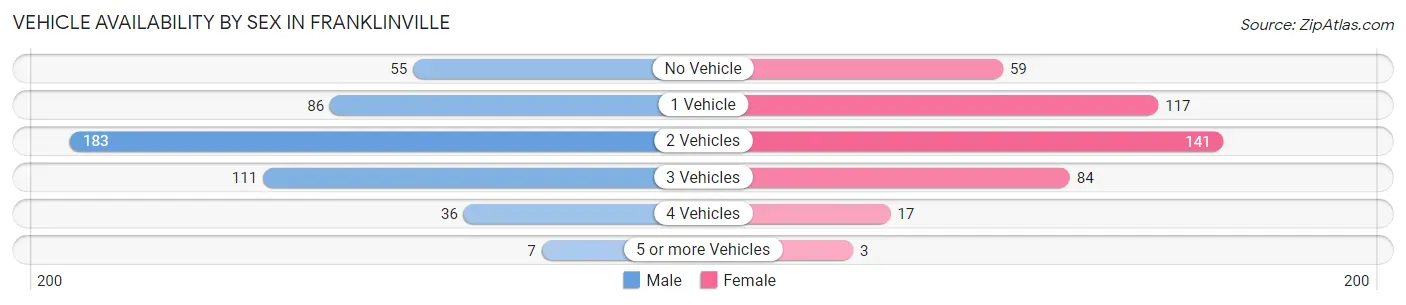
| Vehicles Available | Male | Female |
| No Vehicle | 55 (11.5%) | 59 (14.0%) |
| 1 Vehicle | 86 (18.0%) | 117 (27.8%) |
| 2 Vehicles | 183 (38.3%) | 141 (33.5%) |
| 3 Vehicles | 111 (23.2%) | 84 (20.0%) |
| 4 Vehicles | 36 (7.5%) | 17 (4.0%) |
| 5 or more Vehicles | 7 (1.5%) | 3 (0.7%) |
| Total | 478 (100.0%) | 421 (100.0%) |
Commute Time in Franklinville
The most frequently occuring commute durations in Franklinville are 30 to 34 minutes (114 commuters, 15.0%), 25 to 29 minutes (113 commuters, 14.8%), and 5 to 9 minutes (104 commuters, 13.7%).
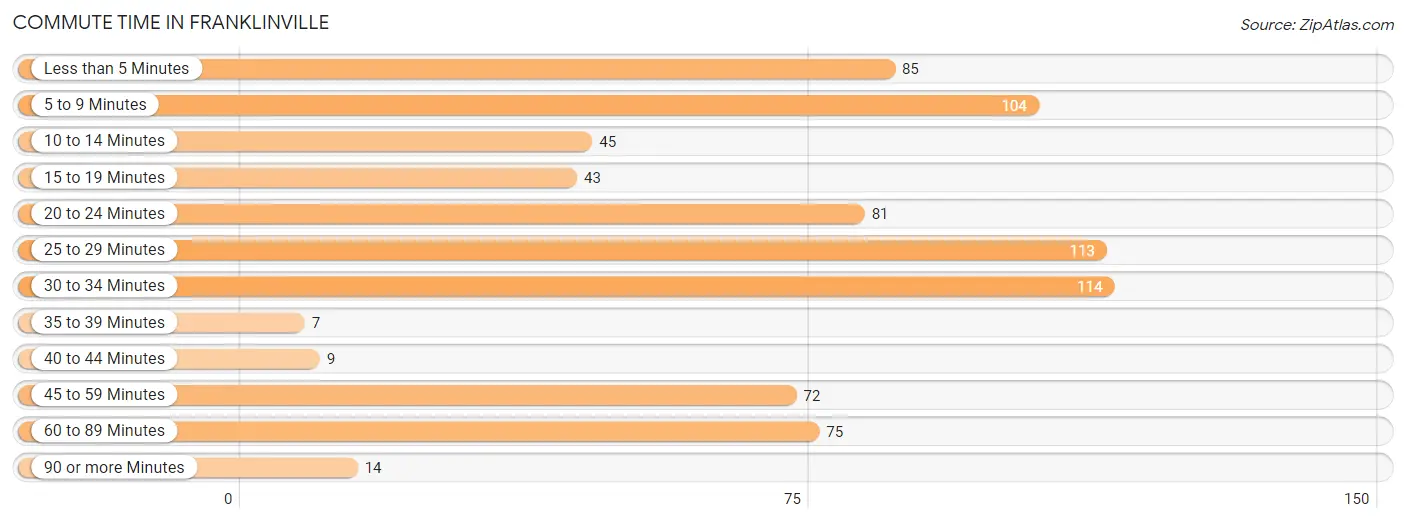
| Commute Time | # Commuters | % Commuters |
| Less than 5 Minutes | 85 | 11.2% |
| 5 to 9 Minutes | 104 | 13.7% |
| 10 to 14 Minutes | 45 | 5.9% |
| 15 to 19 Minutes | 43 | 5.6% |
| 20 to 24 Minutes | 81 | 10.6% |
| 25 to 29 Minutes | 113 | 14.8% |
| 30 to 34 Minutes | 114 | 15.0% |
| 35 to 39 Minutes | 7 | 0.9% |
| 40 to 44 Minutes | 9 | 1.2% |
| 45 to 59 Minutes | 72 | 9.5% |
| 60 to 89 Minutes | 75 | 9.8% |
| 90 or more Minutes | 14 | 1.8% |
Commute Time by Sex in Franklinville
The most common commute times in Franklinville are 30 to 34 minutes (79 commuters, 17.2%) for males and 5 to 9 minutes (59 commuters, 19.5%) for females.
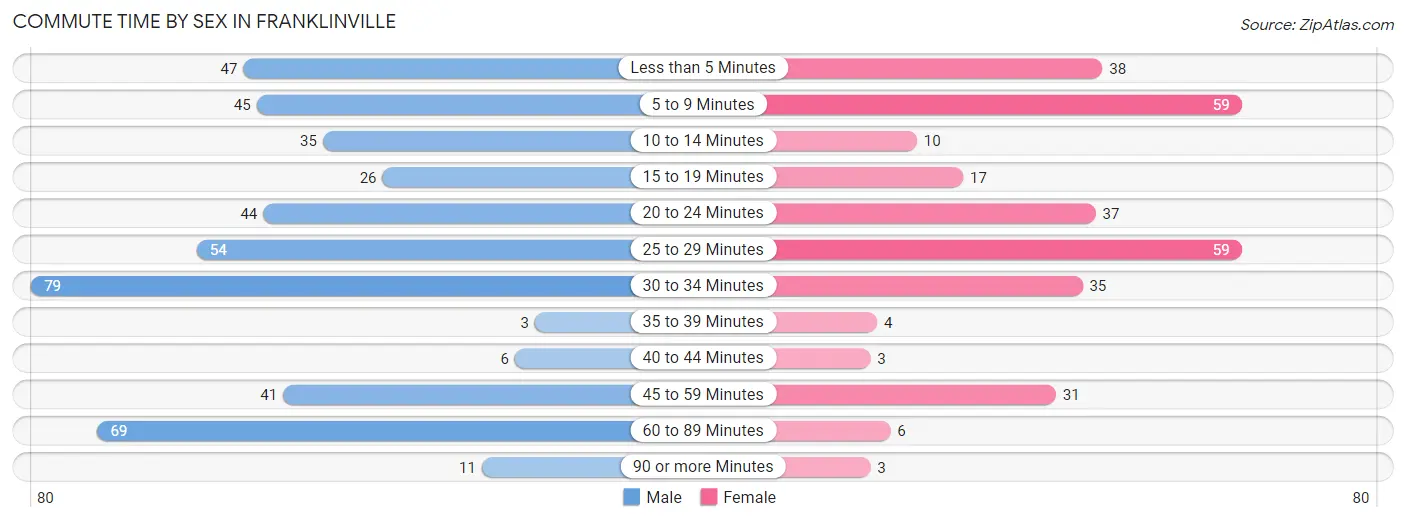
| Commute Time | Male | Female |
| Less than 5 Minutes | 47 (10.2%) | 38 (12.6%) |
| 5 to 9 Minutes | 45 (9.8%) | 59 (19.5%) |
| 10 to 14 Minutes | 35 (7.6%) | 10 (3.3%) |
| 15 to 19 Minutes | 26 (5.7%) | 17 (5.6%) |
| 20 to 24 Minutes | 44 (9.6%) | 37 (12.2%) |
| 25 to 29 Minutes | 54 (11.7%) | 59 (19.5%) |
| 30 to 34 Minutes | 79 (17.2%) | 35 (11.6%) |
| 35 to 39 Minutes | 3 (0.6%) | 4 (1.3%) |
| 40 to 44 Minutes | 6 (1.3%) | 3 (1.0%) |
| 45 to 59 Minutes | 41 (8.9%) | 31 (10.3%) |
| 60 to 89 Minutes | 69 (15.0%) | 6 (2.0%) |
| 90 or more Minutes | 11 (2.4%) | 3 (1.0%) |
Time of Departure to Work by Sex in Franklinville
The most frequent times of departure to work in Franklinville are 7:00 AM to 7:29 AM (108, 23.5%) for males and 12:00 PM to 3:59 PM (41, 13.6%) for females.
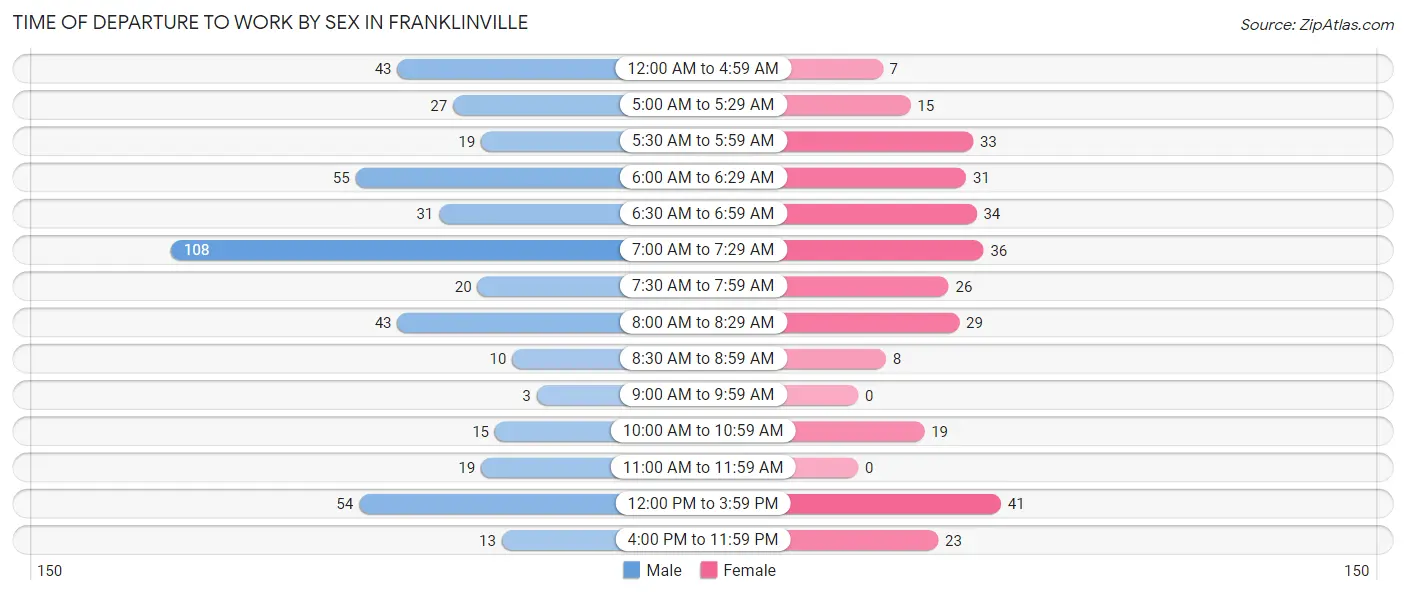
| Time of Departure | Male | Female |
| 12:00 AM to 4:59 AM | 43 (9.3%) | 7 (2.3%) |
| 5:00 AM to 5:29 AM | 27 (5.9%) | 15 (5.0%) |
| 5:30 AM to 5:59 AM | 19 (4.1%) | 33 (10.9%) |
| 6:00 AM to 6:29 AM | 55 (12.0%) | 31 (10.3%) |
| 6:30 AM to 6:59 AM | 31 (6.7%) | 34 (11.3%) |
| 7:00 AM to 7:29 AM | 108 (23.5%) | 36 (11.9%) |
| 7:30 AM to 7:59 AM | 20 (4.3%) | 26 (8.6%) |
| 8:00 AM to 8:29 AM | 43 (9.3%) | 29 (9.6%) |
| 8:30 AM to 8:59 AM | 10 (2.2%) | 8 (2.6%) |
| 9:00 AM to 9:59 AM | 3 (0.6%) | 0 (0.0%) |
| 10:00 AM to 10:59 AM | 15 (3.3%) | 19 (6.3%) |
| 11:00 AM to 11:59 AM | 19 (4.1%) | 0 (0.0%) |
| 12:00 PM to 3:59 PM | 54 (11.7%) | 41 (13.6%) |
| 4:00 PM to 11:59 PM | 13 (2.8%) | 23 (7.6%) |
| Total | 460 (100.0%) | 302 (100.0%) |
Housing Occupancy in Franklinville
Occupancy by Ownership in Franklinville
Of the total 709 dwellings in Franklinville, owner-occupied units account for 543 (76.6%), while renter-occupied units make up 166 (23.4%).
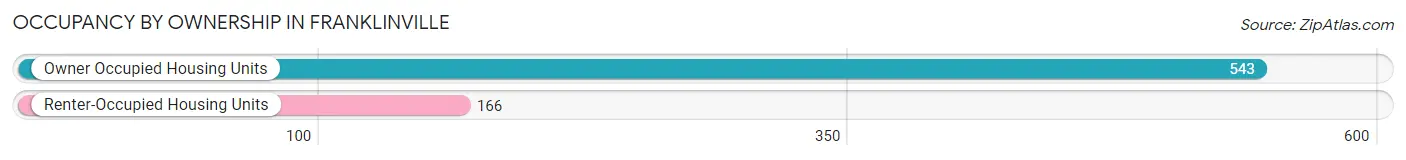
| Occupancy | # Housing Units | % Housing Units |
| Owner Occupied Housing Units | 543 | 76.6% |
| Renter-Occupied Housing Units | 166 | 23.4% |
| Total Occupied Housing Units | 709 | 100.0% |
Occupancy by Household Size in Franklinville
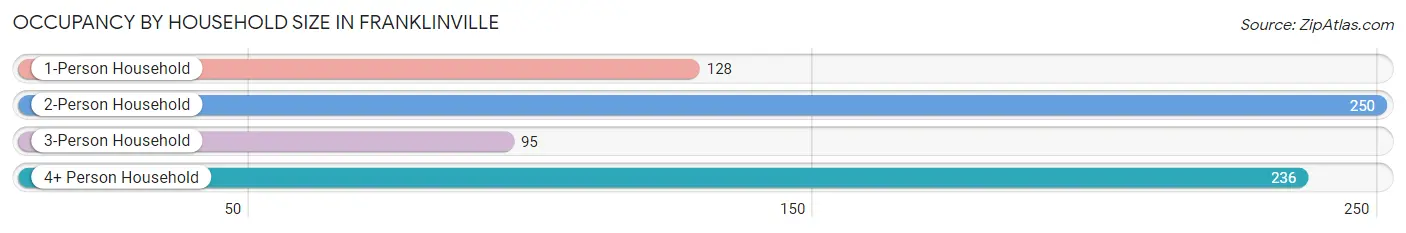
| Household Size | # Housing Units | % Housing Units |
| 1-Person Household | 128 | 18.0% |
| 2-Person Household | 250 | 35.3% |
| 3-Person Household | 95 | 13.4% |
| 4+ Person Household | 236 | 33.3% |
| Total Housing Units | 709 | 100.0% |
Occupancy by Ownership by Household Size in Franklinville
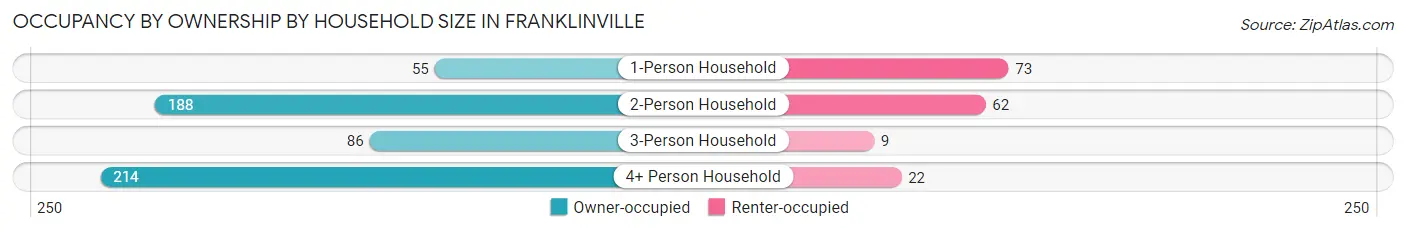
| Household Size | Owner-occupied | Renter-occupied |
| 1-Person Household | 55 (43.0%) | 73 (57.0%) |
| 2-Person Household | 188 (75.2%) | 62 (24.8%) |
| 3-Person Household | 86 (90.5%) | 9 (9.5%) |
| 4+ Person Household | 214 (90.7%) | 22 (9.3%) |
| Total Housing Units | 543 (76.6%) | 166 (23.4%) |
Occupancy by Educational Attainment in Franklinville
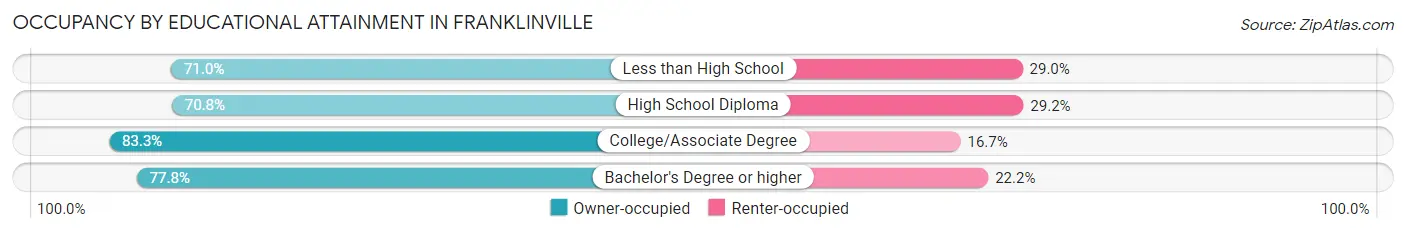
| Household Size | Owner-occupied | Renter-occupied |
| Less than High School | 22 (71.0%) | 9 (29.0%) |
| High School Diploma | 211 (70.8%) | 87 (29.2%) |
| College/Associate Degree | 219 (83.3%) | 44 (16.7%) |
| Bachelor's Degree or higher | 91 (77.8%) | 26 (22.2%) |
Occupancy by Age of Householder in Franklinville
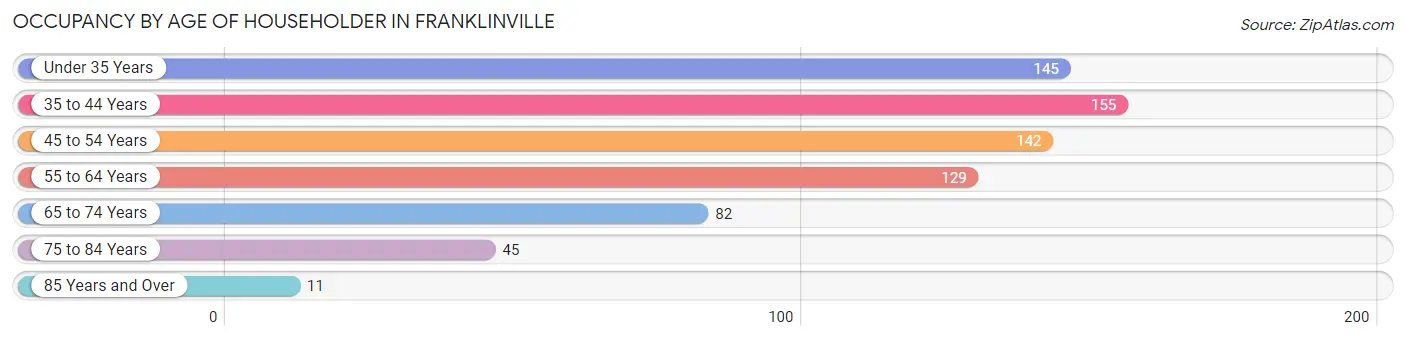
| Age Bracket | # Households | % Households |
| Under 35 Years | 145 | 20.4% |
| 35 to 44 Years | 155 | 21.9% |
| 45 to 54 Years | 142 | 20.0% |
| 55 to 64 Years | 129 | 18.2% |
| 65 to 74 Years | 82 | 11.6% |
| 75 to 84 Years | 45 | 6.4% |
| 85 Years and Over | 11 | 1.5% |
| Total | 709 | 100.0% |
Housing Finances in Franklinville
Median Income by Occupancy in Franklinville
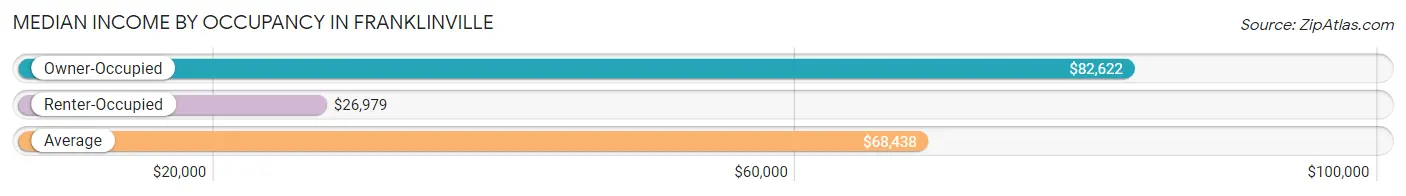
| Occupancy Type | # Households | Median Income |
| Owner-Occupied | 543 (76.6%) | $82,622 |
| Renter-Occupied | 166 (23.4%) | $26,979 |
| Average | 709 (100.0%) | $68,438 |
Occupancy by Householder Income Bracket in Franklinville
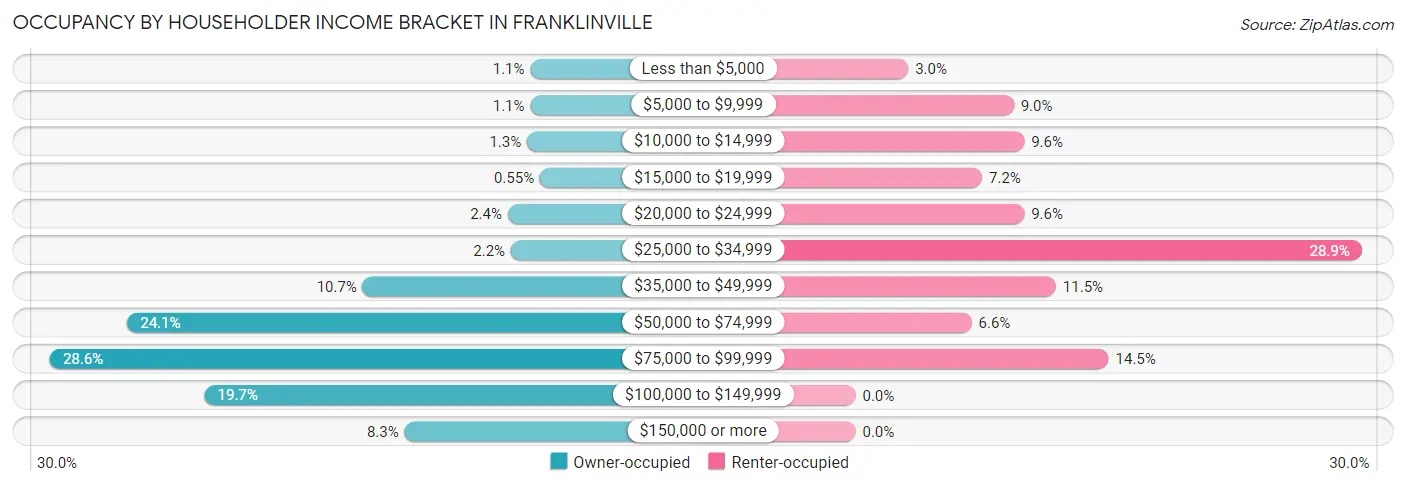
| Income Bracket | Owner-occupied | Renter-occupied |
| Less than $5,000 | 6 (1.1%) | 5 (3.0%) |
| $5,000 to $9,999 | 6 (1.1%) | 15 (9.0%) |
| $10,000 to $14,999 | 7 (1.3%) | 16 (9.6%) |
| $15,000 to $19,999 | 3 (0.5%) | 12 (7.2%) |
| $20,000 to $24,999 | 13 (2.4%) | 16 (9.6%) |
| $25,000 to $34,999 | 12 (2.2%) | 48 (28.9%) |
| $35,000 to $49,999 | 58 (10.7%) | 19 (11.5%) |
| $50,000 to $74,999 | 131 (24.1%) | 11 (6.6%) |
| $75,000 to $99,999 | 155 (28.5%) | 24 (14.5%) |
| $100,000 to $149,999 | 107 (19.7%) | 0 (0.0%) |
| $150,000 or more | 45 (8.3%) | 0 (0.0%) |
| Total | 543 (100.0%) | 166 (100.0%) |
Monthly Housing Cost Tiers in Franklinville
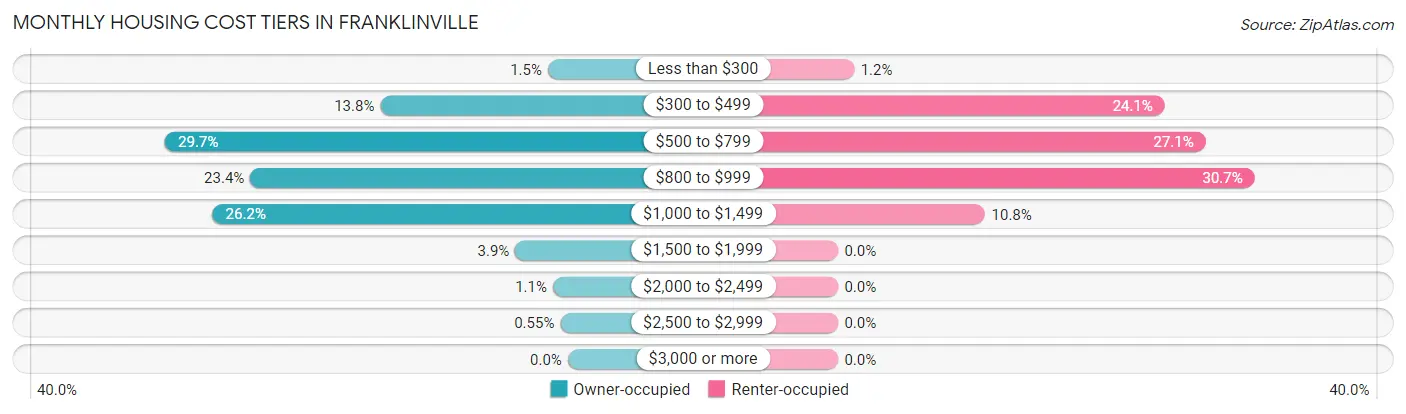
| Monthly Cost | Owner-occupied | Renter-occupied |
| Less than $300 | 8 (1.5%) | 2 (1.2%) |
| $300 to $499 | 75 (13.8%) | 40 (24.1%) |
| $500 to $799 | 161 (29.6%) | 45 (27.1%) |
| $800 to $999 | 127 (23.4%) | 51 (30.7%) |
| $1,000 to $1,499 | 142 (26.2%) | 18 (10.8%) |
| $1,500 to $1,999 | 21 (3.9%) | 0 (0.0%) |
| $2,000 to $2,499 | 6 (1.1%) | 0 (0.0%) |
| $2,500 to $2,999 | 3 (0.5%) | 0 (0.0%) |
| $3,000 or more | 0 (0.0%) | 0 (0.0%) |
| Total | 543 (100.0%) | 166 (100.0%) |
Physical Housing Characteristics in Franklinville
Housing Structures in Franklinville
| Structure Type | # Housing Units | % Housing Units |
| Single Unit, Detached | 543 | 76.6% |
| Single Unit, Attached | 4 | 0.6% |
| 2 Unit Apartments | 79 | 11.1% |
| 3 or 4 Unit Apartments | 66 | 9.3% |
| 5 to 9 Unit Apartments | 0 | 0.0% |
| 10 or more Apartments | 9 | 1.3% |
| Mobile Home / Other | 8 | 1.1% |
| Total | 709 | 100.0% |
Housing Structures by Occupancy in Franklinville
| Structure Type | Owner-occupied | Renter-occupied |
| Single Unit, Detached | 496 (91.3%) | 47 (8.7%) |
| Single Unit, Attached | 4 (100.0%) | 0 (0.0%) |
| 2 Unit Apartments | 35 (44.3%) | 44 (55.7%) |
| 3 or 4 Unit Apartments | 0 (0.0%) | 66 (100.0%) |
| 5 to 9 Unit Apartments | 0 (0.0%) | 0 (0.0%) |
| 10 or more Apartments | 0 (0.0%) | 9 (100.0%) |
| Mobile Home / Other | 8 (100.0%) | 0 (0.0%) |
| Total | 543 (76.6%) | 166 (23.4%) |
Housing Structures by Number of Rooms in Franklinville
| Number of Rooms | Owner-occupied | Renter-occupied |
| 1 Room | 0 (0.0%) | 2 (1.2%) |
| 2 or 3 Rooms | 8 (1.5%) | 54 (32.5%) |
| 4 or 5 Rooms | 58 (10.7%) | 29 (17.5%) |
| 6 or 7 Rooms | 181 (33.3%) | 55 (33.1%) |
| 8 or more Rooms | 296 (54.5%) | 26 (15.7%) |
| Total | 543 (100.0%) | 166 (100.0%) |
Housing Structure by Heating Type in Franklinville
| Heating Type | Owner-occupied | Renter-occupied |
| Utility Gas | 473 (87.1%) | 108 (65.1%) |
| Bottled, Tank, or LP Gas | 16 (2.9%) | 17 (10.2%) |
| Electricity | 32 (5.9%) | 41 (24.7%) |
| Fuel Oil or Kerosene | 0 (0.0%) | 0 (0.0%) |
| Coal or Coke | 0 (0.0%) | 0 (0.0%) |
| All other Fuels | 22 (4.1%) | 0 (0.0%) |
| No Fuel Used | 0 (0.0%) | 0 (0.0%) |
| Total | 543 (100.0%) | 166 (100.0%) |
Household Vehicle Usage in Franklinville
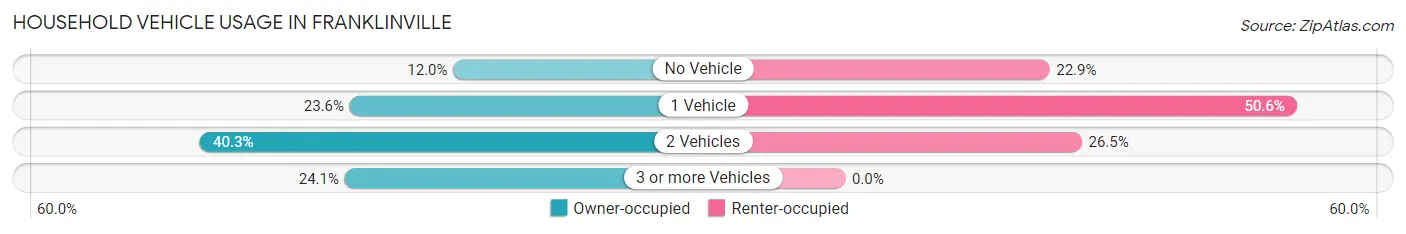
| Vehicles per Household | Owner-occupied | Renter-occupied |
| No Vehicle | 65 (12.0%) | 38 (22.9%) |
| 1 Vehicle | 128 (23.6%) | 84 (50.6%) |
| 2 Vehicles | 219 (40.3%) | 44 (26.5%) |
| 3 or more Vehicles | 131 (24.1%) | 0 (0.0%) |
| Total | 543 (100.0%) | 166 (100.0%) |
Real Estate & Mortgages in Franklinville
Real Estate and Mortgage Overview in Franklinville
| Characteristic | Without Mortgage | With Mortgage |
| Housing Units | 267 | 276 |
| Median Property Value | $100,200 | $85,400 |
| Median Household Income | $70,313 | $27 |
| Monthly Housing Costs | $589 | $0 |
| Real Estate Taxes | $3,337 | $7 |
Property Value by Mortgage Status in Franklinville
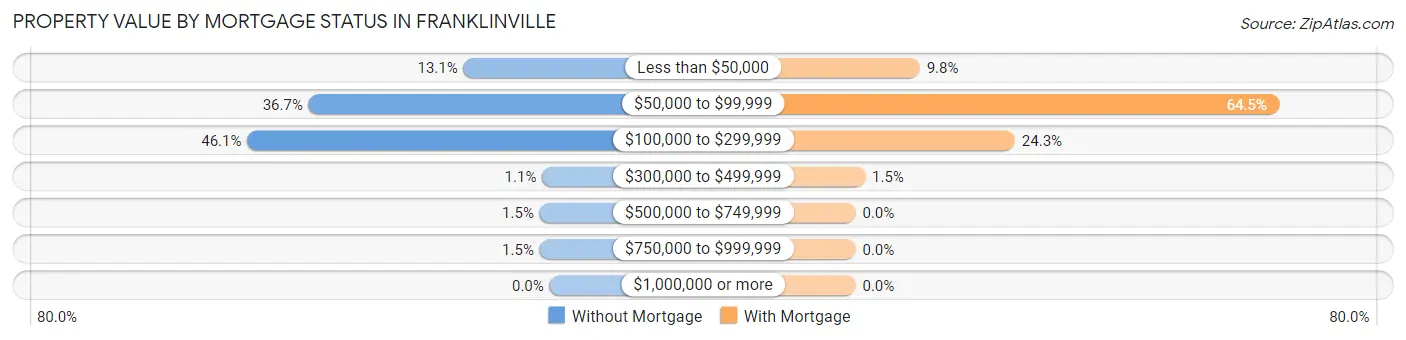
| Property Value | Without Mortgage | With Mortgage |
| Less than $50,000 | 35 (13.1%) | 27 (9.8%) |
| $50,000 to $99,999 | 98 (36.7%) | 178 (64.5%) |
| $100,000 to $299,999 | 123 (46.1%) | 67 (24.3%) |
| $300,000 to $499,999 | 3 (1.1%) | 4 (1.5%) |
| $500,000 to $749,999 | 4 (1.5%) | 0 (0.0%) |
| $750,000 to $999,999 | 4 (1.5%) | 0 (0.0%) |
| $1,000,000 or more | 0 (0.0%) | 0 (0.0%) |
| Total | 267 (100.0%) | 276 (100.0%) |
Household Income by Mortgage Status in Franklinville
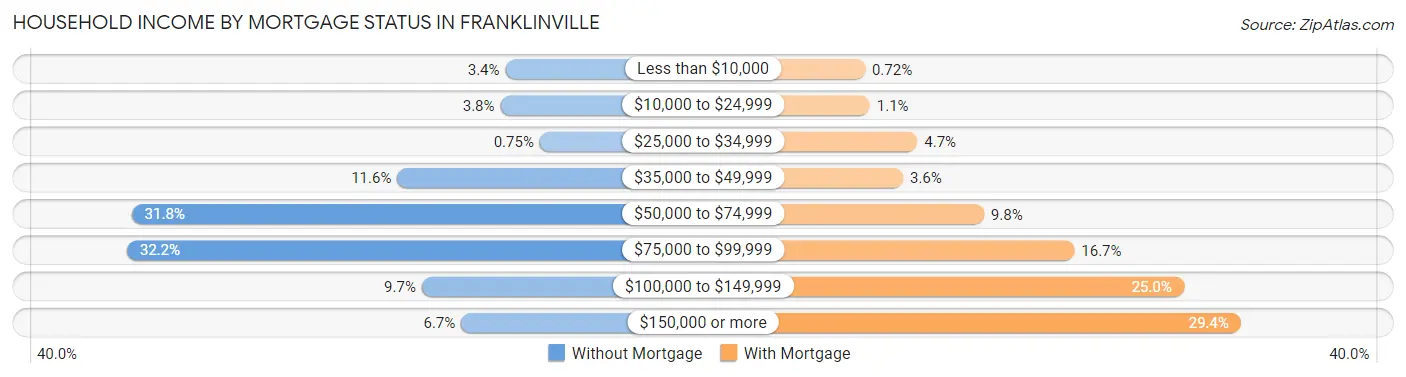
| Household Income | Without Mortgage | With Mortgage |
| Less than $10,000 | 9 (3.4%) | 2 (0.7%) |
| $10,000 to $24,999 | 10 (3.7%) | 3 (1.1%) |
| $25,000 to $34,999 | 2 (0.7%) | 13 (4.7%) |
| $35,000 to $49,999 | 31 (11.6%) | 10 (3.6%) |
| $50,000 to $74,999 | 85 (31.8%) | 27 (9.8%) |
| $75,000 to $99,999 | 86 (32.2%) | 46 (16.7%) |
| $100,000 to $149,999 | 26 (9.7%) | 69 (25.0%) |
| $150,000 or more | 18 (6.7%) | 81 (29.3%) |
| Total | 267 (100.0%) | 276 (100.0%) |
Property Value to Household Income Ratio in Franklinville
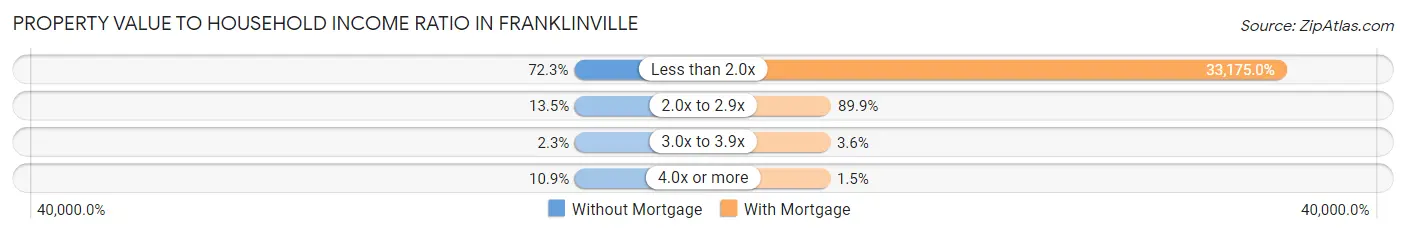
| Value-to-Income Ratio | Without Mortgage | With Mortgage |
| Less than 2.0x | 193 (72.3%) | 91,563 (33,175.0%) |
| 2.0x to 2.9x | 36 (13.5%) | 248 (89.9%) |
| 3.0x to 3.9x | 6 (2.2%) | 10 (3.6%) |
| 4.0x or more | 29 (10.9%) | 4 (1.5%) |
| Total | 267 (100.0%) | 276 (100.0%) |
Real Estate Taxes by Mortgage Status in Franklinville
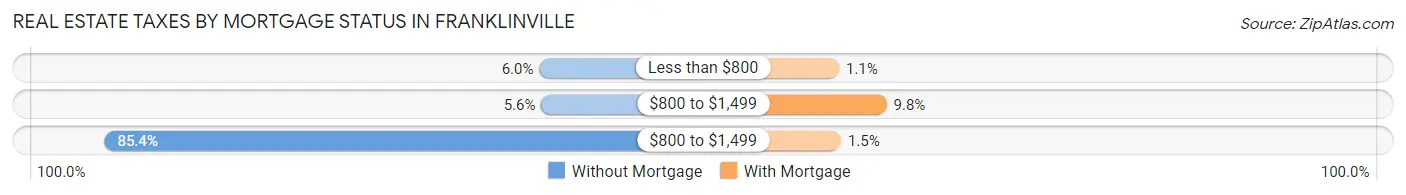
| Property Taxes | Without Mortgage | With Mortgage |
| Less than $800 | 16 (6.0%) | 3 (1.1%) |
| $800 to $1,499 | 15 (5.6%) | 27 (9.8%) |
| $800 to $1,499 | 228 (85.4%) | 4 (1.5%) |
| Total | 267 (100.0%) | 276 (100.0%) |
Health & Disability in Franklinville
Health Insurance Coverage by Age in Franklinville
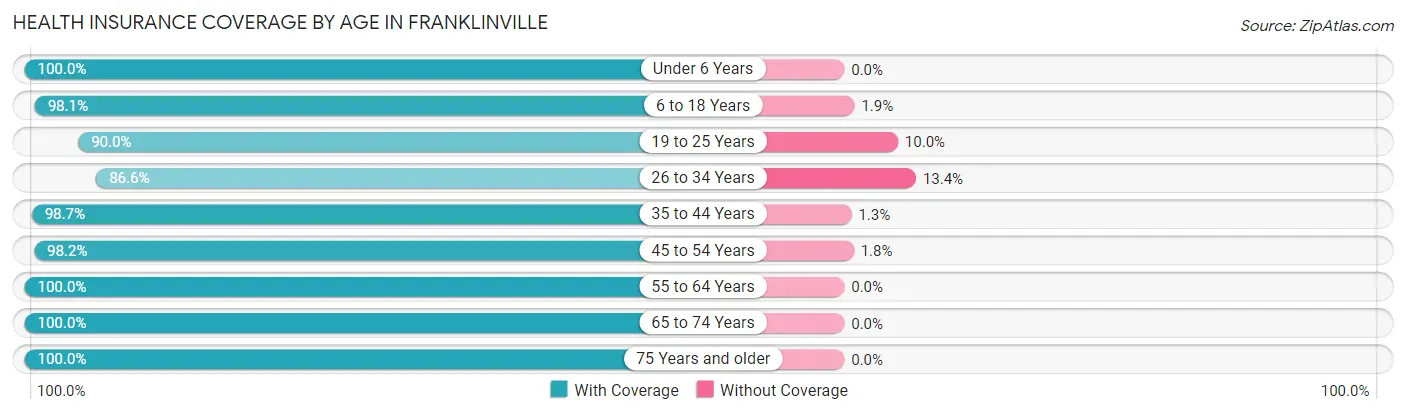
| Age Bracket | With Coverage | Without Coverage |
| Under 6 Years | 143 (100.0%) | 0 (0.0%) |
| 6 to 18 Years | 413 (98.1%) | 8 (1.9%) |
| 19 to 25 Years | 126 (90.0%) | 14 (10.0%) |
| 26 to 34 Years | 253 (86.6%) | 39 (13.4%) |
| 35 to 44 Years | 294 (98.7%) | 4 (1.3%) |
| 45 to 54 Years | 223 (98.2%) | 4 (1.8%) |
| 55 to 64 Years | 241 (100.0%) | 0 (0.0%) |
| 65 to 74 Years | 145 (100.0%) | 0 (0.0%) |
| 75 Years and older | 128 (100.0%) | 0 (0.0%) |
| Total | 1,966 (96.6%) | 69 (3.4%) |
Health Insurance Coverage by Citizenship Status in Franklinville
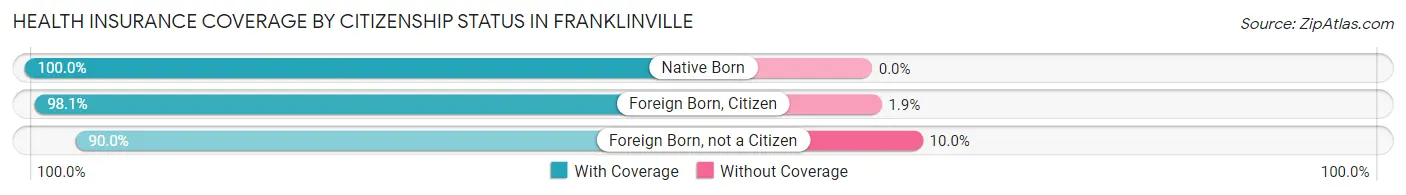
| Citizenship Status | With Coverage | Without Coverage |
| Native Born | 143 (100.0%) | 0 (0.0%) |
| Foreign Born, Citizen | 413 (98.1%) | 8 (1.9%) |
| Foreign Born, not a Citizen | 126 (90.0%) | 14 (10.0%) |
Health Insurance Coverage by Household Income in Franklinville
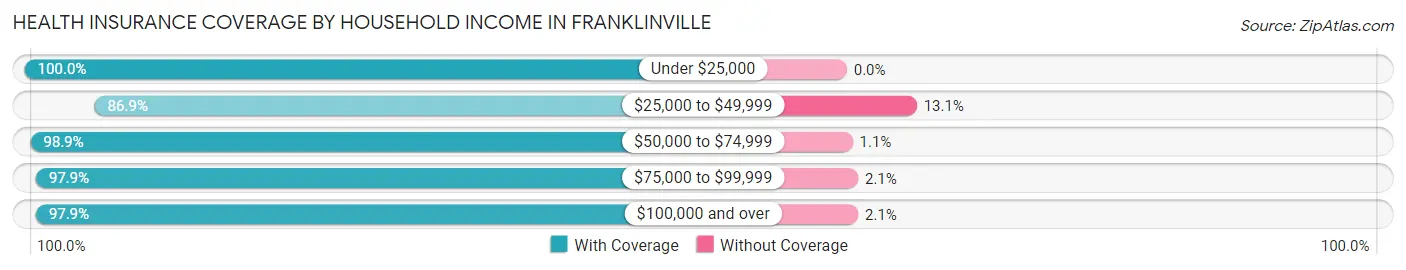
| Household Income | With Coverage | Without Coverage |
| Under $25,000 | 139 (100.0%) | 0 (0.0%) |
| $25,000 to $49,999 | 272 (86.9%) | 41 (13.1%) |
| $50,000 to $74,999 | 456 (98.9%) | 5 (1.1%) |
| $75,000 to $99,999 | 557 (97.9%) | 12 (2.1%) |
| $100,000 and over | 509 (97.9%) | 11 (2.1%) |
Public vs Private Health Insurance Coverage by Age in Franklinville
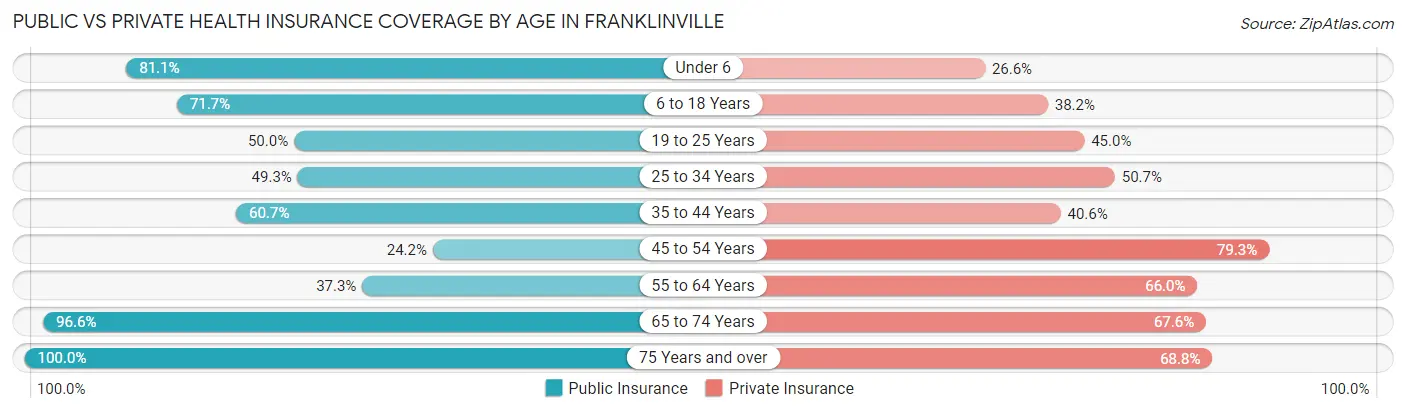
| Age Bracket | Public Insurance | Private Insurance |
| Under 6 | 116 (81.1%) | 38 (26.6%) |
| 6 to 18 Years | 302 (71.7%) | 161 (38.2%) |
| 19 to 25 Years | 70 (50.0%) | 63 (45.0%) |
| 25 to 34 Years | 144 (49.3%) | 148 (50.7%) |
| 35 to 44 Years | 181 (60.7%) | 121 (40.6%) |
| 45 to 54 Years | 55 (24.2%) | 180 (79.3%) |
| 55 to 64 Years | 90 (37.3%) | 159 (66.0%) |
| 65 to 74 Years | 140 (96.6%) | 98 (67.6%) |
| 75 Years and over | 128 (100.0%) | 88 (68.8%) |
| Total | 1,226 (60.3%) | 1,056 (51.9%) |
Disability Status by Sex by Age in Franklinville
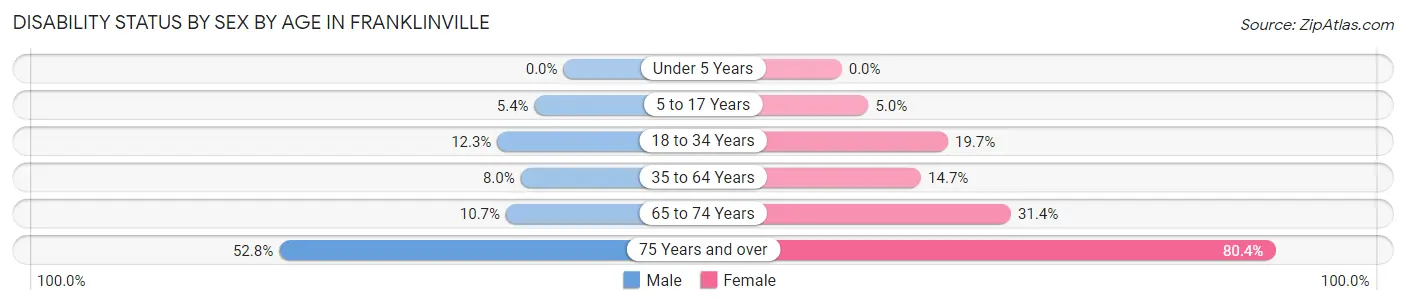
| Age Bracket | Male | Female |
| Under 5 Years | 0 (0.0%) | 0 (0.0%) |
| 5 to 17 Years | 11 (5.4%) | 11 (5.0%) |
| 18 to 34 Years | 28 (12.3%) | 42 (19.7%) |
| 35 to 64 Years | 28 (8.0%) | 61 (14.7%) |
| 65 to 74 Years | 8 (10.7%) | 22 (31.4%) |
| 75 Years and over | 19 (52.8%) | 74 (80.4%) |
Disability Class by Sex by Age in Franklinville
Disability Class: Hearing Difficulty
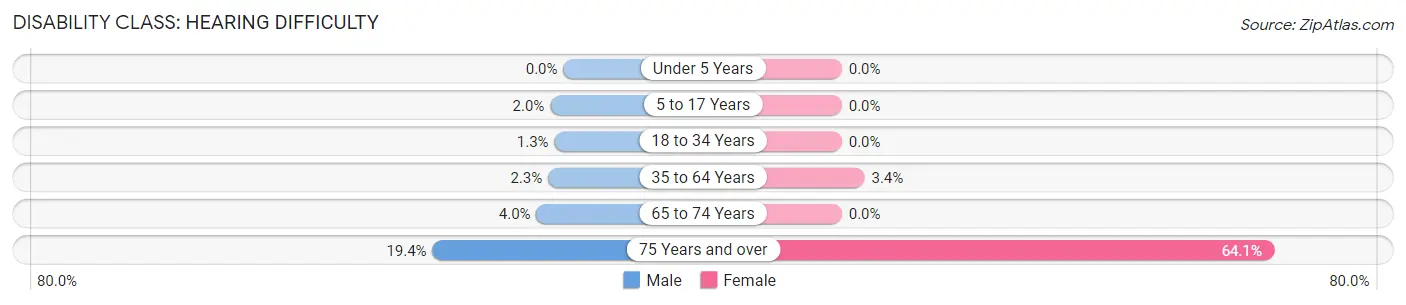
| Age Bracket | Male | Female |
| Under 5 Years | 0 (0.0%) | 0 (0.0%) |
| 5 to 17 Years | 4 (1.9%) | 0 (0.0%) |
| 18 to 34 Years | 3 (1.3%) | 0 (0.0%) |
| 35 to 64 Years | 8 (2.3%) | 14 (3.4%) |
| 65 to 74 Years | 3 (4.0%) | 0 (0.0%) |
| 75 Years and over | 7 (19.4%) | 59 (64.1%) |
Disability Class: Vision Difficulty
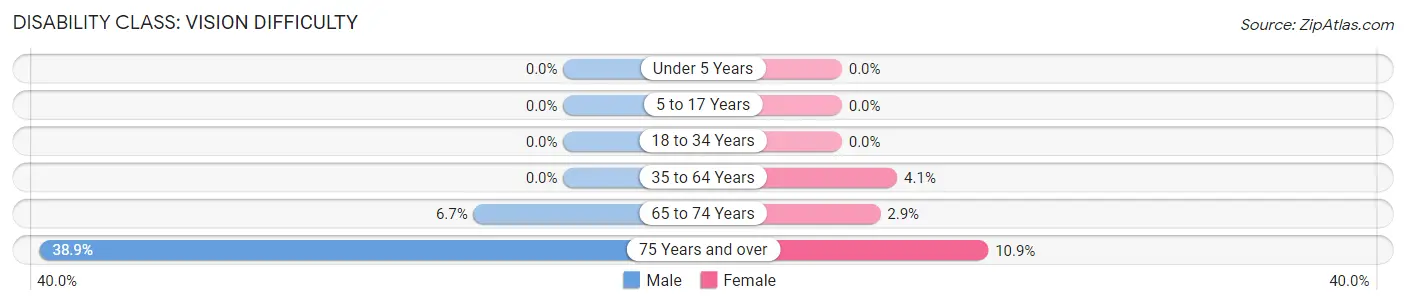
| Age Bracket | Male | Female |
| Under 5 Years | 0 (0.0%) | 0 (0.0%) |
| 5 to 17 Years | 0 (0.0%) | 0 (0.0%) |
| 18 to 34 Years | 0 (0.0%) | 0 (0.0%) |
| 35 to 64 Years | 0 (0.0%) | 17 (4.1%) |
| 65 to 74 Years | 5 (6.7%) | 2 (2.9%) |
| 75 Years and over | 14 (38.9%) | 10 (10.9%) |
Disability Class: Cognitive Difficulty
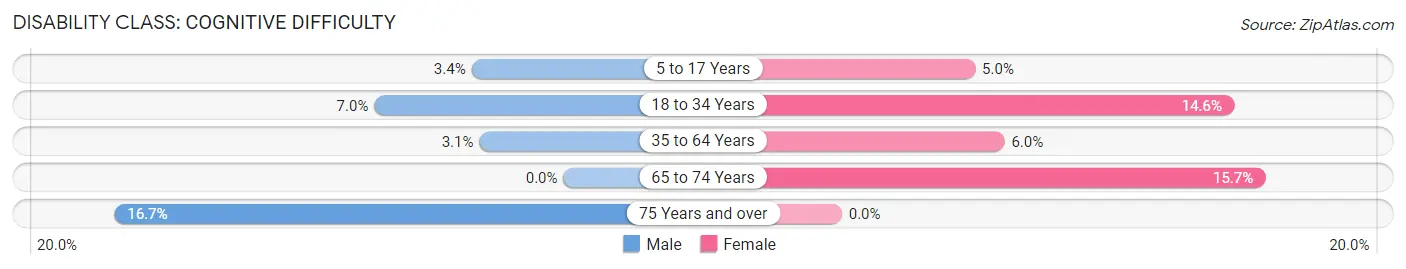
| Age Bracket | Male | Female |
| 5 to 17 Years | 7 (3.4%) | 11 (5.0%) |
| 18 to 34 Years | 16 (7.0%) | 31 (14.5%) |
| 35 to 64 Years | 11 (3.1%) | 25 (6.0%) |
| 65 to 74 Years | 0 (0.0%) | 11 (15.7%) |
| 75 Years and over | 6 (16.7%) | 0 (0.0%) |
Disability Class: Ambulatory Difficulty
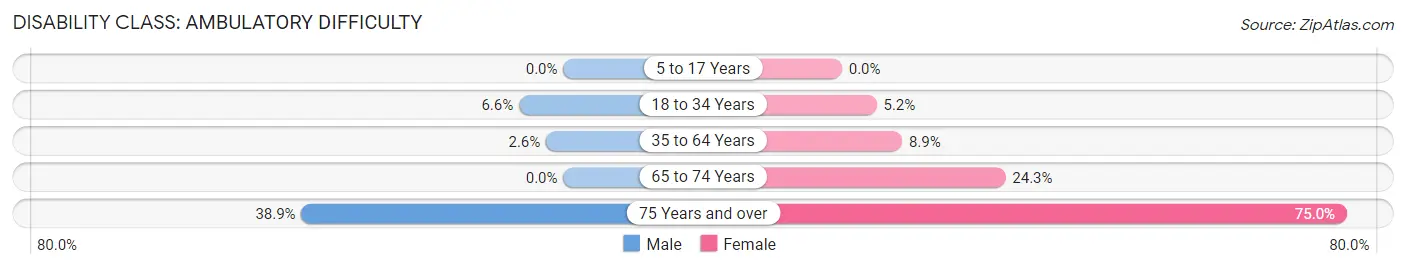
| Age Bracket | Male | Female |
| 5 to 17 Years | 0 (0.0%) | 0 (0.0%) |
| 18 to 34 Years | 15 (6.6%) | 11 (5.2%) |
| 35 to 64 Years | 9 (2.6%) | 37 (8.9%) |
| 65 to 74 Years | 0 (0.0%) | 17 (24.3%) |
| 75 Years and over | 14 (38.9%) | 69 (75.0%) |
Disability Class: Self-Care Difficulty
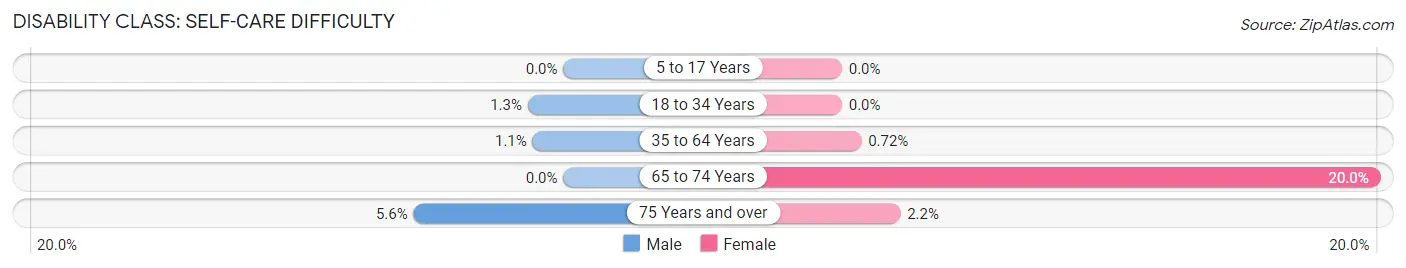
| Age Bracket | Male | Female |
| 5 to 17 Years | 0 (0.0%) | 0 (0.0%) |
| 18 to 34 Years | 3 (1.3%) | 0 (0.0%) |
| 35 to 64 Years | 4 (1.1%) | 3 (0.7%) |
| 65 to 74 Years | 0 (0.0%) | 14 (20.0%) |
| 75 Years and over | 2 (5.6%) | 2 (2.2%) |
Technology Access in Franklinville
Computing Device Access in Franklinville
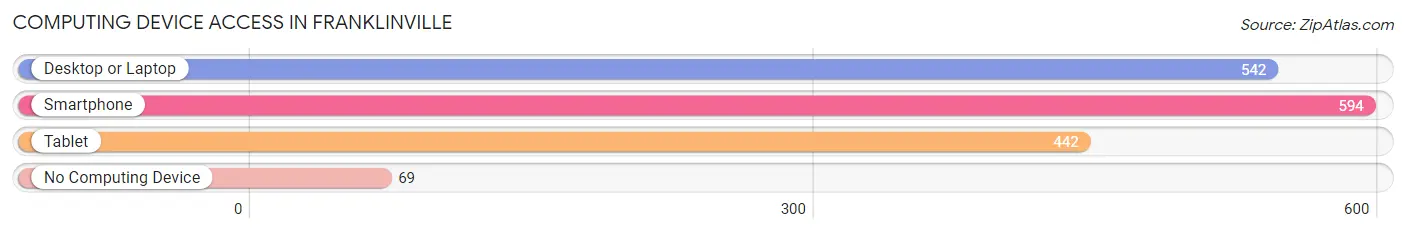
| Device Type | # Households | % Households |
| Desktop or Laptop | 542 | 76.4% |
| Smartphone | 594 | 83.8% |
| Tablet | 442 | 62.3% |
| No Computing Device | 69 | 9.7% |
| Total | 709 | 100.0% |
Internet Access in Franklinville
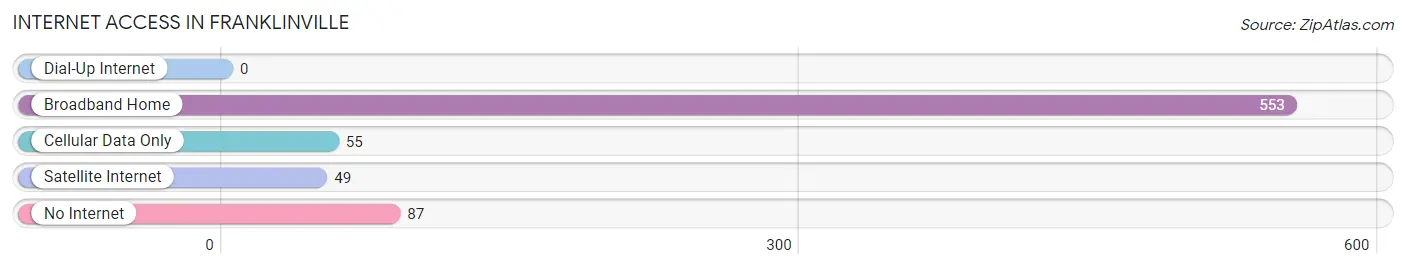
| Internet Type | # Households | % Households |
| Dial-Up Internet | 0 | 0.0% |
| Broadband Home | 553 | 78.0% |
| Cellular Data Only | 55 | 7.8% |
| Satellite Internet | 49 | 6.9% |
| No Internet | 87 | 12.3% |
| Total | 709 | 100.0% |
Franklinville Summary
Franklinville is a small town located in the western part of Cattaraugus County, New York. It is situated in the foothills of the Allegheny Mountains, approximately 30 miles south of Buffalo. The town was founded in 1820 and was named after Benjamin Franklin. The population of Franklinville was 2,845 at the 2010 census.
History
The area that is now Franklinville was originally inhabited by the Seneca Nation of the Iroquois Confederacy. The first white settlers arrived in the area in the late 1700s. The town of Franklinville was established in 1820 and was named after Benjamin Franklin. The first settlers were primarily farmers and the town quickly grew. By the mid-1800s, the town had a population of over 1,000 people.
In the late 1800s, the town began to experience a decline in population as many of the residents moved away to larger cities. The population of Franklinville continued to decline until the 1950s when the town began to experience a resurgence. The town was revitalized by the construction of the Allegheny Reservoir, which provided a source of recreation and tourism for the area.
Geography
Franklinville is located in the western part of Cattaraugus County, New York. It is situated in the foothills of the Allegheny Mountains, approximately 30 miles south of Buffalo. The town is bordered by the towns of Yorkshire to the north, Napoli to the east, and Humphrey to the south. The Allegheny Reservoir is located to the west of the town.
The terrain of Franklinville is mostly rolling hills and valleys. The highest point in the town is 1,400 feet above sea level. The town is home to several small streams, including the Cattaraugus Creek, which flows through the town.
Economy
The economy of Franklinville is largely based on agriculture and tourism. The town is home to several small farms, which produce a variety of crops, including corn, soybeans, and hay. The town is also home to several wineries, which produce a variety of wines.
Tourism is an important part of the economy of Franklinville. The town is home to several recreational areas, including the Allegheny Reservoir, which provides a variety of outdoor activities, such as fishing, boating, and camping. The town is also home to several historic sites, including the Franklinville Historic District, which is listed on the National Register of Historic Places.
Demographics
As of the 2010 census, the population of Franklinville was 2,845. The racial makeup of the town was 97.3% White, 0.7% African American, 0.3% Native American, 0.3% Asian, and 1.4% from other races. Hispanic or Latino of any race were 2.2% of the population.
The median household income in Franklinville was $41,944, and the median family income was $50,000. The per capita income for the town was $20,845. About 11.2% of families and 14.2% of the population were below the poverty line, including 19.2% of those under age 18 and 8.2% of those age 65 or over.
Common Questions
What is Per Capita Income in Franklinville?
Per Capita income in Franklinville is $26,813.
What is the Median Family Income in Franklinville?
Median Family Income in Franklinville is $82,500.
What is the Median Household income in Franklinville?
Median Household Income in Franklinville is $68,438.
What is Income or Wage Gap in Franklinville?
Income or Wage Gap in Franklinville is 41.9%.
Women in Franklinville earn 58.1 cents for every dollar earned by a man.
What is Inequality or Gini Index in Franklinville?
Inequality or Gini Index in Franklinville is 0.38.
What is the Total Population of Franklinville?
Total Population of Franklinville is 2,035.
What is the Total Male Population of Franklinville?
Total Male Population of Franklinville is 959.
What is the Total Female Population of Franklinville?
Total Female Population of Franklinville is 1,076.
What is the Ratio of Males per 100 Females in Franklinville?
There are 89.13 Males per 100 Females in Franklinville.
What is the Ratio of Females per 100 Males in Franklinville?
There are 112.20 Females per 100 Males in Franklinville.
What is the Median Population Age in Franklinville?
Median Population Age in Franklinville is 35.7 Years.
What is the Average Family Size in Franklinville
Average Family Size in Franklinville is 3.3 People.
What is the Average Household Size in Franklinville
Average Household Size in Franklinville is 2.8 People.
How Large is the Labor Force in Franklinville?
There are 984 People in the Labor Forcein in Franklinville.
What is the Percentage of People in the Labor Force in Franklinville?
65.8% of People are in the Labor Force in Franklinville.
What is the Unemployment Rate in Franklinville?
Unemployment Rate in Franklinville is 6.3%.