Marcellus, NY Map & Demographics
Marcellus Map
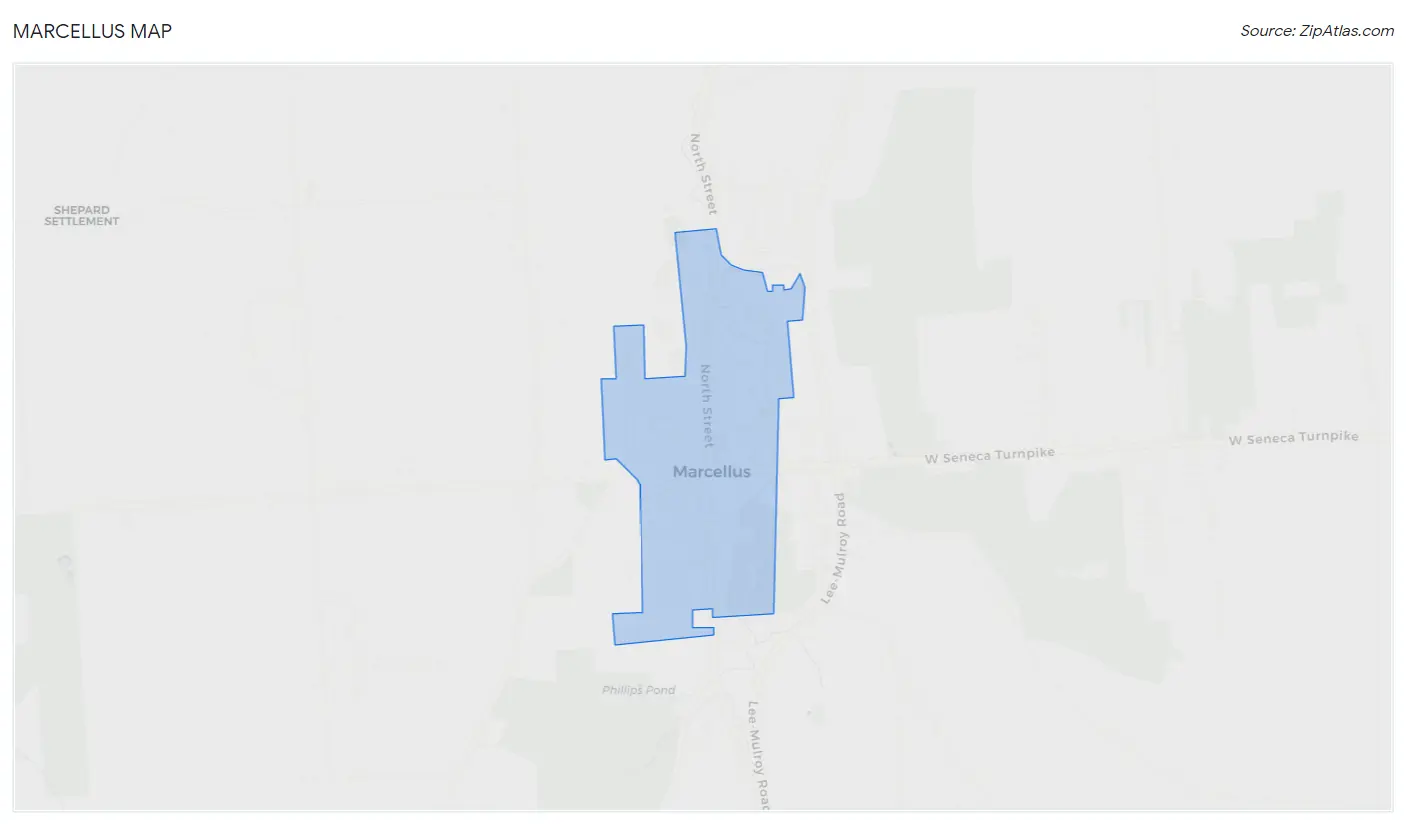
Marcellus Overview
$39,397
PER CAPITA INCOME
$103,000
AVG FAMILY INCOME
$72,028
AVG HOUSEHOLD INCOME
3.7%
WAGE / INCOME GAP [ % ]
96.3¢/ $1
WAGE / INCOME GAP [ $ ]
$12,868
FAMILY INCOME DEFICIT
0.43
INEQUALITY / GINI INDEX
2,048
TOTAL POPULATION
951
MALE POPULATION
1,097
FEMALE POPULATION
86.69
MALES / 100 FEMALES
115.35
FEMALES / 100 MALES
39.0
MEDIAN AGE
2.9
AVG FAMILY SIZE
2.0
AVG HOUSEHOLD SIZE
1,205
LABOR FORCE [ PEOPLE ]
71.2%
PERCENT IN LABOR FORCE
11.5%
UNEMPLOYMENT RATE
Marcellus Zip Codes
Marcellus Area Codes
Income in Marcellus
Income Overview in Marcellus
Per Capita Income in Marcellus is $39,397, while median incomes of families and households are $103,000 and $72,028 respectively.
| Characteristic | Number | Measure |
| Per Capita Income | 2,048 | $39,397 |
| Median Family Income | 466 | $103,000 |
| Mean Family Income | 466 | $116,962 |
| Median Household Income | 1,001 | $72,028 |
| Mean Household Income | 1,001 | $80,452 |
| Income Deficit | 466 | $12,868 |
| Wage / Income Gap (%) | 2,048 | 3.70% |
| Wage / Income Gap ($) | 2,048 | 96.30¢ per $1 |
| Gini / Inequality Index | 2,048 | 0.43 |
Earnings by Sex in Marcellus
Average Earnings in Marcellus are $41,450, $41,063 for men and $42,639 for women, a difference of 3.7%.
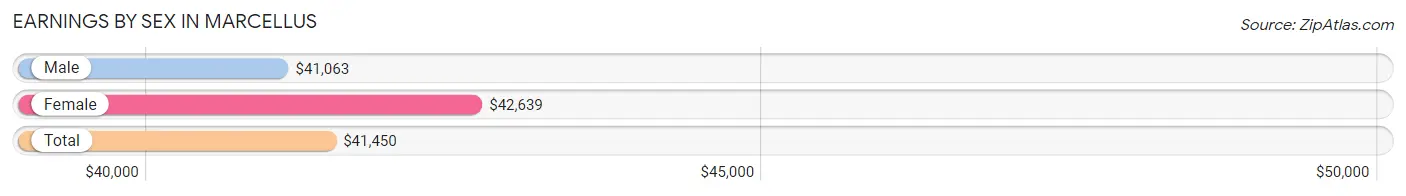
| Sex | Number | Average Earnings |
| Male | 629 (51.4%) | $41,063 |
| Female | 594 (48.6%) | $42,639 |
| Total | 1,223 (100.0%) | $41,450 |
Earnings by Sex by Income Bracket in Marcellus
The most common earnings brackets in Marcellus are $30,000 to $34,999 for men (118 | 18.8%) and $75,000 to $99,999 for women (105 | 17.7%).
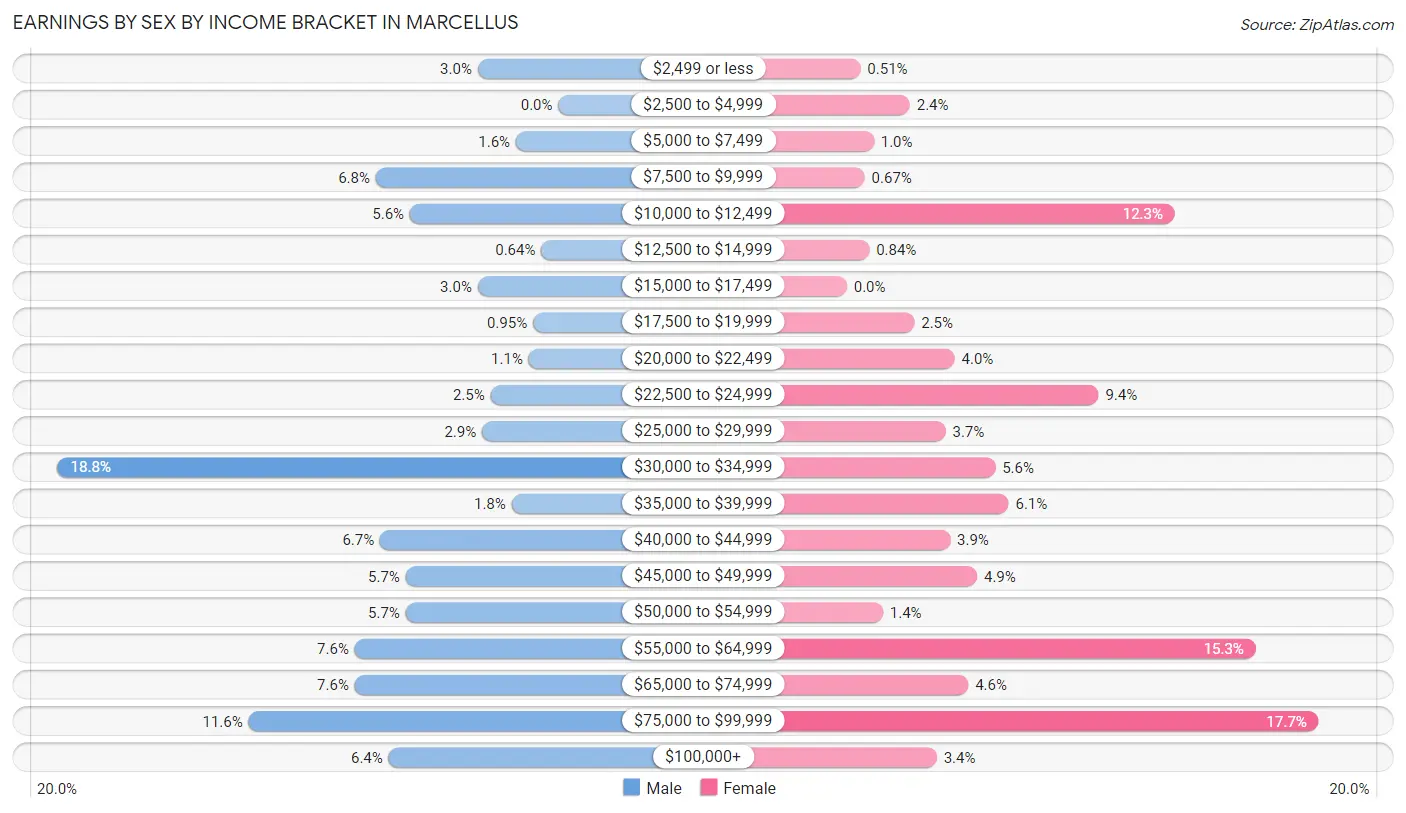
| Income | Male | Female |
| $2,499 or less | 19 (3.0%) | 3 (0.5%) |
| $2,500 to $4,999 | 0 (0.0%) | 14 (2.4%) |
| $5,000 to $7,499 | 10 (1.6%) | 6 (1.0%) |
| $7,500 to $9,999 | 43 (6.8%) | 4 (0.7%) |
| $10,000 to $12,499 | 35 (5.6%) | 73 (12.3%) |
| $12,500 to $14,999 | 4 (0.6%) | 5 (0.8%) |
| $15,000 to $17,499 | 19 (3.0%) | 0 (0.0%) |
| $17,500 to $19,999 | 6 (0.9%) | 15 (2.5%) |
| $20,000 to $22,499 | 7 (1.1%) | 24 (4.0%) |
| $22,500 to $24,999 | 16 (2.5%) | 56 (9.4%) |
| $25,000 to $29,999 | 18 (2.9%) | 22 (3.7%) |
| $30,000 to $34,999 | 118 (18.8%) | 33 (5.6%) |
| $35,000 to $39,999 | 11 (1.8%) | 36 (6.1%) |
| $40,000 to $44,999 | 42 (6.7%) | 23 (3.9%) |
| $45,000 to $49,999 | 36 (5.7%) | 29 (4.9%) |
| $50,000 to $54,999 | 36 (5.7%) | 8 (1.3%) |
| $55,000 to $64,999 | 48 (7.6%) | 91 (15.3%) |
| $65,000 to $74,999 | 48 (7.6%) | 27 (4.5%) |
| $75,000 to $99,999 | 73 (11.6%) | 105 (17.7%) |
| $100,000+ | 40 (6.4%) | 20 (3.4%) |
| Total | 629 (100.0%) | 594 (100.0%) |
Earnings by Sex by Educational Attainment in Marcellus
Average earnings in Marcellus are $43,750 for men and $48,352 for women, a difference of 9.5%. Men with an educational attainment of graduate degree enjoy the highest average annual earnings of $74,107, while those with college or associate's degree education earn the least with $33,779. Women with an educational attainment of graduate degree earn the most with the average annual earnings of $74,219, while those with high school diploma education have the smallest earnings of $23,547.
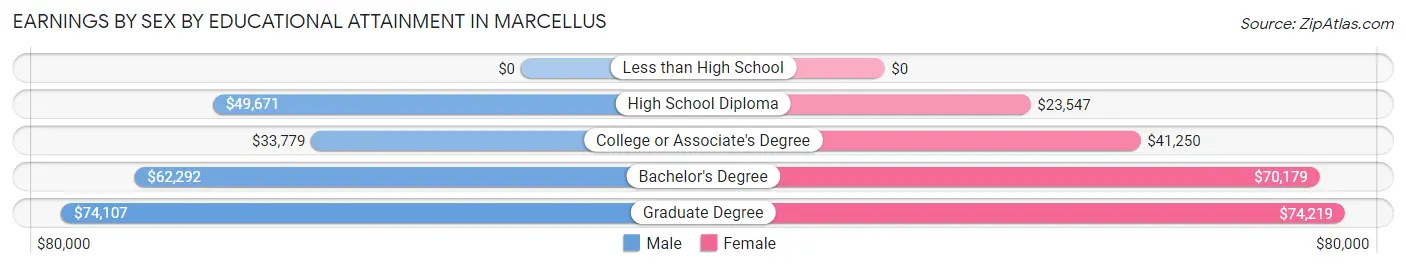
| Educational Attainment | Male Income | Female Income |
| Less than High School | - | - |
| High School Diploma | $49,671 | $23,547 |
| College or Associate's Degree | $33,779 | $41,250 |
| Bachelor's Degree | $62,292 | $70,179 |
| Graduate Degree | $74,107 | $74,219 |
| Total | $43,750 | $48,352 |
Family Income in Marcellus
Family Income Brackets in Marcellus
According to the Marcellus family income data, there are 112 families falling into the $100,000 to $149,999 income range, which is the most common income bracket and makes up 24.0% of all families.
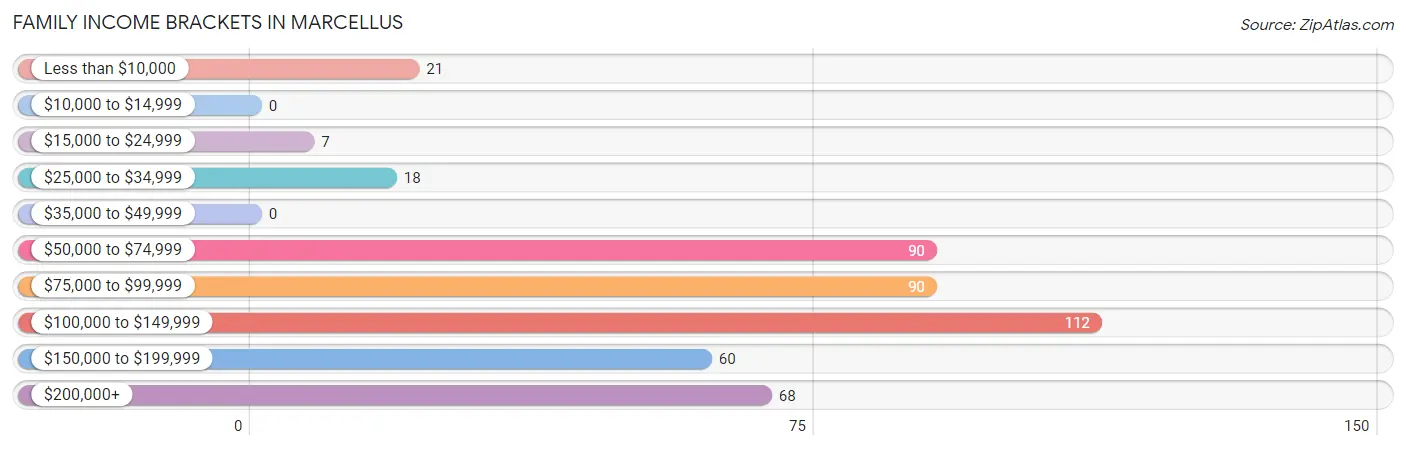
| Income Bracket | # Families | % Families |
| Less than $10,000 | 21 | 4.5% |
| $10,000 to $14,999 | 0 | 0.0% |
| $15,000 to $24,999 | 7 | 1.5% |
| $25,000 to $34,999 | 18 | 3.9% |
| $35,000 to $49,999 | 0 | 0.0% |
| $50,000 to $74,999 | 90 | 19.3% |
| $75,000 to $99,999 | 90 | 19.3% |
| $100,000 to $149,999 | 112 | 24.0% |
| $150,000 to $199,999 | 60 | 12.9% |
| $200,000+ | 68 | 14.6% |
Family Income by Famaliy Size in Marcellus
4-person families (107 | 23.0%) account for the highest median family income in Marcellus with $147,031 per family, while 2-person families (236 | 50.6%) have the highest median income of $43,250 per family member.
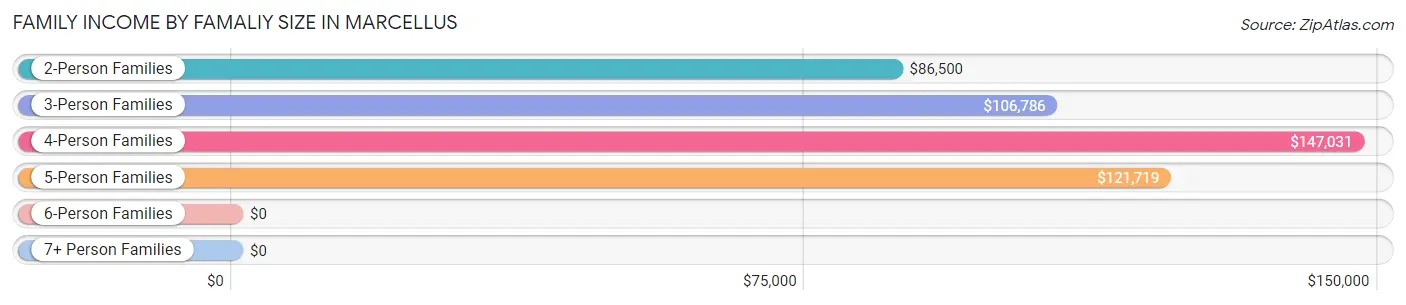
| Income Bracket | # Families | Median Income |
| 2-Person Families | 236 (50.6%) | $86,500 |
| 3-Person Families | 96 (20.6%) | $106,786 |
| 4-Person Families | 107 (23.0%) | $147,031 |
| 5-Person Families | 23 (4.9%) | $121,719 |
| 6-Person Families | 4 (0.9%) | $0 |
| 7+ Person Families | 0 (0.0%) | $0 |
| Total | 466 (100.0%) | $103,000 |
Family Income by Number of Earners in Marcellus
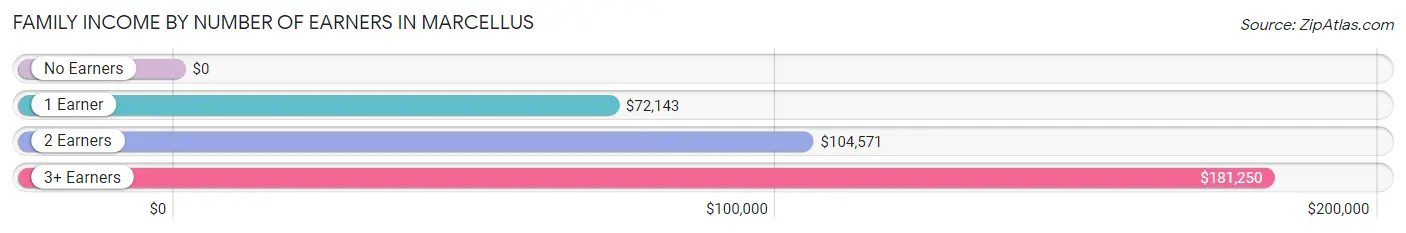
| Number of Earners | # Families | Median Income |
| No Earners | 38 (8.2%) | $0 |
| 1 Earner | 164 (35.2%) | $72,143 |
| 2 Earners | 210 (45.1%) | $104,571 |
| 3+ Earners | 54 (11.6%) | $181,250 |
| Total | 466 (100.0%) | $103,000 |
Household Income in Marcellus
Household Income Brackets in Marcellus
With 216 households falling in the category, the $50,000 to $74,999 income range is the most frequent in Marcellus, accounting for 21.6% of all households. In contrast, only 46 households (4.6%) fall into the less than $10,000 income bracket, making it the least populous group.
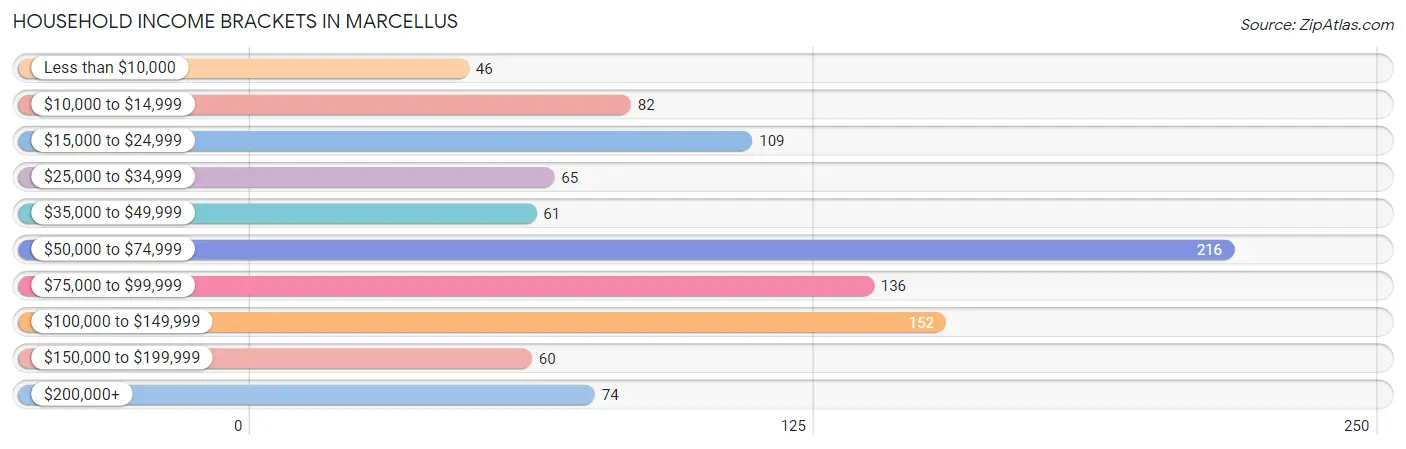
| Income Bracket | # Households | % Households |
| Less than $10,000 | 46 | 4.6% |
| $10,000 to $14,999 | 82 | 8.2% |
| $15,000 to $24,999 | 109 | 10.9% |
| $25,000 to $34,999 | 65 | 6.5% |
| $35,000 to $49,999 | 61 | 6.1% |
| $50,000 to $74,999 | 216 | 21.6% |
| $75,000 to $99,999 | 136 | 13.6% |
| $100,000 to $149,999 | 152 | 15.2% |
| $150,000 to $199,999 | 60 | 6.0% |
| $200,000+ | 74 | 7.4% |
Household Income by Householder Age in Marcellus
The median household income in Marcellus is $72,028, with the highest median household income of $86,500 found in the 45 to 64 years age bracket for the primary householder. A total of 326 households (32.6%) fall into this category. Meanwhile, the 15 to 24 years age bracket for the primary householder has the lowest median household income of $0, with 21 households (2.1%) in this group.
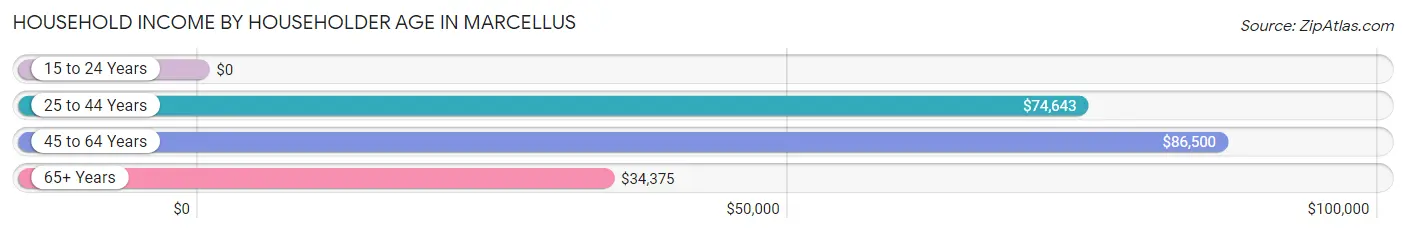
| Income Bracket | # Households | Median Income |
| 15 to 24 Years | 21 (2.1%) | $0 |
| 25 to 44 Years | 356 (35.6%) | $74,643 |
| 45 to 64 Years | 326 (32.6%) | $86,500 |
| 65+ Years | 298 (29.8%) | $34,375 |
| Total | 1,001 (100.0%) | $72,028 |
Poverty in Marcellus
Income Below Poverty by Sex and Age in Marcellus
With 5.9% poverty level for males and 13.3% for females among the residents of Marcellus, under 5 year old males and under 5 year old females are the most vulnerable to poverty, with 11 males (27.5%) and 8 females (57.1%) in their respective age groups living below the poverty level.
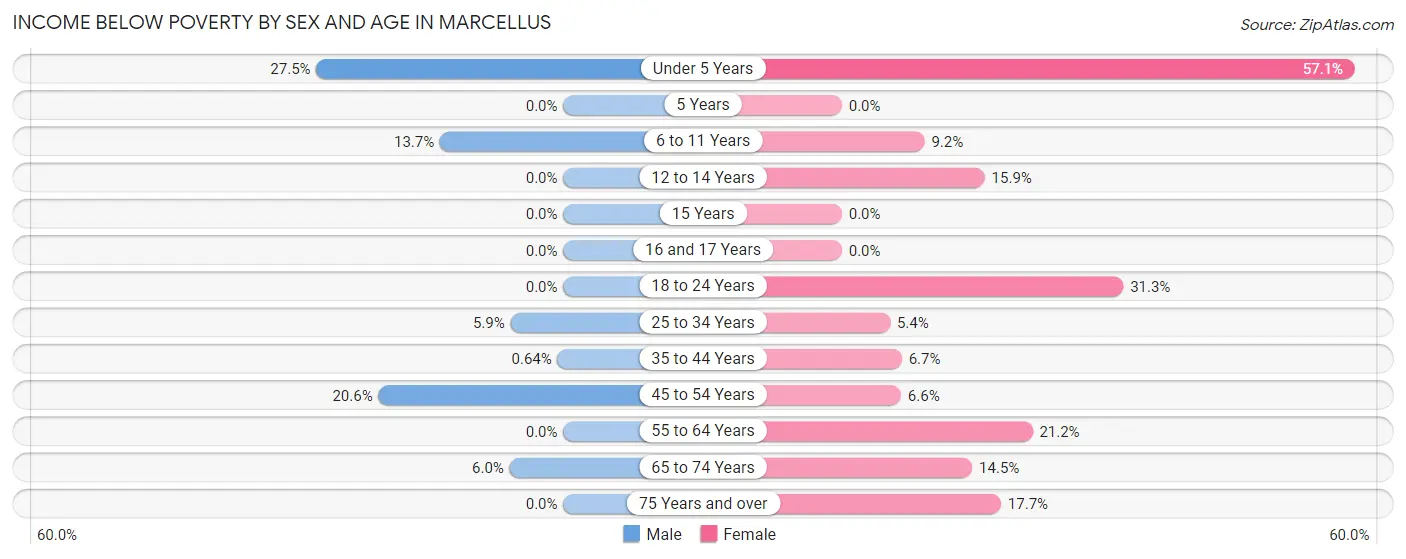
| Age Bracket | Male | Female |
| Under 5 Years | 11 (27.5%) | 8 (57.1%) |
| 5 Years | 0 (0.0%) | 0 (0.0%) |
| 6 to 11 Years | 7 (13.7%) | 7 (9.2%) |
| 12 to 14 Years | 0 (0.0%) | 7 (15.9%) |
| 15 Years | 0 (0.0%) | 0 (0.0%) |
| 16 and 17 Years | 0 (0.0%) | 0 (0.0%) |
| 18 to 24 Years | 0 (0.0%) | 21 (31.3%) |
| 25 to 34 Years | 9 (5.9%) | 6 (5.4%) |
| 35 to 44 Years | 1 (0.6%) | 14 (6.7%) |
| 45 to 54 Years | 21 (20.6%) | 5 (6.6%) |
| 55 to 64 Years | 0 (0.0%) | 45 (21.2%) |
| 65 to 74 Years | 7 (6.0%) | 18 (14.5%) |
| 75 Years and over | 0 (0.0%) | 14 (17.7%) |
| Total | 56 (5.9%) | 145 (13.3%) |
Income Above Poverty by Sex and Age in Marcellus
According to the poverty statistics in Marcellus, males aged 12 to 14 years and females aged 15 years are the age groups that are most secure financially, with 100.0% of males and 100.0% of females in these age groups living above the poverty line.
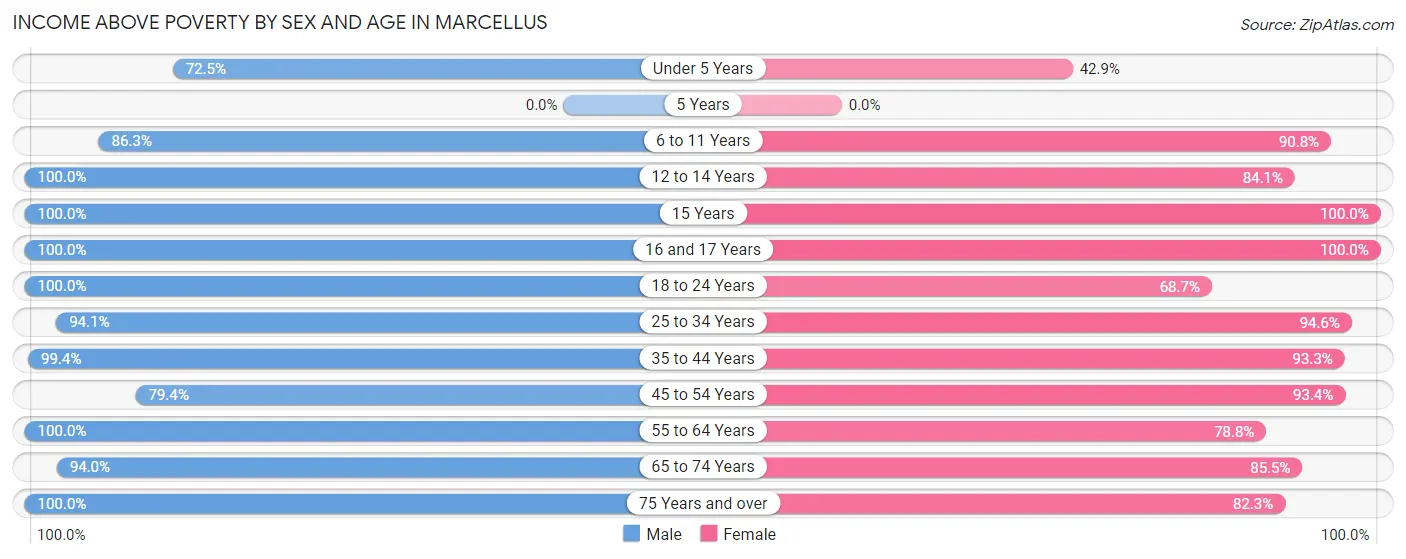
| Age Bracket | Male | Female |
| Under 5 Years | 29 (72.5%) | 6 (42.9%) |
| 5 Years | 0 (0.0%) | 0 (0.0%) |
| 6 to 11 Years | 44 (86.3%) | 69 (90.8%) |
| 12 to 14 Years | 54 (100.0%) | 37 (84.1%) |
| 15 Years | 13 (100.0%) | 59 (100.0%) |
| 16 and 17 Years | 15 (100.0%) | 19 (100.0%) |
| 18 to 24 Years | 64 (100.0%) | 46 (68.7%) |
| 25 to 34 Years | 144 (94.1%) | 106 (94.6%) |
| 35 to 44 Years | 156 (99.4%) | 196 (93.3%) |
| 45 to 54 Years | 81 (79.4%) | 71 (93.4%) |
| 55 to 64 Years | 123 (100.0%) | 167 (78.8%) |
| 65 to 74 Years | 110 (94.0%) | 106 (85.5%) |
| 75 Years and over | 62 (100.0%) | 65 (82.3%) |
| Total | 895 (94.1%) | 947 (86.7%) |
Income Below Poverty Among Married-Couple Families in Marcellus
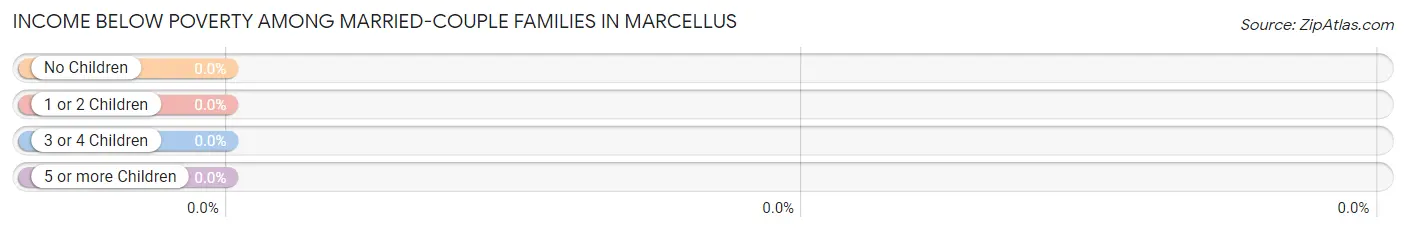
| Children | Above Poverty | Below Poverty |
| No Children | 177 (100.0%) | 0 (0.0%) |
| 1 or 2 Children | 104 (100.0%) | 0 (0.0%) |
| 3 or 4 Children | 14 (100.0%) | 0 (0.0%) |
| 5 or more Children | 0 (0.0%) | 0 (0.0%) |
| Total | 295 (100.0%) | 0 (0.0%) |
Income Below Poverty Among Single-Parent Households in Marcellus
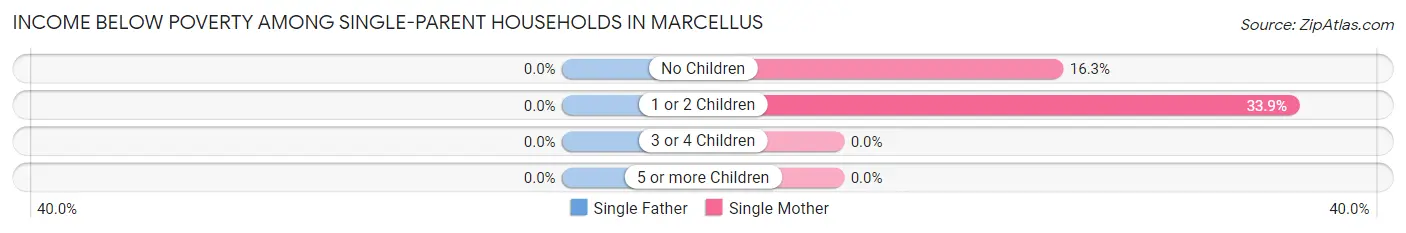
| Children | Single Father | Single Mother |
| No Children | 0 (0.0%) | 8 (16.3%) |
| 1 or 2 Children | 0 (0.0%) | 20 (33.9%) |
| 3 or 4 Children | 0 (0.0%) | 0 (0.0%) |
| 5 or more Children | 0 (0.0%) | 0 (0.0%) |
| Total | 0 (0.0%) | 28 (25.9%) |
Income Below Poverty Among Married-Couple vs Single-Parent Households in Marcellus
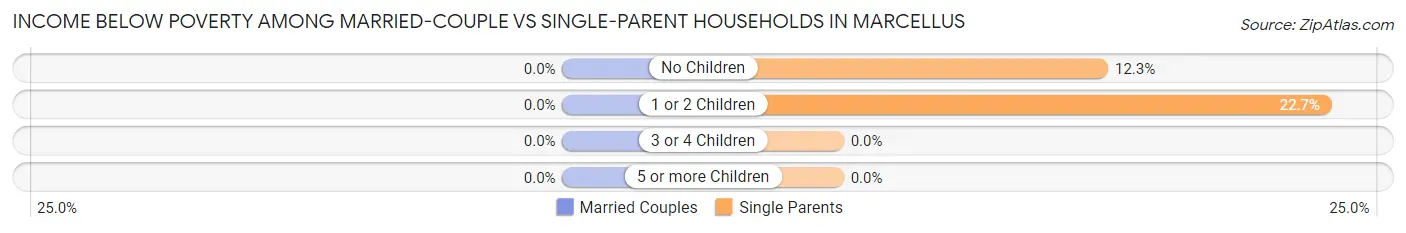
| Children | Married-Couple Families | Single-Parent Households |
| No Children | 0 (0.0%) | 8 (12.3%) |
| 1 or 2 Children | 0 (0.0%) | 20 (22.7%) |
| 3 or 4 Children | 0 (0.0%) | 0 (0.0%) |
| 5 or more Children | 0 (0.0%) | 0 (0.0%) |
| Total | 0 (0.0%) | 28 (16.4%) |
Race in Marcellus
The most populous races in Marcellus are White / Caucasian (2,004 | 97.9%), Hispanic or Latino (36 | 1.8%), and Two or more Races (30 | 1.5%).
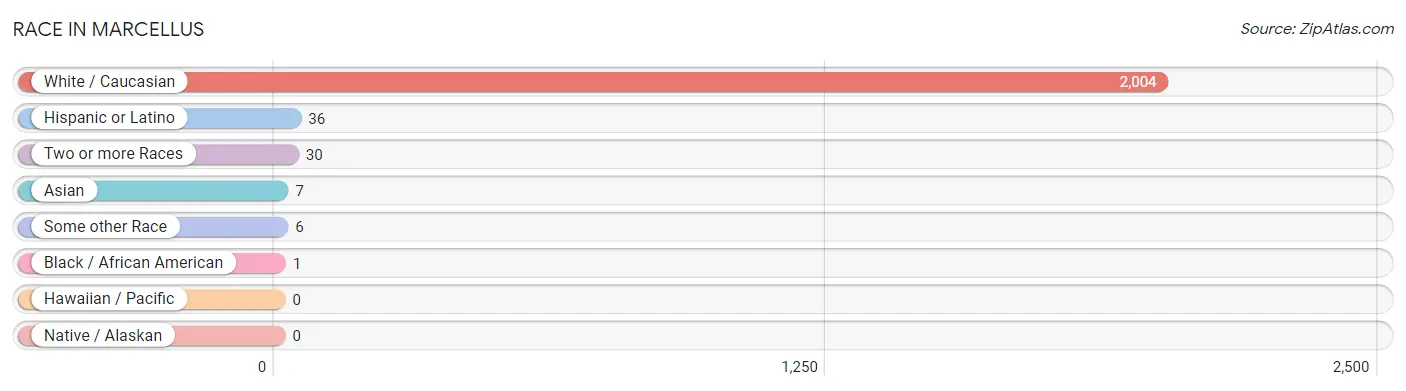
| Race | # Population | % Population |
| Asian | 7 | 0.3% |
| Black / African American | 1 | 0.1% |
| Hawaiian / Pacific | 0 | 0.0% |
| Hispanic or Latino | 36 | 1.8% |
| Native / Alaskan | 0 | 0.0% |
| White / Caucasian | 2,004 | 97.9% |
| Two or more Races | 30 | 1.5% |
| Some other Race | 6 | 0.3% |
| Total | 2,048 | 100.0% |
Ancestry in Marcellus
The most populous ancestries reported in Marcellus are Irish (602 | 29.4%), English (423 | 20.6%), German (244 | 11.9%), Italian (207 | 10.1%), and Polish (195 | 9.5%), together accounting for 81.6% of all Marcellus residents.
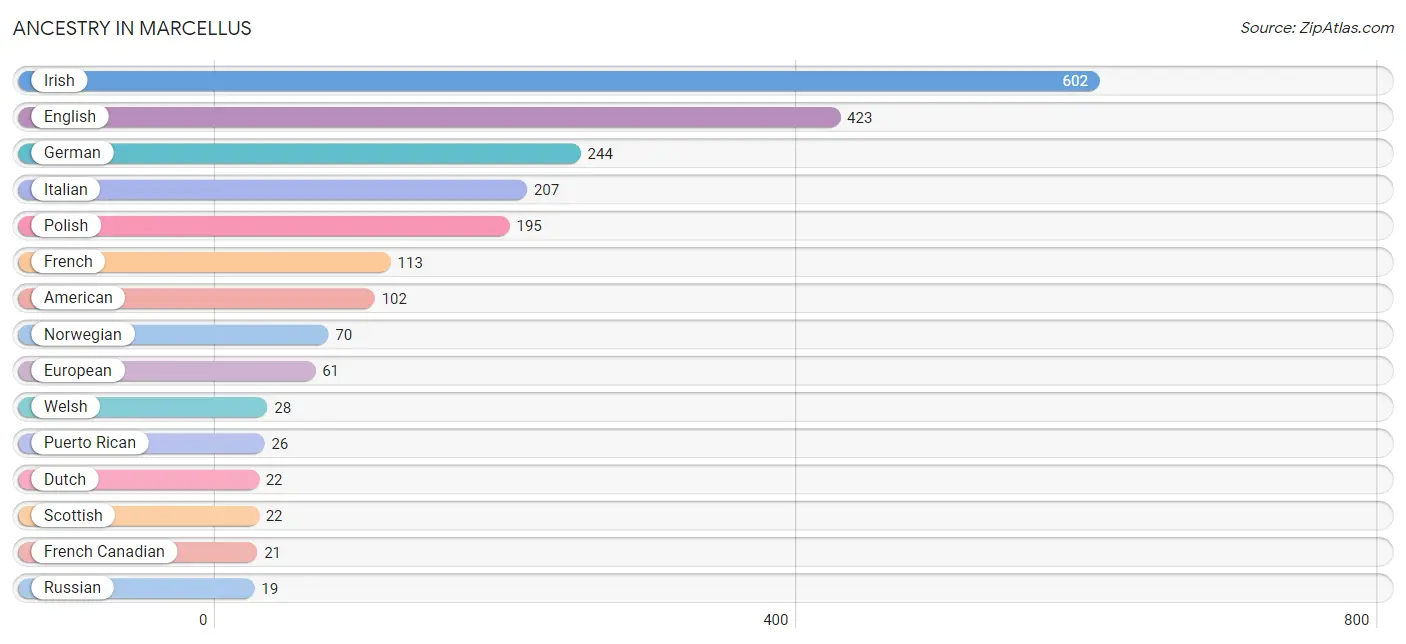
| Ancestry | # Population | % Population |
| American | 102 | 5.0% |
| Austrian | 12 | 0.6% |
| British | 5 | 0.2% |
| Canadian | 7 | 0.3% |
| Central American | 4 | 0.2% |
| Danish | 4 | 0.2% |
| Dutch | 22 | 1.1% |
| Eastern European | 8 | 0.4% |
| English | 423 | 20.6% |
| European | 61 | 3.0% |
| French | 113 | 5.5% |
| French Canadian | 21 | 1.0% |
| German | 244 | 11.9% |
| Guatemalan | 4 | 0.2% |
| Hungarian | 5 | 0.2% |
| Indian (Asian) | 7 | 0.3% |
| Irish | 602 | 29.4% |
| Italian | 207 | 10.1% |
| Norwegian | 70 | 3.4% |
| Polish | 195 | 9.5% |
| Portuguese | 6 | 0.3% |
| Puerto Rican | 26 | 1.3% |
| Russian | 19 | 0.9% |
| Scotch-Irish | 18 | 0.9% |
| Scottish | 22 | 1.1% |
| Slovak | 18 | 0.9% |
| Swedish | 6 | 0.3% |
| Ukrainian | 18 | 0.9% |
| Welsh | 28 | 1.4% | View All 29 Rows |
Immigrants in Marcellus
The most numerous immigrant groups reported in Marcellus came from Europe (12 | 0.6%), Latin America (8 | 0.4%), Asia (7 | 0.3%), China (7 | 0.3%), and Eastern Asia (7 | 0.3%), together accounting for 2.0% of all Marcellus residents.
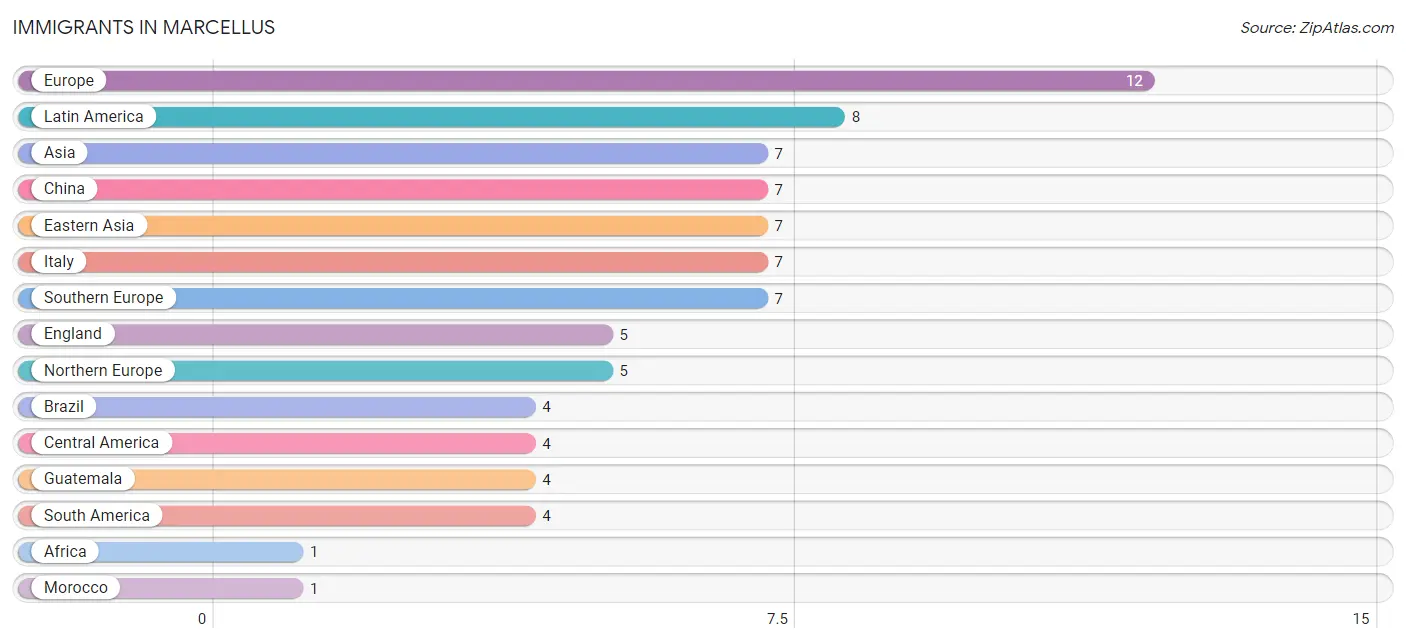
| Immigration Origin | # Population | % Population |
| Africa | 1 | 0.1% |
| Asia | 7 | 0.3% |
| Brazil | 4 | 0.2% |
| Central America | 4 | 0.2% |
| China | 7 | 0.3% |
| Eastern Asia | 7 | 0.3% |
| England | 5 | 0.2% |
| Europe | 12 | 0.6% |
| Guatemala | 4 | 0.2% |
| Italy | 7 | 0.3% |
| Latin America | 8 | 0.4% |
| Morocco | 1 | 0.1% |
| Northern Africa | 1 | 0.1% |
| Northern Europe | 5 | 0.2% |
| South America | 4 | 0.2% |
| Southern Europe | 7 | 0.3% | View All 16 Rows |
Sex and Age in Marcellus
Sex and Age in Marcellus
The most populous age groups in Marcellus are 35 to 39 Years (113 | 11.9%) for men and 35 to 39 Years (147 | 13.4%) for women.
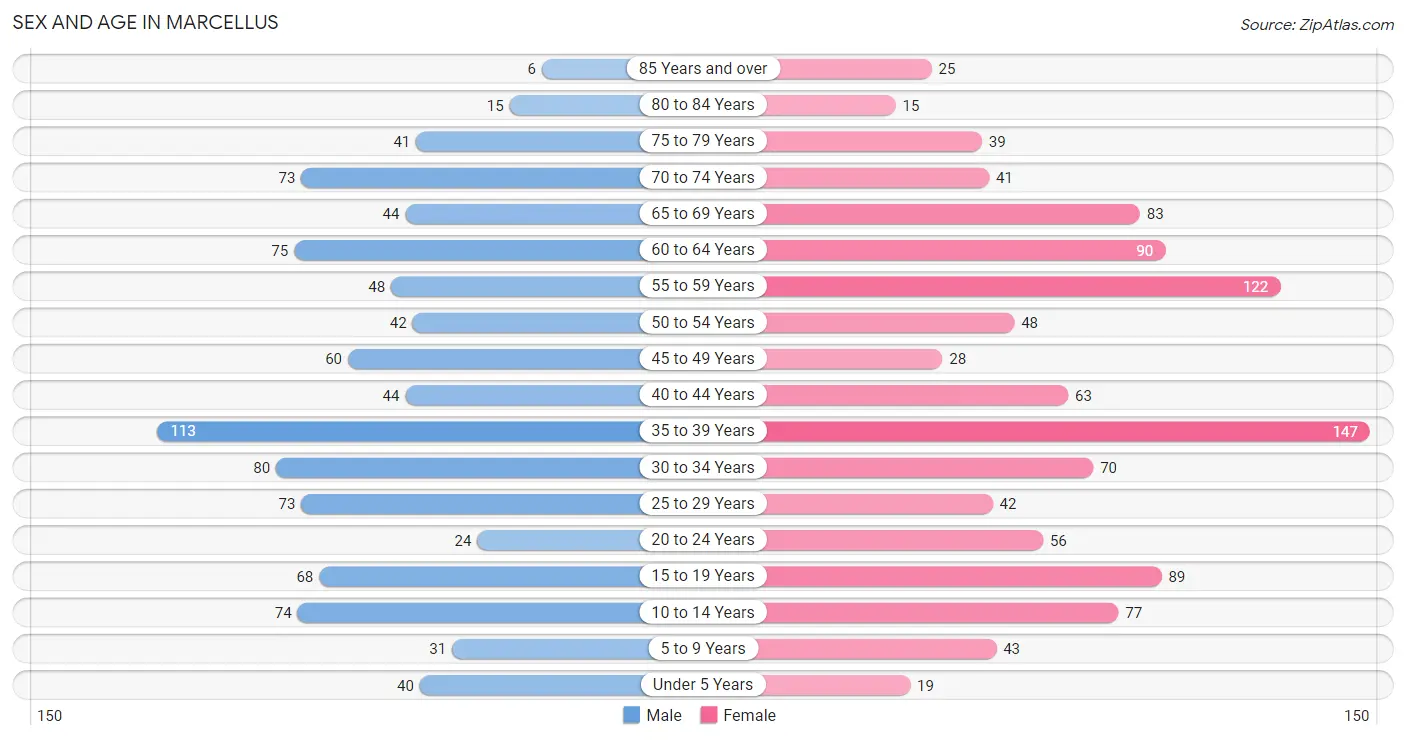
| Age Bracket | Male | Female |
| Under 5 Years | 40 (4.2%) | 19 (1.7%) |
| 5 to 9 Years | 31 (3.3%) | 43 (3.9%) |
| 10 to 14 Years | 74 (7.8%) | 77 (7.0%) |
| 15 to 19 Years | 68 (7.1%) | 89 (8.1%) |
| 20 to 24 Years | 24 (2.5%) | 56 (5.1%) |
| 25 to 29 Years | 73 (7.7%) | 42 (3.8%) |
| 30 to 34 Years | 80 (8.4%) | 70 (6.4%) |
| 35 to 39 Years | 113 (11.9%) | 147 (13.4%) |
| 40 to 44 Years | 44 (4.6%) | 63 (5.7%) |
| 45 to 49 Years | 60 (6.3%) | 28 (2.5%) |
| 50 to 54 Years | 42 (4.4%) | 48 (4.4%) |
| 55 to 59 Years | 48 (5.1%) | 122 (11.1%) |
| 60 to 64 Years | 75 (7.9%) | 90 (8.2%) |
| 65 to 69 Years | 44 (4.6%) | 83 (7.6%) |
| 70 to 74 Years | 73 (7.7%) | 41 (3.7%) |
| 75 to 79 Years | 41 (4.3%) | 39 (3.6%) |
| 80 to 84 Years | 15 (1.6%) | 15 (1.4%) |
| 85 Years and over | 6 (0.6%) | 25 (2.3%) |
| Total | 951 (100.0%) | 1,097 (100.0%) |
Families and Households in Marcellus
Median Family Size in Marcellus
The median family size in Marcellus is 2.91 persons per family, with married-couple families (295 | 63.3%) accounting for the largest median family size of 3.15 persons per family. On the other hand, single female/mother families (108 | 23.2%) represent the smallest median family size with 2.43 persons per family.
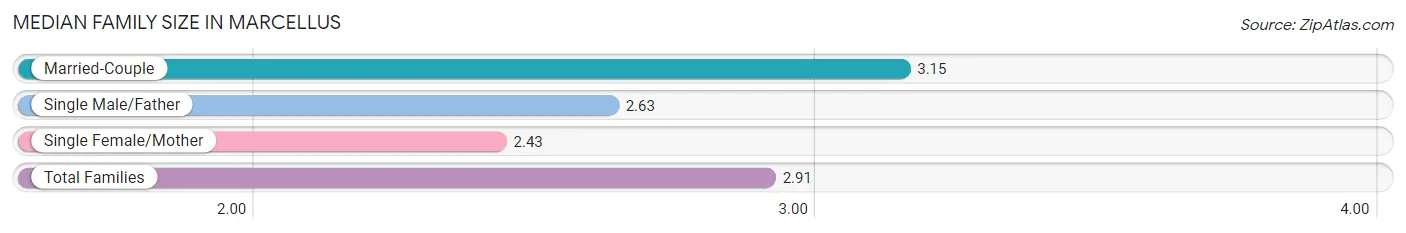
| Family Type | # Families | Family Size |
| Married-Couple | 295 (63.3%) | 3.15 |
| Single Male/Father | 63 (13.5%) | 2.63 |
| Single Female/Mother | 108 (23.2%) | 2.43 |
| Total Families | 466 (100.0%) | 2.91 |
Median Household Size in Marcellus
The median household size in Marcellus is 2.04 persons per household, with married-couple households (295 | 29.5%) accounting for the largest median household size of 3.15 persons per household. non-family households (535 | 53.4%) represent the smallest median household size with 1.19 persons per household.
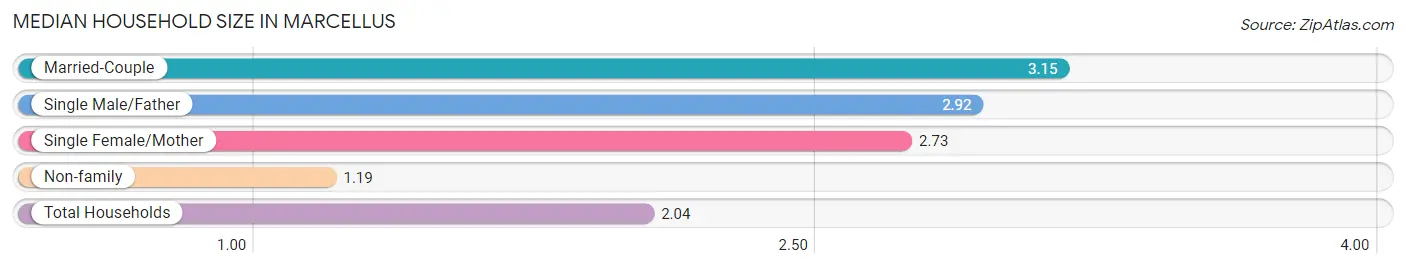
| Household Type | # Households | Household Size |
| Married-Couple | 295 (29.5%) | 3.15 |
| Single Male/Father | 63 (6.3%) | 2.92 |
| Single Female/Mother | 108 (10.8%) | 2.73 |
| Non-family | 535 (53.4%) | 1.19 |
| Total Households | 1,001 (100.0%) | 2.04 |
Household Size by Marriage Status in Marcellus
Out of a total of 1,001 households in Marcellus, 466 (46.6%) are family households, while 535 (53.4%) are nonfamily households. The most numerous type of family households are 2-person households, comprising 220, and the most common type of nonfamily households are 1-person households, comprising 409.
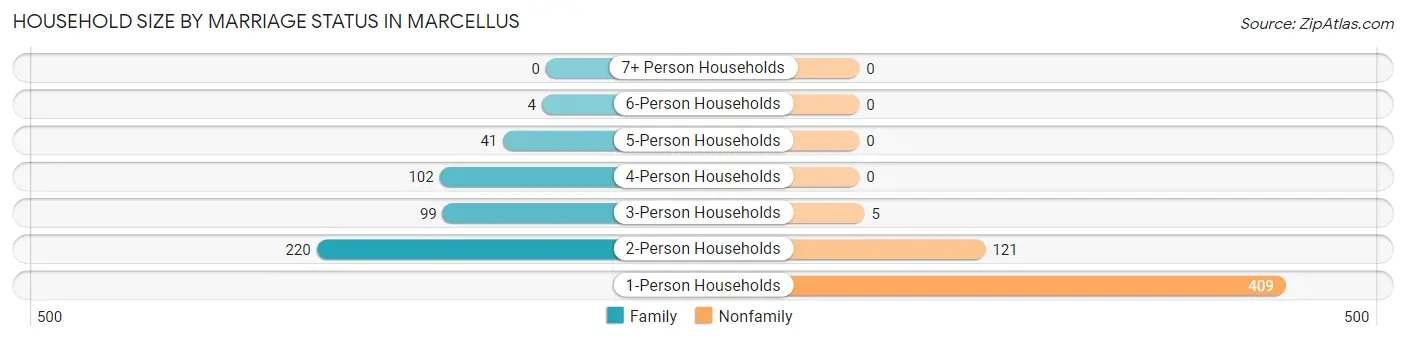
| Household Size | Family Households | Nonfamily Households |
| 1-Person Households | - | 409 (40.9%) |
| 2-Person Households | 220 (22.0%) | 121 (12.1%) |
| 3-Person Households | 99 (9.9%) | 5 (0.5%) |
| 4-Person Households | 102 (10.2%) | 0 (0.0%) |
| 5-Person Households | 41 (4.1%) | 0 (0.0%) |
| 6-Person Households | 4 (0.4%) | 0 (0.0%) |
| 7+ Person Households | 0 (0.0%) | 0 (0.0%) |
| Total | 466 (46.6%) | 535 (53.4%) |
Female Fertility in Marcellus
Fertility by Age in Marcellus
Average fertility rate in Marcellus is 12.0 births per 1,000 women. Women in the age bracket of 20 to 34 years have the highest fertility rate with 36.0 births per 1,000 women. Women in the age bracket of 20 to 34 years acount for 100.0% of all women with births.
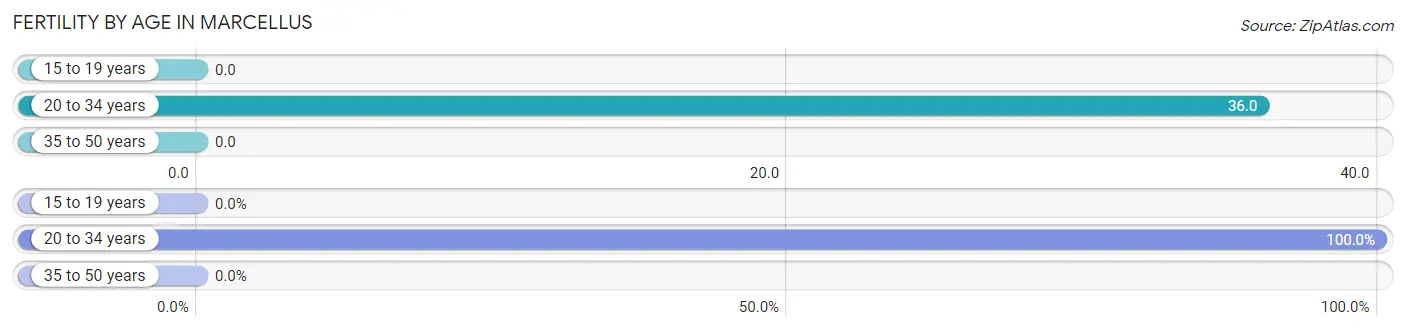
| Age Bracket | Women with Births | Births / 1,000 Women |
| 15 to 19 years | 0 (0.0%) | 0.0 |
| 20 to 34 years | 6 (100.0%) | 36.0 |
| 35 to 50 years | 0 (0.0%) | 0.0 |
| Total | 6 (100.0%) | 12.0 |
Fertility by Age by Marriage Status in Marcellus
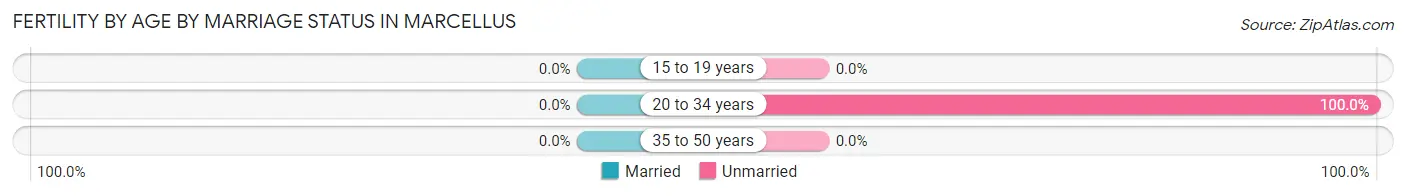
| Age Bracket | Married | Unmarried |
| 15 to 19 years | 0 (0.0%) | 0 (0.0%) |
| 20 to 34 years | 0 (0.0%) | 6 (100.0%) |
| 35 to 50 years | 0 (0.0%) | 0 (0.0%) |
| Total | 0 (0.0%) | 6 (100.0%) |
Fertility by Education in Marcellus
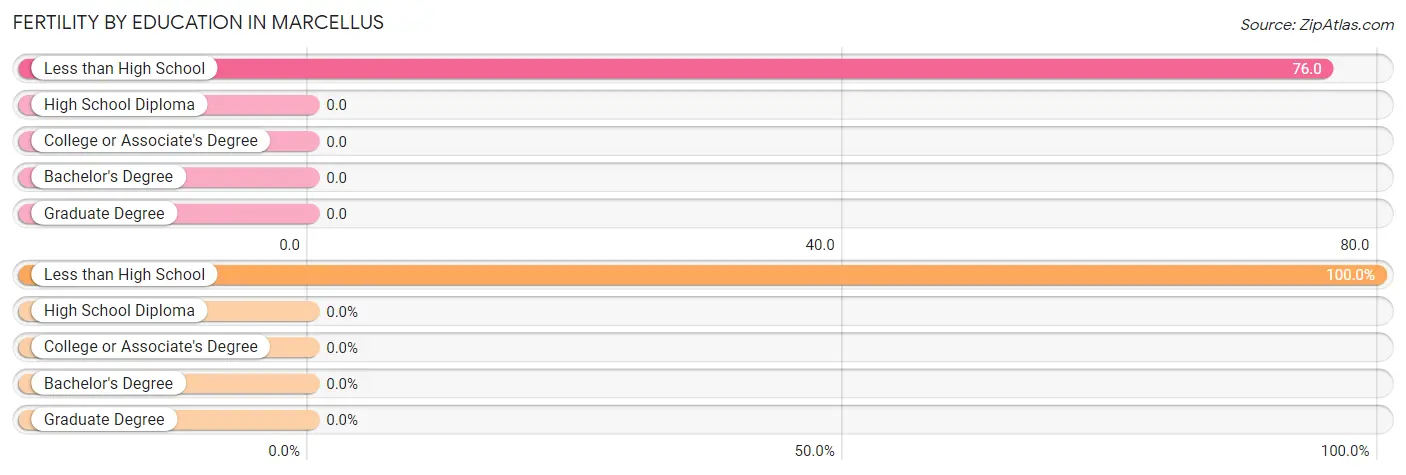
| Educational Attainment | Women with Births | Births / 1,000 Women |
| Less than High School | 6 (100.0%) | 76.0 |
| High School Diploma | 0 (0.0%) | 0.0 |
| College or Associate's Degree | 0 (0.0%) | 0.0 |
| Bachelor's Degree | 0 (0.0%) | 0.0 |
| Graduate Degree | 0 (0.0%) | 0.0 |
| Total | 6 (100.0%) | 12.0 |
Fertility by Education by Marriage Status in Marcellus
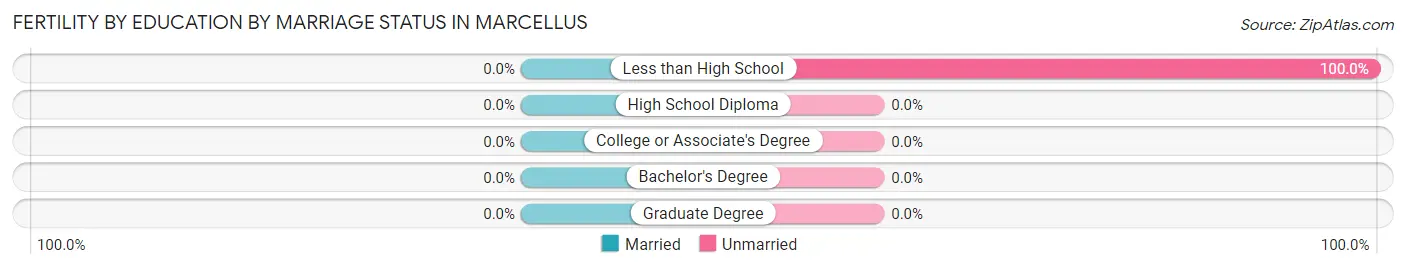
| Educational Attainment | Married | Unmarried |
| Less than High School | 0 (0.0%) | 6 (100.0%) |
| High School Diploma | 0 (0.0%) | 0 (0.0%) |
| College or Associate's Degree | 0 (0.0%) | 0 (0.0%) |
| Bachelor's Degree | 0 (0.0%) | 0 (0.0%) |
| Graduate Degree | 0 (0.0%) | 0 (0.0%) |
| Total | 0 (0.0%) | 6 (100.0%) |
Employment Characteristics in Marcellus
Employment by Class of Employer in Marcellus
Among the 1,067 employed individuals in Marcellus, private company employees (544 | 51.0%), not-for-profit organizations (149 | 14.0%), and local government employees (126 | 11.8%) make up the most common classes of employment.
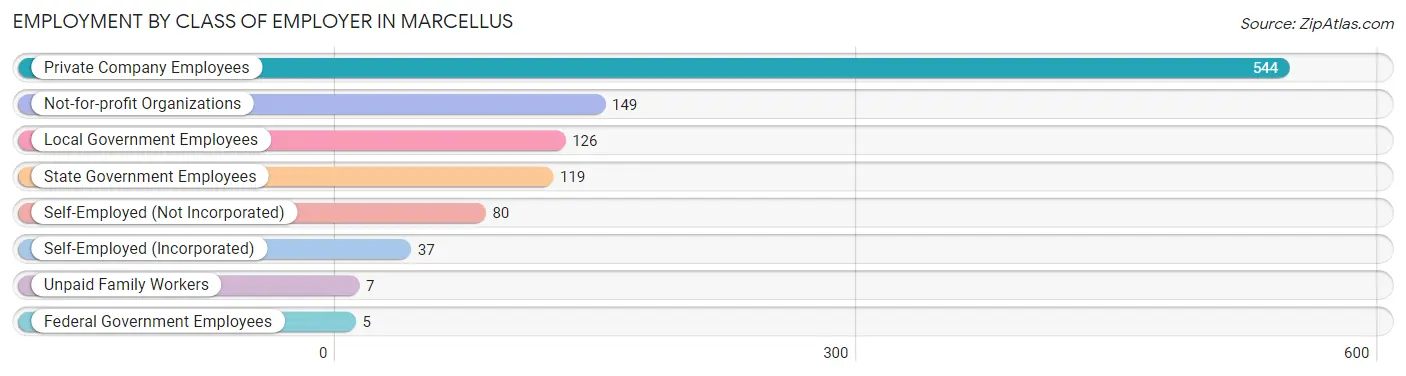
| Employer Class | # Employees | % Employees |
| Private Company Employees | 544 | 51.0% |
| Self-Employed (Incorporated) | 37 | 3.5% |
| Self-Employed (Not Incorporated) | 80 | 7.5% |
| Not-for-profit Organizations | 149 | 14.0% |
| Local Government Employees | 126 | 11.8% |
| State Government Employees | 119 | 11.2% |
| Federal Government Employees | 5 | 0.5% |
| Unpaid Family Workers | 7 | 0.7% |
| Total | 1,067 | 100.0% |
Employment Status by Age in Marcellus
According to the labor force statistics for Marcellus, out of the total population over 16 years of age (1,692), 71.2% or 1,205 individuals are in the labor force, with 11.5% or 139 of them unemployed. The age group with the highest labor force participation rate is 30 to 34 years, with 100.0% or 150 individuals in the labor force. Within the labor force, the 35 to 44 years age range has the highest percentage of unemployed individuals, with 31.8% or 114 of them being unemployed.
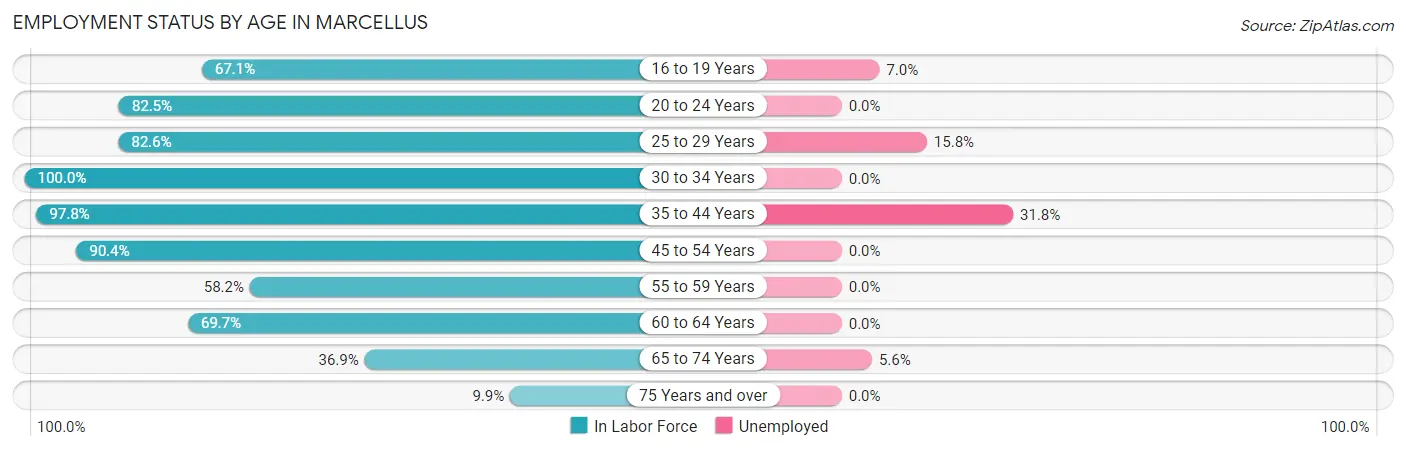
| Age Bracket | In Labor Force | Unemployed |
| 16 to 19 Years | 57 (67.1%) | 4 (7.0%) |
| 20 to 24 Years | 66 (82.5%) | 0 (0.0%) |
| 25 to 29 Years | 95 (82.6%) | 15 (15.8%) |
| 30 to 34 Years | 150 (100.0%) | 0 (0.0%) |
| 35 to 44 Years | 359 (97.8%) | 114 (31.8%) |
| 45 to 54 Years | 161 (90.4%) | 0 (0.0%) |
| 55 to 59 Years | 99 (58.2%) | 0 (0.0%) |
| 60 to 64 Years | 115 (69.7%) | 0 (0.0%) |
| 65 to 74 Years | 89 (36.9%) | 5 (5.6%) |
| 75 Years and over | 14 (9.9%) | 0 (0.0%) |
| Total | 1,205 (71.2%) | 139 (11.5%) |
Employment Status by Educational Attainment in Marcellus
According to labor force statistics for Marcellus, 85.5% of individuals (979) out of the total population between 25 and 64 years of age (1,145) are in the labor force, with 13.2% or 129 of them being unemployed. The group with the highest labor force participation rate are those with the educational attainment of bachelor's degree or higher, with 88.5% or 391 individuals in the labor force. Within the labor force, individuals with high school diploma education have the highest percentage of unemployment, with 22.9% or 52 of them being unemployed.
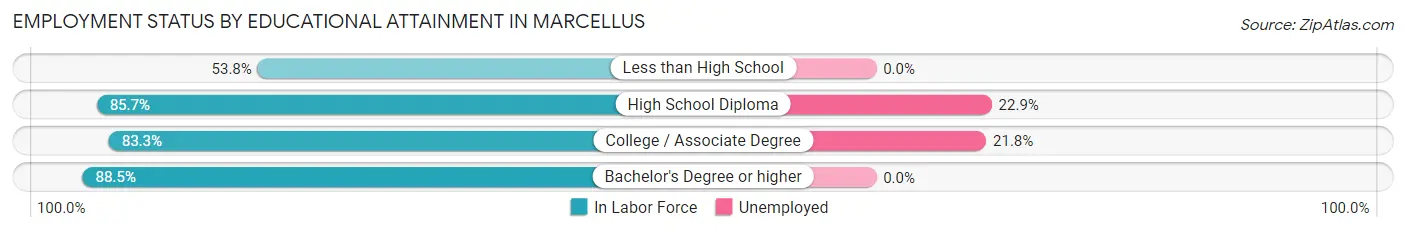
| Educational Attainment | In Labor Force | Unemployed |
| Less than High School | 7 (53.8%) | 0 (0.0%) |
| High School Diploma | 227 (85.7%) | 61 (22.9%) |
| College / Associate Degree | 354 (83.3%) | 93 (21.8%) |
| Bachelor's Degree or higher | 391 (88.5%) | 0 (0.0%) |
| Total | 979 (85.5%) | 151 (13.2%) |
Employment Occupations by Sex in Marcellus
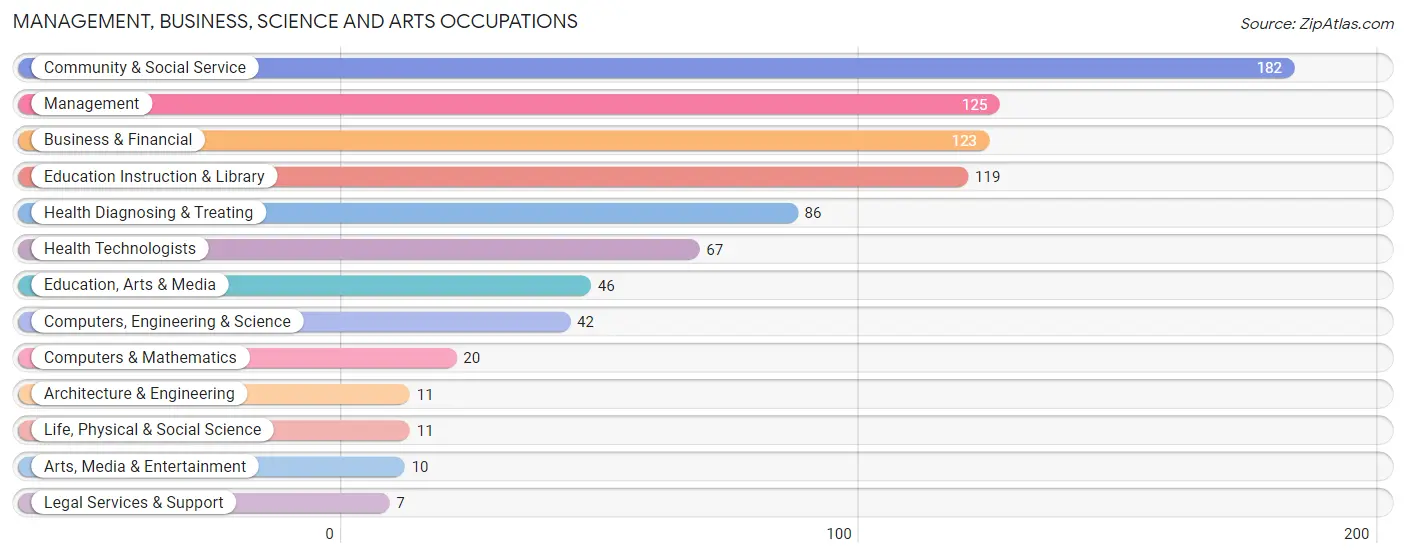
Management, Business, Science and Arts Occupations
The most common Management, Business, Science and Arts occupations in Marcellus are Community & Social Service (182 | 17.1%), Management (125 | 11.7%), Business & Financial (123 | 11.5%), Education Instruction & Library (119 | 11.2%), and Health Diagnosing & Treating (86 | 8.1%).
Management, Business, Science and Arts Occupations by Sex
Within the Management, Business, Science and Arts occupations in Marcellus, the most male-oriented occupations are Architecture & Engineering (100.0%), Management (72.8%), and Computers, Engineering & Science (61.9%), while the most female-oriented occupations are Education, Arts & Media (100.0%), Legal Services & Support (100.0%), and Health Technologists (100.0%).
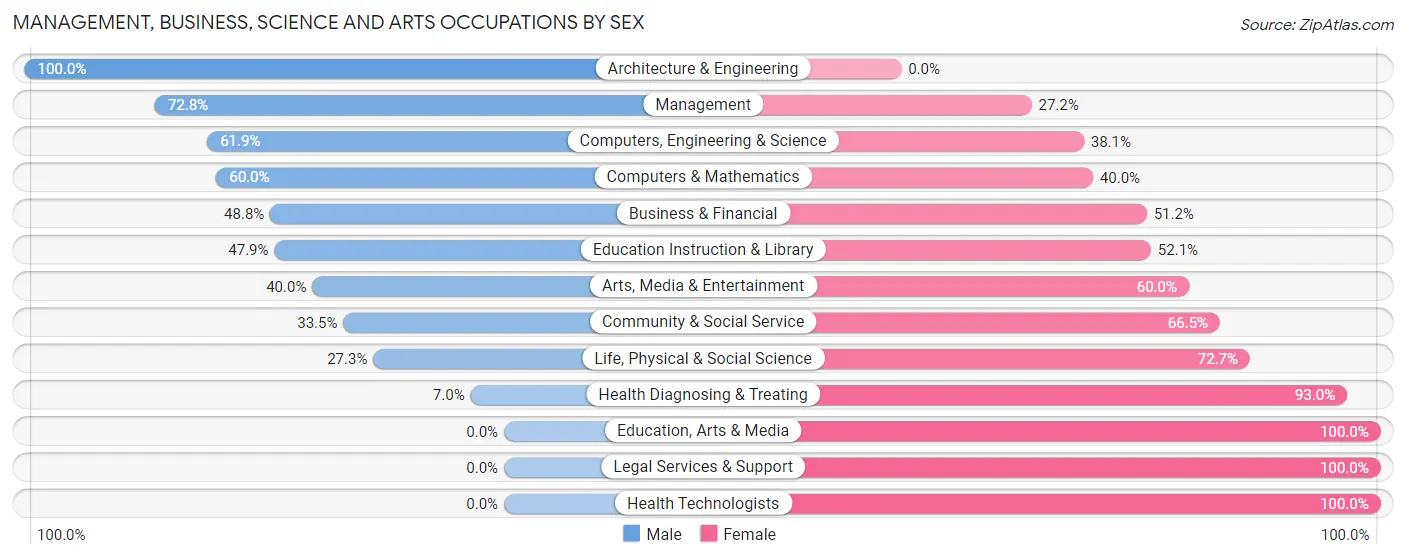
| Occupation | Male | Female |
| Management | 91 (72.8%) | 34 (27.2%) |
| Business & Financial | 60 (48.8%) | 63 (51.2%) |
| Computers, Engineering & Science | 26 (61.9%) | 16 (38.1%) |
| Computers & Mathematics | 12 (60.0%) | 8 (40.0%) |
| Architecture & Engineering | 11 (100.0%) | 0 (0.0%) |
| Life, Physical & Social Science | 3 (27.3%) | 8 (72.7%) |
| Community & Social Service | 61 (33.5%) | 121 (66.5%) |
| Education, Arts & Media | 0 (0.0%) | 46 (100.0%) |
| Legal Services & Support | 0 (0.0%) | 7 (100.0%) |
| Education Instruction & Library | 57 (47.9%) | 62 (52.1%) |
| Arts, Media & Entertainment | 4 (40.0%) | 6 (60.0%) |
| Health Diagnosing & Treating | 6 (7.0%) | 80 (93.0%) |
| Health Technologists | 0 (0.0%) | 67 (100.0%) |
| Total (Category) | 244 (43.7%) | 314 (56.3%) |
| Total (Overall) | 520 (48.7%) | 547 (51.3%) |
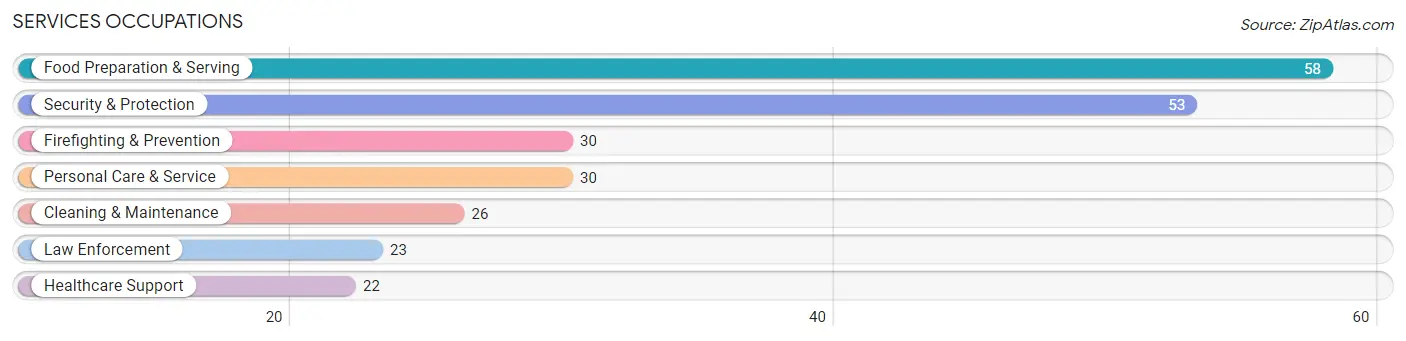
Services Occupations
The most common Services occupations in Marcellus are Food Preparation & Serving (58 | 5.4%), Security & Protection (53 | 5.0%), Firefighting & Prevention (30 | 2.8%), Personal Care & Service (30 | 2.8%), and Cleaning & Maintenance (26 | 2.4%).
Services Occupations by Sex
Within the Services occupations in Marcellus, the most male-oriented occupations are Security & Protection (100.0%), Firefighting & Prevention (100.0%), and Law Enforcement (100.0%), while the most female-oriented occupations are Healthcare Support (100.0%), Personal Care & Service (86.7%), and Cleaning & Maintenance (53.8%).
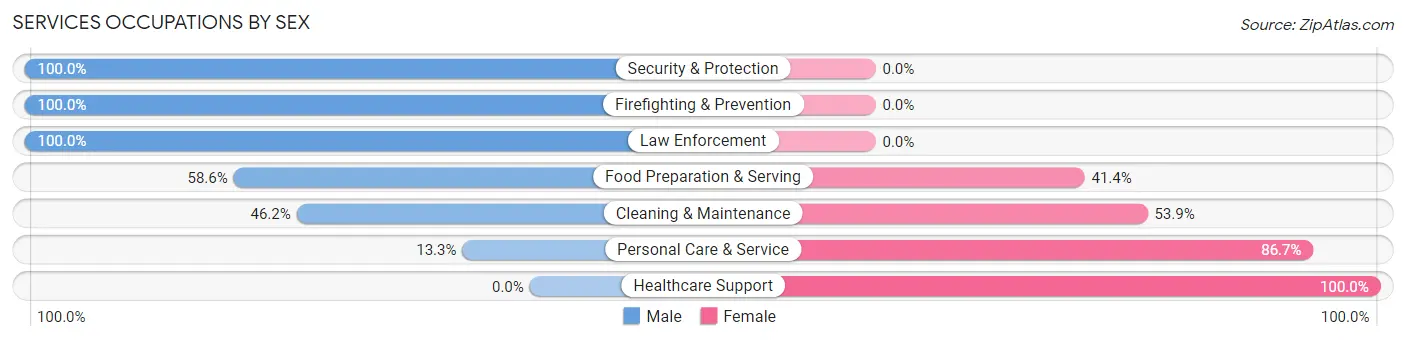
| Occupation | Male | Female |
| Healthcare Support | 0 (0.0%) | 22 (100.0%) |
| Security & Protection | 53 (100.0%) | 0 (0.0%) |
| Firefighting & Prevention | 30 (100.0%) | 0 (0.0%) |
| Law Enforcement | 23 (100.0%) | 0 (0.0%) |
| Food Preparation & Serving | 34 (58.6%) | 24 (41.4%) |
| Cleaning & Maintenance | 12 (46.2%) | 14 (53.8%) |
| Personal Care & Service | 4 (13.3%) | 26 (86.7%) |
| Total (Category) | 103 (54.5%) | 86 (45.5%) |
| Total (Overall) | 520 (48.7%) | 547 (51.3%) |
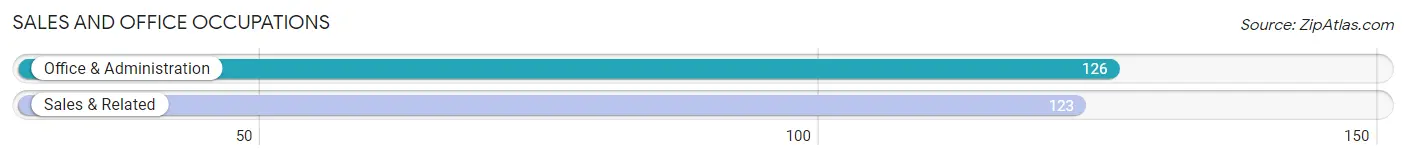
Sales and Office Occupations
The most common Sales and Office occupations in Marcellus are Office & Administration (126 | 11.8%), and Sales & Related (123 | 11.5%).
Sales and Office Occupations by Sex
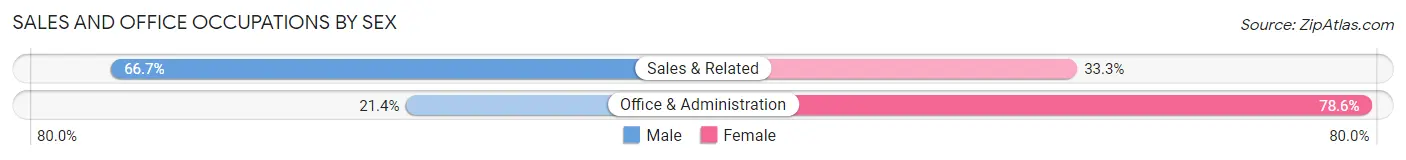
| Occupation | Male | Female |
| Sales & Related | 82 (66.7%) | 41 (33.3%) |
| Office & Administration | 27 (21.4%) | 99 (78.6%) |
| Total (Category) | 109 (43.8%) | 140 (56.2%) |
| Total (Overall) | 520 (48.7%) | 547 (51.3%) |
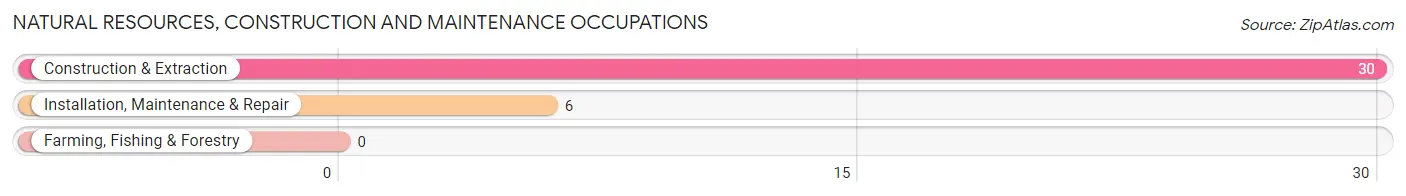
Natural Resources, Construction and Maintenance Occupations
The most common Natural Resources, Construction and Maintenance occupations in Marcellus are Construction & Extraction (30 | 2.8%), and Installation, Maintenance & Repair (6 | 0.6%).
Natural Resources, Construction and Maintenance Occupations by Sex
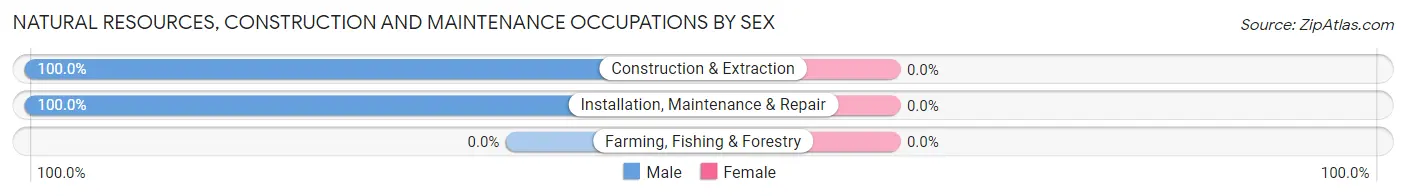
| Occupation | Male | Female |
| Farming, Fishing & Forestry | 0 (0.0%) | 0 (0.0%) |
| Construction & Extraction | 30 (100.0%) | 0 (0.0%) |
| Installation, Maintenance & Repair | 6 (100.0%) | 0 (0.0%) |
| Total (Category) | 36 (100.0%) | 0 (0.0%) |
| Total (Overall) | 520 (48.7%) | 547 (51.3%) |
Production, Transportation and Moving Occupations
The most common Production, Transportation and Moving occupations in Marcellus are Production (30 | 2.8%), and Transportation (5 | 0.5%).
Production, Transportation and Moving Occupations by Sex
| Occupation | Male | Female |
| Production | 23 (76.7%) | 7 (23.3%) |
| Transportation | 5 (100.0%) | 0 (0.0%) |
| Material Moving | 0 (0.0%) | 0 (0.0%) |
| Total (Category) | 28 (80.0%) | 7 (20.0%) |
| Total (Overall) | 520 (48.7%) | 547 (51.3%) |
Employment Industries by Sex in Marcellus
Employment Industries in Marcellus
The major employment industries in Marcellus include Educational Services (212 | 19.9%), Health Care & Social Assistance (173 | 16.2%), Accommodation & Food Services (124 | 11.6%), Retail Trade (96 | 9.0%), and Professional & Scientific (76 | 7.1%).
Employment Industries by Sex in Marcellus
The Marcellus industries that see more men than women are Mining, Quarrying, & Extraction (100.0%), Construction (100.0%), and Wholesale Trade (100.0%), whereas the industries that tend to have a higher number of women are Real Estate, Rental & Leasing (100.0%), Health Care & Social Assistance (90.7%), and Information (61.1%).
| Industry | Male | Female |
| Agriculture, Fishing & Hunting | 0 (0.0%) | 0 (0.0%) |
| Mining, Quarrying, & Extraction | 5 (100.0%) | 0 (0.0%) |
| Construction | 52 (100.0%) | 0 (0.0%) |
| Manufacturing | 25 (43.9%) | 32 (56.1%) |
| Wholesale Trade | 18 (100.0%) | 0 (0.0%) |
| Retail Trade | 59 (61.5%) | 37 (38.5%) |
| Transportation & Warehousing | 0 (0.0%) | 0 (0.0%) |
| Utilities | 6 (100.0%) | 0 (0.0%) |
| Information | 7 (38.9%) | 11 (61.1%) |
| Finance & Insurance | 39 (76.5%) | 12 (23.5%) |
| Real Estate, Rental & Leasing | 0 (0.0%) | 7 (100.0%) |
| Professional & Scientific | 32 (42.1%) | 44 (57.9%) |
| Enterprise Management | 0 (0.0%) | 0 (0.0%) |
| Administrative & Support | 30 (71.4%) | 12 (28.6%) |
| Educational Services | 98 (46.2%) | 114 (53.8%) |
| Health Care & Social Assistance | 16 (9.2%) | 157 (90.7%) |
| Arts, Entertainment & Recreation | 9 (100.0%) | 0 (0.0%) |
| Accommodation & Food Services | 71 (57.3%) | 53 (42.7%) |
| Public Administration | 34 (75.6%) | 11 (24.4%) |
| Total | 520 (48.7%) | 547 (51.3%) |
Education in Marcellus
School Enrollment in Marcellus
The most common levels of schooling among the 452 students in Marcellus are high school (133 | 29.4%), middle school (105 | 23.2%), and elementary school (97 | 21.5%).
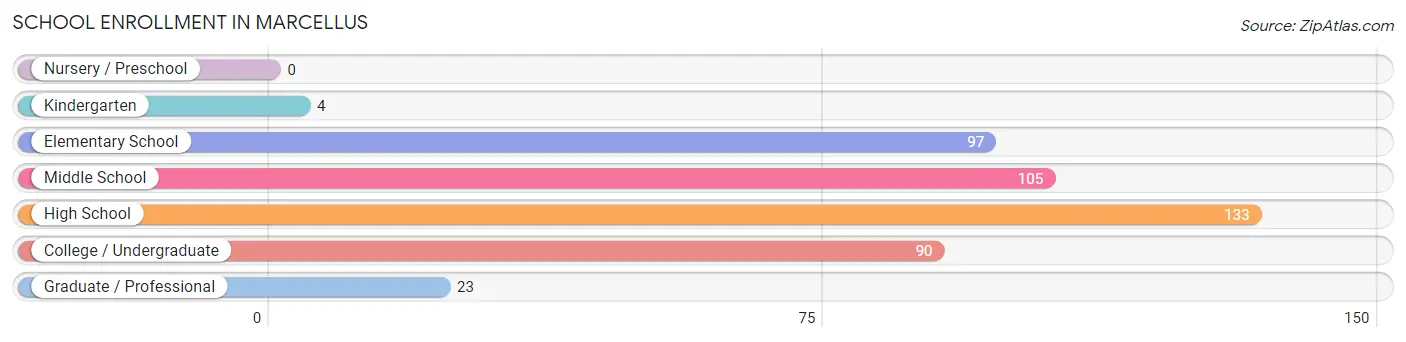
| School Level | # Students | % Students |
| Nursery / Preschool | 0 | 0.0% |
| Kindergarten | 4 | 0.9% |
| Elementary School | 97 | 21.5% |
| Middle School | 105 | 23.2% |
| High School | 133 | 29.4% |
| College / Undergraduate | 90 | 19.9% |
| Graduate / Professional | 23 | 5.1% |
| Total | 452 | 100.0% |
School Enrollment by Age by Funding Source in Marcellus
Out of a total of 452 students who are enrolled in schools in Marcellus, 39 (8.6%) attend a private institution, while the remaining 413 (91.4%) are enrolled in public schools. The age group of 35 years and over has the highest likelihood of being enrolled in private schools, with 23 (85.2% in the age bracket) enrolled. Conversely, the age group of 5 to 9 year old has the lowest likelihood of being enrolled in a private school, with 74 (100.0% in the age bracket) attending a public institution.
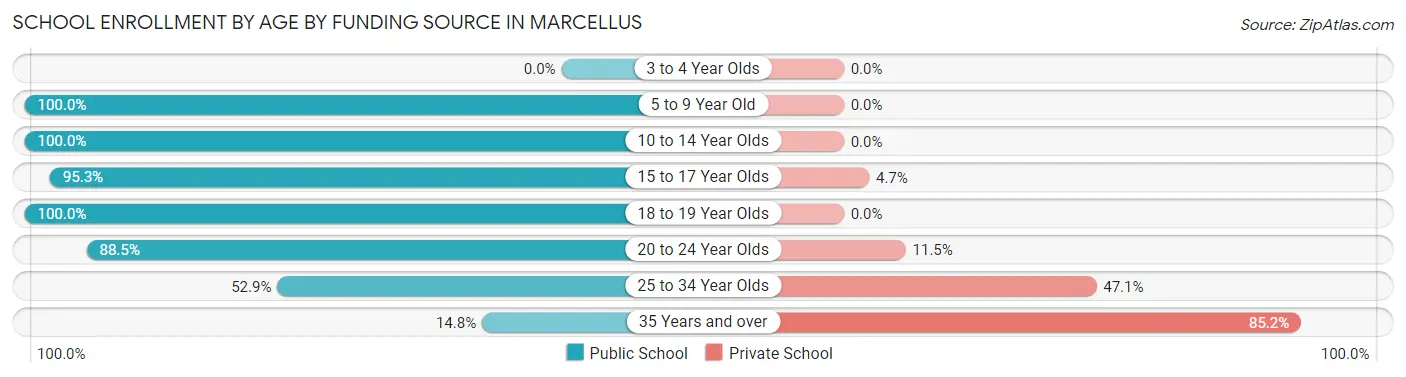
| Age Bracket | Public School | Private School |
| 3 to 4 Year Olds | 0 (0.0%) | 0 (0.0%) |
| 5 to 9 Year Old | 74 (100.0%) | 0 (0.0%) |
| 10 to 14 Year Olds | 151 (100.0%) | 0 (0.0%) |
| 15 to 17 Year Olds | 101 (95.3%) | 5 (4.7%) |
| 18 to 19 Year Olds | 51 (100.0%) | 0 (0.0%) |
| 20 to 24 Year Olds | 23 (88.5%) | 3 (11.5%) |
| 25 to 34 Year Olds | 9 (52.9%) | 8 (47.1%) |
| 35 Years and over | 4 (14.8%) | 23 (85.2%) |
| Total | 413 (91.4%) | 39 (8.6%) |
Educational Attainment by Field of Study in Marcellus
Education (91 | 15.5%), liberal arts & history (77 | 13.1%), business (75 | 12.8%), arts & humanities (48 | 8.2%), and computers & mathematics (44 | 7.5%) are the most common fields of study among 586 individuals in Marcellus who have obtained a bachelor's degree or higher.
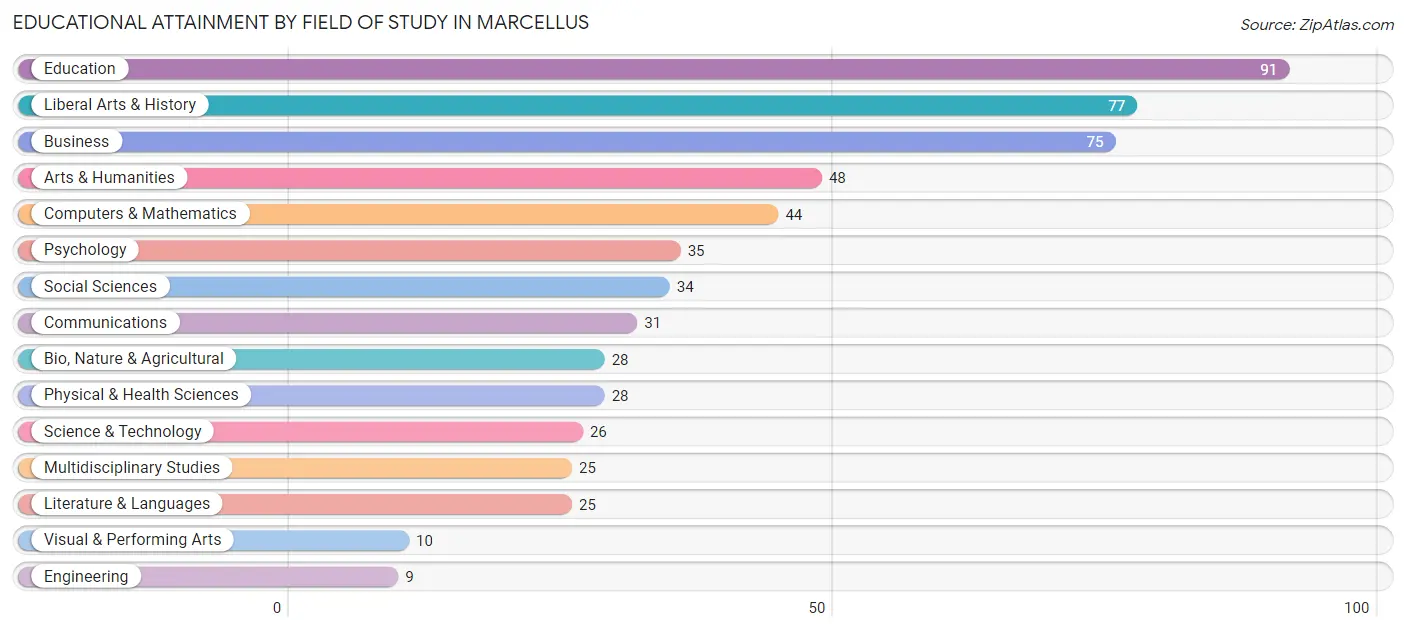
| Field of Study | # Graduates | % Graduates |
| Computers & Mathematics | 44 | 7.5% |
| Bio, Nature & Agricultural | 28 | 4.8% |
| Physical & Health Sciences | 28 | 4.8% |
| Psychology | 35 | 6.0% |
| Social Sciences | 34 | 5.8% |
| Engineering | 9 | 1.5% |
| Multidisciplinary Studies | 25 | 4.3% |
| Science & Technology | 26 | 4.4% |
| Business | 75 | 12.8% |
| Education | 91 | 15.5% |
| Literature & Languages | 25 | 4.3% |
| Liberal Arts & History | 77 | 13.1% |
| Visual & Performing Arts | 10 | 1.7% |
| Communications | 31 | 5.3% |
| Arts & Humanities | 48 | 8.2% |
| Total | 586 | 100.0% |
Transportation & Commute in Marcellus
Vehicle Availability by Sex in Marcellus
The most prevalent vehicle ownership categories in Marcellus are males with 2 vehicles (315, accounting for 60.6%) and females with 2 vehicles (260, making up 57.6%).
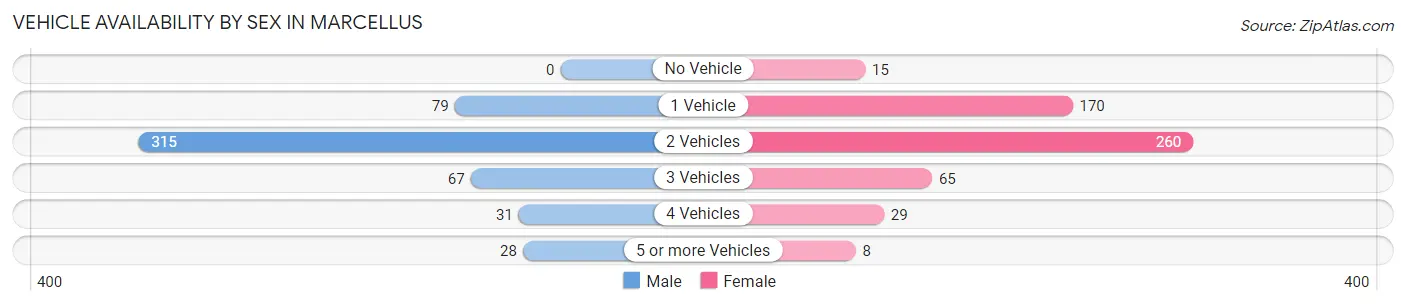
| Vehicles Available | Male | Female |
| No Vehicle | 0 (0.0%) | 15 (2.7%) |
| 1 Vehicle | 79 (15.2%) | 170 (31.1%) |
| 2 Vehicles | 315 (60.6%) | 260 (47.5%) |
| 3 Vehicles | 67 (12.9%) | 65 (11.9%) |
| 4 Vehicles | 31 (6.0%) | 29 (5.3%) |
| 5 or more Vehicles | 28 (5.4%) | 8 (1.5%) |
| Total | 520 (100.0%) | 547 (100.0%) |
Commute Time in Marcellus
The most frequently occuring commute durations in Marcellus are 30 to 34 minutes (220 commuters, 23.2%), 25 to 29 minutes (143 commuters, 15.1%), and 20 to 24 minutes (134 commuters, 14.1%).
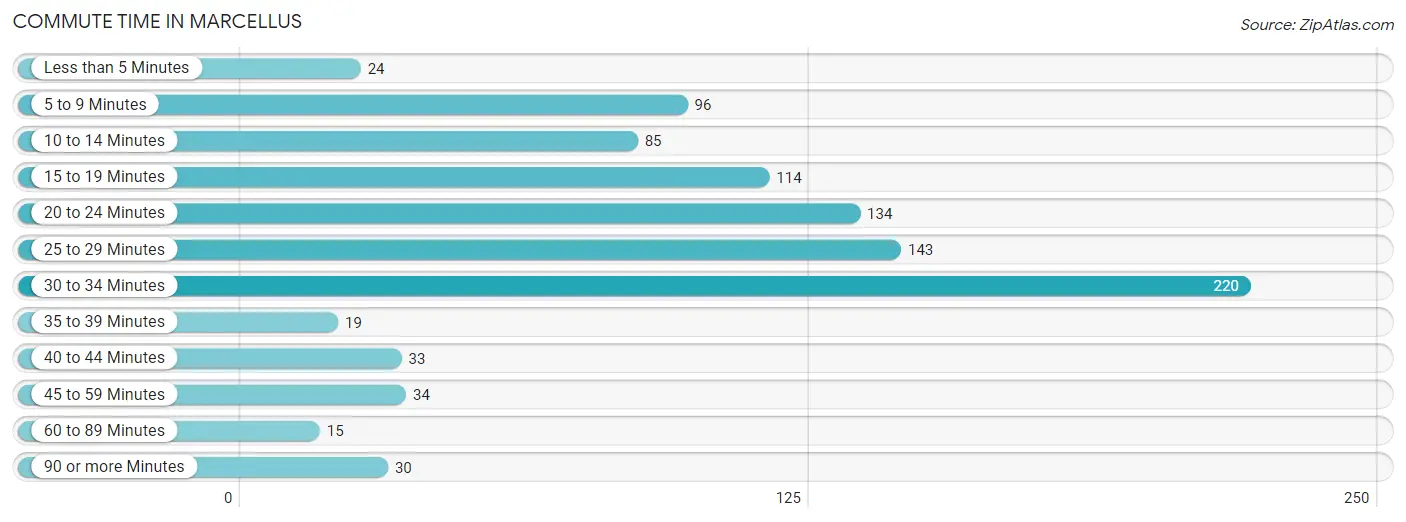
| Commute Time | # Commuters | % Commuters |
| Less than 5 Minutes | 24 | 2.5% |
| 5 to 9 Minutes | 96 | 10.1% |
| 10 to 14 Minutes | 85 | 9.0% |
| 15 to 19 Minutes | 114 | 12.0% |
| 20 to 24 Minutes | 134 | 14.1% |
| 25 to 29 Minutes | 143 | 15.1% |
| 30 to 34 Minutes | 220 | 23.2% |
| 35 to 39 Minutes | 19 | 2.0% |
| 40 to 44 Minutes | 33 | 3.5% |
| 45 to 59 Minutes | 34 | 3.6% |
| 60 to 89 Minutes | 15 | 1.6% |
| 90 or more Minutes | 30 | 3.2% |
Commute Time by Sex in Marcellus
The most common commute times in Marcellus are 30 to 34 minutes (90 commuters, 19.4%) for males and 30 to 34 minutes (130 commuters, 27.0%) for females.
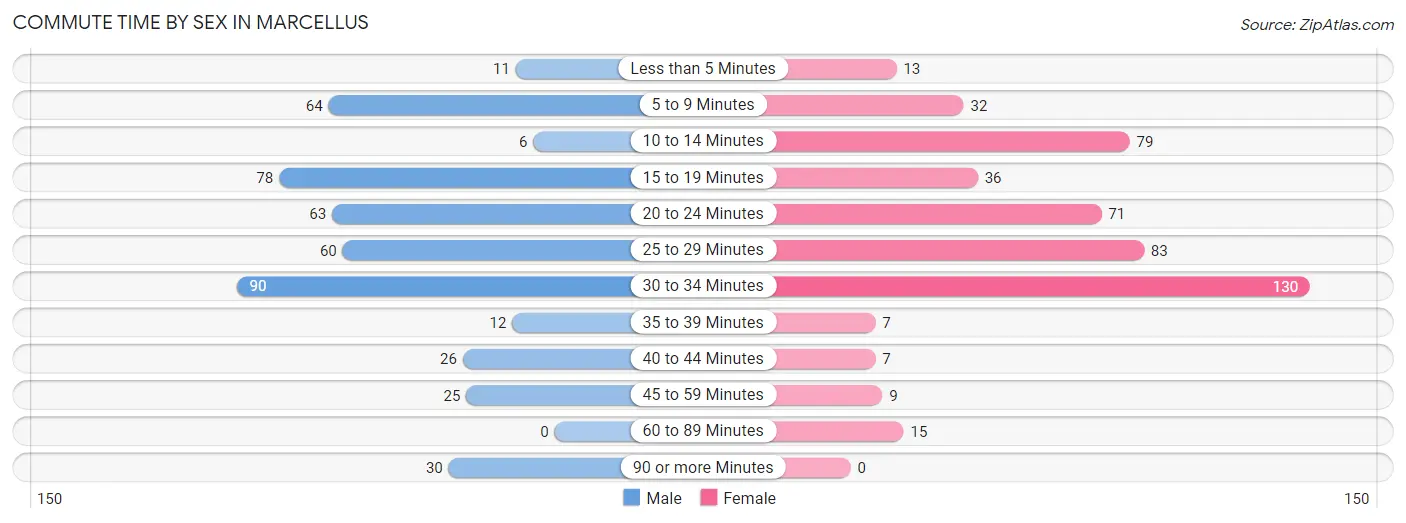
| Commute Time | Male | Female |
| Less than 5 Minutes | 11 (2.4%) | 13 (2.7%) |
| 5 to 9 Minutes | 64 (13.8%) | 32 (6.6%) |
| 10 to 14 Minutes | 6 (1.3%) | 79 (16.4%) |
| 15 to 19 Minutes | 78 (16.8%) | 36 (7.5%) |
| 20 to 24 Minutes | 63 (13.6%) | 71 (14.7%) |
| 25 to 29 Minutes | 60 (12.9%) | 83 (17.2%) |
| 30 to 34 Minutes | 90 (19.4%) | 130 (27.0%) |
| 35 to 39 Minutes | 12 (2.6%) | 7 (1.5%) |
| 40 to 44 Minutes | 26 (5.6%) | 7 (1.5%) |
| 45 to 59 Minutes | 25 (5.4%) | 9 (1.9%) |
| 60 to 89 Minutes | 0 (0.0%) | 15 (3.1%) |
| 90 or more Minutes | 30 (6.5%) | 0 (0.0%) |
Time of Departure to Work by Sex in Marcellus
The most frequent times of departure to work in Marcellus are 7:00 AM to 7:29 AM (86, 18.5%) for males and 6:30 AM to 6:59 AM (112, 23.2%) for females.
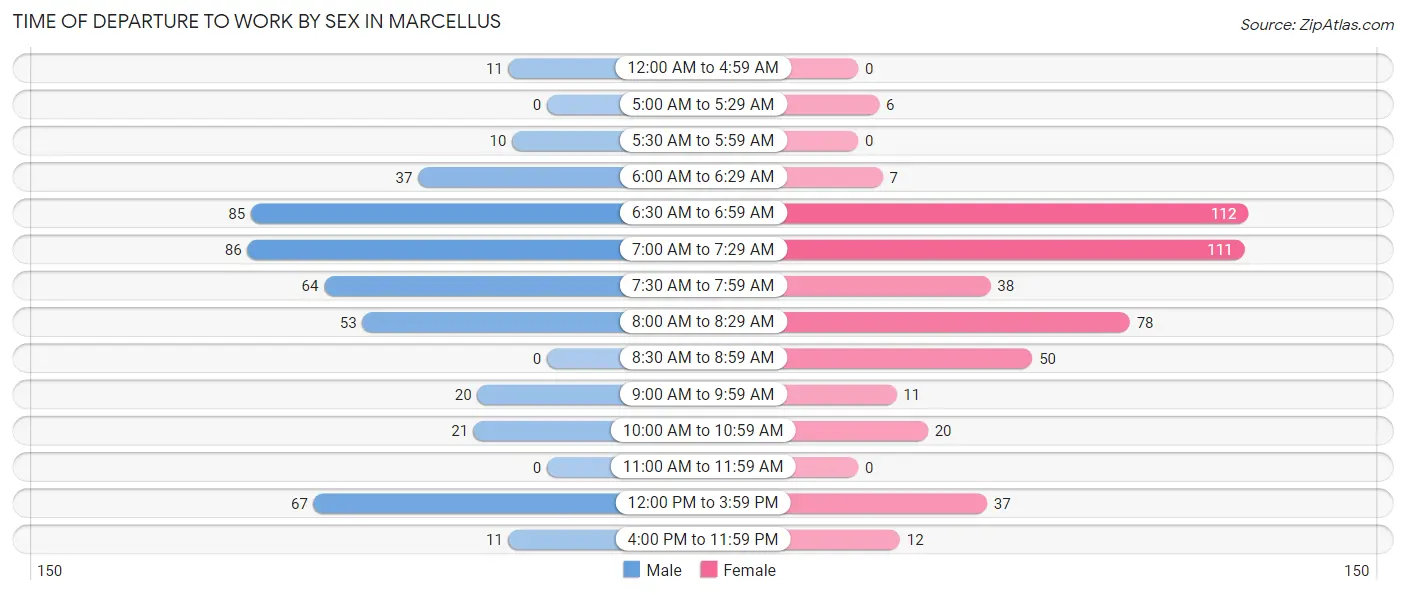
| Time of Departure | Male | Female |
| 12:00 AM to 4:59 AM | 11 (2.4%) | 0 (0.0%) |
| 5:00 AM to 5:29 AM | 0 (0.0%) | 6 (1.2%) |
| 5:30 AM to 5:59 AM | 10 (2.1%) | 0 (0.0%) |
| 6:00 AM to 6:29 AM | 37 (8.0%) | 7 (1.5%) |
| 6:30 AM to 6:59 AM | 85 (18.3%) | 112 (23.2%) |
| 7:00 AM to 7:29 AM | 86 (18.5%) | 111 (23.0%) |
| 7:30 AM to 7:59 AM | 64 (13.8%) | 38 (7.9%) |
| 8:00 AM to 8:29 AM | 53 (11.4%) | 78 (16.2%) |
| 8:30 AM to 8:59 AM | 0 (0.0%) | 50 (10.4%) |
| 9:00 AM to 9:59 AM | 20 (4.3%) | 11 (2.3%) |
| 10:00 AM to 10:59 AM | 21 (4.5%) | 20 (4.2%) |
| 11:00 AM to 11:59 AM | 0 (0.0%) | 0 (0.0%) |
| 12:00 PM to 3:59 PM | 67 (14.4%) | 37 (7.7%) |
| 4:00 PM to 11:59 PM | 11 (2.4%) | 12 (2.5%) |
| Total | 465 (100.0%) | 482 (100.0%) |
Housing Occupancy in Marcellus
Occupancy by Ownership in Marcellus
Of the total 1,001 dwellings in Marcellus, owner-occupied units account for 492 (49.1%), while renter-occupied units make up 509 (50.8%).
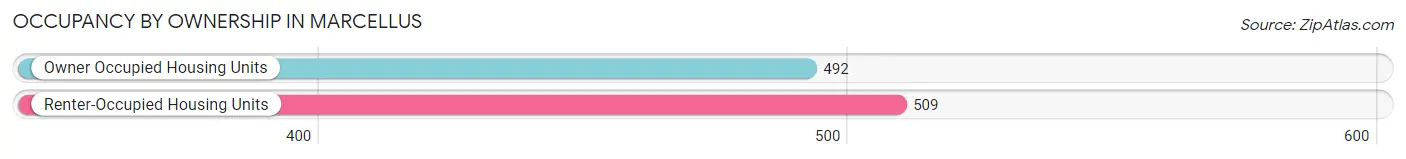
| Occupancy | # Housing Units | % Housing Units |
| Owner Occupied Housing Units | 492 | 49.1% |
| Renter-Occupied Housing Units | 509 | 50.8% |
| Total Occupied Housing Units | 1,001 | 100.0% |
Occupancy by Household Size in Marcellus
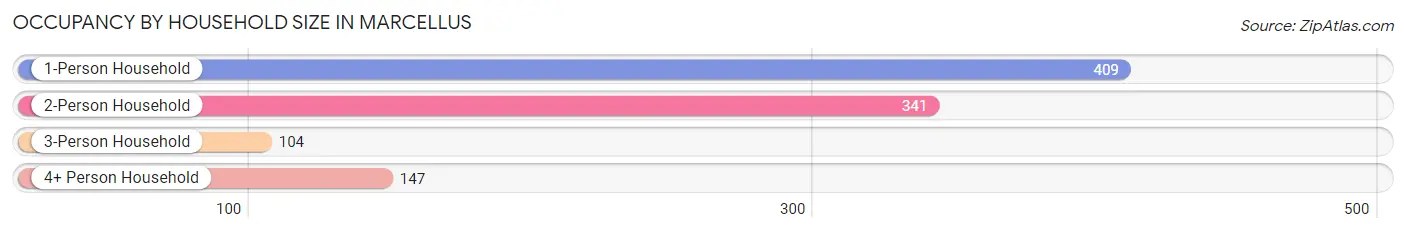
| Household Size | # Housing Units | % Housing Units |
| 1-Person Household | 409 | 40.9% |
| 2-Person Household | 341 | 34.1% |
| 3-Person Household | 104 | 10.4% |
| 4+ Person Household | 147 | 14.7% |
| Total Housing Units | 1,001 | 100.0% |
Occupancy by Ownership by Household Size in Marcellus
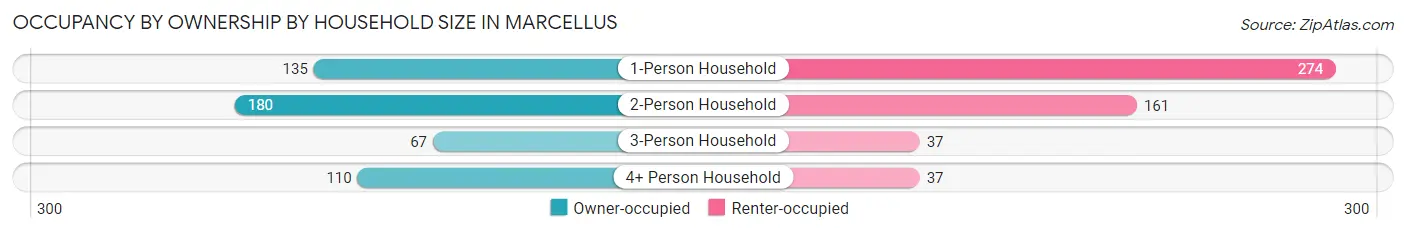
| Household Size | Owner-occupied | Renter-occupied |
| 1-Person Household | 135 (33.0%) | 274 (67.0%) |
| 2-Person Household | 180 (52.8%) | 161 (47.2%) |
| 3-Person Household | 67 (64.4%) | 37 (35.6%) |
| 4+ Person Household | 110 (74.8%) | 37 (25.2%) |
| Total Housing Units | 492 (49.1%) | 509 (50.8%) |
Occupancy by Educational Attainment in Marcellus
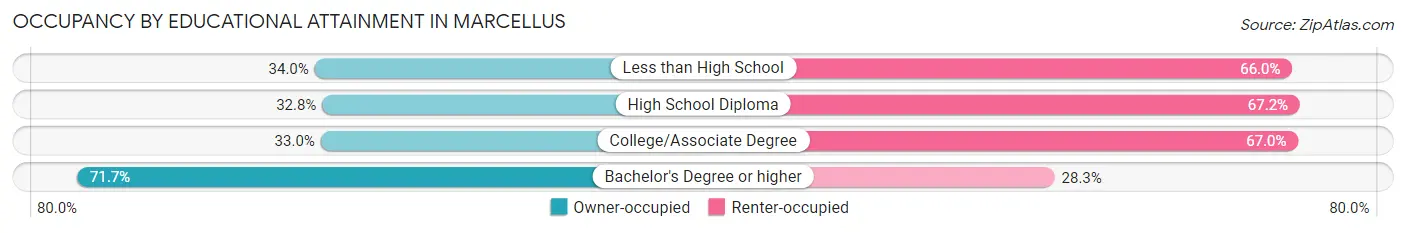
| Household Size | Owner-occupied | Renter-occupied |
| Less than High School | 17 (34.0%) | 33 (66.0%) |
| High School Diploma | 62 (32.8%) | 127 (67.2%) |
| College/Associate Degree | 114 (33.0%) | 231 (67.0%) |
| Bachelor's Degree or higher | 299 (71.7%) | 118 (28.3%) |
Occupancy by Age of Householder in Marcellus
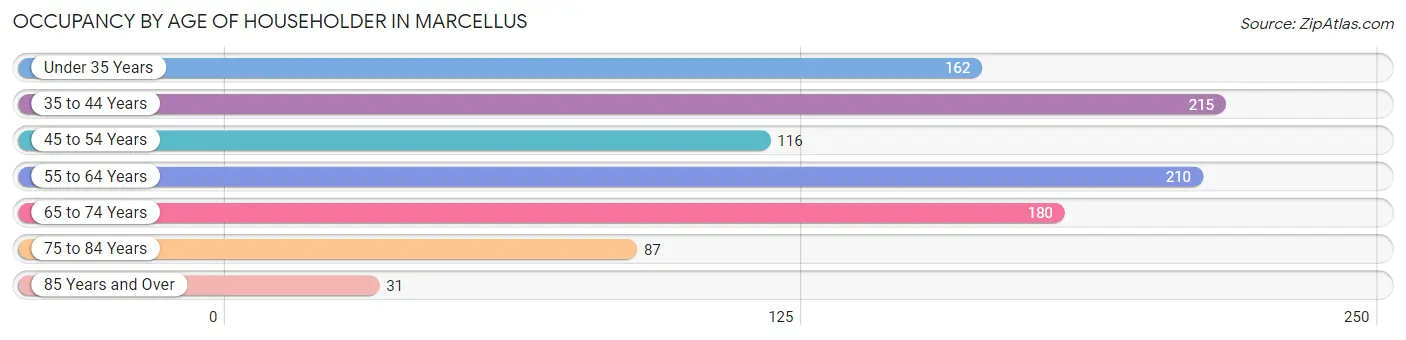
| Age Bracket | # Households | % Households |
| Under 35 Years | 162 | 16.2% |
| 35 to 44 Years | 215 | 21.5% |
| 45 to 54 Years | 116 | 11.6% |
| 55 to 64 Years | 210 | 21.0% |
| 65 to 74 Years | 180 | 18.0% |
| 75 to 84 Years | 87 | 8.7% |
| 85 Years and Over | 31 | 3.1% |
| Total | 1,001 | 100.0% |
Housing Finances in Marcellus
Median Income by Occupancy in Marcellus
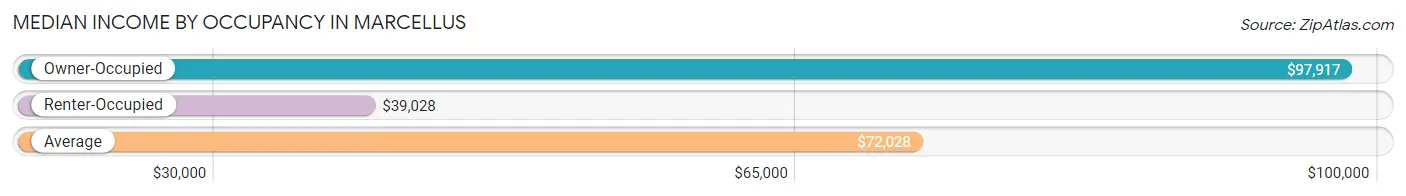
| Occupancy Type | # Households | Median Income |
| Owner-Occupied | 492 (49.1%) | $97,917 |
| Renter-Occupied | 509 (50.8%) | $39,028 |
| Average | 1,001 (100.0%) | $72,028 |
Occupancy by Householder Income Bracket in Marcellus
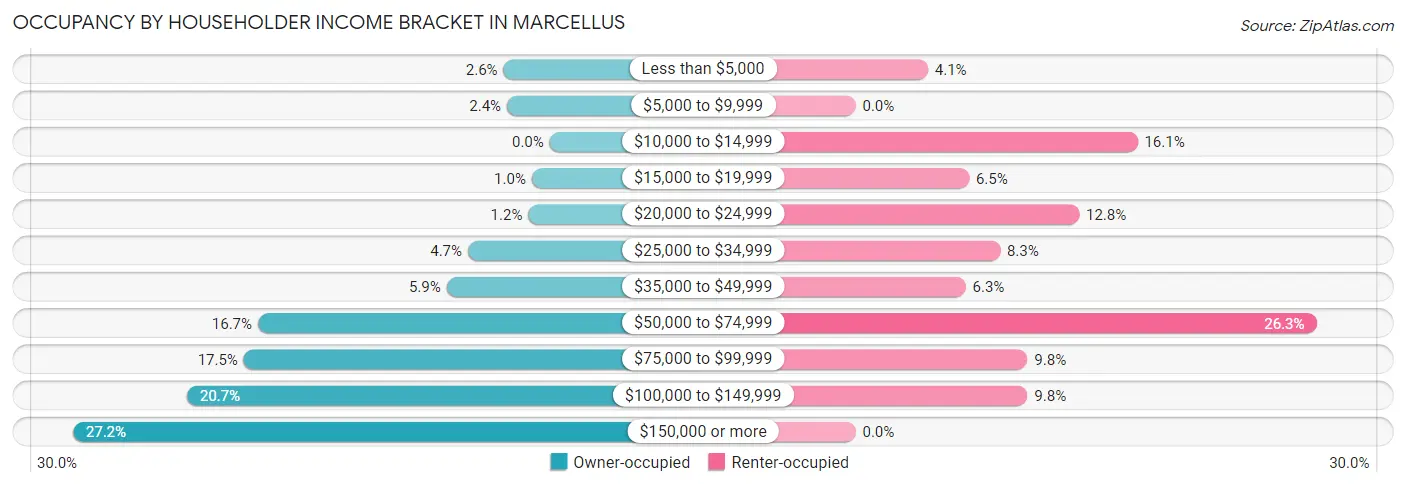
| Income Bracket | Owner-occupied | Renter-occupied |
| Less than $5,000 | 13 (2.6%) | 21 (4.1%) |
| $5,000 to $9,999 | 12 (2.4%) | 0 (0.0%) |
| $10,000 to $14,999 | 0 (0.0%) | 82 (16.1%) |
| $15,000 to $19,999 | 5 (1.0%) | 33 (6.5%) |
| $20,000 to $24,999 | 6 (1.2%) | 65 (12.8%) |
| $25,000 to $34,999 | 23 (4.7%) | 42 (8.3%) |
| $35,000 to $49,999 | 29 (5.9%) | 32 (6.3%) |
| $50,000 to $74,999 | 82 (16.7%) | 134 (26.3%) |
| $75,000 to $99,999 | 86 (17.5%) | 50 (9.8%) |
| $100,000 to $149,999 | 102 (20.7%) | 50 (9.8%) |
| $150,000 or more | 134 (27.2%) | 0 (0.0%) |
| Total | 492 (100.0%) | 509 (100.0%) |
Monthly Housing Cost Tiers in Marcellus
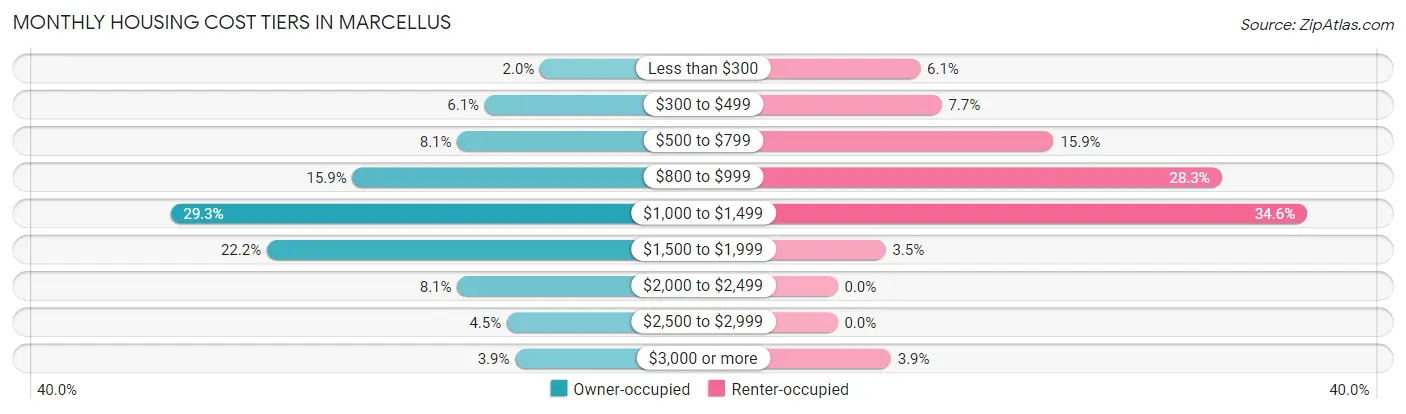
| Monthly Cost | Owner-occupied | Renter-occupied |
| Less than $300 | 10 (2.0%) | 31 (6.1%) |
| $300 to $499 | 30 (6.1%) | 39 (7.7%) |
| $500 to $799 | 40 (8.1%) | 81 (15.9%) |
| $800 to $999 | 78 (15.9%) | 144 (28.3%) |
| $1,000 to $1,499 | 144 (29.3%) | 176 (34.6%) |
| $1,500 to $1,999 | 109 (22.2%) | 18 (3.5%) |
| $2,000 to $2,499 | 40 (8.1%) | 0 (0.0%) |
| $2,500 to $2,999 | 22 (4.5%) | 0 (0.0%) |
| $3,000 or more | 19 (3.9%) | 20 (3.9%) |
| Total | 492 (100.0%) | 509 (100.0%) |
Physical Housing Characteristics in Marcellus
Housing Structures in Marcellus
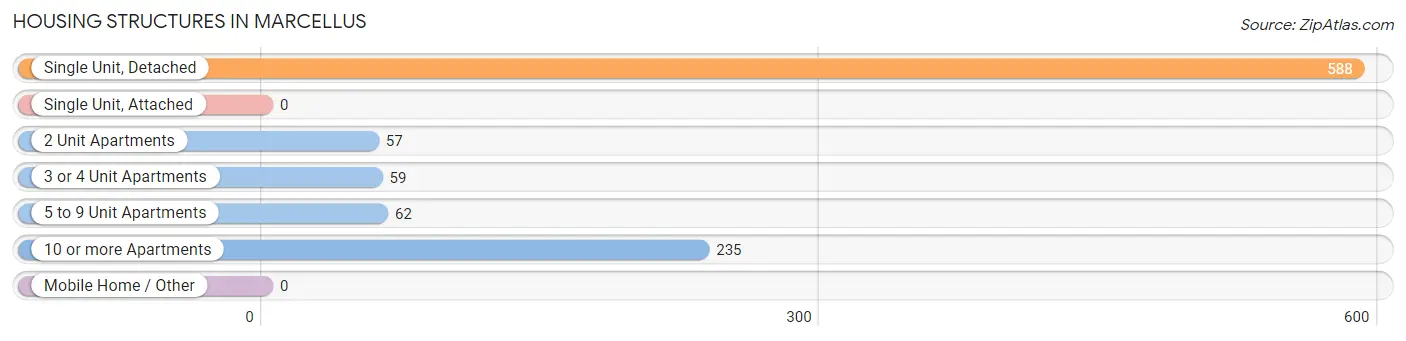
| Structure Type | # Housing Units | % Housing Units |
| Single Unit, Detached | 588 | 58.7% |
| Single Unit, Attached | 0 | 0.0% |
| 2 Unit Apartments | 57 | 5.7% |
| 3 or 4 Unit Apartments | 59 | 5.9% |
| 5 to 9 Unit Apartments | 62 | 6.2% |
| 10 or more Apartments | 235 | 23.5% |
| Mobile Home / Other | 0 | 0.0% |
| Total | 1,001 | 100.0% |
Housing Structures by Occupancy in Marcellus
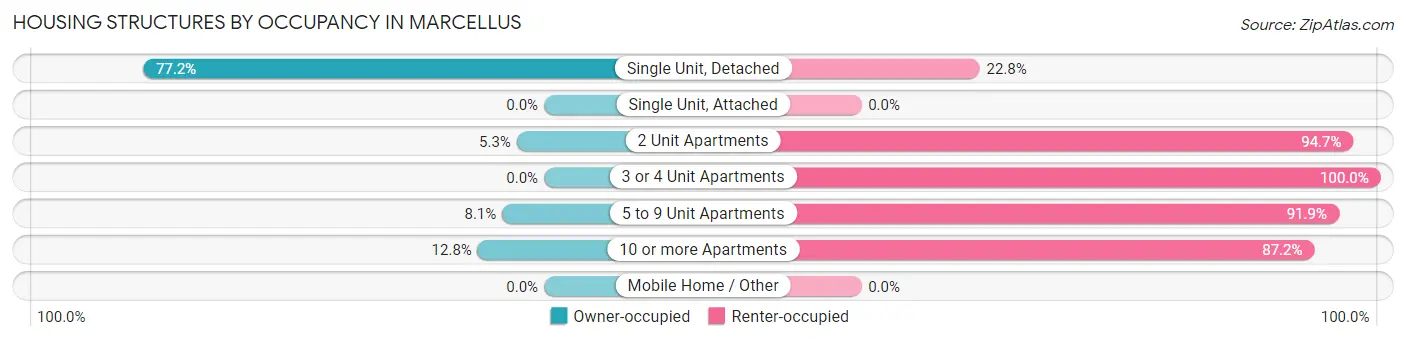
| Structure Type | Owner-occupied | Renter-occupied |
| Single Unit, Detached | 454 (77.2%) | 134 (22.8%) |
| Single Unit, Attached | 0 (0.0%) | 0 (0.0%) |
| 2 Unit Apartments | 3 (5.3%) | 54 (94.7%) |
| 3 or 4 Unit Apartments | 0 (0.0%) | 59 (100.0%) |
| 5 to 9 Unit Apartments | 5 (8.1%) | 57 (91.9%) |
| 10 or more Apartments | 30 (12.8%) | 205 (87.2%) |
| Mobile Home / Other | 0 (0.0%) | 0 (0.0%) |
| Total | 492 (49.1%) | 509 (50.8%) |
Housing Structures by Number of Rooms in Marcellus
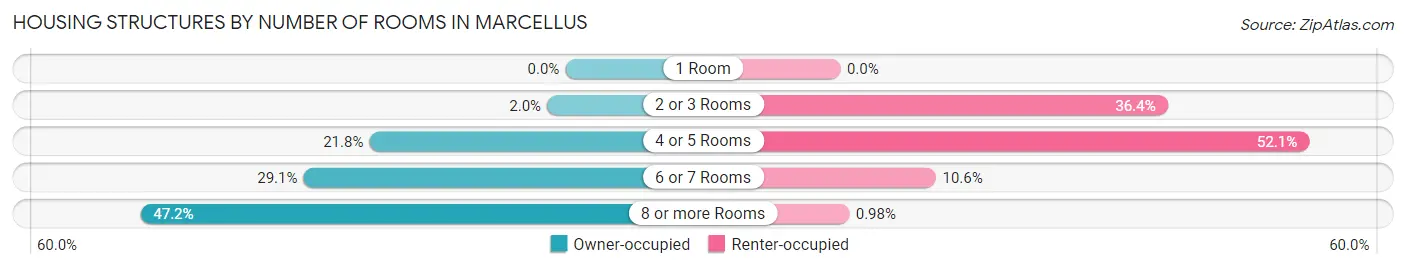
| Number of Rooms | Owner-occupied | Renter-occupied |
| 1 Room | 0 (0.0%) | 0 (0.0%) |
| 2 or 3 Rooms | 10 (2.0%) | 185 (36.3%) |
| 4 or 5 Rooms | 107 (21.7%) | 265 (52.1%) |
| 6 or 7 Rooms | 143 (29.1%) | 54 (10.6%) |
| 8 or more Rooms | 232 (47.1%) | 5 (1.0%) |
| Total | 492 (100.0%) | 509 (100.0%) |
Housing Structure by Heating Type in Marcellus
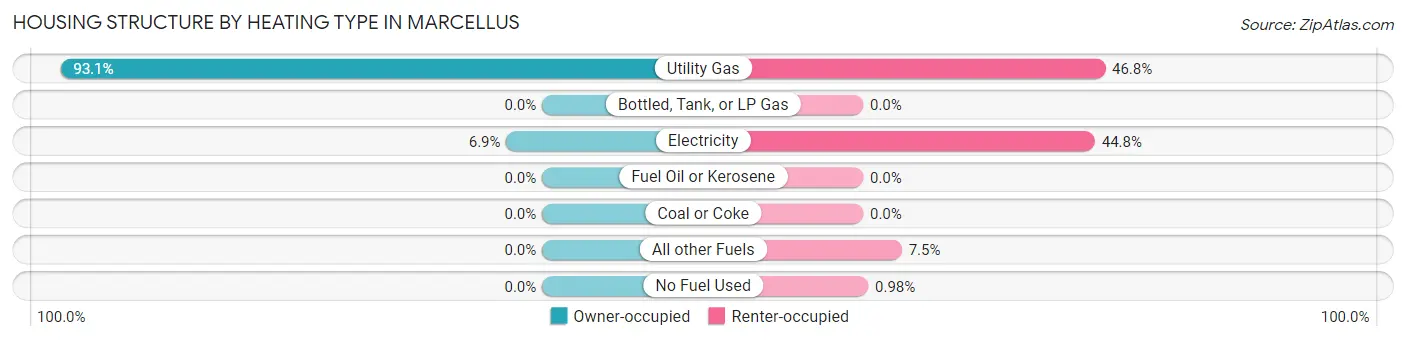
| Heating Type | Owner-occupied | Renter-occupied |
| Utility Gas | 458 (93.1%) | 238 (46.8%) |
| Bottled, Tank, or LP Gas | 0 (0.0%) | 0 (0.0%) |
| Electricity | 34 (6.9%) | 228 (44.8%) |
| Fuel Oil or Kerosene | 0 (0.0%) | 0 (0.0%) |
| Coal or Coke | 0 (0.0%) | 0 (0.0%) |
| All other Fuels | 0 (0.0%) | 38 (7.5%) |
| No Fuel Used | 0 (0.0%) | 5 (1.0%) |
| Total | 492 (100.0%) | 509 (100.0%) |
Household Vehicle Usage in Marcellus
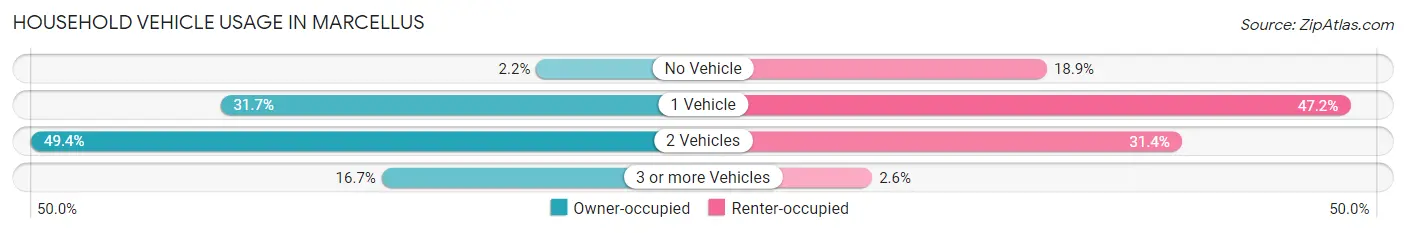
| Vehicles per Household | Owner-occupied | Renter-occupied |
| No Vehicle | 11 (2.2%) | 96 (18.9%) |
| 1 Vehicle | 156 (31.7%) | 240 (47.1%) |
| 2 Vehicles | 243 (49.4%) | 160 (31.4%) |
| 3 or more Vehicles | 82 (16.7%) | 13 (2.5%) |
| Total | 492 (100.0%) | 509 (100.0%) |
Real Estate & Mortgages in Marcellus
Real Estate and Mortgage Overview in Marcellus
| Characteristic | Without Mortgage | With Mortgage |
| Housing Units | 193 | 299 |
| Median Property Value | $206,800 | $219,800 |
| Median Household Income | $82,625 | $63 |
| Monthly Housing Costs | $845 | $19 |
| Real Estate Taxes | $6,228 | $7 |
Property Value by Mortgage Status in Marcellus
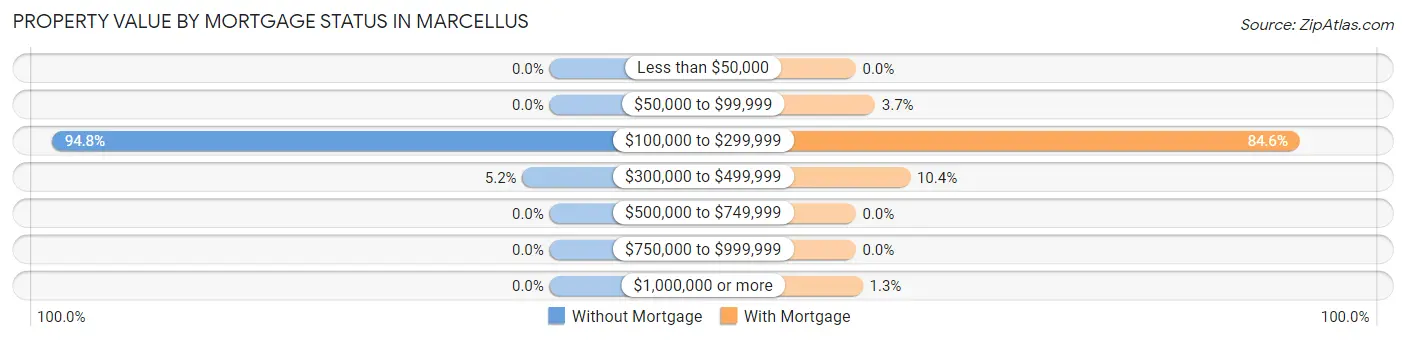
| Property Value | Without Mortgage | With Mortgage |
| Less than $50,000 | 0 (0.0%) | 0 (0.0%) |
| $50,000 to $99,999 | 0 (0.0%) | 11 (3.7%) |
| $100,000 to $299,999 | 183 (94.8%) | 253 (84.6%) |
| $300,000 to $499,999 | 10 (5.2%) | 31 (10.4%) |
| $500,000 to $749,999 | 0 (0.0%) | 0 (0.0%) |
| $750,000 to $999,999 | 0 (0.0%) | 0 (0.0%) |
| $1,000,000 or more | 0 (0.0%) | 4 (1.3%) |
| Total | 193 (100.0%) | 299 (100.0%) |
Household Income by Mortgage Status in Marcellus
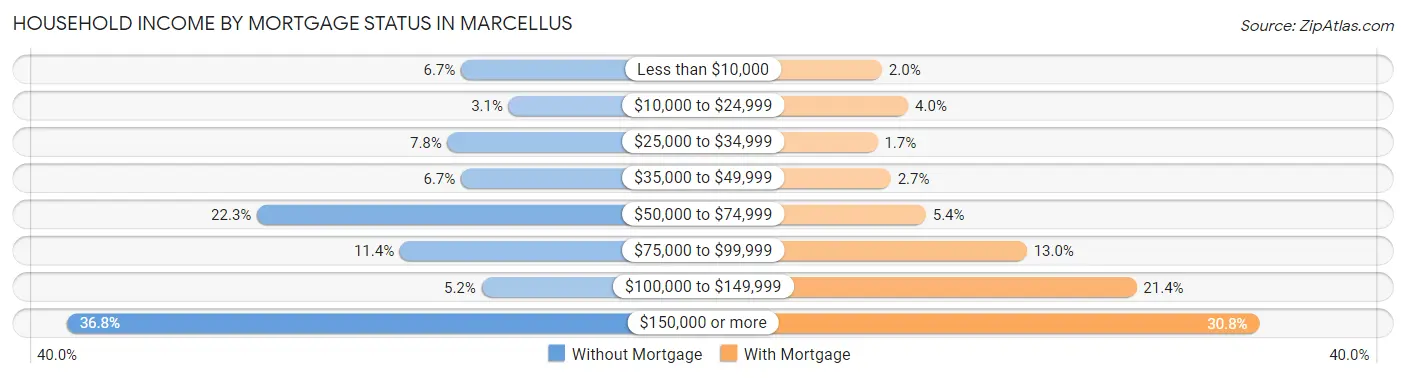
| Household Income | Without Mortgage | With Mortgage |
| Less than $10,000 | 13 (6.7%) | 6 (2.0%) |
| $10,000 to $24,999 | 6 (3.1%) | 12 (4.0%) |
| $25,000 to $34,999 | 15 (7.8%) | 5 (1.7%) |
| $35,000 to $49,999 | 13 (6.7%) | 8 (2.7%) |
| $50,000 to $74,999 | 43 (22.3%) | 16 (5.3%) |
| $75,000 to $99,999 | 22 (11.4%) | 39 (13.0%) |
| $100,000 to $149,999 | 10 (5.2%) | 64 (21.4%) |
| $150,000 or more | 71 (36.8%) | 92 (30.8%) |
| Total | 193 (100.0%) | 299 (100.0%) |
Property Value to Household Income Ratio in Marcellus
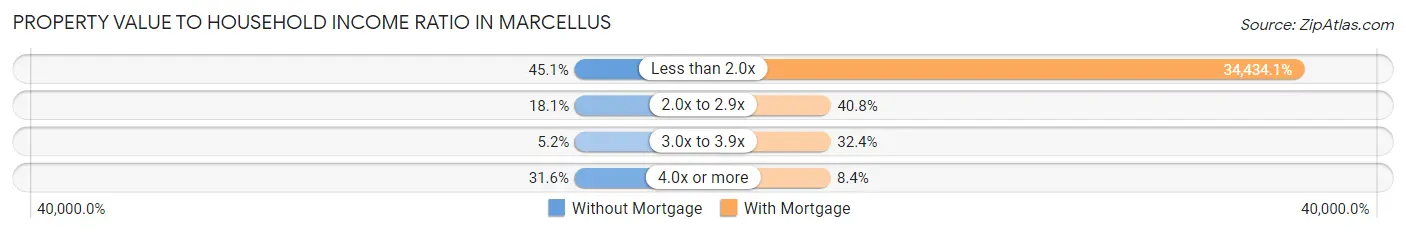
| Value-to-Income Ratio | Without Mortgage | With Mortgage |
| Less than 2.0x | 87 (45.1%) | 102,958 (34,434.1%) |
| 2.0x to 2.9x | 35 (18.1%) | 122 (40.8%) |
| 3.0x to 3.9x | 10 (5.2%) | 97 (32.4%) |
| 4.0x or more | 61 (31.6%) | 25 (8.4%) |
| Total | 193 (100.0%) | 299 (100.0%) |
Real Estate Taxes by Mortgage Status in Marcellus
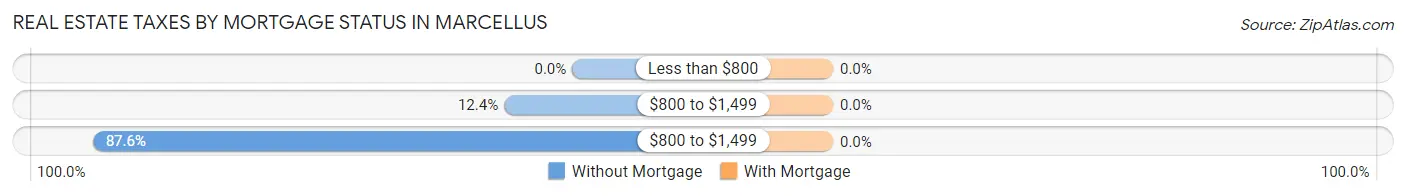
| Property Taxes | Without Mortgage | With Mortgage |
| Less than $800 | 0 (0.0%) | 0 (0.0%) |
| $800 to $1,499 | 24 (12.4%) | 0 (0.0%) |
| $800 to $1,499 | 169 (87.6%) | 0 (0.0%) |
| Total | 193 (100.0%) | 299 (100.0%) |
Health & Disability in Marcellus
Health Insurance Coverage by Age in Marcellus
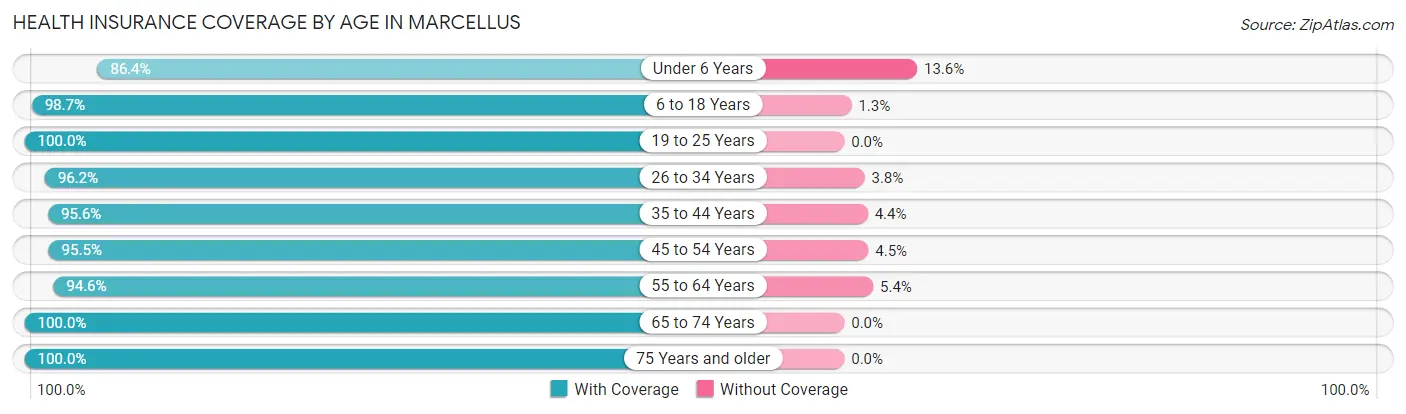
| Age Bracket | With Coverage | Without Coverage |
| Under 6 Years | 51 (86.4%) | 8 (13.6%) |
| 6 to 18 Years | 369 (98.7%) | 5 (1.3%) |
| 19 to 25 Years | 114 (100.0%) | 0 (0.0%) |
| 26 to 34 Years | 230 (96.2%) | 9 (3.8%) |
| 35 to 44 Years | 351 (95.6%) | 16 (4.4%) |
| 45 to 54 Years | 170 (95.5%) | 8 (4.5%) |
| 55 to 64 Years | 317 (94.6%) | 18 (5.4%) |
| 65 to 74 Years | 241 (100.0%) | 0 (0.0%) |
| 75 Years and older | 141 (100.0%) | 0 (0.0%) |
| Total | 1,984 (96.9%) | 64 (3.1%) |
Health Insurance Coverage by Citizenship Status in Marcellus
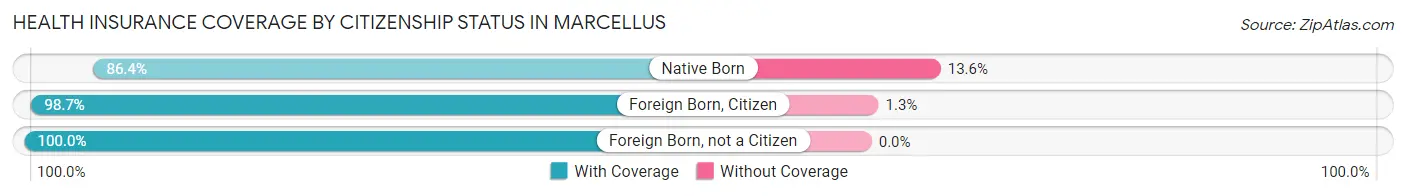
| Citizenship Status | With Coverage | Without Coverage |
| Native Born | 51 (86.4%) | 8 (13.6%) |
| Foreign Born, Citizen | 369 (98.7%) | 5 (1.3%) |
| Foreign Born, not a Citizen | 114 (100.0%) | 0 (0.0%) |
Health Insurance Coverage by Household Income in Marcellus
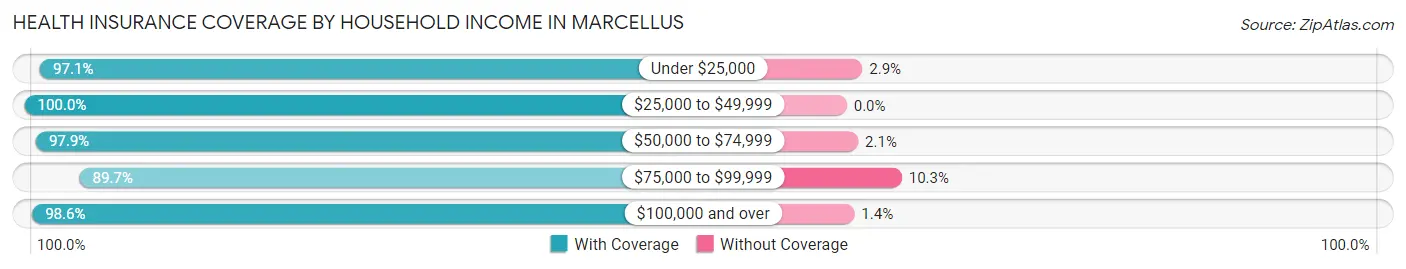
| Household Income | With Coverage | Without Coverage |
| Under $25,000 | 266 (97.1%) | 8 (2.9%) |
| $25,000 to $49,999 | 161 (100.0%) | 0 (0.0%) |
| $50,000 to $74,999 | 368 (97.9%) | 8 (2.1%) |
| $75,000 to $99,999 | 296 (89.7%) | 34 (10.3%) |
| $100,000 and over | 893 (98.6%) | 13 (1.4%) |
Public vs Private Health Insurance Coverage by Age in Marcellus
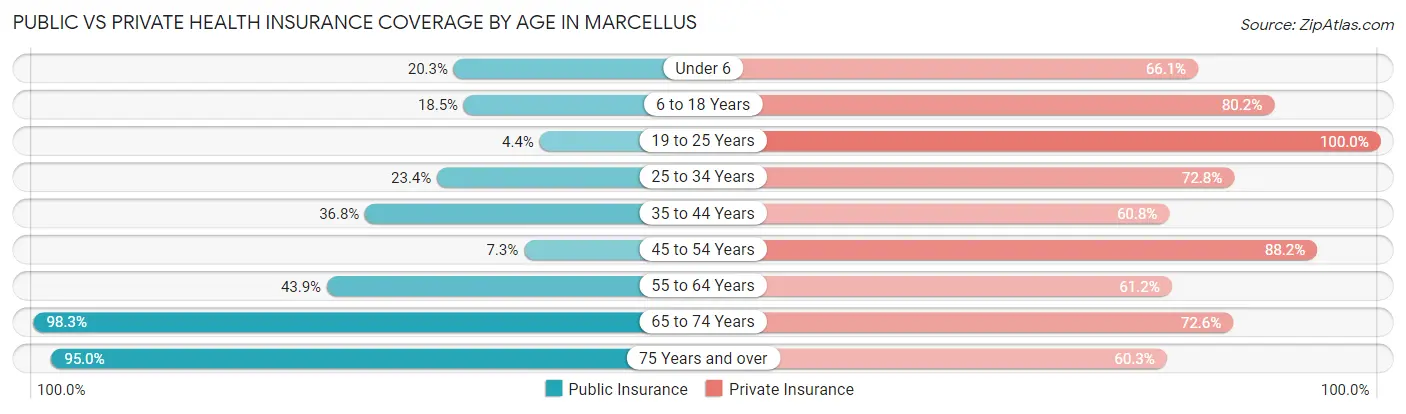
| Age Bracket | Public Insurance | Private Insurance |
| Under 6 | 12 (20.3%) | 39 (66.1%) |
| 6 to 18 Years | 69 (18.4%) | 300 (80.2%) |
| 19 to 25 Years | 5 (4.4%) | 114 (100.0%) |
| 25 to 34 Years | 56 (23.4%) | 174 (72.8%) |
| 35 to 44 Years | 135 (36.8%) | 223 (60.8%) |
| 45 to 54 Years | 13 (7.3%) | 157 (88.2%) |
| 55 to 64 Years | 147 (43.9%) | 205 (61.2%) |
| 65 to 74 Years | 237 (98.3%) | 175 (72.6%) |
| 75 Years and over | 134 (95.0%) | 85 (60.3%) |
| Total | 808 (39.5%) | 1,472 (71.9%) |
Disability Status by Sex by Age in Marcellus
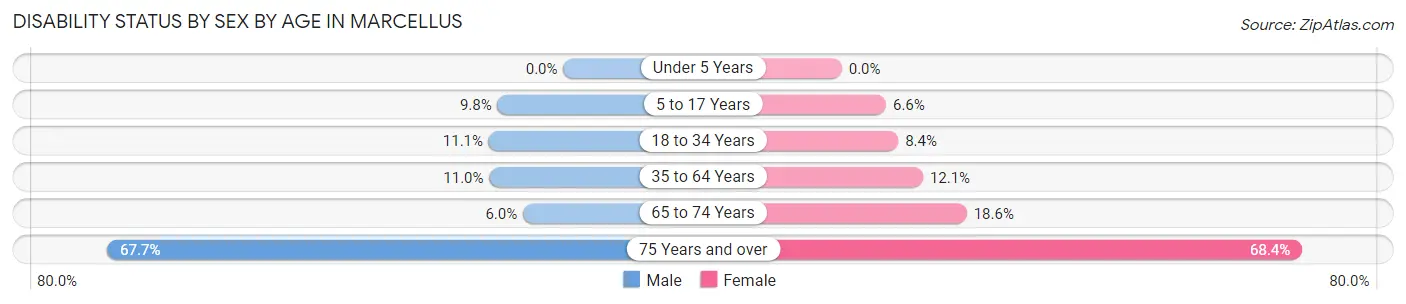
| Age Bracket | Male | Female |
| Under 5 Years | 0 (0.0%) | 0 (0.0%) |
| 5 to 17 Years | 13 (9.8%) | 13 (6.6%) |
| 18 to 34 Years | 24 (11.1%) | 15 (8.4%) |
| 35 to 64 Years | 42 (11.0%) | 60 (12.0%) |
| 65 to 74 Years | 7 (6.0%) | 23 (18.5%) |
| 75 Years and over | 42 (67.7%) | 54 (68.3%) |
Disability Class by Sex by Age in Marcellus
Disability Class: Hearing Difficulty
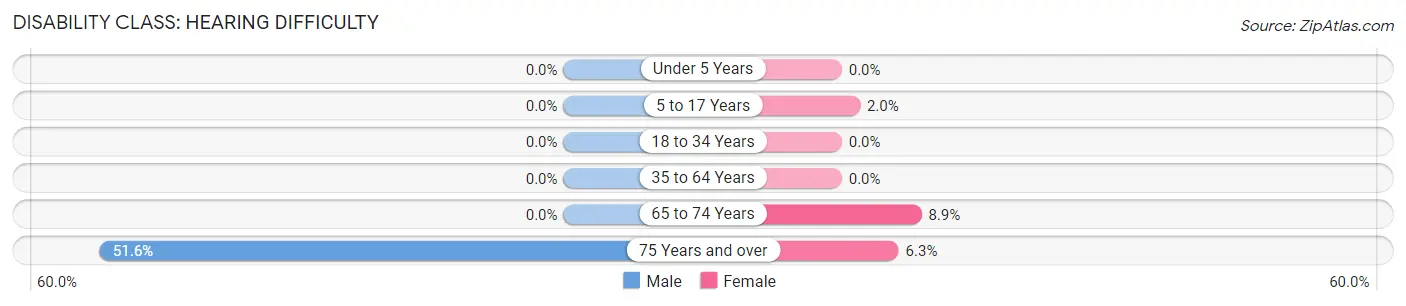
| Age Bracket | Male | Female |
| Under 5 Years | 0 (0.0%) | 0 (0.0%) |
| 5 to 17 Years | 0 (0.0%) | 4 (2.0%) |
| 18 to 34 Years | 0 (0.0%) | 0 (0.0%) |
| 35 to 64 Years | 0 (0.0%) | 0 (0.0%) |
| 65 to 74 Years | 0 (0.0%) | 11 (8.9%) |
| 75 Years and over | 32 (51.6%) | 5 (6.3%) |
Disability Class: Vision Difficulty
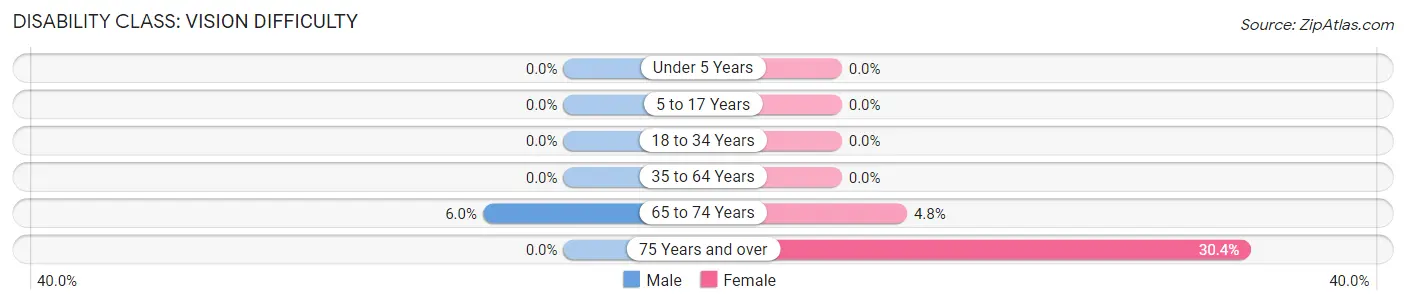
| Age Bracket | Male | Female |
| Under 5 Years | 0 (0.0%) | 0 (0.0%) |
| 5 to 17 Years | 0 (0.0%) | 0 (0.0%) |
| 18 to 34 Years | 0 (0.0%) | 0 (0.0%) |
| 35 to 64 Years | 0 (0.0%) | 0 (0.0%) |
| 65 to 74 Years | 7 (6.0%) | 6 (4.8%) |
| 75 Years and over | 0 (0.0%) | 24 (30.4%) |
Disability Class: Cognitive Difficulty
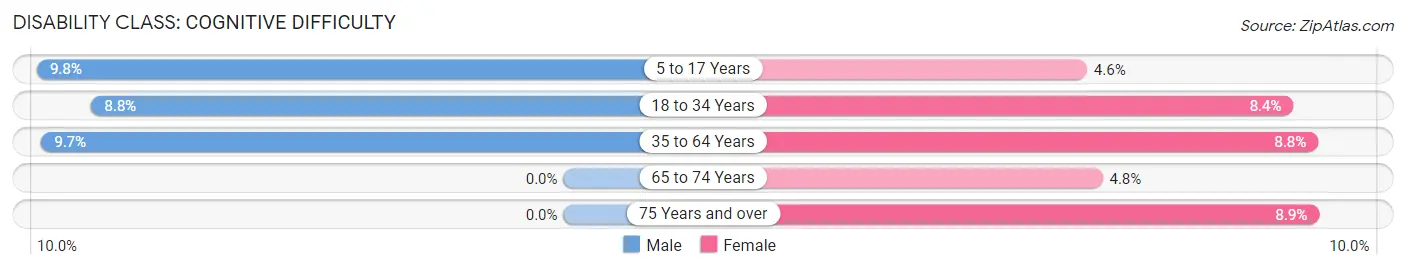
| Age Bracket | Male | Female |
| 5 to 17 Years | 13 (9.8%) | 9 (4.5%) |
| 18 to 34 Years | 19 (8.8%) | 15 (8.4%) |
| 35 to 64 Years | 37 (9.7%) | 44 (8.8%) |
| 65 to 74 Years | 0 (0.0%) | 6 (4.8%) |
| 75 Years and over | 0 (0.0%) | 7 (8.9%) |
Disability Class: Ambulatory Difficulty
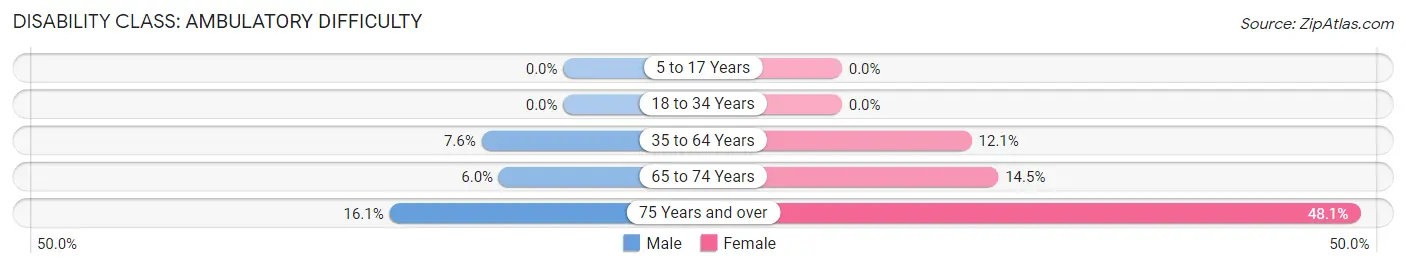
| Age Bracket | Male | Female |
| 5 to 17 Years | 0 (0.0%) | 0 (0.0%) |
| 18 to 34 Years | 0 (0.0%) | 0 (0.0%) |
| 35 to 64 Years | 29 (7.6%) | 60 (12.0%) |
| 65 to 74 Years | 7 (6.0%) | 18 (14.5%) |
| 75 Years and over | 10 (16.1%) | 38 (48.1%) |
Disability Class: Self-Care Difficulty
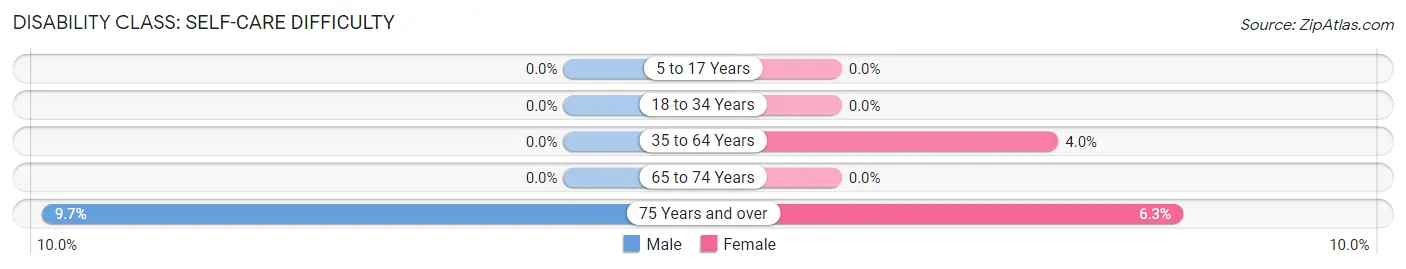
| Age Bracket | Male | Female |
| 5 to 17 Years | 0 (0.0%) | 0 (0.0%) |
| 18 to 34 Years | 0 (0.0%) | 0 (0.0%) |
| 35 to 64 Years | 0 (0.0%) | 20 (4.0%) |
| 65 to 74 Years | 0 (0.0%) | 0 (0.0%) |
| 75 Years and over | 6 (9.7%) | 5 (6.3%) |
Technology Access in Marcellus
Computing Device Access in Marcellus
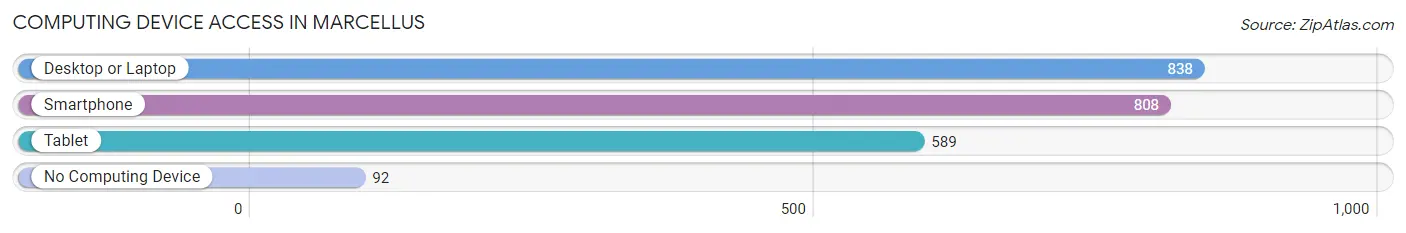
| Device Type | # Households | % Households |
| Desktop or Laptop | 838 | 83.7% |
| Smartphone | 808 | 80.7% |
| Tablet | 589 | 58.8% |
| No Computing Device | 92 | 9.2% |
| Total | 1,001 | 100.0% |
Internet Access in Marcellus
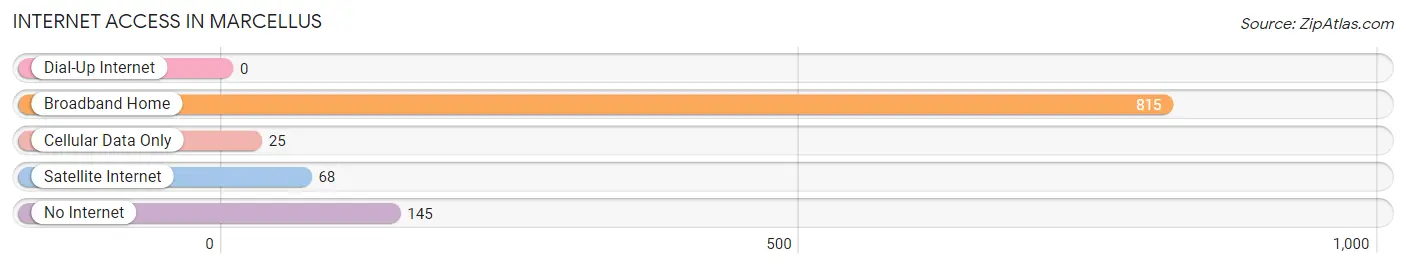
| Internet Type | # Households | % Households |
| Dial-Up Internet | 0 | 0.0% |
| Broadband Home | 815 | 81.4% |
| Cellular Data Only | 25 | 2.5% |
| Satellite Internet | 68 | 6.8% |
| No Internet | 145 | 14.5% |
| Total | 1,001 | 100.0% |
Marcellus Summary
Marcellus, NY is a small town located in Onondaga County, New York. It is situated in the Finger Lakes region of the state, and is part of the Syracuse Metropolitan Statistical Area. The town was founded in 1794 and has a population of approximately 3,500 people.
History
Marcellus was first settled in 1794 by a group of settlers from Massachusetts. The town was named after Marcellus, a Roman general who fought in the Battle of Cannae. The town was officially incorporated in 1823.
In the early 19th century, Marcellus was a thriving agricultural community. The town was known for its production of apples, potatoes, and other crops. In the late 19th century, the town began to experience a decline in its agricultural production. This decline was due to the introduction of new farming techniques and the development of new industries in the area.
In the early 20th century, Marcellus began to experience a resurgence in its economy. This was due to the development of the Marcellus Shale, a large natural gas deposit located beneath the town. The development of the Marcellus Shale has led to an increase in the town’s population and economic activity.
Geography
Marcellus is located in the Finger Lakes region of New York. The town is situated in the northern part of Onondaga County, and is bordered by the towns of Skaneateles, Spafford, and Elbridge. The town is located approximately 20 miles south of Syracuse, and is situated on the western edge of Skaneateles Lake.
The town has a total area of 16.2 square miles, of which 15.9 square miles is land and 0.3 square miles is water. The terrain of the town is mostly flat, with some rolling hills in the northern part of the town. The town is located in the Finger Lakes region, and is home to several small lakes and ponds.
Economy
Marcellus’s economy is largely based on agriculture and natural gas production. The town is home to several farms, which produce a variety of crops, including apples, potatoes, and other vegetables. The town is also home to several natural gas wells, which are operated by several energy companies.
The town is also home to several small businesses, including restaurants, retail stores, and other services. The town is also home to several manufacturing companies, which produce a variety of products, including furniture, clothing, and other items.
Demographics
As of the 2010 census, Marcellus had a population of 3,521 people. The town has a population density of 217.7 people per square mile. The median age of the town’s population is 43.7 years, and the median household income is $51,945.
The town is predominantly white, with 92.3% of the population identifying as white. The town also has a small Hispanic population, with 4.2% of the population identifying as Hispanic or Latino. The town also has a small African American population, with 1.2% of the population identifying as African American.
Marcellus is a small town with a rich history and a diverse economy. The town is home to several farms, natural gas wells, and small businesses. The town is also home to a diverse population, with a mix of white, Hispanic, and African American residents. The town is a great place to live and work, and is a great place to visit.
Common Questions
What is Per Capita Income in Marcellus?
Per Capita income in Marcellus is $39,397.
What is the Median Family Income in Marcellus?
Median Family Income in Marcellus is $103,000.
What is the Median Household income in Marcellus?
Median Household Income in Marcellus is $72,028.
What is Income or Wage Gap in Marcellus?
Income or Wage Gap in Marcellus is 3.7%.
Women in Marcellus earn 96.3 cents for every dollar earned by a man.
What is Family Income Deficit in Marcellus?
Family Income Deficit in Marcellus is $12,868.
Families that are below poverty line in Marcellus earn $12,868 less on average than the poverty threshold level.
What is Inequality or Gini Index in Marcellus?
Inequality or Gini Index in Marcellus is 0.43.
What is the Total Population of Marcellus?
Total Population of Marcellus is 2,048.
What is the Total Male Population of Marcellus?
Total Male Population of Marcellus is 951.
What is the Total Female Population of Marcellus?
Total Female Population of Marcellus is 1,097.
What is the Ratio of Males per 100 Females in Marcellus?
There are 86.69 Males per 100 Females in Marcellus.
What is the Ratio of Females per 100 Males in Marcellus?
There are 115.35 Females per 100 Males in Marcellus.
What is the Median Population Age in Marcellus?
Median Population Age in Marcellus is 39.0 Years.
What is the Average Family Size in Marcellus
Average Family Size in Marcellus is 2.9 People.
What is the Average Household Size in Marcellus
Average Household Size in Marcellus is 2.0 People.
How Large is the Labor Force in Marcellus?
There are 1,205 People in the Labor Forcein in Marcellus.
What is the Percentage of People in the Labor Force in Marcellus?
71.2% of People are in the Labor Force in Marcellus.
What is the Unemployment Rate in Marcellus?
Unemployment Rate in Marcellus is 11.5%.