Plainedge, NY Map & Demographics
Plainedge Map
Plainedge Overview
$50,954
PER CAPITA INCOME
$148,750
AVG FAMILY INCOME
$132,107
AVG HOUSEHOLD INCOME
37.6%
WAGE / INCOME GAP [ % ]
62.4¢/ $1
WAGE / INCOME GAP [ $ ]
0.38
INEQUALITY / GINI INDEX
8,963
TOTAL POPULATION
4,486
MALE POPULATION
4,477
FEMALE POPULATION
100.20
MALES / 100 FEMALES
99.80
FEMALES / 100 MALES
40.1
MEDIAN AGE
3.5
AVG FAMILY SIZE
3.1
AVG HOUSEHOLD SIZE
4,948
LABOR FORCE [ PEOPLE ]
69.3%
PERCENT IN LABOR FORCE
2.6%
UNEMPLOYMENT RATE
Income in Plainedge
Income Overview in Plainedge
Per Capita Income in Plainedge is $50,954, while median incomes of families and households are $148,750 and $132,107 respectively.
| Characteristic | Number | Measure |
| Per Capita Income | 8,963 | $50,954 |
| Median Family Income | 2,290 | $148,750 |
| Mean Family Income | 2,290 | $169,460 |
| Median Household Income | 2,853 | $132,107 |
| Mean Household Income | 2,853 | $151,796 |
| Income Deficit | 2,290 | $0 |
| Wage / Income Gap (%) | 8,963 | 37.59% |
| Wage / Income Gap ($) | 8,963 | 62.41¢ per $1 |
| Gini / Inequality Index | 8,963 | 0.38 |
Earnings by Sex in Plainedge
Average Earnings in Plainedge are $62,172, $75,614 for men and $47,188 for women, a difference of 37.6%.
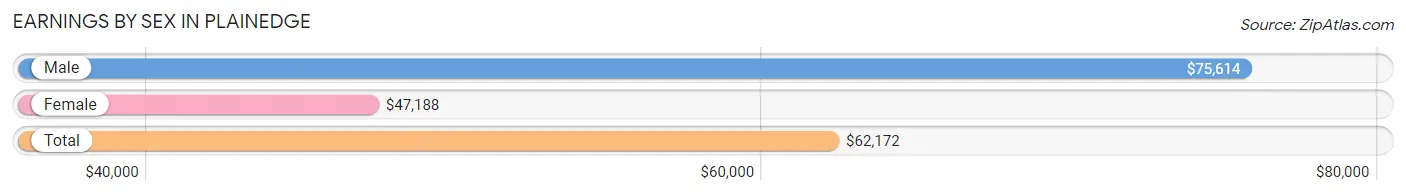
| Sex | Number | Average Earnings |
| Male | 2,821 (55.0%) | $75,614 |
| Female | 2,307 (45.0%) | $47,188 |
| Total | 5,128 (100.0%) | $62,172 |
Earnings by Sex by Income Bracket in Plainedge
The most common earnings brackets in Plainedge are $100,000+ for men (837 | 29.7%) and $100,000+ for women (477 | 20.7%).
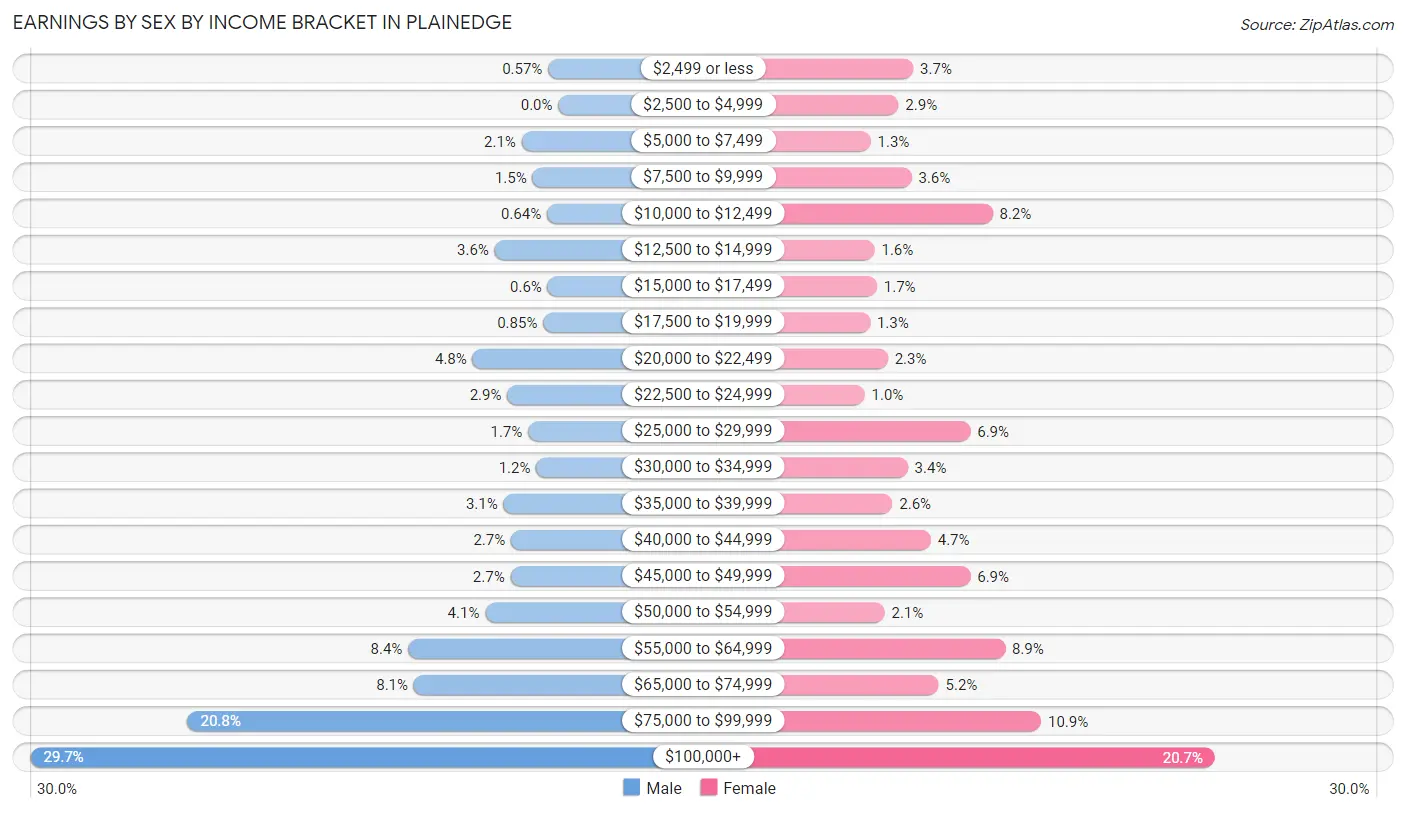
| Income | Male | Female |
| $2,499 or less | 16 (0.6%) | 86 (3.7%) |
| $2,500 to $4,999 | 0 (0.0%) | 67 (2.9%) |
| $5,000 to $7,499 | 58 (2.1%) | 31 (1.3%) |
| $7,500 to $9,999 | 41 (1.5%) | 84 (3.6%) |
| $10,000 to $12,499 | 18 (0.6%) | 189 (8.2%) |
| $12,500 to $14,999 | 101 (3.6%) | 36 (1.6%) |
| $15,000 to $17,499 | 17 (0.6%) | 39 (1.7%) |
| $17,500 to $19,999 | 24 (0.9%) | 30 (1.3%) |
| $20,000 to $22,499 | 136 (4.8%) | 53 (2.3%) |
| $22,500 to $24,999 | 81 (2.9%) | 23 (1.0%) |
| $25,000 to $29,999 | 48 (1.7%) | 160 (6.9%) |
| $30,000 to $34,999 | 35 (1.2%) | 79 (3.4%) |
| $35,000 to $39,999 | 87 (3.1%) | 59 (2.6%) |
| $40,000 to $44,999 | 75 (2.7%) | 109 (4.7%) |
| $45,000 to $49,999 | 76 (2.7%) | 160 (6.9%) |
| $50,000 to $54,999 | 116 (4.1%) | 49 (2.1%) |
| $55,000 to $64,999 | 238 (8.4%) | 205 (8.9%) |
| $65,000 to $74,999 | 229 (8.1%) | 119 (5.2%) |
| $75,000 to $99,999 | 588 (20.8%) | 252 (10.9%) |
| $100,000+ | 837 (29.7%) | 477 (20.7%) |
| Total | 2,821 (100.0%) | 2,307 (100.0%) |
Earnings by Sex by Educational Attainment in Plainedge
Average earnings in Plainedge are $79,745 for men and $52,092 for women, a difference of 34.7%. Men with an educational attainment of graduate degree enjoy the highest average annual earnings of $105,250, while those with high school diploma education earn the least with $71,917. Women with an educational attainment of graduate degree earn the most with the average annual earnings of $99,107, while those with high school diploma education have the smallest earnings of $28,480.
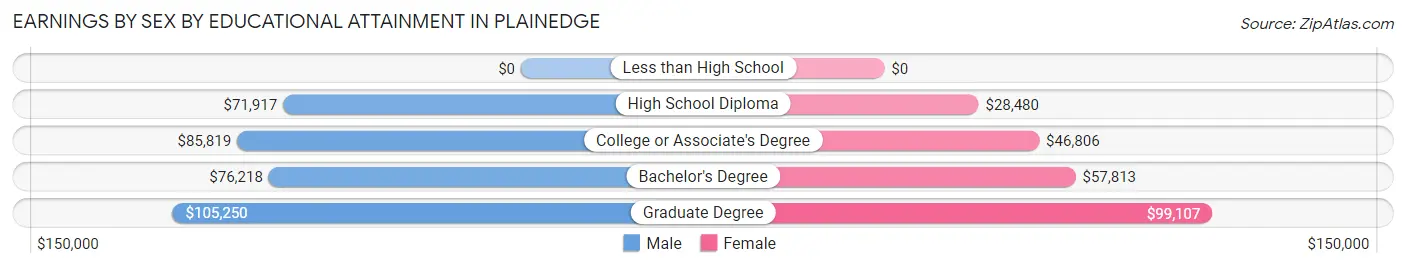
| Educational Attainment | Male Income | Female Income |
| Less than High School | - | - |
| High School Diploma | $71,917 | $28,480 |
| College or Associate's Degree | $85,819 | $46,806 |
| Bachelor's Degree | $76,218 | $57,813 |
| Graduate Degree | $105,250 | $99,107 |
| Total | $79,745 | $52,092 |
Family Income in Plainedge
Family Income Brackets in Plainedge
According to the Plainedge family income data, there are 680 families falling into the $200,000+ income range, which is the most common income bracket and makes up 29.7% of all families.
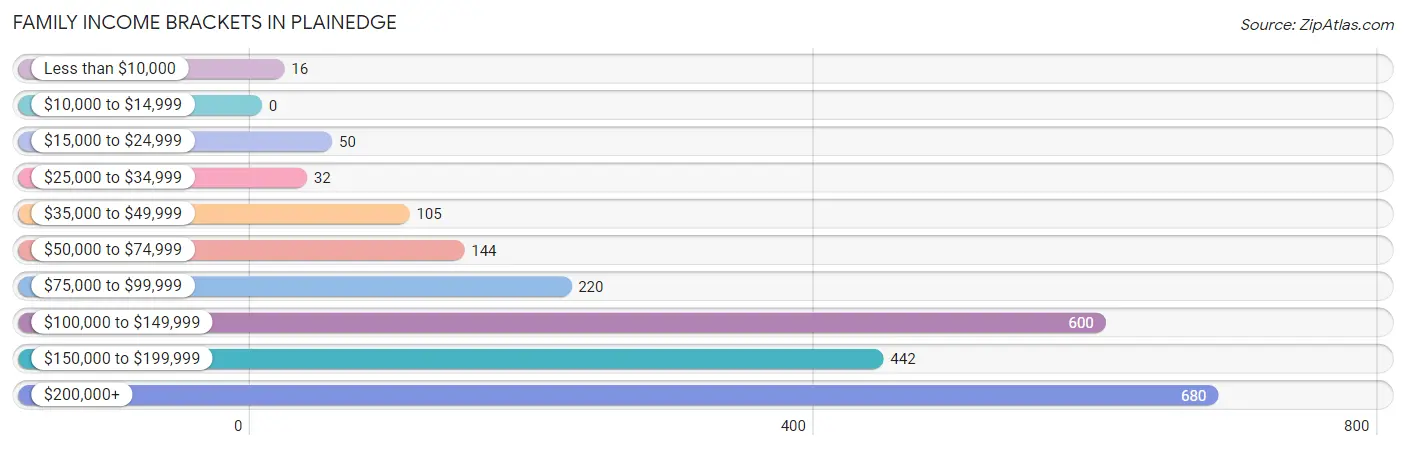
| Income Bracket | # Families | % Families |
| Less than $10,000 | 16 | 0.7% |
| $10,000 to $14,999 | 0 | 0.0% |
| $15,000 to $24,999 | 50 | 2.2% |
| $25,000 to $34,999 | 32 | 1.4% |
| $35,000 to $49,999 | 105 | 4.6% |
| $50,000 to $74,999 | 144 | 6.3% |
| $75,000 to $99,999 | 220 | 9.6% |
| $100,000 to $149,999 | 600 | 26.2% |
| $150,000 to $199,999 | 442 | 19.3% |
| $200,000+ | 680 | 29.7% |
Family Income by Famaliy Size in Plainedge
5-person families (159 | 6.9%) account for the highest median family income in Plainedge with $209,653 per family, while 3-person families (511 | 22.3%) have the highest median income of $54,077 per family member.
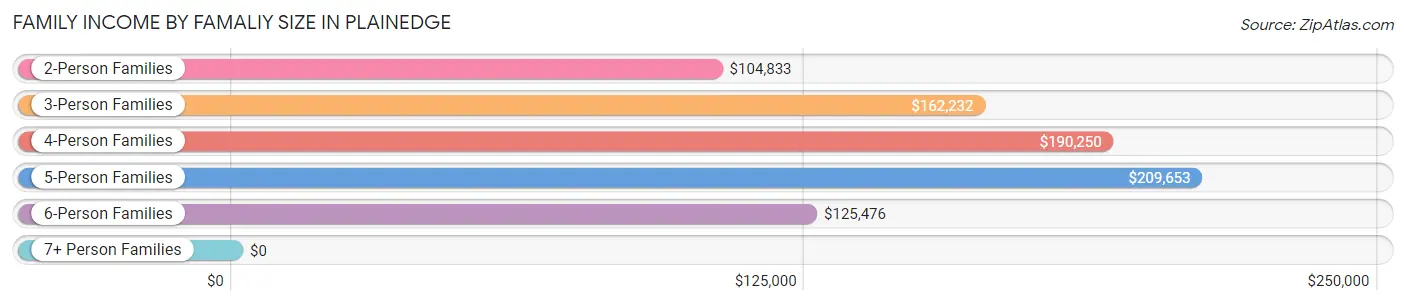
| Income Bracket | # Families | Median Income |
| 2-Person Families | 756 (33.0%) | $104,833 |
| 3-Person Families | 511 (22.3%) | $162,232 |
| 4-Person Families | 740 (32.3%) | $190,250 |
| 5-Person Families | 159 (6.9%) | $209,653 |
| 6-Person Families | 124 (5.4%) | $125,476 |
| 7+ Person Families | 0 (0.0%) | $0 |
| Total | 2,290 (100.0%) | $148,750 |
Family Income by Number of Earners in Plainedge
The median family income in Plainedge is $148,750, with families comprising 3+ earners (543) having the highest median family income of $209,915, while families with no earners (307) have the lowest median family income of $54,432, accounting for 23.7% and 13.4% of families, respectively.
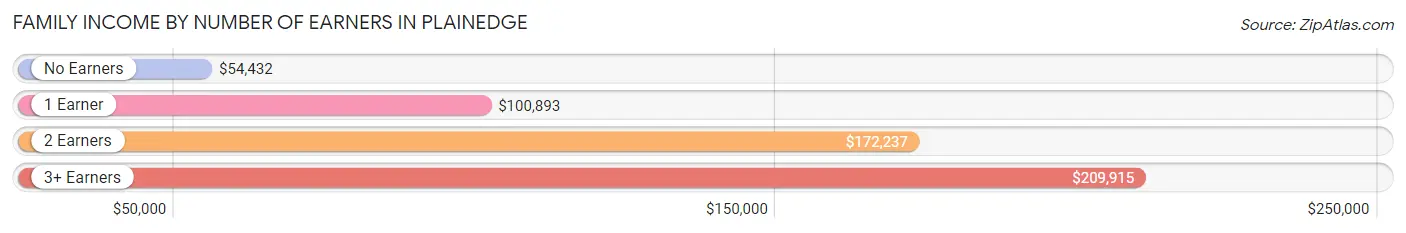
| Number of Earners | # Families | Median Income |
| No Earners | 307 (13.4%) | $54,432 |
| 1 Earner | 430 (18.8%) | $100,893 |
| 2 Earners | 1,010 (44.1%) | $172,237 |
| 3+ Earners | 543 (23.7%) | $209,915 |
| Total | 2,290 (100.0%) | $148,750 |
Household Income in Plainedge
Household Income Brackets in Plainedge
With 713 households falling in the category, the $200,000+ income range is the most frequent in Plainedge, accounting for 25.0% of all households. In contrast, only 40 households (1.4%) fall into the less than $10,000 income bracket, making it the least populous group.
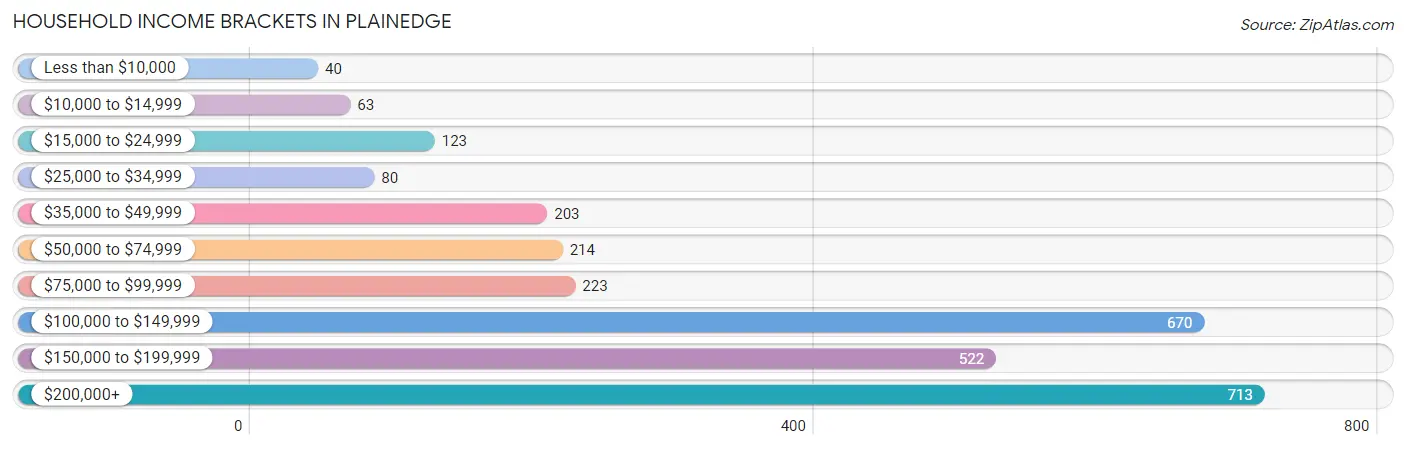
| Income Bracket | # Households | % Households |
| Less than $10,000 | 40 | 1.4% |
| $10,000 to $14,999 | 63 | 2.2% |
| $15,000 to $24,999 | 123 | 4.3% |
| $25,000 to $34,999 | 80 | 2.8% |
| $35,000 to $49,999 | 203 | 7.1% |
| $50,000 to $74,999 | 214 | 7.5% |
| $75,000 to $99,999 | 223 | 7.8% |
| $100,000 to $149,999 | 670 | 23.5% |
| $150,000 to $199,999 | 522 | 18.3% |
| $200,000+ | 713 | 25.0% |
Household Income by Householder Age in Plainedge
The median household income in Plainedge is $132,107, with the highest median household income of $172,411 found in the 45 to 64 years age bracket for the primary householder. A total of 1,131 households (39.6%) fall into this category. Meanwhile, the 15 to 24 years age bracket for the primary householder has the lowest median household income of $0, with 37 households (1.3%) in this group.
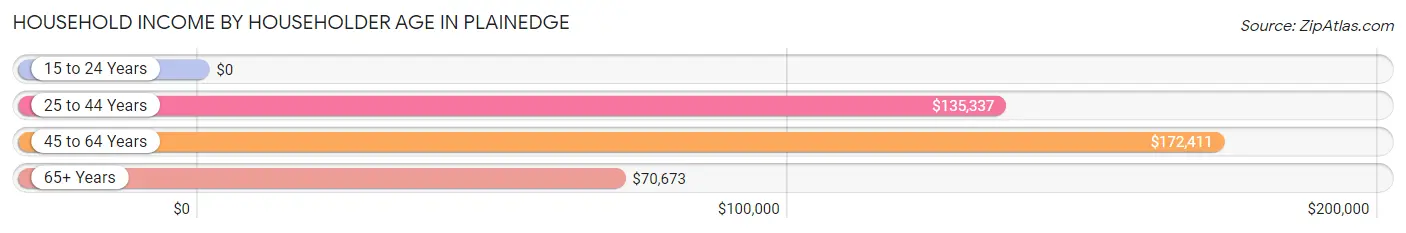
| Income Bracket | # Households | Median Income |
| 15 to 24 Years | 37 (1.3%) | $0 |
| 25 to 44 Years | 834 (29.2%) | $135,337 |
| 45 to 64 Years | 1,131 (39.6%) | $172,411 |
| 65+ Years | 851 (29.8%) | $70,673 |
| Total | 2,853 (100.0%) | $132,107 |
Poverty in Plainedge
Income Below Poverty by Sex and Age in Plainedge
With 7.1% poverty level for males and 4.9% for females among the residents of Plainedge, 6 to 11 year old males and under 5 year old females are the most vulnerable to poverty, with 34 males (17.9%) and 39 females (13.2%) in their respective age groups living below the poverty level.
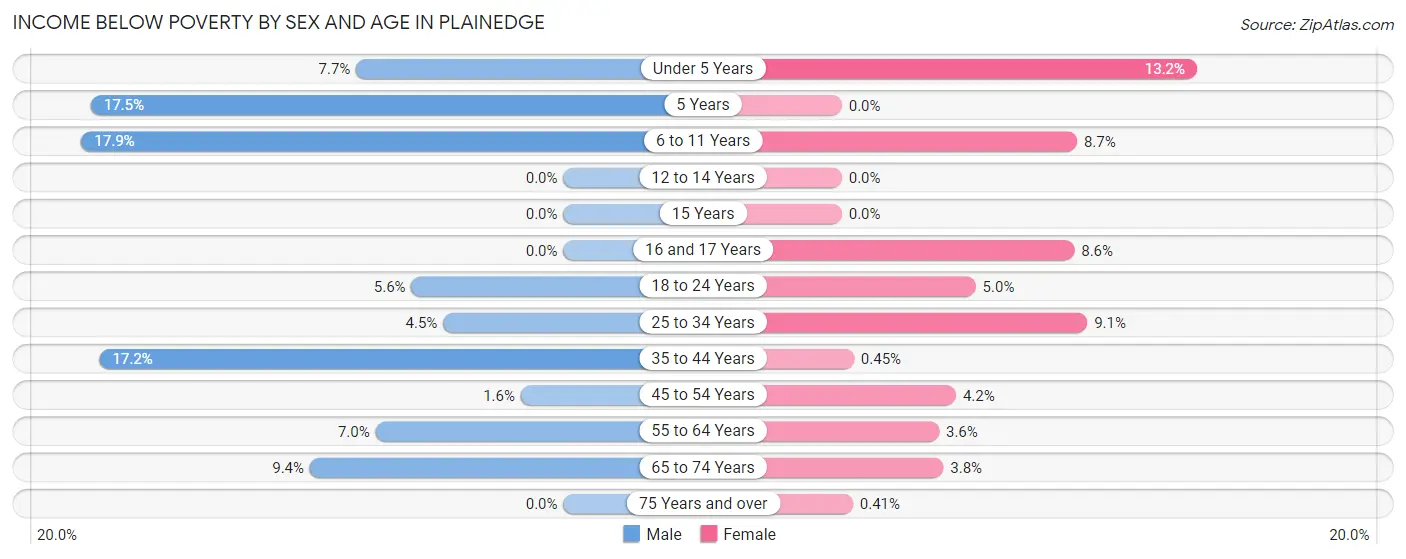
| Age Bracket | Male | Female |
| Under 5 Years | 36 (7.7%) | 39 (13.2%) |
| 5 Years | 10 (17.5%) | 0 (0.0%) |
| 6 to 11 Years | 34 (17.9%) | 31 (8.7%) |
| 12 to 14 Years | 0 (0.0%) | 0 (0.0%) |
| 15 Years | 0 (0.0%) | 0 (0.0%) |
| 16 and 17 Years | 0 (0.0%) | 12 (8.6%) |
| 18 to 24 Years | 23 (5.6%) | 15 (5.0%) |
| 25 to 34 Years | 33 (4.5%) | 53 (9.1%) |
| 35 to 44 Years | 104 (17.2%) | 2 (0.4%) |
| 45 to 54 Years | 10 (1.6%) | 30 (4.2%) |
| 55 to 64 Years | 37 (7.0%) | 19 (3.6%) |
| 65 to 74 Years | 32 (9.4%) | 14 (3.8%) |
| 75 Years and over | 0 (0.0%) | 2 (0.4%) |
| Total | 319 (7.1%) | 217 (4.9%) |
Income Above Poverty by Sex and Age in Plainedge
According to the poverty statistics in Plainedge, males aged 12 to 14 years and females aged 5 years are the age groups that are most secure financially, with 100.0% of males and 100.0% of females in these age groups living above the poverty line.
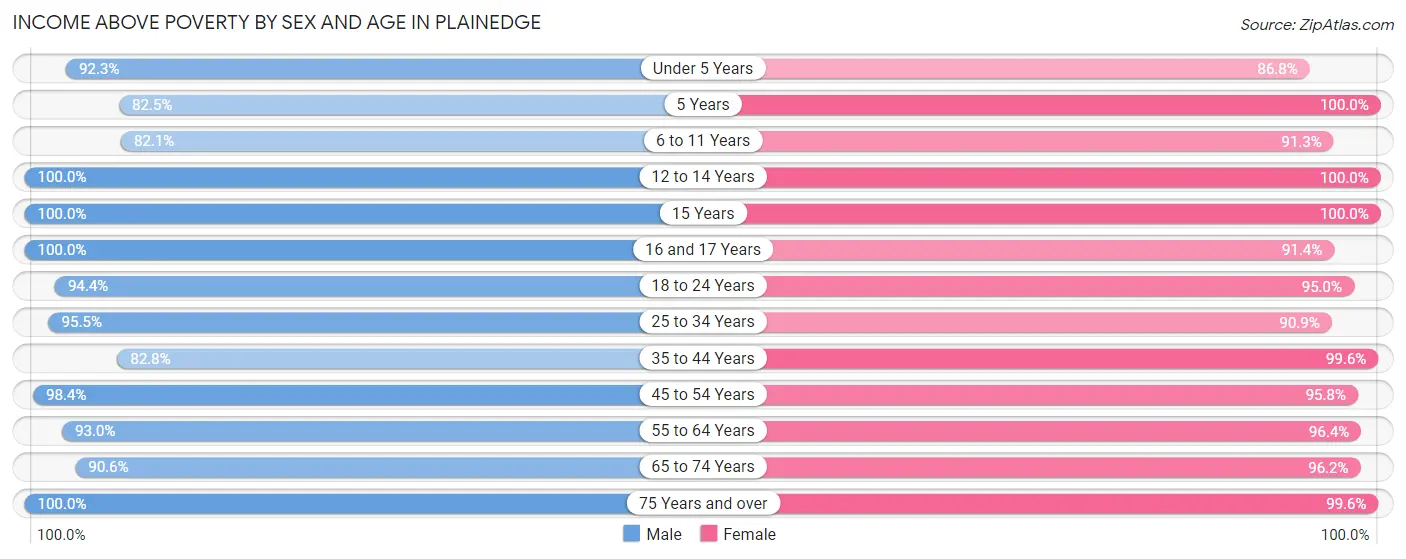
| Age Bracket | Male | Female |
| Under 5 Years | 432 (92.3%) | 257 (86.8%) |
| 5 Years | 47 (82.5%) | 21 (100.0%) |
| 6 to 11 Years | 156 (82.1%) | 324 (91.3%) |
| 12 to 14 Years | 160 (100.0%) | 186 (100.0%) |
| 15 Years | 31 (100.0%) | 52 (100.0%) |
| 16 and 17 Years | 48 (100.0%) | 127 (91.4%) |
| 18 to 24 Years | 385 (94.4%) | 287 (95.0%) |
| 25 to 34 Years | 707 (95.5%) | 529 (90.9%) |
| 35 to 44 Years | 500 (82.8%) | 441 (99.6%) |
| 45 to 54 Years | 622 (98.4%) | 678 (95.8%) |
| 55 to 64 Years | 494 (93.0%) | 507 (96.4%) |
| 65 to 74 Years | 308 (90.6%) | 357 (96.2%) |
| 75 Years and over | 277 (100.0%) | 487 (99.6%) |
| Total | 4,167 (92.9%) | 4,253 (95.2%) |
Income Below Poverty Among Married-Couple Families in Plainedge
The poverty statistics for married-couple families in Plainedge show that 3.1% or 60 of the total 1,944 families live below the poverty line. Families with 3 or 4 children have the highest poverty rate of 24.5%, comprising of 35 families. On the other hand, families with 1 or 2 children have the lowest poverty rate of 1.1%, which includes 9 families.
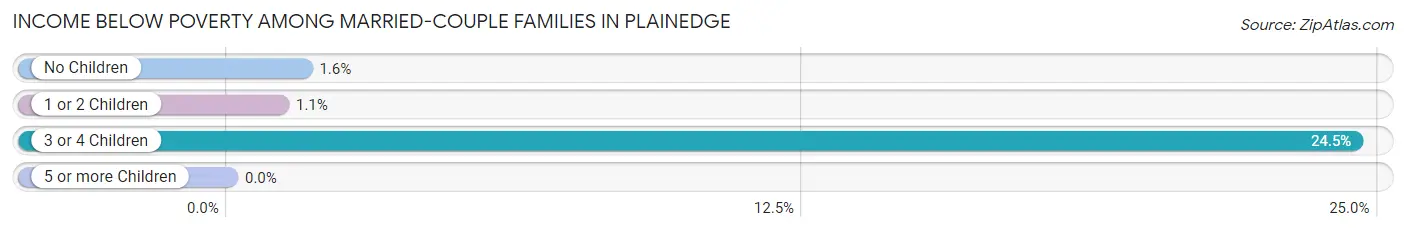
| Children | Above Poverty | Below Poverty |
| No Children | 974 (98.4%) | 16 (1.6%) |
| 1 or 2 Children | 802 (98.9%) | 9 (1.1%) |
| 3 or 4 Children | 108 (75.5%) | 35 (24.5%) |
| 5 or more Children | 0 (0.0%) | 0 (0.0%) |
| Total | 1,884 (96.9%) | 60 (3.1%) |
Income Below Poverty Among Single-Parent Households in Plainedge
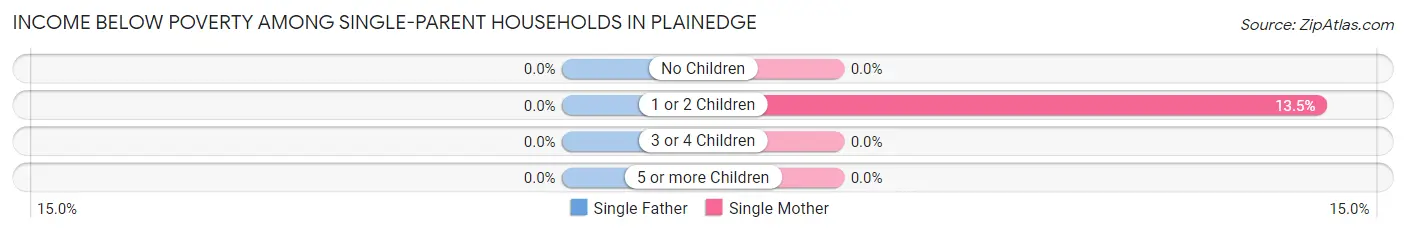
| Children | Single Father | Single Mother |
| No Children | 0 (0.0%) | 0 (0.0%) |
| 1 or 2 Children | 0 (0.0%) | 15 (13.5%) |
| 3 or 4 Children | 0 (0.0%) | 0 (0.0%) |
| 5 or more Children | 0 (0.0%) | 0 (0.0%) |
| Total | 0 (0.0%) | 15 (5.7%) |
Income Below Poverty Among Married-Couple vs Single-Parent Households in Plainedge
The poverty data for Plainedge shows that 60 of the married-couple family households (3.1%) and 15 of the single-parent households (4.3%) are living below the poverty level. Within the married-couple family households, those with 3 or 4 children have the highest poverty rate, with 35 households (24.5%) falling below the poverty line. Among the single-parent households, those with 1 or 2 children have the highest poverty rate, with 15 household (13.0%) living below poverty.
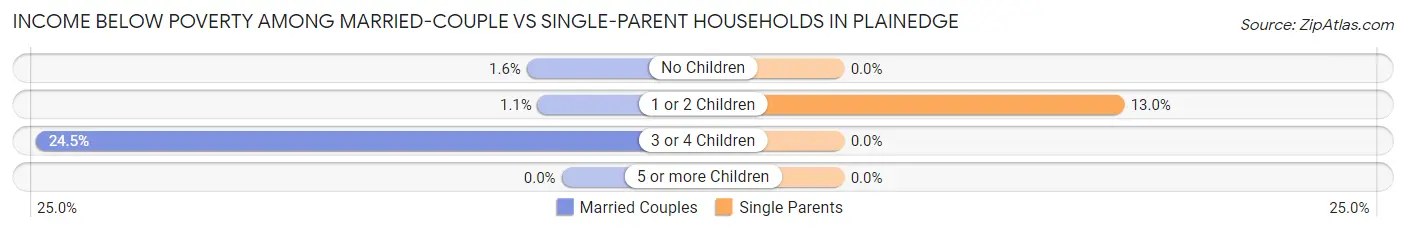
| Children | Married-Couple Families | Single-Parent Households |
| No Children | 16 (1.6%) | 0 (0.0%) |
| 1 or 2 Children | 9 (1.1%) | 15 (13.0%) |
| 3 or 4 Children | 35 (24.5%) | 0 (0.0%) |
| 5 or more Children | 0 (0.0%) | 0 (0.0%) |
| Total | 60 (3.1%) | 15 (4.3%) |
Race in Plainedge
The most populous races in Plainedge are White / Caucasian (6,853 | 76.5%), Asian (1,135 | 12.7%), and Hispanic or Latino (1,067 | 11.9%).
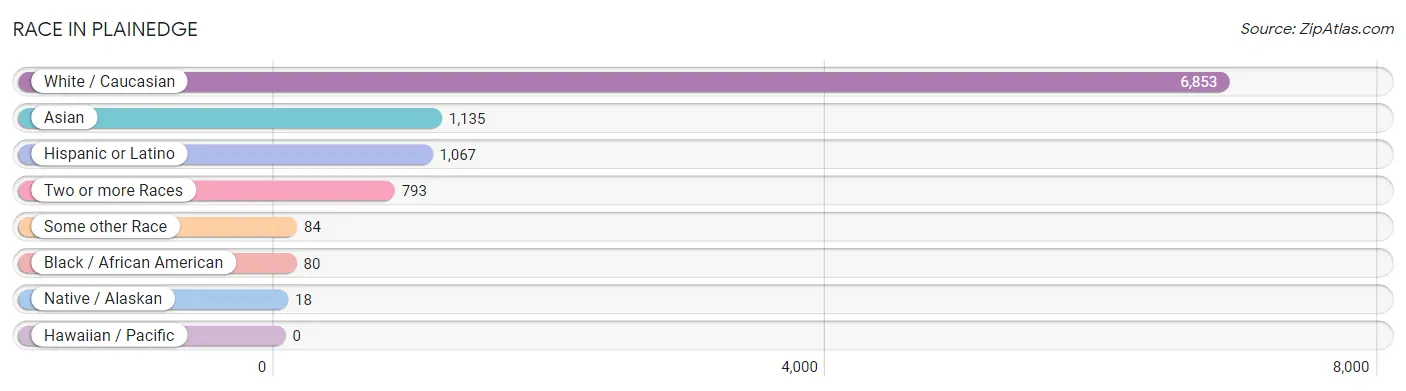
| Race | # Population | % Population |
| Asian | 1,135 | 12.7% |
| Black / African American | 80 | 0.9% |
| Hawaiian / Pacific | 0 | 0.0% |
| Hispanic or Latino | 1,067 | 11.9% |
| Native / Alaskan | 18 | 0.2% |
| White / Caucasian | 6,853 | 76.5% |
| Two or more Races | 793 | 8.8% |
| Some other Race | 84 | 0.9% |
| Total | 8,963 | 100.0% |
Ancestry in Plainedge
The most populous ancestries reported in Plainedge are Italian (3,089 | 34.5%), Irish (1,687 | 18.8%), German (808 | 9.0%), Thai (502 | 5.6%), and Greek (399 | 4.4%), together accounting for 72.3% of all Plainedge residents.
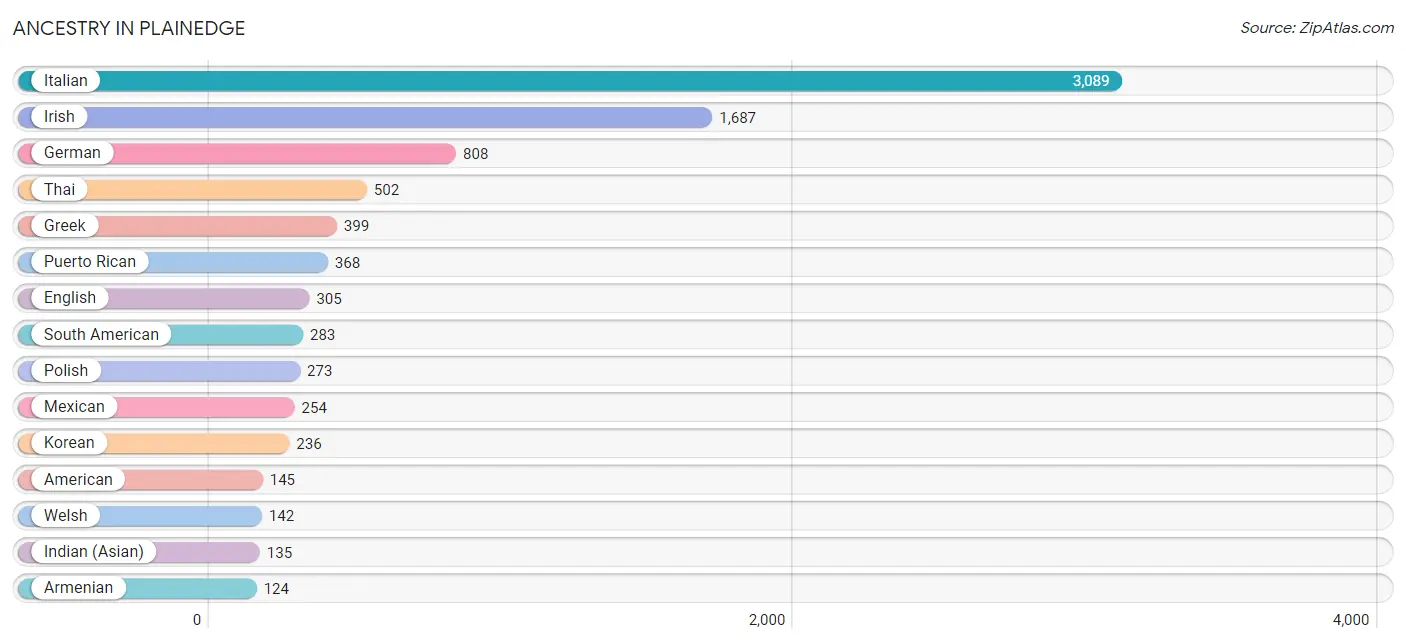
| Ancestry | # Population | % Population |
| Albanian | 9 | 0.1% |
| American | 145 | 1.6% |
| Argentinean | 95 | 1.1% |
| Armenian | 124 | 1.4% |
| Austrian | 123 | 1.4% |
| British | 11 | 0.1% |
| Burmese | 38 | 0.4% |
| Central American | 62 | 0.7% |
| Central American Indian | 12 | 0.1% |
| Colombian | 122 | 1.4% |
| Croatian | 81 | 0.9% |
| Cuban | 9 | 0.1% |
| Czechoslovakian | 22 | 0.3% |
| Dominican | 45 | 0.5% |
| Dutch | 74 | 0.8% |
| Ecuadorian | 6 | 0.1% |
| English | 305 | 3.4% |
| European | 95 | 1.1% |
| Filipino | 11 | 0.1% |
| French | 94 | 1.1% |
| German | 808 | 9.0% |
| Greek | 399 | 4.4% |
| Guamanian / Chamorro | 44 | 0.5% |
| Honduran | 62 | 0.7% |
| Hungarian | 10 | 0.1% |
| Indian (Asian) | 135 | 1.5% |
| Irish | 1,687 | 18.8% |
| Israeli | 9 | 0.1% |
| Italian | 3,089 | 34.5% |
| Korean | 236 | 2.6% |
| Lithuanian | 11 | 0.1% |
| Maltese | 29 | 0.3% |
| Mexican | 254 | 2.8% |
| Norwegian | 14 | 0.2% |
| Peruvian | 12 | 0.1% |
| Polish | 273 | 3.0% |
| Portuguese | 25 | 0.3% |
| Puerto Rican | 368 | 4.1% |
| Romanian | 16 | 0.2% |
| Russian | 24 | 0.3% |
| Scandinavian | 8 | 0.1% |
| Scotch-Irish | 35 | 0.4% |
| Scottish | 79 | 0.9% |
| Slovak | 43 | 0.5% |
| South American | 283 | 3.2% |
| Spaniard | 21 | 0.2% |
| Spanish | 9 | 0.1% |
| Spanish American Indian | 6 | 0.1% |
| Swedish | 59 | 0.7% |
| Thai | 502 | 5.6% |
| Trinidadian and Tobagonian | 29 | 0.3% |
| Ukrainian | 16 | 0.2% |
| Uruguayan | 35 | 0.4% |
| Venezuelan | 13 | 0.2% |
| Welsh | 142 | 1.6% |
| Yugoslavian | 20 | 0.2% | View All 56 Rows |
Immigrants in Plainedge
The most numerous immigrant groups reported in Plainedge came from Asia (664 | 7.4%), Europe (347 | 3.9%), South Central Asia (285 | 3.2%), Southern Europe (245 | 2.7%), and Latin America (220 | 2.5%), together accounting for 19.6% of all Plainedge residents.
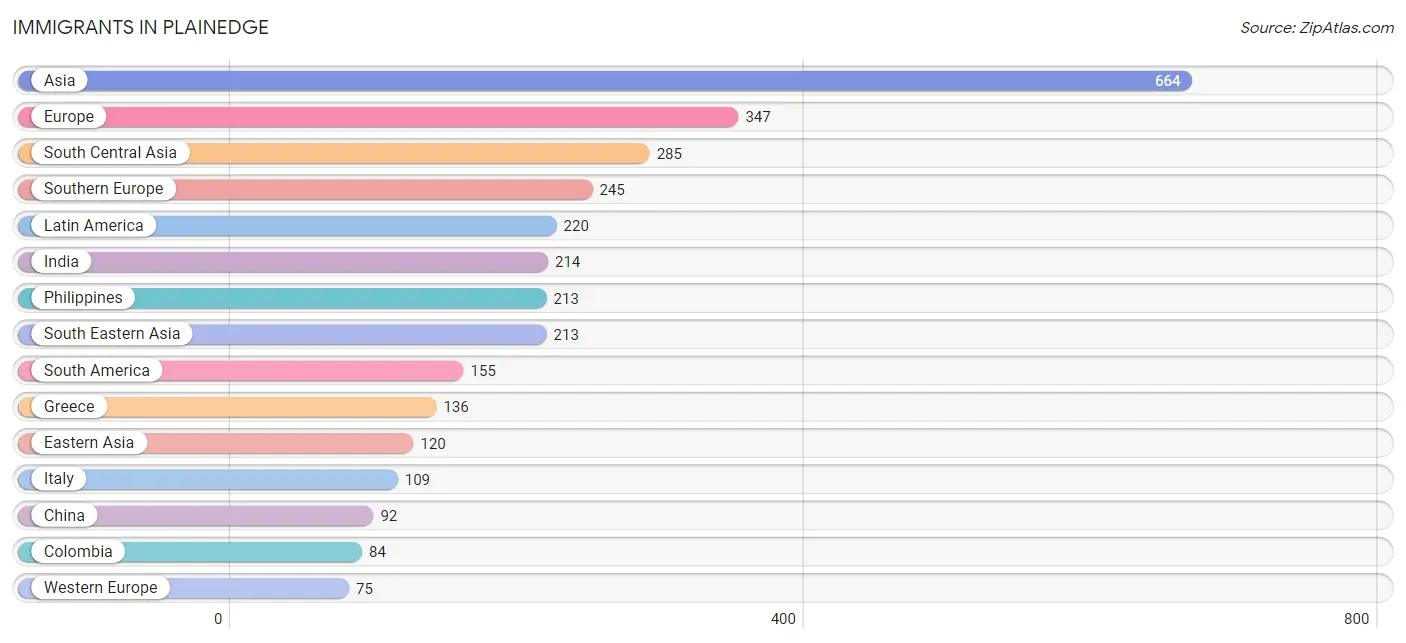
| Immigration Origin | # Population | % Population |
| Albania | 9 | 0.1% |
| Argentina | 30 | 0.3% |
| Asia | 664 | 7.4% |
| Austria | 48 | 0.5% |
| Bulgaria | 18 | 0.2% |
| Caribbean | 37 | 0.4% |
| Central America | 28 | 0.3% |
| China | 92 | 1.0% |
| Colombia | 84 | 0.9% |
| Dominican Republic | 8 | 0.1% |
| Eastern Asia | 120 | 1.3% |
| Eastern Europe | 27 | 0.3% |
| Ecuador | 6 | 0.1% |
| Europe | 347 | 3.9% |
| Germany | 27 | 0.3% |
| Greece | 136 | 1.5% |
| Honduras | 14 | 0.2% |
| Hong Kong | 15 | 0.2% |
| India | 214 | 2.4% |
| Italy | 109 | 1.2% |
| Korea | 28 | 0.3% |
| Kuwait | 46 | 0.5% |
| Latin America | 220 | 2.5% |
| Mexico | 14 | 0.2% |
| Pakistan | 71 | 0.8% |
| Philippines | 213 | 2.4% |
| South America | 155 | 1.7% |
| South Central Asia | 285 | 3.2% |
| South Eastern Asia | 213 | 2.4% |
| Southern Europe | 245 | 2.7% |
| Trinidad and Tobago | 29 | 0.3% |
| Uruguay | 35 | 0.4% |
| Western Asia | 46 | 0.5% |
| Western Europe | 75 | 0.8% | View All 34 Rows |
Sex and Age in Plainedge
Sex and Age in Plainedge
The most populous age groups in Plainedge are 25 to 29 Years (470 | 10.5%) for men and 30 to 34 Years (458 | 10.2%) for women.
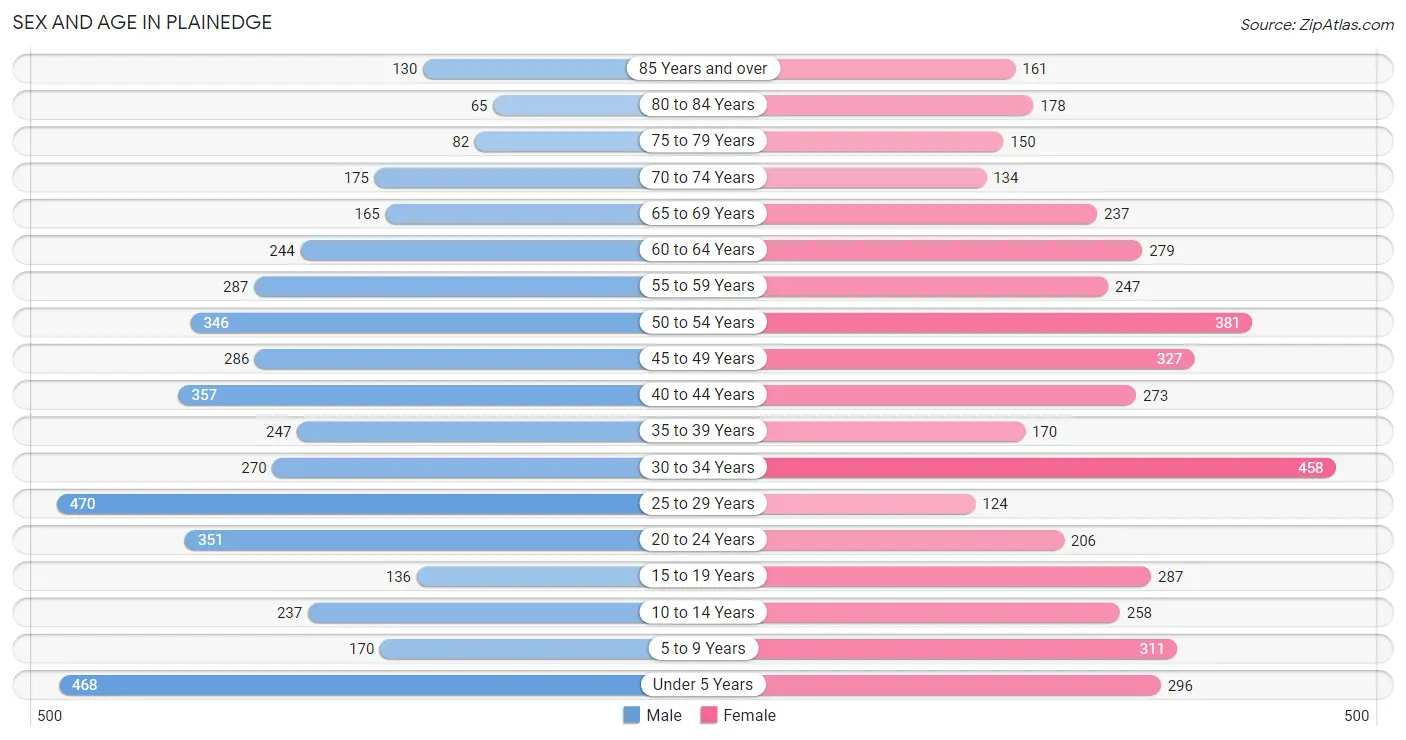
| Age Bracket | Male | Female |
| Under 5 Years | 468 (10.4%) | 296 (6.6%) |
| 5 to 9 Years | 170 (3.8%) | 311 (7.0%) |
| 10 to 14 Years | 237 (5.3%) | 258 (5.8%) |
| 15 to 19 Years | 136 (3.0%) | 287 (6.4%) |
| 20 to 24 Years | 351 (7.8%) | 206 (4.6%) |
| 25 to 29 Years | 470 (10.5%) | 124 (2.8%) |
| 30 to 34 Years | 270 (6.0%) | 458 (10.2%) |
| 35 to 39 Years | 247 (5.5%) | 170 (3.8%) |
| 40 to 44 Years | 357 (8.0%) | 273 (6.1%) |
| 45 to 49 Years | 286 (6.4%) | 327 (7.3%) |
| 50 to 54 Years | 346 (7.7%) | 381 (8.5%) |
| 55 to 59 Years | 287 (6.4%) | 247 (5.5%) |
| 60 to 64 Years | 244 (5.4%) | 279 (6.2%) |
| 65 to 69 Years | 165 (3.7%) | 237 (5.3%) |
| 70 to 74 Years | 175 (3.9%) | 134 (3.0%) |
| 75 to 79 Years | 82 (1.8%) | 150 (3.4%) |
| 80 to 84 Years | 65 (1.5%) | 178 (4.0%) |
| 85 Years and over | 130 (2.9%) | 161 (3.6%) |
| Total | 4,486 (100.0%) | 4,477 (100.0%) |
Families and Households in Plainedge
Median Family Size in Plainedge
The median family size in Plainedge is 3.48 persons per family, with married-couple families (1,944 | 84.9%) accounting for the largest median family size of 3.62 persons per family. On the other hand, single female/mother families (264 | 11.5%) represent the smallest median family size with 2.46 persons per family.
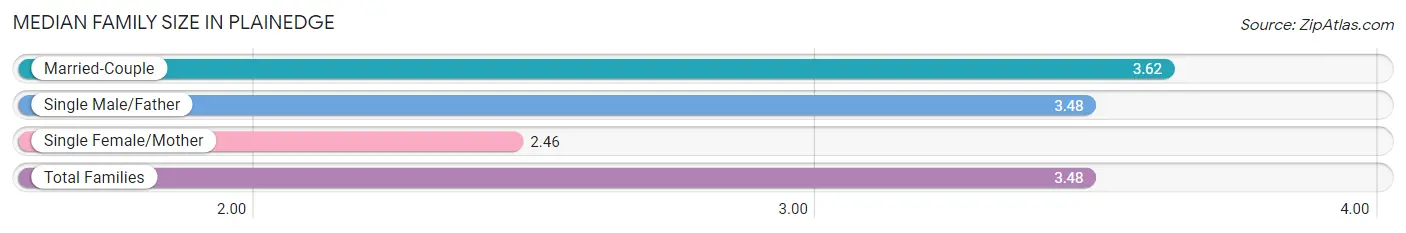
| Family Type | # Families | Family Size |
| Married-Couple | 1,944 (84.9%) | 3.62 |
| Single Male/Father | 82 (3.6%) | 3.48 |
| Single Female/Mother | 264 (11.5%) | 2.46 |
| Total Families | 2,290 (100.0%) | 3.48 |
Median Household Size in Plainedge
The median household size in Plainedge is 3.07 persons per household, with married-couple households (1,944 | 68.1%) accounting for the largest median household size of 3.64 persons per household. non-family households (563 | 19.7%) represent the smallest median household size with 1.20 persons per household.
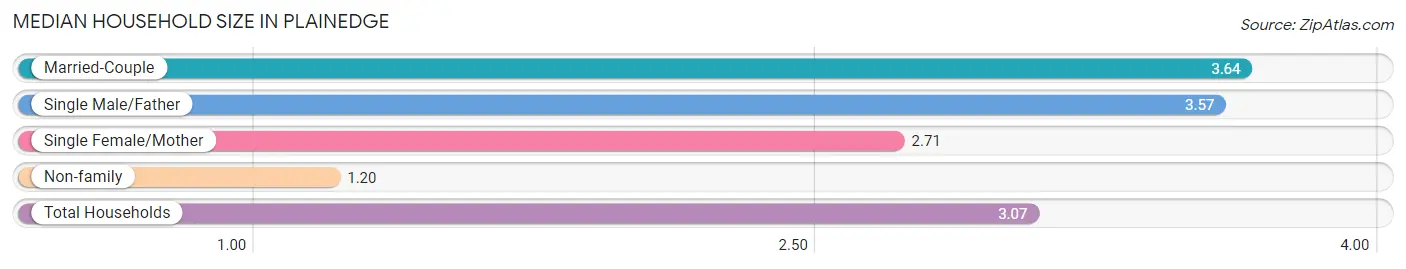
| Household Type | # Households | Household Size |
| Married-Couple | 1,944 (68.1%) | 3.64 |
| Single Male/Father | 82 (2.9%) | 3.57 |
| Single Female/Mother | 264 (9.2%) | 2.71 |
| Non-family | 563 (19.7%) | 1.20 |
| Total Households | 2,853 (100.0%) | 3.07 |
Household Size by Marriage Status in Plainedge
Out of a total of 2,853 households in Plainedge, 2,290 (80.3%) are family households, while 563 (19.7%) are nonfamily households. The most numerous type of family households are 4-person households, comprising 784, and the most common type of nonfamily households are 1-person households, comprising 473.
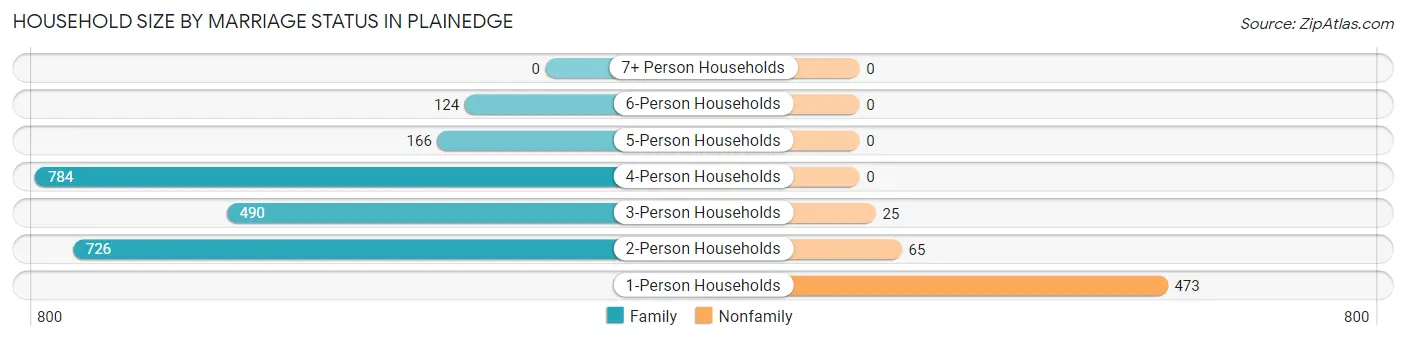
| Household Size | Family Households | Nonfamily Households |
| 1-Person Households | - | 473 (16.6%) |
| 2-Person Households | 726 (25.5%) | 65 (2.3%) |
| 3-Person Households | 490 (17.2%) | 25 (0.9%) |
| 4-Person Households | 784 (27.5%) | 0 (0.0%) |
| 5-Person Households | 166 (5.8%) | 0 (0.0%) |
| 6-Person Households | 124 (4.3%) | 0 (0.0%) |
| 7+ Person Households | 0 (0.0%) | 0 (0.0%) |
| Total | 2,290 (80.3%) | 563 (19.7%) |
Female Fertility in Plainedge
Fertility by Age in Plainedge
Average fertility rate in Plainedge is 114.0 births per 1,000 women. Women in the age bracket of 20 to 34 years have the highest fertility rate with 189.0 births per 1,000 women. Women in the age bracket of 20 to 34 years acount for 69.6% of all women with births.
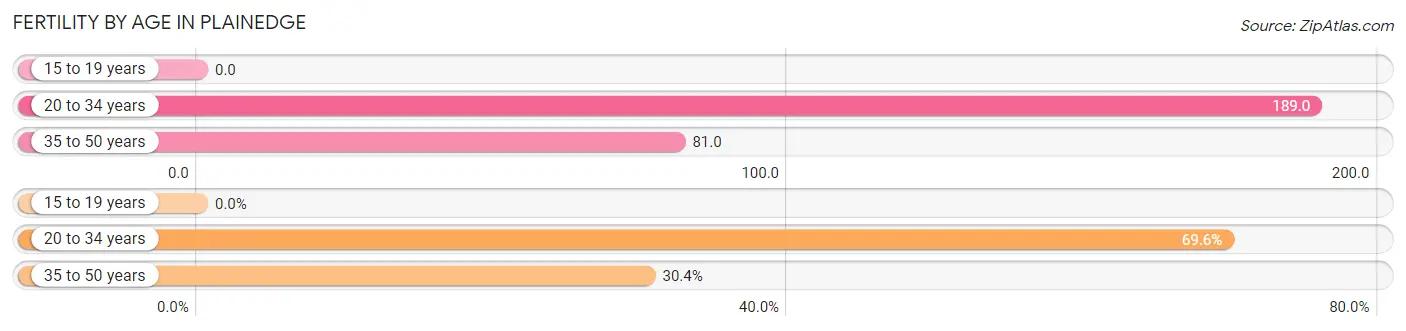
| Age Bracket | Women with Births | Births / 1,000 Women |
| 15 to 19 years | 0 (0.0%) | 0.0 |
| 20 to 34 years | 149 (69.6%) | 189.0 |
| 35 to 50 years | 65 (30.4%) | 81.0 |
| Total | 214 (100.0%) | 114.0 |
Fertility by Age by Marriage Status in Plainedge
50.0% of women with births (214) in Plainedge are married. The highest percentage of unmarried women with births falls into 20 to 34 years age bracket with 71.8% of them unmarried at the time of birth, while the lowest percentage of unmarried women with births belong to 35 to 50 years age bracket with 0.0% of them unmarried.
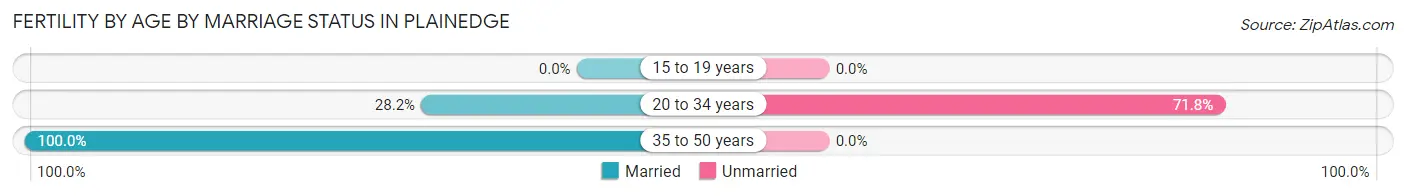
| Age Bracket | Married | Unmarried |
| 15 to 19 years | 0 (0.0%) | 0 (0.0%) |
| 20 to 34 years | 42 (28.2%) | 107 (71.8%) |
| 35 to 50 years | 65 (100.0%) | 0 (0.0%) |
| Total | 107 (50.0%) | 107 (50.0%) |
Fertility by Education in Plainedge
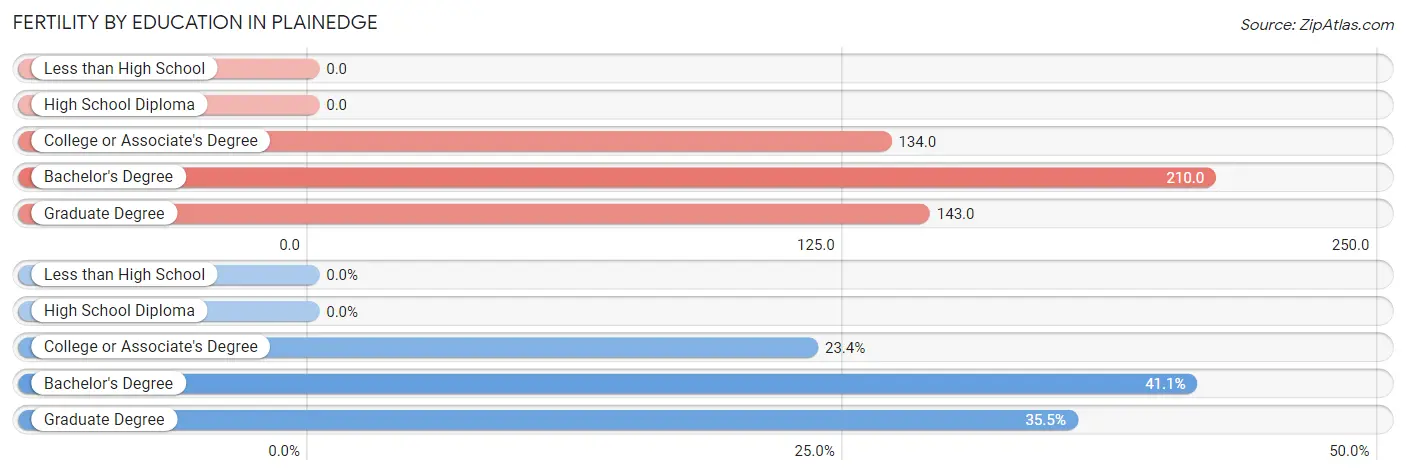
| Educational Attainment | Women with Births | Births / 1,000 Women |
| Less than High School | 0 (0.0%) | 0.0 |
| High School Diploma | 0 (0.0%) | 0.0 |
| College or Associate's Degree | 50 (23.4%) | 134.0 |
| Bachelor's Degree | 88 (41.1%) | 210.0 |
| Graduate Degree | 76 (35.5%) | 143.0 |
| Total | 214 (100.0%) | 114.0 |
Fertility by Education by Marriage Status in Plainedge
50.0% of women with births in Plainedge are unmarried. Women with the educational attainment of graduate degree are most likely to be married with 100.0% of them married at childbirth, while women with the educational attainment of bachelor's degree are least likely to be married with 94.3% of them unmarried at childbirth.
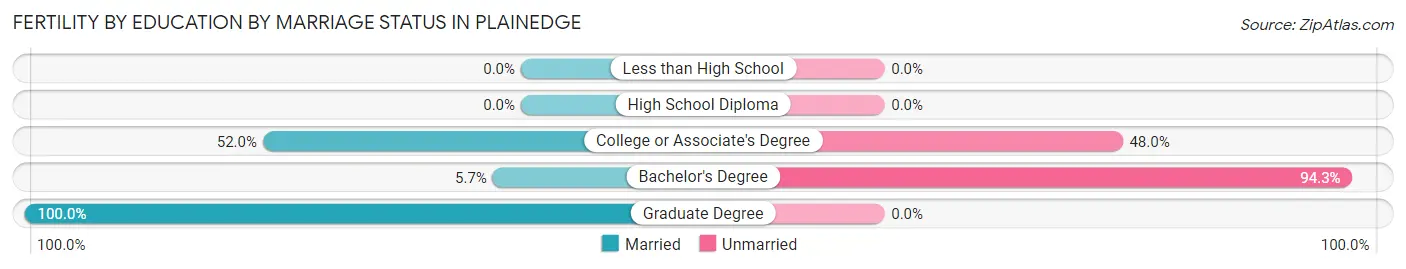
| Educational Attainment | Married | Unmarried |
| Less than High School | 0 (0.0%) | 0 (0.0%) |
| High School Diploma | 0 (0.0%) | 0 (0.0%) |
| College or Associate's Degree | 26 (52.0%) | 24 (48.0%) |
| Bachelor's Degree | 5 (5.7%) | 83 (94.3%) |
| Graduate Degree | 76 (100.0%) | 0 (0.0%) |
| Total | 107 (50.0%) | 107 (50.0%) |
Employment Characteristics in Plainedge
Employment by Class of Employer in Plainedge
Among the 4,778 employed individuals in Plainedge, private company employees (3,190 | 66.8%), local government employees (786 | 16.5%), and not-for-profit organizations (258 | 5.4%) make up the most common classes of employment.
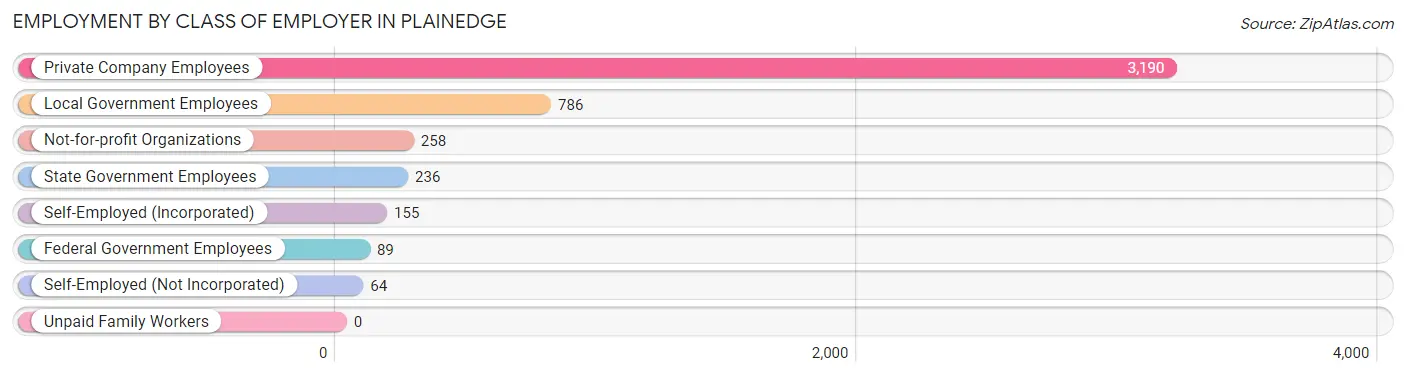
| Employer Class | # Employees | % Employees |
| Private Company Employees | 3,190 | 66.8% |
| Self-Employed (Incorporated) | 155 | 3.2% |
| Self-Employed (Not Incorporated) | 64 | 1.3% |
| Not-for-profit Organizations | 258 | 5.4% |
| Local Government Employees | 786 | 16.5% |
| State Government Employees | 236 | 4.9% |
| Federal Government Employees | 89 | 1.9% |
| Unpaid Family Workers | 0 | 0.0% |
| Total | 4,778 | 100.0% |
Employment Status by Age in Plainedge
According to the labor force statistics for Plainedge, out of the total population over 16 years of age (7,140), 69.3% or 4,948 individuals are in the labor force, with 2.6% or 129 of them unemployed. The age group with the highest labor force participation rate is 25 to 29 years, with 93.3% or 554 individuals in the labor force. Within the labor force, the 60 to 64 years age range has the highest percentage of unemployed individuals, with 11.0% or 37 of them being unemployed.
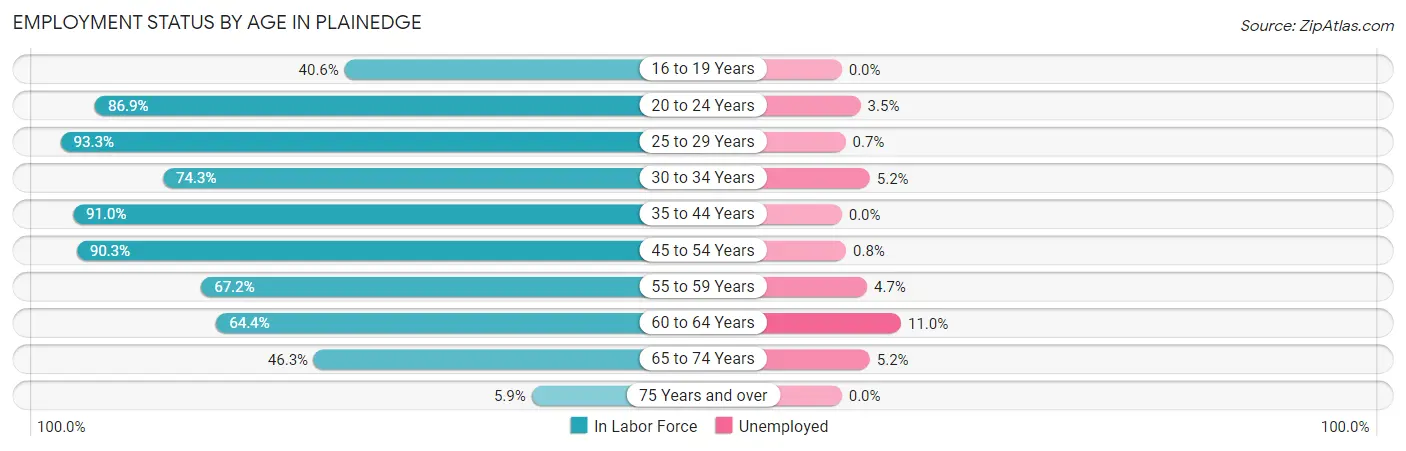
| Age Bracket | In Labor Force | Unemployed |
| 16 to 19 Years | 138 (40.6%) | 0 (0.0%) |
| 20 to 24 Years | 484 (86.9%) | 17 (3.5%) |
| 25 to 29 Years | 554 (93.3%) | 4 (0.7%) |
| 30 to 34 Years | 541 (74.3%) | 28 (5.2%) |
| 35 to 44 Years | 953 (91.0%) | 0 (0.0%) |
| 45 to 54 Years | 1,210 (90.3%) | 10 (0.8%) |
| 55 to 59 Years | 359 (67.2%) | 17 (4.7%) |
| 60 to 64 Years | 337 (64.4%) | 37 (11.0%) |
| 65 to 74 Years | 329 (46.3%) | 17 (5.2%) |
| 75 Years and over | 45 (5.9%) | 0 (0.0%) |
| Total | 4,948 (69.3%) | 129 (2.6%) |
Employment Status by Educational Attainment in Plainedge
According to labor force statistics for Plainedge, 83.0% of individuals (3,956) out of the total population between 25 and 64 years of age (4,766) are in the labor force, with 2.4% or 95 of them being unemployed. The group with the highest labor force participation rate are those with the educational attainment of bachelor's degree or higher, with 92.9% or 2,047 individuals in the labor force. Within the labor force, individuals with less than high school education have the highest percentage of unemployment, with 14.2% or 15 of them being unemployed.
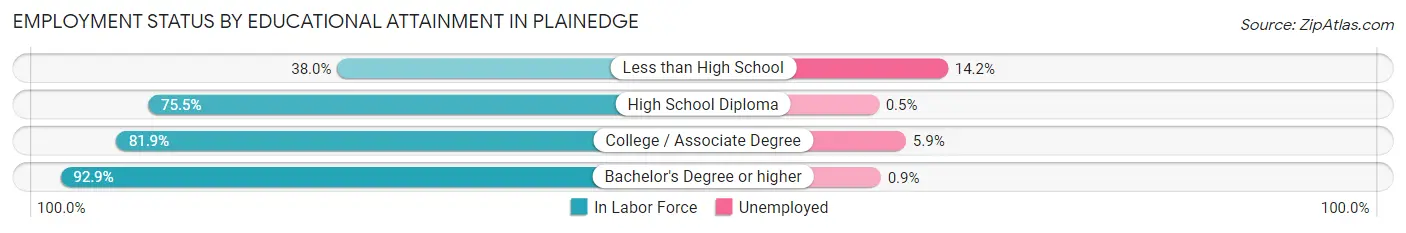
| Educational Attainment | In Labor Force | Unemployed |
| Less than High School | 106 (38.0%) | 40 (14.2%) |
| High School Diploma | 820 (75.5%) | 5 (0.5%) |
| College / Associate Degree | 981 (81.9%) | 71 (5.9%) |
| Bachelor's Degree or higher | 2,047 (92.9%) | 20 (0.9%) |
| Total | 3,956 (83.0%) | 114 (2.4%) |
Employment Occupations by Sex in Plainedge
Management, Business, Science and Arts Occupations
The most common Management, Business, Science and Arts occupations in Plainedge are Community & Social Service (620 | 12.9%), Management (470 | 9.8%), Education Instruction & Library (394 | 8.2%), Business & Financial (339 | 7.0%), and Health Diagnosing & Treating (300 | 6.2%).
Management, Business, Science and Arts Occupations by Sex
Within the Management, Business, Science and Arts occupations in Plainedge, the most male-oriented occupations are Architecture & Engineering (100.0%), Life, Physical & Social Science (100.0%), and Computers, Engineering & Science (87.1%), while the most female-oriented occupations are Health Technologists (97.0%), Legal Services & Support (88.2%), and Education Instruction & Library (77.4%).
| Occupation | Male | Female |
| Management | 226 (48.1%) | 244 (51.9%) |
| Business & Financial | 227 (67.0%) | 112 (33.0%) |
| Computers, Engineering & Science | 195 (87.1%) | 29 (13.0%) |
| Computers & Mathematics | 144 (83.2%) | 29 (16.8%) |
| Architecture & Engineering | 34 (100.0%) | 0 (0.0%) |
| Life, Physical & Social Science | 17 (100.0%) | 0 (0.0%) |
| Community & Social Service | 195 (31.5%) | 425 (68.5%) |
| Education, Arts & Media | 32 (56.1%) | 25 (43.9%) |
| Legal Services & Support | 8 (11.8%) | 60 (88.2%) |
| Education Instruction & Library | 89 (22.6%) | 305 (77.4%) |
| Arts, Media & Entertainment | 66 (65.3%) | 35 (34.6%) |
| Health Diagnosing & Treating | 98 (32.7%) | 202 (67.3%) |
| Health Technologists | 5 (3.0%) | 160 (97.0%) |
| Total (Category) | 941 (48.2%) | 1,012 (51.8%) |
| Total (Overall) | 2,660 (55.2%) | 2,160 (44.8%) |
Services Occupations
The most common Services occupations in Plainedge are Security & Protection (373 | 7.7%), Law Enforcement (286 | 5.9%), Food Preparation & Serving (226 | 4.7%), Personal Care & Service (124 | 2.6%), and Healthcare Support (89 | 1.8%).
Services Occupations by Sex
Within the Services occupations in Plainedge, the most male-oriented occupations are Cleaning & Maintenance (100.0%), Law Enforcement (98.3%), and Security & Protection (96.5%), while the most female-oriented occupations are Healthcare Support (100.0%), Personal Care & Service (100.0%), and Food Preparation & Serving (33.6%).
| Occupation | Male | Female |
| Healthcare Support | 0 (0.0%) | 89 (100.0%) |
| Security & Protection | 360 (96.5%) | 13 (3.5%) |
| Firefighting & Prevention | 79 (90.8%) | 8 (9.2%) |
| Law Enforcement | 281 (98.3%) | 5 (1.8%) |
| Food Preparation & Serving | 150 (66.4%) | 76 (33.6%) |
| Cleaning & Maintenance | 77 (100.0%) | 0 (0.0%) |
| Personal Care & Service | 0 (0.0%) | 124 (100.0%) |
| Total (Category) | 587 (66.0%) | 302 (34.0%) |
| Total (Overall) | 2,660 (55.2%) | 2,160 (44.8%) |
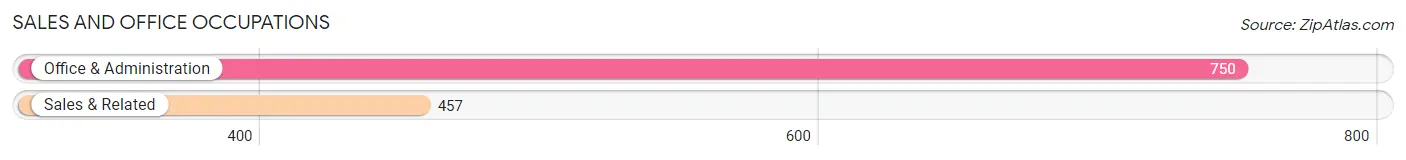
Sales and Office Occupations
The most common Sales and Office occupations in Plainedge are Office & Administration (750 | 15.6%), and Sales & Related (457 | 9.5%).
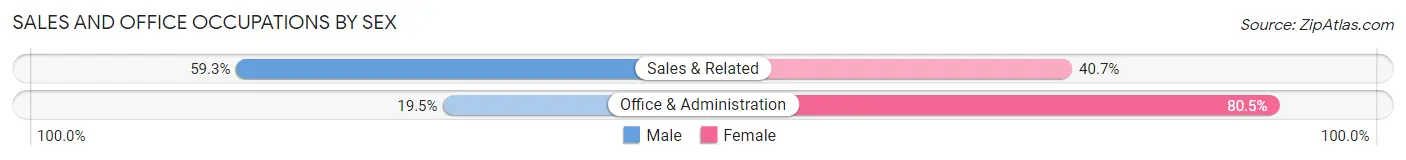
Sales and Office Occupations by Sex
| Occupation | Male | Female |
| Sales & Related | 271 (59.3%) | 186 (40.7%) |
| Office & Administration | 146 (19.5%) | 604 (80.5%) |
| Total (Category) | 417 (34.5%) | 790 (65.4%) |
| Total (Overall) | 2,660 (55.2%) | 2,160 (44.8%) |
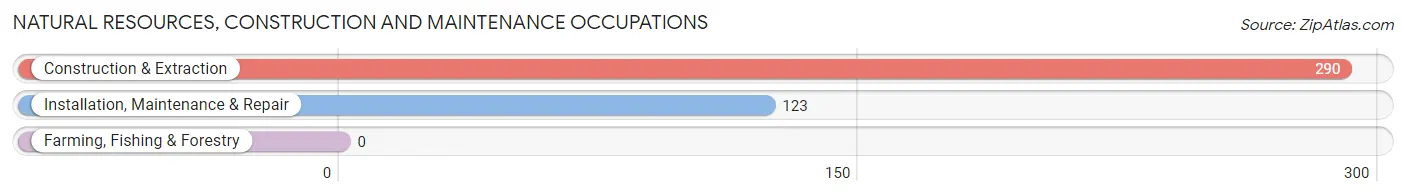
Natural Resources, Construction and Maintenance Occupations
The most common Natural Resources, Construction and Maintenance occupations in Plainedge are Construction & Extraction (290 | 6.0%), and Installation, Maintenance & Repair (123 | 2.5%).
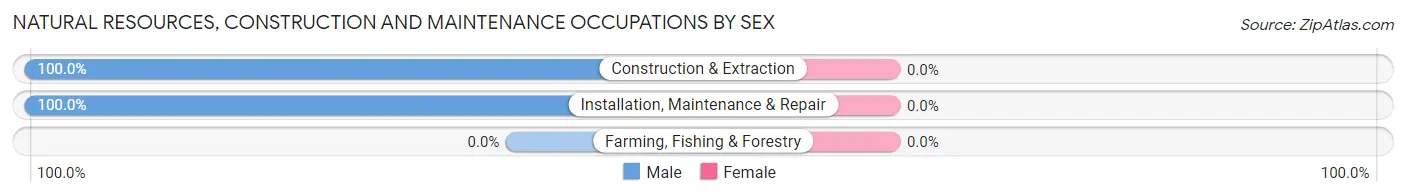
Natural Resources, Construction and Maintenance Occupations by Sex
| Occupation | Male | Female |
| Farming, Fishing & Forestry | 0 (0.0%) | 0 (0.0%) |
| Construction & Extraction | 290 (100.0%) | 0 (0.0%) |
| Installation, Maintenance & Repair | 123 (100.0%) | 0 (0.0%) |
| Total (Category) | 413 (100.0%) | 0 (0.0%) |
| Total (Overall) | 2,660 (55.2%) | 2,160 (44.8%) |
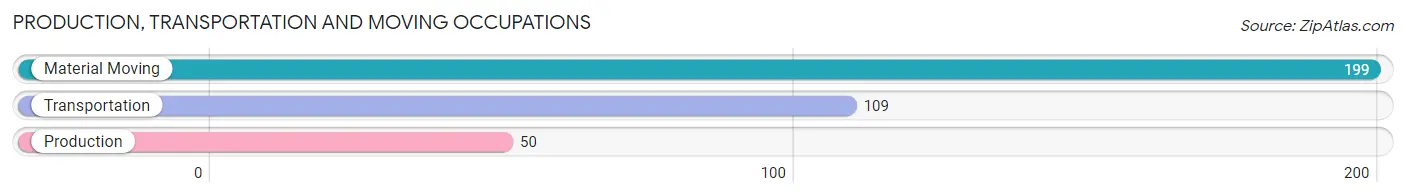
Production, Transportation and Moving Occupations
The most common Production, Transportation and Moving occupations in Plainedge are Material Moving (199 | 4.1%), Transportation (109 | 2.3%), and Production (50 | 1.0%).
Production, Transportation and Moving Occupations by Sex
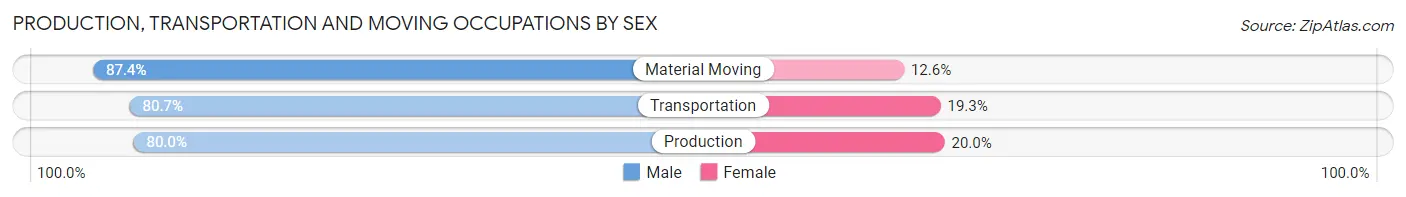
| Occupation | Male | Female |
| Production | 40 (80.0%) | 10 (20.0%) |
| Transportation | 88 (80.7%) | 21 (19.3%) |
| Material Moving | 174 (87.4%) | 25 (12.6%) |
| Total (Category) | 302 (84.4%) | 56 (15.6%) |
| Total (Overall) | 2,660 (55.2%) | 2,160 (44.8%) |
Employment Industries by Sex in Plainedge
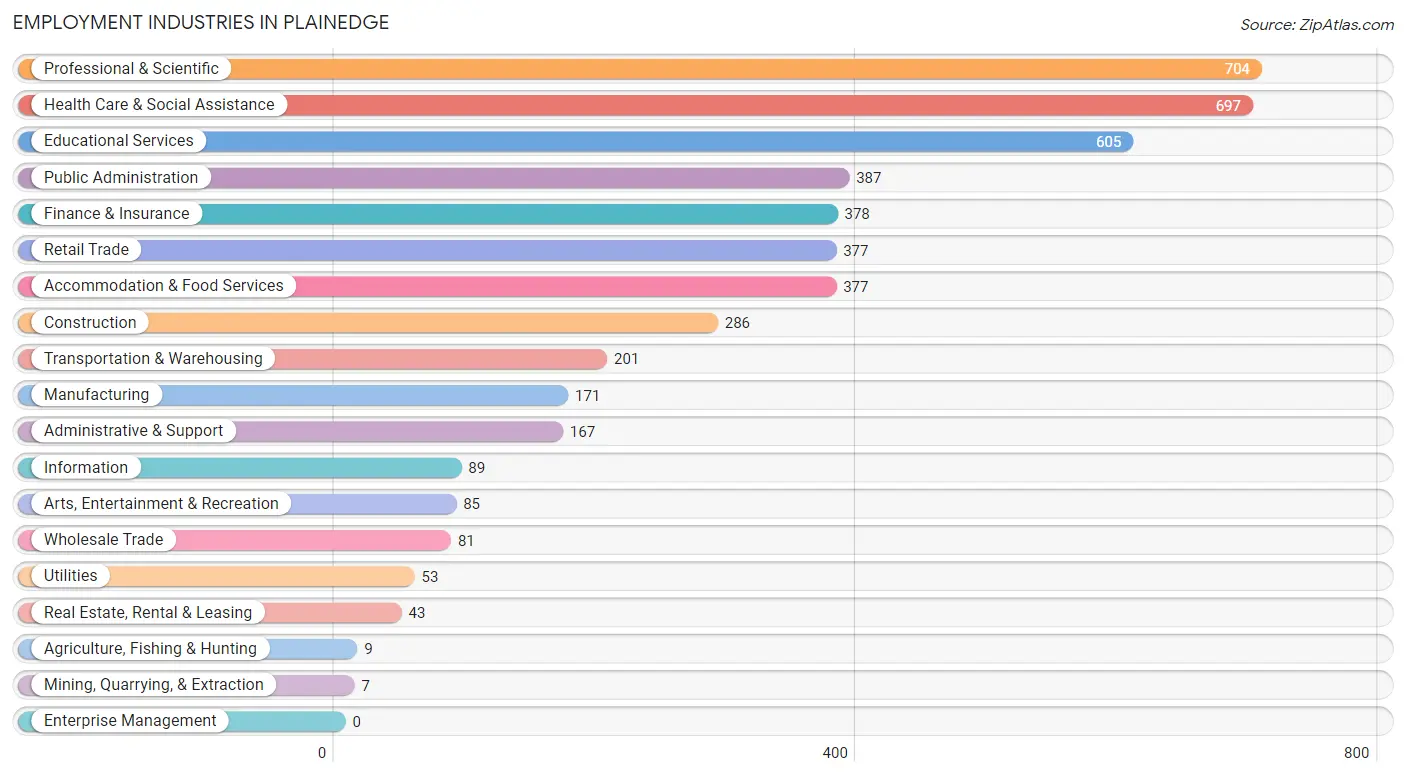
Employment Industries in Plainedge
The major employment industries in Plainedge include Professional & Scientific (704 | 14.6%), Health Care & Social Assistance (697 | 14.5%), Educational Services (605 | 12.6%), Public Administration (387 | 8.0%), and Finance & Insurance (378 | 7.8%).
Employment Industries by Sex in Plainedge
The Plainedge industries that see more men than women are Agriculture, Fishing & Hunting (100.0%), Mining, Quarrying, & Extraction (100.0%), and Construction (93.4%), whereas the industries that tend to have a higher number of women are Health Care & Social Assistance (81.5%), Arts, Entertainment & Recreation (78.8%), and Educational Services (72.4%).
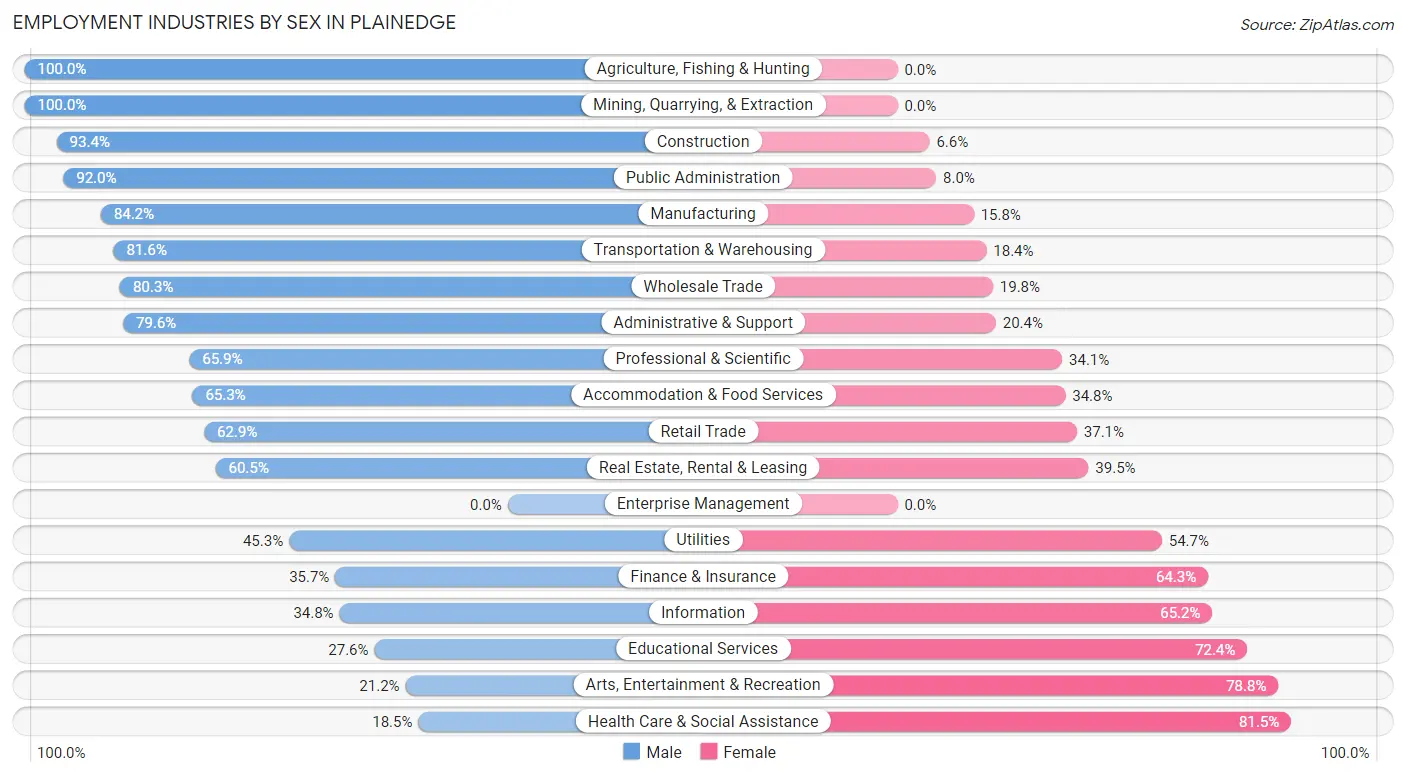
| Industry | Male | Female |
| Agriculture, Fishing & Hunting | 9 (100.0%) | 0 (0.0%) |
| Mining, Quarrying, & Extraction | 7 (100.0%) | 0 (0.0%) |
| Construction | 267 (93.4%) | 19 (6.6%) |
| Manufacturing | 144 (84.2%) | 27 (15.8%) |
| Wholesale Trade | 65 (80.2%) | 16 (19.8%) |
| Retail Trade | 237 (62.9%) | 140 (37.1%) |
| Transportation & Warehousing | 164 (81.6%) | 37 (18.4%) |
| Utilities | 24 (45.3%) | 29 (54.7%) |
| Information | 31 (34.8%) | 58 (65.2%) |
| Finance & Insurance | 135 (35.7%) | 243 (64.3%) |
| Real Estate, Rental & Leasing | 26 (60.5%) | 17 (39.5%) |
| Professional & Scientific | 464 (65.9%) | 240 (34.1%) |
| Enterprise Management | 0 (0.0%) | 0 (0.0%) |
| Administrative & Support | 133 (79.6%) | 34 (20.4%) |
| Educational Services | 167 (27.6%) | 438 (72.4%) |
| Health Care & Social Assistance | 129 (18.5%) | 568 (81.5%) |
| Arts, Entertainment & Recreation | 18 (21.2%) | 67 (78.8%) |
| Accommodation & Food Services | 246 (65.2%) | 131 (34.7%) |
| Public Administration | 356 (92.0%) | 31 (8.0%) |
| Total | 2,660 (55.2%) | 2,160 (44.8%) |
Education in Plainedge
School Enrollment in Plainedge
The most common levels of schooling among the 1,895 students in Plainedge are elementary school (412 | 21.7%), middle school (385 | 20.3%), and high school (364 | 19.2%).
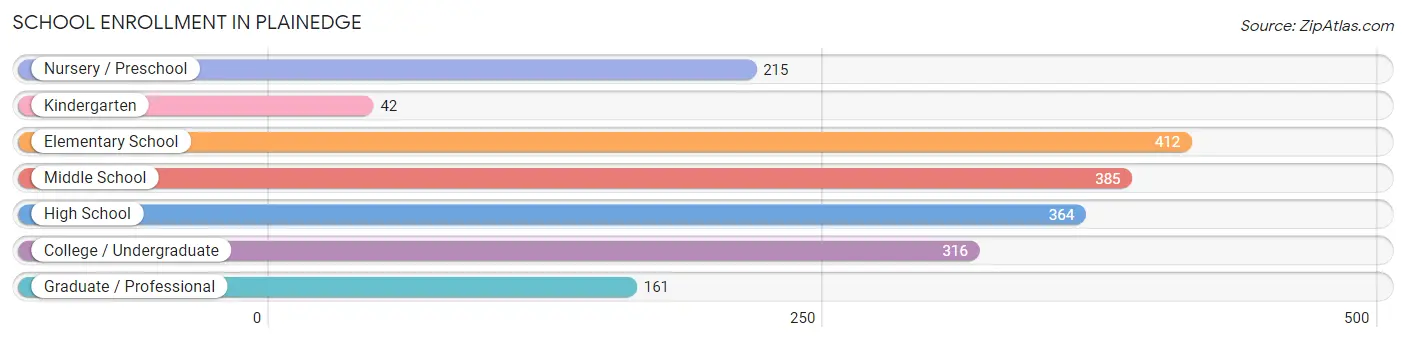
| School Level | # Students | % Students |
| Nursery / Preschool | 215 | 11.4% |
| Kindergarten | 42 | 2.2% |
| Elementary School | 412 | 21.7% |
| Middle School | 385 | 20.3% |
| High School | 364 | 19.2% |
| College / Undergraduate | 316 | 16.7% |
| Graduate / Professional | 161 | 8.5% |
| Total | 1,895 | 100.0% |
School Enrollment by Age by Funding Source in Plainedge
Out of a total of 1,895 students who are enrolled in schools in Plainedge, 394 (20.8%) attend a private institution, while the remaining 1,501 (79.2%) are enrolled in public schools. The age group of 3 to 4 year olds has the highest likelihood of being enrolled in private schools, with 106 (57.6% in the age bracket) enrolled. Conversely, the age group of 15 to 17 year olds has the lowest likelihood of being enrolled in a private school, with 240 (94.5% in the age bracket) attending a public institution.
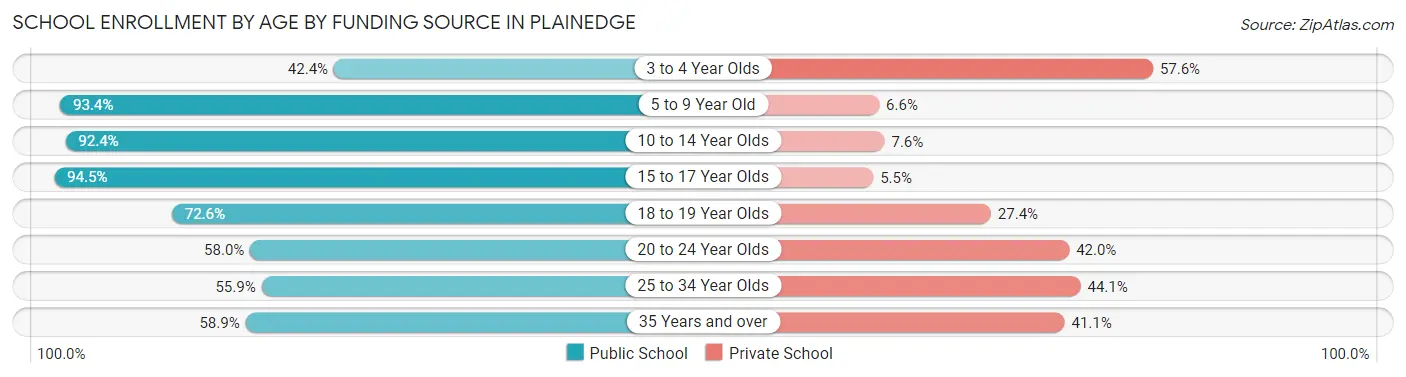
| Age Bracket | Public School | Private School |
| 3 to 4 Year Olds | 78 (42.4%) | 106 (57.6%) |
| 5 to 9 Year Old | 438 (93.4%) | 31 (6.6%) |
| 10 to 14 Year Olds | 413 (92.4%) | 34 (7.6%) |
| 15 to 17 Year Olds | 240 (94.5%) | 14 (5.5%) |
| 18 to 19 Year Olds | 82 (72.6%) | 31 (27.4%) |
| 20 to 24 Year Olds | 127 (58.0%) | 92 (42.0%) |
| 25 to 34 Year Olds | 19 (55.9%) | 15 (44.1%) |
| 35 Years and over | 103 (58.9%) | 72 (41.1%) |
| Total | 1,501 (79.2%) | 394 (20.8%) |
Educational Attainment by Field of Study in Plainedge
Business (756 | 26.7%), arts & humanities (265 | 9.3%), science & technology (253 | 8.9%), computers & mathematics (238 | 8.4%), and education (236 | 8.3%) are the most common fields of study among 2,835 individuals in Plainedge who have obtained a bachelor's degree or higher.
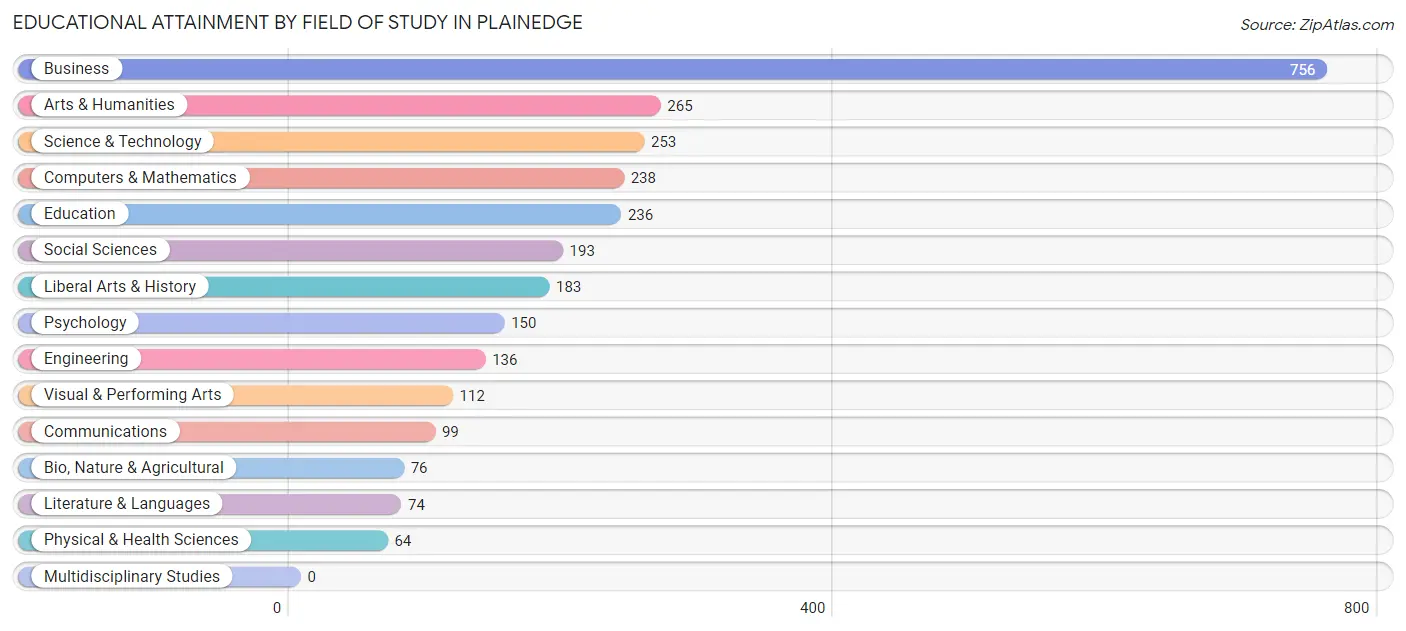
| Field of Study | # Graduates | % Graduates |
| Computers & Mathematics | 238 | 8.4% |
| Bio, Nature & Agricultural | 76 | 2.7% |
| Physical & Health Sciences | 64 | 2.3% |
| Psychology | 150 | 5.3% |
| Social Sciences | 193 | 6.8% |
| Engineering | 136 | 4.8% |
| Multidisciplinary Studies | 0 | 0.0% |
| Science & Technology | 253 | 8.9% |
| Business | 756 | 26.7% |
| Education | 236 | 8.3% |
| Literature & Languages | 74 | 2.6% |
| Liberal Arts & History | 183 | 6.5% |
| Visual & Performing Arts | 112 | 4.0% |
| Communications | 99 | 3.5% |
| Arts & Humanities | 265 | 9.3% |
| Total | 2,835 | 100.0% |
Transportation & Commute in Plainedge
Vehicle Availability by Sex in Plainedge
The most prevalent vehicle ownership categories in Plainedge are males with 2 vehicles (905, accounting for 34.2%) and females with 2 vehicles (784, making up 42.8%).
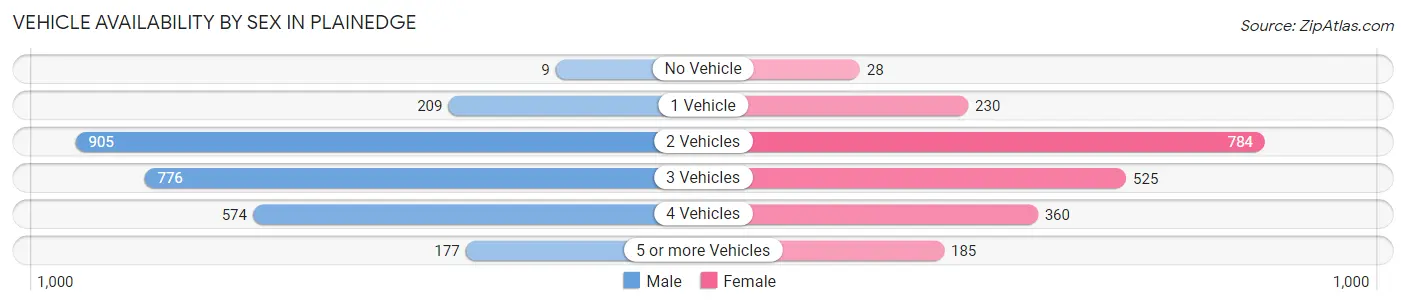
| Vehicles Available | Male | Female |
| No Vehicle | 9 (0.3%) | 28 (1.3%) |
| 1 Vehicle | 209 (7.9%) | 230 (10.9%) |
| 2 Vehicles | 905 (34.2%) | 784 (37.1%) |
| 3 Vehicles | 776 (29.3%) | 525 (24.9%) |
| 4 Vehicles | 574 (21.7%) | 360 (17.1%) |
| 5 or more Vehicles | 177 (6.7%) | 185 (8.8%) |
| Total | 2,650 (100.0%) | 2,112 (100.0%) |
Commute Time in Plainedge
The most frequently occuring commute durations in Plainedge are 15 to 19 minutes (743 commuters, 16.3%), 10 to 14 minutes (606 commuters, 13.3%), and 20 to 24 minutes (533 commuters, 11.7%).
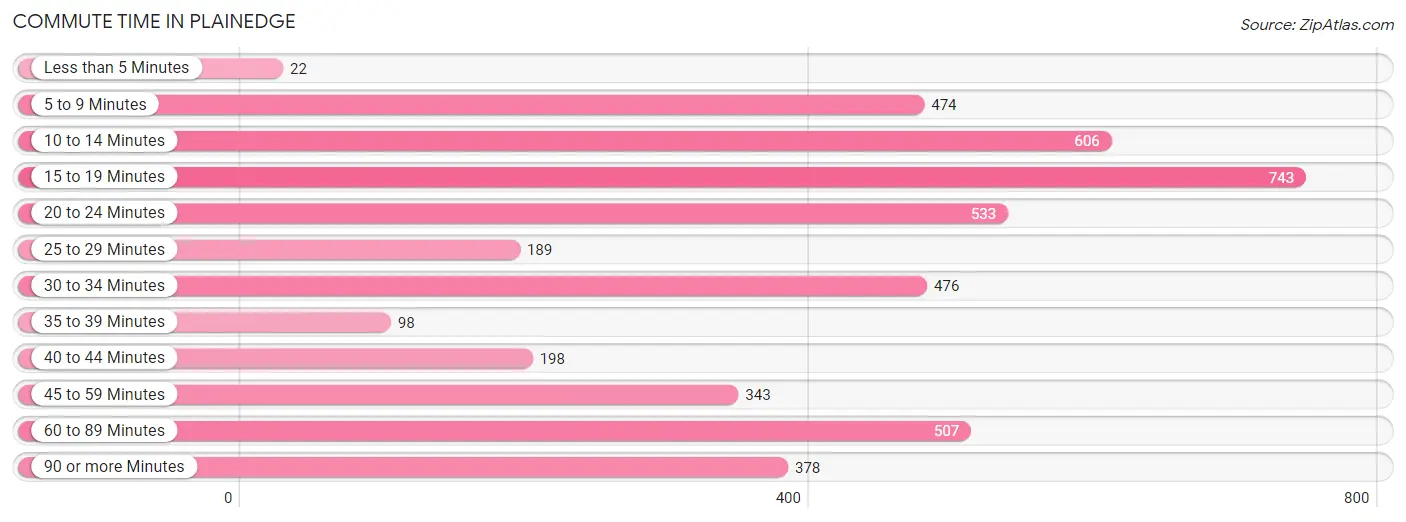
| Commute Time | # Commuters | % Commuters |
| Less than 5 Minutes | 22 | 0.5% |
| 5 to 9 Minutes | 474 | 10.4% |
| 10 to 14 Minutes | 606 | 13.3% |
| 15 to 19 Minutes | 743 | 16.3% |
| 20 to 24 Minutes | 533 | 11.7% |
| 25 to 29 Minutes | 189 | 4.1% |
| 30 to 34 Minutes | 476 | 10.4% |
| 35 to 39 Minutes | 98 | 2.1% |
| 40 to 44 Minutes | 198 | 4.3% |
| 45 to 59 Minutes | 343 | 7.5% |
| 60 to 89 Minutes | 507 | 11.1% |
| 90 or more Minutes | 378 | 8.3% |
Commute Time by Sex in Plainedge
The most common commute times in Plainedge are 60 to 89 minutes (406 commuters, 16.1%) for males and 15 to 19 minutes (411 commuters, 20.1%) for females.
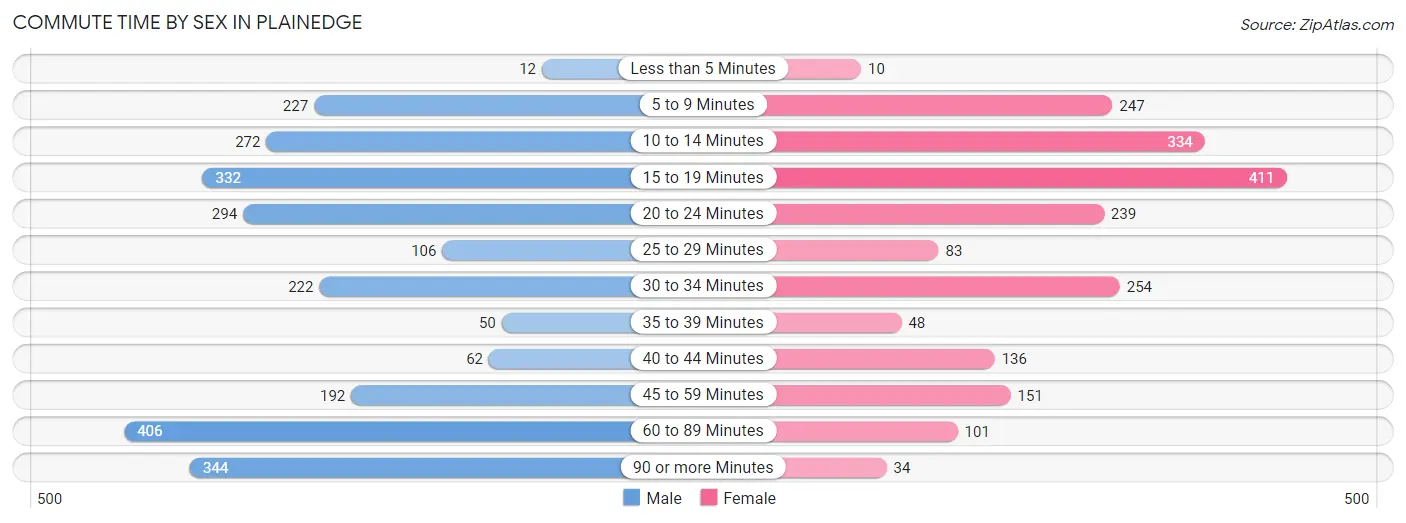
| Commute Time | Male | Female |
| Less than 5 Minutes | 12 (0.5%) | 10 (0.5%) |
| 5 to 9 Minutes | 227 (9.0%) | 247 (12.1%) |
| 10 to 14 Minutes | 272 (10.8%) | 334 (16.3%) |
| 15 to 19 Minutes | 332 (13.2%) | 411 (20.1%) |
| 20 to 24 Minutes | 294 (11.7%) | 239 (11.7%) |
| 25 to 29 Minutes | 106 (4.2%) | 83 (4.1%) |
| 30 to 34 Minutes | 222 (8.8%) | 254 (12.4%) |
| 35 to 39 Minutes | 50 (2.0%) | 48 (2.3%) |
| 40 to 44 Minutes | 62 (2.5%) | 136 (6.6%) |
| 45 to 59 Minutes | 192 (7.6%) | 151 (7.4%) |
| 60 to 89 Minutes | 406 (16.1%) | 101 (4.9%) |
| 90 or more Minutes | 344 (13.7%) | 34 (1.7%) |
Time of Departure to Work by Sex in Plainedge
The most frequent times of departure to work in Plainedge are 7:00 AM to 7:29 AM (449, 17.8%) for males and 8:00 AM to 8:29 AM (396, 19.3%) for females.
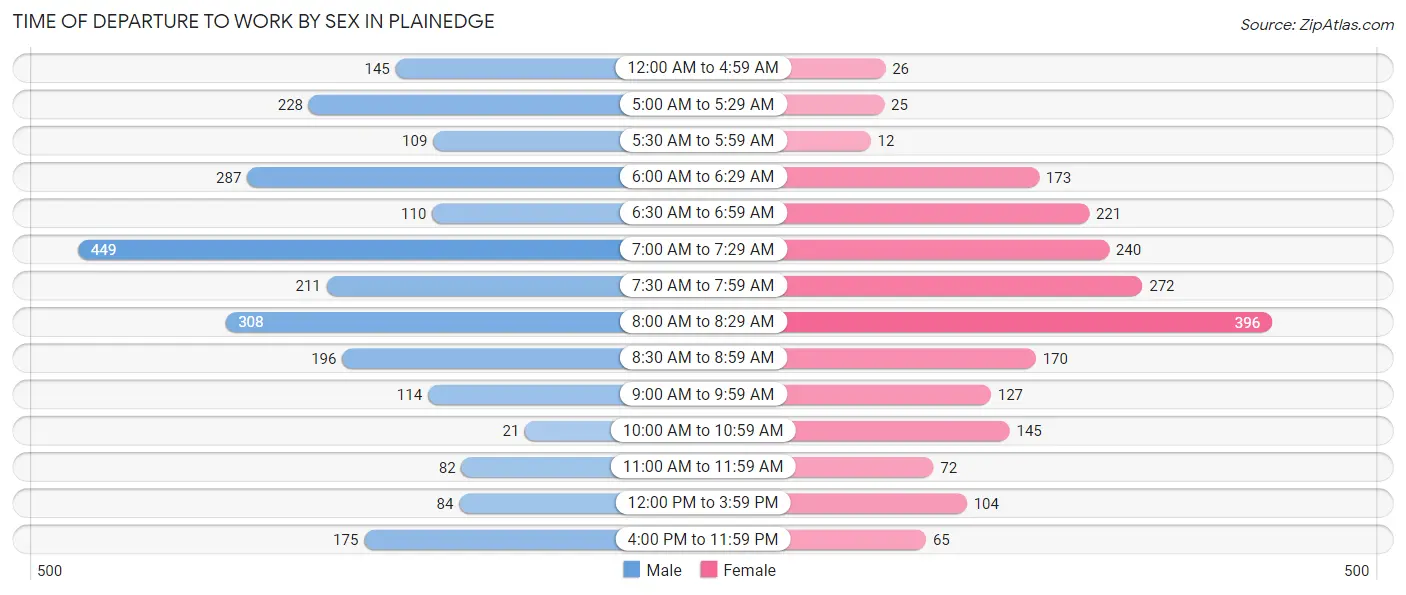
| Time of Departure | Male | Female |
| 12:00 AM to 4:59 AM | 145 (5.8%) | 26 (1.3%) |
| 5:00 AM to 5:29 AM | 228 (9.0%) | 25 (1.2%) |
| 5:30 AM to 5:59 AM | 109 (4.3%) | 12 (0.6%) |
| 6:00 AM to 6:29 AM | 287 (11.4%) | 173 (8.5%) |
| 6:30 AM to 6:59 AM | 110 (4.4%) | 221 (10.8%) |
| 7:00 AM to 7:29 AM | 449 (17.8%) | 240 (11.7%) |
| 7:30 AM to 7:59 AM | 211 (8.4%) | 272 (13.3%) |
| 8:00 AM to 8:29 AM | 308 (12.2%) | 396 (19.3%) |
| 8:30 AM to 8:59 AM | 196 (7.8%) | 170 (8.3%) |
| 9:00 AM to 9:59 AM | 114 (4.5%) | 127 (6.2%) |
| 10:00 AM to 10:59 AM | 21 (0.8%) | 145 (7.1%) |
| 11:00 AM to 11:59 AM | 82 (3.3%) | 72 (3.5%) |
| 12:00 PM to 3:59 PM | 84 (3.3%) | 104 (5.1%) |
| 4:00 PM to 11:59 PM | 175 (7.0%) | 65 (3.2%) |
| Total | 2,519 (100.0%) | 2,048 (100.0%) |
Housing Occupancy in Plainedge
Occupancy by Ownership in Plainedge
Of the total 2,853 dwellings in Plainedge, owner-occupied units account for 2,673 (93.7%), while renter-occupied units make up 180 (6.3%).
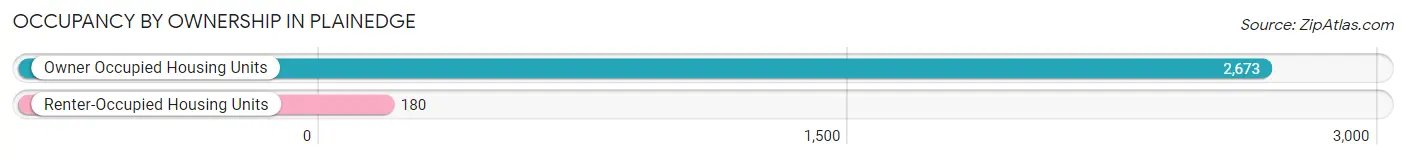
| Occupancy | # Housing Units | % Housing Units |
| Owner Occupied Housing Units | 2,673 | 93.7% |
| Renter-Occupied Housing Units | 180 | 6.3% |
| Total Occupied Housing Units | 2,853 | 100.0% |
Occupancy by Household Size in Plainedge
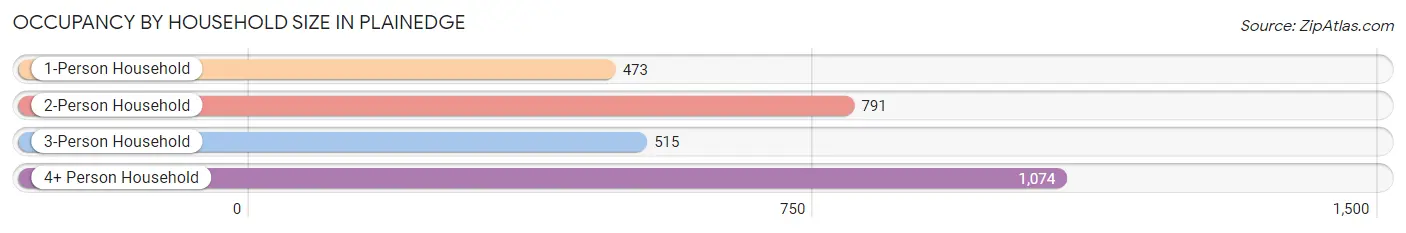
| Household Size | # Housing Units | % Housing Units |
| 1-Person Household | 473 | 16.6% |
| 2-Person Household | 791 | 27.7% |
| 3-Person Household | 515 | 18.0% |
| 4+ Person Household | 1,074 | 37.6% |
| Total Housing Units | 2,853 | 100.0% |
Occupancy by Ownership by Household Size in Plainedge
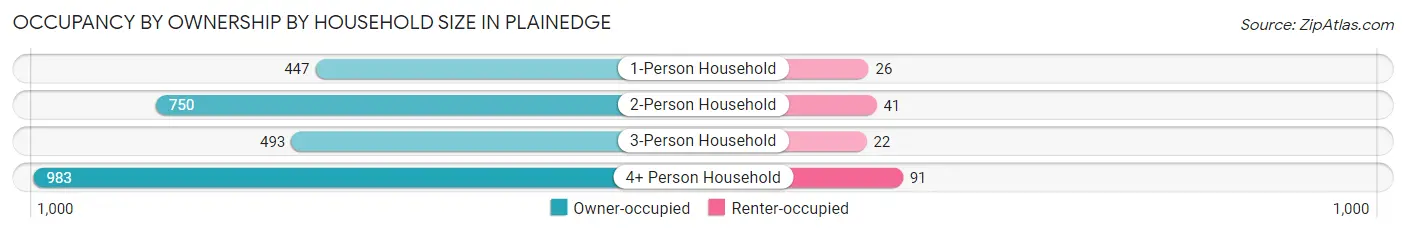
| Household Size | Owner-occupied | Renter-occupied |
| 1-Person Household | 447 (94.5%) | 26 (5.5%) |
| 2-Person Household | 750 (94.8%) | 41 (5.2%) |
| 3-Person Household | 493 (95.7%) | 22 (4.3%) |
| 4+ Person Household | 983 (91.5%) | 91 (8.5%) |
| Total Housing Units | 2,673 (93.7%) | 180 (6.3%) |
Occupancy by Educational Attainment in Plainedge
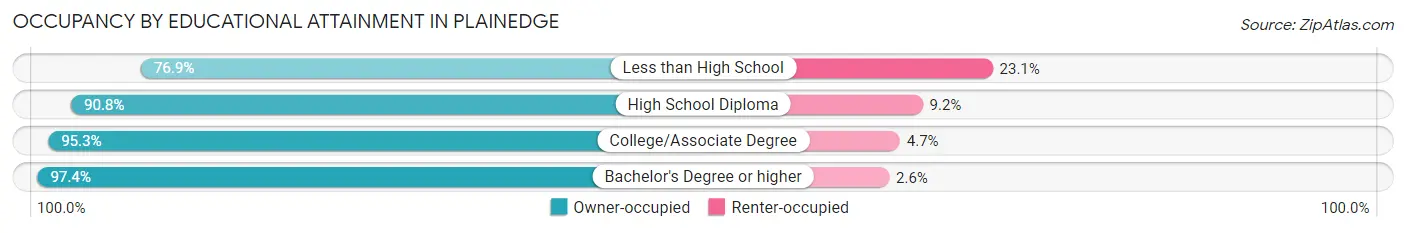
| Household Size | Owner-occupied | Renter-occupied |
| Less than High School | 150 (76.9%) | 45 (23.1%) |
| High School Diploma | 710 (90.8%) | 72 (9.2%) |
| College/Associate Degree | 670 (95.3%) | 33 (4.7%) |
| Bachelor's Degree or higher | 1,143 (97.4%) | 30 (2.6%) |
Occupancy by Age of Householder in Plainedge
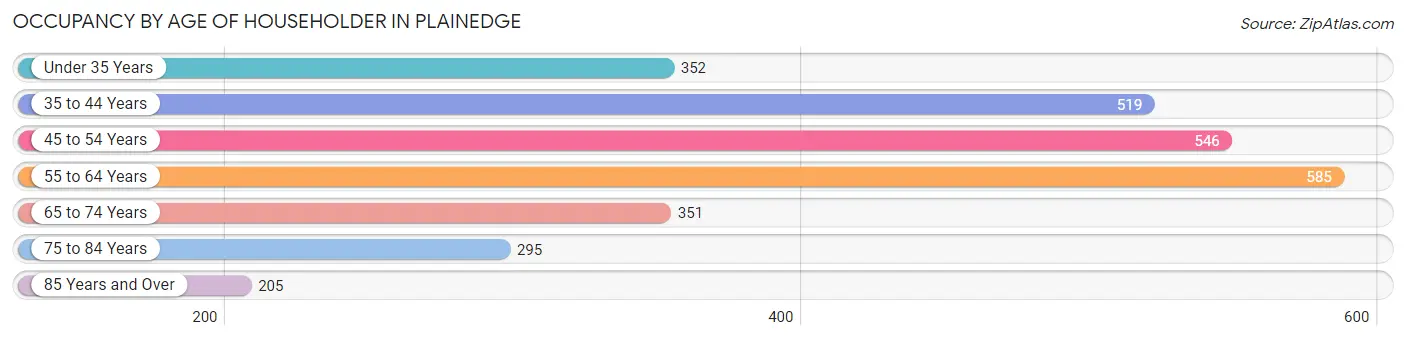
| Age Bracket | # Households | % Households |
| Under 35 Years | 352 | 12.3% |
| 35 to 44 Years | 519 | 18.2% |
| 45 to 54 Years | 546 | 19.1% |
| 55 to 64 Years | 585 | 20.5% |
| 65 to 74 Years | 351 | 12.3% |
| 75 to 84 Years | 295 | 10.3% |
| 85 Years and Over | 205 | 7.2% |
| Total | 2,853 | 100.0% |
Housing Finances in Plainedge
Median Income by Occupancy in Plainedge
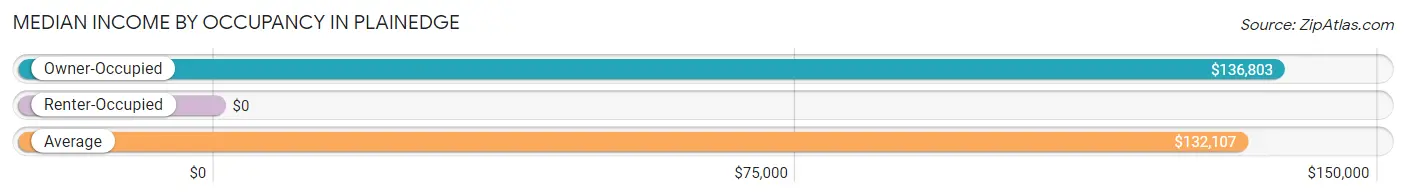
| Occupancy Type | # Households | Median Income |
| Owner-Occupied | 2,673 (93.7%) | $136,803 |
| Renter-Occupied | 180 (6.3%) | $0 |
| Average | 2,853 (100.0%) | $132,107 |
Occupancy by Householder Income Bracket in Plainedge
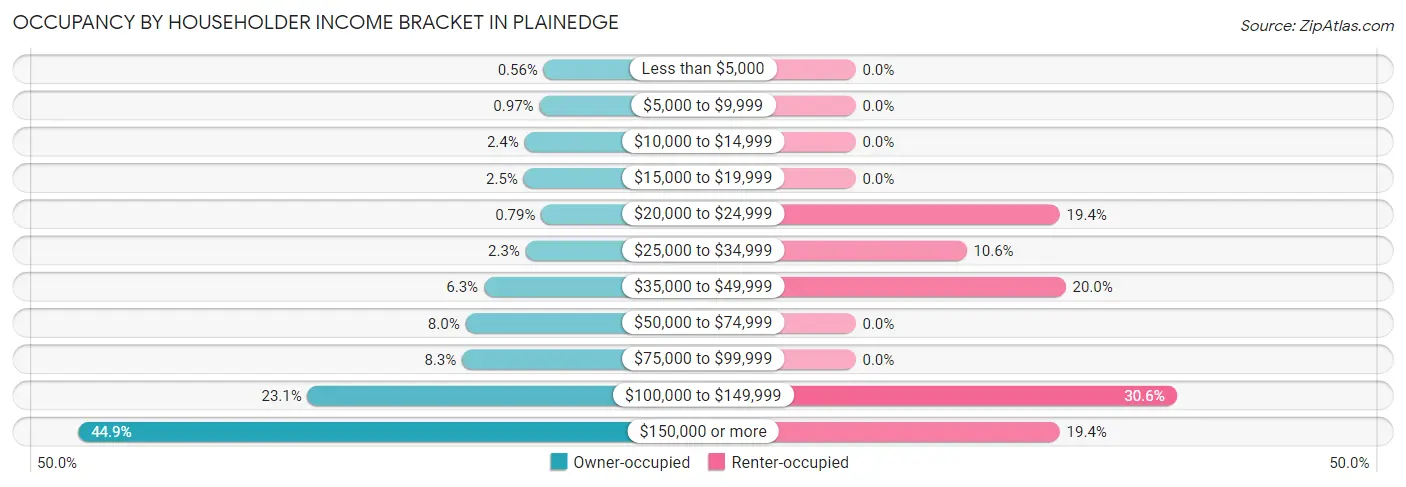
| Income Bracket | Owner-occupied | Renter-occupied |
| Less than $5,000 | 15 (0.6%) | 0 (0.0%) |
| $5,000 to $9,999 | 26 (1.0%) | 0 (0.0%) |
| $10,000 to $14,999 | 64 (2.4%) | 0 (0.0%) |
| $15,000 to $19,999 | 66 (2.5%) | 0 (0.0%) |
| $20,000 to $24,999 | 21 (0.8%) | 35 (19.4%) |
| $25,000 to $34,999 | 61 (2.3%) | 19 (10.6%) |
| $35,000 to $49,999 | 167 (6.2%) | 36 (20.0%) |
| $50,000 to $74,999 | 214 (8.0%) | 0 (0.0%) |
| $75,000 to $99,999 | 223 (8.3%) | 0 (0.0%) |
| $100,000 to $149,999 | 616 (23.1%) | 55 (30.6%) |
| $150,000 or more | 1,200 (44.9%) | 35 (19.4%) |
| Total | 2,673 (100.0%) | 180 (100.0%) |
Monthly Housing Cost Tiers in Plainedge
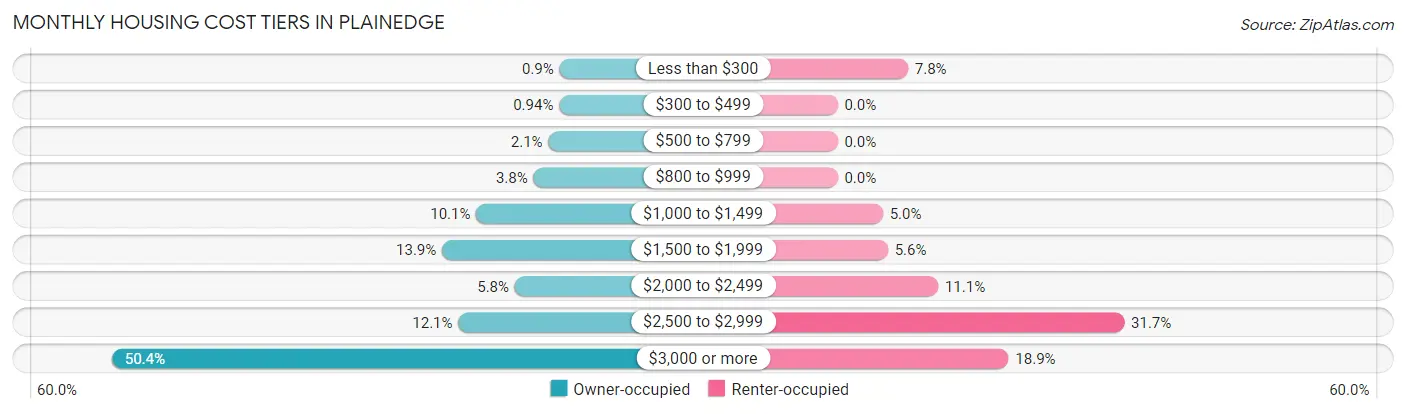
| Monthly Cost | Owner-occupied | Renter-occupied |
| Less than $300 | 24 (0.9%) | 14 (7.8%) |
| $300 to $499 | 25 (0.9%) | 0 (0.0%) |
| $500 to $799 | 57 (2.1%) | 0 (0.0%) |
| $800 to $999 | 101 (3.8%) | 0 (0.0%) |
| $1,000 to $1,499 | 270 (10.1%) | 9 (5.0%) |
| $1,500 to $1,999 | 371 (13.9%) | 10 (5.6%) |
| $2,000 to $2,499 | 156 (5.8%) | 20 (11.1%) |
| $2,500 to $2,999 | 323 (12.1%) | 57 (31.7%) |
| $3,000 or more | 1,346 (50.4%) | 34 (18.9%) |
| Total | 2,673 (100.0%) | 180 (100.0%) |
Physical Housing Characteristics in Plainedge
Housing Structures in Plainedge
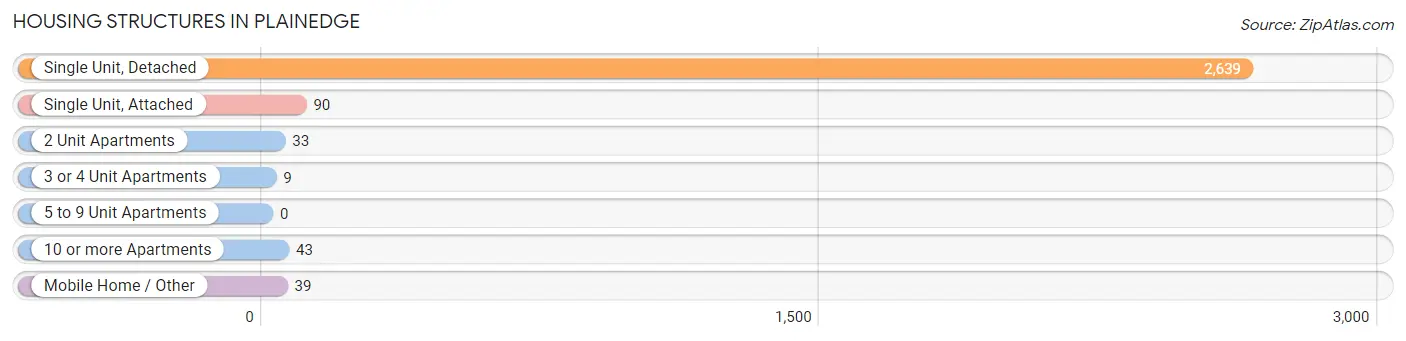
| Structure Type | # Housing Units | % Housing Units |
| Single Unit, Detached | 2,639 | 92.5% |
| Single Unit, Attached | 90 | 3.2% |
| 2 Unit Apartments | 33 | 1.2% |
| 3 or 4 Unit Apartments | 9 | 0.3% |
| 5 to 9 Unit Apartments | 0 | 0.0% |
| 10 or more Apartments | 43 | 1.5% |
| Mobile Home / Other | 39 | 1.4% |
| Total | 2,853 | 100.0% |
Housing Structures by Occupancy in Plainedge
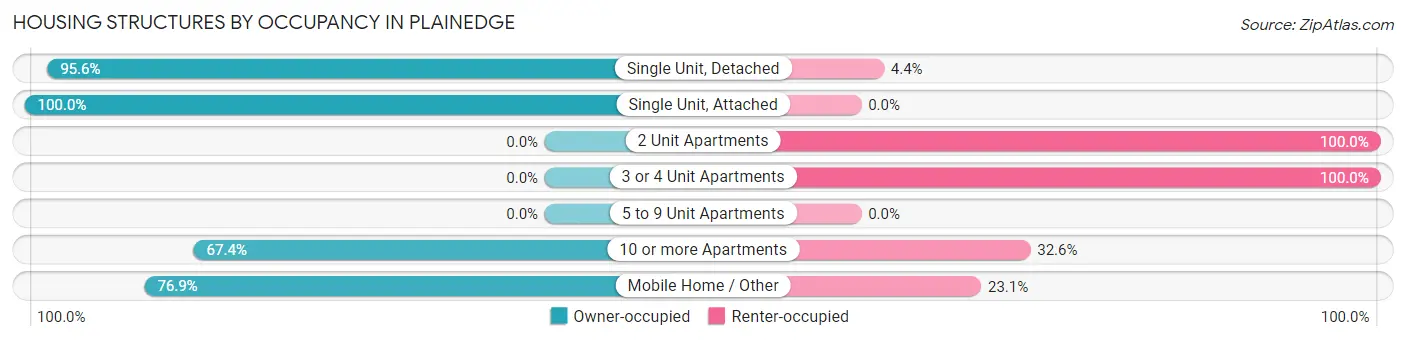
| Structure Type | Owner-occupied | Renter-occupied |
| Single Unit, Detached | 2,524 (95.6%) | 115 (4.4%) |
| Single Unit, Attached | 90 (100.0%) | 0 (0.0%) |
| 2 Unit Apartments | 0 (0.0%) | 33 (100.0%) |
| 3 or 4 Unit Apartments | 0 (0.0%) | 9 (100.0%) |
| 5 to 9 Unit Apartments | 0 (0.0%) | 0 (0.0%) |
| 10 or more Apartments | 29 (67.4%) | 14 (32.6%) |
| Mobile Home / Other | 30 (76.9%) | 9 (23.1%) |
| Total | 2,673 (93.7%) | 180 (6.3%) |
Housing Structures by Number of Rooms in Plainedge
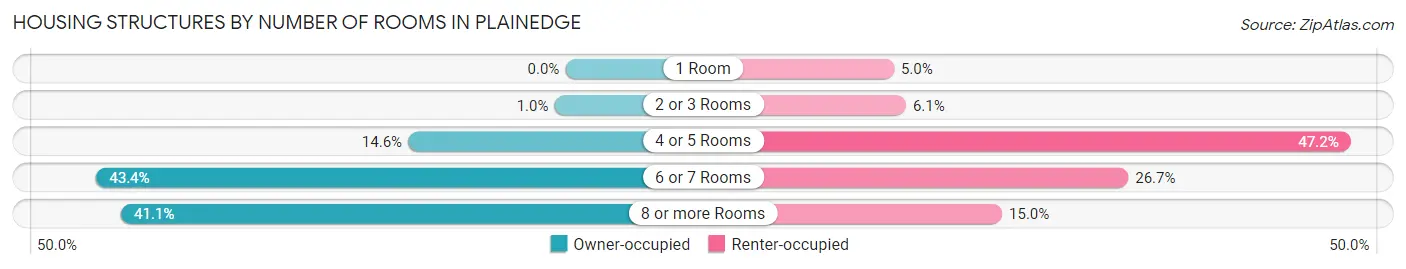
| Number of Rooms | Owner-occupied | Renter-occupied |
| 1 Room | 0 (0.0%) | 9 (5.0%) |
| 2 or 3 Rooms | 27 (1.0%) | 11 (6.1%) |
| 4 or 5 Rooms | 389 (14.5%) | 85 (47.2%) |
| 6 or 7 Rooms | 1,159 (43.4%) | 48 (26.7%) |
| 8 or more Rooms | 1,098 (41.1%) | 27 (15.0%) |
| Total | 2,673 (100.0%) | 180 (100.0%) |
Housing Structure by Heating Type in Plainedge
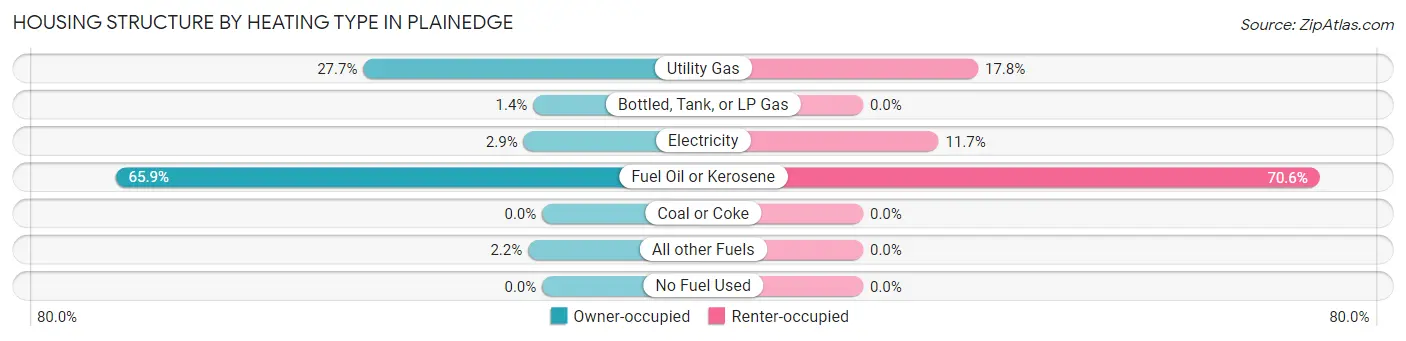
| Heating Type | Owner-occupied | Renter-occupied |
| Utility Gas | 739 (27.7%) | 32 (17.8%) |
| Bottled, Tank, or LP Gas | 37 (1.4%) | 0 (0.0%) |
| Electricity | 77 (2.9%) | 21 (11.7%) |
| Fuel Oil or Kerosene | 1,762 (65.9%) | 127 (70.6%) |
| Coal or Coke | 0 (0.0%) | 0 (0.0%) |
| All other Fuels | 58 (2.2%) | 0 (0.0%) |
| No Fuel Used | 0 (0.0%) | 0 (0.0%) |
| Total | 2,673 (100.0%) | 180 (100.0%) |
Household Vehicle Usage in Plainedge
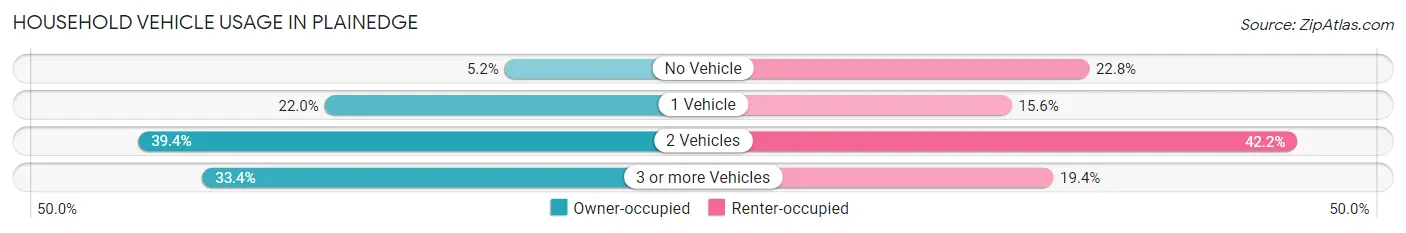
| Vehicles per Household | Owner-occupied | Renter-occupied |
| No Vehicle | 139 (5.2%) | 41 (22.8%) |
| 1 Vehicle | 588 (22.0%) | 28 (15.6%) |
| 2 Vehicles | 1,053 (39.4%) | 76 (42.2%) |
| 3 or more Vehicles | 893 (33.4%) | 35 (19.4%) |
| Total | 2,673 (100.0%) | 180 (100.0%) |
Real Estate & Mortgages in Plainedge
Real Estate and Mortgage Overview in Plainedge
| Characteristic | Without Mortgage | With Mortgage |
| Housing Units | 807 | 1,866 |
| Median Property Value | $505,800 | $580,500 |
| Median Household Income | $68,750 | $1,045 |
| Monthly Housing Costs | $1,472 | $1,346 |
| Real Estate Taxes | $10,001 | $0 |
Property Value by Mortgage Status in Plainedge
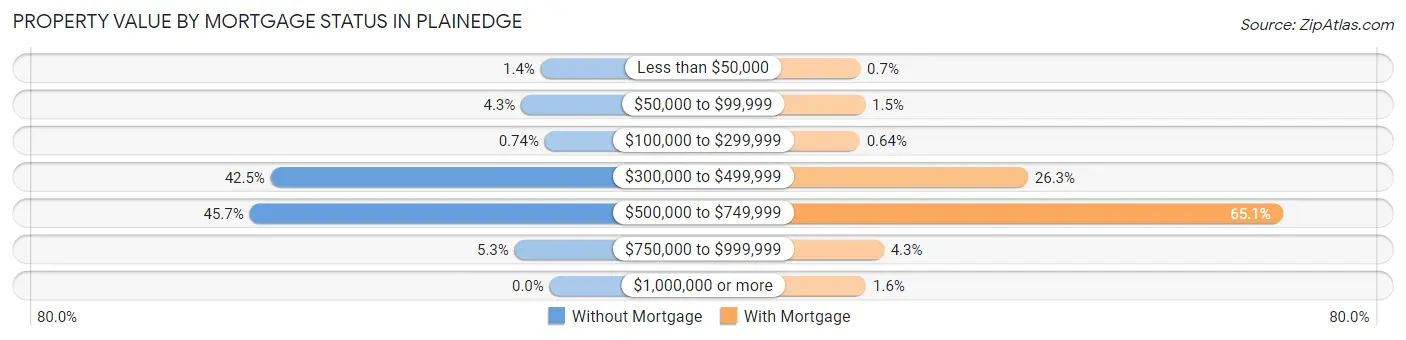
| Property Value | Without Mortgage | With Mortgage |
| Less than $50,000 | 11 (1.4%) | 13 (0.7%) |
| $50,000 to $99,999 | 35 (4.3%) | 27 (1.5%) |
| $100,000 to $299,999 | 6 (0.7%) | 12 (0.6%) |
| $300,000 to $499,999 | 343 (42.5%) | 490 (26.3%) |
| $500,000 to $749,999 | 369 (45.7%) | 1,214 (65.1%) |
| $750,000 to $999,999 | 43 (5.3%) | 80 (4.3%) |
| $1,000,000 or more | 0 (0.0%) | 30 (1.6%) |
| Total | 807 (100.0%) | 1,866 (100.0%) |
Household Income by Mortgage Status in Plainedge
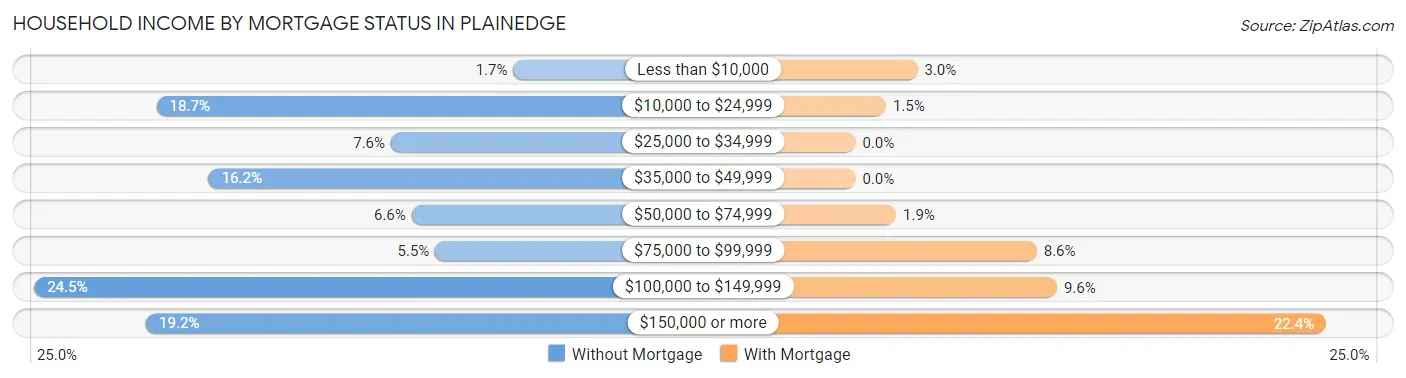
| Household Income | Without Mortgage | With Mortgage |
| Less than $10,000 | 14 (1.7%) | 55 (2.9%) |
| $10,000 to $24,999 | 151 (18.7%) | 27 (1.5%) |
| $25,000 to $34,999 | 61 (7.6%) | 0 (0.0%) |
| $35,000 to $49,999 | 131 (16.2%) | 0 (0.0%) |
| $50,000 to $74,999 | 53 (6.6%) | 36 (1.9%) |
| $75,000 to $99,999 | 44 (5.4%) | 161 (8.6%) |
| $100,000 to $149,999 | 198 (24.5%) | 179 (9.6%) |
| $150,000 or more | 155 (19.2%) | 418 (22.4%) |
| Total | 807 (100.0%) | 1,866 (100.0%) |
Property Value to Household Income Ratio in Plainedge
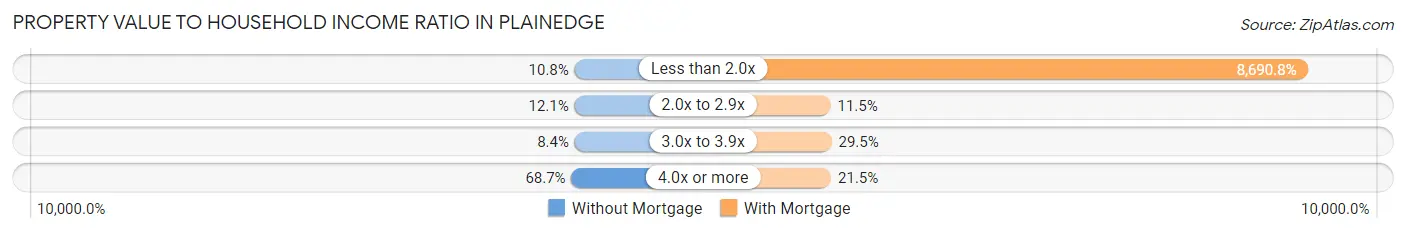
| Value-to-Income Ratio | Without Mortgage | With Mortgage |
| Less than 2.0x | 87 (10.8%) | 162,171 (8,690.8%) |
| 2.0x to 2.9x | 98 (12.1%) | 215 (11.5%) |
| 3.0x to 3.9x | 68 (8.4%) | 550 (29.5%) |
| 4.0x or more | 554 (68.6%) | 401 (21.5%) |
| Total | 807 (100.0%) | 1,866 (100.0%) |
Real Estate Taxes by Mortgage Status in Plainedge
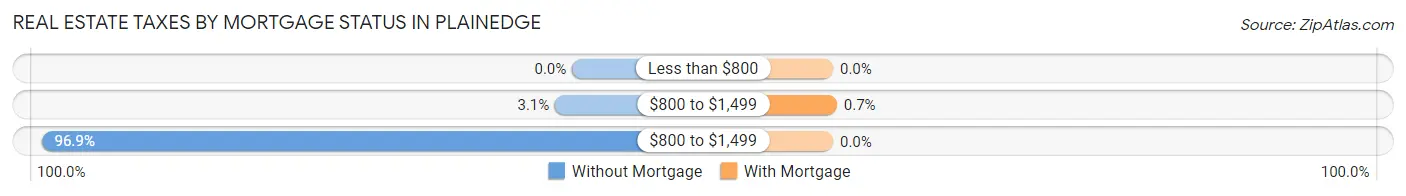
| Property Taxes | Without Mortgage | With Mortgage |
| Less than $800 | 0 (0.0%) | 0 (0.0%) |
| $800 to $1,499 | 25 (3.1%) | 13 (0.7%) |
| $800 to $1,499 | 782 (96.9%) | 0 (0.0%) |
| Total | 807 (100.0%) | 1,866 (100.0%) |
Health & Disability in Plainedge
Health Insurance Coverage by Age in Plainedge
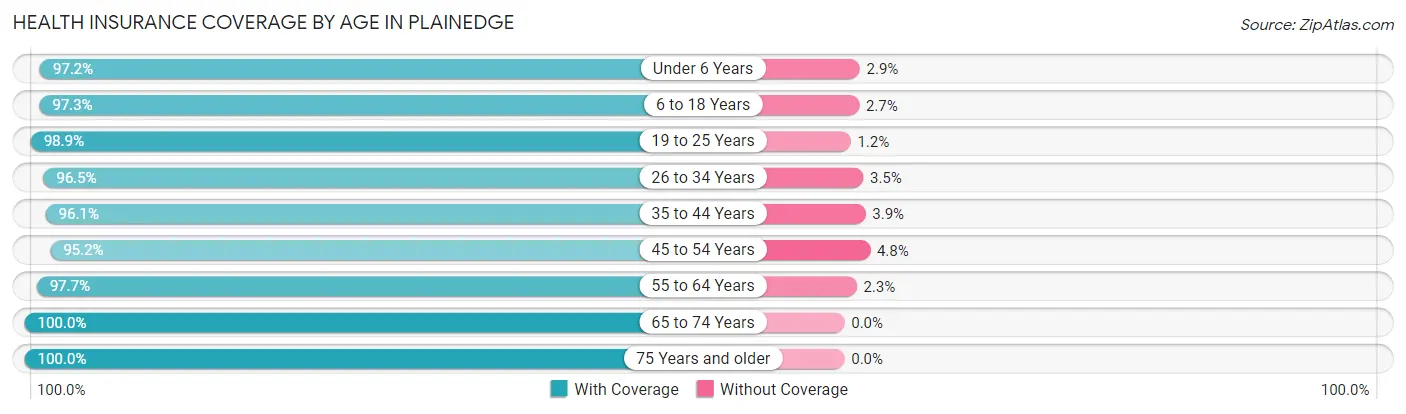
| Age Bracket | With Coverage | Without Coverage |
| Under 6 Years | 818 (97.2%) | 24 (2.9%) |
| 6 to 18 Years | 1,209 (97.3%) | 34 (2.7%) |
| 19 to 25 Years | 687 (98.9%) | 8 (1.1%) |
| 26 to 34 Years | 1,218 (96.5%) | 44 (3.5%) |
| 35 to 44 Years | 1,006 (96.1%) | 41 (3.9%) |
| 45 to 54 Years | 1,276 (95.2%) | 64 (4.8%) |
| 55 to 64 Years | 1,033 (97.7%) | 24 (2.3%) |
| 65 to 74 Years | 711 (100.0%) | 0 (0.0%) |
| 75 Years and older | 766 (100.0%) | 0 (0.0%) |
| Total | 8,724 (97.3%) | 239 (2.7%) |
Health Insurance Coverage by Citizenship Status in Plainedge
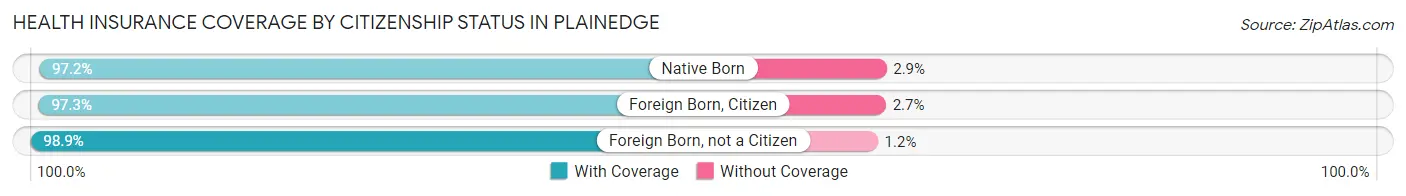
| Citizenship Status | With Coverage | Without Coverage |
| Native Born | 818 (97.2%) | 24 (2.9%) |
| Foreign Born, Citizen | 1,209 (97.3%) | 34 (2.7%) |
| Foreign Born, not a Citizen | 687 (98.9%) | 8 (1.1%) |
Health Insurance Coverage by Household Income in Plainedge
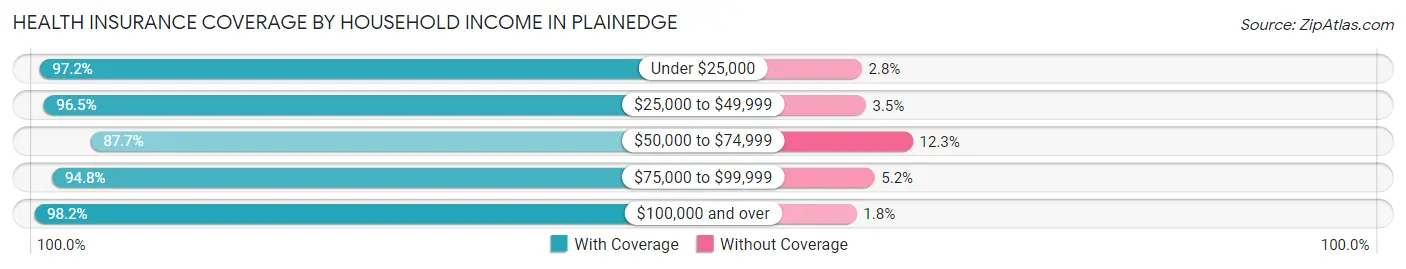
| Household Income | With Coverage | Without Coverage |
| Under $25,000 | 419 (97.2%) | 12 (2.8%) |
| $25,000 to $49,999 | 412 (96.5%) | 15 (3.5%) |
| $50,000 to $74,999 | 406 (87.7%) | 57 (12.3%) |
| $75,000 to $99,999 | 605 (94.8%) | 33 (5.2%) |
| $100,000 and over | 6,671 (98.2%) | 122 (1.8%) |
Public vs Private Health Insurance Coverage by Age in Plainedge
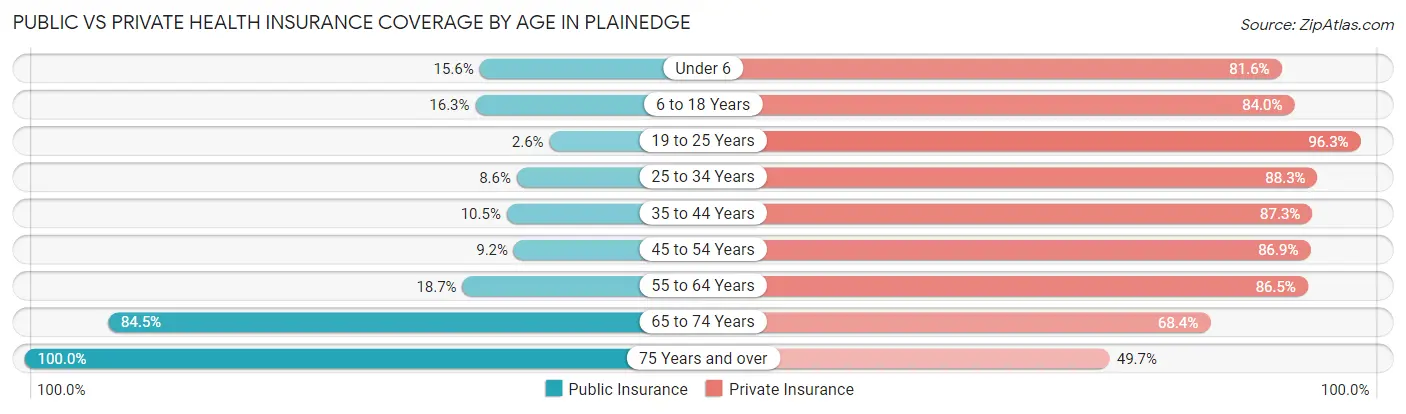
| Age Bracket | Public Insurance | Private Insurance |
| Under 6 | 131 (15.6%) | 687 (81.6%) |
| 6 to 18 Years | 203 (16.3%) | 1,044 (84.0%) |
| 19 to 25 Years | 18 (2.6%) | 669 (96.3%) |
| 25 to 34 Years | 109 (8.6%) | 1,114 (88.3%) |
| 35 to 44 Years | 110 (10.5%) | 914 (87.3%) |
| 45 to 54 Years | 123 (9.2%) | 1,165 (86.9%) |
| 55 to 64 Years | 198 (18.7%) | 914 (86.5%) |
| 65 to 74 Years | 601 (84.5%) | 486 (68.3%) |
| 75 Years and over | 766 (100.0%) | 381 (49.7%) |
| Total | 2,259 (25.2%) | 7,374 (82.3%) |
Disability Status by Sex by Age in Plainedge
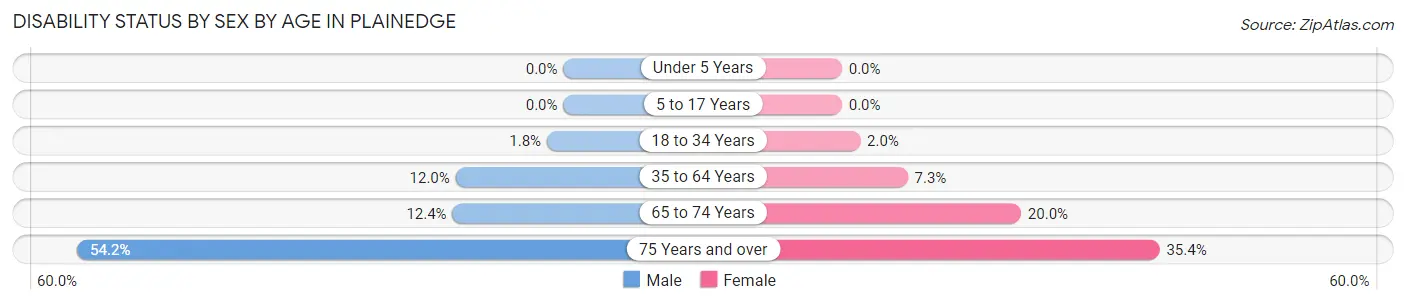
| Age Bracket | Male | Female |
| Under 5 Years | 0 (0.0%) | 0 (0.0%) |
| 5 to 17 Years | 0 (0.0%) | 0 (0.0%) |
| 18 to 34 Years | 21 (1.8%) | 18 (2.0%) |
| 35 to 64 Years | 212 (12.0%) | 123 (7.3%) |
| 65 to 74 Years | 42 (12.3%) | 74 (20.0%) |
| 75 Years and over | 150 (54.1%) | 173 (35.4%) |
Disability Class by Sex by Age in Plainedge
Disability Class: Hearing Difficulty
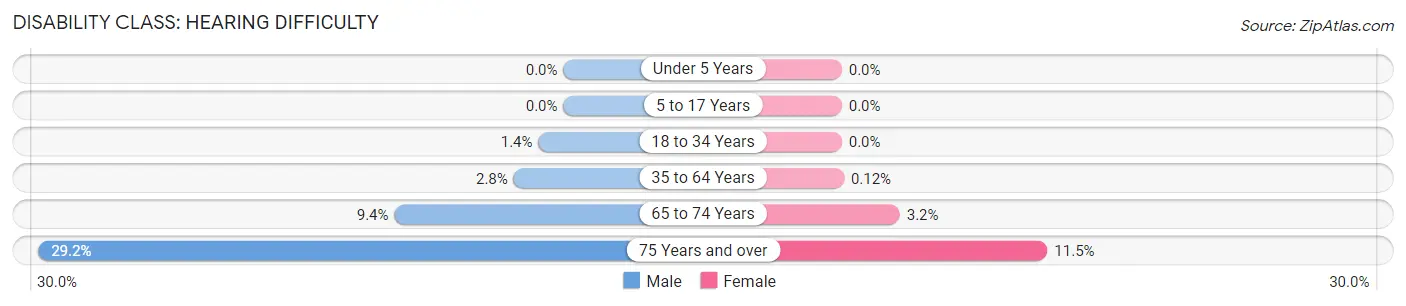
| Age Bracket | Male | Female |
| Under 5 Years | 0 (0.0%) | 0 (0.0%) |
| 5 to 17 Years | 0 (0.0%) | 0 (0.0%) |
| 18 to 34 Years | 16 (1.4%) | 0 (0.0%) |
| 35 to 64 Years | 49 (2.8%) | 2 (0.1%) |
| 65 to 74 Years | 32 (9.4%) | 12 (3.2%) |
| 75 Years and over | 81 (29.2%) | 56 (11.5%) |
Disability Class: Vision Difficulty
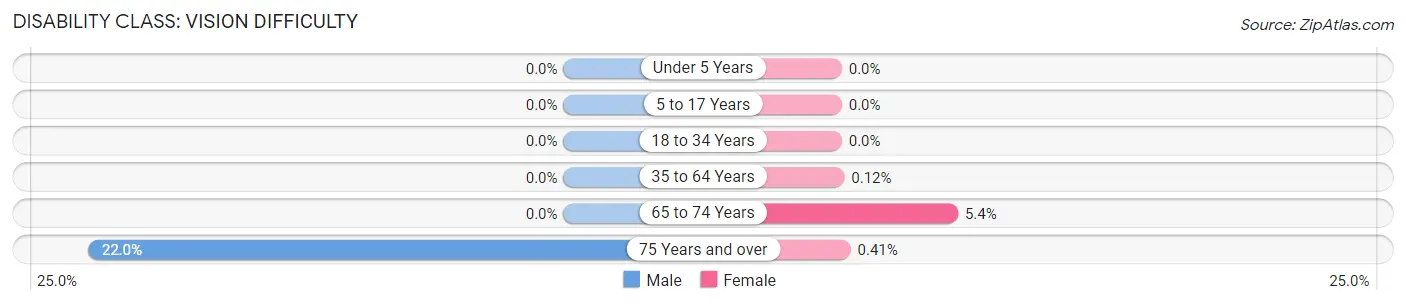
| Age Bracket | Male | Female |
| Under 5 Years | 0 (0.0%) | 0 (0.0%) |
| 5 to 17 Years | 0 (0.0%) | 0 (0.0%) |
| 18 to 34 Years | 0 (0.0%) | 0 (0.0%) |
| 35 to 64 Years | 0 (0.0%) | 2 (0.1%) |
| 65 to 74 Years | 0 (0.0%) | 20 (5.4%) |
| 75 Years and over | 61 (22.0%) | 2 (0.4%) |
Disability Class: Cognitive Difficulty
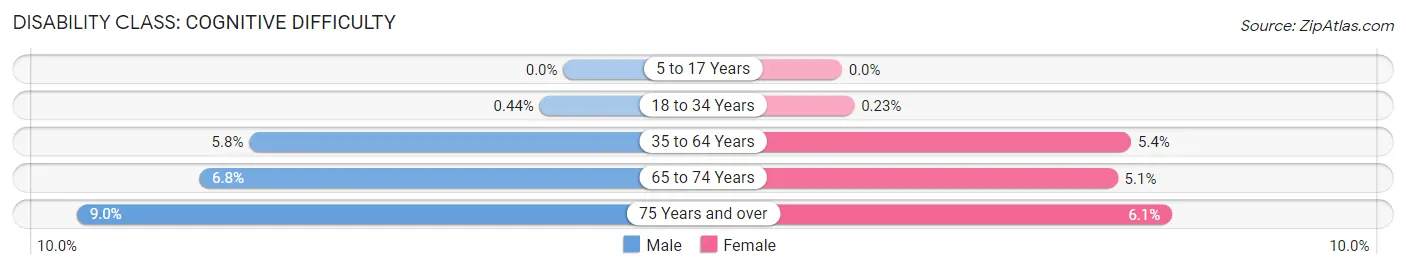
| Age Bracket | Male | Female |
| 5 to 17 Years | 0 (0.0%) | 0 (0.0%) |
| 18 to 34 Years | 5 (0.4%) | 2 (0.2%) |
| 35 to 64 Years | 103 (5.8%) | 90 (5.4%) |
| 65 to 74 Years | 23 (6.8%) | 19 (5.1%) |
| 75 Years and over | 25 (9.0%) | 30 (6.1%) |
Disability Class: Ambulatory Difficulty
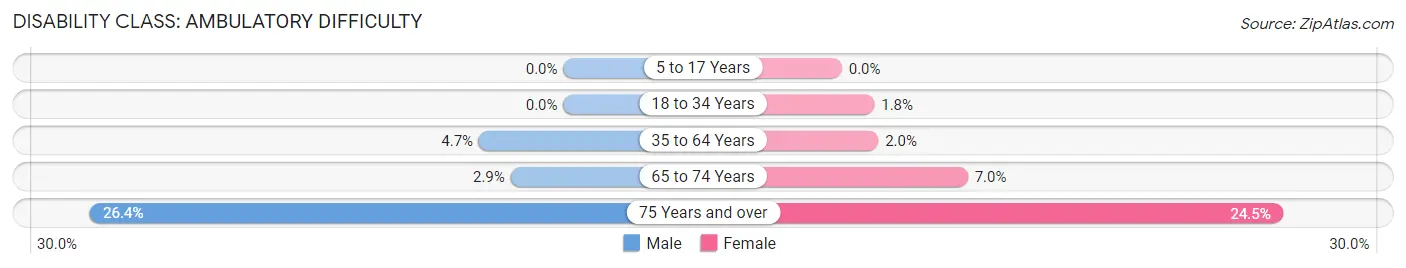
| Age Bracket | Male | Female |
| 5 to 17 Years | 0 (0.0%) | 0 (0.0%) |
| 18 to 34 Years | 0 (0.0%) | 16 (1.8%) |
| 35 to 64 Years | 83 (4.7%) | 34 (2.0%) |
| 65 to 74 Years | 10 (2.9%) | 26 (7.0%) |
| 75 Years and over | 73 (26.4%) | 120 (24.5%) |
Disability Class: Self-Care Difficulty
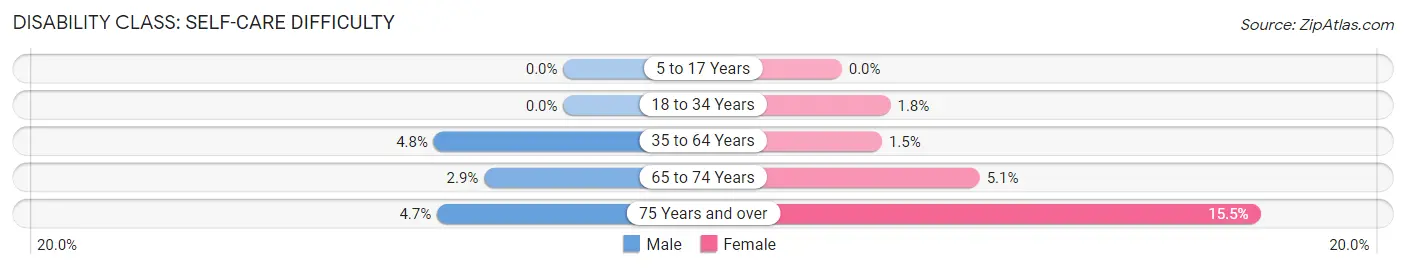
| Age Bracket | Male | Female |
| 5 to 17 Years | 0 (0.0%) | 0 (0.0%) |
| 18 to 34 Years | 0 (0.0%) | 16 (1.8%) |
| 35 to 64 Years | 85 (4.8%) | 25 (1.5%) |
| 65 to 74 Years | 10 (2.9%) | 19 (5.1%) |
| 75 Years and over | 13 (4.7%) | 76 (15.5%) |
Technology Access in Plainedge
Computing Device Access in Plainedge
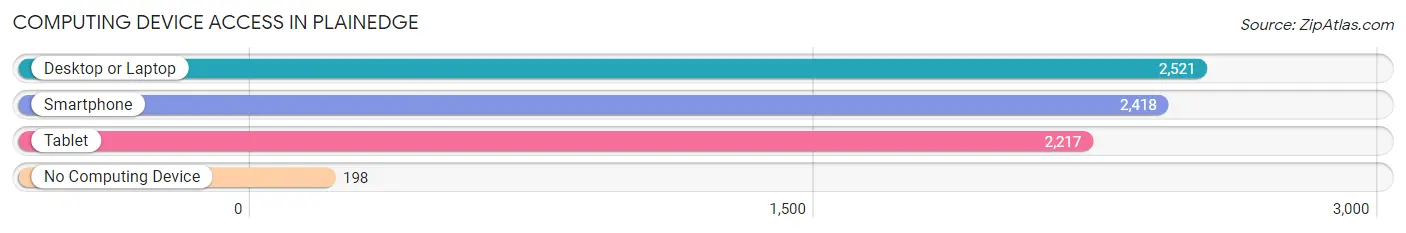
| Device Type | # Households | % Households |
| Desktop or Laptop | 2,521 | 88.4% |
| Smartphone | 2,418 | 84.8% |
| Tablet | 2,217 | 77.7% |
| No Computing Device | 198 | 6.9% |
| Total | 2,853 | 100.0% |
Internet Access in Plainedge
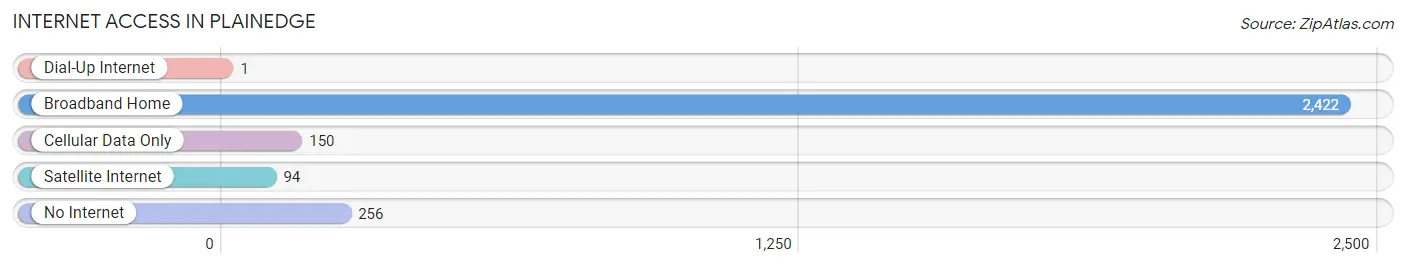
| Internet Type | # Households | % Households |
| Dial-Up Internet | 1 | 0.0% |
| Broadband Home | 2,422 | 84.9% |
| Cellular Data Only | 150 | 5.3% |
| Satellite Internet | 94 | 3.3% |
| No Internet | 256 | 9.0% |
| Total | 2,853 | 100.0% |
Plainedge Summary
Plainedge is a hamlet located in the Town of Oyster Bay in Nassau County, New York. It is located on the South Shore of Long Island, approximately 25 miles east of Manhattan. The hamlet is bordered by the hamlets of Bethpage, Levittown, and Massapequa. Plainedge is home to approximately 10,000 residents.
History
Plainedge was originally inhabited by the Matinecock Native American tribe. The first European settlers arrived in the area in the late 1600s. The hamlet was originally known as “Plainfield” and was part of the Town of Hempstead. In 1837, the hamlet was renamed “Plainedge” and became part of the Town of Oyster Bay.
In the late 1800s, Plainedge began to develop as a farming community. The hamlet was home to several farms, including the Plainedge Dairy Farm, which was established in 1891. The dairy farm was one of the largest in the area and supplied milk to many of the local residents.
In the early 1900s, Plainedge began to develop into a residential community. The hamlet was home to several large estates, including the Plainedge Estate, which was built in 1910. The estate was owned by the prominent Smith family and was the largest estate in the area.
In the 1950s, Plainedge began to experience rapid growth as the population of Long Island increased. The hamlet was home to several new housing developments, including the Plainedge Estates, which was built in 1954. The development was one of the first planned communities in the area and was home to over 1,000 homes.
Geography
Plainedge is located on the South Shore of Long Island, approximately 25 miles east of Manhattan. The hamlet is bordered by the hamlets of Bethpage, Levittown, and Massapequa. The hamlet is located in the Town of Oyster Bay and is part of Nassau County.
The hamlet is located on the Hempstead Plain, which is a flat, low-lying area of land. The area is characterized by sandy soil and is home to several wetlands and ponds. The hamlet is located near several bodies of water, including the South Oyster Bay, the Massapequa Reservoir, and the Bethpage State Park.
Economy
Plainedge is primarily a residential community, but it is also home to several businesses. The hamlet is home to several retail stores, restaurants, and other businesses. The hamlet is also home to several industrial parks, which are home to a variety of businesses, including manufacturing, warehousing, and distribution.
The hamlet is also home to several educational institutions, including Plainedge High School, Plainedge Middle School, and Plainedge Elementary School. The hamlet is also home to several churches and other religious institutions.
Demographics
As of the 2010 census, Plainedge had a population of 10,000. The population is primarily white (90.3%) and the median household income is $90,000. The hamlet is home to a diverse population, with a large Hispanic population (14.3%) and a small Asian population (2.3%).
Conclusion
Plainedge is a hamlet located in the Town of Oyster Bay in Nassau County, New York. It is located on the South Shore of Long Island, approximately 25 miles east of Manhattan. The hamlet is bordered by the hamlets of Bethpage, Levittown, and Massapequa. Plainedge is home to approximately 10,000 residents and is primarily a residential community. The hamlet is home to several businesses, educational institutions, and churches. The population is primarily white (90.3%) and the median household income is $90,000.
Common Questions
What is Per Capita Income in Plainedge?
Per Capita income in Plainedge is $50,954.
What is the Median Family Income in Plainedge?
Median Family Income in Plainedge is $148,750.
What is the Median Household income in Plainedge?
Median Household Income in Plainedge is $132,107.
What is Income or Wage Gap in Plainedge?
Income or Wage Gap in Plainedge is 37.6%.
Women in Plainedge earn 62.4 cents for every dollar earned by a man.
What is Inequality or Gini Index in Plainedge?
Inequality or Gini Index in Plainedge is 0.38.
What is the Total Population of Plainedge?
Total Population of Plainedge is 8,963.
What is the Total Male Population of Plainedge?
Total Male Population of Plainedge is 4,486.
What is the Total Female Population of Plainedge?
Total Female Population of Plainedge is 4,477.
What is the Ratio of Males per 100 Females in Plainedge?
There are 100.20 Males per 100 Females in Plainedge.
What is the Ratio of Females per 100 Males in Plainedge?
There are 99.80 Females per 100 Males in Plainedge.
What is the Median Population Age in Plainedge?
Median Population Age in Plainedge is 40.1 Years.
What is the Average Family Size in Plainedge
Average Family Size in Plainedge is 3.5 People.
What is the Average Household Size in Plainedge
Average Household Size in Plainedge is 3.1 People.
How Large is the Labor Force in Plainedge?
There are 4,948 People in the Labor Forcein in Plainedge.
What is the Percentage of People in the Labor Force in Plainedge?
69.3% of People are in the Labor Force in Plainedge.
What is the Unemployment Rate in Plainedge?
Unemployment Rate in Plainedge is 2.6%.