Rotterdam, NY Map & Demographics
Rotterdam Map
Rotterdam Overview
$37,951
PER CAPITA INCOME
$97,828
AVG FAMILY INCOME
$79,415
AVG HOUSEHOLD INCOME
24.8%
WAGE / INCOME GAP [ % ]
75.2¢/ $1
WAGE / INCOME GAP [ $ ]
$16,125
FAMILY INCOME DEFICIT
0.35
INEQUALITY / GINI INDEX
22,673
TOTAL POPULATION
10,752
MALE POPULATION
11,921
FEMALE POPULATION
90.19
MALES / 100 FEMALES
110.87
FEMALES / 100 MALES
40.7
MEDIAN AGE
3.1
AVG FAMILY SIZE
2.4
AVG HOUSEHOLD SIZE
12,064
LABOR FORCE [ PEOPLE ]
64.9%
PERCENT IN LABOR FORCE
2.9%
UNEMPLOYMENT RATE
Rotterdam Area Codes
Income in Rotterdam
Income Overview in Rotterdam
Per Capita Income in Rotterdam is $37,951, while median incomes of families and households are $97,828 and $79,415 respectively.
| Characteristic | Number | Measure |
| Per Capita Income | 22,673 | $37,951 |
| Median Family Income | 5,578 | $97,828 |
| Mean Family Income | 5,578 | $105,121 |
| Median Household Income | 9,499 | $79,415 |
| Mean Household Income | 9,499 | $89,019 |
| Income Deficit | 5,578 | $16,125 |
| Wage / Income Gap (%) | 22,673 | 24.85% |
| Wage / Income Gap ($) | 22,673 | 75.15¢ per $1 |
| Gini / Inequality Index | 22,673 | 0.35 |
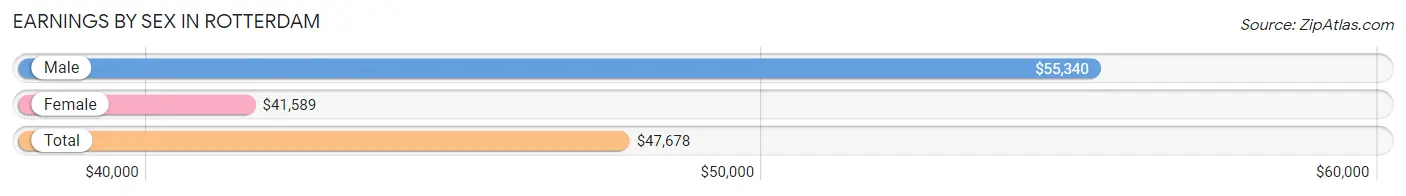
Earnings by Sex in Rotterdam
Average Earnings in Rotterdam are $47,678, $55,340 for men and $41,589 for women, a difference of 24.8%.
| Sex | Number | Average Earnings |
| Male | 5,955 (47.7%) | $55,340 |
| Female | 6,540 (52.3%) | $41,589 |
| Total | 12,495 (100.0%) | $47,678 |
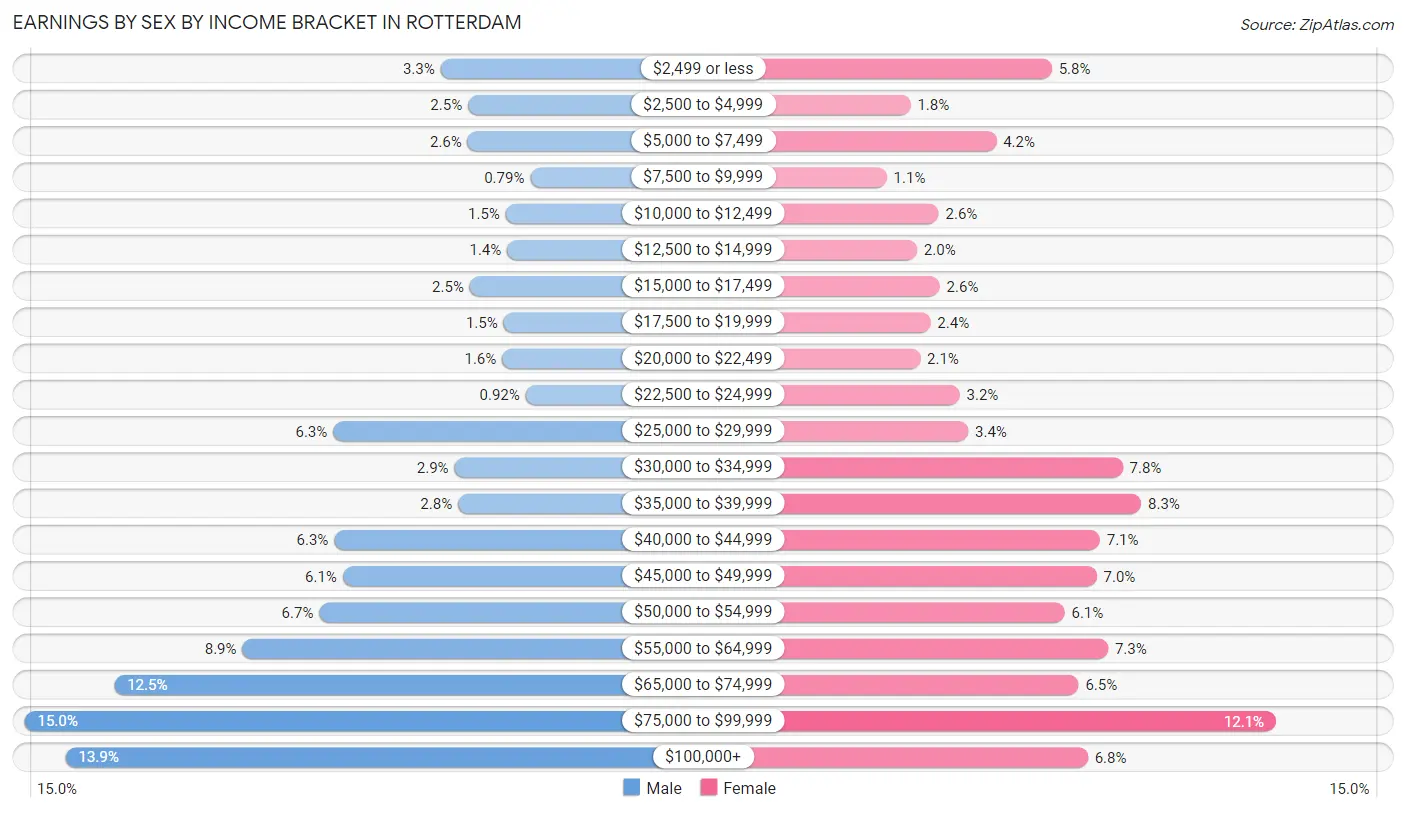
Earnings by Sex by Income Bracket in Rotterdam
The most common earnings brackets in Rotterdam are $75,000 to $99,999 for men (893 | 15.0%) and $75,000 to $99,999 for women (789 | 12.1%).
| Income | Male | Female |
| $2,499 or less | 197 (3.3%) | 377 (5.8%) |
| $2,500 to $4,999 | 151 (2.5%) | 117 (1.8%) |
| $5,000 to $7,499 | 152 (2.5%) | 275 (4.2%) |
| $7,500 to $9,999 | 47 (0.8%) | 73 (1.1%) |
| $10,000 to $12,499 | 88 (1.5%) | 169 (2.6%) |
| $12,500 to $14,999 | 86 (1.4%) | 129 (2.0%) |
| $15,000 to $17,499 | 148 (2.5%) | 171 (2.6%) |
| $17,500 to $19,999 | 92 (1.5%) | 154 (2.4%) |
| $20,000 to $22,499 | 94 (1.6%) | 135 (2.1%) |
| $22,500 to $24,999 | 55 (0.9%) | 207 (3.2%) |
| $25,000 to $29,999 | 377 (6.3%) | 223 (3.4%) |
| $30,000 to $34,999 | 174 (2.9%) | 507 (7.7%) |
| $35,000 to $39,999 | 168 (2.8%) | 541 (8.3%) |
| $40,000 to $44,999 | 375 (6.3%) | 465 (7.1%) |
| $45,000 to $49,999 | 361 (6.1%) | 459 (7.0%) |
| $50,000 to $54,999 | 400 (6.7%) | 400 (6.1%) |
| $55,000 to $64,999 | 529 (8.9%) | 480 (7.3%) |
| $65,000 to $74,999 | 743 (12.5%) | 426 (6.5%) |
| $75,000 to $99,999 | 893 (15.0%) | 789 (12.1%) |
| $100,000+ | 825 (13.9%) | 443 (6.8%) |
| Total | 5,955 (100.0%) | 6,540 (100.0%) |
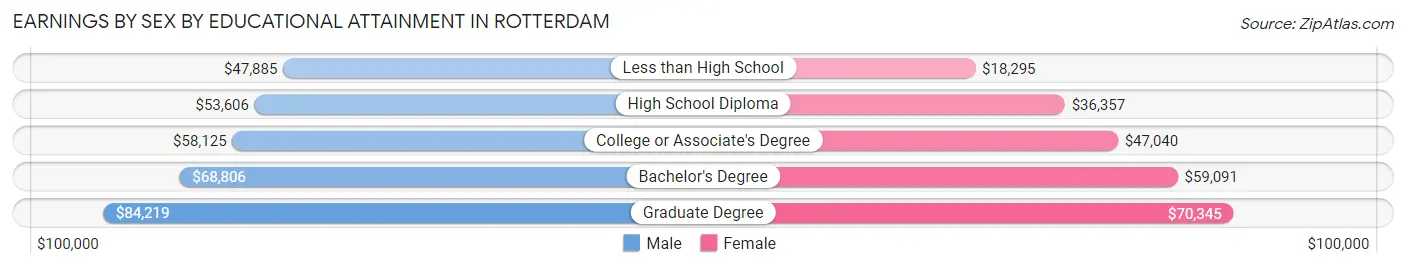
Earnings by Sex by Educational Attainment in Rotterdam
Average earnings in Rotterdam are $59,524 for men and $46,980 for women, a difference of 21.1%. Men with an educational attainment of graduate degree enjoy the highest average annual earnings of $84,219, while those with less than high school education earn the least with $47,885. Women with an educational attainment of graduate degree earn the most with the average annual earnings of $70,345, while those with less than high school education have the smallest earnings of $18,295.
| Educational Attainment | Male Income | Female Income |
| Less than High School | $47,885 | $18,295 |
| High School Diploma | $53,606 | $36,357 |
| College or Associate's Degree | $58,125 | $47,040 |
| Bachelor's Degree | $68,806 | $59,091 |
| Graduate Degree | $84,219 | $70,345 |
| Total | $59,524 | $46,980 |
Family Income in Rotterdam
Family Income Brackets in Rotterdam
According to the Rotterdam family income data, there are 1,679 families falling into the $100,000 to $149,999 income range, which is the most common income bracket and makes up 30.1% of all families. Conversely, the $10,000 to $14,999 income bracket is the least frequent group with only 22 families (0.4%) belonging to this category.
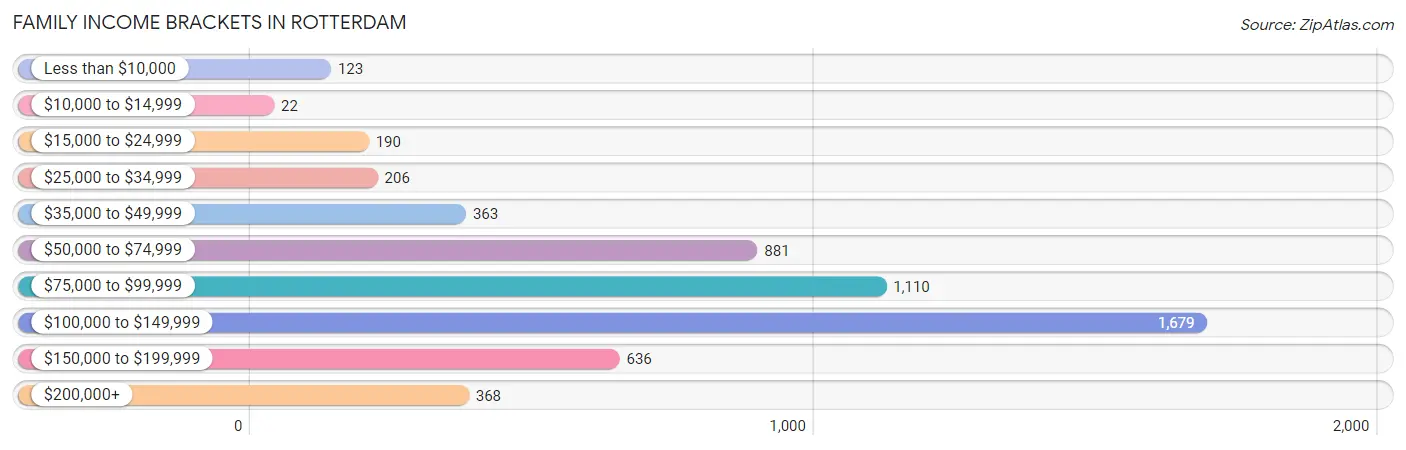
| Income Bracket | # Families | % Families |
| Less than $10,000 | 123 | 2.2% |
| $10,000 to $14,999 | 22 | 0.4% |
| $15,000 to $24,999 | 190 | 3.4% |
| $25,000 to $34,999 | 206 | 3.7% |
| $35,000 to $49,999 | 363 | 6.5% |
| $50,000 to $74,999 | 881 | 15.8% |
| $75,000 to $99,999 | 1,110 | 19.9% |
| $100,000 to $149,999 | 1,679 | 30.1% |
| $150,000 to $199,999 | 636 | 11.4% |
| $200,000+ | 368 | 6.6% |
Family Income by Famaliy Size in Rotterdam
5-person families (278 | 5.0%) account for the highest median family income in Rotterdam with $136,250 per family, while 2-person families (2,787 | 50.0%) have the highest median income of $42,080 per family member.
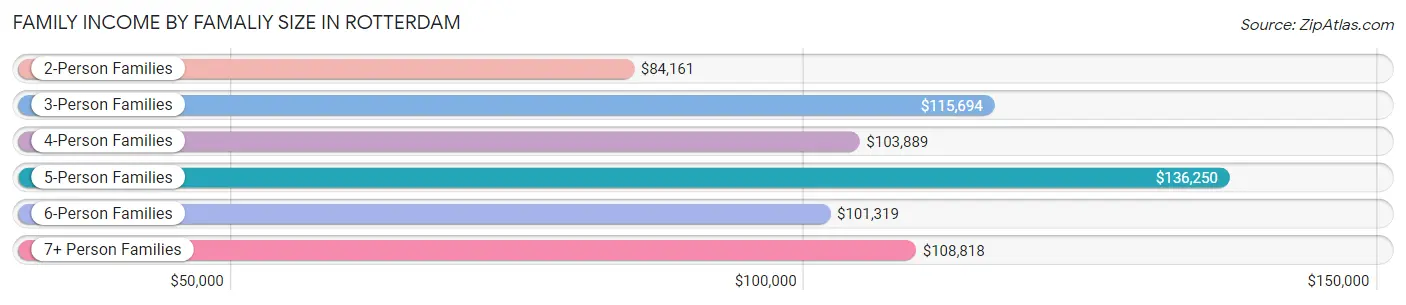
| Income Bracket | # Families | Median Income |
| 2-Person Families | 2,787 (50.0%) | $84,161 |
| 3-Person Families | 1,356 (24.3%) | $115,694 |
| 4-Person Families | 904 (16.2%) | $103,889 |
| 5-Person Families | 278 (5.0%) | $136,250 |
| 6-Person Families | 159 (2.9%) | $101,319 |
| 7+ Person Families | 94 (1.7%) | $108,818 |
| Total | 5,578 (100.0%) | $97,828 |
Family Income by Number of Earners in Rotterdam
The median family income in Rotterdam is $97,828, with families comprising 3+ earners (629) having the highest median family income of $149,234, while families with no earners (943) have the lowest median family income of $58,885, accounting for 11.3% and 16.9% of families, respectively.
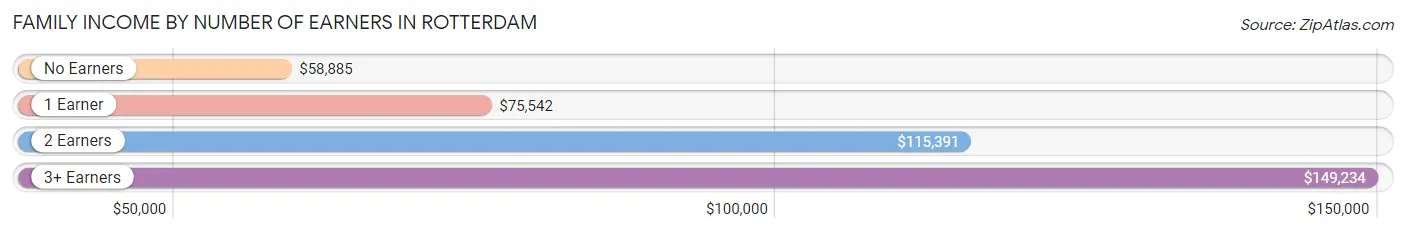
| Number of Earners | # Families | Median Income |
| No Earners | 943 (16.9%) | $58,885 |
| 1 Earner | 1,703 (30.5%) | $75,542 |
| 2 Earners | 2,303 (41.3%) | $115,391 |
| 3+ Earners | 629 (11.3%) | $149,234 |
| Total | 5,578 (100.0%) | $97,828 |
Household Income in Rotterdam
Household Income Brackets in Rotterdam
With 2,090 households falling in the category, the $100,000 to $149,999 income range is the most frequent in Rotterdam, accounting for 22.0% of all households. In contrast, only 171 households (1.8%) fall into the $10,000 to $14,999 income bracket, making it the least populous group.
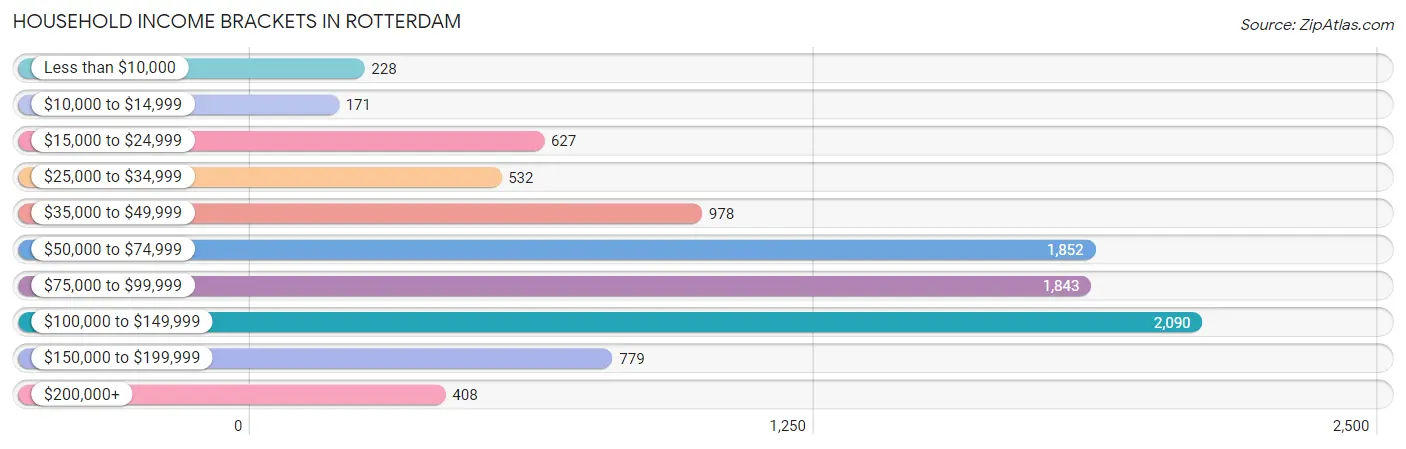
| Income Bracket | # Households | % Households |
| Less than $10,000 | 228 | 2.4% |
| $10,000 to $14,999 | 171 | 1.8% |
| $15,000 to $24,999 | 627 | 6.6% |
| $25,000 to $34,999 | 532 | 5.6% |
| $35,000 to $49,999 | 978 | 10.3% |
| $50,000 to $74,999 | 1,852 | 19.5% |
| $75,000 to $99,999 | 1,843 | 19.4% |
| $100,000 to $149,999 | 2,090 | 22.0% |
| $150,000 to $199,999 | 779 | 8.2% |
| $200,000+ | 408 | 4.3% |
Household Income by Householder Age in Rotterdam
The median household income in Rotterdam is $79,415, with the highest median household income of $91,809 found in the 25 to 44 years age bracket for the primary householder. A total of 2,874 households (30.3%) fall into this category. Meanwhile, the 65+ years age bracket for the primary householder has the lowest median household income of $53,602, with 2,756 households (29.0%) in this group.
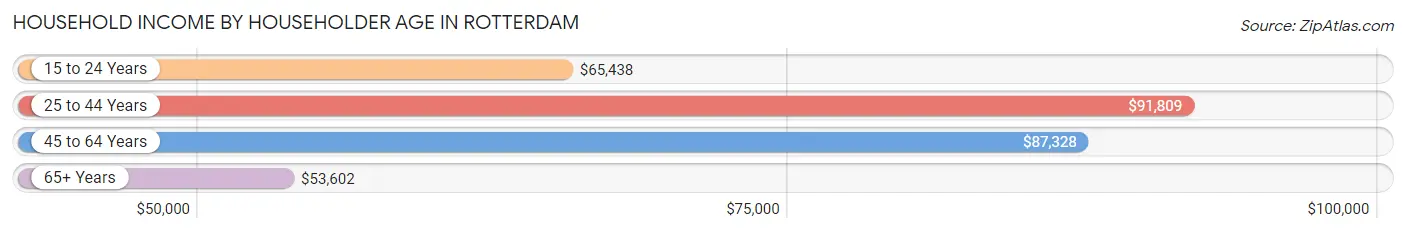
| Income Bracket | # Households | Median Income |
| 15 to 24 Years | 245 (2.6%) | $65,438 |
| 25 to 44 Years | 2,874 (30.3%) | $91,809 |
| 45 to 64 Years | 3,624 (38.2%) | $87,328 |
| 65+ Years | 2,756 (29.0%) | $53,602 |
| Total | 9,499 (100.0%) | $79,415 |
Poverty in Rotterdam
Income Below Poverty by Sex and Age in Rotterdam
With 6.0% poverty level for males and 4.9% for females among the residents of Rotterdam, 5 year old males and 16 and 17 year old females are the most vulnerable to poverty, with 13 males (18.6%) and 38 females (12.5%) in their respective age groups living below the poverty level.
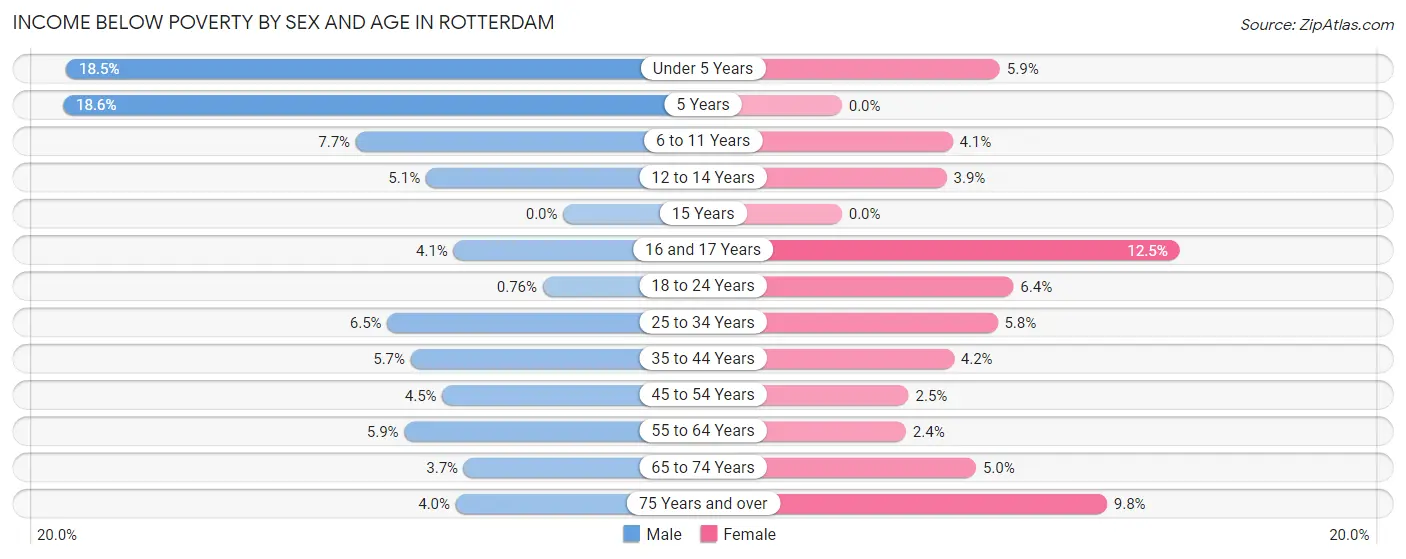
| Age Bracket | Male | Female |
| Under 5 Years | 125 (18.5%) | 39 (5.9%) |
| 5 Years | 13 (18.6%) | 0 (0.0%) |
| 6 to 11 Years | 71 (7.7%) | 28 (4.1%) |
| 12 to 14 Years | 20 (5.1%) | 13 (3.9%) |
| 15 Years | 0 (0.0%) | 0 (0.0%) |
| 16 and 17 Years | 11 (4.1%) | 38 (12.5%) |
| 18 to 24 Years | 5 (0.8%) | 78 (6.4%) |
| 25 to 34 Years | 112 (6.5%) | 88 (5.8%) |
| 35 to 44 Years | 70 (5.7%) | 57 (4.2%) |
| 45 to 54 Years | 59 (4.5%) | 37 (2.5%) |
| 55 to 64 Years | 87 (5.9%) | 45 (2.4%) |
| 65 to 74 Years | 47 (3.7%) | 62 (5.0%) |
| 75 Years and over | 25 (4.0%) | 95 (9.8%) |
| Total | 645 (6.0%) | 580 (4.9%) |
Income Above Poverty by Sex and Age in Rotterdam
According to the poverty statistics in Rotterdam, males aged 15 years and females aged 5 years are the age groups that are most secure financially, with 100.0% of males and 100.0% of females in these age groups living above the poverty line.
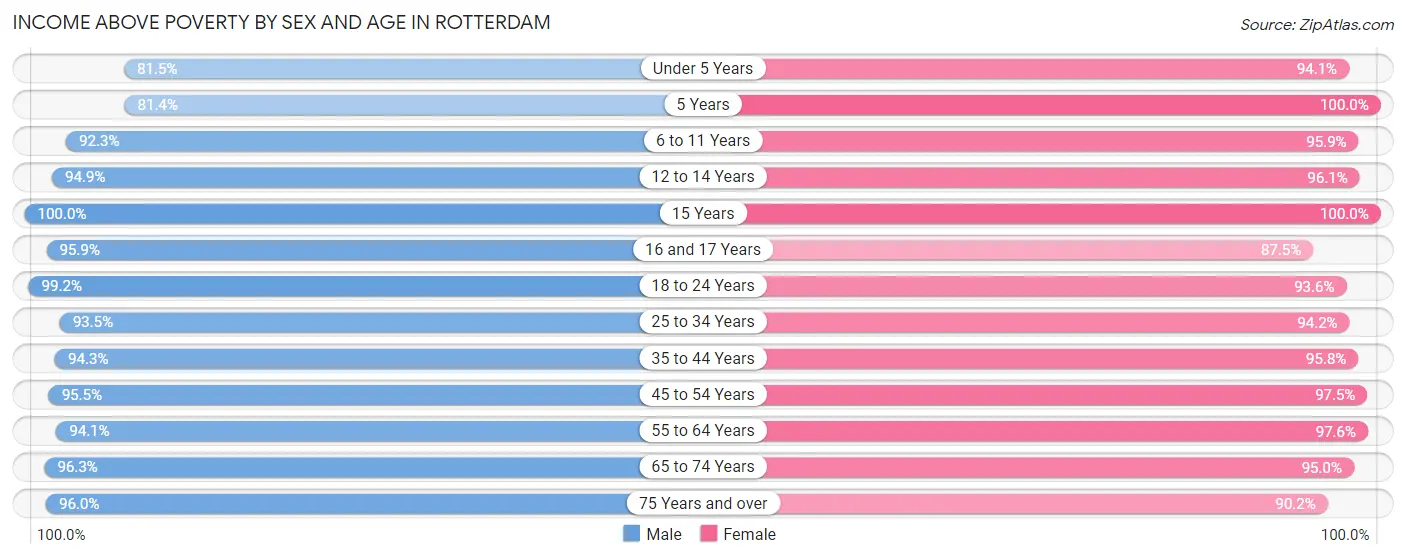
| Age Bracket | Male | Female |
| Under 5 Years | 552 (81.5%) | 625 (94.1%) |
| 5 Years | 57 (81.4%) | 82 (100.0%) |
| 6 to 11 Years | 851 (92.3%) | 653 (95.9%) |
| 12 to 14 Years | 372 (94.9%) | 321 (96.1%) |
| 15 Years | 119 (100.0%) | 143 (100.0%) |
| 16 and 17 Years | 259 (95.9%) | 265 (87.5%) |
| 18 to 24 Years | 657 (99.2%) | 1,147 (93.6%) |
| 25 to 34 Years | 1,604 (93.5%) | 1,435 (94.2%) |
| 35 to 44 Years | 1,167 (94.3%) | 1,314 (95.8%) |
| 45 to 54 Years | 1,255 (95.5%) | 1,453 (97.5%) |
| 55 to 64 Years | 1,387 (94.1%) | 1,849 (97.6%) |
| 65 to 74 Years | 1,225 (96.3%) | 1,184 (95.0%) |
| 75 Years and over | 602 (96.0%) | 870 (90.2%) |
| Total | 10,107 (94.0%) | 11,341 (95.1%) |
Income Below Poverty Among Married-Couple Families in Rotterdam
The poverty statistics for married-couple families in Rotterdam show that 1.9% or 80 of the total 4,286 families live below the poverty line. Families with 5 or more children have the highest poverty rate of 100.0%, comprising of 7 families. On the other hand, families with 1 or 2 children have the lowest poverty rate of 1.3%, which includes 18 families.
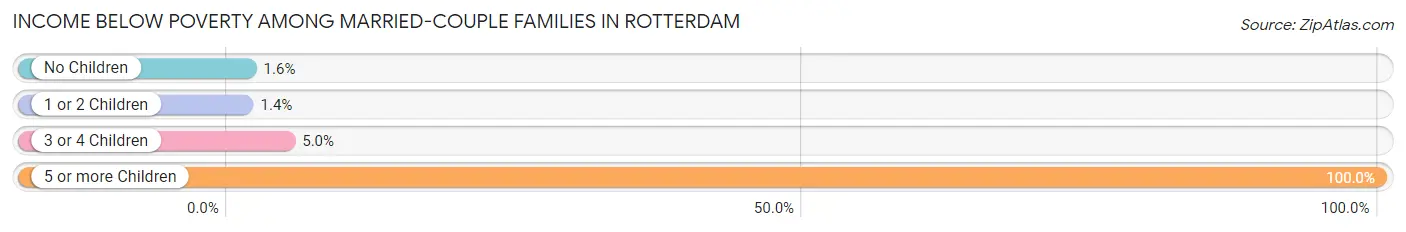
| Children | Above Poverty | Below Poverty |
| No Children | 2,680 (98.4%) | 44 (1.6%) |
| 1 or 2 Children | 1,316 (98.7%) | 18 (1.3%) |
| 3 or 4 Children | 210 (95.0%) | 11 (5.0%) |
| 5 or more Children | 0 (0.0%) | 7 (100.0%) |
| Total | 4,206 (98.1%) | 80 (1.9%) |
Income Below Poverty Among Single-Parent Households in Rotterdam
According to the poverty data in Rotterdam, 11.2% or 36 single-father households and 9.4% or 91 single-mother households are living below the poverty line. Among single-father households, those with 1 or 2 children have the highest poverty rate, with 36 households (22.0%) experiencing poverty. Likewise, among single-mother households, those with 1 or 2 children have the highest poverty rate, with 61 households (12.6%) falling below the poverty line.
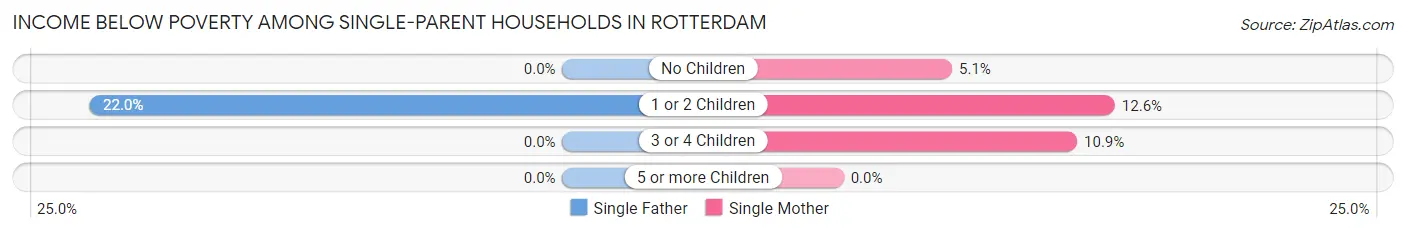
| Children | Single Father | Single Mother |
| No Children | 0 (0.0%) | 20 (5.1%) |
| 1 or 2 Children | 36 (22.0%) | 61 (12.6%) |
| 3 or 4 Children | 0 (0.0%) | 10 (10.9%) |
| 5 or more Children | 0 (0.0%) | 0 (0.0%) |
| Total | 36 (11.2%) | 91 (9.4%) |
Income Below Poverty Among Married-Couple vs Single-Parent Households in Rotterdam
The poverty data for Rotterdam shows that 80 of the married-couple family households (1.9%) and 127 of the single-parent households (9.8%) are living below the poverty level. Within the married-couple family households, those with 5 or more children have the highest poverty rate, with 7 households (100.0%) falling below the poverty line. Among the single-parent households, those with 1 or 2 children have the highest poverty rate, with 97 household (15.0%) living below poverty.
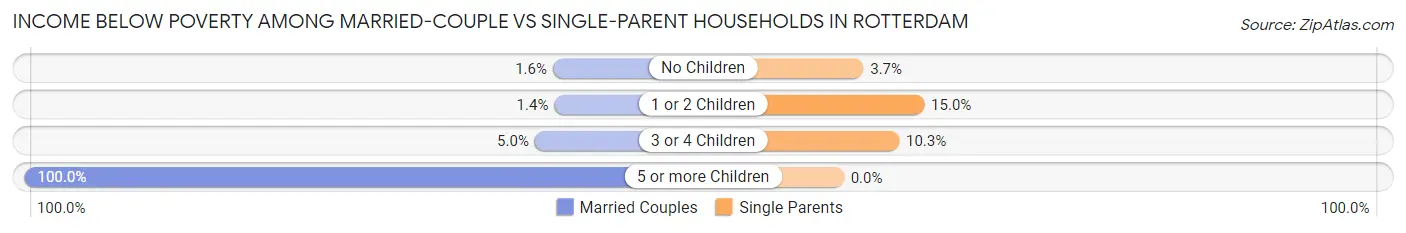
| Children | Married-Couple Families | Single-Parent Households |
| No Children | 44 (1.6%) | 20 (3.6%) |
| 1 or 2 Children | 18 (1.3%) | 97 (15.0%) |
| 3 or 4 Children | 11 (5.0%) | 10 (10.3%) |
| 5 or more Children | 7 (100.0%) | 0 (0.0%) |
| Total | 80 (1.9%) | 127 (9.8%) |
Race in Rotterdam
The most populous races in Rotterdam are White / Caucasian (18,970 | 83.7%), Black / African American (1,551 | 6.8%), and Two or more Races (1,295 | 5.7%).
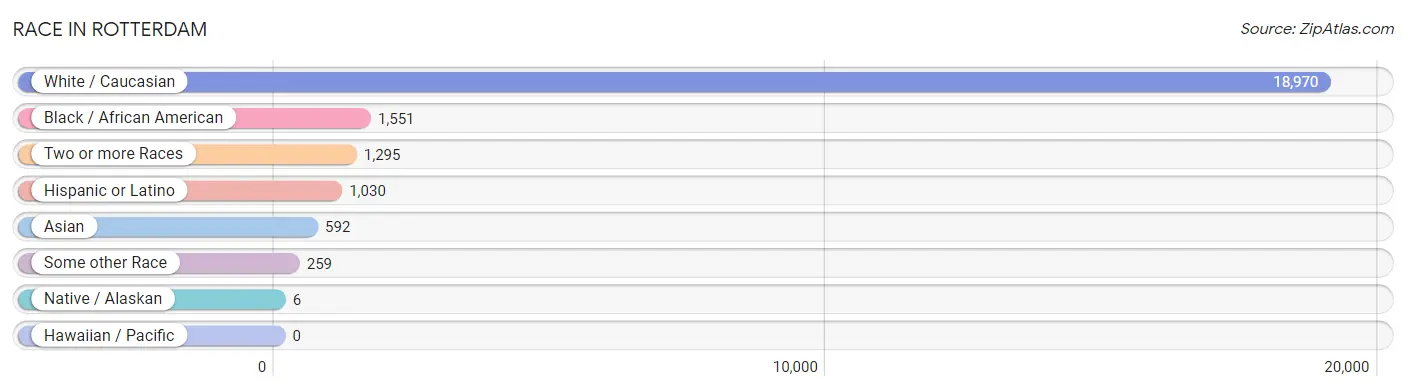
| Race | # Population | % Population |
| Asian | 592 | 2.6% |
| Black / African American | 1,551 | 6.8% |
| Hawaiian / Pacific | 0 | 0.0% |
| Hispanic or Latino | 1,030 | 4.5% |
| Native / Alaskan | 6 | 0.0% |
| White / Caucasian | 18,970 | 83.7% |
| Two or more Races | 1,295 | 5.7% |
| Some other Race | 259 | 1.1% |
| Total | 22,673 | 100.0% |
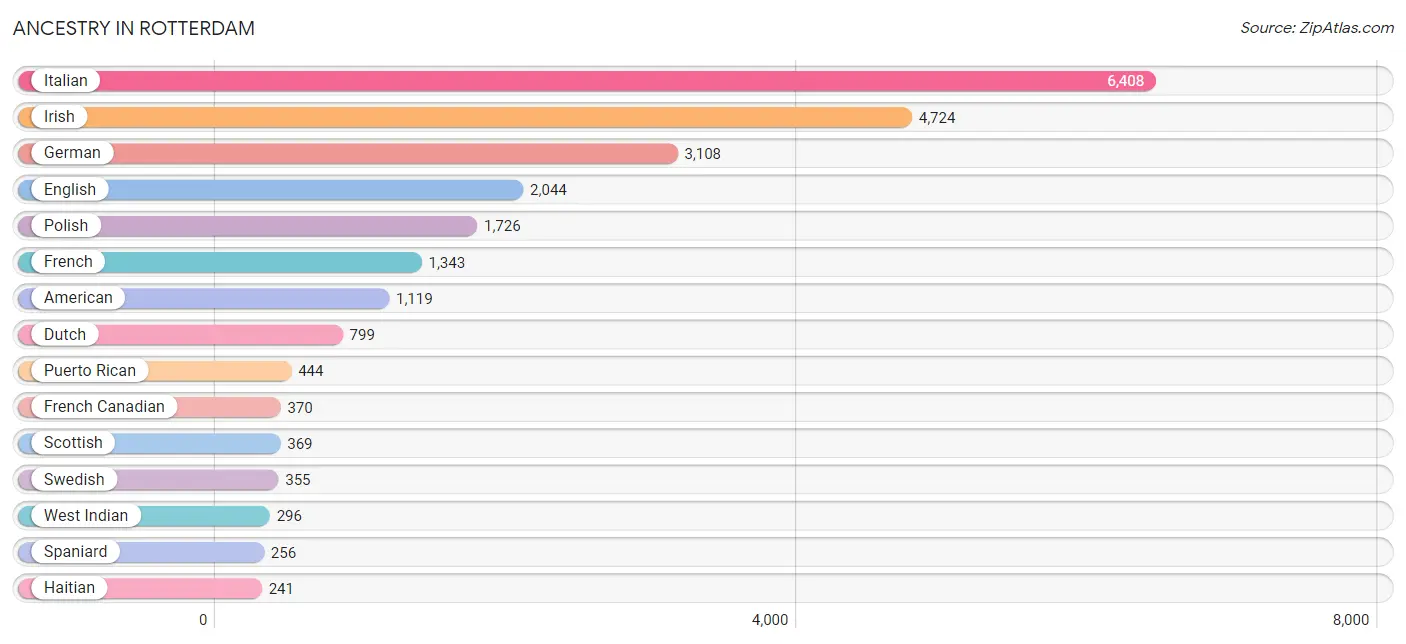
Ancestry in Rotterdam
The most populous ancestries reported in Rotterdam are Italian (6,408 | 28.3%), Irish (4,724 | 20.8%), German (3,108 | 13.7%), English (2,044 | 9.0%), and Polish (1,726 | 7.6%), together accounting for 79.4% of all Rotterdam residents.
| Ancestry | # Population | % Population |
| Afghan | 5 | 0.0% |
| African | 25 | 0.1% |
| Albanian | 23 | 0.1% |
| American | 1,119 | 4.9% |
| Arab | 49 | 0.2% |
| Armenian | 23 | 0.1% |
| Bahamian | 26 | 0.1% |
| Barbadian | 66 | 0.3% |
| Belizean | 16 | 0.1% |
| Bhutanese | 23 | 0.1% |
| Blackfeet | 9 | 0.0% |
| Brazilian | 33 | 0.2% |
| British | 25 | 0.1% |
| Burmese | 129 | 0.6% |
| Canadian | 68 | 0.3% |
| Central American | 85 | 0.4% |
| Central American Indian | 29 | 0.1% |
| Cherokee | 58 | 0.3% |
| Chippewa | 18 | 0.1% |
| Colombian | 11 | 0.1% |
| Costa Rican | 39 | 0.2% |
| Cuban | 28 | 0.1% |
| Czech | 42 | 0.2% |
| Czechoslovakian | 11 | 0.1% |
| Danish | 31 | 0.1% |
| Dominican | 4 | 0.0% |
| Dutch | 799 | 3.5% |
| Eastern European | 74 | 0.3% |
| English | 2,044 | 9.0% |
| Ethiopian | 16 | 0.1% |
| European | 183 | 0.8% |
| Finnish | 26 | 0.1% |
| French | 1,343 | 5.9% |
| French American Indian | 2 | 0.0% |
| French Canadian | 370 | 1.6% |
| German | 3,108 | 13.7% |
| Greek | 84 | 0.4% |
| Guatemalan | 16 | 0.1% |
| Guyanese | 114 | 0.5% |
| Haitian | 241 | 1.1% |
| Hungarian | 56 | 0.3% |
| Indian (Asian) | 74 | 0.3% |
| Indonesian | 164 | 0.7% |
| Irish | 4,724 | 20.8% |
| Iroquois | 35 | 0.2% |
| Italian | 6,408 | 28.3% |
| Jamaican | 72 | 0.3% |
| Korean | 39 | 0.2% |
| Lebanese | 39 | 0.2% |
| Lithuanian | 44 | 0.2% |
| Maltese | 10 | 0.0% |
| Mexican | 65 | 0.3% |
| Moroccan | 10 | 0.0% |
| Native Hawaiian | 4 | 0.0% |
| Nigerian | 23 | 0.1% |
| Northern European | 46 | 0.2% |
| Norwegian | 169 | 0.7% |
| Pennsylvania German | 17 | 0.1% |
| Peruvian | 44 | 0.2% |
| Polish | 1,726 | 7.6% |
| Portuguese | 31 | 0.1% |
| Puerto Rican | 444 | 2.0% |
| Romanian | 8 | 0.0% |
| Russian | 112 | 0.5% |
| Salvadoran | 30 | 0.1% |
| Scandinavian | 13 | 0.1% |
| Scotch-Irish | 75 | 0.3% |
| Scottish | 369 | 1.6% |
| Slovak | 108 | 0.5% |
| Slovene | 12 | 0.1% |
| South American | 69 | 0.3% |
| Spaniard | 256 | 1.1% |
| Spanish | 53 | 0.2% |
| Sri Lankan | 58 | 0.3% |
| Subsaharan African | 64 | 0.3% |
| Swedish | 355 | 1.6% |
| Swiss | 40 | 0.2% |
| Syrian | 9 | 0.0% |
| Thai | 237 | 1.1% |
| Trinidadian and Tobagonian | 38 | 0.2% |
| Turkish | 4 | 0.0% |
| Ukrainian | 27 | 0.1% |
| Welsh | 76 | 0.3% |
| West Indian | 296 | 1.3% | View All 84 Rows |
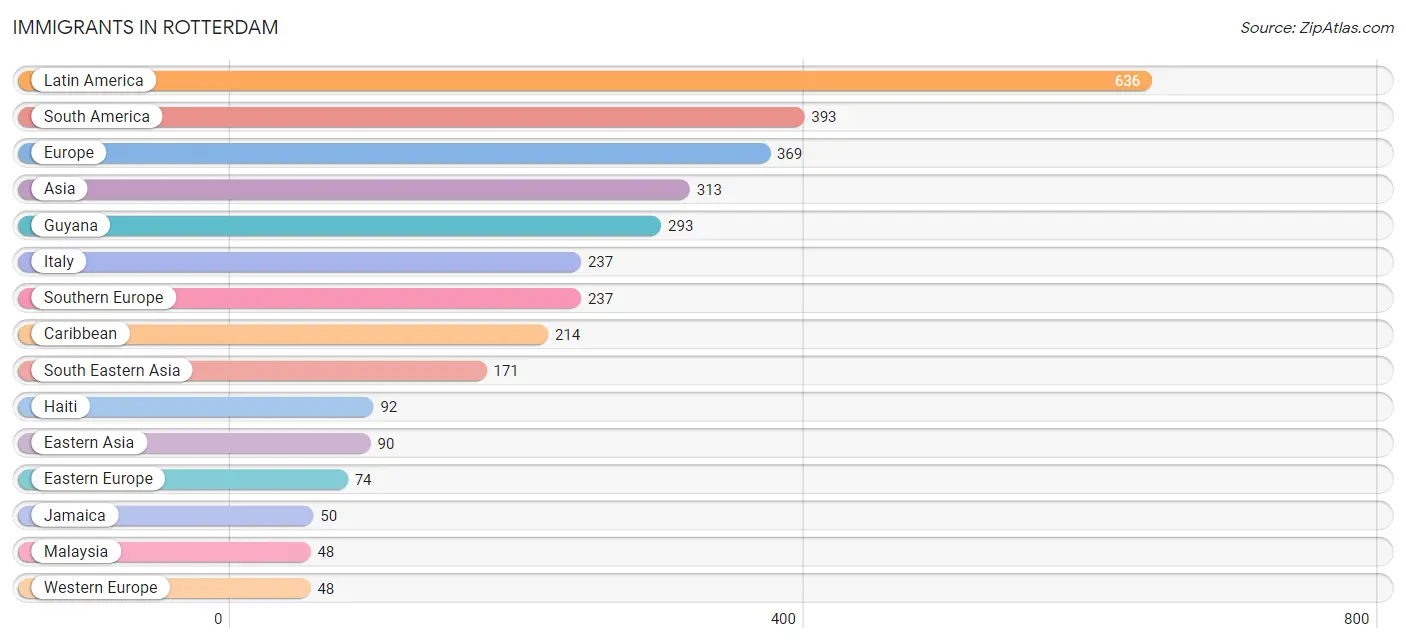
Immigrants in Rotterdam
The most numerous immigrant groups reported in Rotterdam came from Latin America (636 | 2.8%), South America (393 | 1.7%), Europe (369 | 1.6%), Asia (313 | 1.4%), and Guyana (293 | 1.3%), together accounting for 8.8% of all Rotterdam residents.
| Immigration Origin | # Population | % Population |
| Albania | 23 | 0.1% |
| Asia | 313 | 1.4% |
| Barbados | 19 | 0.1% |
| Brazil | 33 | 0.2% |
| Canada | 7 | 0.0% |
| Caribbean | 214 | 0.9% |
| Central America | 29 | 0.1% |
| China | 38 | 0.2% |
| Colombia | 11 | 0.1% |
| Costa Rica | 29 | 0.1% |
| Cuba | 10 | 0.0% |
| Czechoslovakia | 9 | 0.0% |
| Dominican Republic | 6 | 0.0% |
| Eastern Asia | 90 | 0.4% |
| Eastern Europe | 74 | 0.3% |
| Europe | 369 | 1.6% |
| Germany | 42 | 0.2% |
| Guyana | 293 | 1.3% |
| Haiti | 92 | 0.4% |
| Hungary | 20 | 0.1% |
| India | 2 | 0.0% |
| Italy | 237 | 1.1% |
| Jamaica | 50 | 0.2% |
| Japan | 10 | 0.0% |
| Korea | 42 | 0.2% |
| Latin America | 636 | 2.8% |
| Malaysia | 48 | 0.2% |
| Northern Europe | 10 | 0.0% |
| Norway | 10 | 0.0% |
| Pakistan | 34 | 0.2% |
| Peru | 32 | 0.1% |
| Philippines | 29 | 0.1% |
| Poland | 22 | 0.1% |
| South America | 393 | 1.7% |
| South Central Asia | 36 | 0.2% |
| South Eastern Asia | 171 | 0.7% |
| Southern Europe | 237 | 1.1% |
| Switzerland | 6 | 0.0% |
| Trinidad and Tobago | 37 | 0.2% |
| Turkey | 9 | 0.0% |
| Vietnam | 46 | 0.2% |
| Western Asia | 16 | 0.1% |
| Western Europe | 48 | 0.2% | View All 43 Rows |
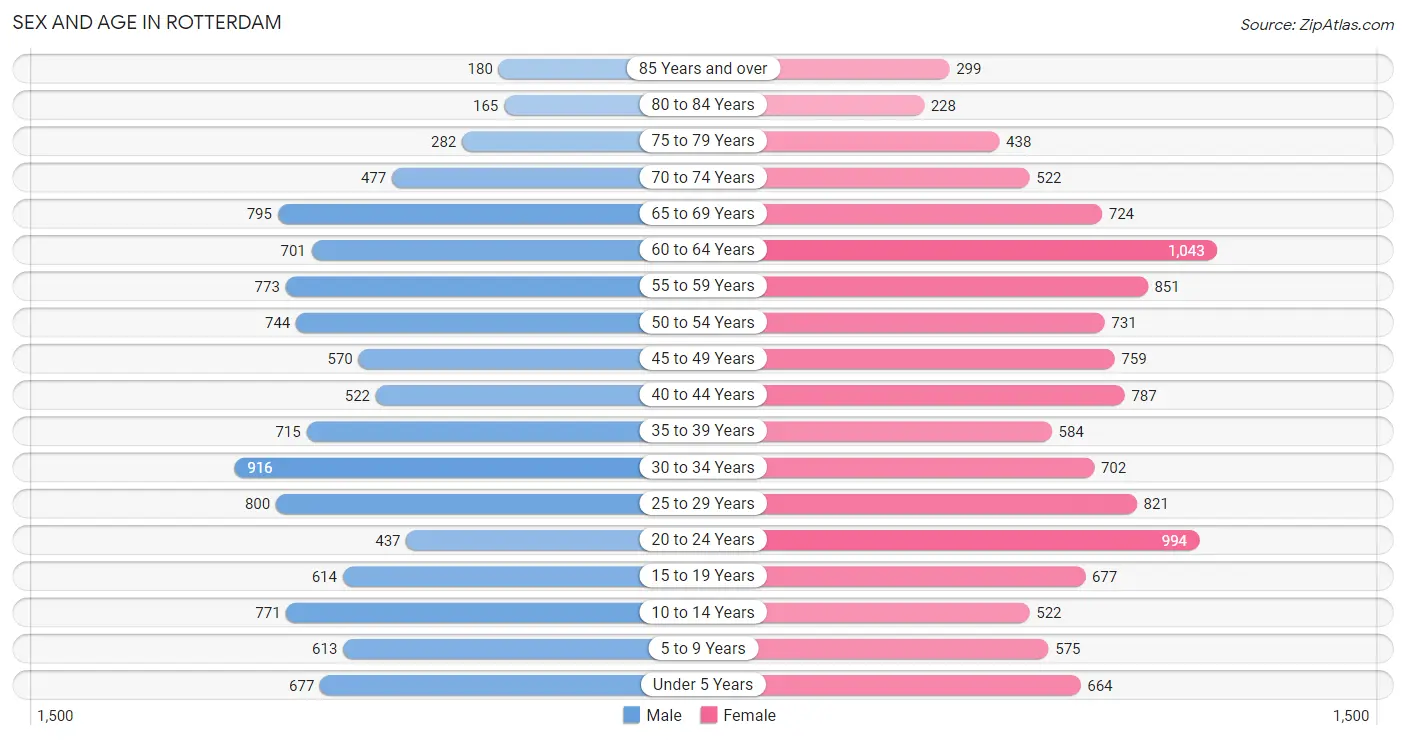
Sex and Age in Rotterdam
Sex and Age in Rotterdam
The most populous age groups in Rotterdam are 30 to 34 Years (916 | 8.5%) for men and 60 to 64 Years (1,043 | 8.7%) for women.
| Age Bracket | Male | Female |
| Under 5 Years | 677 (6.3%) | 664 (5.6%) |
| 5 to 9 Years | 613 (5.7%) | 575 (4.8%) |
| 10 to 14 Years | 771 (7.2%) | 522 (4.4%) |
| 15 to 19 Years | 614 (5.7%) | 677 (5.7%) |
| 20 to 24 Years | 437 (4.1%) | 994 (8.3%) |
| 25 to 29 Years | 800 (7.4%) | 821 (6.9%) |
| 30 to 34 Years | 916 (8.5%) | 702 (5.9%) |
| 35 to 39 Years | 715 (6.7%) | 584 (4.9%) |
| 40 to 44 Years | 522 (4.9%) | 787 (6.6%) |
| 45 to 49 Years | 570 (5.3%) | 759 (6.4%) |
| 50 to 54 Years | 744 (6.9%) | 731 (6.1%) |
| 55 to 59 Years | 773 (7.2%) | 851 (7.1%) |
| 60 to 64 Years | 701 (6.5%) | 1,043 (8.7%) |
| 65 to 69 Years | 795 (7.4%) | 724 (6.1%) |
| 70 to 74 Years | 477 (4.4%) | 522 (4.4%) |
| 75 to 79 Years | 282 (2.6%) | 438 (3.7%) |
| 80 to 84 Years | 165 (1.5%) | 228 (1.9%) |
| 85 Years and over | 180 (1.7%) | 299 (2.5%) |
| Total | 10,752 (100.0%) | 11,921 (100.0%) |
Families and Households in Rotterdam
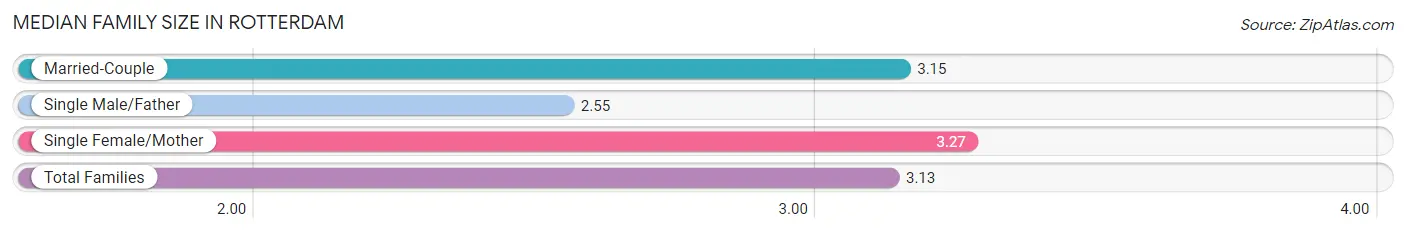
Median Family Size in Rotterdam
The median family size in Rotterdam is 3.13 persons per family, with single female/mother families (971 | 17.4%) accounting for the largest median family size of 3.27 persons per family. On the other hand, single male/father families (321 | 5.8%) represent the smallest median family size with 2.55 persons per family.
| Family Type | # Families | Family Size |
| Married-Couple | 4,286 (76.8%) | 3.15 |
| Single Male/Father | 321 (5.8%) | 2.55 |
| Single Female/Mother | 971 (17.4%) | 3.27 |
| Total Families | 5,578 (100.0%) | 3.13 |
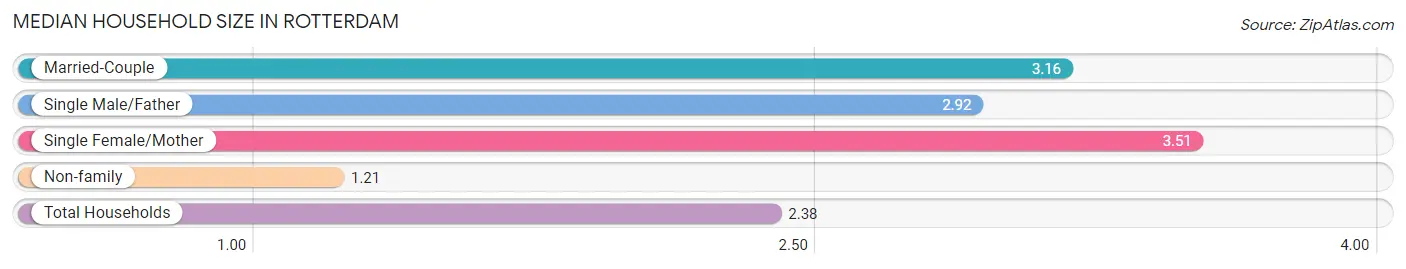
Median Household Size in Rotterdam
The median household size in Rotterdam is 2.38 persons per household, with single female/mother households (971 | 10.2%) accounting for the largest median household size of 3.51 persons per household. non-family households (3,921 | 41.3%) represent the smallest median household size with 1.21 persons per household.
| Household Type | # Households | Household Size |
| Married-Couple | 4,286 (45.1%) | 3.16 |
| Single Male/Father | 321 (3.4%) | 2.92 |
| Single Female/Mother | 971 (10.2%) | 3.51 |
| Non-family | 3,921 (41.3%) | 1.21 |
| Total Households | 9,499 (100.0%) | 2.38 |
Household Size by Marriage Status in Rotterdam
Out of a total of 9,499 households in Rotterdam, 5,578 (58.7%) are family households, while 3,921 (41.3%) are nonfamily households. The most numerous type of family households are 2-person households, comprising 2,628, and the most common type of nonfamily households are 1-person households, comprising 3,188.
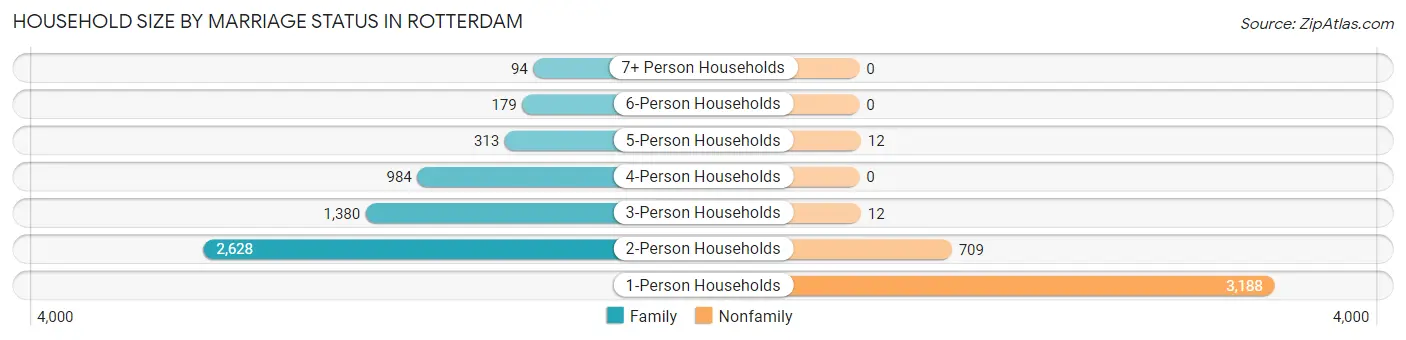
| Household Size | Family Households | Nonfamily Households |
| 1-Person Households | - | 3,188 (33.6%) |
| 2-Person Households | 2,628 (27.7%) | 709 (7.5%) |
| 3-Person Households | 1,380 (14.5%) | 12 (0.1%) |
| 4-Person Households | 984 (10.4%) | 0 (0.0%) |
| 5-Person Households | 313 (3.3%) | 12 (0.1%) |
| 6-Person Households | 179 (1.9%) | 0 (0.0%) |
| 7+ Person Households | 94 (1.0%) | 0 (0.0%) |
| Total | 5,578 (58.7%) | 3,921 (41.3%) |
Female Fertility in Rotterdam
Fertility by Age in Rotterdam
Average fertility rate in Rotterdam is 43.0 births per 1,000 women. Women in the age bracket of 20 to 34 years have the highest fertility rate with 83.0 births per 1,000 women. Women in the age bracket of 20 to 34 years acount for 90.9% of all women with births.
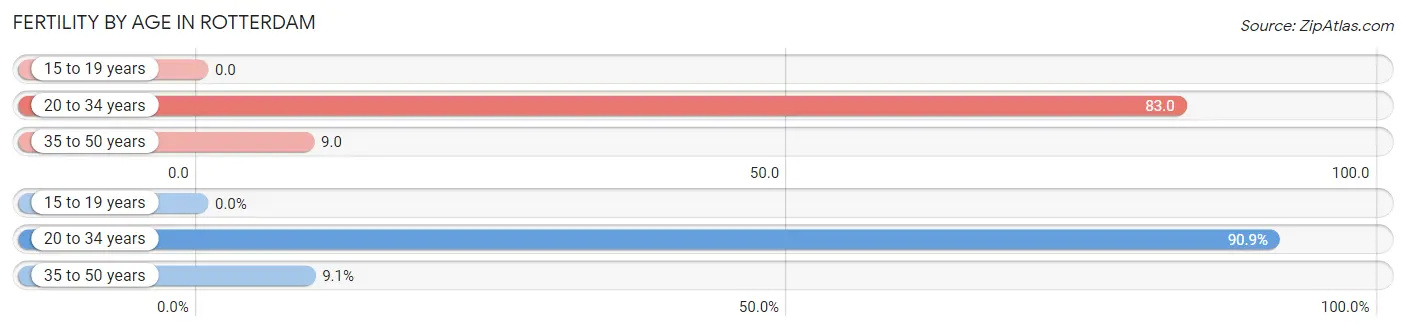
| Age Bracket | Women with Births | Births / 1,000 Women |
| 15 to 19 years | 0 (0.0%) | 0.0 |
| 20 to 34 years | 210 (90.9%) | 83.0 |
| 35 to 50 years | 21 (9.1%) | 9.0 |
| Total | 231 (100.0%) | 43.0 |
Fertility by Age by Marriage Status in Rotterdam
34.6% of women with births (231) in Rotterdam are married. The highest percentage of unmarried women with births falls into 20 to 34 years age bracket with 71.9% of them unmarried at the time of birth, while the lowest percentage of unmarried women with births belong to 35 to 50 years age bracket with 0.0% of them unmarried.
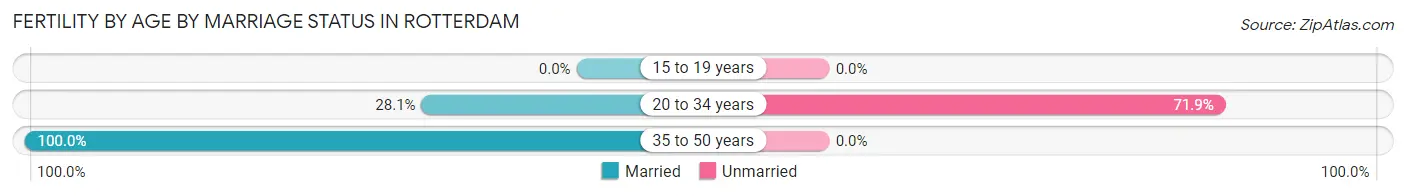
| Age Bracket | Married | Unmarried |
| 15 to 19 years | 0 (0.0%) | 0 (0.0%) |
| 20 to 34 years | 59 (28.1%) | 151 (71.9%) |
| 35 to 50 years | 21 (100.0%) | 0 (0.0%) |
| Total | 80 (34.6%) | 151 (65.4%) |
Fertility by Education in Rotterdam
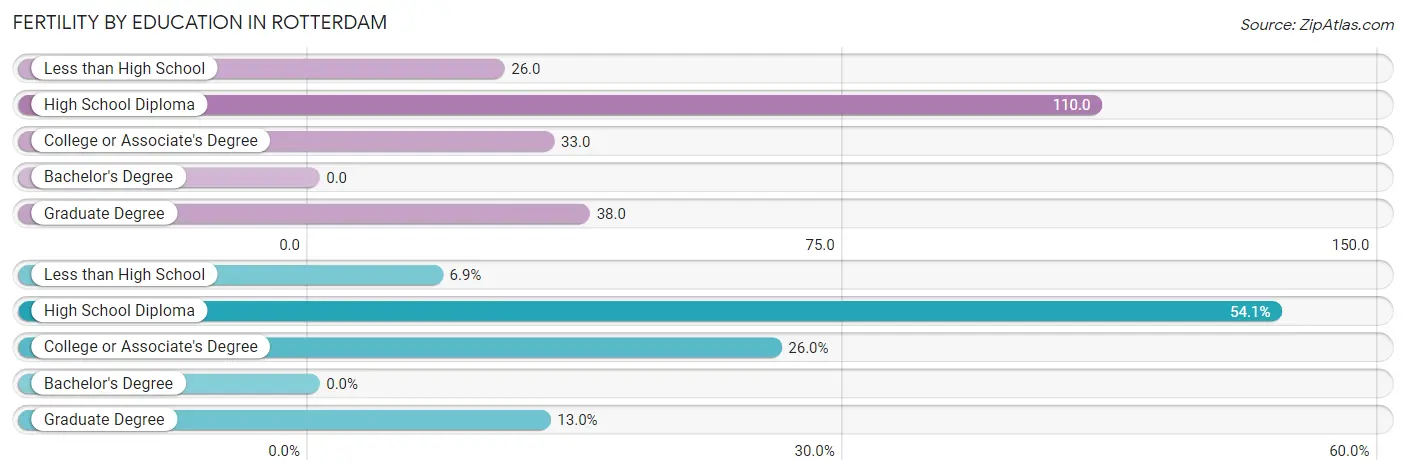
| Educational Attainment | Women with Births | Births / 1,000 Women |
| Less than High School | 16 (6.9%) | 26.0 |
| High School Diploma | 125 (54.1%) | 110.0 |
| College or Associate's Degree | 60 (26.0%) | 33.0 |
| Bachelor's Degree | 0 (0.0%) | 0.0 |
| Graduate Degree | 30 (13.0%) | 38.0 |
| Total | 231 (100.0%) | 43.0 |
Fertility by Education by Marriage Status in Rotterdam
65.4% of women with births in Rotterdam are unmarried. Women with the educational attainment of graduate degree are most likely to be married with 100.0% of them married at childbirth, while women with the educational attainment of less than high school are least likely to be married with 100.0% of them unmarried at childbirth.
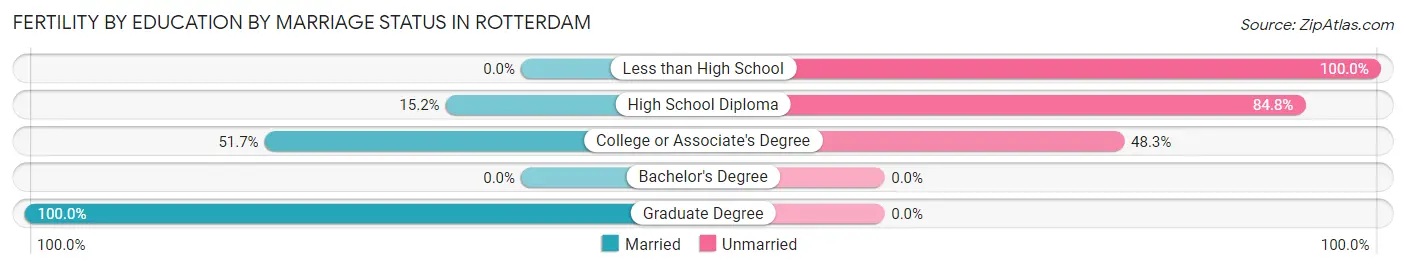
| Educational Attainment | Married | Unmarried |
| Less than High School | 0 (0.0%) | 16 (100.0%) |
| High School Diploma | 19 (15.2%) | 106 (84.8%) |
| College or Associate's Degree | 31 (51.7%) | 29 (48.3%) |
| Bachelor's Degree | 0 (0.0%) | 0 (0.0%) |
| Graduate Degree | 30 (100.0%) | 0 (0.0%) |
| Total | 80 (34.6%) | 151 (65.4%) |
Employment Characteristics in Rotterdam
Employment by Class of Employer in Rotterdam
Among the 11,358 employed individuals in Rotterdam, private company employees (6,673 | 58.8%), state government employees (1,429 | 12.6%), and not-for-profit organizations (1,221 | 10.7%) make up the most common classes of employment.
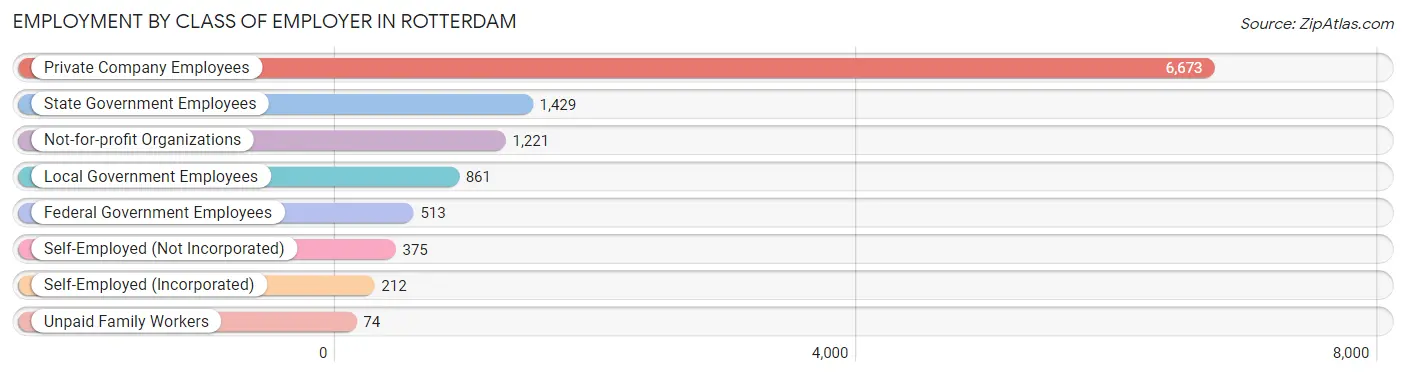
| Employer Class | # Employees | % Employees |
| Private Company Employees | 6,673 | 58.8% |
| Self-Employed (Incorporated) | 212 | 1.9% |
| Self-Employed (Not Incorporated) | 375 | 3.3% |
| Not-for-profit Organizations | 1,221 | 10.7% |
| Local Government Employees | 861 | 7.6% |
| State Government Employees | 1,429 | 12.6% |
| Federal Government Employees | 513 | 4.5% |
| Unpaid Family Workers | 74 | 0.6% |
| Total | 11,358 | 100.0% |
Employment Status by Age in Rotterdam
According to the labor force statistics for Rotterdam, out of the total population over 16 years of age (18,589), 64.9% or 12,064 individuals are in the labor force, with 2.9% or 350 of them unemployed. The age group with the highest labor force participation rate is 25 to 29 years, with 90.0% or 1,459 individuals in the labor force. Within the labor force, the 75 years and over age range has the highest percentage of unemployed individuals, with 11.0% or 8 of them being unemployed.
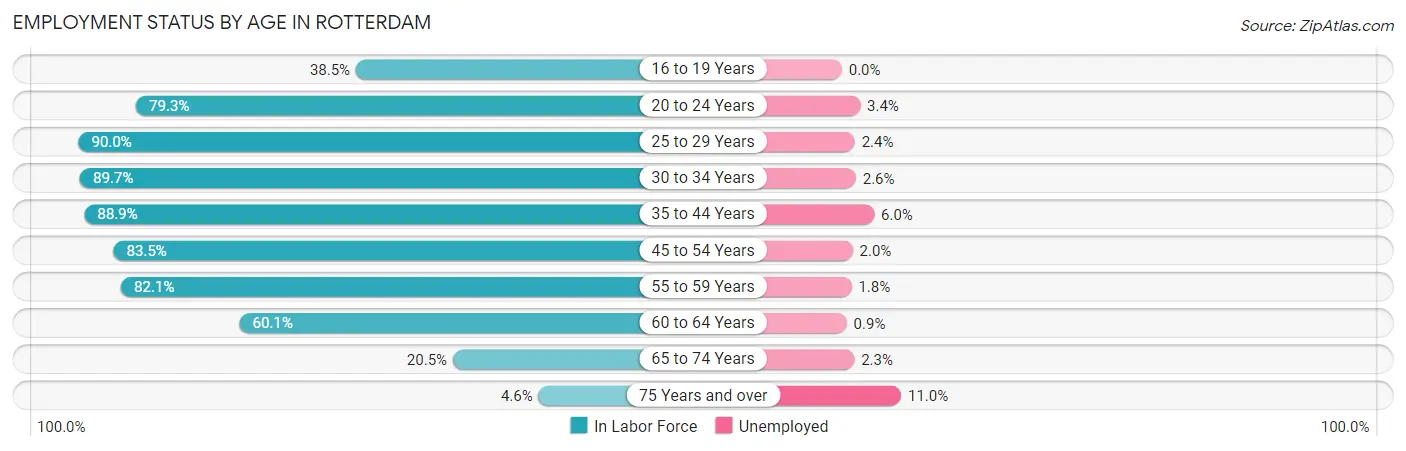
| Age Bracket | In Labor Force | Unemployed |
| 16 to 19 Years | 396 (38.5%) | 0 (0.0%) |
| 20 to 24 Years | 1,135 (79.3%) | 39 (3.4%) |
| 25 to 29 Years | 1,459 (90.0%) | 35 (2.4%) |
| 30 to 34 Years | 1,451 (89.7%) | 38 (2.6%) |
| 35 to 44 Years | 2,319 (88.9%) | 139 (6.0%) |
| 45 to 54 Years | 2,341 (83.5%) | 47 (2.0%) |
| 55 to 59 Years | 1,333 (82.1%) | 24 (1.8%) |
| 60 to 64 Years | 1,048 (60.1%) | 9 (0.9%) |
| 65 to 74 Years | 516 (20.5%) | 12 (2.3%) |
| 75 Years and over | 73 (4.6%) | 8 (11.0%) |
| Total | 12,064 (64.9%) | 350 (2.9%) |
Employment Status by Educational Attainment in Rotterdam
According to labor force statistics for Rotterdam, 82.8% of individuals (9,952) out of the total population between 25 and 64 years of age (12,019) are in the labor force, with 2.9% or 289 of them being unemployed. The group with the highest labor force participation rate are those with the educational attainment of bachelor's degree or higher, with 94.4% or 3,650 individuals in the labor force. Within the labor force, individuals with less than high school education have the highest percentage of unemployment, with 15.7% or 36 of them being unemployed.
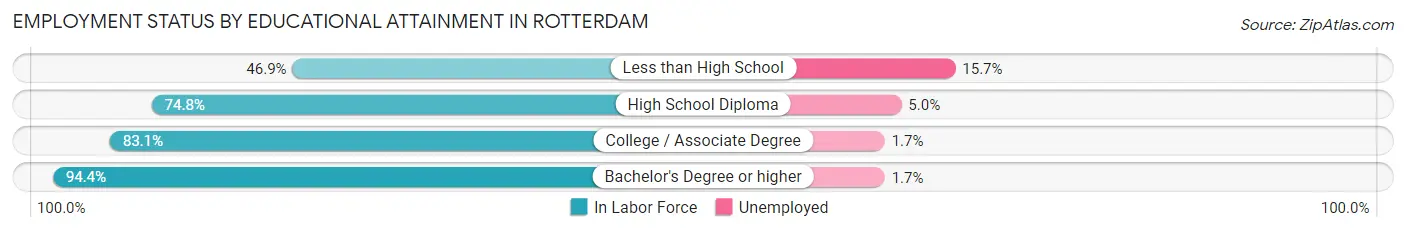
| Educational Attainment | In Labor Force | Unemployed |
| Less than High School | 230 (46.9%) | 77 (15.7%) |
| High School Diploma | 2,662 (74.8%) | 178 (5.0%) |
| College / Associate Degree | 3,410 (83.1%) | 70 (1.7%) |
| Bachelor's Degree or higher | 3,650 (94.4%) | 66 (1.7%) |
| Total | 9,952 (82.8%) | 349 (2.9%) |
Employment Occupations by Sex in Rotterdam
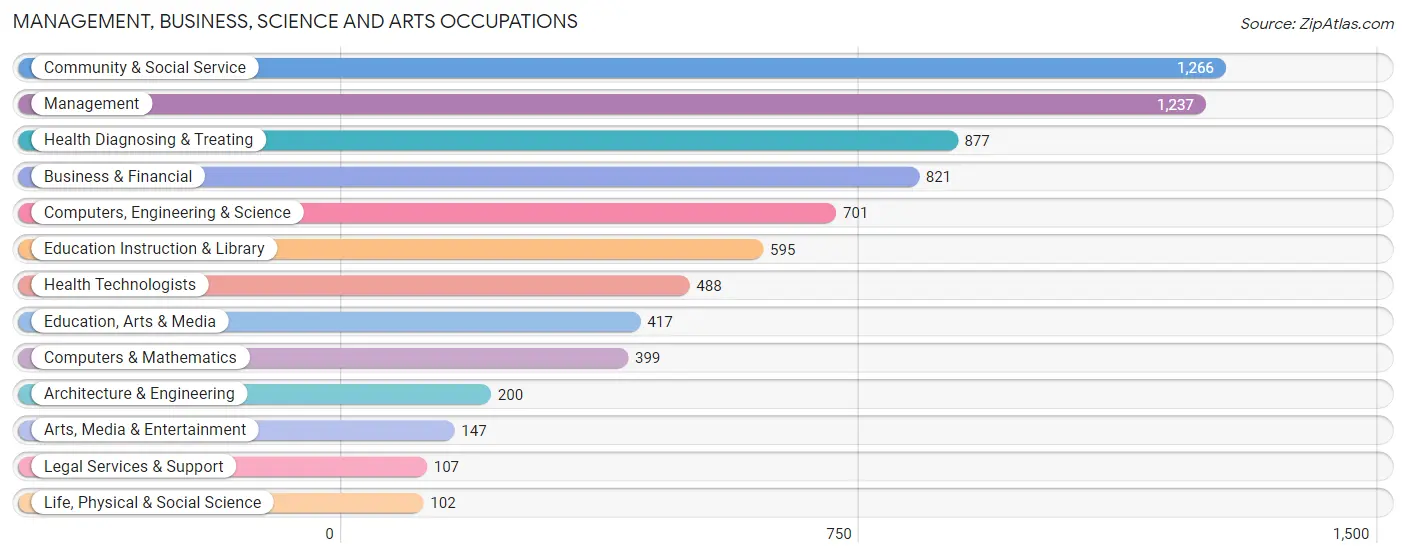
Management, Business, Science and Arts Occupations
The most common Management, Business, Science and Arts occupations in Rotterdam are Community & Social Service (1,266 | 10.8%), Management (1,237 | 10.6%), Health Diagnosing & Treating (877 | 7.5%), Business & Financial (821 | 7.0%), and Computers, Engineering & Science (701 | 6.0%).
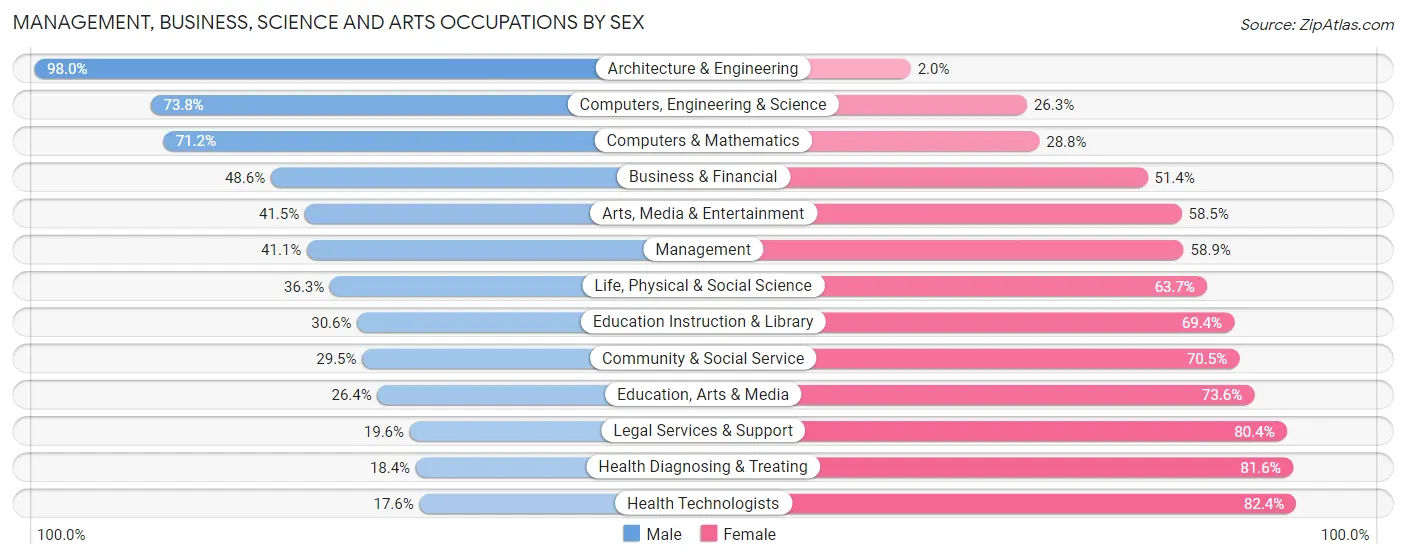
Management, Business, Science and Arts Occupations by Sex
Within the Management, Business, Science and Arts occupations in Rotterdam, the most male-oriented occupations are Architecture & Engineering (98.0%), Computers, Engineering & Science (73.8%), and Computers & Mathematics (71.2%), while the most female-oriented occupations are Health Technologists (82.4%), Health Diagnosing & Treating (81.6%), and Legal Services & Support (80.4%).
| Occupation | Male | Female |
| Management | 508 (41.1%) | 729 (58.9%) |
| Business & Financial | 399 (48.6%) | 422 (51.4%) |
| Computers, Engineering & Science | 517 (73.8%) | 184 (26.3%) |
| Computers & Mathematics | 284 (71.2%) | 115 (28.8%) |
| Architecture & Engineering | 196 (98.0%) | 4 (2.0%) |
| Life, Physical & Social Science | 37 (36.3%) | 65 (63.7%) |
| Community & Social Service | 374 (29.5%) | 892 (70.5%) |
| Education, Arts & Media | 110 (26.4%) | 307 (73.6%) |
| Legal Services & Support | 21 (19.6%) | 86 (80.4%) |
| Education Instruction & Library | 182 (30.6%) | 413 (69.4%) |
| Arts, Media & Entertainment | 61 (41.5%) | 86 (58.5%) |
| Health Diagnosing & Treating | 161 (18.4%) | 716 (81.6%) |
| Health Technologists | 86 (17.6%) | 402 (82.4%) |
| Total (Category) | 1,959 (40.0%) | 2,943 (60.0%) |
| Total (Overall) | 5,550 (47.6%) | 6,116 (52.4%) |
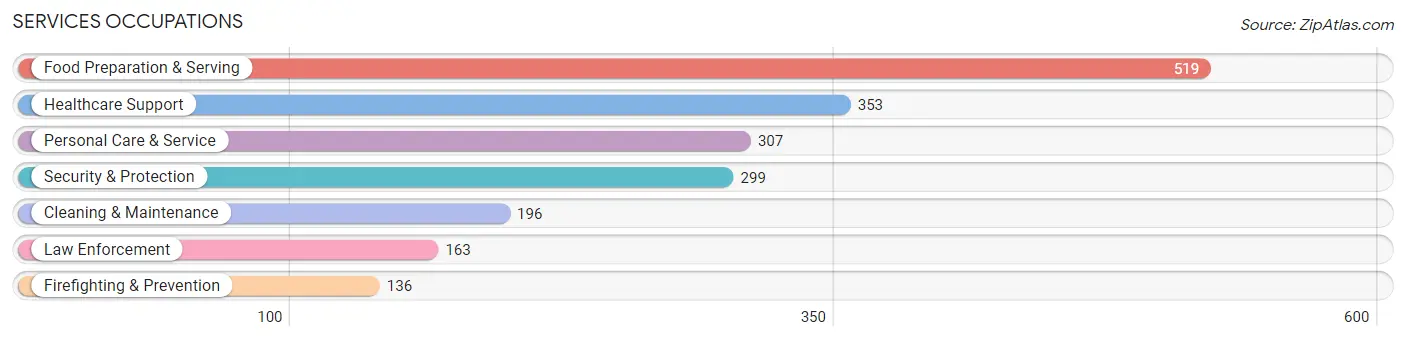
Services Occupations
The most common Services occupations in Rotterdam are Food Preparation & Serving (519 | 4.4%), Healthcare Support (353 | 3.0%), Personal Care & Service (307 | 2.6%), Security & Protection (299 | 2.6%), and Cleaning & Maintenance (196 | 1.7%).
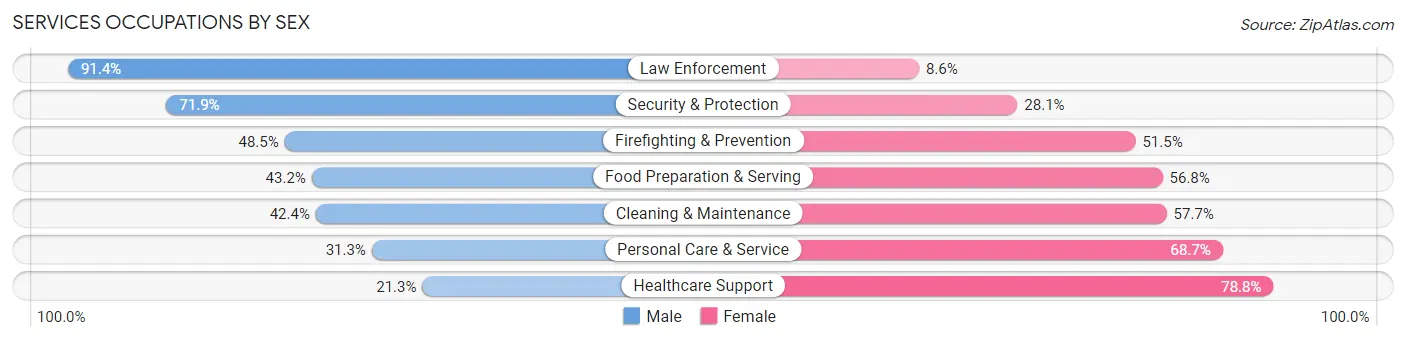
Services Occupations by Sex
Within the Services occupations in Rotterdam, the most male-oriented occupations are Law Enforcement (91.4%), Security & Protection (71.9%), and Firefighting & Prevention (48.5%), while the most female-oriented occupations are Healthcare Support (78.7%), Personal Care & Service (68.7%), and Cleaning & Maintenance (57.7%).
| Occupation | Male | Female |
| Healthcare Support | 75 (21.2%) | 278 (78.7%) |
| Security & Protection | 215 (71.9%) | 84 (28.1%) |
| Firefighting & Prevention | 66 (48.5%) | 70 (51.5%) |
| Law Enforcement | 149 (91.4%) | 14 (8.6%) |
| Food Preparation & Serving | 224 (43.2%) | 295 (56.8%) |
| Cleaning & Maintenance | 83 (42.3%) | 113 (57.7%) |
| Personal Care & Service | 96 (31.3%) | 211 (68.7%) |
| Total (Category) | 693 (41.4%) | 981 (58.6%) |
| Total (Overall) | 5,550 (47.6%) | 6,116 (52.4%) |
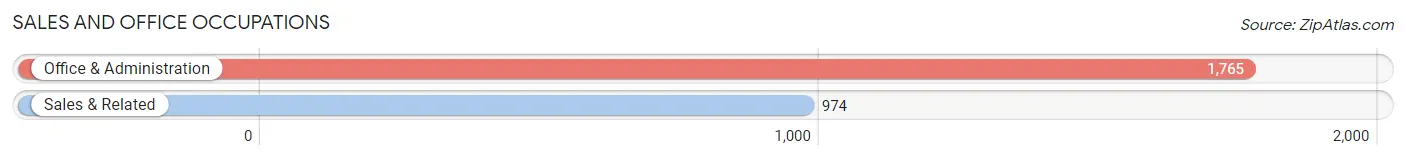
Sales and Office Occupations
The most common Sales and Office occupations in Rotterdam are Office & Administration (1,765 | 15.1%), and Sales & Related (974 | 8.4%).
Sales and Office Occupations by Sex
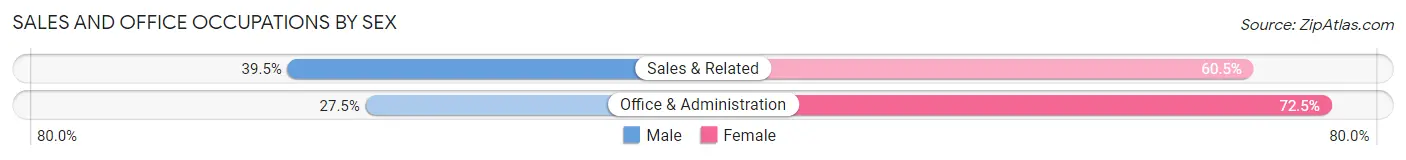
| Occupation | Male | Female |
| Sales & Related | 385 (39.5%) | 589 (60.5%) |
| Office & Administration | 486 (27.5%) | 1,279 (72.5%) |
| Total (Category) | 871 (31.8%) | 1,868 (68.2%) |
| Total (Overall) | 5,550 (47.6%) | 6,116 (52.4%) |
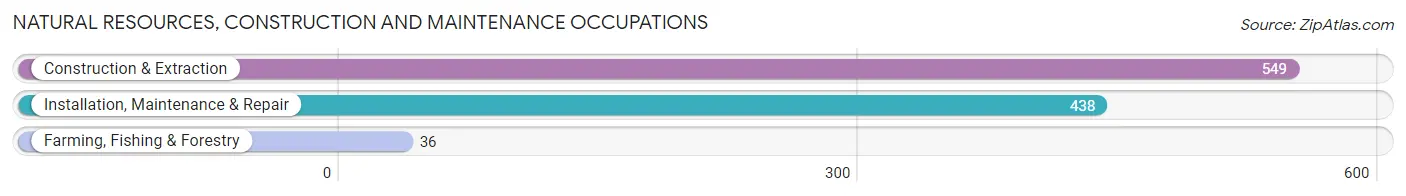
Natural Resources, Construction and Maintenance Occupations
The most common Natural Resources, Construction and Maintenance occupations in Rotterdam are Construction & Extraction (549 | 4.7%), Installation, Maintenance & Repair (438 | 3.7%), and Farming, Fishing & Forestry (36 | 0.3%).
Natural Resources, Construction and Maintenance Occupations by Sex
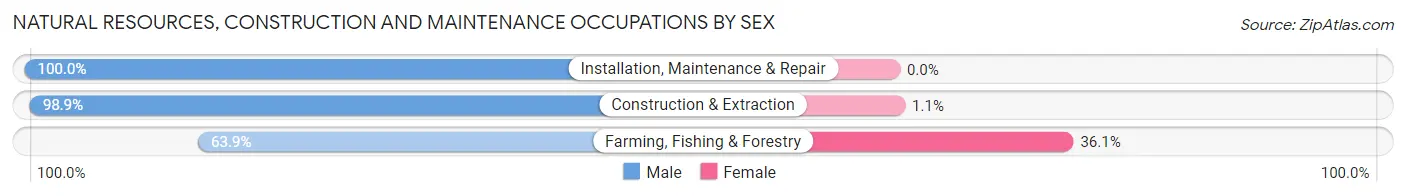
| Occupation | Male | Female |
| Farming, Fishing & Forestry | 23 (63.9%) | 13 (36.1%) |
| Construction & Extraction | 543 (98.9%) | 6 (1.1%) |
| Installation, Maintenance & Repair | 438 (100.0%) | 0 (0.0%) |
| Total (Category) | 1,004 (98.1%) | 19 (1.9%) |
| Total (Overall) | 5,550 (47.6%) | 6,116 (52.4%) |
Production, Transportation and Moving Occupations
The most common Production, Transportation and Moving occupations in Rotterdam are Transportation (483 | 4.1%), Production (433 | 3.7%), and Material Moving (412 | 3.5%).
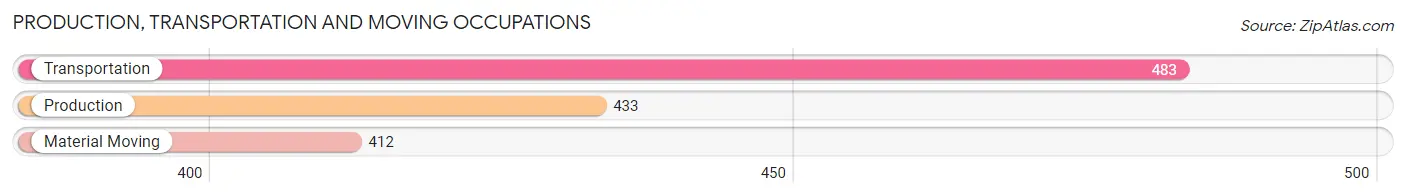
Production, Transportation and Moving Occupations by Sex
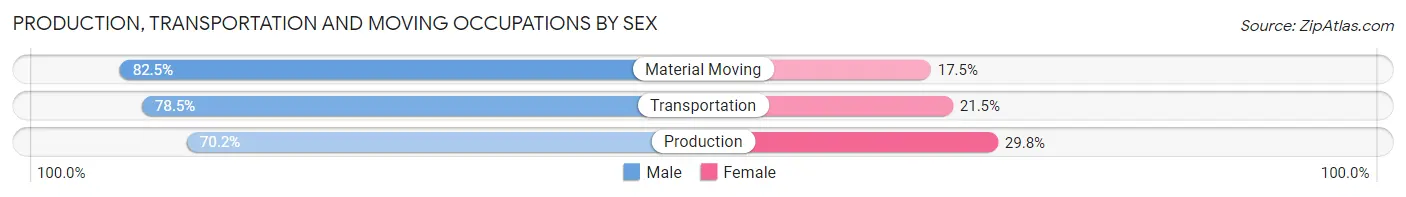
| Occupation | Male | Female |
| Production | 304 (70.2%) | 129 (29.8%) |
| Transportation | 379 (78.5%) | 104 (21.5%) |
| Material Moving | 340 (82.5%) | 72 (17.5%) |
| Total (Category) | 1,023 (77.0%) | 305 (23.0%) |
| Total (Overall) | 5,550 (47.6%) | 6,116 (52.4%) |
Employment Industries by Sex in Rotterdam
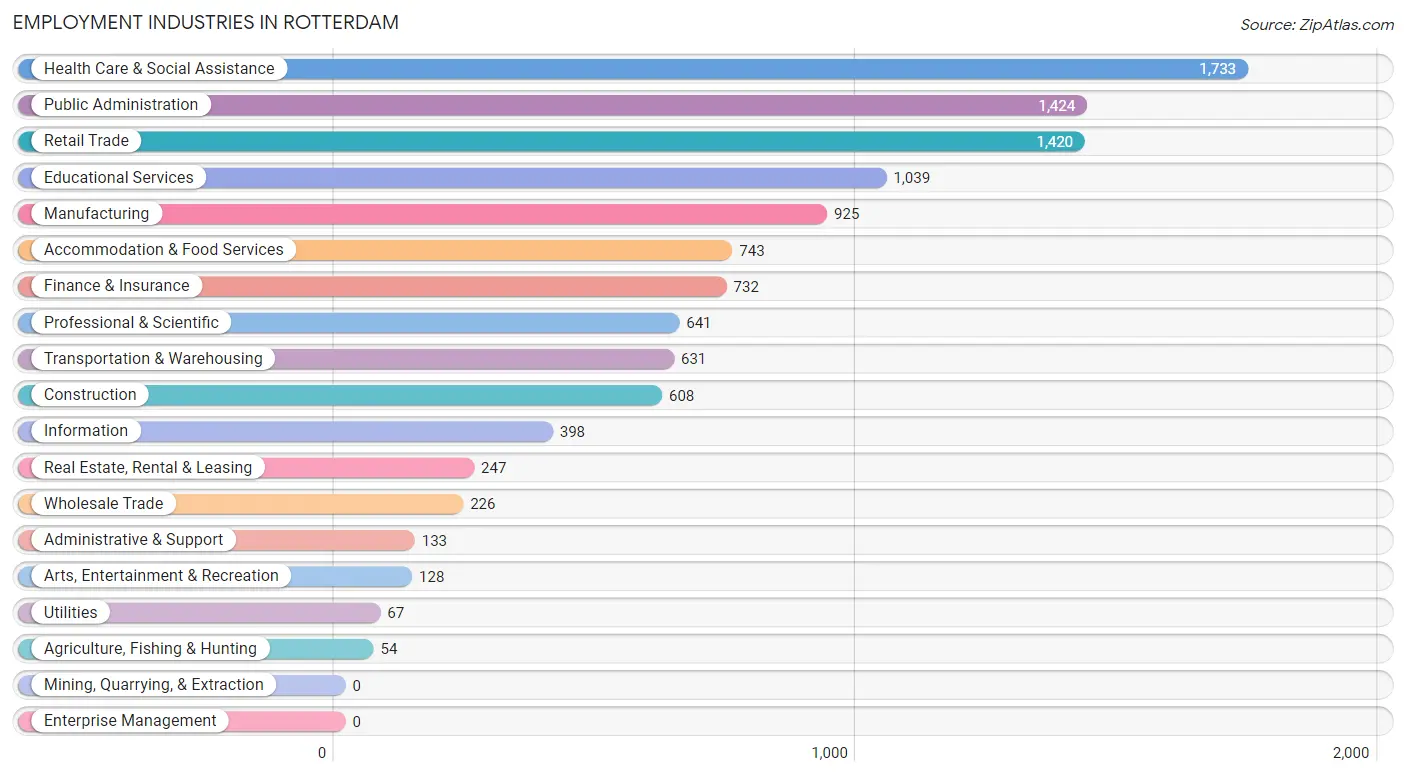
Employment Industries in Rotterdam
The major employment industries in Rotterdam include Health Care & Social Assistance (1,733 | 14.9%), Public Administration (1,424 | 12.2%), Retail Trade (1,420 | 12.2%), Educational Services (1,039 | 8.9%), and Manufacturing (925 | 7.9%).
Employment Industries by Sex in Rotterdam
The Rotterdam industries that see more men than women are Utilities (100.0%), Construction (96.6%), and Agriculture, Fishing & Hunting (75.9%), whereas the industries that tend to have a higher number of women are Health Care & Social Assistance (79.5%), Educational Services (70.6%), and Finance & Insurance (67.8%).
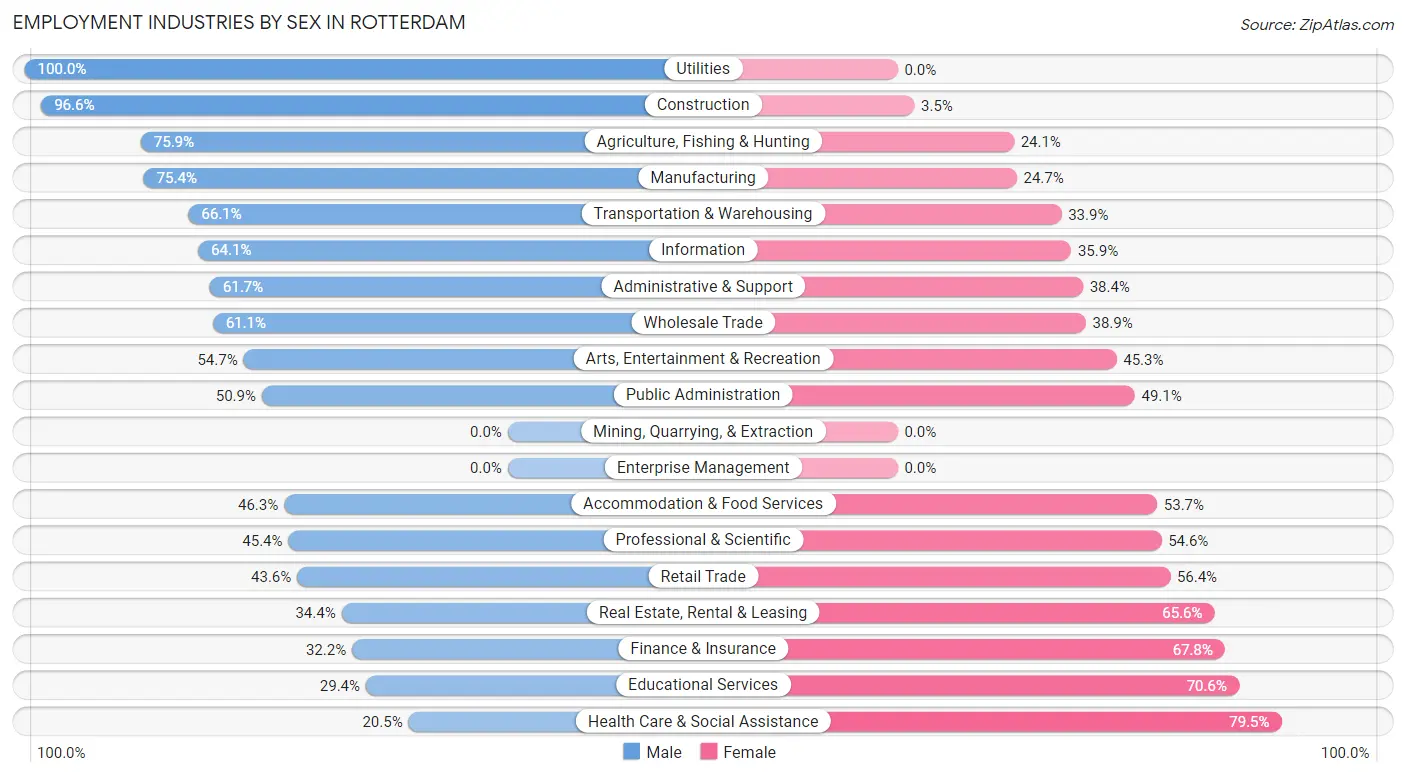
| Industry | Male | Female |
| Agriculture, Fishing & Hunting | 41 (75.9%) | 13 (24.1%) |
| Mining, Quarrying, & Extraction | 0 (0.0%) | 0 (0.0%) |
| Construction | 587 (96.6%) | 21 (3.5%) |
| Manufacturing | 697 (75.3%) | 228 (24.6%) |
| Wholesale Trade | 138 (61.1%) | 88 (38.9%) |
| Retail Trade | 619 (43.6%) | 801 (56.4%) |
| Transportation & Warehousing | 417 (66.1%) | 214 (33.9%) |
| Utilities | 67 (100.0%) | 0 (0.0%) |
| Information | 255 (64.1%) | 143 (35.9%) |
| Finance & Insurance | 236 (32.2%) | 496 (67.8%) |
| Real Estate, Rental & Leasing | 85 (34.4%) | 162 (65.6%) |
| Professional & Scientific | 291 (45.4%) | 350 (54.6%) |
| Enterprise Management | 0 (0.0%) | 0 (0.0%) |
| Administrative & Support | 82 (61.7%) | 51 (38.4%) |
| Educational Services | 305 (29.4%) | 734 (70.6%) |
| Health Care & Social Assistance | 356 (20.5%) | 1,377 (79.5%) |
| Arts, Entertainment & Recreation | 70 (54.7%) | 58 (45.3%) |
| Accommodation & Food Services | 344 (46.3%) | 399 (53.7%) |
| Public Administration | 725 (50.9%) | 699 (49.1%) |
| Total | 5,550 (47.6%) | 6,116 (52.4%) |
Education in Rotterdam
School Enrollment in Rotterdam
The most common levels of schooling among the 4,780 students in Rotterdam are high school (1,192 | 24.9%), middle school (1,156 | 24.2%), and elementary school (955 | 20.0%).
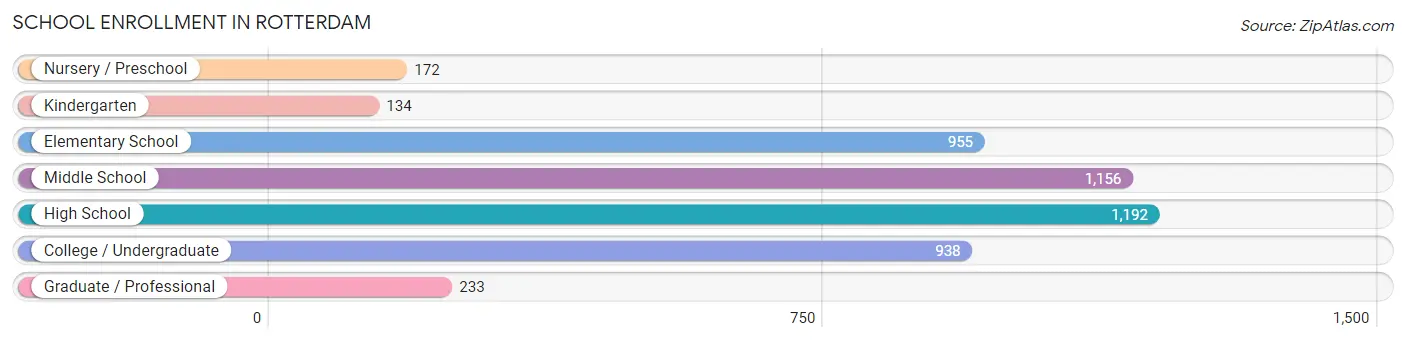
| School Level | # Students | % Students |
| Nursery / Preschool | 172 | 3.6% |
| Kindergarten | 134 | 2.8% |
| Elementary School | 955 | 20.0% |
| Middle School | 1,156 | 24.2% |
| High School | 1,192 | 24.9% |
| College / Undergraduate | 938 | 19.6% |
| Graduate / Professional | 233 | 4.9% |
| Total | 4,780 | 100.0% |
School Enrollment by Age by Funding Source in Rotterdam
Out of a total of 4,780 students who are enrolled in schools in Rotterdam, 674 (14.1%) attend a private institution, while the remaining 4,106 (85.9%) are enrolled in public schools. The age group of 3 to 4 year olds has the highest likelihood of being enrolled in private schools, with 73 (49.7% in the age bracket) enrolled. Conversely, the age group of 15 to 17 year olds has the lowest likelihood of being enrolled in a private school, with 799 (97.6% in the age bracket) attending a public institution.
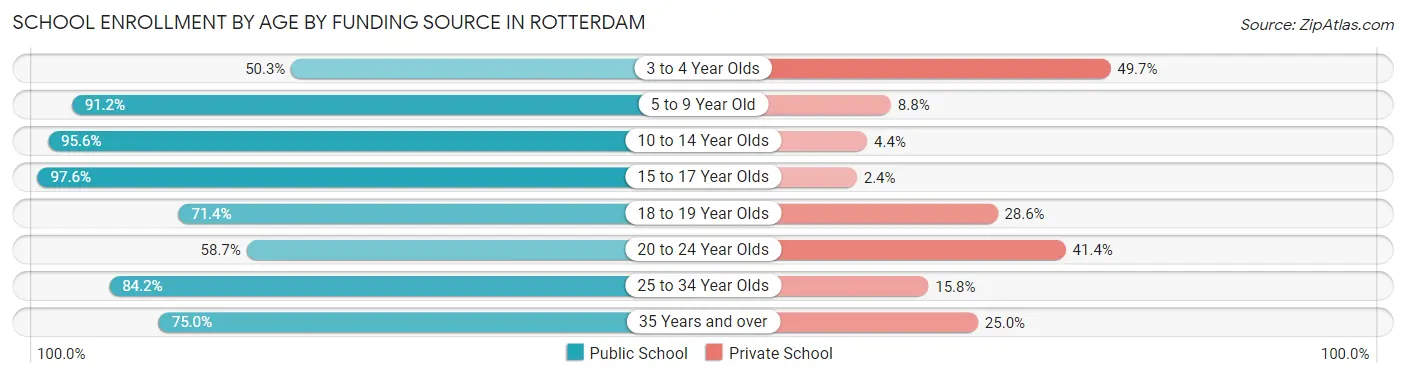
| Age Bracket | Public School | Private School |
| 3 to 4 Year Olds | 74 (50.3%) | 73 (49.7%) |
| 5 to 9 Year Old | 1,005 (91.2%) | 97 (8.8%) |
| 10 to 14 Year Olds | 1,224 (95.6%) | 56 (4.4%) |
| 15 to 17 Year Olds | 799 (97.6%) | 20 (2.4%) |
| 18 to 19 Year Olds | 284 (71.4%) | 114 (28.6%) |
| 20 to 24 Year Olds | 295 (58.7%) | 208 (41.3%) |
| 25 to 34 Year Olds | 235 (84.2%) | 44 (15.8%) |
| 35 Years and over | 189 (75.0%) | 63 (25.0%) |
| Total | 4,106 (85.9%) | 674 (14.1%) |
Educational Attainment by Field of Study in Rotterdam
Business (1,145 | 22.2%), social sciences (664 | 12.9%), education (506 | 9.8%), psychology (382 | 7.4%), and liberal arts & history (355 | 6.9%) are the most common fields of study among 5,158 individuals in Rotterdam who have obtained a bachelor's degree or higher.
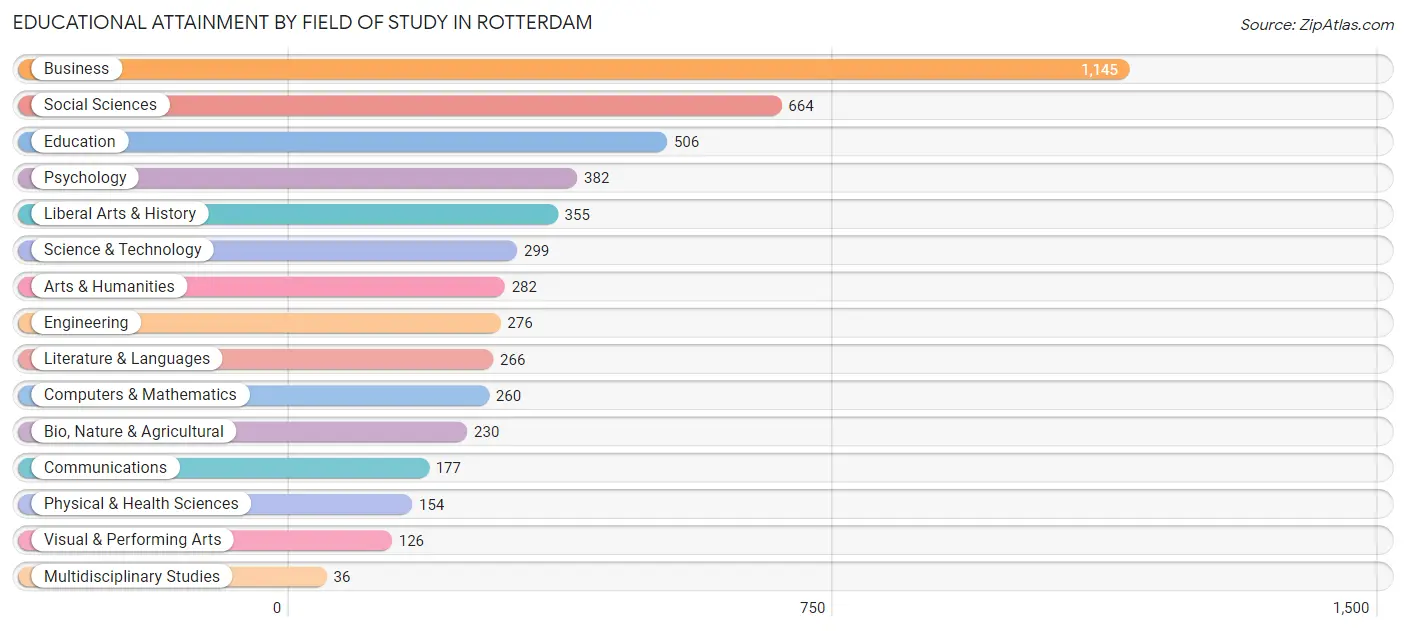
| Field of Study | # Graduates | % Graduates |
| Computers & Mathematics | 260 | 5.0% |
| Bio, Nature & Agricultural | 230 | 4.5% |
| Physical & Health Sciences | 154 | 3.0% |
| Psychology | 382 | 7.4% |
| Social Sciences | 664 | 12.9% |
| Engineering | 276 | 5.3% |
| Multidisciplinary Studies | 36 | 0.7% |
| Science & Technology | 299 | 5.8% |
| Business | 1,145 | 22.2% |
| Education | 506 | 9.8% |
| Literature & Languages | 266 | 5.2% |
| Liberal Arts & History | 355 | 6.9% |
| Visual & Performing Arts | 126 | 2.4% |
| Communications | 177 | 3.4% |
| Arts & Humanities | 282 | 5.5% |
| Total | 5,158 | 100.0% |
Transportation & Commute in Rotterdam
Vehicle Availability by Sex in Rotterdam
The most prevalent vehicle ownership categories in Rotterdam are males with 2 vehicles (2,832, accounting for 51.6%) and females with 2 vehicles (2,458, making up 48.3%).
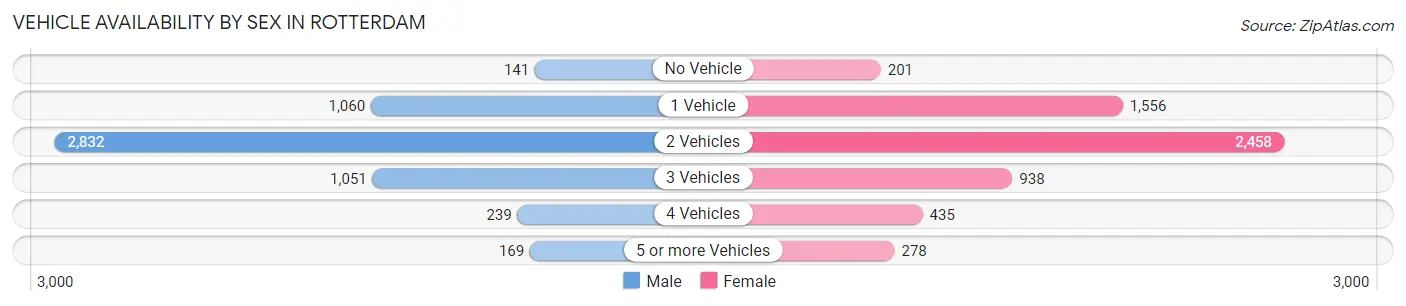
| Vehicles Available | Male | Female |
| No Vehicle | 141 (2.6%) | 201 (3.4%) |
| 1 Vehicle | 1,060 (19.3%) | 1,556 (26.5%) |
| 2 Vehicles | 2,832 (51.6%) | 2,458 (41.9%) |
| 3 Vehicles | 1,051 (19.1%) | 938 (16.0%) |
| 4 Vehicles | 239 (4.3%) | 435 (7.4%) |
| 5 or more Vehicles | 169 (3.1%) | 278 (4.7%) |
| Total | 5,492 (100.0%) | 5,866 (100.0%) |
Commute Time in Rotterdam
The most frequently occuring commute durations in Rotterdam are 20 to 24 minutes (1,729 commuters, 16.9%), 15 to 19 minutes (1,648 commuters, 16.1%), and 30 to 34 minutes (1,554 commuters, 15.2%).
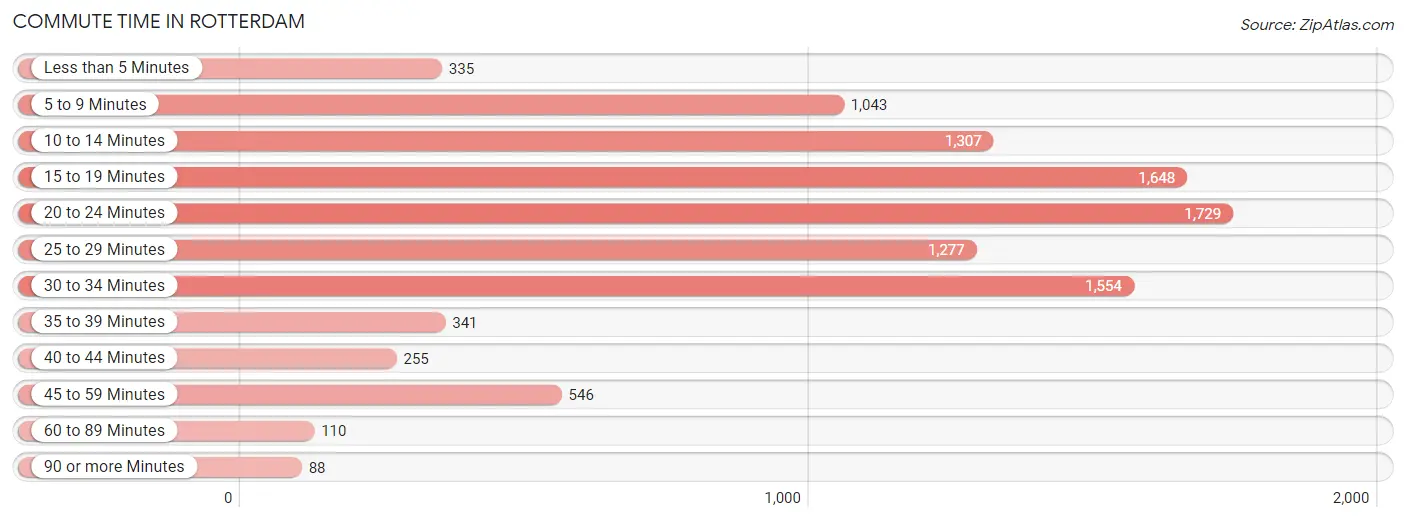
| Commute Time | # Commuters | % Commuters |
| Less than 5 Minutes | 335 | 3.3% |
| 5 to 9 Minutes | 1,043 | 10.2% |
| 10 to 14 Minutes | 1,307 | 12.8% |
| 15 to 19 Minutes | 1,648 | 16.1% |
| 20 to 24 Minutes | 1,729 | 16.9% |
| 25 to 29 Minutes | 1,277 | 12.5% |
| 30 to 34 Minutes | 1,554 | 15.2% |
| 35 to 39 Minutes | 341 | 3.3% |
| 40 to 44 Minutes | 255 | 2.5% |
| 45 to 59 Minutes | 546 | 5.3% |
| 60 to 89 Minutes | 110 | 1.1% |
| 90 or more Minutes | 88 | 0.9% |
Commute Time by Sex in Rotterdam
The most common commute times in Rotterdam are 20 to 24 minutes (929 commuters, 18.1%) for males and 15 to 19 minutes (961 commuters, 18.8%) for females.
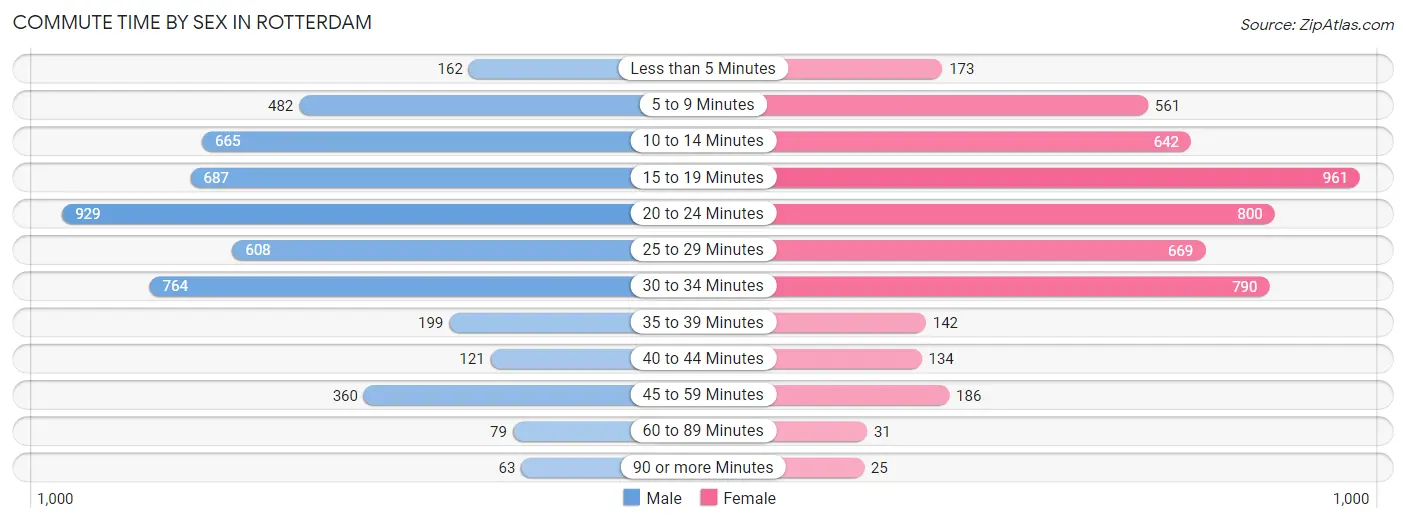
| Commute Time | Male | Female |
| Less than 5 Minutes | 162 (3.2%) | 173 (3.4%) |
| 5 to 9 Minutes | 482 (9.4%) | 561 (11.0%) |
| 10 to 14 Minutes | 665 (13.0%) | 642 (12.6%) |
| 15 to 19 Minutes | 687 (13.4%) | 961 (18.8%) |
| 20 to 24 Minutes | 929 (18.1%) | 800 (15.6%) |
| 25 to 29 Minutes | 608 (11.9%) | 669 (13.1%) |
| 30 to 34 Minutes | 764 (14.9%) | 790 (15.4%) |
| 35 to 39 Minutes | 199 (3.9%) | 142 (2.8%) |
| 40 to 44 Minutes | 121 (2.4%) | 134 (2.6%) |
| 45 to 59 Minutes | 360 (7.0%) | 186 (3.6%) |
| 60 to 89 Minutes | 79 (1.5%) | 31 (0.6%) |
| 90 or more Minutes | 63 (1.2%) | 25 (0.5%) |
Time of Departure to Work by Sex in Rotterdam
The most frequent times of departure to work in Rotterdam are 7:00 AM to 7:29 AM (668, 13.1%) for males and 7:30 AM to 7:59 AM (1,147, 22.4%) for females.
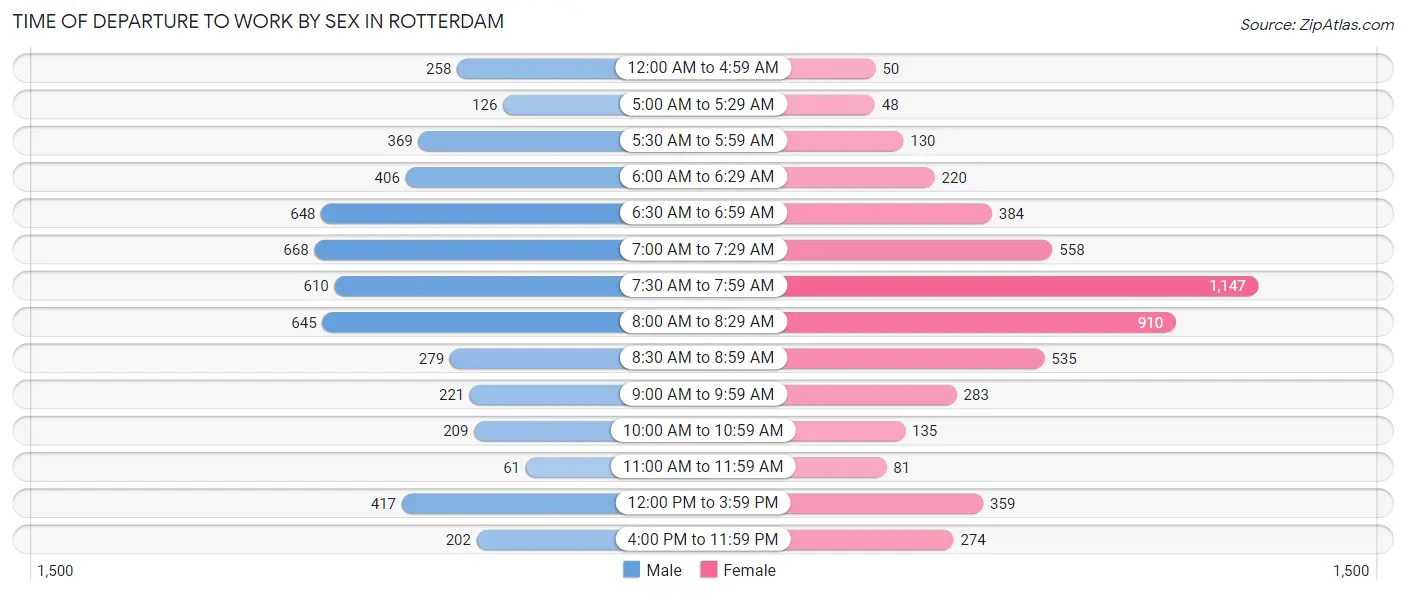
| Time of Departure | Male | Female |
| 12:00 AM to 4:59 AM | 258 (5.0%) | 50 (1.0%) |
| 5:00 AM to 5:29 AM | 126 (2.5%) | 48 (0.9%) |
| 5:30 AM to 5:59 AM | 369 (7.2%) | 130 (2.5%) |
| 6:00 AM to 6:29 AM | 406 (7.9%) | 220 (4.3%) |
| 6:30 AM to 6:59 AM | 648 (12.7%) | 384 (7.5%) |
| 7:00 AM to 7:29 AM | 668 (13.1%) | 558 (10.9%) |
| 7:30 AM to 7:59 AM | 610 (11.9%) | 1,147 (22.4%) |
| 8:00 AM to 8:29 AM | 645 (12.6%) | 910 (17.8%) |
| 8:30 AM to 8:59 AM | 279 (5.4%) | 535 (10.5%) |
| 9:00 AM to 9:59 AM | 221 (4.3%) | 283 (5.5%) |
| 10:00 AM to 10:59 AM | 209 (4.1%) | 135 (2.6%) |
| 11:00 AM to 11:59 AM | 61 (1.2%) | 81 (1.6%) |
| 12:00 PM to 3:59 PM | 417 (8.2%) | 359 (7.0%) |
| 4:00 PM to 11:59 PM | 202 (4.0%) | 274 (5.4%) |
| Total | 5,119 (100.0%) | 5,114 (100.0%) |
Housing Occupancy in Rotterdam
Occupancy by Ownership in Rotterdam
Of the total 9,499 dwellings in Rotterdam, owner-occupied units account for 7,229 (76.1%), while renter-occupied units make up 2,270 (23.9%).
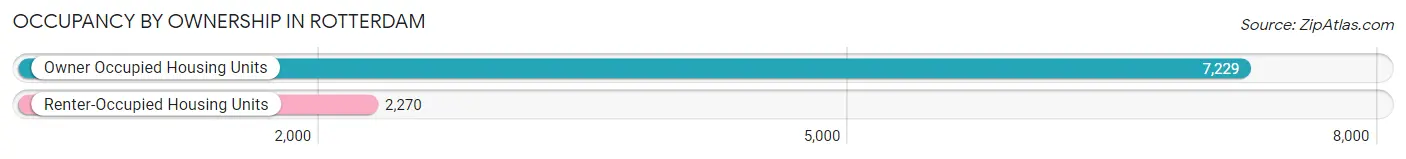
| Occupancy | # Housing Units | % Housing Units |
| Owner Occupied Housing Units | 7,229 | 76.1% |
| Renter-Occupied Housing Units | 2,270 | 23.9% |
| Total Occupied Housing Units | 9,499 | 100.0% |
Occupancy by Household Size in Rotterdam
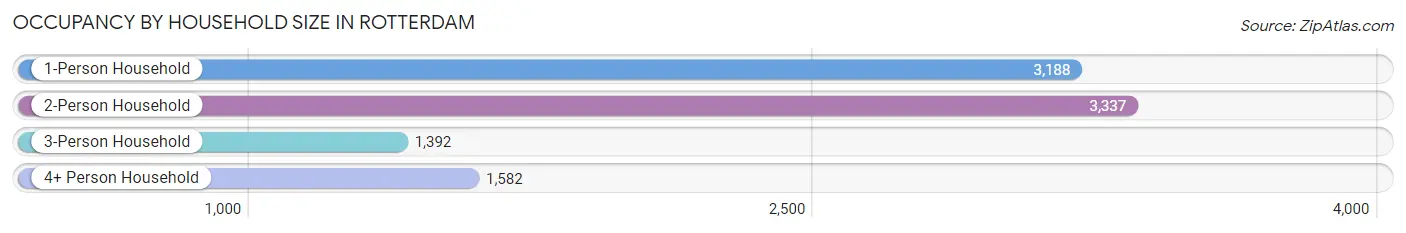
| Household Size | # Housing Units | % Housing Units |
| 1-Person Household | 3,188 | 33.6% |
| 2-Person Household | 3,337 | 35.1% |
| 3-Person Household | 1,392 | 14.6% |
| 4+ Person Household | 1,582 | 16.7% |
| Total Housing Units | 9,499 | 100.0% |
Occupancy by Ownership by Household Size in Rotterdam
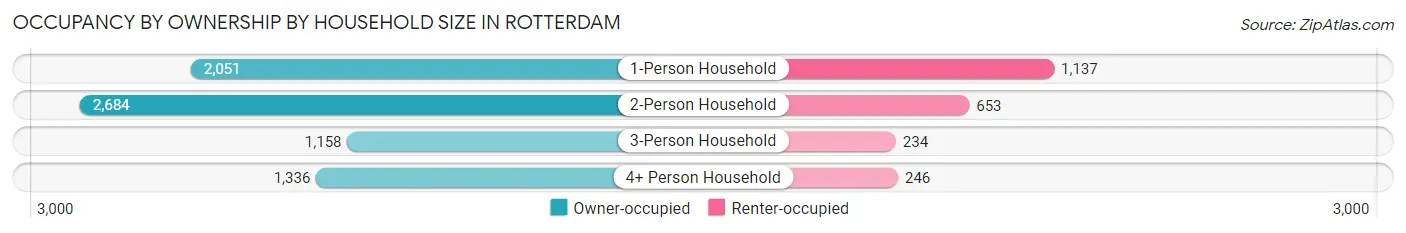
| Household Size | Owner-occupied | Renter-occupied |
| 1-Person Household | 2,051 (64.3%) | 1,137 (35.7%) |
| 2-Person Household | 2,684 (80.4%) | 653 (19.6%) |
| 3-Person Household | 1,158 (83.2%) | 234 (16.8%) |
| 4+ Person Household | 1,336 (84.5%) | 246 (15.5%) |
| Total Housing Units | 7,229 (76.1%) | 2,270 (23.9%) |
Occupancy by Educational Attainment in Rotterdam
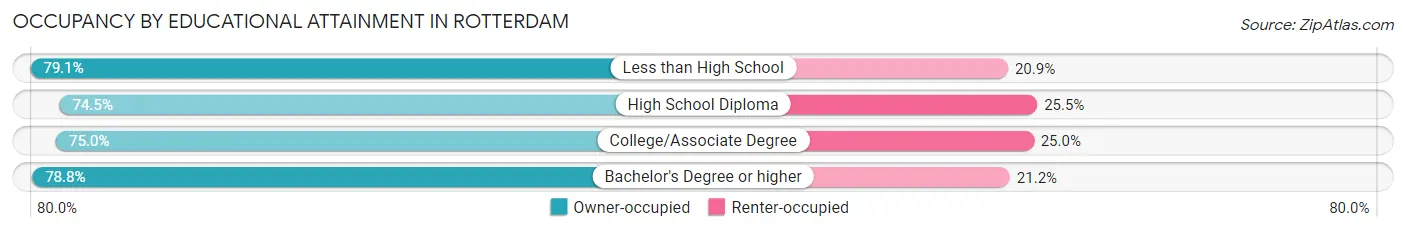
| Household Size | Owner-occupied | Renter-occupied |
| Less than High School | 227 (79.1%) | 60 (20.9%) |
| High School Diploma | 2,114 (74.5%) | 725 (25.5%) |
| College/Associate Degree | 2,648 (75.0%) | 882 (25.0%) |
| Bachelor's Degree or higher | 2,240 (78.8%) | 603 (21.2%) |
Occupancy by Age of Householder in Rotterdam
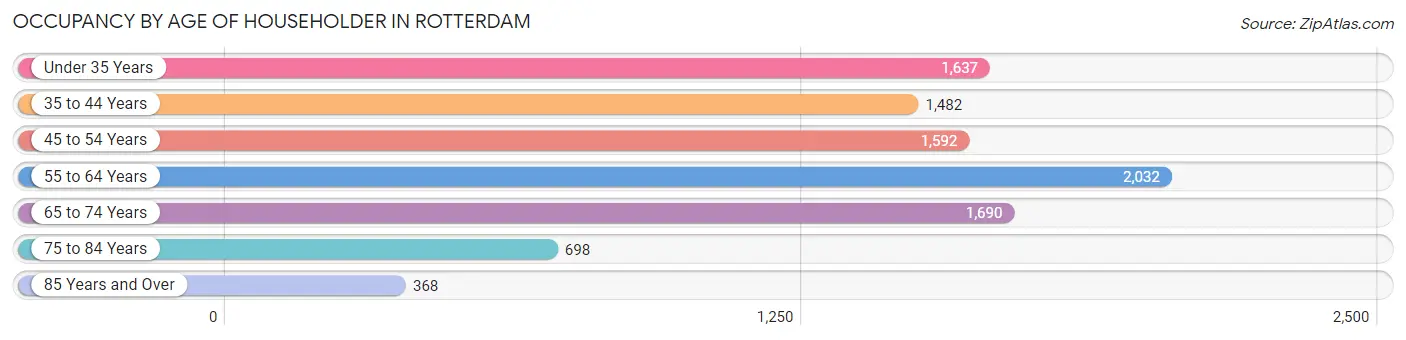
| Age Bracket | # Households | % Households |
| Under 35 Years | 1,637 | 17.2% |
| 35 to 44 Years | 1,482 | 15.6% |
| 45 to 54 Years | 1,592 | 16.8% |
| 55 to 64 Years | 2,032 | 21.4% |
| 65 to 74 Years | 1,690 | 17.8% |
| 75 to 84 Years | 698 | 7.3% |
| 85 Years and Over | 368 | 3.9% |
| Total | 9,499 | 100.0% |
Housing Finances in Rotterdam
Median Income by Occupancy in Rotterdam
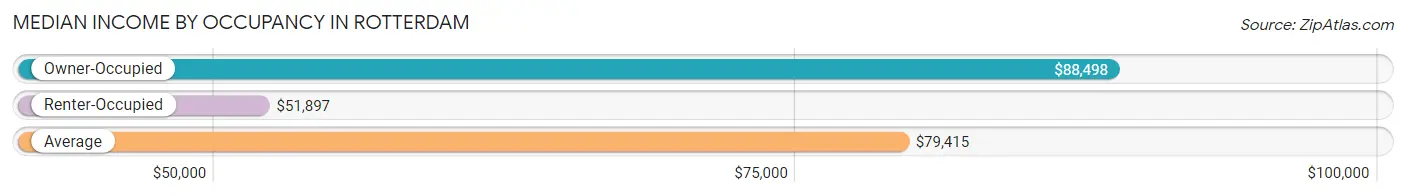
| Occupancy Type | # Households | Median Income |
| Owner-Occupied | 7,229 (76.1%) | $88,498 |
| Renter-Occupied | 2,270 (23.9%) | $51,897 |
| Average | 9,499 (100.0%) | $79,415 |
Occupancy by Householder Income Bracket in Rotterdam
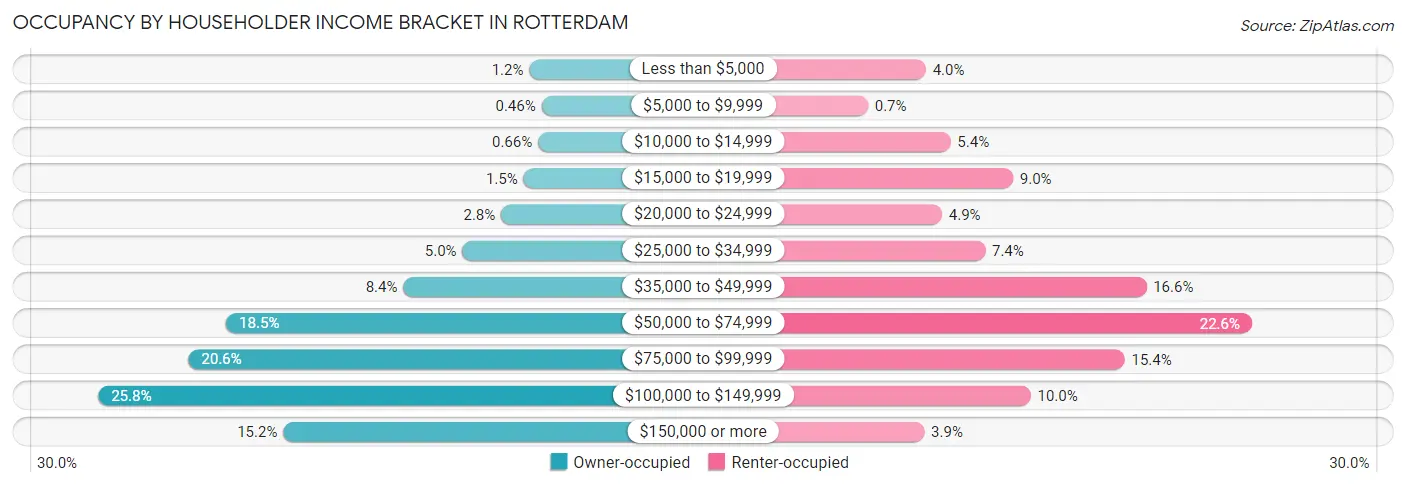
| Income Bracket | Owner-occupied | Renter-occupied |
| Less than $5,000 | 84 (1.2%) | 91 (4.0%) |
| $5,000 to $9,999 | 33 (0.5%) | 16 (0.7%) |
| $10,000 to $14,999 | 48 (0.7%) | 123 (5.4%) |
| $15,000 to $19,999 | 108 (1.5%) | 204 (9.0%) |
| $20,000 to $24,999 | 200 (2.8%) | 112 (4.9%) |
| $25,000 to $34,999 | 360 (5.0%) | 168 (7.4%) |
| $35,000 to $49,999 | 604 (8.4%) | 377 (16.6%) |
| $50,000 to $74,999 | 1,336 (18.5%) | 514 (22.6%) |
| $75,000 to $99,999 | 1,492 (20.6%) | 349 (15.4%) |
| $100,000 to $149,999 | 1,864 (25.8%) | 227 (10.0%) |
| $150,000 or more | 1,100 (15.2%) | 89 (3.9%) |
| Total | 7,229 (100.0%) | 2,270 (100.0%) |
Monthly Housing Cost Tiers in Rotterdam
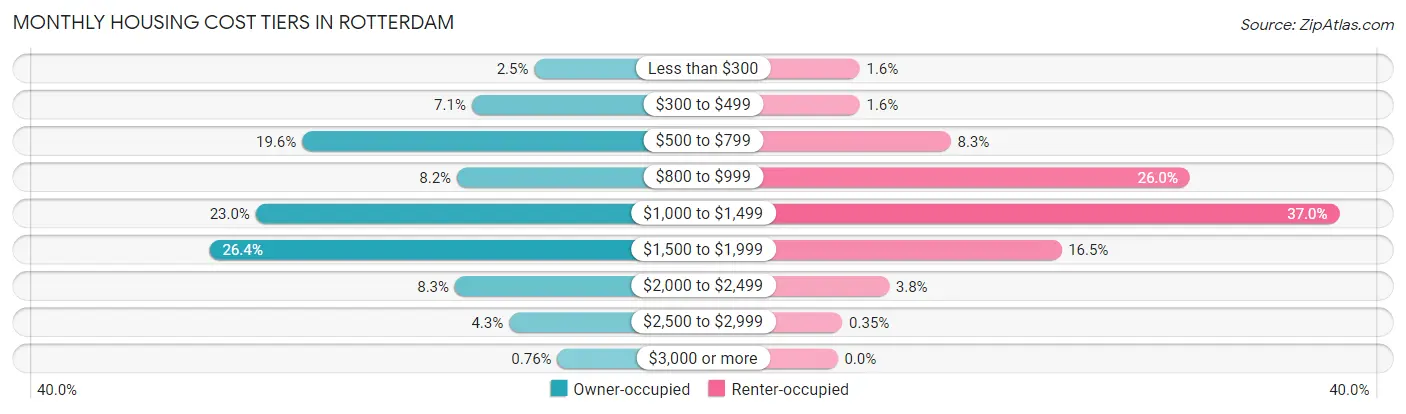
| Monthly Cost | Owner-occupied | Renter-occupied |
| Less than $300 | 178 (2.5%) | 37 (1.6%) |
| $300 to $499 | 511 (7.1%) | 37 (1.6%) |
| $500 to $799 | 1,414 (19.6%) | 189 (8.3%) |
| $800 to $999 | 590 (8.2%) | 589 (26.0%) |
| $1,000 to $1,499 | 1,661 (23.0%) | 839 (37.0%) |
| $1,500 to $1,999 | 1,907 (26.4%) | 374 (16.5%) |
| $2,000 to $2,499 | 601 (8.3%) | 86 (3.8%) |
| $2,500 to $2,999 | 312 (4.3%) | 8 (0.4%) |
| $3,000 or more | 55 (0.8%) | 0 (0.0%) |
| Total | 7,229 (100.0%) | 2,270 (100.0%) |
Physical Housing Characteristics in Rotterdam
Housing Structures in Rotterdam
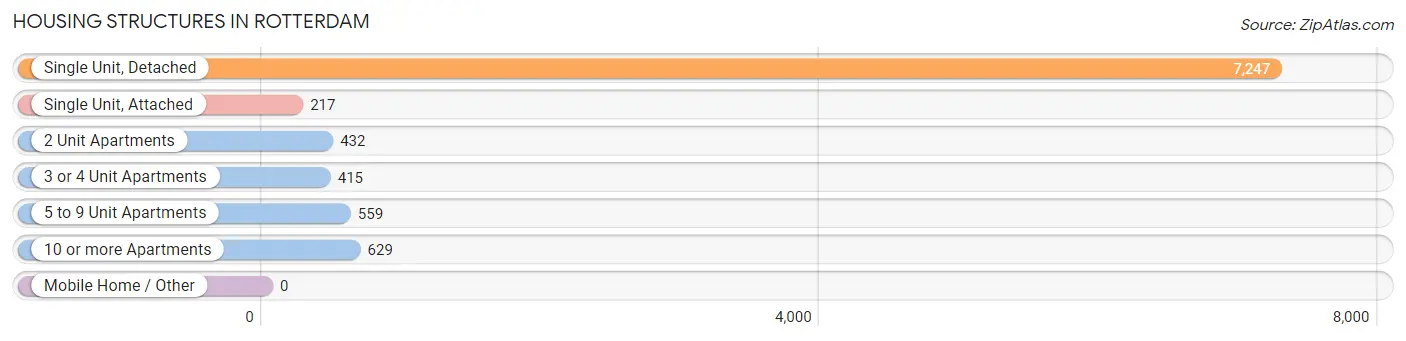
| Structure Type | # Housing Units | % Housing Units |
| Single Unit, Detached | 7,247 | 76.3% |
| Single Unit, Attached | 217 | 2.3% |
| 2 Unit Apartments | 432 | 4.5% |
| 3 or 4 Unit Apartments | 415 | 4.4% |
| 5 to 9 Unit Apartments | 559 | 5.9% |
| 10 or more Apartments | 629 | 6.6% |
| Mobile Home / Other | 0 | 0.0% |
| Total | 9,499 | 100.0% |
Housing Structures by Occupancy in Rotterdam
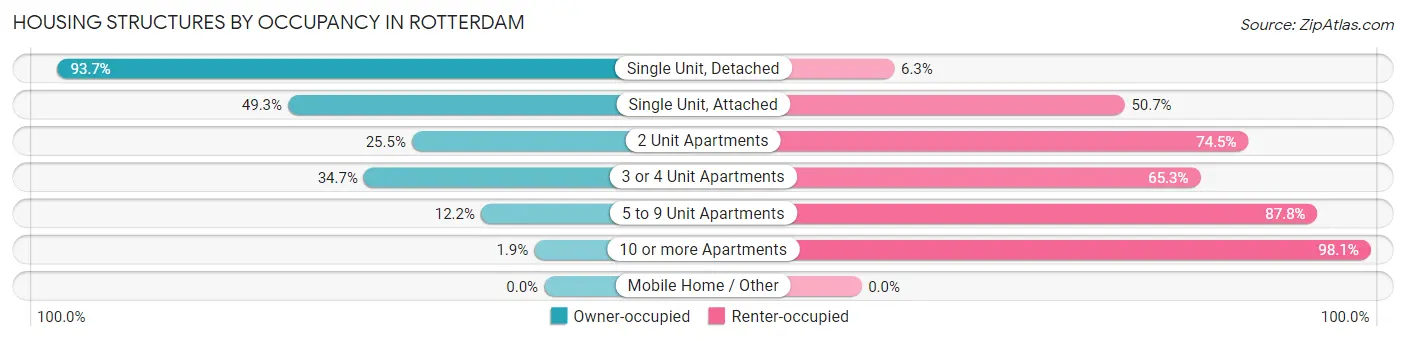
| Structure Type | Owner-occupied | Renter-occupied |
| Single Unit, Detached | 6,788 (93.7%) | 459 (6.3%) |
| Single Unit, Attached | 107 (49.3%) | 110 (50.7%) |
| 2 Unit Apartments | 110 (25.5%) | 322 (74.5%) |
| 3 or 4 Unit Apartments | 144 (34.7%) | 271 (65.3%) |
| 5 to 9 Unit Apartments | 68 (12.2%) | 491 (87.8%) |
| 10 or more Apartments | 12 (1.9%) | 617 (98.1%) |
| Mobile Home / Other | 0 (0.0%) | 0 (0.0%) |
| Total | 7,229 (76.1%) | 2,270 (23.9%) |
Housing Structures by Number of Rooms in Rotterdam
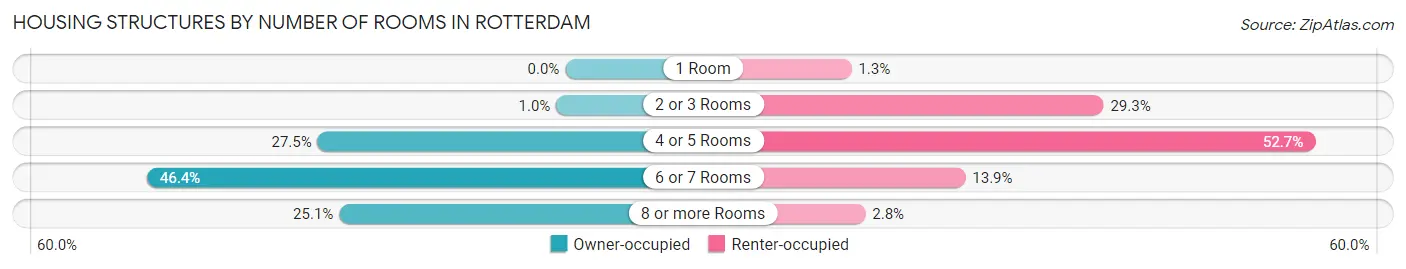
| Number of Rooms | Owner-occupied | Renter-occupied |
| 1 Room | 0 (0.0%) | 29 (1.3%) |
| 2 or 3 Rooms | 72 (1.0%) | 664 (29.2%) |
| 4 or 5 Rooms | 1,987 (27.5%) | 1,197 (52.7%) |
| 6 or 7 Rooms | 3,356 (46.4%) | 316 (13.9%) |
| 8 or more Rooms | 1,814 (25.1%) | 64 (2.8%) |
| Total | 7,229 (100.0%) | 2,270 (100.0%) |
Housing Structure by Heating Type in Rotterdam
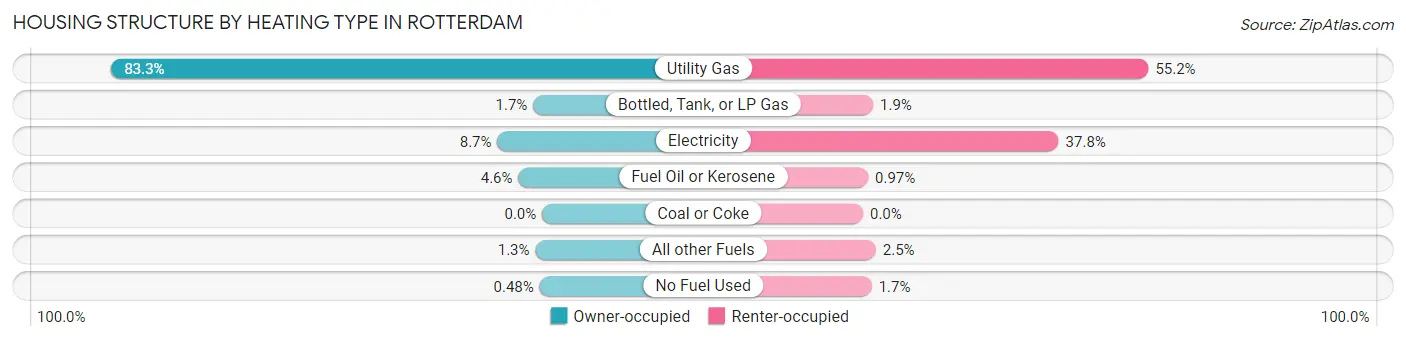
| Heating Type | Owner-occupied | Renter-occupied |
| Utility Gas | 6,019 (83.3%) | 1,252 (55.1%) |
| Bottled, Tank, or LP Gas | 124 (1.7%) | 44 (1.9%) |
| Electricity | 625 (8.6%) | 858 (37.8%) |
| Fuel Oil or Kerosene | 332 (4.6%) | 22 (1.0%) |
| Coal or Coke | 0 (0.0%) | 0 (0.0%) |
| All other Fuels | 94 (1.3%) | 56 (2.5%) |
| No Fuel Used | 35 (0.5%) | 38 (1.7%) |
| Total | 7,229 (100.0%) | 2,270 (100.0%) |
Household Vehicle Usage in Rotterdam
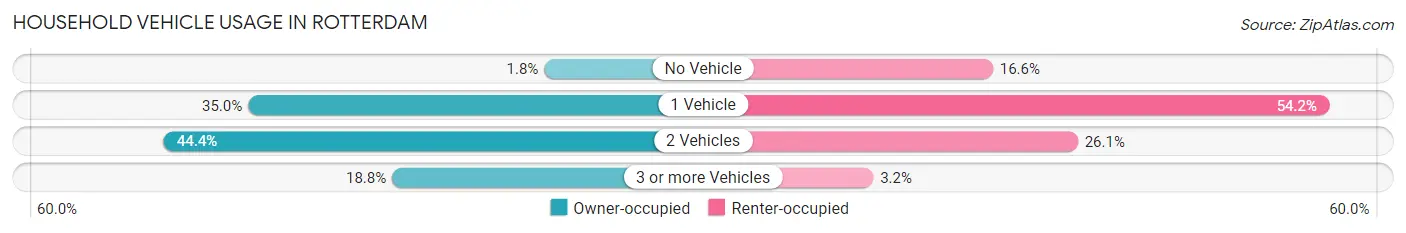
| Vehicles per Household | Owner-occupied | Renter-occupied |
| No Vehicle | 130 (1.8%) | 376 (16.6%) |
| 1 Vehicle | 2,528 (35.0%) | 1,230 (54.2%) |
| 2 Vehicles | 3,209 (44.4%) | 592 (26.1%) |
| 3 or more Vehicles | 1,362 (18.8%) | 72 (3.2%) |
| Total | 7,229 (100.0%) | 2,270 (100.0%) |
Real Estate & Mortgages in Rotterdam
Real Estate and Mortgage Overview in Rotterdam
| Characteristic | Without Mortgage | With Mortgage |
| Housing Units | 2,486 | 4,743 |
| Median Property Value | $190,000 | $190,600 |
| Median Household Income | $68,780 | $916 |
| Monthly Housing Costs | $623 | $47 |
| Real Estate Taxes | $4,063 | $70 |
Property Value by Mortgage Status in Rotterdam
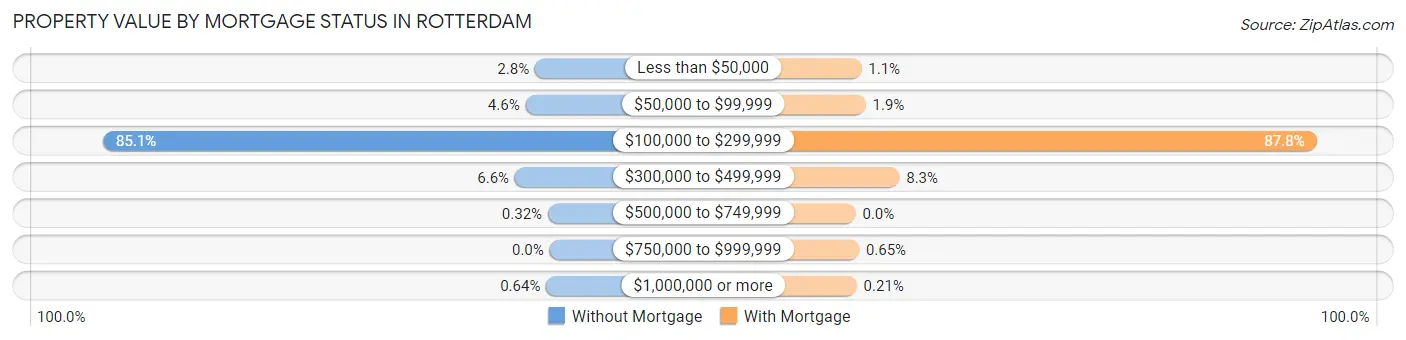
| Property Value | Without Mortgage | With Mortgage |
| Less than $50,000 | 69 (2.8%) | 52 (1.1%) |
| $50,000 to $99,999 | 114 (4.6%) | 91 (1.9%) |
| $100,000 to $299,999 | 2,115 (85.1%) | 4,164 (87.8%) |
| $300,000 to $499,999 | 164 (6.6%) | 395 (8.3%) |
| $500,000 to $749,999 | 8 (0.3%) | 0 (0.0%) |
| $750,000 to $999,999 | 0 (0.0%) | 31 (0.6%) |
| $1,000,000 or more | 16 (0.6%) | 10 (0.2%) |
| Total | 2,486 (100.0%) | 4,743 (100.0%) |
Household Income by Mortgage Status in Rotterdam
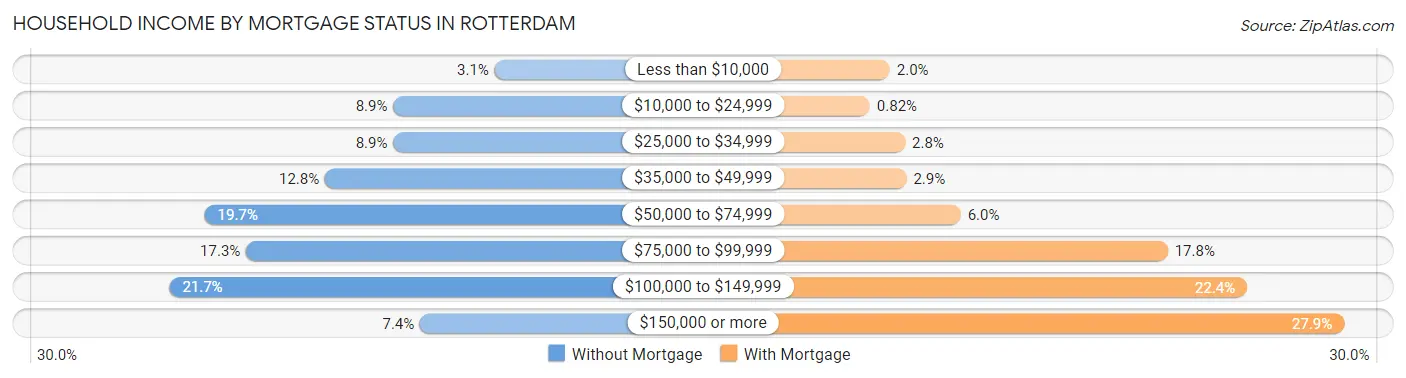
| Household Income | Without Mortgage | With Mortgage |
| Less than $10,000 | 78 (3.1%) | 93 (2.0%) |
| $10,000 to $24,999 | 222 (8.9%) | 39 (0.8%) |
| $25,000 to $34,999 | 222 (8.9%) | 134 (2.8%) |
| $35,000 to $49,999 | 319 (12.8%) | 138 (2.9%) |
| $50,000 to $74,999 | 490 (19.7%) | 285 (6.0%) |
| $75,000 to $99,999 | 431 (17.3%) | 846 (17.8%) |
| $100,000 to $149,999 | 540 (21.7%) | 1,061 (22.4%) |
| $150,000 or more | 184 (7.4%) | 1,324 (27.9%) |
| Total | 2,486 (100.0%) | 4,743 (100.0%) |
Property Value to Household Income Ratio in Rotterdam
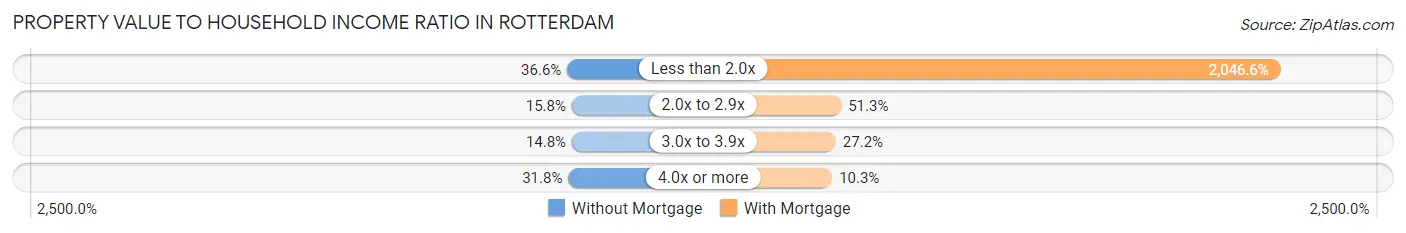
| Value-to-Income Ratio | Without Mortgage | With Mortgage |
| Less than 2.0x | 909 (36.6%) | 97,068 (2,046.5%) |
| 2.0x to 2.9x | 392 (15.8%) | 2,435 (51.3%) |
| 3.0x to 3.9x | 369 (14.8%) | 1,289 (27.2%) |
| 4.0x or more | 791 (31.8%) | 488 (10.3%) |
| Total | 2,486 (100.0%) | 4,743 (100.0%) |
Real Estate Taxes by Mortgage Status in Rotterdam
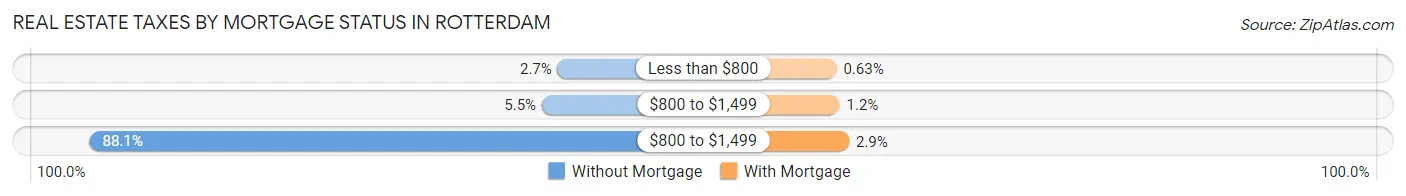
| Property Taxes | Without Mortgage | With Mortgage |
| Less than $800 | 66 (2.6%) | 30 (0.6%) |
| $800 to $1,499 | 137 (5.5%) | 57 (1.2%) |
| $800 to $1,499 | 2,191 (88.1%) | 138 (2.9%) |
| Total | 2,486 (100.0%) | 4,743 (100.0%) |
Health & Disability in Rotterdam
Health Insurance Coverage by Age in Rotterdam
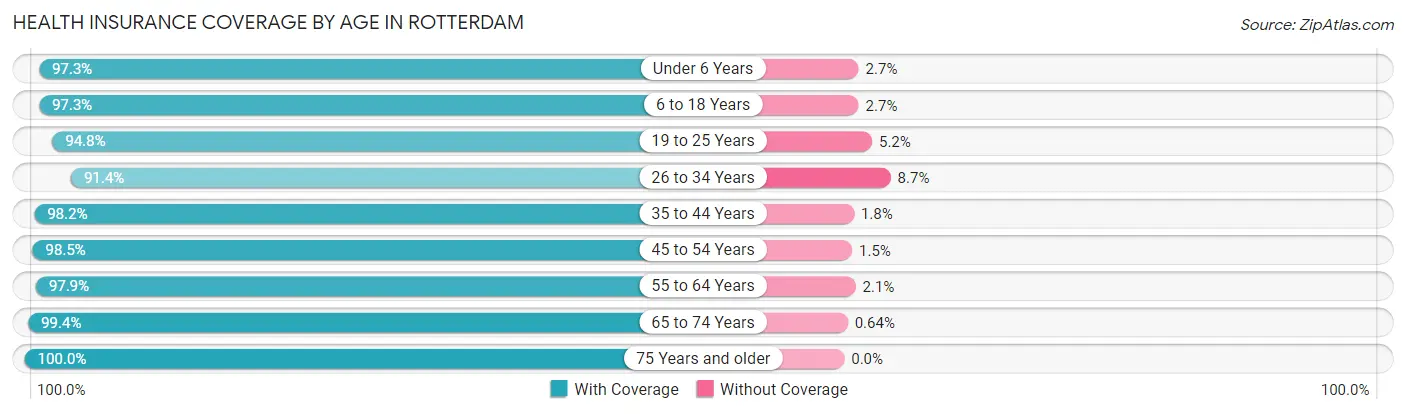
| Age Bracket | With Coverage | Without Coverage |
| Under 6 Years | 1,453 (97.3%) | 40 (2.7%) |
| 6 to 18 Years | 3,381 (97.3%) | 93 (2.7%) |
| 19 to 25 Years | 1,651 (94.8%) | 90 (5.2%) |
| 26 to 34 Years | 2,757 (91.3%) | 261 (8.6%) |
| 35 to 44 Years | 2,561 (98.2%) | 47 (1.8%) |
| 45 to 54 Years | 2,763 (98.5%) | 41 (1.5%) |
| 55 to 64 Years | 3,297 (97.9%) | 71 (2.1%) |
| 65 to 74 Years | 2,502 (99.4%) | 16 (0.6%) |
| 75 Years and older | 1,592 (100.0%) | 0 (0.0%) |
| Total | 21,957 (97.1%) | 659 (2.9%) |
Health Insurance Coverage by Citizenship Status in Rotterdam
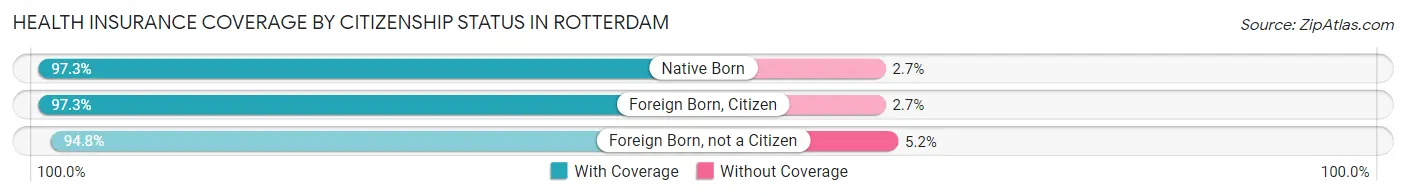
| Citizenship Status | With Coverage | Without Coverage |
| Native Born | 1,453 (97.3%) | 40 (2.7%) |
| Foreign Born, Citizen | 3,381 (97.3%) | 93 (2.7%) |
| Foreign Born, not a Citizen | 1,651 (94.8%) | 90 (5.2%) |
Health Insurance Coverage by Household Income in Rotterdam
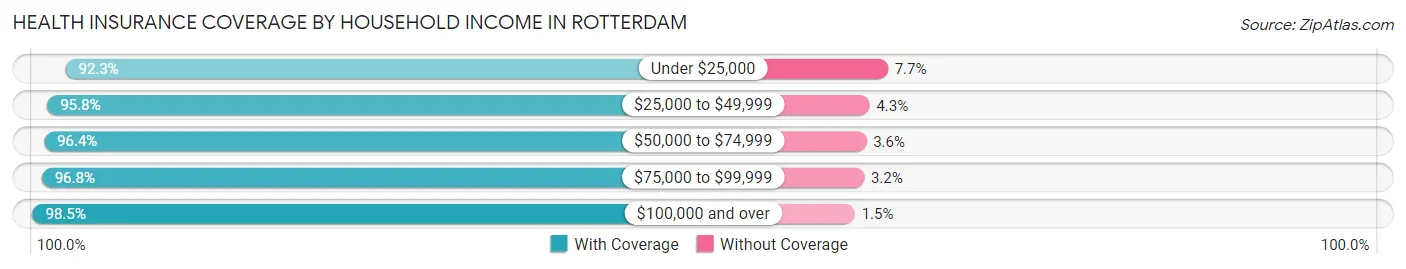
| Household Income | With Coverage | Without Coverage |
| Under $25,000 | 1,434 (92.3%) | 119 (7.7%) |
| $25,000 to $49,999 | 2,432 (95.8%) | 108 (4.3%) |
| $50,000 to $74,999 | 3,505 (96.4%) | 132 (3.6%) |
| $75,000 to $99,999 | 4,426 (96.8%) | 147 (3.2%) |
| $100,000 and over | 10,112 (98.5%) | 152 (1.5%) |
Public vs Private Health Insurance Coverage by Age in Rotterdam
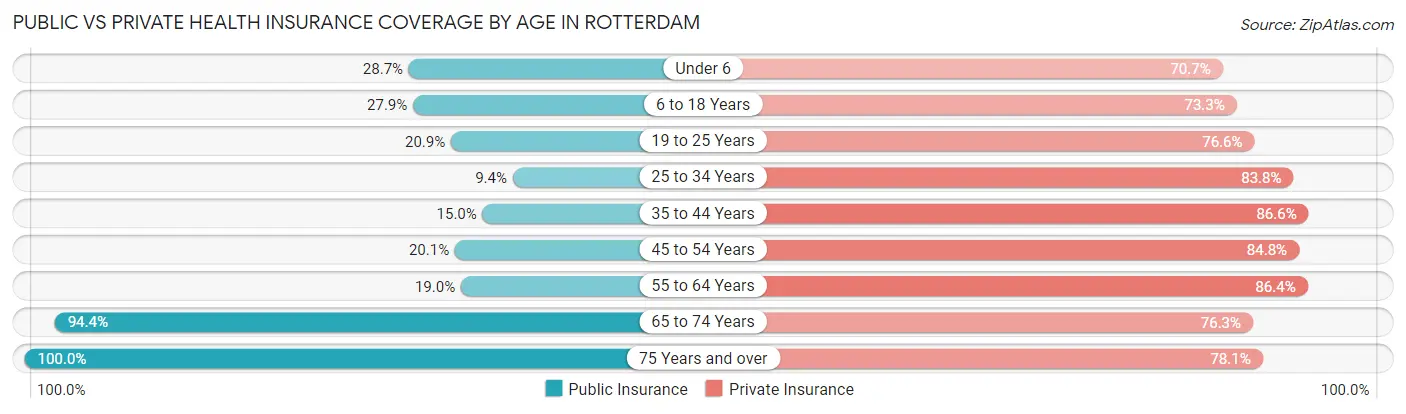
| Age Bracket | Public Insurance | Private Insurance |
| Under 6 | 428 (28.7%) | 1,055 (70.7%) |
| 6 to 18 Years | 969 (27.9%) | 2,545 (73.3%) |
| 19 to 25 Years | 363 (20.8%) | 1,333 (76.6%) |
| 25 to 34 Years | 283 (9.4%) | 2,529 (83.8%) |
| 35 to 44 Years | 391 (15.0%) | 2,259 (86.6%) |
| 45 to 54 Years | 564 (20.1%) | 2,379 (84.8%) |
| 55 to 64 Years | 640 (19.0%) | 2,911 (86.4%) |
| 65 to 74 Years | 2,377 (94.4%) | 1,921 (76.3%) |
| 75 Years and over | 1,592 (100.0%) | 1,243 (78.1%) |
| Total | 7,607 (33.6%) | 18,175 (80.4%) |
Disability Status by Sex by Age in Rotterdam
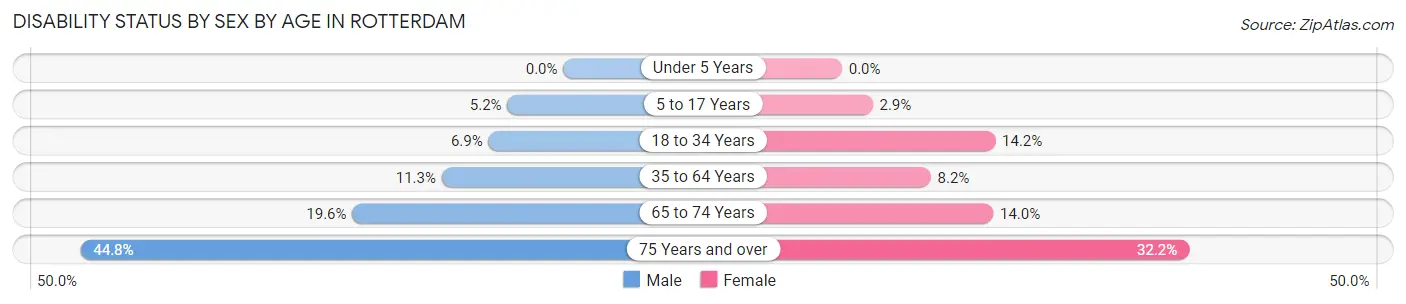
| Age Bracket | Male | Female |
| Under 5 Years | 0 (0.0%) | 0 (0.0%) |
| 5 to 17 Years | 92 (5.2%) | 44 (2.9%) |
| 18 to 34 Years | 161 (6.9%) | 391 (14.2%) |
| 35 to 64 Years | 454 (11.3%) | 392 (8.2%) |
| 65 to 74 Years | 249 (19.6%) | 175 (14.0%) |
| 75 Years and over | 281 (44.8%) | 311 (32.2%) |
Disability Class by Sex by Age in Rotterdam
Disability Class: Hearing Difficulty
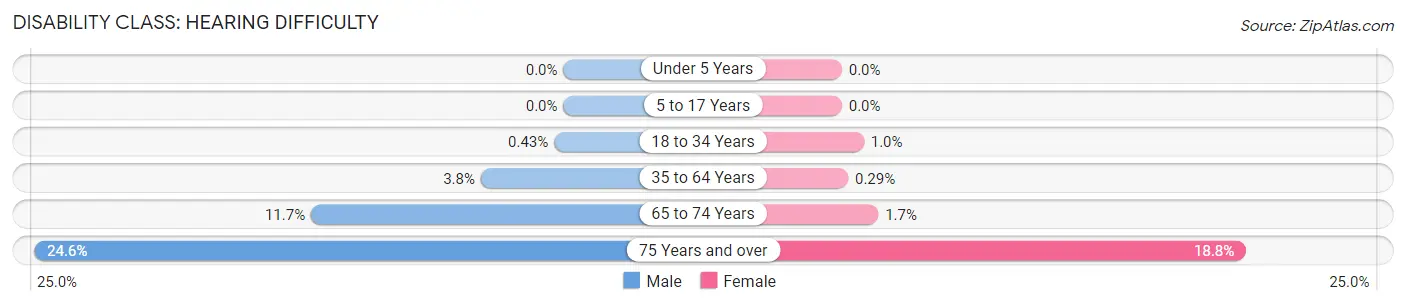
| Age Bracket | Male | Female |
| Under 5 Years | 0 (0.0%) | 0 (0.0%) |
| 5 to 17 Years | 0 (0.0%) | 0 (0.0%) |
| 18 to 34 Years | 10 (0.4%) | 28 (1.0%) |
| 35 to 64 Years | 154 (3.8%) | 14 (0.3%) |
| 65 to 74 Years | 149 (11.7%) | 21 (1.7%) |
| 75 Years and over | 154 (24.6%) | 181 (18.8%) |
Disability Class: Vision Difficulty
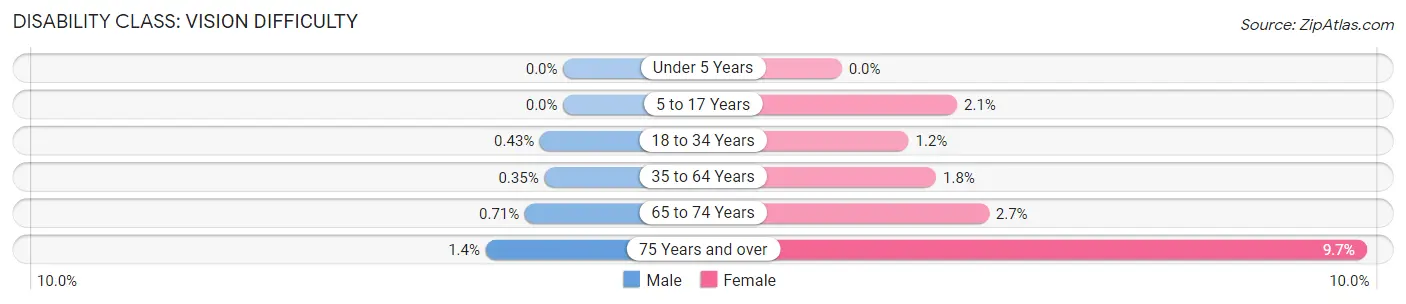
| Age Bracket | Male | Female |
| Under 5 Years | 0 (0.0%) | 0 (0.0%) |
| 5 to 17 Years | 0 (0.0%) | 33 (2.1%) |
| 18 to 34 Years | 10 (0.4%) | 34 (1.2%) |
| 35 to 64 Years | 14 (0.4%) | 83 (1.8%) |
| 65 to 74 Years | 9 (0.7%) | 34 (2.7%) |
| 75 Years and over | 9 (1.4%) | 94 (9.7%) |
Disability Class: Cognitive Difficulty
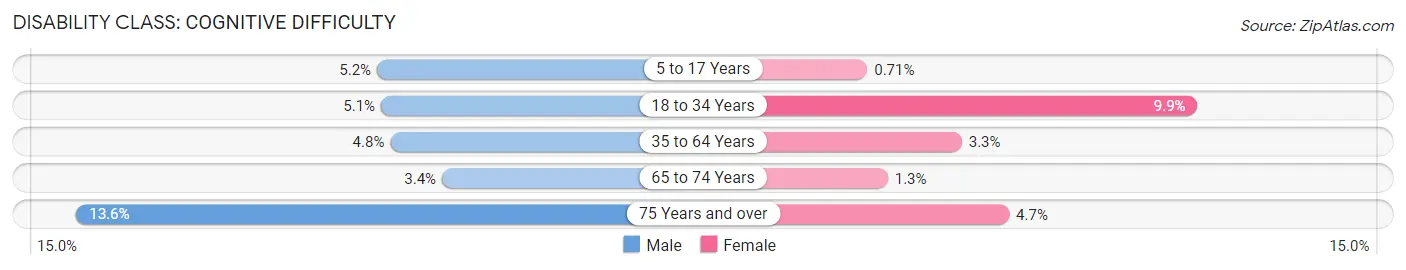
| Age Bracket | Male | Female |
| 5 to 17 Years | 92 (5.2%) | 11 (0.7%) |
| 18 to 34 Years | 118 (5.1%) | 272 (9.9%) |
| 35 to 64 Years | 194 (4.8%) | 159 (3.3%) |
| 65 to 74 Years | 43 (3.4%) | 16 (1.3%) |
| 75 Years and over | 85 (13.6%) | 45 (4.7%) |
Disability Class: Ambulatory Difficulty
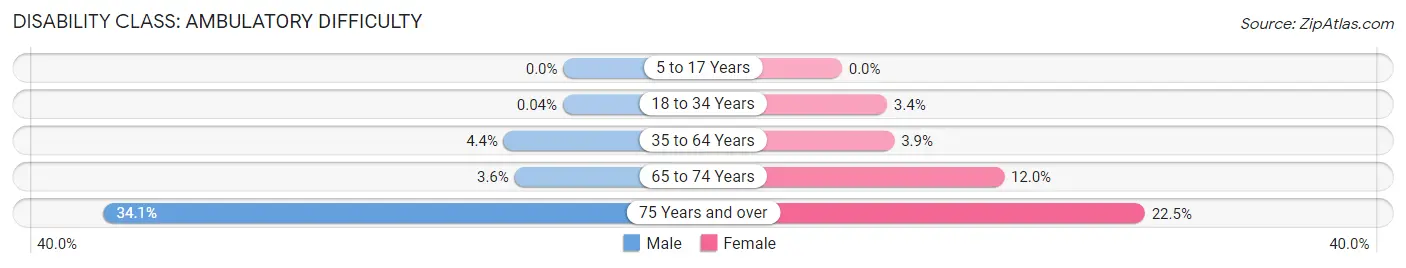
| Age Bracket | Male | Female |
| 5 to 17 Years | 0 (0.0%) | 0 (0.0%) |
| 18 to 34 Years | 1 (0.0%) | 92 (3.4%) |
| 35 to 64 Years | 178 (4.4%) | 185 (3.9%) |
| 65 to 74 Years | 46 (3.6%) | 150 (12.0%) |
| 75 Years and over | 214 (34.1%) | 217 (22.5%) |
Disability Class: Self-Care Difficulty
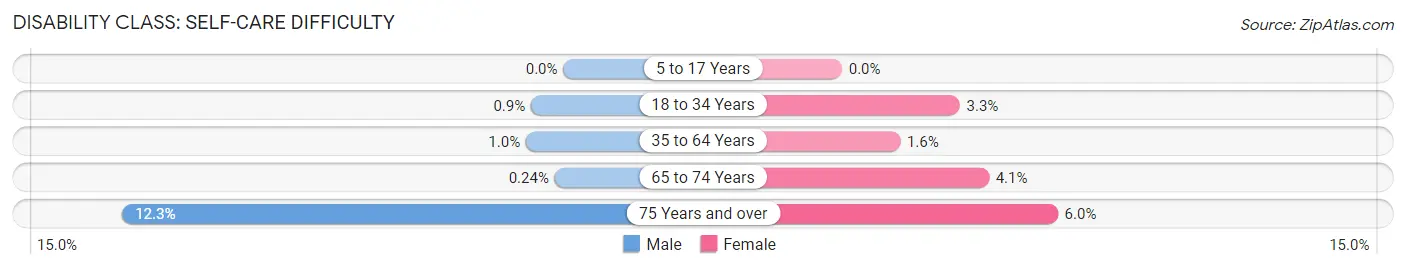
| Age Bracket | Male | Female |
| 5 to 17 Years | 0 (0.0%) | 0 (0.0%) |
| 18 to 34 Years | 21 (0.9%) | 90 (3.3%) |
| 35 to 64 Years | 42 (1.0%) | 77 (1.6%) |
| 65 to 74 Years | 3 (0.2%) | 51 (4.1%) |
| 75 Years and over | 77 (12.3%) | 58 (6.0%) |
Technology Access in Rotterdam
Computing Device Access in Rotterdam
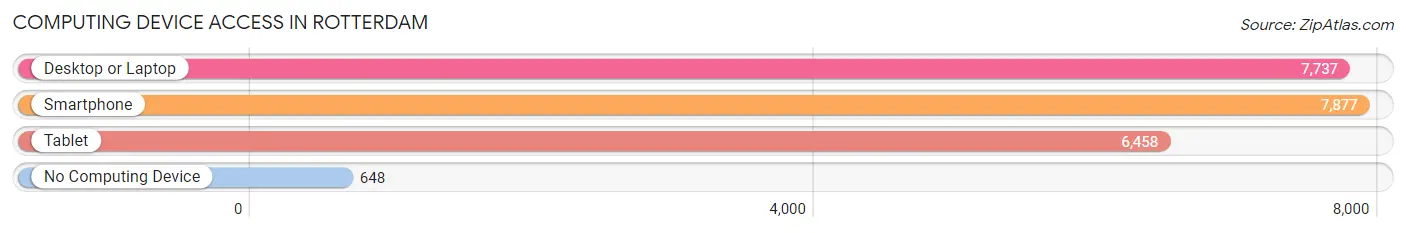
| Device Type | # Households | % Households |
| Desktop or Laptop | 7,737 | 81.5% |
| Smartphone | 7,877 | 82.9% |
| Tablet | 6,458 | 68.0% |
| No Computing Device | 648 | 6.8% |
| Total | 9,499 | 100.0% |
Internet Access in Rotterdam
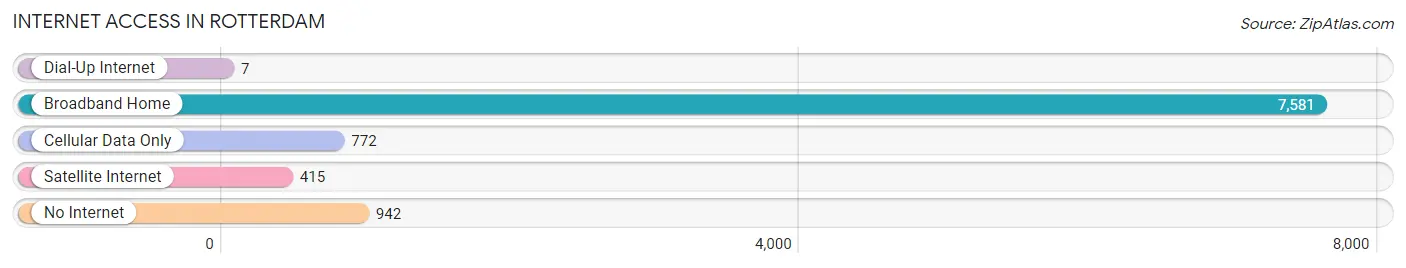
| Internet Type | # Households | % Households |
| Dial-Up Internet | 7 | 0.1% |
| Broadband Home | 7,581 | 79.8% |
| Cellular Data Only | 772 | 8.1% |
| Satellite Internet | 415 | 4.4% |
| No Internet | 942 | 9.9% |
| Total | 9,499 | 100.0% |
Rotterdam Summary
Rotterdam is a town located in Schenectady County, New York, United States. It is part of the Capital District, which is the metropolitan area surrounding Albany, the state capital. As of the 2010 census, the town had a total population of 29,094.
History
The area that is now Rotterdam was first settled in 1710 by Dutch immigrants. The town was originally part of the Manor of Rensselaerswyck, a large estate owned by the Van Rensselaer family. The town was established in 1788 and was named after the Dutch city of Rotterdam.
In the 19th century, the town was an important center for the production of bricks and tile. The town was also home to several large farms, which produced a variety of crops, including apples, potatoes, and hay.
Geography
Rotterdam is located in the eastern part of Schenectady County, in the Capital District of New York. It is bordered by the towns of Princetown to the north, Niskayuna to the east, and Glenville to the south. The Mohawk River forms the western boundary of the town.
The town has a total area of 24.2 square miles, of which 23.9 square miles is land and 0.3 square miles is water. The highest point in the town is the summit of the Helderberg Escarpment, which rises to an elevation of 1,400 feet above sea level.
Economy
Rotterdam is home to several large employers, including General Electric, Price Chopper, and St. Clare's Hospital. The town is also home to several smaller businesses, including restaurants, retail stores, and professional services.
The town is served by the Schenectady County Airport, which is located just outside the town limits. The airport provides general aviation services, as well as air cargo and charter services.
Demographics
As of the 2010 census, there were 29,094 people, 11,845 households, and 7,945 families residing in the town. The population density was 1,214.3 people per square mile. There were 12,541 housing units at an average density of 522.7 per square mile.
The racial makeup of the town was 94.2% White, 1.7% African American, 0.3% Native American, 1.7% Asian, 0.1% Pacific Islander, 0.7% from other races, and 1.3% from two or more races. Hispanic or Latino of any race were 3.2% of the population.
The median income for a household in the town was $60,945, and the median income for a family was $71,945. Males had a median income of $50,945 versus $37,945 for females. The per capita income for the town was $27,945. About 3.2% of families and 4.7% of the population were below the poverty line, including 5.3% of those under age 18 and 4.2% of those age 65 or over.
Common Questions
What is Per Capita Income in Rotterdam?
Per Capita income in Rotterdam is $37,951.
What is the Median Family Income in Rotterdam?
Median Family Income in Rotterdam is $97,828.
What is the Median Household income in Rotterdam?
Median Household Income in Rotterdam is $79,415.
What is Income or Wage Gap in Rotterdam?
Income or Wage Gap in Rotterdam is 24.8%.
Women in Rotterdam earn 75.2 cents for every dollar earned by a man.
What is Family Income Deficit in Rotterdam?
Family Income Deficit in Rotterdam is $16,125.
Families that are below poverty line in Rotterdam earn $16,125 less on average than the poverty threshold level.
What is Inequality or Gini Index in Rotterdam?
Inequality or Gini Index in Rotterdam is 0.35.
What is the Total Population of Rotterdam?
Total Population of Rotterdam is 22,673.
What is the Total Male Population of Rotterdam?
Total Male Population of Rotterdam is 10,752.
What is the Total Female Population of Rotterdam?
Total Female Population of Rotterdam is 11,921.
What is the Ratio of Males per 100 Females in Rotterdam?
There are 90.19 Males per 100 Females in Rotterdam.
What is the Ratio of Females per 100 Males in Rotterdam?
There are 110.87 Females per 100 Males in Rotterdam.
What is the Median Population Age in Rotterdam?
Median Population Age in Rotterdam is 40.7 Years.
What is the Average Family Size in Rotterdam
Average Family Size in Rotterdam is 3.1 People.
What is the Average Household Size in Rotterdam
Average Household Size in Rotterdam is 2.4 People.
How Large is the Labor Force in Rotterdam?
There are 12,064 People in the Labor Forcein in Rotterdam.
What is the Percentage of People in the Labor Force in Rotterdam?
64.9% of People are in the Labor Force in Rotterdam.
What is the Unemployment Rate in Rotterdam?
Unemployment Rate in Rotterdam is 2.9%.