Westvale, NY Map & Demographics
Westvale Map
Westvale Overview
$47,992
PER CAPITA INCOME
$121,250
AVG FAMILY INCOME
$103,646
AVG HOUSEHOLD INCOME
7.7%
WAGE / INCOME GAP [ % ]
92.3¢/ $1
WAGE / INCOME GAP [ $ ]
0.39
INEQUALITY / GINI INDEX
4,933
TOTAL POPULATION
2,541
MALE POPULATION
2,392
FEMALE POPULATION
106.23
MALES / 100 FEMALES
94.14
FEMALES / 100 MALES
42.4
MEDIAN AGE
3.0
AVG FAMILY SIZE
2.5
AVG HOUSEHOLD SIZE
2,463
LABOR FORCE [ PEOPLE ]
64.2%
PERCENT IN LABOR FORCE
1.4%
UNEMPLOYMENT RATE
Income in Westvale
Income Overview in Westvale
Per Capita Income in Westvale is $47,992, while median incomes of families and households are $121,250 and $103,646 respectively.
| Characteristic | Number | Measure |
| Per Capita Income | 4,933 | $47,992 |
| Median Family Income | 1,416 | $121,250 |
| Mean Family Income | 1,416 | $138,729 |
| Median Household Income | 1,955 | $103,646 |
| Mean Household Income | 1,955 | $121,052 |
| Income Deficit | 1,416 | $0 |
| Wage / Income Gap (%) | 4,933 | 7.69% |
| Wage / Income Gap ($) | 4,933 | 92.31¢ per $1 |
| Gini / Inequality Index | 4,933 | 0.39 |
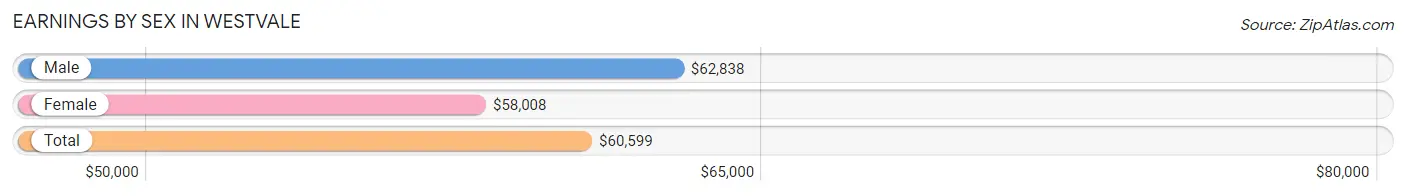
Earnings by Sex in Westvale
Average Earnings in Westvale are $60,599, $62,838 for men and $58,008 for women, a difference of 7.7%.
| Sex | Number | Average Earnings |
| Male | 1,244 (48.7%) | $62,838 |
| Female | 1,311 (51.3%) | $58,008 |
| Total | 2,555 (100.0%) | $60,599 |
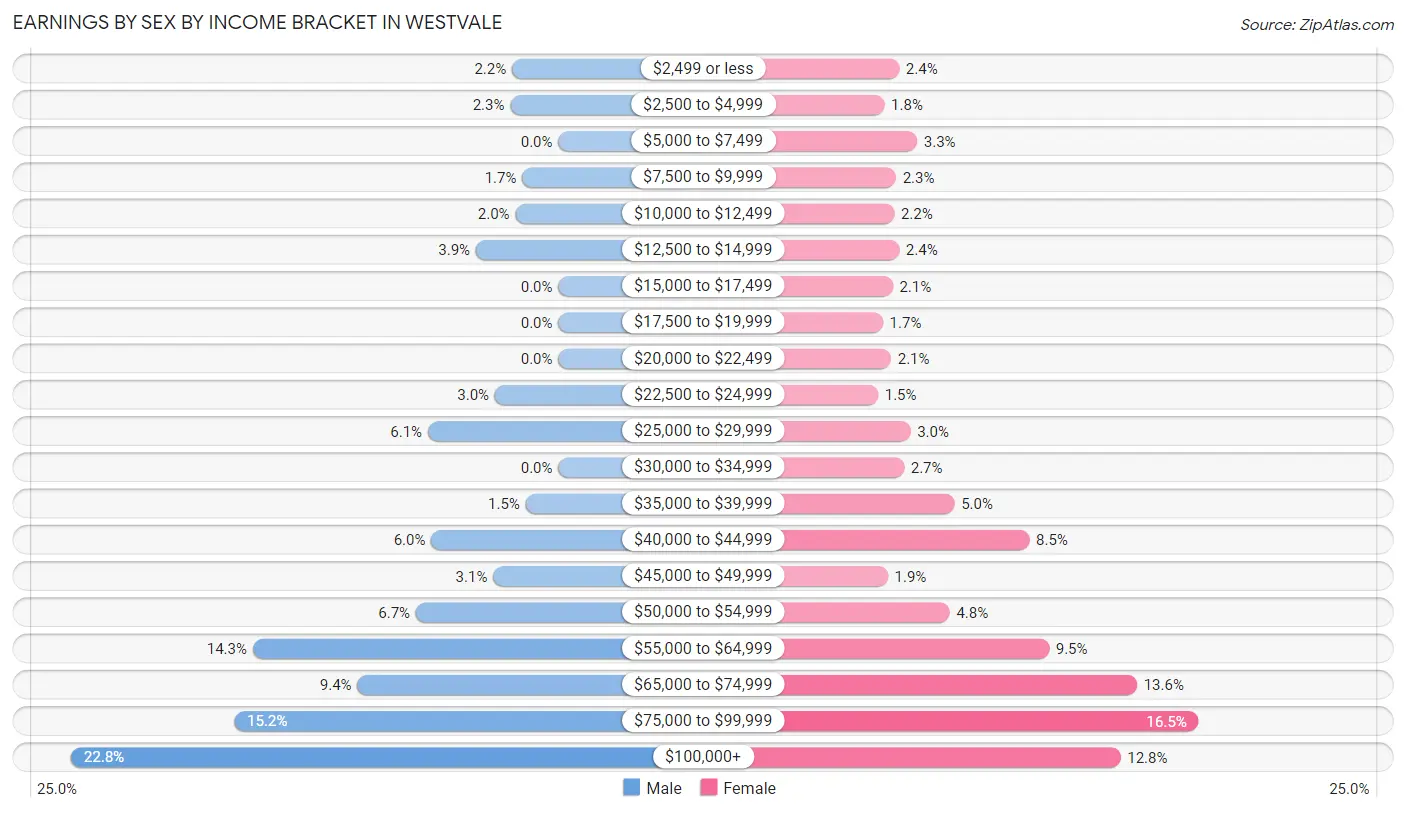
Earnings by Sex by Income Bracket in Westvale
The most common earnings brackets in Westvale are $100,000+ for men (284 | 22.8%) and $75,000 to $99,999 for women (216 | 16.5%).
| Income | Male | Female |
| $2,499 or less | 27 (2.2%) | 32 (2.4%) |
| $2,500 to $4,999 | 28 (2.2%) | 23 (1.8%) |
| $5,000 to $7,499 | 0 (0.0%) | 43 (3.3%) |
| $7,500 to $9,999 | 21 (1.7%) | 30 (2.3%) |
| $10,000 to $12,499 | 25 (2.0%) | 29 (2.2%) |
| $12,500 to $14,999 | 48 (3.9%) | 32 (2.4%) |
| $15,000 to $17,499 | 0 (0.0%) | 28 (2.1%) |
| $17,500 to $19,999 | 0 (0.0%) | 22 (1.7%) |
| $20,000 to $22,499 | 0 (0.0%) | 27 (2.1%) |
| $22,500 to $24,999 | 37 (3.0%) | 19 (1.5%) |
| $25,000 to $29,999 | 76 (6.1%) | 39 (3.0%) |
| $30,000 to $34,999 | 0 (0.0%) | 35 (2.7%) |
| $35,000 to $39,999 | 19 (1.5%) | 66 (5.0%) |
| $40,000 to $44,999 | 74 (5.9%) | 112 (8.5%) |
| $45,000 to $49,999 | 38 (3.0%) | 25 (1.9%) |
| $50,000 to $54,999 | 83 (6.7%) | 63 (4.8%) |
| $55,000 to $64,999 | 178 (14.3%) | 124 (9.5%) |
| $65,000 to $74,999 | 117 (9.4%) | 178 (13.6%) |
| $75,000 to $99,999 | 189 (15.2%) | 216 (16.5%) |
| $100,000+ | 284 (22.8%) | 168 (12.8%) |
| Total | 1,244 (100.0%) | 1,311 (100.0%) |
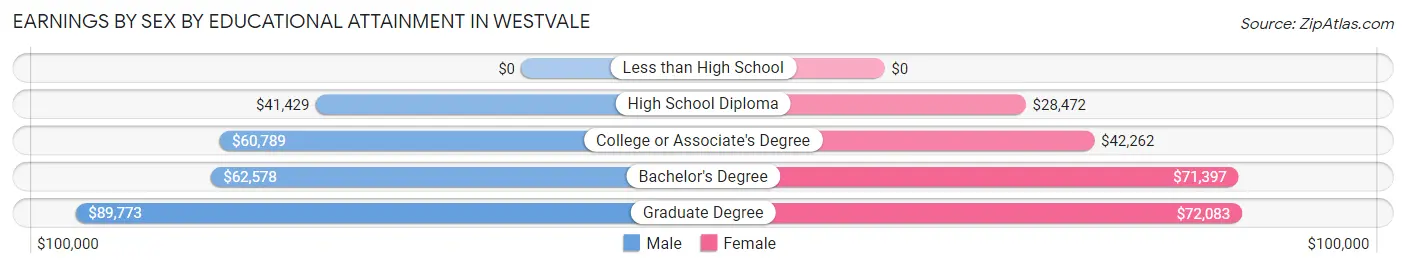
Earnings by Sex by Educational Attainment in Westvale
Average earnings in Westvale are $68,919 for men and $63,598 for women, a difference of 7.7%. Men with an educational attainment of graduate degree enjoy the highest average annual earnings of $89,773, while those with high school diploma education earn the least with $41,429. Women with an educational attainment of graduate degree earn the most with the average annual earnings of $72,083, while those with high school diploma education have the smallest earnings of $28,472.
| Educational Attainment | Male Income | Female Income |
| Less than High School | - | - |
| High School Diploma | $41,429 | $28,472 |
| College or Associate's Degree | $60,789 | $42,262 |
| Bachelor's Degree | $62,578 | $71,397 |
| Graduate Degree | $89,773 | $72,083 |
| Total | $68,919 | $63,598 |
Family Income in Westvale
Family Income Brackets in Westvale
According to the Westvale family income data, there are 460 families falling into the $100,000 to $149,999 income range, which is the most common income bracket and makes up 32.5% of all families.
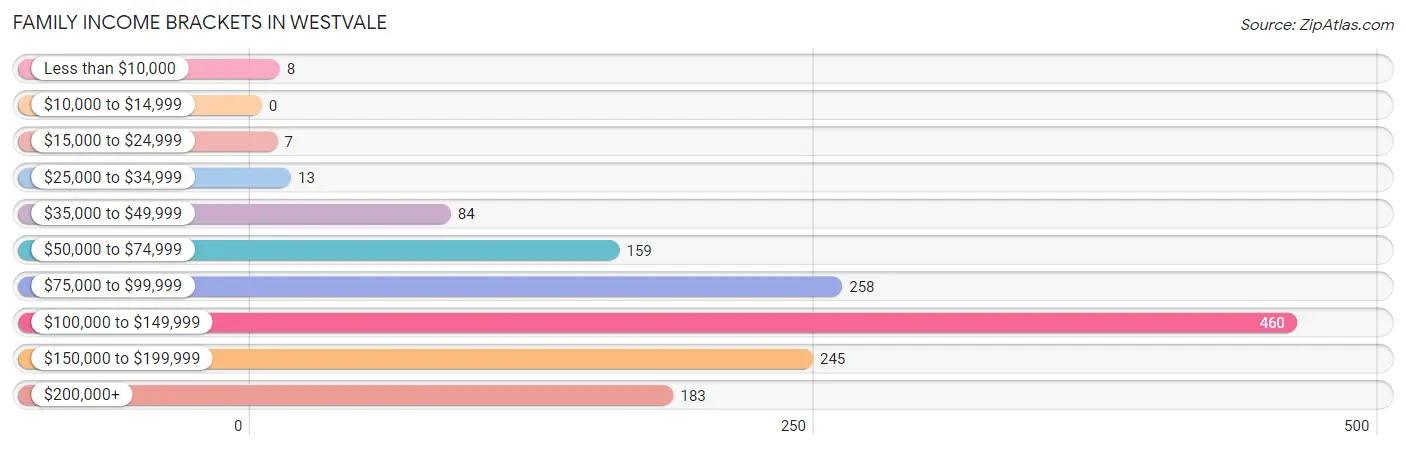
| Income Bracket | # Families | % Families |
| Less than $10,000 | 8 | 0.6% |
| $10,000 to $14,999 | 0 | 0.0% |
| $15,000 to $24,999 | 7 | 0.5% |
| $25,000 to $34,999 | 13 | 0.9% |
| $35,000 to $49,999 | 84 | 5.9% |
| $50,000 to $74,999 | 159 | 11.2% |
| $75,000 to $99,999 | 258 | 18.2% |
| $100,000 to $149,999 | 460 | 32.5% |
| $150,000 to $199,999 | 245 | 17.3% |
| $200,000+ | 183 | 12.9% |
Family Income by Famaliy Size in Westvale
4-person families (280 | 19.8%) account for the highest median family income in Westvale with $147,143 per family, while 2-person families (647 | 45.7%) have the highest median income of $53,106 per family member.
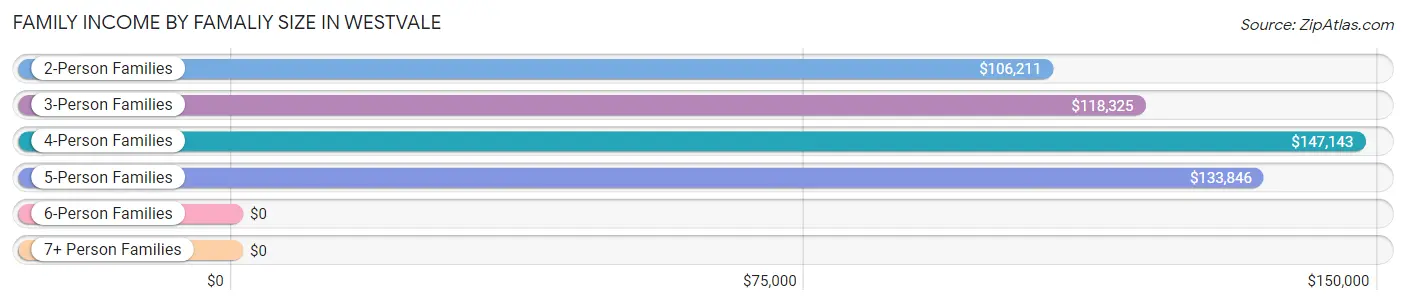
| Income Bracket | # Families | Median Income |
| 2-Person Families | 647 (45.7%) | $106,211 |
| 3-Person Families | 385 (27.2%) | $118,325 |
| 4-Person Families | 280 (19.8%) | $147,143 |
| 5-Person Families | 48 (3.4%) | $133,846 |
| 6-Person Families | 49 (3.5%) | $0 |
| 7+ Person Families | 7 (0.5%) | $0 |
| Total | 1,416 (100.0%) | $121,250 |
Family Income by Number of Earners in Westvale
The median family income in Westvale is $121,250, with families comprising 3+ earners (157) having the highest median family income of $164,306, while families with no earners (246) have the lowest median family income of $79,868, accounting for 11.1% and 17.4% of families, respectively.
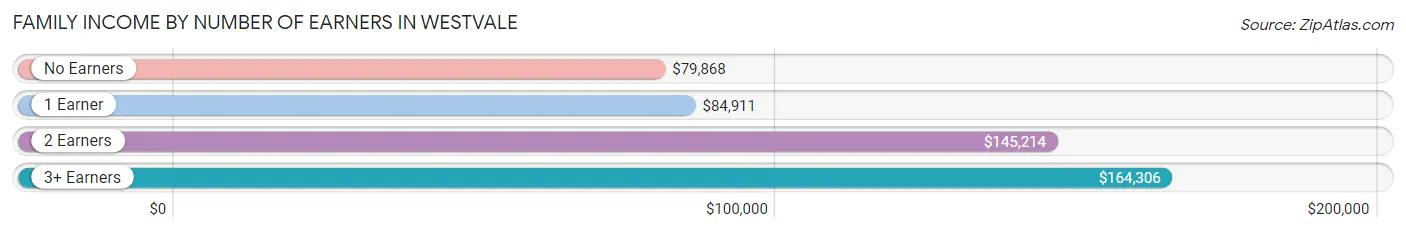
| Number of Earners | # Families | Median Income |
| No Earners | 246 (17.4%) | $79,868 |
| 1 Earner | 425 (30.0%) | $84,911 |
| 2 Earners | 588 (41.5%) | $145,214 |
| 3+ Earners | 157 (11.1%) | $164,306 |
| Total | 1,416 (100.0%) | $121,250 |
Household Income in Westvale
Household Income Brackets in Westvale
With 545 households falling in the category, the $100,000 to $149,999 income range is the most frequent in Westvale, accounting for 27.9% of all households. In contrast, only 25 households (1.3%) fall into the $10,000 to $14,999 income bracket, making it the least populous group.
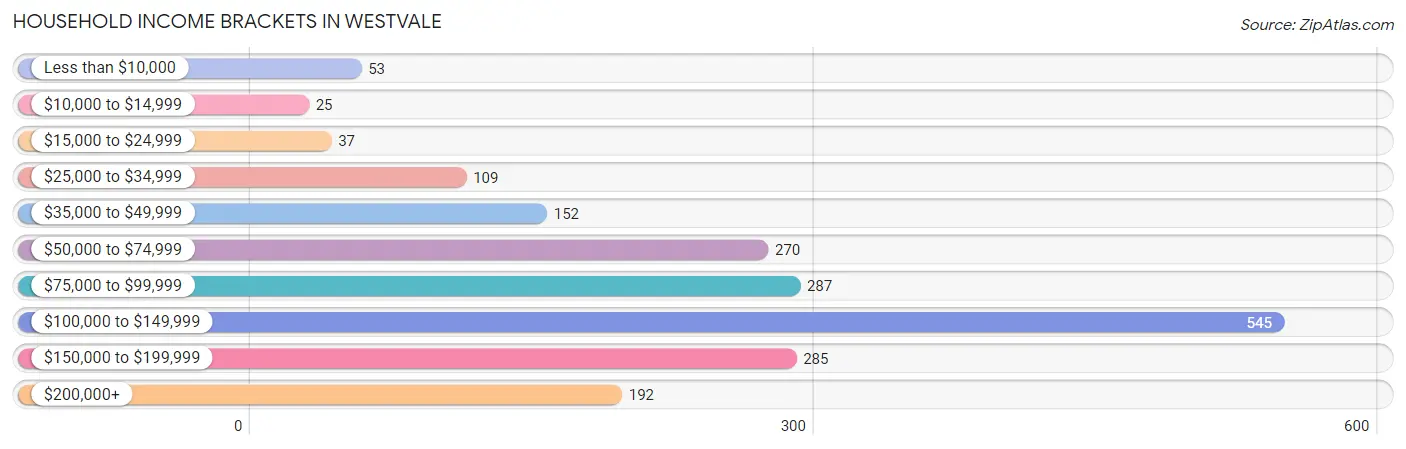
| Income Bracket | # Households | % Households |
| Less than $10,000 | 53 | 2.7% |
| $10,000 to $14,999 | 25 | 1.3% |
| $15,000 to $24,999 | 37 | 1.9% |
| $25,000 to $34,999 | 109 | 5.6% |
| $35,000 to $49,999 | 152 | 7.8% |
| $50,000 to $74,999 | 270 | 13.8% |
| $75,000 to $99,999 | 287 | 14.7% |
| $100,000 to $149,999 | 545 | 27.9% |
| $150,000 to $199,999 | 285 | 14.6% |
| $200,000+ | 192 | 9.8% |
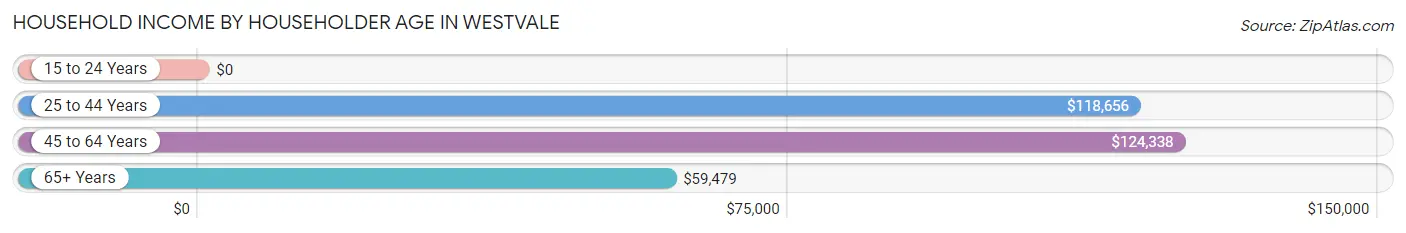
Household Income by Householder Age in Westvale
The median household income in Westvale is $103,646, with the highest median household income of $124,338 found in the 45 to 64 years age bracket for the primary householder. A total of 742 households (38.0%) fall into this category.
| Income Bracket | # Households | Median Income |
| 15 to 24 Years | 0 (0.0%) | $0 |
| 25 to 44 Years | 617 (31.6%) | $118,656 |
| 45 to 64 Years | 742 (38.0%) | $124,338 |
| 65+ Years | 596 (30.5%) | $59,479 |
| Total | 1,955 (100.0%) | $103,646 |
Poverty in Westvale
Income Below Poverty by Sex and Age in Westvale
With 3.3% poverty level for males and 2.7% for females among the residents of Westvale, 15 year old males and 65 to 74 year old females are the most vulnerable to poverty, with 10 males (19.6%) and 26 females (10.5%) in their respective age groups living below the poverty level.
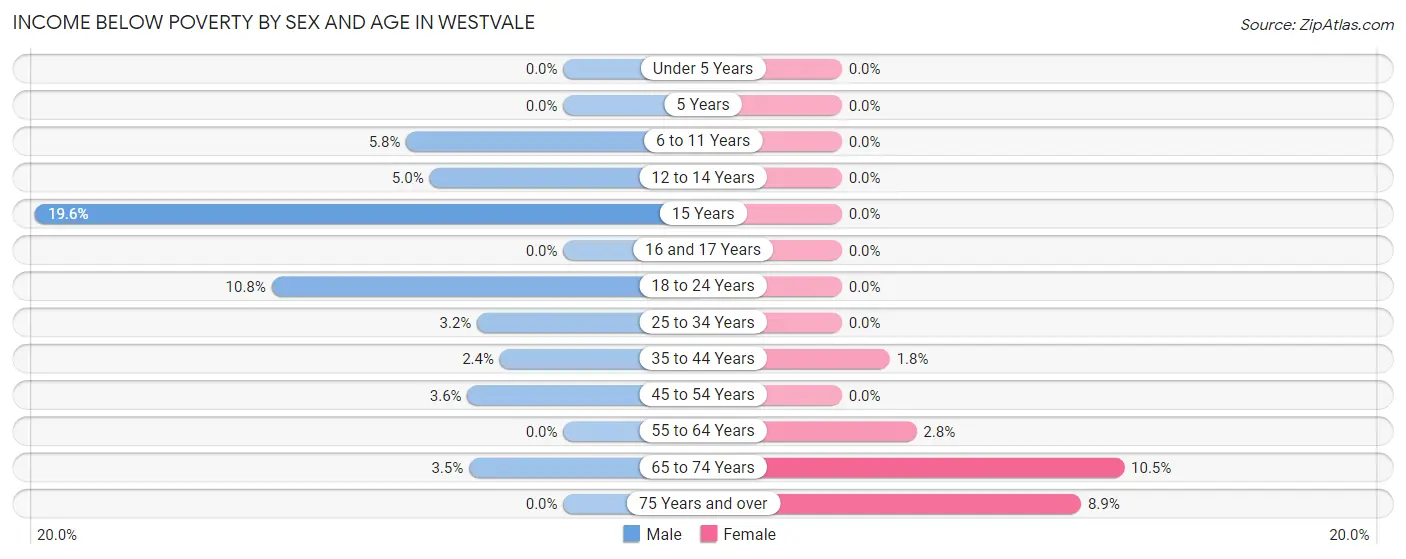
| Age Bracket | Male | Female |
| Under 5 Years | 0 (0.0%) | 0 (0.0%) |
| 5 Years | 0 (0.0%) | 0 (0.0%) |
| 6 to 11 Years | 14 (5.8%) | 0 (0.0%) |
| 12 to 14 Years | 8 (5.0%) | 0 (0.0%) |
| 15 Years | 10 (19.6%) | 0 (0.0%) |
| 16 and 17 Years | 0 (0.0%) | 0 (0.0%) |
| 18 to 24 Years | 13 (10.8%) | 0 (0.0%) |
| 25 to 34 Years | 9 (3.2%) | 0 (0.0%) |
| 35 to 44 Years | 7 (2.4%) | 7 (1.8%) |
| 45 to 54 Years | 11 (3.6%) | 0 (0.0%) |
| 55 to 64 Years | 0 (0.0%) | 9 (2.8%) |
| 65 to 74 Years | 11 (3.5%) | 26 (10.5%) |
| 75 Years and over | 0 (0.0%) | 23 (8.9%) |
| Total | 83 (3.3%) | 65 (2.7%) |
Income Above Poverty by Sex and Age in Westvale
According to the poverty statistics in Westvale, males aged under 5 years and females aged under 5 years are the age groups that are most secure financially, with 100.0% of males and 100.0% of females in these age groups living above the poverty line.
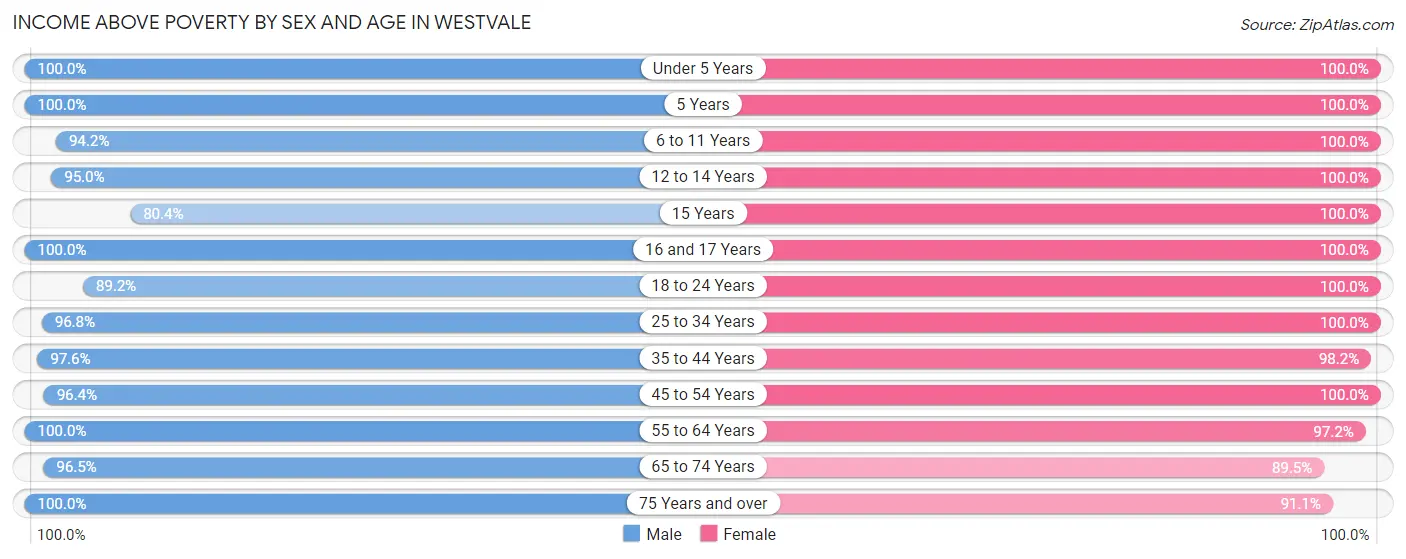
| Age Bracket | Male | Female |
| Under 5 Years | 169 (100.0%) | 145 (100.0%) |
| 5 Years | 36 (100.0%) | 7 (100.0%) |
| 6 to 11 Years | 226 (94.2%) | 161 (100.0%) |
| 12 to 14 Years | 153 (95.0%) | 51 (100.0%) |
| 15 Years | 41 (80.4%) | 49 (100.0%) |
| 16 and 17 Years | 52 (100.0%) | 37 (100.0%) |
| 18 to 24 Years | 107 (89.2%) | 131 (100.0%) |
| 25 to 34 Years | 272 (96.8%) | 222 (100.0%) |
| 35 to 44 Years | 290 (97.6%) | 386 (98.2%) |
| 45 to 54 Years | 298 (96.4%) | 364 (100.0%) |
| 55 to 64 Years | 291 (100.0%) | 316 (97.2%) |
| 65 to 74 Years | 303 (96.5%) | 222 (89.5%) |
| 75 Years and over | 194 (100.0%) | 236 (91.1%) |
| Total | 2,432 (96.7%) | 2,327 (97.3%) |
Income Below Poverty Among Married-Couple Families in Westvale
The poverty statistics for married-couple families in Westvale show that 1.4% or 16 of the total 1,121 families live below the poverty line. Families with 3 or 4 children have the highest poverty rate of 10.0%, comprising of 7 families. On the other hand, families with 1 or 2 children have the lowest poverty rate of 0.0%, which includes 0 families.
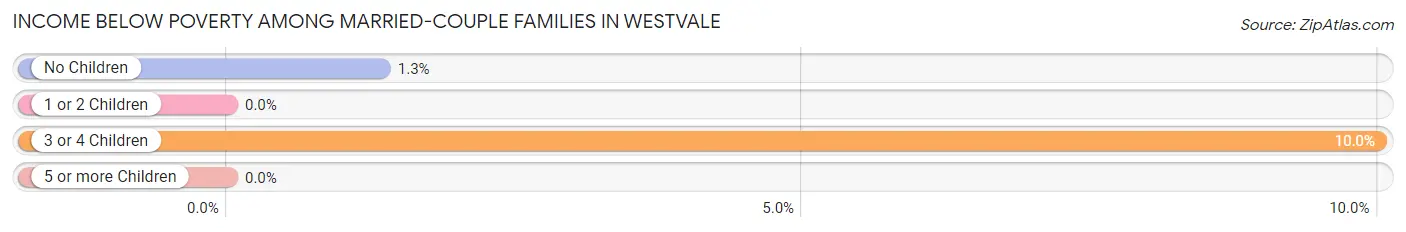
| Children | Above Poverty | Below Poverty |
| No Children | 669 (98.7%) | 9 (1.3%) |
| 1 or 2 Children | 373 (100.0%) | 0 (0.0%) |
| 3 or 4 Children | 63 (90.0%) | 7 (10.0%) |
| 5 or more Children | 0 (0.0%) | 0 (0.0%) |
| Total | 1,105 (98.6%) | 16 (1.4%) |
Income Below Poverty Among Single-Parent Households in Westvale
| Children | Single Father | Single Mother |
| No Children | 0 (0.0%) | 0 (0.0%) |
| 1 or 2 Children | 0 (0.0%) | 0 (0.0%) |
| 3 or 4 Children | 0 (0.0%) | 0 (0.0%) |
| 5 or more Children | 0 (0.0%) | 0 (0.0%) |
| Total | 0 (0.0%) | 0 (0.0%) |
Income Below Poverty Among Married-Couple vs Single-Parent Households in Westvale
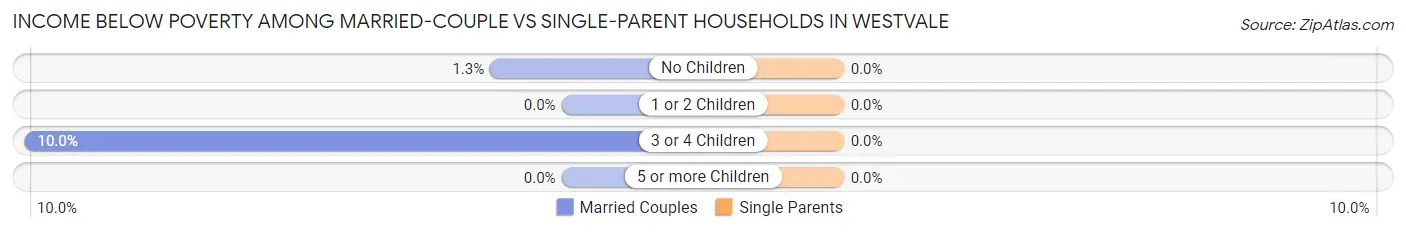
| Children | Married-Couple Families | Single-Parent Households |
| No Children | 9 (1.3%) | 0 (0.0%) |
| 1 or 2 Children | 0 (0.0%) | 0 (0.0%) |
| 3 or 4 Children | 7 (10.0%) | 0 (0.0%) |
| 5 or more Children | 0 (0.0%) | 0 (0.0%) |
| Total | 16 (1.4%) | 0 (0.0%) |
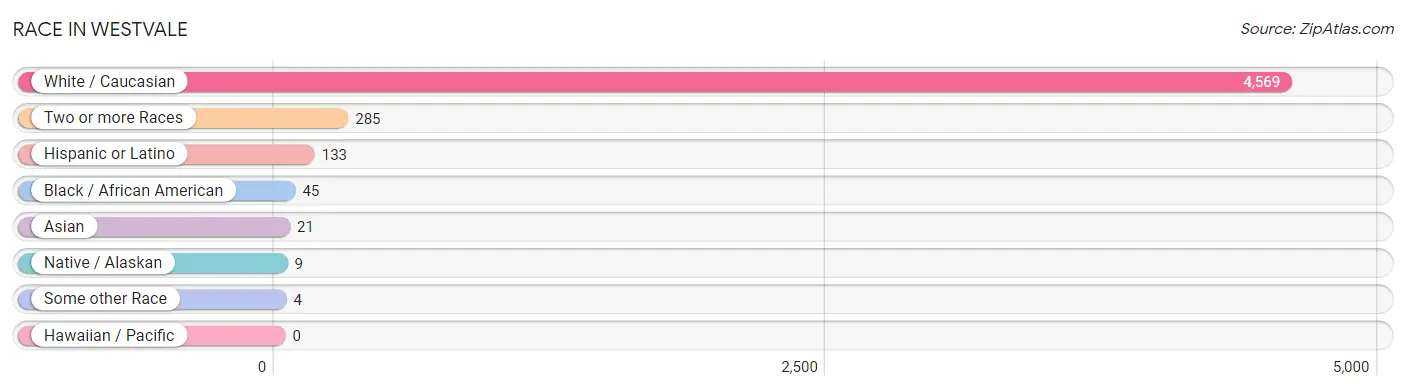
Race in Westvale
The most populous races in Westvale are White / Caucasian (4,569 | 92.6%), Two or more Races (285 | 5.8%), and Hispanic or Latino (133 | 2.7%).
| Race | # Population | % Population |
| Asian | 21 | 0.4% |
| Black / African American | 45 | 0.9% |
| Hawaiian / Pacific | 0 | 0.0% |
| Hispanic or Latino | 133 | 2.7% |
| Native / Alaskan | 9 | 0.2% |
| White / Caucasian | 4,569 | 92.6% |
| Two or more Races | 285 | 5.8% |
| Some other Race | 4 | 0.1% |
| Total | 4,933 | 100.0% |
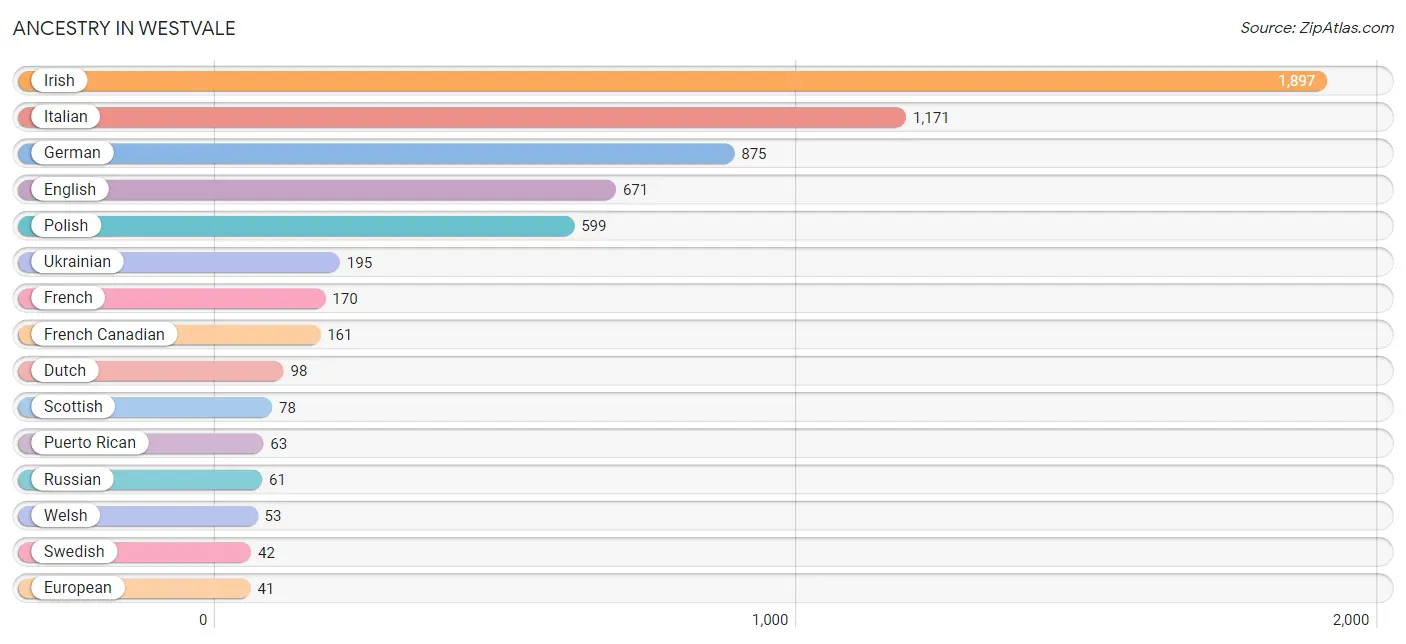
Ancestry in Westvale
The most populous ancestries reported in Westvale are Irish (1,897 | 38.5%), Italian (1,171 | 23.7%), German (875 | 17.7%), English (671 | 13.6%), and Polish (599 | 12.1%), together accounting for 105.7% of all Westvale residents.
| Ancestry | # Population | % Population |
| Alsatian | 12 | 0.2% |
| American | 34 | 0.7% |
| Arab | 18 | 0.4% |
| Austrian | 33 | 0.7% |
| Bhutanese | 9 | 0.2% |
| Canadian | 24 | 0.5% |
| Central American | 29 | 0.6% |
| Central American Indian | 13 | 0.3% |
| Czech | 14 | 0.3% |
| Czechoslovakian | 10 | 0.2% |
| Danish | 8 | 0.2% |
| Dutch | 98 | 2.0% |
| English | 671 | 13.6% |
| European | 41 | 0.8% |
| French | 170 | 3.5% |
| French Canadian | 161 | 3.3% |
| German | 875 | 17.7% |
| Greek | 11 | 0.2% |
| Hungarian | 16 | 0.3% |
| Indian (Asian) | 4 | 0.1% |
| Irish | 1,897 | 38.5% |
| Iroquois | 27 | 0.5% |
| Italian | 1,171 | 23.7% |
| Korean | 18 | 0.4% |
| Lebanese | 18 | 0.4% |
| Lithuanian | 13 | 0.3% |
| Nicaraguan | 12 | 0.2% |
| Pennsylvania German | 11 | 0.2% |
| Peruvian | 8 | 0.2% |
| Polish | 599 | 12.1% |
| Puerto Rican | 63 | 1.3% |
| Russian | 61 | 1.2% |
| Salvadoran | 17 | 0.3% |
| Scotch-Irish | 11 | 0.2% |
| Scottish | 78 | 1.6% |
| South American | 8 | 0.2% |
| Spanish | 33 | 0.7% |
| Swedish | 42 | 0.9% |
| Swiss | 10 | 0.2% |
| Turkish | 4 | 0.1% |
| Ukrainian | 195 | 4.0% |
| Welsh | 53 | 1.1% | View All 42 Rows |
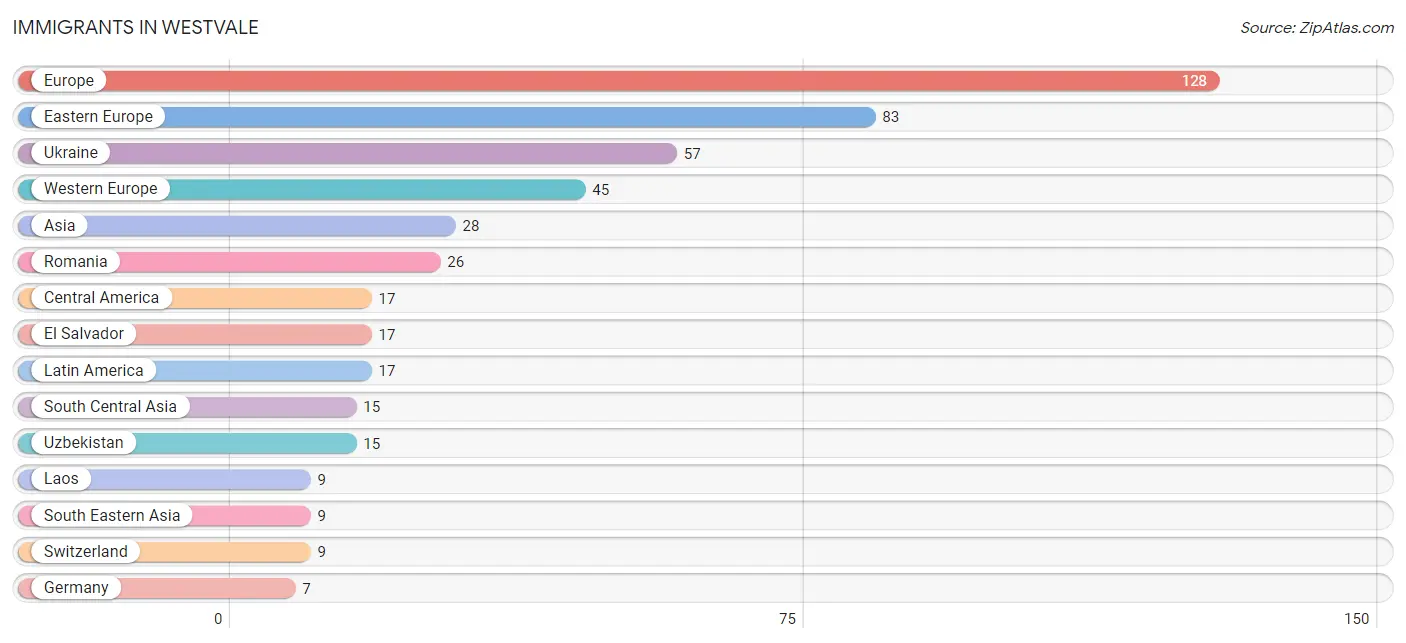
Immigrants in Westvale
The most numerous immigrant groups reported in Westvale came from Europe (128 | 2.6%), Eastern Europe (83 | 1.7%), Ukraine (57 | 1.2%), Western Europe (45 | 0.9%), and Asia (28 | 0.6%), together accounting for 6.9% of all Westvale residents.
| Immigration Origin | # Population | % Population |
| Asia | 28 | 0.6% |
| Canada | 6 | 0.1% |
| Central America | 17 | 0.3% |
| China | 4 | 0.1% |
| Eastern Asia | 4 | 0.1% |
| Eastern Europe | 83 | 1.7% |
| El Salvador | 17 | 0.3% |
| Europe | 128 | 2.6% |
| Germany | 7 | 0.1% |
| Laos | 9 | 0.2% |
| Latin America | 17 | 0.3% |
| Romania | 26 | 0.5% |
| South Central Asia | 15 | 0.3% |
| South Eastern Asia | 9 | 0.2% |
| Switzerland | 9 | 0.2% |
| Ukraine | 57 | 1.2% |
| Uzbekistan | 15 | 0.3% |
| Western Europe | 45 | 0.9% | View All 18 Rows |
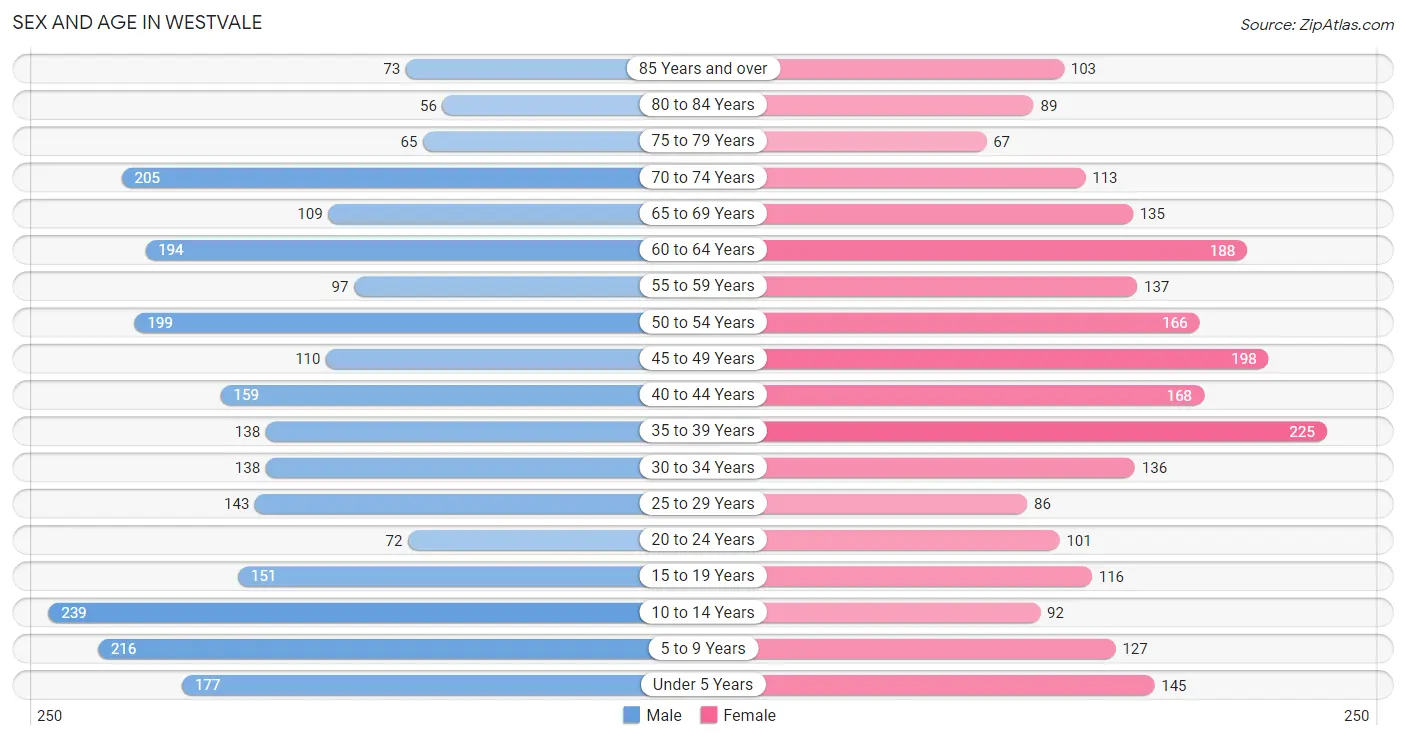
Sex and Age in Westvale
Sex and Age in Westvale
The most populous age groups in Westvale are 10 to 14 Years (239 | 9.4%) for men and 35 to 39 Years (225 | 9.4%) for women.
| Age Bracket | Male | Female |
| Under 5 Years | 177 (7.0%) | 145 (6.1%) |
| 5 to 9 Years | 216 (8.5%) | 127 (5.3%) |
| 10 to 14 Years | 239 (9.4%) | 92 (3.8%) |
| 15 to 19 Years | 151 (5.9%) | 116 (4.9%) |
| 20 to 24 Years | 72 (2.8%) | 101 (4.2%) |
| 25 to 29 Years | 143 (5.6%) | 86 (3.6%) |
| 30 to 34 Years | 138 (5.4%) | 136 (5.7%) |
| 35 to 39 Years | 138 (5.4%) | 225 (9.4%) |
| 40 to 44 Years | 159 (6.3%) | 168 (7.0%) |
| 45 to 49 Years | 110 (4.3%) | 198 (8.3%) |
| 50 to 54 Years | 199 (7.8%) | 166 (6.9%) |
| 55 to 59 Years | 97 (3.8%) | 137 (5.7%) |
| 60 to 64 Years | 194 (7.6%) | 188 (7.9%) |
| 65 to 69 Years | 109 (4.3%) | 135 (5.6%) |
| 70 to 74 Years | 205 (8.1%) | 113 (4.7%) |
| 75 to 79 Years | 65 (2.6%) | 67 (2.8%) |
| 80 to 84 Years | 56 (2.2%) | 89 (3.7%) |
| 85 Years and over | 73 (2.9%) | 103 (4.3%) |
| Total | 2,541 (100.0%) | 2,392 (100.0%) |
Families and Households in Westvale
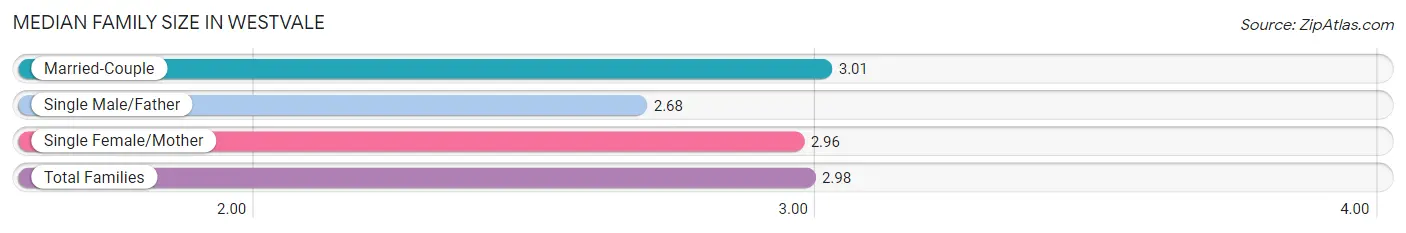
Median Family Size in Westvale
The median family size in Westvale is 2.98 persons per family, with married-couple families (1,121 | 79.2%) accounting for the largest median family size of 3.01 persons per family. On the other hand, single male/father families (103 | 7.3%) represent the smallest median family size with 2.68 persons per family.
| Family Type | # Families | Family Size |
| Married-Couple | 1,121 (79.2%) | 3.01 |
| Single Male/Father | 103 (7.3%) | 2.68 |
| Single Female/Mother | 192 (13.6%) | 2.96 |
| Total Families | 1,416 (100.0%) | 2.98 |
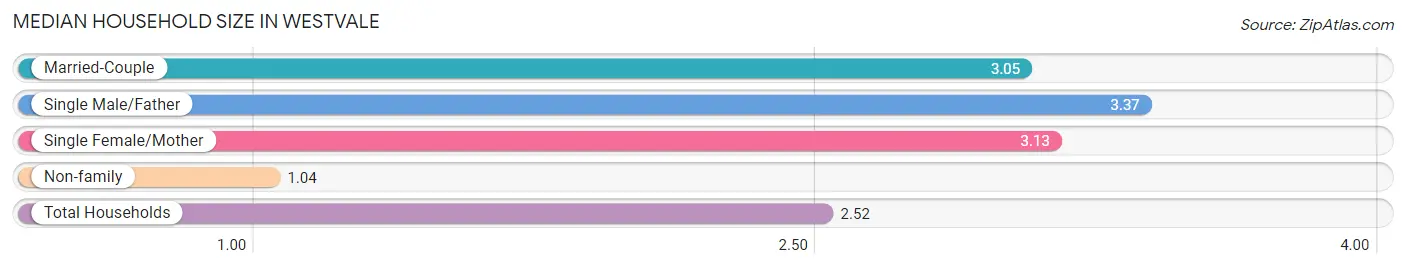
Median Household Size in Westvale
The median household size in Westvale is 2.52 persons per household, with single male/father households (103 | 5.3%) accounting for the largest median household size of 3.37 persons per household. non-family households (539 | 27.6%) represent the smallest median household size with 1.04 persons per household.
| Household Type | # Households | Household Size |
| Married-Couple | 1,121 (57.3%) | 3.05 |
| Single Male/Father | 103 (5.3%) | 3.37 |
| Single Female/Mother | 192 (9.8%) | 3.13 |
| Non-family | 539 (27.6%) | 1.04 |
| Total Households | 1,955 (100.0%) | 2.52 |
Household Size by Marriage Status in Westvale
Out of a total of 1,955 households in Westvale, 1,416 (72.4%) are family households, while 539 (27.6%) are nonfamily households. The most numerous type of family households are 2-person households, comprising 617, and the most common type of nonfamily households are 1-person households, comprising 512.
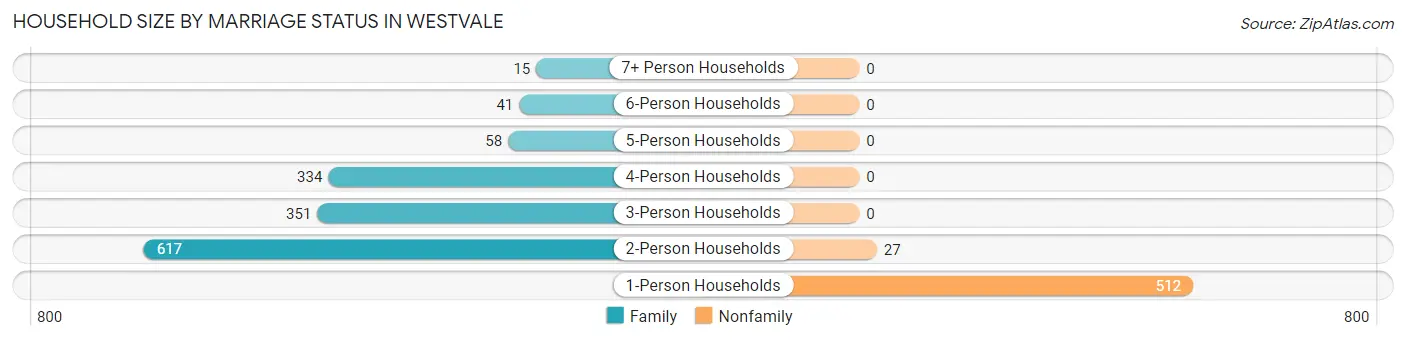
| Household Size | Family Households | Nonfamily Households |
| 1-Person Households | - | 512 (26.2%) |
| 2-Person Households | 617 (31.6%) | 27 (1.4%) |
| 3-Person Households | 351 (17.9%) | 0 (0.0%) |
| 4-Person Households | 334 (17.1%) | 0 (0.0%) |
| 5-Person Households | 58 (3.0%) | 0 (0.0%) |
| 6-Person Households | 41 (2.1%) | 0 (0.0%) |
| 7+ Person Households | 15 (0.8%) | 0 (0.0%) |
| Total | 1,416 (72.4%) | 539 (27.6%) |
Female Fertility in Westvale
Fertility by Age in Westvale
Average fertility rate in Westvale is 58.0 births per 1,000 women. Women in the age bracket of 35 to 50 years have the highest fertility rate with 86.0 births per 1,000 women. Women in the age bracket of 35 to 50 years acount for 87.3% of all women with births.
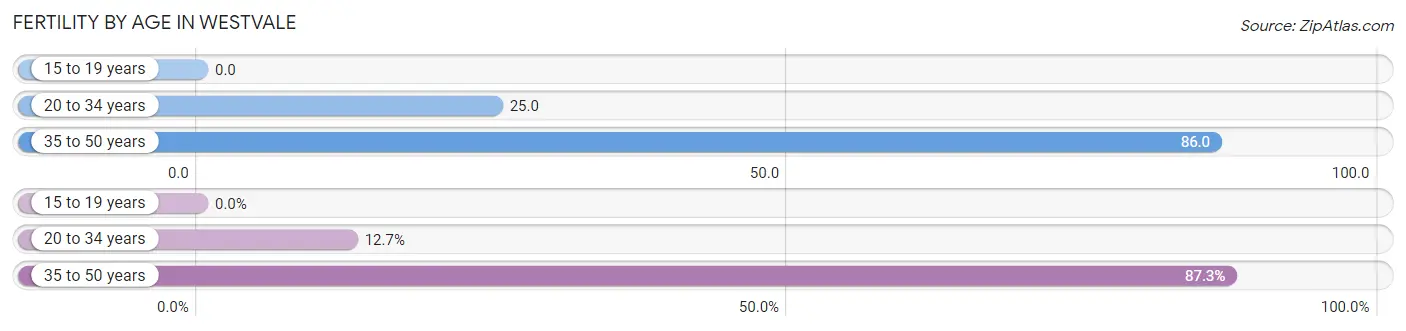
| Age Bracket | Women with Births | Births / 1,000 Women |
| 15 to 19 years | 0 (0.0%) | 0.0 |
| 20 to 34 years | 8 (12.7%) | 25.0 |
| 35 to 50 years | 55 (87.3%) | 86.0 |
| Total | 63 (100.0%) | 58.0 |
Fertility by Age by Marriage Status in Westvale
87.3% of women with births (63) in Westvale are married. The highest percentage of unmarried women with births falls into 20 to 34 years age bracket with 100.0% of them unmarried at the time of birth, while the lowest percentage of unmarried women with births belong to 35 to 50 years age bracket with 0.0% of them unmarried.
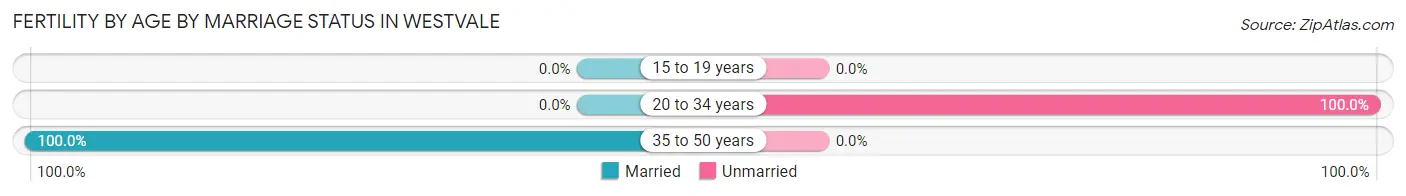
| Age Bracket | Married | Unmarried |
| 15 to 19 years | 0 (0.0%) | 0 (0.0%) |
| 20 to 34 years | 0 (0.0%) | 8 (100.0%) |
| 35 to 50 years | 55 (100.0%) | 0 (0.0%) |
| Total | 55 (87.3%) | 8 (12.7%) |
Fertility by Education in Westvale
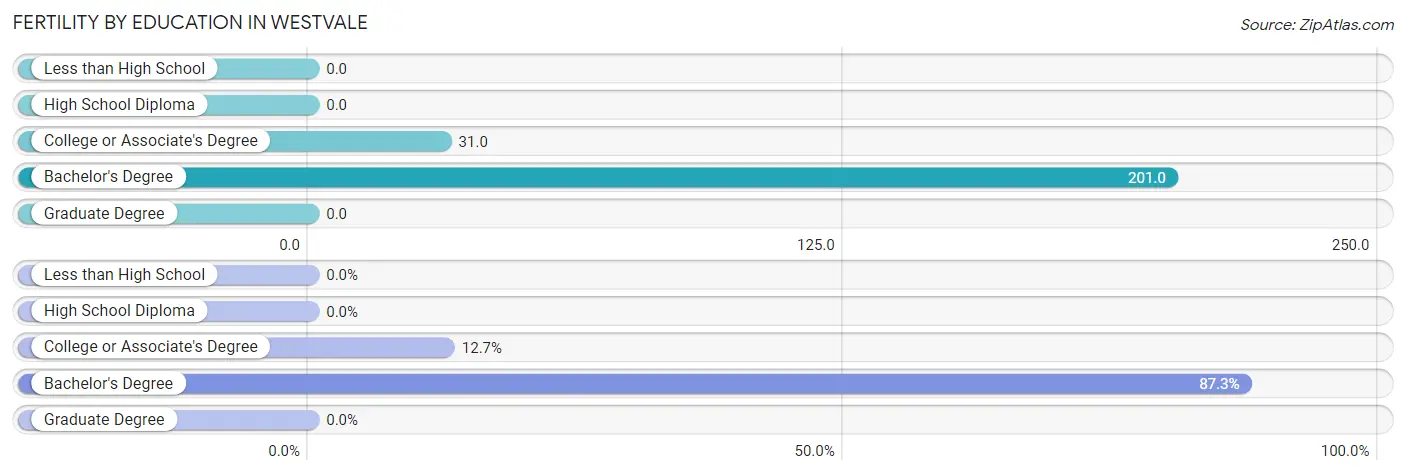
| Educational Attainment | Women with Births | Births / 1,000 Women |
| Less than High School | 0 (0.0%) | 0.0 |
| High School Diploma | 0 (0.0%) | 0.0 |
| College or Associate's Degree | 8 (12.7%) | 31.0 |
| Bachelor's Degree | 55 (87.3%) | 201.0 |
| Graduate Degree | 0 (0.0%) | 0.0 |
| Total | 63 (100.0%) | 58.0 |
Fertility by Education by Marriage Status in Westvale
12.7% of women with births in Westvale are unmarried. Women with the educational attainment of bachelor's degree are most likely to be married with 100.0% of them married at childbirth, while women with the educational attainment of college or associate's degree are least likely to be married with 100.0% of them unmarried at childbirth.
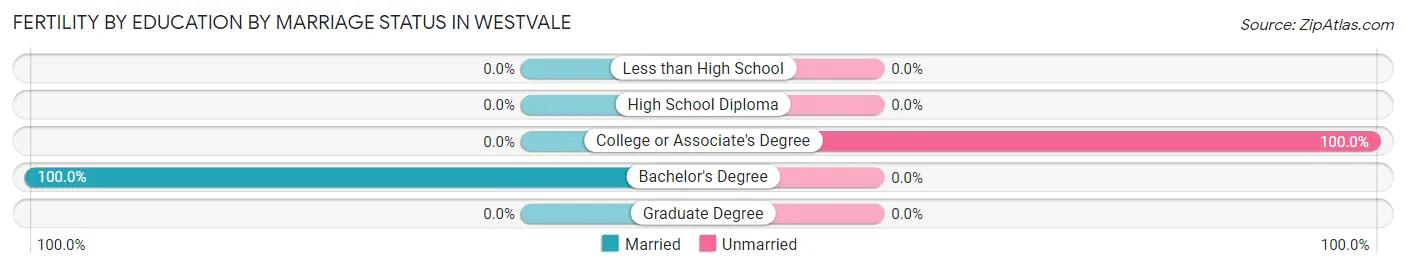
| Educational Attainment | Married | Unmarried |
| Less than High School | 0 (0.0%) | 0 (0.0%) |
| High School Diploma | 0 (0.0%) | 0 (0.0%) |
| College or Associate's Degree | 0 (0.0%) | 8 (100.0%) |
| Bachelor's Degree | 55 (100.0%) | 0 (0.0%) |
| Graduate Degree | 0 (0.0%) | 0 (0.0%) |
| Total | 55 (87.3%) | 8 (12.7%) |
Employment Characteristics in Westvale
Employment by Class of Employer in Westvale
Among the 2,327 employed individuals in Westvale, private company employees (1,254 | 53.9%), local government employees (359 | 15.4%), and not-for-profit organizations (281 | 12.1%) make up the most common classes of employment.
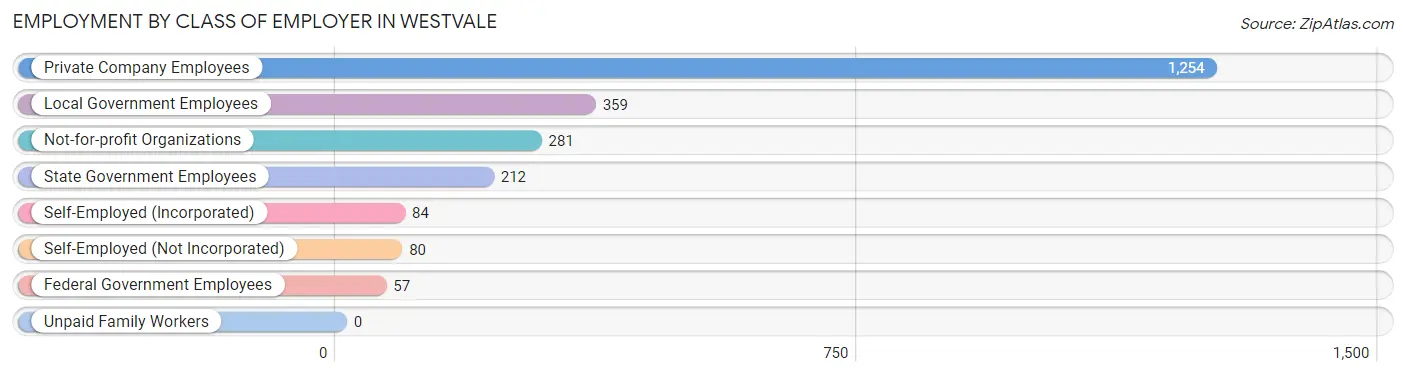
| Employer Class | # Employees | % Employees |
| Private Company Employees | 1,254 | 53.9% |
| Self-Employed (Incorporated) | 84 | 3.6% |
| Self-Employed (Not Incorporated) | 80 | 3.4% |
| Not-for-profit Organizations | 281 | 12.1% |
| Local Government Employees | 359 | 15.4% |
| State Government Employees | 212 | 9.1% |
| Federal Government Employees | 57 | 2.5% |
| Unpaid Family Workers | 0 | 0.0% |
| Total | 2,327 | 100.0% |
Employment Status by Age in Westvale
According to the labor force statistics for Westvale, out of the total population over 16 years of age (3,837), 64.2% or 2,463 individuals are in the labor force, with 1.4% or 34 of them unemployed. The age group with the highest labor force participation rate is 30 to 34 years, with 97.1% or 266 individuals in the labor force. Within the labor force, the 20 to 24 years age range has the highest percentage of unemployed individuals, with 7.7% or 12 of them being unemployed.
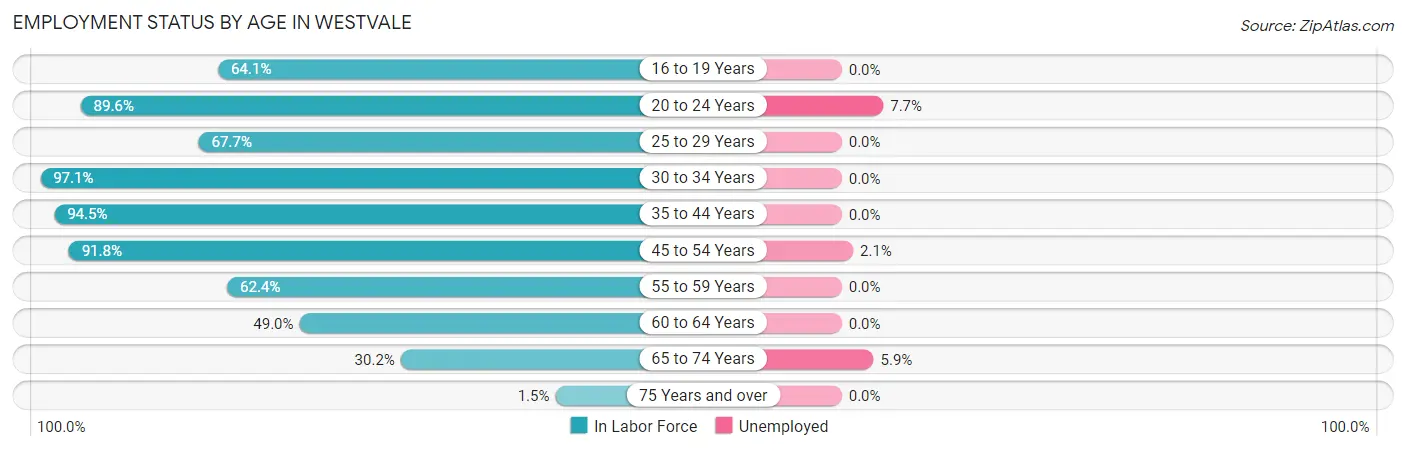
| Age Bracket | In Labor Force | Unemployed |
| 16 to 19 Years | 107 (64.1%) | 0 (0.0%) |
| 20 to 24 Years | 155 (89.6%) | 12 (7.7%) |
| 25 to 29 Years | 155 (67.7%) | 0 (0.0%) |
| 30 to 34 Years | 266 (97.1%) | 0 (0.0%) |
| 35 to 44 Years | 652 (94.5%) | 0 (0.0%) |
| 45 to 54 Years | 618 (91.8%) | 13 (2.1%) |
| 55 to 59 Years | 146 (62.4%) | 0 (0.0%) |
| 60 to 64 Years | 187 (49.0%) | 0 (0.0%) |
| 65 to 74 Years | 170 (30.2%) | 10 (5.9%) |
| 75 Years and over | 7 (1.5%) | 0 (0.0%) |
| Total | 2,463 (64.2%) | 34 (1.4%) |
Employment Status by Educational Attainment in Westvale
According to labor force statistics for Westvale, 81.5% of individuals (2,023) out of the total population between 25 and 64 years of age (2,482) are in the labor force, with 0.6% or 12 of them being unemployed. The group with the highest labor force participation rate are those with the educational attainment of bachelor's degree or higher, with 89.4% or 1,411 individuals in the labor force. Within the labor force, individuals with college / associate degree education have the highest percentage of unemployment, with 3.1% or 13 of them being unemployed.
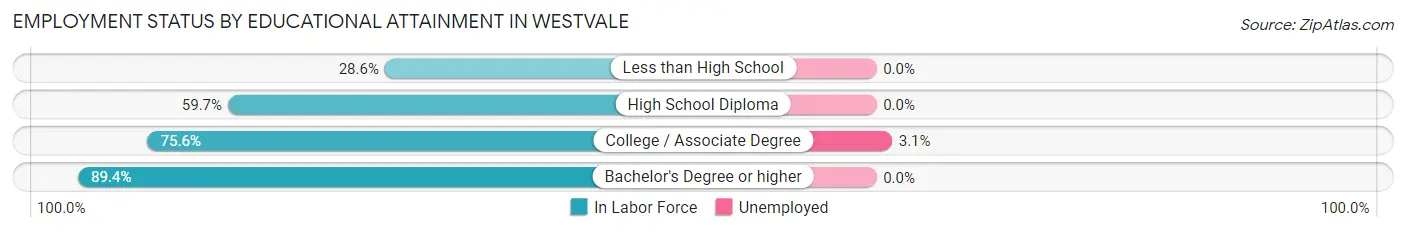
| Educational Attainment | In Labor Force | Unemployed |
| Less than High School | 14 (28.6%) | 0 (0.0%) |
| High School Diploma | 175 (59.7%) | 0 (0.0%) |
| College / Associate Degree | 425 (75.6%) | 17 (3.1%) |
| Bachelor's Degree or higher | 1,411 (89.4%) | 0 (0.0%) |
| Total | 2,023 (81.5%) | 15 (0.6%) |
Employment Occupations by Sex in Westvale
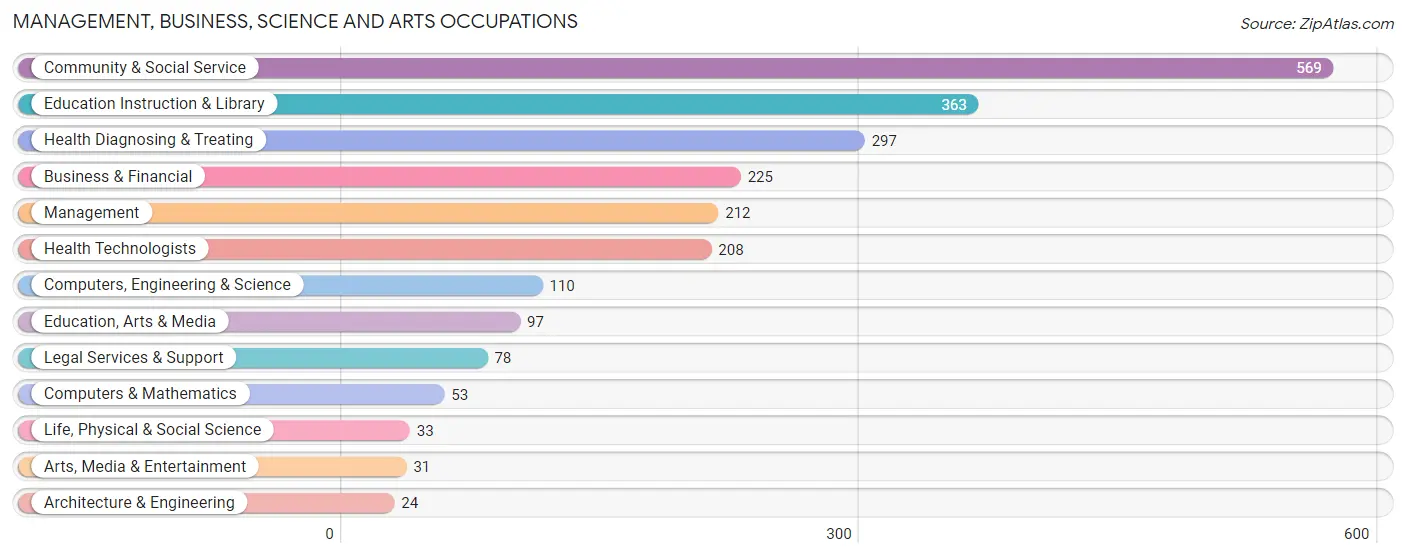
Management, Business, Science and Arts Occupations
The most common Management, Business, Science and Arts occupations in Westvale are Community & Social Service (569 | 23.5%), Education Instruction & Library (363 | 15.0%), Health Diagnosing & Treating (297 | 12.3%), Business & Financial (225 | 9.3%), and Management (212 | 8.7%).
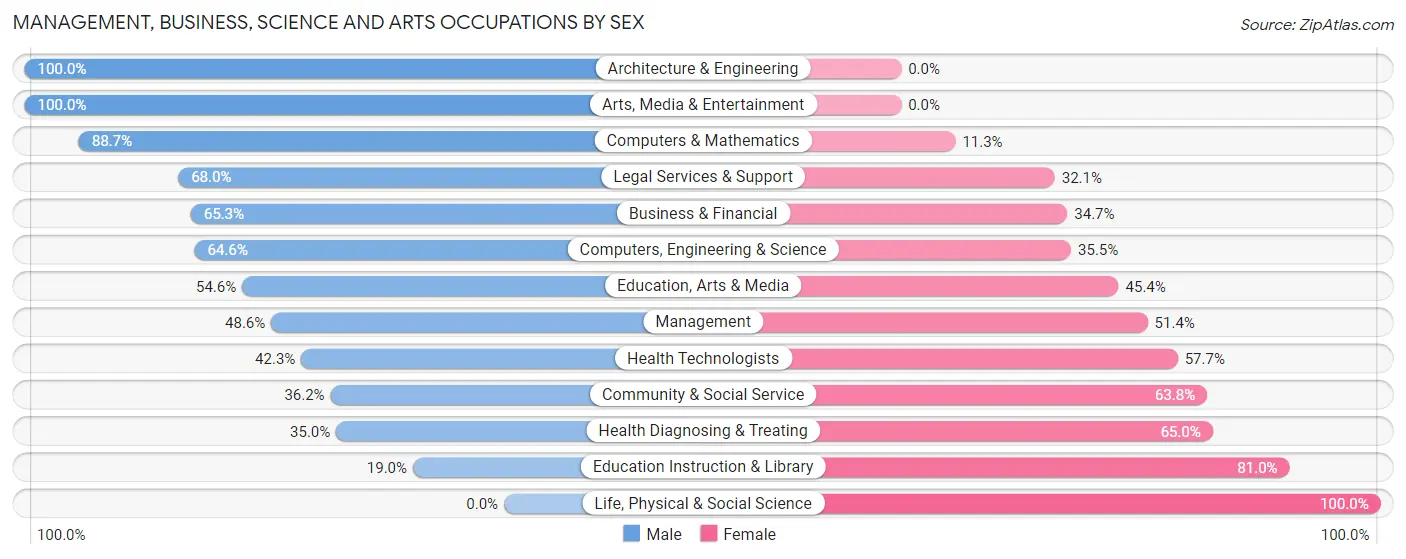
Management, Business, Science and Arts Occupations by Sex
Within the Management, Business, Science and Arts occupations in Westvale, the most male-oriented occupations are Architecture & Engineering (100.0%), Arts, Media & Entertainment (100.0%), and Computers & Mathematics (88.7%), while the most female-oriented occupations are Life, Physical & Social Science (100.0%), Education Instruction & Library (81.0%), and Health Diagnosing & Treating (65.0%).
| Occupation | Male | Female |
| Management | 103 (48.6%) | 109 (51.4%) |
| Business & Financial | 147 (65.3%) | 78 (34.7%) |
| Computers, Engineering & Science | 71 (64.5%) | 39 (35.4%) |
| Computers & Mathematics | 47 (88.7%) | 6 (11.3%) |
| Architecture & Engineering | 24 (100.0%) | 0 (0.0%) |
| Life, Physical & Social Science | 0 (0.0%) | 33 (100.0%) |
| Community & Social Service | 206 (36.2%) | 363 (63.8%) |
| Education, Arts & Media | 53 (54.6%) | 44 (45.4%) |
| Legal Services & Support | 53 (67.9%) | 25 (32.1%) |
| Education Instruction & Library | 69 (19.0%) | 294 (81.0%) |
| Arts, Media & Entertainment | 31 (100.0%) | 0 (0.0%) |
| Health Diagnosing & Treating | 104 (35.0%) | 193 (65.0%) |
| Health Technologists | 88 (42.3%) | 120 (57.7%) |
| Total (Category) | 631 (44.7%) | 782 (55.3%) |
| Total (Overall) | 1,174 (48.4%) | 1,249 (51.5%) |
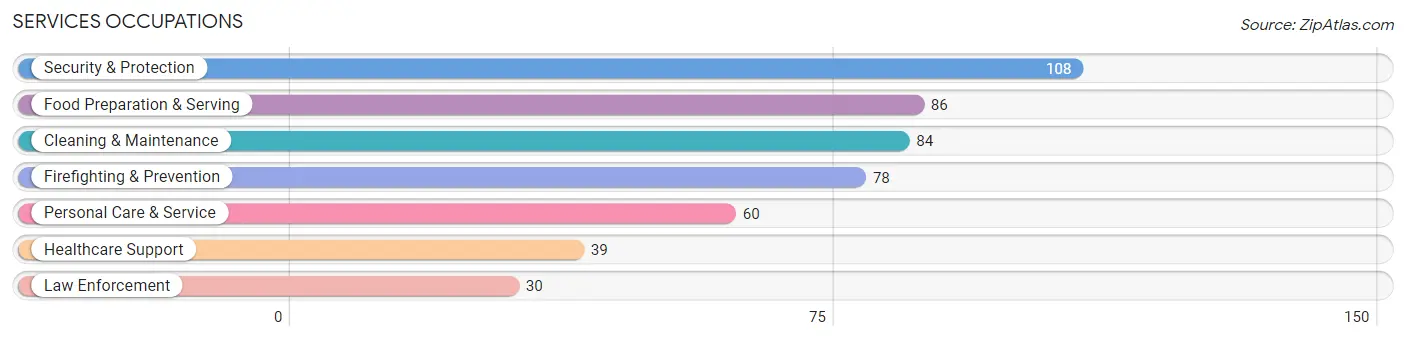
Services Occupations
The most common Services occupations in Westvale are Security & Protection (108 | 4.5%), Food Preparation & Serving (86 | 3.5%), Cleaning & Maintenance (84 | 3.5%), Firefighting & Prevention (78 | 3.2%), and Personal Care & Service (60 | 2.5%).
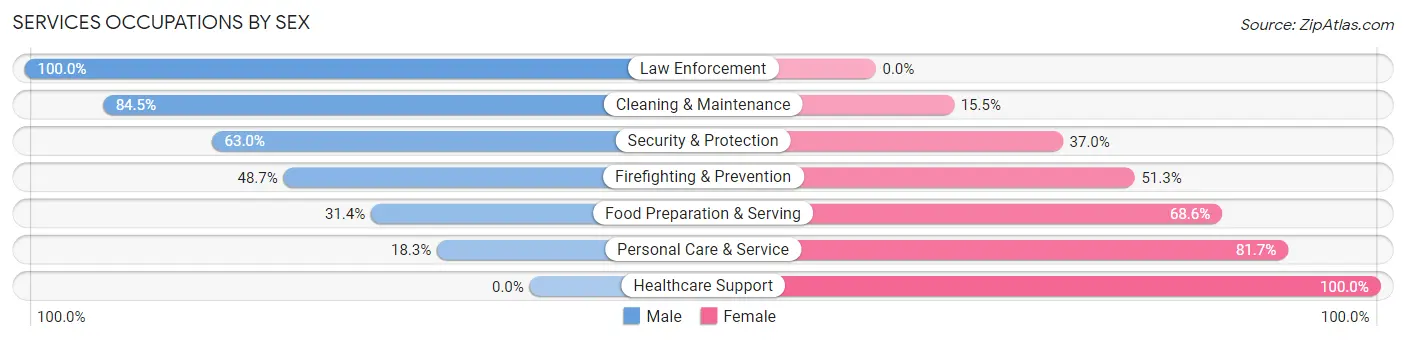
Services Occupations by Sex
Within the Services occupations in Westvale, the most male-oriented occupations are Law Enforcement (100.0%), Cleaning & Maintenance (84.5%), and Security & Protection (63.0%), while the most female-oriented occupations are Healthcare Support (100.0%), Personal Care & Service (81.7%), and Food Preparation & Serving (68.6%).
| Occupation | Male | Female |
| Healthcare Support | 0 (0.0%) | 39 (100.0%) |
| Security & Protection | 68 (63.0%) | 40 (37.0%) |
| Firefighting & Prevention | 38 (48.7%) | 40 (51.3%) |
| Law Enforcement | 30 (100.0%) | 0 (0.0%) |
| Food Preparation & Serving | 27 (31.4%) | 59 (68.6%) |
| Cleaning & Maintenance | 71 (84.5%) | 13 (15.5%) |
| Personal Care & Service | 11 (18.3%) | 49 (81.7%) |
| Total (Category) | 177 (46.9%) | 200 (53.0%) |
| Total (Overall) | 1,174 (48.4%) | 1,249 (51.5%) |
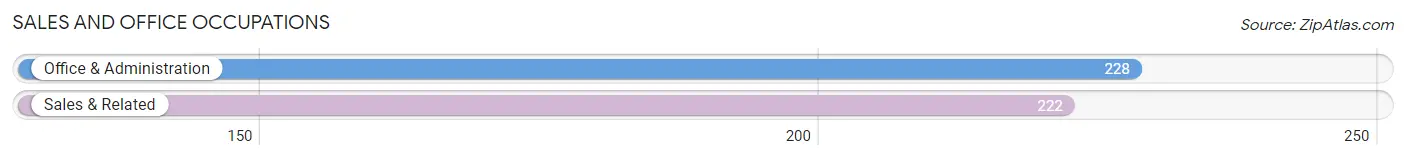
Sales and Office Occupations
The most common Sales and Office occupations in Westvale are Office & Administration (228 | 9.4%), and Sales & Related (222 | 9.2%).
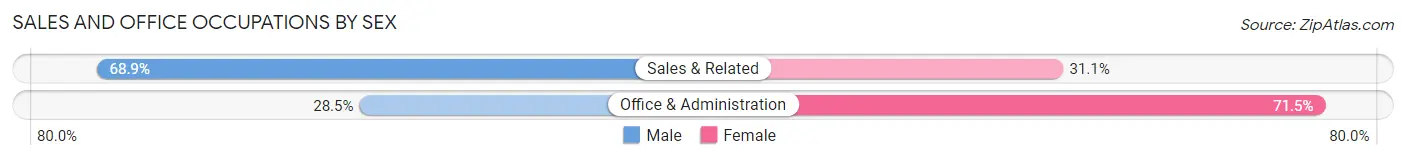
Sales and Office Occupations by Sex
| Occupation | Male | Female |
| Sales & Related | 153 (68.9%) | 69 (31.1%) |
| Office & Administration | 65 (28.5%) | 163 (71.5%) |
| Total (Category) | 218 (48.4%) | 232 (51.6%) |
| Total (Overall) | 1,174 (48.4%) | 1,249 (51.5%) |
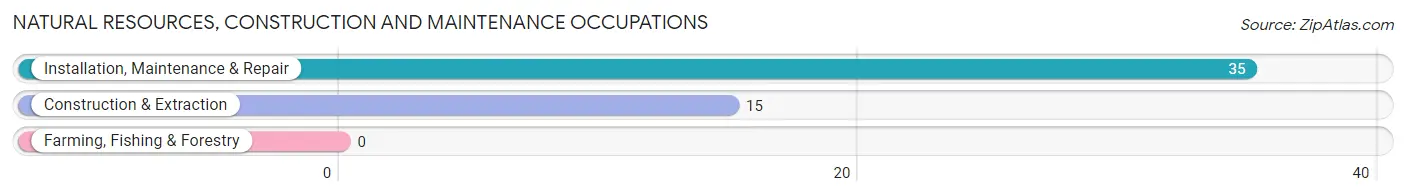
Natural Resources, Construction and Maintenance Occupations
The most common Natural Resources, Construction and Maintenance occupations in Westvale are Installation, Maintenance & Repair (35 | 1.4%), and Construction & Extraction (15 | 0.6%).
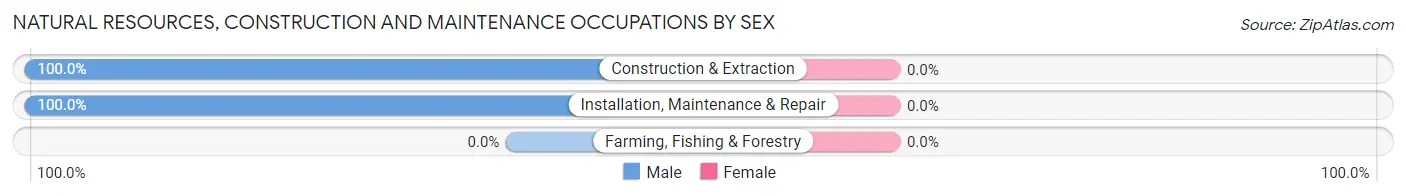
Natural Resources, Construction and Maintenance Occupations by Sex
| Occupation | Male | Female |
| Farming, Fishing & Forestry | 0 (0.0%) | 0 (0.0%) |
| Construction & Extraction | 15 (100.0%) | 0 (0.0%) |
| Installation, Maintenance & Repair | 35 (100.0%) | 0 (0.0%) |
| Total (Category) | 50 (100.0%) | 0 (0.0%) |
| Total (Overall) | 1,174 (48.4%) | 1,249 (51.5%) |
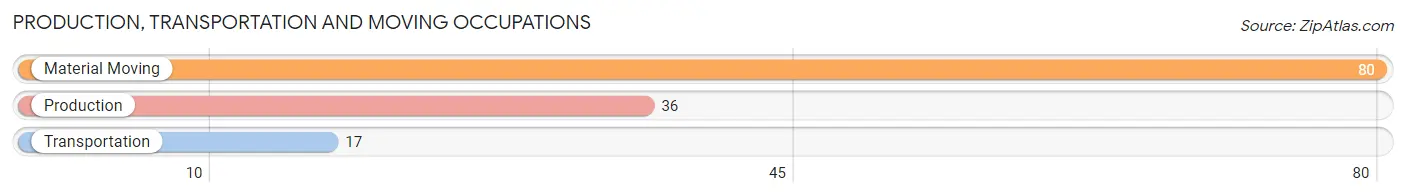
Production, Transportation and Moving Occupations
The most common Production, Transportation and Moving occupations in Westvale are Material Moving (80 | 3.3%), Production (36 | 1.5%), and Transportation (17 | 0.7%).
Production, Transportation and Moving Occupations by Sex
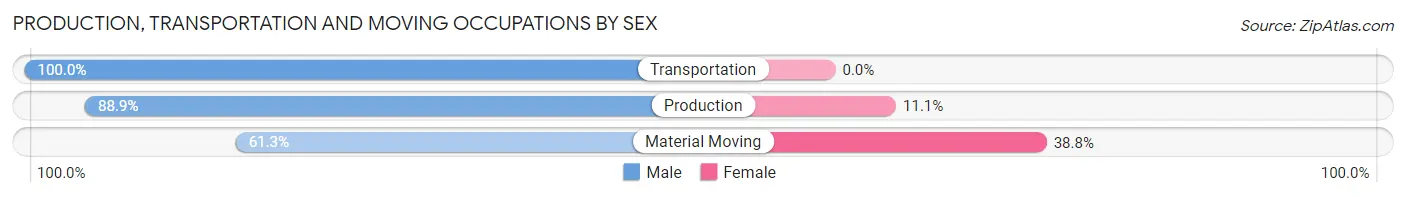
| Occupation | Male | Female |
| Production | 32 (88.9%) | 4 (11.1%) |
| Transportation | 17 (100.0%) | 0 (0.0%) |
| Material Moving | 49 (61.3%) | 31 (38.8%) |
| Total (Category) | 98 (73.7%) | 35 (26.3%) |
| Total (Overall) | 1,174 (48.4%) | 1,249 (51.5%) |
Employment Industries by Sex in Westvale
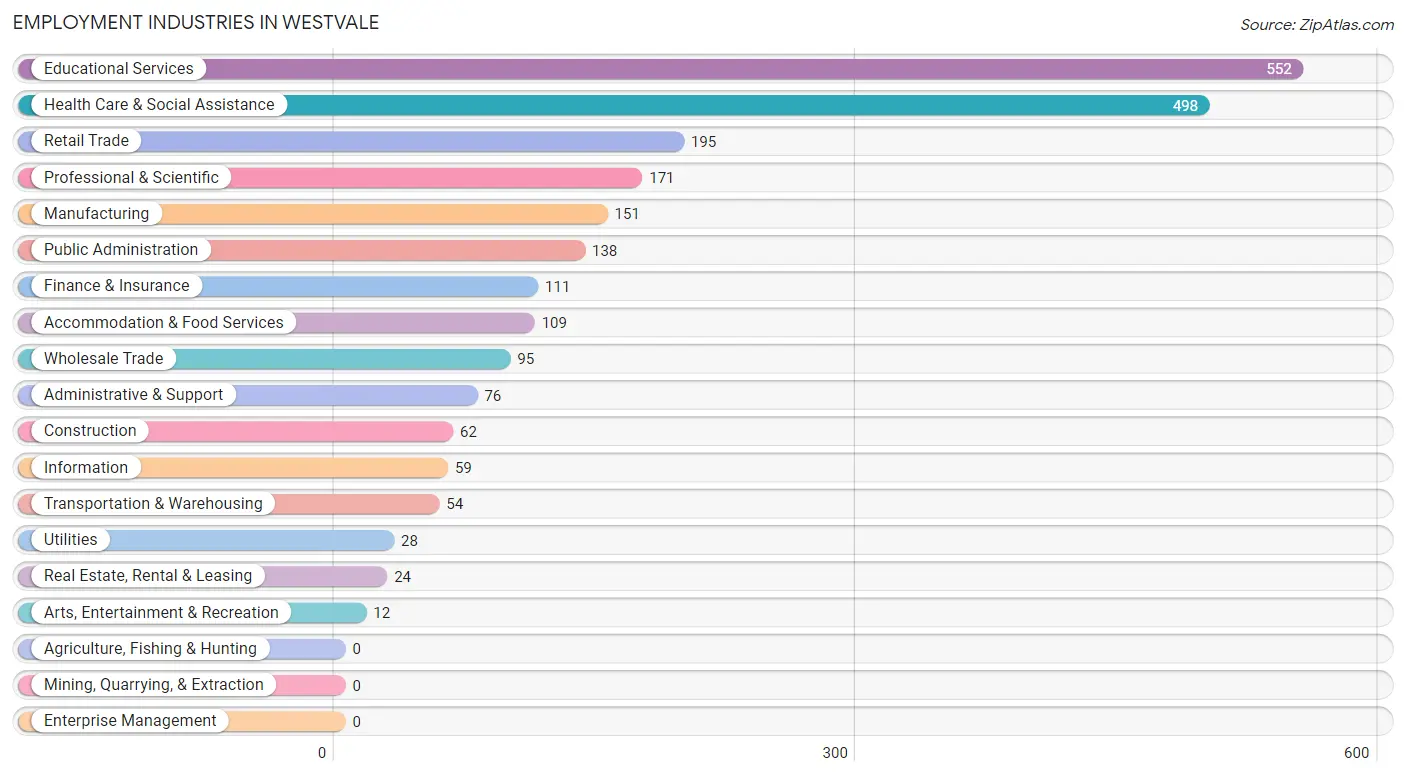
Employment Industries in Westvale
The major employment industries in Westvale include Educational Services (552 | 22.8%), Health Care & Social Assistance (498 | 20.5%), Retail Trade (195 | 8.1%), Professional & Scientific (171 | 7.1%), and Manufacturing (151 | 6.2%).
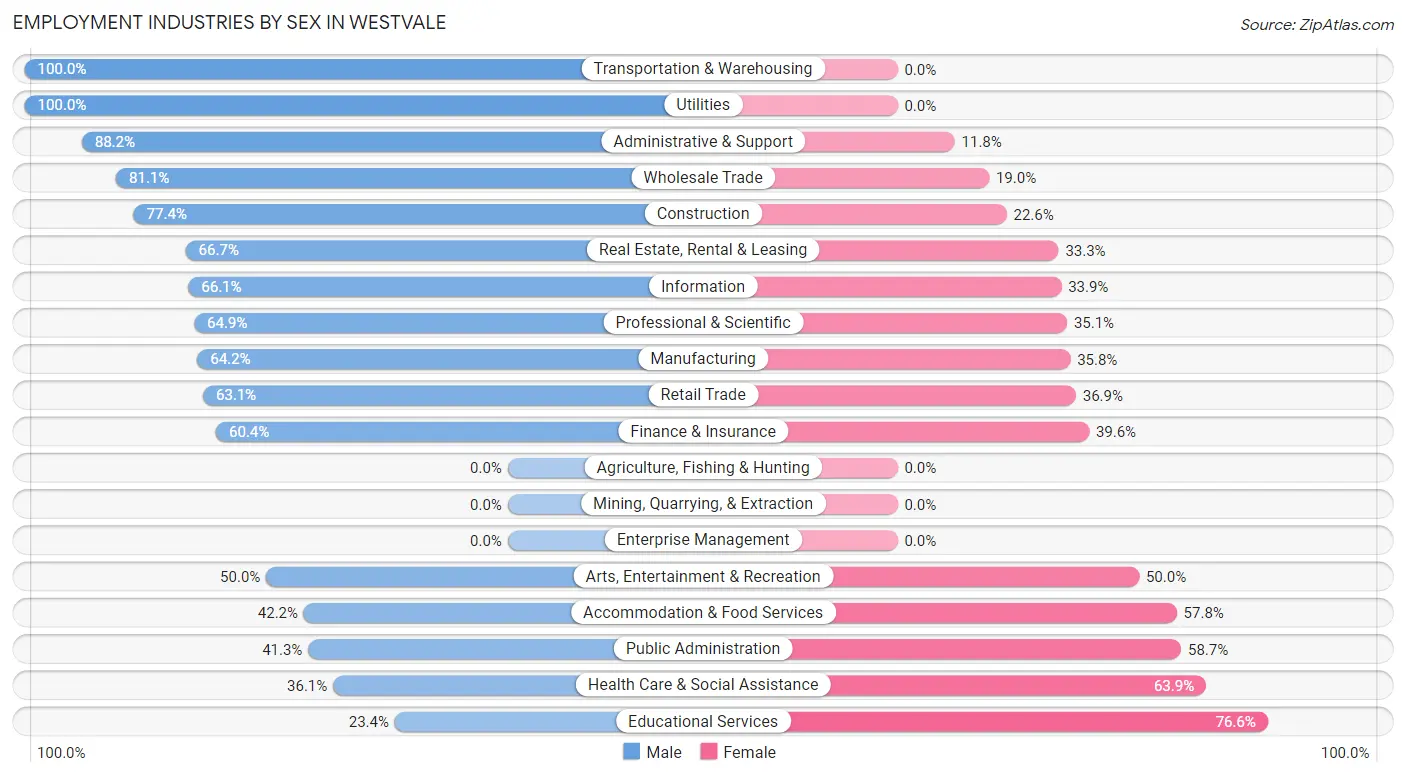
Employment Industries by Sex in Westvale
The Westvale industries that see more men than women are Transportation & Warehousing (100.0%), Utilities (100.0%), and Administrative & Support (88.2%), whereas the industries that tend to have a higher number of women are Educational Services (76.6%), Health Care & Social Assistance (63.9%), and Public Administration (58.7%).
| Industry | Male | Female |
| Agriculture, Fishing & Hunting | 0 (0.0%) | 0 (0.0%) |
| Mining, Quarrying, & Extraction | 0 (0.0%) | 0 (0.0%) |
| Construction | 48 (77.4%) | 14 (22.6%) |
| Manufacturing | 97 (64.2%) | 54 (35.8%) |
| Wholesale Trade | 77 (81.0%) | 18 (19.0%) |
| Retail Trade | 123 (63.1%) | 72 (36.9%) |
| Transportation & Warehousing | 54 (100.0%) | 0 (0.0%) |
| Utilities | 28 (100.0%) | 0 (0.0%) |
| Information | 39 (66.1%) | 20 (33.9%) |
| Finance & Insurance | 67 (60.4%) | 44 (39.6%) |
| Real Estate, Rental & Leasing | 16 (66.7%) | 8 (33.3%) |
| Professional & Scientific | 111 (64.9%) | 60 (35.1%) |
| Enterprise Management | 0 (0.0%) | 0 (0.0%) |
| Administrative & Support | 67 (88.2%) | 9 (11.8%) |
| Educational Services | 129 (23.4%) | 423 (76.6%) |
| Health Care & Social Assistance | 180 (36.1%) | 318 (63.9%) |
| Arts, Entertainment & Recreation | 6 (50.0%) | 6 (50.0%) |
| Accommodation & Food Services | 46 (42.2%) | 63 (57.8%) |
| Public Administration | 57 (41.3%) | 81 (58.7%) |
| Total | 1,174 (48.4%) | 1,249 (51.5%) |
Education in Westvale
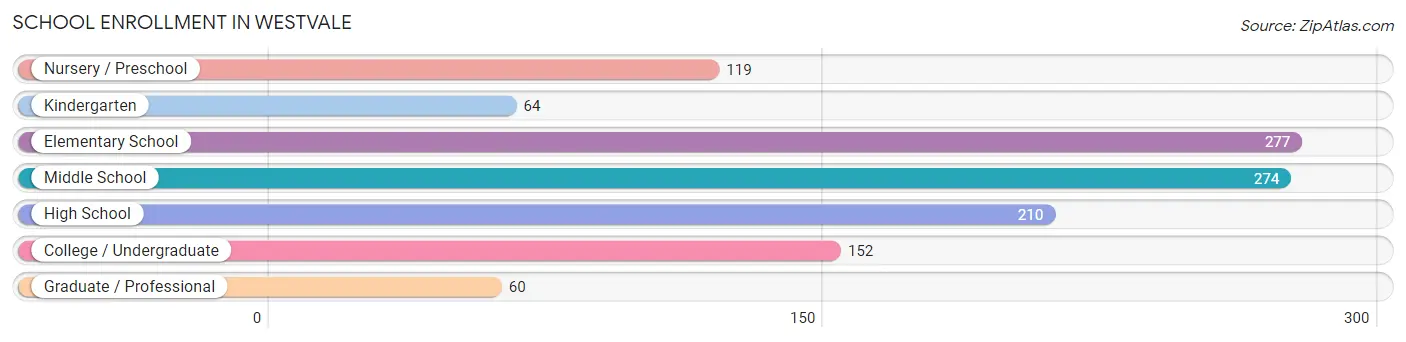
School Enrollment in Westvale
The most common levels of schooling among the 1,156 students in Westvale are elementary school (277 | 24.0%), middle school (274 | 23.7%), and high school (210 | 18.2%).
| School Level | # Students | % Students |
| Nursery / Preschool | 119 | 10.3% |
| Kindergarten | 64 | 5.5% |
| Elementary School | 277 | 24.0% |
| Middle School | 274 | 23.7% |
| High School | 210 | 18.2% |
| College / Undergraduate | 152 | 13.2% |
| Graduate / Professional | 60 | 5.2% |
| Total | 1,156 | 100.0% |
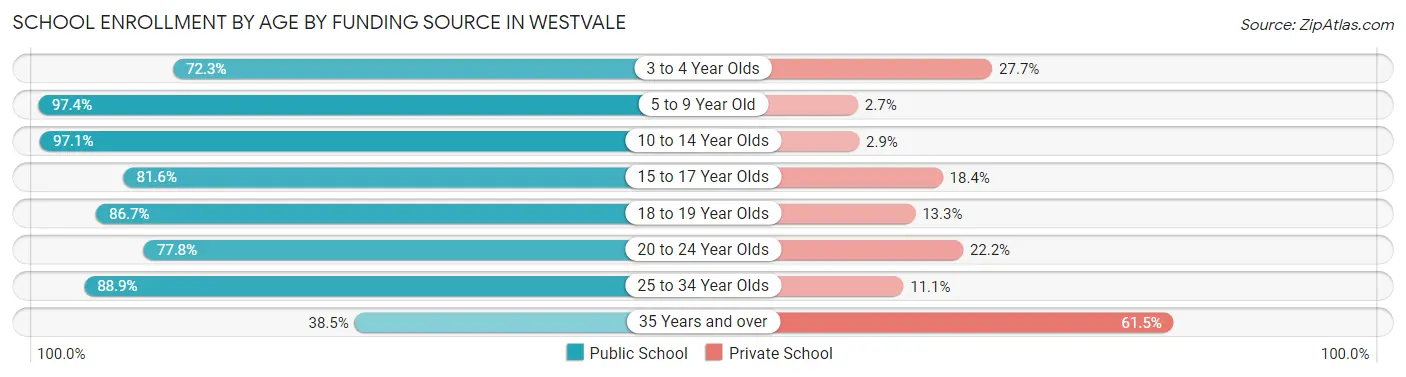
School Enrollment by Age by Funding Source in Westvale
Out of a total of 1,156 students who are enrolled in schools in Westvale, 160 (13.8%) attend a private institution, while the remaining 996 (86.2%) are enrolled in public schools. The age group of 35 years and over has the highest likelihood of being enrolled in private schools, with 59 (61.5% in the age bracket) enrolled. Conversely, the age group of 5 to 9 year old has the lowest likelihood of being enrolled in a private school, with 330 (97.4% in the age bracket) attending a public institution.
| Age Bracket | Public School | Private School |
| 3 to 4 Year Olds | 68 (72.3%) | 26 (27.7%) |
| 5 to 9 Year Old | 330 (97.4%) | 9 (2.6%) |
| 10 to 14 Year Olds | 304 (97.1%) | 9 (2.9%) |
| 15 to 17 Year Olds | 146 (81.6%) | 33 (18.4%) |
| 18 to 19 Year Olds | 39 (86.7%) | 6 (13.3%) |
| 20 to 24 Year Olds | 49 (77.8%) | 14 (22.2%) |
| 25 to 34 Year Olds | 24 (88.9%) | 3 (11.1%) |
| 35 Years and over | 37 (38.5%) | 59 (61.5%) |
| Total | 996 (86.2%) | 160 (13.8%) |
Educational Attainment by Field of Study in Westvale
Business (308 | 14.5%), education (264 | 12.4%), social sciences (215 | 10.1%), liberal arts & history (207 | 9.7%), and science & technology (166 | 7.8%) are the most common fields of study among 2,125 individuals in Westvale who have obtained a bachelor's degree or higher.
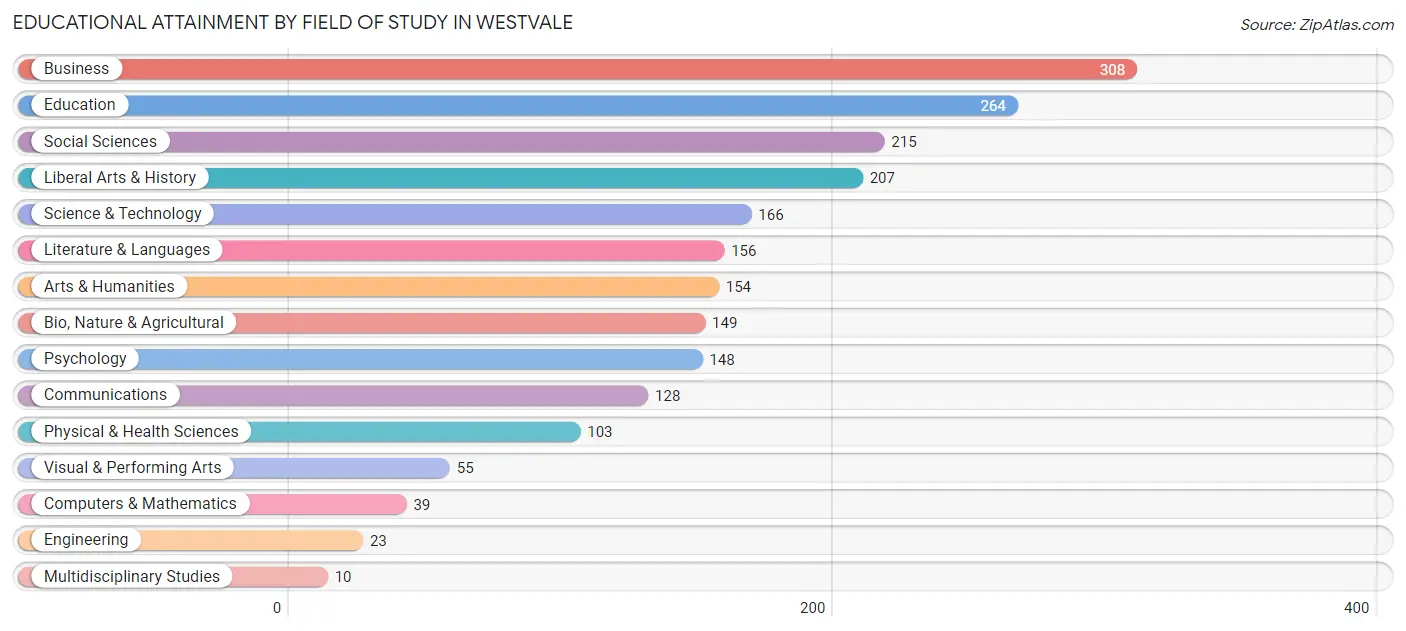
| Field of Study | # Graduates | % Graduates |
| Computers & Mathematics | 39 | 1.8% |
| Bio, Nature & Agricultural | 149 | 7.0% |
| Physical & Health Sciences | 103 | 4.9% |
| Psychology | 148 | 7.0% |
| Social Sciences | 215 | 10.1% |
| Engineering | 23 | 1.1% |
| Multidisciplinary Studies | 10 | 0.5% |
| Science & Technology | 166 | 7.8% |
| Business | 308 | 14.5% |
| Education | 264 | 12.4% |
| Literature & Languages | 156 | 7.3% |
| Liberal Arts & History | 207 | 9.7% |
| Visual & Performing Arts | 55 | 2.6% |
| Communications | 128 | 6.0% |
| Arts & Humanities | 154 | 7.2% |
| Total | 2,125 | 100.0% |
Transportation & Commute in Westvale
Vehicle Availability by Sex in Westvale
The most prevalent vehicle ownership categories in Westvale are males with 2 vehicles (713, accounting for 62.6%) and females with 2 vehicles (693, making up 60.1%).
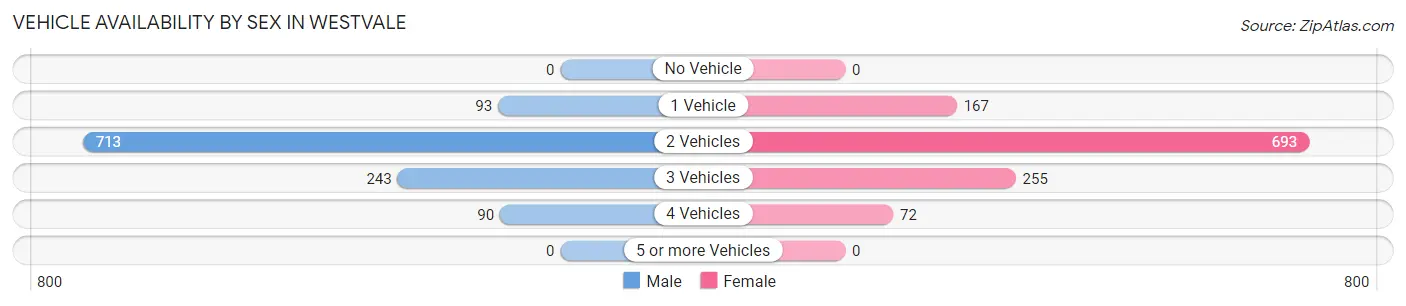
| Vehicles Available | Male | Female |
| No Vehicle | 0 (0.0%) | 0 (0.0%) |
| 1 Vehicle | 93 (8.2%) | 167 (14.1%) |
| 2 Vehicles | 713 (62.6%) | 693 (58.4%) |
| 3 Vehicles | 243 (21.3%) | 255 (21.5%) |
| 4 Vehicles | 90 (7.9%) | 72 (6.1%) |
| 5 or more Vehicles | 0 (0.0%) | 0 (0.0%) |
| Total | 1,139 (100.0%) | 1,187 (100.0%) |
Commute Time in Westvale
The most frequently occuring commute durations in Westvale are 15 to 19 minutes (477 commuters, 22.8%), 20 to 24 minutes (446 commuters, 21.3%), and 10 to 14 minutes (433 commuters, 20.6%).
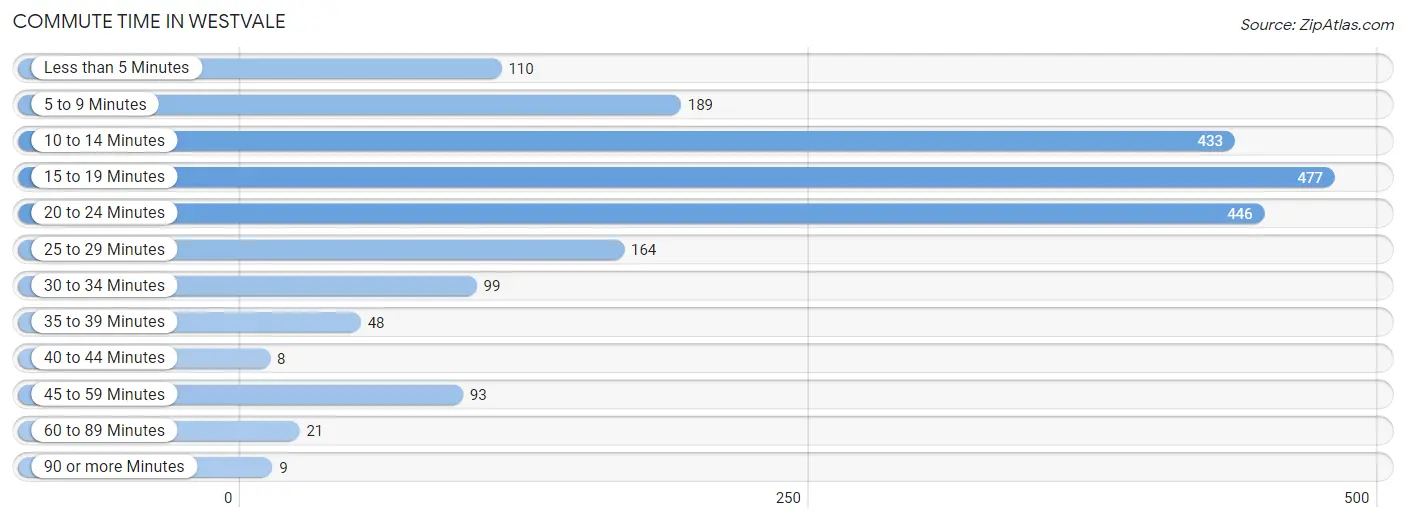
| Commute Time | # Commuters | % Commuters |
| Less than 5 Minutes | 110 | 5.2% |
| 5 to 9 Minutes | 189 | 9.0% |
| 10 to 14 Minutes | 433 | 20.6% |
| 15 to 19 Minutes | 477 | 22.8% |
| 20 to 24 Minutes | 446 | 21.3% |
| 25 to 29 Minutes | 164 | 7.8% |
| 30 to 34 Minutes | 99 | 4.7% |
| 35 to 39 Minutes | 48 | 2.3% |
| 40 to 44 Minutes | 8 | 0.4% |
| 45 to 59 Minutes | 93 | 4.4% |
| 60 to 89 Minutes | 21 | 1.0% |
| 90 or more Minutes | 9 | 0.4% |
Commute Time by Sex in Westvale
The most common commute times in Westvale are 15 to 19 minutes (262 commuters, 25.7%) for males and 10 to 14 minutes (284 commuters, 26.4%) for females.
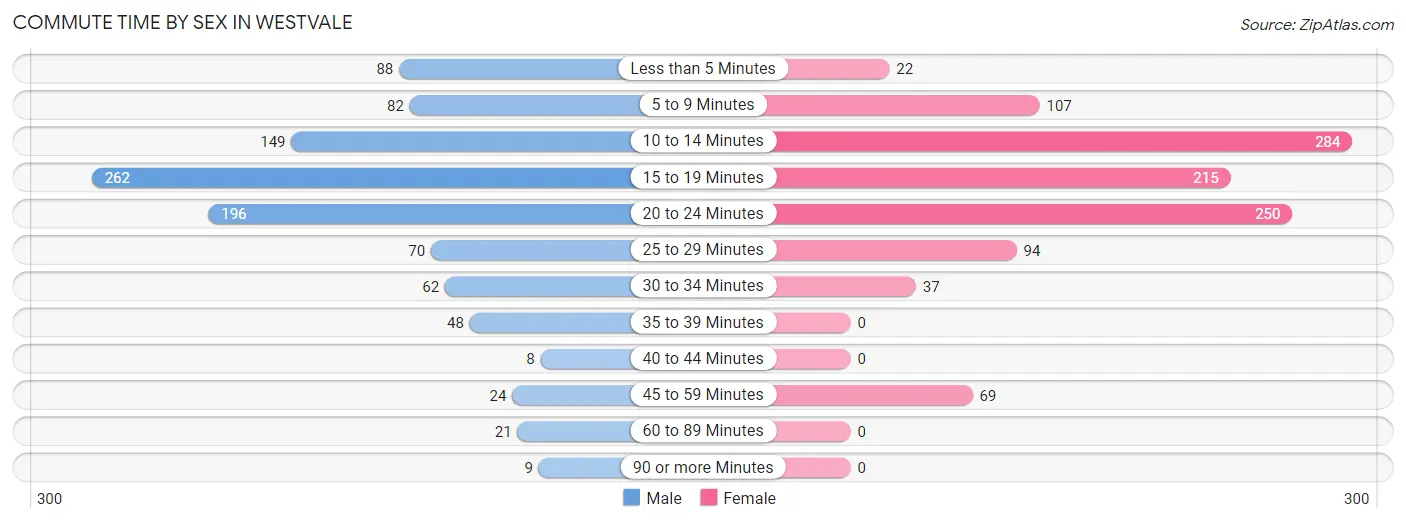
| Commute Time | Male | Female |
| Less than 5 Minutes | 88 (8.6%) | 22 (2.0%) |
| 5 to 9 Minutes | 82 (8.1%) | 107 (9.9%) |
| 10 to 14 Minutes | 149 (14.6%) | 284 (26.4%) |
| 15 to 19 Minutes | 262 (25.7%) | 215 (19.9%) |
| 20 to 24 Minutes | 196 (19.2%) | 250 (23.2%) |
| 25 to 29 Minutes | 70 (6.9%) | 94 (8.7%) |
| 30 to 34 Minutes | 62 (6.1%) | 37 (3.4%) |
| 35 to 39 Minutes | 48 (4.7%) | 0 (0.0%) |
| 40 to 44 Minutes | 8 (0.8%) | 0 (0.0%) |
| 45 to 59 Minutes | 24 (2.4%) | 69 (6.4%) |
| 60 to 89 Minutes | 21 (2.1%) | 0 (0.0%) |
| 90 or more Minutes | 9 (0.9%) | 0 (0.0%) |
Time of Departure to Work by Sex in Westvale
The most frequent times of departure to work in Westvale are 7:00 AM to 7:29 AM (212, 20.8%) for males and 7:30 AM to 7:59 AM (311, 28.8%) for females.
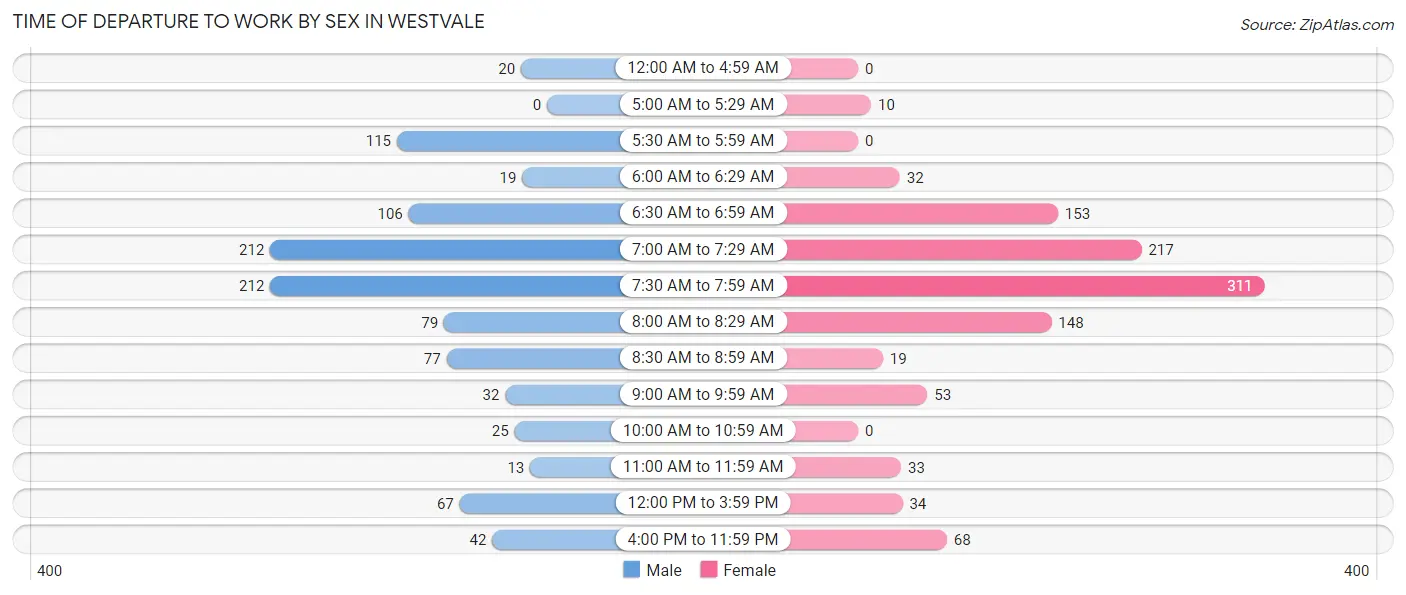
| Time of Departure | Male | Female |
| 12:00 AM to 4:59 AM | 20 (2.0%) | 0 (0.0%) |
| 5:00 AM to 5:29 AM | 0 (0.0%) | 10 (0.9%) |
| 5:30 AM to 5:59 AM | 115 (11.3%) | 0 (0.0%) |
| 6:00 AM to 6:29 AM | 19 (1.9%) | 32 (3.0%) |
| 6:30 AM to 6:59 AM | 106 (10.4%) | 153 (14.2%) |
| 7:00 AM to 7:29 AM | 212 (20.8%) | 217 (20.1%) |
| 7:30 AM to 7:59 AM | 212 (20.8%) | 311 (28.8%) |
| 8:00 AM to 8:29 AM | 79 (7.7%) | 148 (13.7%) |
| 8:30 AM to 8:59 AM | 77 (7.6%) | 19 (1.8%) |
| 9:00 AM to 9:59 AM | 32 (3.1%) | 53 (4.9%) |
| 10:00 AM to 10:59 AM | 25 (2.5%) | 0 (0.0%) |
| 11:00 AM to 11:59 AM | 13 (1.3%) | 33 (3.1%) |
| 12:00 PM to 3:59 PM | 67 (6.6%) | 34 (3.2%) |
| 4:00 PM to 11:59 PM | 42 (4.1%) | 68 (6.3%) |
| Total | 1,019 (100.0%) | 1,078 (100.0%) |
Housing Occupancy in Westvale
Occupancy by Ownership in Westvale
Of the total 1,955 dwellings in Westvale, owner-occupied units account for 1,888 (96.6%), while renter-occupied units make up 67 (3.4%).
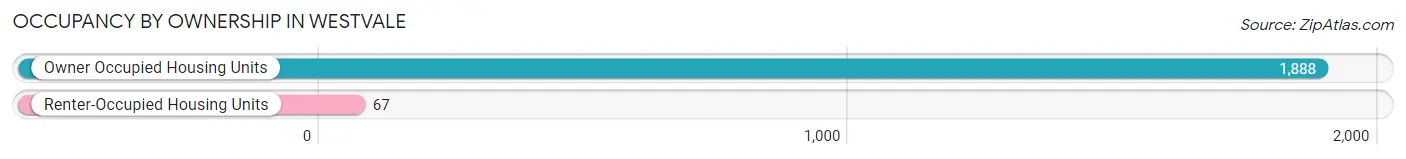
| Occupancy | # Housing Units | % Housing Units |
| Owner Occupied Housing Units | 1,888 | 96.6% |
| Renter-Occupied Housing Units | 67 | 3.4% |
| Total Occupied Housing Units | 1,955 | 100.0% |
Occupancy by Household Size in Westvale
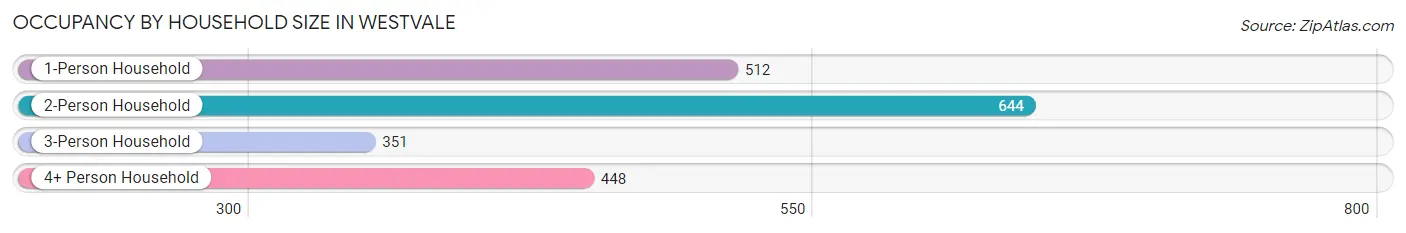
| Household Size | # Housing Units | % Housing Units |
| 1-Person Household | 512 | 26.2% |
| 2-Person Household | 644 | 32.9% |
| 3-Person Household | 351 | 17.9% |
| 4+ Person Household | 448 | 22.9% |
| Total Housing Units | 1,955 | 100.0% |
Occupancy by Ownership by Household Size in Westvale
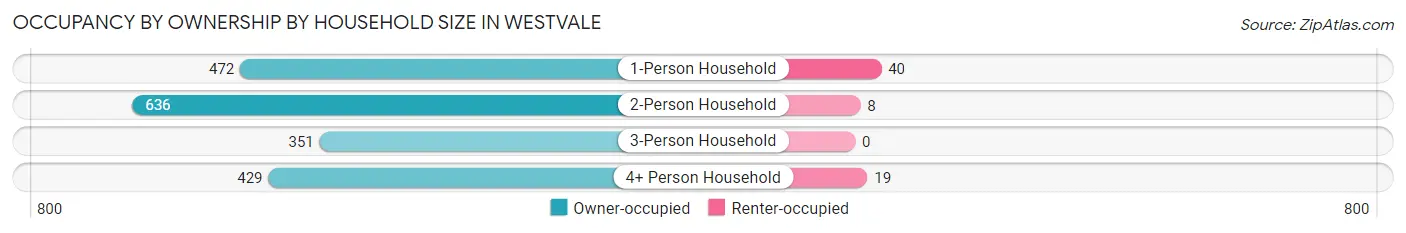
| Household Size | Owner-occupied | Renter-occupied |
| 1-Person Household | 472 (92.2%) | 40 (7.8%) |
| 2-Person Household | 636 (98.8%) | 8 (1.2%) |
| 3-Person Household | 351 (100.0%) | 0 (0.0%) |
| 4+ Person Household | 429 (95.8%) | 19 (4.2%) |
| Total Housing Units | 1,888 (96.6%) | 67 (3.4%) |
Occupancy by Educational Attainment in Westvale
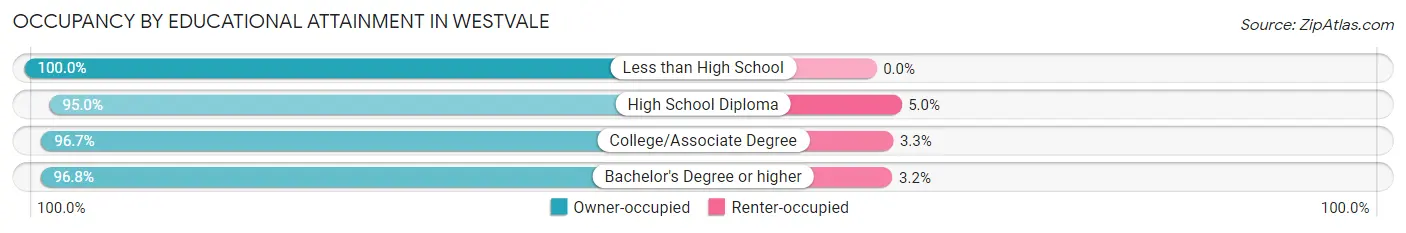
| Household Size | Owner-occupied | Renter-occupied |
| Less than High School | 38 (100.0%) | 0 (0.0%) |
| High School Diploma | 287 (95.0%) | 15 (5.0%) |
| College/Associate Degree | 465 (96.7%) | 16 (3.3%) |
| Bachelor's Degree or higher | 1,098 (96.8%) | 36 (3.2%) |
Occupancy by Age of Householder in Westvale
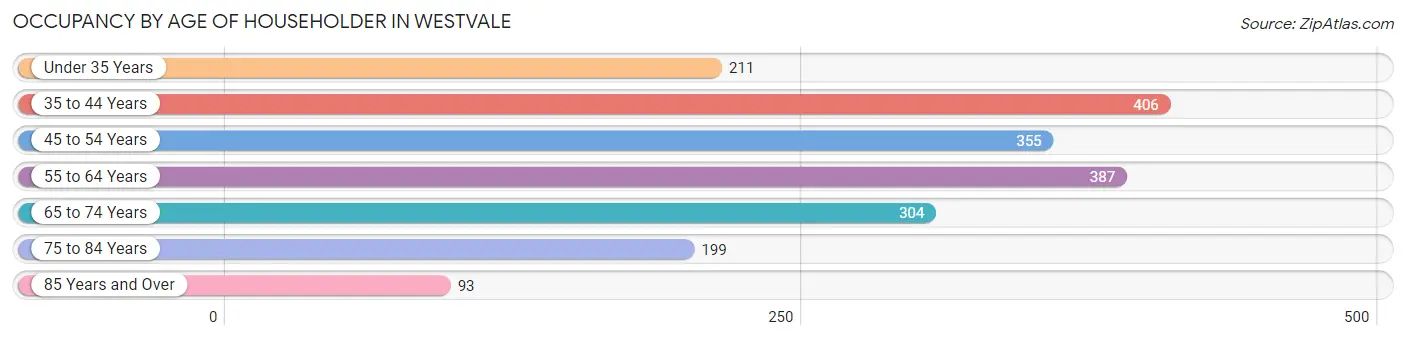
| Age Bracket | # Households | % Households |
| Under 35 Years | 211 | 10.8% |
| 35 to 44 Years | 406 | 20.8% |
| 45 to 54 Years | 355 | 18.2% |
| 55 to 64 Years | 387 | 19.8% |
| 65 to 74 Years | 304 | 15.5% |
| 75 to 84 Years | 199 | 10.2% |
| 85 Years and Over | 93 | 4.8% |
| Total | 1,955 | 100.0% |
Housing Finances in Westvale
Median Income by Occupancy in Westvale
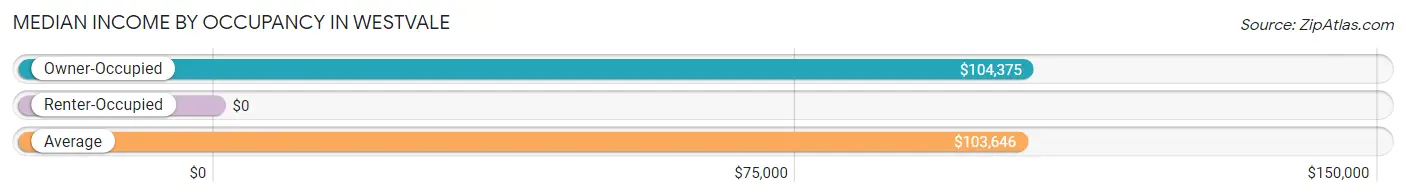
| Occupancy Type | # Households | Median Income |
| Owner-Occupied | 1,888 (96.6%) | $104,375 |
| Renter-Occupied | 67 (3.4%) | $0 |
| Average | 1,955 (100.0%) | $103,646 |
Occupancy by Householder Income Bracket in Westvale
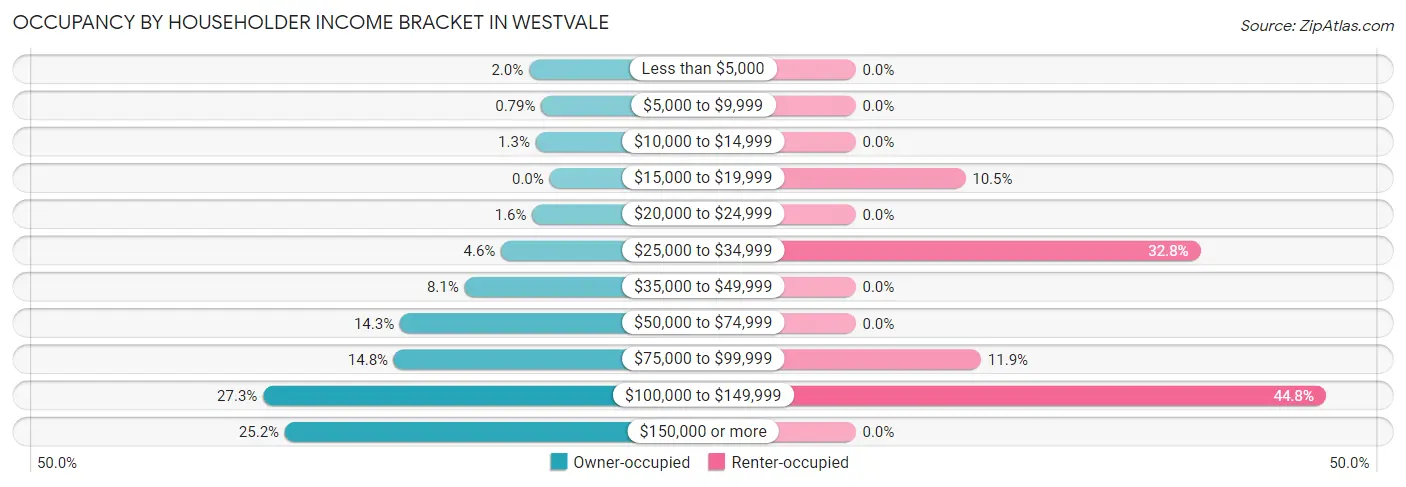
| Income Bracket | Owner-occupied | Renter-occupied |
| Less than $5,000 | 37 (2.0%) | 0 (0.0%) |
| $5,000 to $9,999 | 15 (0.8%) | 0 (0.0%) |
| $10,000 to $14,999 | 25 (1.3%) | 0 (0.0%) |
| $15,000 to $19,999 | 0 (0.0%) | 7 (10.4%) |
| $20,000 to $24,999 | 31 (1.6%) | 0 (0.0%) |
| $25,000 to $34,999 | 87 (4.6%) | 22 (32.8%) |
| $35,000 to $49,999 | 153 (8.1%) | 0 (0.0%) |
| $50,000 to $74,999 | 269 (14.2%) | 0 (0.0%) |
| $75,000 to $99,999 | 280 (14.8%) | 8 (11.9%) |
| $100,000 to $149,999 | 515 (27.3%) | 30 (44.8%) |
| $150,000 or more | 476 (25.2%) | 0 (0.0%) |
| Total | 1,888 (100.0%) | 67 (100.0%) |
Monthly Housing Cost Tiers in Westvale
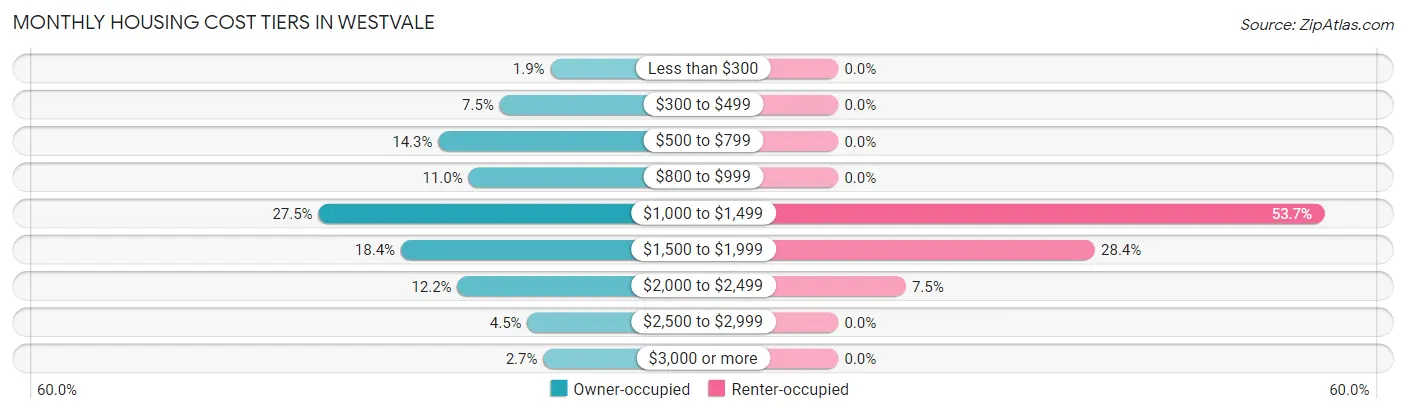
| Monthly Cost | Owner-occupied | Renter-occupied |
| Less than $300 | 36 (1.9%) | 0 (0.0%) |
| $300 to $499 | 142 (7.5%) | 0 (0.0%) |
| $500 to $799 | 270 (14.3%) | 0 (0.0%) |
| $800 to $999 | 207 (11.0%) | 0 (0.0%) |
| $1,000 to $1,499 | 520 (27.5%) | 36 (53.7%) |
| $1,500 to $1,999 | 348 (18.4%) | 19 (28.4%) |
| $2,000 to $2,499 | 230 (12.2%) | 5 (7.5%) |
| $2,500 to $2,999 | 84 (4.4%) | 0 (0.0%) |
| $3,000 or more | 51 (2.7%) | 0 (0.0%) |
| Total | 1,888 (100.0%) | 67 (100.0%) |
Physical Housing Characteristics in Westvale
Housing Structures in Westvale
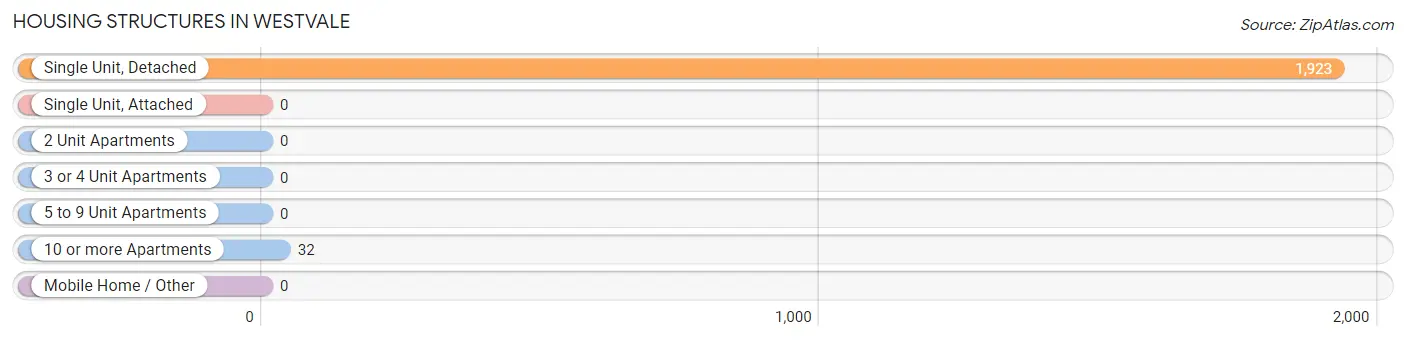
| Structure Type | # Housing Units | % Housing Units |
| Single Unit, Detached | 1,923 | 98.4% |
| Single Unit, Attached | 0 | 0.0% |
| 2 Unit Apartments | 0 | 0.0% |
| 3 or 4 Unit Apartments | 0 | 0.0% |
| 5 to 9 Unit Apartments | 0 | 0.0% |
| 10 or more Apartments | 32 | 1.6% |
| Mobile Home / Other | 0 | 0.0% |
| Total | 1,955 | 100.0% |
Housing Structures by Occupancy in Westvale
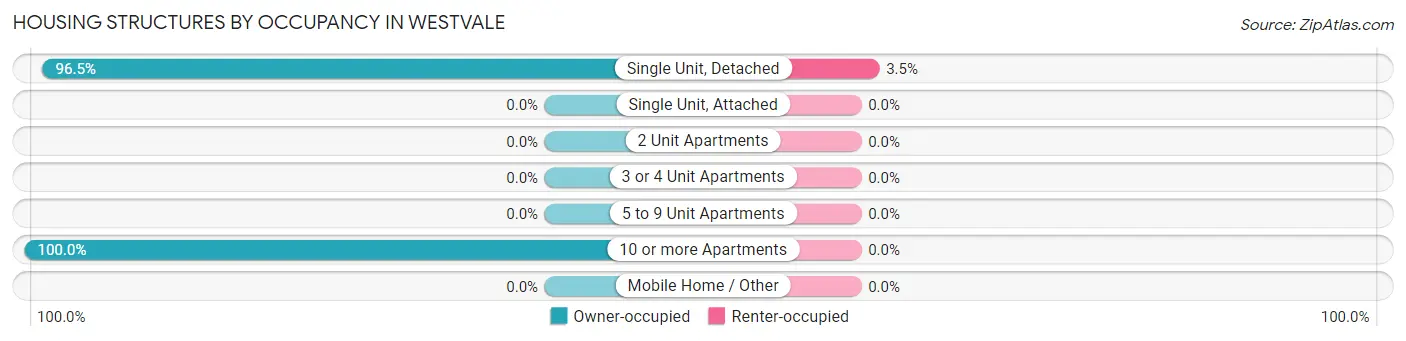
| Structure Type | Owner-occupied | Renter-occupied |
| Single Unit, Detached | 1,856 (96.5%) | 67 (3.5%) |
| Single Unit, Attached | 0 (0.0%) | 0 (0.0%) |
| 2 Unit Apartments | 0 (0.0%) | 0 (0.0%) |
| 3 or 4 Unit Apartments | 0 (0.0%) | 0 (0.0%) |
| 5 to 9 Unit Apartments | 0 (0.0%) | 0 (0.0%) |
| 10 or more Apartments | 32 (100.0%) | 0 (0.0%) |
| Mobile Home / Other | 0 (0.0%) | 0 (0.0%) |
| Total | 1,888 (96.6%) | 67 (3.4%) |
Housing Structures by Number of Rooms in Westvale
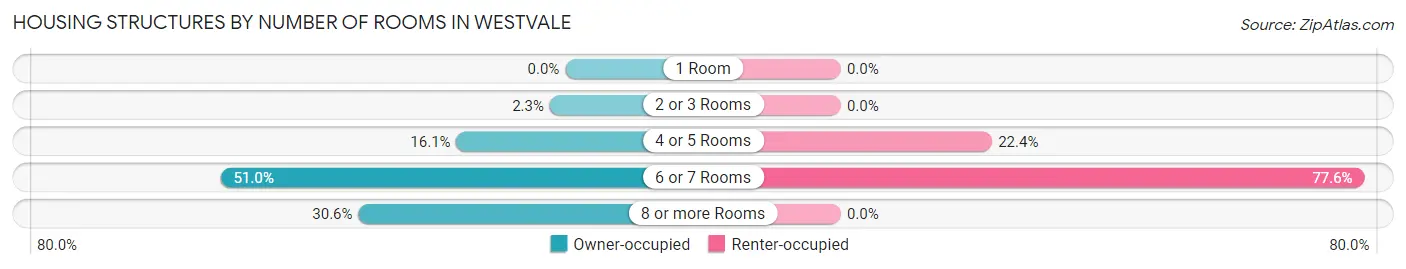
| Number of Rooms | Owner-occupied | Renter-occupied |
| 1 Room | 0 (0.0%) | 0 (0.0%) |
| 2 or 3 Rooms | 43 (2.3%) | 0 (0.0%) |
| 4 or 5 Rooms | 304 (16.1%) | 15 (22.4%) |
| 6 or 7 Rooms | 963 (51.0%) | 52 (77.6%) |
| 8 or more Rooms | 578 (30.6%) | 0 (0.0%) |
| Total | 1,888 (100.0%) | 67 (100.0%) |
Housing Structure by Heating Type in Westvale
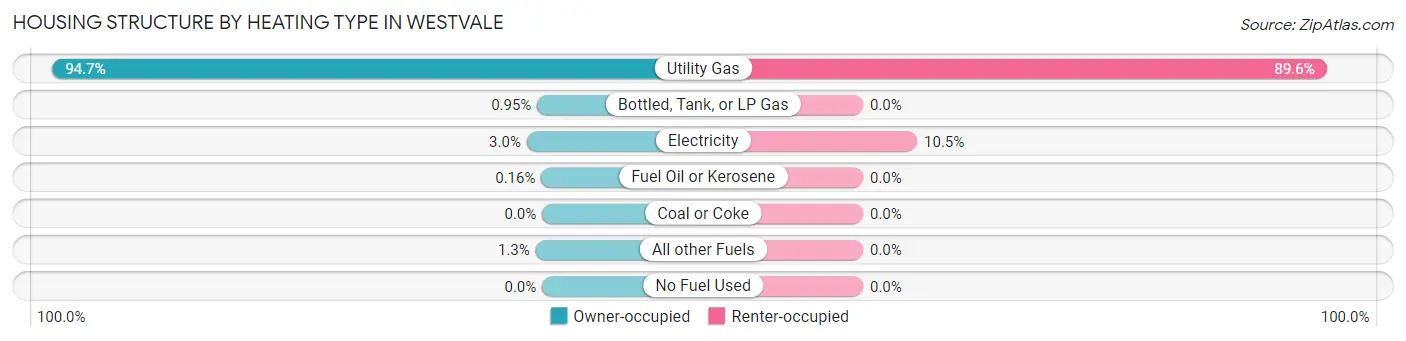
| Heating Type | Owner-occupied | Renter-occupied |
| Utility Gas | 1,787 (94.7%) | 60 (89.5%) |
| Bottled, Tank, or LP Gas | 18 (0.9%) | 0 (0.0%) |
| Electricity | 56 (3.0%) | 7 (10.4%) |
| Fuel Oil or Kerosene | 3 (0.2%) | 0 (0.0%) |
| Coal or Coke | 0 (0.0%) | 0 (0.0%) |
| All other Fuels | 24 (1.3%) | 0 (0.0%) |
| No Fuel Used | 0 (0.0%) | 0 (0.0%) |
| Total | 1,888 (100.0%) | 67 (100.0%) |
Household Vehicle Usage in Westvale
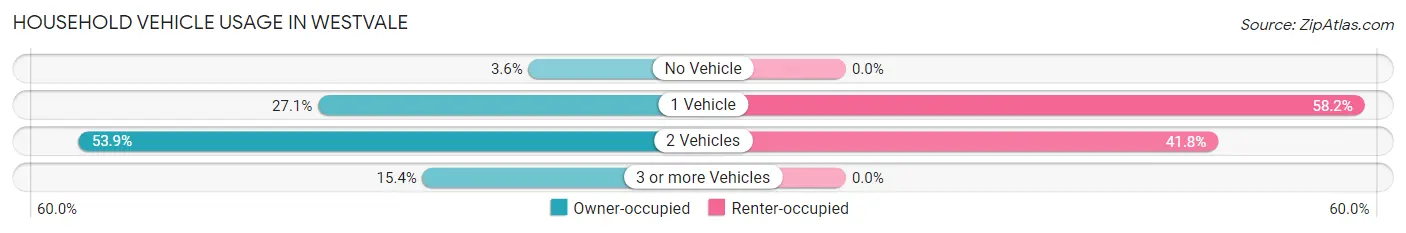
| Vehicles per Household | Owner-occupied | Renter-occupied |
| No Vehicle | 67 (3.5%) | 0 (0.0%) |
| 1 Vehicle | 512 (27.1%) | 39 (58.2%) |
| 2 Vehicles | 1,018 (53.9%) | 28 (41.8%) |
| 3 or more Vehicles | 291 (15.4%) | 0 (0.0%) |
| Total | 1,888 (100.0%) | 67 (100.0%) |
Real Estate & Mortgages in Westvale
Real Estate and Mortgage Overview in Westvale
| Characteristic | Without Mortgage | With Mortgage |
| Housing Units | 609 | 1,279 |
| Median Property Value | $180,300 | $180,400 |
| Median Household Income | $71,094 | $392 |
| Monthly Housing Costs | $706 | $51 |
| Real Estate Taxes | $5,119 | $14 |
Property Value by Mortgage Status in Westvale
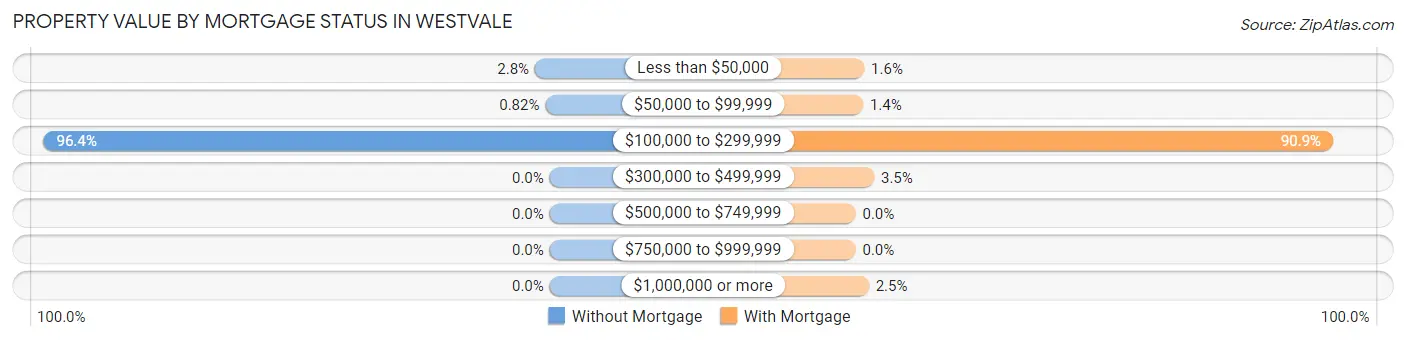
| Property Value | Without Mortgage | With Mortgage |
| Less than $50,000 | 17 (2.8%) | 21 (1.6%) |
| $50,000 to $99,999 | 5 (0.8%) | 18 (1.4%) |
| $100,000 to $299,999 | 587 (96.4%) | 1,163 (90.9%) |
| $300,000 to $499,999 | 0 (0.0%) | 45 (3.5%) |
| $500,000 to $749,999 | 0 (0.0%) | 0 (0.0%) |
| $750,000 to $999,999 | 0 (0.0%) | 0 (0.0%) |
| $1,000,000 or more | 0 (0.0%) | 32 (2.5%) |
| Total | 609 (100.0%) | 1,279 (100.0%) |
Household Income by Mortgage Status in Westvale
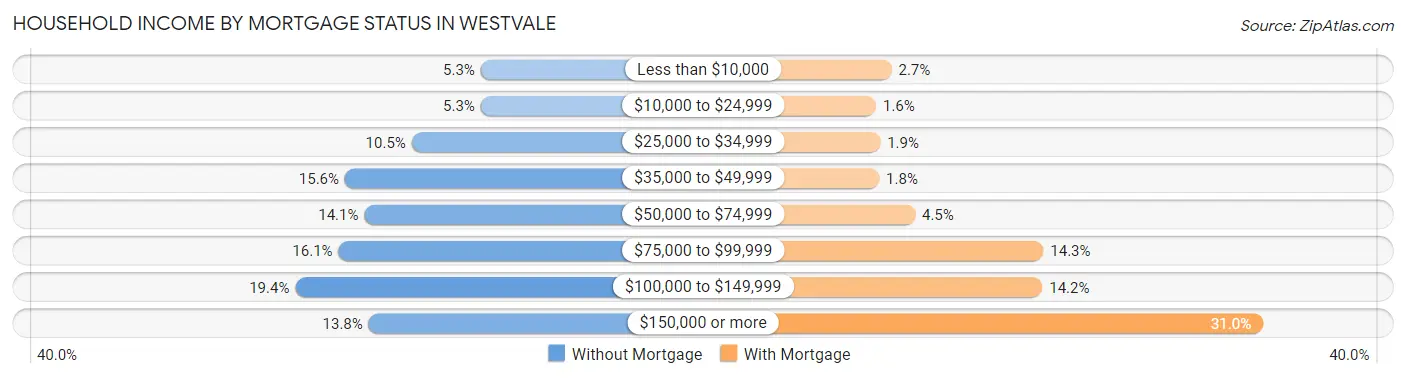
| Household Income | Without Mortgage | With Mortgage |
| Less than $10,000 | 32 (5.2%) | 35 (2.7%) |
| $10,000 to $24,999 | 32 (5.2%) | 20 (1.6%) |
| $25,000 to $34,999 | 64 (10.5%) | 24 (1.9%) |
| $35,000 to $49,999 | 95 (15.6%) | 23 (1.8%) |
| $50,000 to $74,999 | 86 (14.1%) | 58 (4.5%) |
| $75,000 to $99,999 | 98 (16.1%) | 183 (14.3%) |
| $100,000 to $149,999 | 118 (19.4%) | 182 (14.2%) |
| $150,000 or more | 84 (13.8%) | 397 (31.0%) |
| Total | 609 (100.0%) | 1,279 (100.0%) |
Property Value to Household Income Ratio in Westvale
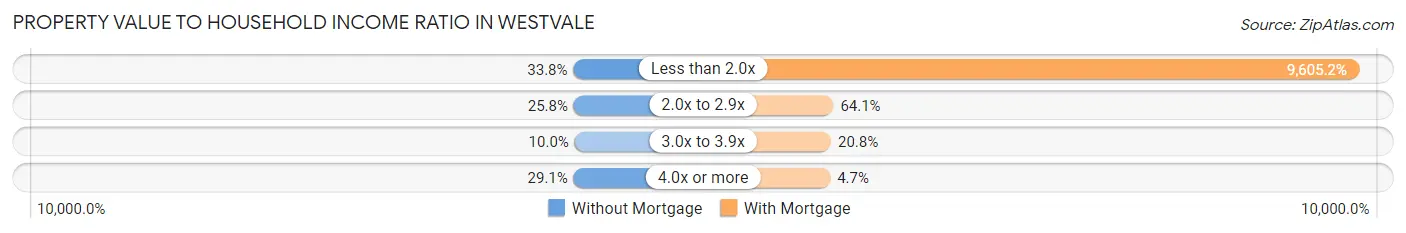
| Value-to-Income Ratio | Without Mortgage | With Mortgage |
| Less than 2.0x | 206 (33.8%) | 122,850 (9,605.2%) |
| 2.0x to 2.9x | 157 (25.8%) | 820 (64.1%) |
| 3.0x to 3.9x | 61 (10.0%) | 266 (20.8%) |
| 4.0x or more | 177 (29.1%) | 60 (4.7%) |
| Total | 609 (100.0%) | 1,279 (100.0%) |
Real Estate Taxes by Mortgage Status in Westvale
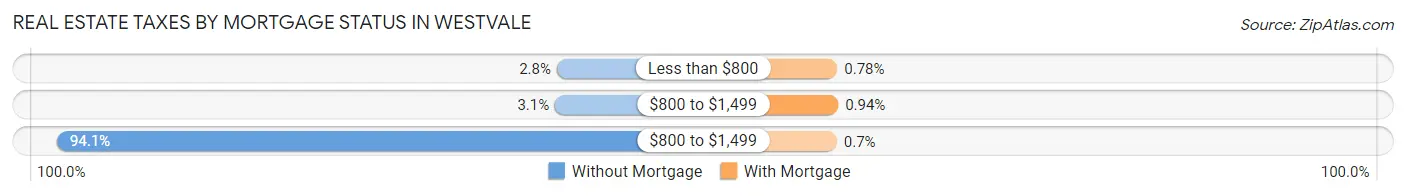
| Property Taxes | Without Mortgage | With Mortgage |
| Less than $800 | 17 (2.8%) | 10 (0.8%) |
| $800 to $1,499 | 19 (3.1%) | 12 (0.9%) |
| $800 to $1,499 | 573 (94.1%) | 9 (0.7%) |
| Total | 609 (100.0%) | 1,279 (100.0%) |
Health & Disability in Westvale
Health Insurance Coverage by Age in Westvale
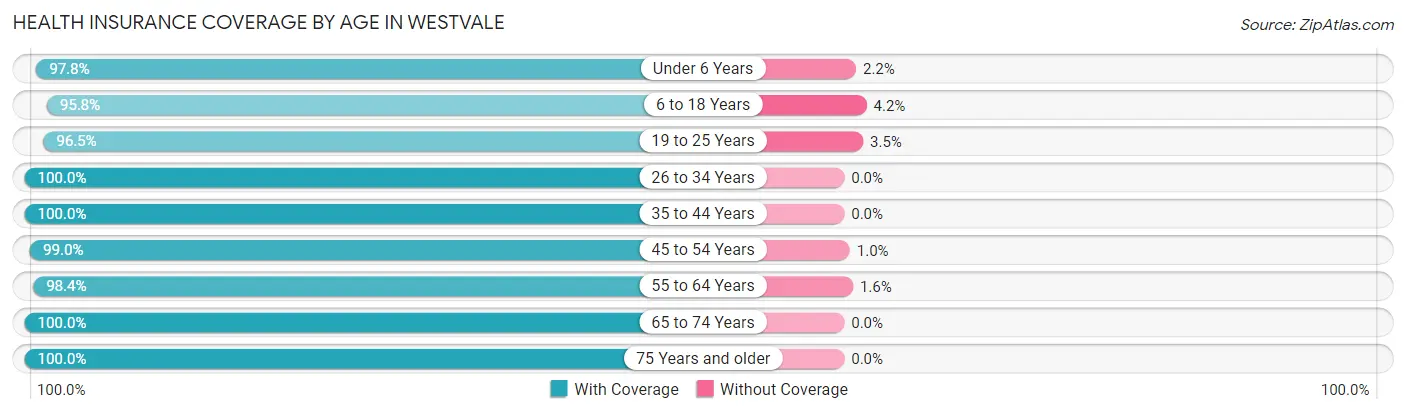
| Age Bracket | With Coverage | Without Coverage |
| Under 6 Years | 357 (97.8%) | 8 (2.2%) |
| 6 to 18 Years | 830 (95.8%) | 36 (4.2%) |
| 19 to 25 Years | 220 (96.5%) | 8 (3.5%) |
| 26 to 34 Years | 480 (100.0%) | 0 (0.0%) |
| 35 to 44 Years | 685 (100.0%) | 0 (0.0%) |
| 45 to 54 Years | 666 (99.0%) | 7 (1.0%) |
| 55 to 64 Years | 606 (98.4%) | 10 (1.6%) |
| 65 to 74 Years | 562 (100.0%) | 0 (0.0%) |
| 75 Years and older | 453 (100.0%) | 0 (0.0%) |
| Total | 4,859 (98.6%) | 69 (1.4%) |
Health Insurance Coverage by Citizenship Status in Westvale
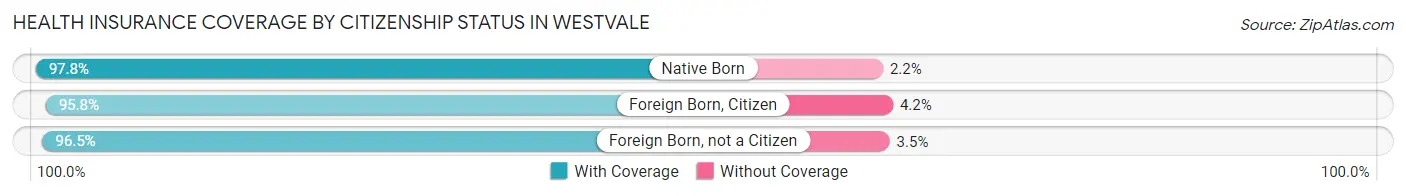
| Citizenship Status | With Coverage | Without Coverage |
| Native Born | 357 (97.8%) | 8 (2.2%) |
| Foreign Born, Citizen | 830 (95.8%) | 36 (4.2%) |
| Foreign Born, not a Citizen | 220 (96.5%) | 8 (3.5%) |
Health Insurance Coverage by Household Income in Westvale
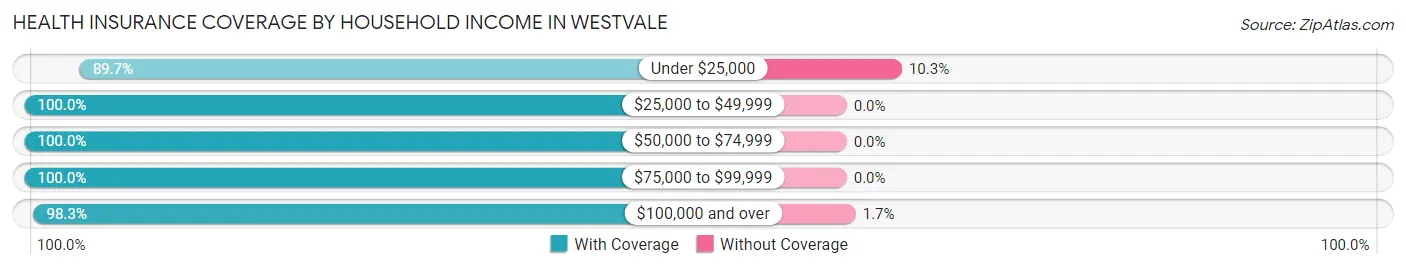
| Household Income | With Coverage | Without Coverage |
| Under $25,000 | 156 (89.7%) | 18 (10.3%) |
| $25,000 to $49,999 | 344 (100.0%) | 0 (0.0%) |
| $50,000 to $74,999 | 479 (100.0%) | 0 (0.0%) |
| $75,000 to $99,999 | 890 (100.0%) | 0 (0.0%) |
| $100,000 and over | 2,982 (98.3%) | 51 (1.7%) |
Public vs Private Health Insurance Coverage by Age in Westvale
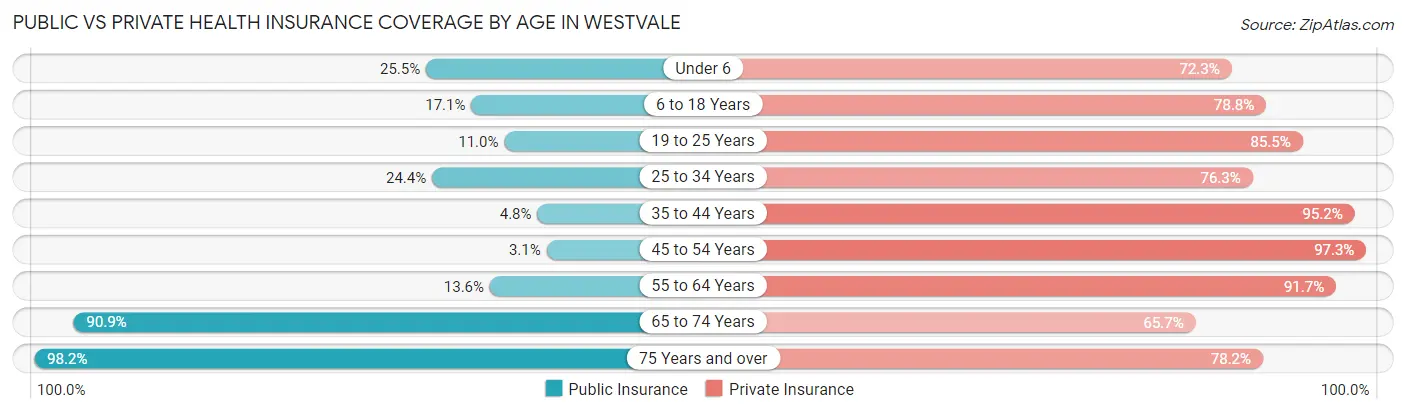
| Age Bracket | Public Insurance | Private Insurance |
| Under 6 | 93 (25.5%) | 264 (72.3%) |
| 6 to 18 Years | 148 (17.1%) | 682 (78.7%) |
| 19 to 25 Years | 25 (11.0%) | 195 (85.5%) |
| 25 to 34 Years | 117 (24.4%) | 366 (76.2%) |
| 35 to 44 Years | 33 (4.8%) | 652 (95.2%) |
| 45 to 54 Years | 21 (3.1%) | 655 (97.3%) |
| 55 to 64 Years | 84 (13.6%) | 565 (91.7%) |
| 65 to 74 Years | 511 (90.9%) | 369 (65.7%) |
| 75 Years and over | 445 (98.2%) | 354 (78.1%) |
| Total | 1,477 (30.0%) | 4,102 (83.2%) |
Disability Status by Sex by Age in Westvale
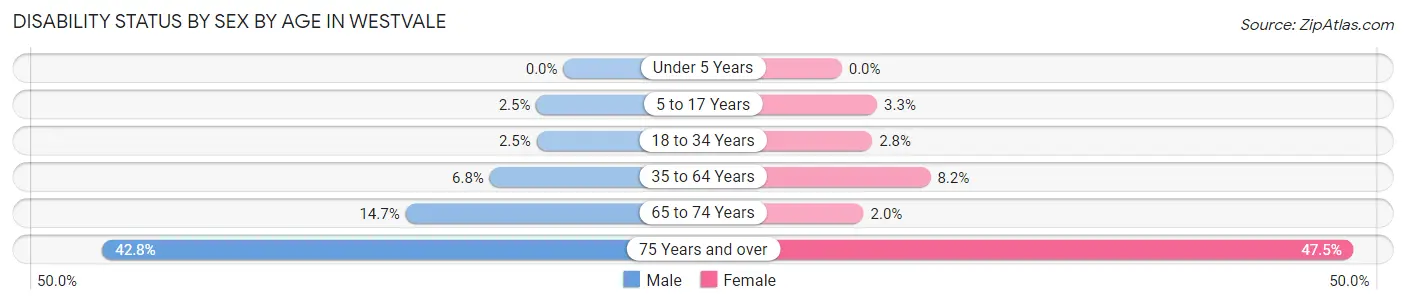
| Age Bracket | Male | Female |
| Under 5 Years | 0 (0.0%) | 0 (0.0%) |
| 5 to 17 Years | 14 (2.5%) | 10 (3.3%) |
| 18 to 34 Years | 10 (2.5%) | 10 (2.8%) |
| 35 to 64 Years | 61 (6.8%) | 89 (8.2%) |
| 65 to 74 Years | 46 (14.6%) | 5 (2.0%) |
| 75 Years and over | 83 (42.8%) | 123 (47.5%) |
Disability Class by Sex by Age in Westvale
Disability Class: Hearing Difficulty
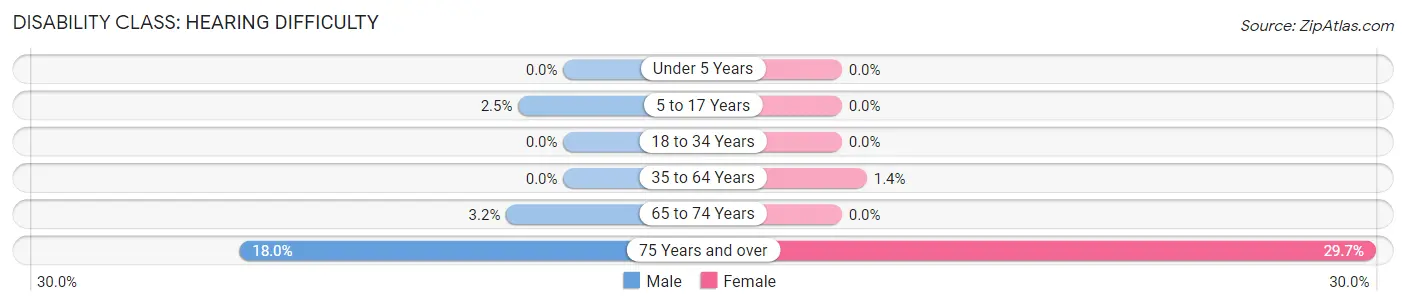
| Age Bracket | Male | Female |
| Under 5 Years | 0 (0.0%) | 0 (0.0%) |
| 5 to 17 Years | 14 (2.5%) | 0 (0.0%) |
| 18 to 34 Years | 0 (0.0%) | 0 (0.0%) |
| 35 to 64 Years | 0 (0.0%) | 15 (1.4%) |
| 65 to 74 Years | 10 (3.2%) | 0 (0.0%) |
| 75 Years and over | 35 (18.0%) | 77 (29.7%) |
Disability Class: Vision Difficulty
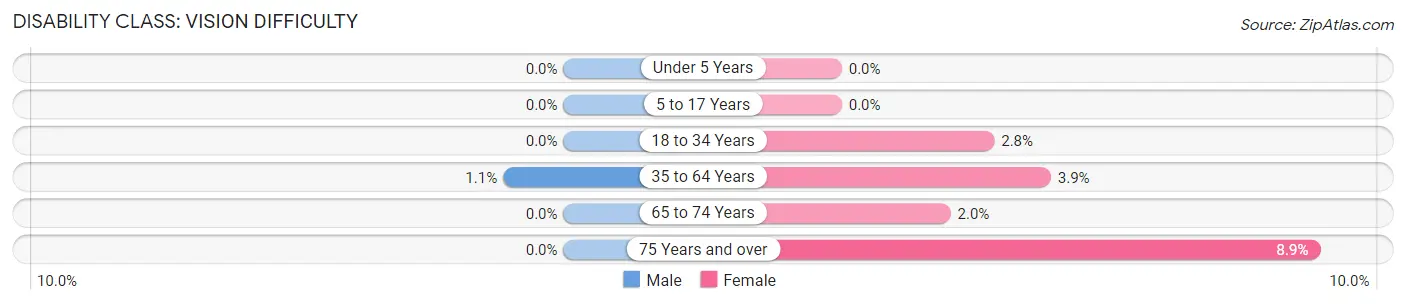
| Age Bracket | Male | Female |
| Under 5 Years | 0 (0.0%) | 0 (0.0%) |
| 5 to 17 Years | 0 (0.0%) | 0 (0.0%) |
| 18 to 34 Years | 0 (0.0%) | 10 (2.8%) |
| 35 to 64 Years | 10 (1.1%) | 42 (3.9%) |
| 65 to 74 Years | 0 (0.0%) | 5 (2.0%) |
| 75 Years and over | 0 (0.0%) | 23 (8.9%) |
Disability Class: Cognitive Difficulty
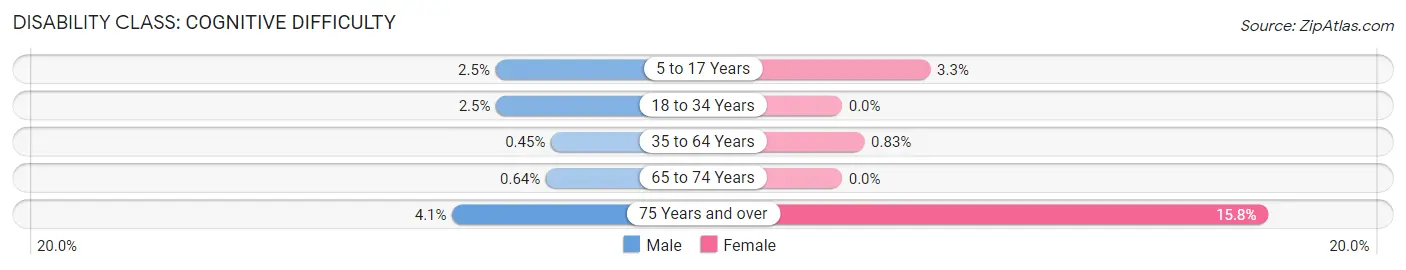
| Age Bracket | Male | Female |
| 5 to 17 Years | 14 (2.5%) | 10 (3.3%) |
| 18 to 34 Years | 10 (2.5%) | 0 (0.0%) |
| 35 to 64 Years | 4 (0.4%) | 9 (0.8%) |
| 65 to 74 Years | 2 (0.6%) | 0 (0.0%) |
| 75 Years and over | 8 (4.1%) | 41 (15.8%) |
Disability Class: Ambulatory Difficulty
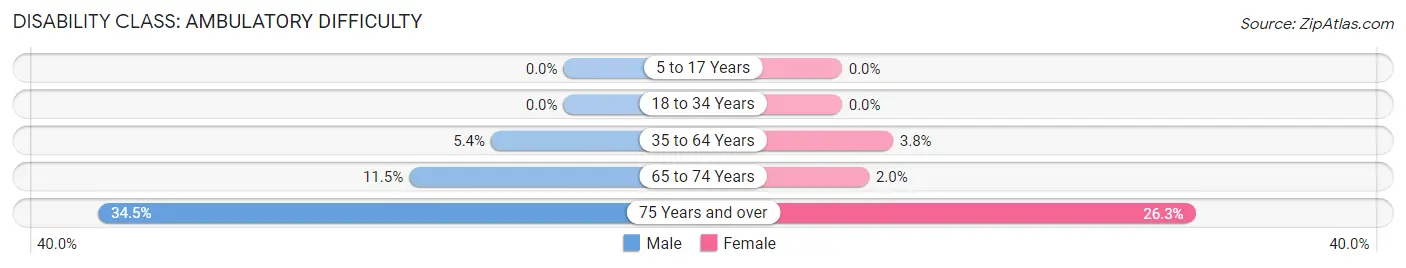
| Age Bracket | Male | Female |
| 5 to 17 Years | 0 (0.0%) | 0 (0.0%) |
| 18 to 34 Years | 0 (0.0%) | 0 (0.0%) |
| 35 to 64 Years | 48 (5.4%) | 41 (3.8%) |
| 65 to 74 Years | 36 (11.5%) | 5 (2.0%) |
| 75 Years and over | 67 (34.5%) | 68 (26.3%) |
Disability Class: Self-Care Difficulty
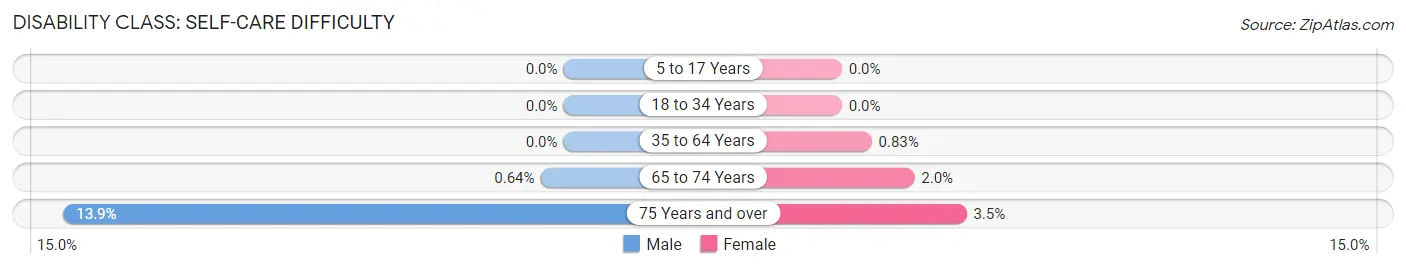
| Age Bracket | Male | Female |
| 5 to 17 Years | 0 (0.0%) | 0 (0.0%) |
| 18 to 34 Years | 0 (0.0%) | 0 (0.0%) |
| 35 to 64 Years | 0 (0.0%) | 9 (0.8%) |
| 65 to 74 Years | 2 (0.6%) | 5 (2.0%) |
| 75 Years and over | 27 (13.9%) | 9 (3.5%) |
Technology Access in Westvale
Computing Device Access in Westvale
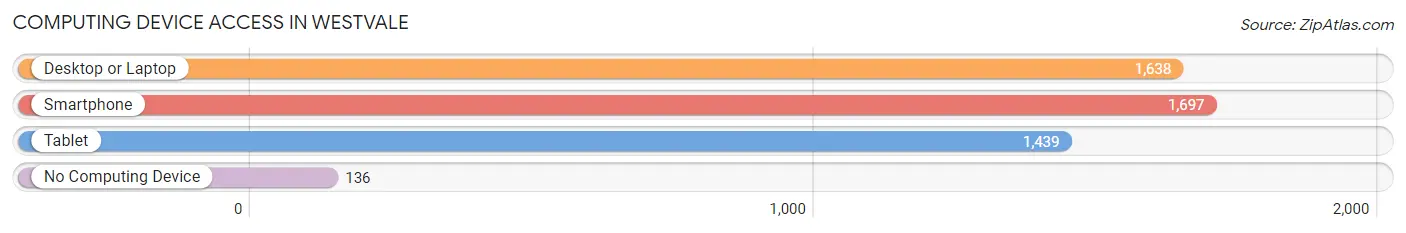
| Device Type | # Households | % Households |
| Desktop or Laptop | 1,638 | 83.8% |
| Smartphone | 1,697 | 86.8% |
| Tablet | 1,439 | 73.6% |
| No Computing Device | 136 | 7.0% |
| Total | 1,955 | 100.0% |
Internet Access in Westvale
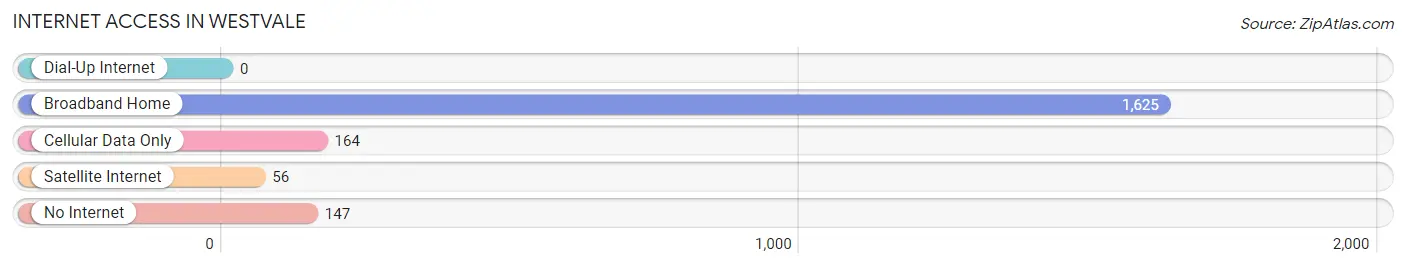
| Internet Type | # Households | % Households |
| Dial-Up Internet | 0 | 0.0% |
| Broadband Home | 1,625 | 83.1% |
| Cellular Data Only | 164 | 8.4% |
| Satellite Internet | 56 | 2.9% |
| No Internet | 147 | 7.5% |
| Total | 1,955 | 100.0% |
Westvale Summary
History
Westvale is a small hamlet located in the town of Onondaga in Onondaga County, New York. It is located just south of Syracuse and is part of the Syracuse Metropolitan Statistical Area. The hamlet was first settled in the early 19th century and was originally known as West Hill. The name was changed to Westvale in 1848 when the post office was established.
The hamlet was originally a farming community, but in the late 19th century, it began to develop into a small industrial center. The first industry to locate in Westvale was the Westvale Iron Works, which was established in 1872. The iron works produced a variety of products, including stoves, boilers, and other metal products. The company was eventually sold to the Syracuse Stove Company in 1891.
In the early 20th century, Westvale began to develop into a residential community. The first homes were built in the early 1900s and the population began to grow steadily. By the mid-20th century, Westvale had become a thriving residential community with a variety of businesses and services.
Geography
Westvale is located in the town of Onondaga in Onondaga County, New York. It is located just south of Syracuse and is part of the Syracuse Metropolitan Statistical Area. The hamlet is situated on the western edge of Onondaga Lake and is bordered by the towns of Salina to the north, Clay to the east, and Camillus to the south.
The terrain of Westvale is mostly flat, with some rolling hills in the northern part of the hamlet. The soil is mostly sandy loam, with some areas of clay. The climate is humid continental, with cold winters and warm summers.
Economy
Westvale is primarily a residential community, but it does have a few businesses and services. The largest employer in the hamlet is the Westvale Shopping Center, which is home to a variety of stores and restaurants. Other businesses in the area include a grocery store, a hardware store, a pharmacy, and a few other small businesses.
The hamlet also has a few small manufacturing companies, including a metal fabrication shop and a printing company. There are also a few small office buildings in the area.
Demographics
As of the 2010 census, the population of Westvale was 4,845. The racial makeup of the hamlet was 94.3% White, 1.7% African American, 0.3% Native American, 1.2% Asian, 0.1% Pacific Islander, and 2.4% from other races. Hispanic or Latino of any race were 4.2% of the population.
The median household income in Westvale was $50,945, and the median family income was $60,945. The per capita income was $25,945. About 5.3% of families and 7.2% of the population were below the poverty line, including 8.3% of those under age 18 and 5.2% of those age 65 or over.
Common Questions
What is Per Capita Income in Westvale?
Per Capita income in Westvale is $47,992.
What is the Median Family Income in Westvale?
Median Family Income in Westvale is $121,250.
What is the Median Household income in Westvale?
Median Household Income in Westvale is $103,646.
What is Income or Wage Gap in Westvale?
Income or Wage Gap in Westvale is 7.7%.
Women in Westvale earn 92.3 cents for every dollar earned by a man.
What is Inequality or Gini Index in Westvale?
Inequality or Gini Index in Westvale is 0.39.
What is the Total Population of Westvale?
Total Population of Westvale is 4,933.
What is the Total Male Population of Westvale?
Total Male Population of Westvale is 2,541.
What is the Total Female Population of Westvale?
Total Female Population of Westvale is 2,392.
What is the Ratio of Males per 100 Females in Westvale?
There are 106.23 Males per 100 Females in Westvale.
What is the Ratio of Females per 100 Males in Westvale?
There are 94.14 Females per 100 Males in Westvale.
What is the Median Population Age in Westvale?
Median Population Age in Westvale is 42.4 Years.
What is the Average Family Size in Westvale
Average Family Size in Westvale is 3.0 People.
What is the Average Household Size in Westvale
Average Household Size in Westvale is 2.5 People.
How Large is the Labor Force in Westvale?
There are 2,463 People in the Labor Forcein in Westvale.
What is the Percentage of People in the Labor Force in Westvale?
64.2% of People are in the Labor Force in Westvale.
What is the Unemployment Rate in Westvale?
Unemployment Rate in Westvale is 1.4%.