Newark, NY Map & Demographics
Newark Map
Newark Overview
$28,132
PER CAPITA INCOME
$64,824
AVG FAMILY INCOME
$56,142
AVG HOUSEHOLD INCOME
4.4%
WAGE / INCOME GAP [ % ]
95.6¢/ $1
WAGE / INCOME GAP [ $ ]
$12,442
FAMILY INCOME DEFICIT
0.40
INEQUALITY / GINI INDEX
9,076
TOTAL POPULATION
4,627
MALE POPULATION
4,449
FEMALE POPULATION
104.00
MALES / 100 FEMALES
96.15
FEMALES / 100 MALES
39.0
MEDIAN AGE
3.1
AVG FAMILY SIZE
2.3
AVG HOUSEHOLD SIZE
4,171
LABOR FORCE [ PEOPLE ]
57.5%
PERCENT IN LABOR FORCE
3.0%
UNEMPLOYMENT RATE
Newark Zip Codes
Newark Area Codes
Income in Newark
Income Overview in Newark
Per Capita Income in Newark is $28,132, while median incomes of families and households are $64,824 and $56,142 respectively.
| Characteristic | Number | Measure |
| Per Capita Income | 9,076 | $28,132 |
| Median Family Income | 2,095 | $64,824 |
| Mean Family Income | 2,095 | $76,879 |
| Median Household Income | 3,780 | $56,142 |
| Mean Household Income | 3,780 | $62,722 |
| Income Deficit | 2,095 | $12,442 |
| Wage / Income Gap (%) | 9,076 | 4.42% |
| Wage / Income Gap ($) | 9,076 | 95.58¢ per $1 |
| Gini / Inequality Index | 9,076 | 0.40 |
Earnings by Sex in Newark
Average Earnings in Newark are $33,795, $34,814 for men and $33,274 for women, a difference of 4.4%.
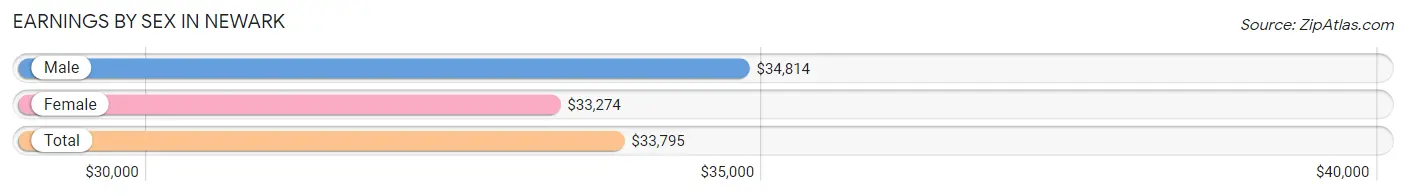
| Sex | Number | Average Earnings |
| Male | 2,671 (58.9%) | $34,814 |
| Female | 1,864 (41.1%) | $33,274 |
| Total | 4,535 (100.0%) | $33,795 |
Earnings by Sex by Income Bracket in Newark
The most common earnings brackets in Newark are $55,000 to $64,999 for men (356 | 13.3%) and $30,000 to $34,999 for women (261 | 14.0%).
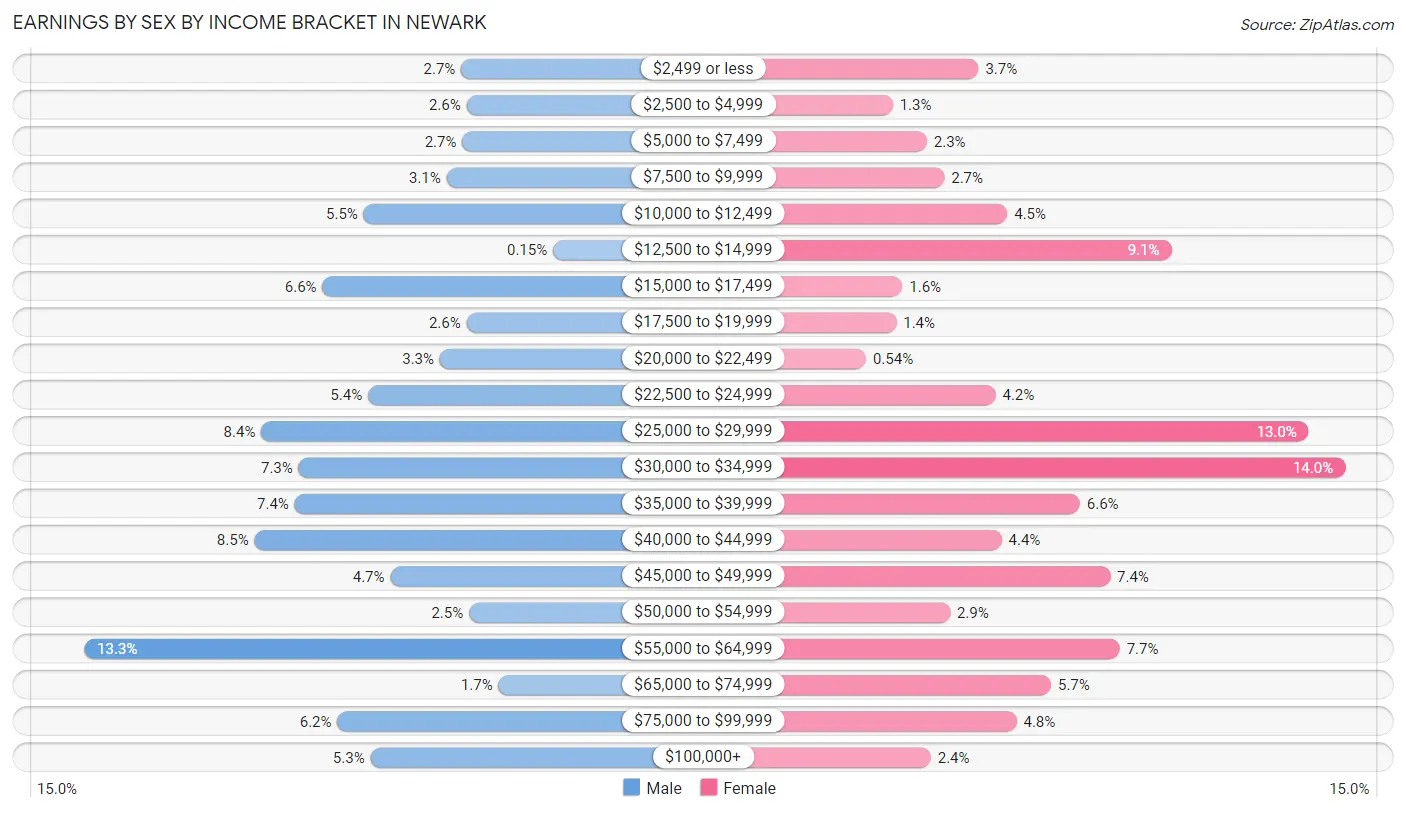
| Income | Male | Female |
| $2,499 or less | 73 (2.7%) | 69 (3.7%) |
| $2,500 to $4,999 | 69 (2.6%) | 24 (1.3%) |
| $5,000 to $7,499 | 72 (2.7%) | 42 (2.2%) |
| $7,500 to $9,999 | 84 (3.1%) | 51 (2.7%) |
| $10,000 to $12,499 | 146 (5.5%) | 84 (4.5%) |
| $12,500 to $14,999 | 4 (0.2%) | 170 (9.1%) |
| $15,000 to $17,499 | 177 (6.6%) | 29 (1.6%) |
| $17,500 to $19,999 | 69 (2.6%) | 26 (1.4%) |
| $20,000 to $22,499 | 89 (3.3%) | 10 (0.5%) |
| $22,500 to $24,999 | 143 (5.3%) | 78 (4.2%) |
| $25,000 to $29,999 | 223 (8.4%) | 242 (13.0%) |
| $30,000 to $34,999 | 195 (7.3%) | 261 (14.0%) |
| $35,000 to $39,999 | 198 (7.4%) | 122 (6.6%) |
| $40,000 to $44,999 | 228 (8.5%) | 81 (4.3%) |
| $45,000 to $49,999 | 126 (4.7%) | 138 (7.4%) |
| $50,000 to $54,999 | 67 (2.5%) | 54 (2.9%) |
| $55,000 to $64,999 | 356 (13.3%) | 143 (7.7%) |
| $65,000 to $74,999 | 45 (1.7%) | 107 (5.7%) |
| $75,000 to $99,999 | 166 (6.2%) | 89 (4.8%) |
| $100,000+ | 141 (5.3%) | 44 (2.4%) |
| Total | 2,671 (100.0%) | 1,864 (100.0%) |
Earnings by Sex by Educational Attainment in Newark
Average earnings in Newark are $40,168 for men and $33,764 for women, a difference of 15.9%. Men with an educational attainment of graduate degree enjoy the highest average annual earnings of $78,750, while those with high school diploma education earn the least with $33,667. Women with an educational attainment of graduate degree earn the most with the average annual earnings of $64,833, while those with less than high school education have the smallest earnings of $25,365.
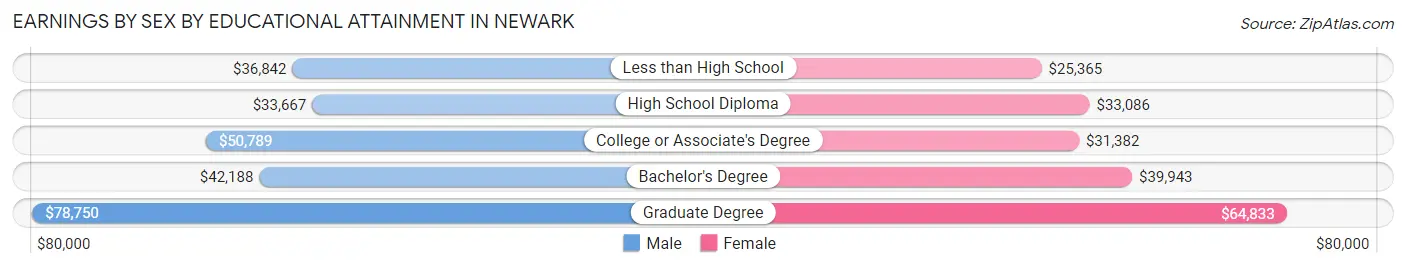
| Educational Attainment | Male Income | Female Income |
| Less than High School | $36,842 | $25,365 |
| High School Diploma | $33,667 | $33,086 |
| College or Associate's Degree | $50,789 | $31,382 |
| Bachelor's Degree | $42,188 | $39,943 |
| Graduate Degree | $78,750 | $64,833 |
| Total | $40,168 | $33,764 |
Family Income in Newark
Family Income Brackets in Newark
According to the Newark family income data, there are 603 families falling into the $50,000 to $74,999 income range, which is the most common income bracket and makes up 28.8% of all families. Conversely, the $10,000 to $14,999 income bracket is the least frequent group with only 44 families (2.1%) belonging to this category.
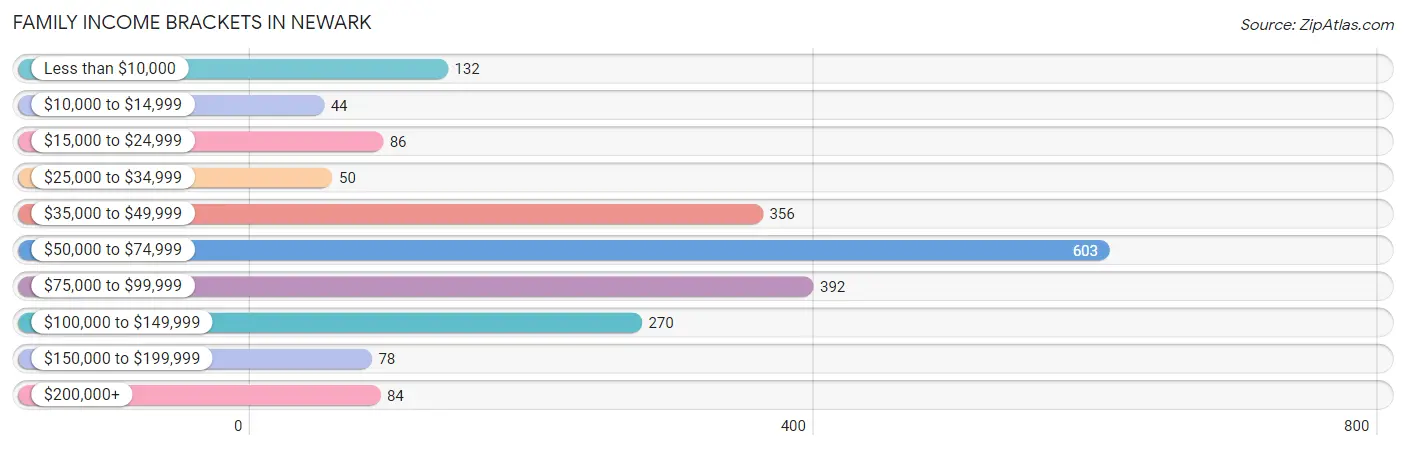
| Income Bracket | # Families | % Families |
| Less than $10,000 | 132 | 6.3% |
| $10,000 to $14,999 | 44 | 2.1% |
| $15,000 to $24,999 | 86 | 4.1% |
| $25,000 to $34,999 | 50 | 2.4% |
| $35,000 to $49,999 | 356 | 17.0% |
| $50,000 to $74,999 | 603 | 28.8% |
| $75,000 to $99,999 | 392 | 18.7% |
| $100,000 to $149,999 | 270 | 12.9% |
| $150,000 to $199,999 | 78 | 3.7% |
| $200,000+ | 84 | 4.0% |
Family Income by Famaliy Size in Newark
2-person families (967 | 46.2%) account for the highest median family income in Newark with $72,944 per family, while 2-person families (967 | 46.2%) have the highest median income of $36,472 per family member.
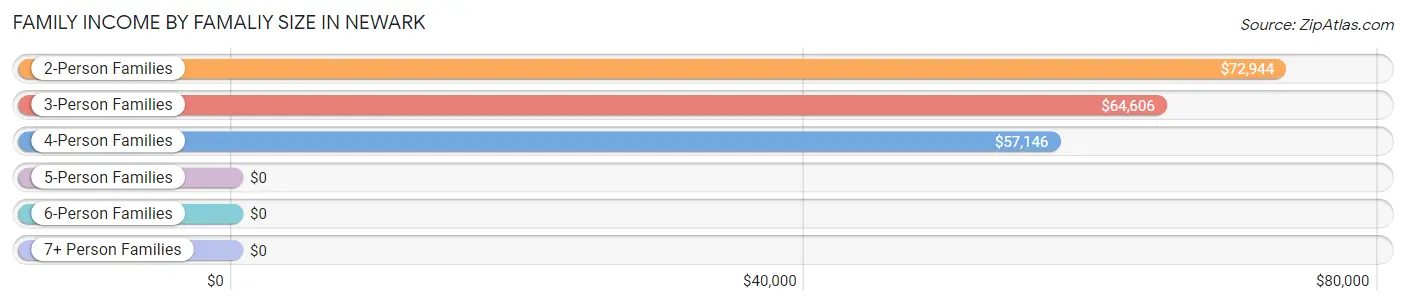
| Income Bracket | # Families | Median Income |
| 2-Person Families | 967 (46.2%) | $72,944 |
| 3-Person Families | 565 (27.0%) | $64,606 |
| 4-Person Families | 334 (15.9%) | $57,146 |
| 5-Person Families | 170 (8.1%) | $0 |
| 6-Person Families | 45 (2.1%) | $0 |
| 7+ Person Families | 14 (0.7%) | $0 |
| Total | 2,095 (100.0%) | $64,824 |
Family Income by Number of Earners in Newark
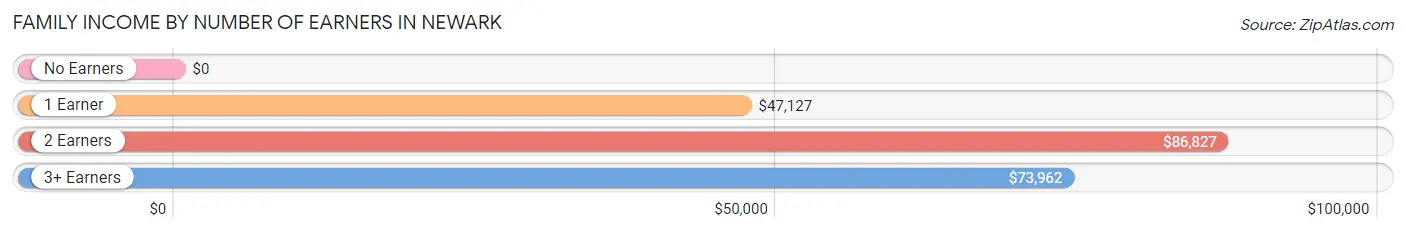
| Number of Earners | # Families | Median Income |
| No Earners | 262 (12.5%) | $0 |
| 1 Earner | 829 (39.6%) | $47,127 |
| 2 Earners | 638 (30.4%) | $86,827 |
| 3+ Earners | 366 (17.5%) | $73,962 |
| Total | 2,095 (100.0%) | $64,824 |
Household Income in Newark
Household Income Brackets in Newark
With 1,009 households falling in the category, the $50,000 to $74,999 income range is the most frequent in Newark, accounting for 26.7% of all households. In contrast, only 87 households (2.3%) fall into the $150,000 to $199,999 income bracket, making it the least populous group.
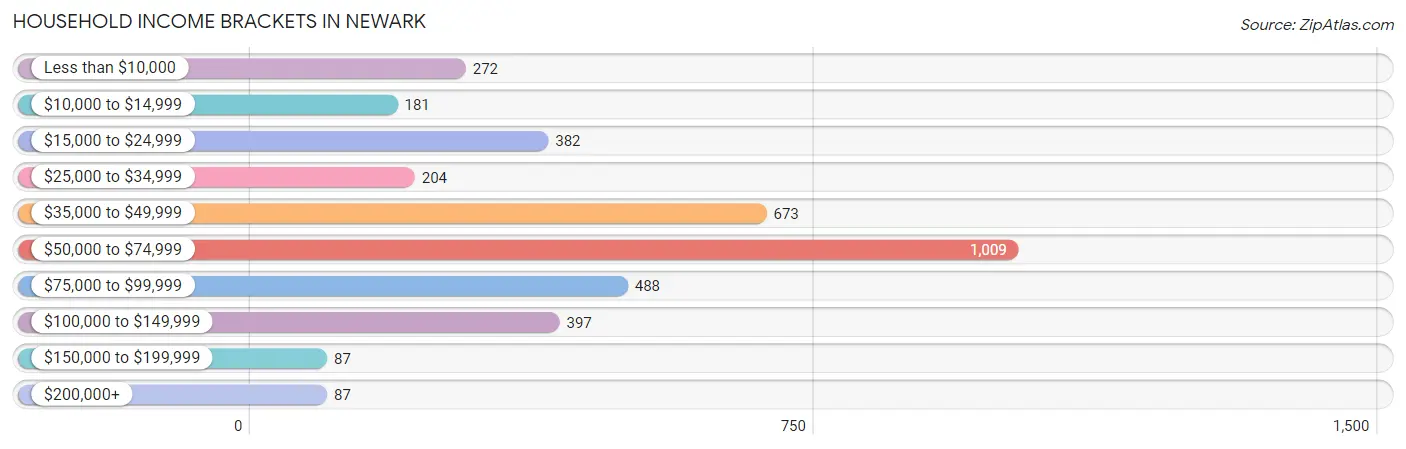
| Income Bracket | # Households | % Households |
| Less than $10,000 | 272 | 7.2% |
| $10,000 to $14,999 | 181 | 4.8% |
| $15,000 to $24,999 | 382 | 10.1% |
| $25,000 to $34,999 | 204 | 5.4% |
| $35,000 to $49,999 | 673 | 17.8% |
| $50,000 to $74,999 | 1,009 | 26.7% |
| $75,000 to $99,999 | 488 | 12.9% |
| $100,000 to $149,999 | 397 | 10.5% |
| $150,000 to $199,999 | 87 | 2.3% |
| $200,000+ | 87 | 2.3% |
Household Income by Householder Age in Newark
The median household income in Newark is $56,142, with the highest median household income of $64,130 found in the 45 to 64 years age bracket for the primary householder. A total of 1,253 households (33.2%) fall into this category. Meanwhile, the 15 to 24 years age bracket for the primary householder has the lowest median household income of $0, with 90 households (2.4%) in this group.
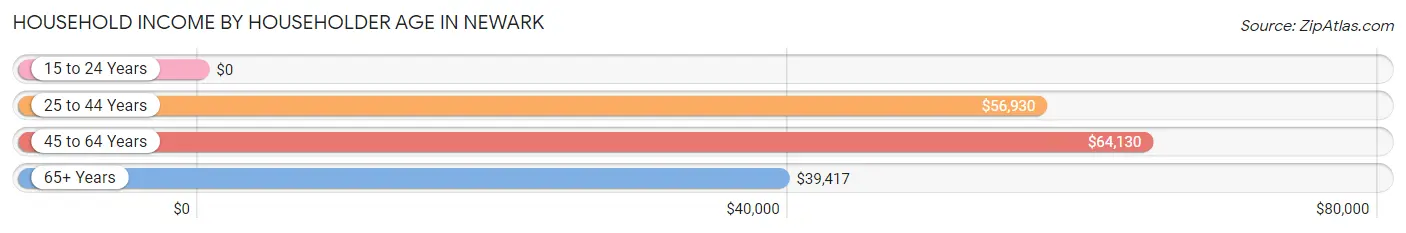
| Income Bracket | # Households | Median Income |
| 15 to 24 Years | 90 (2.4%) | $0 |
| 25 to 44 Years | 1,214 (32.1%) | $56,930 |
| 45 to 64 Years | 1,253 (33.2%) | $64,130 |
| 65+ Years | 1,223 (32.4%) | $39,417 |
| Total | 3,780 (100.0%) | $56,142 |
Poverty in Newark
Income Below Poverty by Sex and Age in Newark
With 12.5% poverty level for males and 15.6% for females among the residents of Newark, 5 year old males and 75 year old and over females are the most vulnerable to poverty, with 28 males (70.0%) and 92 females (29.3%) in their respective age groups living below the poverty level.
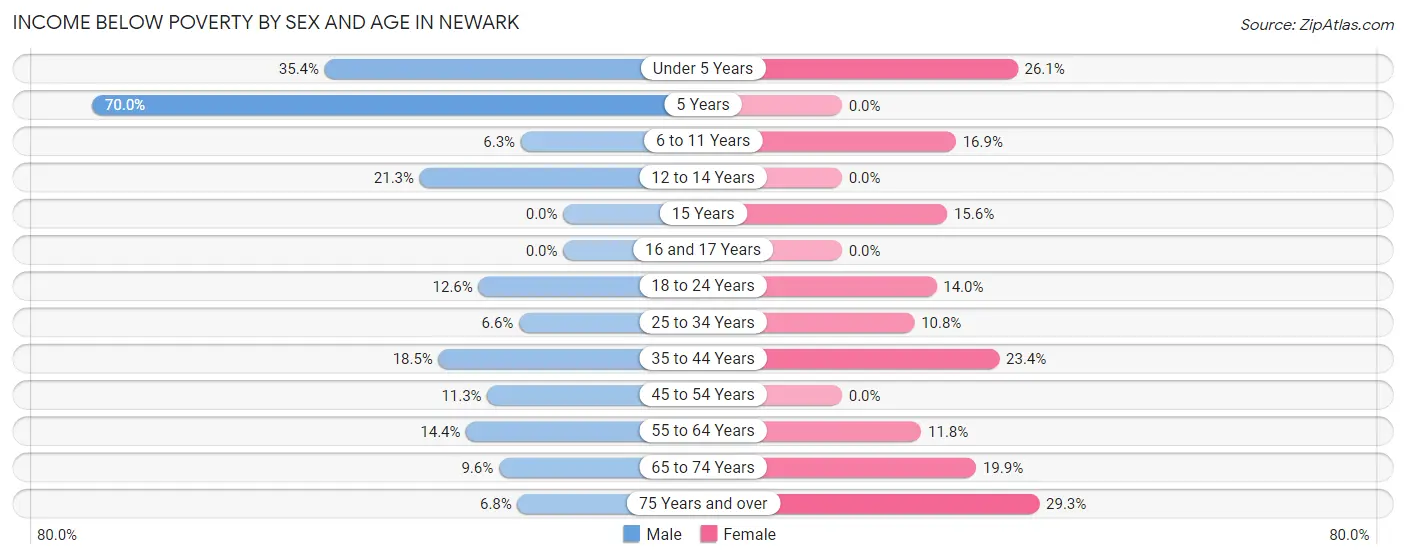
| Age Bracket | Male | Female |
| Under 5 Years | 91 (35.4%) | 77 (26.1%) |
| 5 Years | 28 (70.0%) | 0 (0.0%) |
| 6 to 11 Years | 22 (6.3%) | 88 (16.9%) |
| 12 to 14 Years | 39 (21.3%) | 0 (0.0%) |
| 15 Years | 0 (0.0%) | 20 (15.6%) |
| 16 and 17 Years | 0 (0.0%) | 0 (0.0%) |
| 18 to 24 Years | 57 (12.6%) | 39 (14.0%) |
| 25 to 34 Years | 59 (6.6%) | 67 (10.7%) |
| 35 to 44 Years | 57 (18.5%) | 100 (23.4%) |
| 45 to 54 Years | 56 (11.3%) | 0 (0.0%) |
| 55 to 64 Years | 90 (14.4%) | 72 (11.8%) |
| 65 to 74 Years | 55 (9.6%) | 116 (19.9%) |
| 75 Years and over | 18 (6.8%) | 92 (29.3%) |
| Total | 572 (12.5%) | 671 (15.6%) |
Income Above Poverty by Sex and Age in Newark
According to the poverty statistics in Newark, males aged 15 years and females aged 5 years are the age groups that are most secure financially, with 100.0% of males and 100.0% of females in these age groups living above the poverty line.
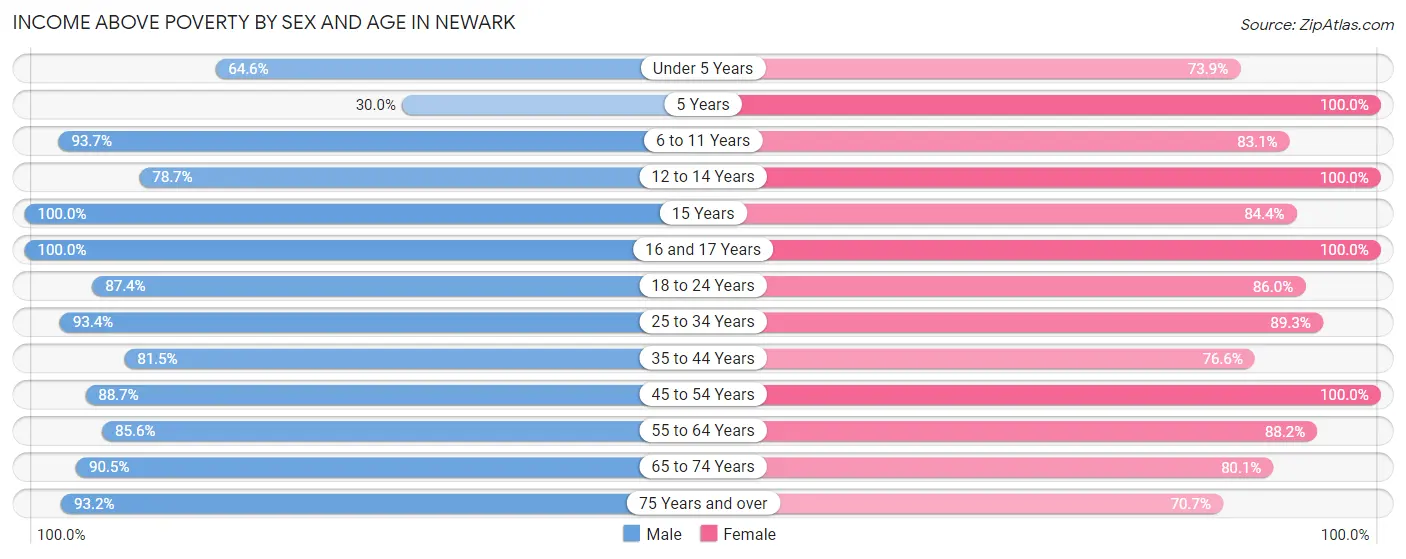
| Age Bracket | Male | Female |
| Under 5 Years | 166 (64.6%) | 218 (73.9%) |
| 5 Years | 12 (30.0%) | 15 (100.0%) |
| 6 to 11 Years | 327 (93.7%) | 432 (83.1%) |
| 12 to 14 Years | 144 (78.7%) | 4 (100.0%) |
| 15 Years | 29 (100.0%) | 108 (84.4%) |
| 16 and 17 Years | 80 (100.0%) | 89 (100.0%) |
| 18 to 24 Years | 396 (87.4%) | 239 (86.0%) |
| 25 to 34 Years | 840 (93.4%) | 556 (89.2%) |
| 35 to 44 Years | 251 (81.5%) | 328 (76.6%) |
| 45 to 54 Years | 441 (88.7%) | 405 (100.0%) |
| 55 to 64 Years | 535 (85.6%) | 539 (88.2%) |
| 65 to 74 Years | 521 (90.4%) | 466 (80.1%) |
| 75 Years and over | 247 (93.2%) | 222 (70.7%) |
| Total | 3,989 (87.5%) | 3,621 (84.4%) |
Income Below Poverty Among Married-Couple Families in Newark
The poverty statistics for married-couple families in Newark show that 5.1% or 70 of the total 1,382 families live below the poverty line. Families with 3 or 4 children have the highest poverty rate of 17.3%, comprising of 22 families. On the other hand, families with 1 or 2 children have the lowest poverty rate of 2.0%, which includes 8 families.
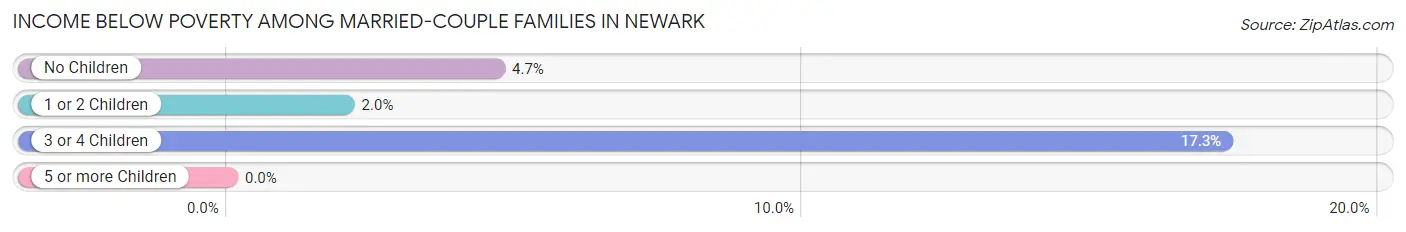
| Children | Above Poverty | Below Poverty |
| No Children | 821 (95.4%) | 40 (4.6%) |
| 1 or 2 Children | 386 (98.0%) | 8 (2.0%) |
| 3 or 4 Children | 105 (82.7%) | 22 (17.3%) |
| 5 or more Children | 0 (0.0%) | 0 (0.0%) |
| Total | 1,312 (94.9%) | 70 (5.1%) |
Income Below Poverty Among Single-Parent Households in Newark
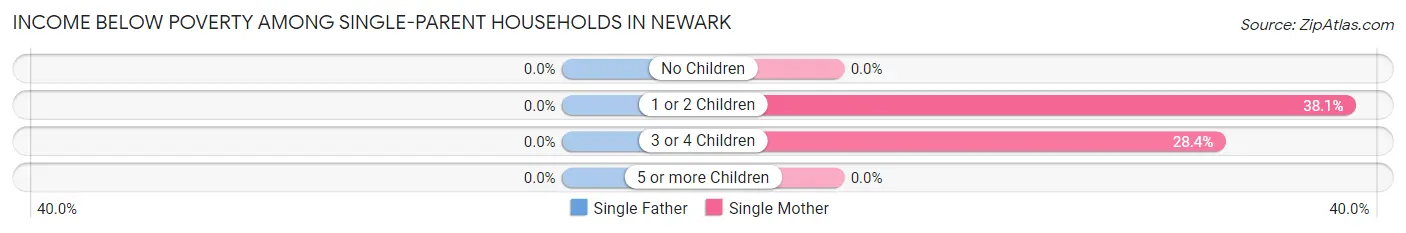
| Children | Single Father | Single Mother |
| No Children | 0 (0.0%) | 0 (0.0%) |
| 1 or 2 Children | 0 (0.0%) | 138 (38.1%) |
| 3 or 4 Children | 0 (0.0%) | 25 (28.4%) |
| 5 or more Children | 0 (0.0%) | 0 (0.0%) |
| Total | 0 (0.0%) | 163 (31.5%) |
Income Below Poverty Among Married-Couple vs Single-Parent Households in Newark
The poverty data for Newark shows that 70 of the married-couple family households (5.1%) and 163 of the single-parent households (22.9%) are living below the poverty level. Within the married-couple family households, those with 3 or 4 children have the highest poverty rate, with 22 households (17.3%) falling below the poverty line. Among the single-parent households, those with 1 or 2 children have the highest poverty rate, with 138 household (29.7%) living below poverty.
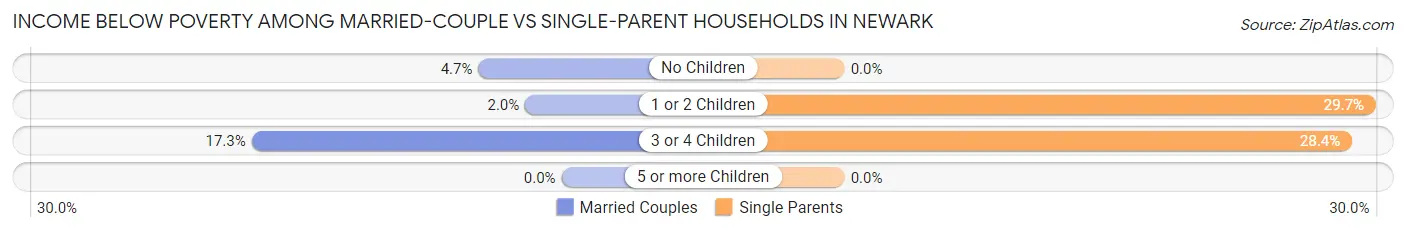
| Children | Married-Couple Families | Single-Parent Households |
| No Children | 40 (4.6%) | 0 (0.0%) |
| 1 or 2 Children | 8 (2.0%) | 138 (29.7%) |
| 3 or 4 Children | 22 (17.3%) | 25 (28.4%) |
| 5 or more Children | 0 (0.0%) | 0 (0.0%) |
| Total | 70 (5.1%) | 163 (22.9%) |
Race in Newark
The most populous races in Newark are White / Caucasian (7,316 | 80.6%), Hispanic or Latino (1,202 | 13.2%), and Two or more Races (917 | 10.1%).
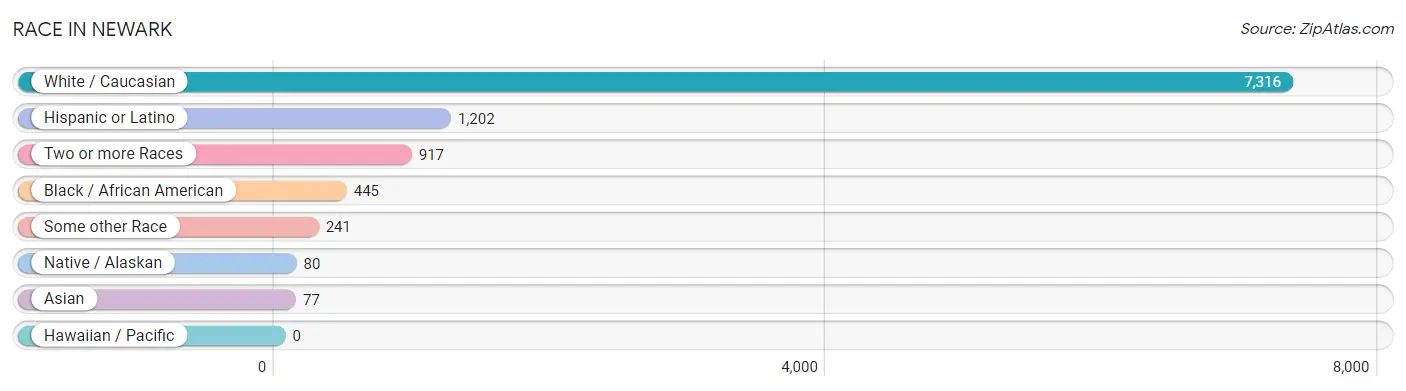
| Race | # Population | % Population |
| Asian | 77 | 0.9% |
| Black / African American | 445 | 4.9% |
| Hawaiian / Pacific | 0 | 0.0% |
| Hispanic or Latino | 1,202 | 13.2% |
| Native / Alaskan | 80 | 0.9% |
| White / Caucasian | 7,316 | 80.6% |
| Two or more Races | 917 | 10.1% |
| Some other Race | 241 | 2.7% |
| Total | 9,076 | 100.0% |
Ancestry in Newark
The most populous ancestries reported in Newark are Italian (1,340 | 14.8%), German (1,309 | 14.4%), Irish (1,299 | 14.3%), English (1,055 | 11.6%), and Dutch (843 | 9.3%), together accounting for 64.4% of all Newark residents.
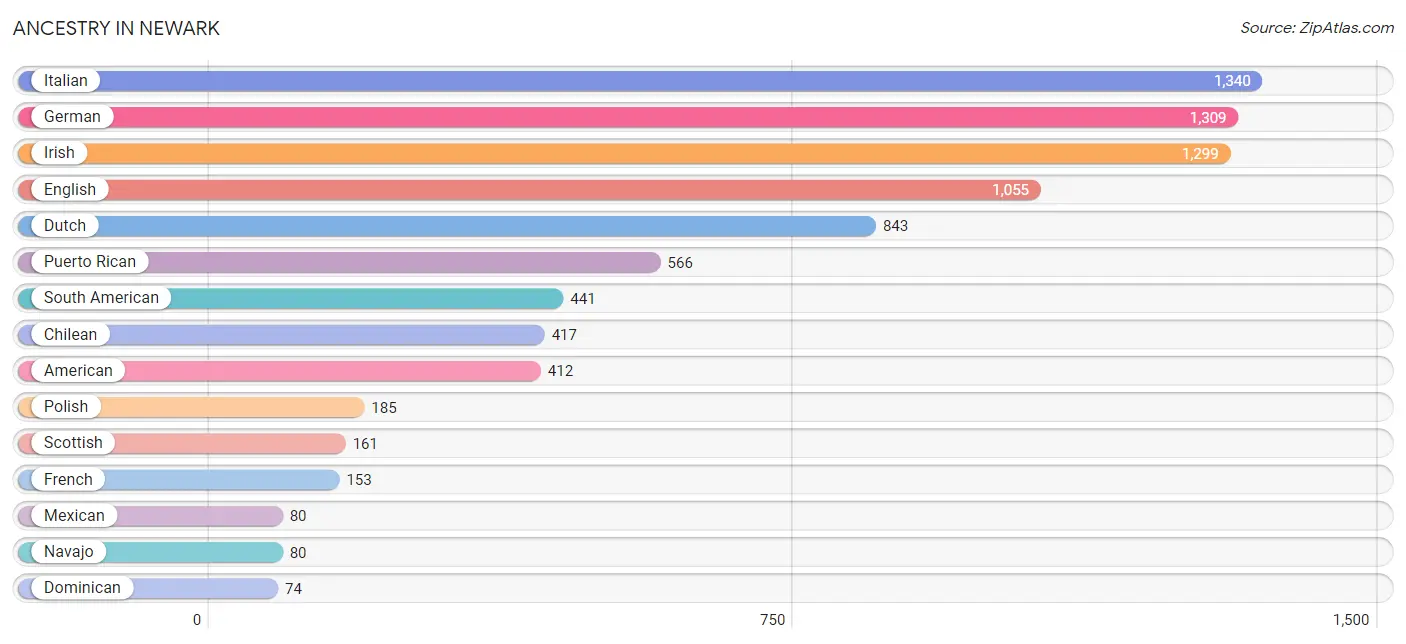
| Ancestry | # Population | % Population |
| African | 22 | 0.2% |
| Albanian | 23 | 0.3% |
| American | 412 | 4.5% |
| Arab | 65 | 0.7% |
| Barbadian | 3 | 0.0% |
| Belgian | 21 | 0.2% |
| Bhutanese | 10 | 0.1% |
| Bolivian | 20 | 0.2% |
| British West Indian | 48 | 0.5% |
| Canadian | 53 | 0.6% |
| Central American | 37 | 0.4% |
| Cherokee | 15 | 0.2% |
| Chilean | 417 | 4.6% |
| Colombian | 4 | 0.0% |
| Danish | 34 | 0.4% |
| Dominican | 74 | 0.8% |
| Dutch | 843 | 9.3% |
| English | 1,055 | 11.6% |
| European | 48 | 0.5% |
| French | 153 | 1.7% |
| French Canadian | 32 | 0.4% |
| German | 1,309 | 14.4% |
| Greek | 2 | 0.0% |
| Haitian | 4 | 0.0% |
| Hungarian | 9 | 0.1% |
| Indian (Asian) | 12 | 0.1% |
| Irish | 1,299 | 14.3% |
| Iroquois | 40 | 0.4% |
| Italian | 1,340 | 14.8% |
| Jordanian | 17 | 0.2% |
| Lebanese | 8 | 0.1% |
| Lithuanian | 53 | 0.6% |
| Mexican | 80 | 0.9% |
| Navajo | 80 | 0.9% |
| Nigerian | 11 | 0.1% |
| Norwegian | 23 | 0.3% |
| Panamanian | 37 | 0.4% |
| Pennsylvania German | 15 | 0.2% |
| Polish | 185 | 2.0% |
| Puerto Rican | 566 | 6.2% |
| Russian | 58 | 0.6% |
| Scandinavian | 14 | 0.2% |
| Scotch-Irish | 38 | 0.4% |
| Scottish | 161 | 1.8% |
| South American | 441 | 4.9% |
| Sri Lankan | 55 | 0.6% |
| Subsaharan African | 33 | 0.4% |
| Swedish | 23 | 0.3% |
| Swiss | 24 | 0.3% |
| Syrian | 40 | 0.4% |
| Ukrainian | 57 | 0.6% |
| Welsh | 68 | 0.7% | View All 52 Rows |
Immigrants in Newark
The most numerous immigrant groups reported in Newark came from Latin America (140 | 1.5%), Asia (100 | 1.1%), Europe (84 | 0.9%), Caribbean (81 | 0.9%), and Dominican Republic (74 | 0.8%), together accounting for 5.3% of all Newark residents.
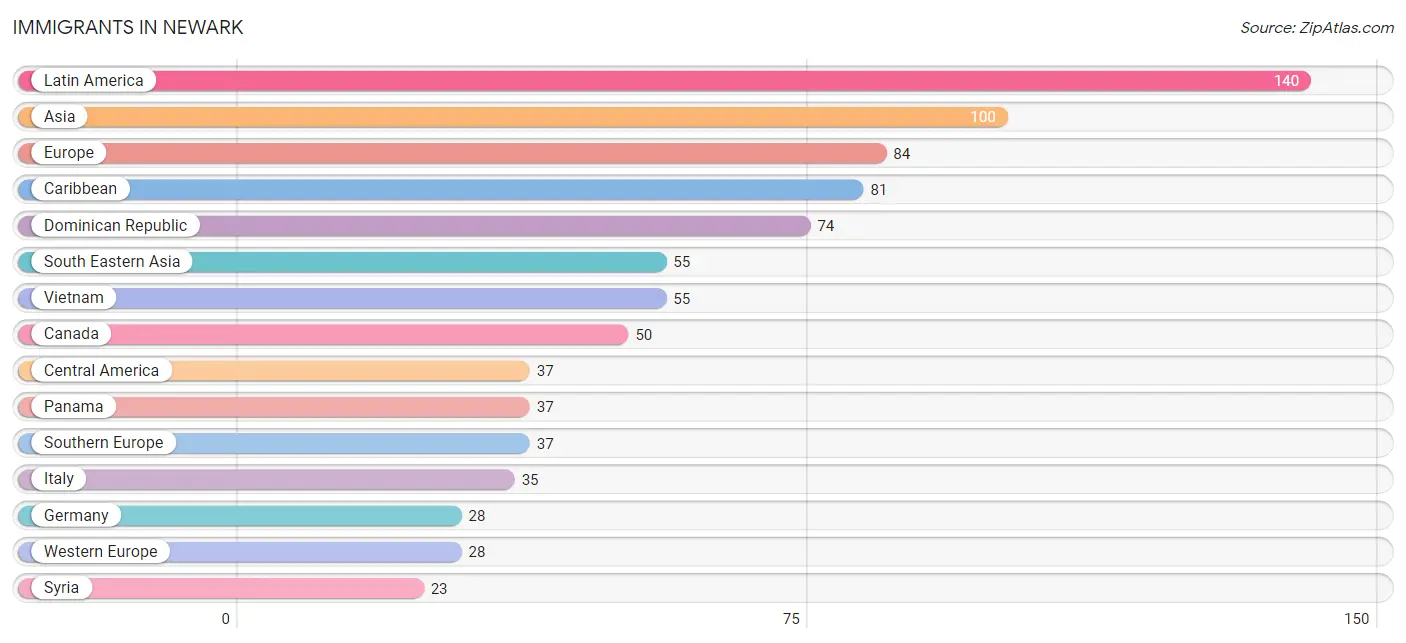
| Immigration Origin | # Population | % Population |
| Argentina | 20 | 0.2% |
| Asia | 100 | 1.1% |
| Barbados | 3 | 0.0% |
| Canada | 50 | 0.5% |
| Caribbean | 81 | 0.9% |
| Central America | 37 | 0.4% |
| China | 12 | 0.1% |
| Dominican Republic | 74 | 0.8% |
| Eastern Asia | 22 | 0.2% |
| England | 19 | 0.2% |
| Europe | 84 | 0.9% |
| Germany | 28 | 0.3% |
| Greece | 2 | 0.0% |
| Haiti | 4 | 0.0% |
| Italy | 35 | 0.4% |
| Japan | 10 | 0.1% |
| Latin America | 140 | 1.5% |
| Northern Europe | 19 | 0.2% |
| Panama | 37 | 0.4% |
| South America | 22 | 0.2% |
| South Eastern Asia | 55 | 0.6% |
| Southern Europe | 37 | 0.4% |
| Syria | 23 | 0.3% |
| Uruguay | 2 | 0.0% |
| Vietnam | 55 | 0.6% |
| Western Asia | 23 | 0.3% |
| Western Europe | 28 | 0.3% | View All 27 Rows |
Sex and Age in Newark
Sex and Age in Newark
The most populous age groups in Newark are 30 to 34 Years (599 | 13.0%) for men and 30 to 34 Years (435 | 9.8%) for women.
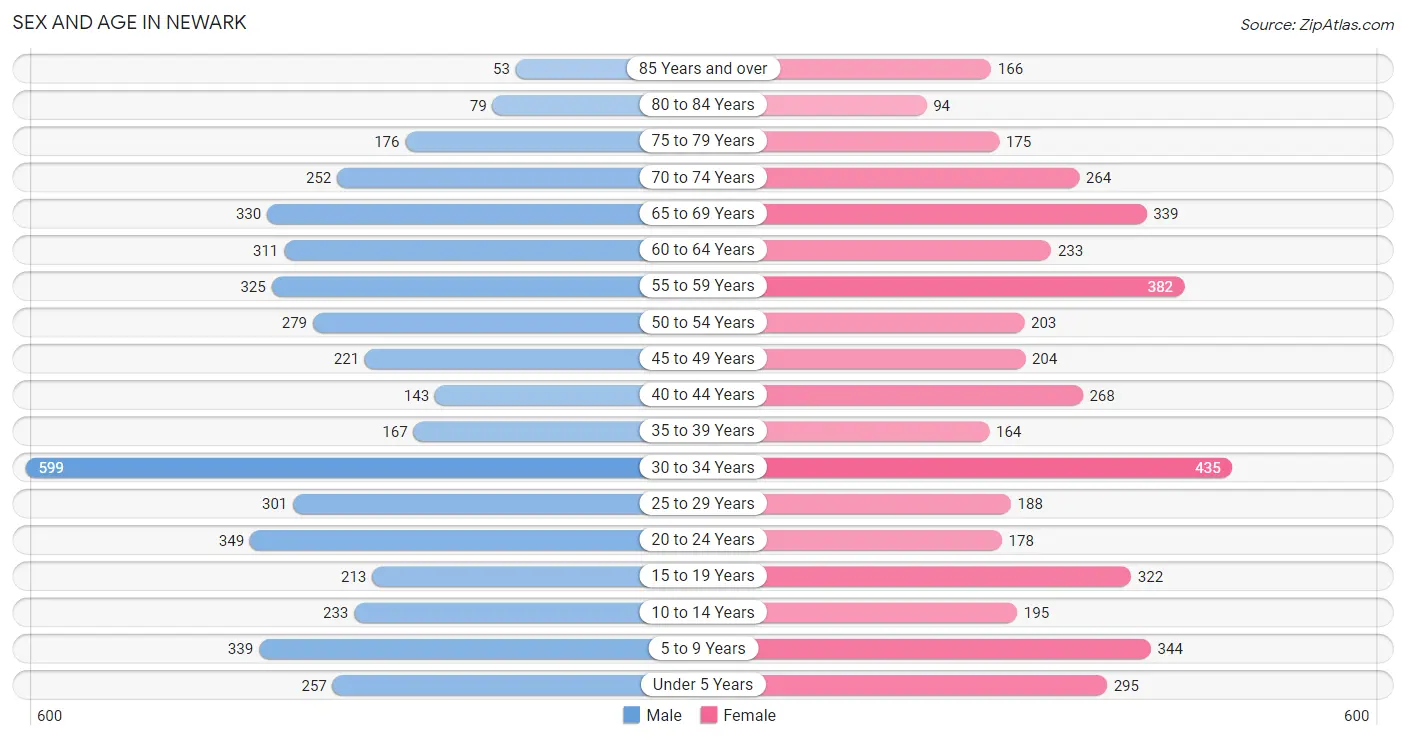
| Age Bracket | Male | Female |
| Under 5 Years | 257 (5.6%) | 295 (6.6%) |
| 5 to 9 Years | 339 (7.3%) | 344 (7.7%) |
| 10 to 14 Years | 233 (5.0%) | 195 (4.4%) |
| 15 to 19 Years | 213 (4.6%) | 322 (7.2%) |
| 20 to 24 Years | 349 (7.5%) | 178 (4.0%) |
| 25 to 29 Years | 301 (6.5%) | 188 (4.2%) |
| 30 to 34 Years | 599 (13.0%) | 435 (9.8%) |
| 35 to 39 Years | 167 (3.6%) | 164 (3.7%) |
| 40 to 44 Years | 143 (3.1%) | 268 (6.0%) |
| 45 to 49 Years | 221 (4.8%) | 204 (4.6%) |
| 50 to 54 Years | 279 (6.0%) | 203 (4.6%) |
| 55 to 59 Years | 325 (7.0%) | 382 (8.6%) |
| 60 to 64 Years | 311 (6.7%) | 233 (5.2%) |
| 65 to 69 Years | 330 (7.1%) | 339 (7.6%) |
| 70 to 74 Years | 252 (5.4%) | 264 (5.9%) |
| 75 to 79 Years | 176 (3.8%) | 175 (3.9%) |
| 80 to 84 Years | 79 (1.7%) | 94 (2.1%) |
| 85 Years and over | 53 (1.1%) | 166 (3.7%) |
| Total | 4,627 (100.0%) | 4,449 (100.0%) |
Families and Households in Newark
Median Family Size in Newark
The median family size in Newark is 3.08 persons per family, with married-couple families (1,382 | 66.0%) accounting for the largest median family size of 3.24 persons per family. On the other hand, single female/mother families (518 | 24.7%) represent the smallest median family size with 2.68 persons per family.
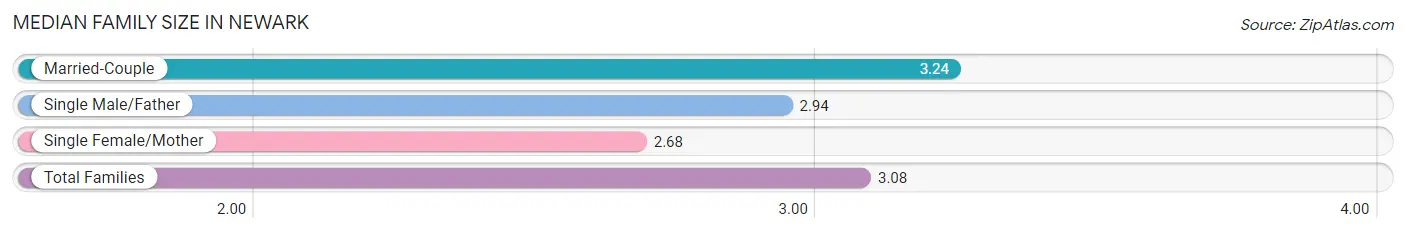
| Family Type | # Families | Family Size |
| Married-Couple | 1,382 (66.0%) | 3.24 |
| Single Male/Father | 195 (9.3%) | 2.94 |
| Single Female/Mother | 518 (24.7%) | 2.68 |
| Total Families | 2,095 (100.0%) | 3.08 |
Median Household Size in Newark
The median household size in Newark is 2.29 persons per household, with single male/father households (195 | 5.2%) accounting for the largest median household size of 3.3 persons per household. non-family households (1,685 | 44.6%) represent the smallest median household size with 1.12 persons per household.
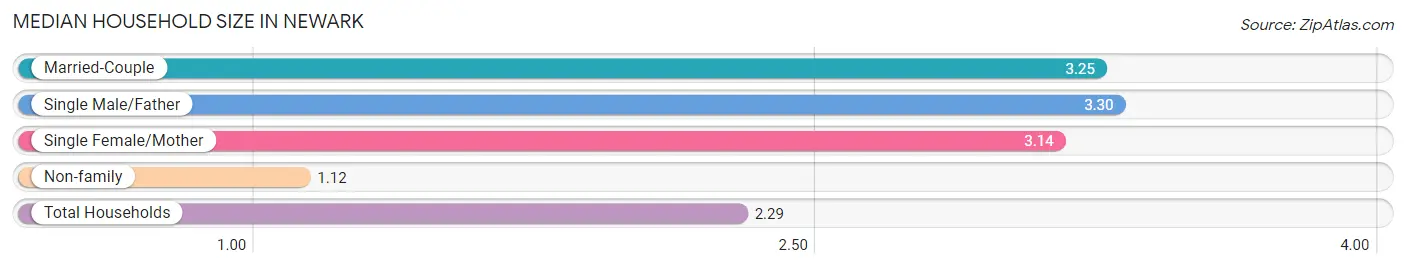
| Household Type | # Households | Household Size |
| Married-Couple | 1,382 (36.6%) | 3.25 |
| Single Male/Father | 195 (5.2%) | 3.30 |
| Single Female/Mother | 518 (13.7%) | 3.14 |
| Non-family | 1,685 (44.6%) | 1.12 |
| Total Households | 3,780 (100.0%) | 2.29 |
Household Size by Marriage Status in Newark
Out of a total of 3,780 households in Newark, 2,095 (55.4%) are family households, while 1,685 (44.6%) are nonfamily households. The most numerous type of family households are 2-person households, comprising 878, and the most common type of nonfamily households are 1-person households, comprising 1,463.
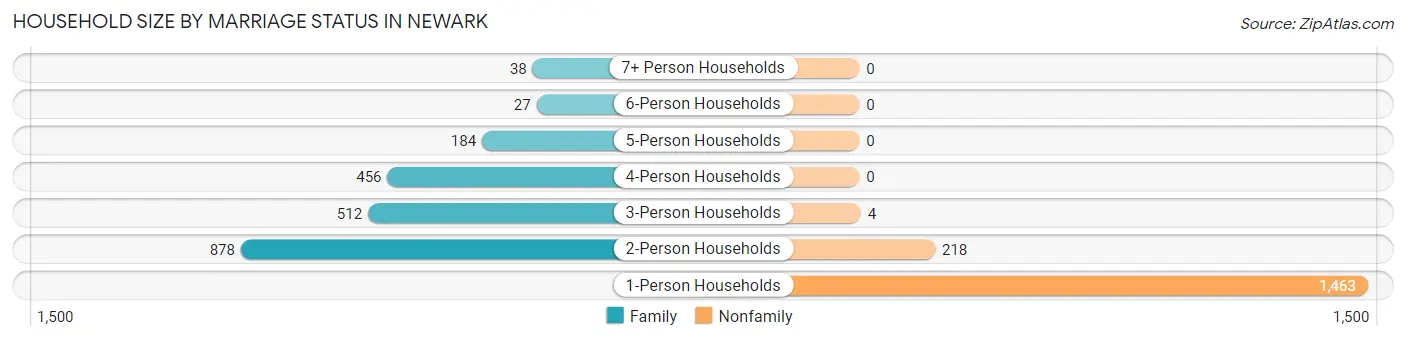
| Household Size | Family Households | Nonfamily Households |
| 1-Person Households | - | 1,463 (38.7%) |
| 2-Person Households | 878 (23.2%) | 218 (5.8%) |
| 3-Person Households | 512 (13.5%) | 4 (0.1%) |
| 4-Person Households | 456 (12.1%) | 0 (0.0%) |
| 5-Person Households | 184 (4.9%) | 0 (0.0%) |
| 6-Person Households | 27 (0.7%) | 0 (0.0%) |
| 7+ Person Households | 38 (1.0%) | 0 (0.0%) |
| Total | 2,095 (55.4%) | 1,685 (44.6%) |
Female Fertility in Newark
Fertility by Age in Newark
Average fertility rate in Newark is 59.0 births per 1,000 women. Women in the age bracket of 20 to 34 years have the highest fertility rate with 115.0 births per 1,000 women. Women in the age bracket of 20 to 34 years acount for 84.4% of all women with births.
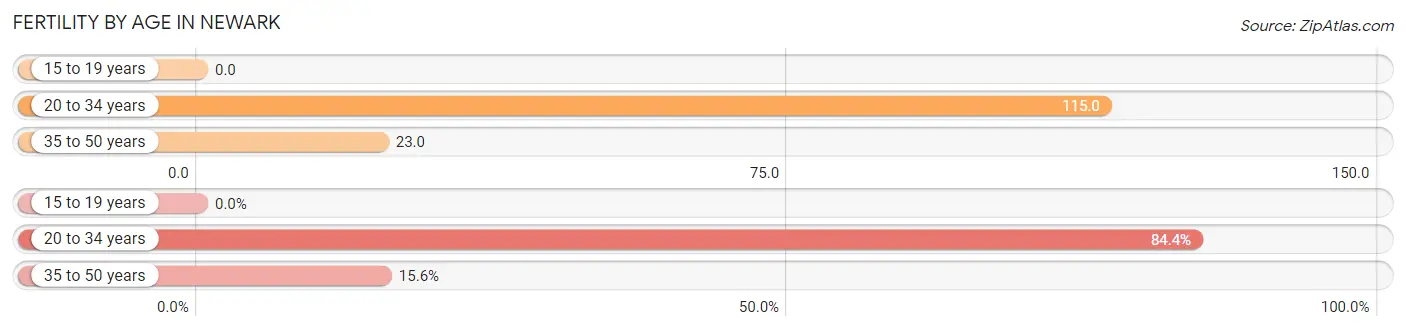
| Age Bracket | Women with Births | Births / 1,000 Women |
| 15 to 19 years | 0 (0.0%) | 0.0 |
| 20 to 34 years | 92 (84.4%) | 115.0 |
| 35 to 50 years | 17 (15.6%) | 23.0 |
| Total | 109 (100.0%) | 59.0 |
Fertility by Age by Marriage Status in Newark
81.7% of women with births (109) in Newark are married. The highest percentage of unmarried women with births falls into 35 to 50 years age bracket with 100.0% of them unmarried at the time of birth, while the lowest percentage of unmarried women with births belong to 20 to 34 years age bracket with 3.3% of them unmarried.
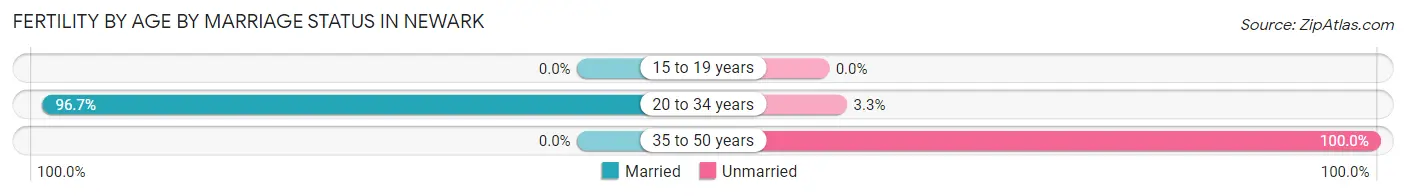
| Age Bracket | Married | Unmarried |
| 15 to 19 years | 0 (0.0%) | 0 (0.0%) |
| 20 to 34 years | 89 (96.7%) | 3 (3.3%) |
| 35 to 50 years | 0 (0.0%) | 17 (100.0%) |
| Total | 89 (81.7%) | 20 (18.3%) |
Fertility by Education in Newark
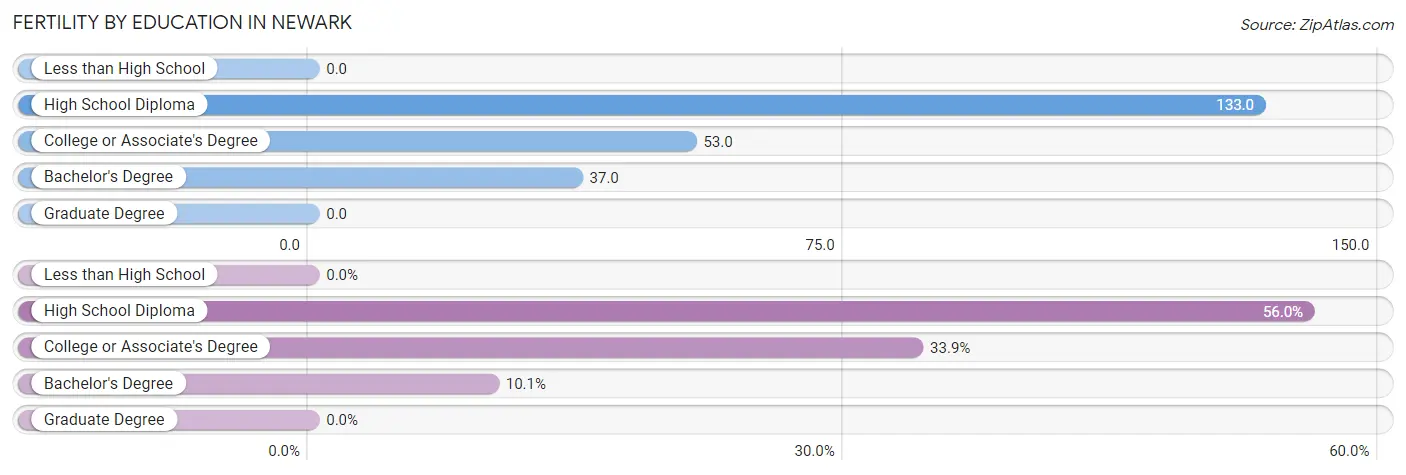
| Educational Attainment | Women with Births | Births / 1,000 Women |
| Less than High School | 0 (0.0%) | 0.0 |
| High School Diploma | 61 (56.0%) | 133.0 |
| College or Associate's Degree | 37 (33.9%) | 53.0 |
| Bachelor's Degree | 11 (10.1%) | 37.0 |
| Graduate Degree | 0 (0.0%) | 0.0 |
| Total | 109 (100.0%) | 59.0 |
Fertility by Education by Marriage Status in Newark
18.3% of women with births in Newark are unmarried. Women with the educational attainment of high school diploma are most likely to be married with 100.0% of them married at childbirth, while women with the educational attainment of college or associate's degree are least likely to be married with 54.0% of them unmarried at childbirth.
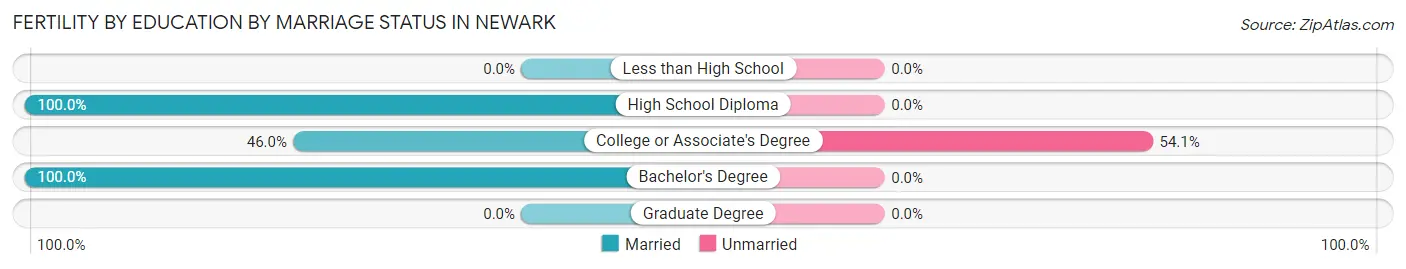
| Educational Attainment | Married | Unmarried |
| Less than High School | 0 (0.0%) | 0 (0.0%) |
| High School Diploma | 61 (100.0%) | 0 (0.0%) |
| College or Associate's Degree | 17 (46.0%) | 20 (54.0%) |
| Bachelor's Degree | 11 (100.0%) | 0 (0.0%) |
| Graduate Degree | 0 (0.0%) | 0 (0.0%) |
| Total | 89 (81.7%) | 20 (18.3%) |
Employment Characteristics in Newark
Employment by Class of Employer in Newark
Among the 3,793 employed individuals in Newark, private company employees (2,319 | 61.1%), local government employees (436 | 11.5%), and state government employees (361 | 9.5%) make up the most common classes of employment.
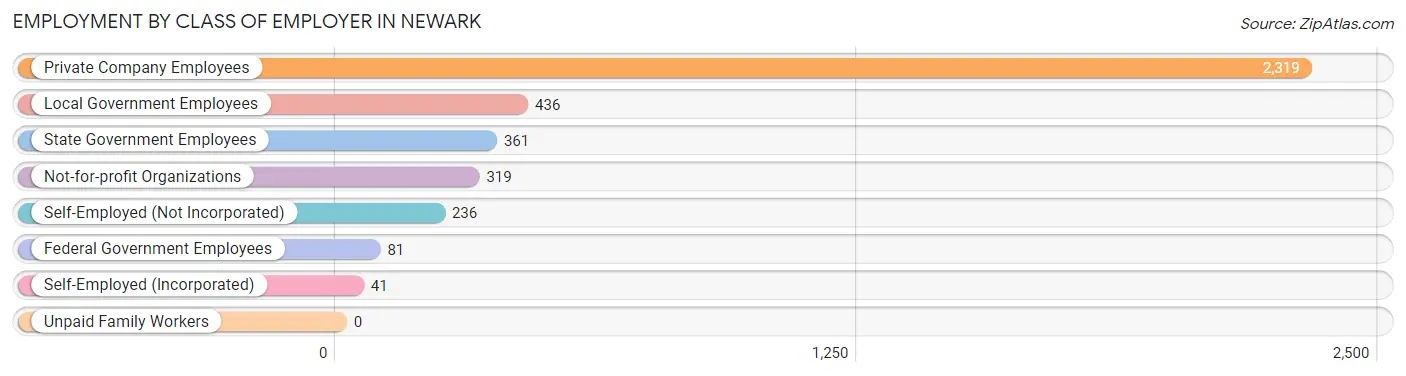
| Employer Class | # Employees | % Employees |
| Private Company Employees | 2,319 | 61.1% |
| Self-Employed (Incorporated) | 41 | 1.1% |
| Self-Employed (Not Incorporated) | 236 | 6.2% |
| Not-for-profit Organizations | 319 | 8.4% |
| Local Government Employees | 436 | 11.5% |
| State Government Employees | 361 | 9.5% |
| Federal Government Employees | 81 | 2.1% |
| Unpaid Family Workers | 0 | 0.0% |
| Total | 3,793 | 100.0% |
Employment Status by Age in Newark
According to the labor force statistics for Newark, out of the total population over 16 years of age (7,254), 57.5% or 4,171 individuals are in the labor force, with 3.0% or 125 of them unemployed. The age group with the highest labor force participation rate is 25 to 29 years, with 85.1% or 416 individuals in the labor force. Within the labor force, the 55 to 59 years age range has the highest percentage of unemployed individuals, with 8.0% or 46 of them being unemployed.
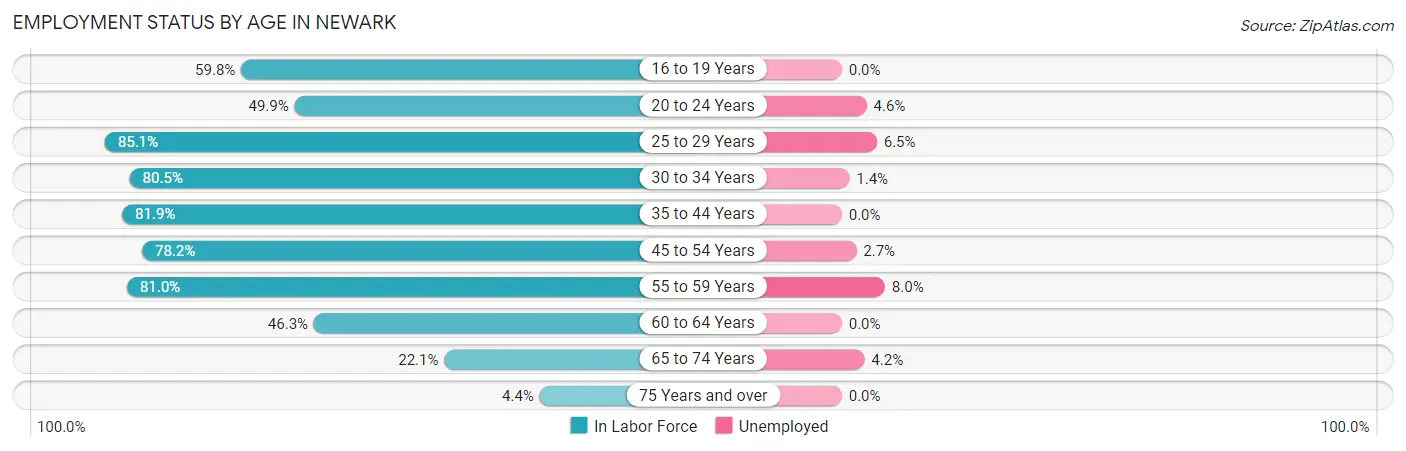
| Age Bracket | In Labor Force | Unemployed |
| 16 to 19 Years | 225 (59.8%) | 0 (0.0%) |
| 20 to 24 Years | 263 (49.9%) | 12 (4.6%) |
| 25 to 29 Years | 416 (85.1%) | 27 (6.5%) |
| 30 to 34 Years | 832 (80.5%) | 12 (1.4%) |
| 35 to 44 Years | 608 (81.9%) | 0 (0.0%) |
| 45 to 54 Years | 709 (78.2%) | 19 (2.7%) |
| 55 to 59 Years | 573 (81.0%) | 46 (8.0%) |
| 60 to 64 Years | 252 (46.3%) | 0 (0.0%) |
| 65 to 74 Years | 262 (22.1%) | 11 (4.2%) |
| 75 Years and over | 33 (4.4%) | 0 (0.0%) |
| Total | 4,171 (57.5%) | 125 (3.0%) |
Employment Status by Educational Attainment in Newark
According to labor force statistics for Newark, 76.6% of individuals (3,388) out of the total population between 25 and 64 years of age (4,423) are in the labor force, with 3.1% or 105 of them being unemployed. The group with the highest labor force participation rate are those with the educational attainment of bachelor's degree or higher, with 89.3% or 707 individuals in the labor force. Within the labor force, individuals with less than high school education have the highest percentage of unemployment, with 4.3% or 19 of them being unemployed.
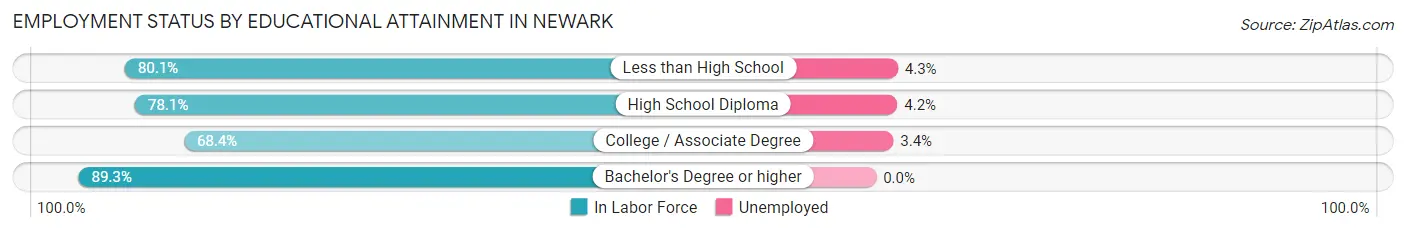
| Educational Attainment | In Labor Force | Unemployed |
| Less than High School | 447 (80.1%) | 24 (4.3%) |
| High School Diploma | 1,084 (78.1%) | 58 (4.2%) |
| College / Associate Degree | 1,153 (68.4%) | 57 (3.4%) |
| Bachelor's Degree or higher | 707 (89.3%) | 0 (0.0%) |
| Total | 3,388 (76.6%) | 137 (3.1%) |
Employment Occupations by Sex in Newark
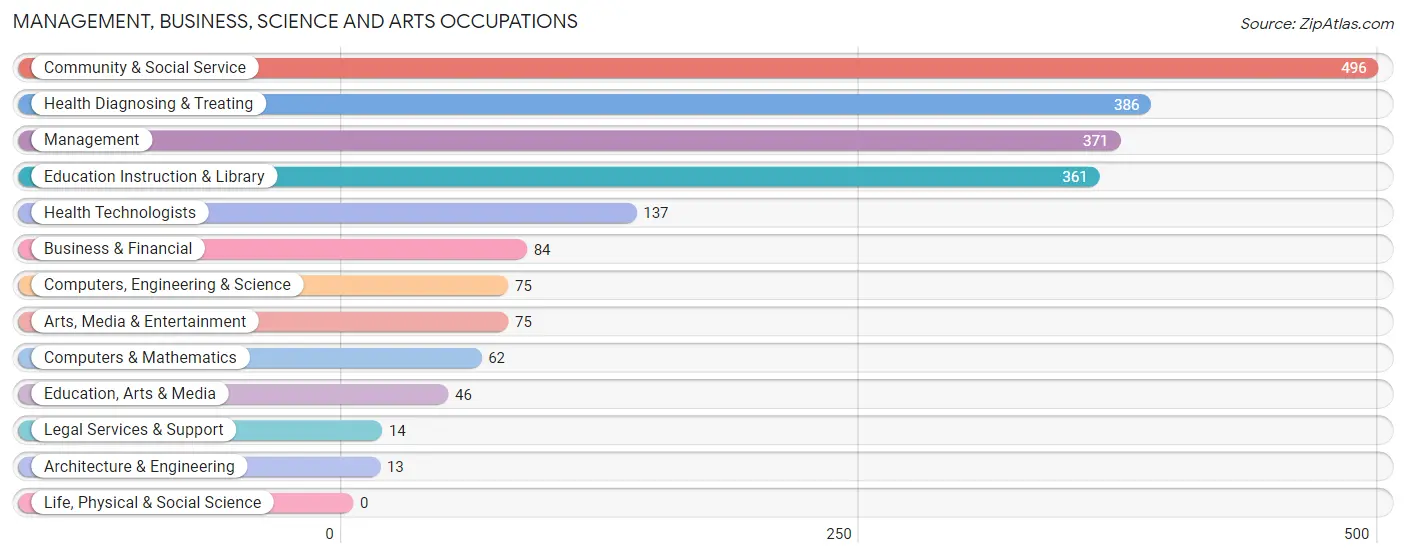
Management, Business, Science and Arts Occupations
The most common Management, Business, Science and Arts occupations in Newark are Community & Social Service (496 | 12.3%), Health Diagnosing & Treating (386 | 9.5%), Management (371 | 9.2%), Education Instruction & Library (361 | 8.9%), and Health Technologists (137 | 3.4%).
Management, Business, Science and Arts Occupations by Sex
Within the Management, Business, Science and Arts occupations in Newark, the most male-oriented occupations are Computers, Engineering & Science (100.0%), Computers & Mathematics (100.0%), and Architecture & Engineering (100.0%), while the most female-oriented occupations are Education Instruction & Library (83.7%), Community & Social Service (71.2%), and Health Diagnosing & Treating (65.3%).
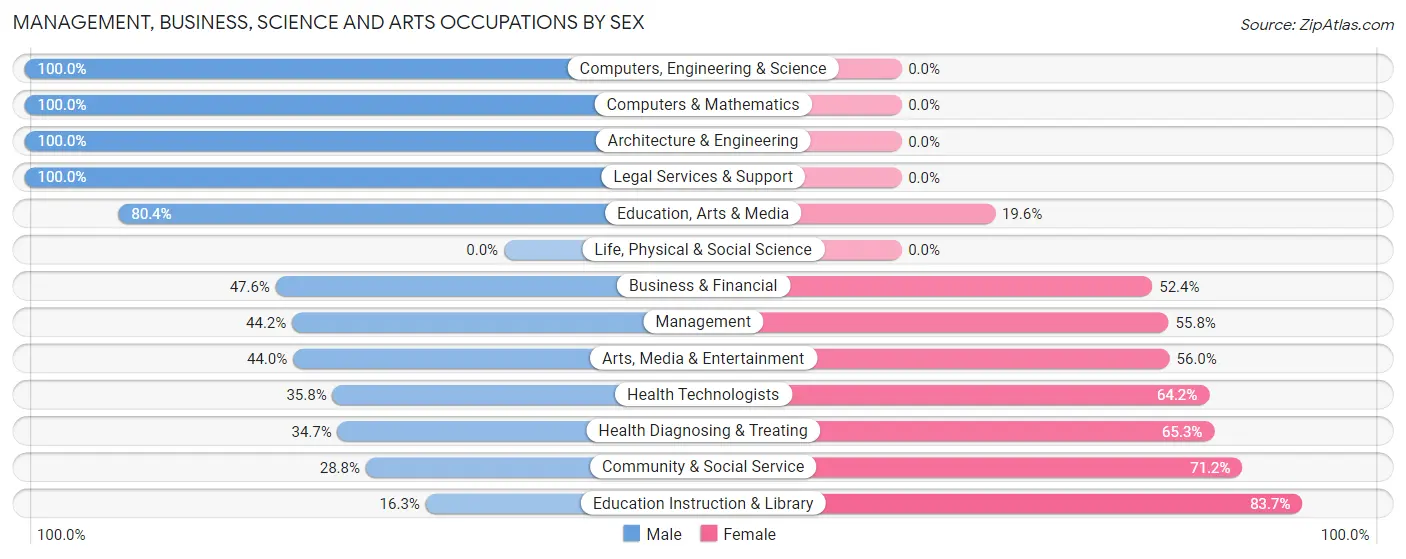
| Occupation | Male | Female |
| Management | 164 (44.2%) | 207 (55.8%) |
| Business & Financial | 40 (47.6%) | 44 (52.4%) |
| Computers, Engineering & Science | 75 (100.0%) | 0 (0.0%) |
| Computers & Mathematics | 62 (100.0%) | 0 (0.0%) |
| Architecture & Engineering | 13 (100.0%) | 0 (0.0%) |
| Life, Physical & Social Science | 0 (0.0%) | 0 (0.0%) |
| Community & Social Service | 143 (28.8%) | 353 (71.2%) |
| Education, Arts & Media | 37 (80.4%) | 9 (19.6%) |
| Legal Services & Support | 14 (100.0%) | 0 (0.0%) |
| Education Instruction & Library | 59 (16.3%) | 302 (83.7%) |
| Arts, Media & Entertainment | 33 (44.0%) | 42 (56.0%) |
| Health Diagnosing & Treating | 134 (34.7%) | 252 (65.3%) |
| Health Technologists | 49 (35.8%) | 88 (64.2%) |
| Total (Category) | 556 (39.4%) | 856 (60.6%) |
| Total (Overall) | 2,289 (56.6%) | 1,757 (43.4%) |
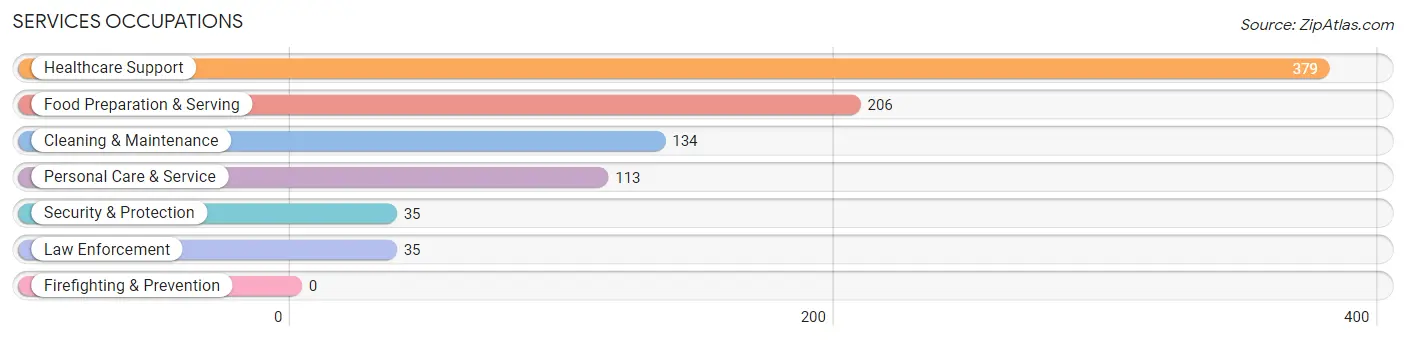
Services Occupations
The most common Services occupations in Newark are Healthcare Support (379 | 9.4%), Food Preparation & Serving (206 | 5.1%), Cleaning & Maintenance (134 | 3.3%), Personal Care & Service (113 | 2.8%), and Security & Protection (35 | 0.9%).
Services Occupations by Sex
Within the Services occupations in Newark, the most male-oriented occupations are Security & Protection (100.0%), Law Enforcement (100.0%), and Cleaning & Maintenance (79.8%), while the most female-oriented occupations are Healthcare Support (78.4%), Personal Care & Service (63.7%), and Food Preparation & Serving (58.7%).
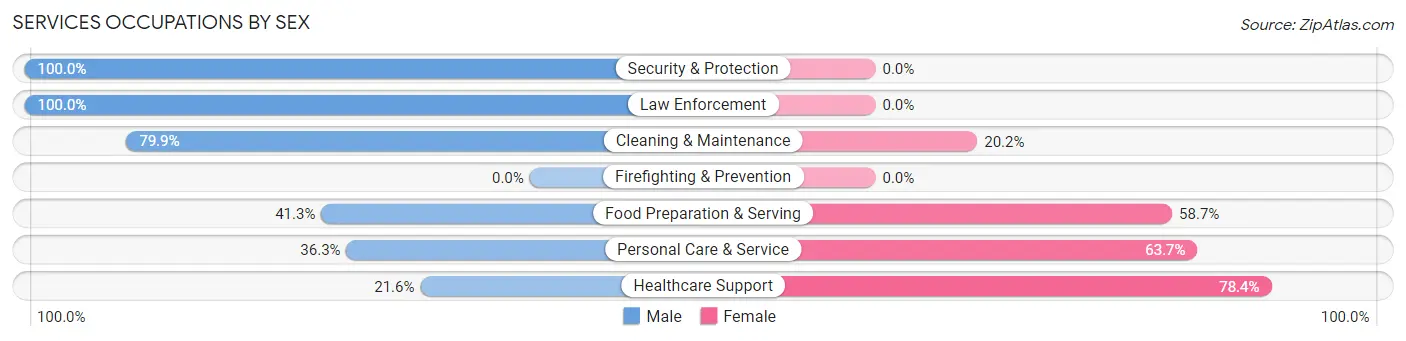
| Occupation | Male | Female |
| Healthcare Support | 82 (21.6%) | 297 (78.4%) |
| Security & Protection | 35 (100.0%) | 0 (0.0%) |
| Firefighting & Prevention | 0 (0.0%) | 0 (0.0%) |
| Law Enforcement | 35 (100.0%) | 0 (0.0%) |
| Food Preparation & Serving | 85 (41.3%) | 121 (58.7%) |
| Cleaning & Maintenance | 107 (79.8%) | 27 (20.2%) |
| Personal Care & Service | 41 (36.3%) | 72 (63.7%) |
| Total (Category) | 350 (40.4%) | 517 (59.6%) |
| Total (Overall) | 2,289 (56.6%) | 1,757 (43.4%) |
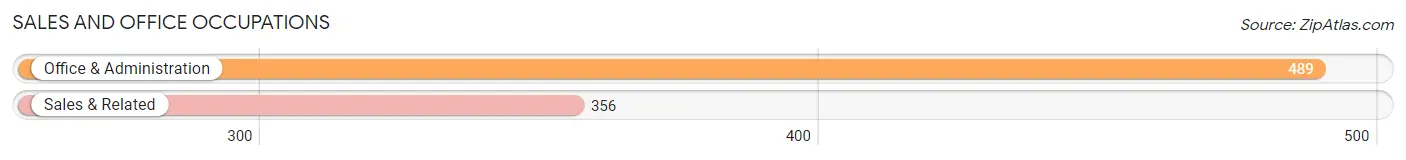
Sales and Office Occupations
The most common Sales and Office occupations in Newark are Office & Administration (489 | 12.1%), and Sales & Related (356 | 8.8%).
Sales and Office Occupations by Sex
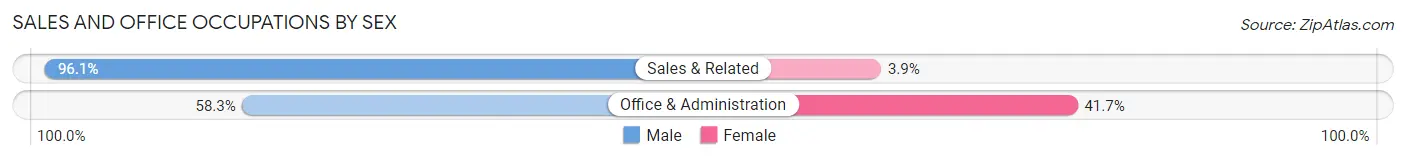
| Occupation | Male | Female |
| Sales & Related | 342 (96.1%) | 14 (3.9%) |
| Office & Administration | 285 (58.3%) | 204 (41.7%) |
| Total (Category) | 627 (74.2%) | 218 (25.8%) |
| Total (Overall) | 2,289 (56.6%) | 1,757 (43.4%) |
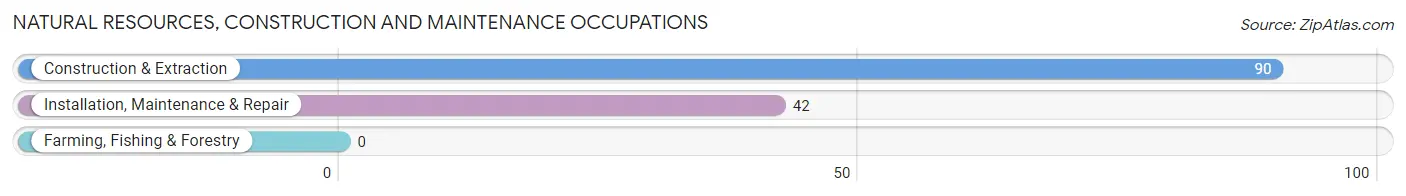
Natural Resources, Construction and Maintenance Occupations
The most common Natural Resources, Construction and Maintenance occupations in Newark are Construction & Extraction (90 | 2.2%), and Installation, Maintenance & Repair (42 | 1.0%).
Natural Resources, Construction and Maintenance Occupations by Sex
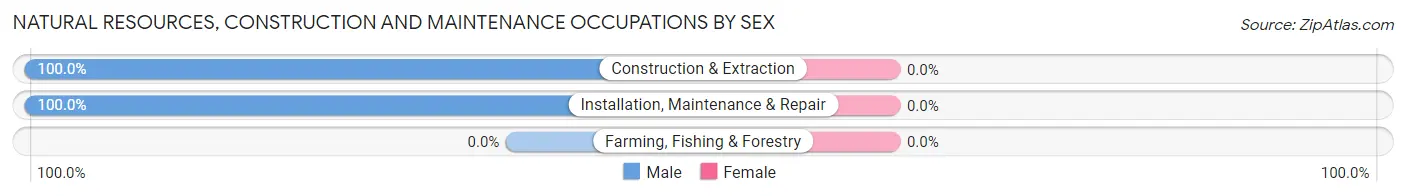
| Occupation | Male | Female |
| Farming, Fishing & Forestry | 0 (0.0%) | 0 (0.0%) |
| Construction & Extraction | 90 (100.0%) | 0 (0.0%) |
| Installation, Maintenance & Repair | 42 (100.0%) | 0 (0.0%) |
| Total (Category) | 132 (100.0%) | 0 (0.0%) |
| Total (Overall) | 2,289 (56.6%) | 1,757 (43.4%) |
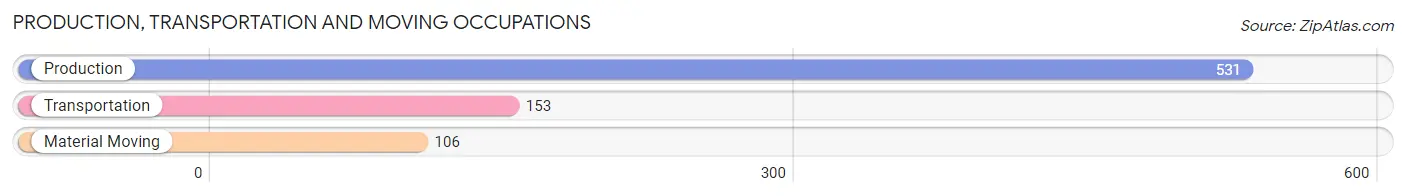
Production, Transportation and Moving Occupations
The most common Production, Transportation and Moving occupations in Newark are Production (531 | 13.1%), Transportation (153 | 3.8%), and Material Moving (106 | 2.6%).
Production, Transportation and Moving Occupations by Sex
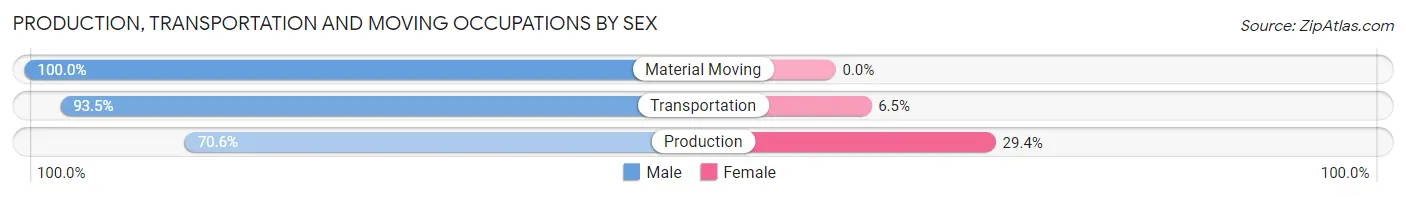
| Occupation | Male | Female |
| Production | 375 (70.6%) | 156 (29.4%) |
| Transportation | 143 (93.5%) | 10 (6.5%) |
| Material Moving | 106 (100.0%) | 0 (0.0%) |
| Total (Category) | 624 (79.0%) | 166 (21.0%) |
| Total (Overall) | 2,289 (56.6%) | 1,757 (43.4%) |
Employment Industries by Sex in Newark
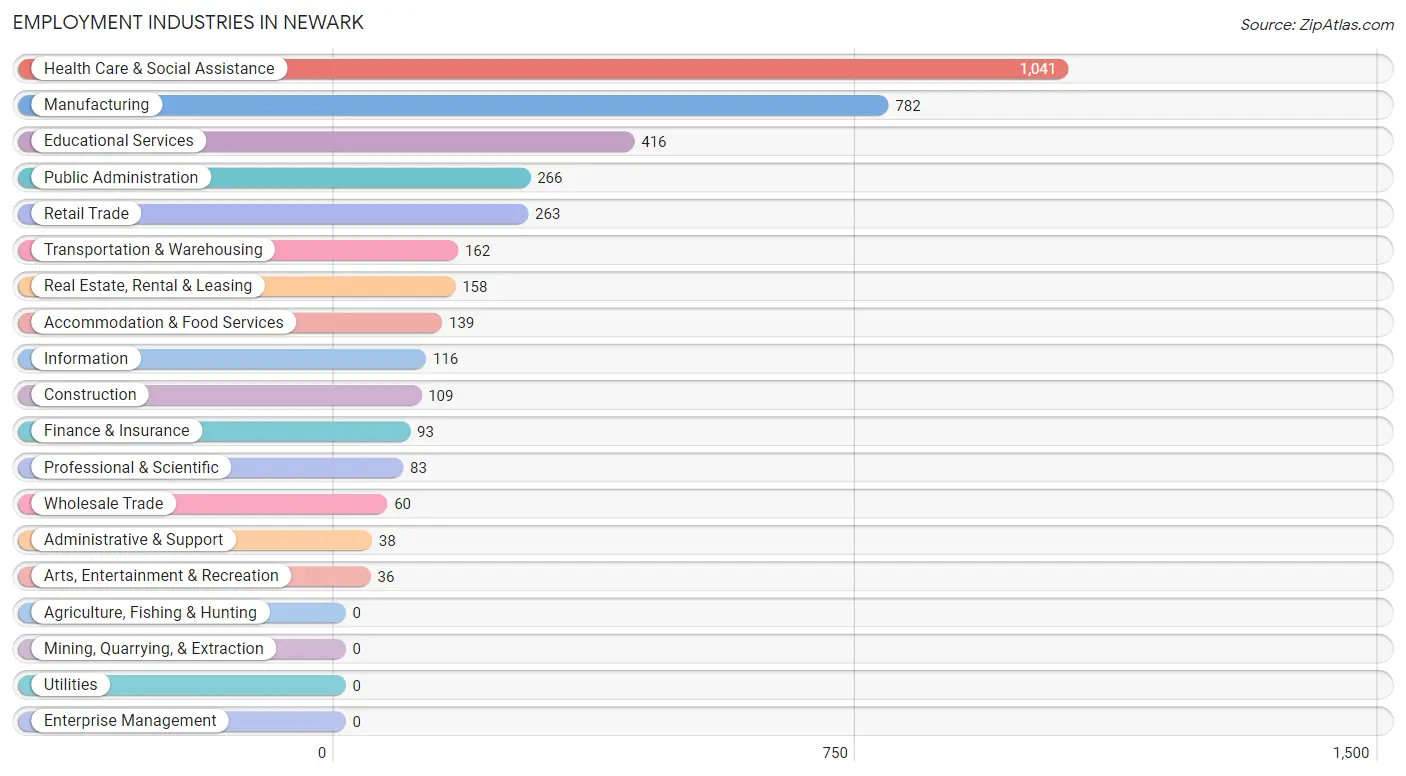
Employment Industries in Newark
The major employment industries in Newark include Health Care & Social Assistance (1,041 | 25.7%), Manufacturing (782 | 19.3%), Educational Services (416 | 10.3%), Public Administration (266 | 6.6%), and Retail Trade (263 | 6.5%).
Employment Industries by Sex in Newark
The Newark industries that see more men than women are Construction (100.0%), Arts, Entertainment & Recreation (100.0%), and Transportation & Warehousing (84.6%), whereas the industries that tend to have a higher number of women are Finance & Insurance (79.6%), Educational Services (79.1%), and Health Care & Social Assistance (68.4%).
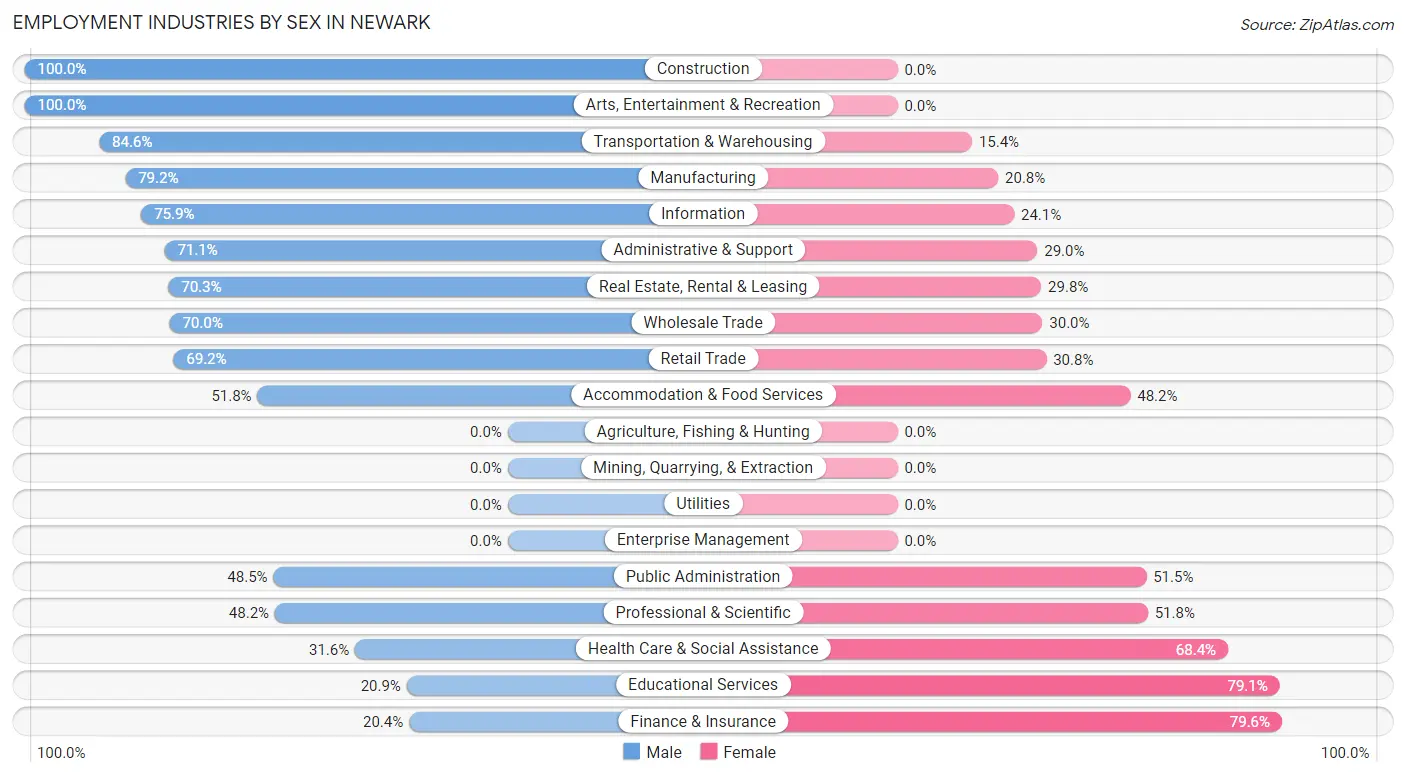
| Industry | Male | Female |
| Agriculture, Fishing & Hunting | 0 (0.0%) | 0 (0.0%) |
| Mining, Quarrying, & Extraction | 0 (0.0%) | 0 (0.0%) |
| Construction | 109 (100.0%) | 0 (0.0%) |
| Manufacturing | 619 (79.2%) | 163 (20.8%) |
| Wholesale Trade | 42 (70.0%) | 18 (30.0%) |
| Retail Trade | 182 (69.2%) | 81 (30.8%) |
| Transportation & Warehousing | 137 (84.6%) | 25 (15.4%) |
| Utilities | 0 (0.0%) | 0 (0.0%) |
| Information | 88 (75.9%) | 28 (24.1%) |
| Finance & Insurance | 19 (20.4%) | 74 (79.6%) |
| Real Estate, Rental & Leasing | 111 (70.3%) | 47 (29.7%) |
| Professional & Scientific | 40 (48.2%) | 43 (51.8%) |
| Enterprise Management | 0 (0.0%) | 0 (0.0%) |
| Administrative & Support | 27 (71.1%) | 11 (28.9%) |
| Educational Services | 87 (20.9%) | 329 (79.1%) |
| Health Care & Social Assistance | 329 (31.6%) | 712 (68.4%) |
| Arts, Entertainment & Recreation | 36 (100.0%) | 0 (0.0%) |
| Accommodation & Food Services | 72 (51.8%) | 67 (48.2%) |
| Public Administration | 129 (48.5%) | 137 (51.5%) |
| Total | 2,289 (56.6%) | 1,757 (43.4%) |
Education in Newark
School Enrollment in Newark
The most common levels of schooling among the 2,042 students in Newark are elementary school (578 | 28.3%), high school (413 | 20.2%), and middle school (358 | 17.5%).
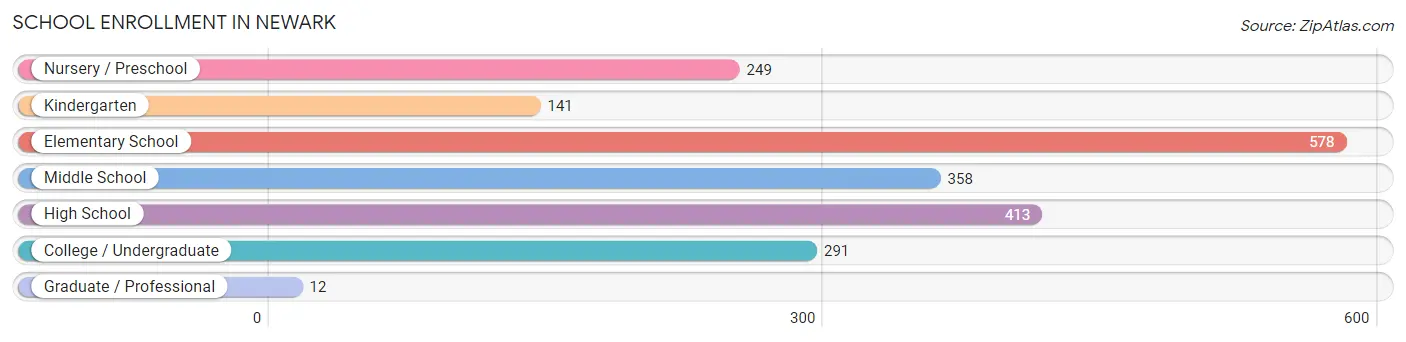
| School Level | # Students | % Students |
| Nursery / Preschool | 249 | 12.2% |
| Kindergarten | 141 | 6.9% |
| Elementary School | 578 | 28.3% |
| Middle School | 358 | 17.5% |
| High School | 413 | 20.2% |
| College / Undergraduate | 291 | 14.2% |
| Graduate / Professional | 12 | 0.6% |
| Total | 2,042 | 100.0% |
School Enrollment by Age by Funding Source in Newark
Out of a total of 2,042 students who are enrolled in schools in Newark, 415 (20.3%) attend a private institution, while the remaining 1,627 (79.7%) are enrolled in public schools. The age group of 35 years and over has the highest likelihood of being enrolled in private schools, with 31 (64.6% in the age bracket) enrolled. Conversely, the age group of 25 to 34 year olds has the lowest likelihood of being enrolled in a private school, with 57 (100.0% in the age bracket) attending a public institution.
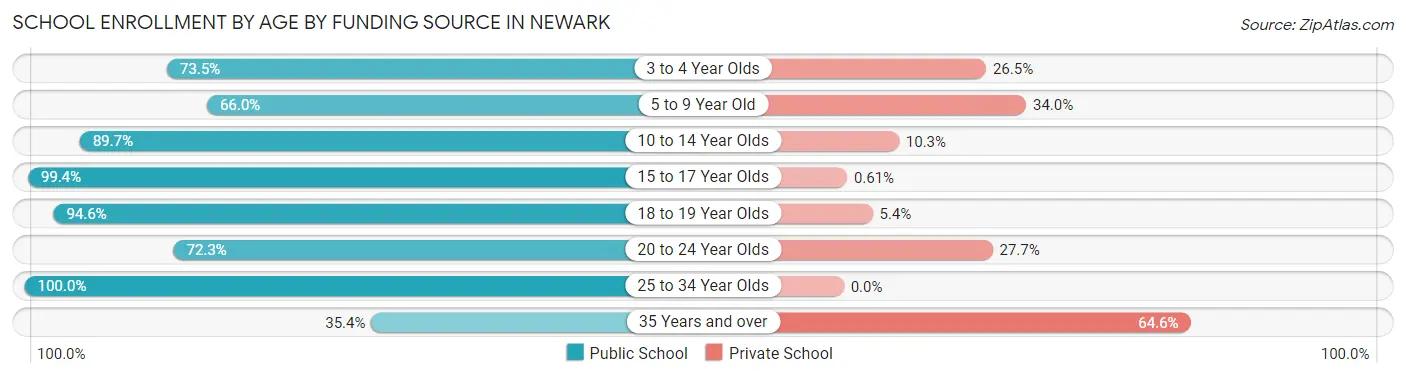
| Age Bracket | Public School | Private School |
| 3 to 4 Year Olds | 183 (73.5%) | 66 (26.5%) |
| 5 to 9 Year Old | 451 (66.0%) | 232 (34.0%) |
| 10 to 14 Year Olds | 384 (89.7%) | 44 (10.3%) |
| 15 to 17 Year Olds | 326 (99.4%) | 2 (0.6%) |
| 18 to 19 Year Olds | 123 (94.6%) | 7 (5.4%) |
| 20 to 24 Year Olds | 86 (72.3%) | 33 (27.7%) |
| 25 to 34 Year Olds | 57 (100.0%) | 0 (0.0%) |
| 35 Years and over | 17 (35.4%) | 31 (64.6%) |
| Total | 1,627 (79.7%) | 415 (20.3%) |
Educational Attainment by Field of Study in Newark
Education (466 | 35.9%), psychology (122 | 9.4%), liberal arts & history (106 | 8.2%), business (102 | 7.9%), and arts & humanities (90 | 6.9%) are the most common fields of study among 1,298 individuals in Newark who have obtained a bachelor's degree or higher.
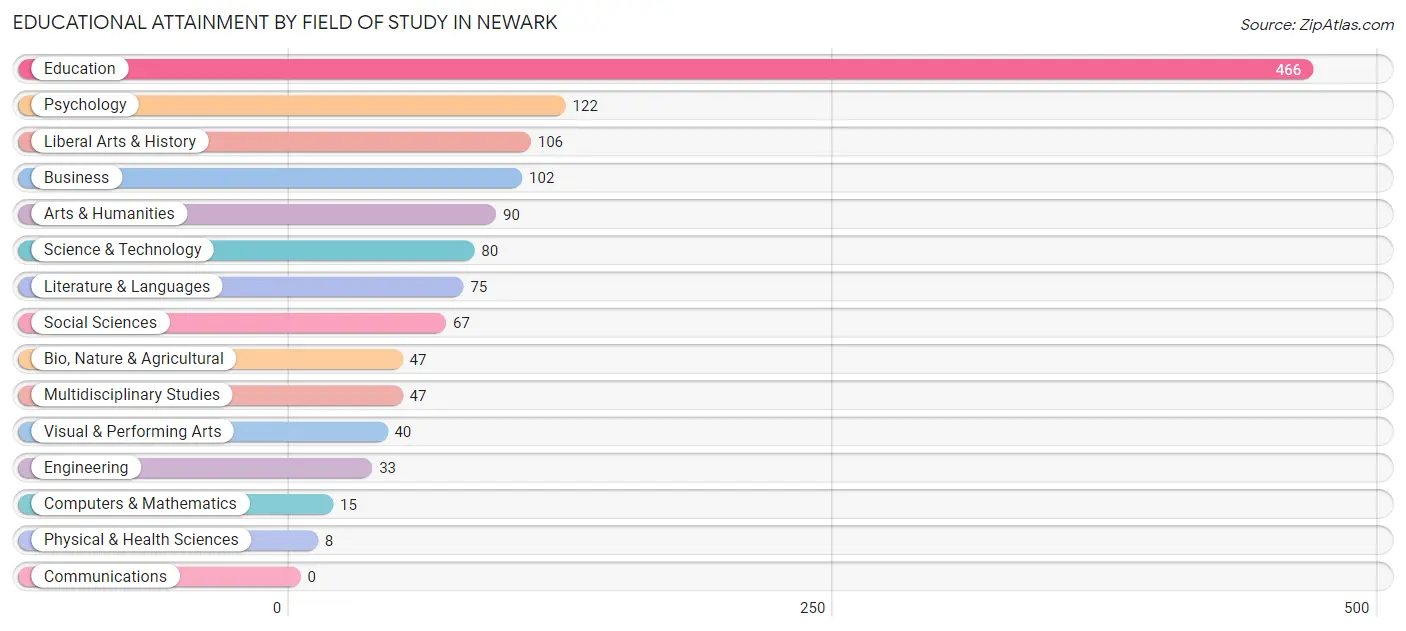
| Field of Study | # Graduates | % Graduates |
| Computers & Mathematics | 15 | 1.2% |
| Bio, Nature & Agricultural | 47 | 3.6% |
| Physical & Health Sciences | 8 | 0.6% |
| Psychology | 122 | 9.4% |
| Social Sciences | 67 | 5.2% |
| Engineering | 33 | 2.5% |
| Multidisciplinary Studies | 47 | 3.6% |
| Science & Technology | 80 | 6.2% |
| Business | 102 | 7.9% |
| Education | 466 | 35.9% |
| Literature & Languages | 75 | 5.8% |
| Liberal Arts & History | 106 | 8.2% |
| Visual & Performing Arts | 40 | 3.1% |
| Communications | 0 | 0.0% |
| Arts & Humanities | 90 | 6.9% |
| Total | 1,298 | 100.0% |
Transportation & Commute in Newark
Vehicle Availability by Sex in Newark
The most prevalent vehicle ownership categories in Newark are males with 2 vehicles (1,262, accounting for 58.6%) and females with 2 vehicles (669, making up 76.9%).
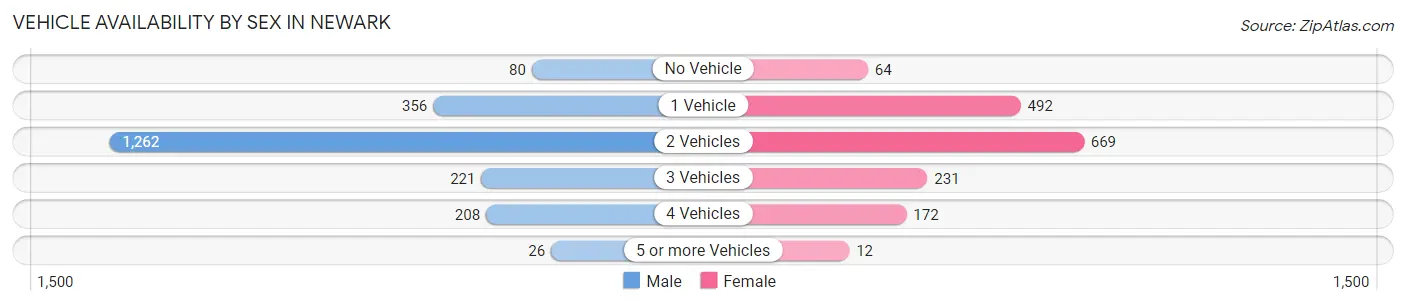
| Vehicles Available | Male | Female |
| No Vehicle | 80 (3.7%) | 64 (3.9%) |
| 1 Vehicle | 356 (16.5%) | 492 (30.0%) |
| 2 Vehicles | 1,262 (58.6%) | 669 (40.8%) |
| 3 Vehicles | 221 (10.3%) | 231 (14.1%) |
| 4 Vehicles | 208 (9.7%) | 172 (10.5%) |
| 5 or more Vehicles | 26 (1.2%) | 12 (0.7%) |
| Total | 2,153 (100.0%) | 1,640 (100.0%) |
Commute Time in Newark
The most frequently occuring commute durations in Newark are 5 to 9 minutes (845 commuters, 23.3%), less than 5 minutes (627 commuters, 17.3%), and 10 to 14 minutes (509 commuters, 14.0%).
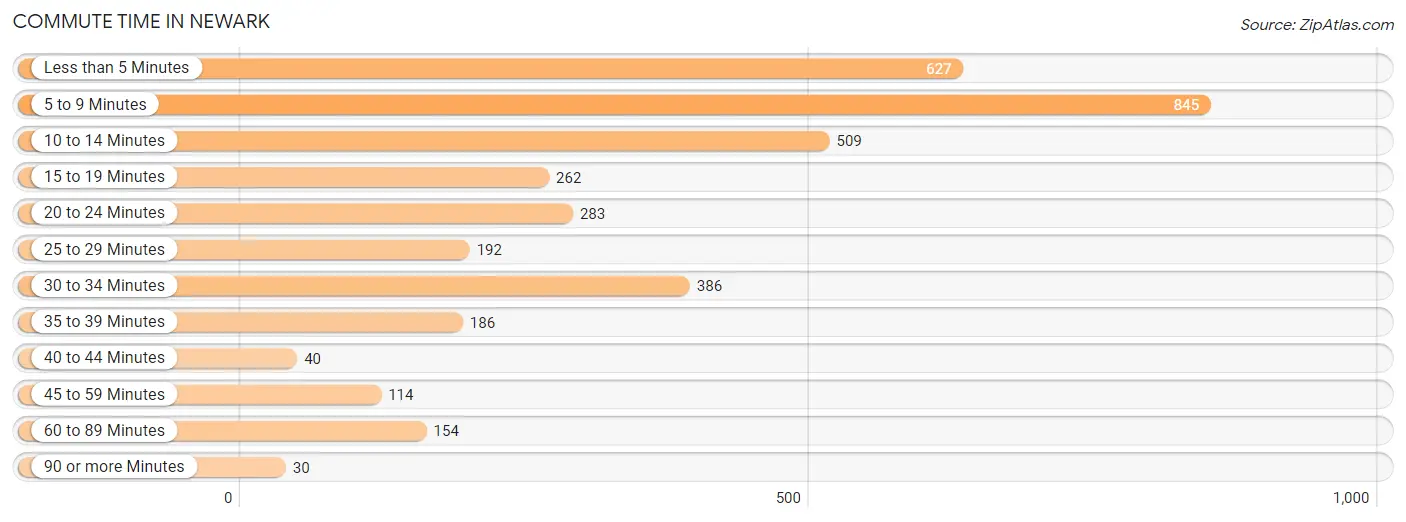
| Commute Time | # Commuters | % Commuters |
| Less than 5 Minutes | 627 | 17.3% |
| 5 to 9 Minutes | 845 | 23.3% |
| 10 to 14 Minutes | 509 | 14.0% |
| 15 to 19 Minutes | 262 | 7.2% |
| 20 to 24 Minutes | 283 | 7.8% |
| 25 to 29 Minutes | 192 | 5.3% |
| 30 to 34 Minutes | 386 | 10.6% |
| 35 to 39 Minutes | 186 | 5.1% |
| 40 to 44 Minutes | 40 | 1.1% |
| 45 to 59 Minutes | 114 | 3.1% |
| 60 to 89 Minutes | 154 | 4.2% |
| 90 or more Minutes | 30 | 0.8% |
Commute Time by Sex in Newark
The most common commute times in Newark are 5 to 9 minutes (478 commuters, 22.5%) for males and 5 to 9 minutes (367 commuters, 24.4%) for females.
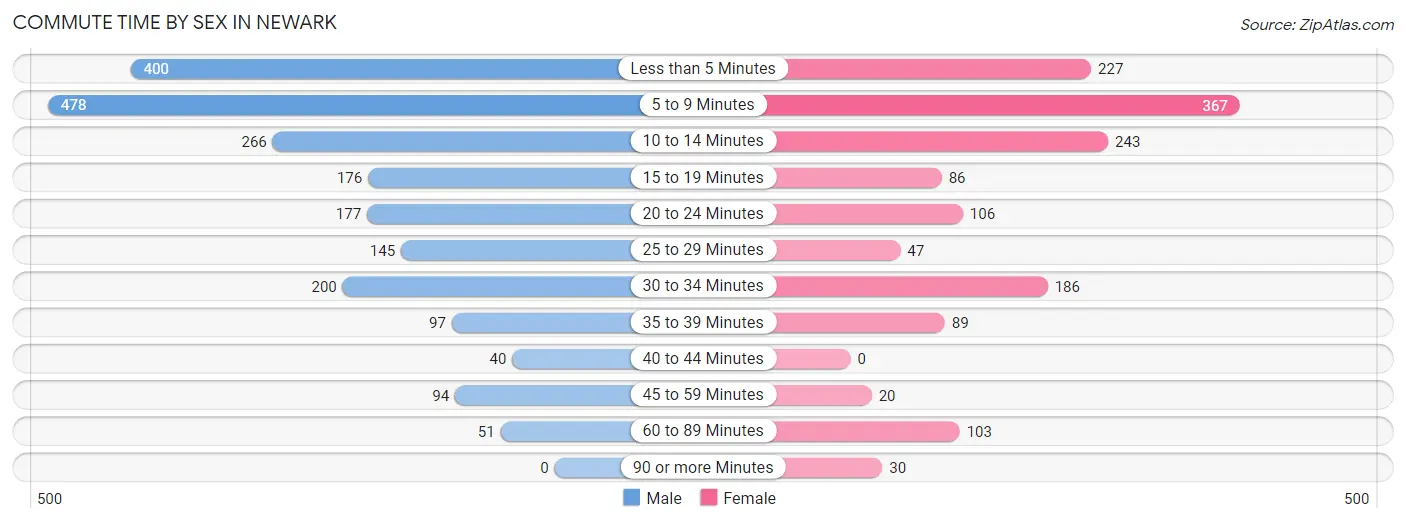
| Commute Time | Male | Female |
| Less than 5 Minutes | 400 (18.8%) | 227 (15.1%) |
| 5 to 9 Minutes | 478 (22.5%) | 367 (24.4%) |
| 10 to 14 Minutes | 266 (12.5%) | 243 (16.2%) |
| 15 to 19 Minutes | 176 (8.3%) | 86 (5.7%) |
| 20 to 24 Minutes | 177 (8.3%) | 106 (7.0%) |
| 25 to 29 Minutes | 145 (6.8%) | 47 (3.1%) |
| 30 to 34 Minutes | 200 (9.4%) | 186 (12.4%) |
| 35 to 39 Minutes | 97 (4.6%) | 89 (5.9%) |
| 40 to 44 Minutes | 40 (1.9%) | 0 (0.0%) |
| 45 to 59 Minutes | 94 (4.4%) | 20 (1.3%) |
| 60 to 89 Minutes | 51 (2.4%) | 103 (6.9%) |
| 90 or more Minutes | 0 (0.0%) | 30 (2.0%) |
Time of Departure to Work by Sex in Newark
The most frequent times of departure to work in Newark are 6:30 AM to 6:59 AM (360, 17.0%) for males and 8:30 AM to 8:59 AM (218, 14.5%) for females.
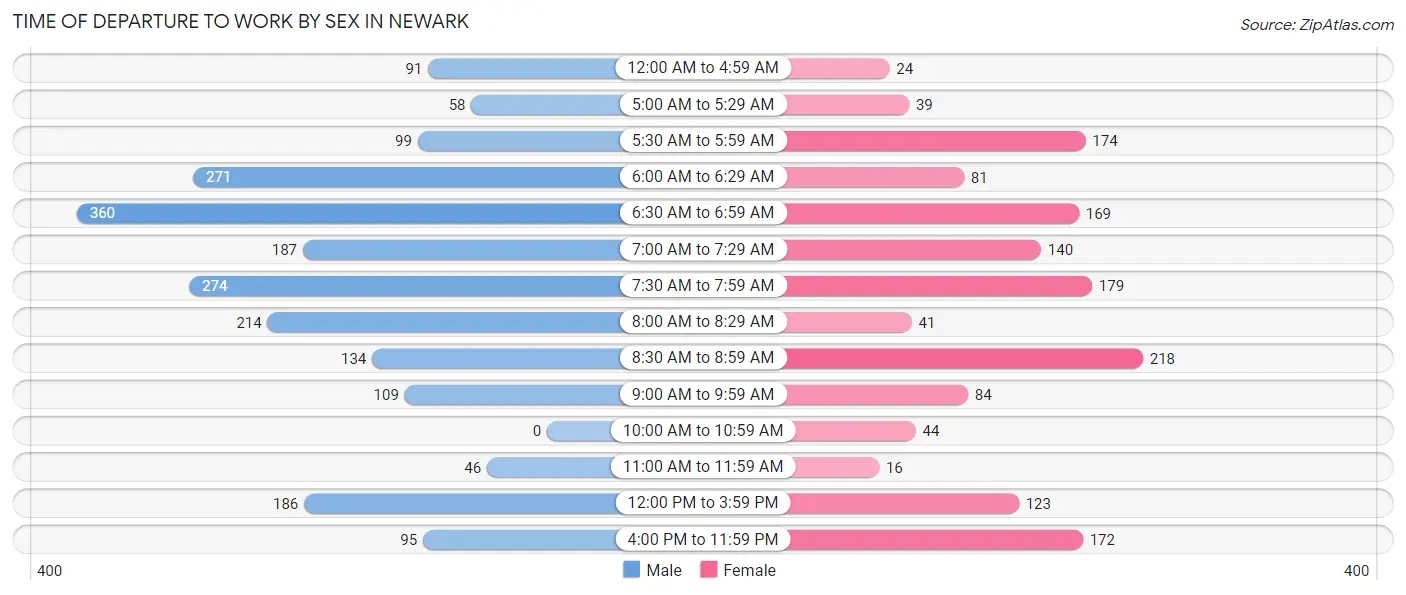
| Time of Departure | Male | Female |
| 12:00 AM to 4:59 AM | 91 (4.3%) | 24 (1.6%) |
| 5:00 AM to 5:29 AM | 58 (2.7%) | 39 (2.6%) |
| 5:30 AM to 5:59 AM | 99 (4.7%) | 174 (11.6%) |
| 6:00 AM to 6:29 AM | 271 (12.8%) | 81 (5.4%) |
| 6:30 AM to 6:59 AM | 360 (17.0%) | 169 (11.2%) |
| 7:00 AM to 7:29 AM | 187 (8.8%) | 140 (9.3%) |
| 7:30 AM to 7:59 AM | 274 (12.9%) | 179 (11.9%) |
| 8:00 AM to 8:29 AM | 214 (10.1%) | 41 (2.7%) |
| 8:30 AM to 8:59 AM | 134 (6.3%) | 218 (14.5%) |
| 9:00 AM to 9:59 AM | 109 (5.1%) | 84 (5.6%) |
| 10:00 AM to 10:59 AM | 0 (0.0%) | 44 (2.9%) |
| 11:00 AM to 11:59 AM | 46 (2.2%) | 16 (1.1%) |
| 12:00 PM to 3:59 PM | 186 (8.8%) | 123 (8.2%) |
| 4:00 PM to 11:59 PM | 95 (4.5%) | 172 (11.4%) |
| Total | 2,124 (100.0%) | 1,504 (100.0%) |
Housing Occupancy in Newark
Occupancy by Ownership in Newark
Of the total 3,780 dwellings in Newark, owner-occupied units account for 2,162 (57.2%), while renter-occupied units make up 1,618 (42.8%).
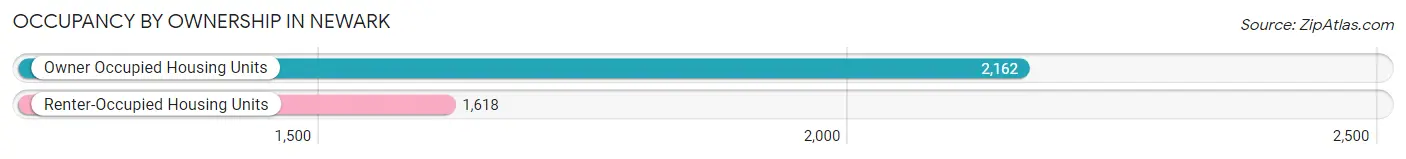
| Occupancy | # Housing Units | % Housing Units |
| Owner Occupied Housing Units | 2,162 | 57.2% |
| Renter-Occupied Housing Units | 1,618 | 42.8% |
| Total Occupied Housing Units | 3,780 | 100.0% |
Occupancy by Household Size in Newark
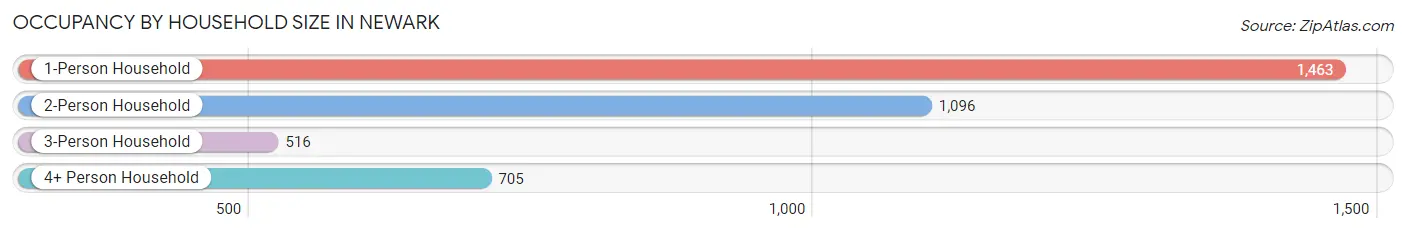
| Household Size | # Housing Units | % Housing Units |
| 1-Person Household | 1,463 | 38.7% |
| 2-Person Household | 1,096 | 29.0% |
| 3-Person Household | 516 | 13.7% |
| 4+ Person Household | 705 | 18.6% |
| Total Housing Units | 3,780 | 100.0% |
Occupancy by Ownership by Household Size in Newark
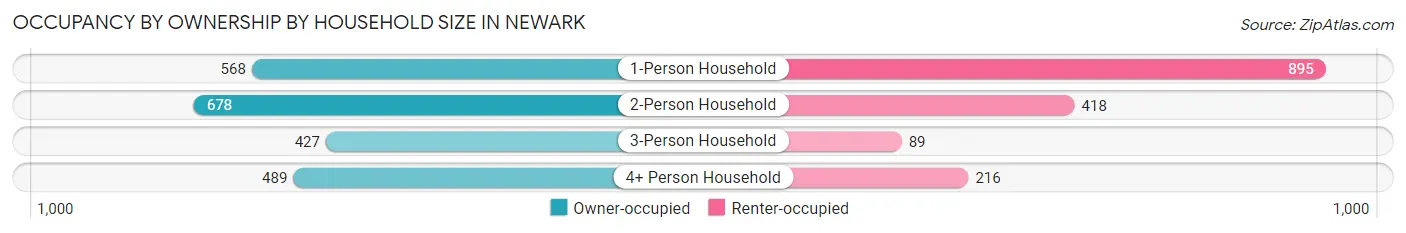
| Household Size | Owner-occupied | Renter-occupied |
| 1-Person Household | 568 (38.8%) | 895 (61.2%) |
| 2-Person Household | 678 (61.9%) | 418 (38.1%) |
| 3-Person Household | 427 (82.8%) | 89 (17.2%) |
| 4+ Person Household | 489 (69.4%) | 216 (30.6%) |
| Total Housing Units | 2,162 (57.2%) | 1,618 (42.8%) |
Occupancy by Educational Attainment in Newark
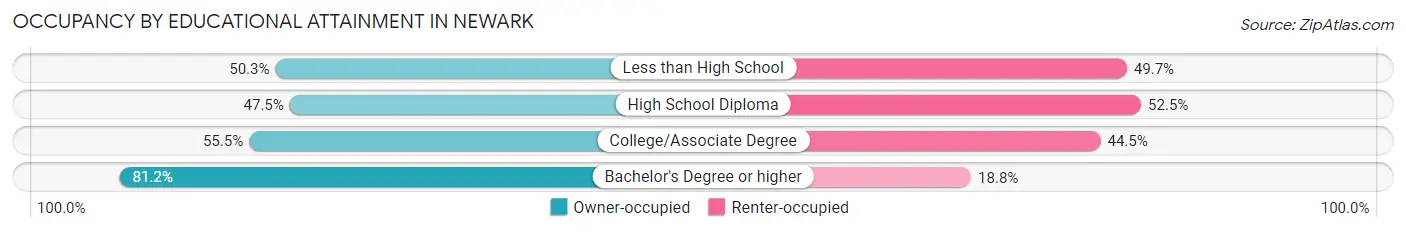
| Household Size | Owner-occupied | Renter-occupied |
| Less than High School | 260 (50.3%) | 257 (49.7%) |
| High School Diploma | 477 (47.5%) | 528 (52.5%) |
| College/Associate Degree | 882 (55.5%) | 707 (44.5%) |
| Bachelor's Degree or higher | 543 (81.2%) | 126 (18.8%) |
Occupancy by Age of Householder in Newark
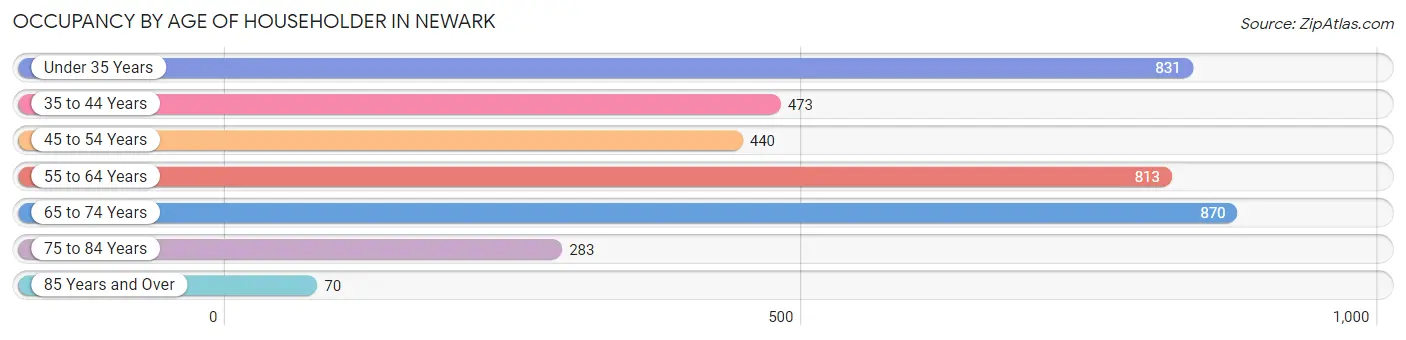
| Age Bracket | # Households | % Households |
| Under 35 Years | 831 | 22.0% |
| 35 to 44 Years | 473 | 12.5% |
| 45 to 54 Years | 440 | 11.6% |
| 55 to 64 Years | 813 | 21.5% |
| 65 to 74 Years | 870 | 23.0% |
| 75 to 84 Years | 283 | 7.5% |
| 85 Years and Over | 70 | 1.8% |
| Total | 3,780 | 100.0% |
Housing Finances in Newark
Median Income by Occupancy in Newark
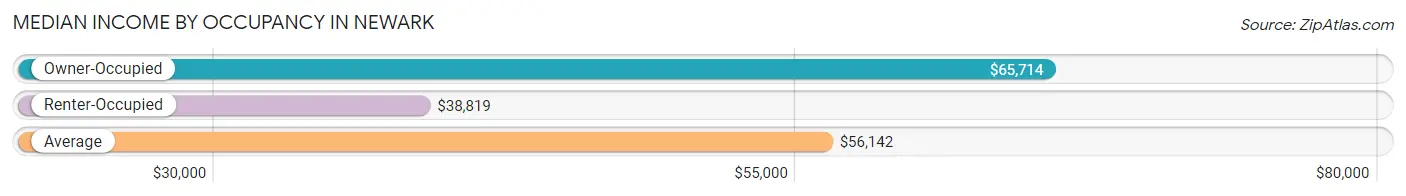
| Occupancy Type | # Households | Median Income |
| Owner-Occupied | 2,162 (57.2%) | $65,714 |
| Renter-Occupied | 1,618 (42.8%) | $38,819 |
| Average | 3,780 (100.0%) | $56,142 |
Occupancy by Householder Income Bracket in Newark
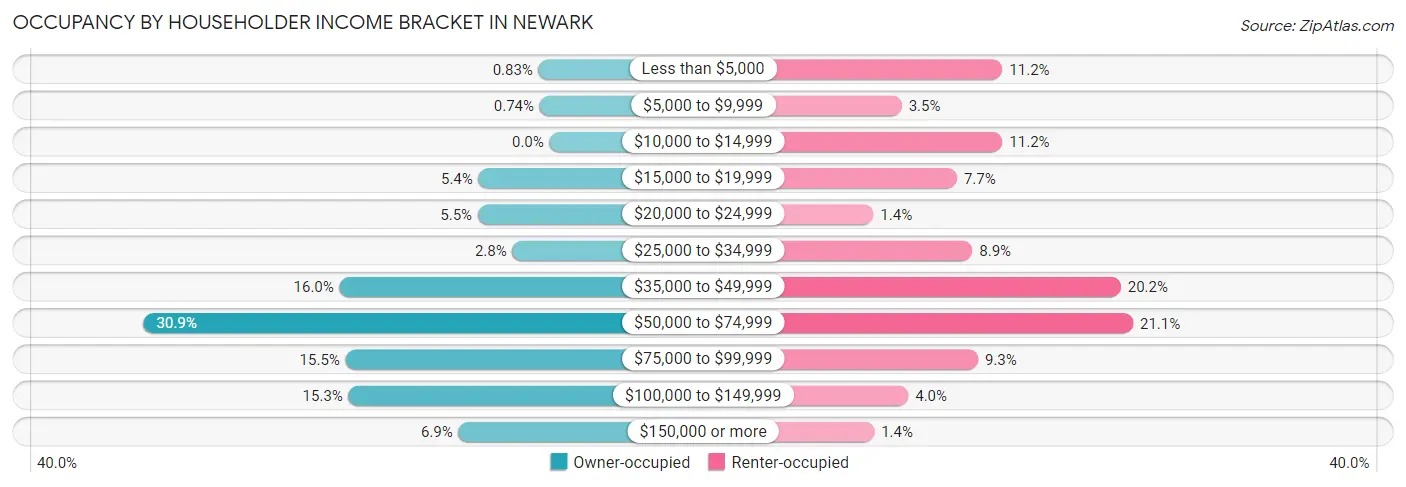
| Income Bracket | Owner-occupied | Renter-occupied |
| Less than $5,000 | 18 (0.8%) | 181 (11.2%) |
| $5,000 to $9,999 | 16 (0.7%) | 57 (3.5%) |
| $10,000 to $14,999 | 0 (0.0%) | 181 (11.2%) |
| $15,000 to $19,999 | 117 (5.4%) | 125 (7.7%) |
| $20,000 to $24,999 | 118 (5.5%) | 22 (1.4%) |
| $25,000 to $34,999 | 61 (2.8%) | 144 (8.9%) |
| $35,000 to $49,999 | 346 (16.0%) | 327 (20.2%) |
| $50,000 to $74,999 | 669 (30.9%) | 342 (21.1%) |
| $75,000 to $99,999 | 336 (15.5%) | 151 (9.3%) |
| $100,000 to $149,999 | 331 (15.3%) | 65 (4.0%) |
| $150,000 or more | 150 (6.9%) | 23 (1.4%) |
| Total | 2,162 (100.0%) | 1,618 (100.0%) |
Monthly Housing Cost Tiers in Newark
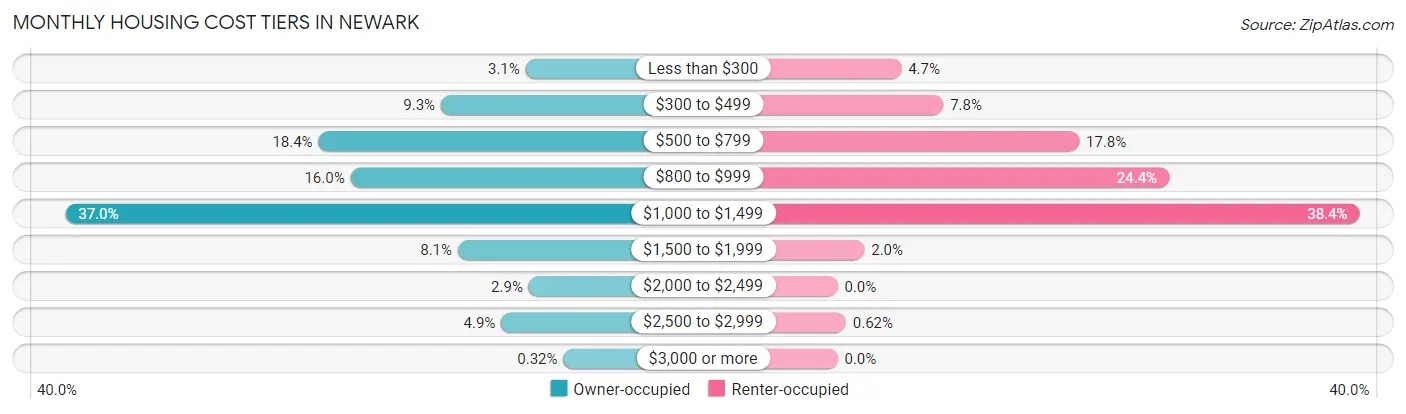
| Monthly Cost | Owner-occupied | Renter-occupied |
| Less than $300 | 67 (3.1%) | 76 (4.7%) |
| $300 to $499 | 202 (9.3%) | 126 (7.8%) |
| $500 to $799 | 397 (18.4%) | 288 (17.8%) |
| $800 to $999 | 346 (16.0%) | 395 (24.4%) |
| $1,000 to $1,499 | 800 (37.0%) | 622 (38.4%) |
| $1,500 to $1,999 | 175 (8.1%) | 32 (2.0%) |
| $2,000 to $2,499 | 62 (2.9%) | 0 (0.0%) |
| $2,500 to $2,999 | 106 (4.9%) | 10 (0.6%) |
| $3,000 or more | 7 (0.3%) | 0 (0.0%) |
| Total | 2,162 (100.0%) | 1,618 (100.0%) |
Physical Housing Characteristics in Newark
Housing Structures in Newark
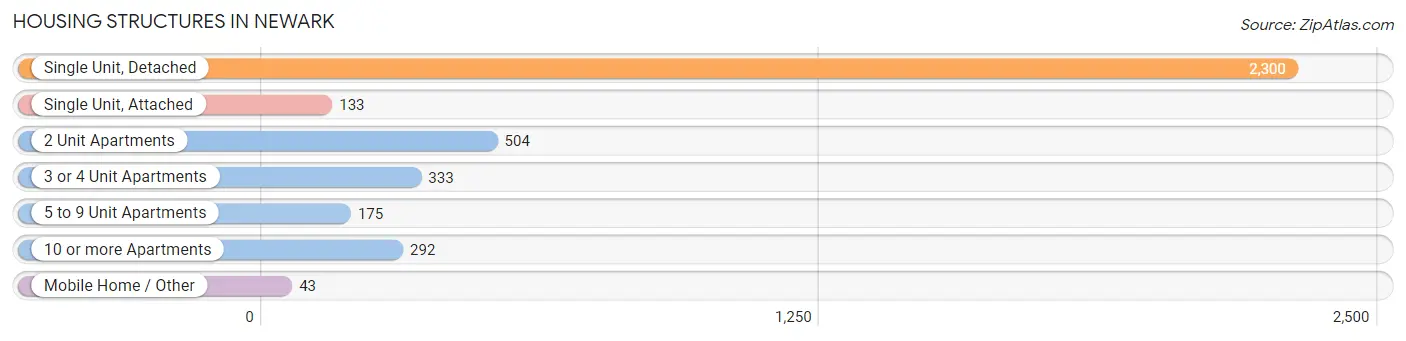
| Structure Type | # Housing Units | % Housing Units |
| Single Unit, Detached | 2,300 | 60.9% |
| Single Unit, Attached | 133 | 3.5% |
| 2 Unit Apartments | 504 | 13.3% |
| 3 or 4 Unit Apartments | 333 | 8.8% |
| 5 to 9 Unit Apartments | 175 | 4.6% |
| 10 or more Apartments | 292 | 7.7% |
| Mobile Home / Other | 43 | 1.1% |
| Total | 3,780 | 100.0% |
Housing Structures by Occupancy in Newark
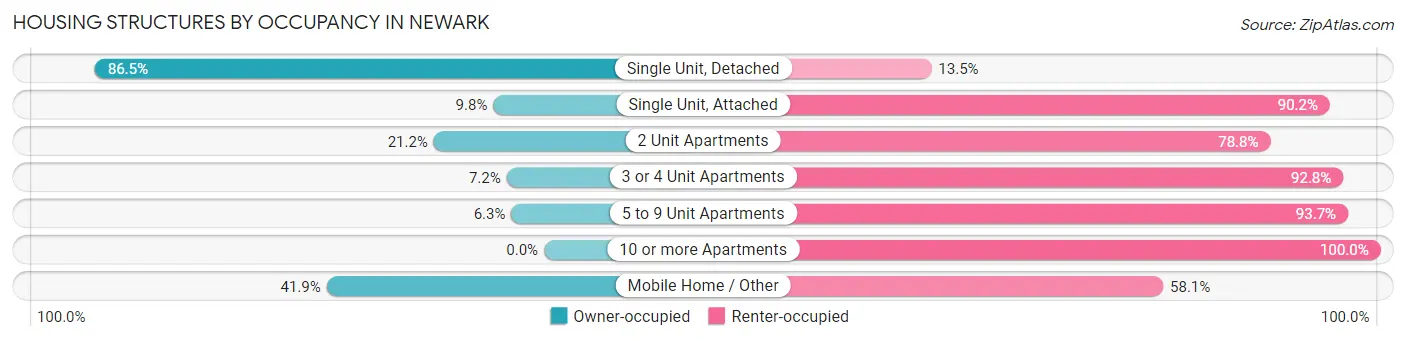
| Structure Type | Owner-occupied | Renter-occupied |
| Single Unit, Detached | 1,989 (86.5%) | 311 (13.5%) |
| Single Unit, Attached | 13 (9.8%) | 120 (90.2%) |
| 2 Unit Apartments | 107 (21.2%) | 397 (78.8%) |
| 3 or 4 Unit Apartments | 24 (7.2%) | 309 (92.8%) |
| 5 to 9 Unit Apartments | 11 (6.3%) | 164 (93.7%) |
| 10 or more Apartments | 0 (0.0%) | 292 (100.0%) |
| Mobile Home / Other | 18 (41.9%) | 25 (58.1%) |
| Total | 2,162 (57.2%) | 1,618 (42.8%) |
Housing Structures by Number of Rooms in Newark
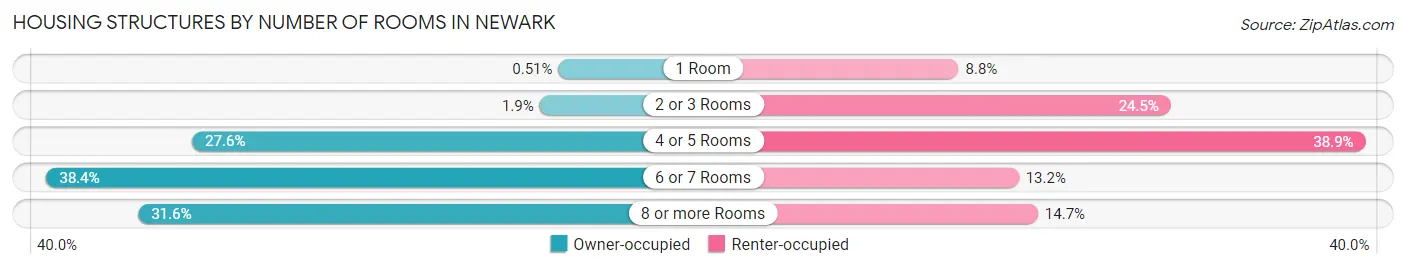
| Number of Rooms | Owner-occupied | Renter-occupied |
| 1 Room | 11 (0.5%) | 142 (8.8%) |
| 2 or 3 Rooms | 41 (1.9%) | 396 (24.5%) |
| 4 or 5 Rooms | 597 (27.6%) | 629 (38.9%) |
| 6 or 7 Rooms | 830 (38.4%) | 214 (13.2%) |
| 8 or more Rooms | 683 (31.6%) | 237 (14.6%) |
| Total | 2,162 (100.0%) | 1,618 (100.0%) |
Housing Structure by Heating Type in Newark
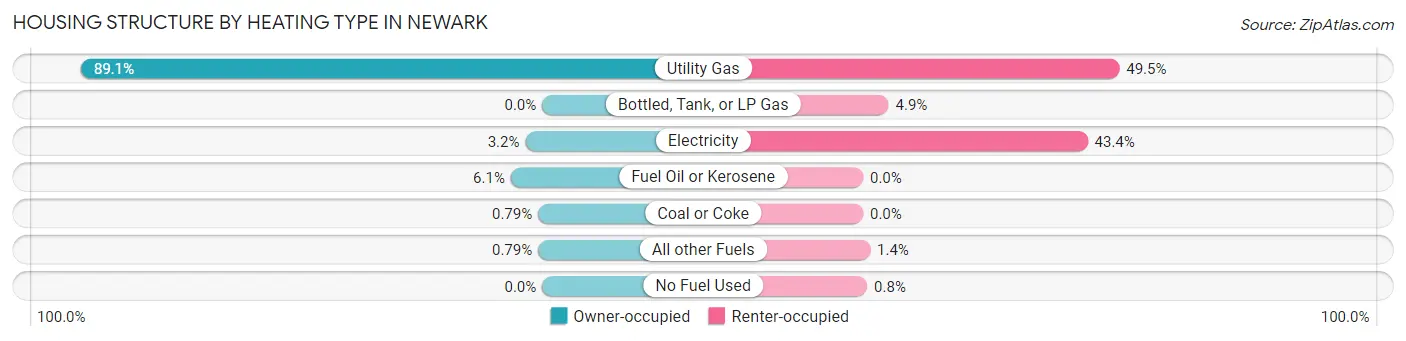
| Heating Type | Owner-occupied | Renter-occupied |
| Utility Gas | 1,927 (89.1%) | 801 (49.5%) |
| Bottled, Tank, or LP Gas | 0 (0.0%) | 80 (4.9%) |
| Electricity | 70 (3.2%) | 702 (43.4%) |
| Fuel Oil or Kerosene | 131 (6.1%) | 0 (0.0%) |
| Coal or Coke | 17 (0.8%) | 0 (0.0%) |
| All other Fuels | 17 (0.8%) | 22 (1.4%) |
| No Fuel Used | 0 (0.0%) | 13 (0.8%) |
| Total | 2,162 (100.0%) | 1,618 (100.0%) |
Household Vehicle Usage in Newark
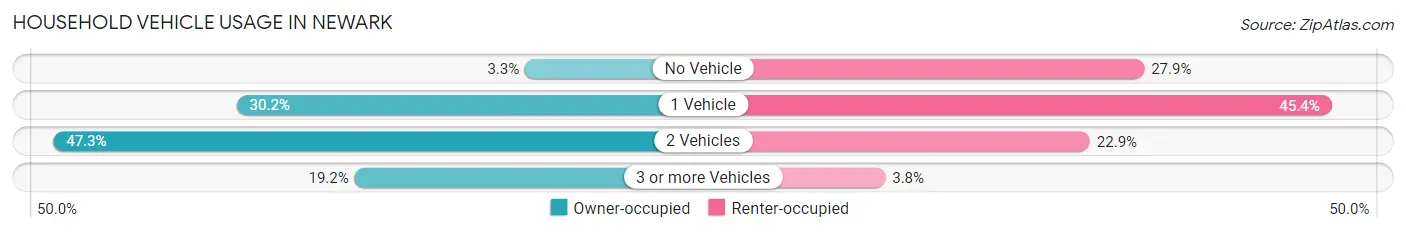
| Vehicles per Household | Owner-occupied | Renter-occupied |
| No Vehicle | 71 (3.3%) | 452 (27.9%) |
| 1 Vehicle | 653 (30.2%) | 735 (45.4%) |
| 2 Vehicles | 1,023 (47.3%) | 370 (22.9%) |
| 3 or more Vehicles | 415 (19.2%) | 61 (3.8%) |
| Total | 2,162 (100.0%) | 1,618 (100.0%) |
Real Estate & Mortgages in Newark
Real Estate and Mortgage Overview in Newark
| Characteristic | Without Mortgage | With Mortgage |
| Housing Units | 813 | 1,349 |
| Median Property Value | $114,300 | $117,000 |
| Median Household Income | $63,906 | $125 |
| Monthly Housing Costs | $621 | $7 |
| Real Estate Taxes | $3,528 | $0 |
Property Value by Mortgage Status in Newark
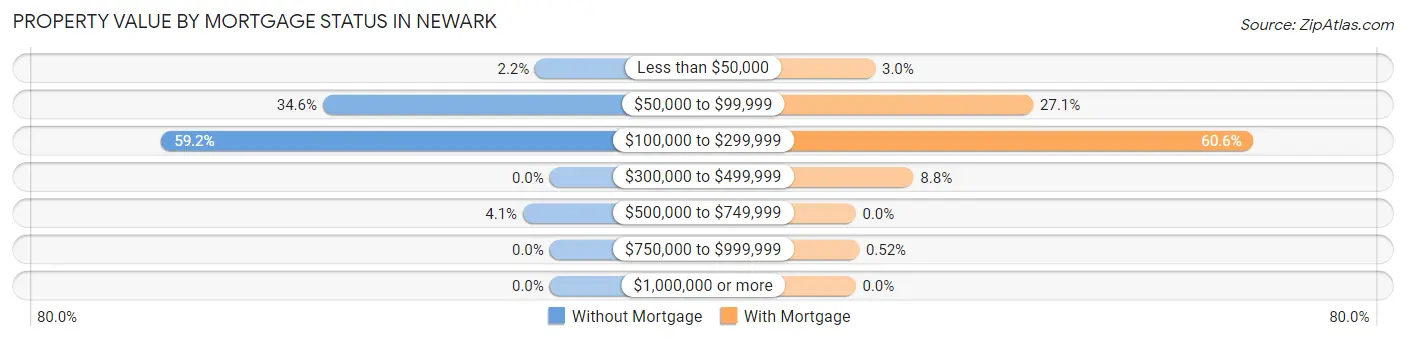
| Property Value | Without Mortgage | With Mortgage |
| Less than $50,000 | 18 (2.2%) | 40 (3.0%) |
| $50,000 to $99,999 | 281 (34.6%) | 365 (27.1%) |
| $100,000 to $299,999 | 481 (59.2%) | 818 (60.6%) |
| $300,000 to $499,999 | 0 (0.0%) | 119 (8.8%) |
| $500,000 to $749,999 | 33 (4.1%) | 0 (0.0%) |
| $750,000 to $999,999 | 0 (0.0%) | 7 (0.5%) |
| $1,000,000 or more | 0 (0.0%) | 0 (0.0%) |
| Total | 813 (100.0%) | 1,349 (100.0%) |
Household Income by Mortgage Status in Newark
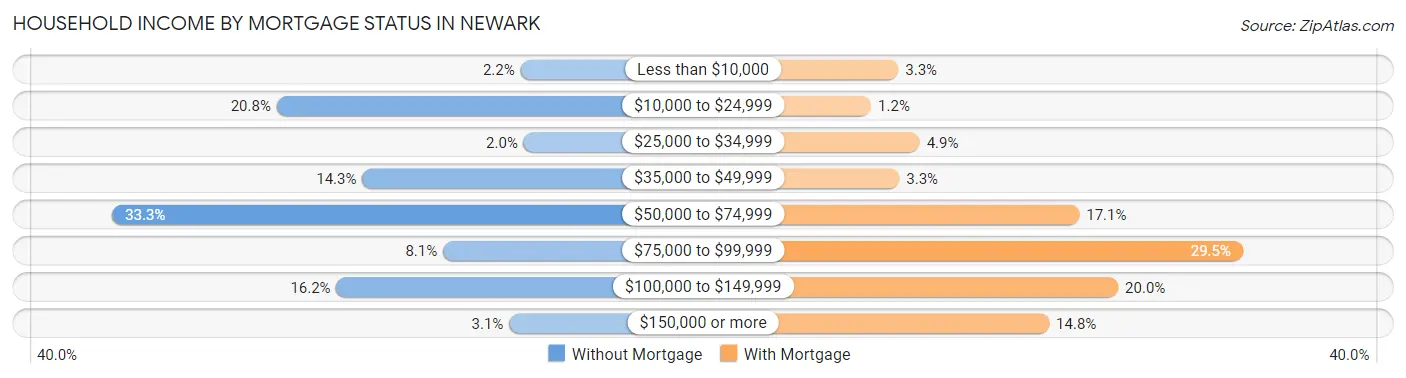
| Household Income | Without Mortgage | With Mortgage |
| Less than $10,000 | 18 (2.2%) | 44 (3.3%) |
| $10,000 to $24,999 | 169 (20.8%) | 16 (1.2%) |
| $25,000 to $34,999 | 16 (2.0%) | 66 (4.9%) |
| $35,000 to $49,999 | 116 (14.3%) | 45 (3.3%) |
| $50,000 to $74,999 | 271 (33.3%) | 230 (17.1%) |
| $75,000 to $99,999 | 66 (8.1%) | 398 (29.5%) |
| $100,000 to $149,999 | 132 (16.2%) | 270 (20.0%) |
| $150,000 or more | 25 (3.1%) | 199 (14.7%) |
| Total | 813 (100.0%) | 1,349 (100.0%) |
Property Value to Household Income Ratio in Newark
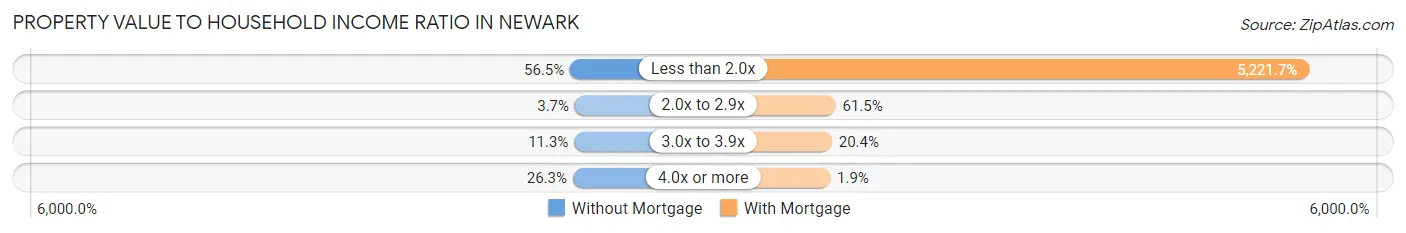
| Value-to-Income Ratio | Without Mortgage | With Mortgage |
| Less than 2.0x | 459 (56.5%) | 70,440 (5,221.7%) |
| 2.0x to 2.9x | 30 (3.7%) | 830 (61.5%) |
| 3.0x to 3.9x | 92 (11.3%) | 275 (20.4%) |
| 4.0x or more | 214 (26.3%) | 25 (1.8%) |
| Total | 813 (100.0%) | 1,349 (100.0%) |
Real Estate Taxes by Mortgage Status in Newark
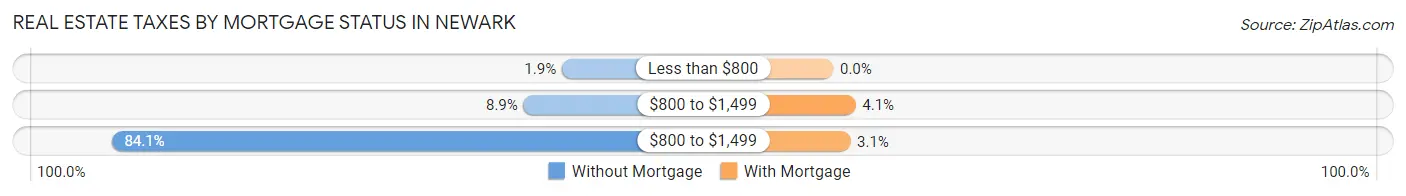
| Property Taxes | Without Mortgage | With Mortgage |
| Less than $800 | 15 (1.8%) | 0 (0.0%) |
| $800 to $1,499 | 72 (8.9%) | 55 (4.1%) |
| $800 to $1,499 | 684 (84.1%) | 42 (3.1%) |
| Total | 813 (100.0%) | 1,349 (100.0%) |
Health & Disability in Newark
Health Insurance Coverage by Age in Newark
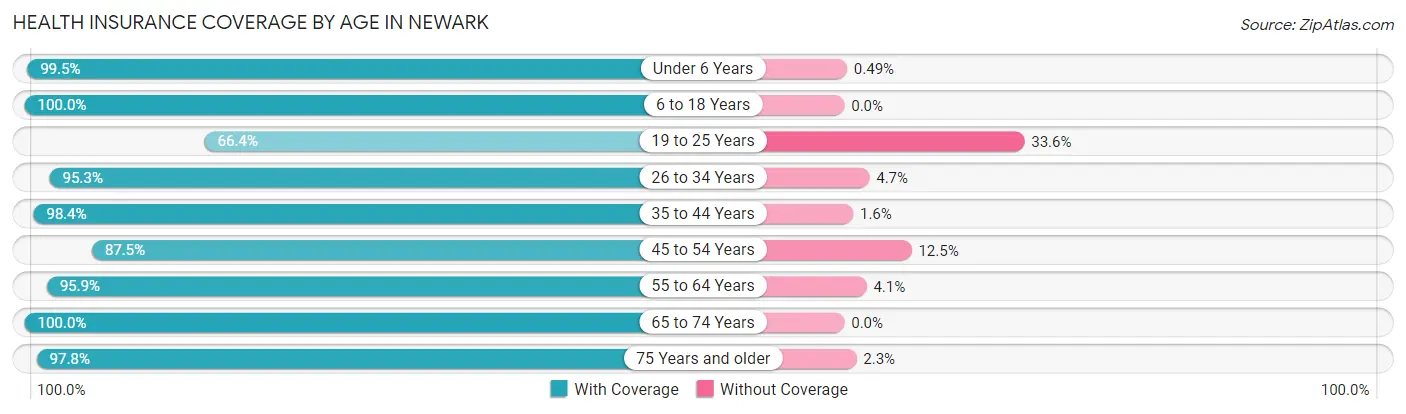
| Age Bracket | With Coverage | Without Coverage |
| Under 6 Years | 604 (99.5%) | 3 (0.5%) |
| 6 to 18 Years | 1,461 (100.0%) | 0 (0.0%) |
| 19 to 25 Years | 489 (66.4%) | 247 (33.6%) |
| 26 to 34 Years | 1,371 (95.3%) | 67 (4.7%) |
| 35 to 44 Years | 724 (98.4%) | 12 (1.6%) |
| 45 to 54 Years | 789 (87.5%) | 113 (12.5%) |
| 55 to 64 Years | 1,185 (95.9%) | 51 (4.1%) |
| 65 to 74 Years | 1,158 (100.0%) | 0 (0.0%) |
| 75 Years and older | 566 (97.8%) | 13 (2.2%) |
| Total | 8,347 (94.3%) | 506 (5.7%) |
Health Insurance Coverage by Citizenship Status in Newark
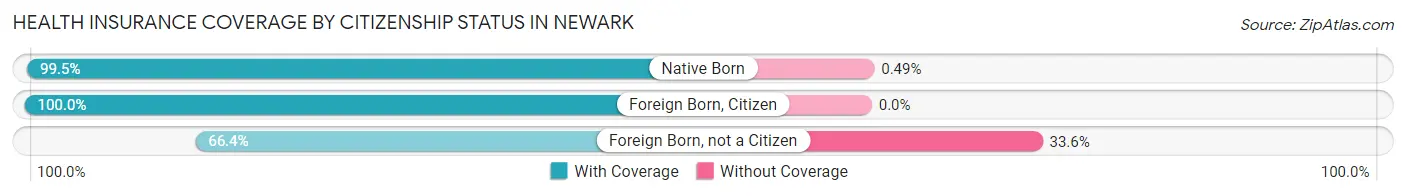
| Citizenship Status | With Coverage | Without Coverage |
| Native Born | 604 (99.5%) | 3 (0.5%) |
| Foreign Born, Citizen | 1,461 (100.0%) | 0 (0.0%) |
| Foreign Born, not a Citizen | 489 (66.4%) | 247 (33.6%) |
Health Insurance Coverage by Household Income in Newark
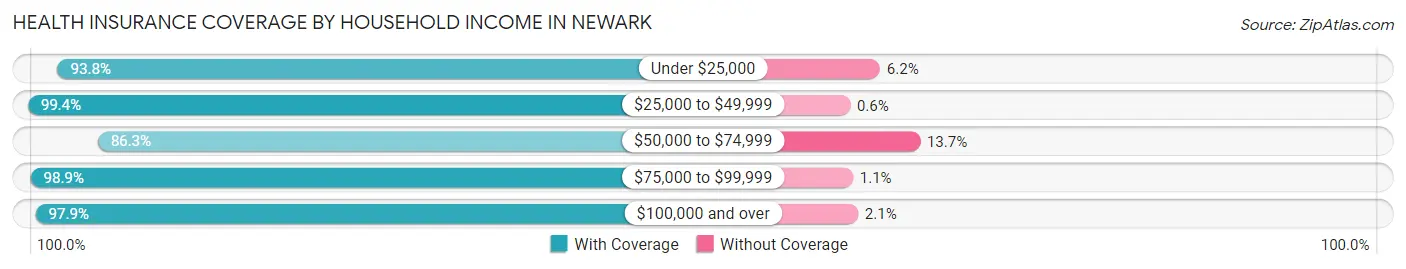
| Household Income | With Coverage | Without Coverage |
| Under $25,000 | 1,105 (93.8%) | 73 (6.2%) |
| $25,000 to $49,999 | 1,823 (99.4%) | 11 (0.6%) |
| $50,000 to $74,999 | 2,336 (86.3%) | 371 (13.7%) |
| $75,000 to $99,999 | 1,053 (98.9%) | 12 (1.1%) |
| $100,000 and over | 1,833 (97.9%) | 39 (2.1%) |
Public vs Private Health Insurance Coverage by Age in Newark
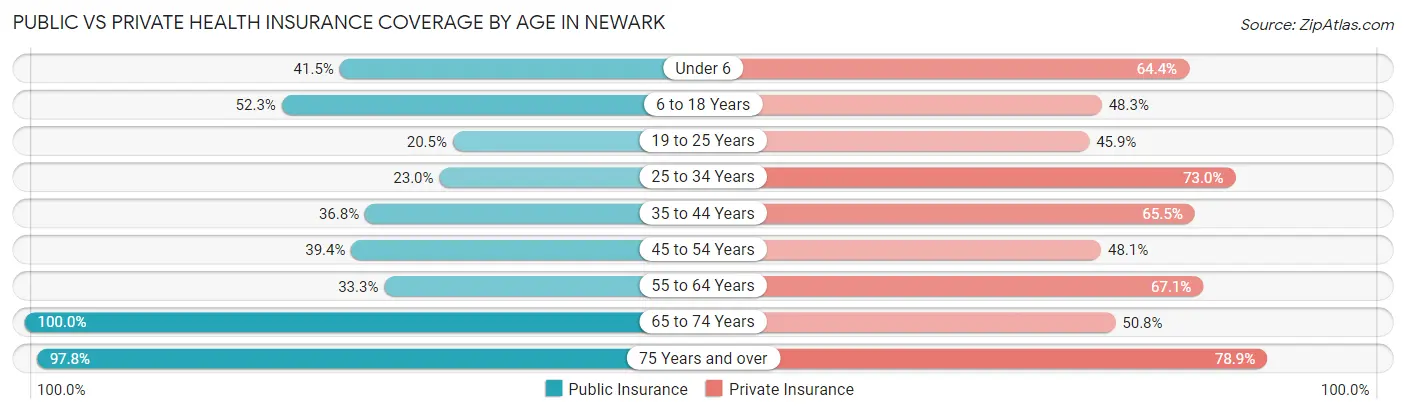
| Age Bracket | Public Insurance | Private Insurance |
| Under 6 | 252 (41.5%) | 391 (64.4%) |
| 6 to 18 Years | 764 (52.3%) | 705 (48.2%) |
| 19 to 25 Years | 151 (20.5%) | 338 (45.9%) |
| 25 to 34 Years | 331 (23.0%) | 1,050 (73.0%) |
| 35 to 44 Years | 271 (36.8%) | 482 (65.5%) |
| 45 to 54 Years | 355 (39.4%) | 434 (48.1%) |
| 55 to 64 Years | 411 (33.3%) | 829 (67.1%) |
| 65 to 74 Years | 1,158 (100.0%) | 588 (50.8%) |
| 75 Years and over | 566 (97.8%) | 457 (78.9%) |
| Total | 4,259 (48.1%) | 5,274 (59.6%) |
Disability Status by Sex by Age in Newark
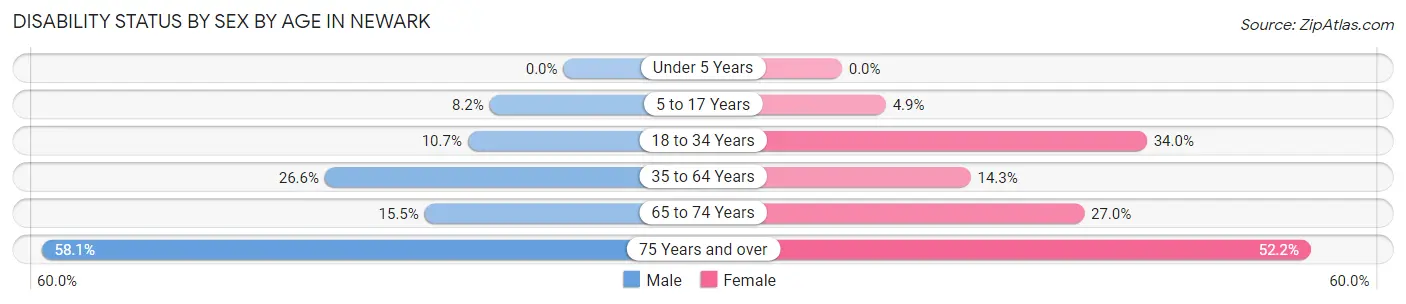
| Age Bracket | Male | Female |
| Under 5 Years | 0 (0.0%) | 0 (0.0%) |
| 5 to 17 Years | 56 (8.2%) | 37 (4.9%) |
| 18 to 34 Years | 144 (10.6%) | 306 (34.0%) |
| 35 to 64 Years | 380 (26.6%) | 207 (14.3%) |
| 65 to 74 Years | 89 (15.4%) | 157 (27.0%) |
| 75 Years and over | 154 (58.1%) | 164 (52.2%) |
Disability Class by Sex by Age in Newark
Disability Class: Hearing Difficulty
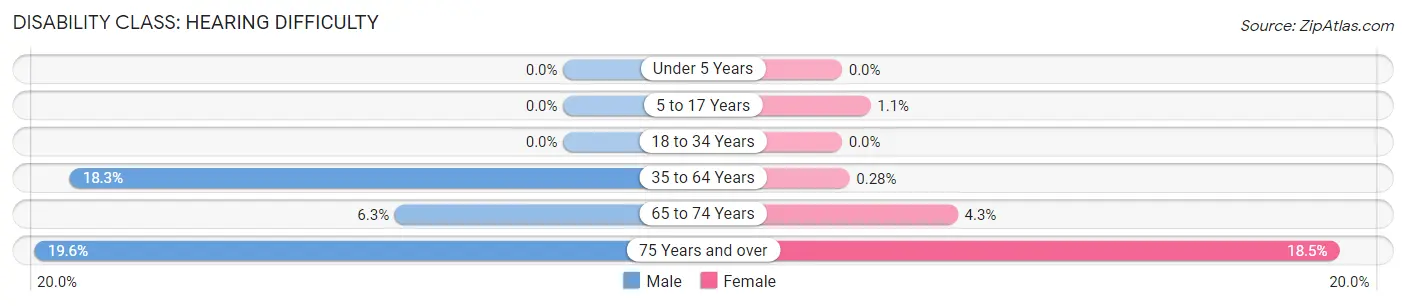
| Age Bracket | Male | Female |
| Under 5 Years | 0 (0.0%) | 0 (0.0%) |
| 5 to 17 Years | 0 (0.0%) | 8 (1.1%) |
| 18 to 34 Years | 0 (0.0%) | 0 (0.0%) |
| 35 to 64 Years | 262 (18.3%) | 4 (0.3%) |
| 65 to 74 Years | 36 (6.2%) | 25 (4.3%) |
| 75 Years and over | 52 (19.6%) | 58 (18.5%) |
Disability Class: Vision Difficulty
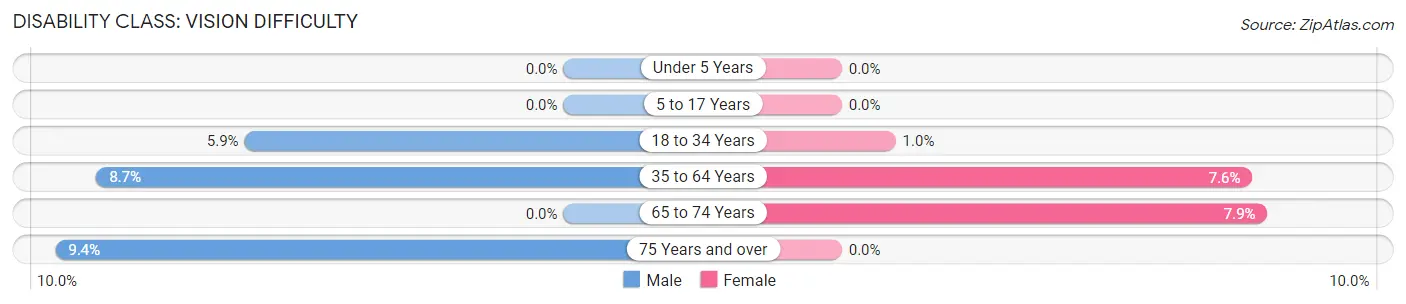
| Age Bracket | Male | Female |
| Under 5 Years | 0 (0.0%) | 0 (0.0%) |
| 5 to 17 Years | 0 (0.0%) | 0 (0.0%) |
| 18 to 34 Years | 80 (5.9%) | 9 (1.0%) |
| 35 to 64 Years | 124 (8.7%) | 110 (7.6%) |
| 65 to 74 Years | 0 (0.0%) | 46 (7.9%) |
| 75 Years and over | 25 (9.4%) | 0 (0.0%) |
Disability Class: Cognitive Difficulty
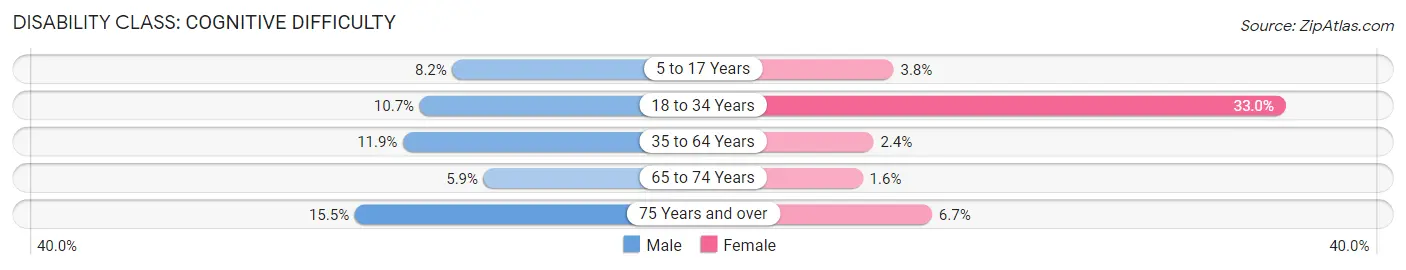
| Age Bracket | Male | Female |
| 5 to 17 Years | 56 (8.2%) | 29 (3.8%) |
| 18 to 34 Years | 144 (10.6%) | 297 (33.0%) |
| 35 to 64 Years | 170 (11.9%) | 34 (2.4%) |
| 65 to 74 Years | 34 (5.9%) | 9 (1.5%) |
| 75 Years and over | 41 (15.5%) | 21 (6.7%) |
Disability Class: Ambulatory Difficulty
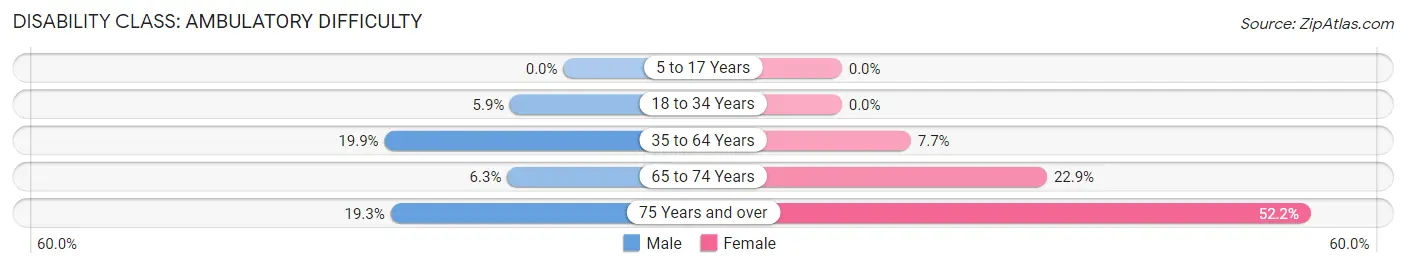
| Age Bracket | Male | Female |
| 5 to 17 Years | 0 (0.0%) | 0 (0.0%) |
| 18 to 34 Years | 80 (5.9%) | 0 (0.0%) |
| 35 to 64 Years | 285 (19.9%) | 111 (7.7%) |
| 65 to 74 Years | 36 (6.2%) | 133 (22.9%) |
| 75 Years and over | 51 (19.3%) | 164 (52.2%) |
Disability Class: Self-Care Difficulty
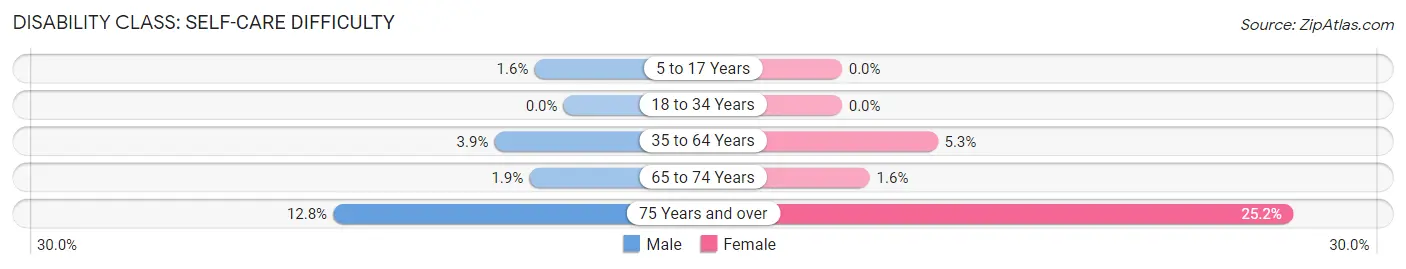
| Age Bracket | Male | Female |
| 5 to 17 Years | 11 (1.6%) | 0 (0.0%) |
| 18 to 34 Years | 0 (0.0%) | 0 (0.0%) |
| 35 to 64 Years | 55 (3.8%) | 77 (5.3%) |
| 65 to 74 Years | 11 (1.9%) | 9 (1.5%) |
| 75 Years and over | 34 (12.8%) | 79 (25.2%) |
Technology Access in Newark
Computing Device Access in Newark
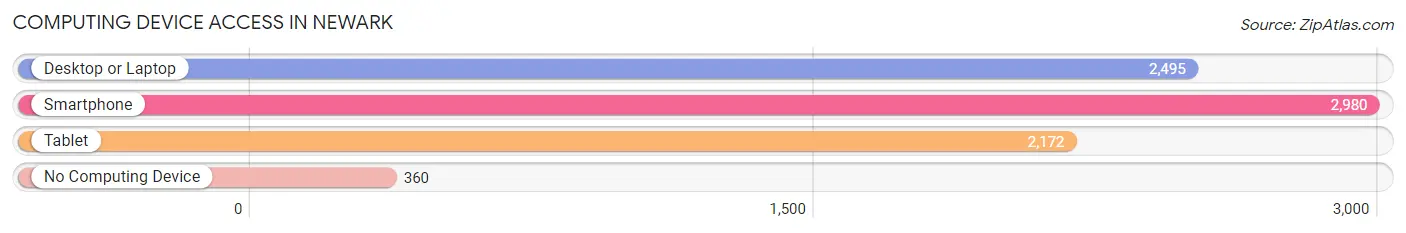
| Device Type | # Households | % Households |
| Desktop or Laptop | 2,495 | 66.0% |
| Smartphone | 2,980 | 78.8% |
| Tablet | 2,172 | 57.5% |
| No Computing Device | 360 | 9.5% |
| Total | 3,780 | 100.0% |
Internet Access in Newark
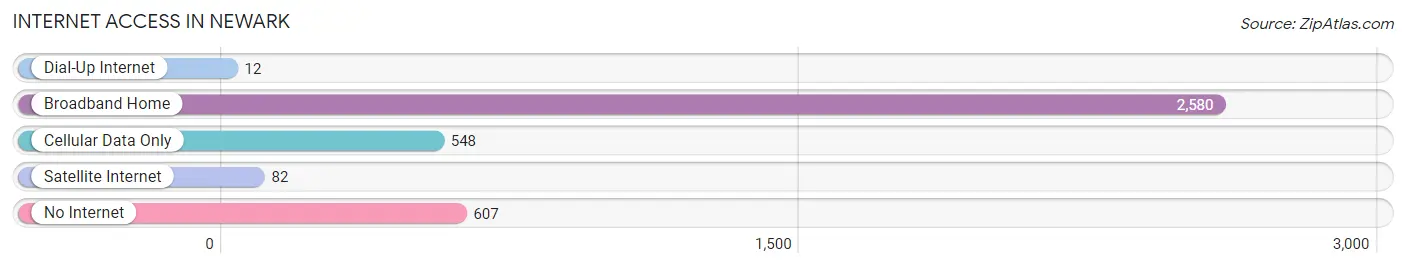
| Internet Type | # Households | % Households |
| Dial-Up Internet | 12 | 0.3% |
| Broadband Home | 2,580 | 68.2% |
| Cellular Data Only | 548 | 14.5% |
| Satellite Internet | 82 | 2.2% |
| No Internet | 607 | 16.1% |
| Total | 3,780 | 100.0% |
Newark Summary
Newark is a village located in Wayne County, New York, United States. The population was 9,145 at the 2010 census. It is the county seat of Wayne County. The village is named after Newark-on-Trent, England.
Geography
Newark is located at the intersection of Routes 31 and 88 in the center of Wayne County. It is located in the Finger Lakes region of New York. The village is situated on the banks of the Clyde River, which flows through the village. The village is surrounded by the towns of Arcadia, Lyons, and Palmyra.
The total area of the village is 2.2 square miles, all of which is land. The village is located at an elevation of 602 feet above sea level.
History
The area that is now Newark was first settled in 1789 by a group of Quakers from Pennsylvania. The village was incorporated in 1853.
The village was an important stop on the Underground Railroad, and was home to several prominent abolitionists.
In the late 19th century, Newark was a major center of industry, with several factories producing furniture, clothing, and other goods.
Economy
The economy of Newark is largely based on agriculture and manufacturing. The village is home to several large farms, as well as several small businesses.
The village is also home to several large manufacturing companies, including Newark Manufacturing, which produces furniture, and Newark Textiles, which produces clothing.
Demographics
As of the 2010 census, there were 9,145 people, 3,717 households, and 2,323 families residing in the village. The population density was 4,093.3 people per square mile. The racial makeup of the village was 94.2% White, 2.2% African American, 0.3% Native American, 0.7% Asian, 0.1% Pacific Islander, 0.7% from other races, and 1.9% from two or more races. Hispanic or Latino of any race were 3.2% of the population.
There were 3,717 households, out of which 30.2% had children under the age of 18 living with them, 44.2% were married couples living together, 14.2% had a female householder with no husband present, and 36.2% were non-families. 30.7% of all households were made up of individuals, and 13.2% had someone living alone who was 65 years of age or older. The average household size was 2.44 and the average family size was 3.03.
The median age in the village was 38.3 years. 24.2% of residents were under the age of 18; 8.2% were between the ages of 18 and 24; 24.7% were from 25 to 44; 26.3% were from 45 to 64; and 16.6% were 65 years of age or older. The gender makeup of the village was 48.2% male and 51.8% female.
Conclusion
Newark is a village located in Wayne County, New York. It is the county seat of Wayne County and is situated on the banks of the Clyde River. The village has a long history, dating back to its settlement in 1789. The economy of Newark is largely based on agriculture and manufacturing, and the village is home to several large farms and manufacturing companies. As of the 2010 census, the population of Newark was 9,145, with a median age of 38.3 years.
Common Questions
What is Per Capita Income in Newark?
Per Capita income in Newark is $28,132.
What is the Median Family Income in Newark?
Median Family Income in Newark is $64,824.
What is the Median Household income in Newark?
Median Household Income in Newark is $56,142.
What is Income or Wage Gap in Newark?
Income or Wage Gap in Newark is 4.4%.
Women in Newark earn 95.6 cents for every dollar earned by a man.
What is Family Income Deficit in Newark?
Family Income Deficit in Newark is $12,442.
Families that are below poverty line in Newark earn $12,442 less on average than the poverty threshold level.
What is Inequality or Gini Index in Newark?
Inequality or Gini Index in Newark is 0.40.
What is the Total Population of Newark?
Total Population of Newark is 9,076.
What is the Total Male Population of Newark?
Total Male Population of Newark is 4,627.
What is the Total Female Population of Newark?
Total Female Population of Newark is 4,449.
What is the Ratio of Males per 100 Females in Newark?
There are 104.00 Males per 100 Females in Newark.
What is the Ratio of Females per 100 Males in Newark?
There are 96.15 Females per 100 Males in Newark.
What is the Median Population Age in Newark?
Median Population Age in Newark is 39.0 Years.
What is the Average Family Size in Newark
Average Family Size in Newark is 3.1 People.
What is the Average Household Size in Newark
Average Household Size in Newark is 2.3 People.
How Large is the Labor Force in Newark?
There are 4,171 People in the Labor Forcein in Newark.
What is the Percentage of People in the Labor Force in Newark?
57.5% of People are in the Labor Force in Newark.
What is the Unemployment Rate in Newark?
Unemployment Rate in Newark is 3.0%.