Clifton Springs, NY Map & Demographics
Clifton Springs Map
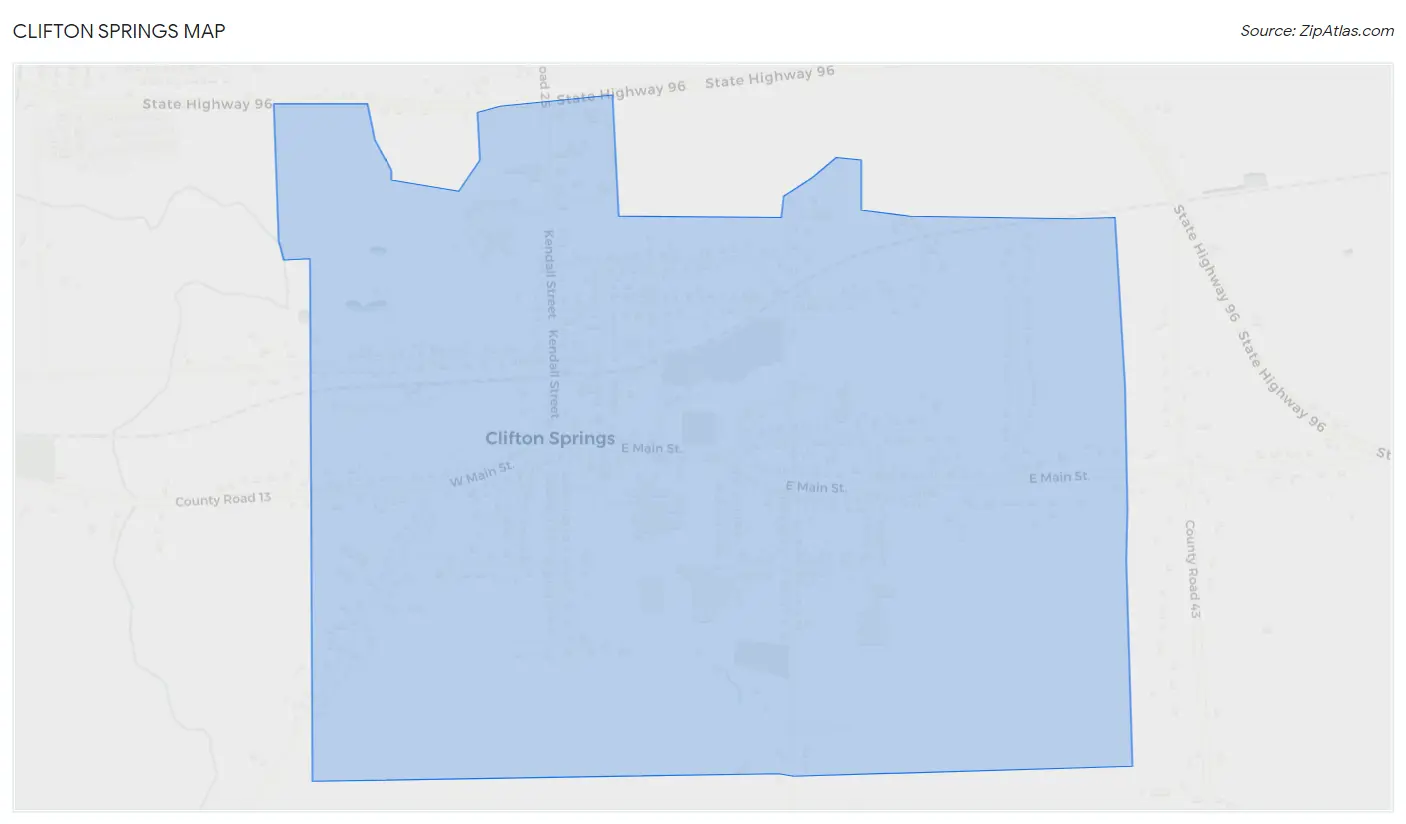
Clifton Springs Overview
$35,223
PER CAPITA INCOME
$94,722
AVG FAMILY INCOME
$67,500
AVG HOUSEHOLD INCOME
36.7%
WAGE / INCOME GAP [ % ]
63.3¢/ $1
WAGE / INCOME GAP [ $ ]
0.48
INEQUALITY / GINI INDEX
2,042
TOTAL POPULATION
897
MALE POPULATION
1,145
FEMALE POPULATION
78.34
MALES / 100 FEMALES
127.65
FEMALES / 100 MALES
45.3
MEDIAN AGE
3.2
AVG FAMILY SIZE
2.3
AVG HOUSEHOLD SIZE
847
LABOR FORCE [ PEOPLE ]
53.3%
PERCENT IN LABOR FORCE
4.8%
UNEMPLOYMENT RATE
Clifton Springs Zip Codes
Clifton Springs Area Codes
Income in Clifton Springs
Income Overview in Clifton Springs
Per Capita Income in Clifton Springs is $35,223, while median incomes of families and households are $94,722 and $67,500 respectively.
| Characteristic | Number | Measure |
| Per Capita Income | 2,042 | $35,223 |
| Median Family Income | 452 | $94,722 |
| Mean Family Income | 452 | $108,208 |
| Median Household Income | 788 | $67,500 |
| Mean Household Income | 788 | $86,884 |
| Income Deficit | 452 | $0 |
| Wage / Income Gap (%) | 2,042 | 36.71% |
| Wage / Income Gap ($) | 2,042 | 63.29¢ per $1 |
| Gini / Inequality Index | 2,042 | 0.48 |
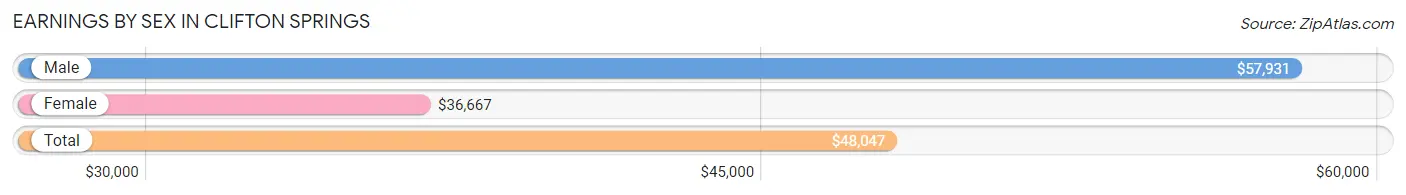
Earnings by Sex in Clifton Springs
Average Earnings in Clifton Springs are $48,047, $57,931 for men and $36,667 for women, a difference of 36.7%.
| Sex | Number | Average Earnings |
| Male | 434 (49.8%) | $57,931 |
| Female | 438 (50.2%) | $36,667 |
| Total | 872 (100.0%) | $48,047 |
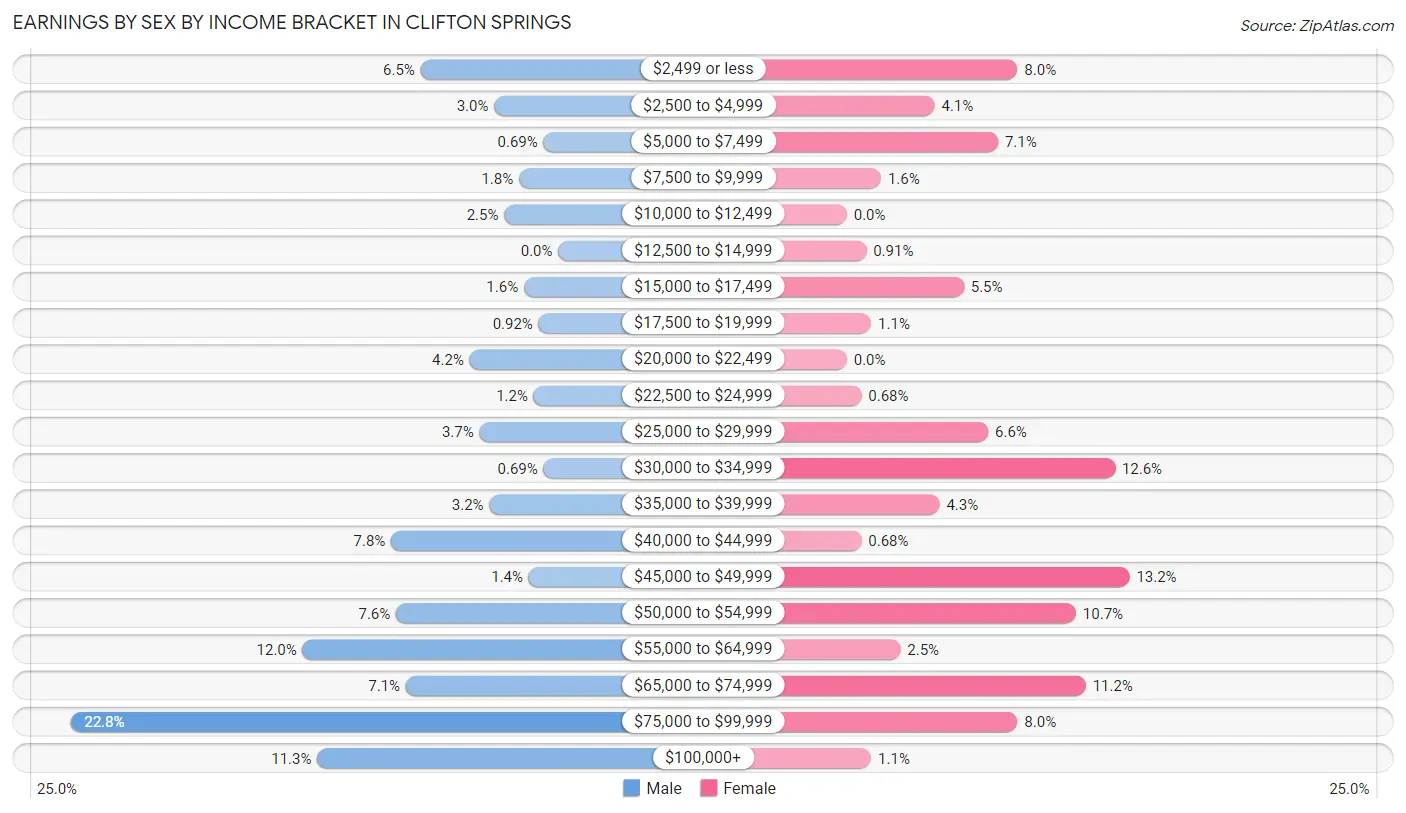
Earnings by Sex by Income Bracket in Clifton Springs
The most common earnings brackets in Clifton Springs are $75,000 to $99,999 for men (99 | 22.8%) and $45,000 to $49,999 for women (58 | 13.2%).
| Income | Male | Female |
| $2,499 or less | 28 (6.5%) | 35 (8.0%) |
| $2,500 to $4,999 | 13 (3.0%) | 18 (4.1%) |
| $5,000 to $7,499 | 3 (0.7%) | 31 (7.1%) |
| $7,500 to $9,999 | 8 (1.8%) | 7 (1.6%) |
| $10,000 to $12,499 | 11 (2.5%) | 0 (0.0%) |
| $12,500 to $14,999 | 0 (0.0%) | 4 (0.9%) |
| $15,000 to $17,499 | 7 (1.6%) | 24 (5.5%) |
| $17,500 to $19,999 | 4 (0.9%) | 5 (1.1%) |
| $20,000 to $22,499 | 18 (4.2%) | 0 (0.0%) |
| $22,500 to $24,999 | 5 (1.1%) | 3 (0.7%) |
| $25,000 to $29,999 | 16 (3.7%) | 29 (6.6%) |
| $30,000 to $34,999 | 3 (0.7%) | 55 (12.6%) |
| $35,000 to $39,999 | 14 (3.2%) | 19 (4.3%) |
| $40,000 to $44,999 | 34 (7.8%) | 3 (0.7%) |
| $45,000 to $49,999 | 6 (1.4%) | 58 (13.2%) |
| $50,000 to $54,999 | 33 (7.6%) | 47 (10.7%) |
| $55,000 to $64,999 | 52 (12.0%) | 11 (2.5%) |
| $65,000 to $74,999 | 31 (7.1%) | 49 (11.2%) |
| $75,000 to $99,999 | 99 (22.8%) | 35 (8.0%) |
| $100,000+ | 49 (11.3%) | 5 (1.1%) |
| Total | 434 (100.0%) | 438 (100.0%) |
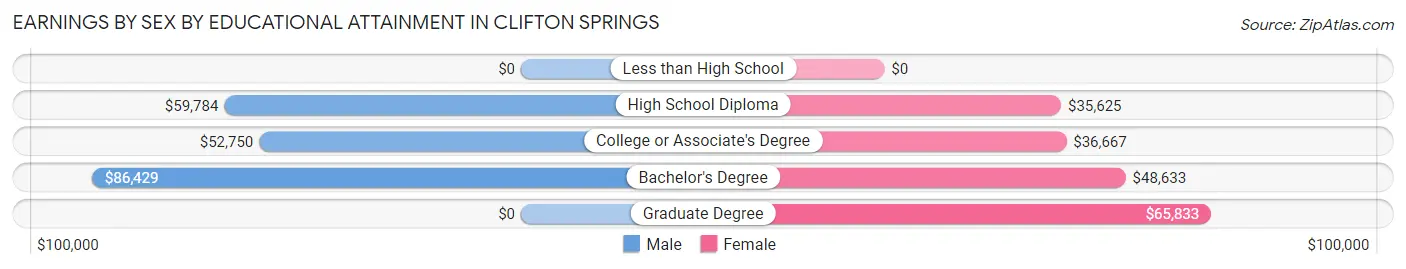
Earnings by Sex by Educational Attainment in Clifton Springs
Average earnings in Clifton Springs are $62,589 for men and $47,019 for women, a difference of 24.9%. Men with an educational attainment of bachelor's degree enjoy the highest average annual earnings of $86,429, while those with college or associate's degree education earn the least with $52,750. Women with an educational attainment of graduate degree earn the most with the average annual earnings of $65,833, while those with high school diploma education have the smallest earnings of $35,625.
| Educational Attainment | Male Income | Female Income |
| Less than High School | - | - |
| High School Diploma | $59,784 | $35,625 |
| College or Associate's Degree | $52,750 | $36,667 |
| Bachelor's Degree | $86,429 | $48,633 |
| Graduate Degree | - | - |
| Total | $62,589 | $47,019 |
Family Income in Clifton Springs
Family Income Brackets in Clifton Springs
According to the Clifton Springs family income data, there are 149 families falling into the $100,000 to $149,999 income range, which is the most common income bracket and makes up 33.0% of all families.
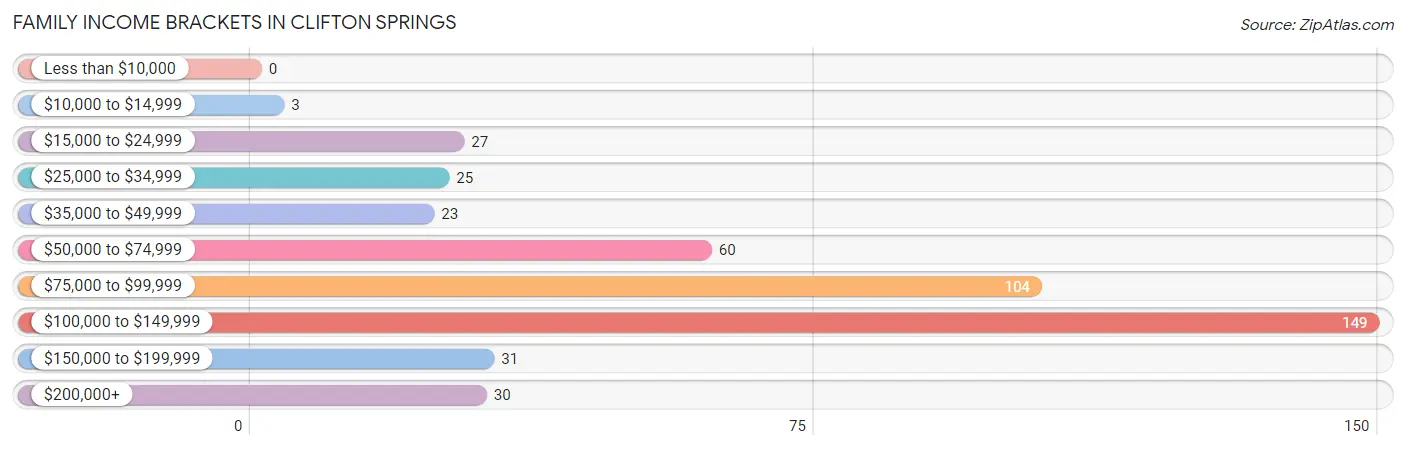
| Income Bracket | # Families | % Families |
| Less than $10,000 | 0 | 0.0% |
| $10,000 to $14,999 | 3 | 0.7% |
| $15,000 to $24,999 | 27 | 6.0% |
| $25,000 to $34,999 | 25 | 5.5% |
| $35,000 to $49,999 | 23 | 5.1% |
| $50,000 to $74,999 | 60 | 13.3% |
| $75,000 to $99,999 | 104 | 23.0% |
| $100,000 to $149,999 | 149 | 33.0% |
| $150,000 to $199,999 | 31 | 6.9% |
| $200,000+ | 30 | 6.6% |
Family Income by Famaliy Size in Clifton Springs
4-person families (50 | 11.1%) account for the highest median family income in Clifton Springs with $147,000 per family, while 2-person families (221 | 48.9%) have the highest median income of $43,906 per family member.
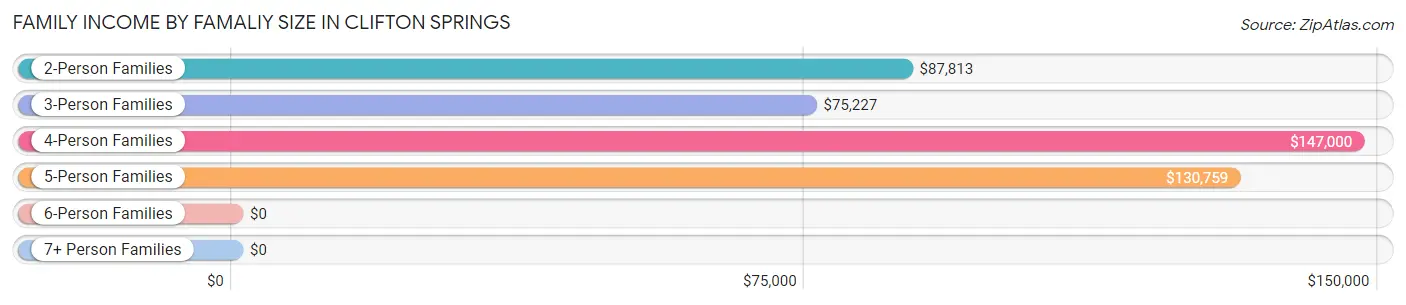
| Income Bracket | # Families | Median Income |
| 2-Person Families | 221 (48.9%) | $87,813 |
| 3-Person Families | 66 (14.6%) | $75,227 |
| 4-Person Families | 50 (11.1%) | $147,000 |
| 5-Person Families | 85 (18.8%) | $130,759 |
| 6-Person Families | 14 (3.1%) | $0 |
| 7+ Person Families | 16 (3.5%) | $0 |
| Total | 452 (100.0%) | $94,722 |
Family Income by Number of Earners in Clifton Springs
The median family income in Clifton Springs is $94,722, with families comprising 3+ earners (77) having the highest median family income of $131,652, while families with no earners (72) have the lowest median family income of $52,500, accounting for 17.0% and 15.9% of families, respectively.
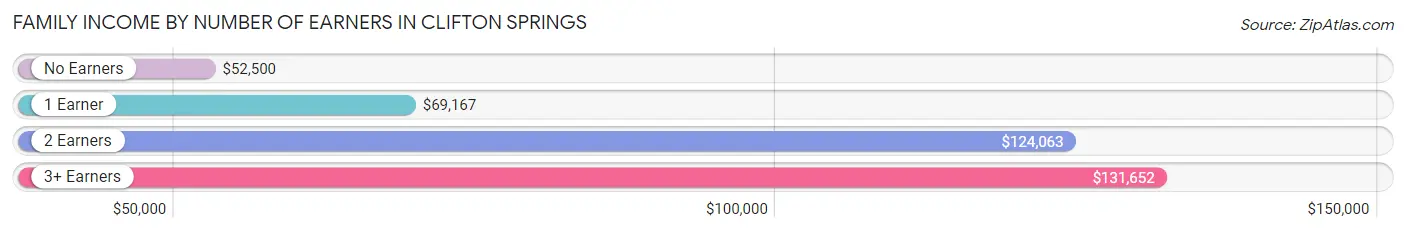
| Number of Earners | # Families | Median Income |
| No Earners | 72 (15.9%) | $52,500 |
| 1 Earner | 140 (31.0%) | $69,167 |
| 2 Earners | 163 (36.1%) | $124,063 |
| 3+ Earners | 77 (17.0%) | $131,652 |
| Total | 452 (100.0%) | $94,722 |
Household Income in Clifton Springs
Household Income Brackets in Clifton Springs
With 180 households falling in the category, the $100,000 to $149,999 income range is the most frequent in Clifton Springs, accounting for 22.8% of all households. In contrast, only 35 households (4.4%) fall into the $150,000 to $199,999 income bracket, making it the least populous group.
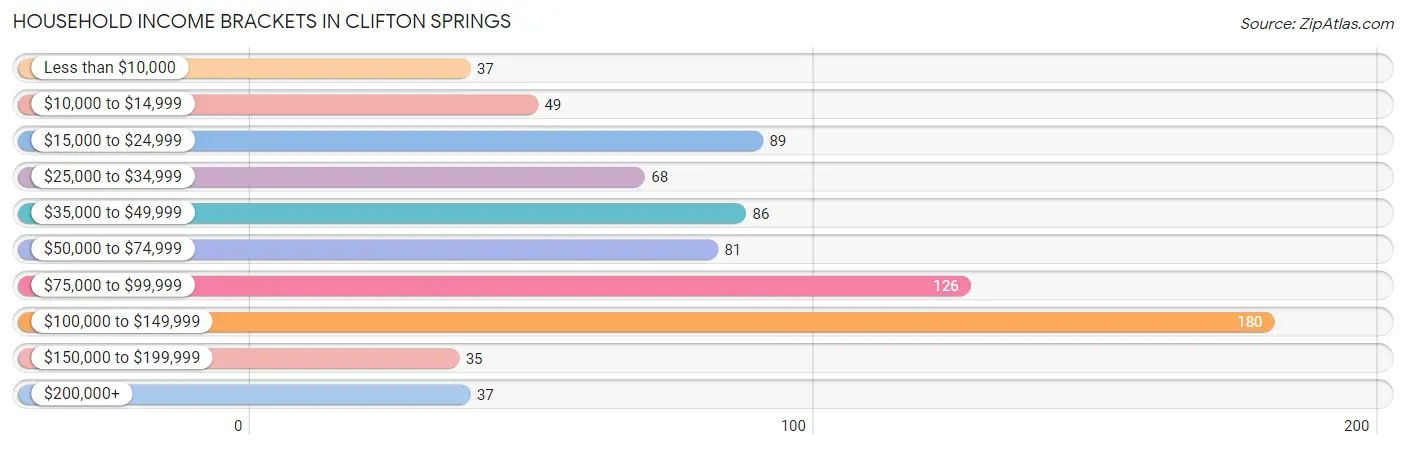
| Income Bracket | # Households | % Households |
| Less than $10,000 | 37 | 4.7% |
| $10,000 to $14,999 | 49 | 6.2% |
| $15,000 to $24,999 | 89 | 11.3% |
| $25,000 to $34,999 | 68 | 8.6% |
| $35,000 to $49,999 | 86 | 10.9% |
| $50,000 to $74,999 | 81 | 10.3% |
| $75,000 to $99,999 | 126 | 16.0% |
| $100,000 to $149,999 | 180 | 22.8% |
| $150,000 to $199,999 | 35 | 4.4% |
| $200,000+ | 37 | 4.7% |
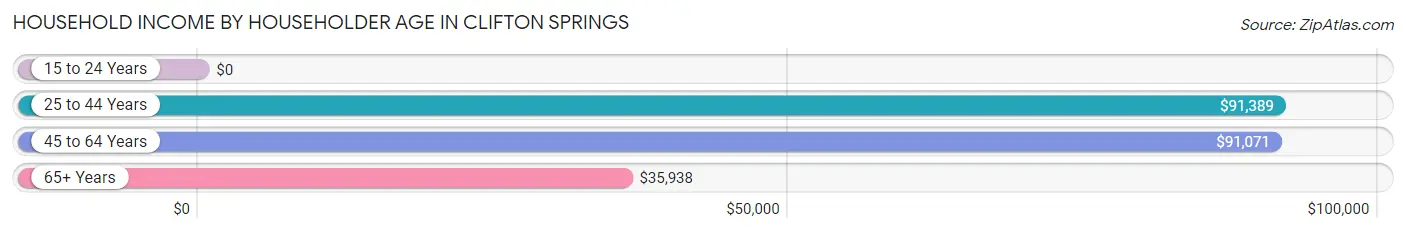
Household Income by Householder Age in Clifton Springs
The median household income in Clifton Springs is $67,500, with the highest median household income of $91,389 found in the 25 to 44 years age bracket for the primary householder. A total of 220 households (27.9%) fall into this category.
| Income Bracket | # Households | Median Income |
| 15 to 24 Years | 0 (0.0%) | $0 |
| 25 to 44 Years | 220 (27.9%) | $91,389 |
| 45 to 64 Years | 284 (36.0%) | $91,071 |
| 65+ Years | 284 (36.0%) | $35,938 |
| Total | 788 (100.0%) | $67,500 |
Poverty in Clifton Springs
Income Below Poverty by Sex and Age in Clifton Springs
With 7.4% poverty level for males and 13.4% for females among the residents of Clifton Springs, under 5 year old males and 55 to 64 year old females are the most vulnerable to poverty, with 6 males (46.2%) and 58 females (33.0%) in their respective age groups living below the poverty level.
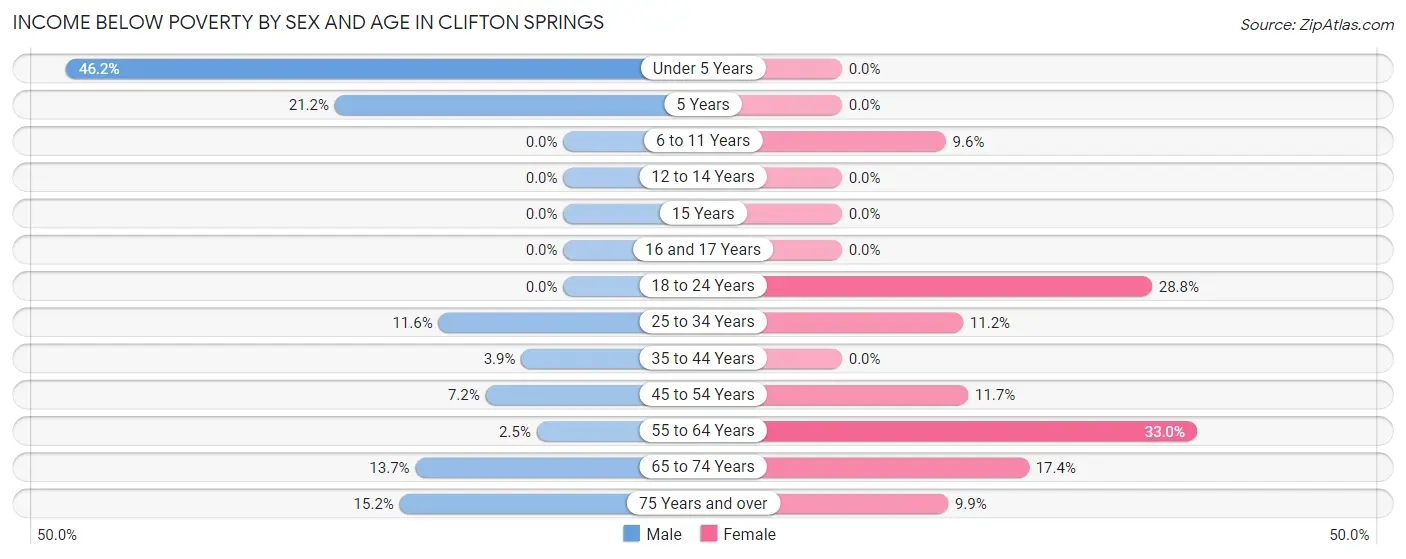
| Age Bracket | Male | Female |
| Under 5 Years | 6 (46.2%) | 0 (0.0%) |
| 5 Years | 7 (21.2%) | 0 (0.0%) |
| 6 to 11 Years | 0 (0.0%) | 8 (9.6%) |
| 12 to 14 Years | 0 (0.0%) | 0 (0.0%) |
| 15 Years | 0 (0.0%) | 0 (0.0%) |
| 16 and 17 Years | 0 (0.0%) | 0 (0.0%) |
| 18 to 24 Years | 0 (0.0%) | 21 (28.8%) |
| 25 to 34 Years | 8 (11.6%) | 10 (11.2%) |
| 35 to 44 Years | 6 (3.9%) | 0 (0.0%) |
| 45 to 54 Years | 7 (7.2%) | 15 (11.7%) |
| 55 to 64 Years | 2 (2.5%) | 58 (33.0%) |
| 65 to 74 Years | 14 (13.7%) | 17 (17.3%) |
| 75 Years and over | 12 (15.2%) | 13 (9.9%) |
| Total | 62 (7.4%) | 142 (13.4%) |
Income Above Poverty by Sex and Age in Clifton Springs
According to the poverty statistics in Clifton Springs, males aged 6 to 11 years and females aged under 5 years are the age groups that are most secure financially, with 100.0% of males and 100.0% of females in these age groups living above the poverty line.
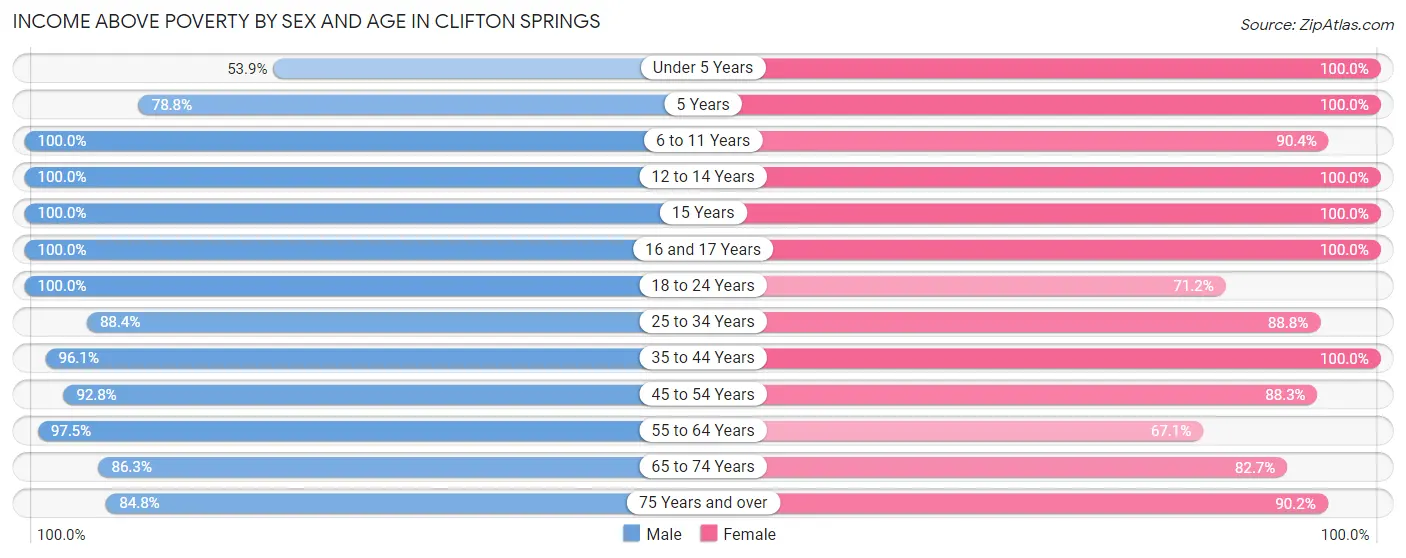
| Age Bracket | Male | Female |
| Under 5 Years | 7 (53.8%) | 39 (100.0%) |
| 5 Years | 26 (78.8%) | 29 (100.0%) |
| 6 to 11 Years | 69 (100.0%) | 75 (90.4%) |
| 12 to 14 Years | 44 (100.0%) | 61 (100.0%) |
| 15 Years | 34 (100.0%) | 48 (100.0%) |
| 16 and 17 Years | 26 (100.0%) | 14 (100.0%) |
| 18 to 24 Years | 37 (100.0%) | 52 (71.2%) |
| 25 to 34 Years | 61 (88.4%) | 79 (88.8%) |
| 35 to 44 Years | 148 (96.1%) | 90 (100.0%) |
| 45 to 54 Years | 90 (92.8%) | 113 (88.3%) |
| 55 to 64 Years | 79 (97.5%) | 118 (67.0%) |
| 65 to 74 Years | 88 (86.3%) | 81 (82.7%) |
| 75 Years and over | 67 (84.8%) | 119 (90.1%) |
| Total | 776 (92.6%) | 918 (86.6%) |
Income Below Poverty Among Married-Couple Families in Clifton Springs
The poverty statistics for married-couple families in Clifton Springs show that 0.8% or 3 of the total 370 families live below the poverty line. Families with no children have the highest poverty rate of 1.4%, comprising of 3 families. On the other hand, families with 1 or 2 children have the lowest poverty rate of 0.0%, which includes 0 families.
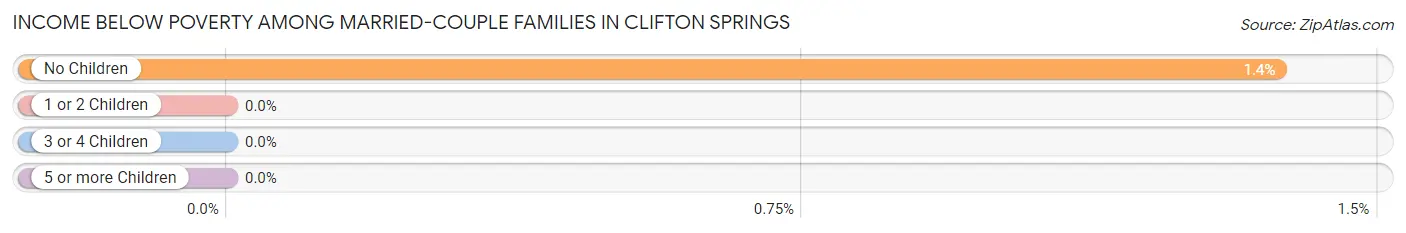
| Children | Above Poverty | Below Poverty |
| No Children | 216 (98.6%) | 3 (1.4%) |
| 1 or 2 Children | 38 (100.0%) | 0 (0.0%) |
| 3 or 4 Children | 113 (100.0%) | 0 (0.0%) |
| 5 or more Children | 0 (0.0%) | 0 (0.0%) |
| Total | 367 (99.2%) | 3 (0.8%) |
Income Below Poverty Among Single-Parent Households in Clifton Springs
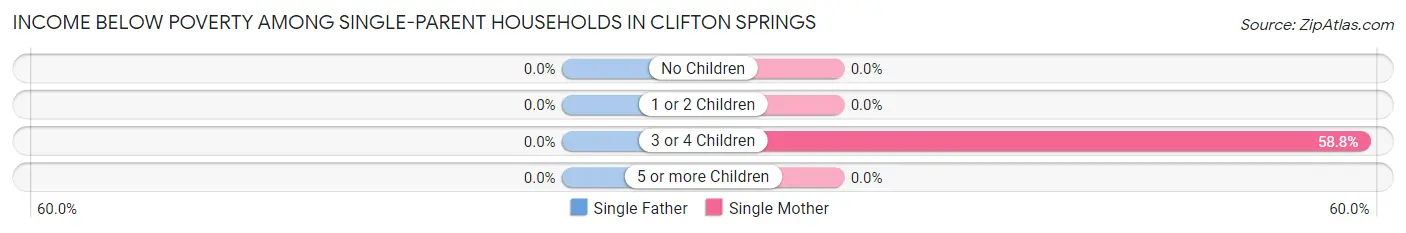
| Children | Single Father | Single Mother |
| No Children | 0 (0.0%) | 0 (0.0%) |
| 1 or 2 Children | 0 (0.0%) | 0 (0.0%) |
| 3 or 4 Children | 0 (0.0%) | 10 (58.8%) |
| 5 or more Children | 0 (0.0%) | 0 (0.0%) |
| Total | 0 (0.0%) | 10 (14.1%) |
Income Below Poverty Among Married-Couple vs Single-Parent Households in Clifton Springs
The poverty data for Clifton Springs shows that 3 of the married-couple family households (0.8%) and 10 of the single-parent households (12.2%) are living below the poverty level. Within the married-couple family households, those with no children have the highest poverty rate, with 3 households (1.4%) falling below the poverty line. Among the single-parent households, those with 3 or 4 children have the highest poverty rate, with 10 household (58.8%) living below poverty.
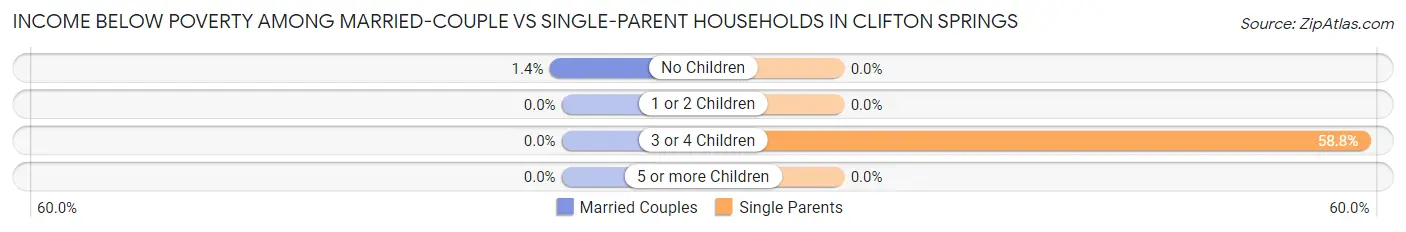
| Children | Married-Couple Families | Single-Parent Households |
| No Children | 3 (1.4%) | 0 (0.0%) |
| 1 or 2 Children | 0 (0.0%) | 0 (0.0%) |
| 3 or 4 Children | 0 (0.0%) | 10 (58.8%) |
| 5 or more Children | 0 (0.0%) | 0 (0.0%) |
| Total | 3 (0.8%) | 10 (12.2%) |
Race in Clifton Springs
The most populous races in Clifton Springs are White / Caucasian (1,953 | 95.6%), Hispanic or Latino (172 | 8.4%), and Two or more Races (29 | 1.4%).
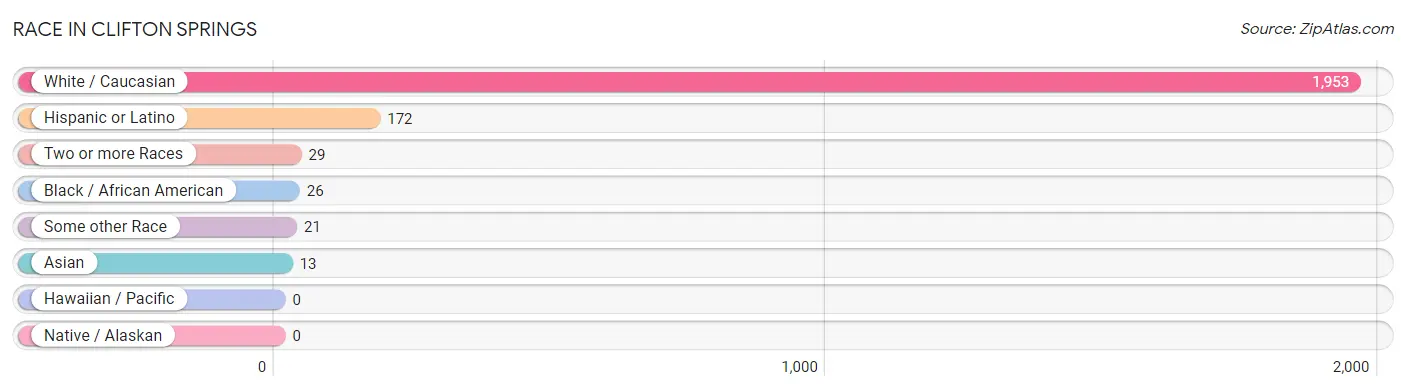
| Race | # Population | % Population |
| Asian | 13 | 0.6% |
| Black / African American | 26 | 1.3% |
| Hawaiian / Pacific | 0 | 0.0% |
| Hispanic or Latino | 172 | 8.4% |
| Native / Alaskan | 0 | 0.0% |
| White / Caucasian | 1,953 | 95.6% |
| Two or more Races | 29 | 1.4% |
| Some other Race | 21 | 1.0% |
| Total | 2,042 | 100.0% |
Ancestry in Clifton Springs
The most populous ancestries reported in Clifton Springs are Italian (382 | 18.7%), German (321 | 15.7%), English (299 | 14.6%), Irish (257 | 12.6%), and Dutch (164 | 8.0%), together accounting for 69.7% of all Clifton Springs residents.
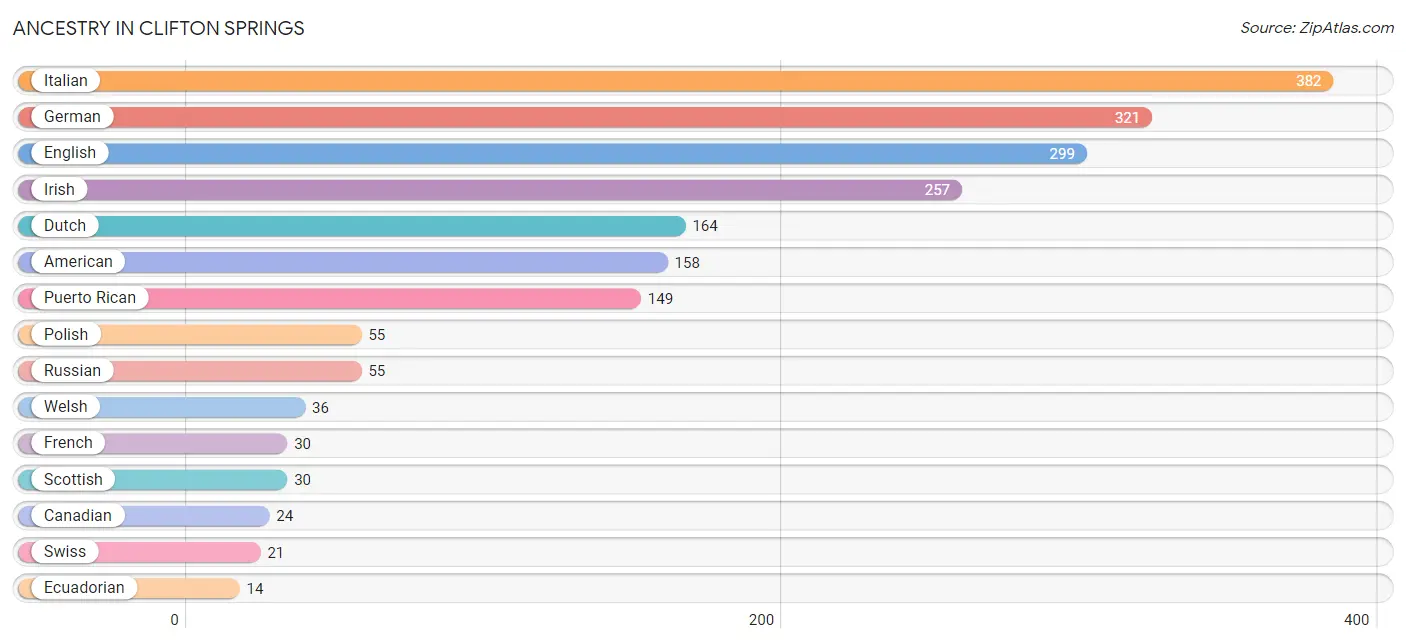
| Ancestry | # Population | % Population |
| American | 158 | 7.7% |
| Arab | 6 | 0.3% |
| Belgian | 9 | 0.4% |
| Blackfeet | 10 | 0.5% |
| British | 4 | 0.2% |
| Canadian | 24 | 1.2% |
| Choctaw | 6 | 0.3% |
| Danish | 3 | 0.2% |
| Dutch | 164 | 8.0% |
| Eastern European | 4 | 0.2% |
| Ecuadorian | 14 | 0.7% |
| English | 299 | 14.6% |
| European | 8 | 0.4% |
| French | 30 | 1.5% |
| French American Indian | 3 | 0.2% |
| French Canadian | 3 | 0.2% |
| German | 321 | 15.7% |
| Greek | 4 | 0.2% |
| Guyanese | 5 | 0.2% |
| Haitian | 5 | 0.2% |
| Indian (Asian) | 5 | 0.2% |
| Irish | 257 | 12.6% |
| Italian | 382 | 18.7% |
| Korean | 13 | 0.6% |
| Mexican | 9 | 0.4% |
| Nigerian | 6 | 0.3% |
| Norwegian | 12 | 0.6% |
| Polish | 55 | 2.7% |
| Puerto Rican | 149 | 7.3% |
| Russian | 55 | 2.7% |
| Scottish | 30 | 1.5% |
| South American | 14 | 0.7% |
| Subsaharan African | 6 | 0.3% |
| Swedish | 3 | 0.2% |
| Swiss | 21 | 1.0% |
| Thai | 5 | 0.2% |
| Ukrainian | 14 | 0.7% |
| Welsh | 36 | 1.8% | View All 38 Rows |
Immigrants in Clifton Springs
The most numerous immigrant groups reported in Clifton Springs came from Latin America (10 | 0.5%), Asia (8 | 0.4%), Caribbean (5 | 0.2%), China (5 | 0.2%), and Eastern Asia (5 | 0.2%), together accounting for 1.6% of all Clifton Springs residents.
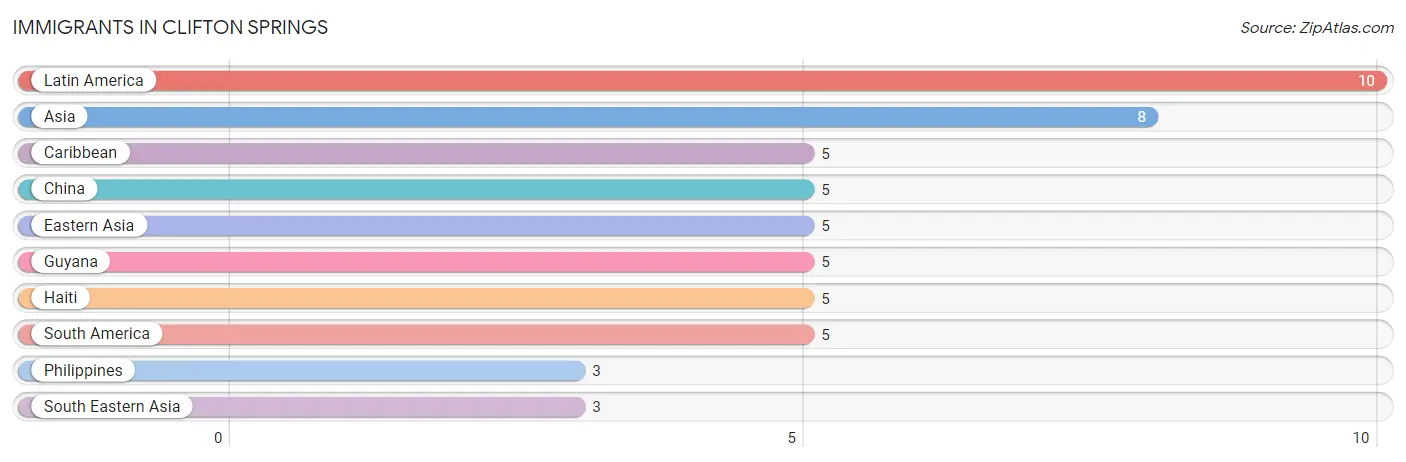
| Immigration Origin | # Population | % Population |
| Asia | 8 | 0.4% |
| Caribbean | 5 | 0.2% |
| China | 5 | 0.2% |
| Eastern Asia | 5 | 0.2% |
| Guyana | 5 | 0.2% |
| Haiti | 5 | 0.2% |
| Latin America | 10 | 0.5% |
| Philippines | 3 | 0.2% |
| South America | 5 | 0.2% |
| South Eastern Asia | 3 | 0.2% | View All 10 Rows |
Sex and Age in Clifton Springs
Sex and Age in Clifton Springs
The most populous age groups in Clifton Springs are 40 to 44 Years (88 | 9.8%) for men and 85 Years and over (117 | 10.2%) for women.
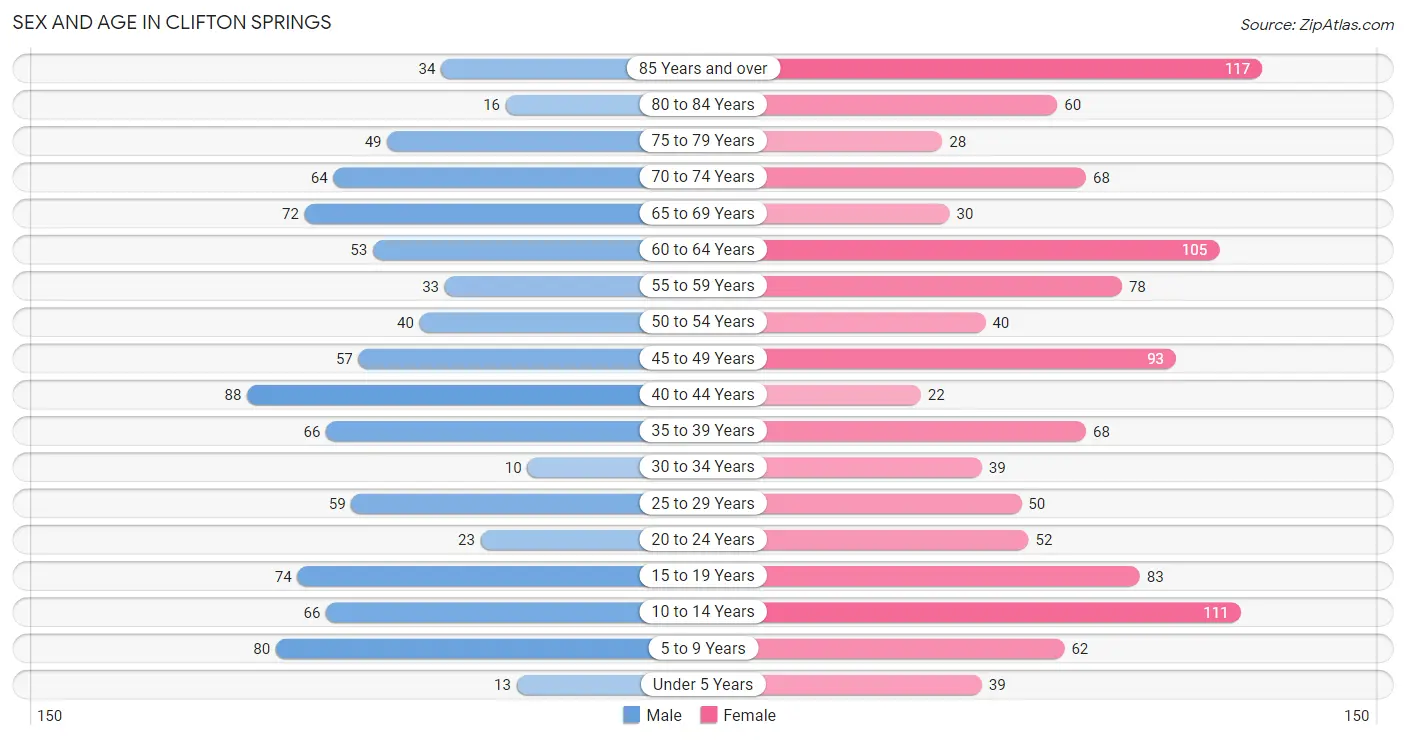
| Age Bracket | Male | Female |
| Under 5 Years | 13 (1.5%) | 39 (3.4%) |
| 5 to 9 Years | 80 (8.9%) | 62 (5.4%) |
| 10 to 14 Years | 66 (7.4%) | 111 (9.7%) |
| 15 to 19 Years | 74 (8.3%) | 83 (7.2%) |
| 20 to 24 Years | 23 (2.6%) | 52 (4.5%) |
| 25 to 29 Years | 59 (6.6%) | 50 (4.4%) |
| 30 to 34 Years | 10 (1.1%) | 39 (3.4%) |
| 35 to 39 Years | 66 (7.4%) | 68 (5.9%) |
| 40 to 44 Years | 88 (9.8%) | 22 (1.9%) |
| 45 to 49 Years | 57 (6.4%) | 93 (8.1%) |
| 50 to 54 Years | 40 (4.5%) | 40 (3.5%) |
| 55 to 59 Years | 33 (3.7%) | 78 (6.8%) |
| 60 to 64 Years | 53 (5.9%) | 105 (9.2%) |
| 65 to 69 Years | 72 (8.0%) | 30 (2.6%) |
| 70 to 74 Years | 64 (7.1%) | 68 (5.9%) |
| 75 to 79 Years | 49 (5.5%) | 28 (2.5%) |
| 80 to 84 Years | 16 (1.8%) | 60 (5.2%) |
| 85 Years and over | 34 (3.8%) | 117 (10.2%) |
| Total | 897 (100.0%) | 1,145 (100.0%) |
Families and Households in Clifton Springs
Median Family Size in Clifton Springs
The median family size in Clifton Springs is 3.16 persons per family, with married-couple families (370 | 81.9%) accounting for the largest median family size of 3.25 persons per family. On the other hand, single female/mother families (71 | 15.7%) represent the smallest median family size with 2.72 persons per family.
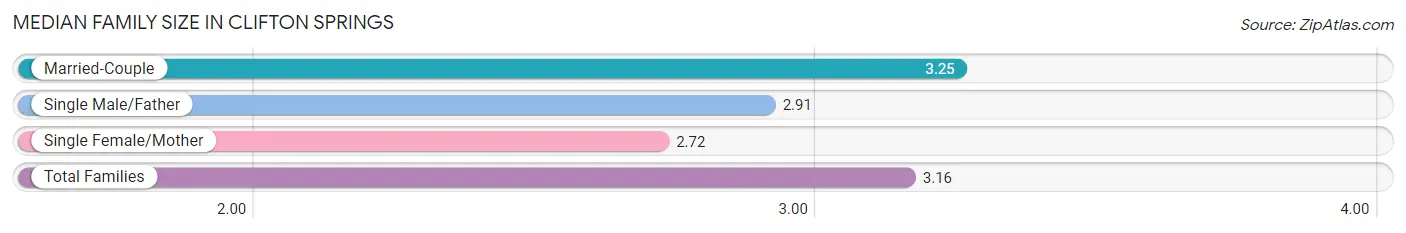
| Family Type | # Families | Family Size |
| Married-Couple | 370 (81.9%) | 3.25 |
| Single Male/Father | 11 (2.4%) | 2.91 |
| Single Female/Mother | 71 (15.7%) | 2.72 |
| Total Families | 452 (100.0%) | 3.16 |
Median Household Size in Clifton Springs
The median household size in Clifton Springs is 2.32 persons per household, with married-couple households (370 | 46.9%) accounting for the largest median household size of 3.25 persons per household. non-family households (336 | 42.6%) represent the smallest median household size with 1.17 persons per household.
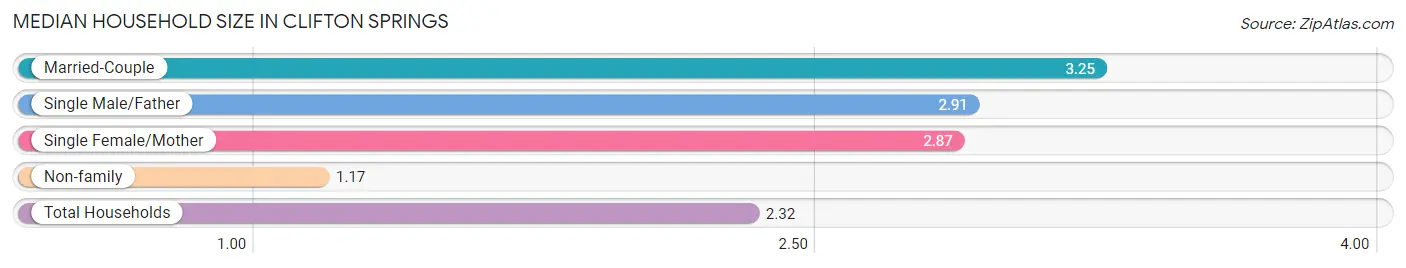
| Household Type | # Households | Household Size |
| Married-Couple | 370 (46.9%) | 3.25 |
| Single Male/Father | 11 (1.4%) | 2.91 |
| Single Female/Mother | 71 (9.0%) | 2.87 |
| Non-family | 336 (42.6%) | 1.17 |
| Total Households | 788 (100.0%) | 2.32 |
Household Size by Marriage Status in Clifton Springs
Out of a total of 788 households in Clifton Springs, 452 (57.4%) are family households, while 336 (42.6%) are nonfamily households. The most numerous type of family households are 2-person households, comprising 212, and the most common type of nonfamily households are 1-person households, comprising 292.
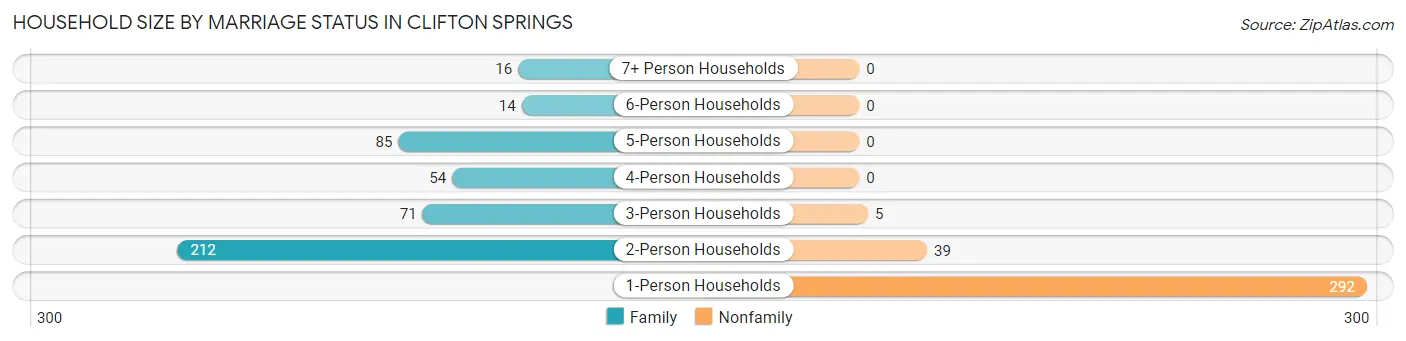
| Household Size | Family Households | Nonfamily Households |
| 1-Person Households | - | 292 (37.1%) |
| 2-Person Households | 212 (26.9%) | 39 (5.0%) |
| 3-Person Households | 71 (9.0%) | 5 (0.6%) |
| 4-Person Households | 54 (6.9%) | 0 (0.0%) |
| 5-Person Households | 85 (10.8%) | 0 (0.0%) |
| 6-Person Households | 14 (1.8%) | 0 (0.0%) |
| 7+ Person Households | 16 (2.0%) | 0 (0.0%) |
| Total | 452 (57.4%) | 336 (42.6%) |
Female Fertility in Clifton Springs
Fertility by Age in Clifton Springs
Average fertility rate in Clifton Springs is 58.0 births per 1,000 women. Women in the age bracket of 20 to 34 years have the highest fertility rate with 113.0 births per 1,000 women. Women in the age bracket of 20 to 34 years acount for 66.7% of all women with births.
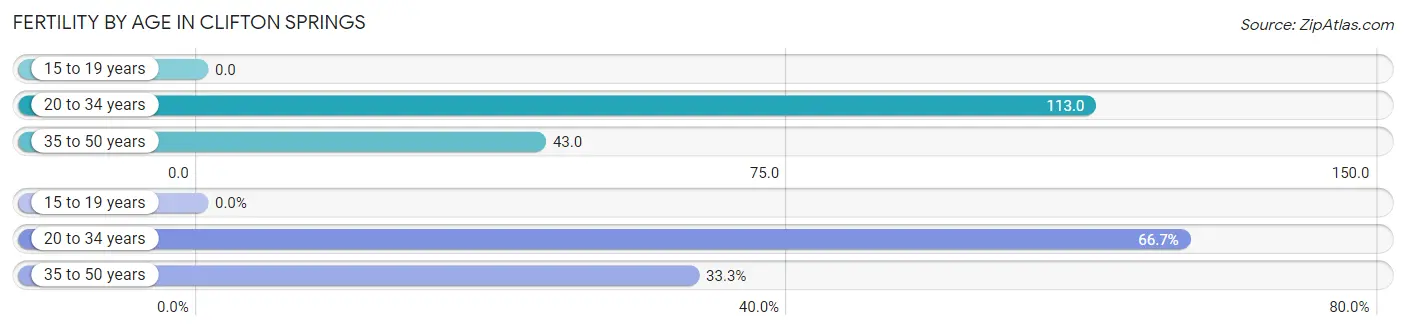
| Age Bracket | Women with Births | Births / 1,000 Women |
| 15 to 19 years | 0 (0.0%) | 0.0 |
| 20 to 34 years | 16 (66.7%) | 113.0 |
| 35 to 50 years | 8 (33.3%) | 43.0 |
| Total | 24 (100.0%) | 58.0 |
Fertility by Age by Marriage Status in Clifton Springs
58.3% of women with births (24) in Clifton Springs are married. The highest percentage of unmarried women with births falls into 20 to 34 years age bracket with 62.5% of them unmarried at the time of birth, while the lowest percentage of unmarried women with births belong to 35 to 50 years age bracket with 0.0% of them unmarried.
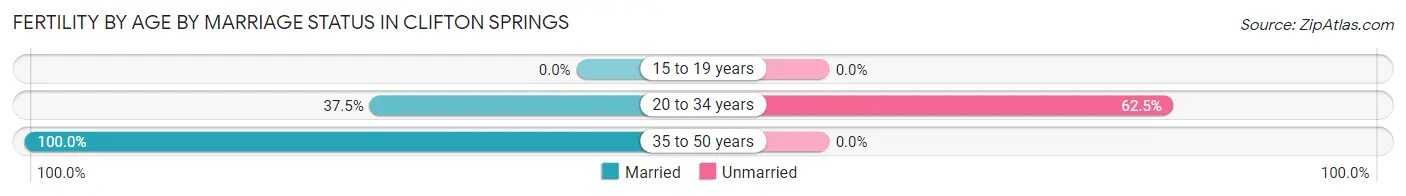
| Age Bracket | Married | Unmarried |
| 15 to 19 years | 0 (0.0%) | 0 (0.0%) |
| 20 to 34 years | 6 (37.5%) | 10 (62.5%) |
| 35 to 50 years | 8 (100.0%) | 0 (0.0%) |
| Total | 14 (58.3%) | 10 (41.7%) |
Fertility by Education in Clifton Springs
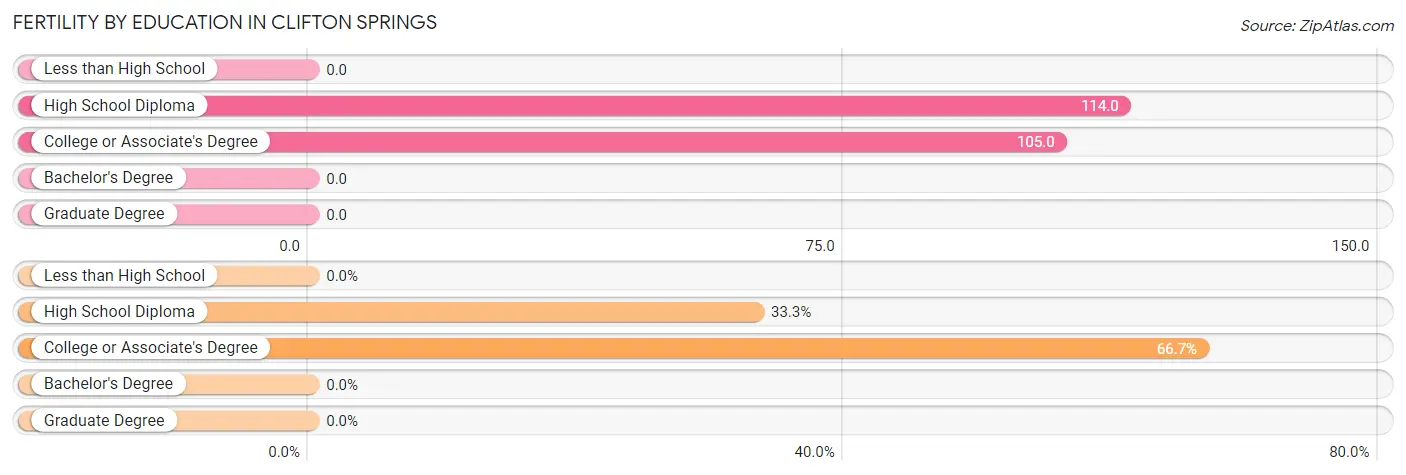
| Educational Attainment | Women with Births | Births / 1,000 Women |
| Less than High School | 0 (0.0%) | 0.0 |
| High School Diploma | 8 (33.3%) | 114.0 |
| College or Associate's Degree | 16 (66.7%) | 105.0 |
| Bachelor's Degree | 0 (0.0%) | 0.0 |
| Graduate Degree | 0 (0.0%) | 0.0 |
| Total | 24 (100.0%) | 58.0 |
Fertility by Education by Marriage Status in Clifton Springs
41.7% of women with births in Clifton Springs are unmarried. Women with the educational attainment of high school diploma are most likely to be married with 100.0% of them married at childbirth, while women with the educational attainment of college or associate's degree are least likely to be married with 62.5% of them unmarried at childbirth.
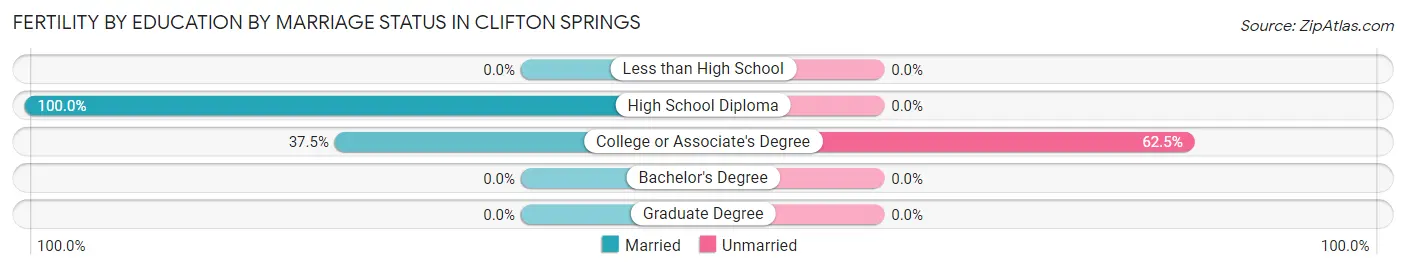
| Educational Attainment | Married | Unmarried |
| Less than High School | 0 (0.0%) | 0 (0.0%) |
| High School Diploma | 8 (100.0%) | 0 (0.0%) |
| College or Associate's Degree | 6 (37.5%) | 10 (62.5%) |
| Bachelor's Degree | 0 (0.0%) | 0 (0.0%) |
| Graduate Degree | 0 (0.0%) | 0 (0.0%) |
| Total | 14 (58.3%) | 10 (41.7%) |
Employment Characteristics in Clifton Springs
Employment by Class of Employer in Clifton Springs
Among the 801 employed individuals in Clifton Springs, private company employees (476 | 59.4%), not-for-profit organizations (168 | 21.0%), and local government employees (71 | 8.9%) make up the most common classes of employment.
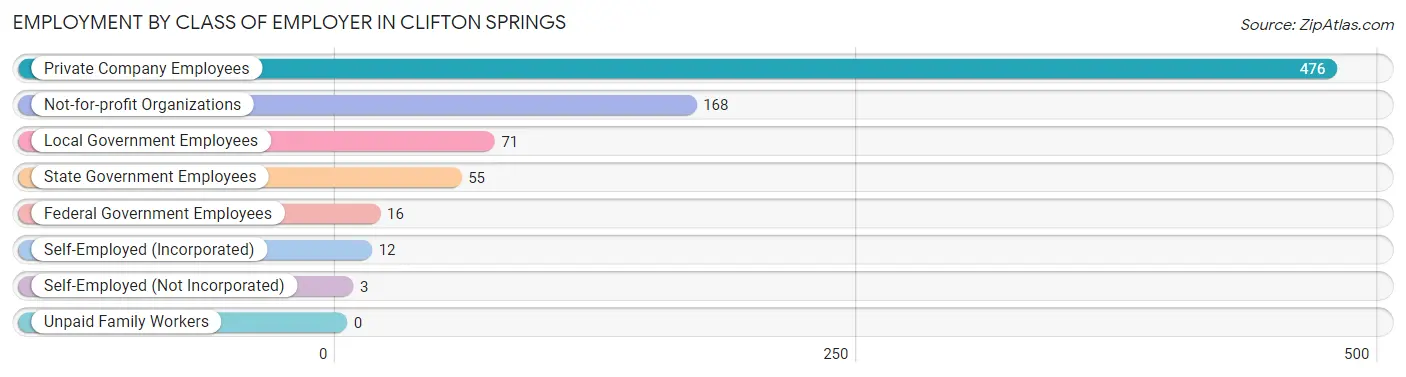
| Employer Class | # Employees | % Employees |
| Private Company Employees | 476 | 59.4% |
| Self-Employed (Incorporated) | 12 | 1.5% |
| Self-Employed (Not Incorporated) | 3 | 0.4% |
| Not-for-profit Organizations | 168 | 21.0% |
| Local Government Employees | 71 | 8.9% |
| State Government Employees | 55 | 6.9% |
| Federal Government Employees | 16 | 2.0% |
| Unpaid Family Workers | 0 | 0.0% |
| Total | 801 | 100.0% |
Employment Status by Age in Clifton Springs
According to the labor force statistics for Clifton Springs, out of the total population over 16 years of age (1,589), 53.3% or 847 individuals are in the labor force, with 4.8% or 41 of them unemployed. The age group with the highest labor force participation rate is 25 to 29 years, with 100.0% or 109 individuals in the labor force. Within the labor force, the 35 to 44 years age range has the highest percentage of unemployed individuals, with 14.4% or 29 of them being unemployed.
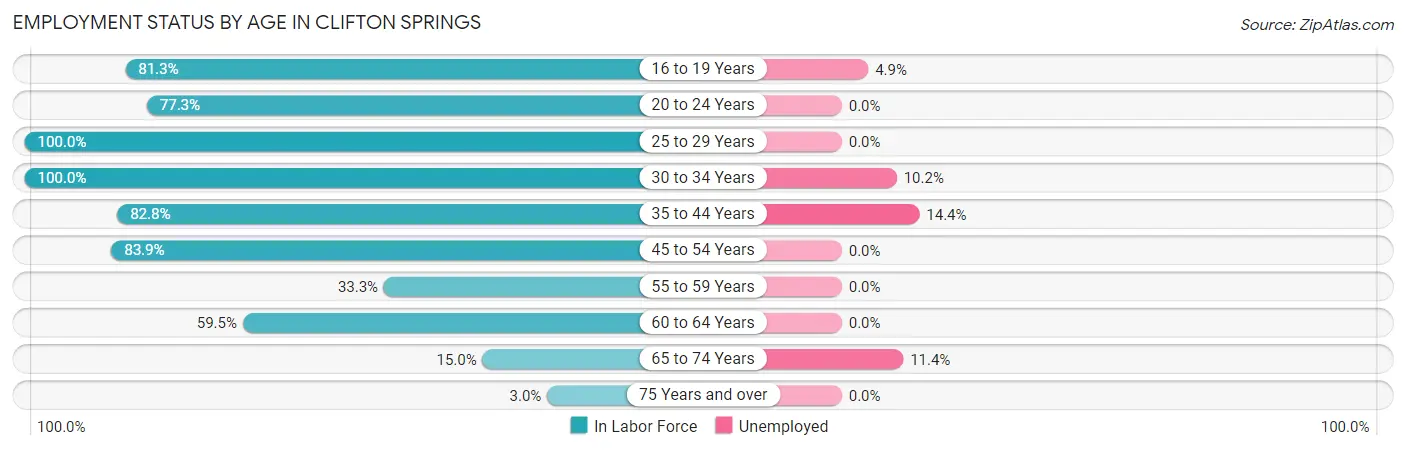
| Age Bracket | In Labor Force | Unemployed |
| 16 to 19 Years | 61 (81.3%) | 3 (4.9%) |
| 20 to 24 Years | 58 (77.3%) | 0 (0.0%) |
| 25 to 29 Years | 109 (100.0%) | 0 (0.0%) |
| 30 to 34 Years | 49 (100.0%) | 5 (10.2%) |
| 35 to 44 Years | 202 (82.8%) | 29 (14.4%) |
| 45 to 54 Years | 193 (83.9%) | 0 (0.0%) |
| 55 to 59 Years | 37 (33.3%) | 0 (0.0%) |
| 60 to 64 Years | 94 (59.5%) | 0 (0.0%) |
| 65 to 74 Years | 35 (15.0%) | 4 (11.4%) |
| 75 Years and over | 9 (3.0%) | 0 (0.0%) |
| Total | 847 (53.3%) | 41 (4.8%) |
Employment Status by Educational Attainment in Clifton Springs
According to labor force statistics for Clifton Springs, 75.9% of individuals (684) out of the total population between 25 and 64 years of age (901) are in the labor force, with 5.0% or 34 of them being unemployed. The group with the highest labor force participation rate are those with the educational attainment of bachelor's degree or higher, with 90.6% or 212 individuals in the labor force. Within the labor force, individuals with high school diploma education have the highest percentage of unemployment, with 20.1% or 34 of them being unemployed.
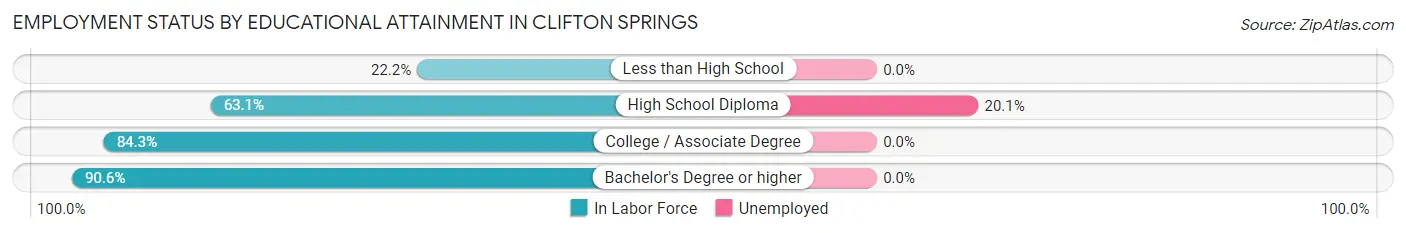
| Educational Attainment | In Labor Force | Unemployed |
| Less than High School | 12 (22.2%) | 0 (0.0%) |
| High School Diploma | 169 (63.1%) | 54 (20.1%) |
| College / Associate Degree | 291 (84.3%) | 0 (0.0%) |
| Bachelor's Degree or higher | 212 (90.6%) | 0 (0.0%) |
| Total | 684 (75.9%) | 45 (5.0%) |
Employment Occupations by Sex in Clifton Springs
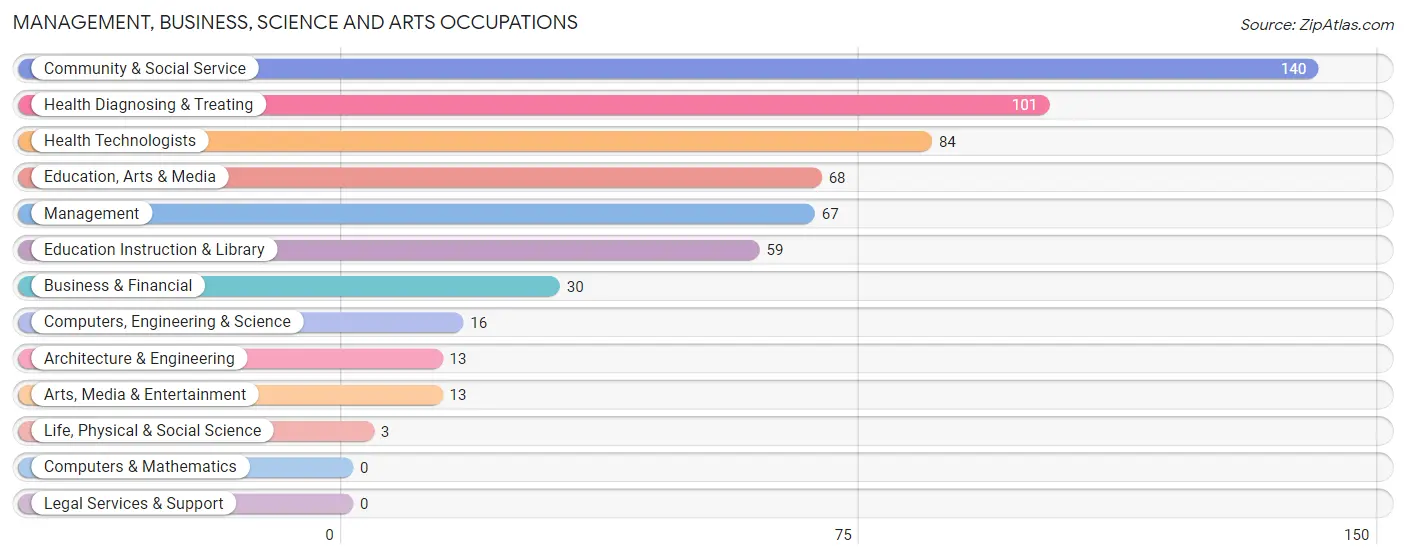
Management, Business, Science and Arts Occupations
The most common Management, Business, Science and Arts occupations in Clifton Springs are Community & Social Service (140 | 17.4%), Health Diagnosing & Treating (101 | 12.5%), Health Technologists (84 | 10.4%), Education, Arts & Media (68 | 8.4%), and Management (67 | 8.3%).
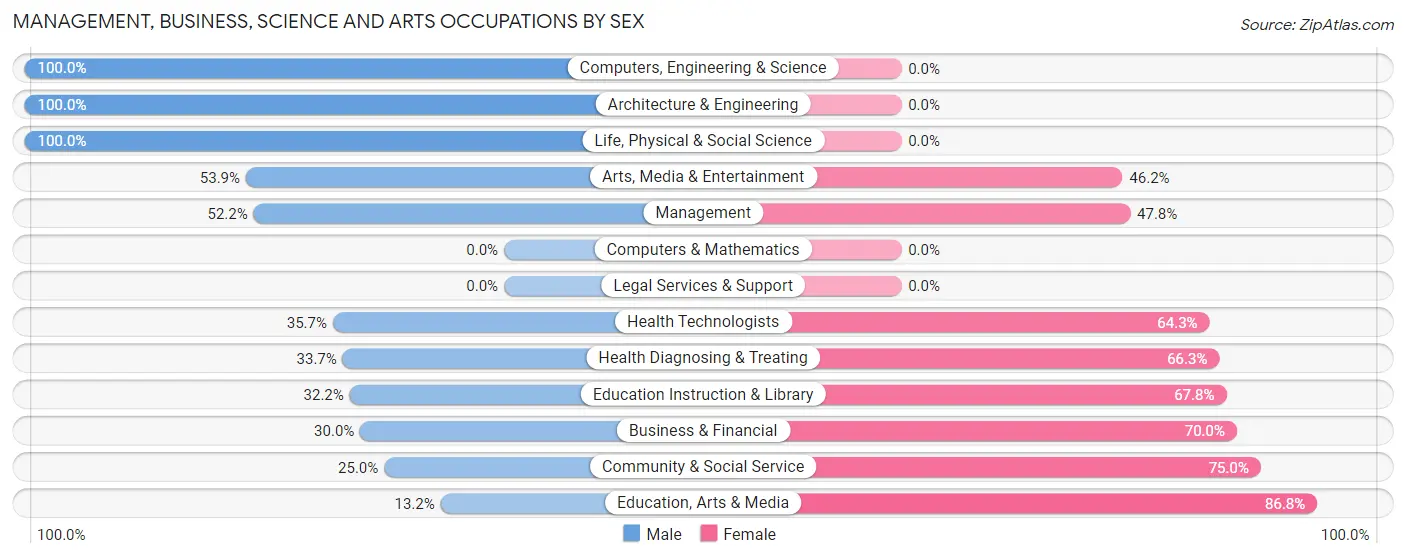
Management, Business, Science and Arts Occupations by Sex
Within the Management, Business, Science and Arts occupations in Clifton Springs, the most male-oriented occupations are Computers, Engineering & Science (100.0%), Architecture & Engineering (100.0%), and Life, Physical & Social Science (100.0%), while the most female-oriented occupations are Education, Arts & Media (86.8%), Community & Social Service (75.0%), and Business & Financial (70.0%).
| Occupation | Male | Female |
| Management | 35 (52.2%) | 32 (47.8%) |
| Business & Financial | 9 (30.0%) | 21 (70.0%) |
| Computers, Engineering & Science | 16 (100.0%) | 0 (0.0%) |
| Computers & Mathematics | 0 (0.0%) | 0 (0.0%) |
| Architecture & Engineering | 13 (100.0%) | 0 (0.0%) |
| Life, Physical & Social Science | 3 (100.0%) | 0 (0.0%) |
| Community & Social Service | 35 (25.0%) | 105 (75.0%) |
| Education, Arts & Media | 9 (13.2%) | 59 (86.8%) |
| Legal Services & Support | 0 (0.0%) | 0 (0.0%) |
| Education Instruction & Library | 19 (32.2%) | 40 (67.8%) |
| Arts, Media & Entertainment | 7 (53.8%) | 6 (46.2%) |
| Health Diagnosing & Treating | 34 (33.7%) | 67 (66.3%) |
| Health Technologists | 30 (35.7%) | 54 (64.3%) |
| Total (Category) | 129 (36.4%) | 225 (63.6%) |
| Total (Overall) | 387 (48.0%) | 419 (52.0%) |
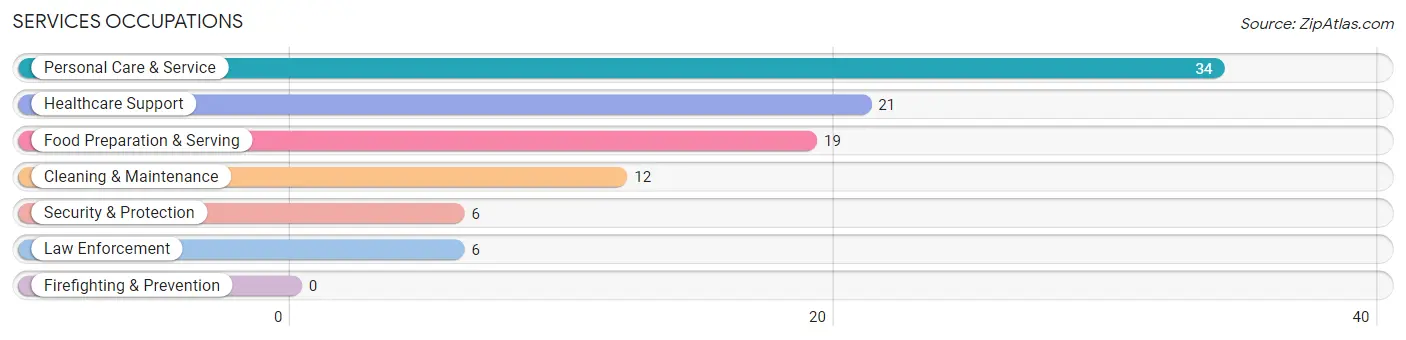
Services Occupations
The most common Services occupations in Clifton Springs are Personal Care & Service (34 | 4.2%), Healthcare Support (21 | 2.6%), Food Preparation & Serving (19 | 2.4%), Cleaning & Maintenance (12 | 1.5%), and Security & Protection (6 | 0.7%).
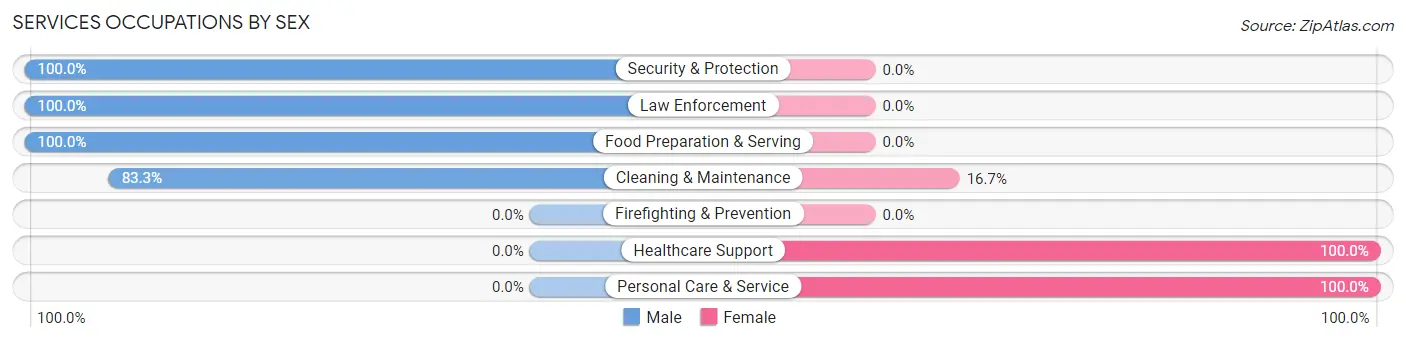
Services Occupations by Sex
Within the Services occupations in Clifton Springs, the most male-oriented occupations are Security & Protection (100.0%), Law Enforcement (100.0%), and Food Preparation & Serving (100.0%), while the most female-oriented occupations are Healthcare Support (100.0%), Personal Care & Service (100.0%), and Cleaning & Maintenance (16.7%).
| Occupation | Male | Female |
| Healthcare Support | 0 (0.0%) | 21 (100.0%) |
| Security & Protection | 6 (100.0%) | 0 (0.0%) |
| Firefighting & Prevention | 0 (0.0%) | 0 (0.0%) |
| Law Enforcement | 6 (100.0%) | 0 (0.0%) |
| Food Preparation & Serving | 19 (100.0%) | 0 (0.0%) |
| Cleaning & Maintenance | 10 (83.3%) | 2 (16.7%) |
| Personal Care & Service | 0 (0.0%) | 34 (100.0%) |
| Total (Category) | 35 (38.0%) | 57 (62.0%) |
| Total (Overall) | 387 (48.0%) | 419 (52.0%) |
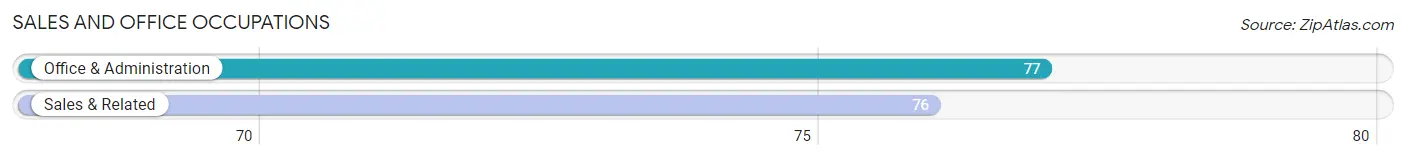
Sales and Office Occupations
The most common Sales and Office occupations in Clifton Springs are Office & Administration (77 | 9.6%), and Sales & Related (76 | 9.4%).
Sales and Office Occupations by Sex
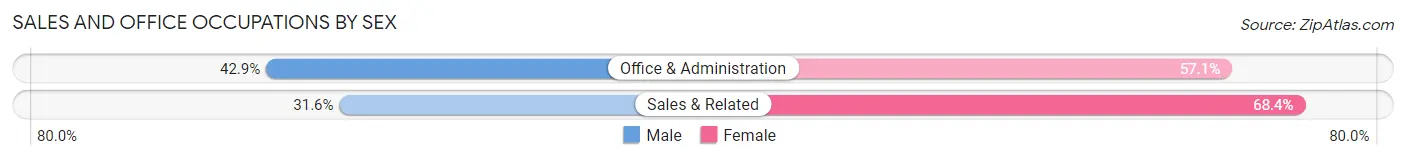
| Occupation | Male | Female |
| Sales & Related | 24 (31.6%) | 52 (68.4%) |
| Office & Administration | 33 (42.9%) | 44 (57.1%) |
| Total (Category) | 57 (37.2%) | 96 (62.7%) |
| Total (Overall) | 387 (48.0%) | 419 (52.0%) |
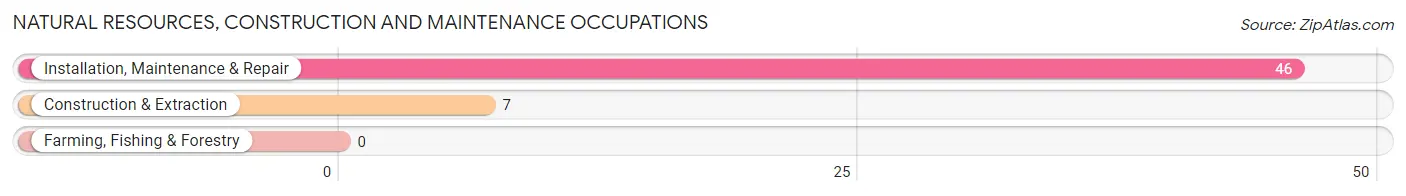
Natural Resources, Construction and Maintenance Occupations
The most common Natural Resources, Construction and Maintenance occupations in Clifton Springs are Installation, Maintenance & Repair (46 | 5.7%), and Construction & Extraction (7 | 0.9%).
Natural Resources, Construction and Maintenance Occupations by Sex
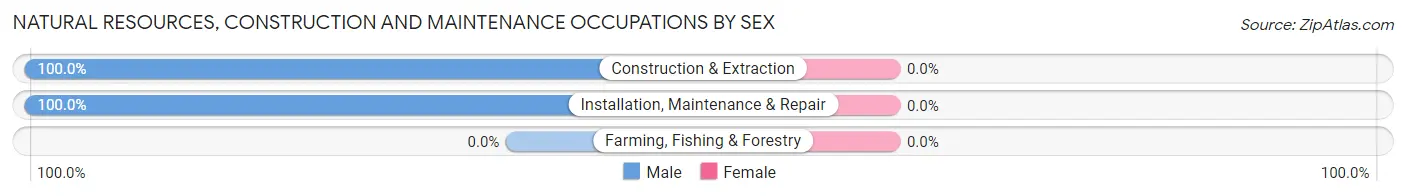
| Occupation | Male | Female |
| Farming, Fishing & Forestry | 0 (0.0%) | 0 (0.0%) |
| Construction & Extraction | 7 (100.0%) | 0 (0.0%) |
| Installation, Maintenance & Repair | 46 (100.0%) | 0 (0.0%) |
| Total (Category) | 53 (100.0%) | 0 (0.0%) |
| Total (Overall) | 387 (48.0%) | 419 (52.0%) |
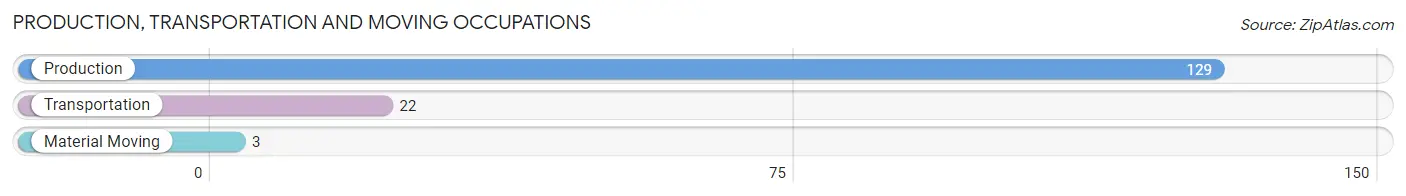
Production, Transportation and Moving Occupations
The most common Production, Transportation and Moving occupations in Clifton Springs are Production (129 | 16.0%), Transportation (22 | 2.7%), and Material Moving (3 | 0.4%).
Production, Transportation and Moving Occupations by Sex
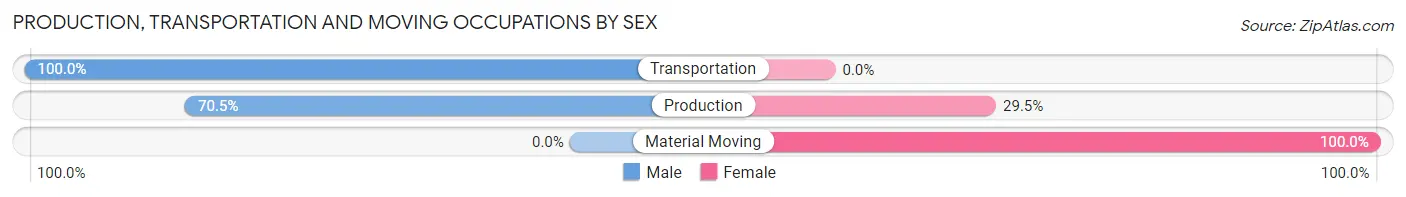
| Occupation | Male | Female |
| Production | 91 (70.5%) | 38 (29.5%) |
| Transportation | 22 (100.0%) | 0 (0.0%) |
| Material Moving | 0 (0.0%) | 3 (100.0%) |
| Total (Category) | 113 (73.4%) | 41 (26.6%) |
| Total (Overall) | 387 (48.0%) | 419 (52.0%) |
Employment Industries by Sex in Clifton Springs
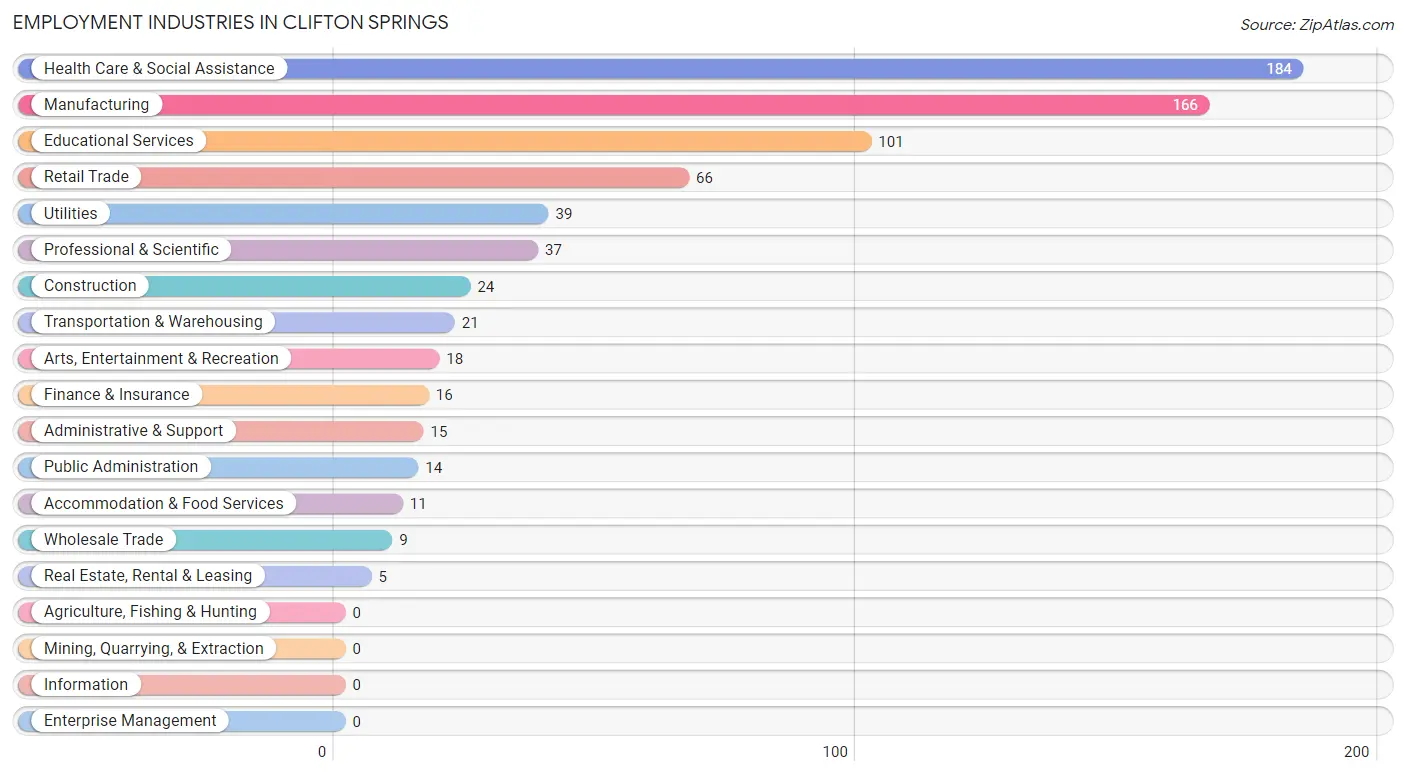
Employment Industries in Clifton Springs
The major employment industries in Clifton Springs include Health Care & Social Assistance (184 | 22.8%), Manufacturing (166 | 20.6%), Educational Services (101 | 12.5%), Retail Trade (66 | 8.2%), and Utilities (39 | 4.8%).
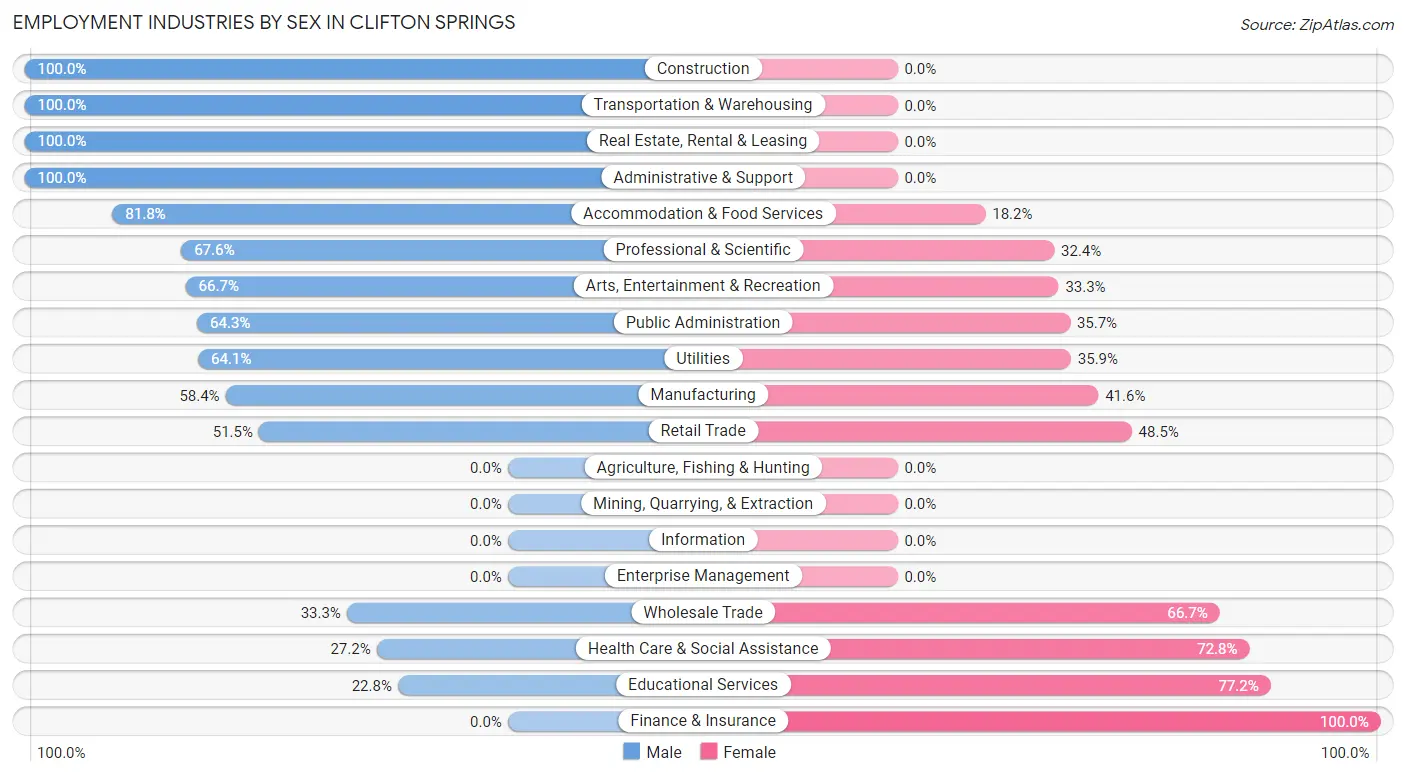
Employment Industries by Sex in Clifton Springs
The Clifton Springs industries that see more men than women are Construction (100.0%), Transportation & Warehousing (100.0%), and Real Estate, Rental & Leasing (100.0%), whereas the industries that tend to have a higher number of women are Finance & Insurance (100.0%), Educational Services (77.2%), and Health Care & Social Assistance (72.8%).
| Industry | Male | Female |
| Agriculture, Fishing & Hunting | 0 (0.0%) | 0 (0.0%) |
| Mining, Quarrying, & Extraction | 0 (0.0%) | 0 (0.0%) |
| Construction | 24 (100.0%) | 0 (0.0%) |
| Manufacturing | 97 (58.4%) | 69 (41.6%) |
| Wholesale Trade | 3 (33.3%) | 6 (66.7%) |
| Retail Trade | 34 (51.5%) | 32 (48.5%) |
| Transportation & Warehousing | 21 (100.0%) | 0 (0.0%) |
| Utilities | 25 (64.1%) | 14 (35.9%) |
| Information | 0 (0.0%) | 0 (0.0%) |
| Finance & Insurance | 0 (0.0%) | 16 (100.0%) |
| Real Estate, Rental & Leasing | 5 (100.0%) | 0 (0.0%) |
| Professional & Scientific | 25 (67.6%) | 12 (32.4%) |
| Enterprise Management | 0 (0.0%) | 0 (0.0%) |
| Administrative & Support | 15 (100.0%) | 0 (0.0%) |
| Educational Services | 23 (22.8%) | 78 (77.2%) |
| Health Care & Social Assistance | 50 (27.2%) | 134 (72.8%) |
| Arts, Entertainment & Recreation | 12 (66.7%) | 6 (33.3%) |
| Accommodation & Food Services | 9 (81.8%) | 2 (18.2%) |
| Public Administration | 9 (64.3%) | 5 (35.7%) |
| Total | 387 (48.0%) | 419 (52.0%) |
Education in Clifton Springs
School Enrollment in Clifton Springs
The most common levels of schooling among the 515 students in Clifton Springs are middle school (140 | 27.2%), high school (137 | 26.6%), and elementary school (109 | 21.2%).
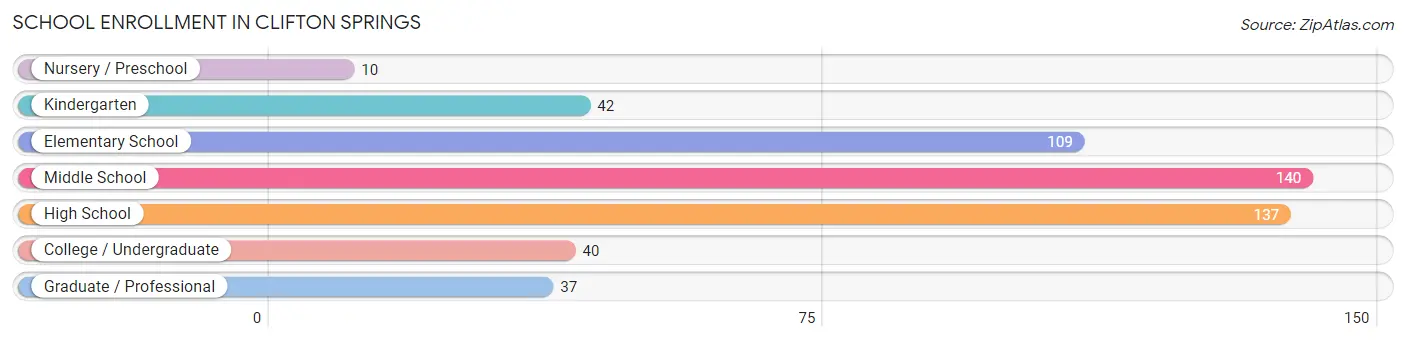
| School Level | # Students | % Students |
| Nursery / Preschool | 10 | 1.9% |
| Kindergarten | 42 | 8.2% |
| Elementary School | 109 | 21.2% |
| Middle School | 140 | 27.2% |
| High School | 137 | 26.6% |
| College / Undergraduate | 40 | 7.8% |
| Graduate / Professional | 37 | 7.2% |
| Total | 515 | 100.0% |
School Enrollment by Age by Funding Source in Clifton Springs
Out of a total of 515 students who are enrolled in schools in Clifton Springs, 121 (23.5%) attend a private institution, while the remaining 394 (76.5%) are enrolled in public schools. The age group of 20 to 24 year olds has the highest likelihood of being enrolled in private schools, with 24 (68.6% in the age bracket) enrolled. Conversely, the age group of 5 to 9 year old has the lowest likelihood of being enrolled in a private school, with 124 (100.0% in the age bracket) attending a public institution.
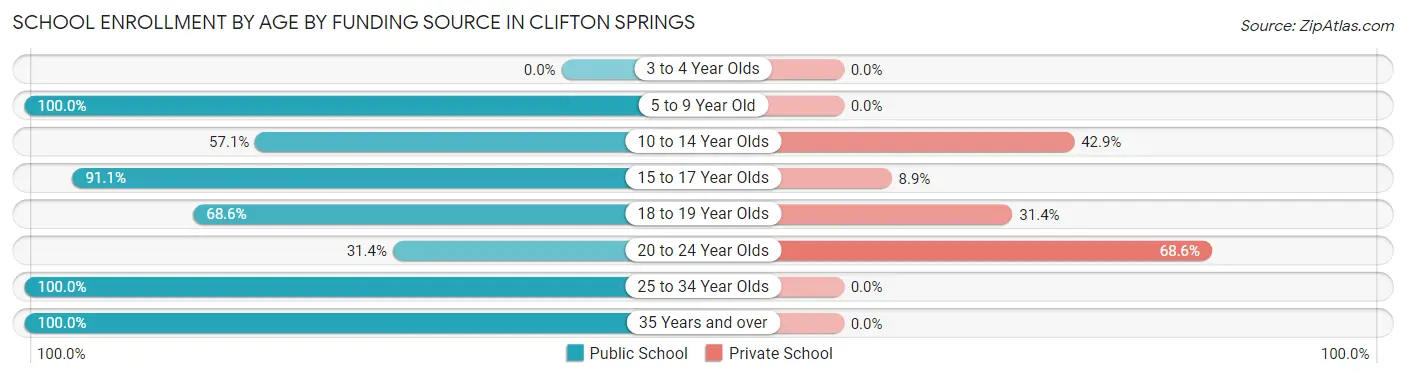
| Age Bracket | Public School | Private School |
| 3 to 4 Year Olds | 0 (0.0%) | 0 (0.0%) |
| 5 to 9 Year Old | 124 (100.0%) | 0 (0.0%) |
| 10 to 14 Year Olds | 101 (57.1%) | 76 (42.9%) |
| 15 to 17 Year Olds | 102 (91.1%) | 10 (8.9%) |
| 18 to 19 Year Olds | 24 (68.6%) | 11 (31.4%) |
| 20 to 24 Year Olds | 11 (31.4%) | 24 (68.6%) |
| 25 to 34 Year Olds | 21 (100.0%) | 0 (0.0%) |
| 35 Years and over | 11 (100.0%) | 0 (0.0%) |
| Total | 394 (76.5%) | 121 (23.5%) |
Educational Attainment by Field of Study in Clifton Springs
Science & technology (55 | 15.5%), education (51 | 14.4%), business (36 | 10.1%), bio, nature & agricultural (32 | 9.0%), and liberal arts & history (28 | 7.9%) are the most common fields of study among 355 individuals in Clifton Springs who have obtained a bachelor's degree or higher.
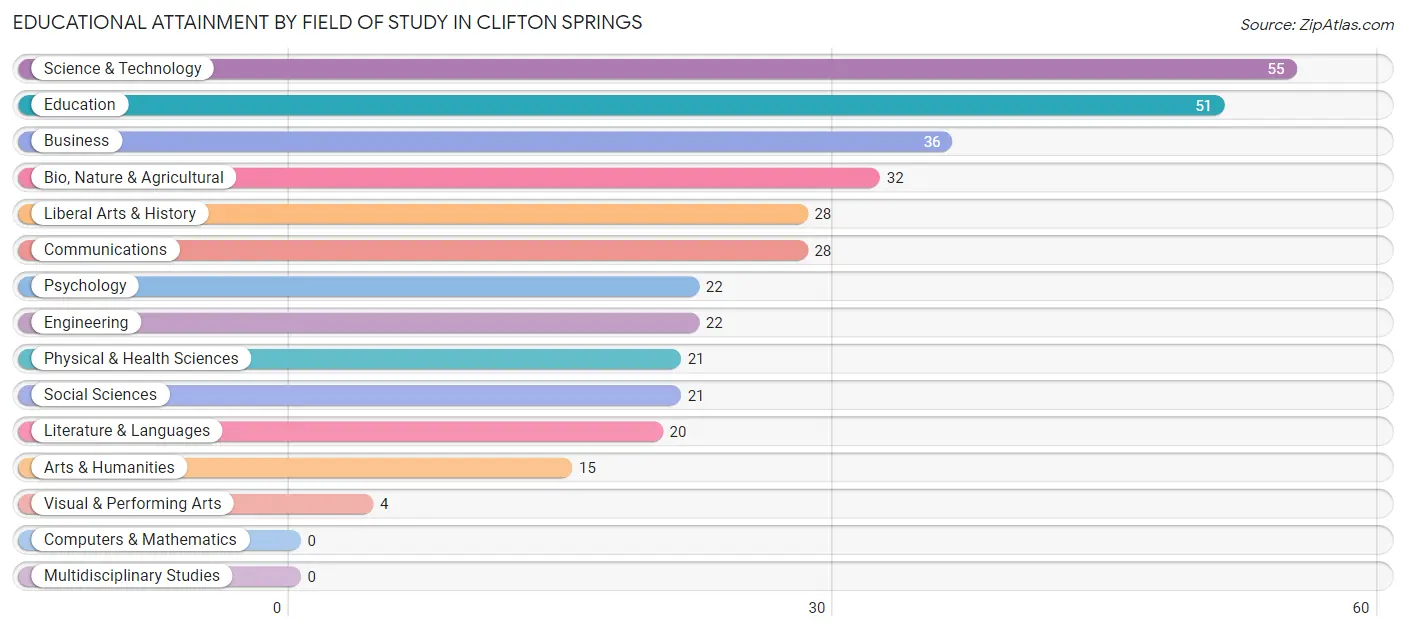
| Field of Study | # Graduates | % Graduates |
| Computers & Mathematics | 0 | 0.0% |
| Bio, Nature & Agricultural | 32 | 9.0% |
| Physical & Health Sciences | 21 | 5.9% |
| Psychology | 22 | 6.2% |
| Social Sciences | 21 | 5.9% |
| Engineering | 22 | 6.2% |
| Multidisciplinary Studies | 0 | 0.0% |
| Science & Technology | 55 | 15.5% |
| Business | 36 | 10.1% |
| Education | 51 | 14.4% |
| Literature & Languages | 20 | 5.6% |
| Liberal Arts & History | 28 | 7.9% |
| Visual & Performing Arts | 4 | 1.1% |
| Communications | 28 | 7.9% |
| Arts & Humanities | 15 | 4.2% |
| Total | 355 | 100.0% |
Transportation & Commute in Clifton Springs
Vehicle Availability by Sex in Clifton Springs
The most prevalent vehicle ownership categories in Clifton Springs are males with 2 vehicles (164, accounting for 42.4%) and females with 2 vehicles (212, making up 39.8%).
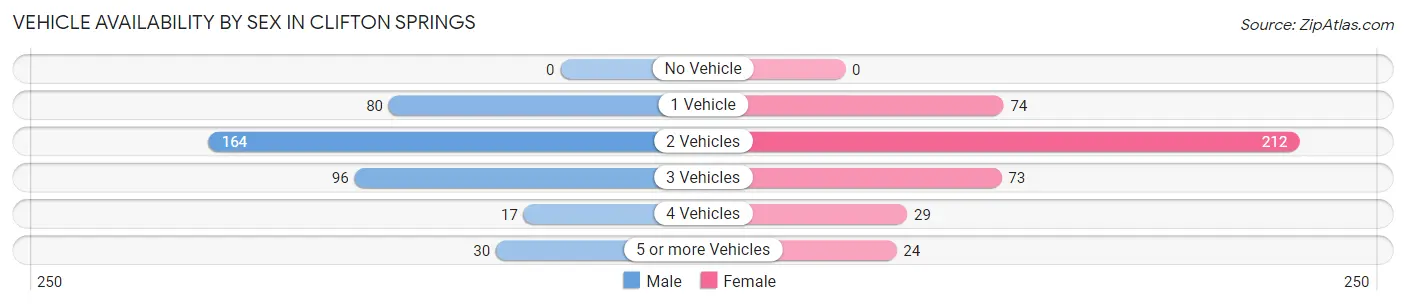
| Vehicles Available | Male | Female |
| No Vehicle | 0 (0.0%) | 0 (0.0%) |
| 1 Vehicle | 80 (20.7%) | 74 (18.0%) |
| 2 Vehicles | 164 (42.4%) | 212 (51.5%) |
| 3 Vehicles | 96 (24.8%) | 73 (17.7%) |
| 4 Vehicles | 17 (4.4%) | 29 (7.0%) |
| 5 or more Vehicles | 30 (7.7%) | 24 (5.8%) |
| Total | 387 (100.0%) | 412 (100.0%) |
Commute Time in Clifton Springs
The most frequently occuring commute durations in Clifton Springs are 5 to 9 minutes (150 commuters, 18.9%), 20 to 24 minutes (148 commuters, 18.7%), and 10 to 14 minutes (138 commuters, 17.4%).
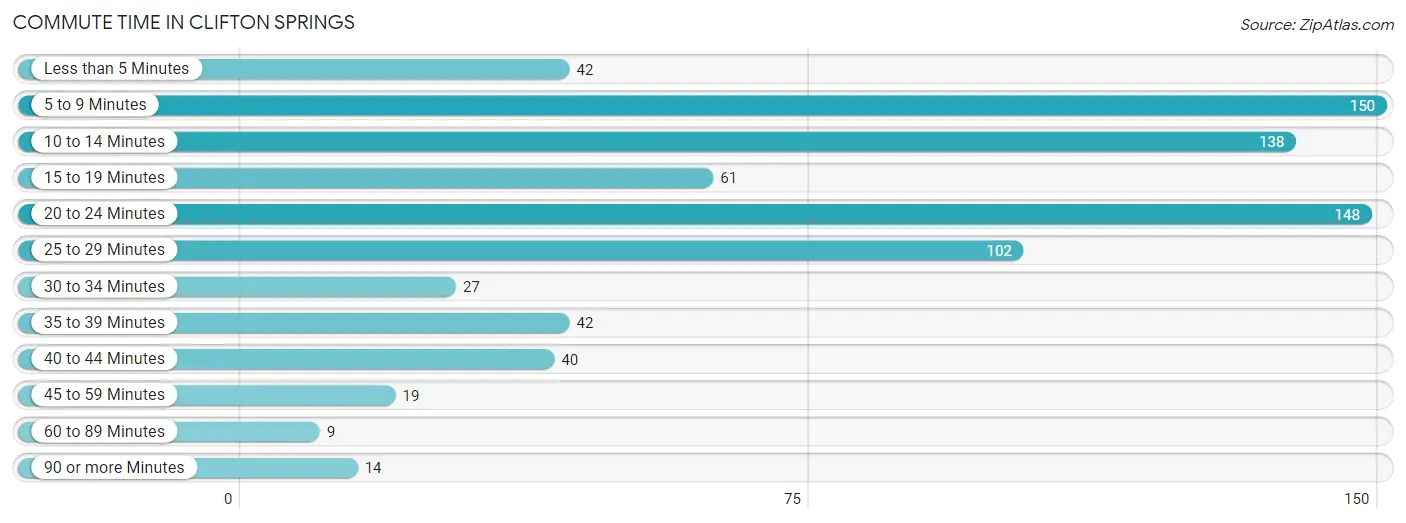
| Commute Time | # Commuters | % Commuters |
| Less than 5 Minutes | 42 | 5.3% |
| 5 to 9 Minutes | 150 | 18.9% |
| 10 to 14 Minutes | 138 | 17.4% |
| 15 to 19 Minutes | 61 | 7.7% |
| 20 to 24 Minutes | 148 | 18.7% |
| 25 to 29 Minutes | 102 | 12.9% |
| 30 to 34 Minutes | 27 | 3.4% |
| 35 to 39 Minutes | 42 | 5.3% |
| 40 to 44 Minutes | 40 | 5.1% |
| 45 to 59 Minutes | 19 | 2.4% |
| 60 to 89 Minutes | 9 | 1.1% |
| 90 or more Minutes | 14 | 1.8% |
Commute Time by Sex in Clifton Springs
The most common commute times in Clifton Springs are 5 to 9 minutes (66 commuters, 17.3%) for males and 20 to 24 minutes (97 commuters, 23.6%) for females.
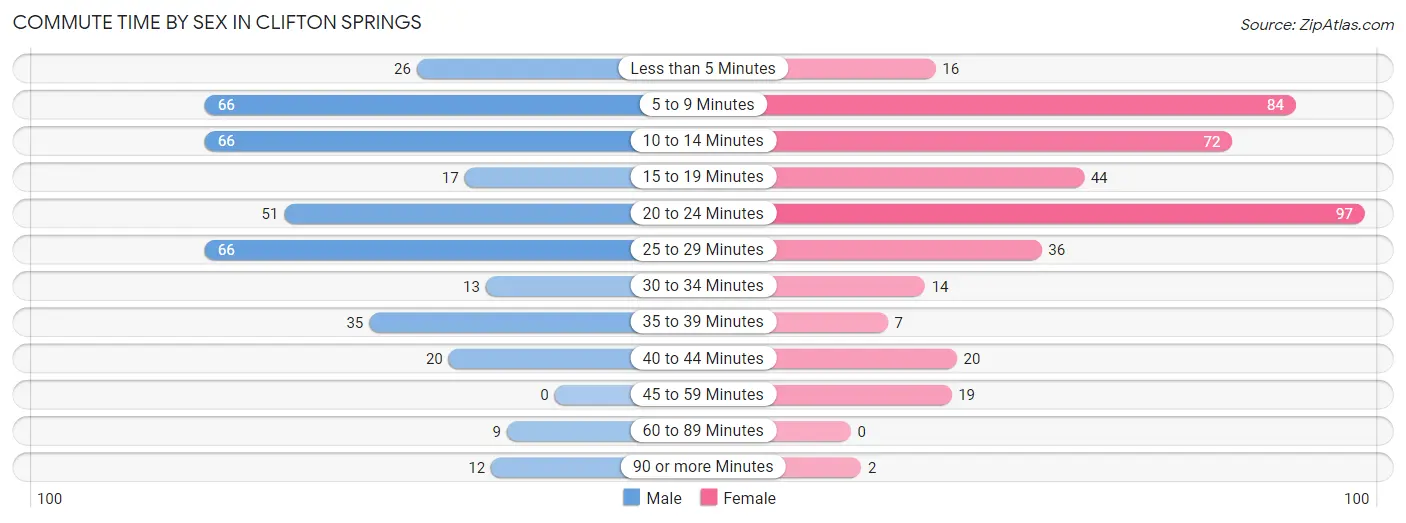
| Commute Time | Male | Female |
| Less than 5 Minutes | 26 (6.8%) | 16 (3.9%) |
| 5 to 9 Minutes | 66 (17.3%) | 84 (20.4%) |
| 10 to 14 Minutes | 66 (17.3%) | 72 (17.5%) |
| 15 to 19 Minutes | 17 (4.5%) | 44 (10.7%) |
| 20 to 24 Minutes | 51 (13.4%) | 97 (23.6%) |
| 25 to 29 Minutes | 66 (17.3%) | 36 (8.8%) |
| 30 to 34 Minutes | 13 (3.4%) | 14 (3.4%) |
| 35 to 39 Minutes | 35 (9.2%) | 7 (1.7%) |
| 40 to 44 Minutes | 20 (5.2%) | 20 (4.9%) |
| 45 to 59 Minutes | 0 (0.0%) | 19 (4.6%) |
| 60 to 89 Minutes | 9 (2.4%) | 0 (0.0%) |
| 90 or more Minutes | 12 (3.2%) | 2 (0.5%) |
Time of Departure to Work by Sex in Clifton Springs
The most frequent times of departure to work in Clifton Springs are 7:00 AM to 7:29 AM (82, 21.5%) for males and 7:30 AM to 7:59 AM (101, 24.6%) for females.
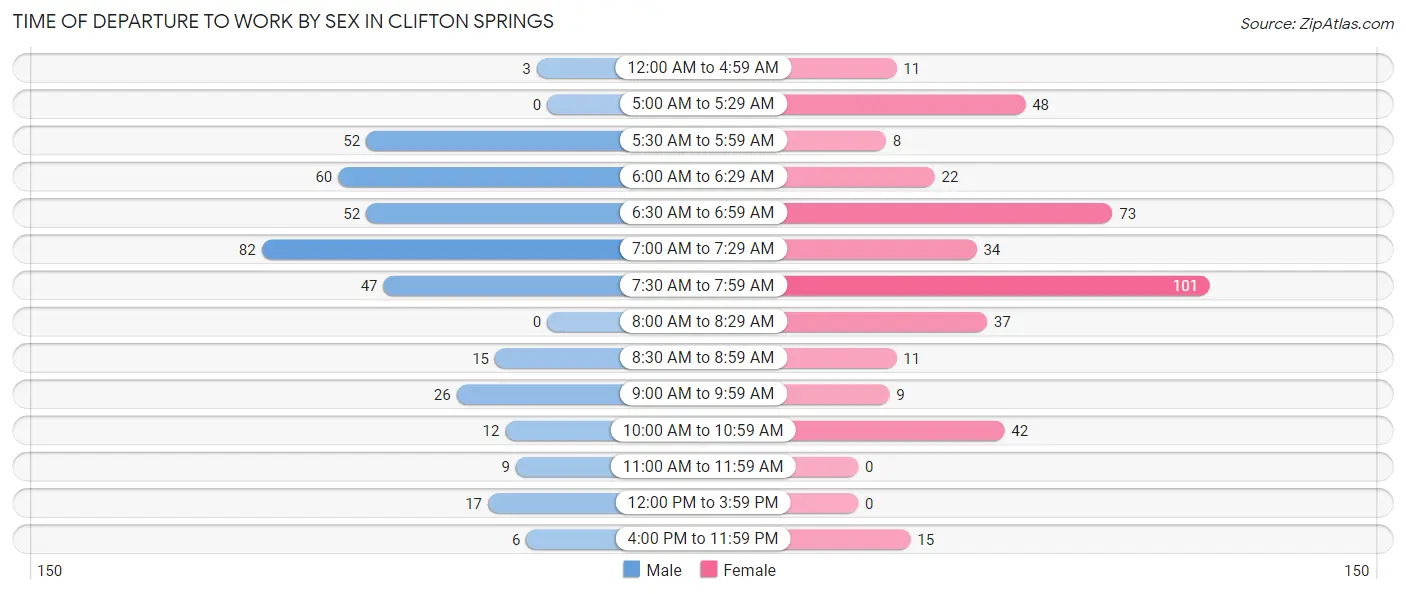
| Time of Departure | Male | Female |
| 12:00 AM to 4:59 AM | 3 (0.8%) | 11 (2.7%) |
| 5:00 AM to 5:29 AM | 0 (0.0%) | 48 (11.7%) |
| 5:30 AM to 5:59 AM | 52 (13.7%) | 8 (1.9%) |
| 6:00 AM to 6:29 AM | 60 (15.8%) | 22 (5.3%) |
| 6:30 AM to 6:59 AM | 52 (13.7%) | 73 (17.8%) |
| 7:00 AM to 7:29 AM | 82 (21.5%) | 34 (8.3%) |
| 7:30 AM to 7:59 AM | 47 (12.3%) | 101 (24.6%) |
| 8:00 AM to 8:29 AM | 0 (0.0%) | 37 (9.0%) |
| 8:30 AM to 8:59 AM | 15 (3.9%) | 11 (2.7%) |
| 9:00 AM to 9:59 AM | 26 (6.8%) | 9 (2.2%) |
| 10:00 AM to 10:59 AM | 12 (3.2%) | 42 (10.2%) |
| 11:00 AM to 11:59 AM | 9 (2.4%) | 0 (0.0%) |
| 12:00 PM to 3:59 PM | 17 (4.5%) | 0 (0.0%) |
| 4:00 PM to 11:59 PM | 6 (1.6%) | 15 (3.6%) |
| Total | 381 (100.0%) | 411 (100.0%) |
Housing Occupancy in Clifton Springs
Occupancy by Ownership in Clifton Springs
Of the total 788 dwellings in Clifton Springs, owner-occupied units account for 491 (62.3%), while renter-occupied units make up 297 (37.7%).
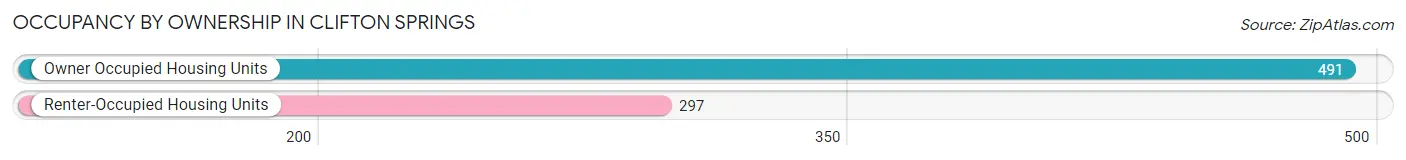
| Occupancy | # Housing Units | % Housing Units |
| Owner Occupied Housing Units | 491 | 62.3% |
| Renter-Occupied Housing Units | 297 | 37.7% |
| Total Occupied Housing Units | 788 | 100.0% |
Occupancy by Household Size in Clifton Springs
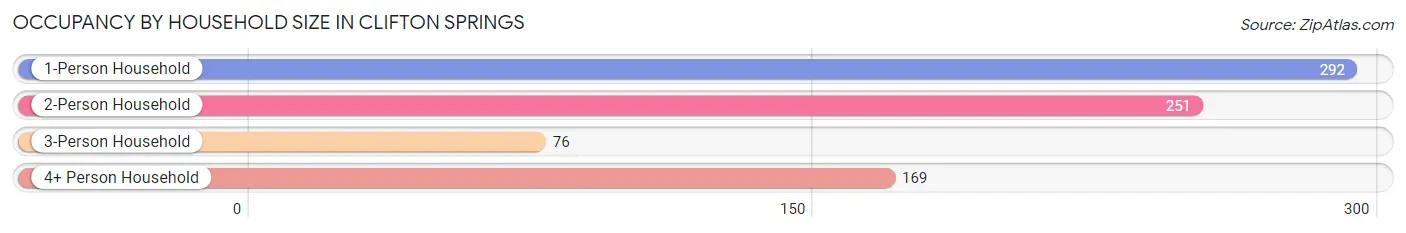
| Household Size | # Housing Units | % Housing Units |
| 1-Person Household | 292 | 37.1% |
| 2-Person Household | 251 | 31.9% |
| 3-Person Household | 76 | 9.6% |
| 4+ Person Household | 169 | 21.4% |
| Total Housing Units | 788 | 100.0% |
Occupancy by Ownership by Household Size in Clifton Springs
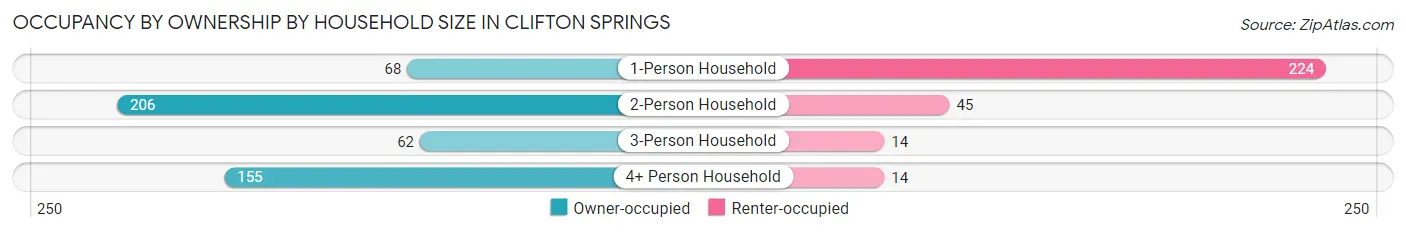
| Household Size | Owner-occupied | Renter-occupied |
| 1-Person Household | 68 (23.3%) | 224 (76.7%) |
| 2-Person Household | 206 (82.1%) | 45 (17.9%) |
| 3-Person Household | 62 (81.6%) | 14 (18.4%) |
| 4+ Person Household | 155 (91.7%) | 14 (8.3%) |
| Total Housing Units | 491 (62.3%) | 297 (37.7%) |
Occupancy by Educational Attainment in Clifton Springs
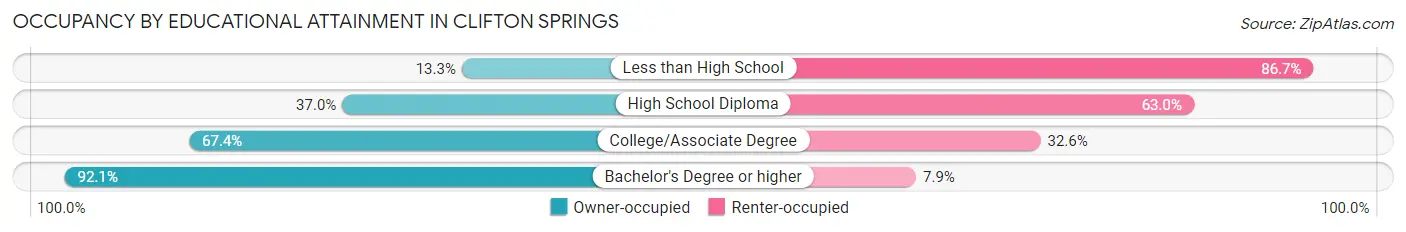
| Household Size | Owner-occupied | Renter-occupied |
| Less than High School | 4 (13.3%) | 26 (86.7%) |
| High School Diploma | 90 (37.0%) | 153 (63.0%) |
| College/Associate Degree | 211 (67.4%) | 102 (32.6%) |
| Bachelor's Degree or higher | 186 (92.1%) | 16 (7.9%) |
Occupancy by Age of Householder in Clifton Springs
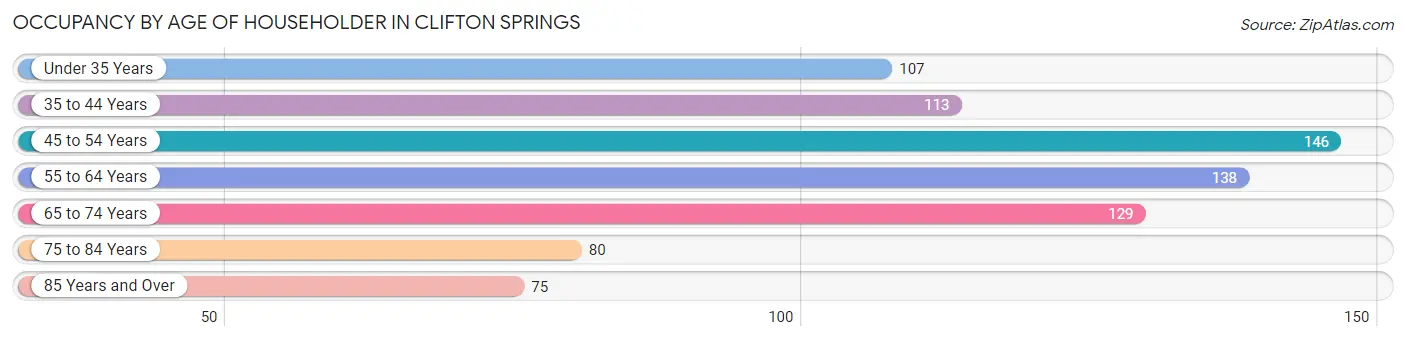
| Age Bracket | # Households | % Households |
| Under 35 Years | 107 | 13.6% |
| 35 to 44 Years | 113 | 14.3% |
| 45 to 54 Years | 146 | 18.5% |
| 55 to 64 Years | 138 | 17.5% |
| 65 to 74 Years | 129 | 16.4% |
| 75 to 84 Years | 80 | 10.2% |
| 85 Years and Over | 75 | 9.5% |
| Total | 788 | 100.0% |
Housing Finances in Clifton Springs
Median Income by Occupancy in Clifton Springs
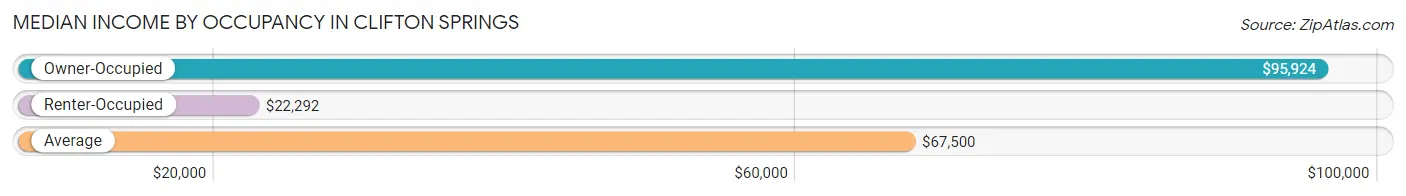
| Occupancy Type | # Households | Median Income |
| Owner-Occupied | 491 (62.3%) | $95,924 |
| Renter-Occupied | 297 (37.7%) | $22,292 |
| Average | 788 (100.0%) | $67,500 |
Occupancy by Householder Income Bracket in Clifton Springs
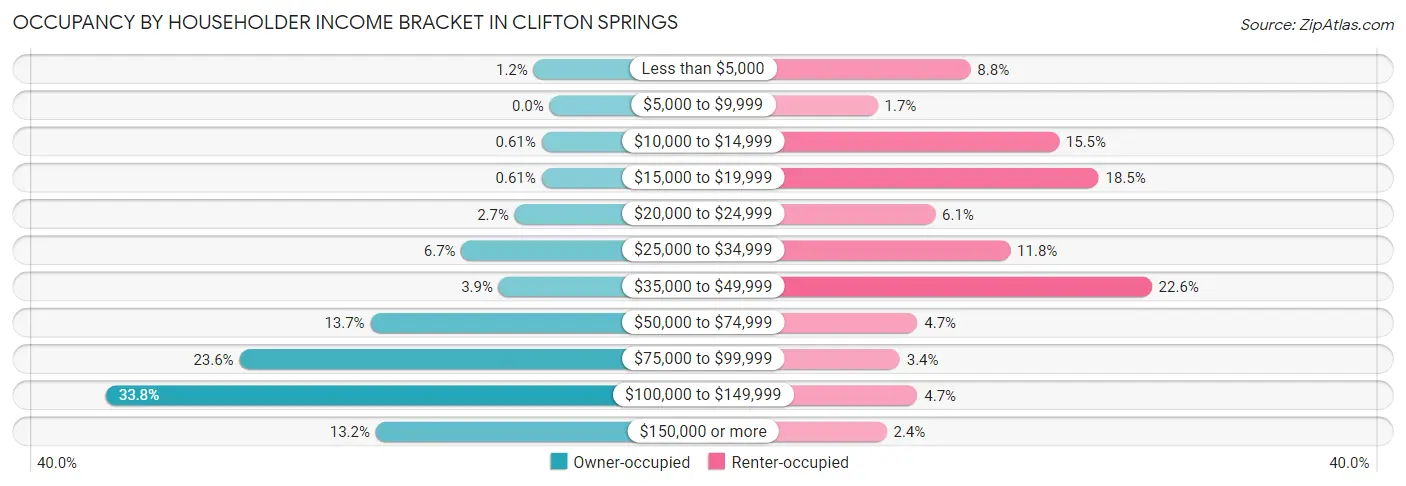
| Income Bracket | Owner-occupied | Renter-occupied |
| Less than $5,000 | 6 (1.2%) | 26 (8.7%) |
| $5,000 to $9,999 | 0 (0.0%) | 5 (1.7%) |
| $10,000 to $14,999 | 3 (0.6%) | 46 (15.5%) |
| $15,000 to $19,999 | 3 (0.6%) | 55 (18.5%) |
| $20,000 to $24,999 | 13 (2.6%) | 18 (6.1%) |
| $25,000 to $34,999 | 33 (6.7%) | 35 (11.8%) |
| $35,000 to $49,999 | 19 (3.9%) | 67 (22.6%) |
| $50,000 to $74,999 | 67 (13.7%) | 14 (4.7%) |
| $75,000 to $99,999 | 116 (23.6%) | 10 (3.4%) |
| $100,000 to $149,999 | 166 (33.8%) | 14 (4.7%) |
| $150,000 or more | 65 (13.2%) | 7 (2.4%) |
| Total | 491 (100.0%) | 297 (100.0%) |
Monthly Housing Cost Tiers in Clifton Springs
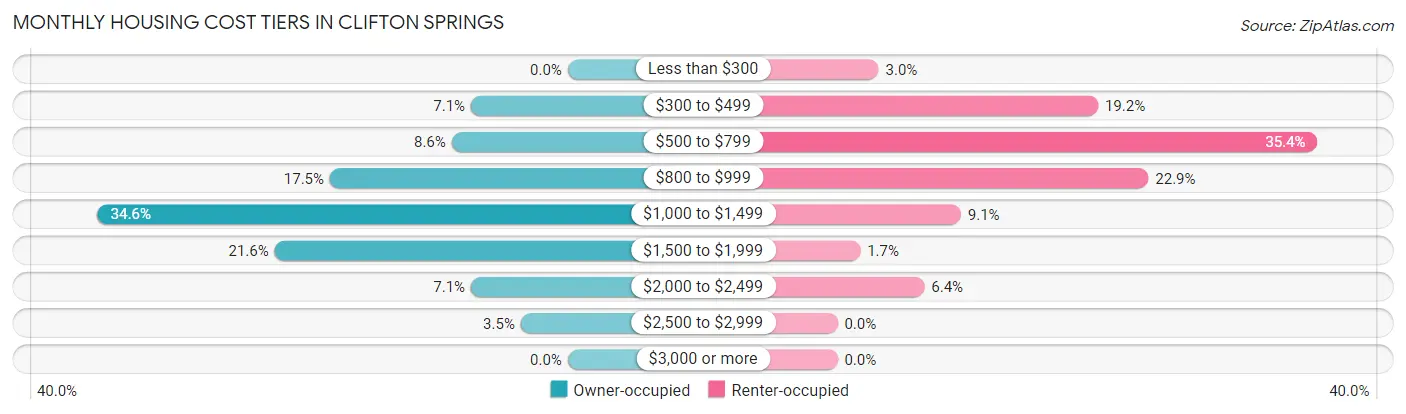
| Monthly Cost | Owner-occupied | Renter-occupied |
| Less than $300 | 0 (0.0%) | 9 (3.0%) |
| $300 to $499 | 35 (7.1%) | 57 (19.2%) |
| $500 to $799 | 42 (8.6%) | 105 (35.3%) |
| $800 to $999 | 86 (17.5%) | 68 (22.9%) |
| $1,000 to $1,499 | 170 (34.6%) | 27 (9.1%) |
| $1,500 to $1,999 | 106 (21.6%) | 5 (1.7%) |
| $2,000 to $2,499 | 35 (7.1%) | 19 (6.4%) |
| $2,500 to $2,999 | 17 (3.5%) | 0 (0.0%) |
| $3,000 or more | 0 (0.0%) | 0 (0.0%) |
| Total | 491 (100.0%) | 297 (100.0%) |
Physical Housing Characteristics in Clifton Springs
Housing Structures in Clifton Springs
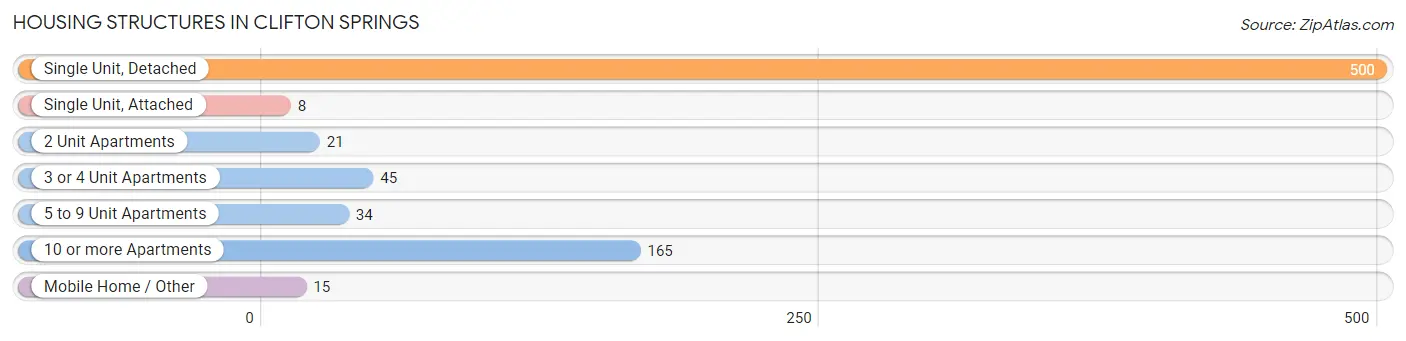
| Structure Type | # Housing Units | % Housing Units |
| Single Unit, Detached | 500 | 63.4% |
| Single Unit, Attached | 8 | 1.0% |
| 2 Unit Apartments | 21 | 2.7% |
| 3 or 4 Unit Apartments | 45 | 5.7% |
| 5 to 9 Unit Apartments | 34 | 4.3% |
| 10 or more Apartments | 165 | 20.9% |
| Mobile Home / Other | 15 | 1.9% |
| Total | 788 | 100.0% |
Housing Structures by Occupancy in Clifton Springs
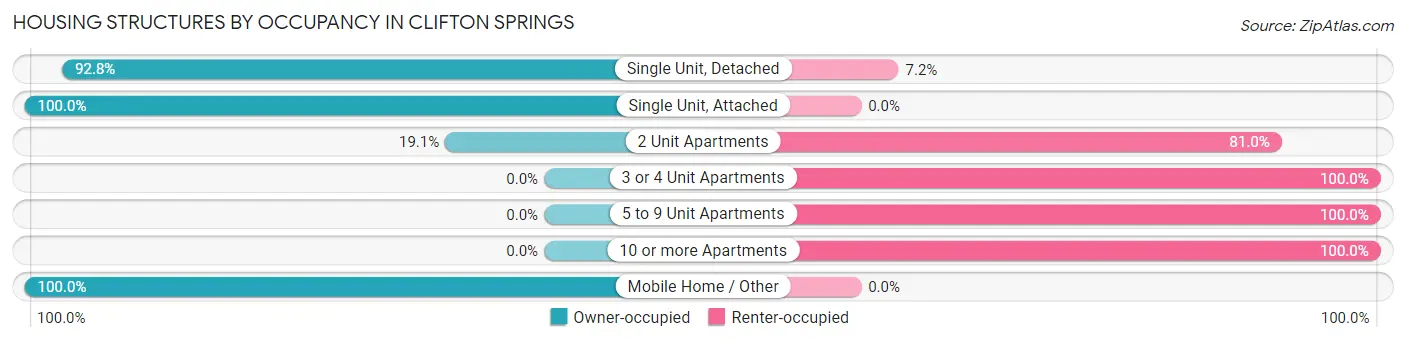
| Structure Type | Owner-occupied | Renter-occupied |
| Single Unit, Detached | 464 (92.8%) | 36 (7.2%) |
| Single Unit, Attached | 8 (100.0%) | 0 (0.0%) |
| 2 Unit Apartments | 4 (19.1%) | 17 (80.9%) |
| 3 or 4 Unit Apartments | 0 (0.0%) | 45 (100.0%) |
| 5 to 9 Unit Apartments | 0 (0.0%) | 34 (100.0%) |
| 10 or more Apartments | 0 (0.0%) | 165 (100.0%) |
| Mobile Home / Other | 15 (100.0%) | 0 (0.0%) |
| Total | 491 (62.3%) | 297 (37.7%) |
Housing Structures by Number of Rooms in Clifton Springs
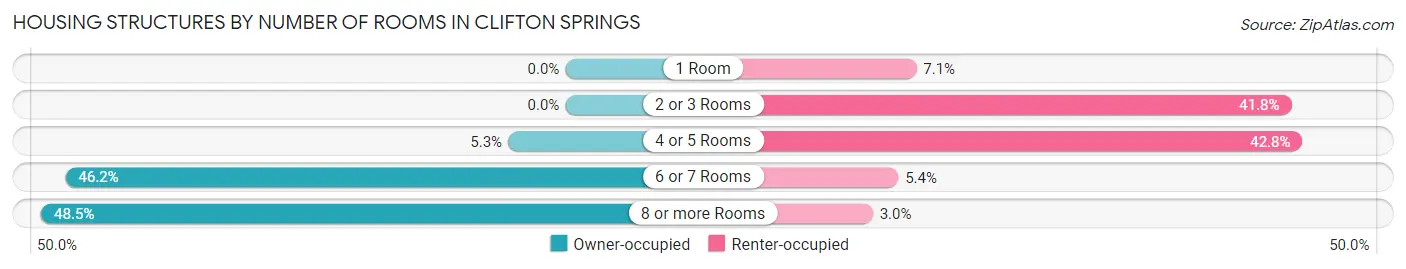
| Number of Rooms | Owner-occupied | Renter-occupied |
| 1 Room | 0 (0.0%) | 21 (7.1%) |
| 2 or 3 Rooms | 0 (0.0%) | 124 (41.7%) |
| 4 or 5 Rooms | 26 (5.3%) | 127 (42.8%) |
| 6 or 7 Rooms | 227 (46.2%) | 16 (5.4%) |
| 8 or more Rooms | 238 (48.5%) | 9 (3.0%) |
| Total | 491 (100.0%) | 297 (100.0%) |
Housing Structure by Heating Type in Clifton Springs
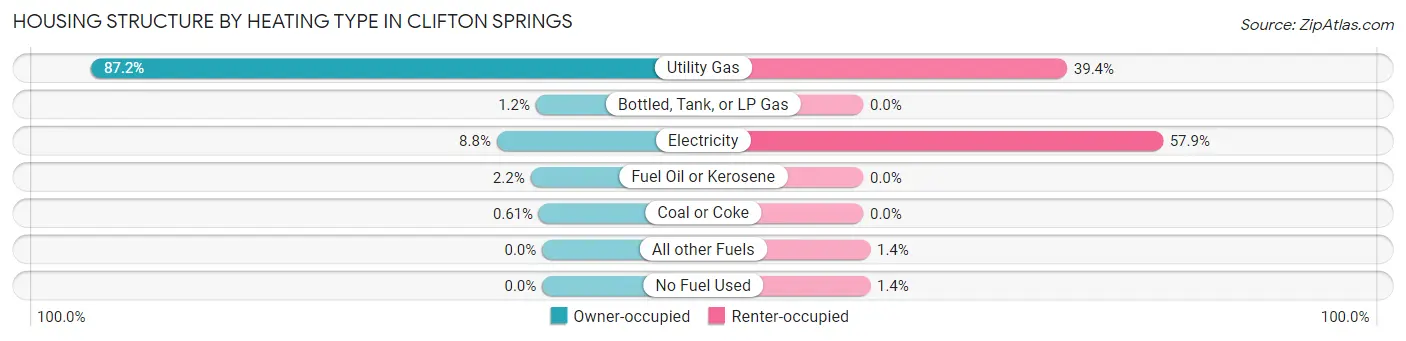
| Heating Type | Owner-occupied | Renter-occupied |
| Utility Gas | 428 (87.2%) | 117 (39.4%) |
| Bottled, Tank, or LP Gas | 6 (1.2%) | 0 (0.0%) |
| Electricity | 43 (8.8%) | 172 (57.9%) |
| Fuel Oil or Kerosene | 11 (2.2%) | 0 (0.0%) |
| Coal or Coke | 3 (0.6%) | 0 (0.0%) |
| All other Fuels | 0 (0.0%) | 4 (1.3%) |
| No Fuel Used | 0 (0.0%) | 4 (1.3%) |
| Total | 491 (100.0%) | 297 (100.0%) |
Household Vehicle Usage in Clifton Springs
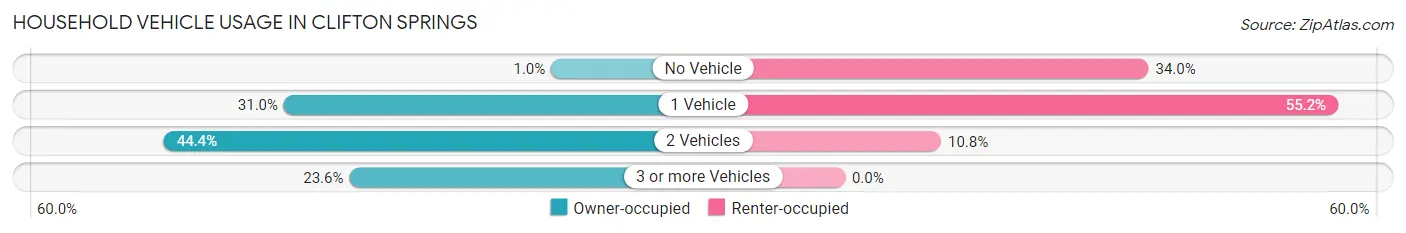
| Vehicles per Household | Owner-occupied | Renter-occupied |
| No Vehicle | 5 (1.0%) | 101 (34.0%) |
| 1 Vehicle | 152 (31.0%) | 164 (55.2%) |
| 2 Vehicles | 218 (44.4%) | 32 (10.8%) |
| 3 or more Vehicles | 116 (23.6%) | 0 (0.0%) |
| Total | 491 (100.0%) | 297 (100.0%) |
Real Estate & Mortgages in Clifton Springs
Real Estate and Mortgage Overview in Clifton Springs
| Characteristic | Without Mortgage | With Mortgage |
| Housing Units | 136 | 355 |
| Median Property Value | $168,000 | $154,300 |
| Median Household Income | $86,250 | $61 |
| Monthly Housing Costs | $772 | $0 |
| Real Estate Taxes | $3,731 | $3 |
Property Value by Mortgage Status in Clifton Springs
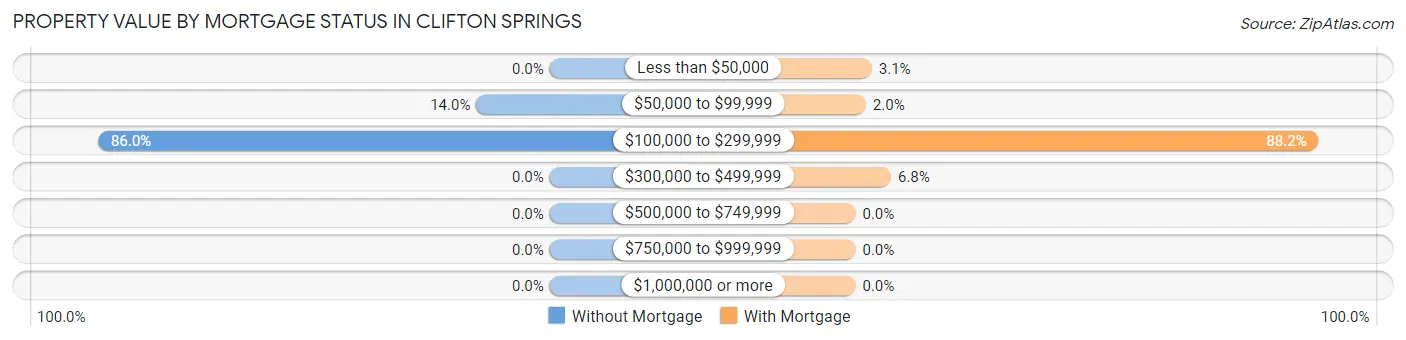
| Property Value | Without Mortgage | With Mortgage |
| Less than $50,000 | 0 (0.0%) | 11 (3.1%) |
| $50,000 to $99,999 | 19 (14.0%) | 7 (2.0%) |
| $100,000 to $299,999 | 117 (86.0%) | 313 (88.2%) |
| $300,000 to $499,999 | 0 (0.0%) | 24 (6.8%) |
| $500,000 to $749,999 | 0 (0.0%) | 0 (0.0%) |
| $750,000 to $999,999 | 0 (0.0%) | 0 (0.0%) |
| $1,000,000 or more | 0 (0.0%) | 0 (0.0%) |
| Total | 136 (100.0%) | 355 (100.0%) |
Household Income by Mortgage Status in Clifton Springs
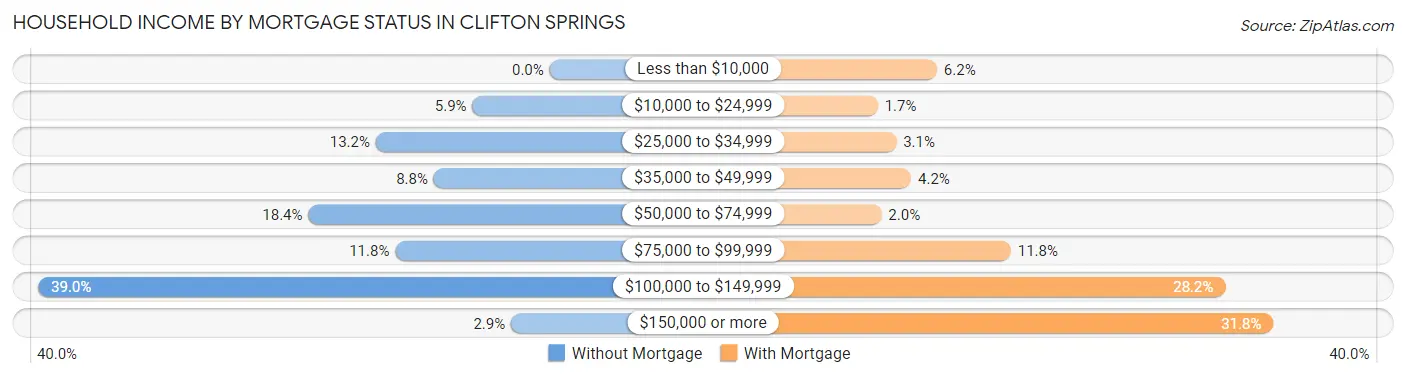
| Household Income | Without Mortgage | With Mortgage |
| Less than $10,000 | 0 (0.0%) | 22 (6.2%) |
| $10,000 to $24,999 | 8 (5.9%) | 6 (1.7%) |
| $25,000 to $34,999 | 18 (13.2%) | 11 (3.1%) |
| $35,000 to $49,999 | 12 (8.8%) | 15 (4.2%) |
| $50,000 to $74,999 | 25 (18.4%) | 7 (2.0%) |
| $75,000 to $99,999 | 16 (11.8%) | 42 (11.8%) |
| $100,000 to $149,999 | 53 (39.0%) | 100 (28.2%) |
| $150,000 or more | 4 (2.9%) | 113 (31.8%) |
| Total | 136 (100.0%) | 355 (100.0%) |
Property Value to Household Income Ratio in Clifton Springs
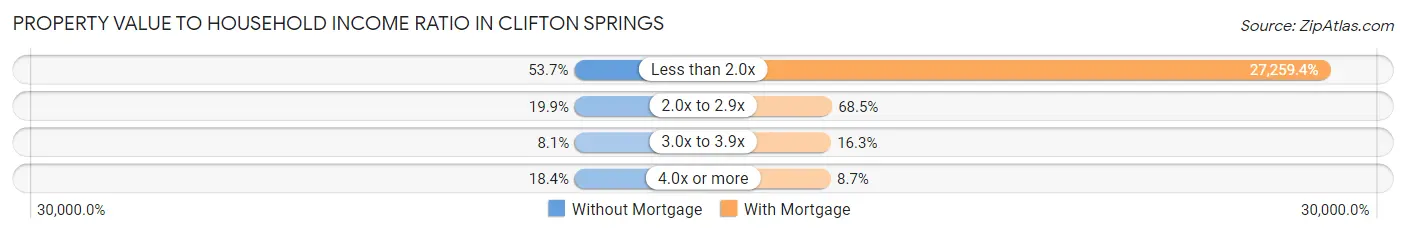
| Value-to-Income Ratio | Without Mortgage | With Mortgage |
| Less than 2.0x | 73 (53.7%) | 96,771 (27,259.4%) |
| 2.0x to 2.9x | 27 (19.9%) | 243 (68.4%) |
| 3.0x to 3.9x | 11 (8.1%) | 58 (16.3%) |
| 4.0x or more | 25 (18.4%) | 31 (8.7%) |
| Total | 136 (100.0%) | 355 (100.0%) |
Real Estate Taxes by Mortgage Status in Clifton Springs
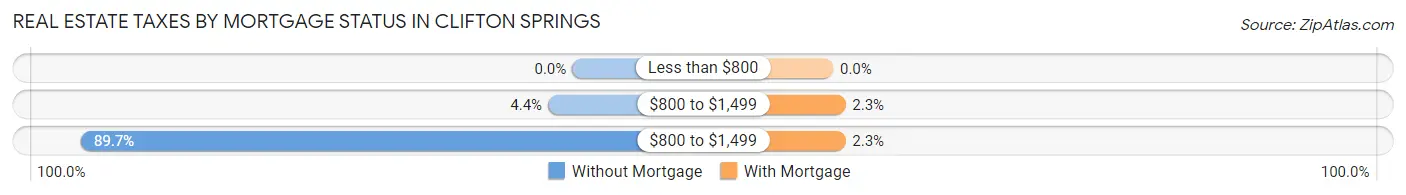
| Property Taxes | Without Mortgage | With Mortgage |
| Less than $800 | 0 (0.0%) | 0 (0.0%) |
| $800 to $1,499 | 6 (4.4%) | 8 (2.2%) |
| $800 to $1,499 | 122 (89.7%) | 8 (2.2%) |
| Total | 136 (100.0%) | 355 (100.0%) |
Health & Disability in Clifton Springs
Health Insurance Coverage by Age in Clifton Springs
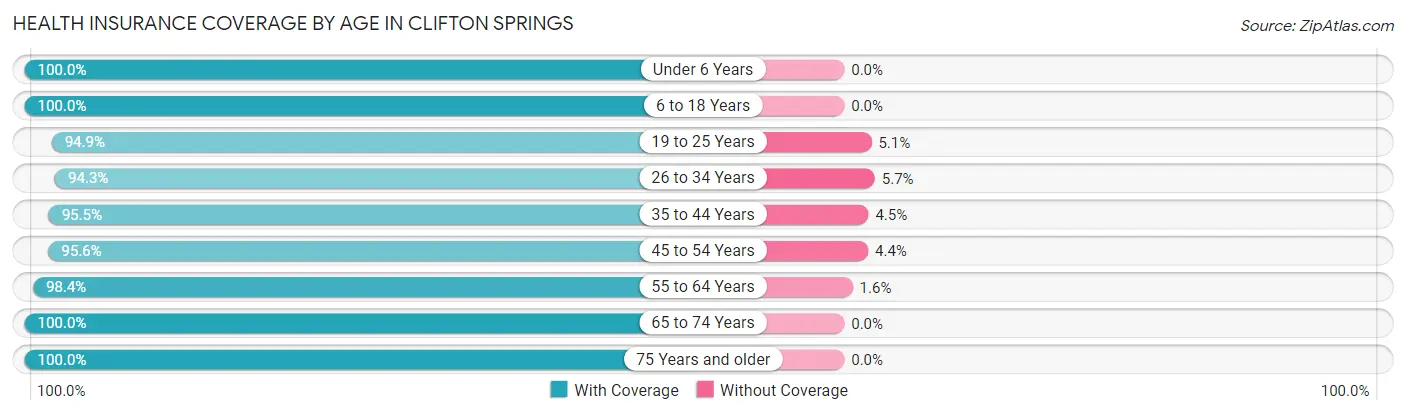
| Age Bracket | With Coverage | Without Coverage |
| Under 6 Years | 114 (100.0%) | 0 (0.0%) |
| 6 to 18 Years | 410 (100.0%) | 0 (0.0%) |
| 19 to 25 Years | 75 (94.9%) | 4 (5.1%) |
| 26 to 34 Years | 149 (94.3%) | 9 (5.7%) |
| 35 to 44 Years | 233 (95.5%) | 11 (4.5%) |
| 45 to 54 Years | 215 (95.6%) | 10 (4.4%) |
| 55 to 64 Years | 253 (98.4%) | 4 (1.6%) |
| 65 to 74 Years | 200 (100.0%) | 0 (0.0%) |
| 75 Years and older | 211 (100.0%) | 0 (0.0%) |
| Total | 1,860 (98.0%) | 38 (2.0%) |
Health Insurance Coverage by Citizenship Status in Clifton Springs
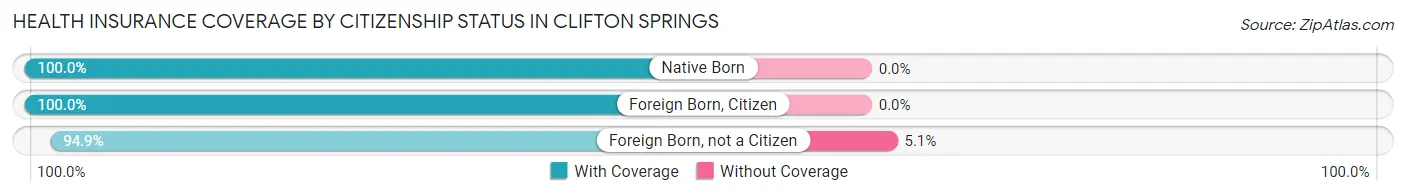
| Citizenship Status | With Coverage | Without Coverage |
| Native Born | 114 (100.0%) | 0 (0.0%) |
| Foreign Born, Citizen | 410 (100.0%) | 0 (0.0%) |
| Foreign Born, not a Citizen | 75 (94.9%) | 4 (5.1%) |
Health Insurance Coverage by Household Income in Clifton Springs
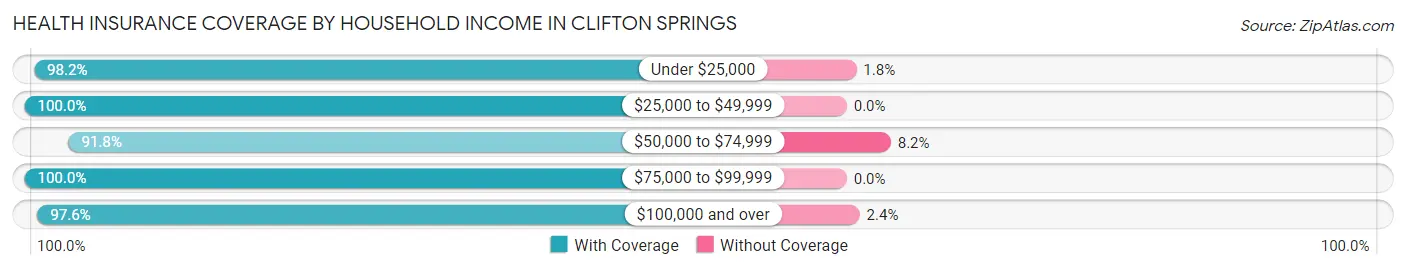
| Household Income | With Coverage | Without Coverage |
| Under $25,000 | 218 (98.2%) | 4 (1.8%) |
| $25,000 to $49,999 | 238 (100.0%) | 0 (0.0%) |
| $50,000 to $74,999 | 156 (91.8%) | 14 (8.2%) |
| $75,000 to $99,999 | 372 (100.0%) | 0 (0.0%) |
| $100,000 and over | 809 (97.6%) | 20 (2.4%) |
Public vs Private Health Insurance Coverage by Age in Clifton Springs
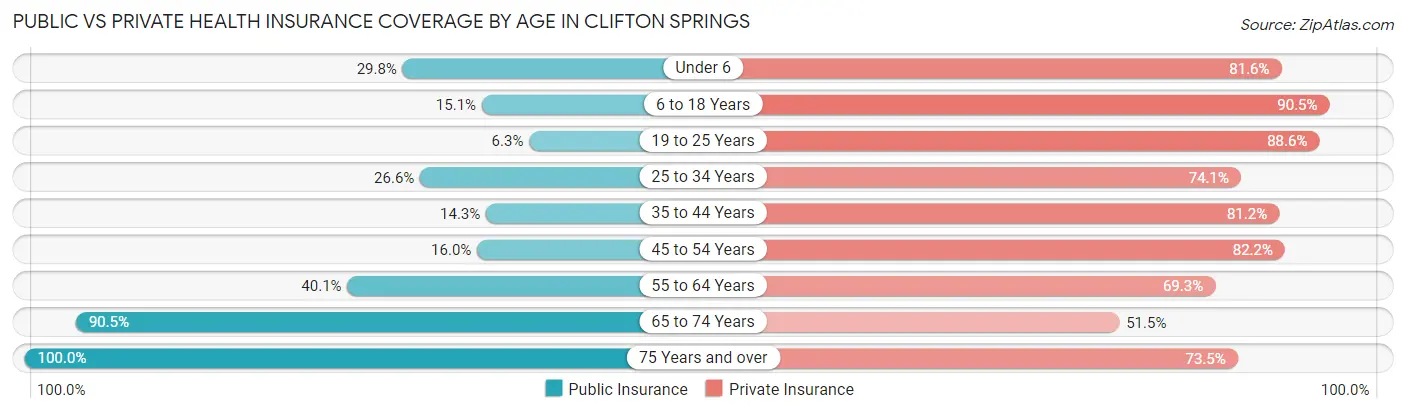
| Age Bracket | Public Insurance | Private Insurance |
| Under 6 | 34 (29.8%) | 93 (81.6%) |
| 6 to 18 Years | 62 (15.1%) | 371 (90.5%) |
| 19 to 25 Years | 5 (6.3%) | 70 (88.6%) |
| 25 to 34 Years | 42 (26.6%) | 117 (74.1%) |
| 35 to 44 Years | 35 (14.3%) | 198 (81.1%) |
| 45 to 54 Years | 36 (16.0%) | 185 (82.2%) |
| 55 to 64 Years | 103 (40.1%) | 178 (69.3%) |
| 65 to 74 Years | 181 (90.5%) | 103 (51.5%) |
| 75 Years and over | 211 (100.0%) | 155 (73.5%) |
| Total | 709 (37.4%) | 1,470 (77.4%) |
Disability Status by Sex by Age in Clifton Springs
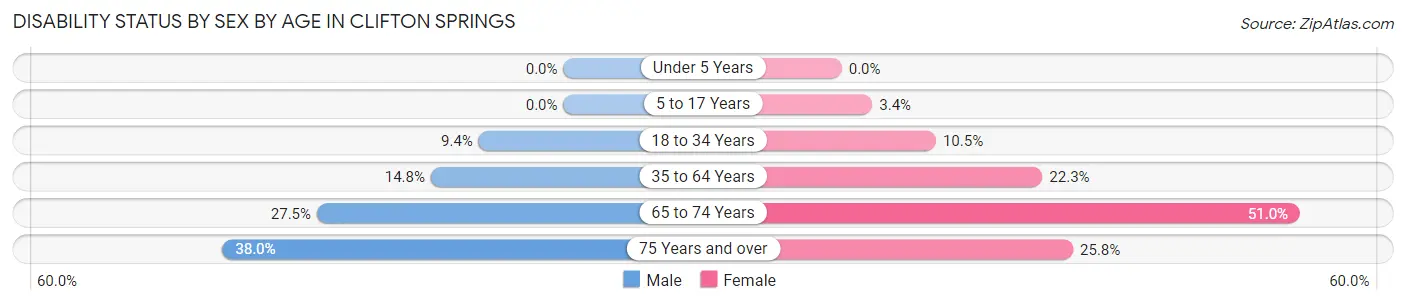
| Age Bracket | Male | Female |
| Under 5 Years | 0 (0.0%) | 0 (0.0%) |
| 5 to 17 Years | 0 (0.0%) | 8 (3.4%) |
| 18 to 34 Years | 10 (9.4%) | 17 (10.5%) |
| 35 to 64 Years | 49 (14.8%) | 88 (22.3%) |
| 65 to 74 Years | 28 (27.5%) | 50 (51.0%) |
| 75 Years and over | 30 (38.0%) | 34 (25.8%) |
Disability Class by Sex by Age in Clifton Springs
Disability Class: Hearing Difficulty
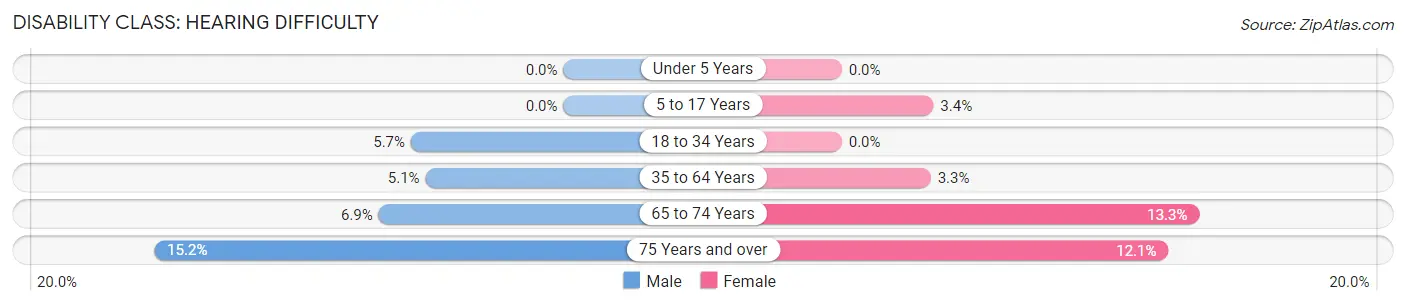
| Age Bracket | Male | Female |
| Under 5 Years | 0 (0.0%) | 0 (0.0%) |
| 5 to 17 Years | 0 (0.0%) | 8 (3.4%) |
| 18 to 34 Years | 6 (5.7%) | 0 (0.0%) |
| 35 to 64 Years | 17 (5.1%) | 13 (3.3%) |
| 65 to 74 Years | 7 (6.9%) | 13 (13.3%) |
| 75 Years and over | 12 (15.2%) | 16 (12.1%) |
Disability Class: Vision Difficulty
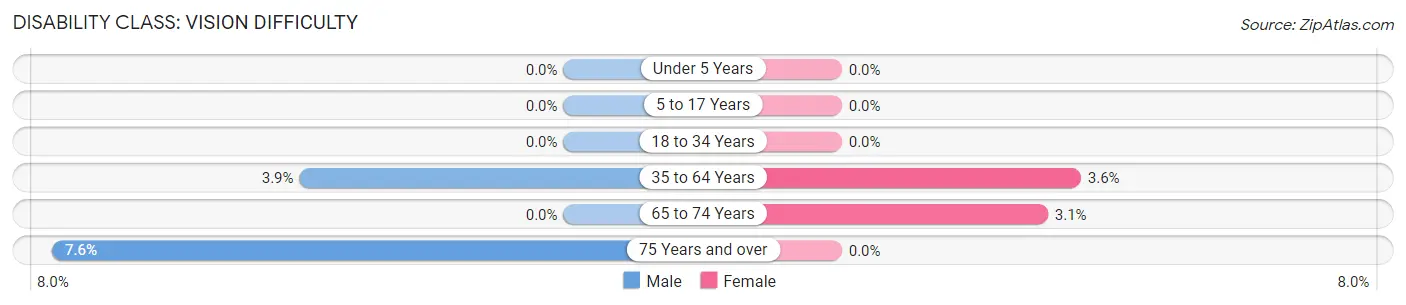
| Age Bracket | Male | Female |
| Under 5 Years | 0 (0.0%) | 0 (0.0%) |
| 5 to 17 Years | 0 (0.0%) | 0 (0.0%) |
| 18 to 34 Years | 0 (0.0%) | 0 (0.0%) |
| 35 to 64 Years | 13 (3.9%) | 14 (3.5%) |
| 65 to 74 Years | 0 (0.0%) | 3 (3.1%) |
| 75 Years and over | 6 (7.6%) | 0 (0.0%) |
Disability Class: Cognitive Difficulty
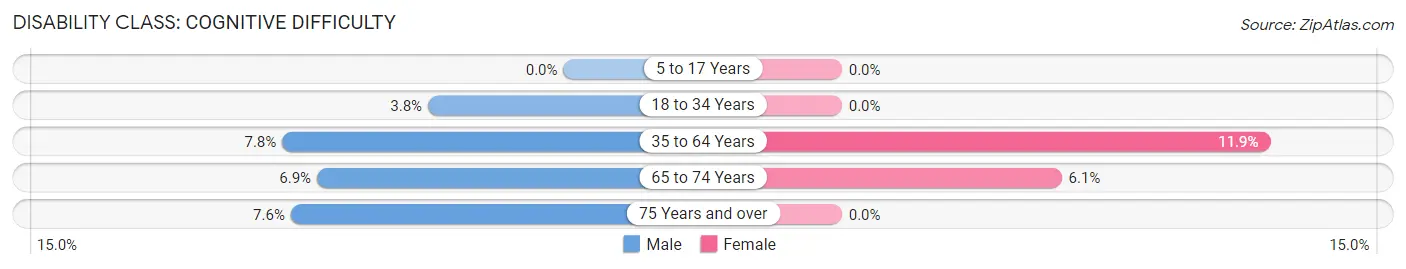
| Age Bracket | Male | Female |
| 5 to 17 Years | 0 (0.0%) | 0 (0.0%) |
| 18 to 34 Years | 4 (3.8%) | 0 (0.0%) |
| 35 to 64 Years | 26 (7.8%) | 47 (11.9%) |
| 65 to 74 Years | 7 (6.9%) | 6 (6.1%) |
| 75 Years and over | 6 (7.6%) | 0 (0.0%) |
Disability Class: Ambulatory Difficulty
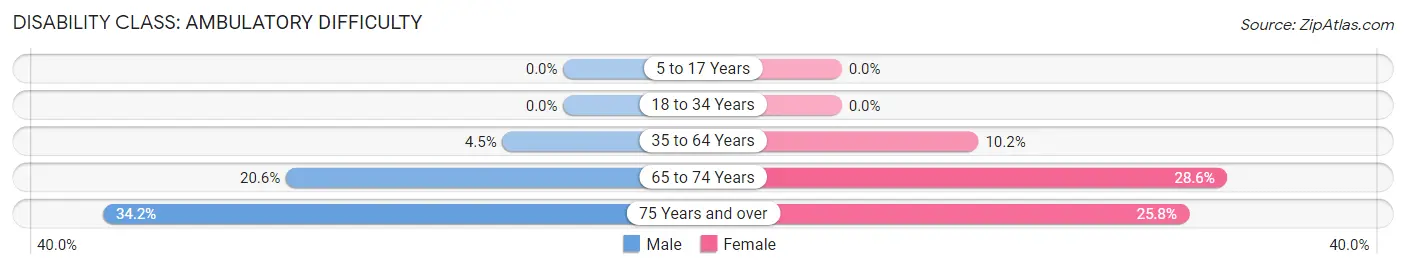
| Age Bracket | Male | Female |
| 5 to 17 Years | 0 (0.0%) | 0 (0.0%) |
| 18 to 34 Years | 0 (0.0%) | 0 (0.0%) |
| 35 to 64 Years | 15 (4.5%) | 40 (10.2%) |
| 65 to 74 Years | 21 (20.6%) | 28 (28.6%) |
| 75 Years and over | 27 (34.2%) | 34 (25.8%) |
Disability Class: Self-Care Difficulty
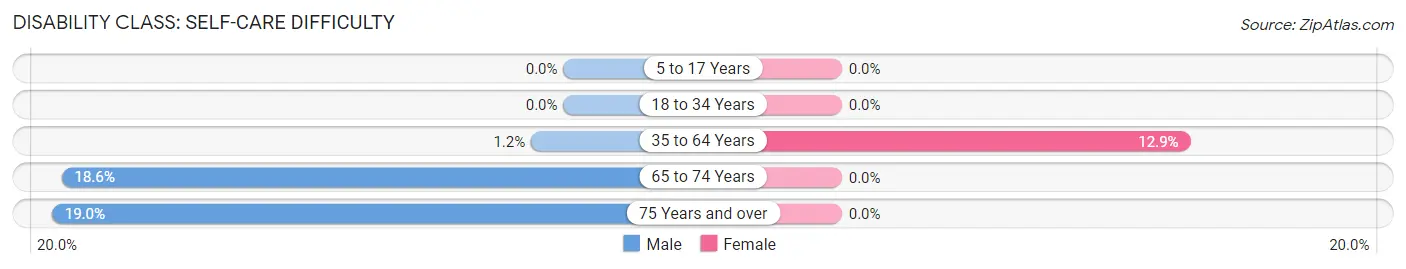
| Age Bracket | Male | Female |
| 5 to 17 Years | 0 (0.0%) | 0 (0.0%) |
| 18 to 34 Years | 0 (0.0%) | 0 (0.0%) |
| 35 to 64 Years | 4 (1.2%) | 51 (12.9%) |
| 65 to 74 Years | 19 (18.6%) | 0 (0.0%) |
| 75 Years and over | 15 (19.0%) | 0 (0.0%) |
Technology Access in Clifton Springs
Computing Device Access in Clifton Springs
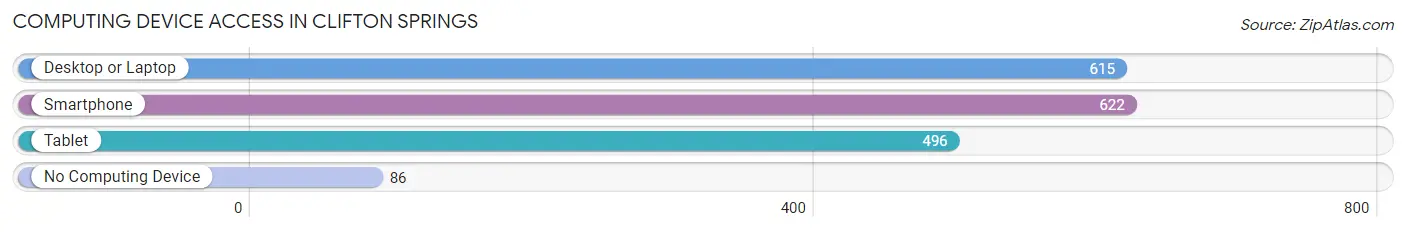
| Device Type | # Households | % Households |
| Desktop or Laptop | 615 | 78.0% |
| Smartphone | 622 | 78.9% |
| Tablet | 496 | 62.9% |
| No Computing Device | 86 | 10.9% |
| Total | 788 | 100.0% |
Internet Access in Clifton Springs
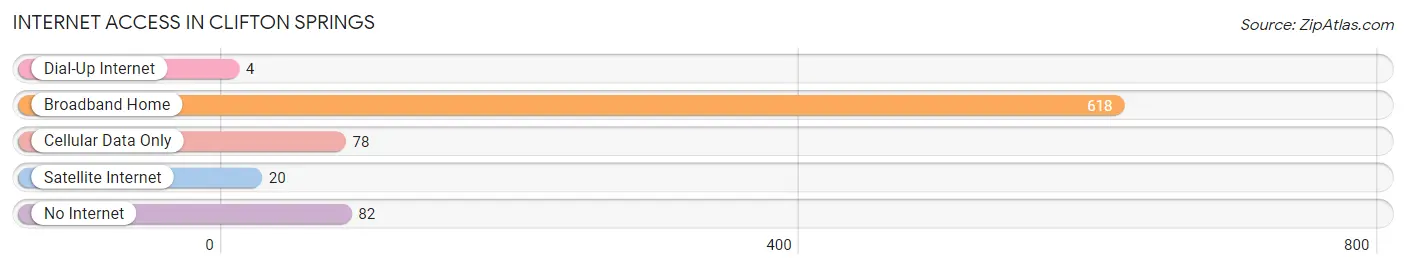
| Internet Type | # Households | % Households |
| Dial-Up Internet | 4 | 0.5% |
| Broadband Home | 618 | 78.4% |
| Cellular Data Only | 78 | 9.9% |
| Satellite Internet | 20 | 2.5% |
| No Internet | 82 | 10.4% |
| Total | 788 | 100.0% |
Clifton Springs Summary
Clifton Springs is a small village located in Ontario County, New York, United States. It is situated on the south shore of Canandaigua Lake, about 25 miles southeast of Rochester. The village is part of the Finger Lakes region and is known for its mineral springs and spa. The population was 2,945 at the 2010 census.
History
Clifton Springs was founded in 1803 by Dr. John Clarke, a physician from Philadelphia. He purchased the land from the Seneca Indians and built a log cabin on the site. He soon discovered the mineral springs and began to promote the area as a health resort. In 1845, the village was incorporated and named after the nearby Clifton Hill.
In the late 19th century, Clifton Springs became a popular destination for wealthy tourists. The village was home to several grand hotels, including the Clifton Springs Hotel and the Clifton Springs Sanitarium. The sanitarium was founded in 1876 and was one of the first medical facilities in the United States to use hydrotherapy.
Geography
Clifton Springs is located at 42°59'N 77°17'W (42.983, -77.283). According to the United States Census Bureau, the village has a total area of 1.2 square miles (3.1 km2), all of it land.
Economy
Clifton Springs is a small village with a limited economy. The village is home to several small businesses, including restaurants, shops, and a few professional services. The village is also home to the Clifton Springs Hospital and Clinic, which is a major employer in the area.
Demographics
As of the census of 2010, there were 2,945 people, 1,093 households, and 717 families residing in the village. The population density was 2,457.5 people per square mile (948.3/km2). There were 1,183 housing units at an average density of 983.3 per square mile (379.7/km2). The racial makeup of the village was 97.2% White, 0.7% African American, 0.2% Native American, 0.7% Asian, 0.1% Pacific Islander, 0.3% from other races, and 0.9% from two or more races. Hispanic or Latino of any race were 1.3% of the population.
There were 1,093 households, out of which 33.2% had children under the age of 18 living with them, 51.2% were married couples living together, 11.7% had a female householder with no husband present, and 32.7% were non-families. 27.2% of all households were made up of individuals, and 11.7% had someone living alone who was 65 years of age or older. The average household size was 2.50 and the average family size was 3.04.
In the village, the population was spread out, with 24.7% under the age of 18, 7.2% from 18 to 24, 28.2% from 25 to 44, 24.2% from 45 to 64, and 15.7% who were 65 years of age or older. The median age was 38 years. For every 100 females, there were 94.2 males. For every 100 females age 18 and over, there were 91.2 males.
The median income for a household in the village was $41,964, and the median income for a family was $50,000. Males had a median income of $35,000 versus $25,000 for females. The per capita income for the village was $20,845. About 5.2% of families and 8.2% of the population were below the poverty line, including 10.2% of those under age 18 and 5.2% of those age 65 or over.
Common Questions
What is Per Capita Income in Clifton Springs?
Per Capita income in Clifton Springs is $35,223.
What is the Median Family Income in Clifton Springs?
Median Family Income in Clifton Springs is $94,722.
What is the Median Household income in Clifton Springs?
Median Household Income in Clifton Springs is $67,500.
What is Income or Wage Gap in Clifton Springs?
Income or Wage Gap in Clifton Springs is 36.7%.
Women in Clifton Springs earn 63.3 cents for every dollar earned by a man.
What is Inequality or Gini Index in Clifton Springs?
Inequality or Gini Index in Clifton Springs is 0.48.
What is the Total Population of Clifton Springs?
Total Population of Clifton Springs is 2,042.
What is the Total Male Population of Clifton Springs?
Total Male Population of Clifton Springs is 897.
What is the Total Female Population of Clifton Springs?
Total Female Population of Clifton Springs is 1,145.
What is the Ratio of Males per 100 Females in Clifton Springs?
There are 78.34 Males per 100 Females in Clifton Springs.
What is the Ratio of Females per 100 Males in Clifton Springs?
There are 127.65 Females per 100 Males in Clifton Springs.
What is the Median Population Age in Clifton Springs?
Median Population Age in Clifton Springs is 45.3 Years.
What is the Average Family Size in Clifton Springs
Average Family Size in Clifton Springs is 3.2 People.
What is the Average Household Size in Clifton Springs
Average Household Size in Clifton Springs is 2.3 People.
How Large is the Labor Force in Clifton Springs?
There are 847 People in the Labor Forcein in Clifton Springs.
What is the Percentage of People in the Labor Force in Clifton Springs?
53.3% of People are in the Labor Force in Clifton Springs.
What is the Unemployment Rate in Clifton Springs?
Unemployment Rate in Clifton Springs is 4.8%.