North Gates, NY Map & Demographics
North Gates Map
North Gates Overview
$35,789
PER CAPITA INCOME
$84,767
AVG FAMILY INCOME
$70,482
AVG HOUSEHOLD INCOME
6.5%
WAGE / INCOME GAP [ % ]
93.5¢/ $1
WAGE / INCOME GAP [ $ ]
0.38
INEQUALITY / GINI INDEX
10,138
TOTAL POPULATION
5,156
MALE POPULATION
4,982
FEMALE POPULATION
103.49
MALES / 100 FEMALES
96.63
FEMALES / 100 MALES
40.0
MEDIAN AGE
2.9
AVG FAMILY SIZE
2.3
AVG HOUSEHOLD SIZE
5,774
LABOR FORCE [ PEOPLE ]
67.1%
PERCENT IN LABOR FORCE
3.0%
UNEMPLOYMENT RATE
Income in North Gates
Income Overview in North Gates
Per Capita Income in North Gates is $35,789, while median incomes of families and households are $84,767 and $70,482 respectively.
| Characteristic | Number | Measure |
| Per Capita Income | 10,138 | $35,789 |
| Median Family Income | 2,656 | $84,767 |
| Mean Family Income | 2,656 | $98,081 |
| Median Household Income | 4,338 | $70,482 |
| Mean Household Income | 4,338 | $81,619 |
| Income Deficit | 2,656 | $0 |
| Wage / Income Gap (%) | 10,138 | 6.50% |
| Wage / Income Gap ($) | 10,138 | 93.50¢ per $1 |
| Gini / Inequality Index | 10,138 | 0.38 |
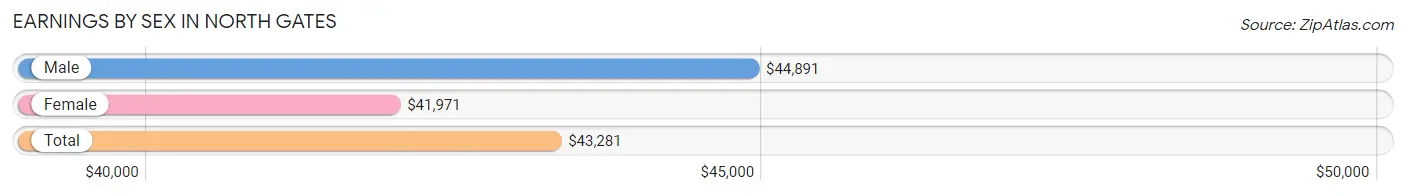
Earnings by Sex in North Gates
Average Earnings in North Gates are $43,281, $44,891 for men and $41,971 for women, a difference of 6.5%.
| Sex | Number | Average Earnings |
| Male | 3,123 (53.2%) | $44,891 |
| Female | 2,743 (46.8%) | $41,971 |
| Total | 5,866 (100.0%) | $43,281 |
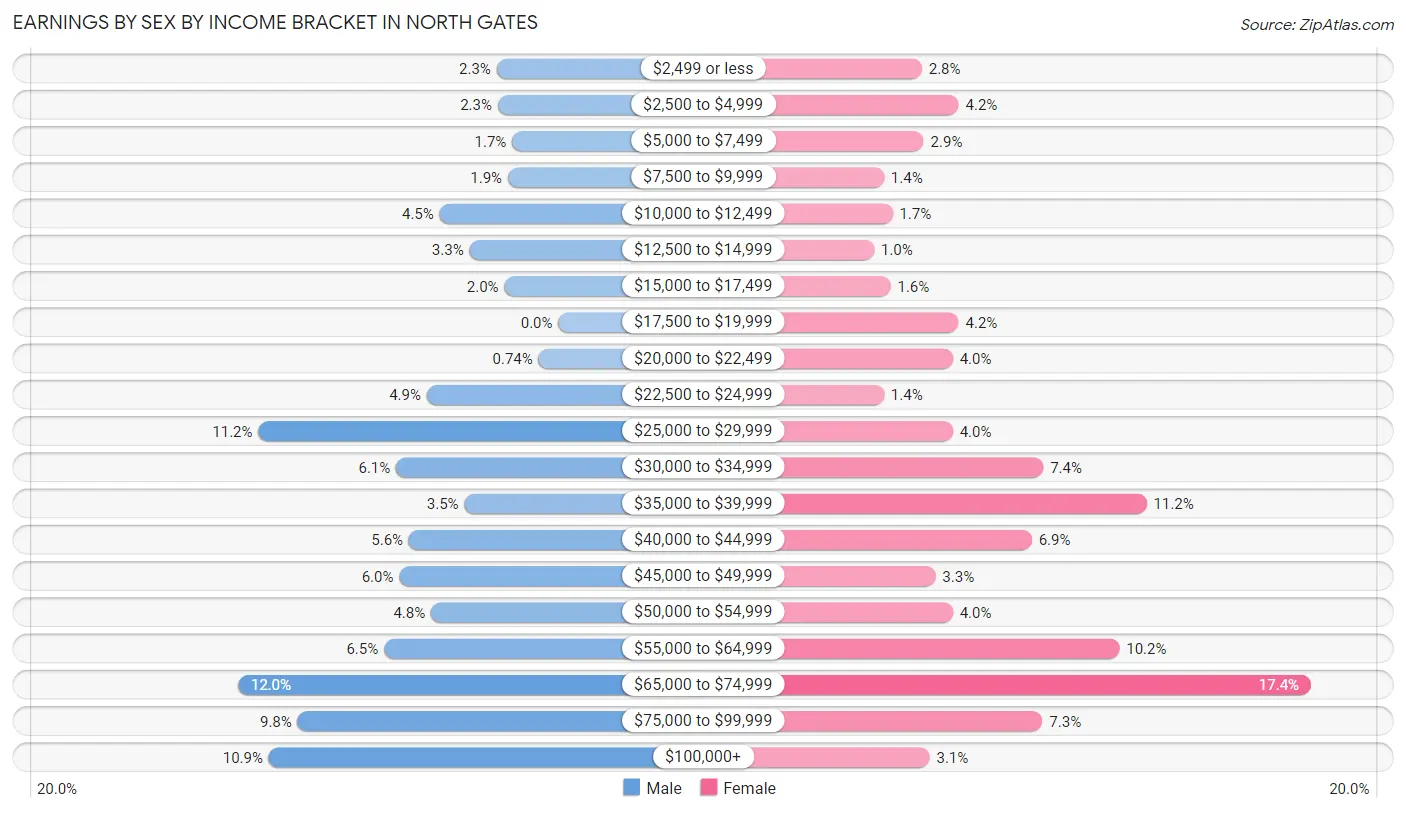
Earnings by Sex by Income Bracket in North Gates
The most common earnings brackets in North Gates are $65,000 to $74,999 for men (375 | 12.0%) and $65,000 to $74,999 for women (477 | 17.4%).
| Income | Male | Female |
| $2,499 or less | 72 (2.3%) | 77 (2.8%) |
| $2,500 to $4,999 | 71 (2.3%) | 115 (4.2%) |
| $5,000 to $7,499 | 54 (1.7%) | 79 (2.9%) |
| $7,500 to $9,999 | 59 (1.9%) | 38 (1.4%) |
| $10,000 to $12,499 | 139 (4.4%) | 47 (1.7%) |
| $12,500 to $14,999 | 104 (3.3%) | 28 (1.0%) |
| $15,000 to $17,499 | 63 (2.0%) | 45 (1.6%) |
| $17,500 to $19,999 | 0 (0.0%) | 115 (4.2%) |
| $20,000 to $22,499 | 23 (0.7%) | 109 (4.0%) |
| $22,500 to $24,999 | 154 (4.9%) | 38 (1.4%) |
| $25,000 to $29,999 | 351 (11.2%) | 109 (4.0%) |
| $30,000 to $34,999 | 190 (6.1%) | 202 (7.4%) |
| $35,000 to $39,999 | 110 (3.5%) | 308 (11.2%) |
| $40,000 to $44,999 | 175 (5.6%) | 190 (6.9%) |
| $45,000 to $49,999 | 186 (6.0%) | 91 (3.3%) |
| $50,000 to $54,999 | 149 (4.8%) | 109 (4.0%) |
| $55,000 to $64,999 | 204 (6.5%) | 280 (10.2%) |
| $65,000 to $74,999 | 375 (12.0%) | 477 (17.4%) |
| $75,000 to $99,999 | 305 (9.8%) | 201 (7.3%) |
| $100,000+ | 339 (10.8%) | 85 (3.1%) |
| Total | 3,123 (100.0%) | 2,743 (100.0%) |
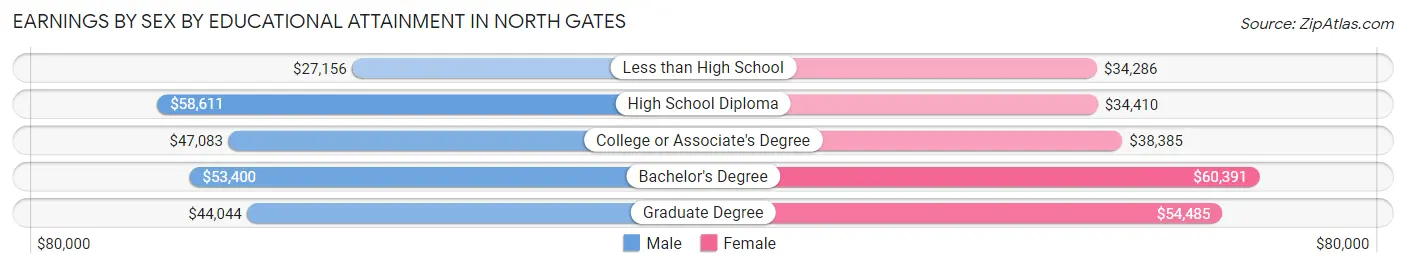
Earnings by Sex by Educational Attainment in North Gates
Average earnings in North Gates are $49,167 for men and $43,382 for women, a difference of 11.8%. Men with an educational attainment of high school diploma enjoy the highest average annual earnings of $58,611, while those with less than high school education earn the least with $27,156. Women with an educational attainment of bachelor's degree earn the most with the average annual earnings of $60,391, while those with less than high school education have the smallest earnings of $34,286.
| Educational Attainment | Male Income | Female Income |
| Less than High School | $27,156 | $34,286 |
| High School Diploma | $58,611 | $34,410 |
| College or Associate's Degree | $47,083 | $38,385 |
| Bachelor's Degree | $53,400 | $60,391 |
| Graduate Degree | $44,044 | $54,485 |
| Total | $49,167 | $43,382 |
Family Income in North Gates
Family Income Brackets in North Gates
According to the North Gates family income data, there are 725 families falling into the $50,000 to $74,999 income range, which is the most common income bracket and makes up 27.3% of all families. Conversely, the $10,000 to $14,999 income bracket is the least frequent group with only 13 families (0.5%) belonging to this category.
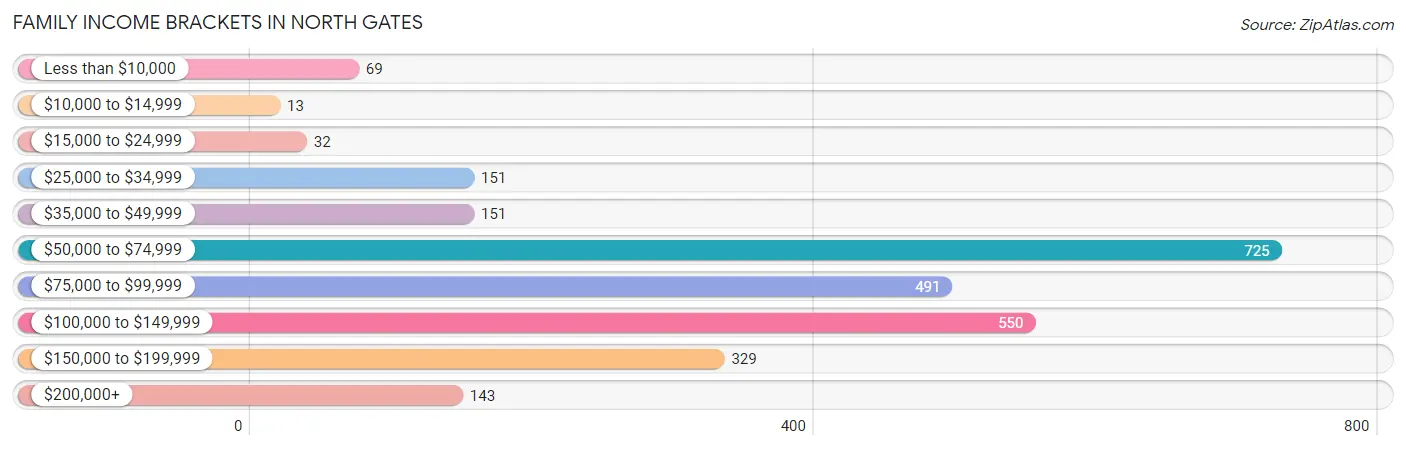
| Income Bracket | # Families | % Families |
| Less than $10,000 | 69 | 2.6% |
| $10,000 to $14,999 | 13 | 0.5% |
| $15,000 to $24,999 | 32 | 1.2% |
| $25,000 to $34,999 | 151 | 5.7% |
| $35,000 to $49,999 | 151 | 5.7% |
| $50,000 to $74,999 | 725 | 27.3% |
| $75,000 to $99,999 | 491 | 18.5% |
| $100,000 to $149,999 | 550 | 20.7% |
| $150,000 to $199,999 | 329 | 12.4% |
| $200,000+ | 143 | 5.4% |
Family Income by Famaliy Size in North Gates
5-person families (106 | 4.0%) account for the highest median family income in North Gates with $117,212 per family, while 2-person families (1,368 | 51.5%) have the highest median income of $41,344 per family member.
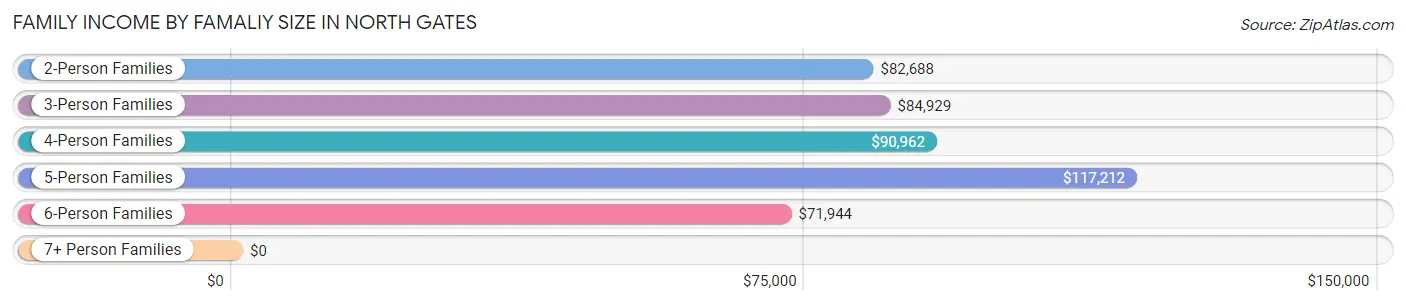
| Income Bracket | # Families | Median Income |
| 2-Person Families | 1,368 (51.5%) | $82,688 |
| 3-Person Families | 808 (30.4%) | $84,929 |
| 4-Person Families | 240 (9.0%) | $90,962 |
| 5-Person Families | 106 (4.0%) | $117,212 |
| 6-Person Families | 134 (5.1%) | $71,944 |
| 7+ Person Families | 0 (0.0%) | $0 |
| Total | 2,656 (100.0%) | $84,767 |
Family Income by Number of Earners in North Gates
The median family income in North Gates is $84,767, with families comprising 3+ earners (339) having the highest median family income of $137,604, while families with no earners (402) have the lowest median family income of $52,917, accounting for 12.8% and 15.1% of families, respectively.
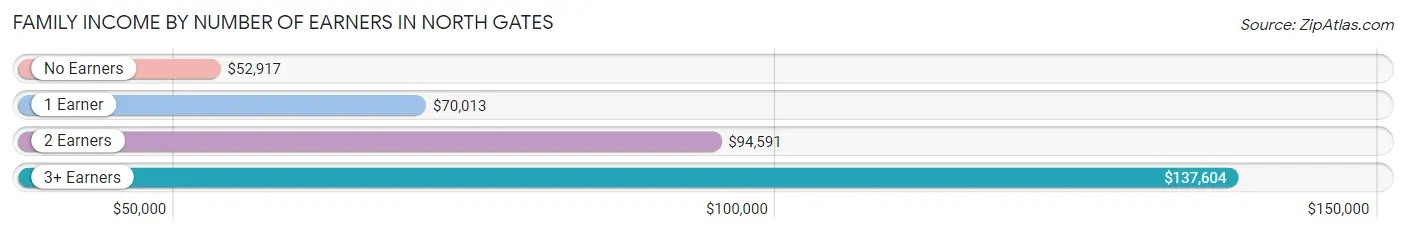
| Number of Earners | # Families | Median Income |
| No Earners | 402 (15.1%) | $52,917 |
| 1 Earner | 937 (35.3%) | $70,013 |
| 2 Earners | 978 (36.8%) | $94,591 |
| 3+ Earners | 339 (12.8%) | $137,604 |
| Total | 2,656 (100.0%) | $84,767 |
Household Income in North Gates
Household Income Brackets in North Gates
With 946 households falling in the category, the $50,000 to $74,999 income range is the most frequent in North Gates, accounting for 21.8% of all households. In contrast, only 117 households (2.7%) fall into the $10,000 to $14,999 income bracket, making it the least populous group.
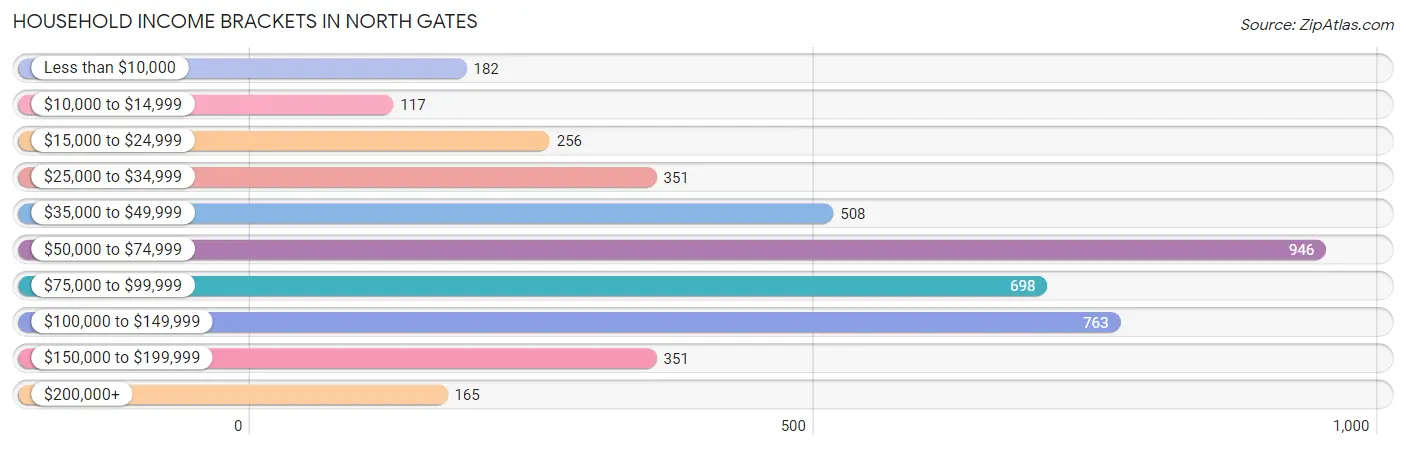
| Income Bracket | # Households | % Households |
| Less than $10,000 | 182 | 4.2% |
| $10,000 to $14,999 | 117 | 2.7% |
| $15,000 to $24,999 | 256 | 5.9% |
| $25,000 to $34,999 | 351 | 8.1% |
| $35,000 to $49,999 | 508 | 11.7% |
| $50,000 to $74,999 | 946 | 21.8% |
| $75,000 to $99,999 | 698 | 16.1% |
| $100,000 to $149,999 | 763 | 17.6% |
| $150,000 to $199,999 | 351 | 8.1% |
| $200,000+ | 165 | 3.8% |
Household Income by Householder Age in North Gates
The median household income in North Gates is $70,482, with the highest median household income of $83,906 found in the 25 to 44 years age bracket for the primary householder. A total of 1,215 households (28.0%) fall into this category. Meanwhile, the 65+ years age bracket for the primary householder has the lowest median household income of $39,464, with 1,302 households (30.0%) in this group.
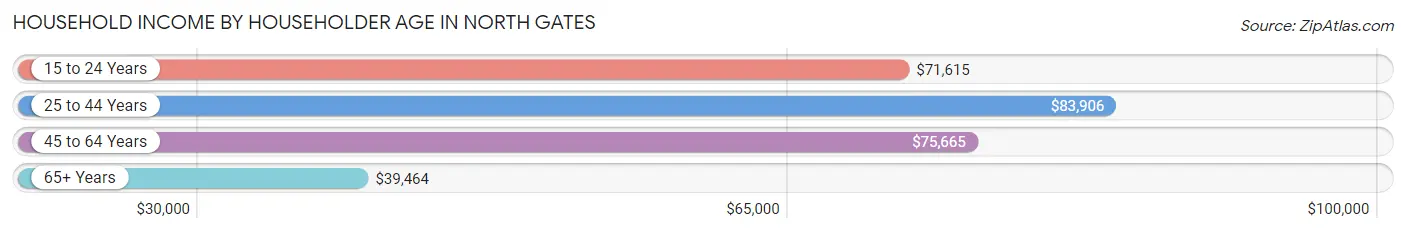
| Income Bracket | # Households | Median Income |
| 15 to 24 Years | 261 (6.0%) | $71,615 |
| 25 to 44 Years | 1,215 (28.0%) | $83,906 |
| 45 to 64 Years | 1,560 (36.0%) | $75,665 |
| 65+ Years | 1,302 (30.0%) | $39,464 |
| Total | 4,338 (100.0%) | $70,482 |
Poverty in North Gates
Income Below Poverty by Sex and Age in North Gates
With 6.4% poverty level for males and 6.1% for females among the residents of North Gates, 65 to 74 year old males and 75 year old and over females are the most vulnerable to poverty, with 92 males (21.2%) and 69 females (17.7%) in their respective age groups living below the poverty level.
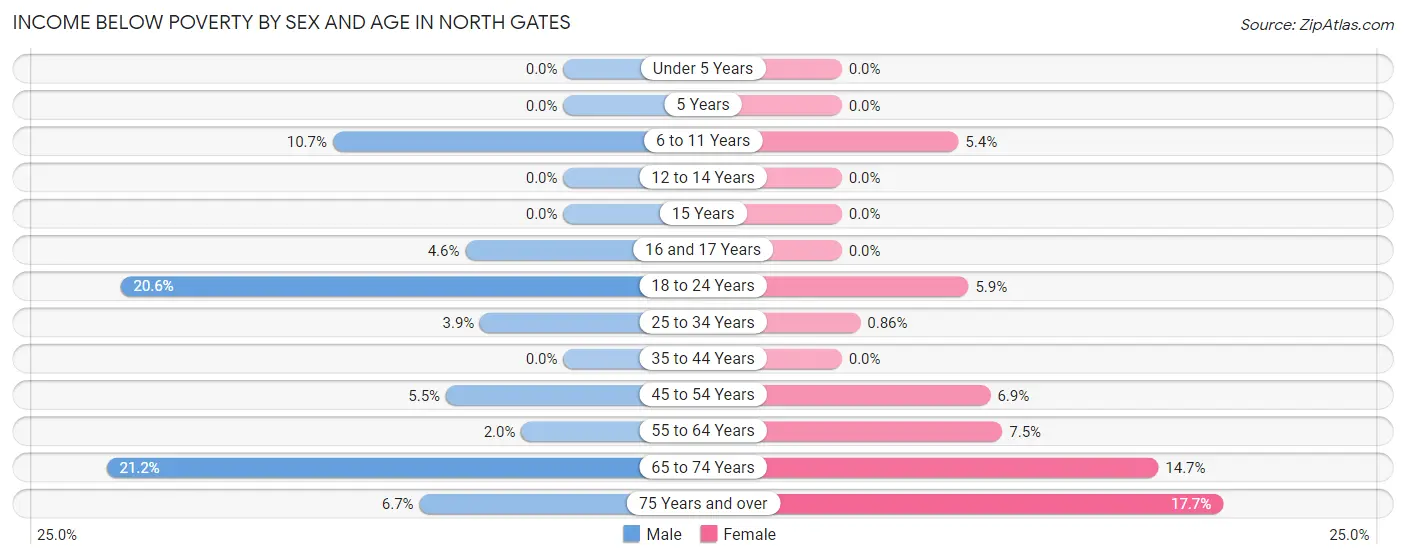
| Age Bracket | Male | Female |
| Under 5 Years | 0 (0.0%) | 0 (0.0%) |
| 5 Years | 0 (0.0%) | 0 (0.0%) |
| 6 to 11 Years | 23 (10.7%) | 21 (5.4%) |
| 12 to 14 Years | 0 (0.0%) | 0 (0.0%) |
| 15 Years | 0 (0.0%) | 0 (0.0%) |
| 16 and 17 Years | 6 (4.5%) | 0 (0.0%) |
| 18 to 24 Years | 82 (20.5%) | 31 (5.9%) |
| 25 to 34 Years | 42 (3.9%) | 7 (0.9%) |
| 35 to 44 Years | 0 (0.0%) | 0 (0.0%) |
| 45 to 54 Years | 44 (5.4%) | 45 (6.9%) |
| 55 to 64 Years | 11 (1.9%) | 50 (7.4%) |
| 65 to 74 Years | 92 (21.2%) | 83 (14.7%) |
| 75 Years and over | 26 (6.7%) | 69 (17.7%) |
| Total | 326 (6.4%) | 306 (6.1%) |
Income Above Poverty by Sex and Age in North Gates
According to the poverty statistics in North Gates, males aged under 5 years and females aged under 5 years are the age groups that are most secure financially, with 100.0% of males and 100.0% of females in these age groups living above the poverty line.
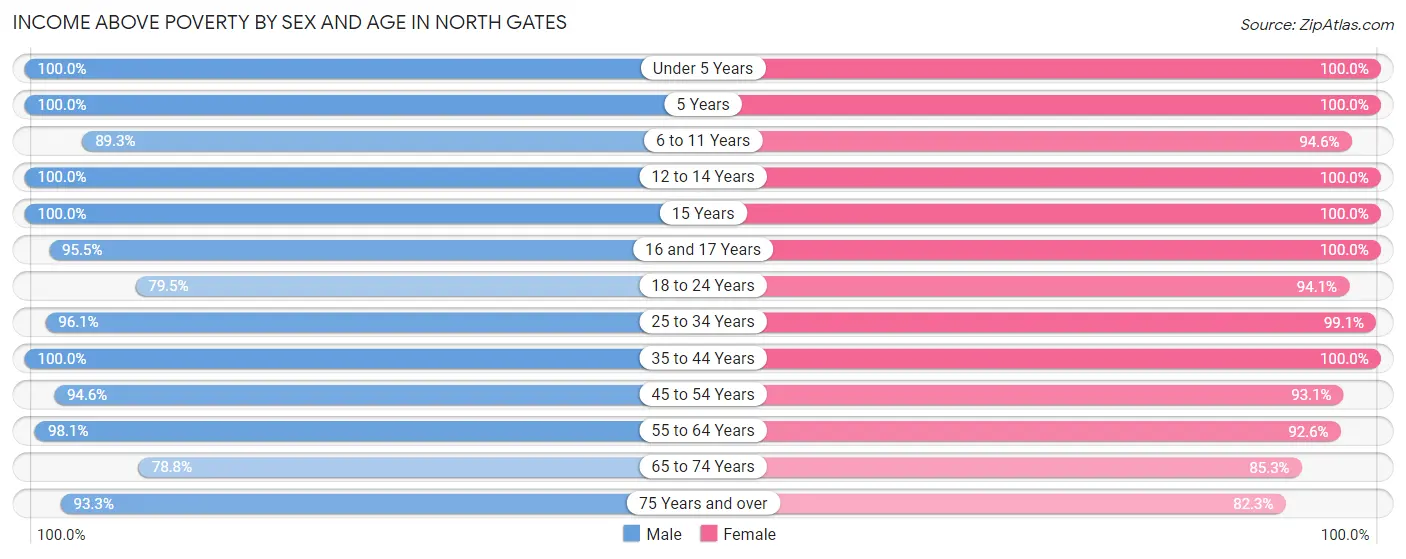
| Age Bracket | Male | Female |
| Under 5 Years | 283 (100.0%) | 265 (100.0%) |
| 5 Years | 75 (100.0%) | 21 (100.0%) |
| 6 to 11 Years | 192 (89.3%) | 367 (94.6%) |
| 12 to 14 Years | 87 (100.0%) | 54 (100.0%) |
| 15 Years | 85 (100.0%) | 32 (100.0%) |
| 16 and 17 Years | 126 (95.5%) | 103 (100.0%) |
| 18 to 24 Years | 317 (79.4%) | 496 (94.1%) |
| 25 to 34 Years | 1,046 (96.1%) | 804 (99.1%) |
| 35 to 44 Years | 566 (100.0%) | 501 (100.0%) |
| 45 to 54 Years | 764 (94.6%) | 607 (93.1%) |
| 55 to 64 Years | 554 (98.1%) | 621 (92.5%) |
| 65 to 74 Years | 342 (78.8%) | 482 (85.3%) |
| 75 Years and over | 363 (93.3%) | 321 (82.3%) |
| Total | 4,800 (93.6%) | 4,674 (93.9%) |
Income Below Poverty Among Married-Couple Families in North Gates
The poverty statistics for married-couple families in North Gates show that 3.6% or 64 of the total 1,752 families live below the poverty line. Families with no children have the highest poverty rate of 5.3%, comprising of 64 families. On the other hand, families with 1 or 2 children have the lowest poverty rate of 0.0%, which includes 0 families.
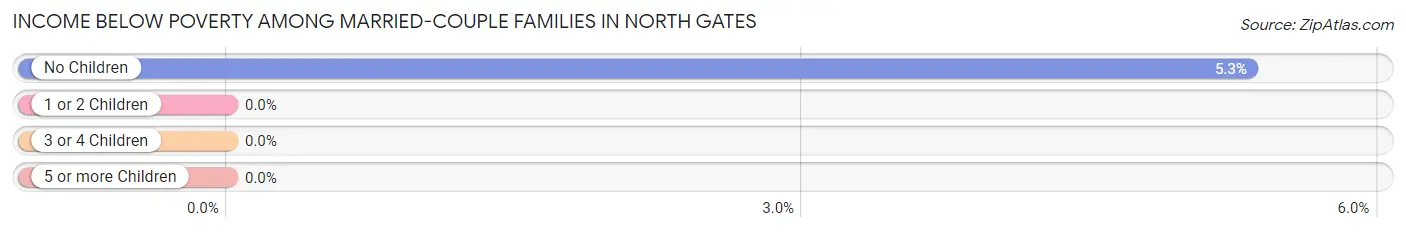
| Children | Above Poverty | Below Poverty |
| No Children | 1,136 (94.7%) | 64 (5.3%) |
| 1 or 2 Children | 482 (100.0%) | 0 (0.0%) |
| 3 or 4 Children | 70 (100.0%) | 0 (0.0%) |
| 5 or more Children | 0 (0.0%) | 0 (0.0%) |
| Total | 1,688 (96.4%) | 64 (3.6%) |
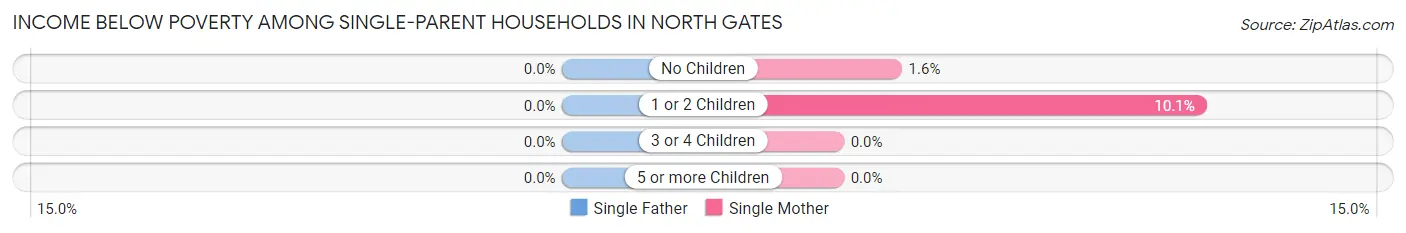
Income Below Poverty Among Single-Parent Households in North Gates
| Children | Single Father | Single Mother |
| No Children | 0 (0.0%) | 5 (1.6%) |
| 1 or 2 Children | 0 (0.0%) | 21 (10.1%) |
| 3 or 4 Children | 0 (0.0%) | 0 (0.0%) |
| 5 or more Children | 0 (0.0%) | 0 (0.0%) |
| Total | 0 (0.0%) | 26 (4.3%) |
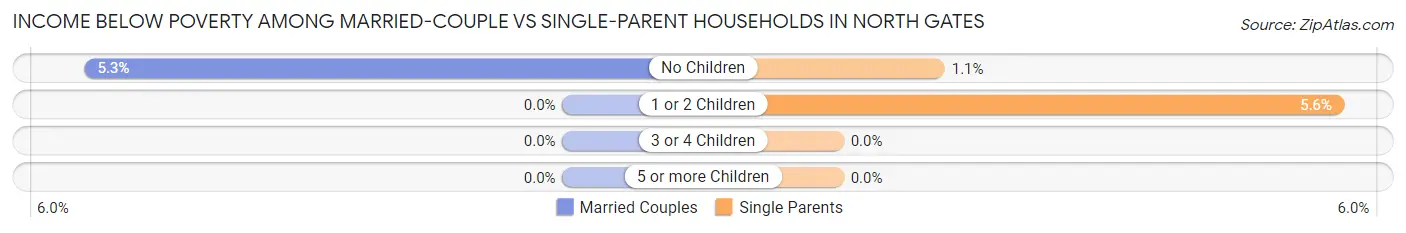
Income Below Poverty Among Married-Couple vs Single-Parent Households in North Gates
The poverty data for North Gates shows that 64 of the married-couple family households (3.6%) and 26 of the single-parent households (2.9%) are living below the poverty level. Within the married-couple family households, those with no children have the highest poverty rate, with 64 households (5.3%) falling below the poverty line. Among the single-parent households, those with 1 or 2 children have the highest poverty rate, with 21 household (5.6%) living below poverty.
| Children | Married-Couple Families | Single-Parent Households |
| No Children | 64 (5.3%) | 5 (1.1%) |
| 1 or 2 Children | 0 (0.0%) | 21 (5.6%) |
| 3 or 4 Children | 0 (0.0%) | 0 (0.0%) |
| 5 or more Children | 0 (0.0%) | 0 (0.0%) |
| Total | 64 (3.6%) | 26 (2.9%) |
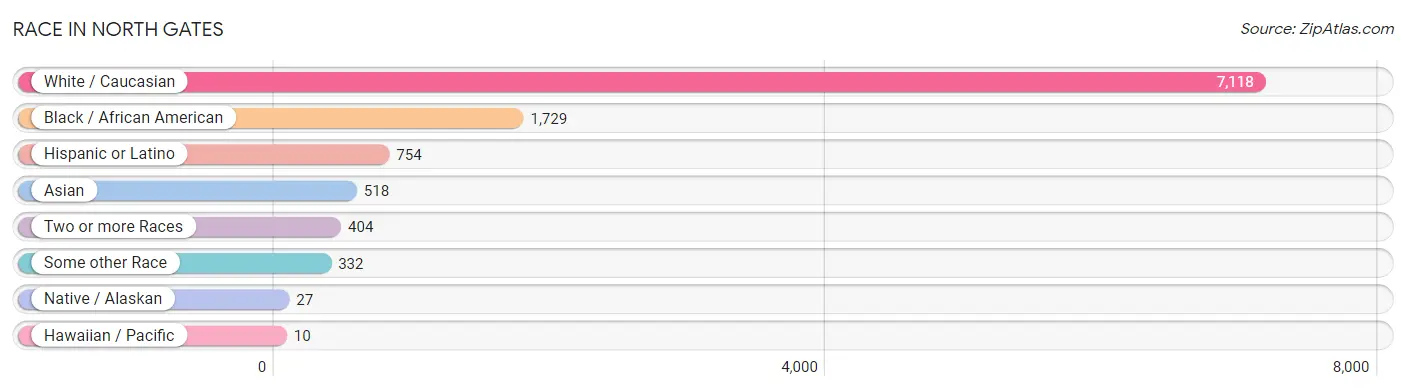
Race in North Gates
The most populous races in North Gates are White / Caucasian (7,118 | 70.2%), Black / African American (1,729 | 17.1%), and Hispanic or Latino (754 | 7.4%).
| Race | # Population | % Population |
| Asian | 518 | 5.1% |
| Black / African American | 1,729 | 17.1% |
| Hawaiian / Pacific | 10 | 0.1% |
| Hispanic or Latino | 754 | 7.4% |
| Native / Alaskan | 27 | 0.3% |
| White / Caucasian | 7,118 | 70.2% |
| Two or more Races | 404 | 4.0% |
| Some other Race | 332 | 3.3% |
| Total | 10,138 | 100.0% |
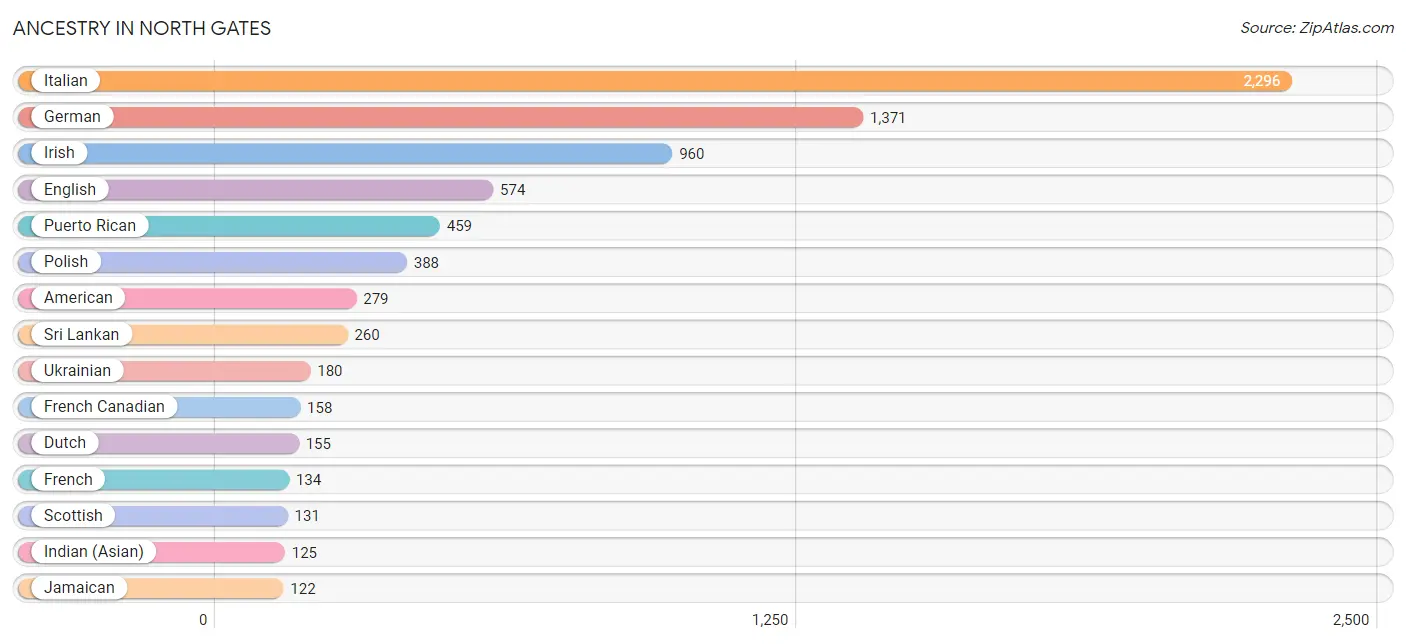
Ancestry in North Gates
The most populous ancestries reported in North Gates are Italian (2,296 | 22.7%), German (1,371 | 13.5%), Irish (960 | 9.5%), English (574 | 5.7%), and Puerto Rican (459 | 4.5%), together accounting for 55.8% of all North Gates residents.
| Ancestry | # Population | % Population |
| African | 25 | 0.3% |
| Albanian | 2 | 0.0% |
| American | 279 | 2.8% |
| Argentinean | 9 | 0.1% |
| Barbadian | 30 | 0.3% |
| Belgian | 58 | 0.6% |
| Bhutanese | 18 | 0.2% |
| Blackfeet | 1 | 0.0% |
| Bolivian | 63 | 0.6% |
| Brazilian | 10 | 0.1% |
| Burmese | 9 | 0.1% |
| Canadian | 11 | 0.1% |
| Central American | 7 | 0.1% |
| Cherokee | 21 | 0.2% |
| Croatian | 5 | 0.1% |
| Cuban | 24 | 0.2% |
| Czech | 14 | 0.1% |
| Danish | 65 | 0.6% |
| Dominican | 119 | 1.2% |
| Dutch | 155 | 1.5% |
| English | 574 | 5.7% |
| European | 43 | 0.4% |
| French | 134 | 1.3% |
| French Canadian | 158 | 1.6% |
| German | 1,371 | 13.5% |
| Greek | 56 | 0.5% |
| Haitian | 100 | 1.0% |
| Indian (Asian) | 125 | 1.2% |
| Indonesian | 7 | 0.1% |
| Irish | 960 | 9.5% |
| Italian | 2,296 | 22.7% |
| Jamaican | 122 | 1.2% |
| Latvian | 58 | 0.6% |
| Mexican | 60 | 0.6% |
| Nicaraguan | 1 | 0.0% |
| Northern European | 17 | 0.2% |
| Norwegian | 61 | 0.6% |
| Pakistani | 29 | 0.3% |
| Pennsylvania German | 9 | 0.1% |
| Polish | 388 | 3.8% |
| Portuguese | 63 | 0.6% |
| Puerto Rican | 459 | 4.5% |
| Russian | 75 | 0.7% |
| Salvadoran | 6 | 0.1% |
| Samoan | 10 | 0.1% |
| Scotch-Irish | 16 | 0.2% |
| Scottish | 131 | 1.3% |
| Serbian | 5 | 0.1% |
| South American | 72 | 0.7% |
| Spaniard | 12 | 0.1% |
| Sri Lankan | 260 | 2.6% |
| Subsaharan African | 25 | 0.3% |
| Swedish | 50 | 0.5% |
| Thai | 1 | 0.0% |
| Turkish | 20 | 0.2% |
| Ukrainian | 180 | 1.8% |
| Welsh | 21 | 0.2% | View All 57 Rows |
Immigrants in North Gates
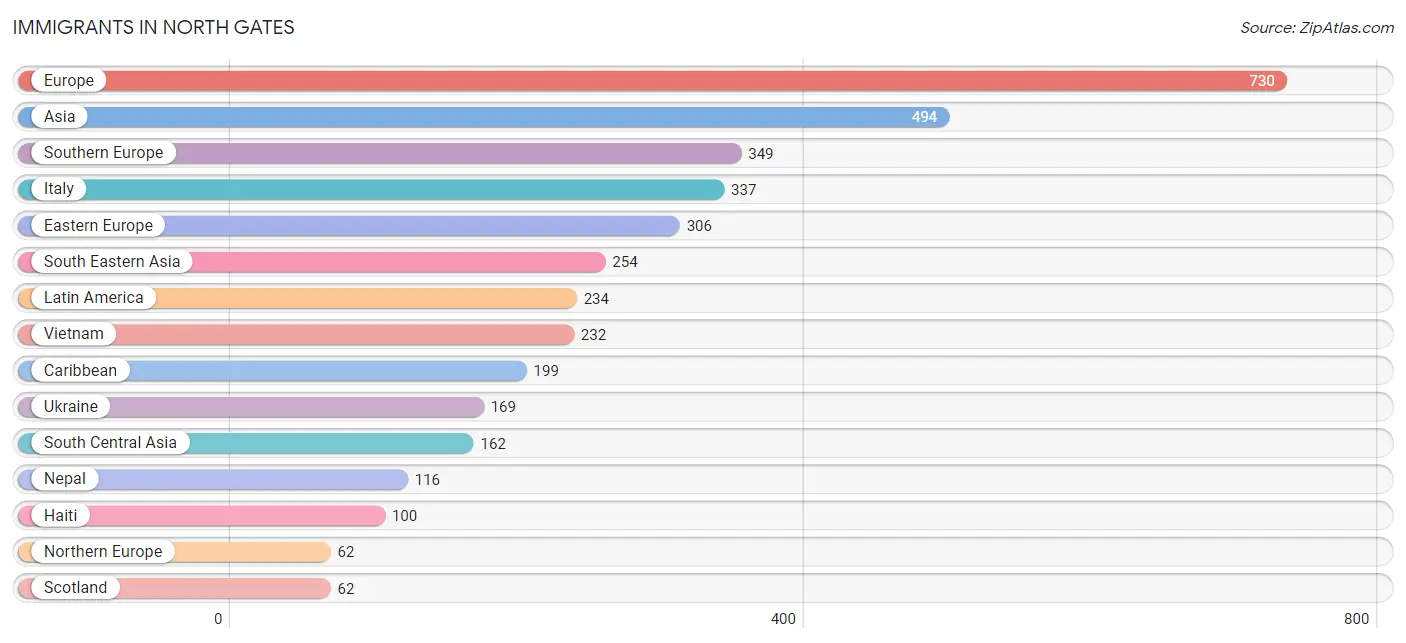
The most numerous immigrant groups reported in North Gates came from Europe (730 | 7.2%), Asia (494 | 4.9%), Southern Europe (349 | 3.4%), Italy (337 | 3.3%), and Eastern Europe (306 | 3.0%), together accounting for 21.9% of all North Gates residents.
| Immigration Origin | # Population | % Population |
| Albania | 2 | 0.0% |
| Argentina | 9 | 0.1% |
| Asia | 494 | 4.9% |
| Bosnia and Herzegovina | 10 | 0.1% |
| Brazil | 10 | 0.1% |
| Canada | 52 | 0.5% |
| Caribbean | 199 | 2.0% |
| Central America | 3 | 0.0% |
| China | 42 | 0.4% |
| Cuba | 14 | 0.1% |
| Dominican Republic | 42 | 0.4% |
| Eastern Asia | 51 | 0.5% |
| Eastern Europe | 306 | 3.0% |
| El Salvador | 2 | 0.0% |
| Europe | 730 | 7.2% |
| Grenada | 18 | 0.2% |
| Haiti | 100 | 1.0% |
| Hong Kong | 14 | 0.1% |
| India | 14 | 0.1% |
| Italy | 337 | 3.3% |
| Korea | 9 | 0.1% |
| Latin America | 234 | 2.3% |
| Latvia | 58 | 0.6% |
| Malaysia | 16 | 0.2% |
| Nepal | 116 | 1.1% |
| Netherlands | 13 | 0.1% |
| Nicaragua | 1 | 0.0% |
| Northern Europe | 62 | 0.6% |
| Romania | 11 | 0.1% |
| Russia | 56 | 0.5% |
| Scotland | 62 | 0.6% |
| South America | 32 | 0.3% |
| South Central Asia | 162 | 1.6% |
| South Eastern Asia | 254 | 2.5% |
| Southern Europe | 349 | 3.4% |
| Spain | 12 | 0.1% |
| Thailand | 6 | 0.1% |
| Turkey | 20 | 0.2% |
| Ukraine | 169 | 1.7% |
| Vietnam | 232 | 2.3% |
| West Indies | 25 | 0.3% |
| Western Asia | 20 | 0.2% |
| Western Europe | 13 | 0.1% | View All 43 Rows |
Sex and Age in North Gates
Sex and Age in North Gates
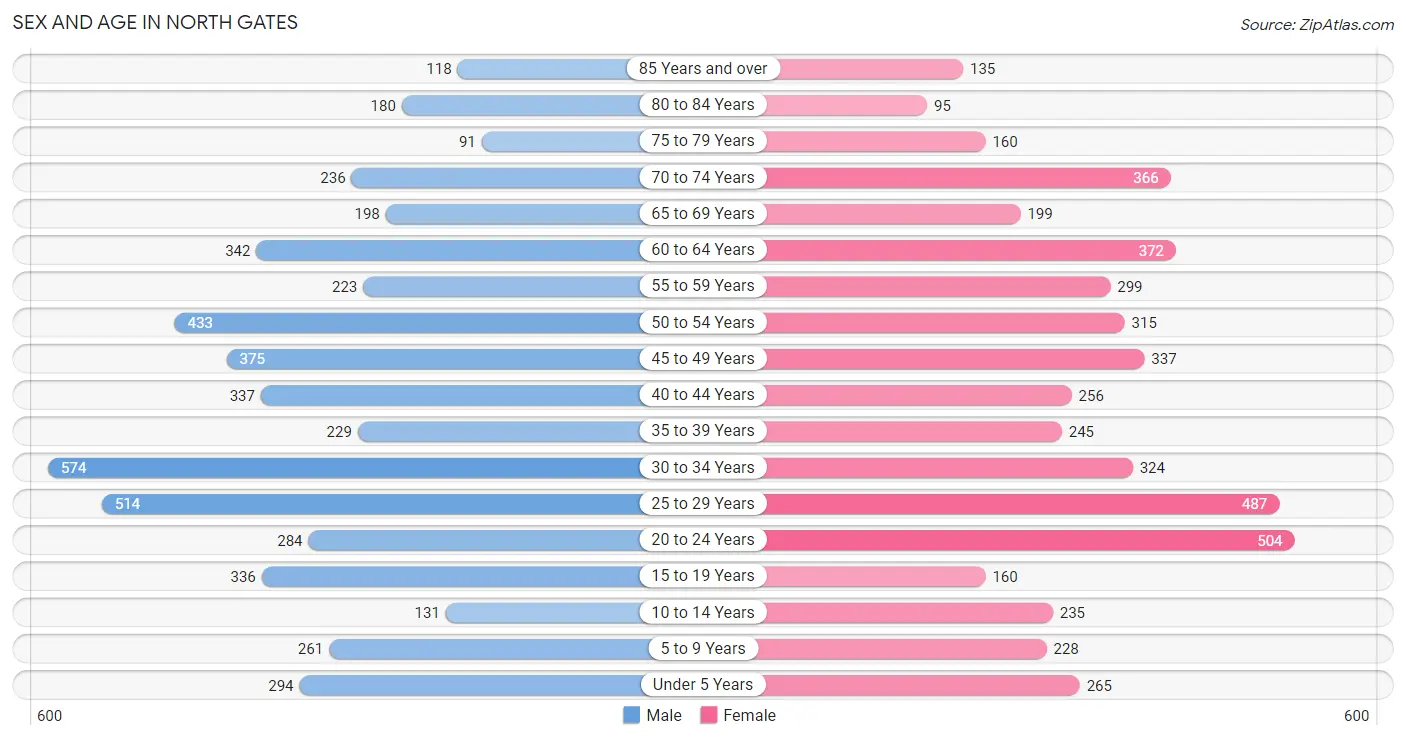
The most populous age groups in North Gates are 30 to 34 Years (574 | 11.1%) for men and 20 to 24 Years (504 | 10.1%) for women.
| Age Bracket | Male | Female |
| Under 5 Years | 294 (5.7%) | 265 (5.3%) |
| 5 to 9 Years | 261 (5.1%) | 228 (4.6%) |
| 10 to 14 Years | 131 (2.5%) | 235 (4.7%) |
| 15 to 19 Years | 336 (6.5%) | 160 (3.2%) |
| 20 to 24 Years | 284 (5.5%) | 504 (10.1%) |
| 25 to 29 Years | 514 (10.0%) | 487 (9.8%) |
| 30 to 34 Years | 574 (11.1%) | 324 (6.5%) |
| 35 to 39 Years | 229 (4.4%) | 245 (4.9%) |
| 40 to 44 Years | 337 (6.5%) | 256 (5.1%) |
| 45 to 49 Years | 375 (7.3%) | 337 (6.8%) |
| 50 to 54 Years | 433 (8.4%) | 315 (6.3%) |
| 55 to 59 Years | 223 (4.3%) | 299 (6.0%) |
| 60 to 64 Years | 342 (6.6%) | 372 (7.5%) |
| 65 to 69 Years | 198 (3.8%) | 199 (4.0%) |
| 70 to 74 Years | 236 (4.6%) | 366 (7.3%) |
| 75 to 79 Years | 91 (1.8%) | 160 (3.2%) |
| 80 to 84 Years | 180 (3.5%) | 95 (1.9%) |
| 85 Years and over | 118 (2.3%) | 135 (2.7%) |
| Total | 5,156 (100.0%) | 4,982 (100.0%) |
Families and Households in North Gates
Median Family Size in North Gates
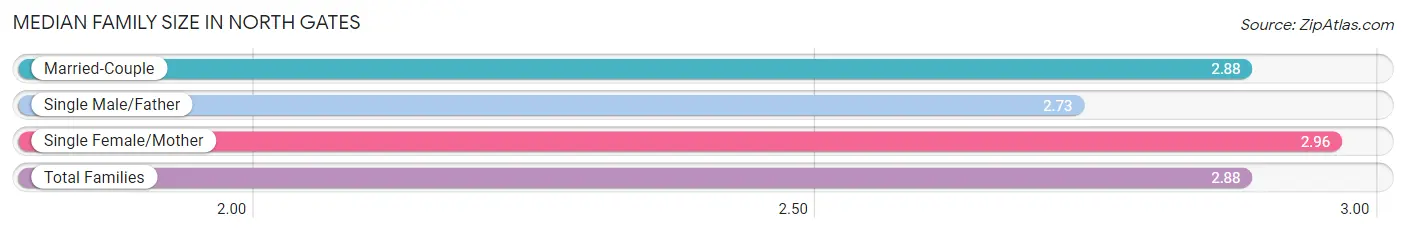
The median family size in North Gates is 2.88 persons per family, with single female/mother families (602 | 22.7%) accounting for the largest median family size of 2.96 persons per family. On the other hand, single male/father families (302 | 11.4%) represent the smallest median family size with 2.73 persons per family.
| Family Type | # Families | Family Size |
| Married-Couple | 1,752 (66.0%) | 2.88 |
| Single Male/Father | 302 (11.4%) | 2.73 |
| Single Female/Mother | 602 (22.7%) | 2.96 |
| Total Families | 2,656 (100.0%) | 2.88 |
Median Household Size in North Gates
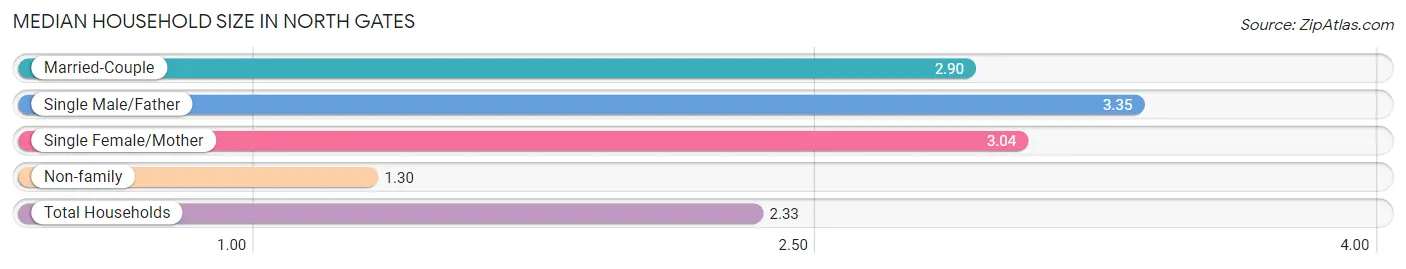
The median household size in North Gates is 2.33 persons per household, with single male/father households (302 | 7.0%) accounting for the largest median household size of 3.35 persons per household. non-family households (1,682 | 38.8%) represent the smallest median household size with 1.30 persons per household.
| Household Type | # Households | Household Size |
| Married-Couple | 1,752 (40.4%) | 2.90 |
| Single Male/Father | 302 (7.0%) | 3.35 |
| Single Female/Mother | 602 (13.9%) | 3.04 |
| Non-family | 1,682 (38.8%) | 1.30 |
| Total Households | 4,338 (100.0%) | 2.33 |
Household Size by Marriage Status in North Gates
Out of a total of 4,338 households in North Gates, 2,656 (61.2%) are family households, while 1,682 (38.8%) are nonfamily households. The most numerous type of family households are 2-person households, comprising 1,273, and the most common type of nonfamily households are 1-person households, comprising 1,246.
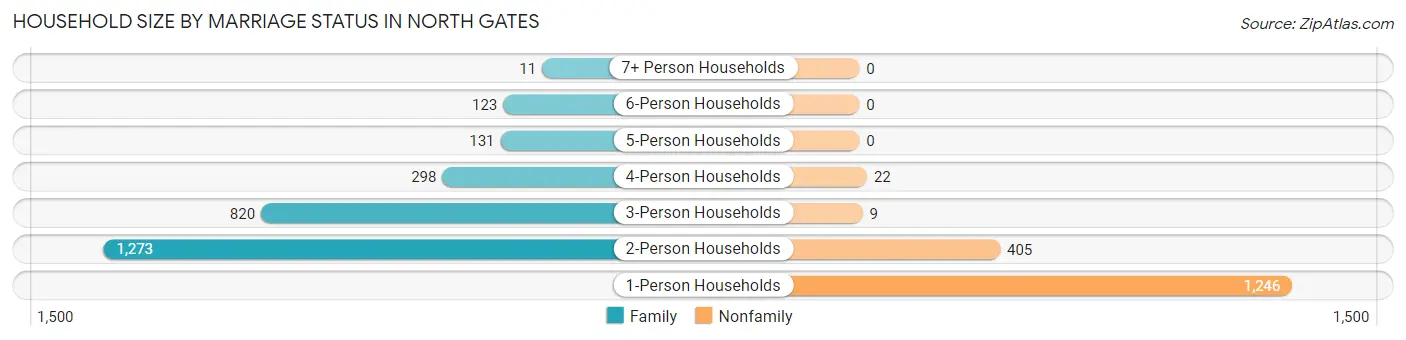
| Household Size | Family Households | Nonfamily Households |
| 1-Person Households | - | 1,246 (28.7%) |
| 2-Person Households | 1,273 (29.3%) | 405 (9.3%) |
| 3-Person Households | 820 (18.9%) | 9 (0.2%) |
| 4-Person Households | 298 (6.9%) | 22 (0.5%) |
| 5-Person Households | 131 (3.0%) | 0 (0.0%) |
| 6-Person Households | 123 (2.8%) | 0 (0.0%) |
| 7+ Person Households | 11 (0.3%) | 0 (0.0%) |
| Total | 2,656 (61.2%) | 1,682 (38.8%) |
Female Fertility in North Gates
Fertility by Age in North Gates
Average fertility rate in North Gates is 44.0 births per 1,000 women. Women in the age bracket of 35 to 50 years have the highest fertility rate with 72.0 births per 1,000 women. Women in the age bracket of 35 to 50 years acount for 62.1% of all women with births.
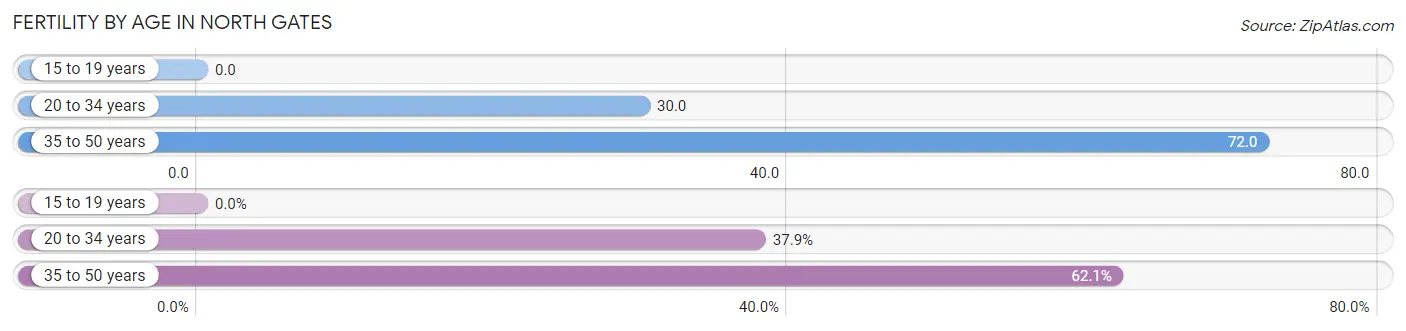
| Age Bracket | Women with Births | Births / 1,000 Women |
| 15 to 19 years | 0 (0.0%) | 0.0 |
| 20 to 34 years | 39 (37.9%) | 30.0 |
| 35 to 50 years | 64 (62.1%) | 72.0 |
| Total | 103 (100.0%) | 44.0 |
Fertility by Age by Marriage Status in North Gates
89.3% of women with births (103) in North Gates are married. The highest percentage of unmarried women with births falls into 20 to 34 years age bracket with 28.2% of them unmarried at the time of birth, while the lowest percentage of unmarried women with births belong to 35 to 50 years age bracket with 0.0% of them unmarried.
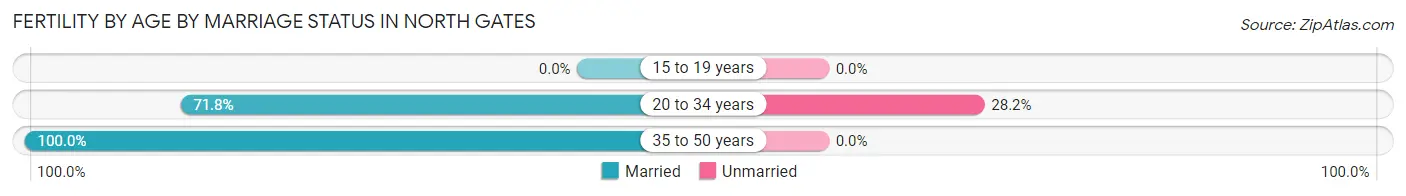
| Age Bracket | Married | Unmarried |
| 15 to 19 years | 0 (0.0%) | 0 (0.0%) |
| 20 to 34 years | 28 (71.8%) | 11 (28.2%) |
| 35 to 50 years | 64 (100.0%) | 0 (0.0%) |
| Total | 92 (89.3%) | 11 (10.7%) |
Fertility by Education in North Gates
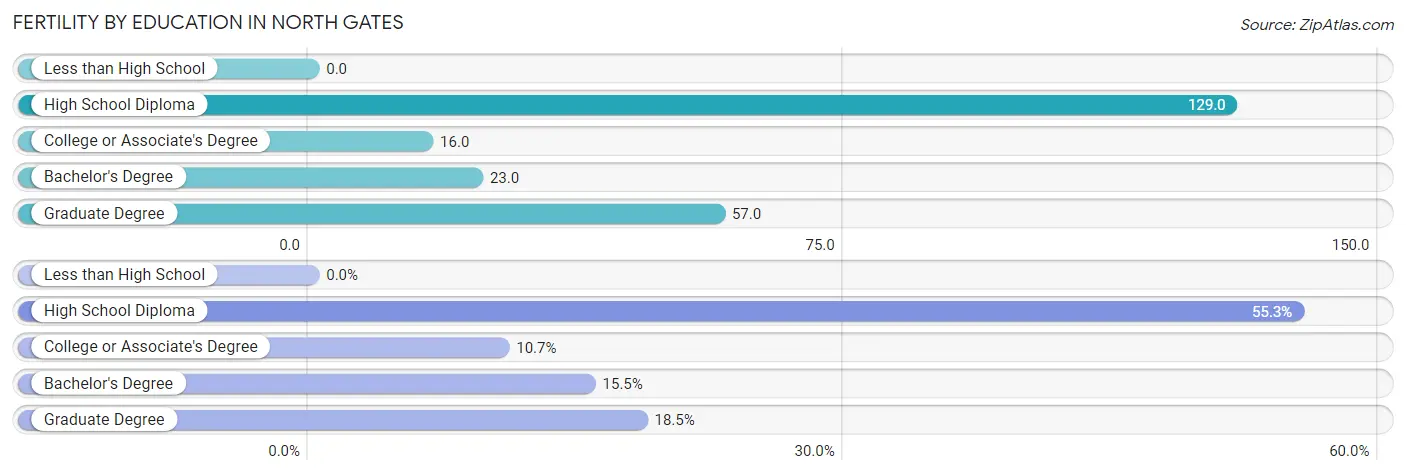
| Educational Attainment | Women with Births | Births / 1,000 Women |
| Less than High School | 0 (0.0%) | 0.0 |
| High School Diploma | 57 (55.3%) | 129.0 |
| College or Associate's Degree | 11 (10.7%) | 16.0 |
| Bachelor's Degree | 16 (15.5%) | 23.0 |
| Graduate Degree | 19 (18.4%) | 57.0 |
| Total | 103 (100.0%) | 44.0 |
Fertility by Education by Marriage Status in North Gates
10.7% of women with births in North Gates are unmarried. Women with the educational attainment of high school diploma are most likely to be married with 100.0% of them married at childbirth, while women with the educational attainment of college or associate's degree are least likely to be married with 100.0% of them unmarried at childbirth.
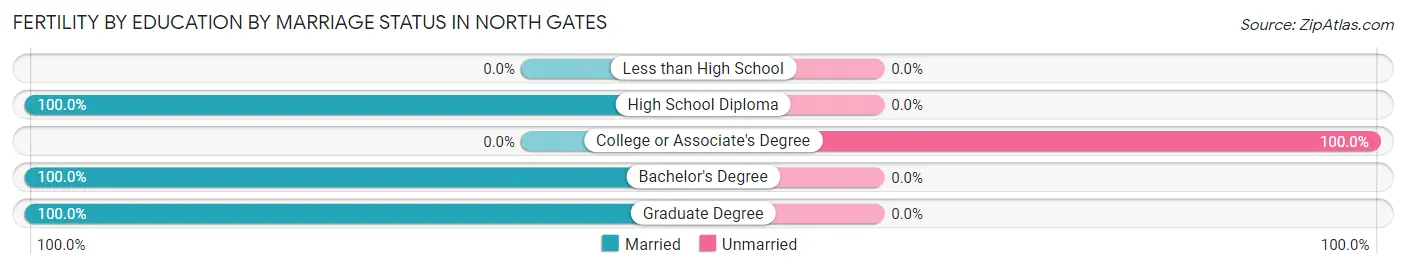
| Educational Attainment | Married | Unmarried |
| Less than High School | 0 (0.0%) | 0 (0.0%) |
| High School Diploma | 57 (100.0%) | 0 (0.0%) |
| College or Associate's Degree | 0 (0.0%) | 11 (100.0%) |
| Bachelor's Degree | 16 (100.0%) | 0 (0.0%) |
| Graduate Degree | 19 (100.0%) | 0 (0.0%) |
| Total | 92 (89.3%) | 11 (10.7%) |
Employment Characteristics in North Gates
Employment by Class of Employer in North Gates
Among the 5,526 employed individuals in North Gates, private company employees (3,728 | 67.5%), not-for-profit organizations (853 | 15.4%), and local government employees (353 | 6.4%) make up the most common classes of employment.
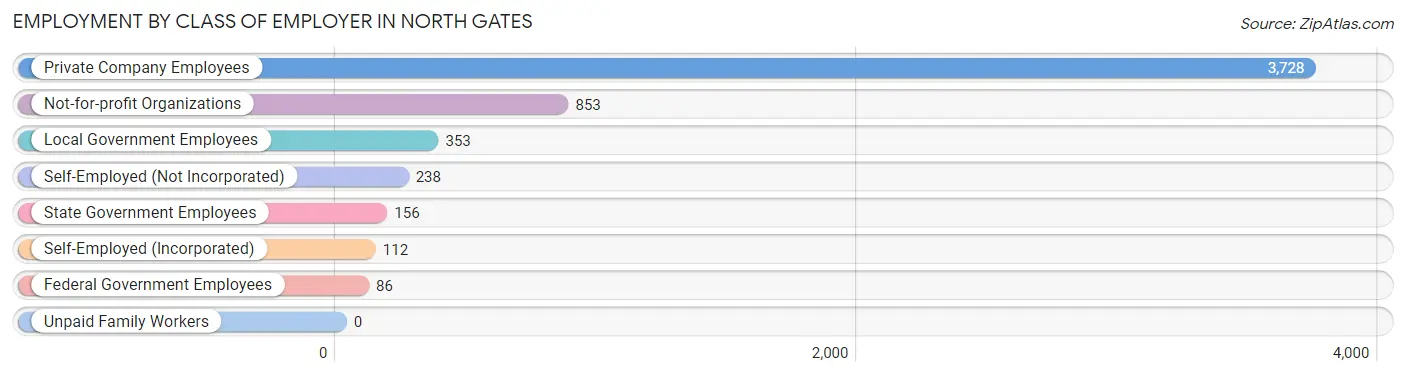
| Employer Class | # Employees | % Employees |
| Private Company Employees | 3,728 | 67.5% |
| Self-Employed (Incorporated) | 112 | 2.0% |
| Self-Employed (Not Incorporated) | 238 | 4.3% |
| Not-for-profit Organizations | 853 | 15.4% |
| Local Government Employees | 353 | 6.4% |
| State Government Employees | 156 | 2.8% |
| Federal Government Employees | 86 | 1.6% |
| Unpaid Family Workers | 0 | 0.0% |
| Total | 5,526 | 100.0% |
Employment Status by Age in North Gates
According to the labor force statistics for North Gates, out of the total population over 16 years of age (8,605), 67.1% or 5,774 individuals are in the labor force, with 3.0% or 173 of them unemployed. The age group with the highest labor force participation rate is 25 to 29 years, with 95.0% or 951 individuals in the labor force. Within the labor force, the 16 to 19 years age range has the highest percentage of unemployed individuals, with 15.7% or 27 of them being unemployed.
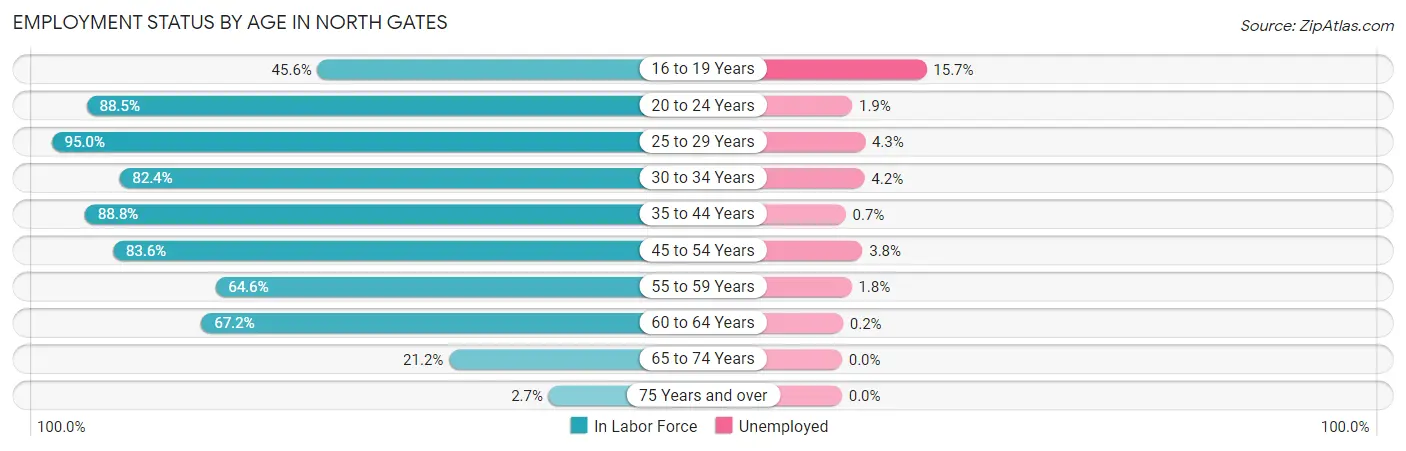
| Age Bracket | In Labor Force | Unemployed |
| 16 to 19 Years | 172 (45.6%) | 27 (15.7%) |
| 20 to 24 Years | 697 (88.5%) | 13 (1.9%) |
| 25 to 29 Years | 951 (95.0%) | 41 (4.3%) |
| 30 to 34 Years | 740 (82.4%) | 31 (4.2%) |
| 35 to 44 Years | 947 (88.8%) | 7 (0.7%) |
| 45 to 54 Years | 1,221 (83.6%) | 46 (3.8%) |
| 55 to 59 Years | 337 (64.6%) | 6 (1.8%) |
| 60 to 64 Years | 480 (67.2%) | 1 (0.2%) |
| 65 to 74 Years | 212 (21.2%) | 0 (0.0%) |
| 75 Years and over | 21 (2.7%) | 0 (0.0%) |
| Total | 5,774 (67.1%) | 173 (3.0%) |
Employment Status by Educational Attainment in North Gates
According to labor force statistics for North Gates, 82.6% of individuals (4,677) out of the total population between 25 and 64 years of age (5,662) are in the labor force, with 2.8% or 131 of them being unemployed. The group with the highest labor force participation rate are those with the educational attainment of bachelor's degree or higher, with 88.0% or 1,456 individuals in the labor force. Within the labor force, individuals with college / associate degree education have the highest percentage of unemployment, with 3.9% or 60 of them being unemployed.
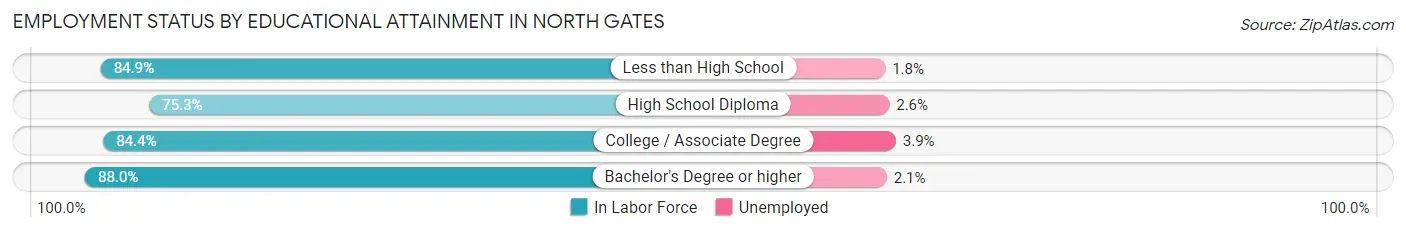
| Educational Attainment | In Labor Force | Unemployed |
| Less than High School | 326 (84.9%) | 7 (1.8%) |
| High School Diploma | 1,363 (75.3%) | 47 (2.6%) |
| College / Associate Degree | 1,530 (84.4%) | 71 (3.9%) |
| Bachelor's Degree or higher | 1,456 (88.0%) | 35 (2.1%) |
| Total | 4,677 (82.6%) | 159 (2.8%) |
Employment Occupations by Sex in North Gates
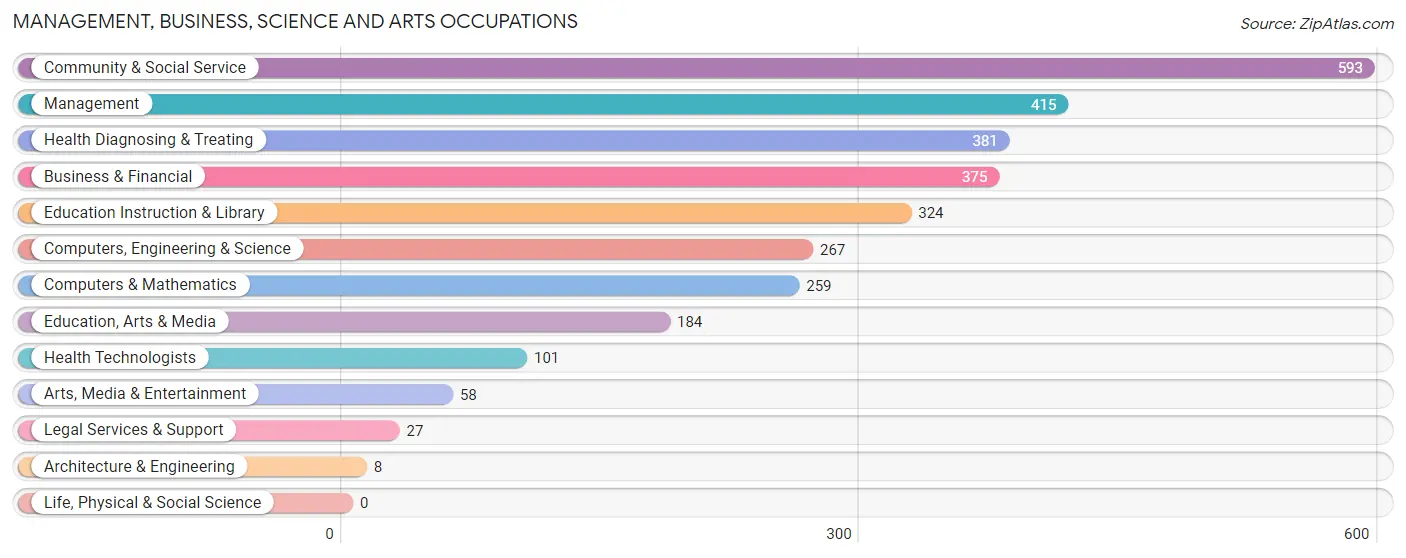
Management, Business, Science and Arts Occupations
The most common Management, Business, Science and Arts occupations in North Gates are Community & Social Service (593 | 10.6%), Management (415 | 7.4%), Health Diagnosing & Treating (381 | 6.8%), Business & Financial (375 | 6.7%), and Education Instruction & Library (324 | 5.8%).
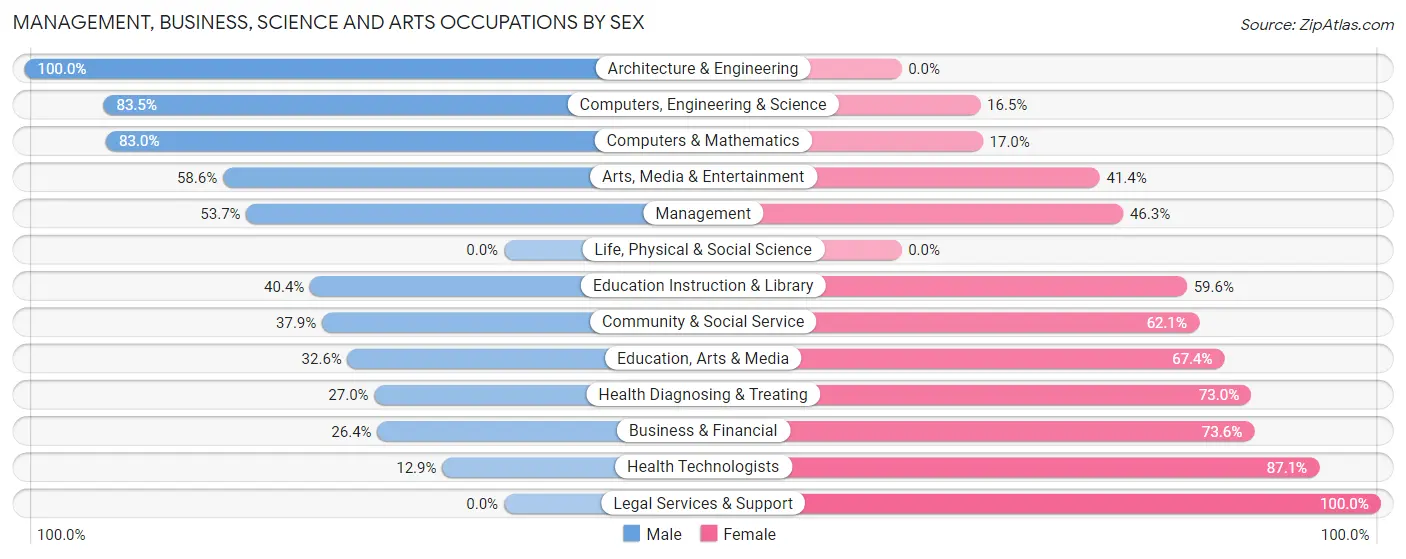
Management, Business, Science and Arts Occupations by Sex
Within the Management, Business, Science and Arts occupations in North Gates, the most male-oriented occupations are Architecture & Engineering (100.0%), Computers, Engineering & Science (83.5%), and Computers & Mathematics (83.0%), while the most female-oriented occupations are Legal Services & Support (100.0%), Health Technologists (87.1%), and Business & Financial (73.6%).
| Occupation | Male | Female |
| Management | 223 (53.7%) | 192 (46.3%) |
| Business & Financial | 99 (26.4%) | 276 (73.6%) |
| Computers, Engineering & Science | 223 (83.5%) | 44 (16.5%) |
| Computers & Mathematics | 215 (83.0%) | 44 (17.0%) |
| Architecture & Engineering | 8 (100.0%) | 0 (0.0%) |
| Life, Physical & Social Science | 0 (0.0%) | 0 (0.0%) |
| Community & Social Service | 225 (37.9%) | 368 (62.1%) |
| Education, Arts & Media | 60 (32.6%) | 124 (67.4%) |
| Legal Services & Support | 0 (0.0%) | 27 (100.0%) |
| Education Instruction & Library | 131 (40.4%) | 193 (59.6%) |
| Arts, Media & Entertainment | 34 (58.6%) | 24 (41.4%) |
| Health Diagnosing & Treating | 103 (27.0%) | 278 (73.0%) |
| Health Technologists | 13 (12.9%) | 88 (87.1%) |
| Total (Category) | 873 (43.0%) | 1,158 (57.0%) |
| Total (Overall) | 2,985 (53.3%) | 2,620 (46.7%) |
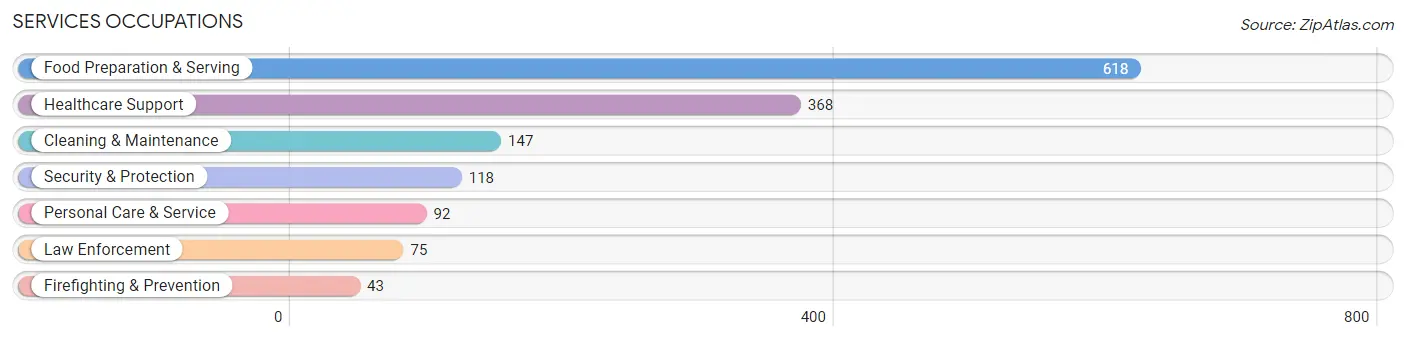
Services Occupations
The most common Services occupations in North Gates are Food Preparation & Serving (618 | 11.0%), Healthcare Support (368 | 6.6%), Cleaning & Maintenance (147 | 2.6%), Security & Protection (118 | 2.1%), and Personal Care & Service (92 | 1.6%).
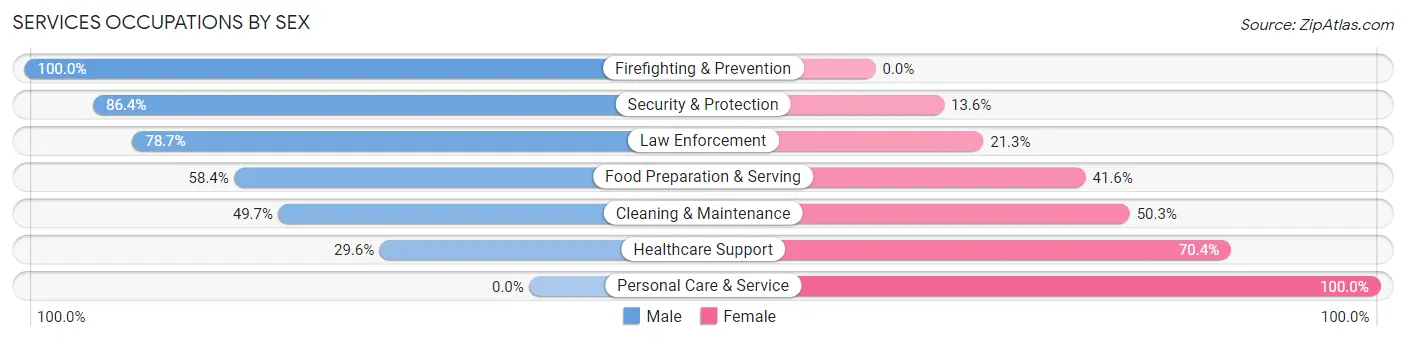
Services Occupations by Sex
Within the Services occupations in North Gates, the most male-oriented occupations are Firefighting & Prevention (100.0%), Security & Protection (86.4%), and Law Enforcement (78.7%), while the most female-oriented occupations are Personal Care & Service (100.0%), Healthcare Support (70.4%), and Cleaning & Maintenance (50.3%).
| Occupation | Male | Female |
| Healthcare Support | 109 (29.6%) | 259 (70.4%) |
| Security & Protection | 102 (86.4%) | 16 (13.6%) |
| Firefighting & Prevention | 43 (100.0%) | 0 (0.0%) |
| Law Enforcement | 59 (78.7%) | 16 (21.3%) |
| Food Preparation & Serving | 361 (58.4%) | 257 (41.6%) |
| Cleaning & Maintenance | 73 (49.7%) | 74 (50.3%) |
| Personal Care & Service | 0 (0.0%) | 92 (100.0%) |
| Total (Category) | 645 (48.0%) | 698 (52.0%) |
| Total (Overall) | 2,985 (53.3%) | 2,620 (46.7%) |
Sales and Office Occupations
The most common Sales and Office occupations in North Gates are Office & Administration (609 | 10.9%), and Sales & Related (356 | 6.4%).
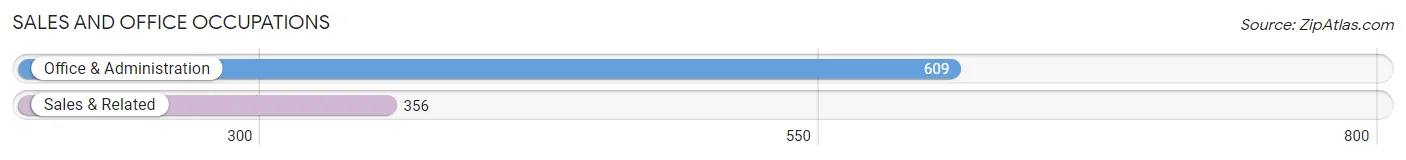
Sales and Office Occupations by Sex
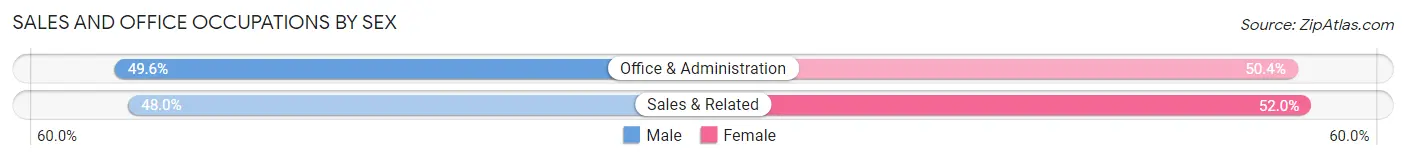
| Occupation | Male | Female |
| Sales & Related | 171 (48.0%) | 185 (52.0%) |
| Office & Administration | 302 (49.6%) | 307 (50.4%) |
| Total (Category) | 473 (49.0%) | 492 (51.0%) |
| Total (Overall) | 2,985 (53.3%) | 2,620 (46.7%) |
Natural Resources, Construction and Maintenance Occupations
The most common Natural Resources, Construction and Maintenance occupations in North Gates are Installation, Maintenance & Repair (164 | 2.9%), Construction & Extraction (111 | 2.0%), and Farming, Fishing & Forestry (1 | 0.0%).
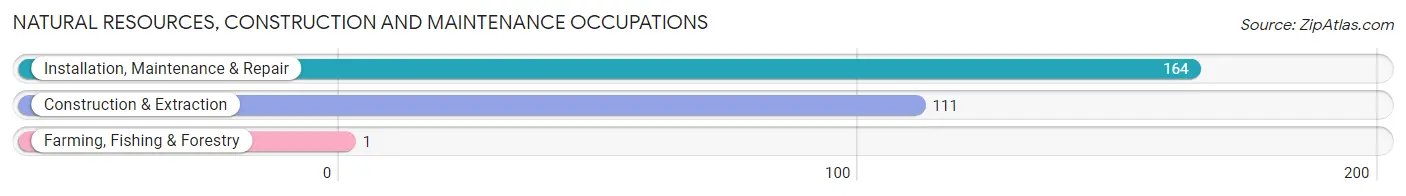
Natural Resources, Construction and Maintenance Occupations by Sex
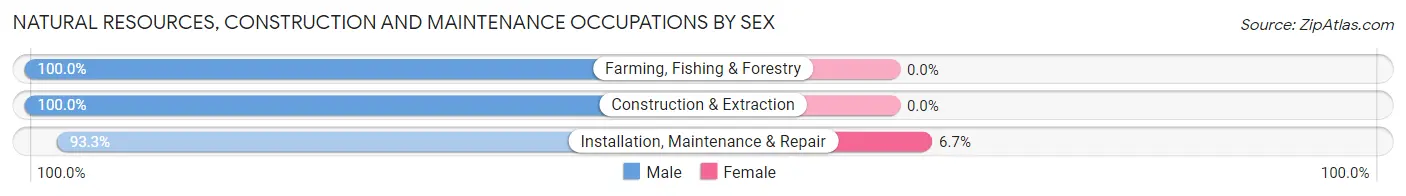
| Occupation | Male | Female |
| Farming, Fishing & Forestry | 1 (100.0%) | 0 (0.0%) |
| Construction & Extraction | 111 (100.0%) | 0 (0.0%) |
| Installation, Maintenance & Repair | 153 (93.3%) | 11 (6.7%) |
| Total (Category) | 265 (96.0%) | 11 (4.0%) |
| Total (Overall) | 2,985 (53.3%) | 2,620 (46.7%) |
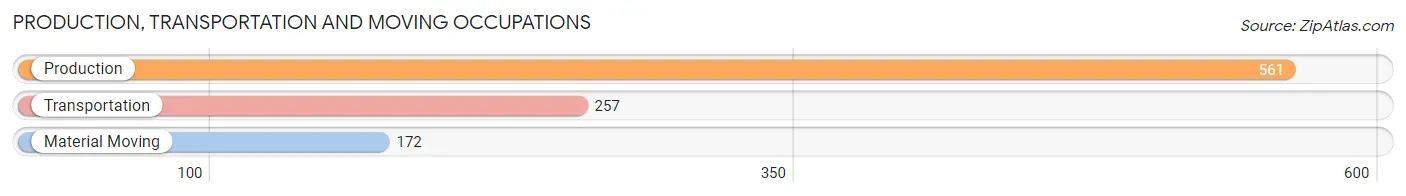
Production, Transportation and Moving Occupations
The most common Production, Transportation and Moving occupations in North Gates are Production (561 | 10.0%), Transportation (257 | 4.6%), and Material Moving (172 | 3.1%).
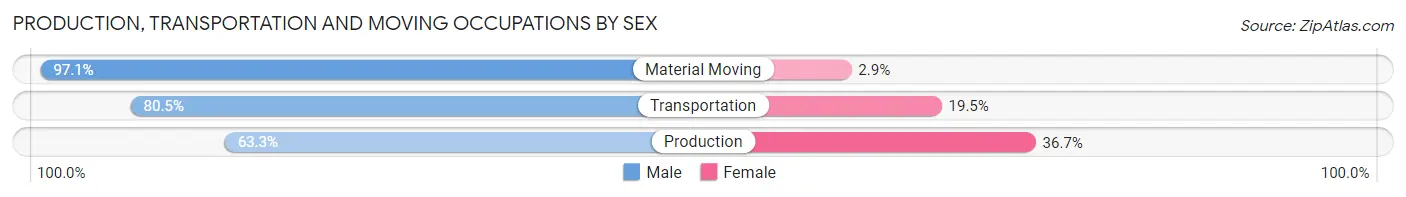
Production, Transportation and Moving Occupations by Sex
| Occupation | Male | Female |
| Production | 355 (63.3%) | 206 (36.7%) |
| Transportation | 207 (80.5%) | 50 (19.5%) |
| Material Moving | 167 (97.1%) | 5 (2.9%) |
| Total (Category) | 729 (73.6%) | 261 (26.4%) |
| Total (Overall) | 2,985 (53.3%) | 2,620 (46.7%) |
Employment Industries by Sex in North Gates
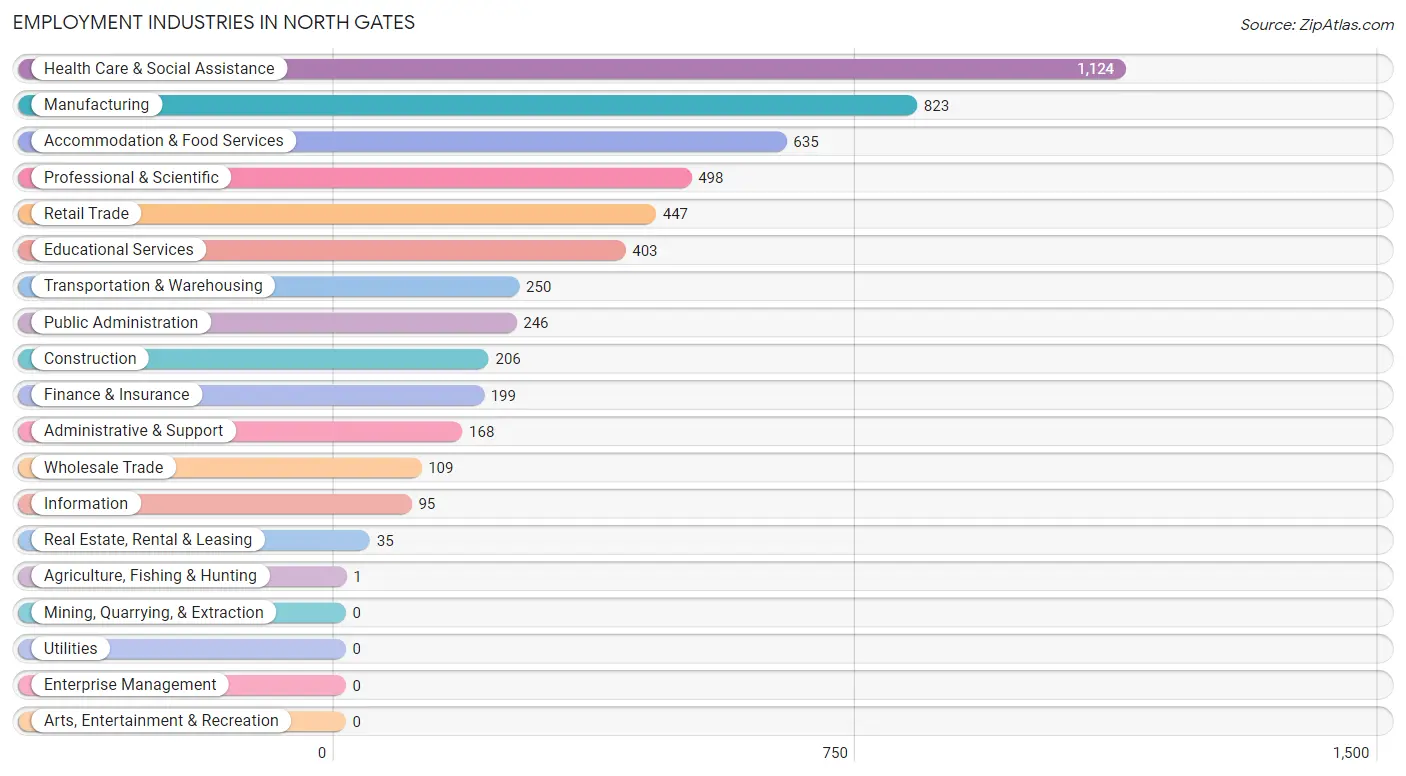
Employment Industries in North Gates
The major employment industries in North Gates include Health Care & Social Assistance (1,124 | 20.1%), Manufacturing (823 | 14.7%), Accommodation & Food Services (635 | 11.3%), Professional & Scientific (498 | 8.9%), and Retail Trade (447 | 8.0%).
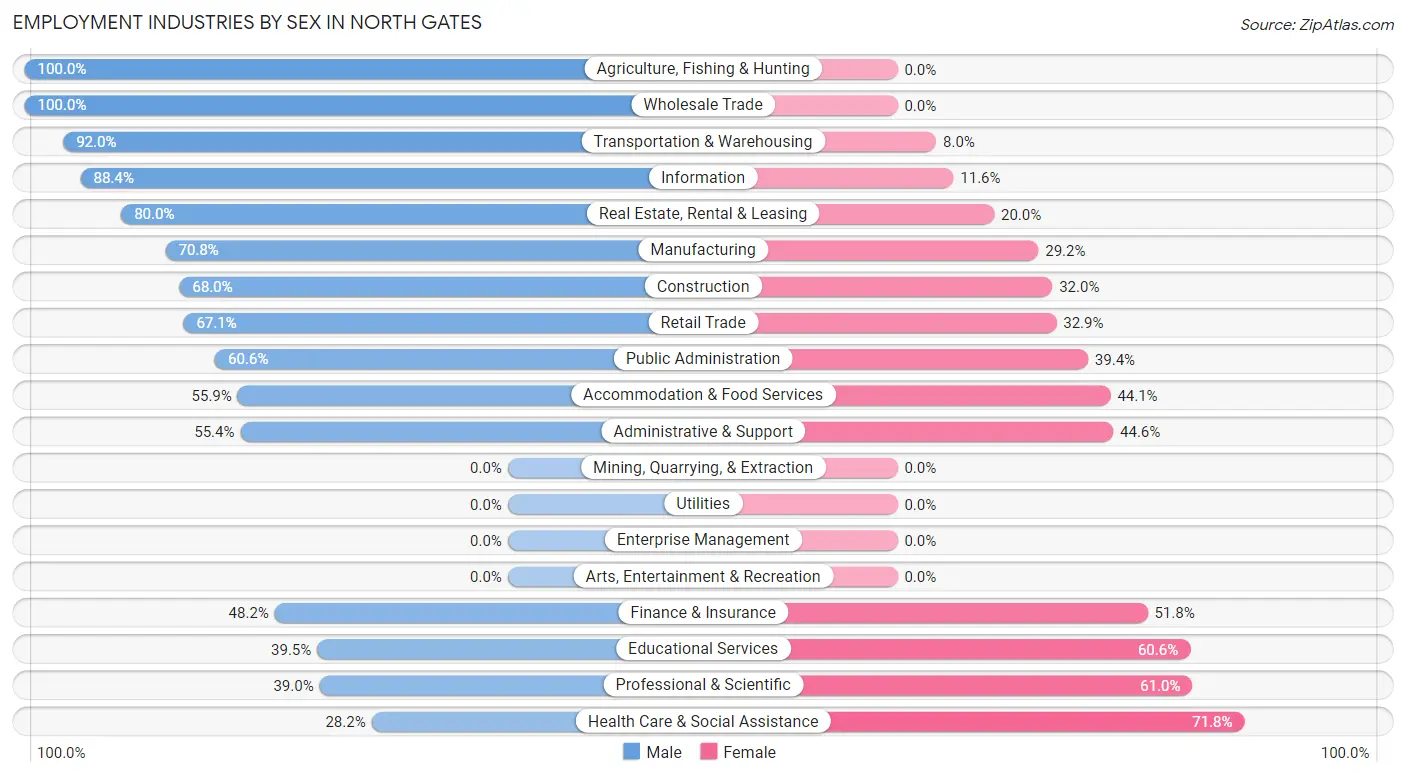
Employment Industries by Sex in North Gates
The North Gates industries that see more men than women are Agriculture, Fishing & Hunting (100.0%), Wholesale Trade (100.0%), and Transportation & Warehousing (92.0%), whereas the industries that tend to have a higher number of women are Health Care & Social Assistance (71.8%), Professional & Scientific (61.0%), and Educational Services (60.6%).
| Industry | Male | Female |
| Agriculture, Fishing & Hunting | 1 (100.0%) | 0 (0.0%) |
| Mining, Quarrying, & Extraction | 0 (0.0%) | 0 (0.0%) |
| Construction | 140 (68.0%) | 66 (32.0%) |
| Manufacturing | 583 (70.8%) | 240 (29.2%) |
| Wholesale Trade | 109 (100.0%) | 0 (0.0%) |
| Retail Trade | 300 (67.1%) | 147 (32.9%) |
| Transportation & Warehousing | 230 (92.0%) | 20 (8.0%) |
| Utilities | 0 (0.0%) | 0 (0.0%) |
| Information | 84 (88.4%) | 11 (11.6%) |
| Finance & Insurance | 96 (48.2%) | 103 (51.8%) |
| Real Estate, Rental & Leasing | 28 (80.0%) | 7 (20.0%) |
| Professional & Scientific | 194 (39.0%) | 304 (61.0%) |
| Enterprise Management | 0 (0.0%) | 0 (0.0%) |
| Administrative & Support | 93 (55.4%) | 75 (44.6%) |
| Educational Services | 159 (39.5%) | 244 (60.6%) |
| Health Care & Social Assistance | 317 (28.2%) | 807 (71.8%) |
| Arts, Entertainment & Recreation | 0 (0.0%) | 0 (0.0%) |
| Accommodation & Food Services | 355 (55.9%) | 280 (44.1%) |
| Public Administration | 149 (60.6%) | 97 (39.4%) |
| Total | 2,985 (53.3%) | 2,620 (46.7%) |
Education in North Gates
School Enrollment in North Gates
The most common levels of schooling among the 1,887 students in North Gates are college / undergraduate (448 | 23.7%), high school (408 | 21.6%), and elementary school (404 | 21.4%).
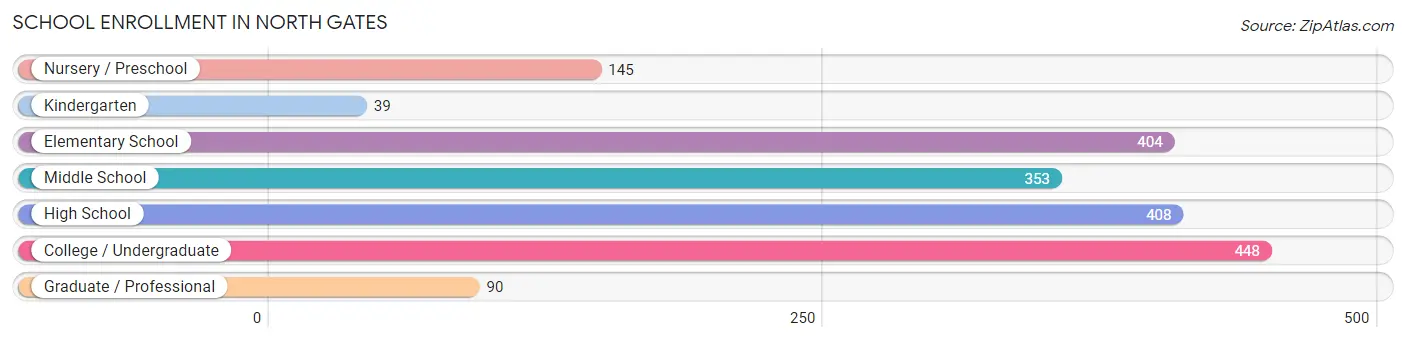
| School Level | # Students | % Students |
| Nursery / Preschool | 145 | 7.7% |
| Kindergarten | 39 | 2.1% |
| Elementary School | 404 | 21.4% |
| Middle School | 353 | 18.7% |
| High School | 408 | 21.6% |
| College / Undergraduate | 448 | 23.7% |
| Graduate / Professional | 90 | 4.8% |
| Total | 1,887 | 100.0% |
School Enrollment by Age by Funding Source in North Gates
Out of a total of 1,887 students who are enrolled in schools in North Gates, 313 (16.6%) attend a private institution, while the remaining 1,574 (83.4%) are enrolled in public schools. The age group of 25 to 34 year olds has the highest likelihood of being enrolled in private schools, with 62 (63.9% in the age bracket) enrolled. Conversely, the age group of 3 to 4 year olds has the lowest likelihood of being enrolled in a private school, with 88 (100.0% in the age bracket) attending a public institution.
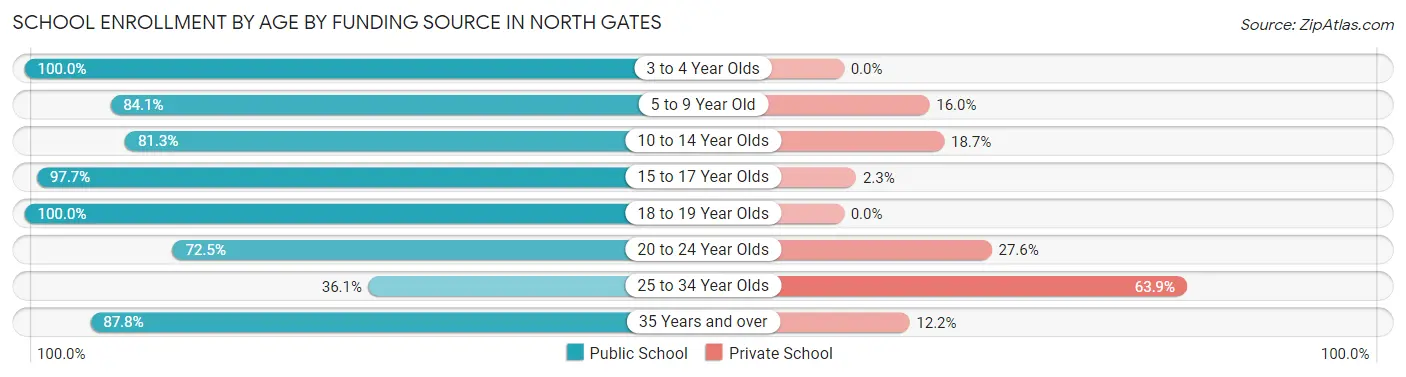
| Age Bracket | Public School | Private School |
| 3 to 4 Year Olds | 88 (100.0%) | 0 (0.0%) |
| 5 to 9 Year Old | 411 (84.1%) | 78 (16.0%) |
| 10 to 14 Year Olds | 287 (81.3%) | 66 (18.7%) |
| 15 to 17 Year Olds | 341 (97.7%) | 8 (2.3%) |
| 18 to 19 Year Olds | 70 (100.0%) | 0 (0.0%) |
| 20 to 24 Year Olds | 213 (72.5%) | 81 (27.6%) |
| 25 to 34 Year Olds | 35 (36.1%) | 62 (63.9%) |
| 35 Years and over | 129 (87.8%) | 18 (12.2%) |
| Total | 1,574 (83.4%) | 313 (16.6%) |
Educational Attainment by Field of Study in North Gates
Science & technology (396 | 18.3%), business (283 | 13.1%), arts & humanities (239 | 11.1%), psychology (228 | 10.6%), and education (205 | 9.5%) are the most common fields of study among 2,160 individuals in North Gates who have obtained a bachelor's degree or higher.
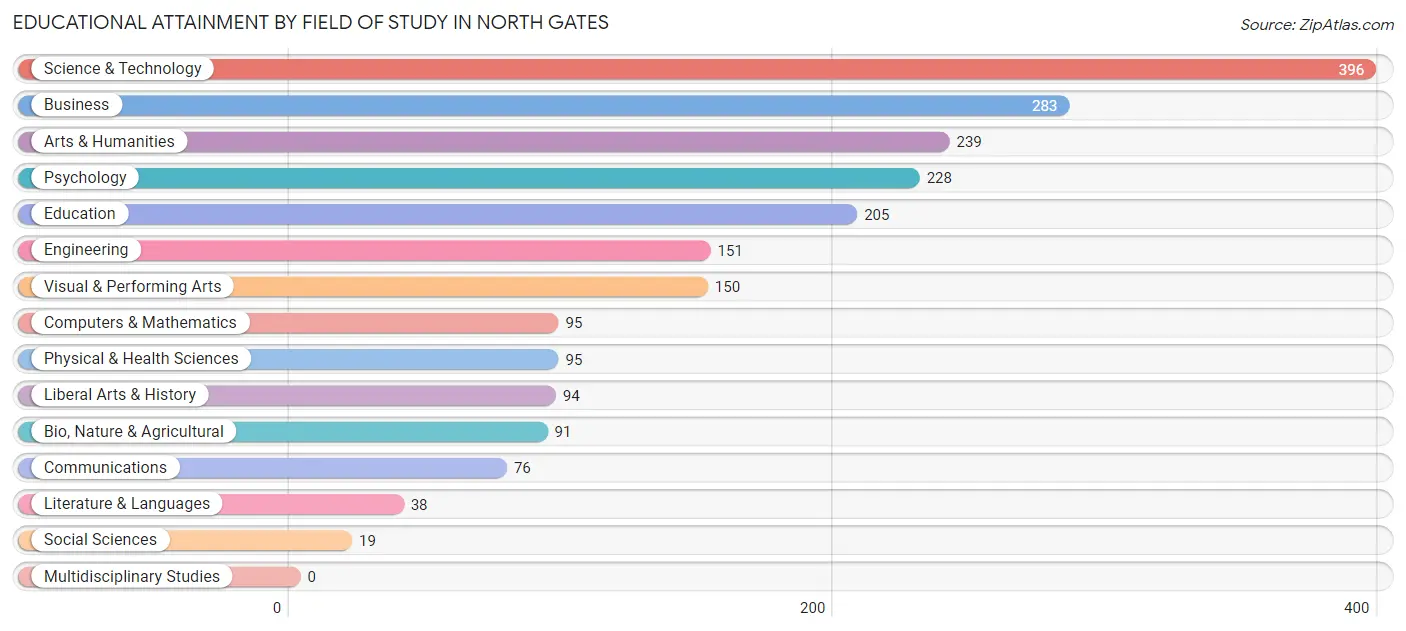
| Field of Study | # Graduates | % Graduates |
| Computers & Mathematics | 95 | 4.4% |
| Bio, Nature & Agricultural | 91 | 4.2% |
| Physical & Health Sciences | 95 | 4.4% |
| Psychology | 228 | 10.6% |
| Social Sciences | 19 | 0.9% |
| Engineering | 151 | 7.0% |
| Multidisciplinary Studies | 0 | 0.0% |
| Science & Technology | 396 | 18.3% |
| Business | 283 | 13.1% |
| Education | 205 | 9.5% |
| Literature & Languages | 38 | 1.8% |
| Liberal Arts & History | 94 | 4.3% |
| Visual & Performing Arts | 150 | 6.9% |
| Communications | 76 | 3.5% |
| Arts & Humanities | 239 | 11.1% |
| Total | 2,160 | 100.0% |
Transportation & Commute in North Gates
Vehicle Availability by Sex in North Gates
The most prevalent vehicle ownership categories in North Gates are males with 2 vehicles (1,595, accounting for 53.6%) and females with 2 vehicles (1,452, making up 62.5%).
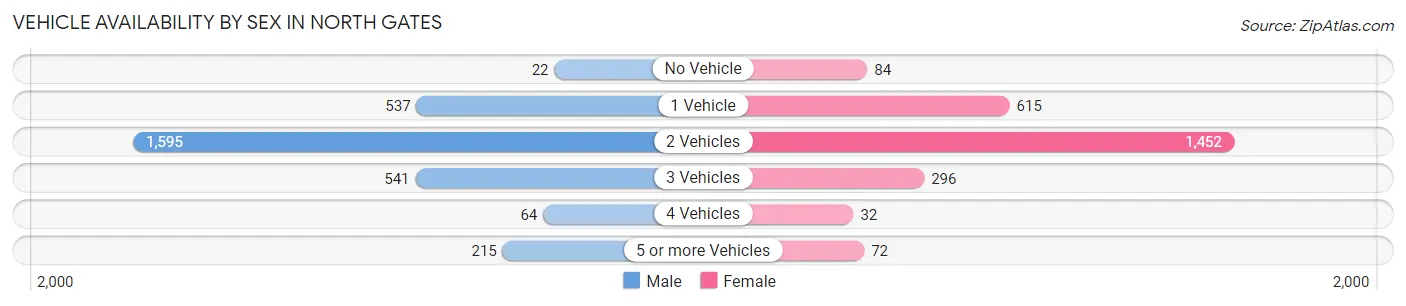
| Vehicles Available | Male | Female |
| No Vehicle | 22 (0.7%) | 84 (3.3%) |
| 1 Vehicle | 537 (18.1%) | 615 (24.1%) |
| 2 Vehicles | 1,595 (53.6%) | 1,452 (56.9%) |
| 3 Vehicles | 541 (18.2%) | 296 (11.6%) |
| 4 Vehicles | 64 (2.1%) | 32 (1.3%) |
| 5 or more Vehicles | 215 (7.2%) | 72 (2.8%) |
| Total | 2,974 (100.0%) | 2,551 (100.0%) |
Commute Time in North Gates
The most frequently occuring commute durations in North Gates are 20 to 24 minutes (1,383 commuters, 27.7%), 15 to 19 minutes (1,058 commuters, 21.2%), and 5 to 9 minutes (847 commuters, 17.0%).
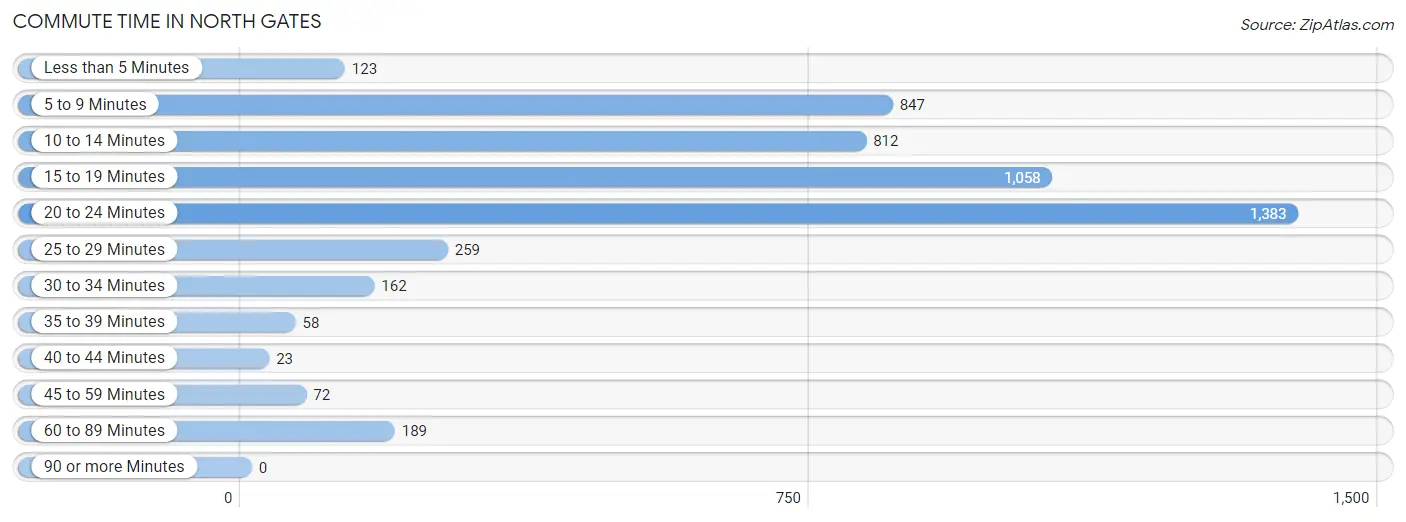
| Commute Time | # Commuters | % Commuters |
| Less than 5 Minutes | 123 | 2.5% |
| 5 to 9 Minutes | 847 | 17.0% |
| 10 to 14 Minutes | 812 | 16.3% |
| 15 to 19 Minutes | 1,058 | 21.2% |
| 20 to 24 Minutes | 1,383 | 27.7% |
| 25 to 29 Minutes | 259 | 5.2% |
| 30 to 34 Minutes | 162 | 3.3% |
| 35 to 39 Minutes | 58 | 1.2% |
| 40 to 44 Minutes | 23 | 0.5% |
| 45 to 59 Minutes | 72 | 1.4% |
| 60 to 89 Minutes | 189 | 3.8% |
| 90 or more Minutes | 0 | 0.0% |
Commute Time by Sex in North Gates
The most common commute times in North Gates are 10 to 14 minutes (620 commuters, 22.9%) for males and 20 to 24 minutes (901 commuters, 39.6%) for females.
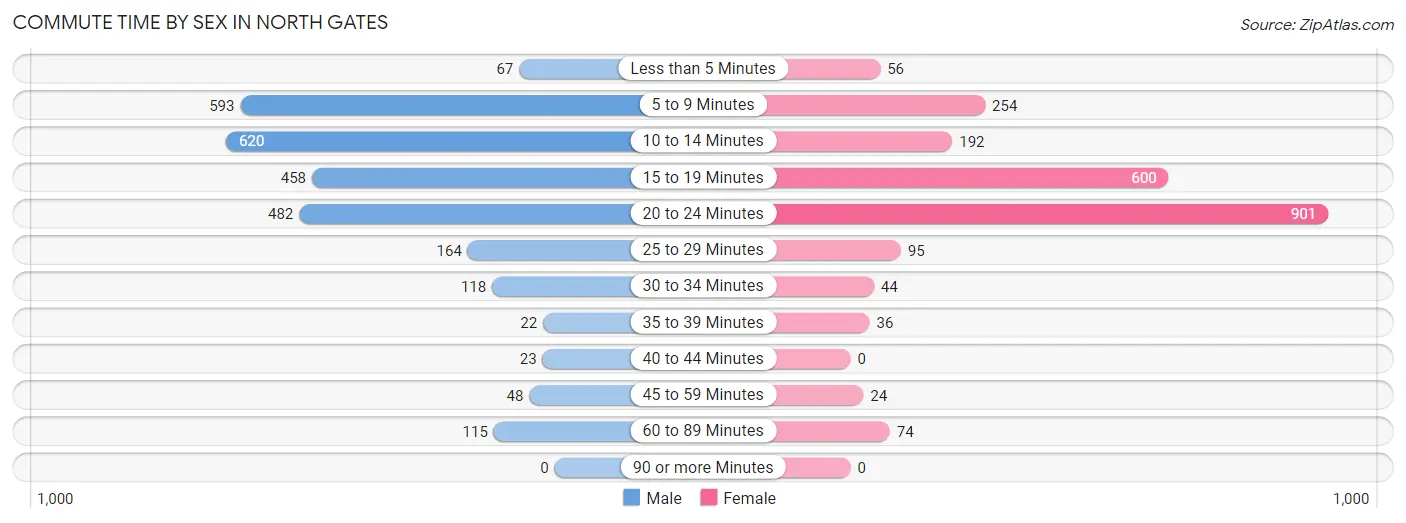
| Commute Time | Male | Female |
| Less than 5 Minutes | 67 (2.5%) | 56 (2.5%) |
| 5 to 9 Minutes | 593 (21.9%) | 254 (11.2%) |
| 10 to 14 Minutes | 620 (22.9%) | 192 (8.4%) |
| 15 to 19 Minutes | 458 (16.9%) | 600 (26.4%) |
| 20 to 24 Minutes | 482 (17.8%) | 901 (39.6%) |
| 25 to 29 Minutes | 164 (6.0%) | 95 (4.2%) |
| 30 to 34 Minutes | 118 (4.3%) | 44 (1.9%) |
| 35 to 39 Minutes | 22 (0.8%) | 36 (1.6%) |
| 40 to 44 Minutes | 23 (0.9%) | 0 (0.0%) |
| 45 to 59 Minutes | 48 (1.8%) | 24 (1.1%) |
| 60 to 89 Minutes | 115 (4.2%) | 74 (3.3%) |
| 90 or more Minutes | 0 (0.0%) | 0 (0.0%) |
Time of Departure to Work by Sex in North Gates
The most frequent times of departure to work in North Gates are 6:00 AM to 6:29 AM (364, 13.4%) for males and 7:30 AM to 7:59 AM (362, 15.9%) for females.
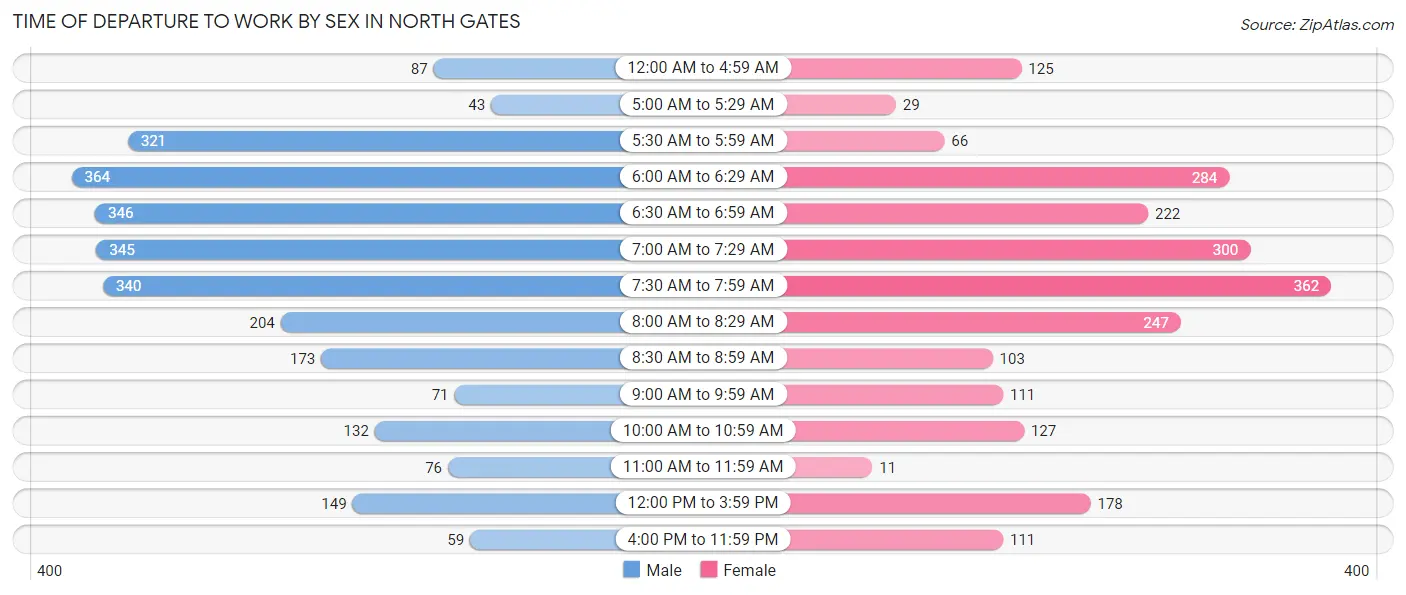
| Time of Departure | Male | Female |
| 12:00 AM to 4:59 AM | 87 (3.2%) | 125 (5.5%) |
| 5:00 AM to 5:29 AM | 43 (1.6%) | 29 (1.3%) |
| 5:30 AM to 5:59 AM | 321 (11.8%) | 66 (2.9%) |
| 6:00 AM to 6:29 AM | 364 (13.4%) | 284 (12.5%) |
| 6:30 AM to 6:59 AM | 346 (12.8%) | 222 (9.8%) |
| 7:00 AM to 7:29 AM | 345 (12.7%) | 300 (13.2%) |
| 7:30 AM to 7:59 AM | 340 (12.6%) | 362 (15.9%) |
| 8:00 AM to 8:29 AM | 204 (7.5%) | 247 (10.8%) |
| 8:30 AM to 8:59 AM | 173 (6.4%) | 103 (4.5%) |
| 9:00 AM to 9:59 AM | 71 (2.6%) | 111 (4.9%) |
| 10:00 AM to 10:59 AM | 132 (4.9%) | 127 (5.6%) |
| 11:00 AM to 11:59 AM | 76 (2.8%) | 11 (0.5%) |
| 12:00 PM to 3:59 PM | 149 (5.5%) | 178 (7.8%) |
| 4:00 PM to 11:59 PM | 59 (2.2%) | 111 (4.9%) |
| Total | 2,710 (100.0%) | 2,276 (100.0%) |
Housing Occupancy in North Gates
Occupancy by Ownership in North Gates
Of the total 4,338 dwellings in North Gates, owner-occupied units account for 2,752 (63.4%), while renter-occupied units make up 1,586 (36.6%).
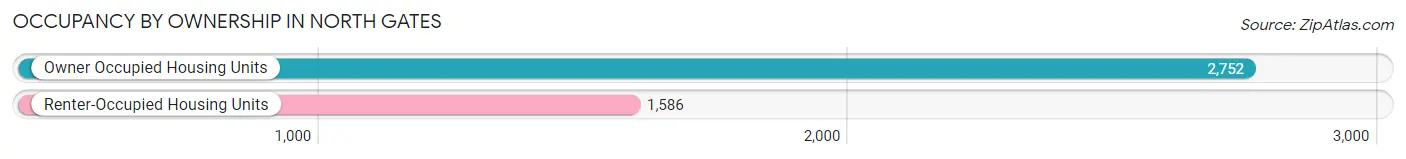
| Occupancy | # Housing Units | % Housing Units |
| Owner Occupied Housing Units | 2,752 | 63.4% |
| Renter-Occupied Housing Units | 1,586 | 36.6% |
| Total Occupied Housing Units | 4,338 | 100.0% |
Occupancy by Household Size in North Gates
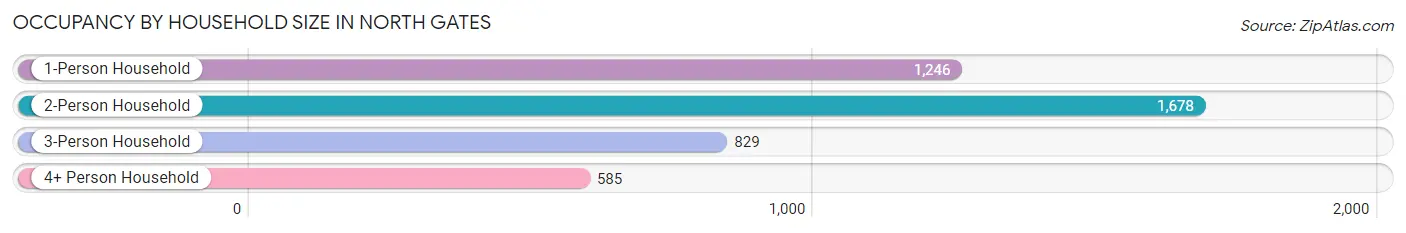
| Household Size | # Housing Units | % Housing Units |
| 1-Person Household | 1,246 | 28.7% |
| 2-Person Household | 1,678 | 38.7% |
| 3-Person Household | 829 | 19.1% |
| 4+ Person Household | 585 | 13.5% |
| Total Housing Units | 4,338 | 100.0% |
Occupancy by Ownership by Household Size in North Gates
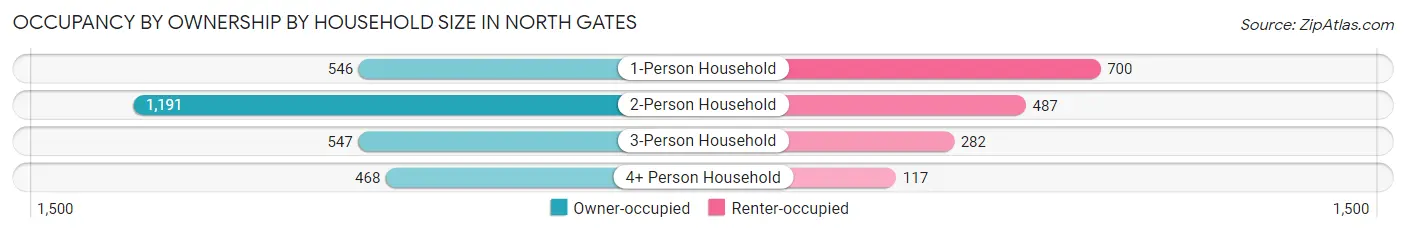
| Household Size | Owner-occupied | Renter-occupied |
| 1-Person Household | 546 (43.8%) | 700 (56.2%) |
| 2-Person Household | 1,191 (71.0%) | 487 (29.0%) |
| 3-Person Household | 547 (66.0%) | 282 (34.0%) |
| 4+ Person Household | 468 (80.0%) | 117 (20.0%) |
| Total Housing Units | 2,752 (63.4%) | 1,586 (36.6%) |
Occupancy by Educational Attainment in North Gates
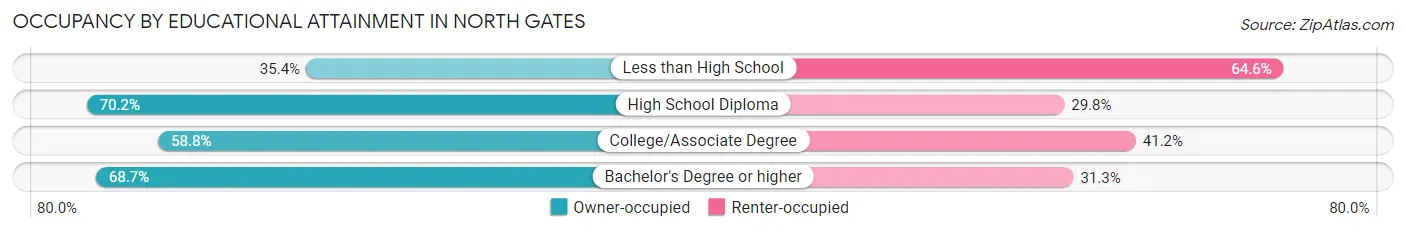
| Household Size | Owner-occupied | Renter-occupied |
| Less than High School | 121 (35.4%) | 221 (64.6%) |
| High School Diploma | 910 (70.2%) | 387 (29.8%) |
| College/Associate Degree | 791 (58.8%) | 554 (41.2%) |
| Bachelor's Degree or higher | 930 (68.7%) | 424 (31.3%) |
Occupancy by Age of Householder in North Gates
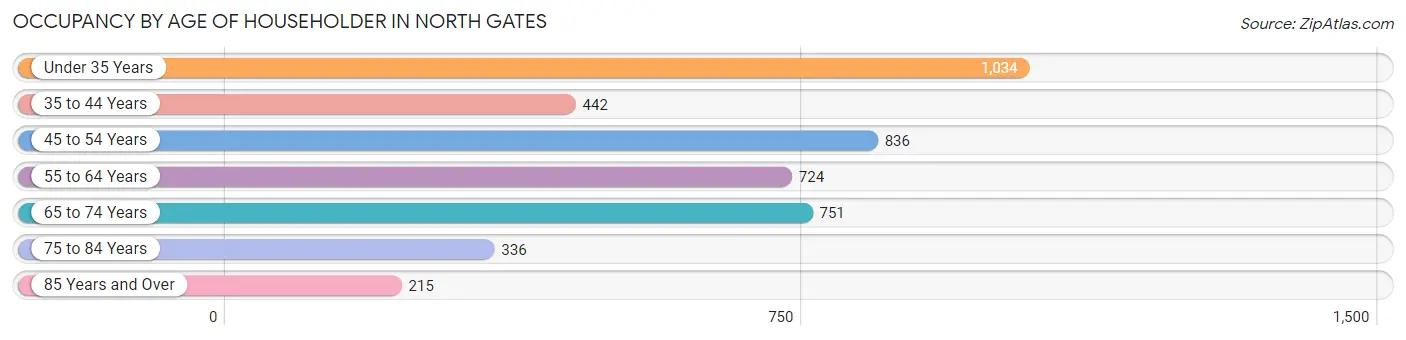
| Age Bracket | # Households | % Households |
| Under 35 Years | 1,034 | 23.8% |
| 35 to 44 Years | 442 | 10.2% |
| 45 to 54 Years | 836 | 19.3% |
| 55 to 64 Years | 724 | 16.7% |
| 65 to 74 Years | 751 | 17.3% |
| 75 to 84 Years | 336 | 7.7% |
| 85 Years and Over | 215 | 5.0% |
| Total | 4,338 | 100.0% |
Housing Finances in North Gates
Median Income by Occupancy in North Gates
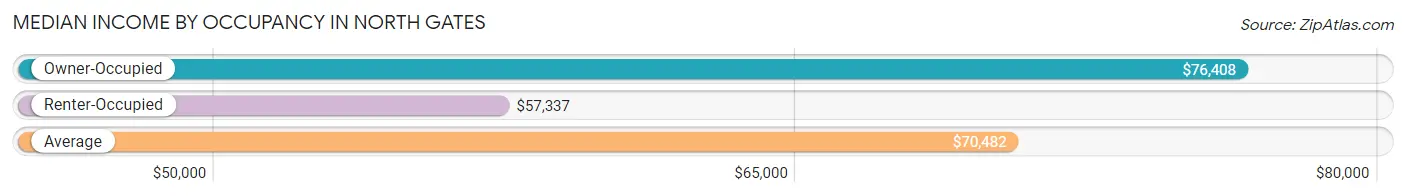
| Occupancy Type | # Households | Median Income |
| Owner-Occupied | 2,752 (63.4%) | $76,408 |
| Renter-Occupied | 1,586 (36.6%) | $57,337 |
| Average | 4,338 (100.0%) | $70,482 |
Occupancy by Householder Income Bracket in North Gates
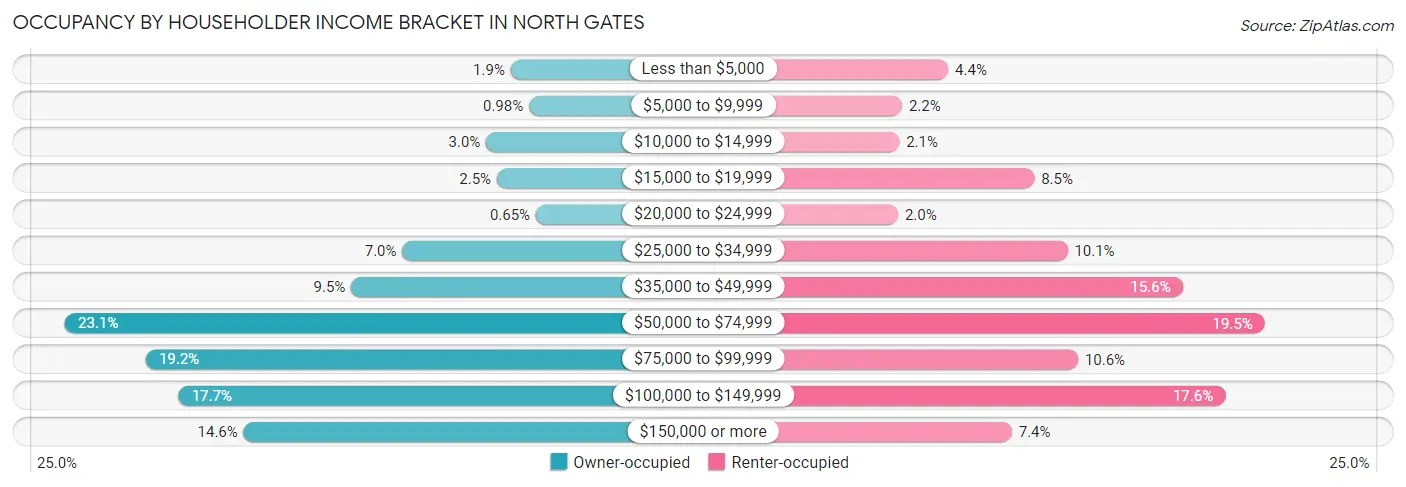
| Income Bracket | Owner-occupied | Renter-occupied |
| Less than $5,000 | 51 (1.8%) | 70 (4.4%) |
| $5,000 to $9,999 | 27 (1.0%) | 35 (2.2%) |
| $10,000 to $14,999 | 83 (3.0%) | 33 (2.1%) |
| $15,000 to $19,999 | 69 (2.5%) | 135 (8.5%) |
| $20,000 to $24,999 | 18 (0.6%) | 32 (2.0%) |
| $25,000 to $34,999 | 193 (7.0%) | 160 (10.1%) |
| $35,000 to $49,999 | 260 (9.5%) | 247 (15.6%) |
| $50,000 to $74,999 | 635 (23.1%) | 309 (19.5%) |
| $75,000 to $99,999 | 529 (19.2%) | 168 (10.6%) |
| $100,000 to $149,999 | 486 (17.7%) | 279 (17.6%) |
| $150,000 or more | 401 (14.6%) | 118 (7.4%) |
| Total | 2,752 (100.0%) | 1,586 (100.0%) |
Monthly Housing Cost Tiers in North Gates
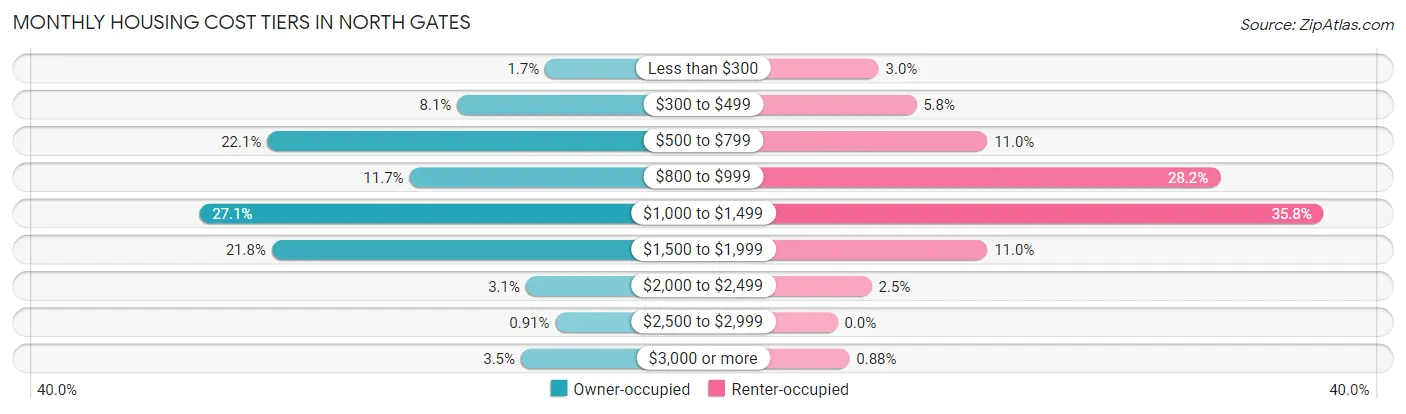
| Monthly Cost | Owner-occupied | Renter-occupied |
| Less than $300 | 46 (1.7%) | 48 (3.0%) |
| $300 to $499 | 224 (8.1%) | 92 (5.8%) |
| $500 to $799 | 609 (22.1%) | 175 (11.0%) |
| $800 to $999 | 321 (11.7%) | 447 (28.2%) |
| $1,000 to $1,499 | 747 (27.1%) | 568 (35.8%) |
| $1,500 to $1,999 | 600 (21.8%) | 175 (11.0%) |
| $2,000 to $2,499 | 85 (3.1%) | 40 (2.5%) |
| $2,500 to $2,999 | 25 (0.9%) | 0 (0.0%) |
| $3,000 or more | 95 (3.5%) | 14 (0.9%) |
| Total | 2,752 (100.0%) | 1,586 (100.0%) |
Physical Housing Characteristics in North Gates
Housing Structures in North Gates
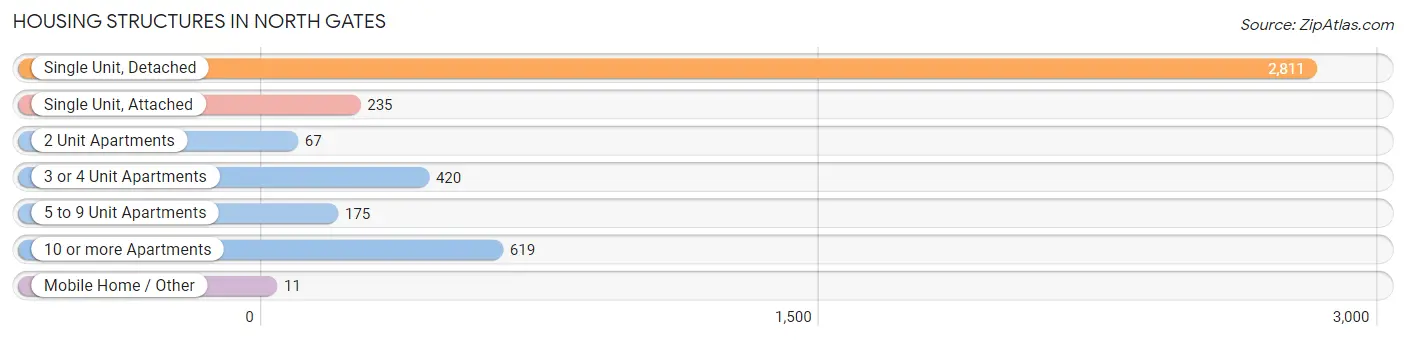
| Structure Type | # Housing Units | % Housing Units |
| Single Unit, Detached | 2,811 | 64.8% |
| Single Unit, Attached | 235 | 5.4% |
| 2 Unit Apartments | 67 | 1.5% |
| 3 or 4 Unit Apartments | 420 | 9.7% |
| 5 to 9 Unit Apartments | 175 | 4.0% |
| 10 or more Apartments | 619 | 14.3% |
| Mobile Home / Other | 11 | 0.3% |
| Total | 4,338 | 100.0% |
Housing Structures by Occupancy in North Gates
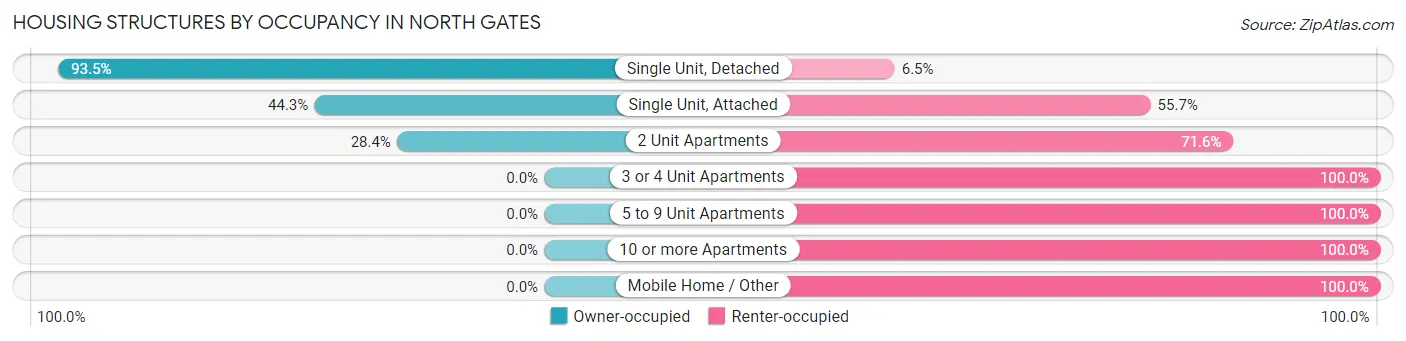
| Structure Type | Owner-occupied | Renter-occupied |
| Single Unit, Detached | 2,629 (93.5%) | 182 (6.5%) |
| Single Unit, Attached | 104 (44.3%) | 131 (55.7%) |
| 2 Unit Apartments | 19 (28.4%) | 48 (71.6%) |
| 3 or 4 Unit Apartments | 0 (0.0%) | 420 (100.0%) |
| 5 to 9 Unit Apartments | 0 (0.0%) | 175 (100.0%) |
| 10 or more Apartments | 0 (0.0%) | 619 (100.0%) |
| Mobile Home / Other | 0 (0.0%) | 11 (100.0%) |
| Total | 2,752 (63.4%) | 1,586 (36.6%) |
Housing Structures by Number of Rooms in North Gates
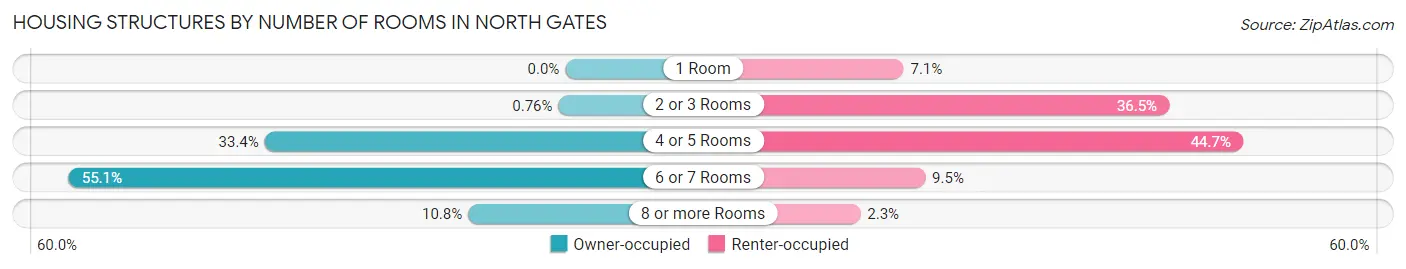
| Number of Rooms | Owner-occupied | Renter-occupied |
| 1 Room | 0 (0.0%) | 112 (7.1%) |
| 2 or 3 Rooms | 21 (0.8%) | 579 (36.5%) |
| 4 or 5 Rooms | 918 (33.4%) | 709 (44.7%) |
| 6 or 7 Rooms | 1,516 (55.1%) | 150 (9.5%) |
| 8 or more Rooms | 297 (10.8%) | 36 (2.3%) |
| Total | 2,752 (100.0%) | 1,586 (100.0%) |
Housing Structure by Heating Type in North Gates
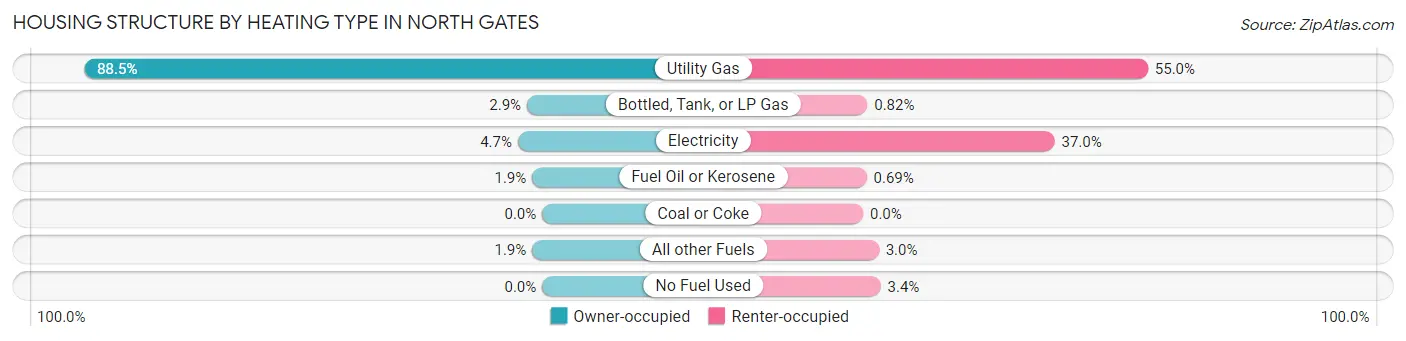
| Heating Type | Owner-occupied | Renter-occupied |
| Utility Gas | 2,436 (88.5%) | 873 (55.0%) |
| Bottled, Tank, or LP Gas | 81 (2.9%) | 13 (0.8%) |
| Electricity | 129 (4.7%) | 587 (37.0%) |
| Fuel Oil or Kerosene | 53 (1.9%) | 11 (0.7%) |
| Coal or Coke | 0 (0.0%) | 0 (0.0%) |
| All other Fuels | 53 (1.9%) | 48 (3.0%) |
| No Fuel Used | 0 (0.0%) | 54 (3.4%) |
| Total | 2,752 (100.0%) | 1,586 (100.0%) |
Household Vehicle Usage in North Gates
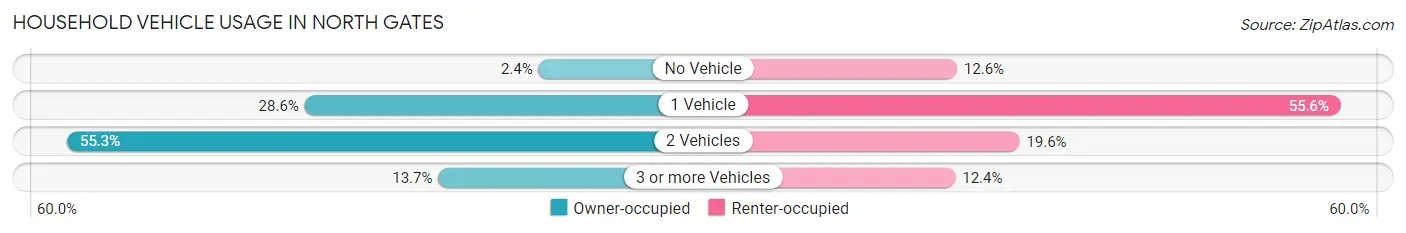
| Vehicles per Household | Owner-occupied | Renter-occupied |
| No Vehicle | 67 (2.4%) | 199 (12.6%) |
| 1 Vehicle | 788 (28.6%) | 881 (55.5%) |
| 2 Vehicles | 1,521 (55.3%) | 310 (19.6%) |
| 3 or more Vehicles | 376 (13.7%) | 196 (12.4%) |
| Total | 2,752 (100.0%) | 1,586 (100.0%) |
Real Estate & Mortgages in North Gates
Real Estate and Mortgage Overview in North Gates
| Characteristic | Without Mortgage | With Mortgage |
| Housing Units | 892 | 1,860 |
| Median Property Value | $125,000 | $142,600 |
| Median Household Income | $60,833 | $338 |
| Monthly Housing Costs | $645 | $95 |
| Real Estate Taxes | $4,338 | $22 |
Property Value by Mortgage Status in North Gates
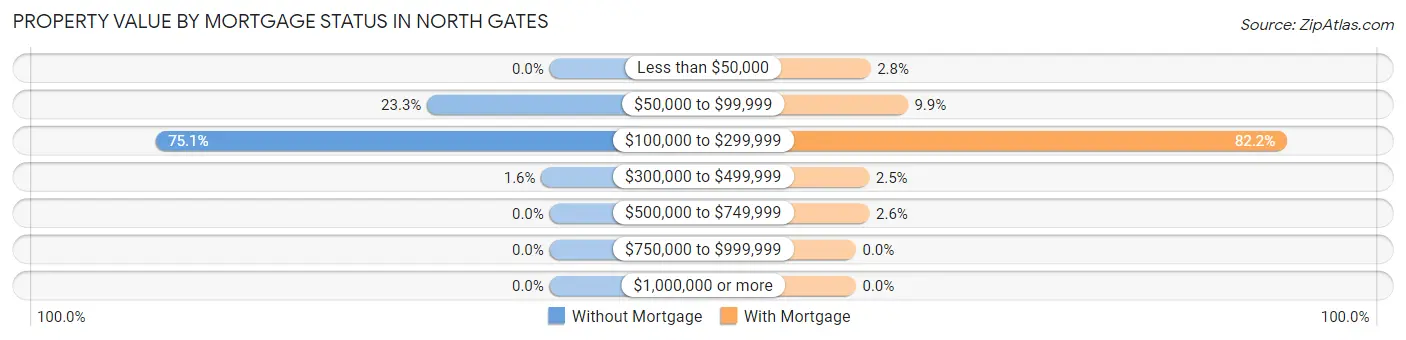
| Property Value | Without Mortgage | With Mortgage |
| Less than $50,000 | 0 (0.0%) | 52 (2.8%) |
| $50,000 to $99,999 | 208 (23.3%) | 184 (9.9%) |
| $100,000 to $299,999 | 670 (75.1%) | 1,529 (82.2%) |
| $300,000 to $499,999 | 14 (1.6%) | 47 (2.5%) |
| $500,000 to $749,999 | 0 (0.0%) | 48 (2.6%) |
| $750,000 to $999,999 | 0 (0.0%) | 0 (0.0%) |
| $1,000,000 or more | 0 (0.0%) | 0 (0.0%) |
| Total | 892 (100.0%) | 1,860 (100.0%) |
Household Income by Mortgage Status in North Gates
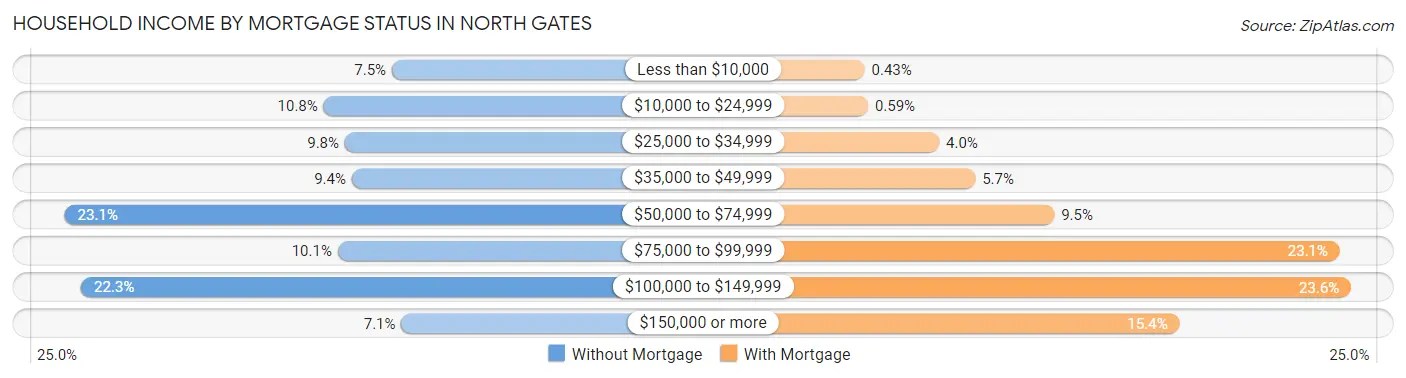
| Household Income | Without Mortgage | With Mortgage |
| Less than $10,000 | 67 (7.5%) | 8 (0.4%) |
| $10,000 to $24,999 | 96 (10.8%) | 11 (0.6%) |
| $25,000 to $34,999 | 87 (9.8%) | 74 (4.0%) |
| $35,000 to $49,999 | 84 (9.4%) | 106 (5.7%) |
| $50,000 to $74,999 | 206 (23.1%) | 176 (9.5%) |
| $75,000 to $99,999 | 90 (10.1%) | 429 (23.1%) |
| $100,000 to $149,999 | 199 (22.3%) | 439 (23.6%) |
| $150,000 or more | 63 (7.1%) | 287 (15.4%) |
| Total | 892 (100.0%) | 1,860 (100.0%) |
Property Value to Household Income Ratio in North Gates
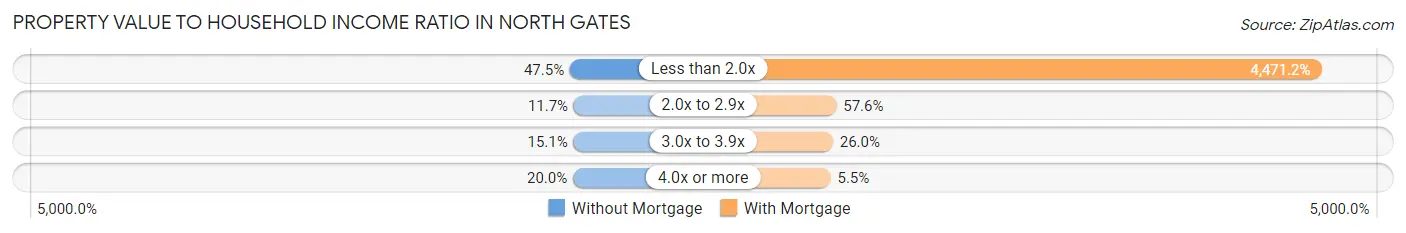
| Value-to-Income Ratio | Without Mortgage | With Mortgage |
| Less than 2.0x | 424 (47.5%) | 83,164 (4,471.2%) |
| 2.0x to 2.9x | 104 (11.7%) | 1,071 (57.6%) |
| 3.0x to 3.9x | 135 (15.1%) | 484 (26.0%) |
| 4.0x or more | 178 (20.0%) | 103 (5.5%) |
| Total | 892 (100.0%) | 1,860 (100.0%) |
Real Estate Taxes by Mortgage Status in North Gates
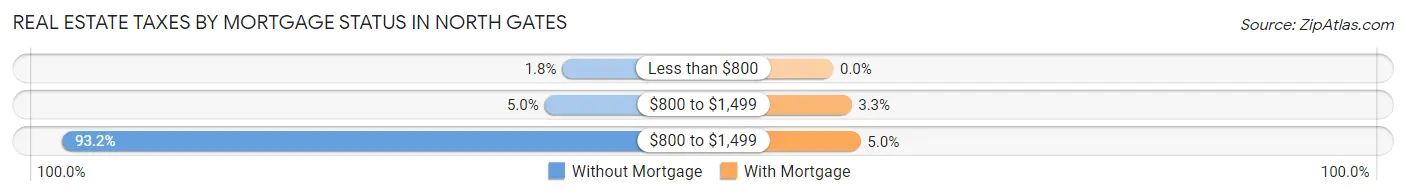
| Property Taxes | Without Mortgage | With Mortgage |
| Less than $800 | 16 (1.8%) | 0 (0.0%) |
| $800 to $1,499 | 45 (5.0%) | 62 (3.3%) |
| $800 to $1,499 | 831 (93.2%) | 93 (5.0%) |
| Total | 892 (100.0%) | 1,860 (100.0%) |
Health & Disability in North Gates
Health Insurance Coverage by Age in North Gates
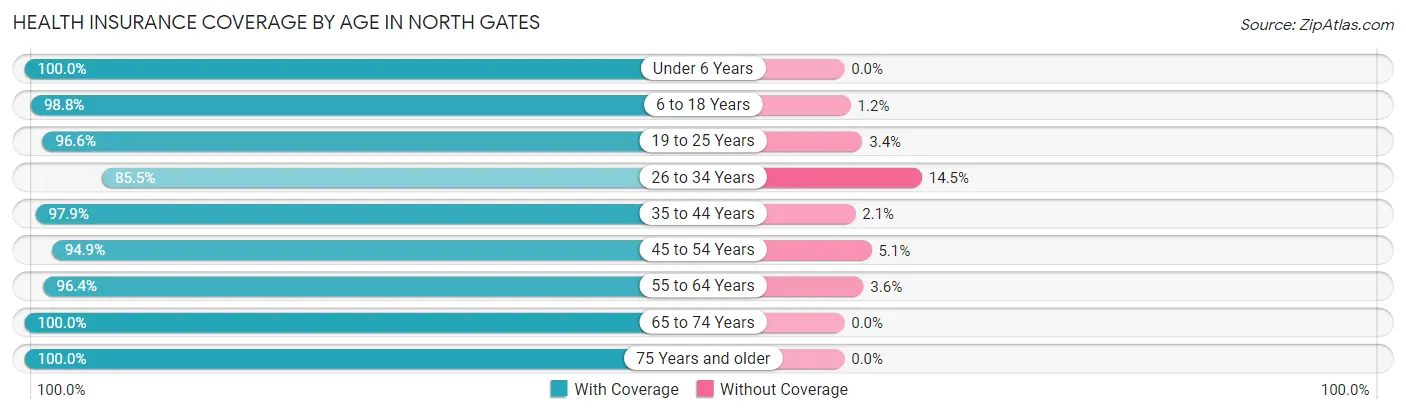
| Age Bracket | With Coverage | Without Coverage |
| Under 6 Years | 655 (100.0%) | 0 (0.0%) |
| 6 to 18 Years | 1,164 (98.8%) | 14 (1.2%) |
| 19 to 25 Years | 1,121 (96.6%) | 39 (3.4%) |
| 26 to 34 Years | 1,366 (85.5%) | 231 (14.5%) |
| 35 to 44 Years | 1,045 (97.9%) | 22 (2.1%) |
| 45 to 54 Years | 1,386 (94.9%) | 74 (5.1%) |
| 55 to 64 Years | 1,192 (96.4%) | 44 (3.6%) |
| 65 to 74 Years | 999 (100.0%) | 0 (0.0%) |
| 75 Years and older | 779 (100.0%) | 0 (0.0%) |
| Total | 9,707 (95.8%) | 424 (4.2%) |
Health Insurance Coverage by Citizenship Status in North Gates
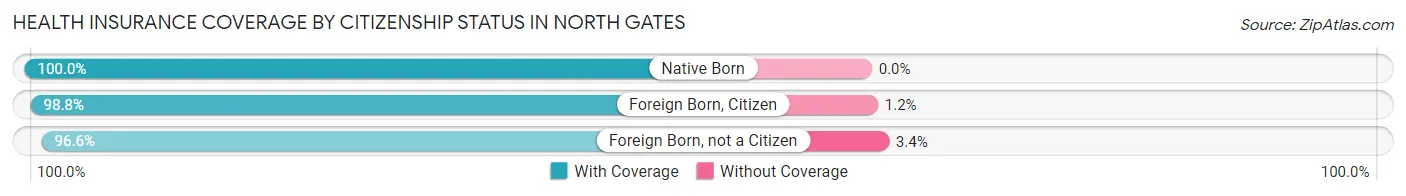
| Citizenship Status | With Coverage | Without Coverage |
| Native Born | 655 (100.0%) | 0 (0.0%) |
| Foreign Born, Citizen | 1,164 (98.8%) | 14 (1.2%) |
| Foreign Born, not a Citizen | 1,121 (96.6%) | 39 (3.4%) |
Health Insurance Coverage by Household Income in North Gates
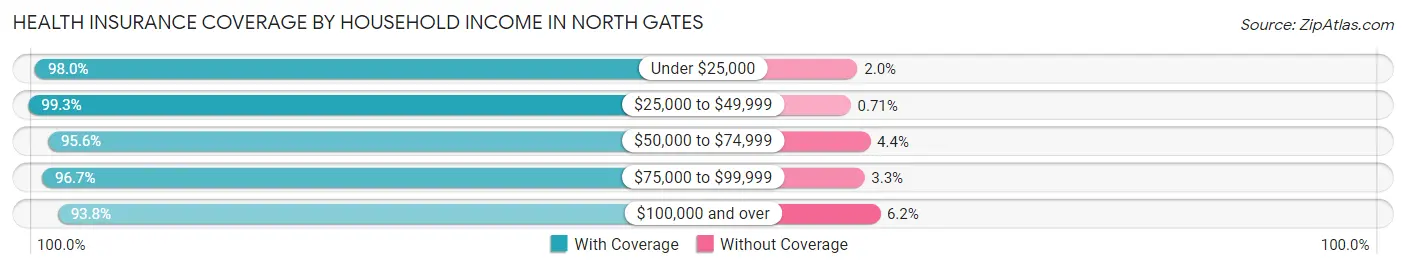
| Household Income | With Coverage | Without Coverage |
| Under $25,000 | 692 (98.0%) | 14 (2.0%) |
| $25,000 to $49,999 | 1,544 (99.3%) | 11 (0.7%) |
| $50,000 to $74,999 | 2,097 (95.6%) | 96 (4.4%) |
| $75,000 to $99,999 | 1,588 (96.7%) | 54 (3.3%) |
| $100,000 and over | 3,760 (93.8%) | 249 (6.2%) |
Public vs Private Health Insurance Coverage by Age in North Gates
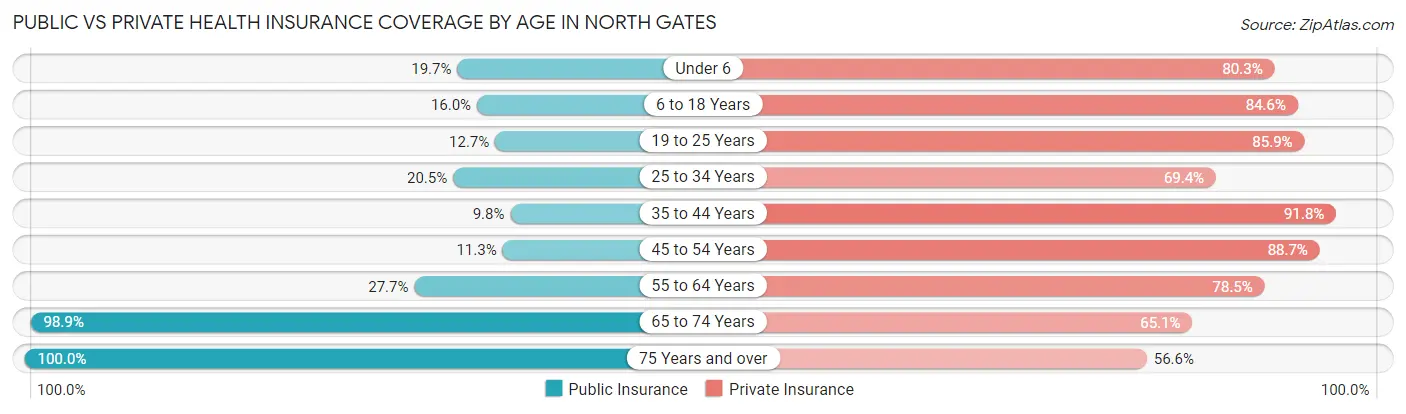
| Age Bracket | Public Insurance | Private Insurance |
| Under 6 | 129 (19.7%) | 526 (80.3%) |
| 6 to 18 Years | 189 (16.0%) | 997 (84.6%) |
| 19 to 25 Years | 147 (12.7%) | 996 (85.9%) |
| 25 to 34 Years | 327 (20.5%) | 1,109 (69.4%) |
| 35 to 44 Years | 105 (9.8%) | 979 (91.7%) |
| 45 to 54 Years | 165 (11.3%) | 1,295 (88.7%) |
| 55 to 64 Years | 342 (27.7%) | 970 (78.5%) |
| 65 to 74 Years | 988 (98.9%) | 650 (65.1%) |
| 75 Years and over | 779 (100.0%) | 441 (56.6%) |
| Total | 3,171 (31.3%) | 7,963 (78.6%) |
Disability Status by Sex by Age in North Gates
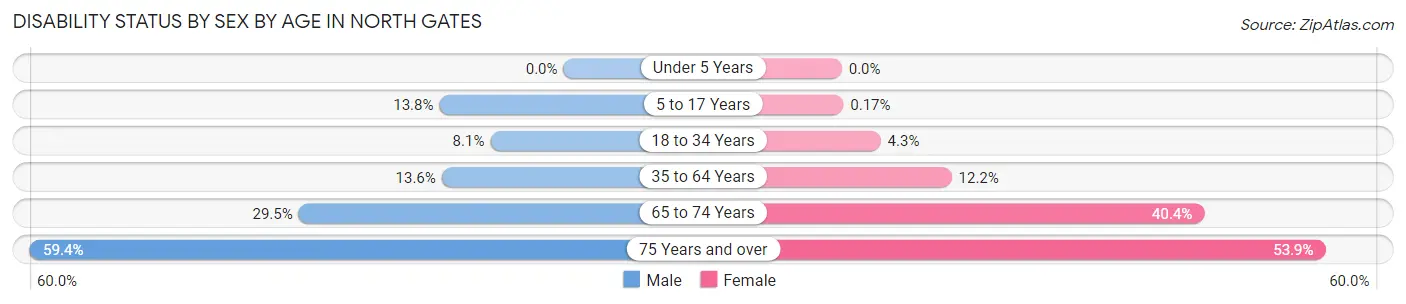
| Age Bracket | Male | Female |
| Under 5 Years | 0 (0.0%) | 0 (0.0%) |
| 5 to 17 Years | 84 (13.8%) | 1 (0.2%) |
| 18 to 34 Years | 121 (8.1%) | 58 (4.3%) |
| 35 to 64 Years | 263 (13.6%) | 223 (12.2%) |
| 65 to 74 Years | 128 (29.5%) | 228 (40.4%) |
| 75 Years and over | 231 (59.4%) | 210 (53.8%) |
Disability Class by Sex by Age in North Gates
Disability Class: Hearing Difficulty
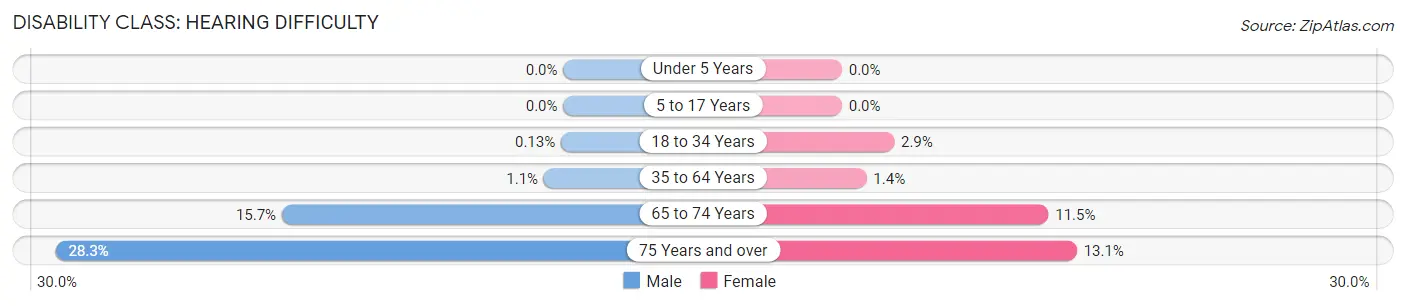
| Age Bracket | Male | Female |
| Under 5 Years | 0 (0.0%) | 0 (0.0%) |
| 5 to 17 Years | 0 (0.0%) | 0 (0.0%) |
| 18 to 34 Years | 2 (0.1%) | 39 (2.9%) |
| 35 to 64 Years | 21 (1.1%) | 25 (1.4%) |
| 65 to 74 Years | 68 (15.7%) | 65 (11.5%) |
| 75 Years and over | 110 (28.3%) | 51 (13.1%) |
Disability Class: Vision Difficulty
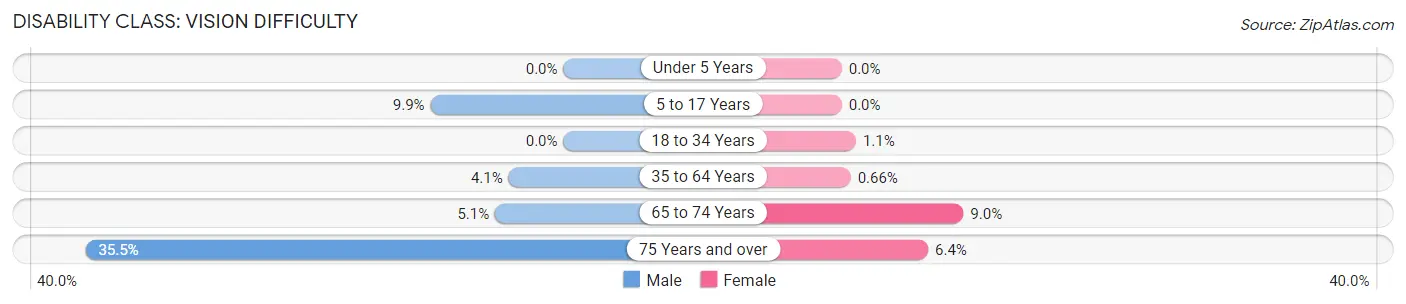
| Age Bracket | Male | Female |
| Under 5 Years | 0 (0.0%) | 0 (0.0%) |
| 5 to 17 Years | 60 (9.9%) | 0 (0.0%) |
| 18 to 34 Years | 0 (0.0%) | 14 (1.1%) |
| 35 to 64 Years | 79 (4.1%) | 12 (0.7%) |
| 65 to 74 Years | 22 (5.1%) | 51 (9.0%) |
| 75 Years and over | 138 (35.5%) | 25 (6.4%) |
Disability Class: Cognitive Difficulty
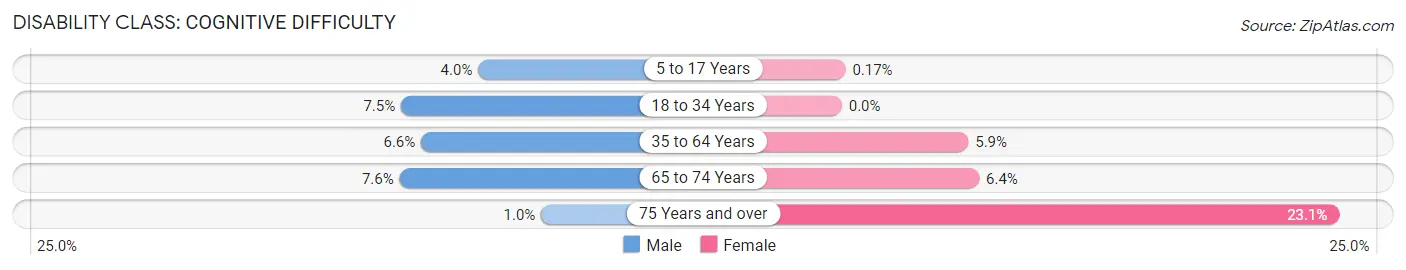
| Age Bracket | Male | Female |
| 5 to 17 Years | 24 (4.0%) | 1 (0.2%) |
| 18 to 34 Years | 112 (7.5%) | 0 (0.0%) |
| 35 to 64 Years | 128 (6.6%) | 107 (5.9%) |
| 65 to 74 Years | 33 (7.6%) | 36 (6.4%) |
| 75 Years and over | 4 (1.0%) | 90 (23.1%) |
Disability Class: Ambulatory Difficulty
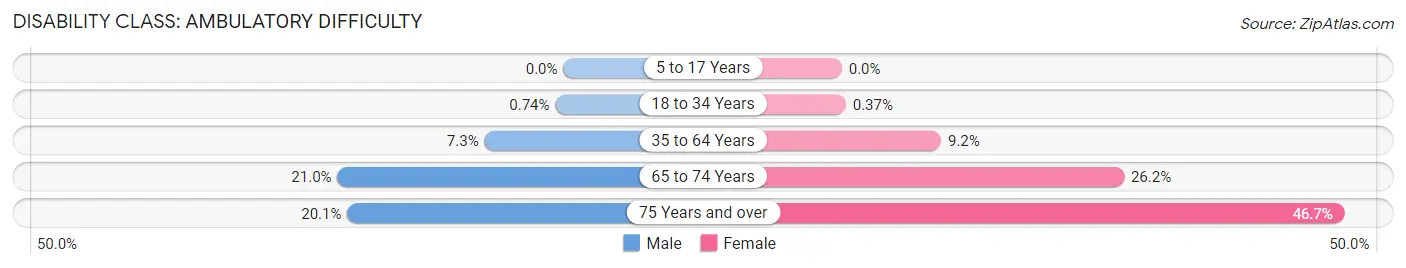
| Age Bracket | Male | Female |
| 5 to 17 Years | 0 (0.0%) | 0 (0.0%) |
| 18 to 34 Years | 11 (0.7%) | 5 (0.4%) |
| 35 to 64 Years | 142 (7.3%) | 168 (9.2%) |
| 65 to 74 Years | 91 (21.0%) | 148 (26.2%) |
| 75 Years and over | 78 (20.1%) | 182 (46.7%) |
Disability Class: Self-Care Difficulty
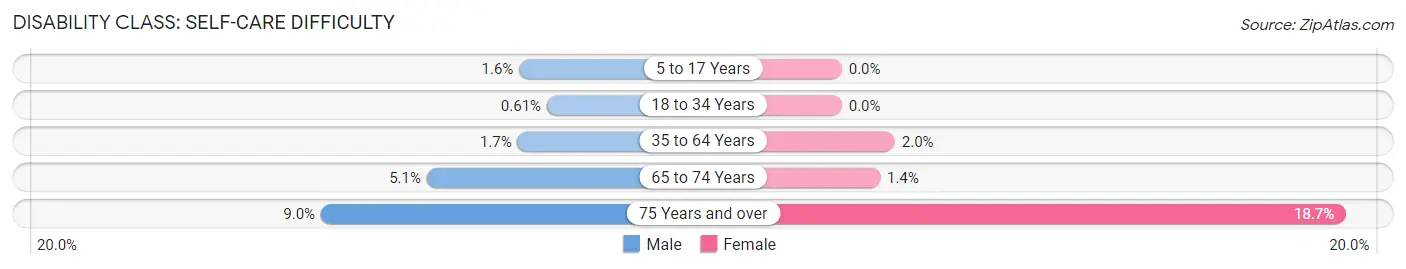
| Age Bracket | Male | Female |
| 5 to 17 Years | 10 (1.6%) | 0 (0.0%) |
| 18 to 34 Years | 9 (0.6%) | 0 (0.0%) |
| 35 to 64 Years | 33 (1.7%) | 36 (2.0%) |
| 65 to 74 Years | 22 (5.1%) | 8 (1.4%) |
| 75 Years and over | 35 (9.0%) | 73 (18.7%) |
Technology Access in North Gates
Computing Device Access in North Gates
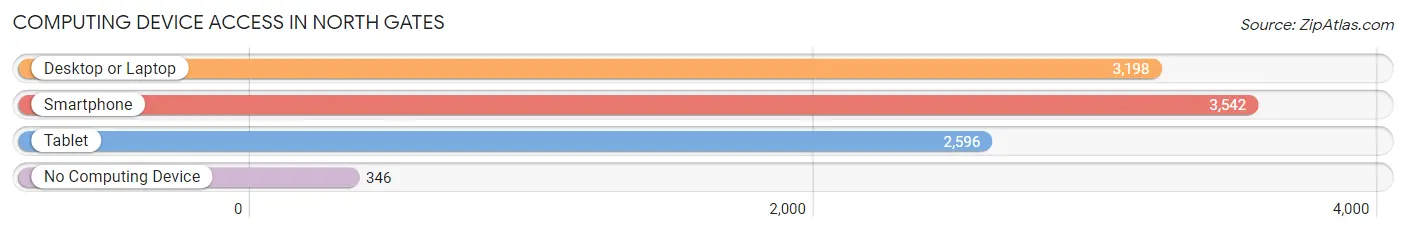
| Device Type | # Households | % Households |
| Desktop or Laptop | 3,198 | 73.7% |
| Smartphone | 3,542 | 81.7% |
| Tablet | 2,596 | 59.8% |
| No Computing Device | 346 | 8.0% |
| Total | 4,338 | 100.0% |
Internet Access in North Gates
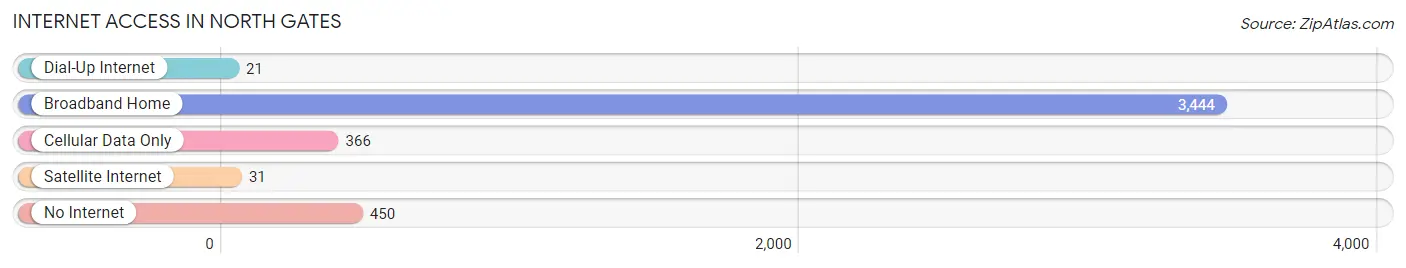
| Internet Type | # Households | % Households |
| Dial-Up Internet | 21 | 0.5% |
| Broadband Home | 3,444 | 79.4% |
| Cellular Data Only | 366 | 8.4% |
| Satellite Internet | 31 | 0.7% |
| No Internet | 450 | 10.4% |
| Total | 4,338 | 100.0% |
North Gates Summary
Gates is a town located in Monroe County, New York, United States. It is a suburb of Rochester, New York, and is part of the Rochester Metropolitan Statistical Area. The population was 29,485 at the 2010 census.
History
The area that is now Gates was originally part of the Town of Northampton, which was established in 1821. In 1823, the Town of Gates was formed from the northern part of Northampton. The town was named after General Horatio Gates, a Revolutionary War hero.
In the early 19th century, the area was largely rural and agricultural. The first settlers were mostly of German and English descent. The town was home to several small villages, including North Gates, West Gates, and East Gates.
In the late 19th century, the area began to experience rapid growth due to the construction of the Erie Canal and the Rochester and Syracuse Railroad. This led to an influx of new residents and businesses.
In the early 20th century, the area continued to grow, and the town was home to several large factories, including the Rochester Malleable Iron Company and the Gates Rubber Company.
Geography
Gates is located in western Monroe County, bordered by the towns of Greece to the north, Parma to the east, Ogden to the south, and Chili to the west. The town is located approximately 10 miles northwest of the city of Rochester.
The town has a total area of 16.2 square miles, of which 16.1 square miles is land and 0.1 square miles (0.6%) is water. The town is located in the Finger Lakes region of New York State.
Economy
Gates is home to several large employers, including the Gates Rubber Company, the Rochester Malleable Iron Company, and the University of Rochester Medical Center. The town is also home to several small businesses, including restaurants, retail stores, and professional services.
Demographics
As of the 2010 census, there were 29,485 people, 11,845 households, and 7,945 families residing in the town. The population density was 1,831.3 people per square mile. The racial makeup of the town was 87.3% White, 8.2% African American, 0.3% Native American, 1.7% Asian, 0.1% Pacific Islander, 0.7% from other races, and 1.9% from two or more races. Hispanic or Latino of any race were 3.2% of the population.
The median income for a household in the town was $60,945, and the median income for a family was $71,945. The per capita income for the town was $27,945. About 4.2% of families and 6.2% of the population were below the poverty line, including 8.2% of those under age 18 and 4.2% of those age 65 or over.
Common Questions
What is Per Capita Income in North Gates?
Per Capita income in North Gates is $35,789.
What is the Median Family Income in North Gates?
Median Family Income in North Gates is $84,767.
What is the Median Household income in North Gates?
Median Household Income in North Gates is $70,482.
What is Income or Wage Gap in North Gates?
Income or Wage Gap in North Gates is 6.5%.
Women in North Gates earn 93.5 cents for every dollar earned by a man.
What is Inequality or Gini Index in North Gates?
Inequality or Gini Index in North Gates is 0.38.
What is the Total Population of North Gates?
Total Population of North Gates is 10,138.
What is the Total Male Population of North Gates?
Total Male Population of North Gates is 5,156.
What is the Total Female Population of North Gates?
Total Female Population of North Gates is 4,982.
What is the Ratio of Males per 100 Females in North Gates?
There are 103.49 Males per 100 Females in North Gates.
What is the Ratio of Females per 100 Males in North Gates?
There are 96.63 Females per 100 Males in North Gates.
What is the Median Population Age in North Gates?
Median Population Age in North Gates is 40.0 Years.
What is the Average Family Size in North Gates
Average Family Size in North Gates is 2.9 People.
What is the Average Household Size in North Gates
Average Household Size in North Gates is 2.3 People.
How Large is the Labor Force in North Gates?
There are 5,774 People in the Labor Forcein in North Gates.
What is the Percentage of People in the Labor Force in North Gates?
67.1% of People are in the Labor Force in North Gates.
What is the Unemployment Rate in North Gates?
Unemployment Rate in North Gates is 3.0%.